Embed Size (px)
Citation preview
CRLVL13/05XP
Soybean Seeds Sampling and DNA Extraction
Report on the Validation of a DNA Extraction Method from Soybean Seeds
14 May 2007
Directorate General-Joint Research Centre Institute for Health and Consumer Protection
Biotechnology & GMOs Unit
Method development and single laboratory validation:
Bayer CropScience GmbH
Method testing and confirmation:
Community Reference Laboratory for GM Food and Feed (CRL-GMFF) Biotechnology & GMOs Unit
CRL-GMFF: Soybean Seeds Sampling and DNA Extraction 1/17
CRLVL13/05XP
Content
1. INTRODUCTION....................................................................................................... 4
2. MATERIALS (EQUIPMENT/CHEMICALS/PLASTICWARE)........................................ 4
3. DESCRIPTION OF THE METHODS ............................................................................ 6
4. TESTING OF THE DNA EXTRACTION METHOD BY THE METHOD DEVELOPER......... 8
5. EXPERIMENTAL TESTING OF THE DNA EXTRACTION METHOD BY THE COMMUNITY REFERENCE LABORATORY FOR GM FOOD AND FEED.......................... 12
6. CONCLUSION......................................................................................................... 17
7. QUALITY ASSURANCE............................................................................................ 17
8. REFERENCES.......................................................................................................... 17
CRL-GMFF: Soybean Seeds Sampling and DNA Extraction 3/17
CRLVL13/05XP
1. Introduction This report describes a plant DNA extraction protocol derived from the publicly available “Dellaporta” method (1). This protocol can be used for the extraction of DNA from soybean seeds and grains ground to powder with a Waring™ blender or with any other appropriate seeds/grains crushing device. These protocols are recommended to be executed only by skilled laboratory personnel as the procedures comprise the use of hazardous chemicals and materials. It is strongly advised to take particular notice of products safety recommendations and guidelines.
2. Materials (Equipment/Chemicals/Plasticware) 2.1. Equipment The following equipment is used in the DNA extraction procedure described (equivalents may be used):
1. Waring blender, model 7010S/7010G/7010HS/7010HG or equivalent 2. 70 mm Blender Base (Eberbach Corp. – Cat.No. 8495) for Waring blender or equivalent 3. Micro centrifuge with 18,000 x g for microcentrifuge tubes 4. Table centrifuge (swinging buckets) with 3,000 x g for Falcon tubes 5. Water bath adjustable to 65°C ± 1°C 6. Fluostar Galaxy type 0403 from BMG LabTechnologies 7. PC with Fluostar software (Fluo32)
2.2. Chemicals The following reagents are used in the DNA extraction procedure described (equivalents may be used):
1. Na2-EDTA; Titriplex III (Merck Cat. No. 1.08418.1000) 2. Tris-HCl; Tris(hydroxymethyl)aminomethane hydrochloride (USB Cat. No. 22676) 3. NaCl; sodium chloride (Duchefa Cat No. S0520) 4. KAc; potassium acetate (Merck Cat. No. 1.04820.1000) 5. NaAc; sodium acetate (Merck Cat. No. 1.06268.1000) 6. SDS; sodium dodecyl sulphate (BDH Cat. No. 442444H) 7. 2-mercaptoethanol (Sigma Cat. No. M6250) 8. RNase A (Roche Cat. No. 0109-142) 9. Ethanol p.a. (Merck Cat. No. 1.00983.1000) 10. Isopropanol p.a. (Merck Cat. No. 1.09634.2500) 11. Phenol:chloroform:isoamylalcohol (25:24:1) equilibrated at pH 8.0 (Sigma Cat. No. P-
2069)
CRL-GMFF: Soybean Seeds Sampling and DNA Extraction 4/17
CRLVL13/05XP
12. Chloroform p.a. (Merck Cat. No. 1.02445.2500) 13. Polyethylene Glycol (MW 8000) (Sigma Cat. No. P2139)
2.3. Solutions The following buffers and solutions are used in the DNA extraction procedure described:
1. Extraction Buffer pH 8.0 • 100 mM Tris HCl pH 8.0 • 50 mM EDTA • 500 mM NaCl • 10 mM 2-mercaptoethanol
2. Tris-EDTA buffer (TE) pH 8.0 • 10 mM Tris HCl pH 8.0 • 1 mM EDTA
3. Tris-EDTA buffer (TE0.1) pH 8.0 • 10 mM Tris HCl pH 8.0 • 0.1 mM EDTA
4. RNase A (10 mg/ml) 5. SDS 20% 6. Ethanol 70%
7. 5M KAc
8. 3M NaAc
2.4. Plasticware
1. 50 ml conical tubes 2. 15 ml conical tubes 3. 2 ml microcentrifuge tubes 4. filter tips
Note: All plasticware has to be sterile and free of DNases, RNases and nucleic acids. 2.5. Precautions
• Phenol, chloroform, isoamyl alcohol, and isopropanol are hazardous chemicals; therefore, all manipulations have to be performed following safety guidelines and under
CRL-GMFF: Soybean Seeds Sampling and DNA Extraction 5/17

CRLVL13/05XP
fume hood. • It is recommended to use clean containers for Waring blenders for grinding the seed
bulk samples. • All tubes and pipette tips have to be discarded as biological hazardous material
2.6 Abbreviations: EDTA ethylenediaminetetraacetic acid PCR polymerase chain reaction RNase A ribonuclease A TE Tris EDTA Tris Tris(hydroxymethyl)aminomethane 3. Description of the methods Sampling: Sampling approaches for seeds and grains are referred to in technical guidance documents and protocols described in:
• International Organization for Standardizations, Switzerland: ISO standard 6644, ISO standard 13690, ISO standard 5725;
• International Rules for Seed Testing (2004) International Seed Testing Association (ISTA), Switzerland. ISBN 3-906549-38-0;
• USDA-GIPSA (2001) Sampling grains for the detection of Biotech grains http://www.usda.gov/gipsa/.
Scope and applicability: The “Dellaporta-derived” method for DNA extraction described below is suitable for the isolation of genomic DNA from ground soybean seeds and grains. Application of the method to other matrices may require adaptation and possible further specific validation. Principle: The basic principle of the DNA extraction consists of first releasing the DNA present in the matrix into aqueous solution and further purifying the DNA from PCR inhibitors. The “Dellaporta-derived” method starts with a lysis step (thermal lysis in the presence of Tris HCl, EDTA, NaCl and 2-mercaptoethanol) followed by isopropanol precipitation and removal of contaminants such as lipophilic molecules and proteins by extraction with phenol:chloroform:isoamylalcohol. A further DNA precipitate is then generated by using isopropanol, followed by RNAse treatment, phenol:chloroform:isoamylalcohol purification and final isopropanol precipitation. The resulting pellet is dissolved in TE buffer.
CRL-GMFF: Soybean Seeds Sampling and DNA Extraction 6/17
CRLVL13/05XP
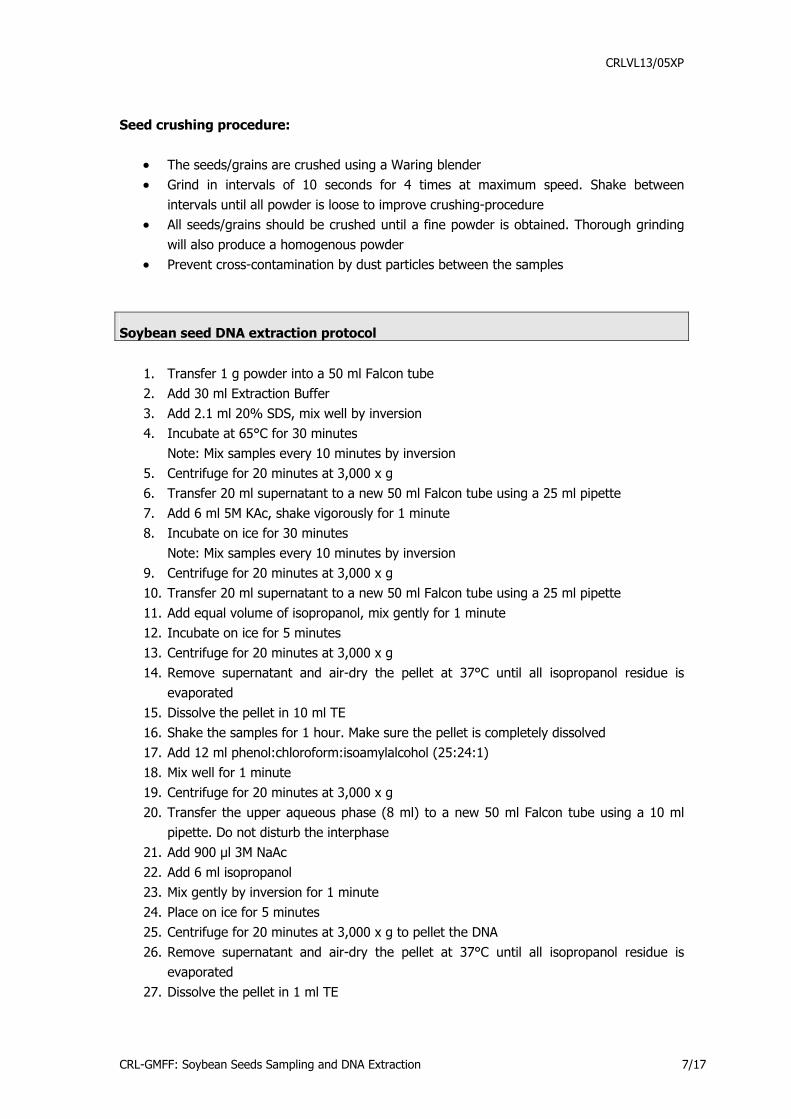
Seed crushing procedure:
• The seeds/grains are crushed using a Waring blender • Grind in intervals of 10 seconds for 4 times at maximum speed. Shake between
intervals until all powder is loose to improve crushing-procedure • All seeds/grains should be crushed until a fine powder is obtained. Thorough grinding
will also produce a homogenous powder • Prevent cross-contamination by dust particles between the samples
Soybean seed DNA extraction protocol
1. Transfer 1 g powder into a 50 ml Falcon tube 2. Add 30 ml Extraction Buffer 3. Add 2.1 ml 20% SDS, mix well by inversion 4. Incubate at 65°C for 30 minutes
Note: Mix samples every 10 minutes by inversion 5. Centrifuge for 20 minutes at 3,000 x g 6. Transfer 20 ml supernatant to a new 50 ml Falcon tube using a 25 ml pipette 7. Add 6 ml 5M KAc, shake vigorously for 1 minute 8. Incubate on ice for 30 minutes
Note: Mix samples every 10 minutes by inversion 9. Centrifuge for 20 minutes at 3,000 x g 10. Transfer 20 ml supernatant to a new 50 ml Falcon tube using a 25 ml pipette 11. Add equal volume of isopropanol, mix gently for 1 minute 12. Incubate on ice for 5 minutes 13. Centrifuge for 20 minutes at 3,000 x g 14. Remove supernatant and air-dry the pellet at 37°C until all isopropanol residue is
evaporated 15. Dissolve the pellet in 10 ml TE 16. Shake the samples for 1 hour. Make sure the pellet is completely dissolved 17. Add 12 ml phenol:chloroform:isoamylalcohol (25:24:1) 18. Mix well for 1 minute 19. Centrifuge for 20 minutes at 3,000 x g 20. Transfer the upper aqueous phase (8 ml) to a new 50 ml Falcon tube using a 10 ml
pipette. Do not disturb the interphase 21. Add 900 µl 3M NaAc 22. Add 6 ml isopropanol 23. Mix gently by inversion for 1 minute 24. Place on ice for 5 minutes 25. Centrifuge for 20 minutes at 3,000 x g to pellet the DNA 26. Remove supernatant and air-dry the pellet at 37°C until all isopropanol residue is
evaporated 27. Dissolve the pellet in 1 ml TE
CRL-GMFF: Soybean Seeds Sampling and DNA Extraction 7/17
CRLVL13/05XP
28. Shake the samples for 1 hour. Make sure the pellet is completely dissolved 29. Transfer the DNA solution to a new 2.0 ml microcentrifuge tube 30. Add 10 µl RNase A (10 mg/ml), mix gently and incubate for 20 min at 37°C 31. Add 800 µl phenol:chloroform:isoamylalcohol (25:24:1) 32. Mix well for 1 minute 33. Centrifuge for 10 minutes in a microcentrifuge at maximum speed 34. Transfer the upper aqueous phase (about 900 µl) to a new 2 ml microcentrifuge tube 35. Add 800 µl chloroform 36. Mix well for 1 minute 37. Centrifuge for 10 minutes in a micro centrifuge at maximum speed 38. Transfer the upper aqueous phase (about 800 µl) to a new 2 ml microcentrifuge tube
containing 90 µl 3M NaAc 39. Add 600 µl isopropanol 40. Mix gently by inversion for 1 minute 41. Place on ice for 5 minutes 42. Centrifuge for 1 minute in a micro centrifuge at maximum speed to pellet the DNA 43. Remove all supernatant 44. Add 1 ml 70% ethanol to wash the DNA pellet. Make sure the DNA pellet is not stuck to
the bottom. Shake the samples for 1 hour 45. Centrifuge for 5 minutes in a micro centrifuge at maximum speed 46. Remove supernatant and air-dry the pellet at 37°C until all ethanol residue is
evaporated 47. Add 200 µl TE 0.1 to the DNA pellet 48. Allow pellet to dissolve for about 10 hours at 4°C 49. Shake samples for minimal 3 hours at 4°C 50. Centrifuge for 1 minute in a micro centrifuge at maximum speed 51. Transfer the supernatant to a new microcentrifuge tube
4. Testing of the DNA extraction method by the method developer 4.1 Performance characteristics A soybean seed bulk sample was ground to fine powder. Six replicated independent DNA extractions were performed on 1 gram flour sub-samples. This experiment was repeated twice under repeatability conditions (within short intervals of time [i.e. days] by the same operator, using the same equipment) resulting in 18 DNA samples. 4.2 DNA concentration, yield and repeatability standard deviation (RSDr)
The concentration of the extracted DNA was determined by fluorescence detection using the PicoGreen dsDNA Quantitation Kit. 1:40 dilutions of each DNA sample were prepared in duplicate and mixed with the PicoGreen reagent. The DNA concentration was determined on
CRL-GMFF: Soybean Seeds Sampling and DNA Extraction 8/17
CRLVL13/05XP
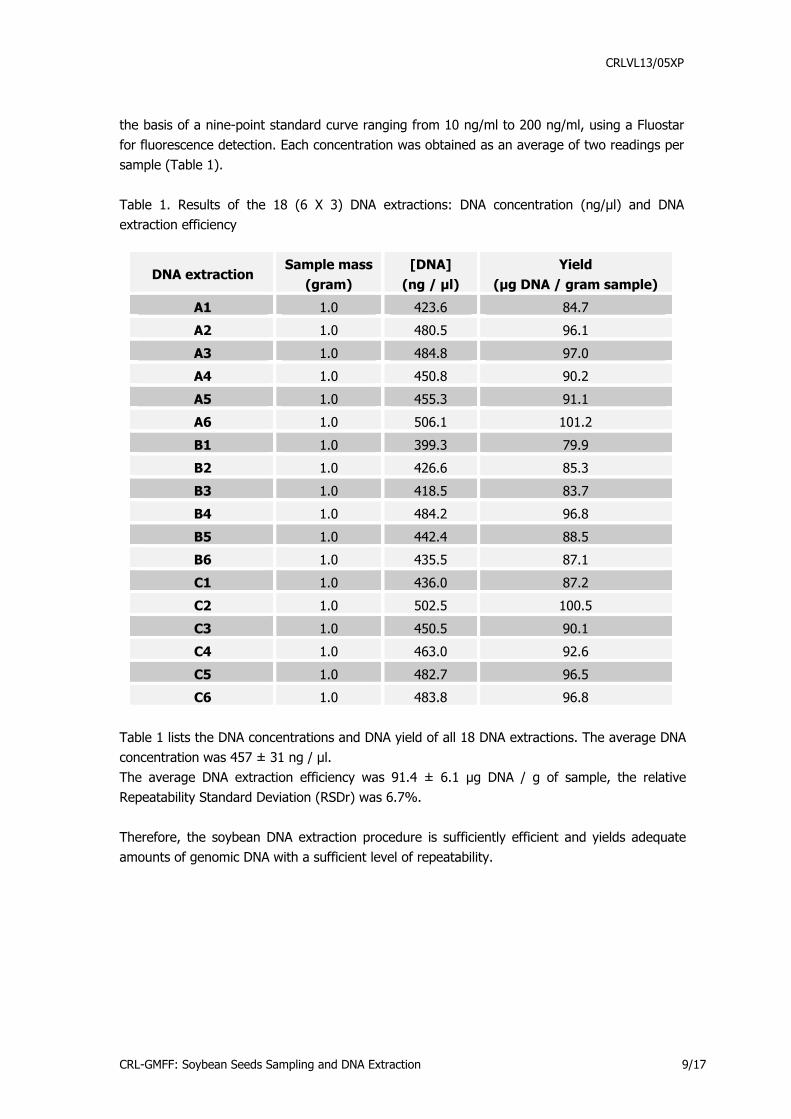
the basis of a nine-point standard curve ranging from 10 ng/ml to 200 ng/ml, using a Fluostar for fluorescence detection. Each concentration was obtained as an average of two readings per sample (Table 1). Table 1. Results of the 18 (6 X 3) DNA extractions: DNA concentration (ng/µl) and DNA extraction efficiency
DNA extraction Sample mass
(gram) [DNA]
(ng / µl) Yield
(µg DNA / gram sample)
A1 1.0 423.6 84.7
A2 1.0 480.5 96.1
A3 1.0 484.8 97.0
A4 1.0 450.8 90.2
A5 1.0 455.3 91.1
A6 1.0 506.1 101.2
B1 1.0 399.3 79.9
B2 1.0 426.6 85.3
B3 1.0 418.5 83.7
B4 1.0 484.2 96.8
B5 1.0 442.4 88.5
B6 1.0 435.5 87.1
C1 1.0 436.0 87.2
C2 1.0 502.5 100.5
C3 1.0 450.5 90.1
C4 1.0 463.0 92.6
C5 1.0 482.7 96.5
C6 1.0 483.8 96.8 Table 1 lists the DNA concentrations and DNA yield of all 18 DNA extractions. The average DNA concentration was 457 ± 31 ng / µl. The average DNA extraction efficiency was 91.4 ± 6.1 µg DNA / g of sample, the relative Repeatability Standard Deviation (RSDr) was 6.7%. Therefore, the soybean DNA extraction procedure is sufficiently efficient and yields adequate amounts of genomic DNA with a sufficient level of repeatability.
CRL-GMFF: Soybean Seeds Sampling and DNA Extraction 9/17
CRLVL13/05XP
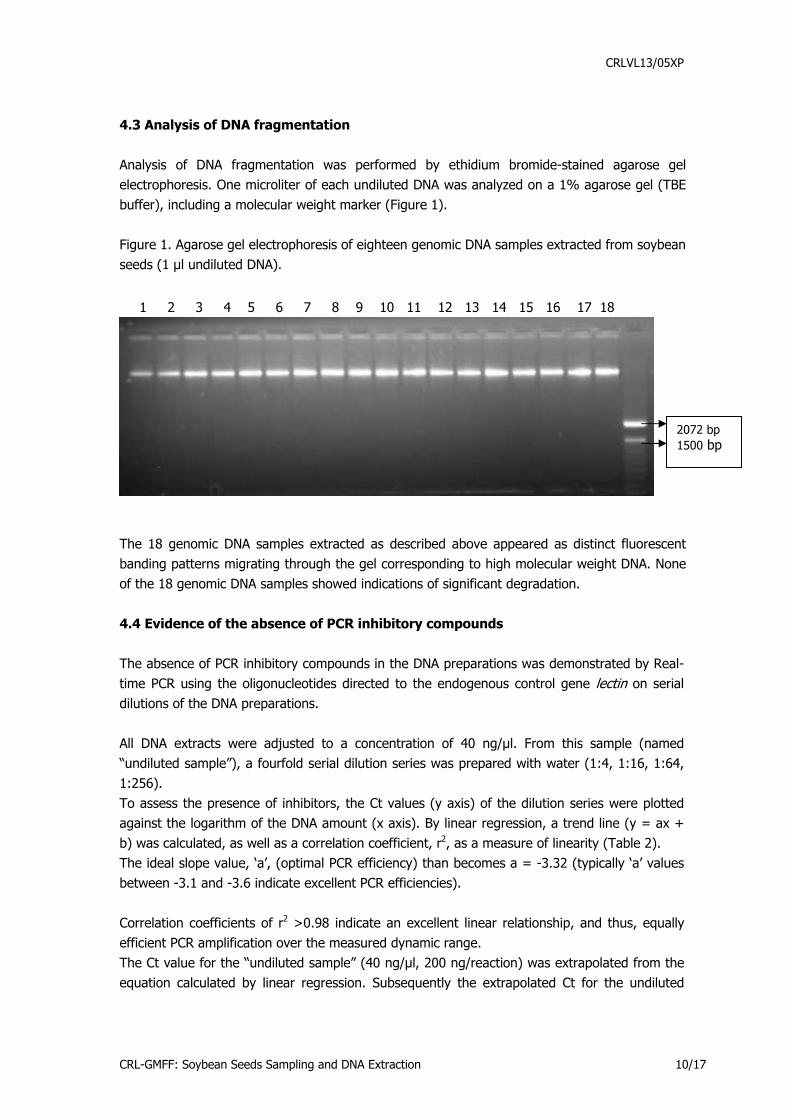
4.3 Analysis of DNA fragmentation Analysis of DNA fragmentation was performed by ethidium bromide-stained agarose gel electrophoresis. One microliter of each undiluted DNA was analyzed on a 1% agarose gel (TBE buffer), including a molecular weight marker (Figure 1). Figure 1. Agarose gel electrophoresis of eighteen genomic DNA samples extracted from soybean seeds (1 µl undiluted DNA).
2072 bp 1500 bp
1 2 3 4 5 6 7 8 9 10 11 12 13 14 15 16 17 18
The 18 genomic DNA samples extracted as described above appeared as distinct fluorescent banding patterns migrating through the gel corresponding to high molecular weight DNA. None of the 18 genomic DNA samples showed indications of significant degradation. 4.4 Evidence of the absence of PCR inhibitory compounds The absence of PCR inhibitory compounds in the DNA preparations was demonstrated by Real-time PCR using the oligonucleotides directed to the endogenous control gene lectin on serial dilutions of the DNA preparations. All DNA extracts were adjusted to a concentration of 40 ng/µl. From this sample (named “undiluted sample”), a fourfold serial dilution series was prepared with water (1:4, 1:16, 1:64, 1:256). To assess the presence of inhibitors, the Ct values (y axis) of the dilution series were plotted against the logarithm of the DNA amount (x axis). By linear regression, a trend line (y = ax + b) was calculated, as well as a correlation coefficient, r2, as a measure of linearity (Table 2). The ideal slope value, ‘a’, (optimal PCR efficiency) than becomes a = -3.32 (typically ‘a’ values between -3.1 and -3.6 indicate excellent PCR efficiencies). Correlation coefficients of r2 >0.98 indicate an excellent linear relationship, and thus, equally efficient PCR amplification over the measured dynamic range. The Ct value for the “undiluted sample” (40 ng/µl, 200 ng/reaction) was extrapolated from the equation calculated by linear regression. Subsequently the extrapolated Ct for the undiluted
CRL-GMFF: Soybean Seeds Sampling and DNA Extraction 10/17
CRLVL13/05XP
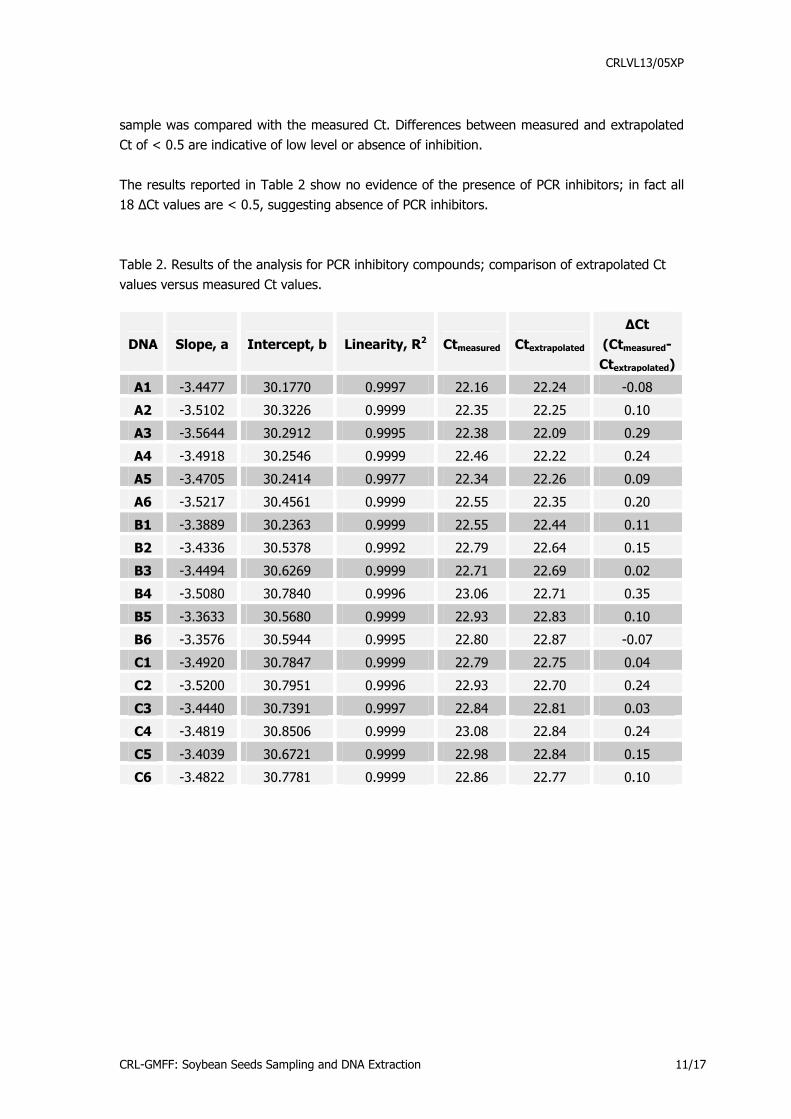
sample was compared with the measured Ct. Differences between measured and extrapolated Ct of < 0.5 are indicative of low level or absence of inhibition. The results reported in Table 2 show no evidence of the presence of PCR inhibitors; in fact all 18 ∆Ct values are < 0.5, suggesting absence of PCR inhibitors. Table 2. Results of the analysis for PCR inhibitory compounds; comparison of extrapolated Ct values versus measured Ct values.
DNA Slope, a Intercept, b Linearity, R2 Ctmeasured Ctextrapolated
∆Ct (Ctmeasured-Ctextrapolated)
A1 -3.4477 30.1770 0.9997 22.16 22.24 -0.08
A2 -3.5102 30.3226 0.9999 22.35 22.25 0.10
A3 -3.5644 30.2912 0.9995 22.38 22.09 0.29
A4 -3.4918 30.2546 0.9999 22.46 22.22 0.24
A5 -3.4705 30.2414 0.9977 22.34 22.26 0.09
A6 -3.5217 30.4561 0.9999 22.55 22.35 0.20
B1 -3.3889 30.2363 0.9999 22.55 22.44 0.11
B2 -3.4336 30.5378 0.9992 22.79 22.64 0.15
B3 -3.4494 30.6269 0.9999 22.71 22.69 0.02
B4 -3.5080 30.7840 0.9996 23.06 22.71 0.35
B5 -3.3633 30.5680 0.9999 22.93 22.83 0.10
B6 -3.3576 30.5944 0.9995 22.80 22.87 -0.07
C1 -3.4920 30.7847 0.9999 22.79 22.75 0.04
C2 -3.5200 30.7951 0.9996 22.93 22.70 0.24
C3 -3.4440 30.7391 0.9997 22.84 22.81 0.03
C4 -3.4819 30.8506 0.9999 23.08 22.84 0.24
C5 -3.4039 30.6721 0.9999 22.98 22.84 0.15
C6 -3.4822 30.7781 0.9999 22.86 22.77 0.10
CRL-GMFF: Soybean Seeds Sampling and DNA Extraction 11/17
CRLVL13/05XP
5. Experimental testing of the DNA extraction method by the Community Reference Laboratory for GM Food and Feed The aim of the experimental testing was to verify that the DNA extraction method provides DNA of suitable quantity and quality for the intended purpose. The DNA extraction method should allow preparation of the analyte in quality and quantity appropriate for the analytical method used to quantify the event-specific analyte versus the reference analyte. The CRL-GMFF tested the “Dellaporta-derived” method proposed by the applicant on samples of food and feed consisting of ground soybean seeds provided by the applicant. To assess the suitability of the DNA extraction method for real-time PCR analysis, the extracted DNA was tested using a qualitative PCR run on the real-time PCR equipment. 5.1 Preparation of samples About 200 g of soybean seed material were ground using a GRINDOMIX GM 200 (Retsch GmbH) mixer. 5.2 DNA extraction DNA was extracted following the “Dellaporta-derived” method described above; the DNA extraction was carried out on 6 test portions (replicates) and repeated over three different days, giving a total of 18 DNA extractions. 5.3 DNA concentration, yield and repeatability Concentration of the DNA extracted was determined by fluorescence detection using the PicoGreen dsDNA Quantitation Kit (Molecular Probes). Each DNA extract was measured twice, and the two values were averaged. DNA concentration was determined on the basis of a five point standard curve ranging from 1 to 500 ng/µl using a Biorad VersaFluor fluorometer. The DNA concentration for all samples is reported in the Table 3.
CRL-GMFF: Soybean Seeds Sampling and DNA Extraction 12/17
CRLVL13/05XP
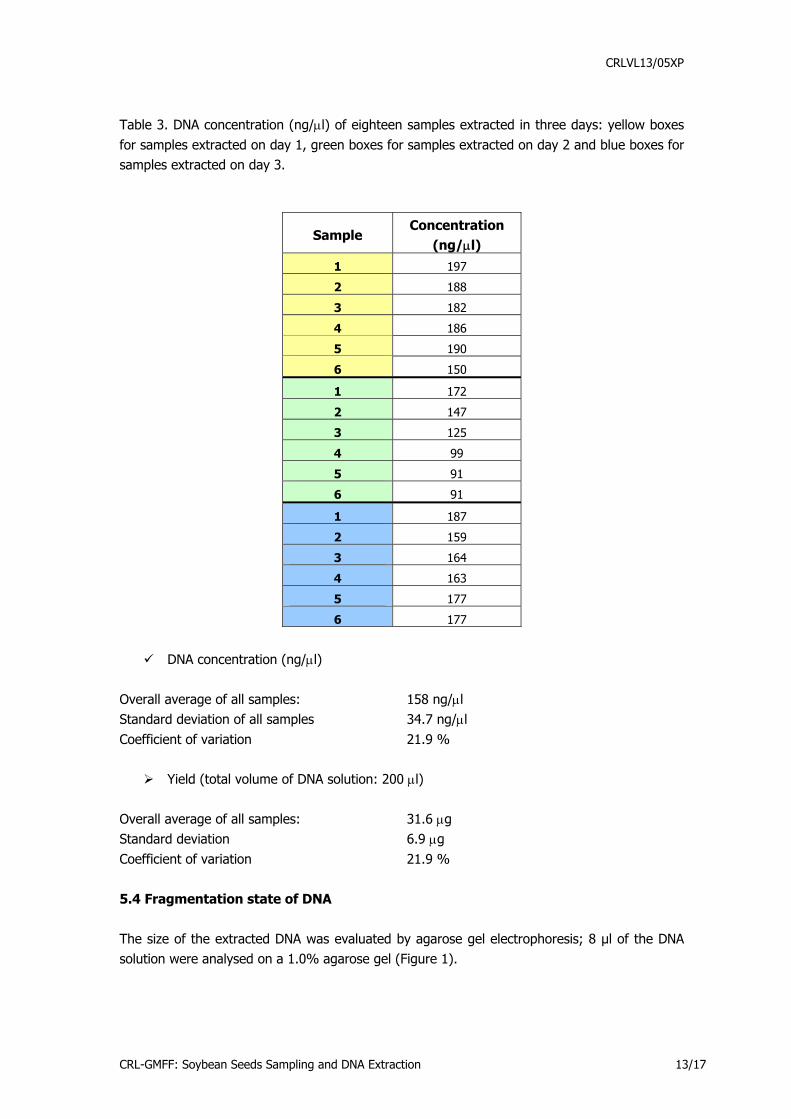
Table 3. DNA concentration (ng/µl) of eighteen samples extracted in three days: yellow boxes for samples extracted on day 1, green boxes for samples extracted on day 2 and blue boxes for samples extracted on day 3.
Sample Concentration
(ng/µl) 1 197
2 188
3 182
4 186
5 190
6 150
1 172
2 147
3 125
4 99
5 91
6 91
1 187
2 159
3 164
4 163
5 177
6 177
DNA concentration (ng/µl)
Overall average of all samples: 158 ng/µl Standard deviation of all samples 34.7 ng/µl Coefficient of variation 21.9 %
Yield (total volume of DNA solution: 200 µl) Overall average of all samples: 31.6 µg Standard deviation 6.9 µg Coefficient of variation 21.9 % 5.4 Fragmentation state of DNA The size of the extracted DNA was evaluated by agarose gel electrophoresis; 8 µl of the DNA solution were analysed on a 1.0% agarose gel (Figure 1).
CRL-GMFF: Soybean Seeds Sampling and DNA Extraction 13/17
CRLVL13/05XP
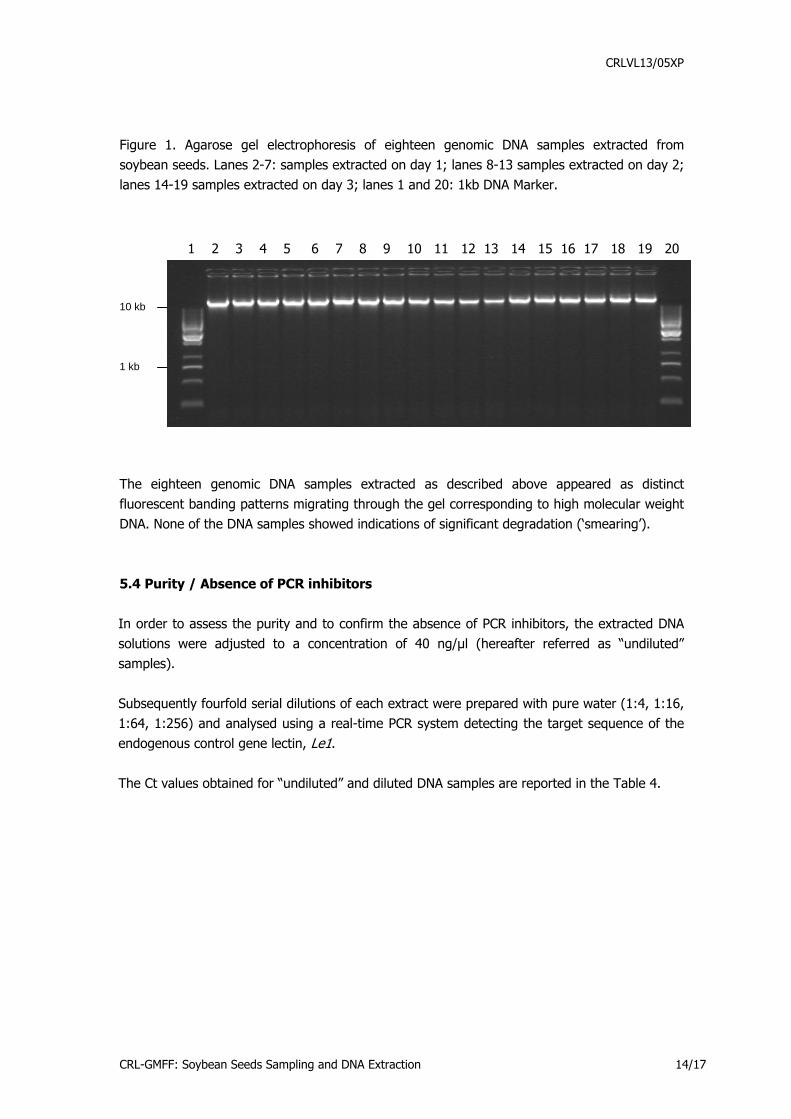
Figure 1. Agarose gel electrophoresis of eighteen genomic DNA samples extracted from soybean seeds. Lanes 2-7: samples extracted on day 1; lanes 8-13 samples extracted on day 2; lanes 14-19 samples extracted on day 3; lanes 1 and 20: 1kb DNA Marker. 1 2 3 4 5 6 7 8 9 10 11 12 13 14 15 16 17 18 19 20
10 kb
1 kb
The eighteen genomic DNA samples extracted as described above appeared as distinct fluorescent banding patterns migrating through the gel corresponding to high molecular weight DNA. None of the DNA samples showed indications of significant degradation (‘smearing’). 5.4 Purity / Absence of PCR inhibitors In order to assess the purity and to confirm the absence of PCR inhibitors, the extracted DNA solutions were adjusted to a concentration of 40 ng/µl (hereafter referred as “undiluted” samples). Subsequently fourfold serial dilutions of each extract were prepared with pure water (1:4, 1:16, 1:64, 1:256) and analysed using a real-time PCR system detecting the target sequence of the endogenous control gene lectin, Le1. The Ct values obtained for “undiluted” and diluted DNA samples are reported in the Table 4.
CRL-GMFF: Soybean Seeds Sampling and DNA Extraction 14/17
CRLVL13/05XP
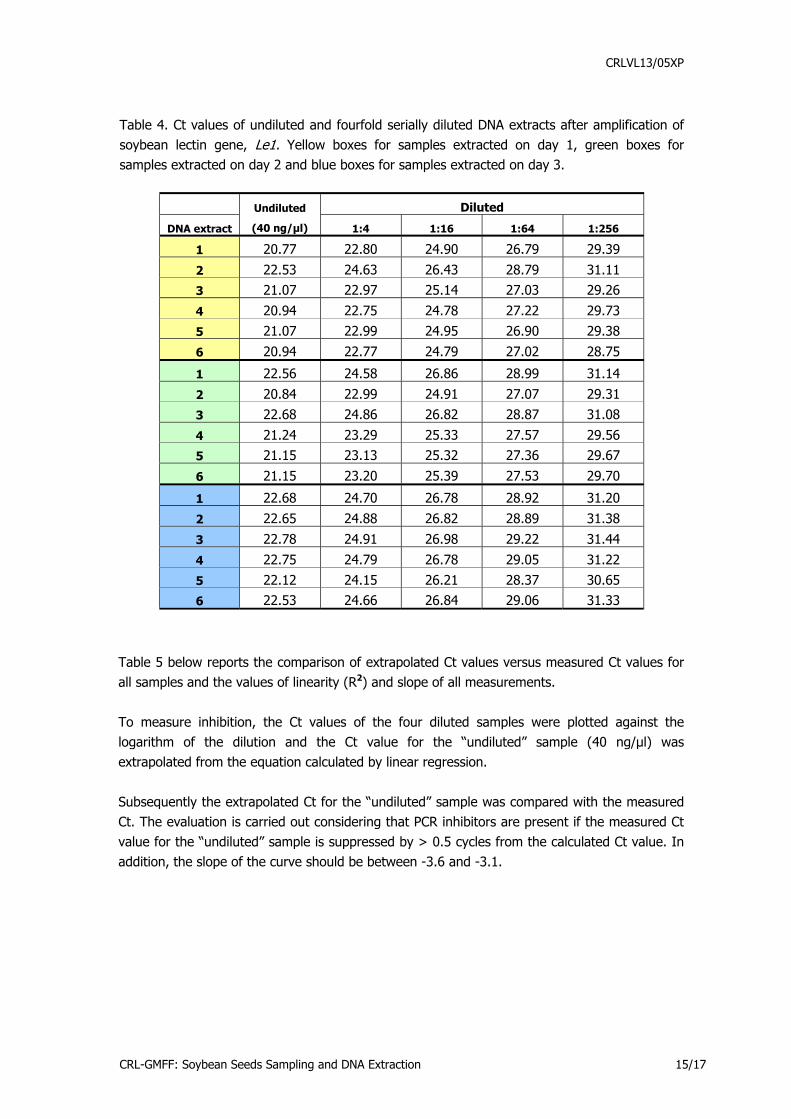
Table 4. Ct values of undiluted and fourfold serially diluted DNA extracts after amplification of soybean lectin gene, Le1 Yellow boxes for samples extracted on day 1, green boxes for samples extracted on day 2 and blue boxes for samples extracted on day 3.
.
Diluted
DNA extract
Undiluted
(40 ng/µl) 1:4 1:16 1:64 1:256
1 20.77 22.80 24.90 26.79 29.39
2 22.53 24.63 26.43 28.79 31.11 3 21.07 22.97 25.14 27.03 29.26
4 20.94 22.75 24.78 27.22 29.73 5 21.07 22.99 24.95 26.90 29.38
6 20.94 22.77 24.79 27.02 28.75
1 22.56 24.58 26.86 28.99 31.14
2 20.84 22.99 24.91 27.07 29.31 3 22.68 24.86 26.82 28.87 31.08
4 21.24 23.29 25.33 27.57 29.56 5 21.15 23.13 25.32 27.36 29.67
6 21.15 23.20 25.39 27.53 29.70
1 22.68 24.70 26.78 28.92 31.20
2 22.65 24.88 26.82 28.89 31.38
3 22.78 24.91 26.98 29.22 31.44
4 22.75 24.79 26.78 29.05 31.22 5 22.12 24.15 26.21 28.37 30.65 6 22.53 24.66 26.84 29.06 31.33
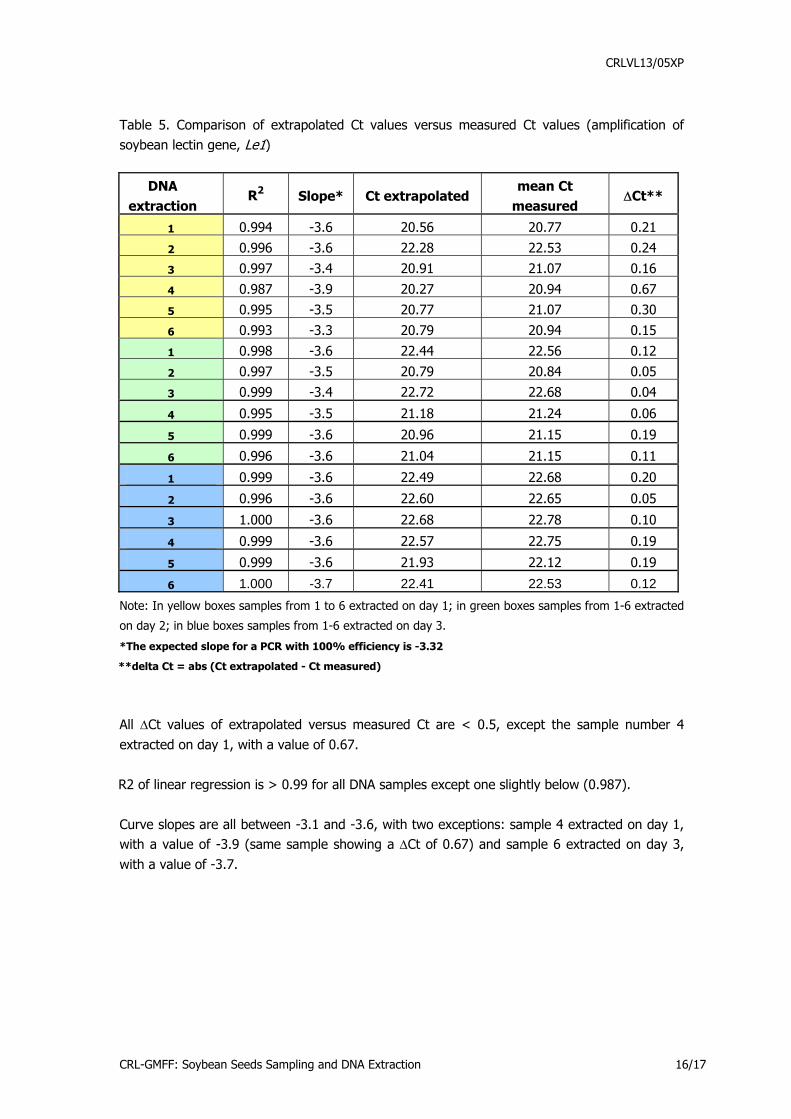
Table 5 below reports the comparison of extrapolated Ct values versus measured Ct values for all samples and the values of linearity (R2) and slope of all measurements. To measure inhibition, the Ct values of the four diluted samples were plotted against the logarithm of the dilution and the Ct value for the “undiluted” sample (40 ng/µl) was extrapolated from the equation calculated by linear regression. Subsequently the extrapolated Ct for the “undiluted” sample was compared with the measured Ct. The evaluation is carried out considering that PCR inhibitors are present if the measured Ct value for the “undiluted” sample is suppressed by > 0.5 cycles from the calculated Ct value. In addition, the slope of the curve should be between -3.6 and -3.1.
CRL-GMFF: Soybean Seeds Sampling and DNA Extraction 15/17
CRLVL13/05XP
Table 5. Comparison of extrapolated Ct values versus measured Ct values (amplification of soybean lectin gene, Le1)
DNA extraction
R2 Slope* Ct extrapolated mean Ct
measured ∆Ct**
1 0.994 -3.6 20.56 20.77 0.21
2 0.996 -3.6 22.28 22.53 0.24
3 0.997 -3.4 20.91 21.07 0.16
4 0.987 -3.9 20.27 20.94 0.67
5 0.995 -3.5 20.77 21.07 0.30
6 0.993 -3.3 20.79 20.94 0.15
1 0.998 -3.6 22.44 22.56 0.12
2 0.997 -3.5 20.79 20.84 0.05
3 0.999 -3.4 22.72 22.68 0.04
4 0.995 -3.5 21.18 21.24 0.06
5 0.999 -3.6 20.96 21.15 0.19
6 0.996 -3.6 21.04 21.15 0.11
1 0.999 -3.6 22.49 22.68 0.20
2 0.996 -3.6 22.60 22.65 0.05
3 1.000 -3.6 22.68 22.78 0.10
4 0.999 -3.6 22.57 22.75 0.19
5 0.999 -3.6 21.93 22.12 0.19
6 1.000 -3.7 22.41 22.53 0.12 Note: In yellow boxes samples from 1 to 6 extracted on day 1; in green boxes samples from 1-6 extracted
on day 2; in blue boxes samples from 1-6 extracted on day 3.
*The expected slope for a PCR with 100% efficiency is -3.32
**delta Ct = abs (Ct extrapolated - Ct measured)
All ∆Ct values of extrapolated versus measured Ct are < 0.5, except the sample number 4 extracted on day 1, with a value of 0.67. R2 of linear regression is > 0.99 for all DNA samples except one slightly below (0.987). Curve slopes are all between -3.1 and -3.6, with two exceptions: sample 4 extracted on day 1, with a value of -3.9 (same sample showing a ∆Ct of 0.67) and sample 6 extracted on day 3, with a value of -3.7.
CRL-GMFF: Soybean Seeds Sampling and DNA Extraction 16/17
CRLVL13/05XP
6. Conclusion The data reported confirm that the extraction method, applied to soybean seeds provided by the applicant, produces DNA of suitable quantity and quality for subsequent PCR based detection applications. The method is consequently applicable to samples of soybean seeds provided as samples of food and feed in accordance with the requirements of Annex I-2.C.2 to Commission Regulation (EC) No 641/2004.
7. Quality assurance The CRL-GMFF carries out all operations according to ISO 9001:2000 (certificate number: CH-32232) and ISO 17025:2005 (certificate number: DAC-PL-0459-06-00) [DNA extraction, qualitative and quantitative PCR in the area of Biology (DNA extraction and PCR method validation for the detection and identification of GMOs in food and feed materials)]
8. References 1. Dellaporta et al. [1983] Plant Molecular Biology Reporter 1, nr 4, pp. 19-21. 2. Sambrook J. and D. W. Russell. Molecular Cloning. A laboratory manual. Third edition. 2001. Cold Spring Harbor Laboratory Press.
CRL-GMFF: Soybean Seeds Sampling and DNA Extraction 17/17