Embed Size (px)
Citation preview

animals
Article
Soybean Oil Replacement by Palm Fatty Acid Distillate inBroiler Chicken Diets: Fat Digestibility and Lipid-ClassContent along the Intestinal Tract
Beatriz Jimenez-Moya 1 , Ana C. Barroeta 1, Alba Tres 2,3 , María Dolores Soler 4 and Roser Sala 1,*
�����������������
Citation: Jimenez-Moya, B.; Barroeta,
A.C.; Tres, A.; Soler, M.D.; Sala, R.
Soybean Oil Replacement by Palm
Fatty Acid Distillate in Broiler
Chicken Diets: Fat Digestibility and
Lipid-Class Content along the
Intestinal Tract. Animals 2021, 11,
1035. https://doi.org/10.3390/
ani11041035
Academic Editor: Beob Gyun Kim
Received: 2 March 2021
Accepted: 1 April 2021
Published: 6 April 2021
Publisher’s Note: MDPI stays neutral
with regard to jurisdictional claims in
published maps and institutional affil-
iations.
Copyright: © 2021 by the authors.
Licensee MDPI, Basel, Switzerland.
This article is an open access article
distributed under the terms and
conditions of the Creative Commons
Attribution (CC BY) license (https://
creativecommons.org/licenses/by/
4.0/).
1 Animal Nutrition and Welfare Service (SNiBA), Animal and Food Science Department, Faculty of Veterinary,Universitat Autònoma de Barcelona, Edifici V, Travessera dels Turons, 08193 Bellaterra, Spain;[email protected] (B.J.-M.); [email protected] (A.C.B.)
2 Departament de Nutrició, Ciències de l’Alimentació i Gastronomia, Campus de l’Alimentació Torribera,Facultat de Farmàcia i Ciències de l’Alimentació, Universitat de Barcelona, Av Prat de la Riba, 171,08921 Santa Coloma de Gramenet, Spain; [email protected]
3 Institut de Recerca en Nutrició i Seguretat Alimentària (INSA-UB), Universitat de Barcelona, Av Prat de laRiba, 171, 08921 Santa Coloma de Gramenet, Spain
4 AviFeed Science, Department of Animal Production and Health Public Veterinary Health and Food Scienceand Technology, Facultad de Veterinaria, Universidad Cardenal Herrera-CEU, CEU Universities, Calle Tirantlo Blanch, 7, 46115 Alfara del Patriarca, Valencia, Spain; [email protected]
* Correspondence: [email protected]
Simple Summary: Palm fatty acid distillate is a by-product of palm oil refining. It is of bothenvironmental and economic interest to include it in the diets of broiler chickens. However, its highsaturation degree and acidity level limit its use. This study aimed to assess the effect of replacingsoybean oil with increasing levels of palm fatty acid distillate on the utilization of fat by broilers.Dietary fat hydrolysis was mostly affected by the age of the bird and including palm fatty aciddistillate mainly affected the absorption process. The replacement of soybean oil by palm fatty aciddistillate reduced the total fat utilization, and in starter chicks delayed the site of fatty acid absorption.As the age increased, the digestibility of saturated fatty acids improved, and, above all, it improvedthe free fatty acid utilization. Therefore, the potential inclusion of palm fatty acid distillate for broilerfeeds depends on the age of the bird. It would not be recommended to include this by-productin starter feeds. However, for the grower-finisher phase, blending palm fatty acid distillate withsoybean oil (1:3, w/w) could be a suitable alternative, that does not have negative repercussions foreither fatty acid absorption or growth performance.
Abstract: Palm fatty acid distillate (PFAD) is a by-product of palm oil (P) refining. Its use in chickendiets is a way to reduce the cost of feed and the environmental impact. Its low unsaturated:saturatedfatty acid ratio (UFA:SFA) and its high free fatty acid (FFA) level could be partially counteracted byits blending with soybean oil (S). The objective was to assess the effect of replacing S with differentlevels of PFAD on lipid-class content and fatty acid (FA) digestibility along the intestinal tract andin the excreta of 11 and 35-day-old broiler chickens. Five experimental diets were prepared bysupplementing a basal diet with S (S6), PFAD (PA6), two blends of them (S4-PA2 and S2-PA4), or P(P6) at 6%. Replacing S with PFAD did not affect performance parameters (p > 0.05) but negativelyaffected feed AME, FA digestibility, and FFA intestinal content (p < 0.05), especially in starter chicks.Including PFAD delayed total FA (TFA) absorption (p < 0.05) at 11 days, but at 35 days it did not affectthe TFA absorption rate. The use of PFAD blended with S, when FFA ≤ 30% and UFA:SFA ≥ 2.6, ledto adequate energy utilization in broiler grower-finisher diets.
Keywords: fat digestibility; lipid classes; free fatty acid; fat by-product; fatty acid distillate; alternativeenergy source; broiler chickens; poultry; intestinal tract
Animals 2021, 11, 1035. https://doi.org/10.3390/ani11041035 https://www.mdpi.com/journal/animals
Animals 2021, 11, 1035 2 of 19
1. Introduction
Fats are usually used in poultry diets as they satisfy a large fraction of the energyrequirements. Palm fatty acid distillate (PFAD) is a fat by-product from the productionof refined palm oil (P) which is one of the most produced and consumed vegetable oilsworldwide [1]. Usually, P is obtained by a physical refining process that includes differentsteps, namely degumming, winterization (optional), bleaching, and deodorization [2]. Thelatter step is a vacuum steam distillation process that removes the FFA that are accumulatedin the fatty acid distillate [3]. PFAD is characterized by having a high proportion of free fattyacids (FFA: 87–94%, being rich in saturated FA (SFA) and including other compounds suchas tocopherols [4]). Based on a circular economy and taking into account the rising cost ofconventional fats, there is increased interest in upcycling by-products from the fat industryfor animal feeding to reduce the cost of feed formulation and also the environmentalimpact [5,6].
Assessing the digestibility of a fat ingredient is one of the clearest ways of definingits nutritional value for an animal. Conventional fat and oil sources used in poultryfeed mainly consist of triacylglycerol (TAG) molecules. During digestion, TAGs, anddiacylglycerols (DAGs) are hydrolyzed into monoacylglycerol (MAG) and FFA, whichare incorporated into dietary mixed micelles (DMM) to attain the enterocytes for theirabsorption. Therefore, studying the evolution of the lipid classes (TAG, DAG, MAG, andFFA) and FA digestibility along the different segments of the gastrointestinal tract (GIT)may be of great interest for understanding the dynamics of fat digestion [7,8], mainly innew alternative fat sources rich in FFA and also in fat blends.
The PFAD is rich in FFA and also in SFA. It is well known that the degree of FAsaturation plays and important role in fat absorption. In broiler chickens, although SFAsare not digested as well as unsaturated FA (UFA), several authors have found a synergisticeffect when saturated sources are blended with unsaturated ones [9–11]. In fact, recentstudies have found that the saturation degree of the dietary fat has more influence on fatdigestibility than its FFA content [5,12]. Moreover, it has been suggested that there is apositive effect on FFA digestibility when there are increasing amounts of DAG or MAG,because their emulsifying effect enhances the inclusion of FFA in DMM [13]. However,there are few studies on FA absorption using blends of crude (rich in TAG) and acid (richin FFA) oils.
Furthermore, it is accepted that the absorption of FA is also affected by the age ofthe chickens. Better results in the hydrolysis–absorption process along with the GIT ofconventional and alternative fats have been obtained in grower-finisher chickens comparedto starter broiler chickens [8].
Therefore, our hypothesis is that PFAD in combination with soybean oil (S) could beconsidered as an alternative energy source for broiler chicken diets, but the use of PFADmight be influenced by the age of the chicken. Thus, the aim of the present study was toresearch the effect of replacing S with graded levels of PFAD on lipid-class content and FAdigestibility along the intestinal segments of the GIT (upper and lower jejunum, upper andlower ileum) and in the excreta in starter and grower-finisher broiler chickens.
2. Materials and Methods2.1. Housing and Animals
The study was carried out at the animal experimental facilities of the Servei de Grangesi Camps Experimentals (Universitat Autònoma de Barcelona; Bellaterra, Barcelona, Spain).All management practices and procedures were approved by the Animal Ethics Committee(CEEAH) of the same institution (number code: 3938), in accordance with the EuropeanUnion guidelines for the care and use of animals in research (2010/63/EU).
A total of 480 newly hatched female broiler chickens (Ross 308) were obtained from acommercial hatchery (Pondex SAU; Lleida, Spain). On arrival, birds were wing-banded,individually weighed and randomly allocated to cages (16 birds per cage) and assignedto one of the five dietary treatments (six replicas per treatment). Birds were housed in

Animals 2021, 11, 1035 3 of 19
metabolic cages, with a grid floor and excreta collection tray, located in an environmentallycontrolled room. Throughout the study, feed and water were offered ad libitum. Thetemperature, humidity, ventilation, and illumination were automatically controlled, asrecommended by the specifications in the Ross 308 lineage management handbook [14].The animals and housing facilities were inspected, at least twice a day (d).
2.2. Experimental Design and Diets
All birds were raised with a starter feed until d 22 and a grower-finisher feed from d23 to d 35, both in mash form. The wheat- and soybean meal-based diet was formulated tomeet or exceed FEDNA’s (Fundación Española para el Desarrollo de la Nutrición Animal)requirements [15] and to minimize basal fat levels, as shown in Table 1. Titanium dioxide(TiO2) was included (5 g/kg) as an inert marker for determining the digestibility of FA.
Table 1. Ingredient composition of the experimental basal diet.
Ingredients, % Starter Diet(from 0 d to 22 d)
Grower-Finisher Diet(from 23 d to 35 d)
Wheat 54.49 44.02Soybean meal 47% 35.40 27.25
Barley - 18.58Experimental fats 1 6.00 6.00Calcium carbonate 1.44 1.39
Monocalcium phosphate 0.99 1.20Titanium dioxide 0.50 0.50
Vitamin and mineral premix 2 0.40 0.40Sodium chloride 0.40 0.35DL-Methionine 0.23 0.17
L-Lysine 0.15 0.12L-Threonine - 0.02
1 Soybean oil, palm oil and palm fatty acid distillate in different proportions. 2 Provides per kg of feed: vitaminA (from retinol), 10,000 IU; vitamin D3 (from cholecalciferol), 4800 IU; vitamin E (from alfa tocopherol), 45 mg;vitamin B1, 3 mg; vitamin B2, 9 mg; vitamin B6, 4.5 mg; vitamin B12, 40 µg; vitamin K3, 3 mg; calciumpantothenate, 16.5 mg; nicotinic acid, 51 mg; folic acid, 1.8 mg; biotin, 150 µg; Fe (from FeSO4·7H2O), 54 mg; I(from Ca(I2O3)2), 1.2 mg; Cu (from CuSO4·5H2O), 12 mg; Mn (from MnO), 90 mg; Zn (from ZnO), 66 mg; Se(from Na2SeO3), 0.18 mg; β-glucanase 150 U; xylanase 270 U.
The experimental diets consisted in a basal diet supplemented with 6% of the differentfat sources (Table 2). The S was included at 6% (S6) and increasing amounts of PFAD wereadded in replacement of S: S4-PA2 (4% of S and 2% of PFAD), S2-PA4 (2% of S and 4% ofPFAD) and PA6 (PFAD at 6%). The P was included at 6% (P6) as a control treatment forPFAD. Thus, 5 different diets were compared that were replicated 6 times. The compositionof the experimental diets is shown in Table 3. The basal diet was manufactured at PinsosMolinet S.A., (Prats de Lluçanès, Barcelona, Spain) and the addition of the experimental fatsources or fat blends to manufacture the experimental diets was performed at Lindo PetGlobal S.A. (Castellar del Vallès, Barcelona, Spain).

Animals 2021, 11, 1035 4 of 19
Table 2. Chemical analyses of the experimental fats 1.
Item S PFAD P
Moisture (g/100 g) ND 0.01 NDInsoluble impurities (g/100 g) 1.27 3.76 0.59
Unsaponifiable matter (g/100 g) 0.99 1.34 0.21
Fatty acid composition (%) 2
C16:0 10.98 46.59 43.94C18:0 3.47 6.62 4.64
C18:1 n-9 25.11 34.96 38.43C18:2 n-6 51.70 8.49 9.70C18:3 n-3 5.34 0.29 0.13
Minor fatty acids 3.40 3.05 3.15SFA 15.86 55.13 50.64
cis-MUFA 27.06 35.87 39.44trans-C18:1 0.04 0.22 0.08
PUFA 57.04 8.78 9.83UFA:SFA 5.29 0.82 0.98
Lipid class composition (%) 3
TAG 96.27 4.01 92.46DAG 3.23 3.04 7.54MAG ND ND NDFFA 0.50 92.94 ND
T (mg/kg) 1007.31 42.79 199.40T3 (mg/kg) ND 52.59 431.87
Abbreviations: S, soybean oil; P, palm oil; PFAD, palm fatty acid distillate; SFA, saturated fatty acids; MUFA,monounsaturated fatty acids; PUFA, polyunsaturated fatty acids; UFA:SFA, unsaturated to saturated fattyacid ratio, calculated as described by Varona et al. [4]; TAG, triacylglycerols; DAG, diacylglycerols; MAG,monoacylglycerols; FFA, free fatty acids; T, sum of α-, β-, γ- and δ-tocopherols; T3, sum of α-, β-, γ- and δ-tocotrienols; ND, not detected. 1 Chemical composition analyzed as described by Varona et al. [4]. 2 Percentage oftotal fatty acids (normalized data, area %); 3 Percentage of total lipid classes (normalized data, area %).
Table 3. Analyzed 1 macronutrient content and fatty-acid and lipid-class composition of the experimental diets 2.
ItemStarter Diets (from 0 to 22 d) Grower-Finisher Diets (from 23 to 35 d)
S6 S4-PA2 S2-PA4 PA6 P6 S6 S4-PA2 S2-PA4 PA6 P6
Macronutrient contentDry matter (g/100 g) 91.00 91.03 91.14 90.89 90.93 90.14 90.27 90.37 90.43 90.02
Crude protein (g/100 g) 23.61 23.87 23.47 23.60 23.15 21.04 22.03 21.45 20.59 20.84Crude fat (g/100 g) 7.51 7.39 8.16 7.78 7.70 8.18 8.08 8.36 8.10 7.49
Crude fiber (g/100 g) 3.29 3.14 3.14 2.86 3.20 3.08 3.10 3.32 3.13 3.41Ash (g/100 g) 5.54 5.58 6.92 7.13 7.09 6.21 6.69 6.51 6.46 5.75
Gross energy, kcal/kg 4367 4402 4368 4332 4332 4339 4355 4320 4308 4324
Fatty acid composition (%)C14:0 - 0.40 0.66 0.91 0.87 0.06 0.39 0.65 0.90 0.85C16:0 14.43 21.99 30.79 39.07 37.38 13.24 21.93 30.24 39.18 36.85C18:0 3.48 4.19 5.07 5.79 4.29 3.35 4.19 4.97 5.69 4.17
C18:1 n-9 22.83 25.07 27.57 30.31 32.34 22.61 25.31 27.85 29.96 32.49C18:1 n-7 1.46 1.28 1.05 0.78 0.83 1.50 1.25 1.00 0.74 0.80C18:2 n-6 50.78 41.48 30.59 20.30 21.37 52.04 41.29 30.99 20.72 22.02C18:3 n-3 5.27 4.13 2.83 1.55 1.46 5.50 4.20 2.93 1.61 1.60
Minor fatty acids 1.75 1.46 1.45 1.29 1.46 1.69 1.44 1.38 1.19 1.22SFA 18.72 27.26 37.14 46.14 43.13 17.70 27.20 36.38 46.07 42.47
MUFA 25.24 27.13 29.44 32.01 34.04 24.76 27.31 29.70 31.60 33.92PUFA 56.04 45.61 33.42 21.85 22.83 57.54 45.49 33.92 22.33 23.62
UFA:SFA 4.16 2.60 1.66 1.14 1.30 4.54 2.61 1.70 1.15 1.34

Animals 2021, 11, 1035 5 of 19
Table 3. Cont.
ItemStarter Diets (from 0 to 22 d) Grower-Finisher Diets (from 23 to 35 d)
S6 S4-PA2 S2-PA4 PA6 P6 S6 S4-PA2 S2-PA4 PA6 P6
Lipid class composition (%)TAG 71.88 54.76 37.54 14.98 78.67 76.67 58.78 37.77 14.20 78.53DAG 11.73 10.05 7.47 4.67 10.54 10.23 9.03 7.28 5.58 10.44MAG 2.19 2.10 1.66 1.19 1.84 2.49 2.20 1.93 1.77 2.31FFA 14.20 33.08 53.33 79.17 8.96 10.61 29.99 53.01 78.44 8.72
Abbreviations: SFA, saturated fatty acids; MUFA, monounsaturated fatty acids; PUFA, polyunsaturated fatty acids; UFA:SFA, unsaturated tosaturated fatty acid ratio, calculated as described by Varona et al. [4]; TAG, triacylglycerols; DAG, diacylglycerols; MAG, monoacylglycerols;FFA, free fatty acids. 1 All samples were analyzed at least in duplicate. 2 Dietary treatments supplemented with 6% of soybean oil (S6),palm fatty acid distillate (PA6), palm oil (P6), or oil blends with 4% soybean oil and 2% palm fatty acid distillate (S4-PA2) or 2% soybean oiland 4% palm fatty acid distillate (S2-PA4). In all cases, fatty acids and lipid classes are expressed as internal area normalization (in %).
2.3. Controls and Sampling
Individual body weight (BW) and feed consumption by cage were measured at 11, 22and 35 d of age to calculate the average daily gain (ADG), average daily feed intake (ADFI)and the feed conversion ratio (FCR) throughout the experiment. Mortality was recordedand weighed to correct these parameters.
Two digestibility balances were performed in young animals from 9 to 11 d and inolder animals from 33 to 35 d. At 11 d of age, 12 birds per cage were killed by cervicaldislocation, and the jejunum (from the distal-most point of insertion of the duodenalmesentery to the junction with Meckel’s diverticulum), and ileum (from the junction withMeckel’s diverticulum to a point 1 cm proximal to the ileocecal junction) were carefullyexcised. Then, both segments (jejunum and ileum) were divided into 2 equal portions,named as upper and lower. Thus, for each cage, samples were taken of the digestivecontent from the upper and lower jejunum and the upper and lower ileum. The samplesfrom the 12 birds from each cage were then homogenized and pooled (n = 6 per type ofsample and dietary treatment). A representative sample of excreta (free of contaminants,such as feed or feathers) was also taken from each cage. Samples were frozen at −20 ◦C,and lyophilized. Thus, 5 different digesta samples were taken: 4 intestinal segments andexcreta. Samples of diets, digesta and excreta were ground to pass through a 0.5-mm sieveand kept at 4 ◦C until further analyses. At 35 d of age, 2 birds per cage were euthanized,and the same procedure described above was carried out for sampling. In addition, at35 d the abdominal fat pad (from the proventriculus surrounding the gizzard down tothe cloaca) of each bird was removed and weighed. Abdominal fat pad weights wereexpressed in absolute values and as a percentage of BW.
2.4. Chemical Analysis
Oil samples were analyzed in triplicate for moisture and volatile matter according tothe AOCS official method Ca 2d-25 [16], insoluble impurities [17], unsaponifiable matteraccording to the AOCS official method Ca 6b-53 [18], lipid-class composition according toIUPAC (2508 method) [19], and total FA composition [20], that were adapted to acid oils byVarona et al. [4]. The chemical analyses of the experimental fats are shown in Table 2.
Analytical determinations of the diets were performed according to the methods ofAOAC International [21]: dry matter (Method 934.01), ash (Method 942.05), crude protein(Method 968.06), crude fiber (Method 962.09), and ether extract (EE) by Soxhlet analysis(Method 920.39). Gross energy was determined by an adiabatic bomb calorimeter (IKAC-4000, Janke-Kunkel; Staufen, Germany).
TiO2 in feed, digestive content and excreta was analyzed following the procedures ofShort et al. [22] and determined by spectrophotometry ICP-OES (Optima 3200 RL, PerkinElmer, Waltham, MA, USA).
Animals 2021, 11, 1035 6 of 19
The FA content of the feed, digestive content, and excreta was determined accordingto the method of Sukhija and Palmquist [23]. A direct extraction-transesterification proce-dure using nonadecanoic acid (C19:0; Sigma Aldrich Chemical Co.; St. Louis, MO, USA)as internal standard was performed. Then, the lipid extract was injected in a gas chro-matograph (HP6890, Agilent Technologies; Waldbronn, Germany) under the conditionsof the method previously described by Cortinas et al. [24]. FAs were identified based onthe retention times of commercial standards of major FA (Supelco 37 component FAMEMix; Sigma-Aldrich Co.). Quantification was carried out by internal normalization. Themacronutrient and FA compositions of the experimental diets are presented in Table 3.
The lipid-class composition (TAG, DAG, MAG, and FFA) of the feed, digestive content,and excreta was determined according to the IUPAC, 2508 method [19] by size-exclusionchromatography on an Agilent 1100 series HPLC chromatograph equipped with an iso-cratic pump, with the oven and a Refractive Index Detector (RID) both set at 35 ◦C (AgilentTechnologies, Santa Clara, USA). Lipid extraction was previously performed following themethodology described by Rodriguez-Sanchez et al. [8] with slight modifications. Briefly,0.1 g of lyophilized sample was weighed to extract the fat content with diethyl ether afteracidification with HCl 1N. After lipid extraction, lipids were dissolved in 2 mL of tetrahy-drofuran and filtered through a Nylon filter (13 mm, 0.45 µm), then 100 µL were injected(20 µL loop) into the HPLC. Separation was conducted using 2 Styragel columns (StyragelHR 1 and Styragel HR 0.5) of 30 cm × 0.78 cm i.d., filled with a spherical styrenedivinyl-benzene copolymer of 5-µm particle size and pore sizes of 100 Å and 50 Å, respectively(Water Associates; Milford, MA, USA), connected in series. The mobile phase consistedof tetrahydrofuran (HPLC quality grade) at 1 mL/min. Lipid classes were identified byusing standards for each lipid-class (trioleoylglycerol for TAG, dioleoylglycerol for DAG,oleoylglycerol for MAG and oleic acid for FFA; Sigma-Aldrich GmbH; Steinheim, Germany)and they were quantified according to their calibration curves.
2.5. Calculations
The apparent digestibility coefficients (ADC) of FA in each intestinal segment and theexcreta were calculated according to the following formula using the TiO2 marker ratio inthe diet and digesta or excreta.
ADC of FA = 1 − {(TiO2/FA)d/(TiO2/FA)e}, (1)
where (TiO2/FA)d is the concentration of the inert marker and the FA in the diet (g/g DM),and (TiO2/FA)e is the concentration of the inert marker and the FA in the digestive contentor excreta (g/g DM).
The apparent metabolizable energy (AME) was calculated with the following equation:
AME (kcal/kg) = Apparent digestibility coefficient of gross energy (%) ∗ gross energy of the diet (2)
To determine the lipid-class content in the different GIT segments and excreta, thecontent of each lipid class present in the digestive tract of the chickens was estimatedaccording to the following formula [12]:
Lipid-class content = [LC]/[TiO2], (3)
where [LC] is the concentration of the lipid-class in the digesta of the GIT segment or excreta(mg/g DM) and [TiO2] is the concentration of TiO2 in the digesta of the GIT segment orexcreta (mg/g DM).
2.6. Statistical Analysis
The study design included 2 main factors: diet (5 treatments) × intestinal segment(5 types, being 4 intestinal segments and the excreta). The effect of the age was alsocompared as described below (11 vs. 35 d). The normality of the data and homogeneityof variance were verified. For each age, the effect of the diet on productive parameters

Animals 2021, 11, 1035 7 of 19
(including abdominal fat depot at 35 d) and AME were statistically analyzed by one-wayANOVA using the GLM procedure of SAS (version 9.4, SAS Institute Inc., Cary, NC, USA)(n = 30; 5 diets × 6 replicas). For each age, and for each intestinal segment and excreta,the effect of the diet on the lipid-class content, FA digestibility, and its contribution on FAabsorption was also evaluated by one-way ANOVA (n = 30; 5 diets × 6 replicas).
For each age, the effect of the intestinal tract on the lipid-class content was alsoanalyzed by one-way ANOVA with the intestinal segments and the excreta as the mainfactor (n = 150; 30 samples × 5 types of digesta samples).
On each intestinal segment, the effect of the age (11 or 35 d) on FA absorption wasstatistically analyzed by one-way ANOVA using the age as the main factor (n = 60; 5 dietarytreatments replicated 6 times × 2 ages). Additionally, for each dietary treatment, one-wayANOVA was used to test the effect of the age on feed AME, and at lower ileum level onlipid-class content and FA digestibility, (n = 12; 6 replicas of lower ileum × 2 ages).
The differences between treatments means were tested using Tukey’s correction formultiple comparisons. The cage served as the experimental unit, so there were six unitsper diet.
The results shown in tables are reported as least-square means, and in all statisticalanalyses, differences were considered significant at p < 0.05.
3. Results3.1. Characterization of Experimental Oils and Diets
The characterization of the experimental oils included in the diets is shown in Table 2.The main FAs in S were linoleic and oleic acids, whereas in P and PFAD they were palmiticand oleic acids. The unsaturated-to-saturated FA ratio (UFA:SFA) was higher for S (5.29)than for PFAD and P (0.82 and 0.98, respectively). Regarding lipid-class composition, S andP were mainly composed of TAG (>92%), whereas PFAD was mainly composed of FFA(92.94%). The rest of parameters observed for PFAD were in line with those usually foundin PFAD [4], being insoluble impurities and unsaponifiable matter higher in PFAD thanin P.
The chemical analysis of the experimental diets is shown in Table 3. Replacing Swith PFAD led to an increment in both saturation degree and FFA content. Therefore, aprogressive decrease in the UFA:SFA from 4.16 to 1.14 in starter diets, and from 4.54 to 1.15in grower-finisher diets was obtained. In parallel, a large increase was achieved in the FFAcontent from 14.20% to 79.17% in starter diets and from 10.61% to 78.44% in grower-finisherdiets. Although the FA profile and saturation degree of P6 and PA6 were similar, their FFAcontent was different (P6: 8–9% FFA; PA6: 78–79% FFA).
3.2. Growth Performance and Abdominal Fat Deposition
The effect of dietary fat source on growth-performance traits in starter (from 0 to 22 d),grower-finisher (from 23 to 35 d) and the global (from 0 to 35 d) periods, and on abdominalfat deposition is reported in Table 4. No significant differences in any of the performanceparameters, nor any feeding period (p > 0.05), were observed due to the saturation degreeor FFA content of the diet. Concerning the effect of the diet on abdominal fat deposition,a tendency for a reduction of fat weight (%) was observed as S was replaced by PFAD(p = 0.08).

Animals 2021, 11, 1035 8 of 19
Table 4. Growth performance and abdominal fat pad deposition of broiler chickens according todifferent fat sources in diet 1.
ItemDietary Treatments 2
SEM 3 p-ValueS6 S4-PA2 S2-PA4 PA6 P6
From 0 to 22 dADFI, g/d/bird 48.7 53.2 50.7 54.0 54.5 2.25 0.335ADG, g/d/bird 37.2 39.1 38.6 39.7 40.6 1.24 0.373
FCR, g/g 1.31 1.36 1.31 1.36 1.34 0.036 0.733BW at 22 d, g 856 899 888 913 933 27.1 0.361
From 23 to 35 dADFI, g/d/bird 134 141 141 144 143 2.92 0.148ADG, g/d/bird 87.8 90.2 89.8 90.3 89.9 2.18 0.929
FCR, g/g 1.53 1.57 1.57 1.59 1.60 0.022 0.175BW at 35 d, g 1997 2072 2055 2086 2101 44.4 0.526
From 0 to 35 dADFI, g/d/bird 80.3 85.8 84.3 87.3 87.5 2.01 0.130ADG, g/d/bird 56.0 58.1 57.6 58.5 58.9 1.27 0.535
FCR, g/g 1.43 1.48 1.46 1.49 1.49 0.017 0.154
Abdominal fat, g 29.62 30.35 29.52 25.66 32.36 1.938 0.136Abdominal fat, % 1.46 1.47 1.42 1.23 1.53 0.082 0.080
Abbreviations: ADFI, average daily feed intake; ADG, average daily gain; FCR, feed conversion ratio; BW, bodyweight. 1 Diets supplemented with 6% of soybean oil (S6), palm fatty acid distillate (PA6), palm oil (P6), oroil blends with 4% soybean oil and 2% palm fatty acid distillate (S4-PA2) or 2% soybean oil and 4% palm fattyacid distillate (S2-PA4). 2 Values are pooled means of 6 replicates with 16 chickens/replicate from 0 to 11 d and4 chickens/replicate from 11 to 35 d. In the case of BW, values are means of 24 chickens each treatment from 22 to35 d. For abdominal fat, values are means of 2 chickens/replicate: 12 for each treatment at 35 d. 3 SEM, standarderror of means of 6 observations per treatment (the experimental unit is the cage).
3.3. Lipid-Class Content along the Intestinal Tract
The lipid-class content (TAG, DAG, MAG, and FFA) in the upper and lower jejunum,upper and lower ileum and excreta determined in 11 and 35-d-old broiler chickens fedthe different experimental diets is shown in Tables 5 and 6, respectively. In general, asignificant decrease in TAG, DAG, and FFA content was observed from the upper jejunumto lower ileum (p < 0.001) (Supplementary Table S1).
Significant differences in TAG, DAG and MAG content in the different diets wereobtained at the jejunum level in starter broiler chickens (Table 5; p ≤ 0.027). In contrast,grower broiler chickens showed no differences among the different dietary treatments forTAG, DAG, and MAG content in any intestinal segment (Table 6). For each experimentaldiet, TAG and DAG content at the lower ileum level was significantly lower in growerchickens than in starter chicks (p ≤ 0.02) (Supplementary Table S2).
Animals 2021, 11, 1035 9 of 19
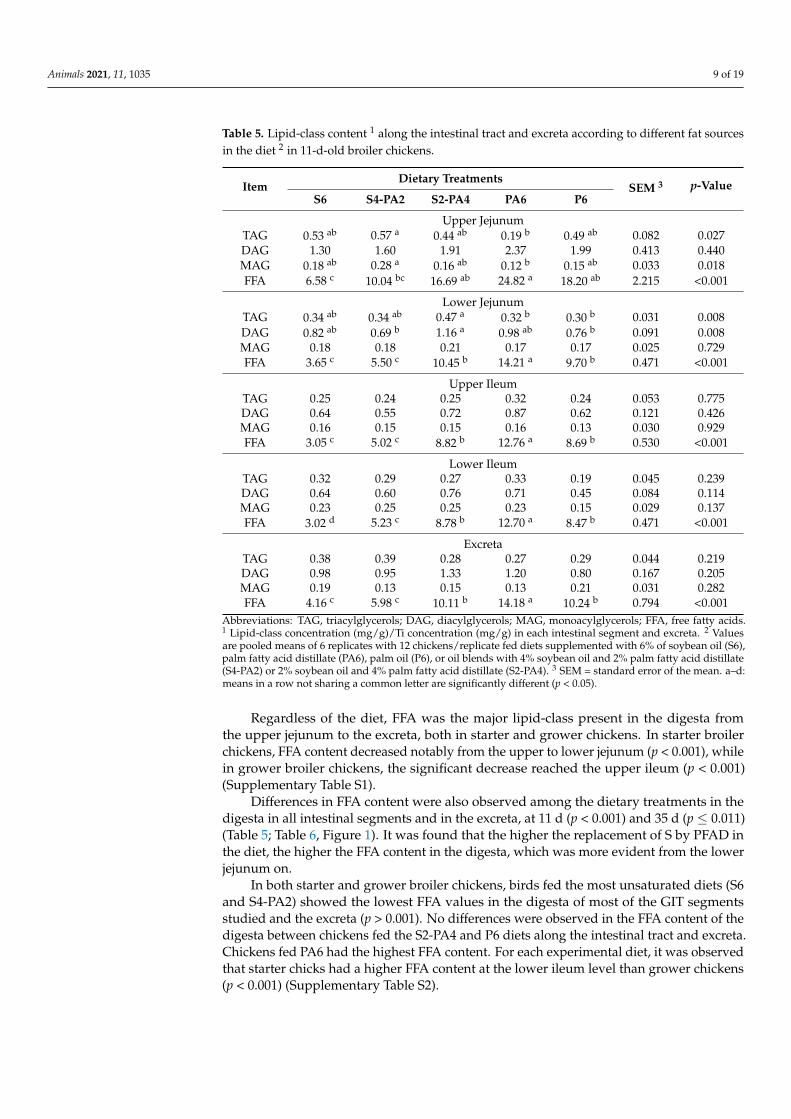
Table 5. Lipid-class content 1 along the intestinal tract and excreta according to different fat sourcesin the diet 2 in 11-d-old broiler chickens.
ItemDietary Treatments
SEM 3 p-ValueS6 S4-PA2 S2-PA4 PA6 P6
Upper JejunumTAG 0.53 ab 0.57 a 0.44 ab 0.19 b 0.49 ab 0.082 0.027DAG 1.30 1.60 1.91 2.37 1.99 0.413 0.440MAG 0.18 ab 0.28 a 0.16 ab 0.12 b 0.15 ab 0.033 0.018FFA 6.58 c 10.04 bc 16.69 ab 24.82 a 18.20 ab 2.215 <0.001
Lower JejunumTAG 0.34 ab 0.34 ab 0.47 a 0.32 b 0.30 b 0.031 0.008DAG 0.82 ab 0.69 b 1.16 a 0.98 ab 0.76 b 0.091 0.008MAG 0.18 0.18 0.21 0.17 0.17 0.025 0.729FFA 3.65 c 5.50 c 10.45 b 14.21 a 9.70 b 0.471 <0.001
Upper IleumTAG 0.25 0.24 0.25 0.32 0.24 0.053 0.775DAG 0.64 0.55 0.72 0.87 0.62 0.121 0.426MAG 0.16 0.15 0.15 0.16 0.13 0.030 0.929FFA 3.05 c 5.02 c 8.82 b 12.76 a 8.69 b 0.530 <0.001
Lower IleumTAG 0.32 0.29 0.27 0.33 0.19 0.045 0.239DAG 0.64 0.60 0.76 0.71 0.45 0.084 0.114MAG 0.23 0.25 0.25 0.23 0.15 0.029 0.137FFA 3.02 d 5.23 c 8.78 b 12.70 a 8.47 b 0.471 <0.001
ExcretaTAG 0.38 0.39 0.28 0.27 0.29 0.044 0.219DAG 0.98 0.95 1.33 1.20 0.80 0.167 0.205MAG 0.19 0.13 0.15 0.13 0.21 0.031 0.282FFA 4.16 c 5.98 c 10.11 b 14.18 a 10.24 b 0.794 <0.001
Abbreviations: TAG, triacylglycerols; DAG, diacylglycerols; MAG, monoacylglycerols; FFA, free fatty acids.1 Lipid-class concentration (mg/g)/Ti concentration (mg/g) in each intestinal segment and excreta. 2 Valuesare pooled means of 6 replicates with 12 chickens/replicate fed diets supplemented with 6% of soybean oil (S6),palm fatty acid distillate (PA6), palm oil (P6), or oil blends with 4% soybean oil and 2% palm fatty acid distillate(S4-PA2) or 2% soybean oil and 4% palm fatty acid distillate (S2-PA4). 3 SEM = standard error of the mean. a–d:means in a row not sharing a common letter are significantly different (p < 0.05).
Regardless of the diet, FFA was the major lipid-class present in the digesta fromthe upper jejunum to the excreta, both in starter and grower chickens. In starter broilerchickens, FFA content decreased notably from the upper to lower jejunum (p < 0.001), whilein grower broiler chickens, the significant decrease reached the upper ileum (p < 0.001)(Supplementary Table S1).
Differences in FFA content were also observed among the dietary treatments in thedigesta in all intestinal segments and in the excreta, at 11 d (p < 0.001) and 35 d (p ≤ 0.011)(Table 5; Table 6, Figure 1). It was found that the higher the replacement of S by PFAD inthe diet, the higher the FFA content in the digesta, which was more evident from the lowerjejunum on.
In both starter and grower broiler chickens, birds fed the most unsaturated diets (S6and S4-PA2) showed the lowest FFA values in the digesta of most of the GIT segmentsstudied and the excreta (p > 0.001). No differences were observed in the FFA content of thedigesta between chickens fed the S2-PA4 and P6 diets along the intestinal tract and excreta.Chickens fed PA6 had the highest FFA content. For each experimental diet, it was observedthat starter chicks had a higher FFA content at the lower ileum level than grower chickens(p < 0.001) (Supplementary Table S2).

Animals 2021, 11, 1035 10 of 19
Table 6. Lipid-class content 1 along the intestinal tract and excreta according to different fat sourcesin the diet 2 in 35-d-old broiler chickens.
ItemDietary Treatments
SEM 3 p-ValueS6 S4-PA2 S2-PA4 PA6 P6
Upper JejunumTAG 0.21 0.20 0.20 0.20 0.26 0.048 0.871DAG 1.32 1.69 1.47 2.22 1.20 0.256 0.073MAG 0.24 0.27 0.30 0.27 0.17 0.048 0.436FFA 8.28 b 10.05 ab 10.40 ab 14.18 a 7.40 b 1.296 0.011
Lower JejunumTAG 0.10 0.26 0.27 0.23 0.22 0.045 0.108DAG 0.43 0.61 0.61 0.72 0.58 0.115 0.496MAG 0.18 0.26 0.19 0.23 0.14 0.041 0.342FFA 3.10 c 4.29 bc 5.72 b 7.89 a 5.08 b 0.412 <0.001
Upper IleumTAG 0.14 0.16 0.13 0.13 0.09 0.021 0.254DAG 0.16 0.21 0.18 0.17 0.17 0.021 0.482MAG 0.11 0.12 0.16 0.14 0.11 0.015 0.090FFA 1.20 c 1.65 c 3.32 b 4.47 a 2.67 b 0.189 <0.001
Lower IleumTAG 0.09 0.11 0.09 0.07 0.07 0.022 0.676DAG 0.14 0.17 0.11 0.18 0.17 0.020 0.141MAG 0.13 0.14 0.21 0.21 0.15 0.022 0.051FFA 0.87 c 1.32 c 2.77 b 4.82 a 2.92 b 0.257 <0.001
ExcretaTAG 0.12 0.21 0.18 0.15 0.15 0.021 0.080DAG 0.13 0.20 0.14 0.24 0.15 0.027 0.055MAG 0.09 b 0.12 ab 0.12 ab 0.16 a 0.13 ab 0.011 0.005FFA 0.96 c 1.63 bc 2.62 b 6.04 a 2.66 b 0.265 <0.001
Abbreviations: TAG, triacylglycerols; DAG, diacylglycerols; MAG, monoacylglycerols; FFA, free fatty acids.1 Lipid-class concentration (mg/g)/Ti concentration (mg/g) in each intestinal segment and excreta. 2 Valuesare pooled means of 6 replicates with 2 chickens/replicate fed diets supplemented with 6% of soybean oil (S6),palm fatty acid distillate (PA6), palm oil (P6), or oil blends with 4% soybean oil and 2% palm fatty acid distillate(S4-PA2) or 2% soybean oil and 4% palm fatty acid distillate (S2-PA4). 3 SEM = standard error of the mean. a–c:means in a row not sharing a common letter are significantly different (p < 0.05).

Animals 2021, 11, 1035 11 of 19
Figure 1. FFA content 1 in the feed, upper jejunum, lower jejunum, upper ileum, lower ileum, andexcreta for the five different diets; with 6% of soybean oil (S6), blend with 4% soybean oil and 2%palm fatty acid distillate (S4-2PA), blend with 2% soybean oil and 4% palm fatty acid distillate(S2-2PA), with 6% of palm fatty acid distillate (PA6) and with 6% palm oil (P6) in (a) 11-d-old broilerchickens and (b) 35-d-old broiler chickens. 1 FFA concentration (mg/g)/Ti concentration (mg/g)in each intestinal segment and excreta. Values are pooled means of 6 replicates per each diet with12 chickens/replicate at 11 d, and 2 chickens/replicate at 35 d. a–d: columns not sharing a commonletter within each intestinal segment are significantly different (p ≤ 0.01).
3.4. Apparent Fatty-Acid Digestibility along the Intestinal Tract
Tables 7 and 8 show the feed apparent metabolizable energy and apparent FA di-gestibility coefficients in the different intestinal segments and excreta determined in 11 and35-d-old broiler chickens fed the different dietary treatments, respectively.
Differences were observed in the feed AME values among the different diets (p < 0.001)both in 11-d-old broiler chickens (Table 7) and in 35-d-old broiler chickens (Table 8). Ingeneral, at both ages, the lowest values were obtained in the PA6 diet and the highest inthe most unsaturated diets (S6 and S4-PA2). An increase in AME values was observed ingrower chickens compared to starter chicks fed diets with higher SFA and FFA contents(PA6, S2-PA4, and P6; p ≤ 0.002) (Supplementary Table S3).
Starter broiler chicks fed the diets containing PA6 showed the lowest digestibilitycoefficients, mainly for TFA and SFA from the lower jejunum on (p < 0.001) (Table 7). For S6and S4-PA2, no differences were obtained in TFA, MUFA or PUFA along the GIT or in theexcreta, and these diets showed the highest TFA digestibility coefficient values. In contrast,birds fed the S2-PA4 diet had lower SFA digestibility coefficients than those fed the S6 dietfrom the lower jejunum on (p < 0.001). Comparing S2-PA4 and P6, no differences were

Animals 2021, 11, 1035 12 of 19
obtained in either the TFA or all FA group digestibility coefficients in the GIT segmentsand excreta examined (except for PUFA at the lower jejunum).
In grower chickens (35 d), birds fed the PA6 diet showed the lowest digestibilitycoefficients for TFA and SFA only in the lower ileum and excreta (p < 0.001) and the lowestMUFA digestibility coefficient in the excreta (p < 0.001) (Table 8). No differences wereobserved between S6 and S4-PA2 in TFA and all FA group digestibility coefficients. Thehighest TFA, SFA, and PUFA digestibility coefficients were shown from the lower jejunumon. Comparing S2-PA4 and P6, no significant differences were observed in TFA or SFAdigestibility (except for SFA in the lower ileum). In contrast, birds fed the S2-PA4 diethad lower MUFA digestibility coefficients than those fed P6 diet from the lower jejunumon (p < 0.001), and higher PUFA digestibility coefficients in the upper ileum and excreta(p < 0.001).
For each experimental diet, chickens at d 35 had higher FA digestibility coefficients atthe lower ileum level than chicks at d 11 (p ≤ 0.05) (Supplementary Table S3).
Table 7. Feed apparent metabolizable energy values and apparent fatty-acid digestibility coefficientsalong the intestinal tract and excreta according to different fat sources in the diet in 11-d-old broilerchickens.
ItemDietary Treatments 1
SEM 4 p-ValueS6 S4-PA2 S2-PA4 PA6 P6
AME, kcal/kg 2 3348 a 3340 a 3074 b 2760 c 3014 b 26.08 <0.001
Upper Jejunum 3
TFA 0.61 a 0.61 a 0.29 b 0.05b 0.20 b 0.071 <0.001SFA 0.20 ab 0.36 a 0.19 ab -0.01b 0.19 ab 0.076 0.044
MUFA 0.51 a 0.51 a 0.35 ab 0.16 b 0.31 ab 0.059 <0.001PUFA 0.78a 0.71 a 0.34 b 0.02 b 0.04 b 0.078 <0.001
Lower Jejunum3
TFA 0.72 a 0.67 a 0.51 b 0.30 c 0.48 b 0.020 <0.001SFA 0.60 a 0.47 b 0.32 c 0.12 d 0.37 c 0.026 <0.001
MUFA 0.69 a 0.67 ab 0.58 b 0.44 c 0.58 b 0.025 <0.001PUFA 0.77 ab 0.78 a 0.67 b 0.48 c 0.56 c 0.026 <0.001
Upper Ileum 3
TFA 0.74 a 0.68 a 0.53 b 0.35 c 0.51 b 0.027 <0.001SFA 0.65 a 0.49 b 0.32 c 0.12 d 0.36 bc 0.033 <0.001
MUFA 0.73 a 0.69 a 0.61 ab 0.52 b 0.62 ab 0.031 <0.001PUFA 0.78 a 0.78 a 0.69 ab 0.59 b 0.63 b 0.028 <0.001
Lower Ileum 3
TFA 0.79 a 0.73 a 0.65 b 0.41 c 0.62 b 0.020 <0.001SFA 0.69 a 0.55 b 0.47 b 0.18 c 0.49 b 0.022 <0.001
MUFA 0.76 a 0.74 a 0.71 a 0.56 b 0.74 a 0.025 <0.001PUFA 0.83 a 0.83 a 0.79 a 0.68 b 0.75 ab 0.028 0.002
Excreta 3
TFA 0.80 a 0.73 ab 0.63 bc 0.47 d 0.60 c 0.023 <0.001SFA 0.64 a 0.53 b 0.43 bc 0.23 d 0.39 c 0.025 <0.001
MUFA 0.79 a 0.77 ab 0.74 ab 0.68 b 0.73 ab 0.021 0.018PUFA 0.85 a 0.81 a 0.75 ab 0.67 b 0.80 a 0.031 0.004
Abbreviations: AME, apparent metabolizable energy; TFA, total fatty acids; SFA, saturated fatty acids; MUFA,monounsaturated fatty acids; PUFA, polyunsaturated fatty acids. 1 Values are pooled means of 6 replicates fromchickens fed diets supplemented with 6% of soybean oil (S6), palm fatty acid distillate (PA6), palm oil (P6), oroil blends with 4% soybean oil and 2% palm fatty acid distillate (S4-PA2) or 2% soybean oil and 4% palm fattyacid distillate (S2-PA4). 2 Values are pooled means of 6 replicates with 16 chickens/replicate. 3 Values are pooledmeans of 6 replicates with 12 chickens/replicate. 4 SEM = standard error of the mean. a–d: means in a row notsharing a common letter are significantly different (p < 0.05).

Animals 2021, 11, 1035 13 of 19
Table 8. Feed apparent metabolizable energy values and apparent fatty-acid digestibility coefficientsalong the intestinal tract and excreta according to different fat sources in the diet in 35-d-old broilerchickens.
ItemDietary Treatments 1
SEM 4 p-ValueS6 S4-PA2 S2-PA4 PA6 P6
AME, kcal/kg 2 3364 a 3379 a 3212 bc 3121 c 3279 ab 32.48 <0.001
Upper Jejunum 3
TFA 0.48 ab 0.53 a 0.32 ab 0.29 b 0.51 a 0.052 0.005SFA 0.21 b 0.46 ab 0.26 ab 0.25 ab 0.48 a 0.062 0.009
MUFA 0.60 ab 0.66 ab 0.52 ab 0.50 b 0.67 a 0.042 0.015PUFA 0.51a 0.49a 0.20bc 0.06c 0.34ab 0.063 <0.001
Lower Jejunum3
TFA 0.81 a 0.78 a 0.65 b 0.62 b 0.69 b 0.021 <0.001SFA 0.73 ab 0.76 a 0.59 c 0.55 c 0.64 bc 0.031 <0.001
MUFA 0.85 a 0.84 a 0.76 b 0.77 b 0.83 a 0.016 <0.001PUFA 0.81 a 0.76 a 0.62 b 0.54 b 0.56 b 0.031 <0.001
Upper Ileum 3
TFA 0.89 a 0.89 a 0.77 bc 0.72 c 0.82 b 0.015 <0.001SFA 0.85 a 0.86 a 0.67 bc 0.61 c 0.77 ab 0.030 <0.001
MUFA 0.91 a 0.91 a 0.85 b 0.84 b 0.91 a 0.008 <0.001PUFA 0.90 a 0.90 a 0.82 b 0.77 c 0.78 c 0.008 <0.001
Lower Ileum 3
TFA 0.92 a 0.92 a 0.82 b 0.76 c 0.84 b 0.010 <0.001SFA 0.90 a 0.90 a 0.71 c 0.64 d 0.78 b 0.017 <0.001
MUFA 0.93 a 0.93 a 0.88 b 0.88 b 0.93 a 0.006 <0.001PUFA 0.93 a 0.93 a 0.87 b 0.85 b 0.83 b 0.013 <0.001
Excreta 3
TFA 0.93 a 0.92 a 0.84 b 0.72 c 0.84 b 0.009 <0.001SFA 0.87 a 0.87 a 0.76 b 0.59 c 0.77 b 0.016 <0.001
MUFA 0.93 a 0.93 a 0.89 b 0.85 c 0.92 a 0.005 <0.001PUFA 0.94 a 0.94 a 0.90 b 0.82 c 0.84 c 0.009 <0.001
Abbreviations: AME, apparent metabolizable energy; TFA, total fatty acids; SFA, saturated fatty acids; MUFA,monounsaturated fatty acids; PUFA, polyunsaturated fatty acids. 1 Values are pooled means of 6 replicates fromchickens fed diets supplemented with 6% of soybean oil (S6), palm fatty acid distillate (PA6), palm oil (P6), or oilblends with 4% soybean oil and 2% palm fatty acid distillate (S4-PA2) or 2% soybean oil and 4% palm fatty aciddistillate (S2-PA4). 2 Values are pooled means of 6 replicates with 4 chickens/replicate. 3 Values are pooled meansof 6 replicates with 2 chickens/replicate. 4 SEM = standard error of the mean. a–d: means in a row not sharing acommon letter are significantly different (p < 0.05).
3.5. Contribution of Each Intestinal Segment to FA Absorption
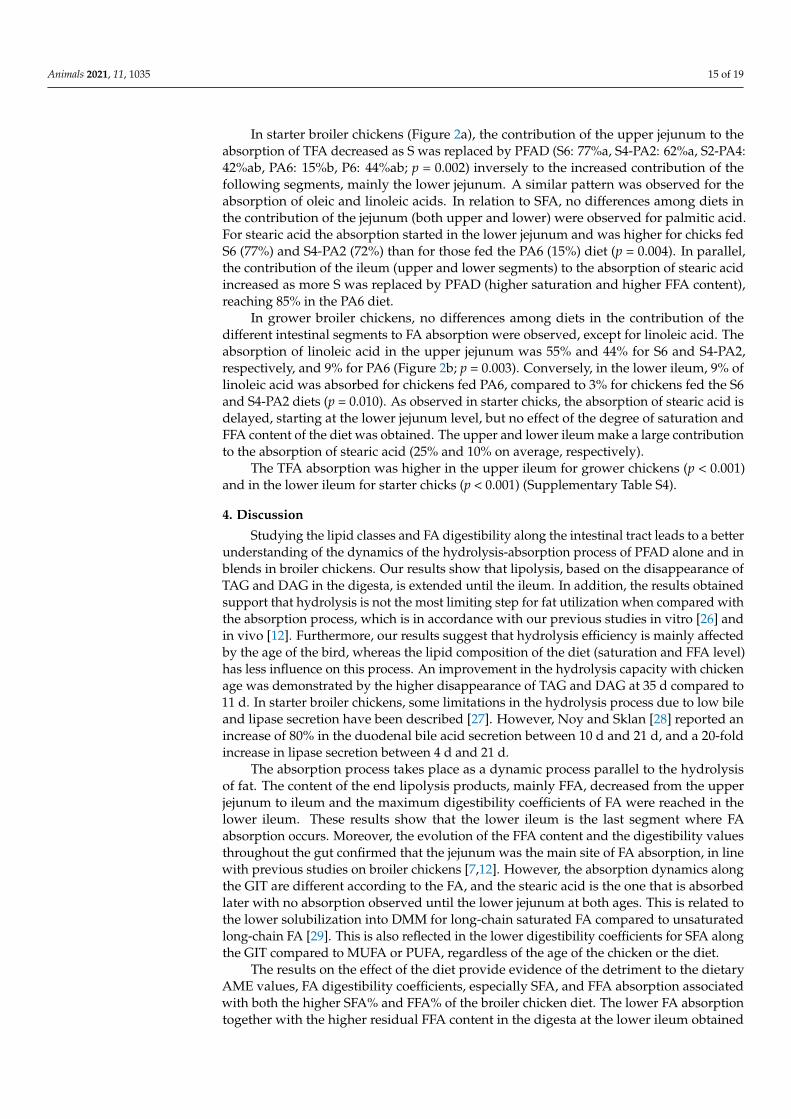
To better understand the importance of the different intestinal segments in the FAabsorption, the contribution of each intestinal segment was calculated as a proportion ofthe total digestibility coefficient obtained in the lower ileum, since it is well known that thisis the last segment where absorption can take place [25]. The contributions of the differentintestinal segments to the digestibility of TFA and the four major FAs (palmitic and stearic,representing SFA; oleic, MUFA; and linoleic, PUFA) are shown in Figure 2.
The results show that jejunum was the main site of TFA absorption (Jejunum: 84%;Ileum: 16%; these results indicate the percentage of FA disappearance), when all diets at11 d and 35 d are considered. It was also the most important place for the absorption ofpalmitic (11 d: 80%; 35 d: 87%), oleic (11 d: 85%; 35 d: 89%), and linoleic acids (11 d: 85%;35 d: 75%).

Animals 2021, 11, 1035 14 of 19
Figure 2. Contribution of each intestinal segment to the apparent fatty acid digestibility, calculated as a proportion of totaldigestibility reached at the lower ileum, along the intestinal tract for the five different diets; with 6% of soybean oil (S6),blend with 4% soybean oil and 2% palm fatty acid distillate (S4-2PA), blend with 2% soybean oil and 4% palm fatty aciddistillate (S2-2PA), with 6% of palm fatty acid distillate (PA6) and with 6% palm oil (P6) in (a) 11-d-old broiler chickensand (b) 35-d-old broiler chickens. TFA (Total Fatty Acids), Palmitic (C16:0), stearic (C18:0), oleic (C18:1n-9) and linoleic(C18:2n-6) acids. Values are means of 6 replicates per each diet with 12 chickens/replicate at 11 d, and 2 chickens/replicateat 35 d. a–d: columns with the same intestinal segment not sharing a common letter are significantly different (p < 0.01).
Animals 2021, 11, 1035 15 of 19
In starter broiler chickens (Figure 2a), the contribution of the upper jejunum to theabsorption of TFA decreased as S was replaced by PFAD (S6: 77%a, S4-PA2: 62%a, S2-PA4:42%ab, PA6: 15%b, P6: 44%ab; p = 0.002) inversely to the increased contribution of thefollowing segments, mainly the lower jejunum. A similar pattern was observed for theabsorption of oleic and linoleic acids. In relation to SFA, no differences among diets inthe contribution of the jejunum (both upper and lower) were observed for palmitic acid.For stearic acid the absorption started in the lower jejunum and was higher for chicks fedS6 (77%) and S4-PA2 (72%) than for those fed the PA6 (15%) diet (p = 0.004). In parallel,the contribution of the ileum (upper and lower segments) to the absorption of stearic acidincreased as more S was replaced by PFAD (higher saturation and higher FFA content),reaching 85% in the PA6 diet.
In grower broiler chickens, no differences among diets in the contribution of thedifferent intestinal segments to FA absorption were observed, except for linoleic acid. Theabsorption of linoleic acid in the upper jejunum was 55% and 44% for S6 and S4-PA2,respectively, and 9% for PA6 (Figure 2b; p = 0.003). Conversely, in the lower ileum, 9% oflinoleic acid was absorbed for chickens fed PA6, compared to 3% for chickens fed the S6and S4-PA2 diets (p = 0.010). As observed in starter chicks, the absorption of stearic acid isdelayed, starting at the lower jejunum level, but no effect of the degree of saturation andFFA content of the diet was obtained. The upper and lower ileum make a large contributionto the absorption of stearic acid (25% and 10% on average, respectively).
The TFA absorption was higher in the upper ileum for grower chickens (p < 0.001)and in the lower ileum for starter chicks (p < 0.001) (Supplementary Table S4).
4. Discussion
Studying the lipid classes and FA digestibility along the intestinal tract leads to a betterunderstanding of the dynamics of the hydrolysis-absorption process of PFAD alone and inblends in broiler chickens. Our results show that lipolysis, based on the disappearance ofTAG and DAG in the digesta, is extended until the ileum. In addition, the results obtainedsupport that hydrolysis is not the most limiting step for fat utilization when compared withthe absorption process, which is in accordance with our previous studies in vitro [26] andin vivo [12]. Furthermore, our results suggest that hydrolysis efficiency is mainly affectedby the age of the bird, whereas the lipid composition of the diet (saturation and FFA level)has less influence on this process. An improvement in the hydrolysis capacity with chickenage was demonstrated by the higher disappearance of TAG and DAG at 35 d compared to11 d. In starter broiler chickens, some limitations in the hydrolysis process due to low bileand lipase secretion have been described [27]. However, Noy and Sklan [28] reported anincrease of 80% in the duodenal bile acid secretion between 10 d and 21 d, and a 20-foldincrease in lipase secretion between 4 d and 21 d.
The absorption process takes place as a dynamic process parallel to the hydrolysisof fat. The content of the end lipolysis products, mainly FFA, decreased from the upperjejunum to ileum and the maximum digestibility coefficients of FA were reached in thelower ileum. These results show that the lower ileum is the last segment where FAabsorption occurs. Moreover, the evolution of the FFA content and the digestibility valuesthroughout the gut confirmed that the jejunum was the main site of FA absorption, in linewith previous studies on broiler chickens [7,12]. However, the absorption dynamics alongthe GIT are different according to the FA, and the stearic acid is the one that is absorbedlater with no absorption observed until the lower jejunum at both ages. This is related tothe lower solubilization into DMM for long-chain saturated FA compared to unsaturatedlong-chain FA [29]. This is also reflected in the lower digestibility coefficients for SFA alongthe GIT compared to MUFA or PUFA, regardless of the age of the chicken or the diet.
The results on the effect of the diet provide evidence of the detriment to the dietaryAME values, FA digestibility coefficients, especially SFA, and FFA absorption associatedwith both the higher SFA% and FFA% of the broiler chicken diet. The lower FA absorptiontogether with the higher residual FFA content in the digesta at the lower ileum obtained

Animals 2021, 11, 1035 16 of 19
for chickens fed the higher level of PFAD (6%; PA6), could be explained by two factors.First, the association of FFA, mainly SFA, with minerals to form insoluble soaps has beendescribed, so that both the FFA and the mineral become unavailable for the absorption [30].This has a greater impact on young birds than on older ones [31]. In our last in vitrostudy [26], we found that fat content from PFAD compared to other fat sources (P, S, orsoybean acid oil) was less available for micellar solubilization. Second, and related to thelipid-class content, the lowest MAG content in PA6 diets (Table 3; 1.5% on average for bothages) may hinder the absorption of many FFAs [9] since the emulsifying properties of MAGimprove the rate of FA incorporation into DMM [32]. This in turn could explain that birdsfed PA6 tended to show the lowest abdominal fat weight (%).
The potential inclusion of PFAD in feed for broiler chickens is influenced by the ageof the bird. In 11-d-old broiler chicks, the supplementation of PFAD at any level studiedhad a negative effect on fat utilization compared to S. Consistent with our results, severalauthors (Wiseman and Salvador, [33]; Vilarrasa et al. [5]; Rodriguez-Sanchez et al. [12])have found a negative impact of dietary saturation and FFA level on fat utilization inbroiler chickens. At 35 d the PA6 showed the worst fat utilization, however, adding PFADin substitution of S with a feed FFA content up to 30% and a UFA:SFA ratio higher than2.6 made it possible to achieve a high level of fat digestibility, similar to that obtainedusing S. This could be partially related to the higher FA digestibility coefficients and higherdietary AME values obtained for the S4-PA2 diet compared to those calculated from theproportions of the components. This suggests a positive synergic effect by the presenceof UFA together with the presence of different lipid-class structures provided by S, sinceUFA and MAG obtained from the lipolysis of TAG are natural emulsifiers, which mightenhance the incorporation of SFA, mainly FFA of PFAD, in the DMM and increase itsabsorption [34]. This synergistic effect is in agreement with the reported positive resultsof blending saturated and unsaturated conventional lipid sources [11] and acid oils [10].However, the similarities obtained in feed AME values, lipid-class content in digesta, andapparent FA digestibility coefficients for S2-PA4 (UFA: SFA ratio: 1.7; FFA%: 53) and P6(UFA: SFA ratio: 1.3; FFA%: 9) suggest that changes in the saturation degree might have agreater impact on FA utilization than the changes in the FFA level of the diet, as reportedby Vilarrasa et al. [5] and Rodriguez-Sanchez et al. [12].
The present results also demonstrated that replacing S with PFAD led to a delay inthe FA absorption along the GIT, which was more evident in starter animals (11-d-oldchicks), and for the absorption of linoleic acid in 35-d-old chickens. Thus, even though thejejunum is the main site of fat absorption, the differentiation between the upper and thelower segments should be considered for future studies, at least in starter broiler chickens.
The comparison of the results between starter (11 d) and grower (35 d) broiler chickensconfirms that the age has a positive effect on the FFA lipid-class absorption, FA absorp-tion, and AME values of all the diets, which is consistent with the findings of Batal andParsons [35], Tancharoenrat et al. [11], Roll et al. [13], Rodriguez-Sanchez et al. [8], andViñado et al. [6]. However, it is important to highlight that the observed improvement withage in FA digestibility (especially for SFA), FFA absorption, and dietary AME values, washigher for those chickens fed the most saturated diets (especially with higher FFA%) thanfor those fed the most unsaturated diets. That there were no differences among diets ingrower chickens in the contribution of intestinal segments to FA absorption suggests thatthe absorption of diets with higher SFA% and FFA% is advanced to the upper intestinalsegments at 35 d. This was especially evident for the absorption of stearic acid, and thecontribution of the lower jejunum increased due to the absorption of this FA acid in growerbroiler chickens fed the PA6 diet. In addition, the higher contribution of the upper ileumin TFA and linoleic acid absorption at 35 d suggests that this segment plays a key role inimproving FA absorption with age. In starter chickens, the limited capacity of fat absorp-tion [27] together with the shorter feed retention time in the GIT (3.15 h in 11-d-old chicksand 5.10 h in 42-d-old chickens) [36] could explain the lower efficiency in the absorptionprocess. This in turn could explain the higher implication of the lower ileum in young

Animals 2021, 11, 1035 17 of 19
chicks as it is the last part of the GIT for the remaining FA to be absorbed. Therefore, itmay be recommendable to separate the ileum into upper and lower segments for furtherstudies. Determining the maximum fat utilization at the lower ileum level instead of fromthe pool of digesta of the whole ileum may give more accurate results.
The maximum digestibility coefficients of SFA reached at the lower ileum, show thatat 11 d both the dietary FFA content (PA6: 0.18 vs. P6: 0.48) and the SFA level (P6: 0.48 vs.S6: 0.69) had a great impact. At 35 d the magnitude of the negative effect was lower than at11 d, for the dietary FFA content (PA6: 0.64 vs. P6: 0.78) and for the SFA level (P6: 0.78 vs.S6: 0.90). This in turn suggests that as age increases, the digestibility of SFA improves and,most notably, the utilization of FFA improves.
5. Conclusions
The present study confirms that determining the lipid classes together with the FAdigestibility along the GIT provides valuable information for better understanding thedynamics of FA utilization in diets with different FA profiles and FFA contents. The resultsdemonstrate that the effect of dietary saturation degree (UFA:SFA) on dietary fat utilizationis higher than the effect of dietary FFA level. A clear improvement in the efficiency of boththe lipolysis and the absorption process was observed with age. Fat hydrolysis is moreaffected by the age of the chicken than by the saturation degree and/or FFA content ofthe diet. The absorption results demonstrated that most of the FA absorption occurs inthe jejunum (from 73% to 92%), but the ileum also plays a key role (from 8% to 27%). Thecontribution of the upper and lower segments of the jejunum and ileum to FA absorptionis influenced by the characteristics of the dietary FA (degree of saturation, chain length,and FFA%), and the age of the chicken. There is a notably higher implication of the upperileum for grower broiler chickens.
Replacing soybean oil with palm fatty acid distillate affected the extent and the siteof FA absorption. The results show that the increase in SFA% and FFA% in the dietreduced and delayed the absorption of the dietary FA, especially the SFA in starter broilerchicks. As age increased, the FA absorption increased, and advanced to the upper intestinalsegments, especially in the most saturated and rich FFA diets. Age has a positive effecton the digestibility of SFA and, above all, on the FFA utilization. For 11-day-old starterbroiler chickens, it is not recommended to use this by-product alone or in blends. Forgrower broiler chickens, it is possible to include palm fatty acid distillate blended with aconventional unsaturated oil, such as soybean oil, in feed formulation, when the blend hasfrom 2.6 UFA:SFA and the FFA% does not exceed 30%, without impairing FA utilization orgrowth performance. This potential strategy for using palm fatty acid distillate withoutnegatively impacting fat utilization by the animal implies a reduction in costs and a way toupcycle and valorize this by-product.
Supplementary Materials: The following are available online at https://www.mdpi.com/article/10.3390/ani11041035/s1, Table S1: Lipid-class content according to different intestinal segmentsand excreta in 11- and 35-day-old broiler chickens, Table S2. Lipid-class content in the lower ileumaccording to different fat sources in the diet in 11- and 35-day-old broiler chickens, Table S3. Feedapparent metabolizable energy value and apparent fatty-acid digestibility coefficients in the lowerileum according to different fat sources in the diet in 11- and 35-day-old broiler chickens, Table S4.Contribution of each intestinal segment to FA absorption according to the age of the chicken.
Author Contributions: Conceptualization, A.C.B. and R.S.; methodology, B.J.-M., A.C.B., R.S., andA.T.; validation, A.C.B., R.S., and A.T.; formal analysis, B.J.-M.; investigation, B.J.-M., R.S., A.C.B.,M.D.S., and A.T.; data curation, B.J.-M., A.C.B., R.S., and A.T. writing—original draft preparation,B.J.-M.; writing—review and editing, R.S., A.C.B., A.T., and M.D.S.; visualization, B.J.-M.; supervision,A.C.B. and R.S.; project administration, A.C.B.; funding acquisition, A.C.B. All authors have read andagreed to the published version of the manuscript.

Animals 2021, 11, 1035 18 of 19
Funding: This research was funded by Spanish Ministry of Economy and Competitiveness by theproject number AGL2015-64431-C2-1-R (MINECO/FEDER-UE), the pre-doctoral FPI contract numberBES-2016-077930 and the Ramon y Cajal contract number RYC-2017-23601.
Institutional Review Board Statement: The study was conducted according to the European Unionguidelines for the care and use of animals in research (2010/63/EU), and all management prac-tices and procedures were approved by the Animal Ethics Committee (CEEAH) of the UniversitatAutònoma de Barcelona (number code: 3938).
Acknowledgments: The English of this manuscript was proofread by Unitat d’AssessoramentLingüístic i Traduccions, Servei de Llengües de la Universitat Autònoma de Barcelona.
Conflicts of Interest: The authors declare no conflict of interest. The funders had no role in the designof the study; in the collection, analyses, or interpretation of data; in the writing of the manuscript, orin the decision to publish the results.
References1. Statista Vegetables. Oils Global Consumption. Available online: https://www.statista.com/statistics/263937/vegetable-oils-
global-consumption/ (accessed on 29 January 2021).2. FEDIOL. The European Vegetable Oil and Protein Meal Industry Association—Refining of Edible Oils. Available online:
www.fediol.eu/web/refining/1011306087/list1187970096/f1.htm (accessed on 20 March 2021).3. Gibon, V.; De Greyt, W.; Kellens, M. Palm oil refining. Eur. J. Lipid Sci. Technol. 2007, 109, 315–335. [CrossRef]4. Varona, E.; Tres, A.; Rafecas, M.; Vichi, S.; Barroeta, A.C.; Guardiola, F. Composition and nutritional value of acid oils and fatty
acid distillates used in animal feeding. Animals 2021, 11, 196. [CrossRef] [PubMed]5. Vilarrasa, E.; Codony, R.; Esteve-Garcia, E.; Barroeta, A.C. Use of re-esterified oils, differing in their degree of saturation and
molecular structure, in broiler chicken diets. Poult. Sci. 2015, 94, 1527–1538. [CrossRef]6. Viñado, A.; Castillejos, L.; Rodriguez-Sanchez, R.; Barroeta, A.C. Crude soybean lecithin as alternative energy source for broiler
chicken diets. Poult. Sci. 2019, 98, 5601–5612. [CrossRef] [PubMed]7. Tancharoenrat, P.; Ravindran, V.; Zaefarian, F.; Ravindran, G. Digestion of fat and fatty acids along the gastrointestinal tract of
broiler chickens. Poult. Sci. 2014, 93, 371–379. [CrossRef] [PubMed]8. Rodriguez-Sanchez, R.; Tres, A.; Sala, R.; Guardiola, F.; Barroeta, A. Evolution of lipid classes and fatty acid digestibility along
the gastrointestinal tract of broiler chickens fed different fat sources at different ages. Poult. Sci. 2019, 98, 1341–1353. [CrossRef][PubMed]
9. Blanch, A.; Barroeta, A.C.; Baucells, M.D.; Puchal, F. The nutritive value of dietary fats in relation to their chemical composition.Apparent fat availability and metabolizable energy in two-week-old chicks. Poult. Sci. 1995, 74, 1335–1340. [CrossRef] [PubMed]
10. Zumbado, M.E.; Scheele, C.W.; Kwakernaak, C. Chemical composition, digestibility, and metabolizable energy content of differentfat and oil by-products. J. Appl. Poult. Res. 1999, 8, 263–271. [CrossRef]
11. Tancharoenrat, P.; Ravindran, V.; Zaefarian, F.; Ravindran, G. Influence of age on the apparent metabolisable energy and totaltract apparent fat digestibility of different fat sources for broiler chickens. Anim. Feed Sci. Technol. 2013, 186, 186–192. [CrossRef]
12. Rodriguez-Sanchez, R.; Tres, A.; Sala, R.; Garcés-Narro, C.; Guardiola, F.; Gasa, J.; Barroeta, A.C. Effects of dietary free fatty-acidcontent and saturation degree on lipid-class composition and fatty-acid digestibility along the gastrointestinal tract in broilerstarter chickens. Poult. Sci. 2019, 98, 4929–4941. [CrossRef]
13. Roll, A.P.; Vilarrasa, E.; Tres, A.; Barroeta, A.C. The different molecular structure and glycerol-to-fatty acid ratio of palm oils affecttheir nutritive value in broiler chicken diets. Animal 2018, 12, 240–248. [CrossRef]
14. Aviagen. Ross Broiler Management Handbook; Aviagen, Ed.; Newbridge: Scotland, UK, 2014.15. Fundación Española para el Desarrollo de la Nutrición Animal. Necesidades Nutricionales para Avicultura: Pollos de Carne y Aves de
Puesta; FEDNA: Madrid, Spain, 2008; ISBN 9788409065295.16. American Oil Chemists’ Society (AOCS). Official Method Ca 2d-25. Moisture and volatile matter, vacuum oven method. In
Official Methods and Recommended Practices of the American Oil Chemists’ Society; AOCS Press: Champaign, IL, USA, 2017.17. International Standard. ISO 663:2017. Animal and Vegetable Fats and Oils, Determination of Insoluble Impurities Content; ISO: Geneva,
Switzerland, 2017.18. American Oil Chemists’ Society (AOCS). Official Method Ca 6b-53. Unsaponifiable matter. In Official Methods and Recommended
Practices of the American Oil Chemists’ Society; AOCS Press: Champaign, IL, USA, 2017.19. IUPAC (International Union of Pure and Applied Chemistry). Determination of polymerized triglycerides in oils and fats by high
performance liquid chromatography (method 2508). In Standard Methods for the Analysis of Oils, Fats and Derivatives; IUPAC, Ed.;Blackwell Scientific Publications: Oxford, UK, 1991.
20. Guardiola, F.; Codony, R.; Rafecas, M.; Boatella, J.; López, A. Fatty acid composition and nutritional value of fresh eggs, fromlarge- and small-scale farms. J. Food Compos. Anal. 1994, 7, 171–188. [CrossRef]
21. American Oil Chemists’ Society. Official Methods of Analysis of AOAC International, 18th ed.; AOAC International: Gaithersburg,MD, USA, 2005; ISBN 5935584-77-3 A.

Animals 2021, 11, 1035 19 of 19
22. Short, F.J.; Gorton, P.; Wiseman, J.; Boorman, K.N. Determination of titanium dioxide added as an inert marker in chickendigestibility studies. Anim. Feed Sci. Technol. 1996, 5, 215–221. [CrossRef]
23. Sukhija, P.S.; Palmquist, D.L. Rapid method for determination of total fatty acid content and composition of feedstuffs and feces.J. Agric. Food Chem. 1988, 36, 1202–1206. [CrossRef]
24. Cortinas, L.; Villaverde, C.; Galobart, J.; Baucells, M.D.; Codony, R.; Barroeta, A.C. Fatty acid content in chicken thigh and breastas affected by dietary polyunsaturation level. Poult. Sci. 2004, 83, 1155–1164. [CrossRef]
25. Renner, R. Site of fat absorption in the chick. Poult. Sci. 1965, 44, 861–864. [CrossRef]26. Jimenez-Moya, B.; Martin, D.; Soler-Rivas, D.; Barroeta, A.C.; Tres, A.; Sala, R. Acid versus crude oils for broiler chicken diets:
In vitro lipid digestion and bioaccessibility. Anim. Feed Sci. Technol. 2021. under review.27. Krogdahl, A. Digestion and absorption of lipids in poultry. J. Nutr. 1985, 115, 675–685. [CrossRef]28. Noy, Y.; Sklan, D. Digestion and absorption in the young chick. Poult. Sci. 1995, 74, 366–373. [CrossRef]29. Freeman, C.P. Properties of fatty acids in dispersions of emulsified lipid and bile salt and the significance of these properties in fat
absorption in the pig and the sheep. Br. J. Nutr. 1969, 23, 249–263. [CrossRef]30. Small, D.M. The effects of glyceride structure on absorption and metabolism. Annu. Rev. Nutr. 1991, 11, 413–434. [CrossRef]
[PubMed]31. Leeson, S.; Summers, J.D. Commercial Poultry Nutrition, 3rd ed.; Nottingham University Press: Nottingham, UK, 2005;
ISBN 9781904761785.32. Ravindran, V.; Tancharoenrat, P.; Zaefarian, F.; Ravindran, G. Fats in poultry nutrition: Digestive physiology and factors
influencing their utilisation. Anim. Feed Sci. Technol. 2016, 213, 1–21. [CrossRef]33. Wiseman, J.; Salvador, F. The influence of free fatty acid content and degree of saturation on the apparent metabolizable energy
value of fats fed to broilers. Poult. Sci. 1991, 70, 573–582. [CrossRef] [PubMed]34. Young, R.J.; Garrett, R.L. Effect of oleic and linoleic acids on the absorption of saturated fatty acids in the chick. J. Nutr. 1963, 81,
321–329. [CrossRef]35. Batal, A.B.; Parsons, C.M. Effects of age on nutrient digestibility in chicks fed different diets. Poult. Sci. 2002, 81, 400–407.
[CrossRef]36. Angel, R.; Kim, S.W.; Li, W.; Jimenez-Moreno, E. Velocidad de paso y ph intestinal en aves: Implicaciones para la digestión y el
uso de enzimas. In Proceedings of the XXIX Curso de Especialización FEDNA, Madrid, Spain, 6–7 November 2013.