Embed Size (px)
Citation preview

Soybean Nutrient ManagementSoybean Nutrient ManagementAA
“Risk Management Tool”“Risk Management Tool”byby
Dale CowanDale CowanAgriAgri--Food LaboratoriesFood Laboratories
GuelphGuelph
AGRI-FOOD LABORATORIES
Soybean Nutrient ManagementSoybean Nutrient Management
Growth StagesGrowth Stages
Nutrient RequirementsNutrient Requirements
Tools to Determining Nutrient RequirementsTools to Determining Nutrient Requirements
Factors affecting Nutrient UptakeFactors affecting Nutrient Uptake
Role of Nutrients in Plant HealthRole of Nutrients in Plant Health
AGRI-FOOD LABORATORIES
Growth StagesGrowth Stages
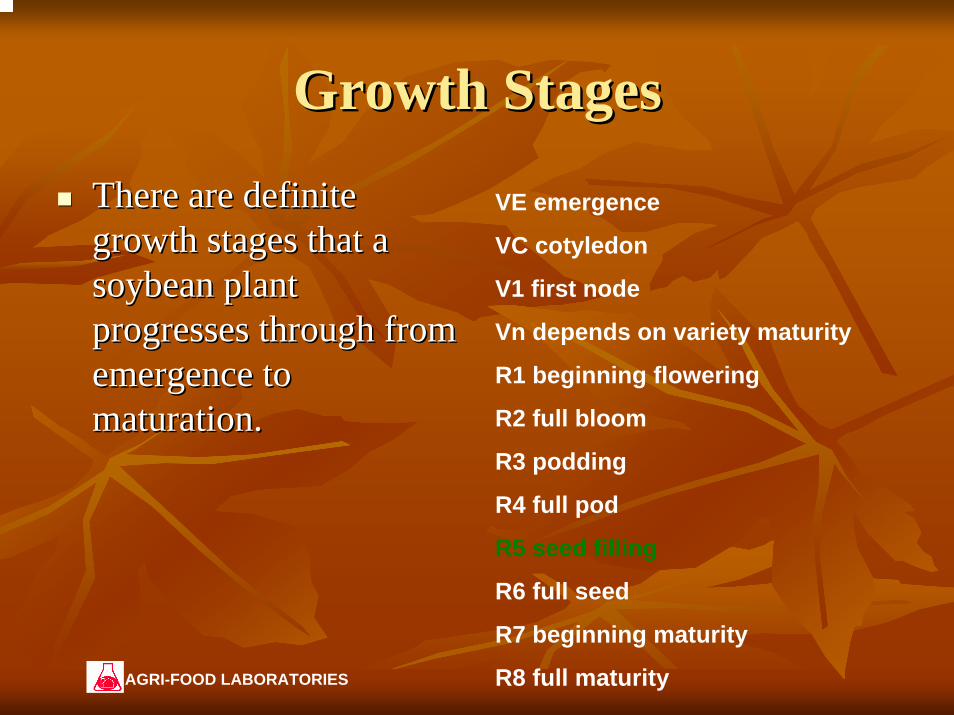
There are definite There are definite growth stages that a growth stages that a soybean plant soybean plant progresses through from progresses through from emergence to emergence to maturation. maturation.
VE emergence
VC cotyledon
V1 first node
Vn depends on variety maturity
R1 beginning flowering
R2 full bloom
R3 podding
R4 full pod
R5 seed filling
R6 full seed
R7 beginning maturity
R8 full maturityAGRI-FOOD LABORATORIES
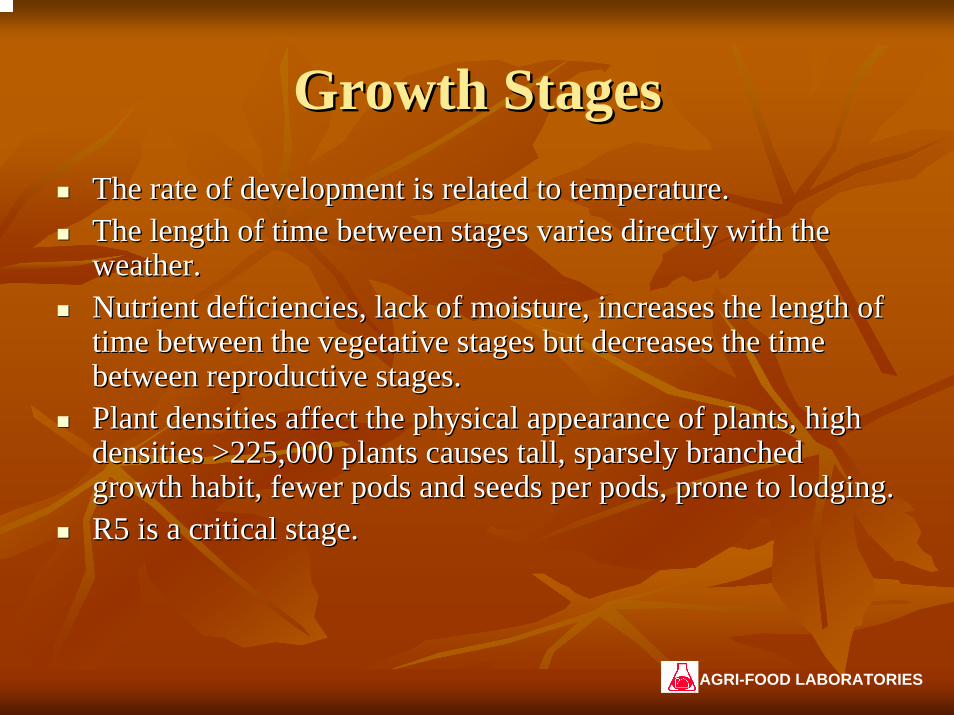
Growth StagesGrowth StagesThe rate of development is related to temperature.The rate of development is related to temperature.The length of time between stages varies directly with the The length of time between stages varies directly with the weather. weather. Nutrient deficiencies, lack of moisture, increases the length ofNutrient deficiencies, lack of moisture, increases the length oftime between the vegetative stages but decreases the time time between the vegetative stages but decreases the time between reproductive stages.between reproductive stages.Plant densities affect the physical appearance of plants, high Plant densities affect the physical appearance of plants, high densities >225,000 plants causes tall, sparsely branched densities >225,000 plants causes tall, sparsely branched growth habit, fewer pods and seeds per pods, prone to lodging.growth habit, fewer pods and seeds per pods, prone to lodging.R5 is a critical stage.R5 is a critical stage.
AGRI-FOOD LABORATORIES
Growth Stage R5Growth Stage R5
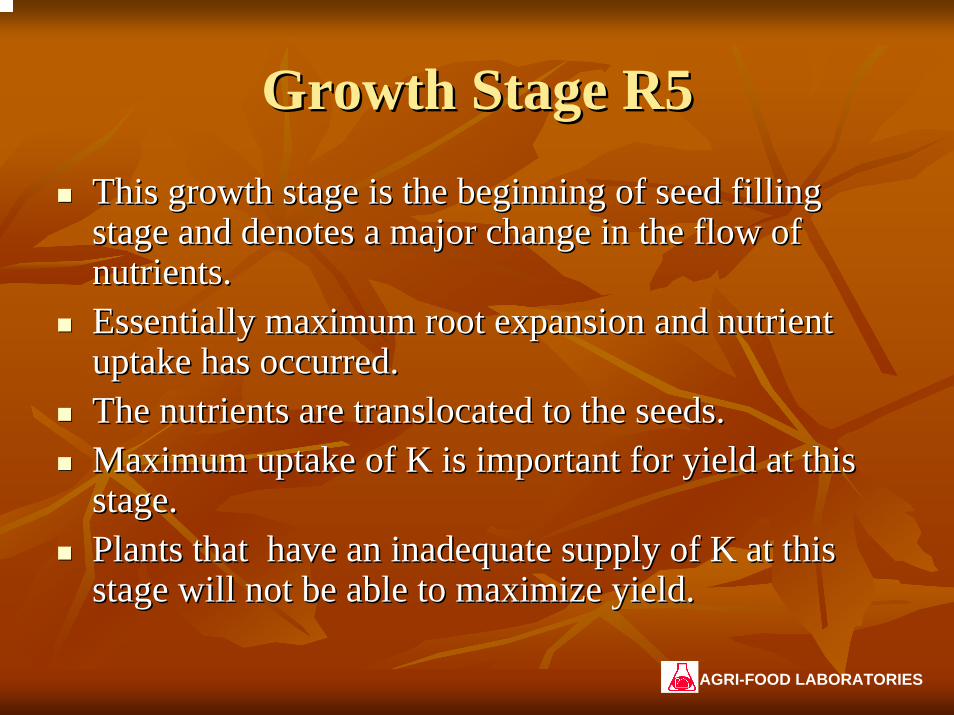
This growth stage is the beginning of seed filling This growth stage is the beginning of seed filling stage and denotes a major change in the flow of stage and denotes a major change in the flow of nutrients.nutrients.Essentially maximum root expansion and nutrient Essentially maximum root expansion and nutrient uptake has occurred.uptake has occurred.The nutrients are translocated to the seeds.The nutrients are translocated to the seeds.Maximum uptake of K is important for yield at this Maximum uptake of K is important for yield at this stage.stage.Plants that have an inadequate supply of K at this Plants that have an inadequate supply of K at this stage will not be able to maximize yield.stage will not be able to maximize yield.
AGRI-FOOD LABORATORIES

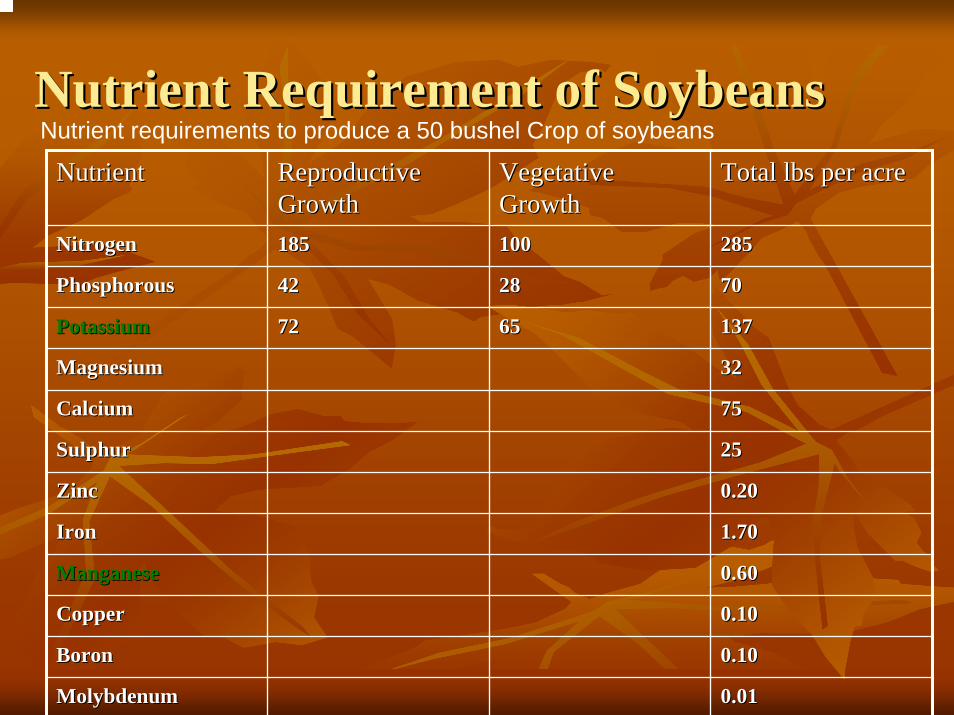
Nutrient Requirement of SoybeansNutrient Requirement of SoybeansNutrient requirements to produce a 50 bushel Crop of soybeans
NutrientNutrient Reproductive Reproductive GrowthGrowth
Vegetative Vegetative GrowthGrowth
Total lbs per acreTotal lbs per acre
NitrogenNitrogen 185185 100100 285285
PhosphorousPhosphorous 4242 2828 7070
PotassiumPotassium 7272 6565 137137
MagnesiumMagnesium 3232
CalciumCalcium 7575
SulphurSulphur 2525
ZincZinc 0.200.20
IronIron 1.701.70
ManganeseManganese 0.600.60
CopperCopper 0.100.10
BoronBoron 0.100.10
MolybdenumMolybdenum 0.010.01
CropCrop Yield Yield LevelLevel
NN PP22OO55 KK22OO MgMg CaCa
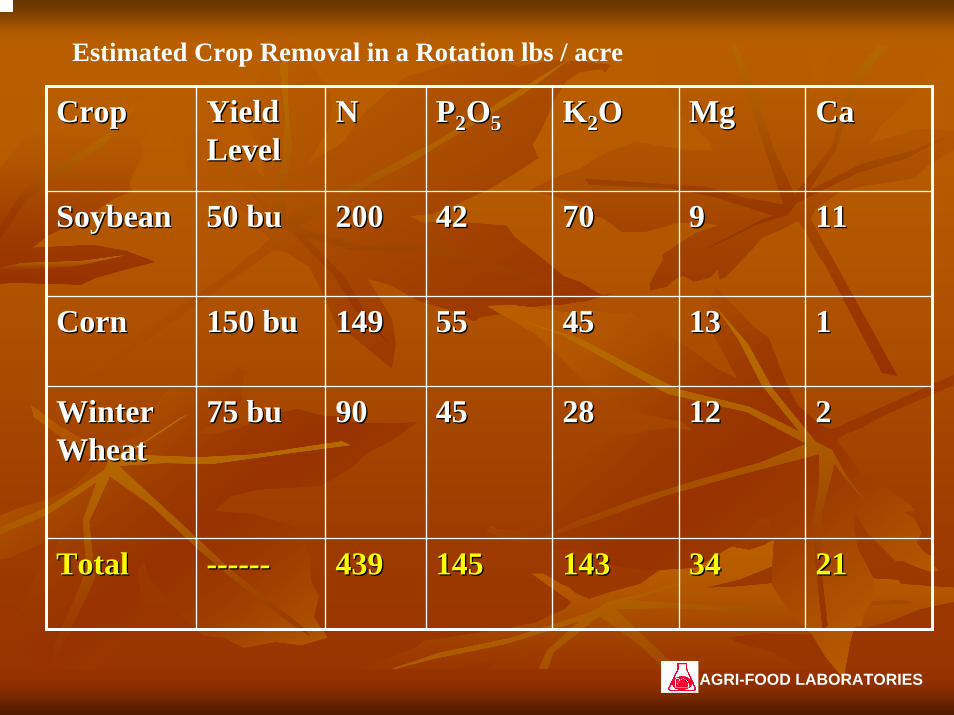
SoybeanSoybean 50 bu50 bu 200200 4242 7070 99
1313
1212
3434
1111
CornCorn 150 bu150 bu 149149 5555 4545 11
Winter Winter WheatWheat
75 bu75 bu 9090 4545 2828 22
TotalTotal ------------ 439439 145145 143143 2121
Estimated Crop Removal in a Rotation lbs / acre
AGRI-FOOD LABORATORIES
CountyCounty Avg P Avg P ppmppm
77--99 99--1515 1515--2020 2525--3030 3030--4040
BrantBrant 5555 -- 77 1515 1212 66
ElginElgin 2929 44 1414 1818 1111 1111
EssexEssex 3232 33 1919 1818 1414 1010
HaldHald--NorfolkNorfolk 5959 11 77 99 66 55
HuronHuron 2929 33 1818 1616 1313 1111
KentKent 3131 33 1515 1616 1414 1111
LambtonLambton 2828 33 1818 1515 1313 1212
MiddlesexMiddlesex 2929 33 1919 1818 1414 1212
OxfordOxford 5252 22 1010 99 88 88
PerthPerth 4848 11 1010 99 99 88
WaterlooWaterloo 4141 22 1010 1111 1111 99
SimcoeSimcoe 2727 77 1818 1313 99 77
WellingtonWellington 3131 55 2121 1414 1111 99
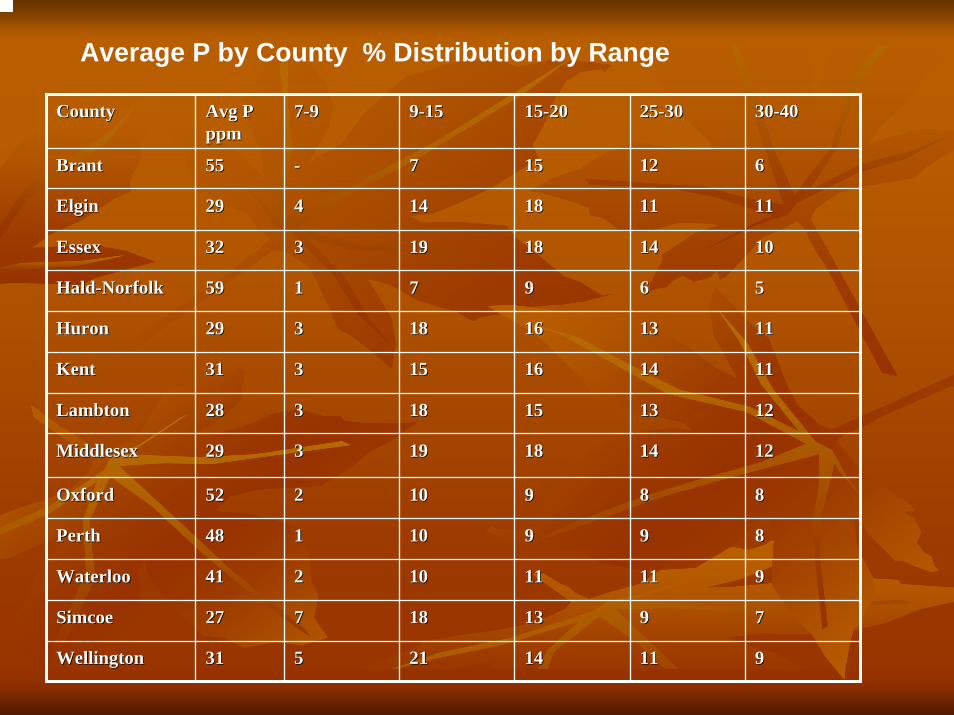
Average P by County % Distribution by Range
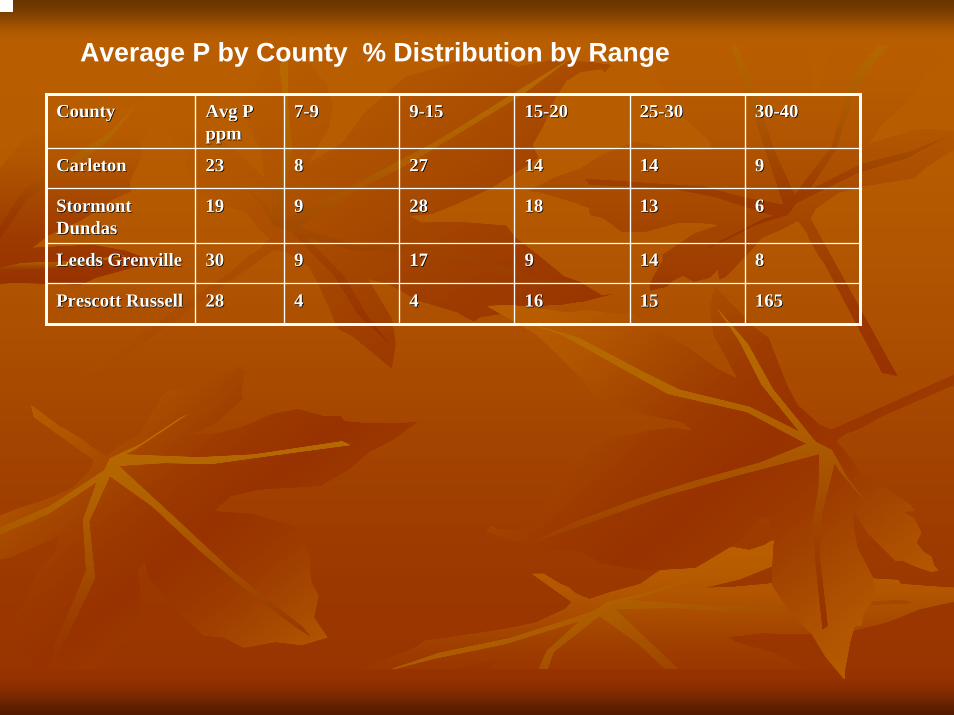
CountyCounty Avg P Avg P ppmppm
77--99 99--1515 1515--2020 2525--3030 3030--4040
CarletonCarleton 2323 88 2727 1414 1414 99
Stormont Stormont DundasDundas
1919 99 2828 1818 1313 66
Leeds GrenvilleLeeds Grenville 3030 99 1717 99 1414 88
Prescott RussellPrescott Russell 2828 44 44 1616 1515 165165
Average P by County % Distribution by Range
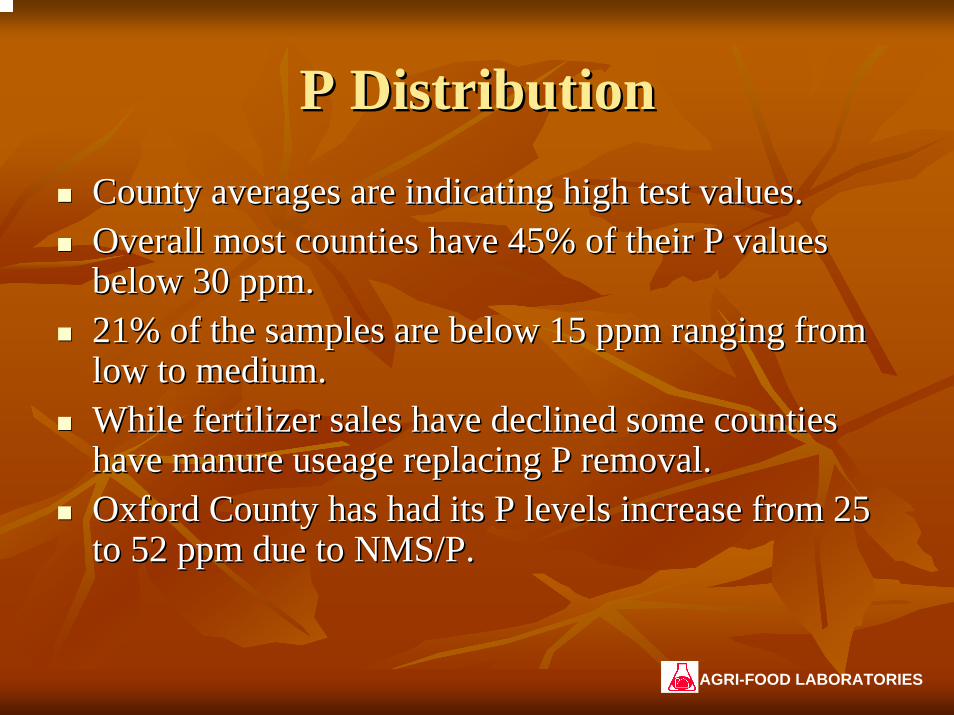
P DistributionP Distribution
County averages are indicating high test values.County averages are indicating high test values.Overall most counties have 45% of their P values Overall most counties have 45% of their P values below 30 ppm.below 30 ppm.21% of the samples are below 15 ppm ranging from 21% of the samples are below 15 ppm ranging from low to medium.low to medium.While fertilizer sales have declined some counties While fertilizer sales have declined some counties have manure useage replacing P removal.have manure useage replacing P removal.Oxford County has had its P levels increase from 25 Oxford County has had its P levels increase from 25 to 52 ppm due to NMS/P.to 52 ppm due to NMS/P.
AGRI-FOOD LABORATORIES
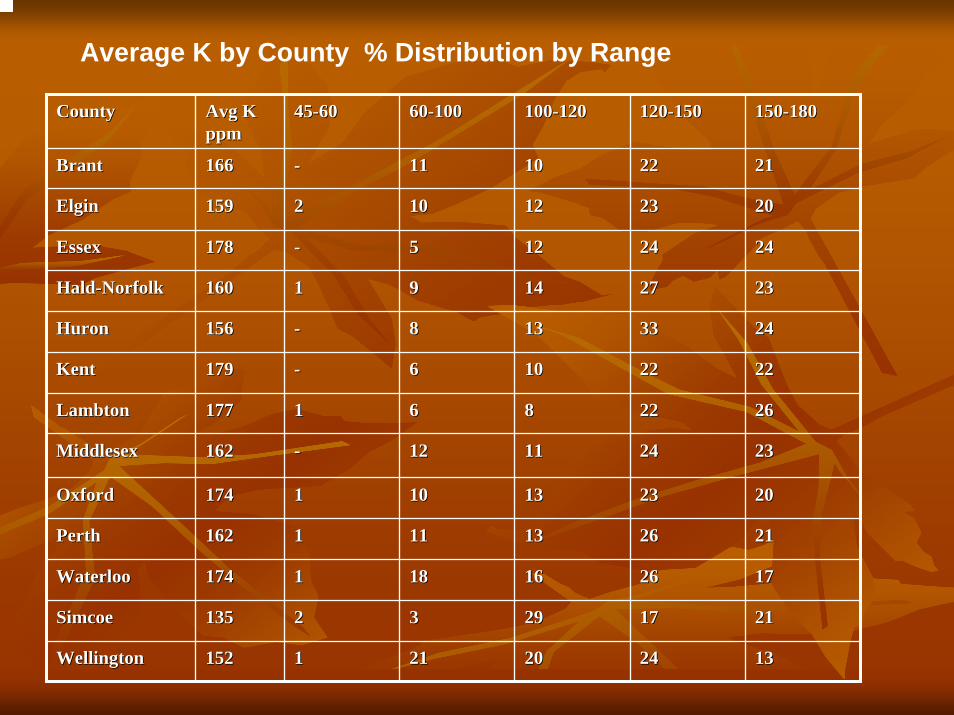
CountyCounty Avg K Avg K ppmppm
4545--6060 6060--100100 100100--120120 120120--150150 150150--180180
BrantBrant 166166 -- 1111 1010 2222 2121
ElginElgin 159159 22 1010 1212 2323 2020
EssexEssex 178178 -- 55 1212 2424 2424
HaldHald--NorfolkNorfolk 160160 11 99 1414 2727 2323
HuronHuron 156156 -- 88 1313 3333 2424
KentKent 179179 -- 66 1010 2222 2222
LambtonLambton 177177 11 66 88 2222 2626
MiddlesexMiddlesex 162162 -- 1212 1111 2424 2323
OxfordOxford 174174 11 1010 1313 2323 2020
PerthPerth 162162 11 1111 1313 2626 2121
WaterlooWaterloo 174174 11 1818 1616 2626 1717
SimcoeSimcoe 135135 22 33 2929 1717 2121
WellingtonWellington 152152 11 2121 2020 2424 1313
Average K by County % Distribution by Range
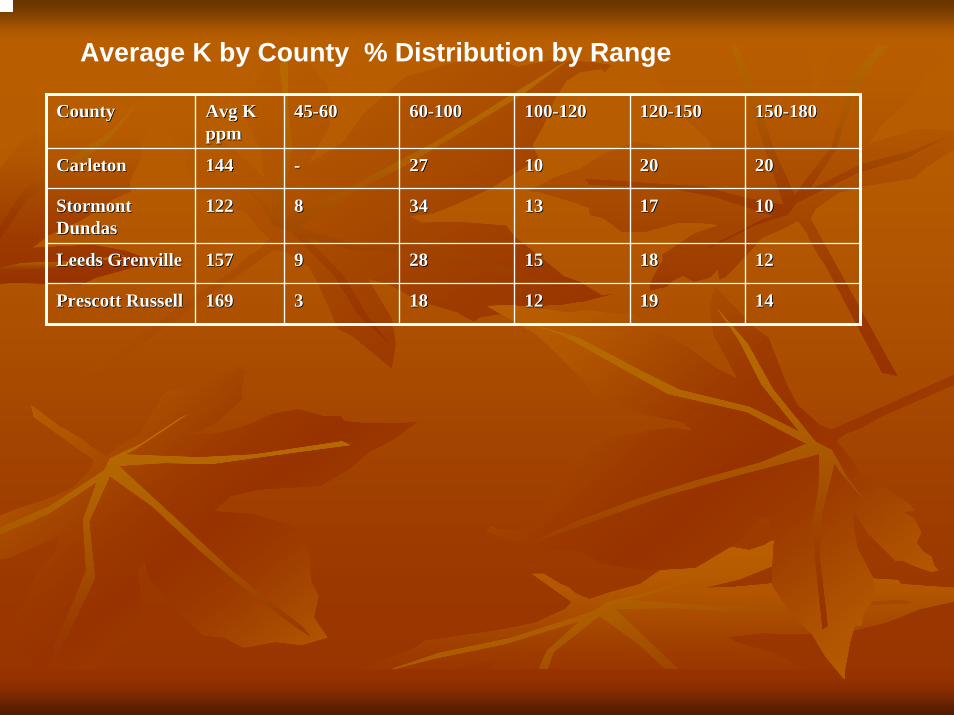
CountyCounty Avg K Avg K ppmppm
4545--6060 6060--100100 100100--120120 120120--150150 150150--180180
CarletonCarleton 144144 -- 2727 1010 2020 2020
Stormont Stormont DundasDundas
122122 88 3434 1313 1717 1010
Leeds GrenvilleLeeds Grenville 157157 99 2828 1515 1818 1212
Prescott RussellPrescott Russell 169169 33 1818 1212 1919 1414
Average K by County % Distribution by Range
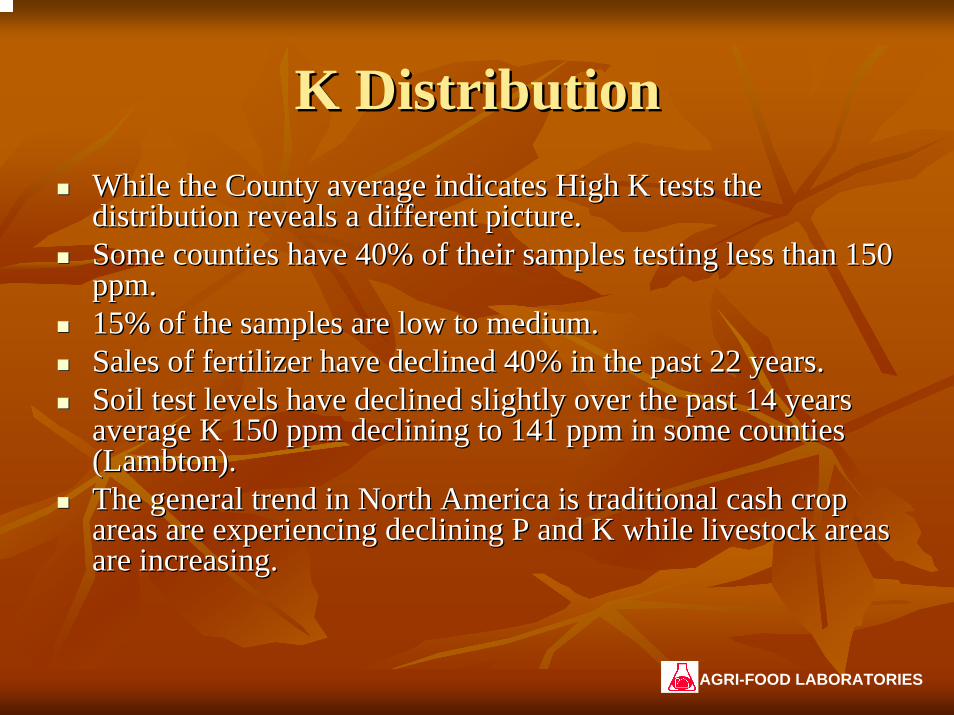
K DistributionK DistributionWhile the County average indicates High K tests the While the County average indicates High K tests the distribution reveals a different picture.distribution reveals a different picture.Some counties have 40% of their samples testing less than 150 Some counties have 40% of their samples testing less than 150 ppm.ppm.15% of the samples are low to medium.15% of the samples are low to medium.Sales of fertilizer have declined 40% in the past 22 years.Sales of fertilizer have declined 40% in the past 22 years.Soil test levels have declined slightly over the past 14 years Soil test levels have declined slightly over the past 14 years average K 150 ppm declining to 141 ppm in some counties average K 150 ppm declining to 141 ppm in some counties (Lambton).(Lambton).The general trend in North America is traditional cash crop The general trend in North America is traditional cash crop areas are experiencing declining P and K while livestock areas areas are experiencing declining P and K while livestock areas are increasing.are increasing.
AGRI-FOOD LABORATORIES
Nutrient Requirements of SoybeansNutrient Requirements of Soybeans
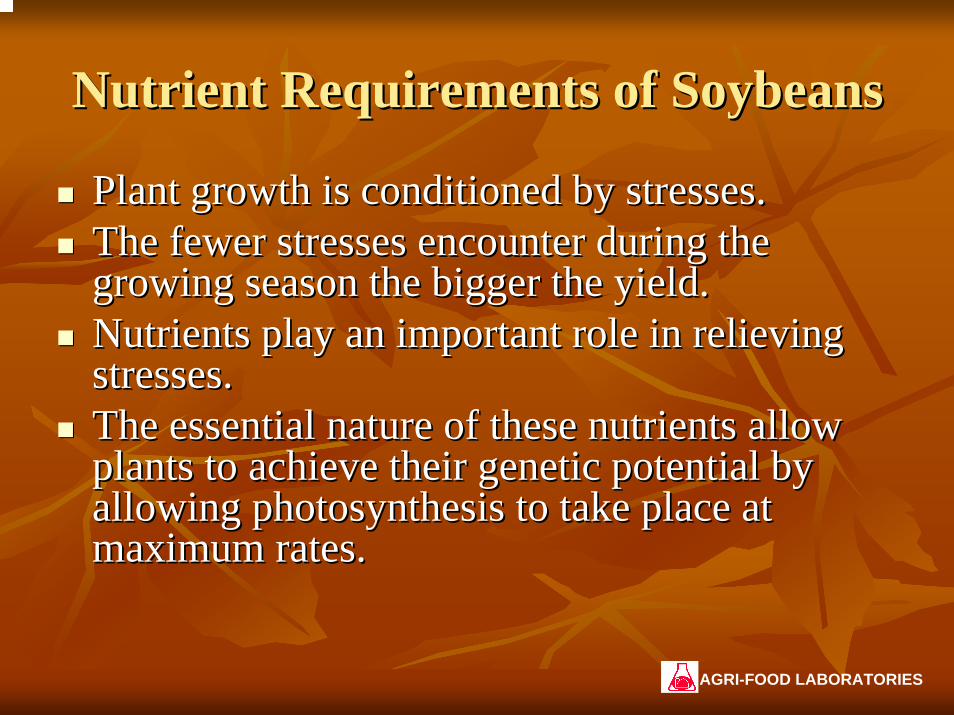
Plant growth is conditioned by stresses.Plant growth is conditioned by stresses.The fewer stresses encounter during the The fewer stresses encounter during the growing season the bigger the yield.growing season the bigger the yield.Nutrients play an important role in relieving Nutrients play an important role in relieving stresses.stresses.The essential nature of these nutrients allow The essential nature of these nutrients allow plants to achieve their genetic potential by plants to achieve their genetic potential by allowing photosynthesis to take place at allowing photosynthesis to take place at maximum rates.maximum rates.
AGRI-FOOD LABORATORIES
Nutrient Requirements of SoybeansNutrient Requirements of Soybeans
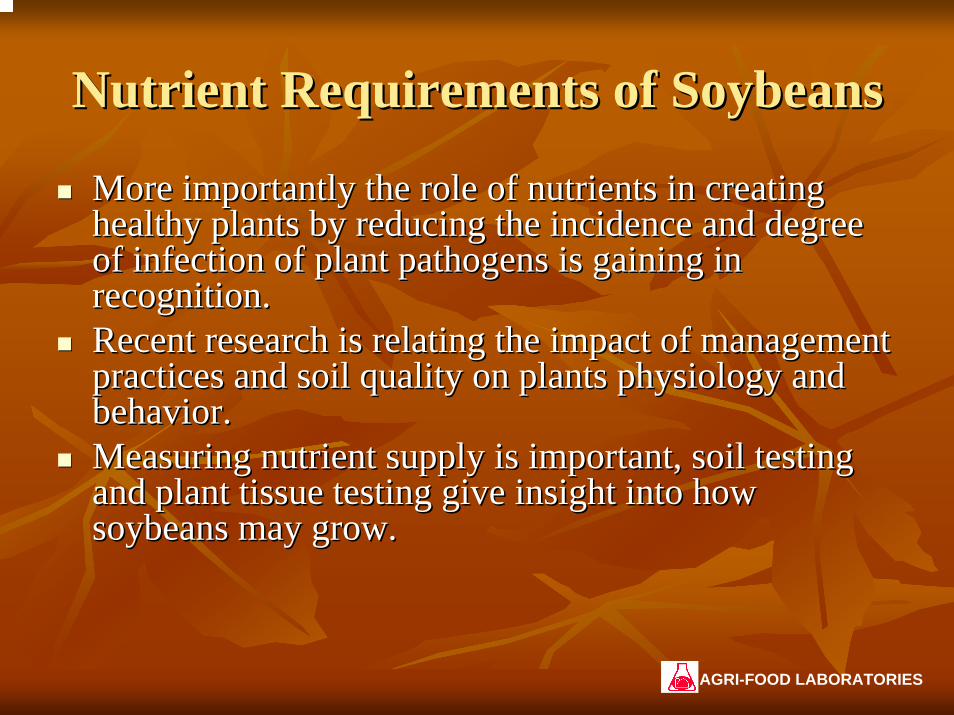
More importantly the role of nutrients in creating More importantly the role of nutrients in creating healthy plants by reducing the incidence and degree healthy plants by reducing the incidence and degree of infection of plant pathogens is gaining in of infection of plant pathogens is gaining in recognition.recognition.Recent research is relating the impact of management Recent research is relating the impact of management practices and soil quality on plants physiology and practices and soil quality on plants physiology and behavior.behavior.Measuring nutrient supply is important, soil testing Measuring nutrient supply is important, soil testing and plant tissue testing give insight into how and plant tissue testing give insight into how soybeans may grow.soybeans may grow.
AGRI-FOOD LABORATORIES
03
2
3
3
3
3
3
2
6
5 6
6
6
10
10
1310
10
1410
1310
10
814
10
2114
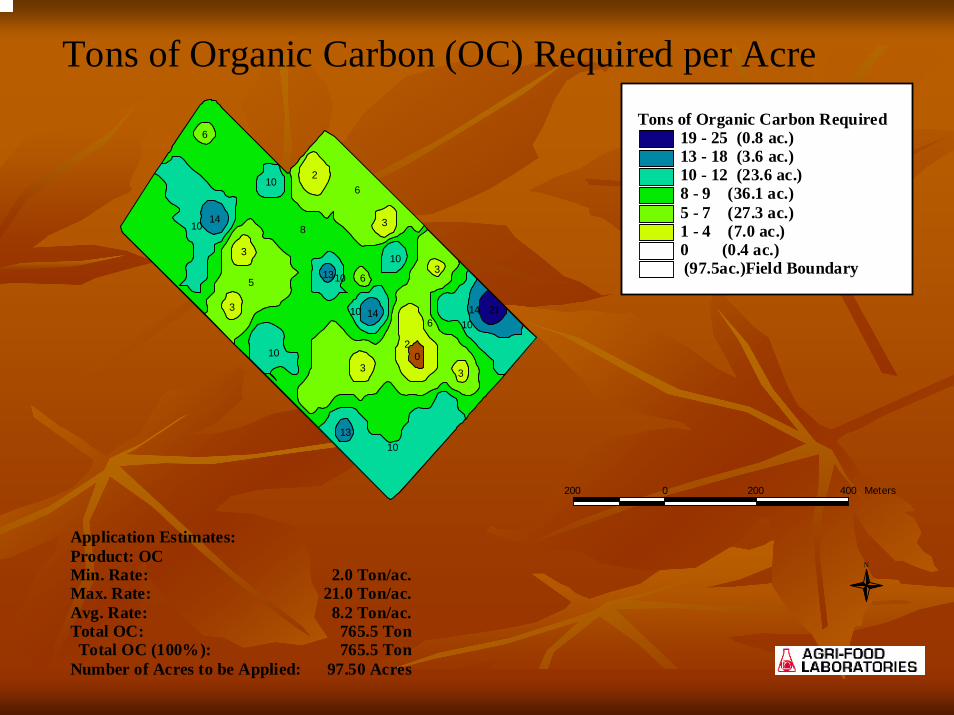
Tons of Organic Carbon (OC) Required per Acre
Application Estimates:Product: OCMin. Rate:Max. Rate:Avg. Rate:Total OC: Total OC (100%):Number of Acres to be Applied:
2.0 Ton/ac.21.0 Ton/ac.8.2 Ton/ac.765.5 Ton765.5 Ton
97.50 Acres
N
(97.5ac.)Field Boundary
Tons of Organic Carbon Required19 - 25 (0.8 ac.)13 - 18 (3.6 ac.)10 - 12 (23.6 ac.)8 - 9 (36.1 ac.)5 - 7 (27.3 ac.)1 - 4 (7.0 ac.)0 (0.4 ac.)
200 0 200 400 Meters
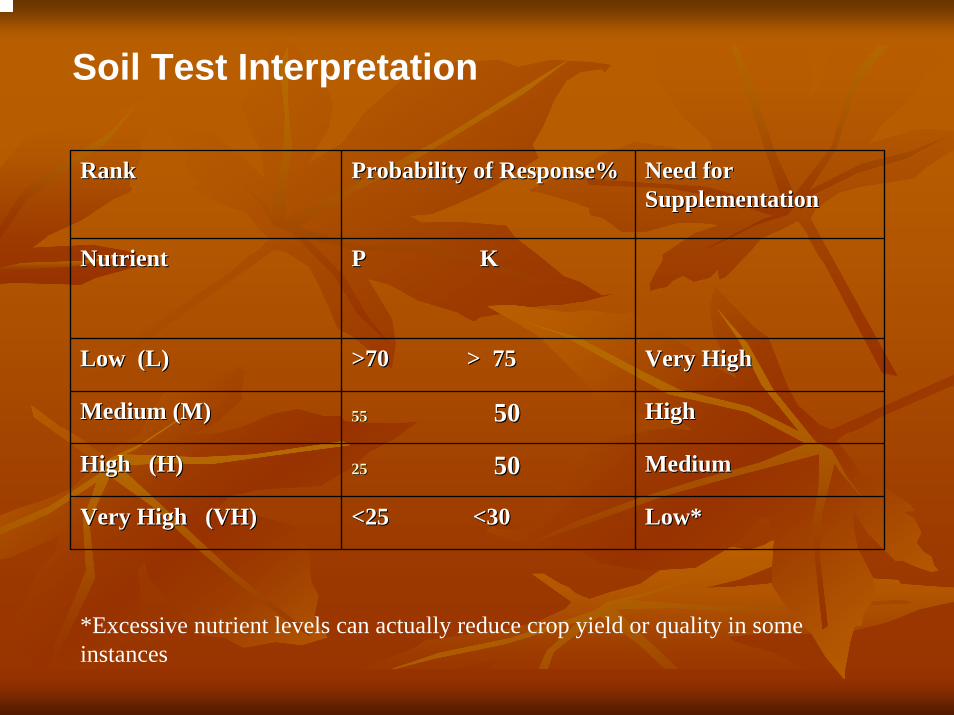
RankRank Probability of Response%Probability of Response% Need for Need for SupplementationSupplementation
NutrientNutrient P KP K
Low (L)Low (L) >70 > 75>70 > 75 Very HighVery High
Medium (M)Medium (M) 5555 5050 HighHigh
High (H)High (H) 2525 5050 MediumMedium
Very High (VH)Very High (VH) <25 <30<25 <30 Low*Low*
*Excessive nutrient levels can actually reduce crop yield or quality in some instances
Soil Test Interpretation
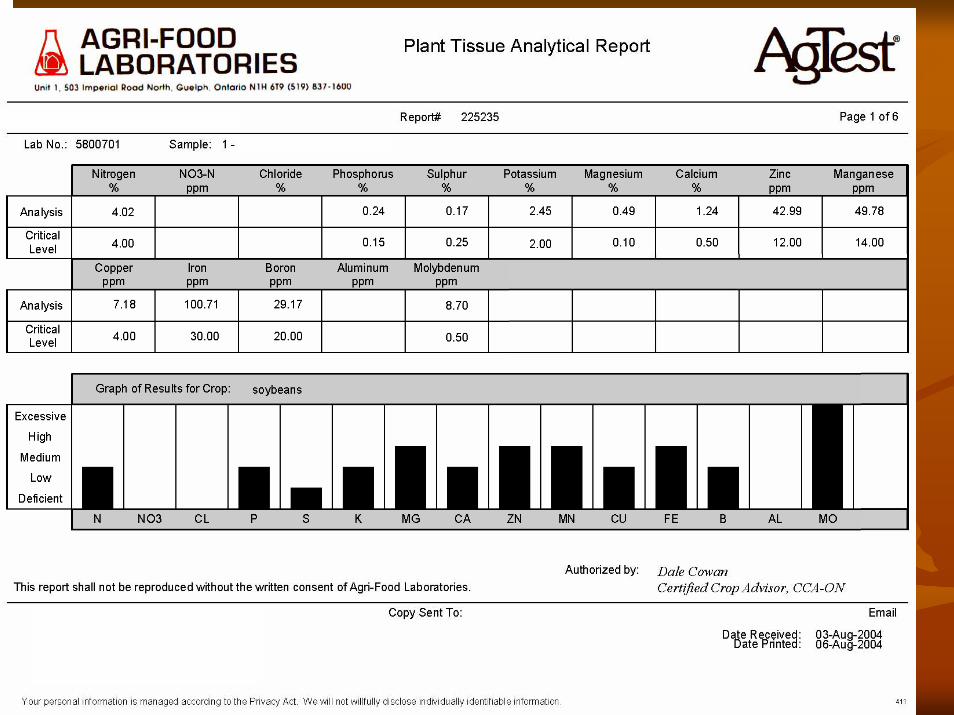
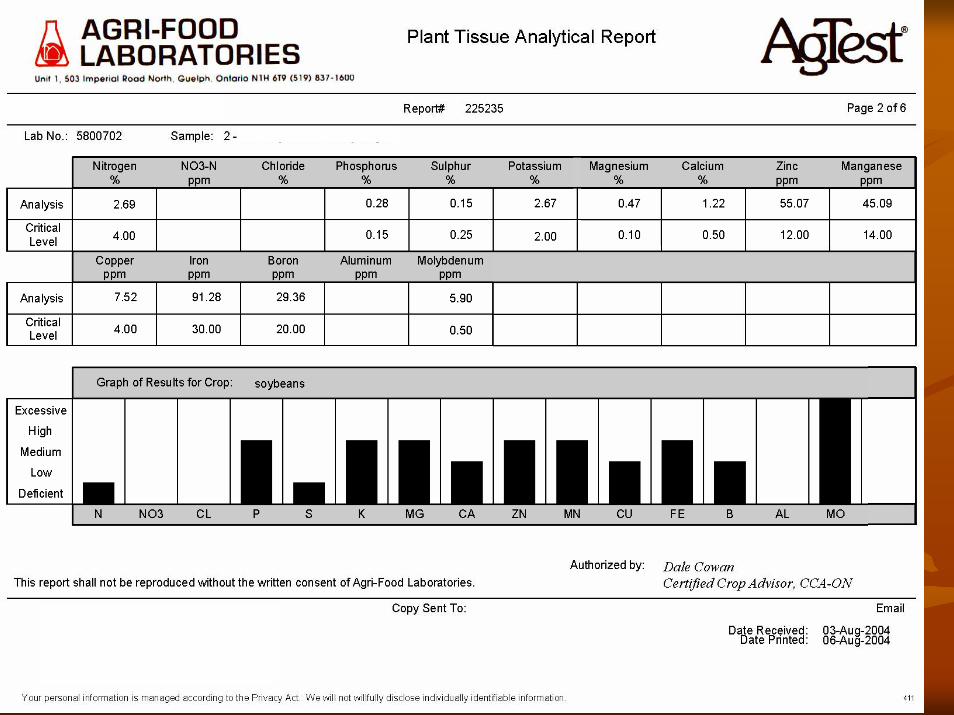
Plant Tissue AnalysisPlant Tissue AnalysisPlant Tissue analysis chemistry measures the total nutrients Plant Tissue analysis chemistry measures the total nutrients contained in the plant part.contained in the plant part.There is a specific plant part to be sampled usually the most There is a specific plant part to be sampled usually the most recently matured leaf.recently matured leaf.Timing is also critical for determination.Timing is also critical for determination.Most agronomically significant crops have critical levels Most agronomically significant crops have critical levels established for interpretation.established for interpretation.Critical levels are set at a level where 90% of maximum yield Critical levels are set at a level where 90% of maximum yield potential can still be achieved.potential can still be achieved.Values below the critical level indicate that yield potential isValues below the critical level indicate that yield potential islower and the nutrient is ranked as deficient.lower and the nutrient is ranked as deficient.
AGRI-FOOD LABORATORIES
Using the Tools of Soil and Plant Using the Tools of Soil and Plant Tissue AnalysisTissue Analysis
In 2003 we started a database of soil and plant tissue analysis In 2003 we started a database of soil and plant tissue analysis in a site specific manner on corn and soybeans.in a site specific manner on corn and soybeans.The objective was to work with farmers that had yield The objective was to work with farmers that had yield monitors and systematic soil sampling done on their fields.monitors and systematic soil sampling done on their fields.This database will be used to assess nutrient balance, This database will be used to assess nutrient balance, applications and crop yield as well as quality.applications and crop yield as well as quality.With the potential for Asian Rust the database may prove With the potential for Asian Rust the database may prove useful in defining cultural practices that influence infection useful in defining cultural practices that influence infection levels. levels. One of the key elements promoting yield and plant health is One of the key elements promoting yield and plant health is Potassium (KPotassium (K++))
AGRI-FOOD LABORATORIES

Soybean Yield and Critical K %
y = -17.255x2 + 82.86x - 54.156R2 = 0.3201
0102030405060
0 0.5 1 1.5 2 2.5 3
K % in tissue
Yie
ld B
PA
Agri-Food data 2003
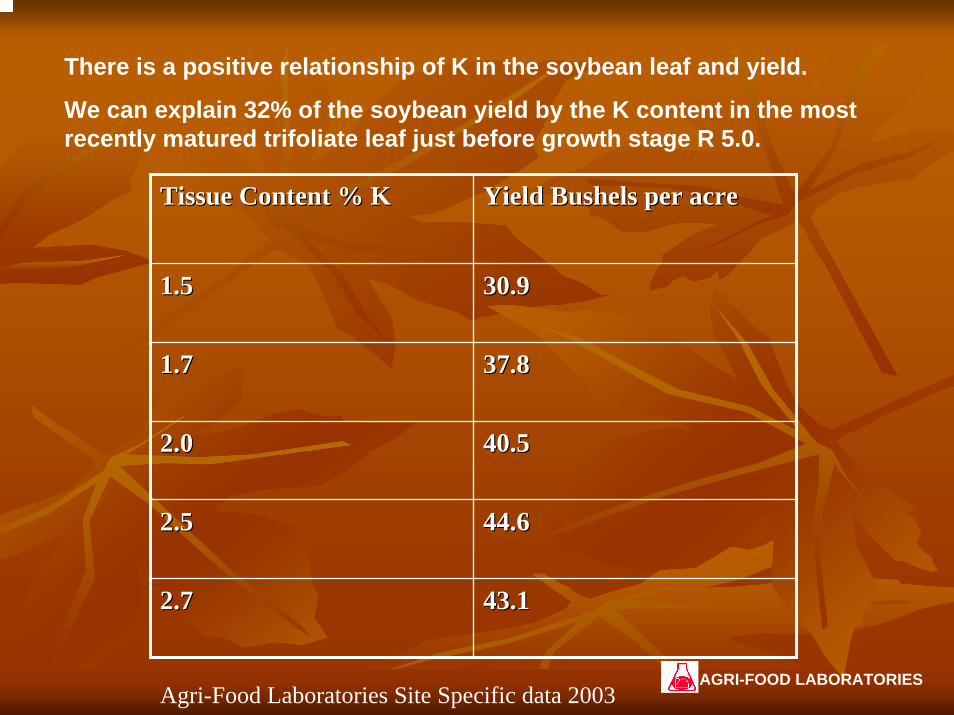
There is a positive relationship of K in the soybean leaf and yield.
We can explain 32% of the soybean yield by the K content in the most recently matured trifoliate leaf just before growth stage R 5.0.
Tissue Content % KTissue Content % K Yield Bushels per acreYield Bushels per acre
1.51.5 30.930.9
1.71.7 37.837.8
2.02.0 40.540.5
2.52.5 44.644.6
2.72.7 43.143.1
AGRI-FOOD LABORATORIESAgri-Food Laboratories Site Specific data 2003

Soil Test K and Plant Tissue KSoil Test K and Plant Tissue KWhat is the relationship between Soil Test K and What is the relationship between Soil Test K and Plant Tissue K levels?Plant Tissue K levels?In the same plot areas we have soil testIn the same plot areas we have soil testThe correlation is not as strong but is positive.The correlation is not as strong but is positive.The weak relationship is not unexpected when you The weak relationship is not unexpected when you consider the difference between fertility and consider the difference between fertility and productivity factorsproductivity factorsSoil structure and root massing determine the root Soil structure and root massing determine the root surface area that governs the amount of nutrient surface area that governs the amount of nutrient uptake by root interception, mass flow and diffusion.uptake by root interception, mass flow and diffusion.
AGRI-FOOD LABORATORIES
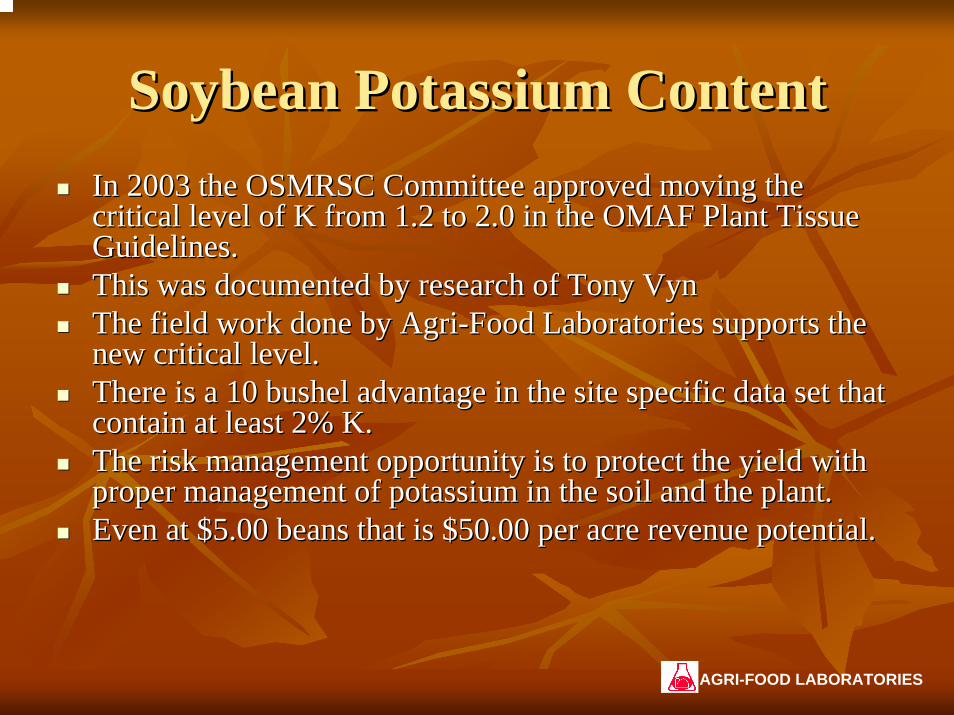
Soybean Potassium ContentSoybean Potassium ContentIn 2003 the OSMRSC Committee approved moving the In 2003 the OSMRSC Committee approved moving the critical level of K from 1.2 to 2.0 in the OMAF Plant Tissue critical level of K from 1.2 to 2.0 in the OMAF Plant Tissue Guidelines.Guidelines.This was documented by research of Tony VynThis was documented by research of Tony VynThe field work done by AgriThe field work done by Agri--Food Laboratories supports the Food Laboratories supports the new critical level.new critical level.There is a 10 bushel advantage in the site specific data set thaThere is a 10 bushel advantage in the site specific data set that t contain at least 2% K.contain at least 2% K.The risk management opportunity is to protect the yield with The risk management opportunity is to protect the yield with proper management of potassium in the soil and the plant.proper management of potassium in the soil and the plant.Even at $5.00 beans that is $50.00 per acre revenue potential.Even at $5.00 beans that is $50.00 per acre revenue potential.
AGRI-FOOD LABORATORIES

Clinton Soybean K, Soil and Tissue
y = 43.352x + 60.892R2 = 0.1278
0
50
100
150
200
250
0 0.5 1 1.5 2 2.5 3
Soybean Tissue K %
Soil
Test
K p
pm
AGRI-FOOD LABORATORIES
Soil Test K and Plant Tissue K and Soil Test K and Plant Tissue K and YieldYield
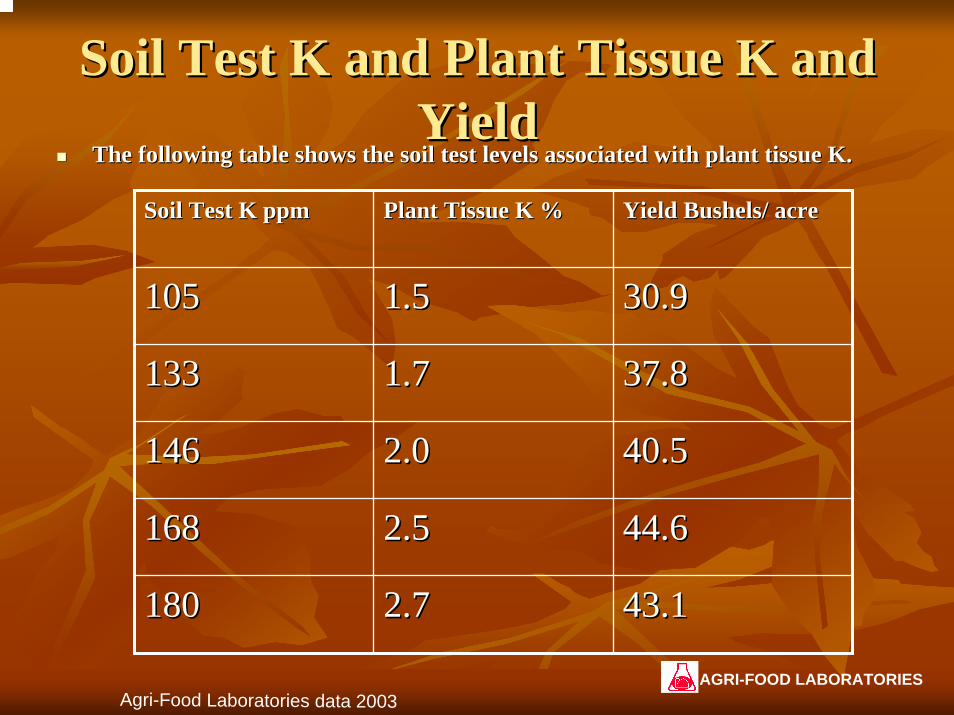
The following table shows the soil test levels associated with pThe following table shows the soil test levels associated with plant tissue K.lant tissue K.
Soil Test K ppmSoil Test K ppm Plant Tissue K %Plant Tissue K % Yield Bushels/ acreYield Bushels/ acre
105105 1.51.5 30.930.9
133133 1.71.7 37.837.8
146146 2.02.0 40.540.5
168168 2.52.5 44.644.6
180180 2.72.7 43.143.1
Agri-Food Laboratories data 2003AGRI-FOOD LABORATORIES
Potassium Recommendation Potassium Recommendation MethodsMethods
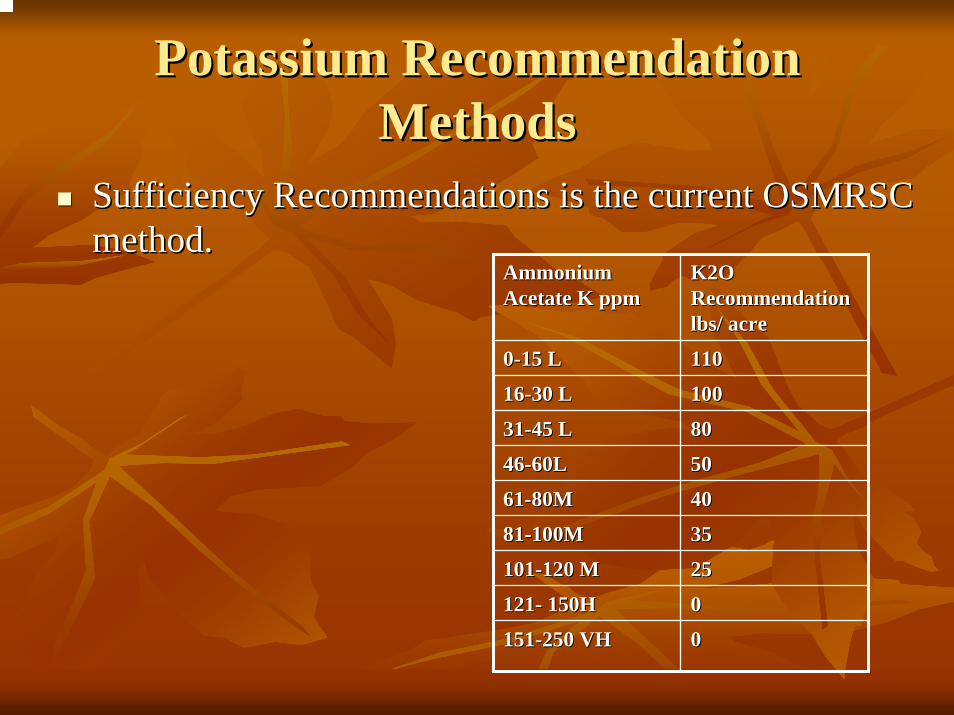
Sufficiency Recommendations is the current OSMRSC Sufficiency Recommendations is the current OSMRSC method.method.
Ammonium Ammonium Acetate K ppmAcetate K ppm
K2O K2O Recommendation Recommendation lbs/ acrelbs/ acre
00--15 L15 L 110110
1616--30 L30 L 100100
3131--45 L45 L 8080
4646--60L60L 5050
6161--80M80M 4040
8181--100M100M 3535
101101--120 M120 M 2525
121121-- 150H150H 00
151151--250 VH250 VH 00
Potassium Recommendation Potassium Recommendation MethodsMethods
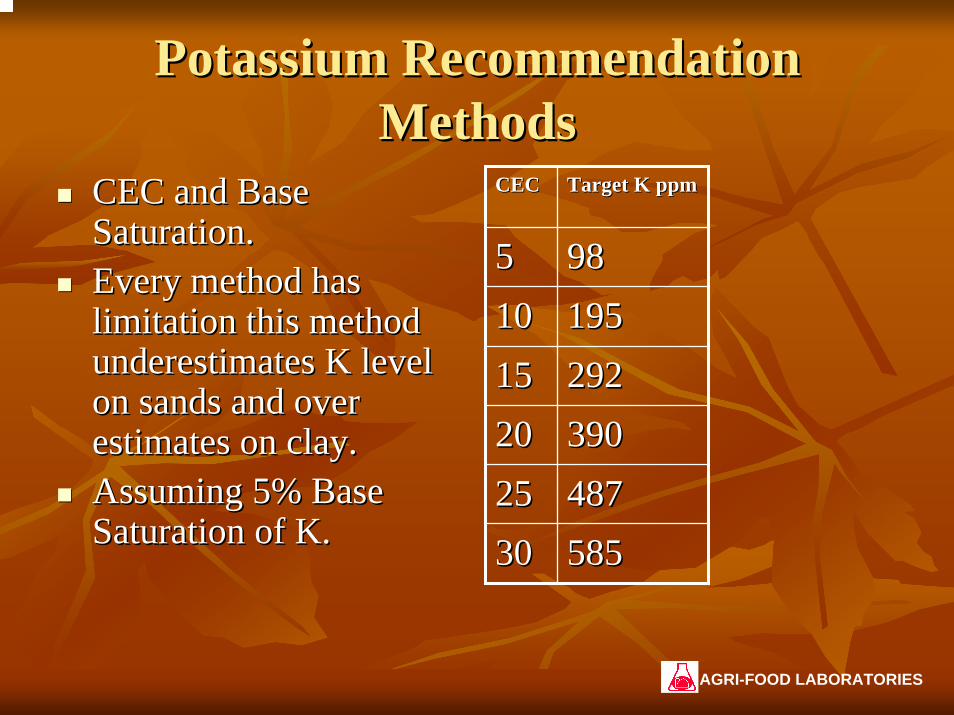
CEC and Base CEC and Base Saturation.Saturation.Every method has Every method has limitation this method limitation this method underestimates K level underestimates K level on sands and over on sands and over estimates on clay.estimates on clay.Assuming 5% Base Assuming 5% Base Saturation of K.Saturation of K.
CECCEC Target K ppmTarget K ppm
55 98981010 1951951515 2922922020 3903902525 4874873030 585585
AGRI-FOOD LABORATORIES
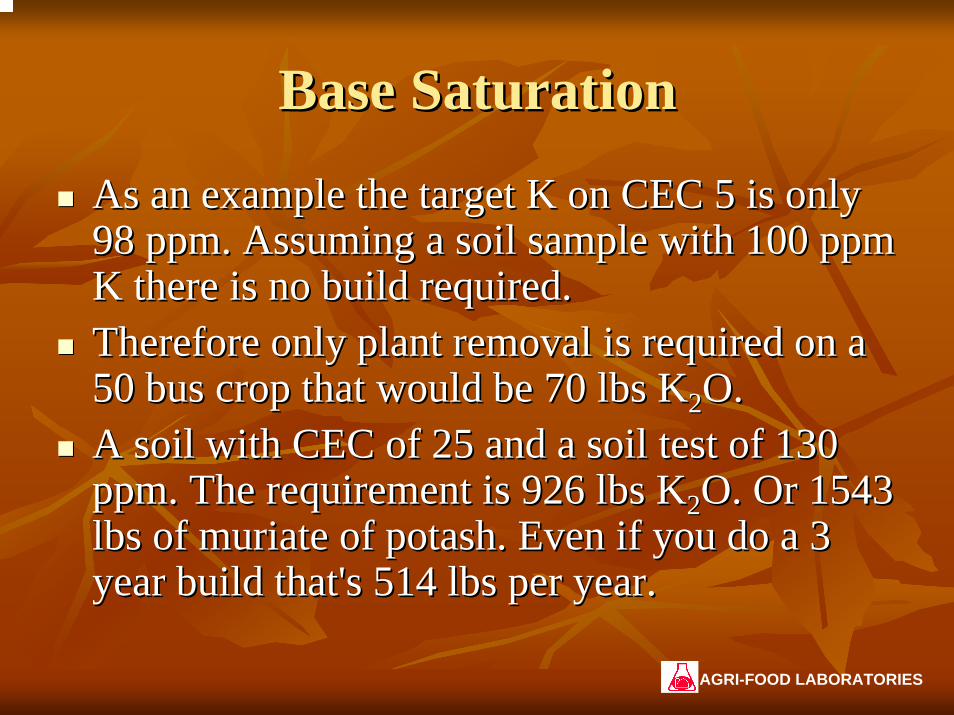
Base SaturationBase Saturation
As an example the target K on CEC 5 is only As an example the target K on CEC 5 is only 98 ppm. Assuming a soil sample with 100 ppm 98 ppm. Assuming a soil sample with 100 ppm K there is no build required.K there is no build required.Therefore only plant removal is required on a Therefore only plant removal is required on a 50 bus crop that would be 70 lbs K50 bus crop that would be 70 lbs K22O.O.A soil with CEC of 25 and a soil test of 130 A soil with CEC of 25 and a soil test of 130 ppm. The requirement is 926 lbs Kppm. The requirement is 926 lbs K22O. Or 1543 O. Or 1543 lbs of muriate of potash. Even if you do a 3 lbs of muriate of potash. Even if you do a 3 year build that's 514 lbs per year. year build that's 514 lbs per year.
AGRI-FOOD LABORATORIES
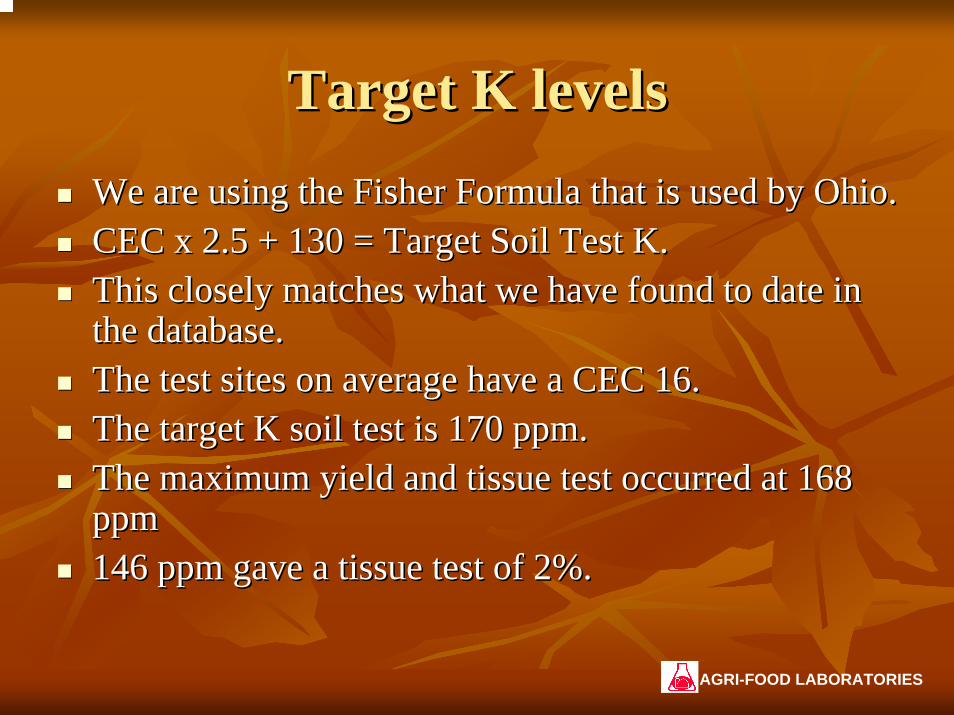
Target K levelsTarget K levels
We are using the Fisher Formula that is used by Ohio.We are using the Fisher Formula that is used by Ohio.CEC x 2.5 + 130 = Target Soil Test K.CEC x 2.5 + 130 = Target Soil Test K.This closely matches what we have found to date in This closely matches what we have found to date in the database.the database.The test sites on average have a CEC 16.The test sites on average have a CEC 16.The target K soil test is 170 ppm.The target K soil test is 170 ppm.The maximum yield and tissue test occurred at 168 The maximum yield and tissue test occurred at 168 ppmppm146 ppm gave a tissue test of 2%.146 ppm gave a tissue test of 2%.
AGRI-FOOD LABORATORIES
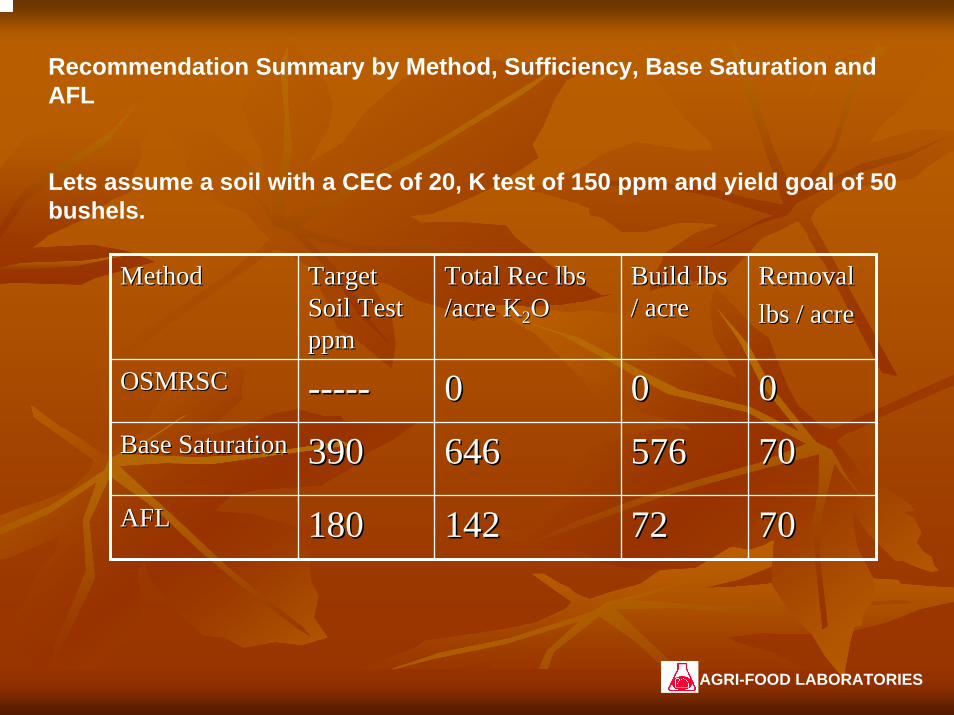
Recommendation Summary by Method, Sufficiency, Base Saturation and AFL
Lets assume a soil with a CEC of 20, K test of 150 ppm and yield goal of 50 bushels.
MethodMethod Target Target Soil Test Soil Test ppmppm
Total Rec lbs Total Rec lbs /acre K/acre K22OO
Build lbs Build lbs / acre/ acre
RemovalRemovallbs / acrelbs / acre
OSMRSCOSMRSC ---------- 00 00 00Base SaturationBase Saturation 390390 646646 576576 7070
AFLAFL 180180 142142 7272 7070
AGRI-FOOD LABORATORIES

The PointThe PointWe are adding value to site specific data.We are adding value to site specific data.The advantage to being able to collect site specific The advantage to being able to collect site specific data is to analyze unique opportunities rather than use data is to analyze unique opportunities rather than use average responses curves.average responses curves.Most calibration curves have a scattering of points, Most calibration curves have a scattering of points, the best fit line can always be fitted to the data.the best fit line can always be fitted to the data.This is an approach that attempts to look for gains in This is an approach that attempts to look for gains in efficiency.efficiency.The investment in Precision Technologies is realized The investment in Precision Technologies is realized when information is turned into specific knowledge when information is turned into specific knowledge based decisions.based decisions.
Soybean Potassium FertilizationSoybean Potassium Fertilization
The soybean crop seldom receives direct fertilizer The soybean crop seldom receives direct fertilizer applications.applications.Soybeans respond to fertile soils.Soybeans respond to fertile soils.It is important to recognize the nutrient needs of the It is important to recognize the nutrient needs of the crop rotation.crop rotation.If the fertilizer has not yet been applied to the rotation If the fertilizer has not yet been applied to the rotation then it is prudent that the application take place then it is prudent that the application take place before soybean planting. Especially if the Soil K test before soybean planting. Especially if the Soil K test is below the target level.is below the target level.
AGRI-FOOD LABORATORIES
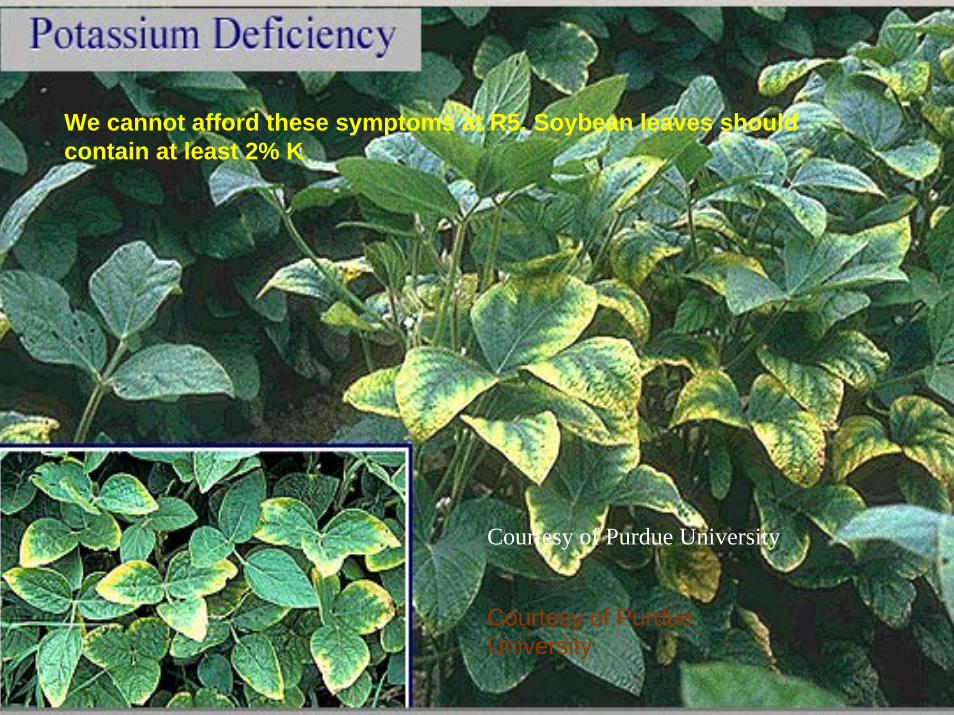
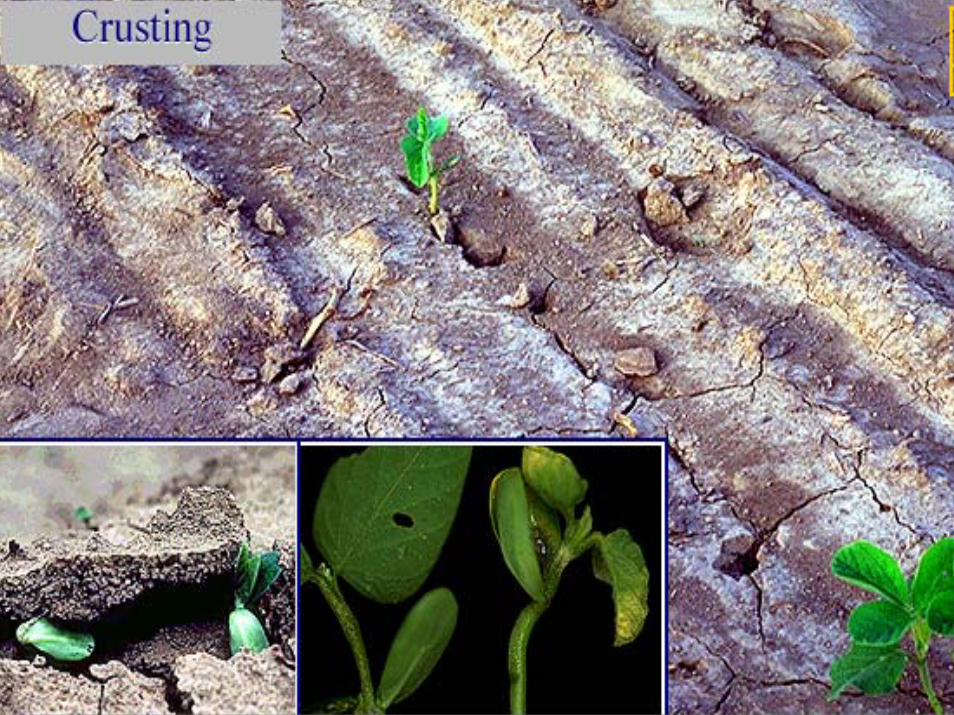
We cannot afford these symptoms at R5. Soybean leaves should contain at least 2% K
Courtesy of Purdue University
Courtesy of Purdue University
Factors Affecting Nutrient Uptake of Factors Affecting Nutrient Uptake of PotassiumPotassium
Level of available K, including solution K and Level of available K, including solution K and readily exchangeable in equilibrium with readily exchangeable in equilibrium with slowly available.slowly available.Previous crop residuePrevious crop residueTillageTillageSoil Moisture and AerationSoil Moisture and AerationSoil temperatureSoil temperature
AGRI-FOOD LABORATORIES
Available KAvailable K
The soil test indicates the soils ability to The soil test indicates the soils ability to supply by measuring solution and readily supply by measuring solution and readily exchangeable K.exchangeable K.Root massing determines surface area Root massing determines surface area available for absorption of K.available for absorption of K.K moves to roots largely by diffusion.K moves to roots largely by diffusion.While N moves 1 cm, P and K move 0.02 and While N moves 1 cm, P and K move 0.02 and 0.2 cm. 0.2 cm.
AGRI-FOOD LABORATORIES
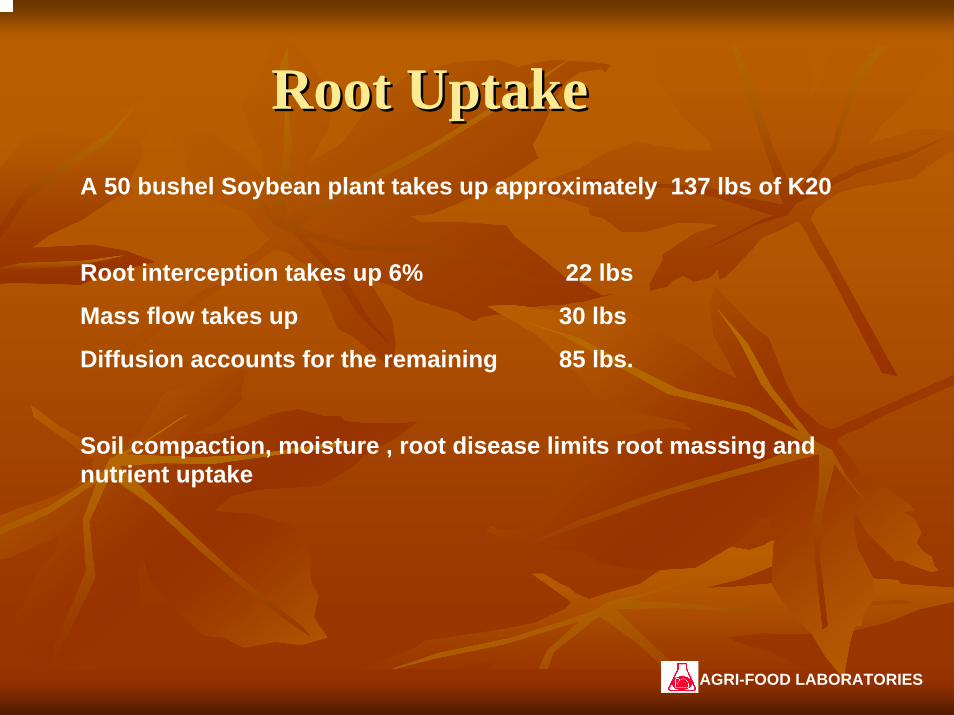
Root UptakeRoot UptakeA 50 bushel Soybean plant takes up approximately 137 lbs of K20
Root interception takes up 6% 22 lbs
Mass flow takes up 30 lbs
Diffusion accounts for the remaining 85 lbs.
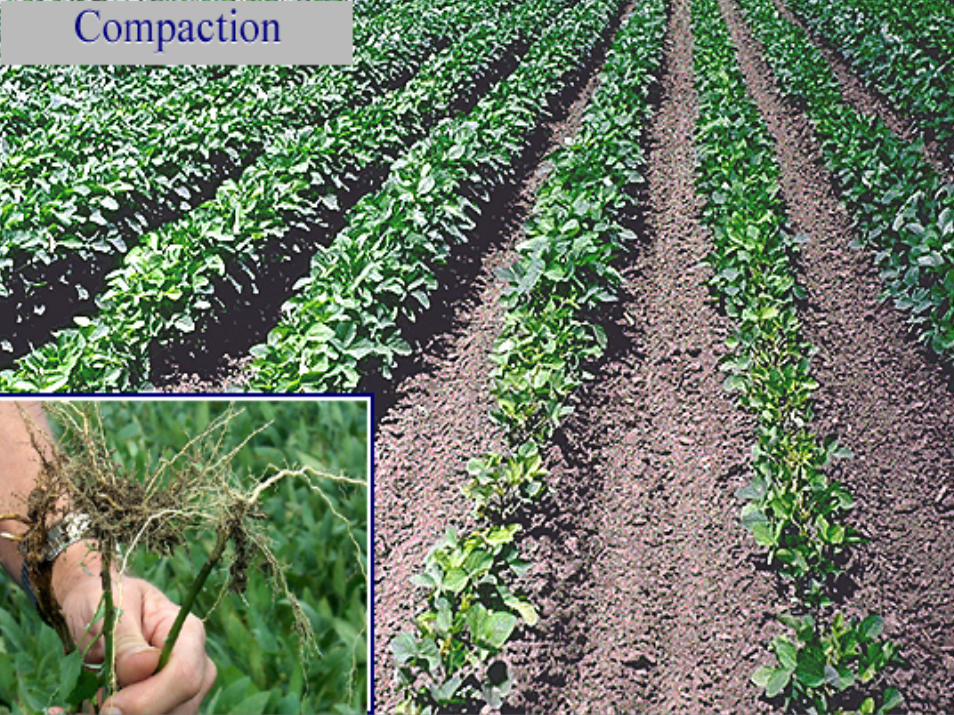
Soil compaction, moisture , root disease limits root massing andnutrient uptake
AGRI-FOOD LABORATORIES
Previous Crop ResiduePrevious Crop Residue
The residue left by the previous crop The residue left by the previous crop influences available K.influences available K.Corn stover is K rich and will breakdown to Corn stover is K rich and will breakdown to leave approximately 150 lbs of K2O.leave approximately 150 lbs of K2O.In contrast corn silage or forage crop residue In contrast corn silage or forage crop residue leaves very little.leaves very little.
AGRI-FOOD LABORATORIES
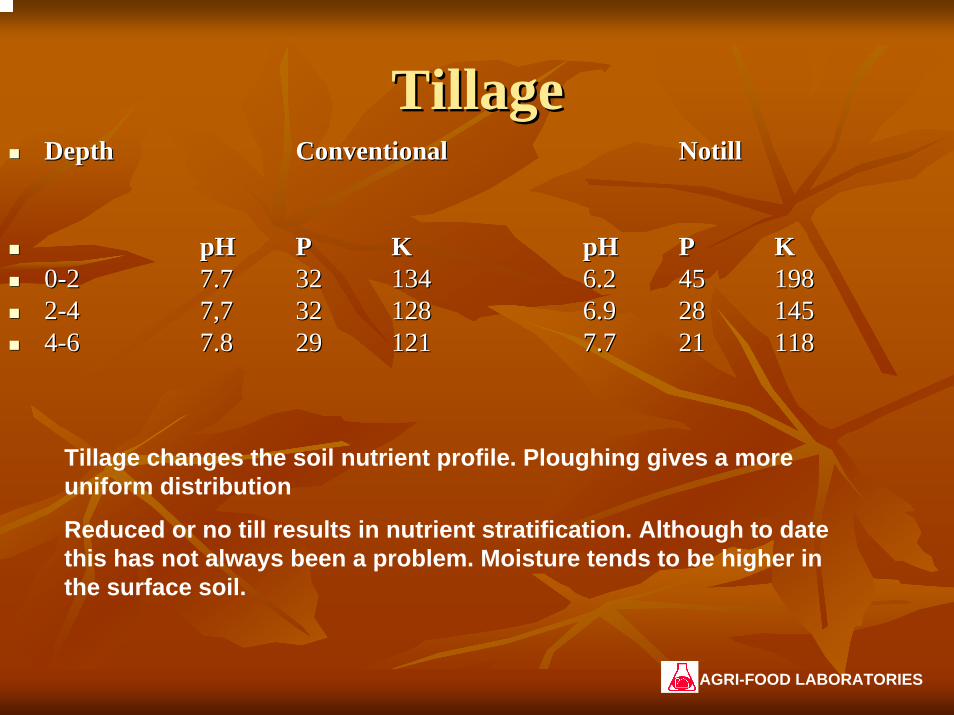
TillageTillageDepthDepth Conventional Conventional NotillNotill
pHpH PP KK pHpH PP KK00--22 7.77.7 3232 134134 6.26.2 4545 19819822--44 7,77,7 3232 128128 6.96.9 2828 14514544--66 7.87.8 2929 121121 7.77.7 2121 118118
Tillage changes the soil nutrient profile. Ploughing gives a more uniform distribution
Reduced or no till results in nutrient stratification. Although to date this has not always been a problem. Moisture tends to be higher in the surface soil.
AGRI-FOOD LABORATORIES
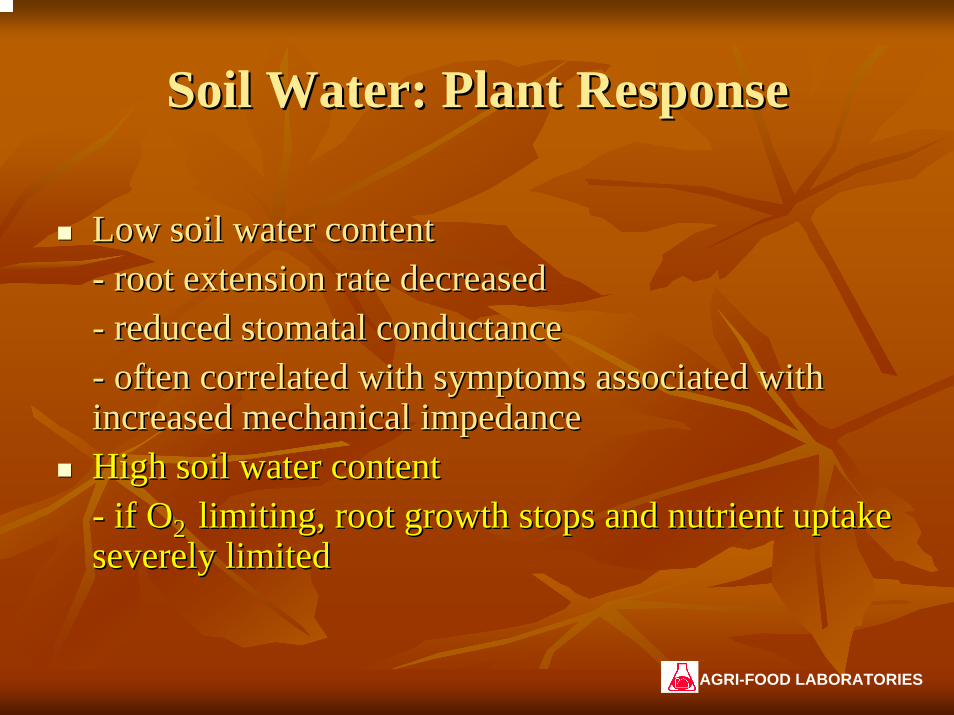
Soil Water: Plant ResponseSoil Water: Plant Response
Low soil water contentLow soil water content-- root extension rate decreasedroot extension rate decreased-- reduced stomatal conductance reduced stomatal conductance -- often correlated with symptoms associated with often correlated with symptoms associated with increased mechanical impedanceincreased mechanical impedanceHigh soil water contentHigh soil water content-- if Oif O2 2 limiting, root growth stops and nutrient uptake limiting, root growth stops and nutrient uptake severely limitedseverely limited
AGRI-FOOD LABORATORIES
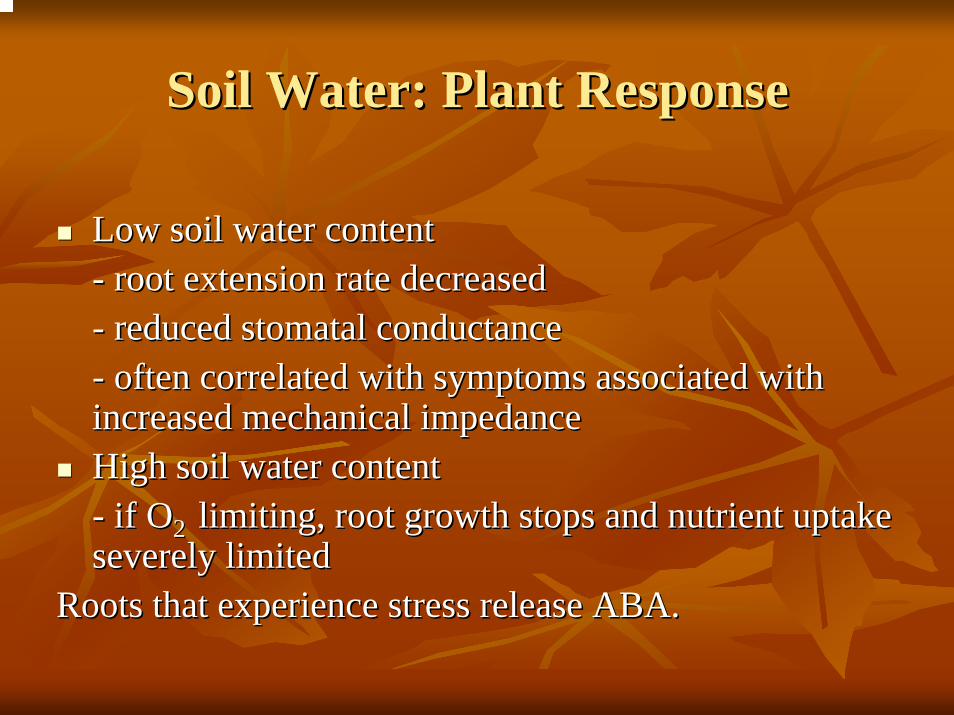
Soil Water: Plant ResponseSoil Water: Plant Response
Low soil water contentLow soil water content-- root extension rate decreasedroot extension rate decreased-- reduced stomatal conductance reduced stomatal conductance -- often correlated with symptoms associated with often correlated with symptoms associated with increased mechanical impedanceincreased mechanical impedanceHigh soil water contentHigh soil water content-- if Oif O2 2 limiting, root growth stops and nutrient uptake limiting, root growth stops and nutrient uptake severely limitedseverely limited
Roots that experience stress release ABA.Roots that experience stress release ABA.
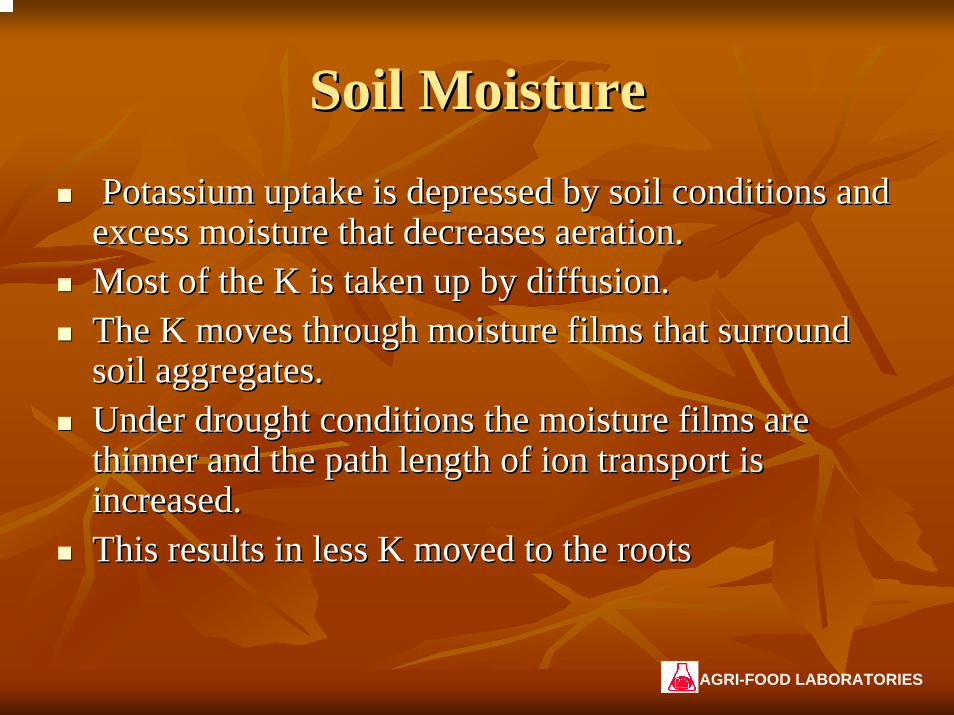
Soil MoistureSoil Moisture
Potassium uptake is depressed by soil conditions and Potassium uptake is depressed by soil conditions and excess moisture that decreases aeration.excess moisture that decreases aeration.Most of the K is taken up by diffusion.Most of the K is taken up by diffusion.The K moves through moisture films that surround The K moves through moisture films that surround soil aggregates.soil aggregates.Under drought conditions the moisture films are Under drought conditions the moisture films are thinner and the path length of ion transport is thinner and the path length of ion transport is increased.increased.This results in less K moved to the rootsThis results in less K moved to the roots
AGRI-FOOD LABORATORIES
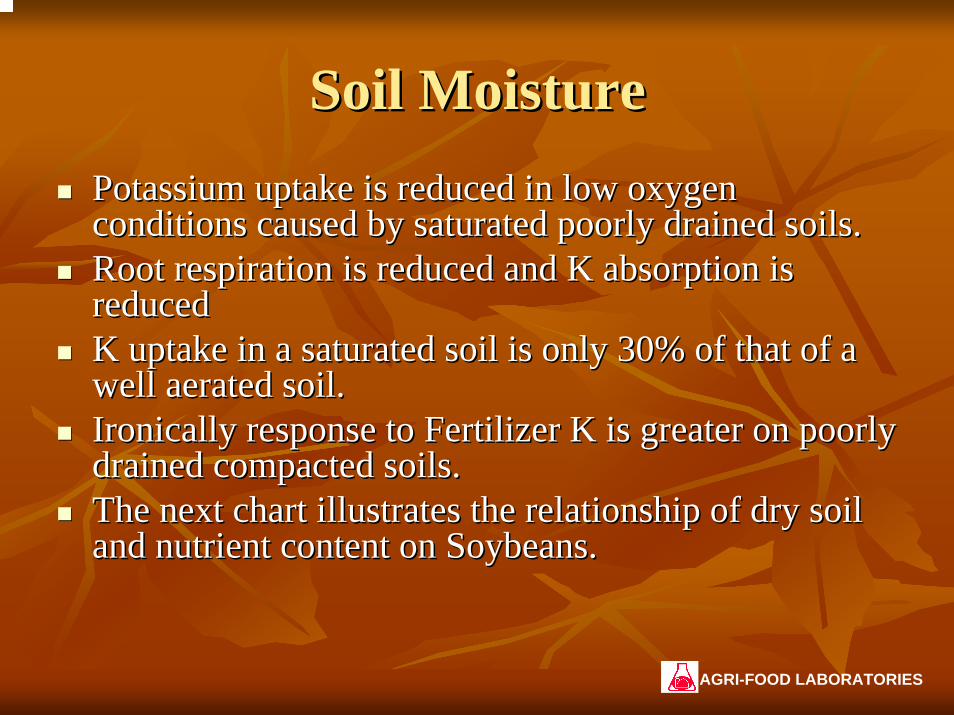
Soil MoistureSoil MoisturePotassium uptake is reduced in low oxygen Potassium uptake is reduced in low oxygen conditions caused by saturated poorly drained soils.conditions caused by saturated poorly drained soils.Root respiration is reduced and K absorption is Root respiration is reduced and K absorption is reducedreducedK uptake in a saturated soil is only 30% of that of a K uptake in a saturated soil is only 30% of that of a well aerated soil.well aerated soil.Ironically response to Fertilizer K is greater on poorly Ironically response to Fertilizer K is greater on poorly drained compacted soils. drained compacted soils. The next chart illustrates the relationship of dry soil The next chart illustrates the relationship of dry soil and nutrient content on Soybeans.and nutrient content on Soybeans.
AGRI-FOOD LABORATORIES
Fertilizer KFertilizer K22O O applied lbs / applied lbs / acreacre
Soil Test K ppmSoil Test K ppm Yields with Yields with moisturemoisture
Yield with Yield with droughtdrought
Tissue K % Tissue K % with moisturewith moisture
Tissue K % Tissue K % with drought with drought
00 5757 4545 2424 1.411.41 0.70.7
3333 6868 4747 33.733.7 1.81.8 1.031.03
6666 8787 48.248.2 38.538.5 2.232.23 1.231.23
133133 105105 46.646.6 38.538.5 2.42.4 1.431.43
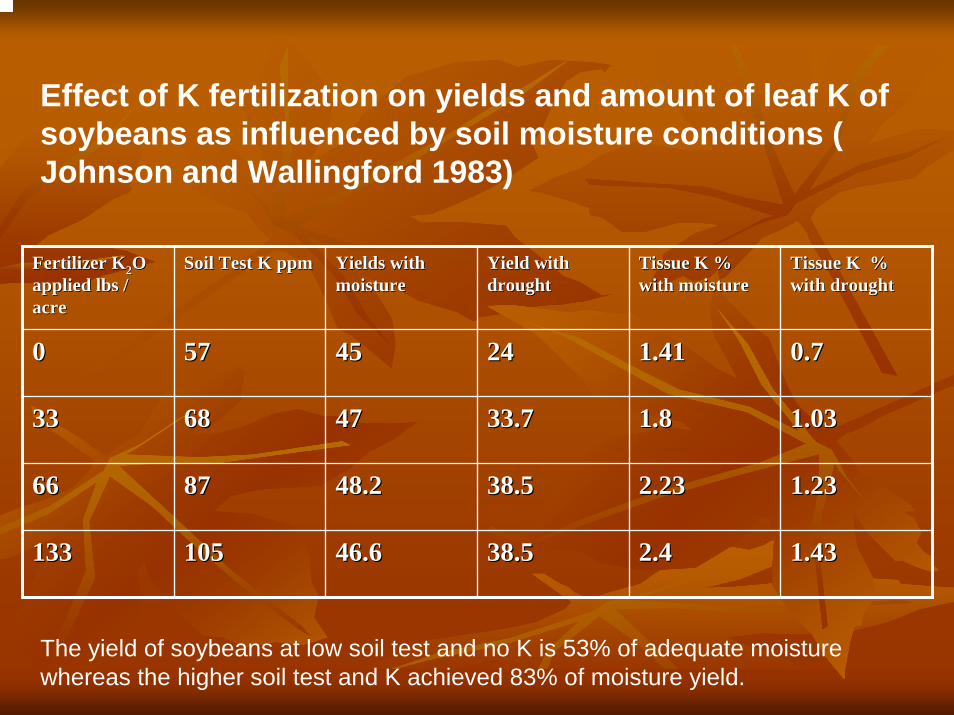
Effect of K fertilization on yields and amount of leaf K of soybeans as influenced by soil moisture conditions ( Johnson and Wallingford 1983)
The yield of soybeans at low soil test and no K is 53% of adequate moisture whereas the higher soil test and K achieved 83% of moisture yield.
Soil Temperature: TillageSoil Temperature: Tillage
Tillage alters Tillage alters -- thermal conductivity of soil by reducing bulk thermal conductivity of soil by reducing bulk density and particle to particle contactdensity and particle to particle contact
-- volumetric heat capacity of soil through effects on volumetric heat capacity of soil through effects on bulk density and soil water statusbulk density and soil water status
-- surface residue which affects reflectance of surface residue which affects reflectance of radiation, surface wind turbulence, and evaporationradiation, surface wind turbulence, and evaporation
AGRI-FOOD LABORATORIES

Soil Temperature: Plant Response Soil Temperature: Plant Response
Low soil temperatureLow soil temperature-- reduces belowreduces below--ground metabolic activityground metabolic activity-- reduces root extension ratesreduces root extension rates-- reduces root water and nutrient uptakereduces root water and nutrient uptake-- reduces root branchingreduces root branching
AGRI-FOOD LABORATORIES
Role of Nutrients in Plant HealthRole of Nutrients in Plant Health
Potassium exerts its greatest influence on plant Potassium exerts its greatest influence on plant disease through enzyme regulation and metabolic disease through enzyme regulation and metabolic functions that alter the host parasite compatibility.functions that alter the host parasite compatibility.In corn a potassium deficiency impairs N metabolism In corn a potassium deficiency impairs N metabolism by accumulating inorganic N in cell sap increasing by accumulating inorganic N in cell sap increasing the susceptibility to Stewarts Wilt.the susceptibility to Stewarts Wilt.It seems the bacteria prefer a N rich environment to It seems the bacteria prefer a N rich environment to enhance their establishment.enhance their establishment.
AGRI-FOOD LABORATORIES
Role of Nutrients in Plant HealthRole of Nutrients in Plant Health
In addition to Potassium, Chloride, Manganese and In addition to Potassium, Chloride, Manganese and Phosphorous have qualities that affect disease Phosphorous have qualities that affect disease establishment.establishment.In the case of Soybean Rust it is not if we get it, it is In the case of Soybean Rust it is not if we get it, it is whenwhenThe control of Rust centers on fungicides and genetic The control of Rust centers on fungicides and genetic development,development,However nutrient status of the plant will play a role in However nutrient status of the plant will play a role in susceptibility and severity of infection..susceptibility and severity of infection..
AGRI-FOOD LABORATORIES
Potassium DeficiencyPotassium DeficiencySymptoms of K deficiency that are particularly Symptoms of K deficiency that are particularly troublesome are.troublesome are.Thin cell wall, weakened stalks, smaller shorter roots, Thin cell wall, weakened stalks, smaller shorter roots, sugar accumulation in leaves, accumulation of unused sugar accumulation in leaves, accumulation of unused Inorganic N mainly Nitrate Inorganic N mainly Nitrate ––NNEach of these impairs the plants ability to resist Each of these impairs the plants ability to resist infection.infection.The present trend in potassium usage is declining as The present trend in potassium usage is declining as are soil test levels in traditional cash crop areas are soil test levels in traditional cash crop areas making the risk of infection more likely in fields that making the risk of infection more likely in fields that are suboptimal in K test level.are suboptimal in K test level.
AGRI-FOOD LABORATORIES
ChlorideChloride
Application of Cl is covered with the use of Application of Cl is covered with the use of muriate of potashmuriate of potashThe use of Cl has been credited with reducing The use of Cl has been credited with reducing take all, common root rot, tan spot, leaf and take all, common root rot, tan spot, leaf and stripe rust in wheat. stripe rust in wheat. Sudden death syndrome in soybeansSudden death syndrome in soybeansThe question is will it have an effect on other The question is will it have an effect on other diseases of soybeans?diseases of soybeans?
AGRI-FOOD LABORATORIES
ManganeseManganeseSeveral micronutrients are involved with development of Several micronutrients are involved with development of resistance in plants to root and foliar diseases.resistance in plants to root and foliar diseases.Micronutrients of Copper, Zinc, Boron are coMicronutrients of Copper, Zinc, Boron are co--factors in factors in numerous pathways that control hormones and cellular numerous pathways that control hormones and cellular development.development.Manganese is most prominent.Manganese is most prominent.Manganese is usually lower in tissues susceptible to fungal, Manganese is usually lower in tissues susceptible to fungal, viral and bacterial pathogens.viral and bacterial pathogens.It is often implicated in root rot, take all, rust, damping off It is often implicated in root rot, take all, rust, damping off and and wilts.wilts.Some concern has been expressed with Mn uptake or Some concern has been expressed with Mn uptake or metabolism of round up ready varieties.metabolism of round up ready varieties.But nothing conclusive can be found.But nothing conclusive can be found.
AGRI-FOOD LABORATORIES
PhosphorousPhosphorous
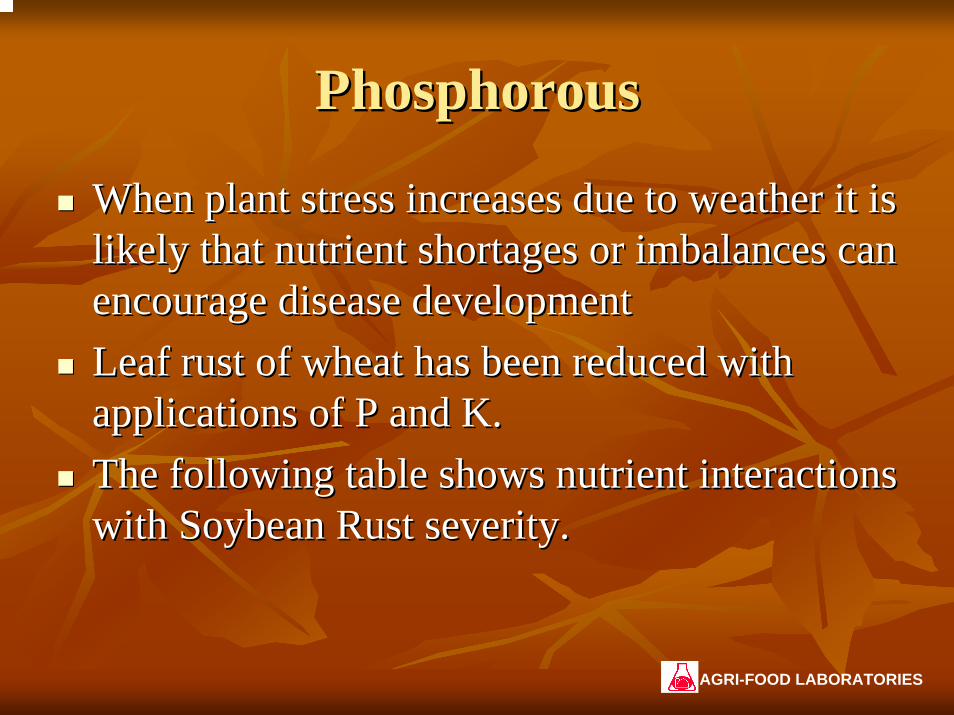
When plant stress increases due to weather it is When plant stress increases due to weather it is likely that nutrient shortages or imbalances can likely that nutrient shortages or imbalances can encourage disease developmentencourage disease developmentLeaf rust of wheat has been reduced with Leaf rust of wheat has been reduced with applications of P and K.applications of P and K.The following table shows nutrient interactions The following table shows nutrient interactions with Soybean Rust severity.with Soybean Rust severity.
AGRI-FOOD LABORATORIES
NN--PP--KKlb/ acrelb/ acre
Rust Rust ReactionReaction
IWGSR IWGSR scorescore
Grams / Grams / 100 seeds100 seeds
Yield Bus/ Yield Bus/ acreacre
00--00--00 SS 343343 9.129.12 15.515.5
2727--00--00 SS 343343 9.589.58 18.918.9
00--6060--00 MSMS 333333 9.469.46 18.618.6
00--00--3232 MSMS 333333 9.589.58 19.319.3
2727--6060--3232 MRMR 232232 10.4610.46 22.122.1
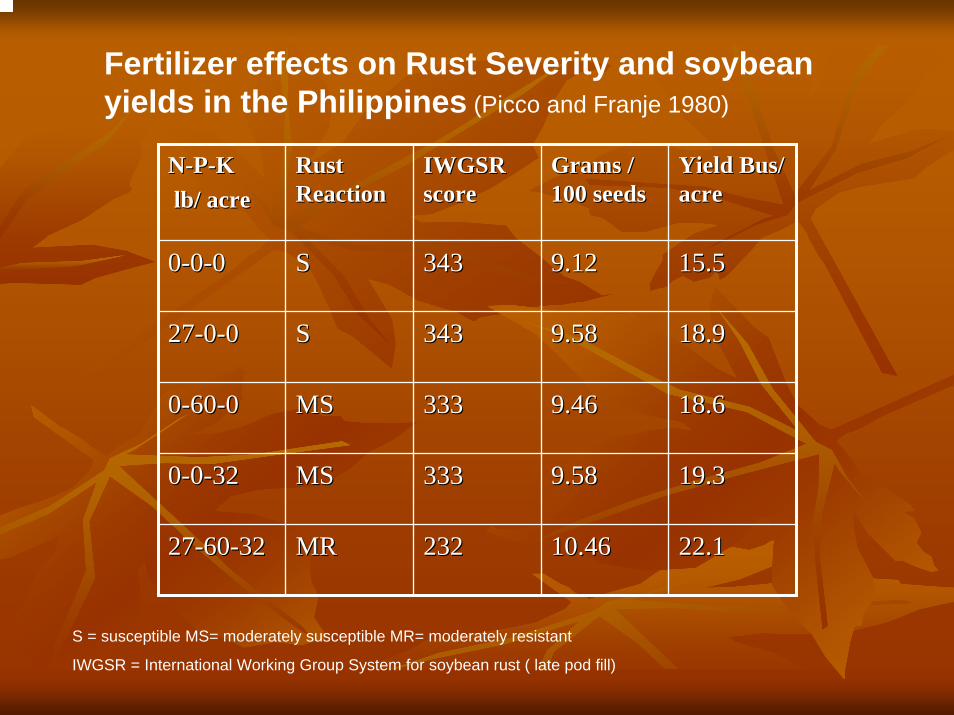
Fertilizer effects on Rust Severity and soybean yields in the Philippines (Picco and Franje 1980)
S = susceptible MS= moderately susceptible MR= moderately resistant
IWGSR = International Working Group System for soybean rust ( late pod fill)
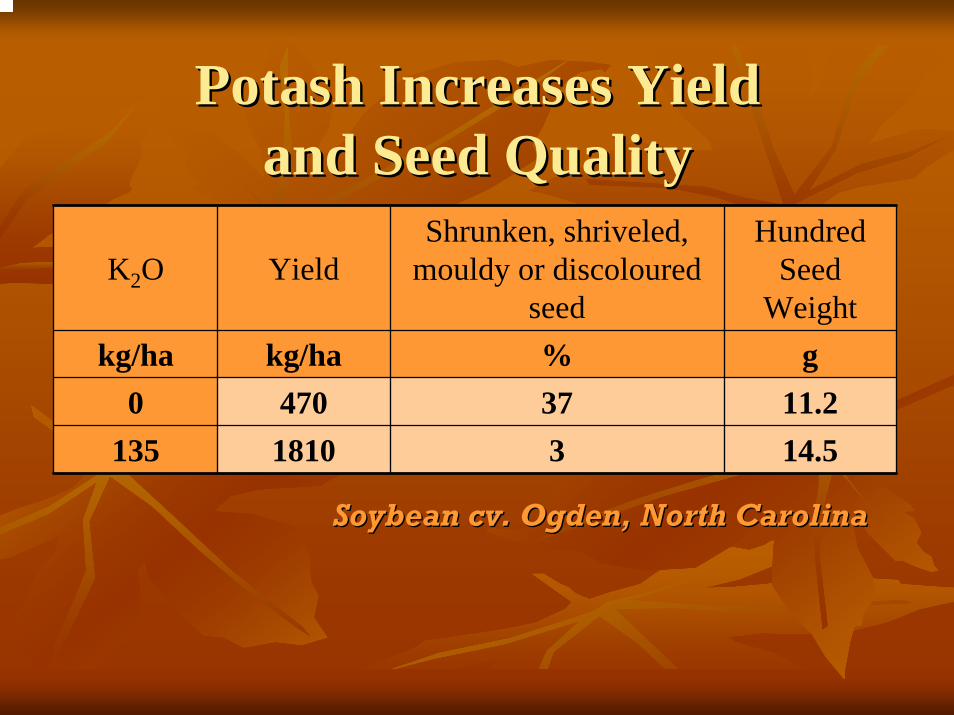
Potash Increases Yield Potash Increases Yield and Seed Qualityand Seed Quality
K2O YieldShrunken, shriveled,
mouldy or discoloured seed
Hundred Seed
Weightkg/ha kg/ha % g
0 470 37 11.2135 1810 3 14.5
Soybean cv. Ogden, North CarolinaSoybean cv. Ogden, North Carolina
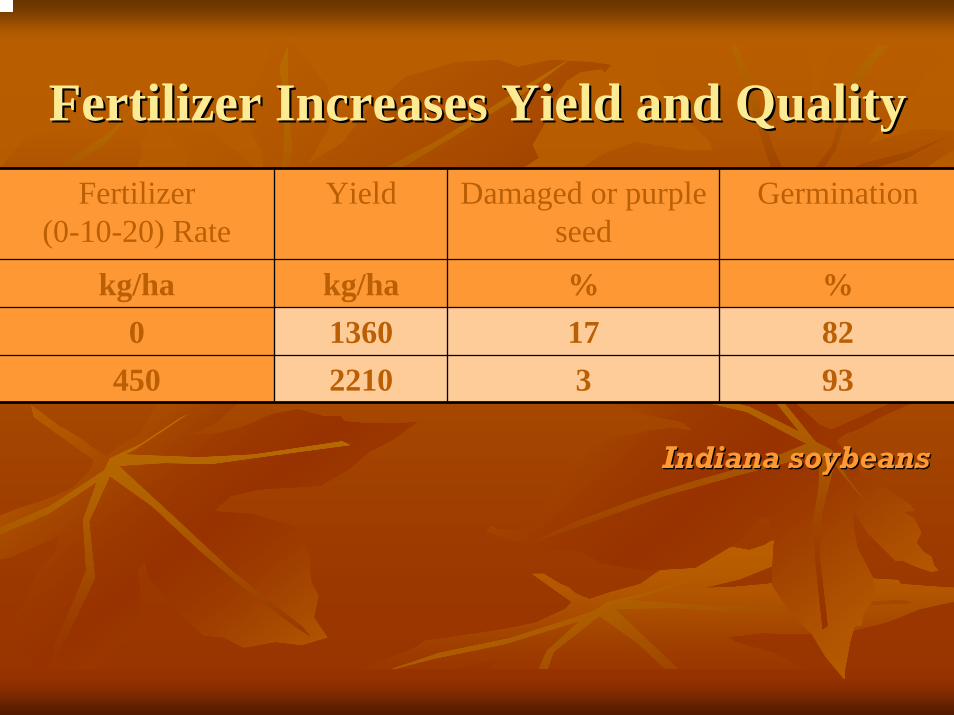
Fertilizer Increases Yield and QualityFertilizer Increases Yield and QualityFertilizer
(0-10-20) RateYield Damaged or purple
seedGermination
kg/ha kg/ha % %0 1360 17 82
450 2210 3 93
Indiana soybeans Indiana soybeans
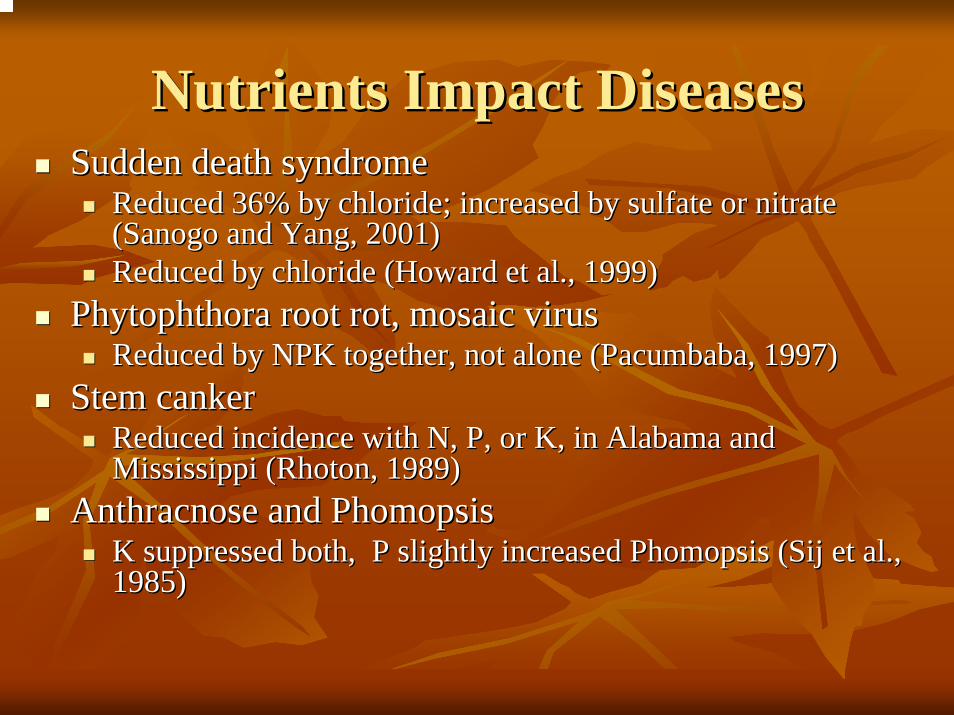
Nutrients Impact DiseasesNutrients Impact DiseasesSudden death syndromeSudden death syndrome
Reduced 36% by chloride; increased by sulfate or nitrate Reduced 36% by chloride; increased by sulfate or nitrate (Sanogo and Yang, 2001)(Sanogo and Yang, 2001)Reduced by chloride (Howard et al., 1999)Reduced by chloride (Howard et al., 1999)
Phytophthora root rot, mosaic virusPhytophthora root rot, mosaic virusReduced by NPK together, not alone (Pacumbaba, 1997)Reduced by NPK together, not alone (Pacumbaba, 1997)
Stem cankerStem cankerReduced incidence with N, P, or K, in Alabama and Reduced incidence with N, P, or K, in Alabama and Mississippi (Rhoton, 1989)Mississippi (Rhoton, 1989)
Anthracnose and PhomopsisAnthracnose and PhomopsisK suppressed both, P slightly increased Phomopsis (Sij et al., K suppressed both, P slightly increased Phomopsis (Sij et al., 1985)1985)

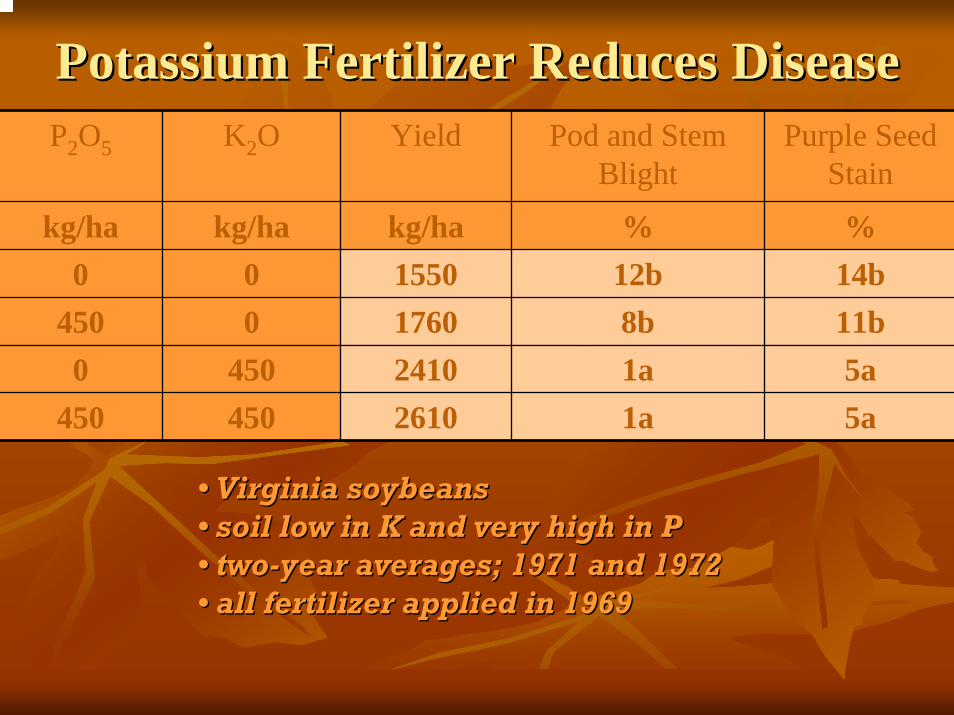
Potassium Fertilizer Reduces DiseasePotassium Fertilizer Reduces DiseaseP2O5 K2O Yield Pod and Stem
BlightPurple Seed
Stain
kg/ha kg/ha kg/ha % %0 0 1550 12b 14b
450 0 1760 8b 11b0 450 2410 1a 5a
450 450 2610 1a 5a
•• Virginia soybeansVirginia soybeans•• soil low in K and very high in P soil low in K and very high in P •• twotwo--year averages; 1971 and 1972 year averages; 1971 and 1972 •• all fertilizer applied in 1969all fertilizer applied in 1969
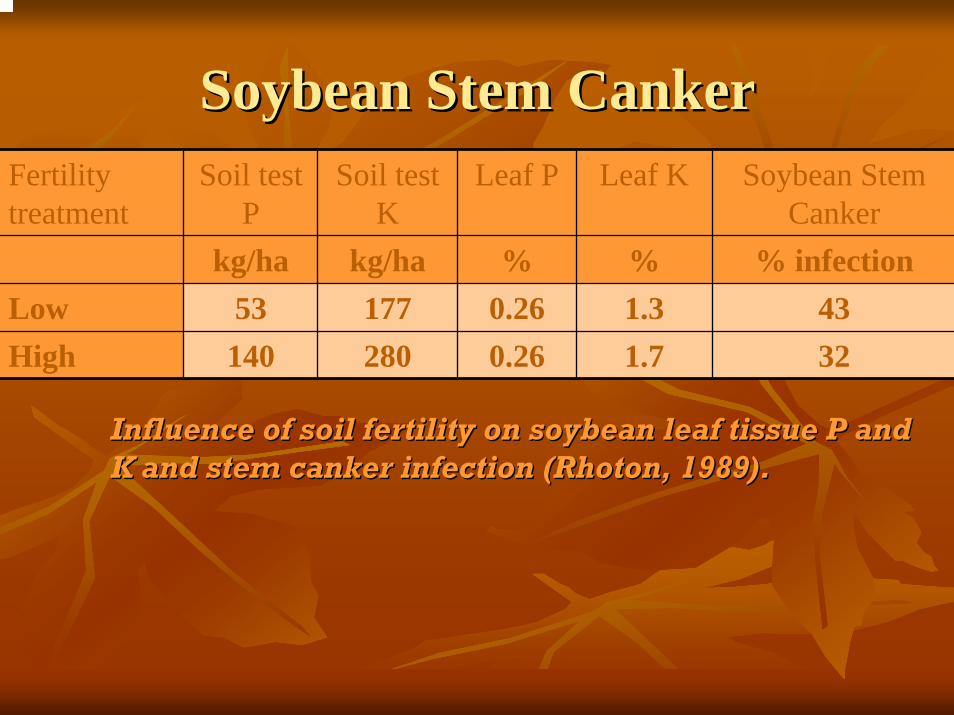
Soybean Stem CankerSoybean Stem Canker
Influence of soil fertility on soybean leaf tissue P and Influence of soil fertility on soybean leaf tissue P and K and stem canker infection (Rhoton, 1989).K and stem canker infection (Rhoton, 1989).
Fertility treatment
Soil test P
Soil test K
Leaf P Leaf K Soybean Stem Canker
kg/ha kg/ha % % % infectionLow 53 177 0.26 1.3 43High 140 280 0.26 1.7 32
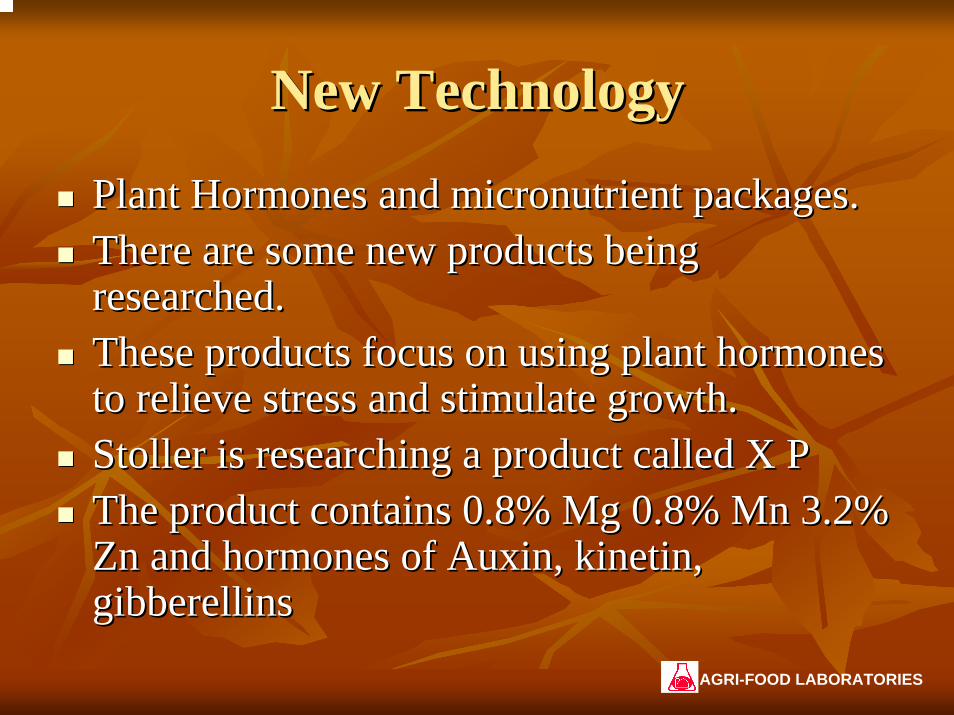
New TechnologyNew Technology
Plant Hormones and micronutrient packages.Plant Hormones and micronutrient packages.There are some new products being There are some new products being researched.researched.These products focus on using plant hormones These products focus on using plant hormones to relieve stress and stimulate growth.to relieve stress and stimulate growth.Stoller is researching a product called X PStoller is researching a product called X PThe product contains 0.8% Mg 0.8% Mn 3.2% The product contains 0.8% Mg 0.8% Mn 3.2% Zn and hormones of Auxin, kinetin, Zn and hormones of Auxin, kinetin, gibberellinsgibberellins
AGRI-FOOD LABORATORIES
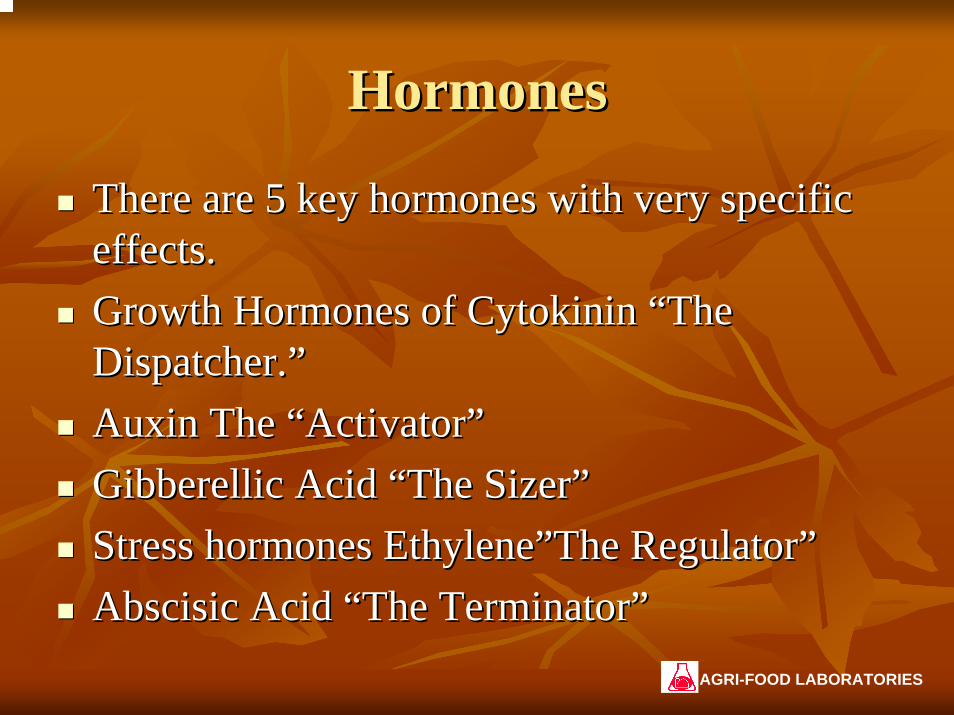
HormonesHormones
There are 5 key hormones with very specific There are 5 key hormones with very specific effects.effects.Growth Hormones of Growth Hormones of CytokininCytokinin “The “The Dispatcher.”Dispatcher.”AuxinAuxin The “Activator”The “Activator”GibberellicGibberellic Acid “The Acid “The SizerSizer””Stress hormones Stress hormones Ethylene”TheEthylene”The Regulator”Regulator”AbscisicAbscisic Acid “The Terminator”Acid “The Terminator”
AGRI-FOOD LABORATORIES
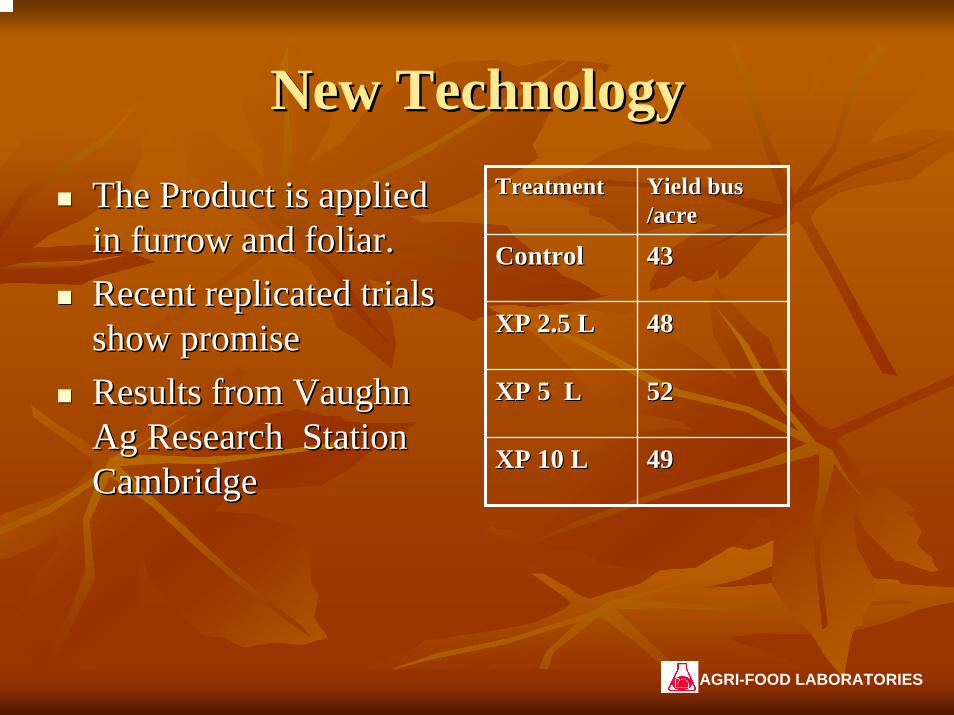
New TechnologyNew Technology
The Product is applied The Product is applied in furrow and foliar.in furrow and foliar.Recent replicated trials Recent replicated trials show promiseshow promiseResults from Vaughn Results from Vaughn Ag Research Station Ag Research Station CambridgeCambridge
TreatmentTreatment Yield bus Yield bus /acre/acre
ControlControl 4343
XP 2.5 LXP 2.5 L 4848
XP 5 LXP 5 L 5252
XP 10 LXP 10 L 4949
AGRI-FOOD LABORATORIES
SummarySummary
Soybean Fertilizer is often overlooked.Soybean Fertilizer is often overlooked.Soybeans remove more nutrients than corn especially Soybeans remove more nutrients than corn especially potassium.potassium.K Soil tests below optimum directly impact K content K Soil tests below optimum directly impact K content and yield.and yield.Fertilizing may not actually increase resistance as Fertilizing may not actually increase resistance as much as stimulating growth to minimize the severity much as stimulating growth to minimize the severity and incidence of diseases.and incidence of diseases.We need to reWe need to re--think Nutrient Management of think Nutrient Management of Soybeans as a “Risk Management Tool”Soybeans as a “Risk Management Tool”
AGRI-FOOD LABORATORIES