Embed Size (px)
Citation preview

Sovereign Credit Default Swap Premia∗Forthcoming, Journal of Investment Management
Patrick Augustin†
McGill University, Desautels Faculty of Management
12 January 2014
Abstract
This paper reviews the young but rapidly growing literature on sovereign credit default
swap premia. A discussion of current debates in the academic and popular press hopefully
raises thought-provoking questions with valuable insights for academics, policymakers and prac-
titioners alike. The main elements of the review relate to the determinants of sovereign CDS
spreads, spillovers and contagion, frictions, the relationship to and impact on public bonds,
as well as trading in the market for sovereign credit derivatives. In addition, I describe key
statistical and stylized facts about prices, the market and its players.
Keywords: Credit Default Swap Spreads, Default Risk, Descriptive Statistics, Literature Review,
Sovereign Debt, Term structure
JEL Classification: A31, F34, G01, G1, O57
∗This manuscript was written during my year as a visiting scholar at the New York University, Leonard N. SternSchool of Business in 2011/2012. It is the introductory chapter to my PhD Dissertation, which I wrote at theStockholm School of Economics. An earlier version of the project circulated as New York University, Stern Schoolof Business Working Paper EC-12-10. I would like to thank Philipp Schnabl, Marti G. Subrahmanyam and ReneKallestrup for valuable feedback and discussions. All remaining errors are my own. Financial support is gratefullyacknowledged from the Jan Wallander and Tom Hedelius Foundation and the Nasdaq OMX Nordic Foundation.†McGill University - Desautels Faculty of Management, 1001 Sherbrooke St. West, Montreal, Quebec H3A 1G5,
Canada. Email: [email protected].

1 Introduction
Whether for right or wrong, credit default swaps (henceforth CDS) have been bedeviled as weapons
of mass destruction, time bombs1 or financial hydrogen bombs.2 With the deepening of the Eu-
ropean sovereign debt crisis, the blame game has carried over to insurance products written on
government debt. Referencing speculation in the sovereign CDS market as a cause of rising gov-
ernment borrowing costs, the German financial regulator implemented an outright ban on naked
sovereign CDS positions in May 2010.3 The European Union followed suit in November 2012 by
restricting the use of sovereign credit insurance to investors seeking to hedge long positions only.
Despite critical voices raising their concerns about the use of sovereign CDS, proponents argue
that they are efficient vehicles to transfer and manage credit risk, with the ability to decrease adverse
selection and monitoring costs. In addition, they may allow for enhanced risk sharing, thereby
encouraging greater market participation. Policy makers, regulators and investors increasingly look
at sovereign CDS prices to gauge the health of our system.4 In addition, observed market prices
are imputed into risk management tools and used as risk factors or hedging vehicles for investment
management purposes. The Basel III framework explicitly recognizes sovereign CDS as an effective
hedge to reduce Credit Valuation Adjustment (CVA) risk capital charges. While there have been
several reviews of the corporate CDS market, a comprehensive overview of the sovereign analogue
does not exist.5 This manuscript attempts to fill this gap by providing market participants and end
users with an informed overview of the key controversies and debates surrounding sovereign CDS
in the academic literature and in the popular press.6 To this end, I stick to the factual definition
of what sovereign credit default swaps really are, namely insurance contracts offering protection
against the default of a referenced sovereign government.
More specifically, the goal of this paper is to describe the key characteristics of the market for
sovereign CDS. In addition, it emphasizes the academic debate surrounding the determinants of
1See Warren Buffett, Berkshire Hathaway Annual Report for 2002, p.13, on line athttp://www.berkshirehathaway.com/2002ar/2002ar.pdf
2Felix Rohatyn, a Wall Street banker employed at Lazard Freres, quoted in Tett (2009).3A naked position refers to an investment position that is unhedged.4Hart and Zingales (Fall 2011), for example, suggest the use of financial CDS to evaluate the health of banks.5See for example Das and Hanouna (2006) for a review of corporate CDS and Stulz (2010) for a review of corporate
CDS in relation to the financial crisis.6This review emphasizes the literature on sovereign CDS spreads. I apologize to any authors on sovereign bond
spreads who feel that their work is relevant and should have been included in this review.
1

spreads, the relationship with and implications for the bond market, and it lays out some basic
trading patterns. Understanding the market’s properties is especially relevant if these products
are regularly used in practice. For example, if risk factors underlying the variation in spreads
are time-varying, hedges meant to reduce capital requirements, or risk models, could break down
during crisis periods precisely then when they are the most needed. On the other hand, a partially
informed view about the implications of sovereign CDS trading may result in regulation which
could ultimately be detrimental to financial markets as a whole.
I hope that this literature review provides a useful starting point for anyone interested in this
asset class with an underlying public debt market of approximately 48 trillion USD7, and that the
exposition raises some thought-provoking questions for academics, policy makers and practitioners
alike.8 Before diving into the specifics, however, I would like to highlight some puzzling observations
and questions as a teaser. Despite the huge press coverage of credit derivatives, they represent only
a tiny fraction (4.68%) of the overall “over-the-counter” derivatives market.9 Moreover, among
all traded credit default swaps, sovereign contracts make up roughly 11%. Although the overall
size of the CDS market is valued at 27 trillion USD, the net economic exposure is only 1.2 trillion
USD.10 Furthermore, why is it that contracts on emerging market economies tend to trade in high
numbers and small volumes, while developed economies tend to trade with a larger net economic
exposure per contract and have fewer contracts outstanding? Why are hedge funds so often blamed
for speculation in the sovereign CDS market, when in fact they represent only a small fraction of
all counterparties? Why is there such a surge in CDS trading on the US government in 2011?
What determines the shape of the sovereign yield curve when government term structures exhibit
similar patterns as those of corporations, but country-specific factors play relatively weaker roles in
explaining variation in CDS spread levels? And finally, why is it so important to avoid a trigger on
Greek CDS when the net reported economic exposure is below 4 billion at the end of 2011? These
facts and more are highlighted along the road.
7This estimate of global public debt is based on the 2012 numbers from the Economist global debt clock. Source:www.economist.com.
8A review of the institutional and legal background of CDS is omitted because of space limitations, but canbe found in section 2 of the working paper version New York University, Stern School of Business Working PaperEC-12-10. For pricing aspects of CDS, I refer the reader to Duffie (1999), Hull and White (2000a) and Lando (2004).
9These numbers are for June 2012. Source: www.bis.org.10The net economic exposure can be understood as an upper bound on insurance payments upon default. Actual
payments are expected to be lower, because recovery values of defaulted bonds are generally non-zero.
2

The remainder of this document structures as follows. Section 2 describes the evolution and
growth of the sovereign CDS market followed by a description of the key characteristics in section
3. In section 4, I review the literature on the determinants of sovereign CDS. Section 5 reviews
the emerging literature on spillovers and contagion. Section 6 follows up with a discussion on
the relationship between sovereign CDS and public bonds and reviews the evidence about frictions.
Finally, section 7 gives an overview of the trading in sovereign CDS markets based on data from the
global data repository DTCC, and provides some indication on how this relates to country-specific
fundamentals. I conclude in section 8.
2 The Market for Sovereign Credit Default Swaps
Engineered in the early nineties by JP Morgan to meet the growing demand to slice and dice credit
risk, CDS featured nearly three-digit growth rates year by year over the last decade.11 I review first
the market size and structure of the sovereign CDS market. Then I discuss the market participants.
2.1 Market Size and Structure
CDS exploded from roughly 6 trillion USD of gross notional amount outstanding in 2004 to a peak
of 58 trillion USD in the second term of 2007.12 Panel A of Table 1 illustrates that these figures
have since come down to 27 trillion USD in June 2012, which is mostly linked due to a netting
of outstanding positions as regulators’ increasing concerns about counterparty risk and calls for
higher transparency have led to portfolio compressions. But it is also partly due to the fact that
credit derivatives were central to the 2007-2009 financial crisis.13 While contracts written on a
single underlying reference made up for the bulk of the trading volume in 2004 with a market
11The exact year of creation is not clear. Tett (2009) refers to the first CDS in 1994, when J.P. Morgan off-loadedits credit risk exposure on Exxon by paying a fee to the European Bank for Reconstruction and Development. Moreimportantly for this review, the author also references a deal between J.P. Morgan and Citibank asset managementon the credit risk of Belgian, Italian and Swedish government bonds around the same time (p.48).
12These statistics are based on the bi-annual reports on the notional amounts outstanding and gross market valuesof OTC derivatives published by the Bank for International Settlements. Statistics for CDS are available since 2004.The notional amounts are likely to slightly underestimate the total value of the market, as until the end of 2011,only 11 countries are reporting their OTC derivative statistics to the BIS. Belgium, Canada, France, Germany, Italy,Japan, the Netherlands, Sweden, Switzerland, the United Kingdom and the United States. From December 2011,Australia and Spain are expected to contribute to the semiannual survey, bringing to 13 the number of reportingcountries. Source: www.bis.org.
13Portfolio compression refers to the process by which two counterparties maintain the same risk profile, but reducethe number of contracts and gross notional value held by participants.
3

share of 80%, multi-name instruments have increased more rapidly due to the practice of synthetic
securitization and represented roughly 42% of the market in 2012. While these numbers sound
impressive, CDS still account for only 4.21% of the total amount of notional outstanding in all
OTC derivatives, which has grown to 638.93 trillion USD. The largest fraction comes from interest
rate derivatives, which is estimated to have a size 494.02 trillion USD, or equivalently 77.32% of
the market.
Notional amounts outstanding provide a measure of market size and a reference from which
contractual payments are determined in derivatives markets. Gross market values, on the other
hand, reflect the sum of all market values in a current gain or loss position. This provides a more
accurate measure of the scale of financial risk transfer taking place in derivatives markets.14 Gross
market values are with 1.19 trillion USD during the first half of 2012 significantly lower than the
gross notional amounts. In addition gross credit exposures, which account for netting agreements
between counterparties, make these numbers shrink even further to a value of 310 billion USD.
This number still reflects a sizable market, but it is much less breathtaking than the total notional
amount outstanding of 27 trillion USD.
Panel B in Table 1 illustrates that sovereign credit derivatives, with 2.99 trillion USD in 2012,
make up approximately 11% of the overall market for OTC credit derivatives. In contrast to
corporate CDS, they are on the other hand largely concentrated around single-name products,
which reflect a trading volume of 2.85 trillion USD, or respectively a fraction of 95%. More detailed
statistics for gross credit exposures of sovereign CDS are not publicly available on the BIS website.
But we can get a noisy estimate if we make the simplifying assumption that the fraction of gross
credit exposure to total notional amount traded is the same for sovereign reference entities and
the overall market. Under this assumption, the gross market value of all outstanding contracts
is approximately 132 billion USD, while the total net exposure reduces to roughly 34.4 billion
USD. Although these are still economically meaningful numbers, regulators ought to keep such
rough magnitudes in mind when they justify interference in the market, as they did to prevent a
default payout trigger for Greece in 2012. During Greece’s default episode, net notional amounts
outstanding for contract written on the Hellenic Republic were in the order of magnitude of 3 billion
14BIS defines gross market value as the sums of the absolute values of all open contracts with either positive ornegative replacement values evaluated at market prices prevailing on the reporting date.
4

USD.15
While CDS investors have access to a wide range of contract maturities, liquidity for corporate
CDS is mostly concentrated around five-year contracts, as is illustrated in Panel C of Table 1.16
The total volume of notional amount outstanding with maturities above one and up to five years,
was 18.25 trillion USD in 2012, representing a market share of 67.76%. This fraction has fluctuated
closely around this level since the BIS started the reporting on CDS. The remaining contracts
are somewhat balanced among maturities below one year, with a total volume 5.61 trillion USD
(20.85%), or above five years, with a total volume of 3.07 trillion USD (11.39%). It seems however
that over the last 2 years, short maturities have gradually been trading more relative to long
maturities. For sovereign reference entities, trading is less concentrated in the 5-year contract. Pan
and Singleton (2008) and Packer and Suthiphongchai (2003) reproduced earlier BIS statistics from
2003, documenting that the 3- and 10-year contracts each accounted for roughly 20% of the volumes
in sovereign markets, and the 1-year contract accounted for an additional 10% of the trading.
2.2 Market Participants
Speculative one-sided bets by hedge funds in the market for sovereign credit derivatives have also
been blamed for a rise in public borrowing costs throughout the European debt crisis. A snapshot
of the counterparties involved in sovereign CDS trading in Panel D of Table 1 reveals that it
is to a large extent the reporting dealers who operate in this market. Their reported trading
volume is approximately 2.03 trillion USD, reflecting a market share of 71.13%, followed second
by Banks and Security Firms with a market share of 13.27% or an underlying notional amount
outstanding of 378 billion USD. Hedge funds are only third in line, with a total volume of 154
billion USD. While this is no evidence, it suggests at least that sovereign CDS are used primarily
for hedging purposes, rather than for speculative bets.17 We should however be cautious with such
fast conclusions, as their trading volume has almost doubled from 2010 to 2012, which may reflect
arbitrage opportunities linked to the European sovereign debt crisis, whereas banks and security
15Source: www.dtcc.com.16CDS have the attractive feature that they are constant maturity products. Thus, every day, a market participant
can buy an insurance contract with an identical remaining maturity. This contrasts with cash bonds, which havedecreasing maturities over time.
17Bongaerts et al. (2011) also cite evidence that banks are primarily net buyers of (corporate) CDS, while insurancecompanies and funds are mainly net sellers.
5

firms have reduced their exposure from 828 billion USD to 378 billion USD over the same period.
Panel E further illustrates that the CDS market is mostly a transnational market. 80.10% of all
trades are with a counterparty based in a foreign country, in contrast to only 19.90% of all contracts
that are handled with a counterparty of the home country. The international nature of the trading
raises questions about the usefulness of unilateral policy decisions affecting the market, such as the
ban of naked CDS by Germany in May 2010, and by the European Union in November 2012.
3 Statistical Facts about Sovereign CDS
This section provides some stylized statistical facts about the probability distributions of sovereign
CDS, based on a data set used in Augustin and Tedongap (2012). The sample consists of daily mid
composite USD denominated CDS quotes for 38 sovereign countries taken from Markit over the
sample period 9 May 2003 until 19 August 2010. All contracts contain the full restructuring clause.
Spreads come from the entire term structure, including 1, 2, 3, 5, 7 and 10-year contracts, and span
5 geographical regions, including the Americas, Europe, Africa, the Middle East and Asia.
A first set of summary statistics is provided in Table 2. Countries are grouped by their average
credit rating on external debt over the sample period. The term structure is always upward sloping
on average, going from 15 basis points at the 1-year horizon to 26 basis points at the ten-year
maturity for AAA rated entities, and from 433 to 599 basis points for the B rated countries. A
mean upward sloping term structure was also shown for a set of three emerging countries in Pan
and Singleton (2008). Augustin (2012), however, reports negative sample averages of the slope for
a series of countries if the sample period includes the European sovereign debt crisis.18 As countries
become less creditworthy, the volatility of their CDS spreads jumps up. For example, the average
standard deviation of the 5-year CDS spread is 34 basis points for the most creditworthy country,
and 328 basis points for the least creditworthy. Moreover, the level of CDS spreads exhibit positive
skewness, with a value usually around 2, and they have very fat tails. But the excess kurtosis
generally decreases with the asset horizon. Finally, CDS spreads are also very persistent. Among
all statistics, the lowest and highest first-order autocorrelation coefficients are 0.9901 and 0.9979
18More specifically, four countries have a negative slope on average, using a monthly data frequency, over the periodJanuary 2001 to February 2012. Greece exhibits the most negative slope with an average of -382 basis points.
6
respectively for daily observations.19
A common theme of interest is the behavior of the term structure of spreads. A structural
credit model of Merton (1974) predicts that the credit curve is increasing for high-quality credit
levels, hump-shaped for intermediate credit quality and decreasing for low levels of creditworthiness.
Lando and Mortensen (2005) have confirmed these predictions for corporate CDS. For their analysis,
they rank their observations based on the average five-year spread level. I attempt to do the same
exercise for the sovereign CDS sample. Hence for each country on each day, I look at the 5-year
CDS spread and group the observations into ranges of 100 basis points and then report within
each category, the average spread, as well as the difference between the 10-year and the 1-year
spread, the 10-year and the 3-year spread and the 3-year and the 1-year spread. The average values
are calculated across time and entities. The results, which are shown in Table 3, yield similar
conclusions as for corporate CDS. The overall slope, defined as the difference between the 10-year
and 1-year spread, first increases as the credit quality weakens, and then decreases before becoming
negative at very high spread observations. Yet, if we look separately at the gap between the 1 to
3-year, as well as the 3 to 10-year spread, it is evident that the former turns negative only much
later, confirming the humped shape curve for intermediate groups.
Another way to look at this is by computing the average slope levels in the same three segments,
as well as the fraction of negative values for sliding groups of 400 curves. This yields the outcome
plotted in Figure 1, from which we can draw the same conclusion. At first glance, such results make
us feel comfortable that statistical models of credit curves can be applied equally well to corporate
and sovereign reference contracts. From an empirical perspective, however, it raises the question
about the determinants of the shape of the sovereign credit curve, as country-specific factors seem
to have relatively weaker explanatory power for the time-series variation of sovereign CDS, at least
at higher sampling frequencies. This contrasts with the predictions of a Merton (Merton 1974)
type world. This issue is further discussed in the following section.
19At lower data frequencies, sovereign CDS spreads are less persistent. See Longstaff et al. (2011) and Augustin(2012) for statistics with a monthly data frequency.
7

4 Determinants of Sovereign CDS spreads
Intuitively, one would expect the fluctuations in sovereign spreads to be driven by country-specific
fundamentals.20 Yet, abundant evidence shows that a major fraction of the variation in sovereign
CDS spreads is determined by global variables unrelated to a country’s economy, in particular
at higher trading frequencies. Moreover, most studies reference some sort of risk originating in
the United States. However, the European sovereign debt crisis has brought the role of domestic
factors back to the forefront, with a spotlight on the sovereign-bank nexus. Surveying the literature
highlights the fact that the role of domestic risk factors tends to be more important in times of
distress and for countries undergoing financial turmoil, while global risk factors tend to be favored
in studies excluding distressed countries and typically outside crisis periods. Future research is
encouraged to focus on the time-varying properties of both sources of risk.
Understanding the risk factors underlying the variation in spreads is important from several
perspectives. If the truth is that global factors are largely responsible for the time-series dynamics,
then any sort of government intervention to bring down spreads may prove ineffective. On the other
hand, if the drivers of risk are state-dependent, then such properties need to be taken into account
to develop useful risk monitoring tools and to build hedges, which don’t break down specifically in
times when they are most needed. Here, I review the main academic results.
4.1 Global Risk Factors
The importance of global risk factors in explaining sovereign CDS spreads is usually motivated by
the fact that sovereign spreads tend to co-move significantly over time, as can be seen in Graph
2a for a sample of 38 countries. In addition, averaging the level of spreads over all countries in
Figure 2b illustrates that spreads jump sharply every time there is a run-up in risk aversion due to
a global risk-related event, such as changes in U.S. monetary policy following falling growth rates,
which have led traders to unwind their carry trades, major corporate bankruptcies of the usual
suspects Bear Stearns and Lehman Brothers, or when the European governments underwent major
political bailouts. This casual observation suggests that global risk factors bear some responsibility
20In fact, the classical Merton model predicts that variation in credit spreads is primarily determined by assetvolatility, financial leverage and the risk-free term structure. See Ericsson et al. (2009) for a discussion on thedeterminants of corporate CDS in relation to the Merton model.
8

for the variation in spreads. In addition, support to the influence of global risk is also provided by
the strong factor structure in spreads, as the first principal component is able to explain a very
large fraction of the spread variation, much higher than is the case for equities. The precise figure
depends on the sample frequency and countries studied, but can be as high as 96% at the daily
level or 64% at a monthly decision interval as shown by Pan and Singleton (2008) and Longstaff
et al. (2011) respectively.21
Among those studies leaning more towards an explanation of global factors is for example
Longstaff et al. (2011). The authors study monthly 5-year CDS of 26 countries over the time
period October 2000 to January 2010 and consider variables related to the local economy, global
financial variables, global risk premia, global investment flow measures as well as regional and
global sovereign credit risk. They conclude that sovereign CDS can be explained to a large extent
by U.S. equity, volatility, and bond market risk premia. Interestingly, they argue that global risk is
not only a better predictor of risk premia, but also of the part of spreads compensating investors for
expected losses. A tight link between sovereign CDS spreads and global risk is also reported by Pan
and Singleton (2008), who study the term-structure of daily CDS spreads of Korea, Mexico and
Turkey from March 2001 to August 2006. Their main interest lies in using the information in the
term structure to disentangle the parameters of the risk neutral default and recovery processes.22
With this goal in mind, they develop a theoretical pricing model to decompose spreads into the
part related to expected losses and a risk premium. Risk premia appear to co-move strongly over
time and are strongly related to the CBOE VIX option volatility index, the spread between the
10-year return on US BB-rated industrial corporate bonds and the 6-month US Treasury bill rate,
and the volatility in the own-currency options market. These findings corroborate the intuition of
time-varying risk premia in the sovereign CDS market.
Ang and Longstaff (2013) conduct a comparative analysis of CDS spreads written on sovereign
21Pan and Singleton (2008) study 3 countries. Augustin and Tedongap (2012) report that the first principalcomponent explains 78% of the daily variation for a set of 38 countries. Augustin (2012) shows that the first principalcomponent explains on average 57% of the variation in monthly spreads of 44 countries and links the magnitude ofthe factor loadings to the shape of the sovereign term structure.
22The authors show that if the recovery rate is defined as a function of face value, the term structure can be used toidentify separately the parameters governing the default and loss processes. Their results suggest that the commonpractice of setting a constant recovery rate of 25% for sovereign reference entities works well for medium sample sizes.The importance of accounting for stochastic recovery rates in the pricing of CDS spreads, especially for sovereignreference entities, is emphasized in Bilal and Singh (2012).
9

states in the United States and European countries. Rather than extracting the risk premium,
they extract the dependence of spreads on a common component and define this part as systemic
risk. The authors find evidence that this systemic risk component is influenced by global financial
factors and dismiss links with macroeconomic fundamentals. Related to the paper by Pan and
Singleton (2008) is the work of Zhang (2008), who develops a CDS pricing model and applies it
to Argentina to infer differences in expectations about expected recovery rates upon default and
expected default probabilities. The author documents that the wedge between risk-adjusted and
historical default probabilities is associated with changes in the business cycle, both the U.S. and
Argentine credit conditions as well as the overall local economy.
Augustin and Tedongap (2012) provide empirical evidence that the first two common compo-
nents among a set of 38 countries spanning a wide geographical region are strongly associated with
expected consumption growth and macroeconomic uncertainty in the United States. The authors
study daily quotes over the time period April 2003 to August 2010 and document that this link is
robust against the influence of global financial market variables such as the CBOE volatility index,
the variance risk premium, the U.S. excess equity return, the price-earnings ratio as well as the
high-yield and investment-grade bond spreads. In addition, they rationalize this new finding in a
structural asset pricing model with recursive preferences and a long-run risk economy where the
default rate process is driven by the global long-run expectations of future consumption growth and
macroeconomic uncertainty. Overall, the results confirm the existence of time-varying risk premia
in sovereign spreads as a compensation for exposure to common U.S. business cycle risk.
Further evidence of influence from the United States on sovereign CDS premia is provided by
Dooley and Hutchison (2009). They document how the subprime crisis channeled through to a
sample of 14 geographically dispersed countries, based on a series of both positive and negative real
and financial news over the sample period January 2007 to February 2009. While they document
that a range of news had statistically and economically significant effects, they find that in particular
the Lehman event and the expansion of Federal Reserve swap lines with the central banks of
industrial and emerging countries uniformly moved all country spreads (in the sample).23 Wang
23On 13 October 2008, the Fed removed its USD swap limits to industrial countries, and on 29 October 2008, theFOMC established swap lines with the central banks of Brazil, Mexico, Korea and Singapore for up to $30 billioneach.
10

and Moore (2012) study the dynamic correlations between the sovereign CDS spreads of 38 emerging
and developed economies with the U.S. from January 2007 to December 2009. Results indicate that
in particular developed economies have become much more integrated with the United States since
the Lehman shock. This tighter link with the U.S. seems to be driven mainly by the U.S. interest
rate channel.
Finally, Benzoni et al. (2012) suggest that the co-movement in sovereign spreads arises because
agents update their beliefs about the state of the underlying economy, which is a hidden factor. To
mitigate uncertainty about the distribution of the underlying state, posterior probabilities of bad
states are over weighted. Thus in case of a negative shock, the probability of being in a bad state
is revised, which negatively affects the default probability of all other countries. Thus, updating of
beliefs will generate correlations in credit spreads that are significantly higher than if spreads were
functions of the macroeconomic conditions only. This mechanism is explained in the fragile beliefs
framework of Hansen and Sargent (2010).24 In addition to the hidden factor, which the authors
define as contagion risk, spreads are modeled to depend also on global financial uncertainty (VIX
and the U.S. high-yield bond spread defined as the difference between the BB and BBB Bank
of America Merrill Lynch corporate bond effective yields) and a country-specific macroeconomic
conditions index.25
4.2 Global and Local Risk Factors
A good transition between the “pro-global” and “pro-local” camps is provided by Remolona et al.
(2008). Based on the intuition that financial asset prices are driven by both country-specific funda-
mentals and investor’s appetite for risk, Remolona et al. (2008) decompose monthly 5-year emerging
markets sovereign CDS spreads over the period January 2002 to May 2006 into a market-based mea-
sure of expected loss and a risk premium. They analyze how each of these two elements is linked to
measures of country-specific risk and measure of global risk aversion/risk appetite. Fundamental
variables include inflation, industrial production, GDP growth consensus forecasts, and foreign ex-
24The model is estimated based on daily 5-year sovereign CDS spreads of 11 Euro zone countries over the sampleperiod 12 February 2004 to 30 September 2010.
25The macroeconomic conditions index summarizes country-specific macroeconomic information derived from apolitical stability indicator, real GDP growth and GDP per capita, unemployment rate, exports to GDP, inflation,the ratio of government surplus to GDP and debt to GDP, and the ratio of the M3 money measure over GDP andforeign exchange reserves over GDP as proxies for country-specific liquidity.
11

change reserves. Proxies for global risk aversion are taken as the Tsatsaronis, Karamptatos (2003)
effective risk appetite indicator, the VIX and a Risk Tolerance Index by JP Morgan Chase. They
find empirical evidence that global risk aversion is the dominant determinant of sovereign risk pre-
mium, while country-specific fundamentals and market liquidity matter more for sovereign risk.
Both components thus behave differently.
Carlos Caceres and Segoviano (2010) analyze how much of the rising spreads can be explained
by shifts in global risk aversion, country-specific risks, directly from worsening fundamentals, or
indirectly from spillovers originating in other sovereigns. The authors argue that the widening of
spreads during the early period of the crisis was essentially driven by changes in a self-computed
measure of risk aversion, but later in the crisis, country-specific factors identified by each country’s
stock of public debt and budget deficit as a share of GDP played the dominant role. In a similar
spirit, Arghyrou and Kontonikas (2012) find evidence in favor of a regime-shift in sovereign debt
pricing towards country-specific macro-fundamentals during the crisis. Prior to the crisis, differ-
ential macro-fundamentals are not able to explain cross-sectional differences in spreads. Finally,
Aizenman et al. (2013) study the relationship between 5-year sovereign CDS spreads and fiscal
space using the deficit-to-tax and public debt-to-tax ratios for 60 countries over the period 2005 to
2010, but they focus their analysis on the GIIPS countries. They confirm the importance of fiscal
space in explaining sovereign spreads. Quantitatively, their results indicate that a 1 percentage
point rise in the debt-to-tax ratio increases 5-year spreads by between 15 and 81 basis points, while
a 1 percentage point rise in the fiscal balance to tax ratio predicts a decrease in spreads by 194 to
829 basis points.
Carr and Wu (2007) present a joint valuation framework for sovereign CDS and currency options
written on the same economy and execute an empirical test for Mexico and Brazil over the time
period January 2, 2002 to March 2, 2005. They document that CDS spreads show strong positive
contemporaneous correlations with both the currency option implied volatility and the slope of the
implied volatility curve in moneyness.26 This analysis confirms their conjecture that economic or
political instability often leads to both worsened sovereign credit quality and aggravated currency
return volatility in a sovereign country. Interestingly, their results suggest that there are additional
26More specifically, the authors refer to the delta-neutral straddle implied volatilities and the risk reversals.
12

systematic movements in the credit spreads that the estimated model fails to capture. Hui and
Fong (2011) reverses the analysis and documents information flow from the sovereign CDS market
to the dollar-yen currency option market during the sovereign debt crisis from September 2009 to
August 2011. In a similar spirit, Pu (2012) exploits pricing differences between USD and EUR
denominated sovereign CDS spreads to show that the dual-currency spread significantly affects the
bilateral exchange rate for ten Eurozone countries from January 2008 to December 2010 and has
predictive power up to a period of ten days. Gray et al. (2007) apply the contingent claims analysis
to price sovereign credit risk by using the government’s balance sheet and exchange rate volatility as
inputs to their model and compare the results to observed CDS spreads. More recently, Plank (2010)
also suggests a structural model for sovereign credit risk based on macroeconomic fundamentals.
In this model, the probability of default reflected in the CDS spread depends on a country’s foreign
exchange reserves, as well as its exports and imports.
Ismailescu and Kazemi (2010) consider the possibility of rating changes affecting the sovereign
CDS spreads of 22 emerging economies over the time period January 2, 2001 to April 22, 2009.27
Using classic event study analysis, the authors conclude that the CDS of investment grade countries
respond mainly to negative credit rating announcements, while the spreads of speculative grade
countries respond largely to positive announcements. In addition, the information content of nega-
tive credit events is anticipated and already reflected in CDS spreads by the time the credit rating
change is announced. Alternatively, CDS spreads do not fully anticipate upcoming positive credit
rating events, which seem to contain new information. Furthermore, the paper documents evidence
of spillover effects arising mainly from rating upgrades, with a one notch rise in the rating of an
event country increasing the average CDS spread of a non-event country by 1.18%. These effects
are asymmetric, high grade countries reacting stronger to rating upgrades and low-grade countries
reacting stronger to rating downgrades. Although controlling for previous rating downgrades re-
duces the magnitude of the spillover effect, it is increased if countries have a common creditor,
which seems to be one channel of transmission. However, competition effects arise if two countries
have similar levels of trade flow correlation with the U.S.28
27For early evidence on the relationship between credit ratings and pricing information, see Cossin and Jung (2005),who show that ratings become more informative after a crisis event.
28Arezki et al. (2011) provide further evidence on the relationship between rating changes and sovereign CDSspreads.
13

4.3 Local Financial Risk Factors - The Sovereign-Bank Nexus
With the intensification of the European sovereign debt crisis following the bank bailouts during
the financial crisis, more and more evidence appears on a tight relationship between sovereign and
domestic financial risk. Acharya et al. (2013) for example illustrate the two-way feedback effect
between sovereign risk and the financial sector. Their results indicate that government bailouts
can negatively impact the financial strength of the sovereign, which in turn reduces the value of
the government guarantees implicit in the financial institutions and causes collateral damage to the
banks’ public bond holdings. As a consequence, CDS spreads of sovereign countries and financial
companies co-move strongly once the government has committed excessively to financial guarantees.
While the authors stress the two-way feedback effect, Dieckmann and Plank (2011) underscore
the unilateral private-to-public risk transfer through which market participants incorporate their
expectations about financial industry bailouts.29 They find that both the state of a country’s
financial system and of the world financial system have strong explanatory power for the behavior of
CDS spreads, while the magnitude of this impact seems to depend on the importance of a country’s
financial system pre-crisis. In addition, they provide evidence that Economic and Monetary Union
member countries exhibit higher sensitivities to the health of the financial system. Likewise, Ejsing
and Lemke (2011) provide evidence of a private-to-public risk transfer over the period January 2008
to June 2009 by showing that financial bailouts decreased banks’ CDS spreads at the expense of
rising sovereign spreads.
Altman and Rijken (2011) propose a “bottom-up” approach to evaluate sovereign default prob-
abilities by adapting the well-known credit-scoring method to countries. This suggests that the
profitability and financial condition of the local economy significantly impacts default risk. The
outcomes are compared to implied CDS rankings provided by the financial market.
Evidence that contingent liabilities of sovereigns arising from implicit or explicit guarantees of
the banking system influence sovereign CDS premia is also provided in Kallestrup et al. (2011).
The authors use consolidated BIS banking statistics combined with CDS spreads to construct a
financial network matrix, reflecting cross-country bank linkages and banks’ exposures to both the
29Dieckmann and Plank (2011) study eighteen advanced western economies on a weekly basis during the 2007/2008financial crisis, from 2007 to 2010.
14

domestic and foreign public, bank and private (non-bank) sectors. Large exposures to one country
turn out to be primarily important when the credit risk of that country is high. Cross-country
financial linkages are shown to have explanatory power for the variation on sovereign CDS spreads
beyond what can be accounted for by common and country-specific risk factors. Also Kallestrup
(2011) shows that there are strong interactions between sovereign credit risk and macrofinancial
risk indicators calculated based on bank balance sheet variables.
Sgherri and Zoli (2009) conduct an analysis of the co-movement between sovereign CDS and
those of the financial sector for ten European countries from January 1999 to April 2009. While
they confirm the dominance of a common time-varying factor, they find that concerns about the
solvency of the national banking systems have become increasingly important. Alter and Schuler
(2012) use a vector error correction framework to analyze price discovery mechanism among both
sovereign and bank CDS spreads before and after government rescue packages. In a nutshell, the
authors find that prior to a financial rescue package, default risk was transmitted primarily from
the bank to the sovereign sector, while post-bailouts, risk was also transmitted the other way round
from sovereigns back to banks.30
Taken at face value, the above results suggest that the role of risk factors underlying the variation
in sovereign spreads is time-varying. Country-specific factors seem to play a more important role
in crisis periods, in particular the sovereign-bank nexus. Such an explanation is in the spirit of
Augustin (2012), who argues that both country-specific fundamentals and global shocks matter for
the pricing of sovereign credit risk, but that they simply matter at different times. The author
argues that the shape of the term structure may serve as a signal to identify the relative importance
of each source of risk. More specifically, in good times, when we observe an upward sloping term
structure for countries, variation in spreads is relatively more driven by global risk factors, while
in bad times when we observe a downward sloping term structure, country fundamentals play a
more important role in explaining variation in spreads.31 That observation could be useful for risk
monitoring and credit scoring methods, as the slope of the term structure is observable in real time.
30Further evidence on the relationship between sovereign and bank CDS is also provided by Aktug et al. (2013).31Augustin (2012) documents the empirical relationship between the shape of the term structure and the explana-
tory power of local risk factors. The mechanism is rationalized in an equilibrium model with recursive utility andlong run risk for CDS spreads. Time variation in the term structure consistent with observed stylized facts arisesthrough the tension between global and local risk.
15

The state-dependent nature of the term structure may thus be a decision input for time-varying
weights associated with various risk factors.
To summarize, there is a strong debate on whether sovereign CDS spreads are driven relatively
more by global risk factors or by country-specific fundamentals, the latter being mostly related
to the health of the domestic financial sector. The truth lies probably somewhere between these
two explanations. Thus, future research is encouraged to focus on the time-varying properties of
both sources of risk. In addition, while the majority of papers focuses on the level of spreads,
time-variation in the term structure may provide valuable information going forward, as suggested
in Pan and Singleton (2008) and Augustin (2012).32
5 Spillovers and Contagion
The deepening sovereign debt crisis has been accompanied with a proliferation of the notions
contagion and spillovers of sovereign risk across countries, both in academic work and in the
popular press. The existence of real contagion is ambiguous. It could be the case that country
spreads co-move simply more or less because of their common exposure to global or regional shocks,
which have time-varying correlations. Alternatively, shocks to these factors may be transmitted
with time-varying intensities. Results in the literature largely depend on the exact definition of the
concept.
Beirne and Fratzscher (2013) investigate the presence of contagion effects among 31 developed
and emerging countries over the period 2004 to 2011.33 The authors distinguish between three types
of contagion: Fundamentals contagion arising from higher sensitivity of financial markets to existing
fundamentals during crisis periods, regional contagion defined as an intensification of cross-country
transmission of sovereign risk, and herding contagion or pure contagion, identified by temporal
cross-country correlations of the unexplained components of sovereign risk (the residuals).34 Their
results suggest evidence in favor of fundamentals contagion, in the sense that financial markets
32Pan and Singleton (2008) emphasize the information in the term structure to help identify recovery rates. Au-gustin (2012) emphasizes the role of the term structure as a signal to identify the relative importance of global andlocal risk factors.
33Beirne and Fratzscher (2013) investigate the presence of contagion for bond yields, CDS spreads and sovereigncredit ratings. The sample period for bond yields and credit ratings covers the period 1999 to 2011.
34More specifically, the presence of tail clustering in the distribution of error terms at a given point of time shouldbe evidence in favor of pure contagion.
16
experienced a wake-up call by becoming more sensitive to countries’ economic fundamentals during
the crisis period compared to the pre-crisis period. This was particularly pronounced for the GIIPS
countries. In contrast, regional spillovers have, if anything, decreased during the crisis and there
is no indication of spill-overs from GIIPS countries to other regions. Finally, there has been only
little evidence of pure contagion, which was generally very short-lived and didn’t dominate the
crisis period.
Caporin et al. (2013) reject the presence of sovereign contagion across 8 European countries
over the period November 2008 to September 2011 by testing whether the propagation effect across
countries is different for large shock realizations relative to average shocks, after conditioning on
common factors.35 Using quantile regression techniques, it is shown that the dependence between
movements of any two CDS changes does not change as a function of the size and sign of the
movements. This is strong evidence of linearity in the propagation of shocks, indicating that the
linkage among the different countries are the same during normal or turbulent times.36 Additional
tests emphasize that pairwise correlations across countries have reduced with the intensification of
the sovereign debt crisis and that correlations are lower for large changes in spreads, but higher for
small changes of spreads.37
Bai et al. (2012) focus on the contagion channel through correlated country fundamentals, dif-
ferentiating between domestic and aggregate credit and liquidity shocks for a sample of twelve
European countries from 2 January 2006 to 31 May 2012. A stylized rational expectations equi-
librium model illustrates how aggregate or country-specific shocks may affect each other through
spillovers and feedback effects. Decomposing spreads into a fundamental credit risk and liquidity
component, it is argued that the first wave of the sovereign debt crisis (August 2008 to April 2010)
was triggered by liquidity (although the liquidity component seems to be negligible before the
Lehman crash), while the second wave (May 2010 to May 2012) seems to be driven by fundamental
credit risk. Tests for spillovers and feedback loops based on a structural vector autoregression
yield four main messages: There were contagion effects based on the fundamental channel in both
35The authors look at France, Germany, Greece, Ireland, Italy, Portugal, Spain and the United Kingdom.36Note that the same test with bond yields show that the intensity of the propagation mechanism even decreased
from the period 2008 to 2011 relative to the period 2003 to 2006.37In contrast, Kalbaska and Gatkowski (2012) investigate exponentially-weighted-moving-average correlations and
Granger causality for nine sovereigns from August 2005 to September 2010. They find an increase in pair-wisecorrelations and 13 directional pairwise Granger causalities.
17

directions as domestic credit shocks tend to have significant effects on the aggregated credit shocks
in other European countries and vice-versa, foreign credit shocks tend to generate a positive and
significant reaction of CDS premia. Secondly, there is a significant contagion effect though the
aggregate liquidity channel as domestic liquidity seems to react significantly to foreign liquidity
shocks. Thirdly, Domestic liquidity shocks seem to have a significant negative effect on the aggre-
gated liquidity shocks in all other countries, pointing to a flight-to-liquidity phenomenon. Lastly,
domestic liquidity shocks seem to have no effect on either domestic or foreign credit risk. Thus, in
Bai et al. (2012), contagion arises primarily through the fundamental credit risk channel.
In contrast Darolles et al. (2012) focus purely on a liquidity channel for 18 emerging markets
from 1 January 2007 to 25 February 2011. Using the CDS-bond basis as a proxy for (il)liquidity,
the authors estimate a state-space model allowing for time-varying asymmetric volatilities and
document that the probability of being in a state of high correlations coincides with periods of high
market illiquidity. They infer that contagion effects are due to liquidity problems in the sovereign
debt market.
Benzoni et al. (2012) suggest a contagion channel through a hidden state of the underlying
economy. Uncertainty about the distribution of defaults makes agents overweight bad outcomes.
Thus, in response to a negative sovereign credit shock, agents update their beliefs about the pos-
terior probabilities in being in the bad state of the world. This updating of beliefs raises the
perceived default intensity of other countries, which generates correlations in credit spreads that
are significantly higher than if spreads were functions of the macroeconomic conditions only. In
Zhang et al. (2012), spillovers across countries are captured by increasing time-varying conditional
default probabilities. They propose a Copula-based framework to estimate daily marginal, joint
and conditional risk-neutral default probabilities, allowing for skewed and fat-tailed distributions
of spread changes, as well as time-varying volatilities and correlations across countries.38 The
model is calibrated daily to a panel of ten European countries over the period 1 January 2008 to
30 June 2011, using USD denominated daily 5-year CDS spreads. Brutti and Saure (2012) show
how financial shocks to Greece spill over to eleven other European economies. The magnitude of
contagion depends on the cross-country bank exposures to sovereign debt. All else being equal, the
38More specifically, the model is based on a multivariate mean-variance mixture distribution, where the risk indi-cators follow jointly a Generalized Hyperbolic skewed t-distribution.
18

transmission rate to the country with the greatest exposure to Greece (1.22 percent of GDP) has
been roughly 46 percent higher than the rate to the country with the least exposure (0.08 percent
of GDP).
In parallel to the literature on the relationship between sovereign and bank risk, several papers
investigate spillover effects between the sovereign and banking sector. Bruyckere et al. (2013)
study contagion/spillovers between sovereign and bank risk for 15 countries and more than 50
banks during 2006 to 2011. They define contagion by the correlation in spreads after having
accounted for the influence of economic fundamentals and common exposures. In other words,
they look at the correlation in the residuals, which they define as excess correlations. They find
statistically significant excess correlations for 86% of the banks in the sample, with an average
excess correlation of 17%. In a second step, these excess correlations are used to identify the
determinants with respect to bank and country-specific characteristics. The results suggest that
excess correlations between banks and their home countries are on average 3.2% higher than the
average excess correlation with other countries, which is 15.5%. The results are stronger for GIIPS
countries (4.47%). Moreover, excess bank-country correlations are stronger if banks are larger,
less-well capitalized banks, if banks rely more on wholesale funding, and if banks have a higher
proportion of non-interest income. Furthermore, excess correlations are higher for countries with
higher credit risk, but high capital adequacy ratios can reduce this effect. Using the information
from the European Banking Authority stress tests, the authors also show that banks which have
a one standard deviation higher bond exposure to country A than to country B have an excess
correlation with country A which is about 1.5 percentage points higher. Finally, the bank-country
contagion seems more pronounced for countries with higher debt-to-GDP ratios, and this effect is
largest in magnitude for the home country.39
Alter and Beyer (2013) attempt to quantify spill-over effects among sovereigns and banks during
the sovereign debt turmoil using daily 5-year bank and sovereign CDS spreads of 11 EU countries
from October 2009 to 3 July 2012. They estimate a VAR model augmented with exogenous factors
to account for any impact from common and regional factors and use the results from impulse-
response functions to construct spill-over indices. Aggregation of spill-over indices over time yields
39A one standard deviation increase in the debt-to-GDP ratio increases excess correlations by 1.14 percentagepoints.
19

a contagion index, which the authors decompose into four components to capture excess spillover
among sovereigns, among banks, from sovereigns to banks and from banks to sovereigns. In sum,
the results indicate increased interdependencies between sovereigns and banks during the sovereign
debt crisis.
Bai and Wei (2012) study the risk transfer from the sovereign to the corporate rather than the
financial sector by focusing on the role of institutions (property rights and creditor/contracting
rights) as a channel to influence the strength of the risk transfer. Using CDS spreads for 2,745
corporations in 30 countries from 2 February 2008 to 16 February 2010, the authors find that a
100 bps rise in sovereign CDS spreads leads on average to a 71 bps increase in corporate CDS
spreads. This relationship is stronger for state-owned institutions, both financial and non-financial.
Regarding the channel, strong property rights tend to weaken the association between sovereign and
corporate credit risk (constraints on executives, expropriation risk, rule of law), while the strength
of the contracting/creditor institutions (credit right index, contract enforcement days) seems to
have no material effect on the relationship between sovereign and corporate CDS. Augustin et al.
(2012) use the joint Greek government bail out and the violation of the no-bail out clause in the
1992 Maastricht Treaty as an exogenous event to investigate how a rise in sovereign credit risk
affects corporate borrowing costs in Europe. They show that a 1% rise in Greece’s credit risk raises
corporate borrowing costs of non-Greek companies by 0.18% on average. Cross-sectional evidence
suggests that companies with subsidiaries in Greece and those sharing a common currency are
affected more strongly by approximately 3 and 4 basis points respectively. In a contemporaneous
paper, Bedendo and Colla (2013) provide additional evidence that higher sovereign CDS spreads
are associated with higher corporate borrowing costs.
To summarize, the literature on contagion largely differs on how the concept is defined. Ac-
cordingly, there is significant heterogeneity in the empirical results. Going forward, it would be
fruitful to differentiate explicitly between the various concepts of contagion and to investigate in
more detail the precise channels through which spillovers may be transferred.
20

6 Frictions and the CDS-Bond Relationship
Duffie (1999) illustrates theoretically that the spread on a par floating rate note over a risk-free
benchmark should essentially be equal to the CDS spread.40 As such, the CDS-Bond basis, defined
as the difference between the CDS and bond spread, should be zero. However, empirically observed
imperfections of this theoretical arbitrage relationship have led researchers to investigate whether
the CDS market is more informationally efficient than the cash bond market and whether it reflects
new information more quickly, or vice-versa. Alternatively, people have looked at the determinants
of the basis, which relates explicitly to limits of arbitrage and frictions in one of the two markets,
or both.
6.1 Price Discovery and Informational Efficiency of Sovereign CDS Spreads
Regarding price discovery, there seems to be some consent that the CDS market is more efficient
for corporate reference entities. For sovereign reference entities however, results are very mixed and
ambiguous. These discrepancies may be related to the different samples, time periods, sampling
frequency and data sources.41 However, while some conclude in favor of the bond market and
others in favor of the CDS market, my interpretation of the literature is that there is increasing
price discovery in the credit derivative market as the market has matured.
Arce et al. (2013) make the sensible point that price discovery is state dependent and related
to the relative liquidity in both markets. As the CDS market has become more mature over time,
this would also explain why its relative informational efficiency has increased. A similar argument
is also made in Ammer and Cai (2011), who provide some evidence that the relatively more liquid
market tends to lead the other, as their measure of relative CDS price leadership is correlated
positively with the ratio of the bond bid-ask spread to the CDS bid-ask spread and negatively with
the number of bonds outstanding. Another main take-away is that a positive basis is usually more
persistent, due to the difficulty of shorting bonds. Moreover, except for some minor exceptions,
40Other references are Lando (2004) and Hull and White (2000a).41Abstracting from technical details, this literature usually adopts the common approach to test whether the two
markets are co-integrated, that is whether they are characterized by a long-run stationary relationship, and thento look at short-term deviations from equilibrium to verify which market adapts to the other one. This is executedusing the techniques of vector error correction modeling, computing Hasbroucks’s and Gonzalo-Granger’s informationmeasures, or by analyzing statistical causality using Granger’s method.
21

almost all studies focus exclusively on the most liquid 5-year segment of the market. Without
spending too much time on the details, I provide a shopping list of the references in the following
paragraph.
Palladini and Portes (2011) study 6 developed economies in Europe from 30 January 2004
through 11 March 2011 using CMA quote data and conclude that CDS spreads lead in the price
discovery process.42 A similar conclusion is drawn by Varga (2009), who takes a special look at
Hungary from 6 February 2004 to 18 June 2008 using the CMA database.43 Using likewise the
CMA data, O’Kane (2012) studies cross-correlations and performs Granger causality tests for 6
European economies from 1 January 2008 to 1 September 2011.44 He finds that for Greece and
Spain, Granger causality flows from the CDS to the bond market, while the results is reversed for
Italy and France. For Portugal and Ireland, there seems to be two-way causality.
Studying 18 sovereign developed and emerging economies from January 2007 to March 2010,
Coudert and Gex (2013) conclude that bonds seem to lead for developed European economies,
while the derivative market wins the horse race in emerging economies.45 The authors also put
forth a differential liquidity argument and argue that the role of CDS has intensified during the
crisis, as bond market players with a bearish view will simply stay out of the markets, while CDS
buyers will stay in and purchase protection. This contrasts with Arce et al. (2011), who argue that
the role of bond markets has increased for European Economies during the financial crisis. They
study 11 European economies from January 2004 to September 2010 using CMA data.46 Fontana
and Scheicher (2010) look at 10 Euro area countries from January 2006 to June 2010 using again
CMA data47. In contrast to most other studies, which use the 5-year spread, the authors study
10-year spreads. In line with the previous mixed results, in half of the sample countries, price
discovery takes place in the CDS market and in the other half, price discovery is observed in the
42The 6 countries are Austria, Belgium, Greece, Ireland, Italy, and Portugal.43While Varga focuses on Hungary, some additional analysis is also provided for 14 emerging countries from 3
January 2005 to 30 May 2008. These countries are Brazil, Bulgaria, Czech Republic, South Africa, Estonia, Croatia,Poland, Latvia, Lithuania, Russia, Romania, Slovakia, Turkey and Ukraine.
44The 6 countries are France, Greece, Italy, Ireland, Portugal and Spain.45See also Coudert and Gex (2010). The sample includes Austria, Belgium, Denmark, Finland, France, Netherlands,
Greece, Ireland, Italy, Portugal and Spain for the advanced European countries; Argentina, Brazil, Mexico, Lithuania,Poland, Turkey and Philippines for the emerging countries; in addition the authors study 17 financial companies.
46The 11 EMU countries are Austria, Belgium, Finland, France, Germany, Greece, Ireland, Italy, the Netherlands,Portugal and Spain.
47Austria, Belgium, France, Germany, Greece, Ireland, Italy, Netherlands, Portugal and Spain.
22

bond market. Further evidence is provided by M. Kabir Hassan and Suk-Yu (2011), who study
7 emerging economies from January 2004 to October 2009 using data from JP Morgan Chase.48
They find that bond markets lead for Brazil and the Philippines, CDS markets lead for Argentina,
and there is no clear dominance for Mexico, China, and South Africa. The additional contribution
is to link pricing efficiency to financial integration. It is argued that sovereigns, for which bond
markets lead the price discovery process, are more financially integrated with the world economy.
Li and Huang (2011) witness an increasing contribution of sovereign CDS rates to credit risk
discovery based on a sample of 22 emerging countries using Thomson Reuters data from 1 January
2004 to 31 July 2008.49 C. Emre Alper and Gerard (2012), studying CDS premia in relation to
asset swap spreads, conclude in favor of price discovery in the derivative market given a sample
of 21 advanced economies from January 2008 to January 201150. Their data comes both from
Datastream and Markit. Aktug et al. (2012) study 30 emerging markets at a monthly sampling
frequency from January 2001 to November 2007 using data from Markit.51 They show that bond
markets lead CDS markets in general, but that they lag CDS spreads in some cases, and that the
markets have become more integrated over time. Support for the bond markets is also found in
Ammer and Cai (2011). The latter investigate 9 emerging economies from 26 February 2001 to 31
March 2005 using Markit data.52 Overall, they find that the bond market leads the CDS market
more often. In an early paper, Chan-Lau and Kim (2004) have a hard time concluding in favor of
any market using CreditTrade data for 8 emerging economies from 19 March 2001 to 29 may 2003.53
Delis and Mylonidis (2011) look at Greece, Italy, Portugal and Spain using CMA data from 9 July
2004 to 25 May 25 2010. Based on 10-year spreads, they argue that CDS almost uniformly Granger
cause bond spreads. Feedback causality is, however, detected during times of intense financial and
economic turbulences.
48The countries are Argentina, Brazil, China, Colombia, Mexico, Philippines and South Africa.49The sample is composed of Argentina, Brazil, Chile, China, Colombia, Czech Republic, Egypt, Hungary, Indone-
sia, Israel, Korea, Malaysia, Mexico, Morocco, Pakistan, Peru, Philippines, Poland, Russia, South Africa, Turkey,Venezuela.
50The 22 countries are Australia, Austria, Belgium, Denmark, Finland, France, Germany, Greece, Ireland, Italy,Japan, the Netherlands, Norway, Portugal, Spain, Sweden, the UK and the US.
51They study Brazil, Bulgaria, Chile, China, Colombia, Croatia, Czech Republic, Dominican Republic, Ecuador,Egypt, El Salvador, Hungary, Korea, Lebanon, Malaysia, Mexico, Morocco, Pakistan, Panama, Peru, Philippines,Poland, Russia, South Africa, Thailand, Turkey, Ukraine, Venezuela and Vietnam.
52Brazil, China, Colombia, Mexico, the Philippines, Russia, Turkey, Uruguay, and Venezuela.53The following countries are reviewed: Brazil, Bulgaria, Colombia, Mexico, the Philippines, Russia, Turkey, and
Venezuela.
23

Gunduz and Kaya (2012) focus on the informational efficiency of sovereign spreads directly,
rather than on the informational efficiency relative to bonds. They investigate the long-memory
properties of spread returns (spread changes) and volatilities (squared spread changes) for 10 Eu-
ropean economies from August 2007 to October 2011, using both parametric and non-parametric
techniques.54 The authors find evidence in favor of long memory in spread changes, suggesting that
markets are (weak-form) informationally efficient and that information is timely impounded into
prices. On the other hand, there is strong evidence in favor of long memory in volatilities for 6
out of 10 countries, suggesting that sovereign default uncertainty is persistent.55 In addition, there
is evidence of Granger causality from volatilities to the levels and changes, suggesting that higher
sovereign default uncertainty raises country risk. Finally, additional elements of analysis can be
found in In et al. (2007), Boone et al. (2010), Li (2009), Bowe et al. (2009), Carboni (2010) and
Adler and Song (2010).
As a conclusion, results are very inconclusive, but differential liquidity seems to matter. Based
on this intuition, Calice et al. (2013) investigate liquidity spillovers between the two markets and
find substantial variation in the patterns of the transmission effect between maturities and across
countries. For several countries, including Greece, Ireland and Portugal the liquidity of the sovereign
CDS market has a substantial time varying influence on sovereign bond credit spreads. In et al.
(2007) study the volatility transmission among the two markets across emerging economies.
6.2 Liquidity and the Determinants of the CDS-Bond Basis
While the dynamics between the cash and derivative market raise interesting questions, another
angle to analyze is the determinants of the short-term deviations from the equilibrium relationship.
Differential liquidity may naturally explain the seemingly arbitrage opportunity. Early studies on
this topic assumed that the credit derivative market was perfectly liquid, as the underlying traded
instruments are by nature simple contractual agreements. This contrasts with the cash market,
where hard money is actually exchanged when the asset is purchased. In this spirit, Longstaff
et al. (2005) postulated CDS spreads to be pure indicators of default risk in order to infer liquidity
54The ten countries are Austria, Belgium, France, Germany, Greece, Ireland, Italy, Netherlands, Portugal andSpain. The non-parametric approach involves log-periodogram regressions, while the parametric approach involvesestimating a dual long memory ARFIMA-GARCH model.
55The 6 countries are Greece, Italy, Ireland, Portugal, Belgium and Spain.
24

characteristics of the bond market.56 Academic work on liquidity effects in the CDS market is very
young, even for corporate reference contracts, but the literature is rapidly growing. Two papers
that study liquidity characteristics in the synthetic credit derivative market for corporate reference
entities are for example Tang and Yan (2007) and Bongaerts et al. (2011). The former show that
both liquidity characteristics and liquidity risk explain about 20% of the time series variation in
CDS spreads, while the latter provide strong evidence for an expected liquidity premium earned
by the protection seller. The premium is however economically small.
For sovereign CDS, Pan and Singleton (2008), who study the term structure of recovery rates
of Mexico, Brazil and Turkey, report anecdotal evidence of liquidity effects from discussion with
practitioners. Lei and Ap Gwilym (2007) study the determinants of CDS liquidity proxied by bid-
ask spreads for a sample of daily CDS spreads from CreditTrade over the sample period 7 July 2003
to 3 March 2005. The subsample of sovereigns represents approximately 10% of the overall sample.
The authors find that demand-supply pressure/imbalance, volatility, price clustering and downgrade
watch status are associated with higher bid-ask spreads. In addition, wider bid-ask spreads are
associated with less popular CDS maturities and weaker credit ratings. Higher notional amounts
traded is related to lower bid-ask spreads, and there is evidence of commonality in bid-ask spreads.
Bid-ask spreads have also narrowed as their trading has matured. Most importantly, speculative-
grade sovereign reference entities have wider bid-ask spreads on average than speculative-grade
corporate reference entities, but there seems to be no difference for investment grade issuers. Finally,
CDS spreads referencing subordinated debt and contracts defining restructuring as a credit event
have larger bid-ask spreads.
Badaoui et al. (2013) use a factor model to decompose sovereign CDS spreads into their default
risk component, a country-specific liquidity component, a systematic liquidity component and a
correlation component to account for correlated credit and liquidity risk. The authors make the
identification assumption that bond and CDS spreads are driven by the same default risk compo-
nent, but that they may have different country-specific and systematic liquidity components, all
of which may be correlated. A daily calibration using both CDS and bond spreads to 9 emerging
countries over the period November 2005 to September 2010 yields that the credit risk compo-
56The assumption that sovereign CDS spreads are pure indicators of default risk is also made in Bai et al. (2012)and Beber et al. (2009).
25
nent represents approximately 55.6% of sovereign CDS spreads, the liquidity risk component about
44.32% and correlation risk is small with a fraction of roughly 0.043%. In addition, the results
suggest a negative relationship between default and liquidity risk. In Badaoui et al. (2012), the
same authors study the dynamic properties of the risk-neutral liquidity risk premium embedded in
the term structure of sovereign CDS, using information on the 1, 3 ,5 ,7 and 10-year daily spreads
for Brazil, the Philippines and Turkey from September 2005 through September 2010. The results
suggest that the term structure of liquidity risk is roughly flat, slightly higher at short and long
horizons, with inversions during periods of distress. Also, the average liquidity risk is higher for
bonds than for CDS. However, the ratio of the CDS to Bond liquidity increases as the default
intensity increases, implying that the surge in liquidity risk is stronger for CDS. The results thus
broadly indicate that there is a significant liquidity risk premium in the term structure of CDS,
which contributes to the time variation in the term structure.
Regarding the determinants of the CDS-bond basis, a liquidity story is supported by Arce et al.
(2011), who show that differential liquidity between the bond and the CDS partially explains the
difference. Specifically, differential liquidity is proxied by the ratio of the bid-ask to the mid spread
in the CDS market divided by the bid-ask to the mid spread in the bond market. In addition, the
authors show evidence for the role of counterparty risk, which is the risk that a CDS counterparty
may not be able to honor its obligations from the insurance contract. This risk becomes especially
important when the default of the counterparty occurs at the same time as the default event of the
underlying reference entity. Arora et al. (2012) show that counterparty risk is significantly priced
in the corporate market, but that it is economically small in magnitude. On average, counterparty
credit risk needs to increase by 646 basis points to reduce the insurance price by 1 basis point. This
small effect is likely the result of collateralization (and maybe overcollateralization) agreements.
In a similar spirit, Levy (2009) also links the pricing discrepancies to both counterparty risk and
liquidity. Kucuk (2010) finds that the basis is strongly associated with various bond and CDS
liquidity variables such as (for bonds and CDS) the average sample bid-ask spread and percentage
bid-ask spread, and (for bonds) lagged trading volume, notional amount outstanding, age and time
to maturity. Similar to the debate on global versus local factors for sovereign CDS spreads, Fontana
and Scheicher (2010) relate the basis mainly to common factors.
26

Another potential source of friction, which can create a wedge between the CDS and bond
spread is the Cheapest-to-Deliver option embedded in CDS contracts. Upon the occurrence of a
credit event, the holder of the insurance contract has the right to deliver the cheapest among a
set of defaulted debt obligations to his counterparty in return for the insurance settlement. This
option makes the contract riskier from the perspective of the CDS seller, and should be relatively
more important, the closer a country is to default. Ammer and Cai (2011) provide a treatment of
the sovereign case, while Jankowitsch et al. (2008) provide positive evidence for corporate CDS.
For sovereigns, some early analysis is also available in Singh (2003).
Fisher (2010) studies theoretically how heterogeneous investors with different beliefs about the
probability of default of a sovereign borrower affect the sovereign CDS-Bond basis. The results of
the model depend on the assumption that a fixed proportion of investors are unable to sell CDS. The
latter constraint becomes binding in bad times, when a relatively bigger proportion of investors
is pessimistic and wants to sell off credit risk (buying CDS). But as the supply is limited, this
constraint creates a wedge between the bond and CDS prices and induces a positive basis. Thus,
the time-varying equilibrium basis depends on the time-varying proportion of pessimistic investors.
A second mechanism that induces the (positive basis) in his model is the prospect of lending fees
from the bonds in bad times. As supply in the CDS market is restricted, some pessimistic investors
who want to take a short position in sovereign credit risk need to short-sell the physical bond. This
allows those who hold on to the bond to charge higher fees by lending it out to short-sellers. This
fee raises bond prices, lowers spreads, and creates a positive basis.
Finally, Adler and Song (2010) provide evidence that short-selling costs were partly responsible
for persisting positive bases for sovereign reference entities. In addition, the authors provide a more
general theoretical pricing framework for the basis, which corrects for biases arising from accrued
spread or coupon payments and bond prices away from their par value.57 In fact, the model
illustrates how accrued payments and bond prices below (above) par may mechanically introduce a
negative and positive (negative) basis respectively. It is exactly this latter effect, which may explain
the well documented basis smile. The average credit quality of a portfolio of bonds depends on the
statistical distribution of historical rating transitions. Hence, the joint consideration of price and
57The pricing framework considered in Adler and Song (2010) is a useful extension to the treatment in Duffie(1999).
27

credit quality will determine the shape of the basis smile, which could very well be a “frown”.
6.3 The Impact of Sovereign CDS on Public Bonds
During the European debt crisis, speculation in the sovereign CDS market was blamed as a cause
of derailing public borrowing costs. As a consequence, BaFin, the German financial regulator, went
ahead with an outright ban on naked sovereign CDS in May 2010, despite an official report by
the European Commission failing to provide conclusive evidence (See Criado et al. 2010.). The
European Union followed Germany by restricting the use of sovereign credit insurance to investors
seeking to hedge long positions in November 2012.58
Academic opinions don’t seem to agree on this idea. Richard Portes (see Portes 2010) advocates
a ban, arguing that naked CDS buying (equivalent to shorting the bond) artificially drives up prices,
thereby increasing a country’s borrowing costs. The argument is largely based on the fact that
sovereign CDS spreads incorporate information more quickly than bond spreads, and that there is
a statistical information flow from the derivative to the cash market. Darrell Duffie (Duffie April
29 2010a, Duffie 2010b), on the other hand, argues that a ban on naked sovereign CDS trading may
instead increase execution costs and lower the quality of price information. In contrast, he argues
that holders of both the derivative and the underlying cash bond have in fact no more incentive to
monitor the borrower, which may induce the borrower to invest less efficiently and thus increases
the probability of default. Goderis and Wagner (2011) argue theoretically that without insurance,
the sovereign country has no incentive to optimally invest (or exert effort) as there is the possibility
of offering a debt restructuring in the bad states of the world, which the lender cannot credibly
commit to reject. When the lender can purchase insurance on the bond, the threat of rejecting the
restructuring offer becomes credible and the debtor will have to internalize more of the costs in the
bad states. This provides incentive to invest more efficiently ex-ante, which in turn reduces default.
Strategic purchase by a (single) bondholder to increase the bargaining power in debt renegotiation
deal is thus beneficial from an ex-ante perspective. However, in the presence of many bondholders,
there may be coordination failures. This may lead to a situation, where lenders buy more insurance
than is socially optimal, which leads to an increased probability of default.59
58See http://ec.europa.eu/internal market/securities/short selling en.html.59Bolton and Oehmke (2011) study this so called “empty creditor” problem theoretically for corporate CDS, while
28

Sambalaibat (2011) studies the issue of naked CDS theoretically and shows that the effect de-
pends on the infrastructure of the insurance market. The overall outcome depends on the parameter
values, and naked CDS buyers may either induce over-investment, leading to lower borrowing costs
or to under-investment with higher borrowing costs. For a legal treatment of how credit derivatives
may affect the sovereign debt restructuring process, see Verdier (2004). Ismailescu and Phillips
(2011) investigate whether the existence or initiation of sovereign CDS has any adverse impact on
sovereign bonds.60 The authors characterize sovereign CDS as efficient monitoring tools which can
reduce the adverse selection costs for informationally opaque countries. Moreover, they allow for
greater risk-sharing among high-default countries and therefore encourage market participation.
Their results indicate that CDS initiation makes public bond markets more complete, that price
efficiency of sovereign bonds increases post CDS initiation (although this seems to be restricted to
high default risk and low financial market openness countries). Finally, CDS initiation reduces the
borrowing costs for investment grade countries, with an average reduction in borrowing costs of
15-26% or 13 bps, but in increases the borrowing costs of high default risk and low financial market
openness countries of about 3 to 5% or roughly 14 basis points.61
To summarize, the theoretical and empirical evidence makes it difficult to draw any conclusion in
favor or against the argument that rising CDS spreads caused public borrowing costs to rise during
the sovereign debt crisis. Sustaining the argument in favor based on price information only, without
having insight into trading positions in relation to actual public exposures, is, in my point of view,
hard to justify. In addition, recent evidence of trading information relative to the size of the public
debt market is rather small. I will review these numbers in the following section. However, even
if one believes that price discovery in the CDS market with information flow from the derivative
to the cash market is evidence in favor of price speculation driving up public borrowing costs,
regulators should keep in mind that empirical results are largely ambiguous when making drastic
Subrahmanyam et al. (2012) provide empirical evidence. The concept of empty creditor refers to the separation ofcash flow and voting rights through the use of credit derivatives. A debt holder, whose exposure is insured with aCDS, keeps an economic interest in the firm’s claims, but has no more risk alignment with other bondholders, whoenjoy no such protection.
60The authors study 54 emerging and developed countries over the sample period 1 January 2000 to 27 February2009.
61The authors also find that CDS initiation is positively predicted by higher financial market uncertainty (localstock market volatility) and the ability of a country to service its debt (foreign currency reserves and exchange ratesrelative to the USD).
29

regulatory changes that may ultimately negatively affect the efficient information transmission in
financial markets.
7 Trading in the Sovereign CDS Market
Very little is known about the trading patterns in the sovereign CDS market. Based on a three-
month sample of detailed transaction-level data over the time period May 1 to July 31 2010 gener-
ously received from a set of dealers, the Federal Reserve Bank of New York spoiled us a with a more
detailed picture of the CDS trading behavior in their staff report No. 517.62 Keeping in mind the
caveat that the data set stems from a period, where overall trading activity was below historical
average, the results indicate that CDS trade not that often despite their highly standardized nature.
For the 29,146 single name sovereign CDS transactions recorded for 74 reference entities, the most
actively traded reference entities traded on average 30 times per day, the less frequently traded 15
times per day on average and the infrequently traded reference entities traded only 2 times per day
on average. Another way to say this, is that a long tail of reference entities trade less than once a
day. In terms of size, the USD denominated trades were mostly traded in 5 million USD tickets,
with a median and mean trade of 10 and 16.74 million USD respectively. For EUR denominated
trades (which amounted to only 574 transactions), the mode was 10 million USD, with a median
trade of 5 million and a mean trade of 12.53 million. For matters of comparison, sovereign single
name CDS trades were on average twice as large as their corporate counterparts.
Although the number of trades seems rather low, market participation for sovereign reference
entities was rather active. On average, 50 market participants are reported to have traded at least
once a day, 200 traded at least once a week and 340 traded at least once a month. In addition,
dealers were more likely to be sellers of protection and the four most active dealers were involved
in 45% of the buying and selling of all CDS trades and in 50% of the overall notional amount.
Yet, according to regulatory definitions of the Department of Justice, the Herfindahl Hirshman
concentration index with levels ranging between 885 and 965 is considered to be low.63 Finally, the
62See Chen et al. (2011).63Note that Giglio (2011) emphasizes the high concentration of the CDS market, thereby referring to industry
reports, which state that in 2006, the top 10 counterparties (all broker/dealers) accounted for about 89% of the totalprotection sold. See footnote 8.
30
market is confirmed to be highly standardized, as 92% of all single-name CDS contracts within the
sample had a fixed coupon and 97% had fixed quarterly payment dates.
Using transactions and quote data from CreditTrade on 77 sovereign reference entities from
January 1997 to June 2003, Packer and Suthiphongchai (2003) emphasized the low trading vol-
ume by indicating that (in 2002), only 6% of all quotes resulted in transactions, with a strong
concentration in a few reference entities. The top five names accounted for more than 40% of all
quotes. These countries were Brazil, Mexico, Japan, the Philippines and South Africa. Lei and
Ap Gwilym (2007) provide descriptive statistics on the characteristics and evolution of credit de-
fault swap trading for a sample of American (North America and Latin America) quotes and trades,
provided by CreditTrade, from 10th June 1997 to 3rd March 2005. Roughly 12% of the sample is
made up by sovereign quotes and trades, the majority of which (85.2%) comes from Brazil, Mexico,
Columbia and Venezuela. The dominating currency denomination is USD (99%), 98.32% of the
sample references senior unsecured debt and 90.36% of the sample uses the Modified Restructuring
clause.64 There has been a shift in the most commonly traded/quoted notional amounts, going
from 10 million USD before 2002 to 5 million USD thereafter. This change is likely due to the
development of the CDS index market. 5-year maturities are the most heavily quoted (83%). In
addition, the average number of reference entities quoted/traded has steadily increased over time,
with an average number of 56 per day in 2005. Also note that in every year, the minimum amount
of reference entities traded/quoted is 1 (except in 2005 it is 4). The number of quotes to trades is
substantial, but decreasing over time. Finally, the total number of quotes and trades exhibits an
inverse U-shape pattern during the week, peaking on Wednesdays.
Another more exhaustive source of information on CDS trading behavior is the Depository Trust
and Clearing Corporation (DTCC). In October 2008, the DTCC Trade Information Warehouse
started to publish detailed weekly reports on stocks and volumes in CDS trading. More specifically,
current and historical positions are shown on an aggregate level and for the 1,000 mostly traded
reference contracts. This move towards higher transparency is greatly welcome. Oehmke and
Zawadowski (2011) use this data to study the determinants of corporate trading and find that
higher amounts of (corporate) CDS outstanding are associated with companies, which have more
64Note that this is prior to the Big Bang protocol.
31

assets on their balance sheet, more bonds outstanding, that are investment grade firms or firms
that have just recently lost their investment grade status, as well as with higher analysts’ forecast
dispersion. Duffie (April 29 2010a) illustrates a few statistics on sovereign CDS from this database
in his testimony to the United House of Representatives. Berg and Streitz (2012) use the data on
sovereign reference entities for 57 countries over the sample period October 2008 to July 2010 to
show that higher ratios of net notional amounts outstanding normalized by total debt (size) are
associated with smaller countries and for countries with a credit rating just above the investment
grade cut-off, while larger countries and those with a speculative grade rating are associated with
higher levels of turnover normalized by net notional amounts outstanding (turnover). In addition,
only negative rating changes and negative rating watches are associated with increases in turnover,
but not with size. As there is still little evidence on the information made available by the DTCC, I
provide below a summarized overview of the main statistical facts for government credit derivatives.
Table 4 illustrates the average gross and net notional amounts outstanding in (million) USD
equivalents on all sovereign CDS contracts (excluding sovereign states in the US) among the 1,000
mostly traded contracts over the time period 31 October 2008 through 12 April 2013. In addition,
there is information on the average number of contracts over that period, the ratios of gross to net
notional amount outstanding and the net notional amount outstanding to the number of contracts.
The countries are classified into five geographical regions following the practice of Markit: Americas,
Asia Ex-Japan, Australia and New Zealand, Europe-Middle East-Africa (EMEA) and Japan. While
the weekly total gross notional volume recorded for sovereign countries in the data repository is
approximately 2.3 trillion USD, the net exposure, which accounts for offsetting effects between
buyers and sellers and represents therefore a more economically meaningful measure, reflects with
213.5 billion USD about 9.23% of that amount. Keeping in mind that this number does not report
the values for sovereign US states and other non-government supranational bodies, this amount
represents approximately 81% of the sovereign single name CDS outstanding as reported by BIS in
the first semester of 2012 (see Table 1).
The total number over all country-specific averages of traded contracts is 165,089, the mean ratio
of gross to net notional amount is 11.70 and on average, the net credit exposure per contract is 1.8
million USD. There is however a significant cross-sectional dispersion. Further analysis also reveals
32
that three of the five GIIPS countries rank among the top ten countries with the highest amount
of net notional exposure. Another striking feature we observe is that emerging economies tend to
have higher numbers of traded contracts, but smaller net exposures per contract on average, while
developed economies trade in bigger bulks, but have fewer contracts outstanding. The world’s two
biggest reference bond markets, the US and Germany, top the list with 5.42 and 6.34 million USD
per contract respectively. At the bottom of the list are the Philippines and Ukraine with an average
of 390,000 and 380,000 USD per traded contract. Moreover, the top ten list of countries with the
highest amount of gross volume outstanding is dominated by emerging market economies, while
developed distressed economies cluster in the top ten list with the highest net notional exposure.65
Columns 8 and 9 in Table 4 indicate the gross amount of public debt in billion USD and
the debt-to-GDP ratios from the World Economic Outlook Database. An interesting fact is that
the net notional amount outstanding relative to gross public debt is on average only 2.2%, with
a median value of 1.3%. In particular Estonia and Bulgaria skew the statistics with values of
23.3, 11.4 and 6.5%. In other words, the net economic exposure of traded insurance contracts
relative to public debt is for many countries below 2%. Figure 3 provides some more intuition
about how the CDS trading is related to individual governments’ debt levels. There seems to be
a statistically significant relationship between the net notional amount of CDS outstanding and
the gross amount of government debt.66 This relationship appears much weaker if debt levels
are compared against gross exposures and the number of contracts outstanding. Duffie (April 29
2010a, 2010b) shows empirical evidence that the volume of CDS is unrelated to the level of spreads,
which is confirmed in Figure 3c.67 This raises once more interesting questions. We have seen that
spreads are mostly related to global risk factors and the health of the domestic financial sector, but
less to individual government characteristics. On the other hand, government characteristics seem
somewhat associated with volumes.
65Additional (unreported) statistics at a yearly frequency show that average weekly gross and net volumes, as wellas ratios of gross to net exposure have increased only modestly over time, with the ratio of gross to net exposure beingroughly equal to a factor of 11. The average number of contracts reported in the warehouse has changed slightlymore over time, which explains the bigger fluctuations in the net notional exposure per contract, which has comedown from 3.6 million USD in 2008 to a mean 1.22 million in 2012. These tables are available from the author uponrequest.
66The relationship between sovereign CDS trading and the level of GDP is very similar. These results are availablefrom the author upon request.
67The relationship is likewise similar if I do the comparison with GDP.
33

Table 5 separately reports statistics for the United States government and the sovereign US
states, which are registered in the DTCC database. In contrast to the statistics on other sovereign
governments, all yearly average values for CDS on US Treasuries exhibit a sharp increase in 2011
and have remained elevated ever since. In fact, the mean gross notional amount jumps by 94%
from 2010 to 2011, going from 13.2 to 25.6 billion USD. That’s a huge surge. The same observation
holds for net exposure, which rises by 84% over the same time period, going from 2.4 to 4.6 billion
USD, while the number of live contracts increases from 479 million to approximately 1.1 billion
contracts, which corresponds to an increase of roughly 133%. These spikes raise the provoking
thought that investors may actually have seriously considered the possibility of US government
default during the lock-out period in summer 2011. In particular, as no such sharp changes are
recorded for the individual states. The evidence is mixed. Gross exposures and number of traded
contracts unilaterally increased, while net notional exposure increased mainly for Illinois in 2011,
while it dropped for instance for New York City, Texas or Florida.
8 Conclusion
Sovereign credit risk is undoubtedly a topic of crucial importance. The supranational bailouts of
Greece, Ireland, Portugal and the vast amount of European Union summits ever since the start
of the sovereign debt crisis eliminate any doubt about the relevance of this topic.68 As we speak,
trying to avoid information on sovereign debt issues is like walking through a mine field in North
Korea.
This paper reviews the young, but steadily growing literature on sovereign CDS. In addition, it
highlights some key debates and discusses controversial statements about the economics of sovereign
CDS in relation to basic statistics from the Bank for International Settlements and the Trade Infor-
mation Warehouse from the Depository Trust and Clearing Corporation. Hopefully, the manuscript
raises some thought-provoking questions with useful insights for academics, policymakers and prac-
titioners alike. I had fun writing this document, I hope you enjoyed reading it.
68I stopped counting at 16.
34

References
Acharya, V. V., Drechsler, I. and Schnabl, P. (2013). A pyrrhic victory? - bank bailouts andsovereign credit risk, forthcoming in the Journal of Finance .
Adler, M. and Song, J. (2010). The behavior of emerging market sovereigns’ credit default swappremiums and bond yield spreads, International Journal of Finance & Economics 15(1): 31–58.
Aizenman, J., Hutchison, M. and Jinjarak, Y. (2013). What is the risk of european sovereign debtdefaults? fiscal space, cds spreads and market pricing of risk, Journal of International Moneyand Finance 34: 37 – 59.
Aktug, R. E., Nayar, N. N. and Vasconcellos, G. M. (2013). Is sovereign risk related to the bankingsector?, Global Finance Journal .
Aktug, R. E., Vasconcellos, G. and Bae, Y. (2012). The dynamics of sovereign credit default swapand bond markets: empirical evidence from the 2001 to 2007 period, Applied Economics Letters19: 251–259.
Alter, A. and Beyer, A. (2013). The dynamics of spillover effects during the european sovereigndebt turmoil, Working Paper .
Alter, A. and Schuler, Y. S. (2012). Credit spread interdependencies of european states and banksduring the financial crisis, Journal of Banking & Finance 36(12): 3444 – 3468.
Altman, E. I. and Rijken, H. A. (2011). Toward a bottom-up approach to assessing sovereigndefault risk, Journal of Applied Corporate Finance 23(1): 20–31.
Ammer, J. and Cai, F. (2011). Sovereign cds and bond pricing dynamics in emerging markets: Doesthe cheapest-to-deliver option matter?, Journal of International Financial Markets, Institutionsand Money 21(3): 369 – 387.
Ang, A. and Longstaff, F. A. (2013). Systemic sovereign credit risk: Lessons from the u.s. andeurope, Journal of Monetary Economics 60(5): 493 – 510.
Arce, O., Mayordomo, S. and na, J. I. P. (2013). Credit-risk valuation in the sovereign cds andbonds markets: Evidence from the euro area crisis, Journal of International Money and Finance235: 124 – 145.
Arce, O., Mayordomo, S. and Pena, J. I. (2011). Do sovereign cds and bond markets share thesame information to price credit risk? an empirical application to the european monetary unioncase, Working Paper .
Arezki, R., Candelon, B. and Sy, A. N. (2011). Sovereign rating news and financial marketsspillovers: Evidence from the european debt crisis, IMF Working Paper 11/68 .
Arghyrou, M. G. and Kontonikas, A. (2012). The emu sovereign-debt crisis: Fundamentals, ex-pectations and contagion, Journal of International Financial Markets, Institutions and Money22(4): 658–677.
Arora, N., Gandhi, P. and Longstaff, F. A. (2012). Counterparty credit risk and the credit defaultswap market, Journal of Financial Economics 103(2): 280 – 293.
35

Augustin, P. (2012). The term structure of cds spreads and sovereign credit risk, Working PaperStockholm School of Economics .
Augustin, P., Boustanifar, H., Breckenfelder, J. and Schnitzler, J. (2012). The real effects ofsovereign credit risk: Evidence from the european sovereign debt crisis, Working Paper StockholmSchool of Economics .
Augustin, P. and Tedongap, R. (2012). Real economic shocks and sovereign credit risk, WorkingPaper Stockholm School of Economics .
Badaoui, S., Cathcart, L. and El-Jahel, L. (2012). Implied liquidity risk in the term structure ofsovereign credit default swap spreads, Working Paper .
Badaoui, S., Cathcart, L. and El-Jahel, L. (2013). Do sovereign credit default swaps represent aclean measure of sovereign default risk? a factor model approach, Journal of Banking & Finance37: pp 2392–2407.
Bai, J., Julliard, C. and Yuan, K. (2012). Eurozone sovereign bond crisis: Liquidity or fundamentalcontagion, Working Paper .
Bai, J. and Wei, S.-J. (2012). When is there a strong transfer risk from the sovereigns to thecorporates? property rights gaps and cds spreads, Federal Reserve Bank of New York, StaffReport no. 579 .
Beber, A., Brandt, M. W. and Kavajecz, K. A. (2009). Flight-to-quality or flight-to-liquidity?evidence from the euro-area bond market, The Review of Financial Studies 22(3): pp. 925–957.
Bedendo, M. and Colla, P. (2013). Sovereign and corporate credit risk: Spillover effects in theeurozone, SSRN Working Paper 2212089 .
Beirne, J. and Fratzscher, M. (2013). The pricing of sovereign risk and contagion during theeuropean sovereign debt crisis, Journal of International Money and Finance 34(0): 60 – 82.
Benzoni, L., Collin-Dufresne, P., Goldstein, R. S. and Helwege, J. (2012). Modeling credit contagionvia the updating of fragile beliefs, Working Paper 2012-04 Federal Reserve Bank of Chicago .
Berg, T. and Streitz, D. (2012). The determinants of the sovereign cds volume, Working Paper .
Bilal, M. and Singh, M. (2012). Cds spreads in european periphery - some technical issues toconsider, Working Paper IMF No 12/77 .
Blanco, R., Brennan, S. and Marsh, I. W. (2005). An empirical analysis of the dynamic relationbetween investment-grade bonds and credit default swaps, The Journal of Finance 60(5): 2255–2281.
Bolton, P. and Oehmke, M. (2011). Credit default swaps and the empty creditor problem, Reviewof Financial Studies 24(8): 2617–2655.
Bongaerts, D., De Jong, F. and Driessen, J., J. (2011). Derivative pricing with liquidity risk: Theoryand evidence from the credit default swap market, The Journal of Finance 66(1): 203–240.
36

Boone, L., Fransolet, L. and Willemann, S. (2010). Euro public debt and the markets: sovereignfundamentals and cds market dynamics, Banque de France Financial Stability Review - Deriva-tives, Financial innovation and stability No 14: Barclays Capital.
Bowe, M., Klimaviciene, A. and Taylor, A. P. (2009). Information transmission and price discoveryin emerging sovereign credit risk markets, Working Paper .
Brutti, F. and Saure, P. (2012). Transmission of sovereign risk in the euro crisis, Working Paper .
Bruyckere, V. D., Gerhardt, M., Schepens, G. and Vennet, R. V. (2013). Bank/sovereign riskspillovers in the european debt crisis, Journal of Banking & Finance 37: 4793 – 4809.
C. Emre Alper, L. F. and Gerard, M. (2012). Pricing of sovereign credit risk: Evidence fromadvanced economies during the financial crisis, IMF Working Paper 12/24 .
Calice, G., Chen, J. and Williams, J. (2013). Liquidity spillovers in sovereign bond and cds markets:An analysis of the eurozone sovereign debt crisis, Journal of Economic Behavior & Organization85(0): 122 – 143.
Caporin, M., Pelizzon, L., Ravazzolo, F. and Rigobon, R. (2013). Measuring sovereign contagionin europe, NBER Working Paper 18741 .
Carboni, A. (2010). The sovereign credit default swap market: price discovery, volumes and linkswith banks’ risk premia, Working Paper Bank of Italy .
Carlos Caceres, V. G. and Segoviano, M. (2010). Sovereign spreads: Global risk aversion, contagionor fundamentals?, IMF Working Paper 10/120 .
Carr, P. and Wu, L. (2007). Theory and evidence on the dynamic interactions between sovereigncredit default swaps and currency options, Journal of Banking & Finance 31(8): 2383–2403.
Chan-Lau, J. A. and Kim, Y. S. (2004). Equity prices, credit default swaps, and bond spreads inemerging markets, IMF Working Paper 04/27 .
Chen, K., Fleming, M., Jackson, J. and Sarkar, A. (2011). An analysis of cds transactions: Impli-cations for public reporting, Federal Reserve Bank of New York Staff Report No. 517 .
Chernov, M., Gorbenko, A. S. and Mak, I. (2011). Cds auctions, Working Paper London School ofEconomics .
Cossin, D. and Jung, G. (2005). Do major financial crises provide information on sovereign risk tothe rest of the world? a look at credit default swap markets, FAME Research Paper N.134 .
Coudert, V. and Gex, M. (2010). Credit default swap and bond markets: which leads the other?,Banque de France Financial Stability Review - Derivatives, Financial innovation and stability .
Coudert, V. and Gex, M. (2013). The interactions between the credit default swap and the bondmarkets in financial turmoil, Review of International Economics 21(3): 492–505.
Criado, S., Degabriel, L., Lewandowska, M., Linden, S. and Ritter, P. (2010). Sovereign cds report,Official Report DG COMP, DG ECFIN and DG MARKT .URL: http://www.ft.com/intl/cdsreport
37

Darolles, S., Dudek, J. and Fol, G. L. (2012). Liquidity contagion: a look at emerging markets,Working Paper .
Das, S. R. and Hanouna, P. (2006). Survey of the literature: Credit default swap spreads, Journalof Investment Management 4: 93–105.
Delis, M. D. and Mylonidis, N. (2011). The chicken or the egg? a note on the dynamic interrelationbetween government bond spreads and credit default swaps, Finance Research Letters 8(3): 163– 170.
Dieckmann, S. and Plank, T. (2011). Default risk of advanced economies: An empirical analysis ofcredit default swaps during the financial crisis, Review of Finance .
Dooley, M. and Hutchison, M. (2009). Transmission of the u.s. subprime crisis to emerging markets:Evidence on the decoupling-recoupling hypothesis, Journal of International Money and Finance28(8): 1331 – 1349.
Duffie, D. (1999). Credit swap valuation, Financial Analysts Journal 55(1): 73–87.
Duffie, D. (2010b). Is there a case for banning short speculation in sovereign bond markets?, Banquede France Financial Stability Review - Derivatives, Financial innovation and stability No. 14.
Duffie, D. (April 29 2010a). Credit default swaps on government debt: potential implications ofthe greek debt crisis, Testimony to the United States House of Representatives, Subcommittee onCapital Markets, Insurance, and Government Sponsored Enterprises .
Ejsing, J. W. and Lemke, W. (2011). The janus-headed salvation sovereign and bank credit riskpremia during 2008-09, Economics Letters 110: 28–31.
Ericsson, J., Jacobs, K. and Oviedo, R. (2009). The determinants of credit default swap premia,Journal of Financial and Quantitative Analysis 44(1): 109 – 132.
Fisher, N.-F. (2010). Explaining sovereign bond-cds arbitrage violations during the financial crisis2008-09, Working Paper London School of Economics .
Fontana, A. and Scheicher, M. (2010). An analysis of euro area sovereign cds and their relationwith government bonds, SSRN eLibrary .
Giglio, S. (2011). Credit default swap spreads and systemic financial risk, Working Paper HarvardUniversity .
Goderis, B. and Wagner, W. (2011). Credit derivatives and sovereign debt crises, UnpublishedPaper, Tilburg University. .
Gray, D. . F., Merton, R. C. and Bodie, Z. (2007). Contingent claims approach to measuring andmanaging sovereign credit risk, Journal of Investment Management 5 4: 5–28.
Gunduz, Y. and Kaya, O. (2012). Sovereign default swap market efficiency and country risk in theeurozone, Deutsche Bundesbank Working Paper No.08/2013 .
Gupta, S. and Sundaram, R. K. (2012). Cds auctions and informative biases in cds recovery rates,Working Paper New York University .
38

Hart, O. and Zingales, L. (Fall 2011). A new capital regulation for large financial institutions,American Law and Economics Review 13(2): 453–490.
Helwege, J., Maurer, S., Sarkar, A. and Wang, H., Y. (2009). Credit default swap auctions andprice discovery., Journal of Fixed Income 19(2): 34 – 42.
Hui, C.-H. and Fong, T. (2011). Information flow between sovereign cds and dollar-yen currencyoption markets in the sovereign debt crisis of 2009-2011, Working Papers 402011, Hong KongInstitute for Monetary Research.
Hull, J. C. and White, A. (2000a). Valuing credit default swaps i: No counterparty default risk,Journal of Derivatives 8: 29–40.
In, F., Kang, B. U. and Kim, T. S. (2007). Sovereign credit default swaps, sovereign debt andvolatility transmission across emerging markets, Working Paper .
Ismailescu, I. and Kazemi, H. (2010). The reaction of emerging market credit default swap spreadsto sovereign credit rating changes, Journal of Banking and Finance 34(12): 2861 – 2873.
Ismailescu, I. and Phillips, B. (2011). Savior or sinner? credit default swaps and the market forsovereign debt, Working Paper .
Jankowitsch, R., Pullirsch, R. and Veza, T. (2008). The delivery option in credit default swaps,Journal of Banking and Finance 32(7): 1269 – 1285.
Kalbaska, A. and Gatkowski, M. (2012). Eurozone sovereign contagion: Evidence from the cdsmarket (2005-2010), Journal of Economic Behavior & Organization 83(3): 657 – 673.
Kallestrup, R. (2011). Bank balance sheets and the dynamics of bank and sovereign credit spreads,Working Paper Copenhagen Business School .
Kallestrup, R., Lando, D. and Murgoci, A. (2011). Financial sector linkages and the dynamics ofbank and sovereign credit spreads, Working Paper Copenhagen Business School, .
Kucuk, U. N. (2010). Non-default component of sovereign emerging market yield spreads and itsdeterminants: Evidence from the credit default swap market., Journal of Fixed Income 19(4): 44– 66.
Lando, D. (2004). Credit Risk Modeling, Princeton University Press.
Lando, D. and Mortensen, A. (2005). Revisiting the slope of the credit spread curve, Journal ofInvestment Management, Vol. 3, No. 4, Fourth Quarter 2005 3(4): 1–27.
Lei, M. and Ap Gwilym, O. (2007). The characteristics and evolution of credit default swap trading.,Journal of Derivatives & Hedge Funds 13(3): 186 – 198.
Levy, A. (2009). The cds bond basis spread in emerging markets: Liquidity and counterparty riskeffects, Working Paper .
Li, N. (2009). The price discovery process in credit derivative market: evidence from sovereign cdsmarket, American Journal of Finance and Accounting 1(4): 393 – 407.
39

Li, N. and Huang, A. Y. (2011). Price discovery between sovereign credit default swaps and bondyield spreads of emerging markets, Journal of Emerging Market Finance 10(2): 197–225.
Longstaff, F. A., Mithal, S. and Neis, E. (2005). Corporate yield spreads: Default risk or liquidity?new evidence from the credit default swap market, The Journal of Finance 60(5): 2213–2253.
Longstaff, F. A., Pan, J., Pedersen, L. H. and Singleton, K. J. (2011). How sovereign is sovereigncredit risk?, American Economic Journal: Macroeconomics 3(2): 75–103.
M. Kabir Hassan, G. M. N. and Suk-Yu, J. (2011). Credit default swaps and sovereign debt markets,Working Paper .
Merton, R. C. (1974). On the pricing of corporate debt: The risk structure of interest rates, TheJournal of Finance 29(2), Papers and Proceedings of the Thirty-Second Annual Meeting of theAmerican Finance Association, New York, New York, December 28-30, 1973): 449–470.
Oehmke, M. and Zawadowski, A. (2011). Positioning in the cds market: Evidence from the dtccdata, Working Paper Columbia University .
O’Kane, D. (2012). The link between eurozone sovereign debt and cds prices, Banks, Markets andInvestors 117.
Packer, F. and Suthiphongchai, C. (2003). Sovereign credit default swaps, BIS Quarterly Review .
Palladini, G. and Portes, R. (2011). Sovereign cds and bond pricing dynamics in the euro-area,Working Paper London Business School .
Pan, J. and Singleton, K. J. (2008). Default and recovery implicit in the term structure of sovereigncds spreads, The Journal of Finance 63(5): 2345–2384.
Plank, T. J. (2010). Do macro-economic fundamentals price sovereign cds spreads of emergingeconomies?, Working Paper .
Portes, R. (2010). Ban naked cds, Euro Intelligence .
Pu, X. (2012). The information content of dual-currency sovereign cds for exchange rate returns,Finance Research Letters 9: 157166.
Remolona, E., Scatigna, M. and Wu, E. (2008). The dynamic pricing of sovereign risk in emergingmarkets: Fundamentals and risk aversion, Journal of Fixed Income 17(4): 57 – 71.
Sambalaibat, B. (2011). Credit default swaps and sovereign debt with moral hazard and debtrenegotiation, Working Paper Carnegie Mellon University .
Sgherri, S. and Zoli, E. (2009). Euro area sovereign risk during the crisis, IMF Working Papers09/222, International Monetary Fund.
Singh, M. (2003). Are credit default swap spreads high in emerging markets? an alternativemethodology for proxying recovery value, IMF Working Paper 03/242 .
Stulz, R. M. (2010). Credit default swaps and the credit crisis, Journal of Economic Perspectives24(1): 73–92.
40

Subrahmanyam, M. G., Tang, D. Y. and Wang, S. Q. (2012). Does the tail wag the dog? the effectof credit default swaps on credit risk, SSRN eLibrary .
Tang, D. Y. and Yan, H. (2007). Liquidity, liquidity spillover, and credit default swap spreads,Working Paper .
Tett, G. (2009). Fool’s Gold: How the Bold Dream of a Small Tribe at J.P. Morgan Was Corruptedby Wall Street Greed and Unleashed a Catastrophe, Free Press.
Varga, L. (2009). The information content of hungarian sovereign cds spreads, Working PaperCentral Bank of Hungary .
Verdier, P.-H. (2004). Credit derivatives and the sovereign debt restructuring process, WorkingPaper Harvard Law School .
Wang, P. and Moore, T. (2012). The integration of the credit default swap markets during theus subprime crisis: Dynamic correlation analysis, Journal of International Financial Markets,Institutions and Money 22(1): 1 – 15.
Zhang, F. X. (2008). Market expectations and default risk premium in credit default swap prices:A study of argentine default., Journal of Fixed Income 18(1): 37 – 55.
Zhang, X., Schwaab, B. and Lucas, A. (2012). Conditional probabilities and contagion measures foreuro area sovereign default risk, forthcoming in the Journal of Business and Economic Statistics..
41
A What Are Credit Default Swaps
Engineered in the early nineties by JP Morgan to meet the growing demand to slice and dice
credit risk69, credit default swaps represent the most simple (”vanilla”) instrument among the
class of credit derivatives. Nevertheless, they remain till this date highly controversial. While the
proponents would defend them as efficient vehicles to transfer and manage credit risk as well as
means to widen the investment opportunity set of return chasers, opponents denounce them as
weapons of mass destruction, time bombs70, financial hydrogen bombs71 or speculative bets on
government default. For the sake of this review, let us stick to the factual definition of what they
really are: insurance contracts offering protection against the default of a referenced sovereign
government or corporation.
Technically speaking, a credit default swap is a fixed income derivative instrument, which
allows a protection buyer to purchase insurance against a contingent credit event on an underlying
reference entity by paying an annuity premium to the protection seller, generally referred to as
the Credit Default Swap spread. The premium is usually defined as a percentage on the notional
amount insured and can be paid in quarterly or bi-annual installments. Readers not familiar with
this particular notion of insurance should simply bear in mind the example of car insurance. But
whereas for car insurance, the contract would be written on a specific vehicle, credit insurance
could be contracted on a given brand, think of a Volkswagen for the sake of the argument. Thus,
any Volkswagen involved in an accident would trigger a payout to the holder of the contract. In the
language of credit derivatives, you would purchase a CDS on a company, the reference entity, and
if that company fails to meet its obligations for any of a predetermined set of its debt obligations,
the payout would occur. More specifically, the contract comprises usually a specific class of the
firm’s capital structure, such as the senior unsecured or the junior debt portion of the company,
and references a particular amount of insured debt, the notional amount.
Failure to meet the debt obligations is labeled a credit event. Hence, a credit event triggers a
payment by the protection seller to the insuree equal to the difference between the notional principal
and the loss upon default of the underlying reference obligation, also called the mid-market value.
In general, the occurrence of a credit event must be documented by public notice and notified to the
investor by the protection buyer. Amid the class of qualifying credit events are Bankruptcy, Failure
to pay, Obligation default or acceleration, Repudiation or moratorium (for sovereign entities) and
Restructuring, and represent thus a broader definition of distress than the more general form of
Chapter 7 or Chapter 11 bankruptcy.
The settlement of insurance contracts comes in two forms, it may be either physically or cash
69The exact year of creation is not clear. Tett (2009) refers to the first CDS in 1994, when J.P. Morgan off-loadedits credit risk exposure on Exxon by paying a fee to the European Bank for Reconstruction and Development. Moreimportantly for this review, the author also references a deal between J.P. Morgan and Citibank asset managementon the credit risk of Belgian, Italian and Swedish government bonds around the same time (p.48).
70See Warren Buffett, Berkshire Hathaway Annual Report for 2002, p.13, on line athttp://www.berkshirehathaway.com/2002ar/2002ar.pdf
71Felix Rohatyn, a Wall Street banker employed at Lazard Freres, quoted in Tett (2009).
42

settled. In case of a cash settlement, the monetary exchange involves only the actual incurred losses
and the claimant holds on to the physical piece of paper providing him with a claim on the capital
structure of the sovereign balance sheet. On the other hand, if there is a physical settlement, the
claimant may hand any reference obligation referenced in the contractual agreement to the insurer
and obtains the full notional amount of the underlying contract in return. The insurer can then try
to maximize its resale value in the secondary market. This implies that the claimant literally holds
a Cheapest-to-Deliver option, as he may deliver the least valuable eligible reference obligation.72
This option is particularly relevant in the case of a corporate restructuring, which is why the
restructuring credit event is the most critical. As a consequence, it has been adapted numerous
times and comes in multiple colors and associated contractual clauses. In particular, apart from
Full Restructuring, which allows the delivery of any obligation with a remaining maturity up to
30 years, a contract may simply omit this definition, in which case it is labeled No Restructuring,
or it may qualify as Modified Restructuring or even Modified Modified Restructuring. The former
definition is more prevalent in the U.S. and limits the remaining maturity of the deliverable reference
obligation to a maximum of 30 months, whereas the latter is predominant in Europe, but restricts
the maximum maturity to 60 months. Even after default, prices of bonds usually suffer from
wide market fluctuations, so the question remains as to how the precise value of the insurance
settlement is determined. Markets have converged to a practice where the mid-market value is
obtained through a dealer poll. Whether this pricing mechanism is efficient, remains unclear.
Three recent papers have taken a closer look at this issue for corporate CDS: Helwege et al. (2009),
Chernov et al. (2011) and Gupta and Sundaram (2012).
Credit default swaps are part of the over-the-counter market (OTC). Thus they are not trad-
ing on an organized exchange and remain to a large extent unregulated. The reason for this is a
provision inserted in 2000 in the Commodity Futures Modernization Act by Senator Phil Gramm,
who from 1995 to 2000 presided over the Senate Banking Committee, exempting CDS from regu-
lation by the Commodity Futures Trading Commission (CFTC).73 Nevertheless, guidance on the
legal and institutional details of CDS contracts is given by the International Swaps and Derivatives
Association (ISDA).74 They also act as a non-voting secretary for the Credit Determination Com-
mittee, which deliberates over issues involving Reference Entities traded under Transaction Types
that relate to the relevant region, including Credit Events, CDS Auctions, Succession Events and
other issues. Moreover, ISDA has played a significant role in the growth of the CDS market by
providing a standardized contract in the 1998 (”the ISDA Master Agreement”), which was updated
in 2002, and supplemented with the 2003 Credit Derivatives Definitions (”The Definitions”) and
the July 2009 Supplement. The contractual details of these contracts are crucial, and as usual,
the devil lies in the details, as was recently proved in the restructuring case of Greek government
72See Ammer and Cai (2011) for evidence on sovereign CDS and Jankowitsch et al. (2008) for evidence on corporateCDS. Ammer and Cai (2011) also study the short-run dynamics between sovereign CDS spreads and their cashcounterparts, in a similar fashion as Blanco et al. (2005) did for the corporate market.
73See Nouriel Roubini and Stephen Mihm, Crisis Economics, pp.199.74See www.isda.org.
43

debt. European officials have heavily pushed towards a voluntary restructuring, which would not
be binding on all bondholders. In such a case, it would not be be likely that the agreed deal would
trigger payments under existing CDS contracts.75 The landscape for CDS has further altered with
the implementation of the CDS Big Bang and Small Bang protocols on 8 April and 20 June 2009
for the American and European CDS markets respectively. The biggest changes relate to the stan-
dardization of the coupon structure and the settlement process. Going forward, the Dodd-Frank
Act in the U.S. will likewise have a significant impact on the way these products are traded. The
Inter-continental Exchange (ICE), a subsidiary of the NYSE, is already recording growing mar-
ket share in the clearing process and both academic and political voices call for a move towards
organized exchanges, more transparency and more orderly price dissemination.76
75See Greek Sovereign Debt Q&A, October 31 2011, www.isda.org76Another growing clearing platform for CDS is provided by the CME.
44

Tab
le1:
Sov
erei
gnC
red
itD
efau
ltS
wap
s:N
otio
nal
Am
ount
outs
tan
din
g,M
arke
tV
alu
esan
dC
red
itE
xp
osu
res
(’00
0,00
0,00
0)
This
table
rep
ort
sth
eto
tal
gro
ssnoti
onal
am
ount
outs
tandin
g,
gro
ssm
ark
etva
lues
and
gro
sscr
edit
exp
osu
res
inbillion
USD
of
all
OT
Cder
ivati
ves
and
the
resp
ecti
ve
mark
etsh
are
sin
%.
Panel
Are
port
sst
ati
stic
sfo
rall
OT
Cder
ivati
ves
,all
cred
itder
ivati
ves
(and
thei
rm
ark
etsh
are
in%
of
all
OT
Cder
ivati
ves
),and
the
bre
akdow
nof
cred
itder
ivati
ves
into
single
-nam
eand
mult
i-nam
ein
stru
men
ts(a
nd
thei
rm
ark
etsh
are
in%
of
all
cred
itder
ivati
ves
).P
anel
Bre
port
sst
ati
stic
sfo
rso
ver
eign
cred
itder
ivati
ves
.P
anel
Csh
ows
the
counte
rpart
ies
of
sover
eign
single
-nam
ecr
edit
def
ault
swaps,
and
Panel
Ddis
pla
ys
the
loca
tion
of
counte
rpart
yfo
rall
OT
Ccr
edit
der
ivati
ves
.P
anel
Edocu
men
tsth
eto
tal
noti
onal
am
ount
outs
tandin
gfo
rall
OT
Ccr
edit
der
ivati
ves
by
rem
ain
ing
tim
eto
matu
rity
and
thei
rre
spec
tive
mark
etsh
are
s.T
he
rem
ain
ing
contr
act
matu
rity
isdet
erm
ined
by
the
dff
eren
ceb
etw
een
the
rep
ort
ing
date
and
the
expir
ydate
of
the
contr
act
and
not
by
the
date
of
exec
uti
on
of
the
dea
l.D
ata
on
tota
lnoti
onal
am
ount
outs
tandin
gare
show
non
anet
basi
s,th
at
istr
ansa
ctio
ns
bet
wee
nre
port
ing
dea
lers
are
rep
ort
edonly
once
.Sourc
e:w
ww
.bis
.org
.
Pan
elA
:O
TC
Der
ivati
ves
-N
oti
on
al
Am
ou
nt
ou
tsta
ndin
g,
Mark
etV
alu
esan
dC
red
itE
xp
osu
res
(’000,0
00,0
00)
Period
All
OTC
Gross
MV
Credit
Derivatives
(%)
Gross
MV
Gross
CE
Sin
gle
Nam
e(%
)SN
Gross
MV
Multi-Nam
e(%
)M
NGross
MV
2004-H
2258
628
9405
6396
(2.4
7)
133
-5
117
(80.0
0)
112
1279
(20.0
0)
22
2007-H
2585
932
15
803
58
244
(9.9
4)
2020
-32
486
(55.7
8)
1158
25
757
(44.2
2)
862
2011-H
1706
884
19
518
32
409
(4.5
8)
1345
375
18
105
(55.8
6)
854
14
305
(44.1
4)
490
2011-H
2647
777
27
278
28
626
(4.4
2)
1586
417
16
865
(58.9
1)
958
11
761
(41.0
9)
628
2012-H
1638
928
25
392
26
931
(4.2
1)
1187
310
15
566
(57.8
0)
715
11
364
(42.2
0)
472
Pan
elB
:S
over
eign
Cre
dit
Der
ivati
ves
-N
oti
on
al
Am
ou
nt
ou
tsta
nd
ing
(’000,0
00,0
00)
Period
Credit
Derivatives
(%)
Sov.All
(%)
Sov.Sin
gle
Nam
e(%
)Sov.M
ulti-Nam
e(%
)2011-H
132
409
(4.5
8)
2908
(8.9
7)
2749
(8.4
8)
159
(0.4
9)
2011-H
228
626
(4.4
2)
3039
(10.6
2)
2928
(10.2
3)
111
(0.3
9)
2012-H
126
931
(4.2
1)
2986
(11.0
9)
2848
(10.5
8)
138
(0.5
1)
Pan
elC
:C
red
itD
eriv
ati
ves
-M
atu
rity
Str
uct
ure
(’000,0
00,0
00)
Period
Tota
l1y
orless
(%)
Over1y
up
to5y
(%)
Over5
years
(%)
2004-H
26
395.7
44
491.2
70
(7.6
8)
4659.5
21
(72.8
5)
1243.7
78
(19.4
5)
2009-H
232
692.6
83
3432.4
29
(10.5
0)
21
307.7
87
(65.1
8)
7952.4
41
(24.3
2)
2012-H
126
930.5
72
5614.8
08
(20.8
5)
18
248.1
84
(67.7
6)
3067.6
09
(11.3
9)
Pan
elD
:C
ou
nte
rPart
ies
of
Sin
gle
-Nam
eS
over
eign
Cre
dit
Def
au
ltS
wap
s-
(’000,0
00,0
00)
2010-H
12011-H
12012-H
1All
Counte
rparties
2393.5
80
2749.2
59
2848.2
32
Reporting
Dealers
1320.0
39
1836.8
89
2026.0
31
(Fra
ctio
n)
(55.1
7)
(66.8
1)
(71.1
3)
Oth
erFin
ancialIn
stitutions
1017.1
22
891.4
83
801.5
72
(Fra
ctio
n)
(42.5
1)
(32.4
3)
(28.1
4)
Cen
tral
Cou
nte
rpart
ies
-2.0
75
116.4
20
Ban
ks
an
dS
ecu
rity
Fir
ms
828.0
23
592.1
94
378.0
90
Insu
ran
ce&
Fin
.G
uara
nty
Fir
ms
8.8
58
14.6
88
14.3
99
SP
Vs
7.9
05
18.1
06
11.4
87
Hed
ge
Fu
nd
s88.5
19
145.1
78
154.0
13
Oth
erF
inan
cial
Cu
stom
ers
83.8
17
119.2
41
127.1
61
Non-F
inancialIn
stitutions
55.4
29
20.8
85
20.6
29
(Fra
ctio
n)
(2.3
2)
(0.7
6)
(0.7
2)
Pan
elE
:C
red
itD
eriv
ati
ves
-L
oca
tion
of
Cou
nte
rPart
y(’
000,0
00,0
00)
Period
Tota
lHom
eCountry
(%)
Abroad
(%)
2011-H
132
409.4
44
5928.4
21
(18.3
0)
26
481.0
23
(81.7
1)
2011-H
228
626.4
07
5540.3
12
(19.3
5)
23
086.0
95
(80.6
5)
2012-H
126
930.5
72
5358.8
31
(19.9
0)
21
571.7
41
(80.1
0)
45

Tab
le2:
Su
mm
ary
Sta
tist
ics
The
table
rep
ort
ssu
mm
ary
stati
stic
sfo
rth
eC
DS
term
stru
cture
of
38
sover
eign
countr
ies
over
the
sam
ple
per
iod
May
9th
,2003
unti
lA
ugust
19th
,2010.
All
CD
Spri
ces
are
mid
com
posi
tequote
sand
USD
den
om
inate
d.
Rati
ng
class
ifica
tion
isach
ieved
by
ass
ignin
gan
inte
ger
valu
era
ngin
gfr
om
1(A
AA
)to
21
(C)
at
each
date
toea
chco
untr
y.T
he
equally
wei
ghte
dhis
tori
cal
aver
age
isth
enro
unded
toth
enea
rest
inte
ger
,w
hic
his
use
das
the
final
rati
ng
cate
gori
zati
on.
The
Mea
n(M
edia
n)
spre
ad
isca
lcula
ted
as
the
his
tori
cal
mea
n(m
edia
n)
spre
ad,
wher
eat
each
date
,all
obse
rvati
ons
wit
hin
agiv
enra
ting
cate
gory
are
aggre
gate
d
by
takin
gth
em
ean.
Sim
ilarl
y,th
est
andard
dev
iati
on
isca
lcula
ted
as
the
standard
dev
iati
on
of
the
data
seri
esaggre
gate
dat
each
date
wit
hin
agiv
enra
ting
cate
gory
.A
C1
isth
efirs
t-ord
erauto
corr
elati
on
coeffi
cien
t.Sourc
e:M
ark
it
AAA
12
35
710
AA
12
35
710
Mean
15
17
19
23
24
26
Mean
24
27
31
38
41
45
Median
22
34
57
Median
34
58
12
16
Min
imum
00
11
22
Min
imum
01
12
23
Maxim
um
304
301
293
274
270
266
Maxim
um
557
536
499
461
433
410
Volatility
26
28
30
34
34
33
Volatility
36
38
40
44
44
43
Skewness
22
22
22
Skewness
22
22
22
Kurto
sis
66
55
44
Kurto
sis
66
55
44
AC1
0.9
940
0.9
949
0.9
970
0.9
975
0.9
975
0.9
974
AC1
0.9
969
0.9
972
0.9
975
0.9
978
0.9
978
0.9
977
A1
23
57
10
BBB
12
35
710
Mean
49
55
61
71
76
81
Mean
77
95
109
132
143
155
Median
12
18
24
34
41
49
Median
33
54
74
106
123
139
Min
imum
12
35
56
Min
imum
33
58
11
14
Maxim
um
1235
1172
1127
1015
952
893
Maxim
um
1190
1100
1110
1106
1096
1081
Volatility
69
72
74
77
75
73
Volatility
105
106
105
103
99
96
Skewness
22
22
22
Skewness
32
22
22
Kurto
sis
65
55
55
Kurto
sis
98
77
66
AC1
0.9
967
0.9
970
0.9
971
0.9
974
0.9
973
0.9
972
AC1
0.9
976
0.9
974
0.9
970
0.9
967
0.9
966
0.9
964
BB
12
35
710
B1
23
57
10
Mean
110
157
196
255
281
305
Mean
433
484
517
564
574
599
Median
78
115
146
197
225
250
Median
328
403
455
517
538
562
Min
imum
15
71
174
72
Min
imum
19
34
55
117
140
186
Maxim
um
822
845
903
1032
1036
1039
Maxim
um
3654
3504
3400
3234
3111
3053
Volatility
92
111
125
138
138
138
Volatility
371
362
350
328
303
286
Skewness
21
11
11
Skewness
22
22
22
Kurto
sis
74
33
33
Kurto
sis
76
66
76
AC1
0.9
979
0.9
977
0.9
976
0.9
974
0.9
972
0.9
971
AC1
0.9
901
0.9
916
0.9
926
0.9
927
0.9
889
0.9
928
46

Table 3: Slope of the CDS Spread Curve
Summary statistics by groups of the 5-year spread level. For each group and maturity, the average spread level andslope has been calculated across time and entities. The groups are sorted according to the 5-year spread level. Source:Markit
Average CDS premium (bps) Average Slope (bps)Group 1y 2y 3y 5y 7y 10y 10y-1y 3y-1y 10y-3y #curves #entities
2 (101-200 bps) 66 88 107 143 160 177 111 41 69 14 012 353 (201-300 bps) 139 172 201 245 263 279 141 62 79 5 995 344 (301-400 bps) 209 256 295 347 367 386 176 86 91 3 711 275 (401-500 bps) 273 334 383 447 468 490 217 111 106 2 444 246 (501-600 bps) 362 433 484 542 557 572 210 122 88 1 137 217 (601-700 bps) 503 567 603 642 633 661 158 100 58 645 178 (701-800 bps) 617 693 725 745 713 741 125 108 16 346 109 (801-900 bps) 622 759 812 850 846 840 218 189 29 230 810 (901-1000 bps) 724 845 894 940 932 919 195 170 25 148 611 (1001-1100 bps) 1 008 1 051 1 052 1 043 1 002 964 -44 44 -87 96 412 (1101-1200 bps) 1 075 1 142 1 149 1 145 1 095 1 052 -23 74 -98 70 213 (1201-1300 bps) 1 207 1 256 1 257 1 251 1 195 1 148 -60 50 -109 48 114 (1301-1400 bps) 1 347 1 382 1 376 1 363 1 309 1 260 -87 29 -116 33 115 (1401-1500 bps) 1 357 1 410 1 425 1 444 1 395 1 349 -8 67 -75 69 116 (1501-3234 bps) 2 369 2 362 2 334 2 281 2 213 2 146 -223 -35 -188 155 1
47
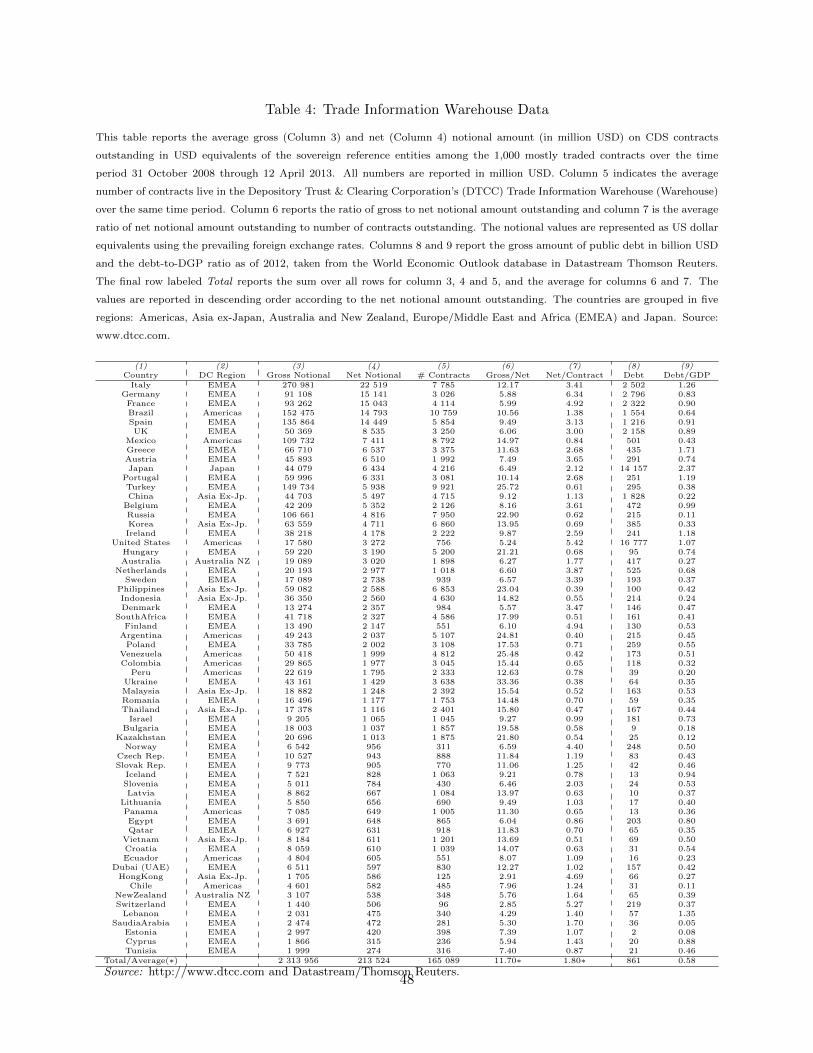
Table 4: Trade Information Warehouse Data
This table reports the average gross (Column 3) and net (Column 4) notional amount (in million USD) on CDS contracts
outstanding in USD equivalents of the sovereign reference entities among the 1,000 mostly traded contracts over the time
period 31 October 2008 through 12 April 2013. All numbers are reported in million USD. Column 5 indicates the average
number of contracts live in the Depository Trust & Clearing Corporation’s (DTCC) Trade Information Warehouse (Warehouse)
over the same time period. Column 6 reports the ratio of gross to net notional amount outstanding and column 7 is the average
ratio of net notional amount outstanding to number of contracts outstanding. The notional values are represented as US dollar
equivalents using the prevailing foreign exchange rates. Columns 8 and 9 report the gross amount of public debt in billion USD
and the debt-to-DGP ratio as of 2012, taken from the World Economic Outlook database in Datastream Thomson Reuters.
The final row labeled Total reports the sum over all rows for column 3, 4 and 5, and the average for columns 6 and 7. The
values are reported in descending order according to the net notional amount outstanding. The countries are grouped in five
regions: Americas, Asia ex-Japan, Australia and New Zealand, Europe/Middle East and Africa (EMEA) and Japan. Source:
www.dtcc.com.
(1) (2) (3) (4) (5) (6) (7) (8) (9)Country DC Region Gross Notional Net Notional # Contracts Gross/Net Net/Contract Debt Debt/GDPItaly EMEA 270 981 22 519 7 785 12.17 3.41 2 502 1.26
Germany EMEA 91 108 15 141 3 026 5.88 6.34 2 796 0.83France EMEA 93 262 15 043 4 114 5.99 4.92 2 322 0.90Brazil Americas 152 475 14 793 10 759 10.56 1.38 1 554 0.64Spain EMEA 135 864 14 449 5 854 9.49 3.13 1 216 0.91UK EMEA 50 369 8 535 3 250 6.06 3.00 2 158 0.89
Mexico Americas 109 732 7 411 8 792 14.97 0.84 501 0.43Greece EMEA 66 710 6 537 3 375 11.63 2.68 435 1.71Austria EMEA 45 893 6 510 1 992 7.49 3.65 291 0.74Japan Japan 44 079 6 434 4 216 6.49 2.12 14 157 2.37
Portugal EMEA 59 996 6 331 3 081 10.14 2.68 251 1.19Turkey EMEA 149 734 5 938 9 921 25.72 0.61 295 0.38China Asia Ex-Jp. 44 703 5 497 4 715 9.12 1.13 1 828 0.22
Belgium EMEA 42 209 5 352 2 126 8.16 3.61 472 0.99Russia EMEA 106 661 4 816 7 950 22.90 0.62 215 0.11Korea Asia Ex-Jp. 63 559 4 711 6 860 13.95 0.69 385 0.33Ireland EMEA 38 218 4 178 2 222 9.87 2.59 241 1.18
United States Americas 17 580 3 272 756 5.24 5.42 16 777 1.07Hungary EMEA 59 220 3 190 5 200 21.21 0.68 95 0.74Australia Australia NZ 19 089 3 020 1 898 6.27 1.77 417 0.27
Netherlands EMEA 20 193 2 977 1 018 6.60 3.87 525 0.68Sweden EMEA 17 089 2 738 939 6.57 3.39 193 0.37
Philippines Asia Ex-Jp. 59 082 2 588 6 853 23.04 0.39 100 0.42Indonesia Asia Ex-Jp. 36 350 2 560 4 630 14.82 0.55 214 0.24Denmark EMEA 13 274 2 357 984 5.57 3.47 146 0.47
SouthAfrica EMEA 41 718 2 327 4 586 17.99 0.51 161 0.41Finland EMEA 13 490 2 147 551 6.10 4.94 130 0.53
Argentina Americas 49 243 2 037 5 107 24.81 0.40 215 0.45Poland EMEA 33 785 2 002 3 108 17.53 0.71 259 0.55
Venezuela Americas 50 418 1 999 4 812 25.48 0.42 173 0.51Colombia Americas 29 865 1 977 3 045 15.44 0.65 118 0.32
Peru Americas 22 619 1 795 2 333 12.63 0.78 39 0.20Ukraine EMEA 43 161 1 429 3 638 33.36 0.38 64 0.35Malaysia Asia Ex-Jp. 18 882 1 248 2 392 15.54 0.52 163 0.53Romania EMEA 16 496 1 177 1 753 14.48 0.70 59 0.35Thailand Asia Ex-Jp. 17 378 1 116 2 401 15.80 0.47 167 0.44Israel EMEA 9 205 1 065 1 045 9.27 0.99 181 0.73
Bulgaria EMEA 18 003 1 037 1 857 19.58 0.58 9 0.18Kazakhstan EMEA 20 696 1 013 1 875 21.80 0.54 25 0.12
Norway EMEA 6 542 956 311 6.59 4.40 248 0.50Czech Rep. EMEA 10 527 943 888 11.84 1.19 83 0.43Slovak Rep. EMEA 9 773 905 770 11.06 1.25 42 0.46
Iceland EMEA 7 521 828 1 063 9.21 0.78 13 0.94Slovenia EMEA 5 011 784 430 6.46 2.03 24 0.53Latvia EMEA 8 862 667 1 084 13.97 0.63 10 0.37
Lithuania EMEA 5 850 656 690 9.49 1.03 17 0.40Panama Americas 7 085 649 1 005 11.30 0.65 13 0.36Egypt EMEA 3 691 648 865 6.04 0.86 203 0.80Qatar EMEA 6 927 631 918 11.83 0.70 65 0.35
Vietnam Asia Ex-Jp. 8 184 611 1 201 13.69 0.51 69 0.50Croatia EMEA 8 059 610 1 039 14.07 0.63 31 0.54Ecuador Americas 4 804 605 551 8.07 1.09 16 0.23
Dubai (UAE) EMEA 6 511 597 830 12.27 1.02 157 0.42HongKong Asia Ex-Jp. 1 705 586 125 2.91 4.69 66 0.27
Chile Americas 4 601 582 485 7.96 1.24 31 0.11NewZealand Australia NZ 3 107 538 348 5.76 1.64 65 0.39Switzerland EMEA 1 440 506 96 2.85 5.27 219 0.37Lebanon EMEA 2 031 475 340 4.29 1.40 57 1.35
SaudiaArabia EMEA 2 474 472 281 5.30 1.70 36 0.05Estonia EMEA 2 997 420 398 7.39 1.07 2 0.08Cyprus EMEA 1 866 315 236 5.94 1.43 20 0.88Tunisia EMEA 1 999 274 316 7.40 0.87 21 0.46
Total/Average(∗) 2 313 956 213 524 165 089 11.70∗ 1.80∗ 861 0.58
Source: http://www.dtcc.com and Datastream/Thomson Reuters.48

Tab
le5:
Tra
de
Info
rmat
ion
War
ehou
seD
ata
Th
ista
ble
rep
ort
sth
eaver
age
yea
rly
gro
ss(P
an
elA
)an
dn
et(P
an
elB
)n
oti
on
al
am
ou
nt
on
CD
Sco
ntr
act
sou
tsta
nd
ing
inU
SD
equ
ivale
nts
of
the
U.S
.so
ver
eign
refe
ren
ce
enti
ties
am
on
gth
e1,0
00
most
lytr
ad
edco
ntr
act
sas
of
31
Dec
emb
er2012.
All
nu
mb
ers
are
rep
ort
edin
million
US
D.
Pan
elC
ind
icate
sth
era
tio
of
gro
ssto
net
noti
on
al
am
ou
nt
ou
tsta
nd
ing
an
dP
an
elD
list
sth
eaver
age
yea
rly
nu
mb
erof
contr
act
slive
inth
eD
eposi
tory
Tru
st&
Cle
ari
ng
Corp
ora
tion
’s(D
TC
C)
Tra
de
Info
rmati
on
Ware
hou
se
(Ware
hou
se).
Pan
elE
list
sth
en
etn
oti
on
al
am
ou
nt
on
CD
Sco
ntr
act
sou
tsta
nd
ing
inm
illion
US
Deq
uiv
ale
nts
toth
eaver
age
yea
rly
nu
mb
erof
contr
act
s.T
he
noti
on
al
valu
esare
rep
rese
nte
das
US
doll
ar
equ
ivale
nts
usi
ng
the
pre
vailin
gfo
reig
nex
chan
ge
rate
s.T
he
sam
ple
per
iod
start
son
31
Oct
ob
er2008
an
den
ds
on
31
Dec
emb
er2012.
Th
evalu
esare
rep
ort
edin
des
cen
din
gord
eracc
ord
ing
toth
eso
ver
eign
’sn
am
e.S
ou
rce:
ww
w.d
tcc.
com
.
PanelA:Gro
ssNotional(’000,000)
PanelB:NetNotional(’000,000)
PanelC:Ratio
Gro
ss/Net
Country
2008
2009
2010
2011
2012
Avera
ge
2008
2009
2010
2011
2012
Avera
ge
2008
2009
2010
2011
2012
Avera
ge
Californ
ia.
4253
7928
9994
8831
7803
.698
885
981
787
840
.6.01
9.20
10.22
11.34
9.24
Florida
.2
688
3855
4651
4412
4030
.298
296
263
284
284
.9.49
13.31
17.82
15.73
14.57
Illinois
..
2061
3146
4078
3213
..
329
608
493
494
..
6.28
5.27
8.36
6.68
New
Jersey
.1
989
3075
4349
4234
3789
.516
440
466
353
424
.3.86
7.42
9.42
12.02
9.33
New
York
.2
333
2922
3317
3289
3021
.282
348
432
370
365
.8.32
8.49
7.70
8.89
8.35
Texas
.1
938
2363
2710
2323
2422
.394
221
186
219
224
.4.95
13.29
14.64
10.87
12.28
New
York
City
.3
004
4423
5697
5317
4818
.756
528
370
439
493
.4.05
8.87
16.06
12.56
11.20
Massachuse
tts
..
1682
1697
1628
1677
..
171
175
184
177
..
9.87
9.70
8.87
9.48
United
Sta
tes
4537
8716
13
156
25
581
23
262
17
115
1296
1987
2441
4575
4406
3263
3.51
4.32
5.43
5.60
5.35
5.11
PanelD:#
Contracts
PanelE:Ratio
NetNotional/Contracts
(’000,000)
Country
2008
2009
2010
2011
2012
Avera
ge
2008
2009
2010
2011
2012
Avera
ge
Californ
ia.
232
599
975
867
674
.3.37
1.59
1.01
0.91
1.69
Florida
.161
274
319
317
279
.1.97
1.10
0.82
0.90
1.12
Illinois
..
152
409
451
358
..
2.19
1.48
1.09
1.52
New
Jersey
.120
215
395
354
311
.4.32
2.33
1.18
1.00
1.64
New
York
.104
194
259
217
201
.2.71
1.87
1.68
1.71
1.93
Texas
.81
96
155
151
129
.4.92
2.39
1.20
1.46
1.95
New
York
City
.171
262
357
362
303
.4.78
2.07
1.04
1.21
1.95
Massachuse
tts
..
112
115
110
114
..
1.52
1.52
1.67
1.56
United
Sta
tes
124
241
479
1114
1226
737
10.43
8.47
5.09
4.29
3.60
5.57
Source:
htt
p:/
/w
ww
.dtc
c.co
m
49

Fig
ure
1:T
he
Slo
pe
ofth
eC
red
itS
pre
adC
urv
e
Gra
ph
1a
plo
tsth
efr
act
ion
of
dec
reasi
ng
CD
Spair
sas
afu
nct
ion
of
the
CD
Sle
vel
insl
idin
gw
indow
sof
400
basi
sp
oin
tsfo
rth
ese
gm
ents
3y-1
y,10y-3
yand
10y-1
y.T
he
72,2
00
curv
esare
sort
edby
the
5-y
ear
pre
miu
m.
Sourc
e:M
ark
it.
For
inst
ance
,th
ele
ft-m
ost
poin
tsplo
tsth
efr
act
ion
of
dec
reasi
ng
CD
Spair
s
again
stth
eav
erage
CD
Spre
miu
mam
ong
the
400
curv
esw
ith
the
low
est
5-y
ear
spre
ad
level
.T
he
nex
tp
oin
tdoes
the
sam
efo
rcu
rves
2to
401,
and
soon,
up
toth
eri
ght-
most
poin
tre
pre
senti
ng
curv
es71,8
01
to72,2
00.
Fig
ure
1b
show
sth
eav
erage
slop
ele
vel
inbasi
sp
oin
tsas
afu
nct
ion
of
CD
Sle
vel
,in
slid
ing
win
dow
sof
400
curv
es.
Sourc
e:M
ark
it.
(a)
(b)
50

Fig
ure
2:
Co-
Mov
emen
tof
Sov
erei
gnC
DS
Sp
read
san
dR
isk
Ave
rsio
n
Gra
ph
2a
illu
stra
tes
the
his
tori
cal
5-y
ear
CD
Ssp
read
for
38
countr
ies
spannin
gfive
geo
gra
phic
al
regio
ns
over
the
tim
ep
erio
dM
ay9th
,2003
unti
lA
ugust
19th
,2010.
Gra
ph
2b
plo
tsth
ehis
tori
cal
aver
age
5-y
ear
CD
Ssp
read
of
the
38
countr
ies
inth
esa
mple
over
the
sam
eti
me
per
iod.
This
plo
tis
insp
ired
by
the
illu
stra
tion
inP
an
and
Sin
gle
ton
(2008).
Sourc
e:M
ark
it.
(a)
05/2
003
02/2
004
11/2
004
08/2
005
06/2
006
03/2
007
12/2
007
09/2
008
06/2
009
04/2
010
0
200
400
600
800
1000
1200
Spread (basis points)
5-ye
ar S
over
eign
CD
S Sp
read
s (S
ourc
e: M
arki
t)
(b)
05/2
003
02/2
004
11/2
004
08/2
005
06/2
006
03/2
007
12/2
007
09/2
008
06/2
009
04/2
010
050100
150
200
250
300
350
400
450
500
Spread (basis points)
5-ye
ar S
over
eign
CD
S Sp
read
- Sa
mpl
e M
ean
over
38
coun
trie
s (S
ourc
e: M
arki
t)
Unw
indi
ng o
f car
ry tr
ades
due
to c
once
rns
onU
.S. M
onet
ary
polic
y
GM
& F
ord
dow
n- g
rade
d to
junk
Unw
indi
ng o
fca
rry
trad
es
Bea
r Ste
arns
Bai
lout
Lehm
an B
roth
ers
Ban
krup
tcy
Euro
zone
coun
trie
s an
dIM
F ag
ree
to€1
10 b
illio
nba
ilout
for
Gre
ece
51

Figure 3: Trade Information Warehouse Data
The following graphs plot the logarithm of the average yearly gross notional amount of CDS outstanding in million
USD (3a), the logarithm of the average yearly net notional amount of CDS outstanding in million USD (3b), the
logarithm of the average yearly number of CDS contracts outstanding (3c) and the logarithm of the average yearly
CDS spread (3d) by the yearly gross amount of Government debt (in billion USD). The CDS gross and net notional
amount outstanding as well as the number of contracts is taken from the 1,000 mostly traded reference entities in
the DTCC database. CDS spreads are from Thomson Reuters Datastream and the gross amount of government debt
is from World Economic Outlook database. The notional values are represented as US dollar equivalents using the
prevailing foreign exchange rates. Source: www.dtcc.com.
(a) (b)
(c) (d)
52