Embed Size (px)
Citation preview

Sovereign Bancorp, Inc.
Keefe, Bruyette & WoodsRegional Bank Conference
February 28, 2008

2
Forward-Looking Statements
This presentation contains statements of Sovereign Bancorp, Inc.’s (the “Company”) strategies, plans and objectives, estimates of future operating results for Sovereign Bancorp, Inc. as well as estimates of financial condition, operating efficiencies, revenue creation and shareholder value
These statements and estimates constitute forward-looking statements (within the meaning of the Private Securities Litigation Reform Act of 1995) which involve significant risks and uncertainties. Actual results may differ materially from the results discussed in these forward-looking statements
Factors that might cause such a difference include, but are not limited to: general economic conditions, changes in interest rates, deposit flows, loan demand, real estate values, and competition; changes in accounting principles, policies, or guidelines; changes in legislation or regulation; and other economic, competitive, governmental, regulatory, and other technological factors affecting the Company’s operations, pricing, products and services
We refer you to our reports filed unto the SEC under the Securities Exchange Act of 1934 for a more detailed explanation of the factors and the risks facing our business

Overview of Sovereign

4
Investment Considerations
Sovereign is the last independent franchise in Northeastern United States
Focused on improving core operating performance
Diversified and stable balance sheet
Management team focused on managing risk and servicing customers

5
An Exceptional Franchise Serving the Northeastern United States 19th largest bank in
U.S. with $85 billion in assets at December
31, 2007
750 offices& over 2,300 ATM’s
Approx. 12,000 team members
Source: SNL DataSource. Market share as of June 2007.
5 Largest MSA’s in Northeast U.S.No. of SOV Mkt SOVOffices Share Rank
New York 208 1.95% 11
Philadelphia 82 6.90% 6
Boston 165 8.58% 3
Providence 56 10.57% 3
Hartford 26 4.68% 6

6
Top Northeastern U.S. Banks and Thrifts by Deposits
Rank Institution# of
BranchesDeposits1
($ billions)Market
Share (%)
1 Bank of America Corp. 2 1,703 155.1 10.7
2 JPMorgan Chase & Co. 3 863 133.8 9.2
3 Wachovia Corp. 907 89.2 6.2
4 Royal Bank of Scotland Group 1,165 79.8 5.5
5 Toronto-Dominion Bank 1,040 71.4 4.9
6 PNC Financial Services Group 1,015 69.2 4.8
7 Citigroup Inc. 360 67.6 4.7
8 Sovereign Bancorp, Inc. 748 49.1 3.4
9 HSBC Holdings plc 4 425 48.7 3.4
10 Capital One Financial Corp. 360 39.0 2.7
11 M&T Bank Corp. 688 35.0 2.4
12 Washington Mutual Inc. 328 19.2 1.3
13 KeyCorp 306 18.4 1.3
14 Bank of New York Mellon Corp. 5 33 17.7 1.2
15 New York Community Bancorp 220 15.2 1.0
Top 15 Total 10,161 908.2 62.8
Total 20,512 1,447.0 100.0
Source: SNL Financial, FactSet. Market data ad of December 18, 20071 Deposit data as of June 30, 2007, pro forma ownership as of 12/18/07. 2,3,4,5 Excludes corporate deposits at main branch of $17.3 billion, $126.0 billion, $22.2 billion, and $29.3 billion, respectively

7
Sovereign’s Business Model
Increased emphasis on core commercial and consumer franchise-based businesses; Sovereign does not have any lending units whose principal focus is on sub-prime lending
Core Commercial: Commercial Real Estate Mini Perm Asset-based Lending C&I Lending Business Banking
• Branch Business Banking• SBA
Centralized strategy with a de-centralized delivery structure Community Banking delivery model, each with a Market CEO Local decision making by experienced commercial/retail bankers Centralized commercial and consumer leadership ensures
consistent product, pricing, policy and performance
Core Consumer (within footprint): Home Equity Lending Residential Mortgage Retail Banking Automobile Lending

8
Strategic Alliances
CVS/Cardtronics Over 1,100 ATMs installed to date Over 500,000 transactions monthly
First Data Corp. Sovereign Merchant Services Dedicated sales force in excess of 100 44,000 processing merchants
ADP Sovereign Payroll Services Dedicated sales force of approximately 225
American Express – OPEN Customer Rewards Program Official card issuer

Improving Productivity

10
Expense Reduction Initiative
Primary focus on: Functional redundancies and operating inefficiencies Products/business lines not meeting profit or strategic goals Optimization of retail delivery channels
Expense reduction initiatives were completed on time and slightly better than plan, eliminated more than $100 million of annual operating expenses
Partially offset by re-invested into the following: Technology Branch infrastructure Marketing
Continuing to search for additional ways to cut costs and operate more efficiently in 2008

11
Customer First Initiative During 2007, several steps were taken to rationalize product
set Rolled out customer switching services across franchise Upgraded commercial online banking system Streamlined retail product set by half in first quarter – 10
checking products to 5 Converted over 400,000 grandfathered accounts to increase
balance retention
Optimize sales process – Customer First Initiative During the fourth quarter of 2007, rolled out pilot program to 25
branches; results were encouraging Franchise wide roll-out in 2008 Program focused on “know your customer” – approximately 85%
of deposits will be portfolio managed Designed to improve customer retention and cross-sell
opportunities

Capital Position and Quality of Earnings

13
Multi-family5.1%
Other Comm'l Loans2.1%
Auto8.5%
Other Consumer
Loans0.4%
Investment Securities
16.6%
Home Equity7.4%
Residential Mortgages
16.7%
C&I15.0%
Comm'l Real Estate14.8%
Diversified and Stable Asset Base
Average balances as percentage of assets
2007 Loan Sales:$3.3 billion correspondent home equity loans$1.0 billion purchased residential mortgages
$1.5 billion purchased Alt-A mortgages$1.3 billion multi-family loans
Total Commercial Loans 52.7% of LoansTotal Consumer Loans 47.3% of Loans
December 31, 2007

14
Risk Profile of Loan Portfolio
($ in millions) Balance% of
LoansNPLs / Loans
NCOs / Average Loans1
Total Past
Dues / Loans
Allowance / Loans
CRE and multi-family
$16,553 29% 0.41% 0.11% 0.43% 1.23%
C&I and other commercial
14,360 25% 0.59% 0.39% 0.48% 1.58%
Residential mortgages
13,341 23% 0.68% 0.11% 2.71% .29%
Home equity 6,197 11% 0.91% 0.25% 0.55% 1.28%2
Auto loans 7,029 12% 0.02% 1.96% 3.05% 2.05%
Total loans $57,780 100% 0.53% 0.42% 1.41% 1.28%
Data as of December 31, 20071 Annualized2 Includes $50 million of reserves on correspondent home equity loan portfolio
15
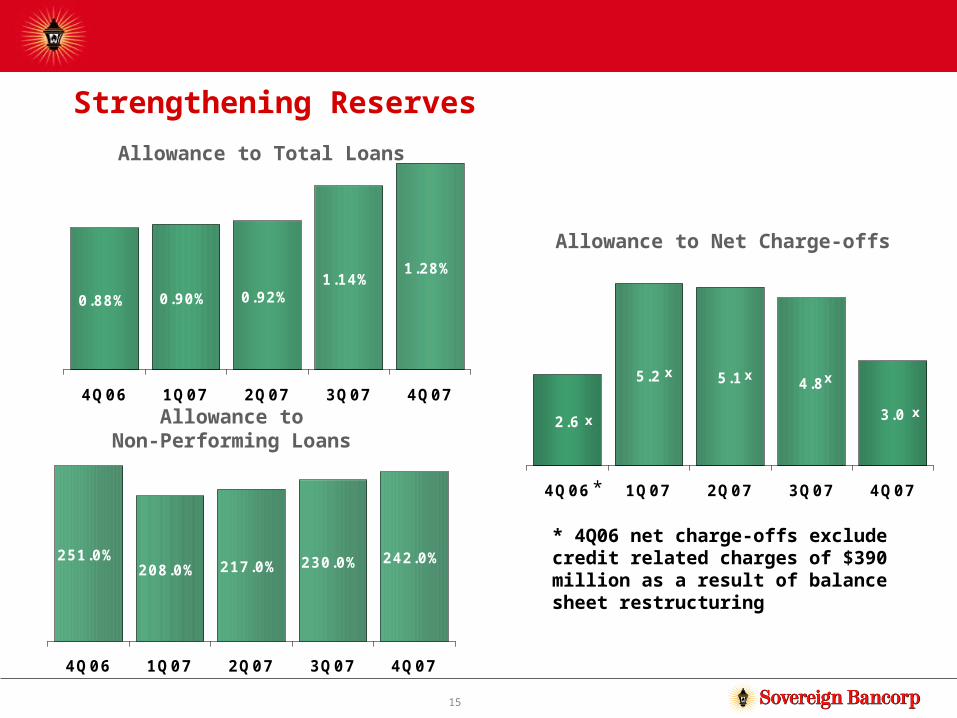
Strengthening Reserves
0.88% 0.90% 0.92%
1.28%1.14%
4Q06 1Q07 2Q07 3Q07 4Q07
Allowance to Total Loans
2.6
5.2 5.1
3.0
4.8
4Q06 1Q07 2Q07 3Q07 4Q07
Allowance to Net Charge-offs
251.0%208.0% 217.0%
242.0%230.0%
4Q06 1Q07 2Q07 3Q07 4Q07
Allowance toNon-Performing Loans
* 4Q06 net charge-offs exclude credit related charges of $390 million as a result of balance sheet restructuring
*
x
x x x
x

16
Geographic Diversity of Loan Portfolio
In-footprint Out-of-footprint
$ in millions BalanceNew
EnglandMid-
Atlantic1 CA FL Other
CRE and multi-family
$16,553 22% 66% 2% 4% 5%
C&I and other commercial
14,360 35% 44% 2% 4% 14%
Residential mortgages
13,341 32% 40% 8% 3% 18%
Home equity 6,197 36% 55% 1% 1% 6%
Auto loans 7,029 38% 24% 0% 15% 24%
Total loans $57,780 30% 50% 3% 5% 12%
Based on outstanding balances as of December 31, 20071 Includes New York
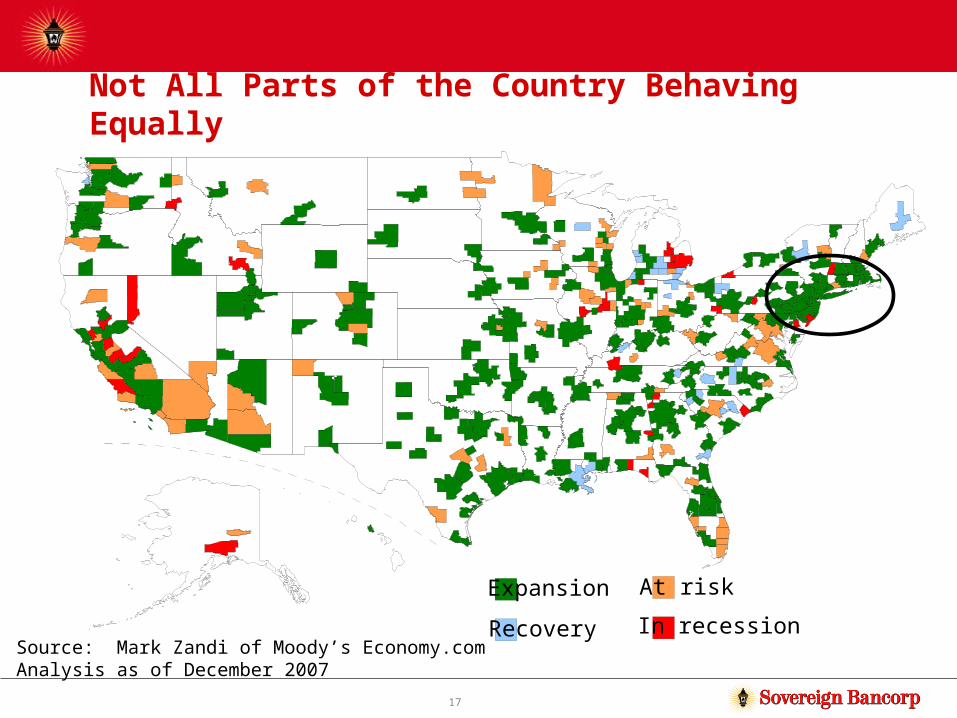
17
Not All Parts of the Country Behaving Equally
Expansion
Recovery
At risk
In recessionSource: Mark Zandi of Moody’s Economy.comAnalysis as of December 2007

18
DDA13%
NOW11%
Repo6%
Savings8%
Money Market21%
CD's24%
Wholesale18%
Average balances
December 31, 2007
High-Quality Deposit Funding
Total Deposits $50.2 billionCore Deposits $29.0 billion

19
Inexpensive Source of Funding
($ in millions)Average Balance
% of Average Balance
Rate
Demand deposit accounts $6,399 12.8% 0.00%
NOW accounts 5,298 10.6% 1.06%
NOW accounts – government & wholesale 3,998 8.0% 4.76%
Customer repurchase agreements 2,878 5.7% 3.69%
Savings accounts 3,890 7.8% 0.67%
Money market accounts 10,531 21.0% 3.58%
Money market accounts – government & wholesale
1,768 3.5% 4.77%
Time deposits 11,955 23.8% 4.70%
Time deposits – wholesale 3,466 6.9% 4.84%
Total deposits $50,183 100.0% 3.13%
Wholesale deposits $9,232 18.4% 4.79%
Total deposits excluding wholesale $40,951 81.6% 2.75%
20
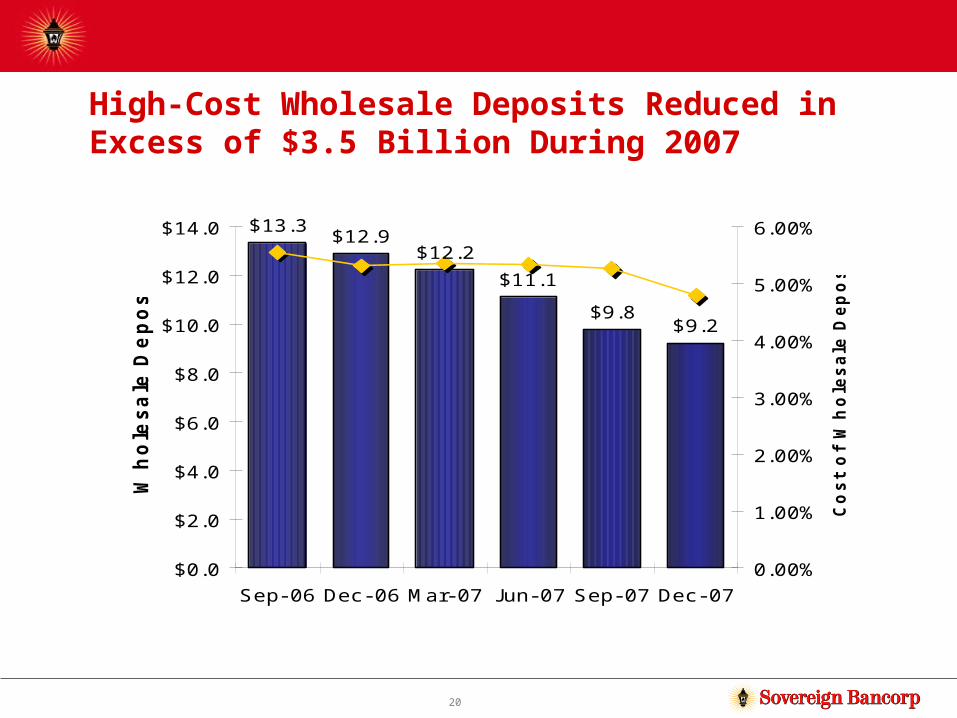
High-Cost Wholesale Deposits Reduced in Excess of $3.5 Billion During 2007
$ in billions
$13.3$12.9
$12.2
$11.1
$9.8$9.2
$0.0
$2.0
$4.0
$6.0
$8.0
$10.0
$12.0
$14.0
Sep- 06 Dec- 06 Mar- 07 J un- 07 Sep- 07 Dec- 07
Whole
sale
Depo
sit
s
0.00%
1.00%
2.00%
3.00%
4.00%
5.00%
6.00%
Co
st
of
Wh
ole
sale
Dep
osit
s

21
5.89%6.03%
6.40%6.29%
5.73%5.82%5.69%
3.95%4.09%
4.33%4.20%
3.73%3.78%
3.49%
3.70%3.85%
4.07%3.95%3.50%3.55%
3.25%
0.00%
1.00%
2.00%
3.00%
4.00%
5.00%
6.00%
7.00%
Jun-06 Sep-06 Dec-06 Mar-07 Jun-07 Sep-07 Dec-07
Tier 1 Leverage Tangible Equity/Tangible Assets Tangible Common Equity/Tangible Assets
Capital LevelsSovereign Bancorp, Inc.
* Capital ratios were negatively impacted due to the need to temporarily hold an additional $4.5 billion and $4.0 billion at of cash and short-term investments at September 30 and December 31, respectively, to maintain compliance with a regulatory guideline.
6.38%*
* Excludes impact of additional cash and investments held to
maintain compliance with a regulatory requirement
4.33%*
4.07%*
6.19%*
4.15%*
3.90%*
22
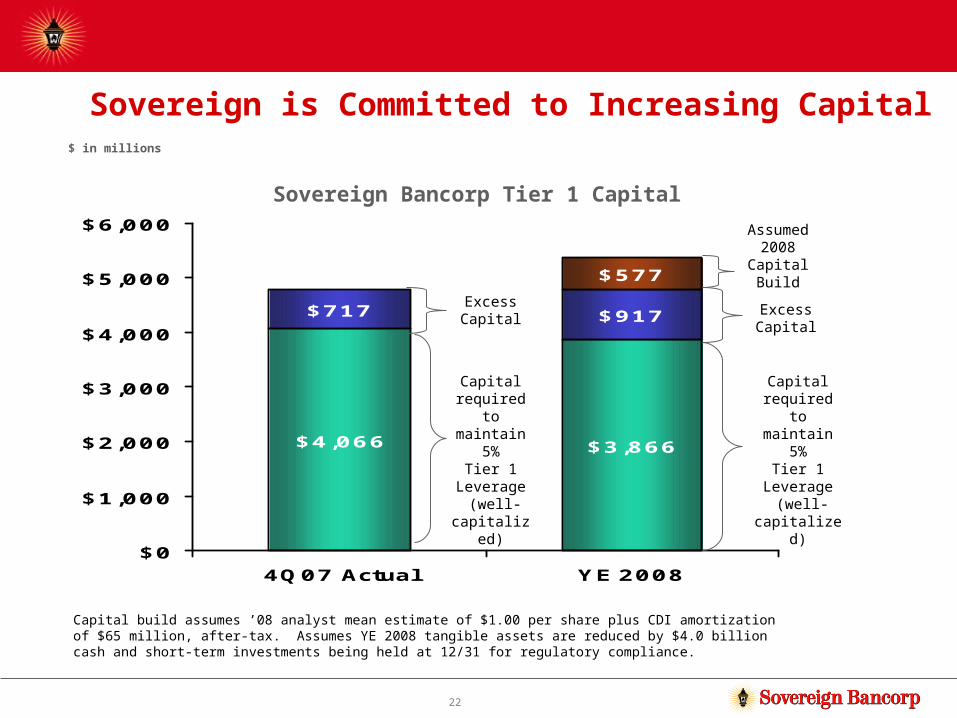
Capital build assumes ’08 analyst mean estimate of $1.00 per share plus CDI amortization of $65 million, after-tax. Assumes YE 2008 tangible assets are reduced by $4.0 billion cash and short-term investments being held at 12/31 for regulatory compliance.
Sovereign is Committed to Increasing Capital
$4,066 $3,866
$717 $917
$577
$0
$1,000
$2,000
$3,000
$4,000
$5,000
$6,000
4Q07 Actual YE 2008
Capital required to maintain
5%Tier 1
Leverage (well-
capitalized)
ExcessCapital
Assumed 2008
Capital Build
$ in millions
Sovereign Bancorp Tier 1 Capital
ExcessCapital
Capital required to
maintain 5%Tier 1
Leverage (well-
capitalized)
23
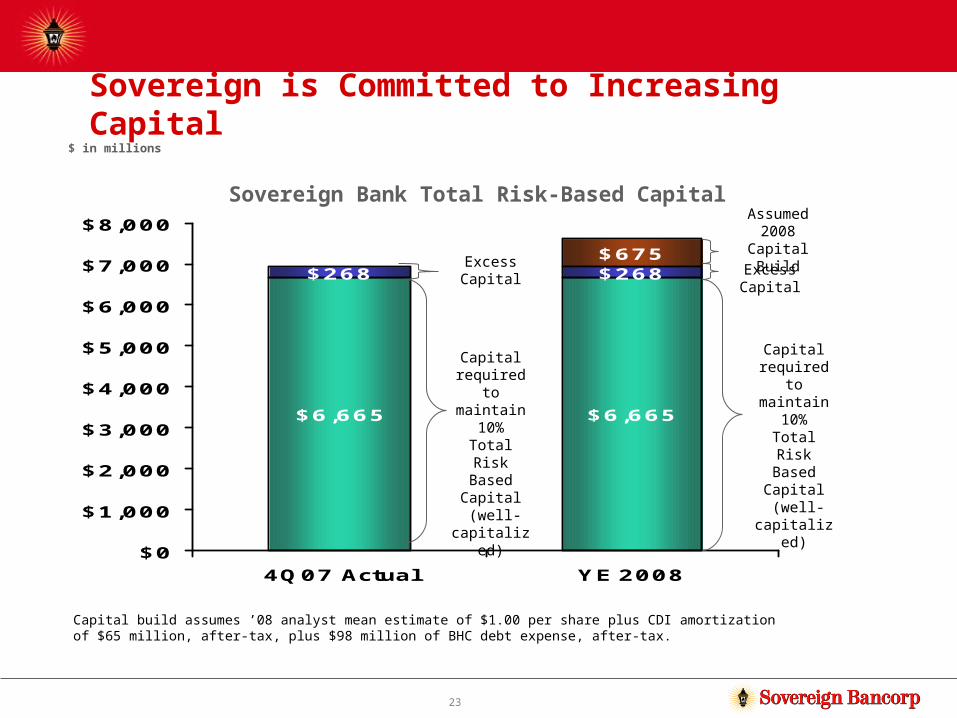
Capital build assumes ’08 analyst mean estimate of $1.00 per share plus CDI amortization of $65 million, after-tax, plus $98 million of BHC debt expense, after-tax.
Sovereign is Committed to Increasing Capital
$6,665 $6,665
$268 $268$675
$0
$1,000
$2,000
$3,000
$4,000
$5,000
$6,000
$7,000
$8,000
4Q07 Actual YE 2008
Capital required to maintain
10%Total Risk
Based Capital (well-
capitalized)
ExcessCapital
Assumed 2008 Capital
Build
$ in millions
Sovereign Bank Total Risk-Based Capital
ExcessCapital
Capital required to maintain
10%Total Risk
Based Capital (well-
capitalized)

24
Recent Steps Taken to Strengthen Capital Base
Over the past twelve months, Sovereign has taken a number of steps to strengthen its capital base in a weakening economic environment:
Disposed of over $7.0 billion of non-core assets and businesses
Recently elected to eliminate auto originations in the Southeast and Southwest, which will further reduce assets in 2008
Reduced annual operating expenses by over $100 million in 2007
Elected to eliminate common shareholder dividend which will conserve approximately $160 million of capital in 2008
25
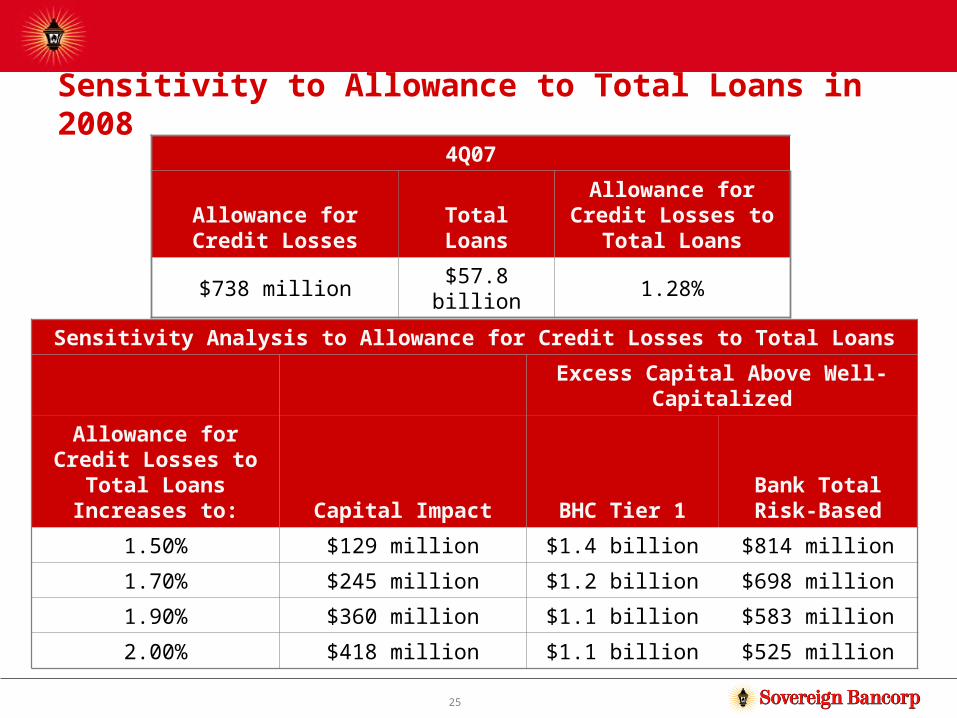
Sensitivity to Allowance to Total Loans in 20084Q07
Allowance for Credit Losses
Total Loans
Allowance for Credit Losses to
Total Loans
$738 million $57.8 billion 1.28%
Sensitivity Analysis to Allowance for Credit Losses to Total Loans
Excess Capital Above Well-Capitalized
Allowance for Credit Losses to
Total Loans Increases to: Capital Impact BHC Tier 1
Bank Total Risk-Based
1.50% $129 million $1.4 billion $814 million
1.70% $245 million $1.2 billion $698 million
1.90% $360 million $1.1 billion $583 million
2.00% $418 million $1.1 billion $525 million

26
What to Expect Going Forward
Disciplined and focused approach to increasing the value of our core franchise Increase the rate of household and enterprise acquisition Increase the rate of cross selling and share of wallet
Disciplined credit risk management practices
Continued monitoring and improving of a solid capital position
Continue to increase communications and transparency Both internally and externally

Appendix

28
What Is Sovereign’s CDO Exposure?
Sovereign’s CDO exposure consists 100% of synthetic credit default swaps referencing investment grade corporate debt, NOT sub-prime or ABS securities
The portfolio totals $750 million, 10-year final maturity bonds (approximately 9 years remaining), yielding 6.61% (LIBOR + 169 bps) 15 tranches all AAA rated 5.69% weighted average subordination; 2.09x worst 10-year period of
investment grade bond losses over last 30 years
Parameters in place to manage credit risk: Structures are synthetic Maximum company specific exposure of 1% Maximum industry exposure of 8% Tranche must be rated AAA by Moody’s or S&P All underlying credits must be investment grade at time of purchase Ability to restructure pool to maintain AAA rating
Held as investments available-for-sale; therefore, mark-to-market adjustment flows through other comprehensive income

29
Residential Mortgages – 23% of Total LoansTotal Residential Mortgages
(includes Alt-A)
Outstanding Balance $13.4 billion
Weighted Average FICO 735
Weighted Average LTV 52.7%
Fixed RateAdjustable Rate
68%32%
>91% 5%
80% to 90% 6%
51% to 79% 72%
<50% 17%
>741 44%
681 to 740 36%
621 to 680 17%
<620 3%
LTVDistribution
FICODistribution
Alt – A Mortgages
Outstanding Balance $2.8 billion
Weighted Average FICO 719
Weighted Average LTV 66.6%
Fixed RateAdjustable Rate
34%66%
>91% 2%
80% to 90% 9%
51% to 79% 76%
<50% 13%
>741 40%
681 to 740 46%
621 to 680 14%
<620 0%
LTVDistribution
FICODistribution
1
1
1
1
Data as of 12/31/07. 1) Statistics based on original loan amount and are as of time of origination for those loans. LTV data represents 100% of balances. FICO data represents 78% of total residential mortgage balances, 100% of Alt-A balances.

30
Direct Home Equity Lending – 10% of Total Loans
Direct Home Equity
Outstanding Balance $5.6 billion
Weighted Average FICO 785
Weighted Average CLTV 62.4%
Fixed Rate LoansLines of Credit
68%32%
First LienSecond Lien
37%63%
>91% 4%
80% to 90% 23%
51% to 79% 43%
<50% 29%
>741 62%
681 to 740 26%
621 to 680 10%
<620 2%
CLTVDistribution
FICODistribution
1
Data as of 12/31/07. 1) Statistics based on original loan amount and are as of time of origination for those loans that data were available. Data represents 100% of balances.
1
31
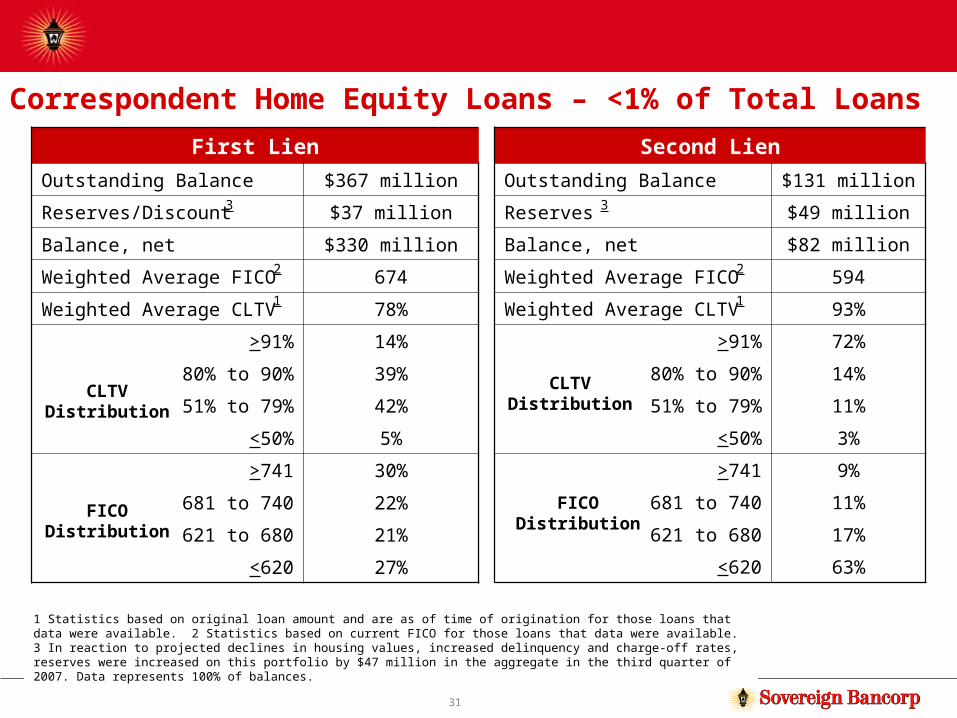
Second Lien
Outstanding Balance $131 million
Reserves $49 million
Balance, net $82 million
Weighted Average FICO 594
Weighted Average CLTV 93%
>91% 72%
80% to 90% 14%
51% to 79% 11%
<50% 3%
>741 9%
681 to 740 11%
621 to 680 17%
<620 63%
Correspondent Home Equity Loans – <1% of Total Loans
First Lien
Outstanding Balance $367 million
Reserves/Discount $37 million
Balance, net $330 million
Weighted Average FICO 674
Weighted Average CLTV 78%
>91% 14%
80% to 90% 39%
51% to 79% 42%
<50% 5%
>741 30%
681 to 740 22%
621 to 680 21%
<620 27%
CLTVDistribution
FICODistribution
CLTVDistribution
FICODistribution
3
1 Statistics based on original loan amount and are as of time of origination for those loans that data were available. 2 Statistics based on current FICO for those loans that data were available. 3 In reaction to projected declines in housing values, increased delinquency and charge-off rates, reserves were increased on this portfolio by $47 million in the aggregate in the third quarter of 2007. Data represents 100% of balances.
2
1
3
2
1
32
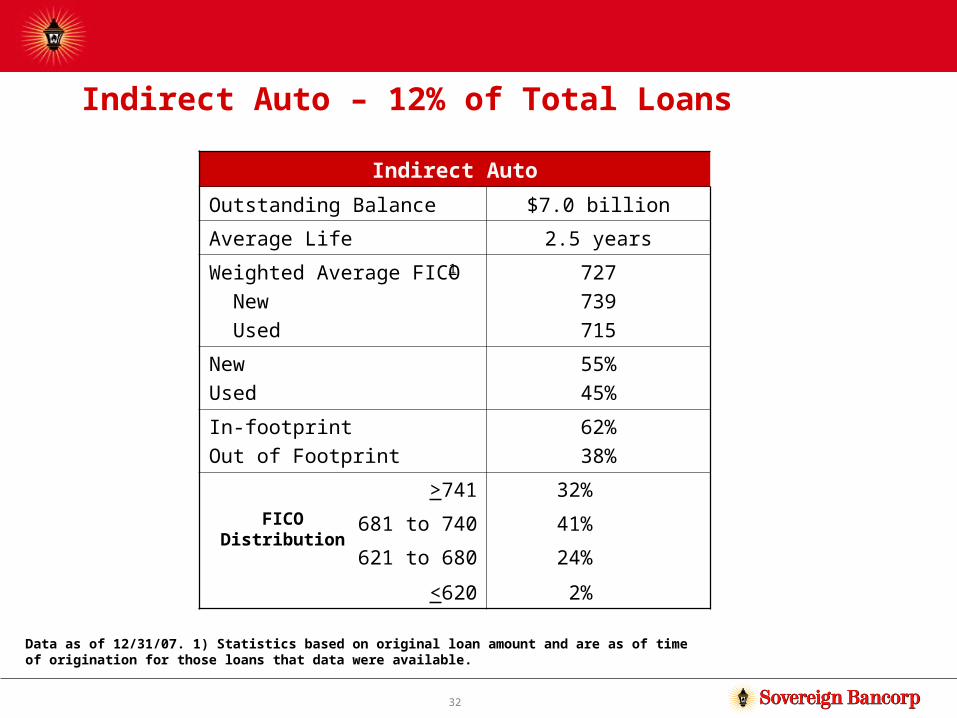
Indirect Auto – 12% of Total Loans
Indirect Auto
Outstanding Balance $7.0 billion
Average Life 2.5 years
Weighted Average FICO New Used
727739715
NewUsed
55%45%
In-footprintOut of Footprint
62%38%
>741 32%
681 to 740 41%
621 to 680 24%
<620 2%
FICODistribution
1
Data as of 12/31/07. 1) Statistics based on original loan amount and are as of time of origination for those loans that data were available.

Sovereign Bancorp, Inc.