Embed Size (px)
Citation preview
Southwestern Public Service Company Load Research Methodology Load research samples are maintained on SPS’s customer rate classes. These samples are refreshed every 5 to 7 years as major tariff changes or similar events occur. Sample participants have specialized metering installed that records usage in 15 minute intervals. The usage then is summarized at 30 and 60 minute aggregation levels. The sample data is expanded to the appropriate rate class population using ratio estimation. Population rate class demand estimates for every sample are calculated by multiplying the monthly rate class population energy usage by the ratio of the sample demand to the monthly sample energy usage. This is a widely used load research estimation technique which takes advantage of the correlation of the monthly sample energy to the sample demand.
Schedule Q-1 Page 1 of 1
Sponsor: Marks Case No. 15-00139-UT

Southwestern Public Service Company Description of the Company
Southwestern Public Service Company (“SPS”), an electric utility company, is a wholly
owned subsidiary of Xcel Energy Inc. (“Xcel Energy”). Xcel Energy is a holding company
incorporated under the laws of Minnesota and is a major U.S. electric and natural gas distribution
utility holding company, with annual electric and natural gas utility revenues of $10.3 billion.
Xcel Energy is the parent company of the following four wholly owned utility operating
companies: Northern States Power Company, a Minnesota corporation; Northern States Power
Company, a Wisconsin corporation; Public Service Company of Colorado, a Colorado
corporation; and SPS. Xcel Energy also has two transmission-only operating companies, Xcel
Energy Southwest Transmission Company, LLC and Xcel Energy Transmission Development
Company, LLC which are regulated by the Federal Energy Regulatory Commission (“FERC”)
(collectively, “Operating Companies”, or individually, “Operating Company”). Xcel Energy’s
subsidiaries are engaged almost exclusively in the electric and natural gas utility business in
portions of eight states: New Mexico, Colorado, Michigan, Minnesota, North Dakota, South
Dakota, Texas, and Wisconsin. A complete list of Xcel Energy subsidiaries as of December 31,
2014 follows on pages 6-8. SPS provides only electric service. Xcel Energy provides a
comprehensive portfolio of energy-related products and services to 3.4 million electricity
customers and 1.9 million natural gas customers. In terms of customers, Xcel Energy is the
fourth-largest combination electric and natural gas distribution utility system in the nation.
SPS serves approximately 386,000 electric customers in the Panhandle and the South
Plains of Texas and eastern and southern New Mexico. The total electric customer count is
comprised of: 74.5% Residential customers, 17.5% Commercial and Industrial customers, 6.4%
Lighting customers, and 1.6% Municipal and School customers. SPS also serves seven
Wholesale customers.
SPS serves approximately 108,000 customers at retail in New Mexico. Cities served by
SPS in New Mexico include Artesia, Carlsbad, Clovis, Dexter, Eunice, Hagerman, Hobbs, Jal,
Schedule Q-2 Page 1 of 8
Sponsors: Evans, Robinson Case No. 15-00139-UT

Lake Arthur, Loving, Malaga, Monument, Otis, Portales, Roswell, Texico, Tucumcari, and
White City.
Industry in SPS’s service territory is primarily agricultural and oil and gas production.
The oil and natural gas production business segments have had increased electric consumption in
recent years. Most of the agricultural areas are irrigated by pumping from natural underground
water supplies. Crops include cotton, corn, grain sorghums, soybeans, and peanuts. There are
also several large cattle feeding operations in the service territory. The dairy and cheese
industries are expanding within the service territory. Electric irrigation load is also increasing as
producers are converting from natural gas irrigation to electric pumps. SPS serves most of the
cities and towns within the service territory, while many areas outside those towns are served by
rural electric cooperatives.
SPS is regulated by the New Mexico Public Regulation Commission (“NMPRC”), the 80
municipalities it serves in Texas, the Public Utility Commission of Texas (“PUCT”), and the
FERC. The NMPRC regulates retail services provided in New Mexico. The PUCT regulates
retail services provided in Texas. The FERC regulates wholesale power sales and transmission
service in interstate commerce.
SPS is uniquely located relative to the electrical grid of North America. SPS is a member
of the Southwest Power Pool (“SPP”), which is a Regional Transmission Organization. SPS is
located in the southwest corner of SPP and the Eastern Interconnection. It is bordered to the
west by the Western Electricity Coordinating Council (“WECC”) and to the south and southeast
by the Electric Reliability Council of Texas (“ERCOT”).
SPS is interconnected with the Eastern Interconnection through six synchronous interties
with the SPP. These interties are near Elk City, Oklahoma (230 kV); Guymon, Oklahoma (115
kV); Shamrock, Texas (115 kV); Groom, Texas (115 kV); Holcomb, Kansas (345 kV) and
Oklaunion, Texas (345 kV). Four of these interties interconnect with utility operating company
subsidiaries of American Electric Power Company. The interconnection near Holcomb, Kansas
Schedule Q-2 Page 2 of 8
Sponsors: Evans, Robinson Case No. 15-00139-UT
is with Sunflower Electric Cooperative and the interconnection in Guymon, Oklahoma is with
WestPlains Energy in Kansas.
SPS is interconnected to the Western Interconnection through three high-voltage direct-
current (“HVDC”) converters owned by three utilities in the WECC. SPS is interconnected to
the west jointly with El Paso Electric Company and Public Service Company of New Mexico
(“PNM”) at the Eddy County HVDC tie located near Artesia, New Mexico, and then with PNM
solely in Roosevelt County, New Mexico at the Blackwater Draw HVDC tie located near Clovis,
New Mexico. The third HVDC tie is with Public Service Company of Colorado, an Xcel Energy
operating company, at the Lamar HVDC tie in Prowers County, Colorado.
SPS is not interconnected with ERCOT.
An Xcel Energy corporate organizational chart follows on page 4. A map of SPS’s
service territory follows on page 5.
Schedule Q-2 Page 3 of 8
Sponsors: Evans, Robinson Case No. 15-00139-UT

Schedule Q-2 Page 4 of 8
Sponsors: Evans, Robinson Case No. 15-00139-UT

PuebloSaguachePawnee
ProwersBentHamilton KearnyOtero
CusterCuster
FinneyStafford
Hodgeman
EdwardsHuerfano
Gray
FordPratt
LasAnimas
Alamosa
Alamosa
Stanton HaskellGrant Kiowa
Baca
Costilla
MeadeClark Barber
StevensMorton Seward Comanche
Union
CimarronWoods
BeaverTexas Harper
Taos
Colfax
Woodward
Ellis
MajorLipscombShermanDallam Hansford Ochiltree
Mora
HardingDewey
RobertsHemphillHutchinson
Hartley
Moore
RogerMillsSan
Miguel Custer
Quay
PotterCarson
GrayWheelerOldham
Beckham Washita
Guadalupe
RandallArmstrong
CollingsworthDonley
DeafSmith
KiowaGreer
Torrance
Harmon
Curry Jackson
De Baca
Parmer
Castro Swisher Briscoe
ChildressHall
Tillman
Roosevelt
Hardeman
Wilbarger
Lincoln
MotleyCottle
FloydHale
LambBailey
Foard
Wichita
Chaves
KingDickensCrosby
LubbockArcher
Hockley
Knox
Baylor
Cochran
Lea
Haskell ThrockmortonYoungKent
Stonewall
Otero
Garza
LynnTerry
Yoakum
Eddy
ShackelfordJonesFisherScurryBordenDawson StephensGaines
TaylorHoward
Mitchell EastlandCallahan
MartinAndrewsNolan
Comanche
Sterling
GlasscockMidlandCoke
Winkler Ector
RunnelsColeman Brown
Culberson
Reeves
LovingHudspeth
Mills
TomGreen
Ward
Crane Upton Reagan
ConchoIrion
McCulloch San SabaPecos
T e x a sT e x a sN e w M e x i c oN e w M e x i c o
0 40 8020Miles
K a n s a sK a n s a s
O k l a h o m aO k l a h o m a
C o l o r a d oC o l o r a d o
Southwestern Public Service Company
Map Updated: 11/13/2014L e g e n dTransmission Line Voltage (kV)
34523011569
Schedule Q-2 Page 5 of 8
Sponsors: Evans, Robinson Case No. 15-00139-UT

Southwestern Public Service Company
Description of Company
List and Description of AffiliatesAs of December 31, 2014
Name Description Incorporated Owner Ownership %
Xcel Energy Inc. (Xcel Energy) Holding Company MN - 1909
Northern States Power Co., a Public utility (gas & electric) MN - 2000 Xcel Energy Inc. 100.00%Minnesota Corporation (NSP-MN)
NSP Nuclear Corporation Holds NSP-MN's interest in MN - 1999 NSP - MN 100.00%Nuclear Management Co. LLC
Nuclear Management Co. LLC (NMC) Operates Monticello and Prairie Island nuclear WI - 1999 NSP Nuclear Corporation 100.00%generating plants
Private Fuel Storage LLC Developing private temporary DE - 1995 NSP - MN 32.80%spent nuclear fuel storage facility
United Power and Land Co. (UP&L) Holds non-utility real estate MN - 1924 NSP - MN 100.00%
Northern States Power Co., a Public utility (gas & electric) WI - 1901 Xcel Energy Inc. 100.00%Wisconsin Corporation (NSP-WI)
Chippewa and Flambeau Improvement Co. Operates hydro reservoirs in Wisconsin WI - 1909 NSP - WI 75.86%
Clearwater Investments, Inc. (Clearwater Inv) Owns interests in affordable housing projects WI - 1991 NSP - WI 100.00%
Woodsedge Eau Claire LP Owns interests in affordable housing projects MN - 2002 Clearwater Inv 99.99%Shoe Factory Holdings, LLC Owns interests in affordable housing projects WI - 1994 Clearwater Inv 98.99%
NSP Lands Inc. Holds non-utility real estate in Wisconsin WI - 1992 NSP - WI 100.00%
Public Service Co. of Colorado (PSCo) Public utility (gas, electric & thermal) CO - 1924 Xcel Energy Inc. 100.00%
PSR Investments Inc. Owns certain life insurance CO - 1985 PSCo 100.00%policies acquired prior to 1986
1480 Welton Inc. Holds real estate CO - 1958 PSCo 100.00%
Green and Clear Lakes Co. Water storage for Cabin Creek hydro facility NY - 1886 PSCo 100.00%
Beeman Ditch Co. Cooling water for generating facilities CO - 1878 PSCo 51.00%Consolidated Extension Canal Co. Cooling water for generating facilities CO - 1910 PSCo 53.50%East Boulder Ditch Co. Cooling water for generating facilities CO - 1865 PSCo 88.90%Fisher Ditch Co. Cooling water for generating facilities CO - 1921 PSCo 62.30%Gardeners' Mutual Ditch Co. Cooling water for generating facilities CO - 1915 PSCo 100.00%Hillcrest Ditch and Reservoir Co. Cooling water for generating facilities CO - 1918 PSCo 77.80%Las Animas Consolidated Canal Co. Cooling water for generating facilities CO - 1941 PSCo 76.60%United Water Co. Cooling water for generating facilities CO - 1915 PSCo 82.00%
WestGas InterState Inc. Natural gas transmission company CO - 1990 Xcel Energy Inc. 100.00%
Xcel Energy Communications Intermediate holding company for subsidiaries MN - 2000 Xcel Energy Inc. 100.00%Group Inc. (Xcel Energy Comm) providing broadband telecommunications
NCE Communications Inc. (NCE Comm) No operations CO - 1996 Xcel Energy Comm 100.00%
Seren Innovations Inc.** Provides cable, telephone and MN - 1996 Xcel Energy Comm 100.00%high speed internet access Calif. assets sold 11-3-05
Xcel Energy Foundation Charitable activities MN - 2001 Xcel Energy Inc. 100.00%
Xcel Energy International Inc. Intermediate holding company DE - 1997 Xcel Energy Inc.(Xcel Energy Intl)** for international subsidiaries 100.00%
** Company is being classified as in discontinued operations
Schedule Q-2 Page 6 of 8
Sponsors: Evans, Robinson Case No. 15-00139-UT

Southwestern Public Service Company
Description of Company
List and Description of AffiliatesAs of December 31, 2014
Name Description Incorporated Owner Ownership %Xcel Energy Markets Holdings Inc. Intermediate holding company for subsidiaries MN - 2000 Xcel Energy Inc. 100.00%(Xcel Energy Mkts) providing energy marketing services
e prime Inc. (e prime)** Unregulated commodity marketing affiliate CO - 1995 Xcel Energy Mkts 100.00%
Young Gas Storage Co. Ltd. Owns and operates an CO - 1993 Xcel Energy Mkts 47.50%underground gas storage
Xcel Energy Retail Holdings Inc. Intermediate holding company for subsidiaries MN - 2000 Xcel Energy Inc. 100.00%(Xcel Energy Retail) providing services to retail customers
Reddy Kilowatt Corporation Energy sales and marketing services MT - 1972 Xcel Energy Retail 100.00%
Xcel Energy Performance Contracting Inc. Holds contracts related to energy conservation MN - 1993 Xcel Energy Retail 100.00%
Xcel Energy Services Inc. Service company for Xcel Energy system DE - 1997 Xcel Energy Inc. 100.00%(Xcel Energy Svcs)
Xcel Energy Ventures Inc. Intermediate holding company for subsidiaries MN - 2000 Xcel Energy Inc. 100.00%(Xcel Energy Ventures) to develop and manage new business ventures
Eloigne Co. (Eloigne) Owns interests in affordable housing projects MN - 1993 Xcel Energy Ventures 100.00%which qualify for low income housing tax credits
Bemicil Townhouse LP Owns interests in affordable housing projects MN – 5/3/93 Eloigne 99.00%Chaska Brickstone LP Owns interests in affordable housing projects MN – 10/7/97 Eloigne 99.99%Cottage Court LP Owns interests in affordable housing projects MN – 6/23/94 Eloigne 99.00%Crown Ridge Apartments LP Owns interests in affordable housing projects MN – 2/16/96 Eloigne 99.99%Dakotah Pioneer LP Owns interests in affordable housing projects ND – 4/20/99 Eloigne 99.99%East Creek LP Owns interests in affordable housing projects MN – 10/23/95 Eloigne 99.00%Edenvale Family Housing LP Owns interests in affordable housing projects MN – 8/29/97 Eloigne 99.99%Fairview Ridge LP Owns interests in affordable housing projects MN – 12/20/93 Eloigne 99.00%Farmington Family Housing LP Owns interests in affordable housing projects MN – 2/16/99 Eloigne 99.99%Farmington Townhome LP Owns interests in affordable housing projects MN – 2/15/98 Eloigne 99.99%Hearthstone Village LP Owns interests in affordable housing projects ND – 9/14/97 Eloigne 99.00%J&D 14-93 LP Owns interests in affordable housing projects MN – 1/3/94 Eloigne 99.00%Jefferson Heights of Zumbrota LP Owns interests in affordable housing projects MN – 10/4/95 Eloigne 99.00%Lauring Green LP Owns interests in affordable housing projects MN – 8/14/89 Eloigne 99.00%Links Lane LP Owns interests in affordable housing projects MN – 8/11/93 Eloigne 99.00%Lyndale Avenue Townhomes LP Owns interests in affordable housing projects MN – 5/6/99 Eloigne 99.99%Mahtomedi Woodland LP Owns interests in affordable housing projects MN – 12/3/96 Eloigne 99.00%Mankato Townhomes LLP Owns interests in affordable housing projects MN – 6/20/97 Eloigne 59.99%Marvin Garden LP Owns interests in affordable housing projects MN – 4/1/94 Eloigne 99.00%Moorhead Townhomes LP Owns interests in affordable housing projects MN – 9/8/99 Eloigne 99.99%Park Rapids Townhomes LP Owns interests in affordable housing projects MN – 6/17/95 Eloigne 99.99%Rochester Townhome LP Owns interests in affordable housing projects MN – 2/5/98 Eloigne 99.00%Rushford Housing LP Owns interests in affordable housing projects MN – 3/27/96 Eloigne 99.99%RWIC Credit Fund LP-1993 Owns interests in affordable housing projects 12/31/199 Eloigne 99.00%Safe Haven Homes LLC Owns interests in affordable housing projects DE - 1997 Eloigne 100.00%Shade Tree Apartments LP Owns interests in affordable housing projects MN – 6/11/99 Eloigne 99.99%Shakopee Boulder Ridge LP Owns interests in affordable housing projects MN – 10/20/98 Eloigne 99.99%Shenandoah Woods LP Owns interests in affordable housing projects MN – 8/29/97 Eloigne 99.99%Sioux Falls Partners LP Owns interests in affordable housing projects SD – 9/2/94 Eloigne 99.00%St. Cloud Housing LP Owns interests in affordable housing projects MN – 1/13/03 Eloigne 99.99%Tower Terrace LP Owns interests in affordable housing projects MN – 5/9/94 Eloigne 99.00%Wyoming LP II Owns interests in affordable housing projects MN – 10/29/99 Eloigne 99.00%
** Company is being classified as in discontinued operations
Schedule Q-2 Page 7 of 8
Sponsors: Evans, Robinson Case No. 15-00139-UT

Southwestern Public Service Company
Description of Company
List and Description of AffiliatesAs of December 31, 2014
Name Description Incorporated Owner Ownership %Xcel Energy Wholesale Group Inc. Intermediate holding company MN - 2000 Xcel Energy Inc. 100.00%(Xcel Energy Wholesale)** for subsidiaries providing wholesale energy
Quixx Corporation (Quixx Corp.)** Energy related projects TX - 1985 Xcel Energy Wholesale 100.00%
Quixx Carolina Inc. (Quixx Carolina)** Energy related projects TX - 1995 Quixx Corp. 100.00%
Quixx Linden L.P.** Energy related projects DE - 1996 Quixx Corp. 43.18%
Quixxlin Corp. (Quixxlin)** Energy related projects DE - 1997 Quixx Corp. 100.00%
Xcel Energy WYCO Inc. Finance and holds 50% interest CO - 1999 Xcel Energy Inc. 100.00%(Xcel Energy WYCO) in WYCO Development LLC
WYCO Development LLC Acquire, own and lease natural CO - 1997 Xcel Energy WYCO 50.00%gas transportation facilities
Xcel Energy Transmission Holding Company, L Intermediate holding company DE - 2014 Xcel Energy Inc. 100.00%(Xcel Energy Transmission Holding Company) for subsidiaries providing energy transmission services
Xcel Energy Southwest Transmission Company, LLEnergy transmission services DE - 2014 Xcel Energy Transmissio 100.00%
Xcel Energy Transmission Development Company,Energy transmission services DE - 2014 Xcel Energy Transmissio 100.00%
Xcel Energy West Transmission Company, LLC Energy transmission services DE - 2014 Xcel Energy Transmissio 100.00%
** Company is being classified as in discontinued operations
Schedule Q-2 Page 8 of 8
Sponsors: Evans, Robinson Case No. 15-00139-UT

ForgingOur Path
Annual Report 2014
Schedule Q-3 Page 1 of 182
Sponsor: Robinson Case No. 15-00139-UT

On the Cover: Construction crews are on the job at Xcel Energy’s Cherokee Generating Station, where the company is making changes to deliver cleaner, more reliable energy for customers.
Company DescriptionXcel Energy is a major U.S. electric and natural gas company, with annual revenues of $11.7 billion. Based in Minneapolis, Minn., the company operates in eight states and provides a comprehensive portfolio of energy-related products and services to 3.5 million electricity customers and 2.0 million natural gas customers.
2012
2.0
1.5
1.0
0.5
0.0
2.5
2013
2013
Ongoing earnings per share*
GAAP (generally accepted accounting principles) earnings per share
Some of the sections in this annual report, including the letter to shareholders on page 1, contain forward-looking statements. For a discussion of factors that could affect operating results, please see the management’s discussion and analysis listed in the table of contents of the Form 10-K.
* A reconciliation to GAAP earnings per share is located in Item 7 of the Form 10-K.
2014
2014
Xcel Energy Earnings Per Share
Dollars per share (diluted)
Financial Highlights
1.82
1.95
2.03
1.85
1.91
2.03
Ongoing earnings per share 1.95 2.03
Total GAAP earnings per share 1.91 2.03
Dividends annualized 1.12 1.20
Stock price (close) 27.94 35.92
Assets (millions) 33,907 36,958
Book value per common share 19.21 20.20
Schedule Q-3 Page 2 of 182
Sponsor: Robinson Case No. 15-00139-UT

Dear fellow shareholders:Once again, Xcel Energy demonstrated that we deliver results and are ready for a rapidly changing energy marketplace. 2014 was another outstanding year in which we achieved strong financial and operational performance and executed well on our strategies to meet the changing needs of our customers, position us for success and build value for you.
We chose Forging Our Path as the theme of this report to capture the forward-thinking approach that is our hallmark. Whether it’s building our renewable energy portfolio, reducing carbon emissions or advocating for regulatory change to support our plans for meeting customers’ needs, we are looking toward the future. Today, we are moving forward with confidence and a focused plan—forging our path to success.
Delivering strong financial resultsYear after year, we’ve met or exceeded our financial targets, and 2014 was no exception. We reported ongoing earnings of $2.03 per share, compared with $1.95 per share in 2013, an increase of 4 percent.
Meeting your expectations is important to us, and I’m proud to say this was the 10th consecutive year we’ve met or exceeded our earnings guidance and
Letter toShareholders
Ben Fowke Chairman, President and CEO
Xcel EnergyAnnual Report 2014 1
Schedule Q-3 Page 3 of 182
Sponsor: Robinson Case No. 15-00139-UT

Delivering cleaner, more reliable options With the skyline of Denver in the background, construction crews work at Xcel Energy’s Cherokee Generating Station, where the company is replacing three retired coal-fired units with a new natural gas plant as part of Colorado’s Clean Air-Clean Jobs effort.
In total, Xcel Energy is retiring six coal-fired units, converting another to natural gas and building the new natural gas plant. In addition to dramatically reducing air emissions, the project will boost reliability but have a minimal impact on customer rates. The project will contribute to a projected system-wide reduction in carbon dioxide emissions since 2005 of more than 30 percent by 2020.
Xcel EnergyAnnual Report 2014 2
Schedule Q-3 Page 4 of 182
Sponsor: Robinson Case No. 15-00139-UT

Xcel EnergyAnnual Report 2014 3
the fifth consecutive year we’ve delivered results in the upper half of our guidance range. Since 2005, in fact, we’ve achieved annual ongoing earnings growth of 6.5 percent.
We also increased your dividend 7 percent in 2014, marking the 11th consecutive year of dividend growth and more than meeting our growth target of 4 percent to 6 percent. Earlier this year, we increased the dividend 6.7 percent and raised our growth target to 5 percent to 7 percent, reflecting the confidence we have in our business plan and our financial flexibility.
Performance over time is proof of our ability to meet your expectations, but reaching challenging benchmarks also illustrates financial strength. In 2014, our stock price rose nearly 29 percent, the strongest annual increase in more than a decade.
Total return, which incorporates stock price performance and dividend payments, was an impressive 33.5 percent, the highest in more than 10 years, which exceeded the average of our peer group as well as the EEI Investor-Owned Electrics.
For the first time ever, we realized $1 billion in net income, a reflection in part of better-than-expected sales growth. Our market capitalization grew to almost $19 billion. Market capitalization is a function of our share price, which again hit record highs in 2014, enabling us to outperform our utility peer group and the broader market.
Finally, our balance sheet and credit metrics are strong, which allow us to access capital markets at attractive rates. That’s important because we plan to invest $14.5 billion over the next five years in our electric and natural gas businesses for stronger, more resilient energy systems.
We know you have options for your investment dollars, so we work hard to consistently meet our financial targets and deliver for you.
With an outstanding year behind us and good prospects for 2015, we are reaffirming our 2015 ongoing earnings guidance of $2.00 to $2.15 per share.
Operating milestones illustrate excellenceOur operating performance was equally impressive in 2014, when we hit several significant milestones—starting with customer satisfaction. Among surveyed customers, 94 percent gave us positive marks for overall satisfaction, appreciating our concern for safety, support of renewable resources, reliable service, reasonable rates and corporate citizenship.
We also demonstrated strong reliability performance. Among large electric utilities in the Midwest, Xcel Energy ranked second in J.D. Power’s 2015 Electric Utility Business Customer Satisfaction Study, which also indicated that each of our operating companies improved their performance.
In another milestone, Xcel Energy employees achieved their best safety performance ever, with injuries down 21 percent. That puts us in a strong position to achieve a first-quartile industry ranking and is a tribute to the diligence of employees and our Journey to Zero safety initiative.
For an entire decade, we’ve been the No. 1 provider of wind energy in the nation, according to the American Wind Energy Association. We set a record for wind generation produced in one hour in 2014 and met 15 percent of electric demand with wind
Schedule Q-3 Page 5 of 182
Sponsor: Robinson Case No. 15-00139-UT

The team includes (from left) Jessica Collins, Andy Sulkko, Tim Kawakami, Steve Wilson, Christina Falce, John Ault and Kathleen Little.
Xcel Energy also continues to add solar resources to its energy mix. In southwest Colorado’s San Luis Valley, the Greater Sandhill solar farm is one of four large-scale facilities that supplies the company with solar power. According to the Solar Electric Power Association, the company in 2014 was among the top 10 U.S. utilities with the most solar capacity.
Relying on renewable energyXcel Energy purchased power analysts visit Limon III, a Colorado wind farm that supplies the company with wind power. The purchased power team negotiates and manages hundreds of contracts, enabling Xcel Energy to remain the No. 1 provider of wind energy in the country, a distinction the company has held for 10 consecutive years. Most important, Xcel Energy is delivering wind at a competitive price for customers.
Xcel EnergyAnnual Report 2014 4
power. Xcel Energy is a leader in integrating wind energy with its other resources, and I am most proud of the fact that we deliver it at an affordable price, which is fundamentally important to customers.
To meet the need for clean energy, we also are on a path to reduce carbon emissions more than 30 percent compared with 2005 levels by 2020, a milestone that makes us an industry leader in carbon reduction. As the U.S. Environmental Protection Agency (EPA) prepares to finalize new rules around carbon, we are working with the Agency and our states to maximize the value of our clean energy leadership by advocating for recognition of the early action we’ve taken to reduce air emissions.
On the natural gas side of our business, we replaced the last remaining cast iron pipe on our system, a major milestone in our effort to modernize for safety and reliability. We also completed a 35-mile natural gas transmission pipeline on time and on budget to bring natural gas to our Cherokee Generating Station as part of its conversion to natural gas. Although it’s difficult to convey the complexity of these projects, the team working on the Cherokee pipeline dealt with an historic flood, negotiated a red-tailed hawk nesting area and crossed three interstate highways, nine canals and one river. We know how to get these projects done and done right, even as new requirements and challenging conditions increase their complexity.
We also stand out in operating our electric transmission system and managing a large upgrade and construction effort. In 2014, we energized 14 new substations and placed more than 760 miles of new transmission lines into service across our operating companies. We rebuilt and upgraded 190 miles of existing transmission lines, totaling about $1 billion in capital projects. Xcel Energy, in fact, is one of the largest builders of 345-kilovolt
Schedule Q-3 Page 6 of 182
Sponsor: Robinson Case No. 15-00139-UT

Resources for the futureBecause customers have told us they want greener, cleaner energy at a reasonable cost, we are expanding our renewable energy portfolio and reducing our reliance on coal.
In the Upper Midwest, for example, we are proposing to double our renewable resources and reduce carbon emissions 40 percent from 2005 levels by 2030. That will result in a balanced energy mix that is 63 percent carbon free.
Nat
ural
Gas
Coal
29% 28% 35%8%
Nuc
lear
Rene
wab
les
63% Carbon Free
Upper Midwest Resource Plan
Xcel EnergyAnnual Report 2014 5
Schedule Q-3 Page 7 of 182
Sponsor: Robinson Case No. 15-00139-UT

Agassiz Valley Grain is a new Xcel Energy natural gas customer in Barnesville, Minn.
Xcel EnergyAnnual Report 2014 6
Schedule Q-3 Page 8 of 182
Sponsor: Robinson Case No. 15-00139-UT

Growing our business to serve customersAs part of its strategic plan for the future, Xcel Energy is exploring growth opportunities in the natural gas business. In 2014, the company expanded natural gas service to three Minnesota communities, including Barnesville, Minn.
At Agassiz Valley Grain in Barnesville, General Manager Dan Noreen (above, right) was pleased to switch from propane to natural gas to fuel the company’s grain drying operation. “It’s a safer product for us to work with,” he said. “It’s a little more dependable and reliable…and natural gas is going to have some cost savings for us long term.”
Residential customers should also see significant savings, according to Xcel Energy’s Gerry Traut (above, left).
“The average customer who has been using propane for heating their home is going to see savings of around $1,000 a year, based on the 2013 – 2014 winter propane prices.”
Xcel EnergyAnnual Report 2014 7
transmission in the country, and we do it well, with our average cost per mile for new transmission below the national average.
Innovation is important to our success, and our customers look to us for solutions. I was especially pleased this year to announce our first-in-the-nation Clean Energy Partnership with the city of Minneapolis and CenterPoint Energy. This partnership represents a new, collaborative approach to helping the city and its residents—our customers—meet aggressive climate and energy goals, while providing a renewed franchise agreement for our service. Working together, we can execute constructive solutions that make our communities strong and vibrant, a working model that charts a great path for us.
Our customers rely on us for energy conservation solutions, too, and we’ve been delivering for more than two decades. In 2014, customers who took advantage of our energy efficiency programs saved enough electricity to power almost 114,000 homes for a year and enough natural gas to serve more than 17,000 homes for a year. In terms of long-term performance, these programs since 1992 have reduced enough electric demand to enable us to avoid building 16 mid-sized power plants.
Looking to the future with optimism and a solid plan Building from a foundation of financial and operational success, we are optimistic about the future. We have a solid and comprehensive plan that will keep us strong and on the leading edge as the energy landscape continues to evolve. We will take advantage of the opportunities those changes offer for our customers and for you.
Schedule Q-3 Page 9 of 182
Sponsor: Robinson Case No. 15-00139-UT

Investing in the futureTo ensure safe, reliable energy well into the future and to deliver renewable energy, Xcel Energy in 2014 invested about $1 billion in its transmission system, constructing new lines and substations as well as rebuilding and upgrading the existing system. The company is one of the largest builders of 345-kilovolt transmission lines in the country, with an average cost per mile for new transmission below the national average.
To compete in a competitive transmission market, Xcel Energy formed three independent transmission companies that will pursue projects that make sense for customers and build value for shareholders.
Xcel EnergyAnnual Report 2014 8
Schedule Q-3 Page 10 of 182
Sponsor: Robinson Case No. 15-00139-UT

Xcel EnergyAnnual Report 2014 9
Improve utility performanceImproving the performance of our operating companies is a key element of our plan. We want to improve our ability to earn our authorized return on equity (ROE) in each operating company, cutting in half the gap between earned and authorized returns. It’s an aggressive goal, but we are on a path to realize it.
One of the most effective ways to improve ROE is to establish longer-term regulatory agreements, which would provide price certainty for customers and give us greater leeway to implement projects, respond to regulation and reduce risk.
Changing a regulatory compact takes time and concerted effort but we’re making progress. In Colorado, regulators approved a three-year rate plan, renewing a long-term agreement we’d already established and demonstrating that a long-term approach is sustainable when we work constructively with stakeholders. In Texas, we proposed legislation that would allow us to recover
costs more quickly, which then enables us to make further investments in our system.
In Minnesota, where the desire for change is perhaps the greatest, we worked collaboratively with a group of energy companies, environmental policy groups and others to propose a better way to align the energy policies our customers want with the rates and recovery needed to make those policies possible. Xcel Energy followed up on the group’s recommendations—called the e21 Initiative—with a roadmap for advancing the e21 vision that we filed with regulators.
Achieve operational excellenceAchieving operational excellence, another element of our plan, is an increasingly challenging goal that we recognize requires new tools and approaches in a competitive environment. As a result, we’ve launched a major effort focused on leveraging technology to improve our processes and change the way we work.
Schedule Q-3 Page 11 of 182
Sponsor: Robinson Case No. 15-00139-UT

Xcel EnergyAnnual Report 2014 10
A key component of that approach is changing our corporate culture to think and act competitively. In many ways, the timing is right for change because we are experiencing a major transition in our workforce as baby boomers retire. Our goal is a workforce that is more engaged than ever and ready for competition.
Meanwhile, we continue to rely on fundamentals such as controlling costs and satisfying customers. We want to keep the growth of our operating and maintenance costs between 0 percent – 2 percent, and we want to keep customer satisfaction high.
Expand customer options and solutions Satisfying customers—another important part of the plan—means giving them what they need and more. This year alone we plan to invest more than $3 billion to keep our systems safe and reliable, which is fundamental in meeting customer needs. Beyond that, we are expanding our portfolio of renewable energy sources and developing new programs to give them more choices in the kind of energy they use and more options to save energy.
One of the best examples of our proactive approach for customers is a resource plan we proposed for the Upper Midwest that would double our renewable energy portfolio and reduce carbon emissions 40 percent by 2030. With carbon reduction as its driver, the plan gradually reduces our reliance on our coal-fired generating units but maintains a diversity of resources to keep costs reasonable. In the end, we would have an energy mix that is 63 percent carbon free.
Invest for the futureIn the fourth component of our strategic plan, we are making significant investments to upgrade and
strengthen our energy systems and exploring other ways to grow our business and ensure long-term success.
The $14.5 billion of system investments we are making over the next five years, for example, grow our rate base, or the value of our assets, by 4.7 percent annually. Beyond that, we are focusing in particular on growth opportunities in transmission and natural gas, businesses where we already have a lot of expertise.
In 2014, we created three independent transmission companies, or Transcos, to give us the flexibility to compete in a competitive transmission market. With respect to transmission, we also are exploring opportunities through our operating companies in states that offer favorable regulatory frameworks. It’s a two-pronged approach that gives us the flexibility to choose projects that make sense for customers and provide value.
While we are in the early days of pursuing growth in natural gas, we see great opportunities for new infrastructure as our industry works to address the EPA’s proposed carbon rules. We will be building infrastructure but also considering upstream investments, which means looking at the potential of investing in a natural gas transmission pipeline or perhaps natural gas reserves. Right now, we are expanding natural gas to communities previously served only by propane. In 2014, we added three Minnesota communities with more than 1,100 new customers and expected annual revenue of $600,000.
Promising options exist, and we are approaching them with the careful consideration we always bring to manage risk and ensure value for you.
Schedule Q-3 Page 12 of 182
Sponsor: Robinson Case No. 15-00139-UT

Hiring the very bestEmployee Andrew Emerson served five years in the Navy before working for Xcel Energy. The company strongly believes that military veterans bring outstanding technical and leadership skills to the workplace.
Xcel Energy’s goal is to ensure 10 percent of newly hired employees are veterans. To achieve it, the company actively participates in job fairs and other outreach in the veteran community. Once veterans are on the job, we make every effort to ensure a smooth transition and a welcoming environment.
“When transferring from the Navy, I was looking for a company to challenge me and give me security like the military did,” Emerson said. “Xcel Energy did both those things and more than exceeded my expectations of a friendly, hard-working and innovative company. I have greatly enjoyed my time with this company and look forward to many more great years.”
Xcel EnergyAnnual Report 2014 11
Employees make a differenceThe success of our strategy depends in large part on the expertise and determination of our employees, who have embraced the plan. Every day, they demonstrate their commitment to customers, understanding that their work is vital to the quality of people’s lives and the strength of their communities. In return, we strive to provide employees a safe and welcoming workplace, give them the tools they need to do their best work and ensure their compensation and benefits are fair.
In 2014, our employee recruitment effort placed special emphasis on hiring military veterans because we recognize that vets are a good fit at Xcel Energy, with outstanding technical and leadership skills among other attributes. Those efforts have garnered us recognition as one of G.I. Job’s Top 100 Military Employers for seven years in a row, a distinction that places us among the top 2 percent of employers dedicated to hiring veterans.
Schedule Q-3 Page 13 of 182
Sponsor: Robinson Case No. 15-00139-UT

Strengthening electric transmission grid takes teamwork As part of the CapX2020 initiative, crews completed a transmission line segment spanning 1.3 miles over the Mississippi River between Wabasha, Minn., and Alma, Wis. Crossing the river was not only technically challenging but also required input and approval from 10 regulatory agencies.
Xcel Energy is one of 11 transmission owning utilities that comprise CapX2020, which was formed to upgrade and expand the electric transmission grid to ensure continued reliable and affordable service. It represents the largest development of new transmission in the Upper Midwest in almost 40 years. The projects provide needed transmission capacity to support new generation options, including renewable energy.
Xcel EnergyAnnual Report 2014 12
Because our path forward relies on strong communities, we support them with employee volunteer activities, funding from the Xcel Energy Foundation and an impressive United Way campaign every year.
In 2014, the Xcel Energy Foundation contributed more than $3.4 million to promote workforce development, STEM education, environmental stewardship and access to the arts. Our United Way campaign resulted in more than $5.2 million benefitting the communities we serve.
Those community efforts are one of many reasons we have been included for eight years in the Dow Jones Sustainability Index for North America, a leading financial index of companies considered best in class for corporate economic, environmental and social performance.
Forging Our PathAs we move forward on our path, rest assured that we will continue to take a leading role in caring for our communities, advocating for customers, collaborating with stakeholders and building value for you. Our performance over time, our ability to reach new milestones and our understanding of a changing marketplace prove that Xcel Energy is well-positioned for long-term success.
It’s a new day in the energy industry, and we are embracing the possibilities and making them work for you. We appreciate the trust you place in us and look forward to another outstanding year.
Sincerely,
Ben Fowke Chairman, President and CEO
Schedule Q-3 Page 14 of 182
Sponsor: Robinson Case No. 15-00139-UT

UNITED STATESSECURITIES AND EXCHANGE COMMISSION
Washington, D.C. 20549
FORM 10-K(Mark One)
ANNUAL REPORT PURSUANT TO SECTION 13 OR 15(d) OF THE SECURITIES EXCHANGE ACT OF 1934
For the fiscal year ended December 31, 2014 or
TRANSITION REPORT PURSUANT TO SECTION 13 OR 15(d) OF THE SECURITIES EXCHANGE ACT OF 1934
Commission File Number: 001-3034
Xcel Energy Inc.(Exact name of registrant as specified in its charter)
Minnesota 41-0448030(State or other jurisdiction of incorporation or organization) (I.R.S. Employer Identification No.)
414 Nicollet MallMinneapolis, MN 55401
(Address of principal executive offices)Registrant’s telephone number, including area code: 612-330-5500
Securities registered pursuant to Section 12(b) of the Act:
Title of each class Name of each exchange on which registeredCommon Stock, $2.50 par value per share New York Stock ExchangeSecurities registered pursuant to section 12(g) of the Act: None
Indicate by check mark if the registrant is a well-known seasoned issuer, as defined in Rule 405 of the Securities Act. Yes No
Indicate by check mark if the registrant is not required to file reports pursuant to Section 13 or Section 15(d) of the Act. Yes No
Indicate by check mark whether the registrant (1) has filed all reports required to be filed by Section 13 or 15(d) of the Securities Exchange Act of 1934 during the preceding 12 months (or for such shorter period that the registrant was required to file such reports), and (2) has been subject to such filing requirements for the past 90 days. Yes No
Indicate by check mark whether the registrant has submitted electronically and posted on its corporate Website, if any, every Interactive Data File required to be submitted and posted pursuant to Rule 405 and Regulation S-T (§232.405 of this chapter) during the preceding 12 months (or for such shorter period that the registrant was required to submit and post such files). Yes No
Indicate by check mark if disclosure of delinquent filers pursuant to Item 405 of Regulations S-K (§229.405 of this chapter) is not contained herein, and will not be contained, to the best of the registrant’s knowledge, in definitive proxy or information statements incorporated by reference in Part III of this Form 10-K or any amendment to this Form 10-K.
Indicate by check mark whether the registrant is a large accelerated filer, an accelerated filer, a non-accelerated filer, or a smaller reporting company. See the definitions of “large accelerated filer,” “accelerated filer” and “smaller reporting company” in Rule 12b-2 of the Exchange Act. Large accelerated filer Accelerated filer Non-accelerated filer (Do not check if a smaller reporting company) Smaller Reporting Company
Indicate by check mark whether the registrant is a shell company (as defined in Rule 12b-2 of the Act). Yes No
As of June 30, 2014, the aggregate market value of the voting common stock held by non-affiliates of the Registrants was $16,279,552,263 and there were 505,105,562 shares of common stock outstanding.
As of February 16, 2015, there were 505,984,840 shares of common stock outstanding, $2.50 par value.
DOCUMENTS INCORPORATED BY REFERENCE
The Registrant’s Definitive Proxy Statement for its 2015 Annual Meeting of Shareholders is incorporated by reference into Part III of this Form 10-K.
Schedule Q-3 Page 15 of 182
Sponsor: Robinson Case No. 15-00139-UT

TABLE OF CONTENTSIndex
PART IItem 1 —
Item 1A —Item 1B —Item 2 —Item 3 —Item 4 —
PART IIItem 5 —
Item 6 —Item 7 —Item 7A —Item 8 —Item 9 —Item 9A —Item 9B —
PART IIIItem 10 —Item 11 —Item 12 —Item 13 —Item 14 —
PART IVItem 15 —
Business . . . . . . . . . . . . . . . . . . . . . . . . . . . . . . . . . . . . . . . . . . . . . . . . . . . . . . . . . . . . . . . . . . . . . . . . . . . . . . . . . . 1DEFINITION OF ABBREVIATIONS AND INDUSTRY TERMS . . . . . . . . . . . . . . . . . . . . . . . . . . . . . . . . . . . 1COMPANY OVERVIEW . . . . . . . . . . . . . . . . . . . . . . . . . . . . . . . . . . . . . . . . . . . . . . . . . . . . . . . . . . . . . . . . . . . 4ELECTRIC UTILITY OPERATIONS . . . . . . . . . . . . . . . . . . . . . . . . . . . . . . . . . . . . . . . . . . . . . . . . . . . . . . . . . 6
NSP-Minnesota. . . . . . . . . . . . . . . . . . . . . . . . . . . . . . . . . . . . . . . . . . . . . . . . . . . . . . . . . . . . . . . . . . . . . . . . . 6NSP-Wisconsin. . . . . . . . . . . . . . . . . . . . . . . . . . . . . . . . . . . . . . . . . . . . . . . . . . . . . . . . . . . . . . . . . . . . . . . . . 13PSCo . . . . . . . . . . . . . . . . . . . . . . . . . . . . . . . . . . . . . . . . . . . . . . . . . . . . . . . . . . . . . . . . . . . . . . . . . . . . . . . . . 14SPS . . . . . . . . . . . . . . . . . . . . . . . . . . . . . . . . . . . . . . . . . . . . . . . . . . . . . . . . . . . . . . . . . . . . . . . . . . . . . . . . . . 19Summary of Recent Federal Regulatory Developments . . . . . . . . . . . . . . . . . . . . . . . . . . . . . . . . . . . . . . . . . 22Electric Operating Statistics . . . . . . . . . . . . . . . . . . . . . . . . . . . . . . . . . . . . . . . . . . . . . . . . . . . . . . . . . . . . . . . 25
NATURAL GAS UTILITY OPERATIONS . . . . . . . . . . . . . . . . . . . . . . . . . . . . . . . . . . . . . . . . . . . . . . . . . . . . . 26NSP-Minnesota. . . . . . . . . . . . . . . . . . . . . . . . . . . . . . . . . . . . . . . . . . . . . . . . . . . . . . . . . . . . . . . . . . . . . . . . . 27NSP-Wisconsin. . . . . . . . . . . . . . . . . . . . . . . . . . . . . . . . . . . . . . . . . . . . . . . . . . . . . . . . . . . . . . . . . . . . . . . . . 28PSCo . . . . . . . . . . . . . . . . . . . . . . . . . . . . . . . . . . . . . . . . . . . . . . . . . . . . . . . . . . . . . . . . . . . . . . . . . . . . . . . . . 29SPS . . . . . . . . . . . . . . . . . . . . . . . . . . . . . . . . . . . . . . . . . . . . . . . . . . . . . . . . . . . . . . . . . . . . . . . . . . . . . . . . . . 30Natural Gas Operating Statistics. . . . . . . . . . . . . . . . . . . . . . . . . . . . . . . . . . . . . . . . . . . . . . . . . . . . . . . . . . . . 31
GENERAL. . . . . . . . . . . . . . . . . . . . . . . . . . . . . . . . . . . . . . . . . . . . . . . . . . . . . . . . . . . . . . . . . . . . . . . . . . . . . . . . 31ENVIRONMENTAL MATTERS . . . . . . . . . . . . . . . . . . . . . . . . . . . . . . . . . . . . . . . . . . . . . . . . . . . . . . . . . . . . . . 32CAPITAL SPENDING AND FINANCING . . . . . . . . . . . . . . . . . . . . . . . . . . . . . . . . . . . . . . . . . . . . . . . . . . . . . . 32EMPLOYEES . . . . . . . . . . . . . . . . . . . . . . . . . . . . . . . . . . . . . . . . . . . . . . . . . . . . . . . . . . . . . . . . . . . . . . . . . . . . . 32EXECUTIVE OFFICERS . . . . . . . . . . . . . . . . . . . . . . . . . . . . . . . . . . . . . . . . . . . . . . . . . . . . . . . . . . . . . . . . . . . . 32Risk Factors . . . . . . . . . . . . . . . . . . . . . . . . . . . . . . . . . . . . . . . . . . . . . . . . . . . . . . . . . . . . . . . . . . . . . . . . . . . . . . . 34Unresolved Staff Comments . . . . . . . . . . . . . . . . . . . . . . . . . . . . . . . . . . . . . . . . . . . . . . . . . . . . . . . . . . . . . . . . . . 42Properties . . . . . . . . . . . . . . . . . . . . . . . . . . . . . . . . . . . . . . . . . . . . . . . . . . . . . . . . . . . . . . . . . . . . . . . . . . . . . . . . . 42Legal Proceedings . . . . . . . . . . . . . . . . . . . . . . . . . . . . . . . . . . . . . . . . . . . . . . . . . . . . . . . . . . . . . . . . . . . . . . . . . . 44Mine Safety Disclosures . . . . . . . . . . . . . . . . . . . . . . . . . . . . . . . . . . . . . . . . . . . . . . . . . . . . . . . . . . . . . . . . . . . . . 44
Market for Registrant’s Common Equity, Related Stockholder Matters and Issuer Purchases of Equity Securities . . . . . . . . . . . . . . . . . . . . . . . . . . . . . . . . . . . . . . . . . . . . . . . . . . . . . . . . . . . . . . . . . . . . . . . . . . . . . . . . . 45Selected Financial Data . . . . . . . . . . . . . . . . . . . . . . . . . . . . . . . . . . . . . . . . . . . . . . . . . . . . . . . . . . . . . . . . . . . . . . 46Management’s Discussion and Analysis of Financial Condition and Results of Operations . . . . . . . . . . . . . . . . . 46Quantitative and Qualitative Disclosures About Market Risk. . . . . . . . . . . . . . . . . . . . . . . . . . . . . . . . . . . . . . . . . 74Financial Statements and Supplementary Data . . . . . . . . . . . . . . . . . . . . . . . . . . . . . . . . . . . . . . . . . . . . . . . . . . . . 74Changes in and Disagreements with Accountants on Accounting and Financial Disclosure . . . . . . . . . . . . . . . . . 151Controls and Procedures . . . . . . . . . . . . . . . . . . . . . . . . . . . . . . . . . . . . . . . . . . . . . . . . . . . . . . . . . . . . . . . . . . . . . 151Other Information . . . . . . . . . . . . . . . . . . . . . . . . . . . . . . . . . . . . . . . . . . . . . . . . . . . . . . . . . . . . . . . . . . . . . . . . . . 151
Directors, Executive Officers and Corporate Governance. . . . . . . . . . . . . . . . . . . . . . . . . . . . . . . . . . . . . . . . . . . . 151Executive Compensation . . . . . . . . . . . . . . . . . . . . . . . . . . . . . . . . . . . . . . . . . . . . . . . . . . . . . . . . . . . . . . . . . . . . . 151Security Ownership of Certain Beneficial Owners and Management and Related Stockholder Matters . . . . . . . . 151Certain Relationships and Related Transactions, and Director Independence . . . . . . . . . . . . . . . . . . . . . . . . . . . . 151Principal Accountant Fees and Services . . . . . . . . . . . . . . . . . . . . . . . . . . . . . . . . . . . . . . . . . . . . . . . . . . . . . . . . . 151
Exhibits, Financial Statement Schedules . . . . . . . . . . . . . . . . . . . . . . . . . . . . . . . . . . . . . . . . . . . . . . . . . . . . . . . . . 152
SIGNATURES . . . . . . . . . . . . . . . . . . . . . . . . . . . . . . . . . . . . . . . . . . . . . . . . . . . . . . . . . . . . . . . . . . . . . . . . . . . . . . . . . . . . . . . 164
Schedule Q-3 Page 16 of 182
Sponsor: Robinson Case No. 15-00139-UT

1
PART I
Item 1 — Business
DEFINITION OF ABBREVIATIONS AND INDUSTRY TERMS
Xcel Energy Inc.’s Subsidiaries and Affiliates (current and former)Cheyenne . . . . . . . . . . . . . . . . Cheyenne Light, Fuel and Power CompanyEloigne . . . . . . . . . . . . . . . . . . Eloigne CompanyNCE . . . . . . . . . . . . . . . . . . . . New Century Energies, Inc.NMC. . . . . . . . . . . . . . . . . . . . Nuclear Management Company, LLCNSP-Minnesota . . . . . . . . . . . Northern States Power Company, a Minnesota corporationNSP System . . . . . . . . . . . . . . The electric production and transmission system of NSP-Minnesota and NSP-Wisconsin operated on
an integrated basis and managed by NSP-MinnesotaNSP-Wisconsin. . . . . . . . . . . . Northern States Power Company, a Wisconsin corporationPSCo. . . . . . . . . . . . . . . . . . . . Public Service Company of ColoradoPSRI . . . . . . . . . . . . . . . . . . . . P.S.R. Investments, Inc.SPS . . . . . . . . . . . . . . . . . . . . . Southwestern Public Service Co.Utility subsidiaries . . . . . . . . . NSP-Minnesota, NSP-Wisconsin, PSCo and SPSWGI . . . . . . . . . . . . . . . . . . . . WestGas InterState, Inc.WYCO . . . . . . . . . . . . . . . . . . WYCO Development LLCXcel Energy . . . . . . . . . . . . . . Xcel Energy Inc. and its subsidiariesXETD . . . . . . . . . . . . . . . . . . . Xcel Energy Transmission Development Company, LLCXEST . . . . . . . . . . . . . . . . . . . Xcel Energy Southwest Transmission Company, LLCXEWT . . . . . . . . . . . . . . . . . . Xcel Energy West Transmission Company, LLC
Federal and State Regulatory AgenciesASLB . . . . . . . . . . . . . . . . . . . Atomic Safety and Licensing BoardCFTC . . . . . . . . . . . . . . . . . . . Commodity Futures Trading CommissionCPUC . . . . . . . . . . . . . . . . . . . Colorado Public Utilities CommissionD.C. Circuit . . . . . . . . . . . . . . United States Court of Appeals for the District of Columbia CircuitDOC . . . . . . . . . . . . . . . . . . . . Minnesota Department of CommerceDOE . . . . . . . . . . . . . . . . . . . . United States Department of EnergyDOI. . . . . . . . . . . . . . . . . . . . . United States Department of the InteriorDOT . . . . . . . . . . . . . . . . . . . . United States Department of TransportationEPA. . . . . . . . . . . . . . . . . . . . . United States Environmental Protection AgencyFERC . . . . . . . . . . . . . . . . . . . Federal Energy Regulatory CommissionIRS . . . . . . . . . . . . . . . . . . . . . Internal Revenue ServiceMPCA. . . . . . . . . . . . . . . . . . . Minnesota Pollution Control AgencyMPSC . . . . . . . . . . . . . . . . . . . Michigan Public Service CommissionMPUC. . . . . . . . . . . . . . . . . . . Minnesota Public Utilities CommissionNDPSC . . . . . . . . . . . . . . . . . . North Dakota Public Service CommissionNERC . . . . . . . . . . . . . . . . . . . North American Electric Reliability CorporationNMAG . . . . . . . . . . . . . . . . . . New Mexico Attorney GeneralNMPRC . . . . . . . . . . . . . . . . . New Mexico Public Regulation CommissionNRC . . . . . . . . . . . . . . . . . . . . Nuclear Regulatory CommissionPNM . . . . . . . . . . . . . . . . . . . . Public Service Company of New MexicoPSCW . . . . . . . . . . . . . . . . . . . Public Service Commission of WisconsinPUCT . . . . . . . . . . . . . . . . . . . Public Utility Commission of TexasSDPUC . . . . . . . . . . . . . . . . . . South Dakota Public Utilities CommissionSEC. . . . . . . . . . . . . . . . . . . . . Securities and Exchange CommissionWDNR . . . . . . . . . . . . . . . . . . Wisconsin Department of Natural Resources
Electric, Purchased Gas and Resource Adjustment ClausesCIP . . . . . . . . . . . . . . . . . . . . . Conservation improvement programDCRF . . . . . . . . . . . . . . . . . . . Distribution cost recovery factorDRC . . . . . . . . . . . . . . . . . . . . Deferred renewable cost riderDSM . . . . . . . . . . . . . . . . . . . . Demand side managementDSMCA . . . . . . . . . . . . . . . . . Demand side management cost adjustmentECA . . . . . . . . . . . . . . . . . . . . Retail electric commodity adjustmentEE . . . . . . . . . . . . . . . . . . . . . . Energy efficiency
Schedule Q-3 Page 17 of 182
Sponsor: Robinson Case No. 15-00139-UT
2
EECRF . . . . . . . . . . . . . . . . . . Energy efficiency cost recovery factorEIR . . . . . . . . . . . . . . . . . . . . . Environmental improvement rider (recovers the costs associated with investments in
environmental improvements to fossil fuel generation plants)EPU . . . . . . . . . . . . . . . . . . . . Extended power uprateERP. . . . . . . . . . . . . . . . . . . . . Electric resource planFCA . . . . . . . . . . . . . . . . . . . . Fuel clause adjustmentFPPCAC . . . . . . . . . . . . . . . . . Fuel and purchased power cost adjustment clauseGAP . . . . . . . . . . . . . . . . . . . . Gas affordability programGCA . . . . . . . . . . . . . . . . . . . . Gas cost adjustmentOATT . . . . . . . . . . . . . . . . . . . Open access transmission tariffPCCA . . . . . . . . . . . . . . . . . . . Purchased capacity cost adjustmentPCRF . . . . . . . . . . . . . . . . . . . Power cost recovery factor (recovers the costs of certain purchased power costs)PGA . . . . . . . . . . . . . . . . . . . . Purchased gas adjustmentPSIA . . . . . . . . . . . . . . . . . . . . Pipeline system integrity adjustmentQSP. . . . . . . . . . . . . . . . . . . . . Quality of service planRDF . . . . . . . . . . . . . . . . . . . . Renewable development fundRES. . . . . . . . . . . . . . . . . . . . . Renewable energy standard (recovers the costs of new renewable generation)RESA . . . . . . . . . . . . . . . . . . . Renewable energy standard adjustmentSCA . . . . . . . . . . . . . . . . . . . . Steam cost adjustmentSEP . . . . . . . . . . . . . . . . . . . . . State energy policyTCA . . . . . . . . . . . . . . . . . . . . Transmission cost adjustmentTCR . . . . . . . . . . . . . . . . . . . . Transmission cost recovery adjustmentTCRF . . . . . . . . . . . . . . . . . . . Transmission cost recovery factor (recovers transmission infrastructure improvement costs
and changes in wholesale transmission charges)
Other Terms and AbbreviationsAFUDC . . . . . . . . . . . . . . . . . Allowance for funds used during constructionATM . . . . . . . . . . . . . . . . . . . . At-the-marketALJ . . . . . . . . . . . . . . . . . . . . . Administrative law judgeAPBO . . . . . . . . . . . . . . . . . . . Accumulated postretirement benefit obligationARO . . . . . . . . . . . . . . . . . . . . Asset retirement obligationASU . . . . . . . . . . . . . . . . . . . . FASB Accounting Standards UpdateBART . . . . . . . . . . . . . . . . . . . Best available retrofit technologyC&I. . . . . . . . . . . . . . . . . . . . . Commercial and IndustrialCAA . . . . . . . . . . . . . . . . . . . . Clean Air ActCACJA . . . . . . . . . . . . . . . . . . Clean Air Clean Jobs ActCAIR . . . . . . . . . . . . . . . . . . . Clean Air Interstate RuleCapX2020. . . . . . . . . . . . . . . . Alliance of electric cooperatives, municipals and investor-owned utilities in the upper
Midwest involved in a joint transmission line planning and construction effortCCN . . . . . . . . . . . . . . . . . . . . Certificate of convenience and necessityCIG . . . . . . . . . . . . . . . . . . . . . Colorado Interstate Gas Company, LLCCO2 . . . . . . . . . . . . . . . . . . . . . Carbon dioxideCON . . . . . . . . . . . . . . . . . . . . Certificate of needCP . . . . . . . . . . . . . . . . . . . . . . Coincident peakCPCN . . . . . . . . . . . . . . . . . . . Certificate of public convenience and necessityCSAPR . . . . . . . . . . . . . . . . . . Cross-State Air Pollution RuleCWIP . . . . . . . . . . . . . . . . . . . Construction work in progressEEI . . . . . . . . . . . . . . . . . . . . . Edison Electric InstituteEGU . . . . . . . . . . . . . . . . . . . . Electric generating unitEPS . . . . . . . . . . . . . . . . . . . . . Earnings per shareERCOT. . . . . . . . . . . . . . . . . . Electric Reliability Council of TexasETR . . . . . . . . . . . . . . . . . . . . Effective tax rateFASB . . . . . . . . . . . . . . . . . . . Financial Accounting Standards BoardFTR. . . . . . . . . . . . . . . . . . . . . Financial transmission rightFTY . . . . . . . . . . . . . . . . . . . . Forecast test yearGAAP . . . . . . . . . . . . . . . . . . . Generally accepted accounting principlesGHG . . . . . . . . . . . . . . . . . . . . Greenhouse gasHTY . . . . . . . . . . . . . . . . . . . . Historic test yearIFRS . . . . . . . . . . . . . . . . . . . . International Financial Reporting StandardsLCM . . . . . . . . . . . . . . . . . . . . Life cycle managementLLW . . . . . . . . . . . . . . . . . . . . Low-level radioactive waste
Schedule Q-3 Page 18 of 182
Sponsor: Robinson Case No. 15-00139-UT

3
LNG . . . . . . . . . . . . . . . . . . . . Liquefied natural gasMACT . . . . . . . . . . . . . . . . . . Maximum achievable control technologyMGP . . . . . . . . . . . . . . . . . . . . Manufactured gas plantMISO . . . . . . . . . . . . . . . . . . . Midcontinent Independent System Operator, Inc.Moody’s . . . . . . . . . . . . . . . . . Moody’s Investor ServicesMVP . . . . . . . . . . . . . . . . . . . . Multi-value projectNative load . . . . . . . . . . . . . . . Customer demand of retail and wholesale customers that a utility has an obligation to serve
under statute or long-term contractNEI . . . . . . . . . . . . . . . . . . . . . Nuclear Energy InstituteNOL . . . . . . . . . . . . . . . . . . . . Net operating lossNOx . . . . . . . . . . . . . . . . . . . . Nitrogen oxideNOV . . . . . . . . . . . . . . . . . . . . Notice of violationNSPS . . . . . . . . . . . . . . . . . . . New source performance standardNTC . . . . . . . . . . . . . . . . . . . . Notifications to constructNYISO . . . . . . . . . . . . . . . . . . New York Independent System OperatorO&M . . . . . . . . . . . . . . . . . . . Operating and maintenanceOCC . . . . . . . . . . . . . . . . . . . . Office of Consumer CounselOCI . . . . . . . . . . . . . . . . . . . . . Other comprehensive incomePCB . . . . . . . . . . . . . . . . . . . . Polychlorinated biphenylPFS . . . . . . . . . . . . . . . . . . . . . Private Fuel Storage, LLCPI . . . . . . . . . . . . . . . . . . . . . . Prairie Island nuclear generating plantPJM. . . . . . . . . . . . . . . . . . . . . PJM Interconnection, LLCPM . . . . . . . . . . . . . . . . . . . . . Particulate matterPPA. . . . . . . . . . . . . . . . . . . . . Purchased power agreementPRP. . . . . . . . . . . . . . . . . . . . . Potentially responsible partyPTC. . . . . . . . . . . . . . . . . . . . . Production tax creditPV. . . . . . . . . . . . . . . . . . . . . . PhotovoltaicQF. . . . . . . . . . . . . . . . . . . . . . Qualifying facilitiesR&E . . . . . . . . . . . . . . . . . . . . Research and experimentationREC . . . . . . . . . . . . . . . . . . . . Renewable energy creditRFP. . . . . . . . . . . . . . . . . . . . . Request for proposalROE . . . . . . . . . . . . . . . . . . . . Return on equityROFR . . . . . . . . . . . . . . . . . . . Right of first refusalRPS. . . . . . . . . . . . . . . . . . . . . Renewable portfolio standardsRSG . . . . . . . . . . . . . . . . . . . . Revenue sufficiency guaranteeRTO . . . . . . . . . . . . . . . . . . . . Regional Transmission OrganizationSCR . . . . . . . . . . . . . . . . . . . . Selective catalytic reductionSharyland . . . . . . . . . . . . . . . . Sharyland Distribution and Transmission Services, LLCSIP . . . . . . . . . . . . . . . . . . . . . State implementation planSO2 . . . . . . . . . . . . . . . . . . . . . Sulfur dioxideSPP . . . . . . . . . . . . . . . . . . . . . Southwest Power Pool, Inc.S&P . . . . . . . . . . . . . . . . . . . . Standard & Poor’s Ratings ServicesTransCo . . . . . . . . . . . . . . . . . Transmission-only subsidiaryTSR. . . . . . . . . . . . . . . . . . . . . Total shareholder return
MeasurementsBcf . . . . . . . . . . . . . . . . . . . . . Billion cubic feetGWh . . . . . . . . . . . . . . . . . . . . Gigawatt hoursKV . . . . . . . . . . . . . . . . . . . . . KilovoltsKWh . . . . . . . . . . . . . . . . . . . . Kilowatt hoursMcf . . . . . . . . . . . . . . . . . . . . . Thousand cubic feetMMBtu . . . . . . . . . . . . . . . . . . Million British thermal unitsMW. . . . . . . . . . . . . . . . . . . . . MegawattsMWh. . . . . . . . . . . . . . . . . . . . Megawatt hours
Schedule Q-3 Page 19 of 182
Sponsor: Robinson Case No. 15-00139-UT

4
COMPANY OVERVIEW
Xcel Energy Inc. is a holding company with subsidiaries engaged primarily in the utility business. In 2014, Xcel Energy Inc.’s continuing operations included the activity of four wholly owned utility subsidiaries that serve electric and natural gas customers in eight states. These utility subsidiaries are NSP-Minnesota, NSP-Wisconsin, PSCo and SPS, and serve customers in portions of Colorado, Michigan, Minnesota, New Mexico, North Dakota, South Dakota, Texas and Wisconsin. Along with WYCO, a joint venture formed with CIG to develop and lease natural gas pipelines, storage, and compression facilities, and WGI, an interstate natural gas pipeline company, these companies comprise the regulated utility operations.
Xcel Energy Inc. was incorporated under the laws of Minnesota in 1909. Xcel Energy’s executive offices are located at 414 Nicollet Mall, Minneapolis, Minn. 55401. Its website address is www.xcelenergy.com. Xcel Energy makes available, free of charge through its website, its annual report on Form 10-K, quarterly reports on Form 10-Q, current reports on Form 8-K and all amendments to those reports filed or furnished pursuant to Section 13(a) or 15(d) of the Securities Exchange Act of 1934 as soon as reasonably practicable after the reports are electronically filed with or furnished to the SEC. The public may read and copy any materials that Xcel Energy files with the SEC at the SEC’s Public Reference Room at 100 F Street, N.E., Washington, D.C. 20549. The public may obtain information on the operation of the Public Reference Room by calling the SEC at 1-800-SEC-0330. The SEC also maintains an internet site that contains reports, proxy and information statements, and other information regarding issuers that file electronically with the SEC at http://www.sec.gov.
Xcel Energy’s corporate strategy focuses on four core objectives: improving utility performance; driving operational excellence; providing options and solutions to customers; and investing for the future. These core objectives are designed to provide an attractive total return to our investors, including long-term annual ongoing EPS growth of four to six percent and annual dividend increases of five to seven percent.
NSP-Minnesota
NSP-Minnesota is a utility primarily engaged in the generation, purchase, transmission, distribution and sale of electricity in Minnesota, North Dakota and South Dakota. The wholesale customers served by NSP-Minnesota comprised approximately seven percent of its total KWh sold in 2014. NSP-Minnesota also purchases, transports, distributes and sells natural gas to retail customers and transports customer-owned natural gas in Minnesota and North Dakota. NSP-Minnesota provides electric utility service to approximately 1.4 million customers and natural gas utility service to approximately 0.5 million customers. Approximately 88 percent of NSP-Minnesota’s retail electric operating revenues were derived from operations in Minnesota during 2014. Although NSP-Minnesota’s large C&I electric retail customers are comprised of many diversified industries, a significant portion of NSP-Minnesota’s large C&I electric sales include the following industries: petroleum, coal and food products. For small C&I customers, significant electric retail sales include the following industries: real estate and educational services. Generally, NSP-Minnesota’s earnings contribute approximately 35 percent to 45 percent of Xcel Energy’s consolidated net income.
The electric production and transmission costs of the entire NSP System are shared by NSP-Minnesota and NSP-Wisconsin. A FERC-approved Interchange Agreement between the two companies provides for the sharing of all generation and transmission costs of the NSP System.
NSP-Minnesota owns the following direct subsidiaries: United Power and Land Company, which holds real estate; and NSP Nuclear Corporation, which owns NMC, an inactive company.
NSP-Wisconsin
NSP-Wisconsin is a utility primarily engaged in the generation, transmission, distribution and sale of electricity in portions of northwestern Wisconsin and in the western portion of the Upper Peninsula of Michigan. NSP-Wisconsin purchases, transports, distributes and sells natural gas to retail customers and transports customer-owned natural gas in this service territory. NSP-Wisconsin provides electric utility service to approximately 255,000 customers and natural gas utility service to approximately 111,000 customers. Approximately 98 percent of NSP-Wisconsin’s retail electric operating revenues were derived from operations in Wisconsin during 2014. Although NSP-Wisconsin’s large C&I electric retail customers are comprised of many diversified industries, a significant portion of NSP-Wisconsin’s large C&I electric sales include the following industries: food products, paper, allied products and sand mining for oil and gas extraction. For small C&I customers, significant electric retail sales include the following industries: grocery and dining establishments, educational services and health services. Generally, NSP-Wisconsin’s earnings contribute approximately five percent to 10 percent of Xcel Energy’s consolidated net income.
The management of the electric production and transmission system of NSP-Wisconsin is integrated with NSP-Minnesota.
Schedule Q-3 Page 20 of 182
Sponsor: Robinson Case No. 15-00139-UT

5
NSP-Wisconsin owns the following direct subsidiaries: Chippewa and Flambeau Improvement Co., which operates hydro reservoirs; Clearwater Investments Inc., which owns interests in affordable housing; and NSP Lands, Inc., which holds real estate.
PSCo
PSCo is a utility engaged primarily in the generation, purchase, transmission, distribution and sale of electricity in Colorado. The wholesale customers served by PSCo comprised approximately 11 percent of its total KWh sold in 2014. PSCo also purchases, transports, distributes and sells natural gas to retail customers and transports customer-owned natural gas. PSCo provides electric utility service to approximately 1.4 million customers and natural gas utility service to approximately 1.3 million customers. All of PSCo’s retail electric operating revenues were derived from operations in Colorado during 2014. Although PSCo’s large C&I electric retail customers are comprised of many diversified industries, a significant portion of PSCo’s large C&I electric sales include the following industries: fabricated metal products, communications and oil and gas extraction. For small C&I customers, significant electric retail sales include the following industries: real estate and dining establishments. Generally, PSCo’s earnings contribute approximately 45 percent to 55 percent of Xcel Energy’s consolidated net income.
PSCo owns the following direct subsidiaries: 1480 Welton, Inc. and United Water Company, both of which own certain real estate interests; and Green and Clear Lakes Company, which owns water rights and certain real estate interests. PSCo also owns PSRI, which held certain former employees’ life insurance policies. PSCo also holds a controlling interest in several other relatively small ditch and water companies.
SPS
SPS is a utility engaged primarily in the generation, purchase, transmission, distribution and sale of electricity in portions of Texas and New Mexico. The wholesale customers served by SPS comprised approximately 31 percent of its total KWh sold in 2014. SPS provides electric utility service to approximately 386,000 retail customers in Texas and New Mexico. Approximately 72 percent of SPS’ retail electric operating revenues were derived from operations in Texas during 2014. Although SPS’ large C&I electric retail customers are comprised of many diversified industries, a significant portion of SPS’ large C&I electric sales include the following industries: oil and gas extraction, as well as petroleum and coal products. For small C&I customers, significant electric retail sales include the following industries: oil and gas extraction and crop related agricultural industries. Generally, SPS’ earnings contribute approximately five percent to 15 percent of Xcel Energy’s consolidated net income.
Other Subsidiaries
WGI is a small interstate natural gas pipeline company engaged in transporting natural gas from the PSCo system near Chalk Bluffs, Colo., to Cheyenne, Wyo.
WYCO was formed as a joint venture with CIG to develop and lease natural gas pipeline, storage, and compression facilities. Xcel Energy has a 50 percent ownership interest in WYCO. The gas pipeline and storage facilities are leased under a FERC-approved agreement to CIG.
Xcel Energy Services Inc. is the service company for Xcel Energy Inc.
XETD and XEST are transmission-only subsidiaries that will participate in MISO and SPP competitive bidding processes for transmission projects. XEWT is a transmission-only subsidiary that will competitively bid on transmission projects in the western United States.
Xcel Energy Inc.’s nonregulated subsidiary is Eloigne, which invests in rental housing projects that qualify for low-income housing tax credits.
Xcel Energy conducts its utility business in the following reportable segments: regulated electric utility, regulated natural gas utility and all other. See Note 17 to the consolidated financial statements for further discussion relating to comparative segment revenues, income from operations and related financial information.
Schedule Q-3 Page 21 of 182
Sponsor: Robinson Case No. 15-00139-UT

6
ELECTRIC UTILITY OPERATIONS
NSP-MinnesotaPublic Utility Regulation
Summary of Regulatory Agencies and Areas of Jurisdiction — Retail rates, services and other aspects of NSP-Minnesota’s operations are regulated by the MPUC, the NDPSC and the SDPUC within their respective states. The MPUC also has regulatory authority over security issuances, property transfers, mergers, dispositions of assets and transactions between NSP-Minnesota and its affiliates. In addition, the MPUC reviews and approves NSP-Minnesota’s ERPs for meeting customers’ future energy needs. The MPUC also certifies the need and siting for generating plants greater than 50 MW and transmission lines greater than 100 KV that will be located within the state. No large power plant or transmission line may be constructed in Minnesota except on a site or route designated by the MPUC. The NDPSC and SDPUC have regulatory authority over generation and transmission facilities, along with the siting and routing of new generation and transmission facilities in North Dakota and South Dakota, respectively.
NSP-Minnesota is subject to the jurisdiction of the FERC with respect to its wholesale electric operations, hydroelectric licensing, accounting practices, wholesale sales for resale, transmission of electricity in interstate commerce, compliance with NERC electric reliability standards, asset transfers and mergers, and natural gas transactions in interstate commerce. NSP-Minnesota has been granted continued authorization from the FERC to make wholesale electric sales at market-based prices. NSP-Minnesota is a transmission owning member of the MISO RTO.
Fuel, Purchased Energy and Conservation Cost-Recovery Mechanisms — NSP-Minnesota has several retail adjustment clauses that recover fuel, purchased energy and other resource costs:
• CIP — The CIP recovers the costs of conservation and demand-side management programs that help customers save energy. • EIR — The EIR recovers the costs of environmental improvement projects.• RDF — The RDF allocates money collected from retail customers to support the research and development of emerging
renewable energy projects and technologies.• RES — The RES recovers the cost of new renewable generation.• SEP — The SEP recovers costs related to various energy policies approved by the Minnesota legislature.• TCR — The TCR recovers costs associated with new investments in electric transmission.• Infrastructure — The Infrastructure rider recovers costs associated with specific investments in generation and incremental
property taxes.
NSP-Minnesota’s retail electric rates in Minnesota, North Dakota and South Dakota include a FCA for monthly billing adjustments for changes in prudently incurred costs of fuel, fuel related items and purchased energy. NSP-Minnesota is permitted to recover these costs through FCA mechanisms approved by the regulators in each jurisdiction. In general, capacity costs are not recovered through the FCA. In addition, costs associated with MISO are generally recovered through either the FCA or base rates.
Minnesota state law requires NSP-Minnesota to invest two percent of its state electric revenues in CIP. NSP-Minnesota was in compliance with this standard in 2014 and expects to be in compliance in 2015. These costs are recovered through an annual cost-recovery mechanism for electric conservation and energy management program expenditures.
CIP Triennial Plan — In 2012, the DOC approved NSP-Minnesota’s 2013 through 2015 CIP Triennial Plan, which increases the savings goals and budgets over the previous plan. The plan sets an electric goal of annually saving the equivalent of 1.5 percent of sales (calculated on a historical three-year average, excluding opt-out customers) and an annual natural gas goal of saving 1.0 percent of sales.
Capacity and Demand
Uninterrupted system peak demand for the NSP System’s electric utility for each of the last three years and the forecast for 2015, assuming normal weather, is listed below.
System Peak Demand (in MW)2012 2013 2014 2015 Forecast
NSP System . . . . . . . . . . . . . . . . . . . . . . . . . . . . . . . . . . . . . . . . . . 9,475 9,524 8,848 9,301
The peak demand for the NSP System typically occurs in the summer. The 2014 uninterrupted system peak demand for the NSP System occurred on July 21, 2014. The 2014 system peak demand was lower due to cooler summer weather. The 2015 forecast assumes normal peak day weather.
Schedule Q-3 Page 22 of 182
Sponsor: Robinson Case No. 15-00139-UT

7
Energy Sources and Related Transmission Initiatives
NSP-Minnesota expects to use existing power plants, power purchases, CIP options, new generation facilities and expansion of existing power plants to meet its system capacity requirements.
Purchased Power — NSP-Minnesota has contracts to purchase power from other utilities and independent power producers. Long-term purchased power contracts typically require a periodic payment to secure the capacity and a charge for the associated energy actually purchased. NSP-Minnesota also makes short-term purchases to meet system load and energy requirements, to replace generation from company-owned units under maintenance or during outages, to meet operating reserve obligations, or to obtain energy at a lower cost.
Purchased Transmission Services — In addition to using their integrated transmission system, NSP-Minnesota and NSP-Wisconsin have contracts with MISO and regional transmission service providers to deliver power and energy to the NSP System.
NSP-Minnesota’s Filing in Support of e21 Initiative — In December 2014, a collaborative report was issued in Minnesota by a diverse stakeholder group known as the e21 Initiative. The e21 report released a set of recommendations that are intended to act as a blueprint for a new customer-centric, performance-based regulatory approach.
Following the e21 report, NSP-Minnesota filed with the MPUC a plan for supporting the e21 Initiative, which includes the following key objectives:
• Leading the effort to reduce carbon emissions 40 percent by 2030 from 2005 levels;• Advancing distribution grid modernization; • Providing our customers with a platform of innovative services and product offerings; and• Implementing a new regulatory framework that provides both predictable rates for customers and a more timely and nimble
review while retaining key benefits of the existing process, thus freeing time for regulatory agencies, stakeholders and utilities to focus on achieving policy objectives.
NSP-Minnesota plans to work with the MPUC and various stakeholders during 2015 to continue the dialogue and implementation of the e21 Initiative and proposals presented by NSP-Minnesota.
NSP System Resource Plans — In January 2015, NSP-Minnesota filed its 2016-2030 Resource Plan with the MPUC, proposing to achieve a 40 percent reduction in carbon emissions by 2030 from 2005 levels through the significant addition of renewables, continued commitment to specific CIP annual achievements, and the continued operation of its existing cost-effective thermal generation. The plan positions NSP-Minnesota to be responsive to future environmental requirements and market trends, builds on the significant investments already made in the NSP System, and acknowledges the divergence in state energy policies within the NSP System. Key points of the resource plan include:
• Adding 600 MW of wind by 2020 and 1,200 MW by 2027, bringing total wind power on the NSP System to over 3,600 MW;• Adding 187 MW of large-scale solar energy by 2016 and an additional 1,700 MW of large-scale solar and 500 MW of
customer-driven small-scale solar; bringing total solar power on the NSP System to approximately 2,400 MW; • Operating the Monticello and PI nuclear plants through their current licenses; and • Continuing to run Sherco Units 1 and 2 with gradually decreasing reliance through 2030.
In February 2015, the MPUC approved the Competitive Acquisition Plan (CAP), in which NSP-Minnesota is required to add capacity to its system to meet a resource need as follows:
• Enter into an agreement for 100 MW of distributed solar with Geronimo Energy LLC;• Enter into an agreement with Calpine Corporation for a 345 MW expansion at its Mankato Energy Center; and • Construct a 215 MW Black Dog Unit 6 combustion turbine.
NSP-Minnesota also proposed use of a collaborative stakeholder process to guide its five-year action plan, and to facilitate the necessary update of its resource analysis to incorporate the CAP outcomes and significantly higher than expected response to its Community Solar Gardens program.
CapX2020 — The estimated cost of the five major CapX2020 transmission projects listed below is $2.0 billion. NSP-Minnesota and NSP-Wisconsin are responsible for approximately $1.1 billion of the total investment. As of Dec. 31, 2014, Xcel Energy has invested $882.3 million of its $1.1 billion share of the five CapX2020 transmission projects.
Schedule Q-3 Page 23 of 182
Sponsor: Robinson Case No. 15-00139-UT

8
Hampton, Minn. to Rochester, Minn. to La Crosse, Wis. 345 KV transmission lineConstruction on the project started in Minnesota in January 2013 and the project is expected to go into service in 2016, although segments are being placed in service as they are completed.
Monticello, Minn. to Fargo, N.D. 345 KV transmission lineIn December 2011, the Monticello, Minn. to St. Cloud, Minn. portion of the Monticello, Minn. to Fargo, N.D. project was placed in service. In April 2014, the St. Cloud, Minn. to Alexandria, Minn. portion of the project was placed in service. In January 2013, construction started on the project in North Dakota. The final phase of the project, Alexandria, Minn. to Fargo, N.D. is expected to go into service in 2015.
Brookings County, S.D. to Hampton, Minn. 345 KV transmission lineIn December 2011, MISO granted the final approval of the project as a MVP. Construction started on the project in Minnesota in May 2012. The project is expected to go fully into service in 2015, although segments are being placed in service as they are completed.
Bemidji, Minn. to Grand Rapids, Minn. 230 KV transmission lineThe Bemidji, Minn. to Grand Rapids, Minn. line was placed in service in September 2012.
Big Stone South to Brookings County, S.D. 345 KV transmission lineIn December 2011, MISO granted final approval of the project as a MVP. In March 2014, the SDPUC approved a permit for construction of the project’s southern portion. Construction is anticipated to begin in late 2015, with completion in 2017.
Minnesota Solar — Minnesota legislation requires 1.5 percent of a public utility’s total electric retail sales to retail customers be generated using solar energy by 2020. Of the 1.5 percent, 10 percent must come from systems sized less than 20 kilowatts. There are two customer-facing solar programs authorized by the legislature: a community solar garden program that provides bill credits to participating subscribers, and a solar production incentive program for systems equal to or less than 20 kilowatts with authorized payments of $5.0 million per year over five years. NSP-Minnesota launched its Solar*Rewards Community program in December 2014.
The legislation also provides for an alternative tariff based on a distributed solar value or Value of Solar (VOS) methodology. In March 2014, a VOS methodology was approved by the MPUC. However, in September 2014 the MPUC determined that the VOS is not in the public interest for use with community solar gardens. The MPUC instead approved a retail rate based credit ranging from 9.5 to 15 cents per kilowatt hour. The actual bill credit amount is dependent on customer class as well as customers’ willingness to transfer the RECs to NSP-Minnesota.
Annual Automatic Adjustment (AAA) of Charges — In June 2013, the DOC proposed that the MPUC adopt a fuel clause incentive that would normalize FCA recovery using monthly patterns derived from averages of the prior three-year period, setting and fixing this level during a rate case with no adjustment between rate cases. NSP-Minnesota and other utilities opposed this proposal. The DOC proposal is pending MPUC action.
Additionally, the DOC has indicated it will review prudence of replacement power costs associated with the Sherco Unit 3 outage event within the 2013 AAA docket. The 2013 and 2012 AAA dockets remain pending.
Minneapolis, Minn. Franchise Agreement — In October 2014, the City of Minneapolis and Xcel Energy signed a 10 year franchise agreement. The City of Minneapolis has the option to end the agreement any time after the first five years and the option to extend it to a maximum of 20 years if both parties agree. A separate clean energy partnership agreement with the City of Minneapolis was also signed, which establishes a board comprised of city and utility officials tasked with creating a work plan to promote energy efficiency, the use of renewable energy, and the reduction of carbon emissions.
Nuclear Power Operations and Waste Disposal
NSP-Minnesota owns two nuclear generating plants: the Monticello plant and the PI plant. Nuclear power plant operations produce gaseous, liquid and solid radioactive wastes which are controlled by federal regulation. High-level radioactive wastes primarily include used nuclear fuel. LLW consists primarily of demineralizer resins, paper, protective clothing, rags, tools and equipment that have become contaminated through use in a plant.
NRC Regulation — The NRC regulates the nuclear operations of NSP-Minnesota. Decisions by the NRC can significantly impact the operations of the nuclear generating plants.
Schedule Q-3 Page 24 of 182
Sponsor: Robinson Case No. 15-00139-UT

9
The NRC imposed new requirements after events at the nuclear generating plant in Fukushima, Japan. In 2012, the NRC issued orders which included requirements for mitigation strategies for beyond-design-basis external events, requirements with regard to reliable spent fuel instrumentation and requirements with regard to reliable hardened containment vents, which are applicable to boiling water reactor containments at the Monticello plant. The NRC also requested additional information including requirements to perform walkdowns of seismic and flood protection, to evaluate seismic and flood hazards and to assess the emergency preparedness staffing and communications capabilities at each plant. Based on current refueling outage plans, the dates of the required compliance are expected to begin in 2015 with all units expected to be fully compliant by December 2016.
In 2013, the NRC issued a revised order with regard to reliable hardened containment vents. Phase 1 addresses severe accident conditions under which the existing hardened vent which comes off of the wet portion of the containment needs to operate. Phase 2 addresses a second hardened vent off of the dry portion of the containment, or a containment venting strategy that makes it unlikely that a licensee would need to vent from the dry portion of the containment. Compliance with the revised order will be completed during refueling outages in 2017-2019.
NSP-Minnesota expects that complying with these external event requirements will cost approximately $90 to $100 million at the Monticello and PI plants. The majority of these costs are expected to be capital in nature. NSP-Minnesota believes the costs associated with compliance would be recoverable from customers through regulatory mechanisms and does not expect a material impact on its results of operations, financial position, or cash flows.
The NRC continues to review its requirements for mitigating the risks of external events on nuclear plants. In 2014, the NRC issued a draft of proposed regulatory guidance for risk mitigation of tornado missiles (projectiles impacting the plant). NSP-Minnesota expects the costs associated with compliance with new NRC regulatory guidance for missile protection to be capital in nature and recoverable from customers. NSP-Minnesota is still evaluating the proposed new requirements and has not yet estimated their financial impact.
Nuclear Regulatory Performance — Since 2000, the NRC has had in place a Reactor Oversight Process (ROP) that classifies U.S. nuclear reactors into various categories (referred to as Columns, from 1 to 5) based on the significance of issues identified in performance indicators or inspection findings. Such issues are evaluated as either green, white, yellow, or red based on their safety significance, with green representing the least safety concern and red representing the most concern. At Dec. 31, 2014, PI Units 1 and 2 were in Column 1 (Licensee Response) with all green performance indicators and no greater than green findings or violations. Monticello was in Column 3 (Degraded Cornerstone) with all green performance indicators and a yellow finding related to flood control. The NRC has completed their inspection that will allow the yellow finding to be closed out. The NRC has notified Monticello that it has a potentially greater than green finding related to plant security which was immediately remedied. Xcel Energy expects to be formally notified of the closeout of the yellow finding, a final determination of the significance of the security finding, and Monticello’s overall column status under the NRC’s ROP in the first half of 2015. Until the NRC makes its determination, we are unable to estimate the cost or impact of any responsive actions required.
LLW Disposal — LLW from NSP-Minnesota’s Monticello and PI nuclear plants is currently disposed at the Clive facility located in Utah and Waste Control Specialists facility located in Texas. If off-site LLW disposal facilities become unavailable, NSP-Minnesota has storage capacity available on-site at PI and Monticello that would allow both plants to continue to operate until the end of their current licensed lives.
High-Level Radioactive Waste Disposal — The federal government has the responsibility to permanently dispose of domestic spent nuclear fuel and other high-level radioactive wastes. The Nuclear Waste Policy Act requires the DOE to implement a program for nuclear high-level waste management. This includes the siting, licensing, construction and operation of a repository for spent nuclear fuel from civilian nuclear power reactors and other high-level radioactive wastes at a permanent federal storage or disposal facility.
Nuclear Geologic Repository - Yucca Mountain ProjectIn 2002, the U.S. Congress designated Yucca Mountain, Nevada as the first deep geologic repository. In 2008, the DOE submitted an application to construct a deep geologic repository at this site to the NRC. In 2010, the DOE announced its intention to stop the Yucca Mountain project and requested the NRC approve the withdrawal of the application. In 2010, the ASLB issued a ruling that the DOE could not withdraw the Yucca Mountain application.
The DOE’s decision and the resulting stoppage of the NRC’s review has prompted multiple legal challenges, including the DOE’s authority to stop the project and withdraw the application, the DOE’s authority to continue to collect the nuclear waste fund fee and the NRC’s authority to stop their review of the DOE’s application.
In August 2013, the D.C. Court of Appeals ordered the NRC to complete their review of the DOE’s application to construct the Yucca Mountain repository. In November 2013, the NRC complied by issuing an order to the NRC Staff to complete and publish a safety evaluation report on the proposed Yucca Mountain nuclear spent fuel and waste repository. The NRC also requested that the DOE prepare a supplemental environmental impact statement (EIS) so the NRC Staff can complete its review.
Schedule Q-3 Page 25 of 182
Sponsor: Robinson Case No. 15-00139-UT
10
In November 2013, the U.S. Court of Appeals ordered the DOE to suspend the collection of the nuclear waste fund fee from nuclear utilities and to recommend to Congress that the nuclear waste fund fee be set to zero. In January 2014, the DOE sent its court mandated proposal to adjust the current fee to zero, which Congress approved in May 2014.
At the time that the DOE decided to stop the Yucca Mountain project and withdraw the application, the Secretary of Energy convened a Blue Ribbon Commission to recommend alternatives to Yucca Mountain for disposal of used nuclear fuel. In January 2012, the Blue Ribbon Commission report was issued. In January 2013, the DOE provided its report to Congress relative to their plans to implement the Blue Ribbon Commission’s recommendations including the required legislative changes and authorizations. The report also announced the Obama Administration’s intent to make a pilot consolidated interim storage facility available in 2021, a larger consolidated interim storage facility available in 2025 and a deep geologic repository available in 2048. See Note 13 and Note 14 to the consolidated financial statements for further discussion.
Nuclear Spent Fuel StorageNSP-Minnesota has interim on-site storage for spent nuclear fuel at its Monticello and PI nuclear generating plants. As of Dec. 31, 2014, there were 38 casks loaded and stored at the PI plant and 15 canisters loaded and stored at the Monticello plant. An additional 26 casks for PI and 15 canisters for Monticello have been authorized by the State of Minnesota. This currently authorized storage capacity is sufficient to allow NSP-Minnesota to operate until the end of the operating licenses in 2030 for Monticello, 2033 for PI Unit 1, and 2034 for PI Unit 2. Authorizations for additional spent fuel storage capacity may be required at each site to support either continued operation or decommissioning if the federal government does not begin operation of a consolidated interim storage installation by the time frames established in the DOE’s Strategy for the Management and Disposal of Used Nuclear Fuel and High-Level Radioactive Waste issued in January 2013.
PFS — The eight partners of PFS, including NSP-Minnesota, have withdrawn their license termination request from the NRC and have stopped activities to dissolve the LLC. This action was taken when the NRC changed its fee rules to no longer require certain licensees like PFS to pay annual fees until their facility becomes operational. PFS is currently reviewing its plans for the future.
NRC Waste Confidence Decision (WCD) — In June 2012, the D.C. Circuit issued a ruling to vacate and remand the NRC’s WCD. The WCD assesses how long temporary on-site storage can remain safe and when facilities for the disposal of nuclear waste will become available. The D.C. Circuit remanded the WCD to the NRC and directed it to prepare an EIS if there are significant impacts or an environmental assessment to support a finding of no significant impact. In September 2014, the NRC published a Generic Environmental Impact Statement (GEIS) and revised WCD rule, now called the Continued Storage Rule (CSR) on the temporary on-site storage of spent nuclear fuel. Issuance of the CSR now allows the NRC to proceed with final license decisions regarding the new and renewal of plant and Independent Spent Fuel Storage Installation (ISFSI) operating licenses without the need to litigate contentions related to the continued storage of spent nuclear fuel on-site. This may facilitate potential future licensing needs for NSP-Minnesota.
See Notes 13 and 14 to the consolidated financial statements for further discussion regarding nuclear related items.
Nuclear Plant Power Uprates and Life Extension
PI ISFSI License Renewal — The current license to operate an ISFSI at PI expired in October 2013. An application to renew the ISFSI license for an additional 40 years until 2053 was submitted by NSP-Minnesota to the NRC in October 2011. As PI met the NRC’s criteria for timely renewal, it will be allowed to continue to operate under the current license until the NRC has rendered a decision on the license renewal application. The NRC’s ASLB will establish a schedule for the hearing which should be completed by the second half of 2015.
Monticello Nuclear Uprate Project — NSP-Minnesota has received all federal and state approvals that are necessary and has completed all of the plant modifications to achieve the 71 MW capacity Monticello Nuclear Uprate Project and is in the process of completing the power ascension testing required by the NRC. Operation at the full increased power level is expected in the first half of 2015. As of Dec. 31, 2014, Monticello was operating at 656 MW, which includes approximately 56 MW of the extended uprate capacity. See Note 12 to the consolidated financial statements for further discussion.
Schedule Q-3 Page 26 of 182
Sponsor: Robinson Case No. 15-00139-UT

11
Energy Source Statistics
Year Ended Dec. 312014 2013 2012
NSP SystemMillions of
KWhPercent ofGeneration
Millions ofKWh
Percent ofGeneration
Millions ofKWh
Percent ofGeneration
Coal . . . . . . . . . . . . . . . . . . . . . . . . . . . . . . . . 18,079 39% 15,844 36% 16,023 35%Nuclear . . . . . . . . . . . . . . . . . . . . . . . . . . . . . 13,434 29 12,161 28 13,231 29Natural Gas . . . . . . . . . . . . . . . . . . . . . . . . . . 3,402 7 5,550 13 6,200 13Wind (a) . . . . . . . . . . . . . . . . . . . . . . . . . . . . . 6,243 14 5,481 13 5,443 12Hydroelectric. . . . . . . . . . . . . . . . . . . . . . . . . 3,560 8 3,223 7 3,193 7Other (b) . . . . . . . . . . . . . . . . . . . . . . . . . . . . . 1,417 3 1,323 3 1,617 4
Total . . . . . . . . . . . . . . . . . . . . . . . . . . . . . . 46,135 100% 43,582 100% 45,707 100%
Owned generation . . . . . . . . . . . . . . . . . . . . . 33,641 73% 29,249 67% 31,365 69%Purchased generation . . . . . . . . . . . . . . . . . . 12,494 27 14,333 33 14,342 31
Total . . . . . . . . . . . . . . . . . . . . . . . . . . . . . . 46,135 100% 43,582 100% 45,707 100%(a) This category includes wind energy de-bundled from RECs and also includes Windsource RECs. The NSP System uses RECs to meet or exceed state resource
requirements and may sell surplus RECs.(b) Includes energy from other sources, including solar, biomass, oil and refuse. Distributed generation from the Solar*Rewards program is not included, and was
approximately seven, eight, and six net million KWh for 2014, 2013, and 2012, respectively.
Fuel Supply and Costs
The following table shows the delivered cost per MMBtu of each significant category of fuel consumed for owned electric generation, the percentage of total fuel requirements represented by each category of fuel and the total weighted average cost of all fuels.
Coal (a) Nuclear Natural GasWeightedAverage
Owned Fuel CostNSP System Generating Plants Cost Percent Cost Percent Cost Percent
2014 . . . . . . . . . . . . . . . . . . . . . . . . . . . . $ 2.23 52% $ 0.89 42% $ 6.27 6% $ 1.942013 . . . . . . . . . . . . . . . . . . . . . . . . . . . . 2.20 49 0.95 40 5.08 11 2.032012 . . . . . . . . . . . . . . . . . . . . . . . . . . . . 2.13 47 0.90 42 4.21 11 1.88
(a) Includes refuse-derived fuel and wood.
The higher cost of natural gas was primarily due to higher market prices from increased demand because of cold weather in early 2014.
See Items 1A and 7 for further discussion of fuel supply and costs.
Fuel Sources
Coal — The NSP System normally maintains approximately 41 days of coal inventory. Coal supply inventories at Dec. 31, 2014 and 2013 were approximately 27 and 34 days usage, respectively. At Dec. 31, 2014, coal inventories were below optimal levels due to railcar congestion. NSP-Minnesota’s generation stations use low-sulfur western coal purchased primarily under contracts with suppliers operating in Wyoming and Montana. During 2014 and 2013, coal requirements for the NSP System’s major coal-fired generating plants were approximately 9.3 million tons and 7.3 million tons, respectively. Coal requirements for 2014 were higher as Sherco Unit 3 was placed back in service. The estimated coal requirements for 2015 are approximately 8.7 million tons, which reflects the retirement of Black Dog Units 3 and 4.
NSP-Minnesota and NSP-Wisconsin have contracted for coal supplies to provide 88 percent of their estimated coal requirements in 2015, and a declining percentage of the requirements in subsequent years. The NSP System’s general coal purchasing objective is to contract for approximately 100 percent of requirements for the first year, 67 percent of requirements in year two, and 33 percent of requirements in year three. Remaining requirements will be filled through the procurement process or over-the-counter transactions.
NSP-Minnesota and NSP-Wisconsin have a number of coal transportation contracts that provide for delivery of 100 percent of their coal requirements in 2015 and 2016. Coal delivery may be subject to interruptions or reductions due to operation of the mines, transportation problems, weather and availability of equipment.
Schedule Q-3 Page 27 of 182
Sponsor: Robinson Case No. 15-00139-UT

12
Nuclear — NSP-Minnesota secures contracts for uranium concentrates, uranium conversion, uranium enrichment and fuel fabrication to operate its’ nuclear plants. The contract strategy involves a portfolio of spot purchases and medium and long-term contracts for uranium concentrates, conversion services and enrichment services with multiple producers and with a focus on diversification to minimize potential impacts caused by supply interruptions due to geographical and world political issues.
• Current nuclear fuel supply contracts cover 100 percent of uranium concentrates requirements through 2018 and approximately 72 percent of the requirements for 2019 through 2027.
• Current contracts for conversion services cover 100 percent of the requirements through 2021 and approximately 62 percent of the requirements for 2022 through 2027.
• Current enrichment service contracts cover 100 percent of the requirements through 2021 and approximately 68 percent of the requirements for 2025 through 2027.
Fabrication services for Monticello and PI are 100 percent committed through 2030 and 2019, respectively.
NSP-Minnesota expects sufficient uranium concentrates, conversion services and enrichment services to be available for the total fuel requirements of its nuclear generating plants. Some exposure to spot market price volatility will remain due to index-based pricing structures contained in certain supply contracts.
Natural gas — The NSP System uses both firm and interruptible natural gas supply and standby oil in combustion turbines and certain boilers. Natural gas supplies, transportation and storage services for power plants are procured under contracts to provide an adequate supply of fuel. However, as natural gas primarily serves intermediate and peak demand, remaining forecasted requirements are able to be procured through a liquid spot market. Generally, natural gas supply contracts have variable pricing that is tied to various natural gas indices. Most transportation contract pricing is based on FERC approved transportation tariff rates. Certain natural gas supply and transportation agreements include obligations for the purchase and/or delivery of specified volumes of natural gas or to make payments in lieu of delivery. At Dec. 31, 2014 and 2013, the NSP System did not have any commitments related to gas supply contracts; however commitments related to gas transportation and storage contracts were approximately $349 million and $389 million, respectively. Commitments related to gas transportation and storage contracts expire in various years from 2015 to 2028.
The NSP System also has limited on-site fuel oil storage facilities and primarily relies on the spot market for incremental supplies.
Renewable Energy Sources
The NSP System’s renewable energy portfolio includes wind, hydroelectric, biomass and solar power from both owned generating facilities and PPAs. As of Dec. 31, 2014, the NSP System was in compliance with mandated RPS, which require generation from renewable resources of 18 percent and 12.9 percent of NSP-Minnesota and NSP-Wisconsin electric retail sales, respectively.
• Renewable energy comprised 24.2 percent and 22.9 percent of the NSP System’s total owned and purchased energy for 2014 and 2013, respectively.
• Wind energy comprised 13.7 percent and 12.6 percent of the total owned and purchased energy on the NSP System for 2014 and 2013, respectively.
• Hydroelectric energy comprised 7.8 percent and 7.4 percent of the total owned and purchased energy on the NSP System for 2014 and 2013, respectively.
• Biomass and solar power comprised approximately 2.7 percent and 3.0 percent of the total owned and purchased energy on the NSP System for 2014 and 2013, respectively.
The NSP System also offers customer-focused renewable energy initiatives. Windsource® allows customers in Minnesota, Wisconsin, and Michigan to purchase a portion or all of their electricity from renewable sources. In 2014, the number of customers utilizing Windsource increased to approximately 43,000 from 37,000 in 2013. Windsource MWh sales increased from approximately 181,000 MWh in 2013 to 186,000 MWh in 2014.
Additionally, to encourage the growth of solar energy on the system, customers are offered incentives to install solar panels on their homes and businesses under the Solar*Rewards® program. Over 915 PV systems with approximately 11.1 MW of aggregate capacity and over 679 PV systems with approximately 7.3 MW of aggregate capacity have been installed in Minnesota under this program as of Dec. 31, 2014 and 2013, respectively.
As part of NSP-Minnesota’s North Dakota 2013 electric rate case settlement, NSP-Minnesota is required to file a system restack proposal in 2015 to ensure that additional costs for compliance with Minnesota renewable initiatives are not paid for by North Dakota customers.
Schedule Q-3 Page 28 of 182
Sponsor: Robinson Case No. 15-00139-UT

13
Wind — The NSP System acquires the majority of its wind energy from PPAs with wind farm owners, primarily located in Southwestern Minnesota. Currently, the NSP System has more than 100 of these agreements in place, with facilities ranging in size from under one MW to more than 200 MW. The NSP System owns and operates two wind farms which have the capacity to generate 302 MWs. Collectively, the NSP System had approximately 1,860 MWs of wind energy on its system at the end of 2014 and 2013. In October 2013, the MPUC approved four new projects, which are anticipated to provide up to 750 MW of capacity, including two projects totaling 350 MW that will be owned by NSP-Minnesota. One additional 20 MW project was approved in 2014. All five projects are targeted to be operational in late 2015. With the new projects, the NSP System is anticipated to have approximately 2,630 MWs of wind power. In addition to receiving purchased wind energy under these agreements, the NSP System also typically receives wind RECs, which are used to meet state renewable resource requirements. The average cost per MWh of wind energy under the existing contracts was approximately $41 for 2014 and 2013. The cost per MWh of wind energy varies by contract and may be influenced by a number of factors including regulation, state-specific renewable resource requirements, and the year of contract execution. Generally, contracts executed in 2014 continued to benefit from improvements in technology, excess capacity among manufacturers, and motivation to commence new construction prior to the expiration of the Federal PTCs in 2014, with certain projects qualifying into future years.
Hydroelectric — The NSP System acquires its hydroelectric energy from both owned generation and PPAs. The NSP System owns 20 hydroelectric plants throughout Wisconsin and Minnesota which provide 268 MW of capacity. For 2014, PPAs provided approximately 38 MW of hydroelectric capacity. Additionally, the NSP System purchases approximately 850 MW of generation from Manitoba Hydro which is sourced primarily from its fleet of hydroelectric facilities.
Wholesale Commodity Marketing Operations
NSP-Minnesota conducts various wholesale marketing operations, including the purchase and sale of electric capacity, energy and energy-related products. See Item 7 for further discussion.
NSP-WisconsinPublic Utility Regulation
Summary of Regulatory Agencies and Areas of Jurisdiction — Retail rates, services and other aspects of NSP-Wisconsin’s operations are regulated by the PSCW and the MPSC, within their respective states. In addition, each of the state commissions certifies the need for new generating plants and electric transmission lines before the facilities may be sited and built. NSP-Wisconsin is subject to the jurisdiction of the FERC with respect to its wholesale electric operations, hydroelectric generation licensing, accounting practices, wholesale sales for resale, the transmission of electricity in interstate commerce, compliance with the NERC electric reliability standards, asset transactions and mergers, and natural gas transactions in interstate commerce. NSP-Wisconsin and NSP-Minnesota have been granted continued joint authorization from the FERC to make wholesale electric sales at market-based prices. NSP-Wisconsin is a transmission owning member of the MISO RTO.
The PSCW has a biennial base rate filing requirement. By June of each odd numbered year, NSP-Wisconsin must submit a rate filing for the test year beginning the following January. In recent years, NSP-Wisconsin has been submitting rate filings each year.
Fuel and Purchased Energy Cost Recovery Mechanisms — NSP-Wisconsin does not have an automatic electric fuel adjustment clause for Wisconsin retail customers. Instead, under Wisconsin rules, utilities submit a forward-looking annual fuel cost plan to the PSCW for approval. Once the PSCW approves the fuel cost plan, utilities defer the amount of any fuel cost under-collection or over-collection in excess of a two percent annual tolerance band, for future rate recovery or refund. Approval of a fuel cost plan and any rate adjustment for refund or recovery of deferred costs is determined by the PSCW after an opportunity for a hearing. Rate recovery of deferred fuel cost is subject to an earnings test based on the utility’s most recently authorized ROE. Fuel cost under-collections that exceed the two percent annual tolerance band for a calendar year may not be recovered if the utility earnings for that year exceed the authorized ROE.
NSP-Wisconsin’s retail electric rate schedules for Michigan customers include power supply cost recovery factors, which are based on 12-month projections. After each 12-month period, a reconciliation is submitted whereby over-collections are refunded and any under-collections are collected from the customers over the subsequent 12-month period.
Wisconsin Energy Efficiency Program — In Wisconsin, the primary energy efficiency program is funded by the state’s utilities, but operated by independent contractors subject to oversight by the PSCW and the utilities. NSP-Wisconsin recovers these costs in rates charged to Wisconsin retail customers.
Capacity and Demand
NSP-Wisconsin operates an integrated system with NSP-Minnesota. See NSP-Minnesota Capacity and Demand.
Schedule Q-3 Page 29 of 182
Sponsor: Robinson Case No. 15-00139-UT

14
Energy Sources and Related Transmission Initiatives
NSP-Wisconsin operates an integrated system with NSP-Minnesota. See NSP-Minnesota Energy Sources and Related Transmission Initiatives.
NSP-Wisconsin CapX2020 CPCN — The PSCW issued a CPCN for the Wisconsin portion of the Hampton, Minn. to La Crosse, Wis. project in May 2012. The Wisconsin route is approximately 50 miles of new transmission line with an estimated cost of $211 million. The line is expected to go into service in the fall of 2015.
NSP-Wisconsin / American Transmission Company, LLC (ATC) - La Crosse, Wis. to Madison, Wis. Transmission Line — In October 2013, NSP-Wisconsin and ATC jointly filed an application with the PSCW for a CPCN for a new 345 KV transmission line that would extend from La Crosse, Wis. to Madison, Wis. The proposed line, known as the Badger Coulee line, would run between 154 and 187 miles based on the permitted route, which includes an estimated project cost, including AFUDC, of between $540 and $580 million. NSP-Wisconsin’s half of the project is shared with two partners, Dairyland Power Cooperative and WPPI Energy. NSP-Wisconsin’s portion of the investment is estimated to be between $190 and $207 million. In 2011, MISO determined the line to be a MVP project, and as such, eligible for cost sharing under MISO’s MVP tariff. The PSCW held hearings on the application in January 2015, and a decision is expected by April 2015. If approved, NSP-Wisconsin and ATC anticipate beginning construction on the line in late 2016, with completion by late 2018.
Fuel Supply and Costs
NSP-Wisconsin operates an integrated system with NSP-Minnesota. See NSP-Minnesota Fuel Supply and Costs.
PSCoPublic Utility Regulation
Summary of Regulatory Agencies and Areas of Jurisdiction — PSCo is regulated by the CPUC with respect to its facilities, rates, accounts, services and issuance of securities. PSCo is regulated by the FERC with respect to its wholesale electric operations, accounting practices, hydroelectric licensing, wholesale sales for resale, the transmission of electricity in interstate commerce, compliance with the NERC electric reliability standards, asset transactions and mergers and natural gas transactions in interstate commerce.
Fuel, Purchased Energy and Conservation Cost-Recovery Mechanisms — PSCo has several retail adjustment clauses that recover fuel, purchased energy and other resource costs:
• ECA — The ECA recovers fuel and purchased energy costs. Short-term sales margins are shared with retail customers through the ECA. The ECA is revised quarterly.
• PCCA — The PCCA recovers purchased capacity payments.• SCA — The SCA recovers the difference between PSCo’s actual cost of fuel and the amount of these costs recovered under its
base steam service rates. The SCA rate is revised annually in January, as well as on an interim basis.• DSMCA — The DSMCA recovers DSM, interruptible service option credit costs and performance initiatives for achieving
various energy savings goals.• RESA — The RESA recovers the incremental costs of compliance with the RES with a maximum of two percent of the
customer’s total bill.• Wind Energy Service — Wind Energy Service is a premium service for customers who voluntarily choose to pay an additional
charge for renewable resources.• TCA — The TCA recovers costs associated with transmission investment outside of rate cases.• CACJA — As part of its pending electric rate case, PSCo proposed to establish a CACJA rider, retroactive to Jan. 1, 2015, to
recover costs associated with implementing its compliance plan under the CACJA.
PSCo recovers fuel and purchased energy costs from its wholesale electric customers through a fuel cost adjustment clause approved by the FERC. PSCo’s wholesale customers have agreed to pay the full cost of certain renewable energy purchase and generation costs through a fuel clause and in exchange receive RECs associated with those resources. The wholesale customers pay their jurisdictional allocation of production costs through a fully forecasted formula rate with true-up.
Schedule Q-3 Page 30 of 182
Sponsor: Robinson Case No. 15-00139-UT
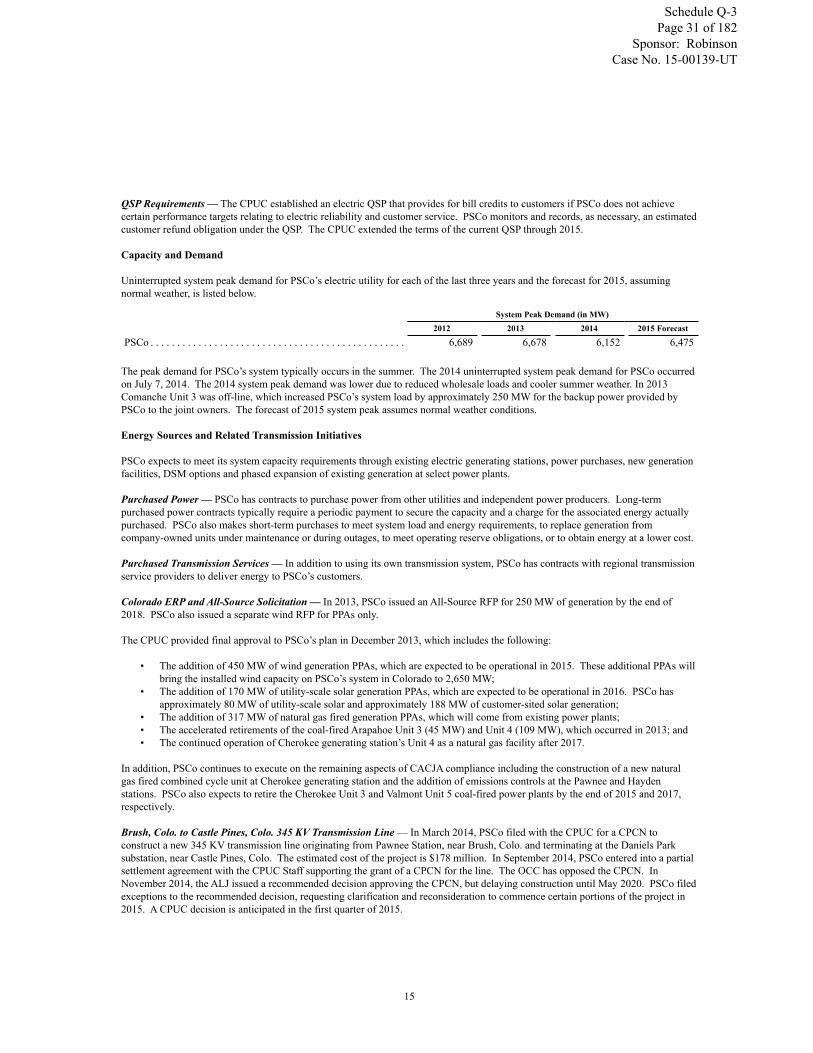
15
QSP Requirements — The CPUC established an electric QSP that provides for bill credits to customers if PSCo does not achieve certain performance targets relating to electric reliability and customer service. PSCo monitors and records, as necessary, an estimated customer refund obligation under the QSP. The CPUC extended the terms of the current QSP through 2015.
Capacity and Demand
Uninterrupted system peak demand for PSCo’s electric utility for each of the last three years and the forecast for 2015, assuming normal weather, is listed below.
System Peak Demand (in MW)2012 2013 2014 2015 Forecast
PSCo . . . . . . . . . . . . . . . . . . . . . . . . . . . . . . . . . . . . . . . . . . . . . . . . 6,689 6,678 6,152 6,475
The peak demand for PSCo’s system typically occurs in the summer. The 2014 uninterrupted system peak demand for PSCo occurred on July 7, 2014. The 2014 system peak demand was lower due to reduced wholesale loads and cooler summer weather. In 2013 Comanche Unit 3 was off-line, which increased PSCo’s system load by approximately 250 MW for the backup power provided by PSCo to the joint owners. The forecast of 2015 system peak assumes normal weather conditions.
Energy Sources and Related Transmission Initiatives
PSCo expects to meet its system capacity requirements through existing electric generating stations, power purchases, new generation facilities, DSM options and phased expansion of existing generation at select power plants.
Purchased Power — PSCo has contracts to purchase power from other utilities and independent power producers. Long-term purchased power contracts typically require a periodic payment to secure the capacity and a charge for the associated energy actually purchased. PSCo also makes short-term purchases to meet system load and energy requirements, to replace generation from company-owned units under maintenance or during outages, to meet operating reserve obligations, or to obtain energy at a lower cost.
Purchased Transmission Services — In addition to using its own transmission system, PSCo has contracts with regional transmission service providers to deliver energy to PSCo’s customers.
Colorado ERP and All-Source Solicitation — In 2013, PSCo issued an All-Source RFP for 250 MW of generation by the end of 2018. PSCo also issued a separate wind RFP for PPAs only.
The CPUC provided final approval to PSCo’s plan in December 2013, which includes the following:
• The addition of 450 MW of wind generation PPAs, which are expected to be operational in 2015. These additional PPAs will bring the installed wind capacity on PSCo’s system in Colorado to 2,650 MW;
• The addition of 170 MW of utility-scale solar generation PPAs, which are expected to be operational in 2016. PSCo has approximately 80 MW of utility-scale solar and approximately 188 MW of customer-sited solar generation;
• The addition of 317 MW of natural gas fired generation PPAs, which will come from existing power plants;• The accelerated retirements of the coal-fired Arapahoe Unit 3 (45 MW) and Unit 4 (109 MW), which occurred in 2013; and• The continued operation of Cherokee generating station’s Unit 4 as a natural gas facility after 2017.
In addition, PSCo continues to execute on the remaining aspects of CACJA compliance including the construction of a new natural gas fired combined cycle unit at Cherokee generating station and the addition of emissions controls at the Pawnee and Hayden stations. PSCo also expects to retire the Cherokee Unit 3 and Valmont Unit 5 coal-fired power plants by the end of 2015 and 2017, respectively.
Brush, Colo. to Castle Pines, Colo. 345 KV Transmission Line — In March 2014, PSCo filed with the CPUC for a CPCN to construct a new 345 KV transmission line originating from Pawnee Station, near Brush, Colo. and terminating at the Daniels Park substation, near Castle Pines, Colo. The estimated cost of the project is $178 million. In September 2014, PSCo entered into a partial settlement agreement with the CPUC Staff supporting the grant of a CPCN for the line. The OCC has opposed the CPCN. In November 2014, the ALJ issued a recommended decision approving the CPCN, but delaying construction until May 2020. PSCo filed exceptions to the recommended decision, requesting clarification and reconsideration to commence certain portions of the project in 2015. A CPUC decision is anticipated in the first quarter of 2015.
Schedule Q-3 Page 31 of 182
Sponsor: Robinson Case No. 15-00139-UT

16
Thornton, Colo. Substation Project — In October 2014, PSCo filed with the CPUC for a CPCN to construct a new substation to serve growing load in and around Thornton, Colo. to be placed into service in July 2016. The estimated cost of the project is approximately $34 million. The OCC and the City of Thornton have intervened in the CPCN proceeding. In November 2014, the matter was referred to an ALJ for hearing procedures. In January 2015, PSCo and the OCC filed a settlement agreement with the CPUC requesting approval of the CPCN. The City of Thornton did not oppose the settlement. An evidentiary hearing was held in February 2015 and a CPUC decision is anticipated in the first quarter of 2015.
Boulder, Colo. Municipalization — PSCo’s franchise agreement with the City of Boulder (Boulder) expired in December 2010. In November 2011, a ballot measure was passed which authorized the formation and operation of a municipal utility and the issuance of enterprise revenue bonds, subject to certain restrictions, including the level of initial rates and debt service coverage. In May 2014, the Boulder City Council passed an ordinance to establish an electric utility.
In 2013, the CPUC ruled that it has jurisdiction under Colorado law to determine the utility that will serve customers outside Boulder’s city limits, and will determine certain system separation matters as well as what facilities need to be constructed to ensure reliable service. The CPUC has declared that it should make its determinations prior to any eminent domain actions. In January 2014, Boulder appealed this ruling to the Boulder District Court. In January 2015, the Boulder District Court affirmed the CPUC decision.
Boulder sent PSCo an offer of $128 million for certain portions of PSCo’s transmission and distribution business. PSCo has notified Boulder that its offer was deficient. Under Colorado law, a condemning entity must pay the owner fair market value for the taking of and damages to the remainder of the property.
In July 2014, Boulder filed a petition for condemnation in the Boulder District Court. PSCo filed a motion to dismiss the petition based upon the CPUC’s ruling that it must determine the appropriate system separations prior to Boulder filing its condemnation case. PSCo’s motion to dismiss was granted in February 2015. This decision does not prevent Boulder from filing another condemnation petition if it obtains CPUC approval of a separation plan.
In August 2014, PSCo filed a petition with the FERC requesting an order requiring that Boulder’s attempt to acquire PSCo’s transmission and distribution facilities by condemnation requires prior FERC approval under the Federal Power Act. In December 2014, the FERC issued an order granting PSCo’s petition.
If Boulder proceeds with another condemnation petition and were to succeed in the eminent domain proceeding, PSCo would seek to obtain full compensation for the business and its associated property taken by Boulder, as well as for all damages resulting to PSCo and its system. PSCo would also seek appropriate compensation for stranded costs with the FERC.
RES Compliance Plan — Colorado law mandates that at least 30 percent of PSCo’s energy sales are supplied by renewable energy by 2020 and includes a distributed generation standard. In July 2013, PSCo filed its 2014 RES compliance plan. In July 2014, the ALJ issued a recommended decision accepting PSCo’s compliance plan with modifications. The CPUC approved the recommended decision with modifications in December 2014. PSCo subsequently requested additional adjustments to the CPUC’s decision, which were granted through an order issued in February 2015.
Net Metering Standard — In a filing, PSCo proposed to track and quantify the system costs that are not avoided by distributed solar generation, which PSCo has defined as a “net metering incentive,” for purposes of equitably recovering costs between customers. The CPUC assigned the net metering issue to its own docket. A CPUC decision is anticipated in the third quarter of 2015.
Steam System Package Boilers and Regulatory Plan — In December 2014, PSCo filed the results of a steam survey along with both a short-term plan and a long-term plan for the steam system consisting of a request for a conditional CPCN to construct either one or two boilers for its steam utility, dependent on the next two seasons of winter peaking capacity. A decision is anticipated in the third quarter of 2015.
Schedule Q-3 Page 32 of 182
Sponsor: Robinson Case No. 15-00139-UT

17
Energy Source Statistics
Year Ended Dec. 312014 2013 2012
PSCoMillions of
KWhPercent ofGeneration
Millions ofKWh
Percent ofGeneration
Millions ofKWh
Percent ofGeneration
Coal . . . . . . . . . . . . . . . . . . . . . . . . . . . . . . . . 18,274 53% 19,647 56% 21,367 59%Natural Gas . . . . . . . . . . . . . . . . . . . . . . . . . . 8,601 25 7,565 22 7,930 22Wind (a) . . . . . . . . . . . . . . . . . . . . . . . . . . . . . 6,472 19 6,750 19 5,752 16Hydroelectric. . . . . . . . . . . . . . . . . . . . . . . . . 617 2 655 2 590 2Other (b) . . . . . . . . . . . . . . . . . . . . . . . . . . . . . 294 1 250 1 263 1
Total . . . . . . . . . . . . . . . . . . . . . . . . . . . . . . 34,258 100% 34,867 100% 35,902 100%
Owned generation . . . . . . . . . . . . . . . . . . . . . 23,023 67% 22,873 66% 23,766 66%Purchased generation . . . . . . . . . . . . . . . . . . 11,235 33 11,994 34 12,136 34
Total . . . . . . . . . . . . . . . . . . . . . . . . . . . . . . 34,258 100% 34,867 100% 35,902 100%(a) This category includes wind energy de-bundled from RECs and also includes Windsource RECs. PSCo uses RECs to meet or exceed state resource requirements
and may sell surplus RECs.(b) Distributed generation from the Solar*Rewards program is not included, and was approximately 197, 172, and 133 net million KWh for 2014, 2013, and 2012,
respectively.
Fuel Supply and Costs
The following table shows the delivered cost per MMBtu of each significant category of fuel consumed for owned electric generation, the percentage of total fuel requirements represented by each category of fuel and the total weighted average cost of all fuels.
Coal Natural Gas Weighted AverageOwned Fuel CostPSCo Generating Plants Cost Percent Cost Percent
2014 . . . . . . . . . . . . . . . . . . . . . . . . . . . . . . . . . . . . . . . . . . . . $ 1.82 75% $ 5.32 25% $ 2.682013 . . . . . . . . . . . . . . . . . . . . . . . . . . . . . . . . . . . . . . . . . . . . 1.84 80 4.86 20 2.452012 . . . . . . . . . . . . . . . . . . . . . . . . . . . . . . . . . . . . . . . . . . . . 1.77 78 4.25 22 2.31
The higher cost of natural gas was primarily due to higher market prices from increased demand because of cold weather in early 2014.
See Items 1A and 7 for further discussion of fuel supply and costs.
Fuel Sources
Coal — PSCo normally maintains approximately 41 days of coal inventory. Coal supply inventories at Dec. 31, 2014 and 2013 were approximately 36 and 41 days usage, respectively. At Dec. 31, 2014, coal inventories were below optimal levels due to railcar congestion. PSCo’s generation stations use low-sulfur western coal purchased primarily under contracts with suppliers operating in Colorado and Wyoming. During 2014 and 2013, PSCo’s coal requirements for existing plants were approximately 10.3 million tons and 11.3 million tons, respectively. The estimated coal requirements for 2015 are approximately 11.0 million tons.
PSCo has contracted for coal supply to provide 96 percent of its estimated coal requirements in 2015, and a declining percentage of requirements in subsequent years. PSCo’s general coal purchasing objective is to contract for approximately 100 percent of requirements for the first year, 67 percent of requirements in year two, and 33 percent of requirements in year three. Remaining requirements will be filled through the procurement process or over-the-counter transactions.
PSCo has coal transportation contracts that provide for delivery of 100 percent of its coal requirements in 2015 and 2016. Coal delivery may be subject to interruptions or reductions due to operation of the mines, transportation problems, weather and availability of equipment.
Schedule Q-3 Page 33 of 182
Sponsor: Robinson Case No. 15-00139-UT

18
Natural gas — PSCo uses both firm and interruptible natural gas supply and standby oil in combustion turbines and certain boilers. Natural gas supplies for PSCo’s power plants are procured under contracts to provide an adequate supply of fuel. However, as natural gas primarily serves intermediate and peak demand, any remaining forecasted requirements are able to be procured through a liquid spot market. The majority of natural gas supply under contract is covered by a long-term agreement with Anadarko Energy Services Company, the balance of natural gas supply contracts have variable pricing features tied to changes in various natural gas indices. PSCo hedges a portion of that risk through financial instruments. See Note 11 to the consolidated financial statements for further discussion.
Most transportation contract pricing is based on FERC approved transportation tariff rates. Certain natural gas supply and transportation agreements include obligations for the purchase and/or delivery of specified volumes of natural gas or to make payments in lieu of delivery.
• At Dec. 31, 2014, PSCo’s commitments related to gas supply contracts, which expire in various years from 2015 through 2023, were approximately $902 million and commitments related to gas transportation and storage contracts, which expire in various years from 2015 through 2060, were approximately $685 million.
• At Dec. 31, 2013, PSCo’s commitments related to gas supply contracts were approximately $1.1 billion and commitments related to gas transportation and storage contracts were approximately $723 million.
PSCo has limited on-site fuel oil storage facilities and primarily relies on the spot market for incremental supplies.
Renewable Energy Sources
PSCo’s renewable energy portfolio includes wind, hydroelectric, biomass and solar power from both owned generating facilities and PPAs. As of Dec. 31, 2014, PSCo was in compliance with mandated RPS, which require generation from renewable resources of 12 percent of electric retail sales.
• Renewable energy comprised 21.4 percent and 21.9 percent of PSCo’s total owned and purchased energy for 2014 and 2013, respectively.
• Wind energy comprised 18.9 percent and 19.3 percent of PSCo’s total owned and purchased energy for 2014 and 2013, respectively.
• Hydroelectric, biomass and solar power comprised approximately 2.5 percent and 2.6 percent of PSCo’s total owned and purchased energy for 2014 and 2013.
PSCo also offers customer-focused renewable energy initiatives. Windsource allows customers to purchase a portion or all of their electricity from renewable sources. In 2014, the number of customers utilizing Windsource increased to approximately 41,000 from 37,000 in 2013. Windsource MWh sales declined slightly, due in part to loss of certain commercial customers, from approximately 197,000 MWh in 2013 to 188,000 MWh in 2014.
Additionally, to encourage the growth of solar energy on the system, customers are offered incentives to install solar panels on their homes and businesses under the Solar*Rewards program. Over 24,000 PV systems with approximately 221 MW of aggregate capacity and over 18,250 PV systems with approximately 188 MW of aggregate capacity have been installed in Colorado under this program as of Dec. 31, 2014 and 2013, respectively. In 2014, the first community solar gardens were interconnected in Colorado. As of Dec. 31, 2014, 14 gardens have been completed with 9.6 MW of capacity.
Wind — PSCo acquires the majority of its wind energy from PPAs with wind farm owners, primarily located in Colorado. Currently, PSCo has 18 of these agreements in place, with facilities ranging in size from two MW to over 300 MW. PSCo owns and operates the 26 MW Ponnequin Wind Farm in northern Colorado, which has been in service since 1999.
• PSCo had approximately 2,340 MW and 2,170 MW of wind energy on its system at the end of 2014 and 2013, respectively.• In October 2013, the CPUC approved the addition of 450 MW of Colorado wind generation PPA’s.• With the new projects, PSCo is anticipated to have approximately 2,592 MW of wind power by 2016. In addition to
receiving purchased wind energy under these agreements, PSCo also typically receives wind RECs, which are used to meet state renewable resource requirements.
• The average cost per MWh of wind energy under these contracts was approximately $45 in both 2014 and 2013. The cost per MWh of wind energy varies by contract and may be influenced by a number of factors including regulation, state-specific renewable resource requirements, and the year of contract execution. Generally, contracts executed in 2014 continued to benefit from improvements in technology, excess capacity among manufacturers, and motivation to commence new construction prior to the expiration of the Federal PTCs in 2014, with certain projects qualifying into future years.
Schedule Q-3 Page 34 of 182
Sponsor: Robinson Case No. 15-00139-UT

19
Wholesale Commodity Marketing Operations
PSCo conducts various wholesale marketing operations, including the purchase and sale of electric capacity, energy and energy related products. See Item 7 for further discussion.
SPSPublic Utility Regulation
Summary of Regulatory Agencies and Areas of Jurisdiction — The PUCT and NMPRC regulate SPS’ retail electric operations and have jurisdiction over its retail rates and services and the construction of transmission or generation in their respective states. The municipalities in which SPS operates in Texas have original jurisdiction over SPS’ rates in those communities. Each municipality can deny SPS’ rate increases. SPS can then appeal municipal rate decisions to the PUCT, which hears all municipal rate denials in one hearing. The NMPRC also has jurisdiction over the issuance of securities. SPS is regulated by the FERC with respect to its wholesale electric operations, accounting practices, wholesale sales for resale, the transmission of electricity in interstate commerce, compliance with NERC electric reliability standards, asset transactions and mergers, and natural gas transactions in interstate commerce. SPS has received authorization from the FERC to make wholesale electric sales at market-based prices.
Fuel, Purchased Energy and Conservation Cost-Recovery Mechanisms — SPS has several retail adjustment clauses that recover fuel, purchased energy and other resource costs:
• DCRF — The DCRF rider recovers distribution costs in Texas.• DRC — The DRC rider previously recovered deferred costs associated with renewable energy programs in New Mexico.• EECRF — The EECRF rider recovers costs associated with providing energy efficiency programs in Texas.• EE rider — The EE rider recovers costs associated with providing energy efficiency programs in New Mexico.• FPPCAC — The FPPCAC adjusts monthly to recover the difference between the actual fuel and purchased power costs and the
amount included in base rates of SPS’ New Mexico retail jurisdiction.• PCRF — The PCRF rider allows recovery of certain purchased power costs in Texas.• RPS — The RPS rider recovers deferred costs associated with renewable energy programs in New Mexico.• TCRF — The TCRF rider recovers transmission infrastructure improvement costs and changes in wholesale transmission
charges in Texas.
Fuel and purchased energy costs are recovered in Texas through a fixed fuel and purchased energy recovery factor, which is part of SPS’ retail electric tariff. SO2 and NOx allowance revenues and costs are also recovered through the fixed fuel and purchased energy recovery factor. The regulations allow retail fuel factors to change up to three times per year.
The fixed fuel and purchased energy recovery factor provides for the over- or under-recovery of fuel and purchased energy expenses. Regulations also require refunding or surcharging over- or under- recovery amounts, including interest, when they exceed four percent of the utility’s annual fuel and purchased energy costs on a rolling 12-month basis, if this condition is expected to continue.
PUCT regulations require periodic examination of SPS’ fuel and purchased energy costs, the efficient use of fuel and purchased energy, fuel acquisition and management policies and purchased energy commitments. SPS is required to file an application for the PUCT to retrospectively review fuel and purchased energy costs at least every three years.
NMPRC regulations require SPS to request authority to continue collecting its fuel and purchased power costs through a fuel adjustment clause every four years. The NMPRC previously granted SPS authority to use a fuel adjustment clause through November 2014, and allows its continued use while a new application is pending. In November 2014, SPS filed an application with the NMPRC to continue use of the fuel adjustment clause for an additional four years. Hearings are scheduled for May 2015.
SPS recovers fuel and purchased energy costs from its wholesale customers through a monthly wholesale fuel and purchased economic energy cost adjustment clause accepted for filing by the FERC.
Capacity and Demand
Uninterrupted system peak demand for SPS for each of the last three years and the forecast for 2015, assuming normal weather, is listed below.
System Peak Demand (in MW)2012 2013 2014 2015 Forecast
SPS . . . . . . . . . . . . . . . . . . . . . . . . . . . . . . . . . . . . . . . . . . . . . . . . . 5,265 5,056 4,871 4,982
Schedule Q-3 Page 35 of 182
Sponsor: Robinson Case No. 15-00139-UT

20
The peak demand for the SPS system typically occurs in the summer. The 2014 uninterrupted system peak demand for SPS occurred on Aug. 7, 2014. The 2014 peak demand decreased due to cooler summer weather.
Energy Sources and Related Transmission Initiatives
SPS expects to use existing electric generating stations, power purchases, DSM and new generation options to meet its net dependable system capacity requirements.
Purchased Power — SPS has contracts to purchase power from other utilities and independent power producers. Long-term purchased power contracts typically require a periodic payment to secure the capacity and a charge for the associated energy actually purchased. SPS also makes short-term purchases to meet system load and energy requirements, to replace generation from company-owned units under maintenance or during outages, to meet operating reserve obligations or to obtain energy at a lower cost.
Purchased Transmission Services — SPS has contractual arrangements with SPP and regional transmission service providers, including PSCo, to deliver power and energy to its native load customers, which are retail and wholesale load obligations with terms of more than one year.
SPP Integrated Market (IM) — In February 2014, the FERC granted SPS approval to make sales to the SPP IM at market-based rates. Further, In February and March, respectively, SPS was granted interim approval for revised QF tariff pricing in Texas and New Mexico to be consistent with the new market and to coincide with the start of the IM. The SPP IM began operations in March 2014 and operates in the day ahead and real time energy and ancillary services market. In April 2014, the FERC approved SPS’ filings to modify its wholesale power sales contracts to allow recovery of SPP IM charges and revenues through the SPP wholesale FCA.
SPS Transmission NTCs — As a member of SPP, SPS accepts NTCs for electric transmission line and substation projects to be built within the SPP footprint. SPS has accepted NTCs for projects with an estimated capital cost of approximately $1.9 billion and will continue to review new NTCs for acceptance as they are issued. These projects generally span several years to plan, site, procure and develop. The NMPRC and the PUCT must approve the siting and routing of any SPP identified transmission line NTC projects that require permitting approval. Projects identified through SPP NTCs may have costs allocated to other SPP members in accordance with the SPP OATT. Costs allocated to SPS are permissible for recovery through the NMPRC, the PUCT and the FERC processes.
High Priority Incremental Load Study ReportIn April 2014, the SPP Board of Directors approved the High Priority Incremental Load Study Report, a reliability assessment that evaluated the anticipated transmission needs of certain parts of the SPP resulting from expected load growth in the area. As a result of this study, SPS has received NTCs and conditional NTCs for 44 new transmission projects to be placed into service by 2020. SPS is developing plans for these projects in preparation of submitting CCNs to the PUCT and the NMPRC. These projects are intended to provide regional reliability benefits as well as the ability to serve the increase in load in southeastern New Mexico.
TUCO substation to Woodward, Okla. 345 KV transmission lineThe TUCO to Woodward District extra high voltage interchange is a 345 KV transmission line. SPS constructed the line to just inside the Oklahoma state line, and Oklahoma Gas and Electric Company (OGE) built from there to Woodward, Okla. SPS’ investment in the TUCO to Woodward line and substation is approximately $206 million and is expected to be recovered from SPP members, including SPS, in accordance with the SPP tariff. The line was placed into service in September 2014.
Hitchland substation to Woodward, Okla. 345 KV transmission lineThe Hitchland substation to Woodward, Okla. line is a 345 KV double circuit transmission line and associated substation facilities in the Oklahoma and Texas Panhandle. SPS built the first 30 miles to Beaver County, Okla. and OGE completed the line from there to Woodward, Okla. SPS’ investment for the Hitchland to Woodward line and substation is approximately $58 million and is expected to be recovered from SPP members in accordance with the SPP tariff. The line was placed into service in May 2014.
Potash Junction substation to Roadrunner substation 345 KV transmission lineIn April 2014, SPS filed a CCN with the NMPRC for a new 345 KV transmission line from the Potash Junction substation to the Roadrunner substation, both near Carlsbad, N.M. The proposed line would run 40 miles and cost an estimated $54 million. The NMPRC approved the CCN in December 2014. The line is anticipated to be placed into service in the fourth quarter of 2015.
SPS Resource Plans — SPS is required to develop and implement a renewable portfolio plan in which 15 percent of its energy to serve its New Mexico retail customers is produced by renewable resources in 2015. SPS primarily fulfills its renewable portfolio requirements through PPAs.
Schedule Q-3 Page 36 of 182
Sponsor: Robinson Case No. 15-00139-UT
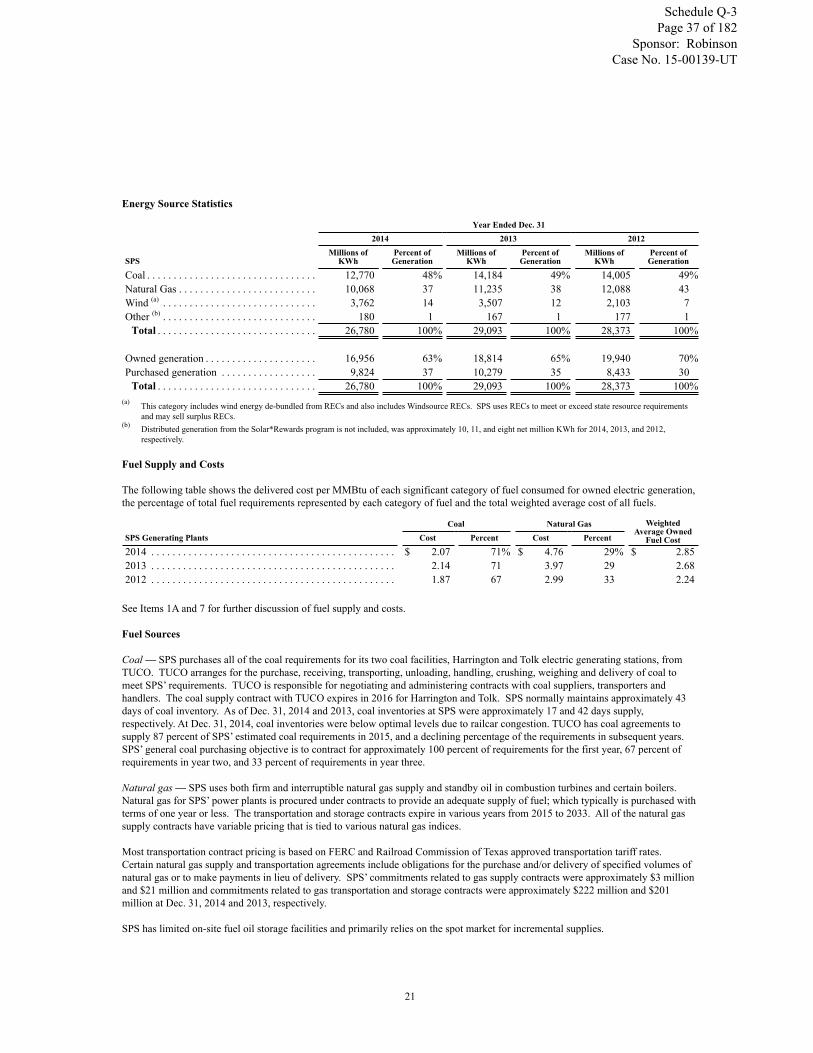
21
Energy Source Statistics
Year Ended Dec. 312014 2013 2012
SPSMillions of
KWhPercent ofGeneration
Millions ofKWh
Percent ofGeneration
Millions ofKWh
Percent ofGeneration
Coal . . . . . . . . . . . . . . . . . . . . . . . . . . . . . . . . 12,770 48% 14,184 49% 14,005 49%Natural Gas . . . . . . . . . . . . . . . . . . . . . . . . . . 10,068 37 11,235 38 12,088 43Wind (a) . . . . . . . . . . . . . . . . . . . . . . . . . . . . . 3,762 14 3,507 12 2,103 7Other (b) . . . . . . . . . . . . . . . . . . . . . . . . . . . . . 180 1 167 1 177 1
Total . . . . . . . . . . . . . . . . . . . . . . . . . . . . . . 26,780 100% 29,093 100% 28,373 100%
Owned generation . . . . . . . . . . . . . . . . . . . . . 16,956 63% 18,814 65% 19,940 70%Purchased generation . . . . . . . . . . . . . . . . . . 9,824 37 10,279 35 8,433 30
Total . . . . . . . . . . . . . . . . . . . . . . . . . . . . . . 26,780 100% 29,093 100% 28,373 100%(a) This category includes wind energy de-bundled from RECs and also includes Windsource RECs. SPS uses RECs to meet or exceed state resource requirements
and may sell surplus RECs.(b) Distributed generation from the Solar*Rewards program is not included, was approximately 10, 11, and eight net million KWh for 2014, 2013, and 2012,
respectively.
Fuel Supply and Costs
The following table shows the delivered cost per MMBtu of each significant category of fuel consumed for owned electric generation, the percentage of total fuel requirements represented by each category of fuel and the total weighted average cost of all fuels.
Coal Natural Gas WeightedAverage Owned
Fuel CostSPS Generating Plants Cost Percent Cost Percent
2014 . . . . . . . . . . . . . . . . . . . . . . . . . . . . . . . . . . . . . . . . . . . . . . $ 2.07 71% $ 4.76 29% $ 2.852013 . . . . . . . . . . . . . . . . . . . . . . . . . . . . . . . . . . . . . . . . . . . . . . 2.14 71 3.97 29 2.682012 . . . . . . . . . . . . . . . . . . . . . . . . . . . . . . . . . . . . . . . . . . . . . . 1.87 67 2.99 33 2.24
See Items 1A and 7 for further discussion of fuel supply and costs.
Fuel Sources
Coal — SPS purchases all of the coal requirements for its two coal facilities, Harrington and Tolk electric generating stations, from TUCO. TUCO arranges for the purchase, receiving, transporting, unloading, handling, crushing, weighing and delivery of coal to meet SPS’ requirements. TUCO is responsible for negotiating and administering contracts with coal suppliers, transporters and handlers. The coal supply contract with TUCO expires in 2016 for Harrington and Tolk. SPS normally maintains approximately 43 days of coal inventory. As of Dec. 31, 2014 and 2013, coal inventories at SPS were approximately 17 and 42 days supply, respectively. At Dec. 31, 2014, coal inventories were below optimal levels due to railcar congestion. TUCO has coal agreements to supply 87 percent of SPS’ estimated coal requirements in 2015, and a declining percentage of the requirements in subsequent years. SPS’ general coal purchasing objective is to contract for approximately 100 percent of requirements for the first year, 67 percent of requirements in year two, and 33 percent of requirements in year three.
Natural gas — SPS uses both firm and interruptible natural gas supply and standby oil in combustion turbines and certain boilers. Natural gas for SPS’ power plants is procured under contracts to provide an adequate supply of fuel; which typically is purchased with terms of one year or less. The transportation and storage contracts expire in various years from 2015 to 2033. All of the natural gas supply contracts have variable pricing that is tied to various natural gas indices.
Most transportation contract pricing is based on FERC and Railroad Commission of Texas approved transportation tariff rates. Certain natural gas supply and transportation agreements include obligations for the purchase and/or delivery of specified volumes of natural gas or to make payments in lieu of delivery. SPS’ commitments related to gas supply contracts were approximately $3 million and $21 million and commitments related to gas transportation and storage contracts were approximately $222 million and $201 million at Dec. 31, 2014 and 2013, respectively.
SPS has limited on-site fuel oil storage facilities and primarily relies on the spot market for incremental supplies.
Schedule Q-3 Page 37 of 182
Sponsor: Robinson Case No. 15-00139-UT

22
Renewable Energy Sources
SPS’ renewable energy portfolio includes wind and solar power from both owned generating facilities and PPAs. As of Dec. 31, 2014, SPS is in compliance with mandated RPS, which require generation from renewable resources of approximately four percent and 10 percent of Texas and New Mexico electric retail sales, respectively.
• Renewable energy comprised 14.7 percent and 12.7 percent of SPS’ energy for 2014 and 2013, respectively. • Wind energy comprised 14.0 percent and 12.1 percent of SPS’ energy for 2014 and 2013, respectively. • Solar power comprised approximately 0.4 percent of SPS’ energy for both 2014 and 2013.
SPS also offers customer-focused renewable energy initiatives. Windsource allows customers in New Mexico to purchase a portion or all of their electricity from renewable sources. The number of Windsource participants remained consistent at approximately 900 in 2013 and 2014. Windsource sales were approximately 4,400 MWh in 2013 and 3,900 MWh in 2014.
Additionally, to encourage the growth of solar energy on the system in New Mexico, customers are offered incentives to install solar panels on their homes and businesses under the Solar*Rewards program. Over 315 PV systems with approximately 20.8 MW of aggregate capacity and over 115 PV systems with approximately 7.6 MW of aggregate capacity have been installed in New Mexico under this program as of Dec. 31, 2014 and 2013, respectively.
Wind — SPS acquires its wind energy from independent power producers (IPP) and qualified facilities (QF) contracts with wind farm owners, primarily located in the Texas Panhandle area of Texas and New Mexico. SPS currently has 37 of these agreements in place, with facilities ranging in size from under two MW to 250 MW for a total capacity greater than 1,800 MW. SPS had approximately 1,500 MW and 1,000 MW of wind energy on its system at the end of 2014 and 2013, respectively. In addition to receiving purchased wind energy under these agreements, SPS also typically receives wind RECs, which are used to meet state renewable resource requirements. The average cost per MWh of wind energy under the IPP contracts and QF contracts was approximately $26 for both 2014 and 2013. The cost per MWh of wind energy varies by contract and may be influenced by a number of factors including regulation, state-specific renewable resource requirements and the year of contract execution. Generally, contracts executed in 2014 continued to benefit from improvements in technology, excess capacity among manufacturers, and motivation to commence new construction prior to the expiration of the Federal PTCs in 2014, with certain projects qualifying into future years.
Wholesale Commodity Marketing Operations
SPS conducts various wholesale marketing operations, including the purchase and sale of electric capacity, energy and energy related products. SPS uses physical and financial instruments to minimize commodity price and credit risk and hedge sales and purchases. See Item 7 for further discussion.
Summary of Recent Federal Regulatory Developments
The FERC has jurisdiction over rates for electric transmission service in interstate commerce and electricity sold at wholesale, hydro facility licensing, natural gas transportation, asset transactions and mergers, accounting practices and certain other activities of Xcel Energy Inc.’s utility subsidiaries and transmission-only subsidiaries, including enforcement of NERC mandatory electric reliability standards. State and local agencies have jurisdiction over many of Xcel Energy Inc.’s utility subsidiaries’ activities, including regulation of retail rates and environmental matters. In addition to the matters discussed below, see Note 12 to the accompanying consolidated financial statements for a discussion of other regulatory matters.
FERC Order, New ROE Policy — In June 2014, the FERC adopted a new two-step ROE methodology for electric utilities. In October 2014, the FERC upheld the determination of the long-term growth rate to be used in its new ROE methodology. Several parties sought rehearing of the June 2014 order and therefore the new FERC policy may be subject to additional changes.
Schedule Q-3 Page 38 of 182
Sponsor: Robinson Case No. 15-00139-UT

23
FERC Order 1000, Transmission Planning and Cost Allocation (Order 1000) — In 2011, the FERC issued a final ruling, Order 1000, adopting new requirements for transmission planning, cost allocation and development to be effective prospectively. Order 1000 requires:
• The development of tariffs that provide for joint regional transmission planning and cost allocation for all FERC-jurisdictional utilities within a region;
• The coordination between regions for the development of interregional plans for transmission planning and cost allocation;• Each public utility transmission provider to amend its Open Access Transmission Tariff to describe procedures that provide
for the consideration of transmission needs driven by public policy requirements in the local and regional transmission planning processes; and
• The removal of ROFR provisions from FERC-jurisdictional wholesale transmission contracts and tariffs that presently grant the incumbent transmission owner a federal ROFR to build certain types of transmission projects in its service area.
MISO, SPP and the jurisdictional WestConnect utilities, including PSCo, have submitted multiple compliance filings with the FERC to implement the Order 1000 requirements. Some of the new compliance provisions that were filed have already been approved but others remain under review by the FERC.
In August 2014, the D.C. Circuit denied all appeals and upheld Order 1000 in its entirety and indicated that challenges to the removal of federal ROFR provisions from individual contracts or tariffs could be considered in individual compliance filings. The FERC’s decisions to remove federal ROFR provisions in certain MISO and SPP agreements were appealed to federal courts of appeal in 2014, and those appeals are pending. The removal of a federal ROFR would eliminate rights that NSP-Minnesota, NSP-Wisconsin and SPS currently have under the MISO and SPP tariffs, respectively, to build certain transmission projects within their footprints.
In 2014, MISO and SPP both filed compliance plans that would allow the RTOs to recognize state law ROFRs in any selection process for Order 1000 transmission projects. The commissions granted these requests in 2014. In 2015, the FERC issued orders on rehearing on the compliance filing that would continue to allow MISO and SPP the authority to recognize state ROFRs. Xcel Energy has state ROFRs in Minnesota, North Dakota, South Dakota and believes it has a state ROFR in Texas.
Order 1000 could create opportunities for third parties to build and own certain regional transmission projects that had previously been reserved for the MISO and SPP transmission owners, potentially reducing NSP-Minnesota’s, NSP-Wisconsin’s and SPS’s financial return on new investments in electric transmission facilities. Xcel Energy formed its TransCo entities to pursue opportunities for new investments in electric transmission facilities that may be possible under Order 1000. The ultimate impact of Order 1000 on future Xcel Energy transmission investment is not known at this time.
TransCos — In 2014, Xcel Energy formed the Xcel Energy Transmission Holding Company, LLC and two of its TransCo subsidiaries that will participate in the MISO and SPP competitive bidding processes. Transmission assets held by these entities will be subject to FERC jurisdiction. Xcel Energy has also formed an additional TransCo subsidiary to pursue transmission projects in the western United States.
MISOXETD was approved as a non-transmission owning member in MISO in April 2014, and a qualified transmission developer (QTD) in December 2014. This allows XETD to competitively bid for MISO transmission projects starting in 2015 or 2016.
SPPIn September 2014, SPP determined that XEST’s participant application was complete. This allows XEST to competitively bid for SPP transmission projects starting in 2015. The number of projects made available for competitive bidding in SPP in 2015, as the RTO establishes its rules and processes, is not expected to be significant.
In November 2014, the FERC approved XETD and XEST’s forward-looking transmission formula rates that will apply in their respective jurisdictions with an effective date retroactive to Nov. 1, 2014. The FERC approved the following items requested in the TransCo rate filings:
• A capital structure based on 55 percent equity and 45 percent debt for both TransCos;• Deferral of start-up costs for future recovery in rates, subject to a future filing prior to actual recovery;• XETD’s request for a base ROE using the currently applicable MISO regional rate of 12.38 percent, subject to any potential
modifications resulting from a pending ROE complaint against the MISO transmission owners; and• XEST’s base ROE of 10.64 percent. However, the FERC suspended the proposed ROE and the ROE will be subject to
refund and potential modifications resulting from settlement judge or hearing procedures set for 2015. Also, the FERC granted XEST’s request for a 50 basis point adder for membership in SPP.
Schedule Q-3 Page 39 of 182
Sponsor: Robinson Case No. 15-00139-UT

24
In January 2015, XETD and XEST submitted compliance filings to the orders. Golden Spread Electric Cooperative, Inc. (Golden Spread) filed a protest to the XEST compliance filing in February 2015. The first settlement conference for the XEST ROE issue was held Jan. 6, 2015. The next settlement conference is scheduled for March 10, 2015.
WestConnectXEWT executed the WestConnect planning participation agreement in January 2015, and is participating in the WestConnect regional planning process as an independent transmission developer or owner.
NERC Critical Infrastructure Protection Requirements — The FERC has approved version 5 of NERC’s critical infrastructure protection standards. Requirements must be applied to high and medium impact assets by April 1, 2016 and to low impact assets by April 1, 2017. Xcel Energy is currently in the process of evaluating the new requirements and identifying initiatives needed to meet the compliance deadlines.
NERC Physical Security Requirements — In November 2014, the FERC approved NERC’s proposed critical infrastructure protection standard related to physical security for bulk electric system facilities. The new standard will become enforceable in October 2015 with staggered milestone deliverable dates through 2016. Xcel Energy is currently in the process of developing and performing the initial risk assessment in accordance with the requirements of the standard, which will provide a basis to estimate the cost of protections necessary to meet the standard. The additional cost for compliance is anticipated to be recoverable through rates.
SPP and MISO Complaints Regarding RTO Joint Operating Agreement (JOA) — SPP and MISO have a longstanding dispute regarding the interpretation of their JOA, which is intended to coordinate RTO operations along the MISO/SPP system boundary. SPP and MISO disagree over MISO’s authority to transmit power over SPP transmission facilities between the traditional MISO region in the Midwest and the Entergy system. Several cases have been filed with the FERC by MISO and SPP. In June 2014, the FERC accepted a proposed tariff change by MISO to recover transmission charges imposed by SPP retroactive to January 2014, and set the issues for settlement judge and hearing procedures. If SPP is successful in charging MISO for use of the SPP system, the NSP System would experience higher costs from MISO, which could be material, but SPS would collect revenues from SPP. The outcome of the JOA disputes, and the potential impact on Xcel Energy, are uncertain at this time.
Xcel Energy Services Inc. and NSP-Wisconsin vs. ATC (La Crosse, Wis. to Madison, Wis. Transmission Line) — In February 2012, Xcel Energy Services Inc. and NSP-Wisconsin filed a complaint with the FERC concerning ownership of the proposed La Crosse, Wis. to Madison, Wis. 345 KV transmission line. In July 2012, the FERC ruled favorably on Xcel Energy Services Inc.’s and NSP-Wisconsin’s complaint, ruling that the responsibilities to construct the La Crosse, Wis. to Madison, Wis. transmission line, also known as the Badger Coulee line, belong equally to NSP-Wisconsin and ATC. In August 2012, ATC requested rehearing and requested that the FERC grant a stay of the ruling. ATC and NSP-Wisconsin jointly filed a CPCN application with the PSCW for the project in October 2013. In May 2014, the FERC issued an order denying the ATC request for rehearing and motion for stay. The 60 day period for ATC to appeal the FERC order lapsed, making the FERC ruling final.
MISO Transmission Pricing — The MISO Tariff presently provides for different allocation methods for the costs of new transmission investments depending on whether the project is primarily local or regional in nature. If a project qualifies as a MVP, the costs would be fully allocated to all loads in the MISO region. MVP eligibility is generally obtained for higher voltage (345 KV and higher) projects expected to serve multiple purposes, such as improved reliability, reduced congestion, transmission for renewable energy, and load serving.
Schedule Q-3 Page 40 of 182
Sponsor: Robinson Case No. 15-00139-UT

25
Electric Operating Statistics
Electric Sales Statistics
Year Ended Dec. 312014 2013 2012
Electric sales (Millions of KWh)Residential. . . . . . . . . . . . . . . . . . . . . . . . . . . . . . . . . . . . . . . . . . . . . . . . . . . . . . . . . . . . 24,857 25,306 25,033Large C&I . . . . . . . . . . . . . . . . . . . . . . . . . . . . . . . . . . . . . . . . . . . . . . . . . . . . . . . . . . . . 27,657 27,206 27,396Small C&I . . . . . . . . . . . . . . . . . . . . . . . . . . . . . . . . . . . . . . . . . . . . . . . . . . . . . . . . . . . . 36,022 35,873 35,660Public authorities and other. . . . . . . . . . . . . . . . . . . . . . . . . . . . . . . . . . . . . . . . . . . . . . . 1,104 1,098 1,109
Total retail . . . . . . . . . . . . . . . . . . . . . . . . . . . . . . . . . . . . . . . . . . . . . . . . . . . . . . . . . . 89,640 89,483 89,198Sales for resale . . . . . . . . . . . . . . . . . . . . . . . . . . . . . . . . . . . . . . . . . . . . . . . . . . . . . . . . 14,931 15,065 15,781
Total energy sold. . . . . . . . . . . . . . . . . . . . . . . . . . . . . . . . . . . . . . . . . . . . . . . . . . . . . 104,571 104,548 104,979
Number of customers at end of periodResidential. . . . . . . . . . . . . . . . . . . . . . . . . . . . . . . . . . . . . . . . . . . . . . . . . . . . . . . . . . . . 2,994,075 2,965,717 2,940,024Large C&I . . . . . . . . . . . . . . . . . . . . . . . . . . . . . . . . . . . . . . . . . . . . . . . . . . . . . . . . . . . . 1,128 1,132 1,147Small C&I . . . . . . . . . . . . . . . . . . . . . . . . . . . . . . . . . . . . . . . . . . . . . . . . . . . . . . . . . . . . 426,289 422,553 419,618Public authorities and other. . . . . . . . . . . . . . . . . . . . . . . . . . . . . . . . . . . . . . . . . . . . . . . 68,306 67,998 68,510
Total retail . . . . . . . . . . . . . . . . . . . . . . . . . . . . . . . . . . . . . . . . . . . . . . . . . . . . . . . . . . 3,489,798 3,457,400 3,429,299Wholesale . . . . . . . . . . . . . . . . . . . . . . . . . . . . . . . . . . . . . . . . . . . . . . . . . . . . . . . . . . . . 44 65 75
Total customers . . . . . . . . . . . . . . . . . . . . . . . . . . . . . . . . . . . . . . . . . . . . . . . . . . . . . . 3,489,842 3,457,465 3,429,374
Electric revenues (Thousands of Dollars)Residential. . . . . . . . . . . . . . . . . . . . . . . . . . . . . . . . . . . . . . . . . . . . . . . . . . . . . . . . . . . . $ 2,956,576 $ 2,906,208 $ 2,713,575Large C&I . . . . . . . . . . . . . . . . . . . . . . . . . . . . . . . . . . . . . . . . . . . . . . . . . . . . . . . . . . . . 1,789,742 1,694,720 1,534,728Small C&I . . . . . . . . . . . . . . . . . . . . . . . . . . . . . . . . . . . . . . . . . . . . . . . . . . . . . . . . . . . . 3,382,750 3,248,586 3,023,154Public authorities and other. . . . . . . . . . . . . . . . . . . . . . . . . . . . . . . . . . . . . . . . . . . . . . . 143,442 138,126 130,538
Total retail . . . . . . . . . . . . . . . . . . . . . . . . . . . . . . . . . . . . . . . . . . . . . . . . . . . . . . . . . . 8,272,510 7,987,640 7,401,995Wholesale . . . . . . . . . . . . . . . . . . . . . . . . . . . . . . . . . . . . . . . . . . . . . . . . . . . . . . . . . . . . 796,766 693,728 687,912Other electric revenues . . . . . . . . . . . . . . . . . . . . . . . . . . . . . . . . . . . . . . . . . . . . . . . . . . 396,614 352,677 427,389
Total electric revenues . . . . . . . . . . . . . . . . . . . . . . . . . . . . . . . . . . . . . . . . . . . . . . . . $ 9,465,890 $ 9,034,045 $ 8,517,296
KWh sales per retail customer . . . . . . . . . . . . . . . . . . . . . . . . . . . . . . . . . . . . . . . . . . . . 25,686 25,882 26,011Revenue per retail customer . . . . . . . . . . . . . . . . . . . . . . . . . . . . . . . . . . . . . . . . . . . . . . $ 2,370 $ 2,310 $ 2,158Residential revenue per KWh . . . . . . . . . . . . . . . . . . . . . . . . . . . . . . . . . . . . . . . . . . . . . 11.89¢ 11.48¢ 10.84¢Large C&I revenue per KWh . . . . . . . . . . . . . . . . . . . . . . . . . . . . . . . . . . . . . . . . . . . . . 6.47 6.23 5.60Small C&I revenue per KWh . . . . . . . . . . . . . . . . . . . . . . . . . . . . . . . . . . . . . . . . . . . . . 9.39 9.06 8.48Total retail revenue per KWh . . . . . . . . . . . . . . . . . . . . . . . . . . . . . . . . . . . . . . . . . . . . . 9.23 8.93 8.30Wholesale revenue per KWh . . . . . . . . . . . . . . . . . . . . . . . . . . . . . . . . . . . . . . . . . . . . . 5.34 4.60 4.36
Schedule Q-3 Page 41 of 182
Sponsor: Robinson Case No. 15-00139-UT

26
Energy Source Statistics
Year Ended Dec. 312014 2013 2012
Xcel EnergyMillions of
KWhPercent ofGeneration
Millions ofKWh
Percent ofGeneration
Millions ofKWh
Percent ofGeneration
Coal . . . . . . . . . . . . . . . . . . . . . . . . . . . . . . . . 49,123 46% 49,675 46% 51,395 47%Natural Gas . . . . . . . . . . . . . . . . . . . . . . . . . . 22,071 21 24,350 23 26,218 24Wind (a) . . . . . . . . . . . . . . . . . . . . . . . . . . . . . 16,478 15 15,738 14 13,298 12Nuclear . . . . . . . . . . . . . . . . . . . . . . . . . . . . . 13,503 12 12,177 11 13,249 12Hydroelectric. . . . . . . . . . . . . . . . . . . . . . . . . 4,203 4 3,900 4 3,800 3Other (b) . . . . . . . . . . . . . . . . . . . . . . . . . . . . . 1,795 2 1,704 2 2,022 2
Total . . . . . . . . . . . . . . . . . . . . . . . . . . . . . . 107,173 100% 107,544 100% 109,982 100%
Owned generation . . . . . . . . . . . . . . . . . . . . . 73,620 69% 70,936 66% 75,071 68%Purchased generation . . . . . . . . . . . . . . . . . . 33,553 31 36,608 34 34,911 32
Total . . . . . . . . . . . . . . . . . . . . . . . . . . . . . . 107,173 100% 107,544 100% 109,982 100%(a) This category includes wind energy de-bundled from RECs and also includes Windsource RECs. Xcel Energy uses RECs to meet or exceed state resource
requirements and may sell surplus RECs.(b) Includes energy from other sources, including solar, biomass, oil and refuse. Distributed generation from the Solar*Rewards program is not included, and was
approximately 222, 198, and 152 net million KWh for 2014, 2013 and 2012, respectively.
NATURAL GAS UTILITY OPERATIONS
Overview
The most significant developments in the natural gas operations of the utility subsidiaries are continued volatility in natural gas market prices, uncertainty regarding political and regulatory developments that impact hydraulic fracturing, safety requirements for natural gas pipelines and the continued trend of declining use per residential and small C&I customer, as a result of improved building construction technologies, higher appliance efficiencies and conservation. From 2000 to 2014, average annual sales to the typical residential customer declined 14 percent, while sales to the typical small C&I customer declined 6 percent, each on a weather-normalized basis. Although wholesale price increases do not directly affect earnings because of natural gas cost-recovery mechanisms, high prices can encourage further efficiency efforts by customers.
The Pipeline and Hazardous Materials Safety Administration
Pipeline Safety Act — The Pipeline Safety, Regulatory Certainty, and Job Creation Act, signed into law in January 2012 (Pipeline Safety Act) requires additional verification of pipeline infrastructure records by pipeline owners and operators to confirm the maximum allowable operating pressure of lines located in high consequence areas or more-densely populated areas. The DOT Pipeline and Hazardous Materials Safety Administration (PHMSA) will require operators to re-confirm the maximum allowable operating pressure if records are inadequate. This process could cause temporary or permanent limitations on throughput for affected pipelines.
In addition, the Pipeline Safety Act requires PHMSA to issue reports and develop new regulations including: requiring use of automatic or remote-controlled shut-off valves; requiring testing of certain previously untested transmission lines; and expanding integrity management requirements. The Pipeline Safety Act also raises the maximum penalty for violating pipeline safety rules to $2 million per day for related violations. While Xcel Energy cannot predict the ultimate impact Pipeline Safety Act will have on its costs, operations or financial results, it is taking actions that are intended to comply with the Pipeline Safety Act and any related PHMSA regulations as they become effective. PSCo and NSP-Minnesota can generally recover costs to comply with the transmission and distribution integrity management programs through the PSIA and GUIC riders, respectively.
Schedule Q-3 Page 42 of 182
Sponsor: Robinson Case No. 15-00139-UT
27
NSP-MinnesotaPublic Utility Regulation
Summary of Regulatory Agencies and Areas of Jurisdiction — Retail rates, services and other aspects of NSP-Minnesota’s retail natural gas operations are regulated by the MPUC and the NDPSC within their respective states. The MPUC has regulatory authority over security issuances, certain property transfers, mergers with other utilities and transactions between NSP-Minnesota and its affiliates. In addition, the MPUC reviews and approves NSP-Minnesota’s natural gas supply plans for meeting customers’ future energy needs. NSP-Minnesota is subject to the jurisdiction of the FERC with respect to certain natural gas transactions in interstate commerce. NSP-Minnesota is subject to the DOT, the Minnesota Office of Pipeline Safety, the NDPSC and the SDPUC for pipeline safety compliance, including pipeline facilities used in electric utility operations for fuel deliveries.
Purchased Gas and Conservation Cost-Recovery Mechanisms — NSP-Minnesota’s retail natural gas rates for Minnesota and North Dakota include a PGA clause that provides for prospective monthly rate adjustments to reflect the forecasted cost of purchased natural gas, transportation service and storage service. The annual difference between the natural gas cost revenues collected through PGA rates and the actual natural gas costs is collected or refunded over the subsequent 12-month period.
NSP-Minnesota also recovers costs associated with transmission and distribution pipeline integrity management programs through its GUIC rider. Costs recoverable under the GUIC rider include funding for pipeline assessments as well as deferred costs from NSP-Minnesota’s existing sewer separation and pipeline integrity management programs. The MPUC and NDPSC have the authority to disallow recovery of certain costs if they find the utility was not prudent in its procurement activities.
Minnesota state law requires utilities to invest 0.5 percent of their state natural gas revenues in CIP. These costs are recovered through customer base rates and an annual cost-recovery mechanism for the CIP expenditures.
Capability and Demand
Natural gas supply requirements are categorized as firm or interruptible (customers with an alternate energy supply). The maximum daily send-out (firm and interruptible) for NSP-Minnesota was 752,931 MMBtu, which occurred on Jan. 2, 2014 and 767,636 MMBtu, which occurred on Jan. 21, 2013.
NSP-Minnesota purchases natural gas from independent suppliers, generally based on market indices that reflect current prices. The natural gas is delivered under transportation agreements with interstate pipelines. These agreements provide for firm deliverable pipeline capacity of 610,048 MMBtu per day. In addition, NSP-Minnesota contracts with providers of underground natural gas storage services. These agreements provide storage for approximately 26 percent of winter natural gas requirements and 30 percent of peak day firm requirements of NSP-Minnesota.
NSP-Minnesota also owns and operates one LNG plant with a storage capacity of 2.0 Bcf equivalent and three propane-air plants with a storage capacity of 1.3 Bcf equivalent to help meet its peak requirements. These peak-shaving facilities have production capacity equivalent to 246,000 MMBtu of natural gas per day, or approximately 30 percent of peak day firm requirements. LNG and propane-air plants provide a cost-effective alternative to annual fixed pipeline transportation charges to meet the peaks caused by firm space heating demand on extremely cold winter days.
NSP-Minnesota is required to file for a change in natural gas supply contract levels to meet peak demand, to redistribute demand costs among classes, or to exchange one form of demand for another. In August 2014, the MPUC approved NSP-Minnesota’s contract demand levels for the years 2007 through 2013. Demand levels filed with the MPUC in 2014 are awaiting approval.
Natural Gas Supply and Costs
NSP-Minnesota actively seeks natural gas supply, transportation and storage alternatives to yield a diversified portfolio that provides increased flexibility, decreased interruption and financial risk and economical rates. In addition, NSP-Minnesota conducts natural gas price hedging activity that has been approved by the MPUC.
The following table summarizes the average delivered cost per MMBtu of natural gas purchased for resale by NSP-Minnesota’s regulated retail natural gas distribution business:
2014 . . . . . . . . . . . . . . . . . . . . . . . . . . . . . . . . . . . . . . . . $ 6.172013 . . . . . . . . . . . . . . . . . . . . . . . . . . . . . . . . . . . . . . . . 4.532012 . . . . . . . . . . . . . . . . . . . . . . . . . . . . . . . . . . . . . . . . 4.41
Schedule Q-3 Page 43 of 182
Sponsor: Robinson Case No. 15-00139-UT

28
The higher cost of natural gas was primarily due to higher at market prices from increased demand because of cold weather in early 2014.
NSP-Minnesota has firm natural gas transportation contracts with several pipelines, which expire in various years from 2015 through 2033.
NSP-Minnesota has certain natural gas supply, transportation and storage agreements that include obligations for the purchase and/or delivery of specified volumes of natural gas or to make payments in lieu of delivery. At Dec. 31, 2014, NSP-Minnesota was committed to approximately $294 million in such obligations under these contracts.
NSP-Minnesota purchases firm natural gas supply utilizing long-term and short-term agreements from approximately 31 domestic and Canadian suppliers. This diversity of suppliers and contract lengths allows NSP-Minnesota to maintain competition from suppliers and minimize supply costs.
See Items 1A and 7 for further discussion of natural gas supply and costs.
NSP-WisconsinPublic Utility Regulation
Summary of Regulatory Agencies and Areas of Jurisdiction — NSP-Wisconsin is regulated by the PSCW and the MPSC. The PSCW has a biennial base-rate filing requirement. By June of each odd-numbered year, NSP-Wisconsin must submit a rate filing for the test year period beginning the following January. NSP-Wisconsin is subject to the jurisdiction of the FERC with respect to certain natural gas transactions in interstate commerce. NSP-Wisconsin is subject to the DOT, the PSCW and the MPSC for pipeline safety compliance.
Natural Gas Cost-Recovery Mechanisms — NSP-Wisconsin has a retail PGA cost-recovery mechanism for Wisconsin operations to recover the actual cost of natural gas and transportation and storage services. The PSCW has the authority to disallow certain costs if it finds NSP-Wisconsin was not prudent in its procurement activities.
NSP-Wisconsin’s natural gas rate schedules for Michigan customers include a natural gas cost-recovery factor, which is based on 12-month projections.
Capability and Demand
Natural gas supply requirements are categorized as firm or interruptible (customers with an alternate energy supply). The maximum daily send-out (firm and interruptible) for NSP-Wisconsin was 163,520 MMBtu, which occurred on Jan. 6, 2014, and 155,087 MMBtu, which occurred on Jan. 21, 2013.
NSP-Wisconsin purchases natural gas from independent suppliers, generally based on market indices that reflect current prices. The natural gas is delivered under transportation agreements with interstate pipelines. These agreements provide for firm deliverable pipeline capacity of approximately 131,857 MMBtu per day. In addition, NSP-Wisconsin contracts with providers of underground natural gas storage services. These agreements provide storage for approximately 31 percent of winter natural gas requirements and 34 percent of peak day firm requirements of NSP-Wisconsin.
NSP-Wisconsin also owns and operates one LNG plant with a storage capacity of 270,000 Mcf equivalent and one propane-air plant with a storage capacity of 2,700 Mcf equivalent to help meet its peak requirements. These peak-shaving facilities have production capacity equivalent to 18,408 MMBtu of natural gas per day, or approximately 13 percent of peak day firm requirements. LNG and propane-air plants provide a cost-effective alternative to annual fixed pipeline transportation charges to meet the peaks caused by firm space heating demand on extremely cold winter days.
NSP-Wisconsin is required to file a natural gas supply plan with the PSCW annually to change natural gas supply contract levels to meet peak demand. NSP-Wisconsin’s winter 2014-2015 supply plan was approved by the PSCW in October 2014.
Natural Gas Supply and Costs
NSP-Wisconsin actively seeks natural gas supply, transportation and storage alternatives to yield a diversified portfolio that provides increased flexibility, decreased interruption and financial risk and economical rates. In addition, NSP-Wisconsin conducts natural gas price hedging activity that has been approved by the PSCW.
Schedule Q-3 Page 44 of 182
Sponsor: Robinson Case No. 15-00139-UT

29
The following table summarizes the average delivered cost per MMBtu of natural gas purchased for resale by NSP-Wisconsin’s regulated retail natural gas distribution business:
2014 . . . . . . . . . . . . . . . . . . . . . . . . . . . . . . . . . . . . . . . . $ 6.522013 . . . . . . . . . . . . . . . . . . . . . . . . . . . . . . . . . . . . . . . . 4.512012 . . . . . . . . . . . . . . . . . . . . . . . . . . . . . . . . . . . . . . . . 4.36
The higher cost of natural gas was primarily due to higher at market prices from increased demand because of cold weather in early 2014.
The cost of natural gas supply, transportation service and storage service is recovered through various cost-recovery adjustment mechanisms. NSP-Wisconsin has firm natural gas transportation contracts with several pipelines, which expire in various years from 2015 through 2029.
NSP-Wisconsin has certain natural gas supply, transportation and storage agreements that include obligations for the purchase and/or delivery of specified volumes of natural gas or to make payments in lieu of delivery. At Dec. 31, 2014, NSP-Wisconsin was committed to approximately $71 million in such obligations under these contracts.
NSP-Wisconsin purchased firm natural gas supply utilizing long-term and short-term agreements from approximately 8 domestic and Canadian suppliers. This diversity of suppliers and contract lengths allows NSP-Wisconsin to maintain competition from suppliers and minimize supply costs.
See Items 1A and 7 for further discussion of natural gas supply and costs.
PSCoPublic Utility Regulation
Summary of Regulatory Agencies and Areas of Jurisdiction — PSCo is regulated by the CPUC with respect to its facilities, rates, accounts, services and issuance of securities. PSCo holds a FERC certificate that allows it to transport natural gas in interstate commerce without PSCo becoming subject to full FERC jurisdiction under the Federal Natural Gas Act. PSCo is subject to the DOT and the CPUC with regards to pipeline safety compliance.
Purchased Natural Gas and Conservation Cost-Recovery Mechanisms — PSCo has retail adjustment clauses that recover purchased natural gas and other resource costs:
• GCA — The GCA recovers the actual costs of purchased natural gas and transportation to meet the requirements of its customers and is revised quarterly to allow for changes in natural gas rates.
• DSMCA — The DSMCA recovers costs of DSM and performance initiatives to achieve various energy savings goals.• PSIA — The PSIA recovers costs associated with transmission and distribution pipeline integrity management programs and
two projects to replace large transmission pipelines. The rider was extended through 2015.
QSP Requirements — The CPUC established a natural gas QSP that provides for bill credits to customers if PSCo does not achieve certain performance targets relating to natural gas leak repair time and customer service. The CPUC has extended the terms of the QSP through 2015.
Capability and Demand
PSCo projects peak day natural gas supply requirements for firm sales and backup transportation to be 1,983,672 MMBtu. In addition, firm transportation customers hold 771,112 MMBtu of capacity for PSCo without supply backup. Total firm delivery obligation for PSCo is 2,754,784 MMBtu per day. The maximum daily deliveries for PSCo for firm and interruptible services were 2,116,747 MMBtu on Dec. 30, 2014 and 1,865,207 MMBtu on Dec. 5, 2013.
Schedule Q-3 Page 45 of 182
Sponsor: Robinson Case No. 15-00139-UT

30
PSCo purchases natural gas from independent suppliers, generally based on market indices that reflect current prices. The natural gas is delivered under transportation agreements with interstate pipelines. These agreements provide for firm deliverable pipeline capacity of approximately 1,814,265 MMBtu per day, which includes 850,840 MMBtu of natural gas held under third-party underground storage agreements. In addition, PSCo operates three company-owned underground storage facilities, which provide approximately 41,000 MMBtu of natural gas supplies on a peak day. The balance of the quantities required to meet firm peak day sales obligations are primarily purchased at PSCo’s city gate meter stations.
PSCo is required by CPUC regulations to file a natural gas purchase plan each year projecting and describing the quantities of natural gas supplies, upstream services and the costs of those supplies and services for the 12-month period of the following year. PSCo is also required to file a natural gas purchase report by October of each year reporting actual quantities and costs incurred for natural gas supplies and upstream services for the previous 12-month period.
Natural Gas Supply and Costs
PSCo actively seeks natural gas supply, transportation and storage alternatives to yield a diversified portfolio that provides increased flexibility, decreased interruption and financial risk and economical rates. In addition, PSCo conducts natural gas price hedging activities that have been approved by the CPUC.
The following table summarizes the average delivered cost per MMBtu of natural gas purchased for resale by PSCo’s regulated retail natural gas distribution business:
2014 . . . . . . . . . . . . . . . . . . . . . . . . . . . . . . . . . . . . . . . . $ 4.912013 . . . . . . . . . . . . . . . . . . . . . . . . . . . . . . . . . . . . . . . . 4.202012 . . . . . . . . . . . . . . . . . . . . . . . . . . . . . . . . . . . . . . . . 4.28
The higher cost of natural gas was primarily due to higher at market prices from increased demand because of cold weather in early 2014.
PSCo has natural gas supply, transportation and storage agreements that include obligations for the purchase and/or delivery of specified volumes of natural gas or to make payments in lieu of delivery. At Dec. 31, 2014, PSCo was committed to approximately $1.4 billion in such obligations under these contracts, which expire in various years from 2015 through 2029.
PSCo purchases natural gas by optimizing a balance of long-term and short-term natural gas purchases, firm transportation and natural gas storage contracts. During 2014, PSCo purchased natural gas from approximately 34 suppliers.
See Items 1A and 7 for further discussion of natural gas supply and costs.
SPSNatural Gas Facilities Used for Electric Generation
SPS does not provide retail natural gas service, but purchases and transports natural gas for certain of its generation facilities and operates natural gas pipeline facilities connecting the generation facilities to interstate natural gas pipelines. SPS is subject to the jurisdiction of the FERC with respect to certain natural gas transactions in interstate commerce; and to the jurisdiction of the DOT and the PUCT for pipeline safety compliance.
See Items 1A and 7 for further discussion of natural gas supply and costs.
Schedule Q-3 Page 46 of 182
Sponsor: Robinson Case No. 15-00139-UT

31
Natural Gas Operating Statistics
Year Ended Dec. 312014 2013 2012
Natural gas deliveries (Thousands of MMBtu)Residential . . . . . . . . . . . . . . . . . . . . . . . . . . . . . . . . . . . . . . . . . . . . . . . . . . . . . . . . . . . . . 152,269 150,280 123,835C&I . . . . . . . . . . . . . . . . . . . . . . . . . . . . . . . . . . . . . . . . . . . . . . . . . . . . . . . . . . . . . . . . . . . 95,879 92,849 77,848
Total retail. . . . . . . . . . . . . . . . . . . . . . . . . . . . . . . . . . . . . . . . . . . . . . . . . . . . . . . . . . . . 248,148 243,129 201,683Transportation and other. . . . . . . . . . . . . . . . . . . . . . . . . . . . . . . . . . . . . . . . . . . . . . . . . . . 124,000 125,057 116,611
Total deliveries . . . . . . . . . . . . . . . . . . . . . . . . . . . . . . . . . . . . . . . . . . . . . . . . . . . . . . . . 372,148 368,186 318,294
Number of customers at end of periodResidential . . . . . . . . . . . . . . . . . . . . . . . . . . . . . . . . . . . . . . . . . . . . . . . . . . . . . . . . . . . . . 1,795,190 1,776,849 1,760,364C&I . . . . . . . . . . . . . . . . . . . . . . . . . . . . . . . . . . . . . . . . . . . . . . . . . . . . . . . . . . . . . . . . . . . 155,515 154,646 154,158
Total retail. . . . . . . . . . . . . . . . . . . . . . . . . . . . . . . . . . . . . . . . . . . . . . . . . . . . . . . . . . . . 1,950,705 1,931,495 1,914,522Transportation and other. . . . . . . . . . . . . . . . . . . . . . . . . . . . . . . . . . . . . . . . . . . . . . . . . . . 6,594 6,320 5,789
Total customers. . . . . . . . . . . . . . . . . . . . . . . . . . . . . . . . . . . . . . . . . . . . . . . . . . . . . . . . 1,957,299 1,937,815 1,920,311
Natural gas revenues (Thousands of Dollars)Residential . . . . . . . . . . . . . . . . . . . . . . . . . . . . . . . . . . . . . . . . . . . . . . . . . . . . . . . . . . . . . $ 1,320,207 $ 1,126,859 $ 964,642C&I . . . . . . . . . . . . . . . . . . . . . . . . . . . . . . . . . . . . . . . . . . . . . . . . . . . . . . . . . . . . . . . . . . . 727,071 586,548 488,644
Total retail. . . . . . . . . . . . . . . . . . . . . . . . . . . . . . . . . . . . . . . . . . . . . . . . . . . . . . . . . . . . 2,047,278 1,713,407 1,453,286Transportation and other. . . . . . . . . . . . . . . . . . . . . . . . . . . . . . . . . . . . . . . . . . . . . . . . . . . 95,460 91,272 84,088
Total natural gas revenues. . . . . . . . . . . . . . . . . . . . . . . . . . . . . . . . . . . . . . . . . . . . . . . $ 2,142,738 $ 1,804,679 $ 1,537,374
MMBtu sales per retail customer . . . . . . . . . . . . . . . . . . . . . . . . . . . . . . . . . . . . . . . . . . . . 127.21 125.88 105.34Revenue per retail customer . . . . . . . . . . . . . . . . . . . . . . . . . . . . . . . . . . . . . . . . . . . . . . . . $ 1,050 $ 887 $ 759Residential revenue per MMBtu. . . . . . . . . . . . . . . . . . . . . . . . . . . . . . . . . . . . . . . . . . . . . 8.67 7.50 7.79C&I revenue per MMBtu . . . . . . . . . . . . . . . . . . . . . . . . . . . . . . . . . . . . . . . . . . . . . . . . . . 7.58 6.32 6.28Transportation and other revenue per MMBtu . . . . . . . . . . . . . . . . . . . . . . . . . . . . . . . . . . 0.77 0.73 0.72
GENERAL
Seasonality
The demand for electric power and natural gas is affected by seasonal differences in the weather. In general, peak sales of electricity occur in the summer months, and peak sales of natural gas occur in the winter months. As a result, the overall operating results may fluctuate substantially on a seasonal basis. Additionally, Xcel Energy’s operations have historically generated less revenues and income when weather conditions are milder in the winter and cooler in the summer. See Item 7 for further discussion.
Competition
Xcel Energy is a vertically integrated utility in all of its jurisdictions, subject to traditional cost-of-service regulation by state public utilities commissions. However, Xcel Energy is subject to different public policies that promote competition and the development of energy markets. Xcel Energy’s industrial and large commercial customers have the ability to own or operate facilities to generate their own electricity. In addition, customers may have the option of substituting other fuels, such as natural gas, steam or chilled water for heating, cooling and manufacturing purposes, or the option of relocating their facilities to a lower cost region. Customers also have the opportunity to supply their own power with on-site solar generation (typically rooftop solar) and in most jurisdictions can currently avoid paying for most of the fixed production, transmission and distribution costs incurred to serve them. Finally, in some of our states, customers can elect to subscribe to a community solar garden at pricing that affords them the same opportunity to avoid fixed charges as if they had rooftop installations.
Schedule Q-3 Page 47 of 182
Sponsor: Robinson Case No. 15-00139-UT

32
The FERC has continued to promote competitive wholesale markets through open access transmission and other means. As a result, Xcel Energy Inc.’s utility subsidiaries and their wholesale customers can purchase the output from generation resources of competing wholesale suppliers and use the transmission systems of the utility subsidiaries on a comparable basis to serve their native load. State public utilities commissions have created resource planning programs that promote competition in the acquisition of electricity generation resources used to provide service to retail customers. In addition, FERC Order 1000 seeks to establish competition for construction and operation of certain new electric transmission facilities. Xcel Energy Inc.’s utility subsidiaries also have franchise agreements with certain cities subject to periodic renewal. If a city elected not to renew the franchise agreement, it could seek alternative means for its citizens to access electric power or gas, such as municipalization. Several states have policies designed to promote the development of solar and other distributed energy resources through significant incentive policies; with these incentives and federal tax subsidies, distributed generating resources are potential competitors to Xcel Energy’s electric service business. While each of Xcel Energy Inc.’s utility subsidiaries faces these challenges, Xcel Energy believes their rates and services are competitive with currently available alternatives.
ENVIRONMENTAL MATTERS
Xcel Energy’s facilities are regulated by federal and state environmental agencies. These agencies have jurisdiction over air emissions, water quality, wastewater discharges, solid wastes and hazardous substances. Various company activities require registrations, permits, licenses, inspections and approvals from these agencies. Xcel Energy has received all necessary authorizations for the construction and continued operation of its generation, transmission and distribution systems. Xcel Energy’s facilities have been designed and constructed to operate in compliance with applicable environmental standards. However, it is not possible to determine when or to what extent additional facilities or modifications of existing or planned facilities will be required as a result of changes to environmental regulations, interpretations or enforcement policies or what effect future laws or regulations may have upon Xcel Energy’s operations. See Item 7 and Notes 12 and 13 to the consolidated financial statements for further discussion.
There are significant future environmental regulations under consideration to encourage the use of clean energy technologies and regulate emissions of GHGs to address climate change. Xcel Energy has undertaken a number of initiatives to meet current requirements and prepare for potential future regulations, reduce GHG emissions and respond to state renewable and energy efficiency goals. If these future environmental regulations do not provide credit for the investments we have already made to reduce GHG emissions, or if they require additional initiatives or emission reductions, then their requirements would potentially impose additional substantial costs. We believe, based on prior state commission practice, we would recover the cost of these initiatives through rates.
Xcel Energy is committed to addressing climate change and potential climate change regulation through efforts to reduce its GHG emissions in a balanced, cost-effective manner. Xcel Energy adopted a methodology for calculating CO2 emissions based on the reporting protocols of The Climate Registry, a nonprofit organization that provides and compiles GHG emissions data from reporting entities. Starting in 2011, Xcel Energy began reporting GHG emissions to the EPA under the EPA’s mandatory GHG Reporting Program.
Based on The Climate Registry’s current reporting protocol, Xcel Energy estimated that its current electric generating portfolio emitted approximately 57.6 million and 57.2 million tons of CO2 in 2014 and 2013, respectively. Xcel Energy also estimated emissions associated with electricity purchased for resale to Xcel Energy customers from generation facilities owned by third parties. Xcel Energy estimates these non-owned facilities emitted approximately 11.4 million and 14.7 million tons of CO2 in 2014 and 2013, respectively. Estimated total CO2 emissions associated with service to Xcel Energy electric customers decreased by 3.0 million tons in 2014 compared to 2013. The decrease in emissions was associated with a decrease of 5.4 million net MWh of generation since 2011. The average annual decrease in CO2 emissions since 2011 is approximately 3.1 million tons of CO2 per year.
CAPITAL SPENDING AND FINANCING
See Item 7 for a discussion of expected capital expenditures and funding sources.
EMPLOYEES
As of Dec. 31, 2014, Xcel Energy had 11,589 full-time employees and 102 part-time employees, of which 5,588 were covered under collective-bargaining agreements. See Note 9 to the consolidated financial statements for further discussion.
EXECUTIVE OFFICERS
Ben Fowke, 56, Chairman of the Board, President and Chief Executive Officer and Director, Xcel Energy Inc., August 2011 to present. Chief Executive Officer, NSP-Minnesota, NSP-Wisconsin, PSCo, and SPS January 2015 to present. Previously, President and Chief Operating Officer, Xcel Energy Inc., August 2009 to August 2011; Executive Vice President and Chief Financial Officer, Xcel Energy Inc., December 2008 to August 2009.
Schedule Q-3 Page 48 of 182
Sponsor: Robinson Case No. 15-00139-UT

33
Christopher B. Clark, 48, President and Director, NSP-Minnesota, January 2015 to present. Previously, Regional Vice President, Rates and Regulatory Affairs, NSP-Minnesota, October 2012 to December 2014; Managing Attorney and Director, Government and Regulatory Affairs, NSP-Minnesota, November 2007 to October 2012.
David L. Eves, 56, President and Director, PSCo, January 2015 to present. Previously, President, Director and Chief Executive Officer, PSCo, December 2009 to December 2014; President, Director and Chief Operating Officer, PSCo, November 2009 to December 2009; President and Director, SPS, December 2006 to November 2009; Chief Executive Officer, SPS, August 2006 to November 2009.
David T. Hudson, 54, President and Director, SPS, January 2015 to present. Previously, President, Director and Chief Executive Officer, SPS, January 2014 to December 2014; Director, Community Service & Economic Development, SPS, April 2011 to January 2014; Director, Strategic Planning, SPS, May 2008 to April 2011.
Kent T. Larson, 55, Executive Vice President and Group President Operations, Xcel Energy Inc., January 2015 to present. Previously, Senior Vice President, Group President Operations, Xcel Energy Services Inc., August 2014 to December 2014; Senior Vice President Operations, Xcel Energy Services Inc., September 2011 to August 2014; Chief Energy Supply Officer, Xcel Energy Services Inc., March 2010 to September 2011; Vice President, Transmission, Xcel Energy Services Inc., August 2008 to March 2010.
Teresa S. Madden, 59, Executive Vice President, Chief Financial Officer, Xcel Energy Inc., January 2015 to present. Previously, Senior Vice President, Chief Financial Officer, Xcel Energy Inc., September 2011 to December 2014; Vice President and Controller, Xcel Energy Inc., January 2004 to September 2011.
Marvin E. McDaniel, Jr., 55, Executive Vice President, Group President, Utilities, and Chief Administrative Officer, Xcel Energy Inc., January 2015 to present. Previously, Senior Vice President, Chief Administrative Officer, Xcel Energy Inc., August 2012 to December 2014; Senior Vice President and Chief Administrative Officer, Xcel Energy Services Inc., September 2011 to August 2012; Vice President and Chief Administrative Officer, Xcel Energy Services Inc., August 2009 to September 2011 and Vice President, Talent and Technology Business Areas, Xcel Energy Services Inc., August 2009 to September 2011; Vice President, Human Resources, Xcel Energy Services Inc., July 2007 to August 2009.
Timothy O’Connor, 55, Senior Vice President, Chief Nuclear Officer, Xcel Energy Services Inc., February 2013 to present. Previously, Acting Chief Nuclear Officer, NSP-Minnesota, September 2012 to February 2013; Vice President, Engineering and Nuclear Regulatory Compliance and Licensing July 2012 to September 2012; Monticello Site Vice President in May 2007 to July 2012.
Judy M. Poferl, 55, Senior Vice President, Corporate Secretary and Executive Services, Xcel Energy Inc., January 2015 to present. Previously, Vice President, Corporate Secretary, Xcel Energy Inc., May 2013 to December 2014; President, Director and Chief Executive Officer, NSP-Minnesota, August 2009 to May 2013; Regional Vice President, NSP-Minnesota, September 2008 to August 2009; Managing Director, Government and Regulatory Affairs, Xcel Energy Services Inc., November 2007 to September 2008.
Jeffrey S. Savage, 43, Senior Vice President, Controller, Xcel Energy Inc., January 2015 to present. Previously, Vice President, Controller, Xcel Energy Inc., September 2011 to December 2014; Senior Director, Financial Reporting, Corporate and Technical Accounting, Xcel Energy Services Inc., December 2009 to September 2011; Director, Financial Reporting and Technical Accounting, Xcel Energy Services Inc., March 2007 to December 2009.
Mark E. Stoering, 54, President and Director, NSP-Wisconsin, January 2015 to present. Previously, President, Director and Chief Executive Officer, NSP-Wisconsin, January 2012 to December 2014; Vice President, Portfolio Strategy and Business Development, Xcel Energy Services Inc., August 2000 to December 2011.
George E. Tyson, II, 49, Senior Vice President, Treasurer, Xcel Energy Inc., January 2015 to present. Previously, Vice President, Treasurer, Xcel Energy Inc., May 2004 to December 2014.
Scott M. Wilensky, 58, Executive Vice President, General Counsel, Xcel Energy Inc., January 2015 to present. Previously, Senior Vice President, General Counsel, Xcel Energy Inc., September 2011 to December 2014; Vice President, Regulatory and Resource Planning, Xcel Energy Services Inc., September 2009 to September 2011; Vice President, Government and Regulatory Affairs, Xcel Energy Services Inc., August 2008 to September 2009.
No family relationships exist between any of the executive officers or directors.
Schedule Q-3 Page 49 of 182
Sponsor: Robinson Case No. 15-00139-UT

34
Item 1A — Risk Factors
Like other companies in our industry, Xcel Energy is subject to a variety of risks, many of which are beyond our control. Important risks that may adversely affect the business, financial condition, and results of operations are further described below. These risks should be carefully considered together with the other information set forth in this report and in future reports that Xcel Energy files with the SEC.
Oversight of Risk and Related Processes
A key accountability of the Board of Directors is to identify, manage and mitigate material risk. Our Board employs an effective process for doing so, combining management and Board risk oversight. The guidelines on corporate governance and Board committee charters define the scope of review and inquiry for the Board and its committees regarding risk management. As provided below, management and each committee has responsibility for overseeing aspects of risk management and mitigation of the risk.
Management identifies and analyzes risks to determine materiality and other attributes such as timing, probability and controllability, broadly considering our business, the utility industry, the domestic and global economy and the environment. Identification and analysis occurs formally through a key risk assessment process conducted by senior management, the financial disclosure process, the hazard risk management process and internal auditing and compliance with financial and operational controls. Management also identifies and analyzes risk through its business planning process and development of goals and key performance indicators, which include risk identification to determine barriers to implementing Xcel Energy’s strategy. At the same time, the business planning process identifies areas in which there is a potential for a business area to take inappropriate risk to meet goals and determines how to prevent inappropriate risk-taking.
At a threshold level, Xcel Energy has developed a robust compliance program and promotes a culture of compliance, including tone at the top, which mitigates risk. The process for risk mitigation includes adherence to our code of conduct and other compliance policies, operation of formal risk management structures and groups, and overall business management to mitigate the risks inherent in the implementation strategy. Building on this culture of compliance, Xcel Energy manages and further mitigates risks through operation of formal risk management structures and groups, including management councils, risk committees and the services of internal corporate areas such as internal audit, the corporate controller and legal services.
Management communicates regularly with the Board and key stakeholders regarding risk. Senior management presents a periodic assessment of key risks to the Board. The presentation of the key risks and the discussion provides the Board with information on the risks management believes are material, including the earnings impact, timing, likelihood and controllability. Management also provides information to the Board in presentations and communications over the course of the year.
The Board has assigned several important aspects of its governance and oversight to four standing committees to ensure issues and risks are well understood and effectively managed. While the Board as a whole reviews management’s key risk assessment and analyzes areas of potential future risk to Xcel Energy, the committees provide focused oversight of specific risks assigned to them. This provides robust and comprehensive risk management that is critical to successful execution of corporate strategy.
Risks Associated with Our Business
Environmental Risks
We are subject to environmental laws and regulations, with which compliance could be difficult and costly.
We are subject to environmental laws and regulations that affect many aspects of our past, present and future operations, including air emissions, water quality, wastewater discharges and the generation, transport and disposal of solid wastes and hazardous substances. These laws and regulations require us to obtain and comply with a wide variety of environmental requirements including those for protected natural and cultural resources (such as wetlands, endangered species and other protected wildlife, and archaeological and historical resources), licenses, permits, inspections and other approvals. Environmental laws and regulations can also require us to restrict or limit the output of certain facilities or the use of certain fuels, install pollution control equipment at our facilities, clean up spills and other contamination and correct environmental hazards. Environmental regulations may also lead to shutdown of existing facilities, either due to the difficulty in assuring compliance or that the costs of compliance no longer makes operation of the units economic. Both public officials and private individuals may seek to enforce the applicable environmental laws and regulations against us. We may be required to pay all or a portion of the cost to remediate (i.e., cleanup) sites where our past activities, or the activities of certain other parties, caused environmental contamination. At Dec. 31, 2014, these sites included:
• Sites of former MGPs operated by our subsidiaries, predecessors, or other entities; and• Third party sites, such as landfills, for which we are alleged to be a PRP that sent hazardous materials and wastes.
Schedule Q-3 Page 50 of 182
Sponsor: Robinson Case No. 15-00139-UT

35
We are also subject to mandates to provide customers with clean energy, renewable energy and energy conservation offerings. Failure to meet the requirements of these mandates may result in fines or penalties, which could have a material effect on our results of operations. If our regulators do not allow us to recover all or a part of the cost of capital investment or the O&M costs incurred to comply with the mandates, it could have a material effect on our results of operations, financial position or cash flows.
In addition, existing environmental laws or regulations may be revised, and new laws or regulations seeking to protect the environment may be adopted or become applicable to us, including but not limited to, regulation of mercury, NOx, SO2, CO2 and other GHGs, particulates and cooling water intake systems. We may also incur additional unanticipated obligations or liabilities under existing environmental laws and regulations.
We are subject to physical and financial risks associated with climate change.
There is a growing consensus that emissions of GHGs are linked to global climate change. Climate change creates physical and financial risk. Physical risks from climate change include changes in weather conditions, changes in precipitation and extreme weather events.
Our customers’ energy needs vary with weather conditions, primarily temperature and humidity. For residential customers, heating and cooling represent their largest energy use. To the extent weather conditions are affected by climate change, customers’ energy use could increase or decrease. Increased energy use due to weather changes may require us to invest in additional generating assets, transmission and other infrastructure to serve increased load. Decreased energy use due to weather changes may affect our financial condition, through decreased revenues. Extreme weather conditions in general require more system backup, adding to costs, and can contribute to increased system stress, including service interruptions. Weather conditions outside of our service territory could also have an impact on our revenues. We buy and sell electricity depending upon system needs and market opportunities. Extreme weather conditions creating high energy demand may raise electricity prices, which would increase the cost of energy we provide to our customers.
Severe weather impacts our service territories, primarily when thunderstorms, tornadoes and snow or ice storms occur. To the extent the frequency of extreme weather events increases, this could increase our cost of providing service. Changes in precipitation resulting in droughts or water shortages could adversely affect our operations, principally our fossil generating units. A negative impact to water supplies due to long-term drought conditions could adversely impact our ability to provide electricity to customers, as well as increase the price they pay for energy. We may not recover all costs related to mitigating these physical and financial risks.
To the extent climate change impacts a region’s economic health, it may also impact our revenues. Our financial performance is tied to the health of the regional economies we serve. The price of energy, as a factor in a region’s cost of living as well as an important input into the cost of goods and services, has an impact on the economic health of our communities. The cost of additional regulatory requirements, such as a tax on GHGs, regulation of CO2 emissions under section 111(d) of the CAA, or additional environmental regulation could impact the availability of goods and prices charged by our suppliers which would normally be borne by consumers through higher prices for energy and purchased goods. To the extent financial markets view climate change and emissions of GHGs as a financial risk, this could negatively affect our ability to access capital markets or cause us to receive less than ideal terms and conditions.
Financial Risks
Our profitability depends in part on the ability of our utility subsidiaries to recover their costs from their customers and there may be changes in circumstances or in the regulatory environment that impair the ability of our utility subsidiaries to recover costs from their customers.
We are subject to comprehensive regulation by federal and state utility regulatory agencies. The utility commissions in the states where we operate regulate many aspects of our utility operations, including siting and construction of facilities, customer service and the rates that we can charge customers. The FERC has jurisdiction, among other things, over wholesale rates for electric transmission service, the sale of electric energy in interstate commerce and certain natural gas transactions in interstate commerce.
Schedule Q-3 Page 51 of 182
Sponsor: Robinson Case No. 15-00139-UT

36
The profitability of our utility operations is dependent on our ability to recover the costs of providing energy and utility services to our customers and earn a return on our capital investment in our utility operations. Our utility subsidiaries provide service at rates approved by one or more regulatory commissions. These rates are generally regulated and based on an analysis of the utility’s costs incurred in a test year. Our utility subsidiaries are subject to both future and historical test years depending upon the regulatory mechanisms approved in each jurisdiction. Thus, the rates a utility is allowed to charge may or may not match its costs at any given time. While rate regulation is premised on providing an opportunity to earn a reasonable rate of return on invested capital, in a continued low interest rate environment there has been pressure pushing down ROE. There can also be no assurance that the applicable regulatory commission will judge all the costs of our utility subsidiaries to have been prudent or that the regulatory process in which rates are determined will always result in rates that will produce full recovery of such costs. Cost disallowances may arise as a result of prudence investigations (e.g., Monticello LCM/EPU project or the recent investigation of our PSIA costs). Rising fuel costs could increase the risk that our utility subsidiaries will not be able to fully recover their fuel costs from their customers. Furthermore, there could be changes in the regulatory environment that would impair the ability of our utility subsidiaries to recover costs historically collected from their customers.
Management currently believes these prudently incurred costs are recoverable given the existing regulatory mechanisms in place. However, adverse regulatory rulings or the imposition of additional regulations, including additional environmental or climate change regulation, could have an adverse impact on our results of operations and hence could materially and adversely affect our ability to meet our financial obligations, including debt payments and the payment of dividends on our common stock.
Any reductions in our credit ratings could increase our financing costs and the cost of maintaining certain contractual relationships.
We cannot be assured that any of our current ratings or our subsidiaries’ ratings will remain in effect for any given period of time or that a rating will not be lowered or withdrawn entirely by a rating agency. In addition, our credit ratings may change as a result of the differing methodologies or change in the methodologies used by the various rating agencies. Any downgrade could lead to higher borrowing costs. Also, our utility subsidiaries may enter into certain procurement and derivative contracts that require the posting of collateral or settlement of applicable contracts if credit ratings fall below investment grade.
We are subject to capital market and interest rate risks.
Utility operations require significant capital investment in property, plant and equipment. As a result, we frequently need to access the debt and equity capital markets. Any disruption in capital markets could have a material impact on our ability to fund our operations. Capital markets are global in nature and are impacted by numerous issues and events throughout the world economy. Capital market disruption events and resulting broad financial market distress could prevent us from issuing new securities or cause us to issue securities with less than ideal terms and conditions, such as higher interest rates.
Higher interest rates on short-term borrowings with variable interest rates or on incremental commercial paper issuances could also have an adverse effect on our operating results. Changes in interest rates may also impact the fair value of the debt securities in the nuclear decommissioning fund and master pension trust, as well as our ability to earn a return on short-term investments of excess cash.
We are subject to credit risks.
Credit risk includes the risk that our retail customers will not pay their bills, which may lead to a reduction in liquidity and an eventual increase in bad debt expense. Retail credit risk is comprised of numerous factors including the price of products and services provided, the overall economy and local economies in the geographic areas we serve, including local unemployment rates.
Credit risk also includes the risk that various counterparties that owe us money or product will breach their obligations. Should the counterparties to these arrangements fail to perform, we may be forced to enter into alternative arrangements. In that event, our financial results could be adversely affected and we could incur losses.
Schedule Q-3 Page 52 of 182
Sponsor: Robinson Case No. 15-00139-UT
37
One alternative available to address counterparty credit risk is to transact on liquid commodity exchanges. The credit risk is then socialized through the exchange central clearinghouse function. While exchanges do remove counterparty credit risk, all participants are subject to margin requirements, which create an additional need for liquidity to post margin as exchange positions change value daily. The Dodd-Frank Wall Street Reform and Consumer Protection Act (Dodd-Frank Act) requires broad clearing of financial swap transactions through a central counterparty, which could lead to additional margin requirements that would impact our liquidity. However, we have taken advantage of an exception to mandatory clearing afforded to commercial end-users who are not classified as a major swap participant. The Board of Directors has authorized Xcel Energy and its subsidiaries to take advantage of this end-user exception. In addition, the CFTC’s rules permit us to deal in utility operations-related swaps with utility special entities and not be required to register as a swap dealer provided that our aggregate gross notional amount of swap dealing activity (including utility operations-related swaps) does not exceed the general de minimis threshold and provided that we have not exceeded the special entity de minimis threshold (excluding utility operations-related swaps) of $25 million for the preceding 12 months. Our current level of financial swap activity with special entities is significantly below this special entity de minimis threshold; therefore, we will not be classified as a swap dealer in our special entity activity. Swap transactions with non-special entities have a much higher level of activity considered to be de minimis, currently $8 billion, and our level of activity is well under this limit; therefore, we will not be classified as a swap dealer under the Dodd-Frank Act. We are currently reporting all of our swap transactions as part of the Dodd-Frank Act.
We may at times have direct credit exposure in our short-term wholesale and commodity trading activity to various financial institutions trading for their own accounts or issuing collateral support on behalf of other counterparties. We may also have some indirect credit exposure due to participation in organized markets, such as SPP, PJM and MISO, in which any credit losses are socialized to all market participants.
We do have additional indirect credit exposures to various domestic and foreign financial institutions in the form of letters of credit provided as security by power suppliers under various long-term physical purchased power contracts. If any of the credit ratings of the letter of credit issuers were to drop below the designated investment grade rating stipulated in the underlying long-term purchased power contracts, the supplier would need to replace that security with an acceptable substitute. If the security were not replaced, the party could be in technical default under the contract, which would enable us to exercise our contractual rights.
Increasing costs associated with our defined benefit retirement plans and other employee benefits may adversely affect our results of operations, financial position or liquidity.
We have defined benefit pension and postretirement plans that cover substantially all of our employees. Assumptions related to future costs, return on investments, interest rates and other actuarial assumptions have a significant impact on our funding requirements related to these plans. These estimates and assumptions may change based on economic conditions, actual stock and bond market performance, changes in interest rates and changes in governmental regulations. In addition, the Pension Protection Act changed the minimum funding requirements for defined benefit pension plans with modifications to these funding requirements that allowed additional flexibility in the timing of contributions. Therefore, our funding requirements and related contributions may change in the future. Also, the payout of a significant percentage of pension plan liabilities in a single year due to high retirements or employees leaving the company could trigger settlement accounting and could require the company to recognize material incremental pension expense related to unrecognized plan losses in the year these liabilities are paid.
Increasing costs associated with health care plans may adversely affect our results of operations.
Our self-insured costs of health care benefits for eligible employees have increased in recent years. Increasing levels of large individual health care claims and overall health care claims could have an adverse impact on our operating results, financial position and liquidity. We believe that our employee benefit costs, including costs related to health care plans for our employees and former employees, will continue to rise. Changes in industry standards utilized by management in key assumptions (e.g., mortality tables) could have a significant impact on future liabilities and benefit costs. Legislation related to health care could also significantly change our benefit programs and costs.
Schedule Q-3 Page 53 of 182
Sponsor: Robinson Case No. 15-00139-UT

38
We must rely on cash from our subsidiaries to make dividend payments.
We are a holding company and our investments in our subsidiaries are our primary assets. Substantially all of our operations are conducted by our subsidiaries. Consequently, our operating cash flow and our ability to service our indebtedness and pay dividends depends upon the operating cash flows of our subsidiaries and the payment of funds by them to us in the form of dividends. Our subsidiaries are separate legal entities that have no obligation to pay any amounts due pursuant to our obligations or to make any funds available for that purpose or for dividends on our common stock, whether by dividends or otherwise. In addition, each subsidiary’s ability to pay dividends to us depends on any statutory and/or contractual restrictions that may be applicable to such subsidiary, which may include requirements to maintain minimum levels of equity ratios, working capital or assets. Also, our utility subsidiaries are regulated by various state utility commissions, which generally possess broad powers to ensure that the needs of the utility customers are being met.
If our utility subsidiaries were to cease making dividend payments, our ability to pay dividends on our common stock or otherwise meet our financial obligations could be adversely affected.
Operational Risks
We are subject to commodity risks and other risks associated with energy markets and energy production.
We engage in wholesale sales and purchases of electric capacity, energy and energy-related products as well as natural gas. As a result we are subject to market supply and commodity price risk. Commodity price changes can affect the value of our commodity trading derivatives. We mark certain derivatives to estimated fair market value on a daily basis (mark-to-market accounting). Actual settlements can vary significantly from estimated fair values recorded to the consolidated financial statements, and significant changes from the assumptions underlying our fair value estimates could cause significant earnings variability.
If we encounter market supply shortages or our suppliers are otherwise unable to meet their contractual obligations, we may be unable to fulfill our contractual obligations to our customers at previously authorized or anticipated costs. Any such disruption, if significant, would cause us to seek alternative supply services at potentially higher costs or suffer increased liability for unfulfilled contractual obligations. Any significantly higher energy or fuel costs relative to corresponding sales commitments would have a negative impact on our cash flows and could potentially result in economic losses. Potential market supply shortages may not be fully resolved through alternative supply sources and such interruptions may cause short-term disruptions in our ability to provide electric and/or natural gas services to our customers. The impact of these cost and reliability issues vary in magnitude for each operating subsidiary depending upon unique operating conditions such as generation fuels mix, availability of water for cooling, availability of fuel transportation including rail shipments of coal, electric generation capacity, transmission, natural gas pipeline capacity, etc.
Our subsidiary, NSP-Minnesota, is subject to the risks of nuclear generation.
NSP-Minnesota’s two nuclear stations, PI and Monticello, subject it to the risks of nuclear generation, which include:
• The risks associated with use of radioactive material in the production of energy, the management, handling, storage and disposal of these radioactive materials and the current lack of a long-term disposal solution for radioactive materials;
• Limitations on the amounts and types of insurance commercially available to cover losses that might arise in connection with nuclear operations; and
• Uncertainties with respect to the technological and financial aspects of decommissioning nuclear plants at the end of their licensed lives.
The NRC has authority to impose licensing and safety-related requirements for the operation of nuclear generation facilities. In the event of non-compliance, the NRC has the authority to impose fines or shut down a unit, or both, until compliance is achieved. Revised NRC safety requirements could necessitate substantial capital expenditures or a substantial increase in operating expenses at NSP-Minnesota’s nuclear plants. In addition, the Institute for Nuclear Power Operations reviews NSP-Minnesota’s nuclear operations and nuclear generation facilities. Compliance with the Institute for Nuclear Power Operations’ recommendations could result in substantial capital expenditures or a substantial increase in operating expenses.
If an incident did occur, it could have a material effect on our results of operations or financial condition. Furthermore, the non-compliance of other nuclear facilities operators with applicable regulations or the occurrence of a serious nuclear incident at other facilities could result in increased regulation of the industry as a whole, which could then increase NSP-Minnesota’s compliance costs and impact the results of operations of its facilities.
NSP-Wisconsin’s production and transmission system is operated on an integrated basis with NSP-Minnesota’s production and transmission system, and NSP-Wisconsin may be subject to risks associated with NSP-Minnesota’s nuclear generation.
Schedule Q-3 Page 54 of 182
Sponsor: Robinson Case No. 15-00139-UT

39
Our utility operations are subject to long-term planning risks.
Our utility operations file long-term resource plans with our regulators. These plans are based on numerous assumptions over the planning horizon such as: sales growth, customer usage, economic activity, costs, regulatory mechanisms, impact of technology, the installation of distributed generation, customer behavioral response and continuation of the existing utility business model. Given the uncertainty in these planning assumptions, there is a risk that the magnitude and timing of resource additions and demand may not coincide. This is particularly true in PSCo where the addition of customer-site solar installations introduces additional downward pressure on load growth. This could lead to under recovery of costs and excess resources to meet customer demand. Xcel Energy’s aging infrastructure may pose a risk to system reliability and expose us to premature financial obligations. Xcel Energy is engaged in significant and ongoing infrastructure investment programs.
In addition, large industrial customers may leave our system and invest in their own on-site distributed generation or seek law changes to give them the authority to purchase directly from other suppliers or organized markets. The recent low natural gas price environment has caused some customers to consider their options in this area, particularly customers with industrial processes using steam. Wholesale customers may purchase directly from other suppliers and procure only transmission service from our utility subsidiaries. These circumstances provide for greater long-term planning uncertainty related to future load growth. Similarly, distributed solar generation may become an economic competitive threat to our load growth in the future. However, we believe the economics, absent significant subsidies, do not support such a trend in the near term unless a state mandates the purchase of such generation. Some states have considered such legislation.
Our natural gas transmission and distribution operations involve numerous risks that may result in accidents and other operating risks and costs.
Our natural gas transmission and distribution activities include a variety of inherent hazards and operating risks, such as leaks, explosions and mechanical problems, which could cause substantial financial losses. In addition, these risks could result in loss of human life, significant damage to property, environmental pollution, impairment of our operations and substantial losses to us. We maintain insurance against some, but not all, of these risks and losses.
The occurrence of any of these events not fully covered by insurance could have a material effect on our financial position and results of operations. For our natural gas transmission or distribution lines located near populated areas the level of potential damages resulting from these risks is greater.
Additionally, the operating or other costs that may be required in order to comply with potential new regulations, including the Pipeline Safety Act, could be significant. The Pipeline Safety Act requires verification of pipeline infrastructure records by intrastate and interstate pipeline owners and operators to confirm the maximum allowable operating pressure of lines located in high consequence areas or more-densely populated areas. We have programs in place to comply with the Pipeline Safety Act and for systematic infrastructure monitoring and renewal over time. A significant incident could increase regulatory scrutiny and result in penalties and higher costs of operations.
Public Policy Risks
We may be subject to legislative and regulatory responses to climate change and emissions, with which compliance could be difficult and costly.
Increased public awareness and concern regarding climate change may result in more state, regional and/or federal requirements to reduce or mitigate the effects of GHGs. Legislative and regulatory responses related to climate change and new interpretations of existing laws through climate change litigation create financial risk as our electric generating facilities may be subject to additional regulation under climate change laws at either the state or federal level in the future. The EPA is regulating GHGs under the CAA. The EPA has regulated GHG emissions from motor vehicles and has proposed regulations to reduce GHG emissions from existing power plants that are expected to become final in 2015, with state plans to achieve the EPA’s goals due by 2017. Such regulations could impose substantial costs on our system.
The United States continues to participate in international negotiations related to the United Nations Framework Convention on Climate Change (UNFCCC). In 2014, the United States and China jointly announced GHG emissions goals. Further, the 20th Conference of the Parties (COP) to the UNFCCC concluded with the objective of developing an agreement among countries on emission reductions at the 2015 COP. This could result in additional GHG regulation or reduction goals in the United States.
Schedule Q-3 Page 55 of 182
Sponsor: Robinson Case No. 15-00139-UT

40
We have been, and in the future may be subject to climate change lawsuits. An adverse outcome in any of these cases could require substantial capital expenditures and could possibly require payment of substantial penalties or damages. Defense costs associated with such litigation can also be significant. Such payments or expenditures could affect results of operations, cash flows and financial condition if such costs are not recovered through regulated rates.
There are many uncertainties regarding when and in what form climate change legislation or regulations will be imposed. The impact of legislation and regulations will depend on a number of factors, including what GHG emission reduction goals are set, what flexibility is allowed to meet the goals, how and whether early action to reduce GHG emissions is credited, whether GHG sources in other sectors of the economy are regulated, the degree to which GHG offsets are recognized as compliance options, how any emission allowances would be allocated to specific sources and the indirect impact of carbon regulation on natural gas and coal prices. In addition, international treaties or accords could have an impact to the extent they lead to future federal or state regulations. Another important factor is our ability to recover the costs incurred to comply with any regulatory requirements in a timely manner. If our regulators do not allow us to recover all or a part of the cost of capital investment or the O&M costs incurred to comply with the mandates, it could have a material effect on our results of operations.
We are also subject to a significant number of proposed and potential rules that will impact our coal-fired and other generation facilities. These include rules associated with emissions of SO2 and NOx, mercury, regional haze, ozone and particulate matter, water discharges and ash management. The costs of investment to comply with these rules could be substantial and in some cases would lead to early retirement of coal units. We may not be able to timely recover all costs related to complying with regulatory requirements imposed on us.
Increased risks of regulatory penalties could negatively impact our business.
The Energy Act increased civil penalty authority for violation of FERC statutes, rules and orders. The FERC can now impose penalties of up to $1 million per violation per day. In addition, NERC electric reliability standards are now mandatory and subject to potential financial penalties by regional entities, the NERC or the FERC for violations. If a serious reliability incident did occur, it could have a material effect on our operations or financial results. Some states have the authority to impose substantial penalties in the event of non-compliance.
We attempt to mitigate the risk of regulatory penalties through formal training on such prohibited practices and a compliance function that reviews our interaction with the markets under FERC and CFTC jurisdictions. However, there is no guarantee our compliance program will be sufficient to ensure against violations.
Macroeconomic Risks
Economic conditions impact our business.
Our operations are affected by local, national and worldwide economic conditions both positively and negatively. Growth in our customer base is correlated with economic conditions. While the number of customers is growing, sales growth is relatively modest due to an increased focus on energy efficiency including federal standards for appliance and lighting efficiency and distributed generation, primarily solar PV. Instability in the financial markets also may affect the cost of capital and our ability to raise capital, which are discussed in the capital market risk section above.
Economic conditions may be impacted by insufficient financial sector liquidity leading to potential increased unemployment, which may impact customers’ ability to pay timely, increase customer bankruptcies, and may lead to increased bad debt.
Further, worldwide economic activity has an impact on the demand for basic commodities needed for utility infrastructure, such as steel, copper, aluminum, etc., which may impact our ability to acquire sufficient supplies. Additionally, the cost of those commodities may be higher than expected.
Schedule Q-3 Page 56 of 182
Sponsor: Robinson Case No. 15-00139-UT

41
Our operations could be impacted by war, acts of terrorism, threats of terrorism or disruptions in normal operating conditions due to localized or regional events.
Our generation plants, fuel storage facilities, transmission and distribution facilities and information systems may be targets of terrorist activities that could disrupt our ability to produce or distribute some portion of our energy products. Any such disruption could result in a decrease in revenues and additional costs to repair and insure our assets. These disruptions could have a material impact on our financial condition and results of operations. The potential for terrorism has subjected our operations to increased risks and could have a material effect on our business. We have already incurred increased costs for security and capital expenditures in response to these risks. In addition, we may experience additional capital and operating costs to implement security for our plants, including our nuclear power plants under the NRC’s design basis threat requirements. We have also already incurred increased costs for compliance with NERC reliability standards associated with critical infrastructure protection, and may experience additional capital and operating costs to comply with the NERC critical infrastructure protection standards as they are implemented and clarified.
The insurance industry has also been affected by these events and the availability of insurance may decrease. In addition, the insurance we are able to obtain may have higher deductibles, higher premiums and more restrictive policy terms.
A disruption of the regional electric transmission grid, interstate natural gas pipeline infrastructure or other fuel sources, could negatively impact our business. Because our generation, transmission systems and local natural gas distribution companies are part of an interconnected system, we face the risk of possible loss of business due to a disruption caused by the actions of a neighboring utility or an event (severe storm, severe temperature extremes, generator or transmission facility outage, pipeline rupture, railroad disruption, sudden and significant increase or decrease in wind generation, or any disruption of work force such as may be caused by flu or other epidemic) within our operating systems or on a neighboring system. Any such disruption could result in a significant decrease in revenues and significant additional costs to repair assets, which could have a material impact on our financial condition and results.
The degree to which we are able to maintain day-to-day operations in response to unforeseen events will in part determine the financial impact of certain events on our financial condition and results. It is difficult to predict the magnitude of such events and associated impacts.
A cyber incident or cyber security breach could have a material effect on our business.
We operate in an industry that requires the continued operation of sophisticated information technology systems and network infrastructure. In addition, we use our systems and infrastructure to create, collect, use, disclose, store, dispose of and otherwise process sensitive information, including company data, customer energy usage data, and personal information regarding customers, employees and their dependents, contractors, shareholders and other individuals.
Our generation, transmission, distribution and fuel storage facilities, information technology systems and other infrastructure or physical assets, as well as the information processed in our systems (e.g., information about our customers, employees, operations, infrastructure and assets) could be affected by cyber security incidents, including those caused by human error. Our industry has begun to see an increased volume and sophistication of cyber security incidents from international activist organizations, Nation States, and individuals. Cyber security incidents could harm our businesses by limiting our generating, transmitting and distributing capabilities, delaying our development and construction of new facilities or capital improvement projects to existing facilities, disrupting our customer operations, or exposing us to liability. Our generation, transmission systems and natural gas pipelines are part of an interconnected system. Therefore, a disruption caused by the impact of a cyber security incident of the regional electric transmission grid, natural gas pipeline infrastructure or other fuel sources of our third party service providers’ operations, could also negatively impact our business. In addition, such an event would likely receive regulatory scrutiny at both the federal and state level. We are unable to quantify the potential impact of cyber security threats or subsequent related actions. These potential cyber security incidents and corresponding regulatory action could result in a material decrease in revenues and may cause significant additional costs (e.g., penalties, third party claims, repairs, insurance or compliance) and potentially disrupt our supply and markets for natural gas, oil and other fuels.
We maintain security measures designed to protect our information technology systems, network infrastructure and other assets. However, these assets and the information they process may be vulnerable to cyber security incidents, including the resulting disability, or failures of assets or unauthorized access to assets or information. If our technology systems were to fail or be breached, or those of our third-party service providers, we may be unable to fulfill critical business functions, including effectively maintaining certain internal controls over financial reporting. We are unable to quantify the potential impact of cyber security incidents on our business.
Schedule Q-3 Page 57 of 182
Sponsor: Robinson Case No. 15-00139-UT

42
Rising energy prices could negatively impact our business.
While we have fuel clause recovery mechanisms in most of our states, higher fuel costs could significantly impact our results of operations if costs are not recovered. In addition, higher fuel costs could reduce customer demand and/or increase bad debt expense, which could also have a material impact on our results of operations. Delays in the timing of the collection of fuel cost recoveries as compared with expenditures for fuel purchases could have an impact on our cash flows. Low fuel costs could have a positive impact on sales although, particularly on the southern part of our service territory, low oil prices could negatively impact oil and gas production activities. We are unable to predict future prices or the ultimate impact of such prices on our results of operations or cash flows.
Our operating results may fluctuate on a seasonal and quarterly basis and can be adversely affected by milder weather.
Our electric and natural gas utility businesses are seasonal, and weather patterns can have a material impact on our operating performance. Demand for electricity is often greater in the summer and winter months associated with cooling and heating. Because natural gas is heavily used for residential and commercial heating, the demand for this product depends heavily upon weather patterns throughout our service territory, and a significant amount of natural gas revenues are recognized in the first and fourth quarters related to the heating season. Accordingly, our operations have historically generated less revenues and income when weather conditions are milder in the winter and cooler in the summer. Unusually mild winters and summers could have an adverse effect on our financial condition, results of operations, or cash flows.
Item 1B — Unresolved Staff Comments
None.
Item 2 — Properties
Virtually all of the utility plant property of NSP-Minnesota, NSP-Wisconsin, PSCo and SPS is subject to the lien of their first mortgage bond indentures.
Electric Utility Generating Stations:
NSP-Minnesota
Station, Location and Unit Fuel Installed
Summer 2014Net Dependable
Capability (MW)Steam:A.S. King-Bayport, Minn., 1 Unit . . . . . . . . . . . . . . . . . . . . . . . . Coal 1968 511Sherco-Becker, Minn.
Unit 1. . . . . . . . . . . . . . . . . . . . . . . . . . . . . . . . . . . . . . . . . . . . . Coal 1976 680Unit 2. . . . . . . . . . . . . . . . . . . . . . . . . . . . . . . . . . . . . . . . . . . . . Coal 1977 682Unit 3. . . . . . . . . . . . . . . . . . . . . . . . . . . . . . . . . . . . . . . . . . . . . Coal 1987 507 (a)
Monticello-Monticello, Minn., 1 Unit . . . . . . . . . . . . . . . . . . . . . Nuclear 1971 554PI-Welch, Minn.
Unit 1. . . . . . . . . . . . . . . . . . . . . . . . . . . . . . . . . . . . . . . . . . . . . Nuclear 1973 521Unit 2. . . . . . . . . . . . . . . . . . . . . . . . . . . . . . . . . . . . . . . . . . . . . Nuclear 1974 519
Black Dog-Burnsville, Minn., 2 Units. . . . . . . . . . . . . . . . . . . . . Coal/Natural Gas 1955-1960 215Various locations, 4 Units . . . . . . . . . . . . . . . . . . . . . . . . . . . . . . Wood/Refuse-derived fuel Various 36 (b)
Combustion Turbine:Angus Anson-Sioux Falls, S.D., 3 Units . . . . . . . . . . . . . . . . . . . Natural Gas 1994-2005 327Black Dog-Burnsville, Minn., 2 Units. . . . . . . . . . . . . . . . . . . . . Natural Gas 1987-2002 271Blue Lake-Shakopee, Minn., 6 Units. . . . . . . . . . . . . . . . . . . . . . Natural Gas 1974-2005 453High Bridge-St. Paul, Minn., 3 Units . . . . . . . . . . . . . . . . . . . . . Natural Gas 2008 534Inver Hills-Inver Grove Heights, Minn., 6 Units. . . . . . . . . . . . . Natural Gas 1972 282Riverside-Minneapolis, Minn., 3 Units . . . . . . . . . . . . . . . . . . . . Natural Gas 2009 470Various locations, 17 Units . . . . . . . . . . . . . . . . . . . . . . . . . . . . . Natural Gas Various 101Wind:Grand Meadow-Mower County, Minn., 67 Units . . . . . . . . . . . . Wind 2008 101 (c)
Nobles-Nobles County, Minn., 134 Units . . . . . . . . . . . . . . . . . . Wind 2010 201 (c)
Total 6,965(a) Based on NSP-Minnesota’s ownership of 59 percent.(b) Refuse-derived fuel is made from municipal solid waste.(c) This capacity is only available when wind conditions are sufficiently high enough to support the noted generation values above. Therefore, the on-demand net
dependable capacity is zero.
Schedule Q-3 Page 58 of 182
Sponsor: Robinson Case No. 15-00139-UT

43
NSP-Wisconsin
Station, Location and Unit Fuel Installed
Summer 2014Net Dependable
Capability (MW)Steam:Bay Front-Ashland, Wis., 3 Units . . . . . . . . . . . . . . . . . . . . . . . . Coal/Wood/Natural Gas 1948-1956 56French Island-La Crosse, Wis., 2 Units . . . . . . . . . . . . . . . . . . . . Wood/Refuse-derived fuel 1940-1948 16
(a)
Combustion Turbine:Flambeau Station-Park Falls, Wis., 1 Unit. . . . . . . . . . . . . . . . . . Natural Gas 1969 12French Island-La Crosse, Wis., 2 Units . . . . . . . . . . . . . . . . . . . . Natural Gas 1974 122Wheaton-Eau Claire, Wis., 6 Units . . . . . . . . . . . . . . . . . . . . . . . Natural Gas 1973 290Hydro:Various locations, 63 Units . . . . . . . . . . . . . . . . . . . . . . . . . . . . . Hydro Various 135
Total 631(a) Refuse-derived fuel is made from municipal solid waste.
PSCo
Station, Location and Unit Fuel Installed
Summer 2014Net Dependable
Capability (MW)Steam:Cherokee-Denver, Colo., 2 Units. . . . . . . . . . . . . . . . . . . . . . . . . Coal 1957-1968 504Comanche-Pueblo, Colo.
Unit 1. . . . . . . . . . . . . . . . . . . . . . . . . . . . . . . . . . . . . . . . . . . . . Coal 1973 325Unit 2. . . . . . . . . . . . . . . . . . . . . . . . . . . . . . . . . . . . . . . . . . . . . Coal 1975 335Unit 3. . . . . . . . . . . . . . . . . . . . . . . . . . . . . . . . . . . . . . . . . . . . . Coal 2010 500 (a)
Craig-Craig, Colo., 2 Units . . . . . . . . . . . . . . . . . . . . . . . . . . . . . Coal 1979-1980 83 (b)
Hayden-Hayden, Colo., 2 Units. . . . . . . . . . . . . . . . . . . . . . . . . . Coal 1965-1976 237 (c)
Pawnee-Brush, Colo., 1 Unit . . . . . . . . . . . . . . . . . . . . . . . . . . . . Coal 1981 505Valmont-Boulder, Colo., 1 Unit. . . . . . . . . . . . . . . . . . . . . . . . . . Coal 1964 184Zuni-Denver, Colo., 1 Unit . . . . . . . . . . . . . . . . . . . . . . . . . . . . . Coal 1948-1954 59Combustion Turbine:Blue Spruce-Aurora, Colo., 2 Units. . . . . . . . . . . . . . . . . . . . . . . Natural Gas 2003 264Fort St. Vrain-Platteville, Colo., 6 Units . . . . . . . . . . . . . . . . . . . Natural Gas 1972-2009 969Rocky Mountain-Keenesburg, Colo., 3 Units . . . . . . . . . . . . . . . Natural Gas 2004 580Various locations, 6 Units . . . . . . . . . . . . . . . . . . . . . . . . . . . . . . Natural Gas Various 172Hydro:Cabin Creek-Georgetown, Colo.
Pumped Storage, 2 Units. . . . . . . . . . . . . . . . . . . . . . . . . . . . . . Hydro 1967 210Various locations, 9 Units . . . . . . . . . . . . . . . . . . . . . . . . . . . . . . Hydro Various 26Wind:Ponnequin-Weld County, Colo., 37 Units . . . . . . . . . . . . . . . . . . Wind 1999-2001 25 (d)
Total 4,978
(a) Based on PSCo’s ownership interest of 67 percent of Unit 3.(b) Based on PSCo’s ownership interest of 10 percent.(c) Based on PSCo’s ownership interest of 76 percent of Unit 1 and 37 percent of Unit 2.(d) This capacity is only available when wind conditions are sufficiently high enough to support the noted generation values above. Therefore, the on-demand net
dependable capacity is zero.
Schedule Q-3 Page 59 of 182
Sponsor: Robinson Case No. 15-00139-UT

44
SPS
Station, Location and Unit Fuel Installed
Summer 2014Net Dependable
Capability (MW)Steam:Harrington-Amarillo, Texas, 3 Units. . . . . . . . . . . . . . . . . . . . . . Coal 1976-1980 1,018Tolk-Muleshoe, Texas, 2 Units . . . . . . . . . . . . . . . . . . . . . . . . . . Coal 1982-1985 1,067Cunningham-Hobbs, N.M., 2 Units. . . . . . . . . . . . . . . . . . . . . . . Natural Gas 1957-1965 254Jones-Lubbock, Texas, 2 Units . . . . . . . . . . . . . . . . . . . . . . . . . . Natural Gas 1971-1974 486Maddox-Hobbs, N.M., 1 Unit . . . . . . . . . . . . . . . . . . . . . . . . . . . Natural Gas 1967 112Nichols-Amarillo, Texas, 3 Units . . . . . . . . . . . . . . . . . . . . . . . . Natural Gas 1960-1968 457Plant X-Earth, Texas, 4 Units . . . . . . . . . . . . . . . . . . . . . . . . . . . Natural Gas 1952-1964 411Combustion Turbine:Carlsbad-Carlsbad, N.M., 1 Unit . . . . . . . . . . . . . . . . . . . . . . . . . Natural Gas 1968 10Cunningham-Hobbs, N.M., 2 Units. . . . . . . . . . . . . . . . . . . . . . . Natural Gas 1998 212Jones-Lubbock, Texas, 2 Units . . . . . . . . . . . . . . . . . . . . . . . . . . Natural Gas 2011-2013 338Maddox-Hobbs, N.M., 1 Unit . . . . . . . . . . . . . . . . . . . . . . . . . . . Natural Gas 1963-1976 61
Total 4,426
Electric utility overhead and underground transmission and distribution lines (measured in conductor miles) at Dec. 31, 2014:
Conductor Miles NSP-Minnesota NSP-Wisconsin PSCo SPS
500 KV . . . . . . . . . . . . . . . . . . . . . . . . . . . . . . . . . . . . . 2,917 — — —345 KV . . . . . . . . . . . . . . . . . . . . . . . . . . . . . . . . . . . . . 8,403 1,152 2,630 8,110230 KV . . . . . . . . . . . . . . . . . . . . . . . . . . . . . . . . . . . . . 1,803 — 12,162 9,312161 KV . . . . . . . . . . . . . . . . . . . . . . . . . . . . . . . . . . . . . 416 1,575 — —138 KV . . . . . . . . . . . . . . . . . . . . . . . . . . . . . . . . . . . . . — — 92 —115 KV . . . . . . . . . . . . . . . . . . . . . . . . . . . . . . . . . . . . . 7,502 1,746 4,889 12,378Less than 115 KV . . . . . . . . . . . . . . . . . . . . . . . . . . . . . 84,090 32,408 75,110 23,294
Electric utility transmission and distribution substations at Dec. 31, 2014:
NSP-Minnesota NSP-Wisconsin PSCo SPS
Quantity. . . . . . . . . . . . . . . . . . . . . . . . . . . . . . . . . . . . . 356 201 229 433
Natural gas utility mains at Dec. 31, 2014:
Miles NSP-Minnesota NSP-Wisconsin PSCo WGI
Transmission . . . . . . . . . . . . . . . . . . . . . . . . . . . . . . . . . 136 — 2,258 11Distribution . . . . . . . . . . . . . . . . . . . . . . . . . . . . . . . . . . 9,931 2,316 21,844 —
Item 3 — Legal Proceedings
Xcel Energy is involved in various litigation matters that are being defended and handled in the ordinary course of business. The assessment of whether a loss is probable or is a reasonable possibility, and whether the loss or a range of loss is estimable, often involves a series of complex judgments about future events. Management maintains accruals for such losses that are probable of being incurred and subject to reasonable estimation. Management is sometimes unable to estimate an amount or range of a reasonably possible loss in certain situations, including but not limited to when (1) the damages sought are indeterminate, (2) the proceedings are in the early stages, or (3) the matters involve novel or unsettled legal theories. In such cases, there is considerable uncertainty regarding the timing or ultimate resolution of such matters, including a possible eventual loss.
Additional Information
See Note 13 to the consolidated financial statements for further discussion of legal claims and environmental proceedings. See Item 1, Item 7 and Note 12 to the consolidated financial statements for a discussion of proceedings involving utility rates and other regulatory matters.
Item 4 — Mine Safety Disclosures
None.
Schedule Q-3 Page 60 of 182
Sponsor: Robinson Case No. 15-00139-UT

45
PART II
Item 5 — Market for Registrant’s Common Equity, Related Stockholder Matters and Issuer Purchases of Equity Securities
Quarterly Stock Data
Xcel Energy Inc.’s common stock is listed on the New York Stock Exchange (NYSE). The trading symbol is XEL. The number of common shareholders of record as of Dec. 31, 2014 was approximately 67,716. The following are the high and low stock prices based on the NYSE Composite Transactions for the quarters of 2014 and 2013 and the dividends declared per share during those quarters. See Item 7 and Note 4 to the consolidated financial statements for further discussion of Xcel Energy Inc.’s dividend policy.
2014 High Low Dividends
First quarter . . . . . . . . . . . . . . . . . . . . . . . . . . . . . . . . . . . . . . . . . . . . . . . . . . . . . . . . . . . . . $ 30.77 $ 27.27 $ 0.3000Second quarter . . . . . . . . . . . . . . . . . . . . . . . . . . . . . . . . . . . . . . . . . . . . . . . . . . . . . . . . . . . 32.37 29.83 0.3000Third quarter . . . . . . . . . . . . . . . . . . . . . . . . . . . . . . . . . . . . . . . . . . . . . . . . . . . . . . . . . . . . 32.48 29.60 0.3000Fourth quarter . . . . . . . . . . . . . . . . . . . . . . . . . . . . . . . . . . . . . . . . . . . . . . . . . . . . . . . . . . . 37.58 30.18 0.3000
2013 High Low Dividends
First quarter . . . . . . . . . . . . . . . . . . . . . . . . . . . . . . . . . . . . . . . . . . . . . . . . . . . . . . . . . . . . . $ 29.74 $ 26.77 $ 0.2700Second quarter . . . . . . . . . . . . . . . . . . . . . . . . . . . . . . . . . . . . . . . . . . . . . . . . . . . . . . . . . . . 31.79 27.38 0.2800Third quarter . . . . . . . . . . . . . . . . . . . . . . . . . . . . . . . . . . . . . . . . . . . . . . . . . . . . . . . . . . . . 30.41 26.90 0.2800Fourth quarter . . . . . . . . . . . . . . . . . . . . . . . . . . . . . . . . . . . . . . . . . . . . . . . . . . . . . . . . . . . 29.40 27.14 0.2800
The following compares our cumulative TSR on common stock with the cumulative total return of the EEI Investor-Owned Electrics Index and the S&P’s 500 Composite Stock Price Index over the last five years (assuming a $100 investment on Dec. 31, 2009, and the reinvestment of all dividends).
The EEI Investor-Owned Electrics Index currently includes 48 companies and is a broad measure of industry performance.
COMPARISON OF FIVE YEAR CUMULATIVE TOTAL RETURN*Among Xcel Energy Inc., the EEI Investor-Owned Electrics
and the S&P 500
* $100 invested on Dec. 31, 2009 in stock or index — including reinvestment of dividends. Fiscal years ending Dec. 31.
2009 2010 2011 2012 2013 2014
Xcel Energy Inc. . . . . . . . . . . . . . . . . . . . . . . . . . . . . $ 100 $ 116 $ 142 $ 143 $ 155 $ 207EEI Investor-Owned Electrics . . . . . . . . . . . . . . . . . . 100 107 128 131 148 191S&P 500. . . . . . . . . . . . . . . . . . . . . . . . . . . . . . . . . . . 100 115 117 136 180 205
Schedule Q-3 Page 61 of 182
Sponsor: Robinson Case No. 15-00139-UT

46
Securities Authorized for Issuance Under Equity Compensation Plans
Information required under Item 5 — Securities Authorized for Issuance Under Equity Compensation Plans is contained in Xcel Energy Inc.’s Proxy Statement for its 2015 Annual Meeting of Shareholders, which is incorporated by reference.
UNREGISTERED SALES OF EQUITY SECURITIES AND USE OF PROCEEDS
Purchases of Equity Securities by the Issuer and Affiliated Purchasers
The following table provides information about our purchases of equity securities that are registered by Xcel Energy Inc. pursuant to Section 12 of the Exchange Act for the year ended Dec. 31, 2014:
Issuer Purchases of Equity Securities
Period
Total Numberof Shares
PurchasedAverage PricePaid per Share
Total Number ofShares Purchased as
Part of PubliclyAnnounced Plans or
Programs
Maximum Number (orApproximate Dollar Value) of
Shares That May Yet BePurchased Under the Plans or
Programs
Jan. 1, 2014 — Jan. 31, 2014 (a) . . . . 18,874 $ 28.11 — —Feb. 1, 2014 — Dec. 31, 2014 . . . . . — — — —
Total . . . . . . . . . . . . . . . . . . . . . . . . 18,874 — —(a) Xcel Energy Inc. or one of its agents periodically purchases common shares in order to satisfy obligations under the Stock Equivalent Plan for Non-Employee
Directors.
Item 6 — Selected Financial Data
(Millions of Dollars, Thousands of Shares, Except Per Share Data) 2014 2013 2012 2011 2010
Operating revenues . . . . . . . . . . . . . . . . . . . . . . . . . . . . . . . . $ 11,686 $ 10,915 $ 10,128 $ 10,655 $ 10,311Operating expenses . . . . . . . . . . . . . . . . . . . . . . . . . . . . . . . . 9,738 9,067 8,306 8,873 8,691Net income. . . . . . . . . . . . . . . . . . . . . . . . . . . . . . . . . . . . . . . 1,021 948 905 841 756Earnings available to common shareholders . . . . . . . . . . . . . 1,021 948 905 834 752Weighted average common shares outstanding:
Basic . . . . . . . . . . . . . . . . . . . . . . . . . . . . . . . . . . . . . . . . . . 503,847 496,073 487,899 485,039 462,052Diluted . . . . . . . . . . . . . . . . . . . . . . . . . . . . . . . . . . . . . . . . . 504,117 496,532 488,434 485,615 463,391
EPS:Basic . . . . . . . . . . . . . . . . . . . . . . . . . . . . . . . . . . . . . . . . . . $ 2.03 $ 1.91 $ 1.86 $ 1.72 $ 1.63Diluted . . . . . . . . . . . . . . . . . . . . . . . . . . . . . . . . . . . . . . . . . 2.03 1.91 1.85 1.72 1.62
Dividends declared per common share . . . . . . . . . . . . . . . . . 1.20 1.11 1.07 1.03 1.00Total assets. . . . . . . . . . . . . . . . . . . . . . . . . . . . . . . . . . . . . . . 36,958 33,907 31,141 29,497 27,388Long-term debt (a). . . . . . . . . . . . . . . . . . . . . . . . . . . . . . . . . . 11,500 10,911 10,144 8,849 9,263Book value per share . . . . . . . . . . . . . . . . . . . . . . . . . . . . . . . 20.20 19.21 18.19 17.44 16.76Return on average common equity . . . . . . . . . . . . . . . . . . . . 10.3% 10.3% 10.4% 10.1% 9.8%Ratio of earnings to fixed charges (b) . . . . . . . . . . . . . . . . . . . 3.3 3.1 2.8 2.8 2.7
Non-GAAP:Ongoing earnings (c) . . . . . . . . . . . . . . . . . . . . . . . . . . . . . . . . $ 1,021 $ 968 $ 888 $ 841 $ 756
(a) Includes capital lease obligations.(b) See Exhibit 12.01.(c) See Item 7 for a reconciliation of ongoing earnings to GAAP earnings.
Item 7 — Management’s Discussion and Analysis of Financial Condition and Results of Operations
Business Segments and Organizational Overview
Xcel Energy Inc. is a public utility holding company. Xcel Energy’s operations included the activity of four utility subsidiaries that serve electric and natural gas customers in eight states. These utility subsidiaries are NSP-Minnesota, NSP-Wisconsin, PSCo and SPS. These utilities serve customers in portions of Colorado, Michigan, Minnesota, New Mexico, North Dakota, South Dakota, Texas and Wisconsin. Along with the TransCo subsidiaries, WYCO, a joint venture formed with CIG to develop and lease natural gas pipelines, storage and compression facilities, and WGI, an interstate natural gas pipeline company, these companies comprise the regulated utility operations.
Schedule Q-3 Page 62 of 182
Sponsor: Robinson Case No. 15-00139-UT

47
Xcel Energy Inc.’s nonregulated subsidiary is Eloigne, which invests in rental housing projects that qualify for low-income housing tax credits.
Forward-Looking Statements
Except for the historical statements contained in this report, the matters discussed in the following discussion and analysis are forward-looking statements that are subject to certain risks, uncertainties and assumptions. Such forward-looking statements, including the 2015 EPS guidance and assumptions, are intended to be identified in this document by the words “anticipate,” “believe,” “estimate,” “expect,” “intend,” “may,” “objective,” “outlook,” “plan,” “project,” “possible,” “potential,” “should” and similar expressions. Actual results may vary materially. Forward-looking statements speak only as of the date they are made, and we do not undertake any obligation to update them to reflect changes that occur after that date. Factors that could cause actual results to differ materially include, but are not limited to: general economic conditions, including inflation rates, monetary fluctuations and their impact on capital expenditures and the ability of Xcel Energy Inc. and its subsidiaries to obtain financing on favorable terms; business conditions in the energy industry, including the risk of a slowdown in the U.S. economy or delay in growth recovery; trade, fiscal, taxation and environmental policies in areas where Xcel Energy has a financial interest; customer business conditions; actions of credit rating agencies; competitive factors, including the extent and timing of the entry of additional competition in the markets served by Xcel Energy Inc. and its subsidiaries; unusual weather; effects of geopolitical events, including war and acts of terrorism; cyber security threats and data security breaches; state, federal and foreign legislative and regulatory initiatives that affect cost and investment recovery, have an impact on rates or have an impact on asset operation or ownership or impose environmental compliance conditions; structures that affect the speed and degree to which competition enters the electric and natural gas markets; costs and other effects of legal and administrative proceedings, settlements, investigations and claims; actions by regulatory bodies impacting our nuclear operations, including those affecting costs, operations or the approval of requests pending before the NRC; financial or regulatory accounting policies imposed by regulatory bodies; availability or cost of capital; employee work force factors; the items described under Factors Affecting Results of Operations; and the other risk factors listed from time to time by Xcel Energy Inc. in reports filed with the SEC, including “Risk Factors” in Item 1A of this Annual Report on Form 10-K and Exhibit 99.01 hereto.
Management’s Strategic Plans
Xcel Energy’s corporate strategy focuses on the following primary objectives:
• Improving utility performance;• Driving operational excellence;• Providing options and solutions to customers; and• Investing for the future.
These objectives are designed to provide our investors an attractive total return and our customers with clean, safe, reliable energy at a competitive price. Below is a discussion of these objectives and how they support our overall strategy.
Improving utility performance
Xcel Energy is made up of several utility operating companies. As part of the regulatory process, each state will generally establish an authorized ROE. In many of our states, our utility operating companies are earning less than the authorized ROE. This is referred to as an ROE gap. An ROE gap can be a result of numerous factors including the timing of implementation of new rates, timing of capital investments, a regulatory commission not allowing the recovery of certain costs, the time period used as test year for rate cases, fluctuations in sales, the impact of weather, unanticipated cost increases, etc. Xcel Energy is focused on closing this gap over the next several years. As a result, we have established the following goals:
• Close the ROE gap by 50 basis points by 2018; and • Derive 75 percent of our revenue from multi-year plans by 2017.
We are pursuing regulatory and legislative changes to streamline rate case proceedings and optimize recovery, while improving our alignment with state policies and keeping pace with evolving customer preferences.
Schedule Q-3 Page 63 of 182
Sponsor: Robinson Case No. 15-00139-UT

48
Driving operational excellence
Managing our operational performance and satisfying our customers has, and will continue to be, a fundamental priority. However, operational excellence also includes managing costs. By building on past success, leveraging technology, managing risks and continuously striving to improve our processes, we can bend the cost curve downward. Over the next five years, Xcel Energy is planning to implement cost saving measures which are intended to align increases in O&M expense more closely to sales growth. Our financial objective is to slow our annual O&M expense growth to approximately zero percent to two percent. However, we will not sacrifice reliability or safety to meet this initiative.
In addition, 50 percent of our workforce will be eligible to retire in the next ten years. Managing this workforce transition is key to our operational excellence objective.
Providing options and solutions to customers
Adapting to a changing environment is critical to our success. Our customers expect to be offered choices and we are committed to providing options and solutions that are fair and satisfy their needs. Environmental leadership is a core priority and is designed to meet customer and policy maker expectations for clean energy at a competitive price while creating shareholder value. We will continue to offer and expand our production of renewable energy, including wind and solar alternatives, and further develop DSM, conservation and renewable programs.
Investing for the future
Sound investments today are necessary for tomorrow’s success. Our base capital expenditures are projected to be approximately $14.5 billion from 2015 through 2019. This capital forecast will grow rate base at a compounded average annual rate of approximately 4.7 percent. Our capital investment plan includes needed investments in transmission, adding new generation, reducing emissions in our power plants, refreshing our infrastructure, improving reliability, replacing natural gas pipelines and increasing the levels of renewable energy on our system. In addition to our base capital investment plan, we are looking at potential incremental investments in natural gas assets and transmission projects through our recently established independent TransCos.
Xcel Energy has a proven track record of making sound investments. We proactively made the decision to balance our generation portfolio and expand our alternative energy production. Our customers, stakeholders and the environment are currently benefiting from these decisions and will continue to do so in the future.
Providing an attractive total return
Successful execution of our strategic plan should allow Xcel Energy to deliver an attractive total return for our shareholders. Through a combination of earnings growth and dividend yield, we plan to:
• Deliver long-term annual EPS growth of four percent to six percent, based on a weather-normalized 2014 EPS of $2.00;• Deliver annual dividend increases of five percent to seven percent;• Target a dividend payout ratio of 60 to 70 percent of annual ongoing EPS; and• Maintain senior unsecured debt credit ratings in the BBB+ to A range.
We have successfully achieved our prior financial objectives, meeting or exceeding our earnings guidance range for ten consecutive years and believe we are positioned to continue to achieve our value proposition. Our ongoing earnings have grown approximately 6.5 percent and our dividend has grown approximately 3.8 percent annually from 2005 through 2014. Prior to 2014, our objective was to grow the dividend two to four percent annually. In addition, our current senior unsecured debt credit ratings for Xcel Energy and its utility subsidiaries are in the BBB+ to A range.
Financial Review
The following discussion and analysis by management focuses on those factors that had a material effect on Xcel Energy’s financial condition, results of operations and cash flows during the periods presented, or are expected to have a material impact in the future. It should be read in conjunction with the accompanying consolidated financial statements and the related notes to consolidated financial statements.
Schedule Q-3 Page 64 of 182
Sponsor: Robinson Case No. 15-00139-UT

49
The only common equity securities that are publicly traded are common shares of Xcel Energy Inc. The diluted earnings and EPS of each subsidiary as well as the ROE of each subsidiary discussed below do not represent a direct legal interest in the assets and liabilities allocated to such subsidiary but rather represent a direct interest in our assets and liabilities as a whole. Ongoing diluted EPS and ongoing ROE for Xcel Energy and by subsidiary are financial measures not recognized under GAAP. Ongoing diluted EPS is calculated by dividing the net income or loss attributable to the controlling interest of each subsidiary, adjusted for certain nonrecurring items, by the weighted average fully diluted Xcel Energy Inc. common shares outstanding for the period. Ongoing ROE is calculated by dividing the net income or loss attributable to the controlling interest of Xcel Energy or each subsidiary, adjusted for certain nonrecurring items, by each entity’s average common stockholders’ or stockholder’s equity. We use these non-GAAP financial measures to evaluate and provide details of earnings results. We believe these measurements are useful to investors to evaluate the actual and projected financial performance and contribution of our subsidiaries. These non-GAAP financial measures should not be considered as alternatives to measures calculated and reported in accordance with GAAP.
Results of Operations
The following table summarizes the diluted EPS for Xcel Energy:
Diluted Earnings (Loss) Per Share 2014 2013 2012
PSCo. . . . . . . . . . . . . . . . . . . . . . . . . . . . . . . . . . . . . . . . . . . . . . . . . . . . . . . . . . . . . . . . . . . $ 0.90 $ 0.91 $ 0.90NSP-Minnesota . . . . . . . . . . . . . . . . . . . . . . . . . . . . . . . . . . . . . . . . . . . . . . . . . . . . . . . . . . 0.80 0.79 0.70SPS . . . . . . . . . . . . . . . . . . . . . . . . . . . . . . . . . . . . . . . . . . . . . . . . . . . . . . . . . . . . . . . . . . . . 0.26 0.23 0.22NSP-Wisconsin. . . . . . . . . . . . . . . . . . . . . . . . . . . . . . . . . . . . . . . . . . . . . . . . . . . . . . . . . . . 0.14 0.12 0.10Equity earnings of unconsolidated subsidiaries . . . . . . . . . . . . . . . . . . . . . . . . . . . . . . . . . . 0.04 0.04 0.04Regulated utility . . . . . . . . . . . . . . . . . . . . . . . . . . . . . . . . . . . . . . . . . . . . . . . . . . . . . . . . . . 2.14 2.09 1.96Xcel Energy Inc. and other. . . . . . . . . . . . . . . . . . . . . . . . . . . . . . . . . . . . . . . . . . . . . . . . . . (0.11) (0.14) (0.14)Ongoing diluted EPS . . . . . . . . . . . . . . . . . . . . . . . . . . . . . . . . . . . . . . . . . . . . . . . . . . . . . 2.03 1.95 1.82SPS FERC complaint case orders . . . . . . . . . . . . . . . . . . . . . . . . . . . . . . . . . . . . . . . . . . . . — (0.04) —Prescription drug tax benefit . . . . . . . . . . . . . . . . . . . . . . . . . . . . . . . . . . . . . . . . . . . . . . . . — — 0.03GAAP diluted EPS . . . . . . . . . . . . . . . . . . . . . . . . . . . . . . . . . . . . . . . . . . . . . . . . . . . . . . . $ 2.03 $ 1.91 $ 1.85
Ongoing earnings exclude adjustments for certain items. For 2013, the adjustment to GAAP earnings is related to the SPS FERC complaint case orders. For 2012, the adjustment is related to the Patient Protection and Affordable Care Act. See below under Adjustments to GAAP Earnings and Note 12 and Note 6 to the consolidated financial statements for further discussion, respectively, for the 2013 and 2012 adjustments.
Xcel Energy’s management believes that ongoing earnings provide a meaningful comparison of earnings results and is representative of Xcel Energy’s fundamental core earnings power. Xcel Energy’s management uses ongoing earnings internally for financial planning and analysis, for reporting of results to the Board of Directors, in determining whether performance targets are met for performance-based compensation, and when communicating its earnings outlook to analysts and investors.
2013 Adjustment to GAAP Earnings
SPS FERC Orders — As a result of the orders issued in August 2013 by the FERC for a potential SPS customer refund, a pre-tax charge of $36 million was recorded in 2013. Of this amount, approximately $30 million ($26 million revenue reduction and $4 million of interest) was attributable to periods prior to 2013 and not representative of ongoing earnings. As such, GAAP earnings include the total after tax amount of $24.4 million and ongoing earnings exclude $20.2 million. See Note 12 to the consolidated financial statements for further discussion.
2012 Adjustment to GAAP Earnings
Prescription drug tax benefit — In the third quarter of 2012, Xcel Energy implemented a tax strategy related to the allocation of funding of Xcel Energy’s retiree prescription drug plan. This strategy restored a portion of the tax benefit associated with federal subsidies for prescription drug plans that had been accrued since 2004 and was expensed in 2010. As a result, Xcel Energy recognized approximately $17 million, or $0.03 per share, of income tax benefit. See Note 6 to the consolidated financial statements for further discussion.
Schedule Q-3 Page 65 of 182
Sponsor: Robinson Case No. 15-00139-UT

50
Earnings Adjusted for Certain Items (Ongoing EPS)
2014 Comparison with 2013
Xcel Energy — Overall, ongoing earnings increased $0.08 per share for 2014. Ongoing earnings increased as a result of higher electric and natural gas margins due to rate increases in various jurisdictions, weather-normalized sales growth and lower interest charges. These positive factors were partially offset by the unfavorable impact of milder weather, as well as higher expected O&M expenses, property taxes and depreciation. 2013 GAAP earnings include a $0.04 per share charge for a potential SPS customer refund based on FERC orders issued in August 2013. This item was excluded from 2013 ongoing earnings.
PSCo — PSCo’s ongoing earnings decreased $0.01 per share for 2014. Higher natural gas and electric margins primarily due to rate increases, higher AFUDC, lower O&M expenses and weather-normalized sales growth were offset by higher property taxes, depreciation, accruals associated with the electric earnings test refund obligations and the unfavorable impact of weather.
NSP-Minnesota — NSP-Minnesota’s ongoing earnings increased $0.01 per share for 2014. Ongoing earnings were positively impacted by electric rate increases in Minnesota (interim, subject to refund) and North Dakota and weather-normalized sales growth. These items were partially offset by higher O&M expenses, the unfavorable impact of weather, lower AFUDC, increased property taxes and interest charges.
SPS — SPS’ ongoing earnings increased $0.03 per share for 2014. Electric rate increases in Texas and New Mexico and weather-normalized sales growth offset higher O&M and depreciation expenses.
NSP-Wisconsin — NSP-Wisconsin’s ongoing earnings increased $0.02 per share for 2014. An electric rate increase led to higher electric margin, while weather-normalized sales growth positively impacted both electric and natural gas margins. These increases were partially offset by additional O&M expenses.
Xcel Energy Inc. and other — Xcel Energy Inc. and other includes financing costs at the holding company and other items. Earnings improved by $0.03 per share for 2014, largely due to lower financing costs as a result of the refinancing of junior subordinated notes.
2013 Comparison with 2012
Xcel Energy — Overall, ongoing earnings increased $0.13 per share for 2013. Ongoing earnings increased as a result of higher electric and gas margins due to rate increases in various states, the impact of favorable colder weather on the natural gas business and reduced interest charges. These positive factors were partially offset by planned increases in O&M expenses and depreciation.
PSCo — PSCo’s ongoing earnings increased $0.01 per share for 2013. Ongoing earnings increased as a result of higher gas and electric margins primarily due to rate increases, the impact of cooler weather on natural gas margins and lower interest charges, partially offset by higher depreciation, O&M expenses and customer refunds related to the 2013 electric earnings test refund obligation.
NSP-Minnesota — NSP-Minnesota’s ongoing earnings increased $0.09 per share for 2013. Ongoing earnings were positively impacted by electric rate increases in Minnesota and South Dakota, interim rates subject to refund in North Dakota, the impact of cooler winter weather and lower interest charges. These items were partially offset by higher O&M expenses.
SPS — SPS’ ongoing earnings increased $0.01 per share for 2013. Electric rate increases in Texas and the gain associated with the sale of certain transmission assets to Sharyland were partially offset by higher depreciation.
NSP-Wisconsin — NSP-Wisconsin’s ongoing earnings increased $0.02 per share for 2013. Higher ongoing earnings from electric and natural gas rates and cooler winter weather were partially offset by higher O&M expenses and depreciation.
Schedule Q-3 Page 66 of 182
Sponsor: Robinson Case No. 15-00139-UT

51
Changes in Diluted EPS
The following table summarizes significant components contributing to the changes in 2014 EPS compared with the same period in 2013.
Diluted Earnings (Loss) Per Share Dec. 31
2013 GAAP diluted EPS. . . . . . . . . . . . . . . . . . . . . . . . . . . . . . . . . . . . . . . . . . . . . . . . . . . . . . . . . . . . . . . . . . . . . . . . . . . . $ 1.91SPS FERC complaint case orders. . . . . . . . . . . . . . . . . . . . . . . . . . . . . . . . . . . . . . . . . . . . . . . . . . . . . . . . . . . . . . . . . . . . . . 0.042013 ongoing diluted EPS . . . . . . . . . . . . . . . . . . . . . . . . . . . . . . . . . . . . . . . . . . . . . . . . . . . . . . . . . . . . . . . . . . . . . . . . . . 1.95
Components of change — 2014 vs. 2013Higher electric margins (excludes 2013 impact of SPS FERC complaint case orders). . . . . . . . . . . . . . . . . . . . . . . . . . . . 0.26Higher natural gas margins. . . . . . . . . . . . . . . . . . . . . . . . . . . . . . . . . . . . . . . . . . . . . . . . . . . . . . . . . . . . . . . . . . . . . . . . . . 0.06Lower interest charges (excludes 2013 impact of SPS FERC complaint case orders) . . . . . . . . . . . . . . . . . . . . . . . . . . . . 0.01Higher O&M expenses. . . . . . . . . . . . . . . . . . . . . . . . . . . . . . . . . . . . . . . . . . . . . . . . . . . . . . . . . . . . . . . . . . . . . . . . . . . . . (0.07)Higher taxes (other than income taxes) . . . . . . . . . . . . . . . . . . . . . . . . . . . . . . . . . . . . . . . . . . . . . . . . . . . . . . . . . . . . . . . . (0.06)Higher depreciation and amortization . . . . . . . . . . . . . . . . . . . . . . . . . . . . . . . . . . . . . . . . . . . . . . . . . . . . . . . . . . . . . . . . . (0.05)Higher conservation and DSM program expenses . . . . . . . . . . . . . . . . . . . . . . . . . . . . . . . . . . . . . . . . . . . . . . . . . . . . . . . . (0.05)Dilution from at-the-market program, direct stock purchase plan and benefit plans. . . . . . . . . . . . . . . . . . . . . . . . . . . . . . (0.03)Other, net . . . . . . . . . . . . . . . . . . . . . . . . . . . . . . . . . . . . . . . . . . . . . . . . . . . . . . . . . . . . . . . . . . . . . . . . . . . . . . . . . . . . . . . 0.01
2014 ongoing and GAAP diluted EPS. . . . . . . . . . . . . . . . . . . . . . . . . . . . . . . . . . . . . . . . . . . . . . . . . . . . . . . . . . . . . . . . . $ 2.03
Diluted Earnings (Loss) Per Share Dec. 31
2012 GAAP diluted EPS. . . . . . . . . . . . . . . . . . . . . . . . . . . . . . . . . . . . . . . . . . . . . . . . . . . . . . . . . . . . . . . . . . . . . . . . . . . . $ 1.85Prescription drug tax benefit. . . . . . . . . . . . . . . . . . . . . . . . . . . . . . . . . . . . . . . . . . . . . . . . . . . . . . . . . . . . . . . . . . . . . . . . . . (0.03)2012 ongoing diluted EPS . . . . . . . . . . . . . . . . . . . . . . . . . . . . . . . . . . . . . . . . . . . . . . . . . . . . . . . . . . . . . . . . . . . . . . . . . . 1.82
Components of change — 2013 vs. 2012Higher electric margins (excludes impact of SPS FERC complaint case orders) . . . . . . . . . . . . . . . . . . . . . . . . . . . . . . . . 0.18Higher natural gas margins. . . . . . . . . . . . . . . . . . . . . . . . . . . . . . . . . . . . . . . . . . . . . . . . . . . . . . . . . . . . . . . . . . . . . . . . . . 0.08Higher AFUDC — equity . . . . . . . . . . . . . . . . . . . . . . . . . . . . . . . . . . . . . . . . . . . . . . . . . . . . . . . . . . . . . . . . . . . . . . . . . . 0.05Lower interest charges (excludes impact of SPS FERC complaint case orders) . . . . . . . . . . . . . . . . . . . . . . . . . . . . . . . . . 0.04Gain on sale of transmission assets (included in O&M expenses) . . . . . . . . . . . . . . . . . . . . . . . . . . . . . . . . . . . . . . . . . . . 0.02Higher O&M expenses (excludes gain on sale of transmission assets) . . . . . . . . . . . . . . . . . . . . . . . . . . . . . . . . . . . . . . . . (0.14)Higher depreciation and amortization . . . . . . . . . . . . . . . . . . . . . . . . . . . . . . . . . . . . . . . . . . . . . . . . . . . . . . . . . . . . . . . . . (0.06)Dilution from at-the-market program, direct stock purchase plan and benefit plans. . . . . . . . . . . . . . . . . . . . . . . . . . . . . . (0.03)Higher taxes (other than income taxes) . . . . . . . . . . . . . . . . . . . . . . . . . . . . . . . . . . . . . . . . . . . . . . . . . . . . . . . . . . . . . . . . (0.01)
2013 ongoing diluted EPS . . . . . . . . . . . . . . . . . . . . . . . . . . . . . . . . . . . . . . . . . . . . . . . . . . . . . . . . . . . . . . . . . . . . . . . . . . 1.95SPS FERC complaint case orders. . . . . . . . . . . . . . . . . . . . . . . . . . . . . . . . . . . . . . . . . . . . . . . . . . . . . . . . . . . . . . . . . . . . . . (0.04)2013 GAAP diluted EPS. . . . . . . . . . . . . . . . . . . . . . . . . . . . . . . . . . . . . . . . . . . . . . . . . . . . . . . . . . . . . . . . . . . . . . . . . . . . $ 1.91
The following table summarizes the ROE for Xcel Energy and its utility subsidiaries:
ROE — 2014 PSCo NSP-Minnesota SPS NSP-Wisconsin Xcel Energy
2014 ongoing and GAAP ROE . . . . . . . . . . . . . 9.40% 8.82% 8.88% 10.85% 10.33%
ROE — 2013 PSCo NSP-Minnesota SPS NSP-Wisconsin Xcel Energy
2013 ongoing ROE . . . . . . . . . . . . . . . . . . . . . . 9.66% 9.24% 9.03% 10.61% 10.50%SPS FERC complaint case orders . . . . . . . . . . . — — (1.54) — (0.22)2013 GAAP ROE . . . . . . . . . . . . . . . . . . . . . . . 9.66% 9.24% 7.49% 10.61% 10.28%
ROE - 2012 PSCo NSP-Minnesota SPS NSP-Wisconsin Xcel Energy
2012 ongoing ROE . . . . . . . . . . . . . . . . . . . . . . 9.92% 8.77% 9.44% 9.62% 10.24%Prescription drug tax benefit . . . . . . . . . . . . . . . 0.38 — — — 0.192012 GAAP ROE . . . . . . . . . . . . . . . . . . . . . . . 10.30% 8.77% 9.44% 9.62% 10.43%
Schedule Q-3 Page 67 of 182
Sponsor: Robinson Case No. 15-00139-UT
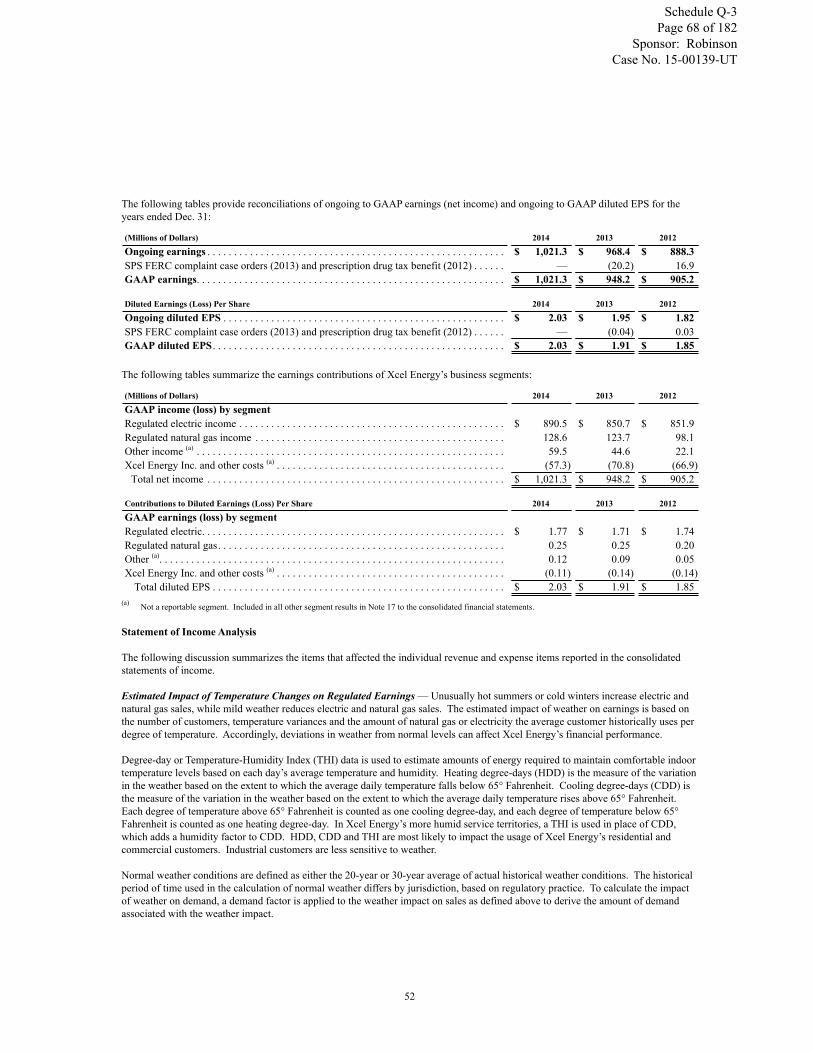
52
The following tables provide reconciliations of ongoing to GAAP earnings (net income) and ongoing to GAAP diluted EPS for the years ended Dec. 31:
(Millions of Dollars) 2014 2013 2012
Ongoing earnings . . . . . . . . . . . . . . . . . . . . . . . . . . . . . . . . . . . . . . . . . . . . . . . . . . . . . . . . $ 1,021.3 $ 968.4 $ 888.3SPS FERC complaint case orders (2013) and prescription drug tax benefit (2012) . . . . . . — (20.2) 16.9GAAP earnings. . . . . . . . . . . . . . . . . . . . . . . . . . . . . . . . . . . . . . . . . . . . . . . . . . . . . . . . . . $ 1,021.3 $ 948.2 $ 905.2
Diluted Earnings (Loss) Per Share 2014 2013 2012
Ongoing diluted EPS . . . . . . . . . . . . . . . . . . . . . . . . . . . . . . . . . . . . . . . . . . . . . . . . . . . . . $ 2.03 $ 1.95 $ 1.82SPS FERC complaint case orders (2013) and prescription drug tax benefit (2012) . . . . . . — (0.04) 0.03GAAP diluted EPS . . . . . . . . . . . . . . . . . . . . . . . . . . . . . . . . . . . . . . . . . . . . . . . . . . . . . . . $ 2.03 $ 1.91 $ 1.85
The following tables summarize the earnings contributions of Xcel Energy’s business segments:
(Millions of Dollars) 2014 2013 2012
GAAP income (loss) by segmentRegulated electric income . . . . . . . . . . . . . . . . . . . . . . . . . . . . . . . . . . . . . . . . . . . . . . . . . . $ 890.5 $ 850.7 $ 851.9Regulated natural gas income . . . . . . . . . . . . . . . . . . . . . . . . . . . . . . . . . . . . . . . . . . . . . . . 128.6 123.7 98.1Other income (a) . . . . . . . . . . . . . . . . . . . . . . . . . . . . . . . . . . . . . . . . . . . . . . . . . . . . . . . . . . 59.5 44.6 22.1Xcel Energy Inc. and other costs (a) . . . . . . . . . . . . . . . . . . . . . . . . . . . . . . . . . . . . . . . . . . . (57.3) (70.8) (66.9)
Total net income . . . . . . . . . . . . . . . . . . . . . . . . . . . . . . . . . . . . . . . . . . . . . . . . . . . . . . . . $ 1,021.3 $ 948.2 $ 905.2
Contributions to Diluted Earnings (Loss) Per Share 2014 2013 2012
GAAP earnings (loss) by segmentRegulated electric. . . . . . . . . . . . . . . . . . . . . . . . . . . . . . . . . . . . . . . . . . . . . . . . . . . . . . . . . $ 1.77 $ 1.71 $ 1.74Regulated natural gas. . . . . . . . . . . . . . . . . . . . . . . . . . . . . . . . . . . . . . . . . . . . . . . . . . . . . . 0.25 0.25 0.20Other (a). . . . . . . . . . . . . . . . . . . . . . . . . . . . . . . . . . . . . . . . . . . . . . . . . . . . . . . . . . . . . . . . . 0.12 0.09 0.05Xcel Energy Inc. and other costs (a) . . . . . . . . . . . . . . . . . . . . . . . . . . . . . . . . . . . . . . . . . . . (0.11) (0.14) (0.14)
Total diluted EPS . . . . . . . . . . . . . . . . . . . . . . . . . . . . . . . . . . . . . . . . . . . . . . . . . . . . . . . $ 2.03 $ 1.91 $ 1.85(a) Not a reportable segment. Included in all other segment results in Note 17 to the consolidated financial statements.
Statement of Income Analysis
The following discussion summarizes the items that affected the individual revenue and expense items reported in the consolidated statements of income.
Estimated Impact of Temperature Changes on Regulated Earnings — Unusually hot summers or cold winters increase electric and natural gas sales, while mild weather reduces electric and natural gas sales. The estimated impact of weather on earnings is based on the number of customers, temperature variances and the amount of natural gas or electricity the average customer historically uses per degree of temperature. Accordingly, deviations in weather from normal levels can affect Xcel Energy’s financial performance.
Degree-day or Temperature-Humidity Index (THI) data is used to estimate amounts of energy required to maintain comfortable indoor temperature levels based on each day’s average temperature and humidity. Heating degree-days (HDD) is the measure of the variation in the weather based on the extent to which the average daily temperature falls below 65° Fahrenheit. Cooling degree-days (CDD) is the measure of the variation in the weather based on the extent to which the average daily temperature rises above 65° Fahrenheit. Each degree of temperature above 65° Fahrenheit is counted as one cooling degree-day, and each degree of temperature below 65° Fahrenheit is counted as one heating degree-day. In Xcel Energy’s more humid service territories, a THI is used in place of CDD, which adds a humidity factor to CDD. HDD, CDD and THI are most likely to impact the usage of Xcel Energy’s residential and commercial customers. Industrial customers are less sensitive to weather.
Normal weather conditions are defined as either the 20-year or 30-year average of actual historical weather conditions. The historical period of time used in the calculation of normal weather differs by jurisdiction, based on regulatory practice. To calculate the impact of weather on demand, a demand factor is applied to the weather impact on sales as defined above to derive the amount of demand associated with the weather impact.
Schedule Q-3 Page 68 of 182
Sponsor: Robinson Case No. 15-00139-UT

53
The percentage increase (decrease) in normal and actual HDD, CDD and THI are provided in the following table:
2014 vs.Normal
2013 vs.Normal
2014 vs.2013
2012 vs.Normal
2013 vs.2012
HDD . . . . . . . . . . . . . . . . . . . . . . . . . . . . . . . . . . . . . . . . . . . 7.8% 6.5% 0.4% (15.9)% 25.8%CDD . . . . . . . . . . . . . . . . . . . . . . . . . . . . . . . . . . . . . . . . . . . (2.6) 24.7 (20.3) 46.1 (13.6)THI . . . . . . . . . . . . . . . . . . . . . . . . . . . . . . . . . . . . . . . . . . . . (11.9) 21.8 (24.2) 36.1 (9.7)
Weather — The following table summarizes the estimated impact of temperature variations on EPS compared with sales under normal weather conditions:
2014 vs.Normal
2013 vs.Normal
2014 vs.2013
2012 vs.Normal
2013 vs.2012
Retail electric . . . . . . . . . . . . . . . . . . . . . . . . . . . . . . . . . . . . $ 0.010 $ 0.088 $ (0.078) $ 0.081 $ 0.007Firm natural gas . . . . . . . . . . . . . . . . . . . . . . . . . . . . . . . . . . 0.019 0.021 (0.002) (0.033) 0.054
Total . . . . . . . . . . . . . . . . . . . . . . . . . . . . . . . . . . . . . . . . . . $ 0.029 $ 0.109 $ (0.080) $ 0.048 $ 0.061
Sales Growth (Decline) — The following tables summarize Xcel Energy and its utility subsidiaries’ sales growth (decline) for actual and weather-normalized sales for the years ended Dec. 31, compared with the previous year:
2014 vs. 2013Xcel Energy NSP-Wisconsin SPS PSCo NSP-Minnesota
ActualElectric residential . . . . . . . . . . . . . . . . . . . . . (1.8)% (0.3)% (0.4)% (2.8)% (1.6)%Electric C&I. . . . . . . . . . . . . . . . . . . . . . . . . . 1.0 4.2 2.5 0.3 —
Total retail electric sales . . . . . . . . . . . . . . . 0.2 2.8 1.8 (0.7) (0.5)Firm natural gas sales . . . . . . . . . . . . . . . . . . 2.3 7.4 N/A (0.7) 7.3
2014 vs. 2013Xcel Energy NSP-Wisconsin SPS PSCo NSP-Minnesota
Weather-normalizedElectric residential . . . . . . . . . . . . . . . . . . . . . 0.5% 0.5% 0.4% 0.3% 0.7%Electric C&I. . . . . . . . . . . . . . . . . . . . . . . . . . 1.7 4.4 2.8 1.6 0.6
Total retail electric sales . . . . . . . . . . . . . . . 1.3 3.3 2.3 1.2 0.6Firm natural gas sales . . . . . . . . . . . . . . . . . . 4.6 3.8 N/A 5.2 3.6
Weather-normalized Electric Growth
• NSP-Wisconsin’s electric sales growth was largely due to strong sales to large C&I customers primarily in the oil, gas and sand mining industries.
• SPS’ C&I growth was driven by continued expansion from oil and gas exploration and production in the Southeastern New Mexico, Permian Basin area.
• PSCo’s electric sales growth was primarily due to customers in the food manufacturing, fracking and mining industries.• NSP-Minnesota’s electric sales growth was led by an increased number of customers for both residential and small C&I, as
well as higher use per customer in small C&I.
Weather-normalized Natural Gas Growth
• Across our natural gas service territories, strong sales were experienced in 2014, which continued the trend that began in the last half of 2013.
Weather-normalized sales for 2015 are projected to increase approximately 1.0 percent for retail electric customers and to decline approximately 2.0 percent for retail firm natural gas customers.
2013 vs. 2012Xcel Energy NSP-Wisconsin SPS PSCo NSP-Minnesota
Actual (Without 2012 Leap Day)Electric residential . . . . . . . . . . . . . . . . . . . . . 1.4% 3.9% 0.9% 1.1% 1.3%Electric C&I. . . . . . . . . . . . . . . . . . . . . . . . . . 0.3 1.0 1.8 0.3 (0.7)
Total retail electric sales . . . . . . . . . . . . . . . 0.6 1.9 1.5 0.5 (0.1)Firm natural gas sales . . . . . . . . . . . . . . . . . . 21.9 30.0 N/A 17.8 29.1
Schedule Q-3 Page 69 of 182
Sponsor: Robinson Case No. 15-00139-UT

54
2013 vs. 2012Xcel Energy NSP-Wisconsin SPS PSCo NSP-Minnesota
Weather-normalized (Without2012 Leap Day)Electric residential . . . . . . . . . . . . . . . . . . . . . 0.5% 0.5% 0.7% 1.3% (0.2)%Electric C&I. . . . . . . . . . . . . . . . . . . . . . . . . . 0.4 0.9 2.1 0.9 (1.1)
Total retail electric sales . . . . . . . . . . . . . . . 0.4 0.8 1.7 1.0 (0.8)Firm natural gas sales . . . . . . . . . . . . . . . . . . 3.8 5.9 N/A 3.3 4.2
2013 vs. 2012Xcel Energy NSP-Wisconsin SPS PSCo NSP-Minnesota
ActualElectric residential . . . . . . . . . . . . . . . . . . . . . 1.1% 3.6% 0.6% 0.8% 1.1%Electric C&I. . . . . . . . . . . . . . . . . . . . . . . . . . — 0.7 1.5 — (1.0)
Total retail electric sales . . . . . . . . . . . . . . . 0.3 1.6 1.3 0.3 (0.4)Firm natural gas sales . . . . . . . . . . . . . . . . . . 21.3 29.4 N/A 17.3 28.5
2013 vs. 2012Xcel Energy NSP-Wisconsin SPS PSCo NSP-Minnesota
Weather-normalizedElectric residential . . . . . . . . . . . . . . . . . . . . . 0.2% 0.2% 0.5% 1.0% (0.5)%Electric C&I. . . . . . . . . . . . . . . . . . . . . . . . . . 0.1 0.6 1.8 0.7 (1.4)
Total retail electric sales . . . . . . . . . . . . . . . 0.1 0.5 1.5 0.7 (1.1)Firm natural gas sales . . . . . . . . . . . . . . . . . . 3.3 5.3 N/A 2.8 3.7
Electric Revenues and Margin
Electric revenues and fuel and purchased power expenses are largely impacted by the fluctuation in the price of natural gas, coal and uranium used in the generation of electricity, but as a result of the design of fuel recovery mechanisms to recover current expenses, these price fluctuations have minimal impact on electric margin. The following table details the electric revenues and margin:
(Millions of Dollars) 2014 2013 2012
Electric revenues . . . . . . . . . . . . . . . . . . . . . . . . . . . . . . . . . . . . . . . . . . . . . . . . . . . . . . . . . $ 9,466 $ 9,034 $ 8,517Electric fuel and purchased power . . . . . . . . . . . . . . . . . . . . . . . . . . . . . . . . . . . . . . . . . . . (4,210) (4,019) (3,624)
Electric margin . . . . . . . . . . . . . . . . . . . . . . . . . . . . . . . . . . . . . . . . . . . . . . . . . . . . . . . . . $ 5,256 $ 5,015 $ 4,893
The following tables summarize the components of the changes in electric revenues and electric margin for the years ended Dec. 31:
Electric Revenues
(Millions of Dollars) 2014 vs. 2013
Retail rate increases (a) . . . . . . . . . . . . . . . . . . . . . . . . . . . . . . . . . . . . . . . . . . . . . . . . . . . . . . . . . . . . . . . . . . . . . . . . . . $ 129Trading. . . . . . . . . . . . . . . . . . . . . . . . . . . . . . . . . . . . . . . . . . . . . . . . . . . . . . . . . . . . . . . . . . . . . . . . . . . . . . . . . . . . . . 100Fuel and purchased power cost recovery . . . . . . . . . . . . . . . . . . . . . . . . . . . . . . . . . . . . . . . . . . . . . . . . . . . . . . . . . . . . 78Non-fuel riders . . . . . . . . . . . . . . . . . . . . . . . . . . . . . . . . . . . . . . . . . . . . . . . . . . . . . . . . . . . . . . . . . . . . . . . . . . . . . . . . 57Transmission revenue . . . . . . . . . . . . . . . . . . . . . . . . . . . . . . . . . . . . . . . . . . . . . . . . . . . . . . . . . . . . . . . . . . . . . . . . . . 48Conservation and DSM program revenues (offset by expenses). . . . . . . . . . . . . . . . . . . . . . . . . . . . . . . . . . . . . . . . . . 44Retail sales growth, excluding weather impact . . . . . . . . . . . . . . . . . . . . . . . . . . . . . . . . . . . . . . . . . . . . . . . . . . . . . . . 24Estimated impact of weather . . . . . . . . . . . . . . . . . . . . . . . . . . . . . . . . . . . . . . . . . . . . . . . . . . . . . . . . . . . . . . . . . . . . . (60)Other, net . . . . . . . . . . . . . . . . . . . . . . . . . . . . . . . . . . . . . . . . . . . . . . . . . . . . . . . . . . . . . . . . . . . . . . . . . . . . . . . . . . . . (14)
Total increase in ongoing electric revenues. . . . . . . . . . . . . . . . . . . . . . . . . . . . . . . . . . . . . . . . . . . . . . . . . . . . . . . . . 406SPS FERC complaint case orders (b) . . . . . . . . . . . . . . . . . . . . . . . . . . . . . . . . . . . . . . . . . . . . . . . . . . . . . . . . . . . . . . . 26
Total increase in GAAP electric revenues. . . . . . . . . . . . . . . . . . . . . . . . . . . . . . . . . . . . . . . . . . . . . . . . . . . . . . . . . . $ 432
2014 Comparison with 2013 — Electric revenues increased primarily due to various rate increases across all of the utility subsidiaries, higher trading and increased fuel and purchased power cost recovery, which is offset in operating expense.
Schedule Q-3 Page 70 of 182
Sponsor: Robinson Case No. 15-00139-UT

55
Electric Margin
(Millions of Dollars) 2014 vs. 2013
Retail rate increases (a) . . . . . . . . . . . . . . . . . . . . . . . . . . . . . . . . . . . . . . . . . . . . . . . . . . . . . . . . . . . . . . . . . . . . . . . . . . $ 129Non-fuel riders . . . . . . . . . . . . . . . . . . . . . . . . . . . . . . . . . . . . . . . . . . . . . . . . . . . . . . . . . . . . . . . . . . . . . . . . . . . . . . . . 57Conservation and DSM program revenues (offset by expenses). . . . . . . . . . . . . . . . . . . . . . . . . . . . . . . . . . . . . . . . . . 44Transmission revenue, net of costs . . . . . . . . . . . . . . . . . . . . . . . . . . . . . . . . . . . . . . . . . . . . . . . . . . . . . . . . . . . . . . . . 31Retail sales growth, excluding weather impact . . . . . . . . . . . . . . . . . . . . . . . . . . . . . . . . . . . . . . . . . . . . . . . . . . . . . . . 24NSP-Wisconsin fuel recovery . . . . . . . . . . . . . . . . . . . . . . . . . . . . . . . . . . . . . . . . . . . . . . . . . . . . . . . . . . . . . . . . . . . . 11Estimated impact of weather . . . . . . . . . . . . . . . . . . . . . . . . . . . . . . . . . . . . . . . . . . . . . . . . . . . . . . . . . . . . . . . . . . . . . (60)Firm wholesale. . . . . . . . . . . . . . . . . . . . . . . . . . . . . . . . . . . . . . . . . . . . . . . . . . . . . . . . . . . . . . . . . . . . . . . . . . . . . . . . (6)Other, net . . . . . . . . . . . . . . . . . . . . . . . . . . . . . . . . . . . . . . . . . . . . . . . . . . . . . . . . . . . . . . . . . . . . . . . . . . . . . . . . . . . . (15)
Total increase in ongoing electric margin . . . . . . . . . . . . . . . . . . . . . . . . . . . . . . . . . . . . . . . . . . . . . . . . . . . . . . . . . . 215SPS FERC complaint case orders (b) . . . . . . . . . . . . . . . . . . . . . . . . . . . . . . . . . . . . . . . . . . . . . . . . . . . . . . . . . . . . . . . 26
Total increase in GAAP electric margin . . . . . . . . . . . . . . . . . . . . . . . . . . . . . . . . . . . . . . . . . . . . . . . . . . . . . . . . . . . $ 241
(a) The retail rate increases include final rates in Texas, Colorado (net of estimated earnings test refund obligations), New Mexico, Wisconsin and North Dakota and interim rates in Minnesota, subject to and net of estimated provision for refund. See Note 12 to the consolidated financial statements.
(b) As a result of two orders issued by the FERC in August 2013, a pretax charge of approximately $36 million ($32 million in electric revenues, of which $6 million relates to 2013 and $26 million relates to periods prior to 2013, and $4 million in interest charges) was recorded in 2013. See Note 12 to the consolidated financial statements.
2014 Comparison to 2013 — The increase in electric margin was primarily due to the various rate increases across all of the utility subsidiaries.
Electric Revenues
(Millions of Dollars) 2013 vs. 2012
Fuel and purchased power cost recovery . . . . . . . . . . . . . . . . . . . . . . . . . . . . . . . . . . . . . . . . . . . . . . . . . . . . . . . . . . . . $ 360Retail rate increases (a) . . . . . . . . . . . . . . . . . . . . . . . . . . . . . . . . . . . . . . . . . . . . . . . . . . . . . . . . . . . . . . . . . . . . . . . . . . 229Transmission revenue . . . . . . . . . . . . . . . . . . . . . . . . . . . . . . . . . . . . . . . . . . . . . . . . . . . . . . . . . . . . . . . . . . . . . . . . . . 68Non-fuel riders . . . . . . . . . . . . . . . . . . . . . . . . . . . . . . . . . . . . . . . . . . . . . . . . . . . . . . . . . . . . . . . . . . . . . . . . . . . . . . . . 18Estimated impact of weather . . . . . . . . . . . . . . . . . . . . . . . . . . . . . . . . . . . . . . . . . . . . . . . . . . . . . . . . . . . . . . . . . . . . . 7PSCo earnings test refund obligation. . . . . . . . . . . . . . . . . . . . . . . . . . . . . . . . . . . . . . . . . . . . . . . . . . . . . . . . . . . . . . . (43)Firm wholesale. . . . . . . . . . . . . . . . . . . . . . . . . . . . . . . . . . . . . . . . . . . . . . . . . . . . . . . . . . . . . . . . . . . . . . . . . . . . . . . . (36)Conservation and DSM program incentives . . . . . . . . . . . . . . . . . . . . . . . . . . . . . . . . . . . . . . . . . . . . . . . . . . . . . . . . . (24)Trading. . . . . . . . . . . . . . . . . . . . . . . . . . . . . . . . . . . . . . . . . . . . . . . . . . . . . . . . . . . . . . . . . . . . . . . . . . . . . . . . . . . . . . (19)SPS FERC complaint case orders (b) . . . . . . . . . . . . . . . . . . . . . . . . . . . . . . . . . . . . . . . . . . . . . . . . . . . . . . . . . . . . . . . (6)Other, net . . . . . . . . . . . . . . . . . . . . . . . . . . . . . . . . . . . . . . . . . . . . . . . . . . . . . . . . . . . . . . . . . . . . . . . . . . . . . . . . . . . . (11)
Total increase in ongoing electric revenues. . . . . . . . . . . . . . . . . . . . . . . . . . . . . . . . . . . . . . . . . . . . . . . . . . . . . . . . . 543SPS FERC complaint case orders (b) . . . . . . . . . . . . . . . . . . . . . . . . . . . . . . . . . . . . . . . . . . . . . . . . . . . . . . . . . . . . . . . (26)
Total increase in GAAP electric revenues. . . . . . . . . . . . . . . . . . . . . . . . . . . . . . . . . . . . . . . . . . . . . . . . . . . . . . . . . . $ 517
2013 Comparison with 2012 — Electric revenues increased primarily due to higher fuel and purchased power cost recovery, which is offset in operating expense, and various rate increases across all of the utility subsidiaries.
Schedule Q-3 Page 71 of 182
Sponsor: Robinson Case No. 15-00139-UT

56
Electric Margin
(Millions of Dollars) 2013 vs. 2012
Retail rate increases (a) . . . . . . . . . . . . . . . . . . . . . . . . . . . . . . . . . . . . . . . . . . . . . . . . . . . . . . . . . . . . . . . . . . . . . . . . . . $ 229Transmission revenue, net of costs . . . . . . . . . . . . . . . . . . . . . . . . . . . . . . . . . . . . . . . . . . . . . . . . . . . . . . . . . . . . . . . . 36Non-fuel riders . . . . . . . . . . . . . . . . . . . . . . . . . . . . . . . . . . . . . . . . . . . . . . . . . . . . . . . . . . . . . . . . . . . . . . . . . . . . . . . . 18Estimated impact of weather . . . . . . . . . . . . . . . . . . . . . . . . . . . . . . . . . . . . . . . . . . . . . . . . . . . . . . . . . . . . . . . . . . . . . 7PSCo earnings test refund obligation. . . . . . . . . . . . . . . . . . . . . . . . . . . . . . . . . . . . . . . . . . . . . . . . . . . . . . . . . . . . . . . (43)Conservation and DSM program incentives . . . . . . . . . . . . . . . . . . . . . . . . . . . . . . . . . . . . . . . . . . . . . . . . . . . . . . . . . (24)Firm wholesale. . . . . . . . . . . . . . . . . . . . . . . . . . . . . . . . . . . . . . . . . . . . . . . . . . . . . . . . . . . . . . . . . . . . . . . . . . . . . . . . (24)Trading margin. . . . . . . . . . . . . . . . . . . . . . . . . . . . . . . . . . . . . . . . . . . . . . . . . . . . . . . . . . . . . . . . . . . . . . . . . . . . . . . . (12)SPS FERC complaint case orders (b) . . . . . . . . . . . . . . . . . . . . . . . . . . . . . . . . . . . . . . . . . . . . . . . . . . . . . . . . . . . . . . . (6)Other, net . . . . . . . . . . . . . . . . . . . . . . . . . . . . . . . . . . . . . . . . . . . . . . . . . . . . . . . . . . . . . . . . . . . . . . . . . . . . . . . . . . . . (33)
Total increase in ongoing electric margin . . . . . . . . . . . . . . . . . . . . . . . . . . . . . . . . . . . . . . . . . . . . . . . . . . . . . . . . . . 148SPS FERC complaint case orders (b) . . . . . . . . . . . . . . . . . . . . . . . . . . . . . . . . . . . . . . . . . . . . . . . . . . . . . . . . . . . . . . . (26)
Total increase in GAAP electric margin . . . . . . . . . . . . . . . . . . . . . . . . . . . . . . . . . . . . . . . . . . . . . . . . . . . . . . . . . . . $ 122
(a) The retail rate increases include final rates in Minnesota, Colorado, Wisconsin, South Dakota and Texas and interim rates, subject to refund, in North Dakota. The Minnesota rate increase is net of a provision for customer refunds of $131 million for the twelve months ended Dec. 31, 2013 based on the final rate order received for the 2013 electric rate case. Due to the order, there was a reduction in revenues and expenses of approximately $40 million, primarily related to depreciation of $32 million and O&M expense of $8 million in 2013.
(b) As a result of two orders issued by the FERC in August 2013, a pretax charge of approximately $36 million ($32 million in electric revenues, of which $6 million relates to 2013 and $26 million relates to periods prior to 2013, and $4 million in interest charges) was recorded in 2013. See Note 12 to the consolidated financial statements.
2013 Comparison to 2012 — The increase in electric margin was primarily due to the various rate increases across all of the utility subsidiaries.
Natural Gas Revenues and Margin
Total natural gas expense tends to vary with changing sales requirements and the cost of natural gas purchases. However, due to the design of purchased natural gas cost recovery mechanisms to recover current expenses for sales to retail customers, fluctuations in the cost of natural gas have little effect on natural gas margin. The following table details natural gas revenues and margin:
(Millions of Dollars) 2014 2013 2012
Natural gas revenues . . . . . . . . . . . . . . . . . . . . . . . . . . . . . . . . . . . . . . . . . . . . . . . . . . . . . . $ 2,143 $ 1,805 $ 1,537Cost of natural gas sold and transported . . . . . . . . . . . . . . . . . . . . . . . . . . . . . . . . . . . . . . . (1,372) (1,083) (881)
Natural gas margin . . . . . . . . . . . . . . . . . . . . . . . . . . . . . . . . . . . . . . . . . . . . . . . . . . . . . . $ 771 $ 722 $ 656
The following tables summarize the components of the changes in natural gas revenues and natural gas margin for the years ended Dec. 31:
Natural Gas Revenues
(Millions of Dollars) 2014 vs. 2013
Purchased natural gas adjustment clause recovery . . . . . . . . . . . . . . . . . . . . . . . . . . . . . . . . . . . . . . . . . . . . . . . . . . . . $ 293Retail rate increases (Colorado). . . . . . . . . . . . . . . . . . . . . . . . . . . . . . . . . . . . . . . . . . . . . . . . . . . . . . . . . . . . . . . . . . . 19PSIA rider (Colorado) . . . . . . . . . . . . . . . . . . . . . . . . . . . . . . . . . . . . . . . . . . . . . . . . . . . . . . . . . . . . . . . . . . . . . . . . . . 14Retail sales growth, excluding weather impact . . . . . . . . . . . . . . . . . . . . . . . . . . . . . . . . . . . . . . . . . . . . . . . . . . . . . . . 10Estimated impact of weather . . . . . . . . . . . . . . . . . . . . . . . . . . . . . . . . . . . . . . . . . . . . . . . . . . . . . . . . . . . . . . . . . . . . . (1)Other, net . . . . . . . . . . . . . . . . . . . . . . . . . . . . . . . . . . . . . . . . . . . . . . . . . . . . . . . . . . . . . . . . . . . . . . . . . . . . . . . . . . . . 3
Total increase in natural gas revenues. . . . . . . . . . . . . . . . . . . . . . . . . . . . . . . . . . . . . . . . . . . . . . . . . . . . . . . . . . . . . $ 338
2014 Comparison to 2013 — Natural gas revenues increased primarily due to the purchased natural gas adjustment clause recovery, which is offset in operating expense.
Schedule Q-3 Page 72 of 182
Sponsor: Robinson Case No. 15-00139-UT

57
Natural Gas Margin
(Millions of Dollars) 2014 vs. 2013
Retail rate increases (Colorado). . . . . . . . . . . . . . . . . . . . . . . . . . . . . . . . . . . . . . . . . . . . . . . . . . . . . . . . . . . . . . . . . . . $ 19PSIA rider (Colorado), partially offset in O&M expenses . . . . . . . . . . . . . . . . . . . . . . . . . . . . . . . . . . . . . . . . . . . . . . 14Retail sales growth, excluding weather impact . . . . . . . . . . . . . . . . . . . . . . . . . . . . . . . . . . . . . . . . . . . . . . . . . . . . . . . 10Estimated impact of weather . . . . . . . . . . . . . . . . . . . . . . . . . . . . . . . . . . . . . . . . . . . . . . . . . . . . . . . . . . . . . . . . . . . . . (1)Other, net . . . . . . . . . . . . . . . . . . . . . . . . . . . . . . . . . . . . . . . . . . . . . . . . . . . . . . . . . . . . . . . . . . . . . . . . . . . . . . . . . . . . 7
Total increase in natural gas margin . . . . . . . . . . . . . . . . . . . . . . . . . . . . . . . . . . . . . . . . . . . . . . . . . . . . . . . . . . . . . . $ 49
2014 Comparison to 2013 — Natural gas margins increased primarily due to rate increases and the PSIA in Colorado.
Natural Gas Revenues
(Millions of Dollars) 2013 vs. 2012
Purchased natural gas adjustment clause recovery . . . . . . . . . . . . . . . . . . . . . . . . . . . . . . . . . . . . . . . . . . . . . . . . . . . . $ 198Estimated impact of weather . . . . . . . . . . . . . . . . . . . . . . . . . . . . . . . . . . . . . . . . . . . . . . . . . . . . . . . . . . . . . . . . . . . . . 42Retail rate increases (Colorado and Wisconsin) . . . . . . . . . . . . . . . . . . . . . . . . . . . . . . . . . . . . . . . . . . . . . . . . . . . . . . 15Retail sales growth. . . . . . . . . . . . . . . . . . . . . . . . . . . . . . . . . . . . . . . . . . . . . . . . . . . . . . . . . . . . . . . . . . . . . . . . . . . . . 9Conservation and DSM program incentives . . . . . . . . . . . . . . . . . . . . . . . . . . . . . . . . . . . . . . . . . . . . . . . . . . . . . . . . . 5Conservation and DSM program revenues (offset by expenses). . . . . . . . . . . . . . . . . . . . . . . . . . . . . . . . . . . . . . . . . . 4Other, net . . . . . . . . . . . . . . . . . . . . . . . . . . . . . . . . . . . . . . . . . . . . . . . . . . . . . . . . . . . . . . . . . . . . . . . . . . . . . . . . . . . . (5)
Total increase in natural gas revenues. . . . . . . . . . . . . . . . . . . . . . . . . . . . . . . . . . . . . . . . . . . . . . . . . . . . . . . . . . . . . $ 268
2013 Comparison to 2012 — Natural gas revenues increased primarily due to the purchased natural gas adjustment clause recovery, which is offset in operating expense.
Natural Gas Margin
(Millions of Dollars) 2013 vs. 2012
Estimated impact of weather . . . . . . . . . . . . . . . . . . . . . . . . . . . . . . . . . . . . . . . . . . . . . . . . . . . . . . . . . . . . . . . . . . . . . $ 42Retail rate increases (Colorado and Wisconsin) . . . . . . . . . . . . . . . . . . . . . . . . . . . . . . . . . . . . . . . . . . . . . . . . . . . . . . 15Retail sales growth. . . . . . . . . . . . . . . . . . . . . . . . . . . . . . . . . . . . . . . . . . . . . . . . . . . . . . . . . . . . . . . . . . . . . . . . . . . . . 9Conservation and DSM program incentive . . . . . . . . . . . . . . . . . . . . . . . . . . . . . . . . . . . . . . . . . . . . . . . . . . . . . . . . . . 5Conservation and DSM program revenues (offset by expenses). . . . . . . . . . . . . . . . . . . . . . . . . . . . . . . . . . . . . . . . . . 4Other, net . . . . . . . . . . . . . . . . . . . . . . . . . . . . . . . . . . . . . . . . . . . . . . . . . . . . . . . . . . . . . . . . . . . . . . . . . . . . . . . . . . . . (9)
Total increase in natural gas margin . . . . . . . . . . . . . . . . . . . . . . . . . . . . . . . . . . . . . . . . . . . . . . . . . . . . . . . . . . . . . . $ 66
2013 Comparison to 2012 — Natural gas margins increased primarily due to cooler winter weather and rate increases in Colorado and Wisconsin.
Non-Fuel Operating Expenses and Other Items
O&M Expenses — O&M expenses increased $60.8 million, or 2.7 percent, for 2014 compared with 2013, and $97.4 million, or 4.5 percent, for 2013 compared with 2012. The following tables summarize the changes in O&M expenses:
(Millions of Dollars) 2014 vs. 2013
Nuclear plant operations and amortization . . . . . . . . . . . . . . . . . . . . . . . . . . . . . . . . . . . . . . . . . . . . . . . . . . . . . . . . . . $ 362013 gain on sale of transmission assets . . . . . . . . . . . . . . . . . . . . . . . . . . . . . . . . . . . . . . . . . . . . . . . . . . . . . . . . . . . . 14Transmission costs . . . . . . . . . . . . . . . . . . . . . . . . . . . . . . . . . . . . . . . . . . . . . . . . . . . . . . . . . . . . . . . . . . . . . . . . . . . . . 4Electric and natural gas distribution expenses . . . . . . . . . . . . . . . . . . . . . . . . . . . . . . . . . . . . . . . . . . . . . . . . . . . . . . . . 1Employee benefits . . . . . . . . . . . . . . . . . . . . . . . . . . . . . . . . . . . . . . . . . . . . . . . . . . . . . . . . . . . . . . . . . . . . . . . . . . . . . (6)Plant generation costs . . . . . . . . . . . . . . . . . . . . . . . . . . . . . . . . . . . . . . . . . . . . . . . . . . . . . . . . . . . . . . . . . . . . . . . . . . (3)Other, net . . . . . . . . . . . . . . . . . . . . . . . . . . . . . . . . . . . . . . . . . . . . . . . . . . . . . . . . . . . . . . . . . . . . . . . . . . . . . . . . . . . . 15
Total increase in O&M expenses. . . . . . . . . . . . . . . . . . . . . . . . . . . . . . . . . . . . . . . . . . . . . . . . . . . . . . . . . . . . . . . . . $ 61
Schedule Q-3 Page 73 of 182
Sponsor: Robinson Case No. 15-00139-UT

58
2014 Comparison to 2013 — The increase in O&M expenses for 2014 was largely driven by the following:
• Nuclear cost increases are related to the amortization of prior outages and initiatives designed to improve the operational efficiencies of the plants; and
• Gain on sale of transmission assets relates to the 2013 gain associated with the sale of certain SPS’ transmission assets to Sharyland.
(Millions of Dollars) 2013 vs. 2012
Electric and gas distribution expenses . . . . . . . . . . . . . . . . . . . . . . . . . . . . . . . . . . . . . . . . . . . . . . . . . . . . . . . . . . . . . . $ 44Nuclear plant operations and amortization . . . . . . . . . . . . . . . . . . . . . . . . . . . . . . . . . . . . . . . . . . . . . . . . . . . . . . . . . . 33Transmission costs . . . . . . . . . . . . . . . . . . . . . . . . . . . . . . . . . . . . . . . . . . . . . . . . . . . . . . . . . . . . . . . . . . . . . . . . . . . . . 13Employee benefits . . . . . . . . . . . . . . . . . . . . . . . . . . . . . . . . . . . . . . . . . . . . . . . . . . . . . . . . . . . . . . . . . . . . . . . . . . . . . 7Gain on sale of transmission assets . . . . . . . . . . . . . . . . . . . . . . . . . . . . . . . . . . . . . . . . . . . . . . . . . . . . . . . . . . . . . . . . (14)Other, net . . . . . . . . . . . . . . . . . . . . . . . . . . . . . . . . . . . . . . . . . . . . . . . . . . . . . . . . . . . . . . . . . . . . . . . . . . . . . . . . . . . . 14
Total increase in O&M expenses. . . . . . . . . . . . . . . . . . . . . . . . . . . . . . . . . . . . . . . . . . . . . . . . . . . . . . . . . . . . . . . . . $ 97
2013 Comparison to 2012 — The increase in O&M expenses for 2013 was largely driven by the following:
• Electric and gas distribution expenses were primarily driven by increased maintenance activities due to vegetation management, storms and outages;
• Nuclear cost increases are related to the amortization of prior outages and initiatives designed to improve the operational efficiencies of the plants;
• Increased transmission costs were related to higher substation maintenance expenditures and reliability costs;• Higher employee benefits related primarily to increased pension expense; and• See Note 12 to the consolidated financial statements for further discussion of the gain on sale of transmission assets.
Conservation and DSM Program Expenses — Conservation and DSM program expenses increased $41.0 million, or 15.7 percent, for 2014 compared with 2013. The increase was primarily attributable to higher electric recovery rates at NSP-Minnesota. Conservation and DSM program expenses are generally recovered in our major jurisdictions concurrently through riders and base rates.
Depreciation and Amortization — Depreciation and amortization increased $41.2 million, or 4.2 percent, for 2014 compared with 2013. The increase was primarily attributable to the PI steam generator replacement placed in service in December 2013 and normal system expansion, partially offset by additional accelerated amortization of the excess depreciation reserve associated with certain Minnesota assets. See further discussion within Note 12 to the consolidated financial statements.
Depreciation and amortization increased $51.8 million, or 5.6 percent, for 2013 compared with 2012. The increase is primarily attributable to normal system expansion, which was partially offset by reductions related to the final rate order received for the 2013 Minnesota electric rate case that reduced depreciation expense by approximately $32 million for 2013.
Taxes (Other Than Income Taxes) — Taxes (other than income taxes) increased $45.3 million, or 10.8 percent, for 2014 compared with 2013. The increase was primarily due to higher property taxes in Colorado, Minnesota and Texas.
Taxes (other than income taxes) increased $11.6 million, or 2.8 percent, for 2013 compared with 2012. The annual increase is due to higher property taxes primarily in Colorado and Texas.
AFUDC, Equity and Debt — AFUDC increased $1.3 million for 2014 compared with 2013. The increase was primarily due to construction related to the CACJA and the expansion of transmission facilities, partially offset by the portion of the Monticello LCM/EPU placed in service in July 2013 and the PI steam generator replacement placed in service in December 2013.
AFUDC increased $28.7 million for 2013 compared with 2012. The increase is primarily due to construction related to the CACJA and the expansion of transmission facilities.
Interest Charges — Interest charges decreased $8.6 million, or 1.5 percent, for 2014 compared with 2013. The decrease was primarily due to refinancings at lower interest rates, partially offset by higher long-term debt levels. In addition, interest charges in 2013 reflected $4 million of interest associated with the customer refund at SPS based on a FERC order, interest on customer refunds in Minnesota and the write off of $6.3 million of unamortized debt expense related to the junior subordinated notes called in May 2013.
Schedule Q-3 Page 74 of 182
Sponsor: Robinson Case No. 15-00139-UT

59
Interest charges decreased $26.4 million, or 4.4 percent, for 2013 compared with 2012. The decrease is primarily due to refinancings at lower interest rates. This was partially offset by higher long-term debt levels, $4 million of interest associated with the customer refund at SPS based on the August 2013 FERC orders, $5 million of interest associated with customer refunds in Minnesota for the 2013 electric rate case and the write off of $6.3 million of unamortized debt expense related to the junior subordinated notes called in May 2013.
Income Taxes — Income tax expense increased $39.8 million for 2014 compared with 2013. The increase was primarily due to higher 2014 pretax earnings and recognition of additional R&E credits in 2013. These were partially offset by a 2014 tax benefit for prior year adjustments. The ETR was 33.9 percent for 2014 compared with 33.8 percent for 2013. See Note 6 to the consolidated financial statements for further discussion.
Income tax expense increased $33.8 million for 2013 compared with 2012. The increase in income tax expense was primarily due to higher pretax earnings in 2013, a tax benefit for a carryback in 2012 and for the restoration in 2012 of a portion of the tax benefit associated with federal subsidies for prescription drug plans that was previously written off in 2010. These were partially offset in 2013 by a tax benefit for a carryback claim related to 2013, R&E credits and increased permanent plant-related reductions. The ETR was 33.8 percent for 2013 compared with 33.2 percent for 2012. The higher ETR for 2013 was primarily due to the adjustments referenced above. See Note 6 to the consolidated financial statements for further discussion.
Xcel Energy Inc. and Other Results
The following tables summarize the net income and EPS contributions of Xcel Energy Inc. and its nonregulated businesses:
Contribution to Xcel Energy’s Earnings(Millions of Dollars) 2014 2013 2012
Xcel Energy Inc. financing costs . . . . . . . . . . . . . . . . . . . . . . . . . . . . . . . . . . . . . . . . . . . $ (51.8) $ (62.9) $ (71.5)Eloigne (a) . . . . . . . . . . . . . . . . . . . . . . . . . . . . . . . . . . . . . . . . . . . . . . . . . . . . . . . . . . . . . (0.5) (0.8) 3.8Xcel Energy Inc. taxes and other results . . . . . . . . . . . . . . . . . . . . . . . . . . . . . . . . . . . . . (5.0) (7.1) 0.8
Total Xcel Energy Inc. and other costs . . . . . . . . . . . . . . . . . . . . . . . . . . . . . . . . . . . . . $ (57.3) $ (70.8) $ (66.9)
Contribution to Xcel Energy’s EPS(Earnings per Share) 2014 2013 2012
Xcel Energy Inc. financing costs . . . . . . . . . . . . . . . . . . . . . . . . . . . . . . . . . . . . . . . . . . . $ (0.10) $ (0.13) $ (0.15)Eloigne (a) . . . . . . . . . . . . . . . . . . . . . . . . . . . . . . . . . . . . . . . . . . . . . . . . . . . . . . . . . . . . . — — 0.01Xcel Energy Inc. taxes and other results . . . . . . . . . . . . . . . . . . . . . . . . . . . . . . . . . . . . . (0.01) (0.01) —
Total Xcel Energy Inc. and other costs . . . . . . . . . . . . . . . . . . . . . . . . . . . . . . . . . . . . . $ (0.11) $ (0.14) $ (0.14)
(a) Amounts include gains or losses associated with sales of properties held by Eloigne.
Xcel Energy Inc.’s results include interest charges, which are incurred at Xcel Energy Inc. and are not directly assigned to individual subsidiaries.
Factors Affecting Results of Operations
Xcel Energy’s utility revenues depend on customer usage, which varies with weather conditions, general business conditions and the cost of energy services. Various regulatory agencies approve the prices for electric and natural gas service within their respective jurisdictions and affect Xcel Energy’s ability to recover its costs from customers. The historical and future trends of Xcel Energy’s operating results have been, and are expected to be, affected by a number of factors, including those listed below.
General Economic Conditions
Economic conditions may have a material impact on Xcel Energy’s operating results. While economic growth has been improving over the past year, management cannot predict whether this trend will be sustained going forward. Other events impact overall economic conditions and management cannot predict the impact of fluctuating energy prices, terrorist activity, war or the threat of war. However, Xcel Energy could experience a material impact to its results of operations, future growth or ability to raise capital resulting from a sustained general slowdown in economic growth or a significant increase in interest rates.
Schedule Q-3 Page 75 of 182
Sponsor: Robinson Case No. 15-00139-UT

60
Fuel Supply and Costs
Xcel Energy Inc.’s operating utilities have varying dependence on coal, natural gas and uranium. Changes in commodity prices are generally recovered through fuel recovery mechanisms and have very little impact on earnings. However, availability of supply, the potential implementation of a carbon tax or emissions-related generation restrictions and unanticipated changes in regulatory recovery mechanisms could impact our operations. See Item 1 for further discussion of fuel supply and costs.
Pension Plan Costs and Assumptions
Xcel Energy has significant net pension and postretirement benefit costs that are measured using actuarial valuations. Inherent in these valuations are key assumptions including discount rates and expected return on plan assets. Xcel Energy evaluates these key assumptions at least annually by analyzing current market conditions, which include changes in interest rates and market returns. Changes in the related net pension and postretirement benefits costs and funding requirements may occur in the future due to changes in assumptions. The payout of a significant percentage of pension plan liabilities in a single year due to high retirements or employees leaving the company would trigger settlement accounting and could require the company to recognize material incremental pension expense related to unrecognized plan losses in the year these liabilities are paid. For further discussion and a sensitivity analysis on these assumptions, see “Employee Benefits” under Critical Accounting Policies and Estimates.
Regulation
FERC and State Regulation — The FERC and various state and local regulatory commissions regulate Xcel Energy Inc.’s utility subsidiaries and TransCo subsidiaries. Decisions by these regulators can significantly impact Xcel Energy’s results of operations. Xcel Energy expects to periodically file for rate changes based on changing energy market and general economic conditions.
The electric and natural gas rates charged to customers of Xcel Energy Inc.’s utility subsidiaries are approved by the FERC or the regulatory commissions in the states in which they operate. The rates are designed to recover plant investment, operating costs and an allowed return on investment. Xcel Energy requests changes in rates for utility services through filings with the governing commissions. Changes in operating costs can affect Xcel Energy’s financial results, depending on the timing of filing general rate cases and the implementation of final rates. In addition to changes in operating costs, other factors affecting rate filings are new investments, sales, conservation and DSM efforts, and the cost of capital. In addition, the regulatory commissions authorize the ROE, capital structure and depreciation rates in rate proceedings.
Wholesale Energy Market Regulation — Wholesale energy markets in the Midwest and South Central U.S. are operated by MISO and SPP, respectively, to centrally dispatch all regional electric generation and apply a regional transmission congestion management system. NSP-Minnesota and NSP-Wisconsin are members of MISO and SPS is a member of SPP. NSP-Minnesota, NSP-Wisconsin and SPS expect to recover energy charges through either base rates or various recovery mechanisms. See Note 12 to the consolidated financial statements for further discussion.
Capital Expenditure Regulation — Xcel Energy Inc.’s utility subsidiaries make substantial investments in plant additions to build and upgrade power plants, and expand and maintain the reliability of the energy transmission and distribution systems. In addition to filings for increases in base rates charged to customers to recover the costs associated with such investments, the CPUC, MPUC, SDPUC, NDPSC and PUCT in certain instances have approved proposals to recover, through a rate rider, costs to upgrade generation plants and lower emissions, increase transmission investment cost, and/or increase distribution investment cost, and increase purchased power capacity cost. These non-fuel rate riders are expected to provide cash flows to enable recovery of costs incurred on a more timely basis. For wholesale electric transmission and production services, Xcel Energy has, consistent with FERC policy, implemented formula rates for each of the utility subsidiaries that will provide annual rate changes as transmission or production investments increase in a manner similar to the retail rate riders. In November 2014, the FERC approved transmission formula rates for XETD and XEST, which would apply to electric transmission assets the TransCos may own. NSP-Minnesota and NSP-Wisconsin have no cost-based wholesale production customers and therefore have not implemented a production formula rate.
Environmental Matters
Environmental costs include accruals for nuclear plant decommissioning and payments for storage of spent nuclear fuel, disposal of hazardous materials and waste, remediation of contaminated sites, monitoring of discharges to the environment and compliance with laws and permits with respect to emissions. A trend of greater environmental awareness and increasingly stringent regulation may continue to cause higher operating expenses and capital expenditures for environmental compliance.
Schedule Q-3 Page 76 of 182
Sponsor: Robinson Case No. 15-00139-UT

61
Costs charged to operating expenses for nuclear decommissioning and spent nuclear fuel disposal expenses, environmental monitoring and disposal of hazardous materials and waste were approximately:
• $292 million in 2014;• $275 million in 2013; and• $263 million in 2012.
Xcel Energy estimates an average annual expense of approximately $339 million from 2015 through 2019 for similar costs. The precise timing and amount of environmental costs, including those for site remediation and disposal of hazardous materials, are unknown. Additionally, the extent to which environmental costs will be included in and recovered through rates may fluctuate.
Capital expenditures for environmental improvements at regulated facilities were approximately:
• $373 million in 2014;• $517 million in 2013; and• $255 million in 2012.
See Item 7 — Capital Requirements for further discussion.
Xcel Energy’s operations are subject to federal and state laws and regulations related to air emissions, water discharges and waste management from various sources. Such laws and regulations impose monitoring and reporting requirements and may require Xcel Energy to obtain pre-approval for the construction or modification of projects that increase air emissions, water discharges or land disposal of wastes, obtain and comply with permits that contain emission, discharge and operational limitations, or install or operate pollution control equipment at facilities. Xcel Energy will likely be required to incur capital expenditures in the future to comply with these requirements for remediation plans of MGP sites and various regulations for air emissions, water intake and discharge and waste disposal. Actual expenditures could vary from the estimates presented. The scope and timing of these expenditures cannot be determined until any new or revised regulations become final.
There are emission controls, known as BART, for industrial facilities releasing emissions that reduce visibility in certain national parks and wilderness areas. Xcel Energy generating facilities in Minnesota and Colorado are subject to BART requirements. Further, generating facilities throughout the Xcel Energy territory are subject to state and federal mercury reduction requirements. In addition, the EPA has proposed to require installation of dry scrubbers on Tolk Units 1 and 2 under a federal visibility plan for Texas.
See Note 13 to the consolidated financial statements for further discussion of Xcel Energy’s environmental contingencies.
Inflation
Inflation at its current level is not expected to materially affect Xcel Energy’s prices or returns to shareholders. However, potential future inflation could result from economic conditions or the economic and monetary policies of the U.S. Government and the Federal Reserve. This could lead to future price increases for materials and services required to deliver electric and natural gas services to customers. These potential cost increases could in turn lead to increased prices to customers. If current low oil prices lead to sustained deflation, that could also reduce general economic activity although it may lead to lower electric and natural gas prices to customers.
CRITICAL ACCOUNTING POLICIES AND ESTIMATES
Preparation of the consolidated financial statements and related disclosures in compliance with GAAP requires the application of accounting rules and guidance, as well as the use of estimates. The application of these policies involves judgments regarding future events, including the likelihood of success of particular projects, legal and regulatory challenges and anticipated recovery of costs. These judgments could materially impact the consolidated financial statements and disclosures, based on varying assumptions. In addition, the financial and operating environment also may have a significant effect on the operation of the business and on the results reported. The following is a list of accounting policies and estimates that are most significant to the portrayal of Xcel Energy’s financial condition and results, and require management’s most difficult, subjective or complex judgments. Each of these has a higher likelihood of resulting in materially different reported amounts under different conditions or using different assumptions. Each critical accounting policy has been reviewed and discussed with the Audit Committee of Xcel Energy Inc.’s Board of Directors on a quarterly basis.
Schedule Q-3 Page 77 of 182
Sponsor: Robinson Case No. 15-00139-UT

62
Regulatory Accounting
Xcel Energy Inc. is a holding company with rate-regulated subsidiaries that are subject to the accounting for Regulated Operations, which provides that rate-regulated entities account and report assets and liabilities consistent with the recovery of those incurred costs in rates and if the competitive environment makes it probable that such rates will be charged and collected. Xcel Energy’s rates are derived through the ratemaking process, which results in the recording of regulatory assets and liabilities based on the probability of future cash flows. Regulatory assets generally represent incurred or accrued costs that have been deferred because they are probable of future recovery from customers. Regulatory liabilities generally represent amounts that are expected to be refunded to customers in future rates or amounts collected in current rates for future costs. In other businesses or industries, regulatory assets and regulatory liabilities would generally be charged to net income or OCI.
Each reporting period Xcel Energy assesses the probability of future recoveries and obligations associated with regulatory assets and liabilities. Factors such as the current regulatory environment, recently issued rate orders and historical precedents are considered. Decisions made by regulatory agencies can directly impact the amount and timing of cost recovery as well as the rate of return on invested capital and may materially impact Xcel Energy’s results of operations, financial condition, or cash flows.
As of Dec. 31, 2014 and 2013, Xcel Energy has recorded regulatory assets of $3.2 billion and $2.9 billion and regulatory liabilities of $1.6 billion and $1.3 billion, respectively. Each subsidiary is subject to regulation that varies from jurisdiction to jurisdiction. If future recovery of costs, in any such jurisdiction, ceases to be probable, Xcel Energy would be required to charge these assets to current net income or OCI. There are no current or expected proposals or changes in the regulatory environment that impact the probability of future recovery of these assets. See Note 15 to the consolidated financial statements for further discussion of regulatory assets and liabilities and Note 12 to the consolidated financial statements for further discussion of rate matters.
Income Tax Accruals
Judgment, uncertainty, and estimates are a significant aspect of the income tax accrual process that accounts for the effects of current and deferred income taxes. Uncertainty associated with the application of tax statutes and regulations and the outcomes of tax audits and appeals require that judgment and estimates be made in the accrual process and in the calculation of the ETR. Changes in tax laws and rates may affect recorded deferred tax assets and liabilities and our ETR in the future. There exists the potential for federal tax reform that may significantly change the tax rules applicable to Xcel Energy. At this time, due to the inherent uncertainty of future legislation, any potential resulting impact cannot be reasonably estimated.
ETRs are also highly impacted by assumptions. ETR calculations are revised every quarter based on best available year-end tax assumptions (income levels, deductions, credits, etc.); adjusted in the following year after returns are filed, with the tax accrual estimates being trued-up to the actual amounts claimed on the tax returns; and further adjusted after examinations by taxing authorities have been completed.
In accordance with the interim period reporting guidance, income tax expense for the first three quarters in a year is based on the forecasted ETR. The forecasted ETR reflects a number of estimates including forecasted annual income, permanent tax adjustments and tax credits.
Accounting for income taxes also requires that only tax benefits that meet the more likely than not recognition threshold can be recognized or continue to be recognized. The change in the unrecognized tax benefits needs to be reasonably estimated based on evaluation of the nature of uncertainty, the nature of event that could cause the change and an estimated range of reasonably possible changes. Management will use prudent business judgment to derecognize appropriate amounts of tax benefits at any period end, and as new developments occur. Unrecognized tax benefits can be recognized as issues are favorably resolved and loss exposures decline.
We may adjust our unrecognized tax benefits and interest accruals to the updated estimates as disputes with the IRS and state tax authorities are resolved. These adjustments may increase or decrease earnings. See Note 6 to the consolidated financial statements for further discussion.
Employee Benefits
Xcel Energy’s pension costs are based on an actuarial calculation that includes a number of key assumptions, most notably the annual return level that pension and postretirement health care investment assets are expected to earn in the future and the interest rate used to discount future pension benefit payments to a present value obligation. In addition, the pension cost calculation uses an asset-smoothing methodology to reduce the volatility of varying investment performance over time. See Note 9 to the consolidated financial statements for further discussion on the rate of return and discount rate used in the calculation of pension costs and obligations.
Schedule Q-3 Page 78 of 182
Sponsor: Robinson Case No. 15-00139-UT

63
Pension costs are expected to increase in 2015 and decline in the following few years. Funding requirements are expected to decrease in 2015 and then be flat in the following years. While investment returns exceeded the assumed levels in 2012 and again in 2014, investment returns were slightly below the assumed levels in 2013. The pension cost calculation uses a market-related valuation of pension assets. Xcel Energy uses a calculated value method to determine the market-related value of the plan assets. The market-related value is determined by adjusting the fair market value of assets at the beginning of the year to reflect the investment gains and losses (the difference between the actual investment return and the expected investment return on the market-related value) during each of the previous five years at the rate of 20 percent per year. As these differences between the actual investment returns and the expected investment returns are incorporated into the market-related value, the differences are recognized in pension cost over the expected average remaining years of service for active employees which was approximately 11 years in 2014.
Based on current assumptions and the recognition of past investment gains and losses, Xcel Energy currently projects the pension costs recognized for financial reporting purposes will be $140.4 million in 2015 and $129.6 million in 2016, while the actual pension costs were $126.5 million in 2014 and $151.8 million in 2013. The expected increase in the 2015 cost is due primarily to the impact of a potential settlement in the most recent Colorado electric rate case, updating the mortality tables and a decrease in the discount rate which were offset by the reduced amortization of prior service costs and other historic loss amounts, including the 2008 market loss. Further, future year costs are expected to decrease primarily as a result of reductions in loss amortizations and an increase in expected return on assets as a result of increases in assets via planned contributions and the subsequent expected return of current assets.
In 2014, the Society of Actuaries published a new mortality table and projection scale that increased the overall life expectancy of males and females. Xcel Energy has reviewed its own population through a credibility analysis and adopted the RP 2014 table with modifications based on our population and specific experience.
At Dec. 31, 2014, Xcel Energy set the rate of return on assets used to measure pension costs at 7.09 percent, which is a four basis point increase from Dec. 31, 2013. The rate of return used to measure postretirement health care costs is 5.80 percent at Dec. 31, 2014 and is a 137 basis point decrease from Dec. 31, 2013. Xcel Energy’s ongoing investment strategy is based on plan-specific investment recommendations that seek to minimize potential investment and interest rate risk as a plan’s funded status increases over time. The investment recommendations result in a greater percentage of long-duration fixed income securities being allocated to specific plans having relatively higher funded status ratios and a greater percentage of growth assets being allocated to plans having relatively lower funded status ratios.
Xcel Energy set the discount rates used to value the Dec. 31, 2014 pension and postretirement health care obligations at 4.11 percent and 4.08 percent, which represent a 64 basis point and 74 basis point decrease from Dec. 31, 2013, respectively. Xcel Energy uses a bond matching study as its primary basis for determining the discount rate used to value pension and postretirement health care obligations. The bond matching study utilizes a portfolio of high grade (Aa or higher) bonds that matches the expected cash flows of Xcel Energy’s benefit plans in amount and duration. The effective yield on this cash flow matched bond portfolio determines the discount rate for the individual plans. The bond matching study is validated for reasonableness against the Citigroup Pension Liability Discount Curve and the Citigroup Above Median Curve. At Dec. 31, 2014, these reference points supported the selected rate. In addition to these reference points, Xcel Energy also reviews general actuarial survey data to assess the reasonableness of the discount rate selected.
The following are the pension funding contributions across all four of Xcel Energy’s pension plans, both voluntary and required, for 2012 through 2015:
• $90.0 million in January 2015;• $130.6 million in 2014;• $192.4 million in 2013; and• $198.1 million in 2012.
For future years, we anticipate contributions will be made as necessary. These contributions are summarized in Note 9 to the consolidated financial statements. Future year amounts are estimates and may change based on actual market performance, changes in interest rates and any changes in governmental regulations. Therefore, additional contributions could be required in the future.
Schedule Q-3 Page 79 of 182
Sponsor: Robinson Case No. 15-00139-UT

64
If Xcel Energy were to use alternative assumptions at Dec. 31, 2014, a one-percent change would result in the following impact on 2015 pension costs:
Pension Costs(Millions of Dollars) +1% -1%
Rate of return. . . . . . . . . . . . . . . . . . . . . . . . . . . . . . . . . . . . . . . . . . . . . . . . . . . . . . . . . . . . . . . . . . . . . . . . $ (20.6) $ 20.6Discount rate (a) . . . . . . . . . . . . . . . . . . . . . . . . . . . . . . . . . . . . . . . . . . . . . . . . . . . . . . . . . . . . . . . . . . . . . . (10.6) 13.4
(a) These costs include the effects of regulation.
Effective Jan. 1, 2015, the initial medical trend assumption was decreased from 7.00 percent to 6.50 percent. The ultimate trend assumption remained at 4.5 percent. The period until the ultimate rate is reached is four years. Xcel Energy bases its medical trend assumption on the long-term cost inflation expected in the health care market, considering the levels projected and recommended by industry experts, as well as recent actual medical cost experienced by Xcel Energy’s retiree medical plan.
• Xcel Energy contributed $17.1 million, $17.6 million and $47.1 million during 2014, 2013 and 2012, respectively, to the postretirement health care plans.
• Xcel Energy expects to contribute approximately $12.8 million during 2015.
Xcel Energy recovers employee benefits costs in its regulated utility operations consistent with accounting guidance with the exception of the areas noted below.
• NSP-Minnesota recognizes pension expense in all regulatory jurisdictions based on expense as calculated using the aggregate normal cost actuarial method. Differences between aggregate normal cost and expense as calculated by pension accounting standards are deferred as a regulatory liability.
• Colorado, Texas, New Mexico and FERC jurisdictions allow the recovery of other postretirement benefit costs only to the extent that recognized expense is matched by cash contributions to an irrevocable trust. Xcel Energy has consistently funded at a level to allow full recovery of costs in these jurisdictions.
• PSCo and SPS recognize pension expense in all regulatory jurisdictions based on expense consistent with accounting guidance. The Colorado electric retail and Texas jurisdictions record the difference between annual recognized pension expense and the annual amount of pension expense approved in their last respective general rate case as a deferral to a regulatory asset.
• Beginning in 2015, the Colorado electric retail jurisdiction expects to recognize additional expense associated with a pending order to accelerate amortization of the qualified prepaid pension asset. A regulatory liability would be recorded to account for any resulting regulatory obligation.
See Note 9 to the consolidated financial statements for further discussion.
Nuclear Decommissioning
Xcel Energy recognizes liabilities for the expected cost of retiring tangible long-lived assets for which a legal obligation exists. These AROs are recognized at fair value as incurred and are capitalized as part of the cost of the related long-lived assets. In the absence of quoted market prices, Xcel Energy estimates the fair value of its AROs using present value techniques, in which it makes various assumptions including estimates of the amounts and timing of future cash flows associated with retirement activities, credit-adjusted risk free rates and cost escalation rates. When Xcel Energy revises any assumptions used to estimate AROs, it adjusts the carrying amount of both the ARO liability and the related long-lived asset. Xcel Energy accretes ARO liabilities to reflect the passage of time using the interest method.
A significant portion of Xcel Energy’s AROs relates to the future decommissioning of NSP-Minnesota’s nuclear facilities. The total obligation for nuclear decommissioning is expected to be funded 100 percent by the external decommissioning trust fund. The difference between regulatory funding (including depreciation expense less returns from the external trust fund) and expense recognized under current accounting guidance is deferred as a regulatory asset. The amounts recorded for AROs related to future nuclear decommissioning were $2,038 million and $1,628 million as of Dec. 31, 2014 and 2013, respectively. Based on their significance, the following discussion relates specifically to the AROs associated with nuclear decommissioning.
Schedule Q-3 Page 80 of 182
Sponsor: Robinson Case No. 15-00139-UT

65
NSP-Minnesota obtains periodic cost studies in order to estimate the cost and timing of planned nuclear decommissioning activities. These independent cost studies are based on relevant information available at the time performed. Estimates of future cash flows for extended periods of time are by nature highly uncertain and may vary significantly from actual results. NSP-Minnesota is required to file a nuclear decommissioning study every three years. In December 2014, NSP-Minnesota submitted this filing to the MPUC, whichcovered all expenses over the decommissioning period of the nuclear plants, including decontamination and removal of radioactive material. A decision on the filing is expected in late 2015 or early 2016.
The following key assumptions have a significant effect on the estimated nuclear obligation:
• Timing — Decommissioning cost estimates are impacted by each facility’s retirement date and the expected timing of the actual decommissioning activities. Currently, the estimated retirement dates coincide with each unit’s operating license with the NRC (i.e., 2030 for Monticello and 2033 and 2034 for PI’s Unit 1 and 2, respectively). The estimated timing of the decommissioning activities is based upon the DECON method, which is required by the MPUC. By utilizing this method, which assumes prompt removal and dismantlement, these activities are expected to begin at the end of the license date and be completed for both facilities by 2091.
• Technology and Regulation — There is limited experience with actual decommissioning of large nuclear facilities. Changes in technology and experience as well as changes in regulations regarding nuclear decommissioning could cause cost estimates to change significantly. NSP-Minnesota’s 2014 nuclear decommissioning filing assumed current technology and regulations.
• Escalation Rates — Escalation rates represent projected cost increases over time due to both general inflation and increases in the cost of specific decommissioning activities. NSP-Minnesota used an escalation rate of 4.36 percent in calculating the AROs related to nuclear decommissioning for the remaining operational period through the radiological decommissioning period. An escalation rate of 3.36 percent was utilized for the period of operating costs related to interim dry cask storage of spent nuclear fuel and site restoration.
• Discount Rates — Changes in timing or estimated expected cash flows that result in upward revisions to the ARO are calculated using the then-current credit-adjusted risk-free interest rate. The credit-adjusted risk-free rate in effect when the change occurs is used to discount the revised estimate of the incremental expected cash flows of the retirement activity. If the change in timing or estimated expected cash flows results in a downward revision of the ARO, the undiscounted revised estimate of expected cash flows is discounted using the credit-adjusted risk-free rate in effect at the date of initial measurement and recognition of the original ARO. Discount rates ranging from approximately four and seven percent have been used to calculate the net present value of the expected future cash flows over time.
Significant uncertainties exist in estimating the future cost of nuclear decommissioning including the method to be utilized, the ultimate costs to decommission, and the planned method of disposing spent fuel. If different cost estimates, life assumptions or cost escalation rates were utilized, the AROs could change materially. However, changes in estimates have minimal impact on results of operations as NSP-Minnesota expects to continue to recover all costs in future rates.
Xcel Energy continually makes judgments and estimates related to these critical accounting policy areas, based on an evaluation of the varying assumptions and uncertainties for each area. The information and assumptions underlying many of these judgments and estimates will be affected by events beyond the control of Xcel Energy, or otherwise change over time. This may require adjustments to recorded results to better reflect the events and updated information that becomes available. The accompanying financial statements reflect management’s best estimates and judgments of the impact of these factors as of Dec. 31, 2014.
Derivatives, Risk Management and Market Risk
Xcel Energy Inc. and its subsidiaries are exposed to a variety of market risks in the normal course of business. Market risk is the potential loss that may occur as a result of adverse changes in the market or fair value of a particular instrument or commodity. All financial and commodity-related instruments, including derivatives, are subject to market risk. See Note 11 to the consolidated financial statements for further discussion of market risks associated with derivatives.
Xcel Energy is exposed to the impact of adverse changes in price for energy and energy-related products, which is partially mitigated by the use of commodity derivatives. In addition to ongoing monitoring and maintaining credit policies intended to minimize overall credit risk, when necessary, management takes steps to mitigate changes in credit and concentration risks associated with its derivatives and other contracts, including parental guarantees and requests of collateral. While Xcel Energy expects that the counterparties will perform under the contracts underlying its derivatives, the contracts expose Xcel Energy to some credit and non-performance risk.
Schedule Q-3 Page 81 of 182
Sponsor: Robinson Case No. 15-00139-UT

66
Though no material non-performance risk currently exists with the counterparties to Xcel Energy’s commodity derivative contracts, distress in the financial markets may in the future impact that risk to the extent it impacts those counterparties. Distress in the financial markets may also impact the fair value of the securities in the nuclear decommissioning fund and master pension trust, as well as Xcel Energy’s ability to earn a return on short-term investments of excess cash.
Commodity Price Risk — Xcel Energy Inc.’s utility subsidiaries are exposed to commodity price risk in their electric and natural gas operations. Commodity price risk is managed by entering into long- and short-term physical purchase and sales contracts for electric capacity, energy and energy-related products and for various fuels used in generation and distribution activities. Commodity price risk is also managed through the use of financial derivative instruments. Xcel Energy’s risk management policy allows it to manage commodity price risk within each rate-regulated operation to the extent such exposure exists.
Wholesale and Commodity Trading Risk — Xcel Energy Inc.’s utility subsidiaries conduct various wholesale and commodity trading activities, including the purchase and sale of electric capacity, energy and energy-related instruments. Xcel Energy’s risk management policy allows management to conduct these activities within guidelines and limitations as approved by its risk management committee, which is made up of management personnel not directly involved in the activities governed by this policy.
At Dec. 31, 2014, the fair values by source for net commodity trading contract assets were as follows:
Futures / Forwards
(Thousands of Dollars)Source ofFair Value
MaturityLess Than
1 YearMaturity
1 to 3 YearsMaturity
4 to 5 Years
MaturityGreater Than
5 Years
Total Futures /ForwardsFair Value
NSP-Minnesota . . . . . . . . . . . . . . . . 1 $ 6,359 $ 8,238 $ 1,401 $ 1,088 $ 17,0862 4,400 — — — 4,400
$ 10,759 $ 8,238 $ 1,401 $ 1,088 $ 21,486
Options
(Thousands of Dollars)Source ofFair Value
MaturityLess Than
1 YearMaturity
1 to 3 YearsMaturity
4 to 5 Years
MaturityGreater Than
5 YearsTotal Options
Fair Value
NSP-Minnesota . . . . . . . . . . . . . . . . 2 $ 325 $ — $ — $ — $ 325
1 — Prices actively quoted or based on actively quoted prices.2 — Prices based on models and other valuation methods.
Changes in the fair value of commodity trading contracts before the impacts of margin-sharing mechanisms for the years ended Dec. 31, were as follows:
(Thousands of Dollars) 2014 2013
Fair value of commodity trading net contract assets outstanding at Jan. 1 . . . . . . . . . . . . . . . . . . . . . . . . . $ 30,514 $ 28,314Contracts realized or settled during the period . . . . . . . . . . . . . . . . . . . . . . . . . . . . . . . . . . . . . . . . . . . . . . (12,698) (6,665)Commodity trading contract additions and changes during the period . . . . . . . . . . . . . . . . . . . . . . . . . . . . 3,995 8,865Fair value of commodity trading net contract assets outstanding at Dec. 31 . . . . . . . . . . . . . . . . . . . . . . . $ 21,811 $ 30,514
At Dec. 31, 2014, a 10 percent increase in market prices for commodity trading contracts would increase pretax income by approximately $0.9 million, whereas a 10 percent decrease would decrease pretax income by approximately $0.9 million. At Dec. 31, 2013, a 10 percent increase in market prices for commodity trading contracts would decrease pretax income by approximately $0.6 million, whereas a 10 percent decrease would increase pretax income by approximately $0.6 million.
Xcel Energy Inc.’s utility subsidiaries’ wholesale and commodity trading operations measure the outstanding risk exposure to price changes on transactions, contracts and obligations that have been entered into, but not closed, including transactions that are not recorded at fair value, using an industry standard methodology known as Value at Risk (VaR). VaR expresses the potential change in fair value on the outstanding transactions, contracts and obligations over a particular period of time under normal market conditions.
The VaRs for the NSP-Minnesota and PSCo commodity trading operations, calculated on a consolidated basis using a Monte Carlo simulation with a 95 percent confidence level and a one-day holding period, were as follows:
(Millions of Dollars)Year Ended
Dec. 31 VaR Limit Average High Low
2014 . . . . . . . . . . . . . . . . . . . . . . . . . . . . . . . . . . . . . . $ 0.57 $ 3.00 $ 0.61 $ 4.06 $ 0.132013 . . . . . . . . . . . . . . . . . . . . . . . . . . . . . . . . . . . . . . 0.29 3.00 0.41 1.65 <0.01
Schedule Q-3 Page 82 of 182
Sponsor: Robinson Case No. 15-00139-UT

67
Nuclear Fuel Supply — NSP-Minnesota is scheduled to take delivery of approximately 13 percent of its 2015 enriched nuclear material requirements from sources that could be impacted by events in Ukraine and sanctions against Russia. In 2014, NSP-Minnesota arranged for and took delivery of material from alternate sources that were not impacted by these world events. These alternate sources are expected to provide the flexibility to manage NSP-Minnesota’s nuclear fuel supply to ensure that plant availability and reliability will not be negatively impacted in the near-term. Long-term, through 2024, NSP-Minnesota is scheduled to take delivery of approximately 34 percent of its average enriched nuclear material requirements from sources that could be impacted by events in Ukraine and extended sanctions against Russia. NSP-Minnesota is closely following the progression of these events and will periodically assess if further actions are required to assure a secure supply of enriched nuclear material beyond 2015.
Interest Rate Risk — Xcel Energy is subject to the risk of fluctuating interest rates in the normal course of business. Xcel Energy’s risk management policy allows interest rate risk to be managed through the use of fixed rate debt, floating rate debt and interest rate derivatives such as swaps, caps, collars and put or call options.
At Dec. 31, 2014 and 2013, a 100 basis point change in the benchmark rate on Xcel Energy’s variable rate debt would impact annual pretax interest expense by approximately $10.4 million and $8.3 million, respectively. See Note 11 to the consolidated financial statements for a discussion of Xcel Energy Inc. and its subsidiaries’ interest rate derivatives.
NSP-Minnesota also maintains a nuclear decommissioning fund, as required by the NRC. The nuclear decommissioning fund is subject to interest rate risk and equity price risk. At Dec. 31, 2014, the fund was invested in a diversified portfolio of cash equivalents, debt securities, equity securities, and other investments. These investments may be used only for activities related to nuclear decommissioning. Given the purpose and legal restrictions on the use of nuclear decommissioning fund assets, realized and unrealized gains on fund investments over the life of the fund are deferred as an offset of NSP-Minnesota’s regulatory asset for nuclear decommissioning costs. Consequently, any realized and unrealized gains and losses on securities in the nuclear decommissioning fund, including any other-than-temporary impairments, are deferred as a component of the regulatory asset for nuclear decommissioning. Since the accounting for nuclear decommissioning recognizes that costs are recovered through rates, fluctuations in equity prices or interest rates do not have a direct impact on earnings.
Credit Risk — Xcel Energy Inc. and its subsidiaries are also exposed to credit risk. Credit risk relates to the risk of loss resulting from counterparties’ nonperformance on their contractual obligations. Xcel Energy Inc. and its subsidiaries maintain credit policies intended to minimize overall credit risk and actively monitor these policies to reflect changes and scope of operations.
At Dec. 31, 2014, a 10 percent increase in commodity prices would have resulted in an increase in credit exposure of $12.2 million, while a decrease in prices of 10 percent would have resulted in an increase in credit exposure of $2.7 million. At Dec. 31, 2013, a 10 percent increase in commodity prices would have resulted in an increase in credit exposure of $15.2 million, while a decrease in prices of 10 percent would have resulted in an increase in credit exposure of $2.6 million.
Xcel Energy Inc. and its subsidiaries conduct standard credit reviews for all counterparties. Xcel Energy employs additional credit risk control mechanisms when appropriate, such as letters of credit, parental guarantees, standardized master netting agreements and termination provisions that allow for offsetting of positive and negative exposures. Credit exposure is monitored and, when necessary, the activity with a specific counterparty is limited until credit enhancement is provided. Distress in the financial markets could increase Xcel Energy’s credit risk.
Fair Value Measurements
Xcel Energy follows accounting and disclosure guidance on fair value measurements that contains a hierarchy for inputs used in measuring fair value and requires disclosure of the observability of the inputs used in these measurements. See Note 11 to the consolidated financial statements for further discussion of the fair value hierarchy and the amounts of assets and liabilities measured at fair value that have been assigned to Level 3.
Commodity Derivatives — Xcel Energy continuously monitors the creditworthiness of the counterparties to its commodity derivative contracts and assesses each counterparty’s ability to perform on the transactions set forth in the contracts. Given this assessment and the typically short duration of these contracts, the impact of discounting commodity derivative assets for counterparty credit risk was not material to the fair value of commodity derivative assets at Dec. 31, 2014. Adjustments to fair value for credit risk of commodity trading instruments are recorded in electric revenues. Credit risk adjustments for other commodity derivative instruments are deferred as OCI or regulatory assets and liabilities. The classification as a regulatory asset or liability is based on commission approved regulatory recovery mechanisms. Xcel Energy also assesses the impact of its own credit risk when determining the fair value of commodity derivative liabilities. The impact of discounting commodity derivative liabilities for credit risk was immaterial to the fair value of commodity derivative liabilities at Dec. 31, 2014.
Commodity derivative assets and liabilities assigned to Level 3 typically consist of FTRs, as well as forwards and options that are long-term in nature. Level 3 commodity derivative assets and liabilities represent 3.7 percent and 41.0 percent of gross assets and liabilities, respectively, measured at fair value at Dec. 31, 2014.
Schedule Q-3 Page 83 of 182
Sponsor: Robinson Case No. 15-00139-UT

68
Determining the fair value of FTRs requires numerous management forecasts that vary in observability, including various forward commodity prices, retail and wholesale demand, generation and resulting transmission system congestion. Given the limited observability of management’s forecasts for several of these inputs, these instruments have been assigned a Level 3. Level 3 commodity derivatives assets and liabilities included $67.0 million and $10.9 million of estimated fair values, respectively, for FTRs held at Dec. 31, 2014.
Determining the fair value of certain commodity forwards and options can require management to make use of subjective price and volatility forecasts which extend to periods beyond those readily observable on active exchanges or quoted by brokers. When less observable forward price and volatility forecasts are significant to determining the value of commodity forwards and options, these instruments are assigned to Level 3. There were no Level 3 forwards or options held at Dec. 31, 2014.
Nuclear Decommissioning Fund — Nuclear decommissioning fund assets assigned to Level 3 consist of private equity investments and real estate investments. Based on an evaluation of NSP-Minnesota’s ability to redeem private equity investments and real estate investment funds measured at net asset value, estimated fair values for these investments totaling $165.5 million in the nuclear decommissioning fund at Dec. 31, 2014 (approximately 9.2 percent of total assets measured at fair value) are assigned to Level 3. Realized and unrealized gains and losses on nuclear decommissioning fund investments are deferred as a regulatory asset.
Liquidity and Capital Resources
Cash Flows
(Millions of Dollars) 2014 2013 2012
Net cash provided by operating activities . . . . . . . . . . . . . . . . . . . . . . . . . . . . . . . . . . . . $ 2,648 $ 2,584 $ 2,005
Net cash provided by operating activities increased by $64 million for 2014 as compared to 2013. Additional net income, excluding amounts related to non-cash operating activities (e.g. depreciation and deferred tax expenses) and lower pension contributions in 2014 were offset by changes in working capital and other noncurrent assets and liabilities.
Net cash provided by operating activities increased by $579 million for 2013 as compared to 2012. The increase was primarily the result of higher net income, changes in working capital due to the timing of payments and receipts, net changes in regulatory assets and liabilities, and payments mainly related to interest rate swap settlements in 2012.
(Millions of Dollars) 2014 2013 2012
Net cash used in investing activities . . . . . . . . . . . . . . . . . . . . . . . . . . . . . . . . . . . . . . . . . $ (3,117) $ (3,213) $ (2,333)
Net cash used in investing activities decreased by $96 million for 2014 as compared to 2013. The decrease was primarily attributable to higher capital expenditures in 2013 associated with several major construction projects including the Monticello nuclear EPU and the PI steam generator replacement. The change in capital expenditures was partially offset by the impact of higher insurance proceeds related to Sherco Unit 3 and proceeds received from the sale of certain transmission assets to Sharyland in 2013.
Net cash used in investing activities increased by $880 million for 2013 as compared to 2012. The increase was primarily the result of higher capital expenditures for several major construction projects including the Monticello nuclear EPU project as well as the PI steam generator replacement and certain other transmission line projects. Other differences mainly related to changes in restricted cash.
(Millions of Dollars) 2014 2013 2012
Net cash provided by financing activities . . . . . . . . . . . . . . . . . . . . . . . . . . . . . . . . . . . . $ 442 $ 654 $ 350
Net cash provided by financing activities decreased by $212 million for 2014 as compared to 2013. The decrease was primarily due to lower proceeds from long-term debt, less issuances of common stock and higher dividend payments, partially offset by higher proceeds from short-term debt and lower repayments of long-term debt.
Net cash provided by financing activities increased by $654 million for 2013 as compared to 2012. The increase was primarily due to the issuance of more common stock during 2013, lower repayments of previously existing long-term debt, which was partially offset by reductions in long-term and short-term borrowing.
See discussion of trends, commitments and uncertainties with the potential for future impact on cash flow and liquidity under Capital Sources.
Schedule Q-3 Page 84 of 182
Sponsor: Robinson Case No. 15-00139-UT

69
Capital Requirements
Xcel Energy expects to meet future financing requirements by periodically issuing short-term debt, long-term debt, common stock, hybrid and other securities to maintain desired capitalization ratios.
Capital Expenditures — The current estimated capital expenditure programs of Xcel Energy Inc. and its subsidiaries for the years 2015 through 2019 are shown in the table below.
Actual Forecast
(Millions of Dollars) 2014 2015 2016 2017 2018 20192015 - 2019
TotalBy Subsidiary
NSP-Minnesota . . . . . . . . . . . . . . . . . . . . . . . . . $ 1,159 $ 1,625 $ 990 $ 975 $ 845 $ 950 $ 5,385PSCo. . . . . . . . . . . . . . . . . . . . . . . . . . . . . . . . . . 1,064 950 820 815 885 1,010 4,480SPS . . . . . . . . . . . . . . . . . . . . . . . . . . . . . . . . . . . 542 570 710 735 595 565 3,175NSP-Wisconsin. . . . . . . . . . . . . . . . . . . . . . . . . . 290 230 260 300 325 325 1,440
Total capital expenditures . . . . . . . . . . . . . . . . $ 3,055 $ 3,375 $ 2,780 $ 2,825 $ 2,650 $ 2,850 $ 14,480
By Function 2014 2015 2016 2017 2018 20192015 - 2019
Total
Electric transmission . . . . . . . . . . . . . . . . . . . . . $ 972 $ 875 $ 780 $ 905 $ 975 $ 1,000 $ 4,535Electric generation . . . . . . . . . . . . . . . . . . . . . . . 710 1,190 630 620 415 450 3,305Electric distribution . . . . . . . . . . . . . . . . . . . . . . 545 605 630 640 650 680 3,205Natural gas . . . . . . . . . . . . . . . . . . . . . . . . . . . . . 525 370 370 305 355 380 1,780Nuclear fuel . . . . . . . . . . . . . . . . . . . . . . . . . . . . 154 90 120 120 65 150 545Other. . . . . . . . . . . . . . . . . . . . . . . . . . . . . . . . . . 149 245 250 235 190 190 1,110
Total capital expenditures . . . . . . . . . . . . . . . . $ 3,055 $ 3,375 $ 2,780 $ 2,825 $ 2,650 $ 2,850 $ 14,480
The capital expenditure programs of Xcel Energy are subject to continuing review and modification. Actual utility capital expenditures may vary from the estimates due to changes in electric and natural gas projected load growth, regulatory decisions, legislative initiatives, reserve margin requirements, the availability of purchased power, alternative plans for meeting long-term energy needs, compliance with environmental requirements, RPS and merger, acquisition and divestiture opportunities. The table above does not include potential expenditures of Xcel Energy’s TransCos.
The current estimated financing plans to fund capital expenditures of Xcel Energy Inc. and its subsidiaries for the years 2015 through 2019 are shown in the table below.
(Millions of Dollars)
Funding Capital ExpendituresCash from Operations* . . . . . . . . . . . . . . . . . . . . . . . . . . . . . . . . . . . . . . . . . . . . . . . . . . . . . . . . . . . . . . . . . . . . . . $ 11,500New Debt** . . . . . . . . . . . . . . . . . . . . . . . . . . . . . . . . . . . . . . . . . . . . . . . . . . . . . . . . . . . . . . . . . . . . . . . . . . . . . . . 2,605Equity from Dividend Reinvestment Program (DRIP) and Benefit Programs . . . . . . . . . . . . . . . . . . . . . . . . . . . . 375
2015-2019 Capital Expenditures . . . . . . . . . . . . . . . . . . . . . . . . . . . . . . . . . . . . . . . . . . . . . . . . . . . . . . . . . . . . . . $ 14,480
Maturing Debt . . . . . . . . . . . . . . . . . . . . . . . . . . . . . . . . . . . . . . . . . . . . . . . . . . . . . . . . . . . . . . . . . . . . . . . . . . . . $ 2,995
* Cash from operations, net of dividend and pension funding.** Reflects a combination of short and long-term debt.
Schedule Q-3 Page 85 of 182
Sponsor: Robinson Case No. 15-00139-UT

70
Contractual Obligations and Other Commitments — In addition to its capital expenditure programs, Xcel Energy has contractual obligations and other commitments that will need to be funded in the future. The following is a summarized table of contractual obligations and other commercial commitments at Dec. 31, 2014. See the statements of capitalization and additional discussion in Notes 4 and 13 to the consolidated financial statements.
Payments Due by Period(Thousands of Dollars) Total Less than 1 Year 1 to 3 Years 3 to 5 Years After 5 Years
Long-term debt, principal and interest payments (a) . . . . . . . . . . . . . . . . . . . . . . . . . . . $ 20,295,497 $ 788,787 $ 2,069,075 $ 2,483,533 $ 14,954,102
Capital lease obligations . . . . . . . . . . . . . . . . . . 352,185 17,787 32,143 29,154 273,101Operating leases (b)(c) . . . . . . . . . . . . . . . . . . . . . 3,103,660 254,550 467,423 463,693 1,917,994Unconditional purchase obligations (d) . . . . . . . 10,101,197 2,023,394 2,555,760 1,406,598 4,115,445Other long-term obligations, including current portion (e) . . . . . . . . . . . . . . . . . . . . . . . . . . . . . 200,289 52,207 83,775 64,307 —
Payments to vendors in process . . . . . . . . . . . . 35,151 35,151 — — —Short-term debt . . . . . . . . . . . . . . . . . . . . . . . . . 1,019,500 1,019,500 — — —
Total contractual cash obligations (f)(g)(h) . . . . $ 35,107,479 $ 4,191,376 $ 5,208,176 $ 4,447,285 $ 21,260,642
(a) Includes interest payments over the terms of the debt. Interest is calculated using the applicable interest rate at Dec. 31, 2014, and outstanding principal for each investment with the terms ending at each instrument’s maturity.
(b) Under some leases, Xcel Energy would have to sell or purchase the property that it leases if it chose to terminate before the scheduled lease expiration date. Most of Xcel Energy’s railcar, vehicle and equipment and aircraft leases have these terms. At Dec. 31, 2014, the amount that Xcel Energy would have to pay if it chose to terminate these leases was approximately $62.2 million. In addition, at the end of the equipment lease terms, each lease must be extended, equipment purchased for the greater of the fair value or unamortized value of equipment sold to a third party with Xcel Energy making up any deficiency between the sales price and the unamortized value.
(c) Included in operating lease payments are $228.3 million, $425.4 million, $424.6 million and $1.8 billion, for the less than 1 year, 1-3 years, 3-5 years and after 5 years categories, respectively, pertaining to PPAs that were accounted for as operating leases.
(d) Xcel Energy Inc. and its subsidiaries have contracts providing for the purchase and delivery of a significant portion of its current coal, nuclear fuel and natural gas requirements. Additionally, the utility subsidiaries of Xcel Energy Inc. have entered into agreements with utilities and other energy suppliers for purchased power to meet system load and energy requirements, replace generation from company-owned units under maintenance and during outages, and meet operating reserve obligations. Certain contractual purchase obligations are adjusted on indices. The effects of price changes are mitigated through cost of energy adjustment mechanisms.
(e) Other long-term obligations relate primarily to amounts associated with technology agreements as well as uncertain tax positions.(f) Xcel Energy also has outstanding authority under O&M contracts to purchase up to approximately $3.6 billion of goods and services through the year 2050, in
addition to the amounts disclosed in this table.(g) In January 2015, contributions of $90.0 million were made across four of Xcel Energy’s pension plans. Obligations of this type are dependent on several factors,
including management discretion, and therefore, they are not included in the table.(h) Xcel Energy expects to contribute approximately $12.8 million to the postretirement health care plans during 2015. Obligations of this type are dependent on
several factors, including management discretion, and therefore, they are not included in the table.
Common Stock Dividends — Future dividend levels will be dependent on Xcel Energy’s results of operations, financial position, cash flows, reinvestment opportunities and other factors, and will be evaluated by the Xcel Energy Inc. Board of Directors. Xcel Energy’s financial objectives include: growing annual ongoing EPS four percent to six percent, growing the annual dividend five percent to seven percent and targeting a dividend payout ratio of 60 percent to 70 percent of annual ongoing EPS. On Feb. 18, 2015, Xcel Energy announced a quarterly dividend of $0.32 per share, which represented an increase of 6.7 percent. Xcel Energy’s dividend policy balances:
• Projected cash generation;• Projected capital investment;• A reasonable rate of return on shareholder investment; and• The impact on Xcel Energy’s capital structure and credit ratings.
In addition, there are certain statutory limitations that could affect dividend levels. Federal law places certain limits on the ability of public utilities within a holding company system to declare dividends.
Specifically, under the Federal Power Act, a public utility may not pay dividends from any funds properly included in a capital account. The utility subsidiaries’ dividends may be limited directly or indirectly by state regulatory commissions or bond indenture covenants. See Note 4 to the consolidated financial statements for further discussion of restrictions on dividend payments.
Schedule Q-3 Page 86 of 182
Sponsor: Robinson Case No. 15-00139-UT
71
Regulation of Derivatives — In July 2010, financial reform legislation was passed that provides for the regulation of derivative transactions amongst other provisions. Provisions within the bill provide the CFTC and the SEC with expanded regulatory authority over derivative and swap transactions. Regulations effected under this legislation could preclude or impede some types of over-the-counter energy commodity transactions and/or require clearing through regulated central counterparties, which could negatively impact the market for these transactions or result in extensive margin and fee requirements.
As a result of this legislation, there will be material increased reporting requirements for certain volumes of derivative and swap activity. In April 2012, the CFTC ruled that swap dealing activity conducted by entities for the preceding 12 months under a notional limit, initially set at $8 billion with further potential reduction to $3 billion after five years, will fall under the general de minimis threshold and will not subject an entity to registering as a swap dealer. An entity may deal in utility operations-related swaps and not be required to register as a swap dealer provided that the aggregate gross notional amount of swap dealing activity (including utility operations-related swaps) does not exceed the general de minimis threshold and provided that the entity has not exceeded the special entity de minimis threshold (excluding utility operations-related swaps) of $25 million for the preceding 12 months. Xcel Energy’s current and projected swap activity is well below these de minimis thresholds. The bill also contains provisions that should exempt certain derivatives end users from much of the clearing and margin requirements. Xcel Energy does not expect to be materially impacted by the margining provisions. Xcel Energy is currently meeting all other reporting requirements.
SPP FTR Margining Requirements — The SPP conducted its first annual FTR auction in the spring of 2014 associated with the implementation of the SPP IM. The process for transmission owners involves the receipt of Auction Revenue Rights (ARRs) and, if elected by the transmission owner, conversion of those ARRs to firm FTRs. SPP requires that the transmission owner post collateral for the conversion of ARRs to FTRs. At Dec. 31, 2014, SPS had a $30 million letter of credit posted with SPP, which was a reduction from the initial requirement of $41 million.
Pension Fund — Xcel Energy’s pension assets are invested in a diversified portfolio of domestic and international equity securities, short-term to long-duration fixed income and interest rate swap securities, and alternative investments, including private equity, real estate, hedge funds and commodity investments.
The funded status and pension assumptions are summarized in the following tables:
(Millions of Dollars) Dec. 31, 2014 Dec. 31, 2013
Fair value of pension assets . . . . . . . . . . . . . . . . . . . . . . . . . . . . . . . . . . . . . . . . . . . . . . . . . . . . . . . . $ 3,084 $ 3,010Projected pension obligation (a). . . . . . . . . . . . . . . . . . . . . . . . . . . . . . . . . . . . . . . . . . . . . . . . . . . . . . 3,747 3,441
Funded status . . . . . . . . . . . . . . . . . . . . . . . . . . . . . . . . . . . . . . . . . . . . . . . . . . . . . . . . . . . . . . . . . . $ (663) $ (431)(a) Excludes nonqualified plan of $47 million and $37 million at Dec. 31, 2014 and 2013, respectively.
Pension Assumptions 2014 2013
Discount rate. . . . . . . . . . . . . . . . . . . . . . . . . . . . . . . . . . . . . . . . . . . . . . . . . . . . . . . . . . . . . . . . . . . . 4.11% 4.75%Expected long-term rate of return. . . . . . . . . . . . . . . . . . . . . . . . . . . . . . . . . . . . . . . . . . . . . . . . . . . . 7.09 7.05
Capital Sources
Short-Term Funding Sources — Xcel Energy uses a number of sources to fulfill short-term funding needs, including operating cash flow, notes payable, commercial paper and bank lines of credit. The amount and timing of short-term funding needs depend in large part on financing needs for construction expenditures, working capital and dividend payments.
Short-Term Investments — Xcel Energy Inc., NSP-Minnesota, NSP-Wisconsin, PSCo and SPS maintain cash operating and short-term investment accounts. At Dec. 31, 2014 and 2013, there was $3.3 million and $21.7 million of cash held in these accounts, respectively.
Commercial Paper — Xcel Energy Inc., NSP-Minnesota, NSP-Wisconsin, PSCo and SPS each have individual commercial paper programs. The authorized levels for these commercial paper programs are:
• $1 billion for Xcel Energy Inc.;• $700 million for PSCo;• $500 million for NSP-Minnesota;• $400 million for SPS; and• $150 million for NSP-Wisconsin.
Schedule Q-3 Page 87 of 182
Sponsor: Robinson Case No. 15-00139-UT

72
Commercial paper outstanding for Xcel Energy was as follows:
(Amounts in Millions, Except Interest Rates)Three Months Ended
Dec. 31, 2014
Borrowing limit . . . . . . . . . . . . . . . . . . . . . . . . . . . . . . . . . . . . . . . . . . . . . . . . . . . . . . . . . . . . . . . . . . . . . . . . . . . . $ 2,750Amount outstanding at period end. . . . . . . . . . . . . . . . . . . . . . . . . . . . . . . . . . . . . . . . . . . . . . . . . . . . . . . . . . . . . . 1,020Average amount outstanding . . . . . . . . . . . . . . . . . . . . . . . . . . . . . . . . . . . . . . . . . . . . . . . . . . . . . . . . . . . . . . . . . . 802Maximum amount outstanding . . . . . . . . . . . . . . . . . . . . . . . . . . . . . . . . . . . . . . . . . . . . . . . . . . . . . . . . . . . . . . . . 1,021Weighted average interest rate, computed on a daily basis . . . . . . . . . . . . . . . . . . . . . . . . . . . . . . . . . . . . . . . . . . . 0.36%Weighted average interest rate at end of period. . . . . . . . . . . . . . . . . . . . . . . . . . . . . . . . . . . . . . . . . . . . . . . . . . . . 0.56
(Amounts in Millions, Except Interest Rates)Year Ended Dec. 31,
2014Year Ended Dec. 31,
2013Year Ended Dec. 31,
2012
Borrowing limit . . . . . . . . . . . . . . . . . . . . . . . . . . . . . . . . . . . . . . . . $ 2,750 $ 2,450 $ 2,450Amount outstanding at period end . . . . . . . . . . . . . . . . . . . . . . . . . . 1,020 759 602Average amount outstanding . . . . . . . . . . . . . . . . . . . . . . . . . . . . . . 841 481 403Maximum amount outstanding . . . . . . . . . . . . . . . . . . . . . . . . . . . . . 1,200 1,160 634Weighted average interest rate, computed on a daily basis . . . . . . . 0.33% 0.31% 0.35%Weighted average interest rate at end of period . . . . . . . . . . . . . . . . 0.56 0.25 0.36
Credit Facilities — In October 2014, Xcel Energy Inc., NSP-Minnesota, NSP-Wisconsin, PSCo and SPS entered into amended five-year credit agreements with a syndicate of banks, replacing their previous five-year credit agreements. The total size of the credit facilities is $2.75 billion and each credit facility terminates in October 2019.
NSP-Minnesota, PSCo, SPS and Xcel Energy Inc. each have the right to request an extension of the revolving termination date for two additional one-year periods. NSP-Wisconsin has the right to request an extension of the revolving termination date for an additional one-year period. All extension requests are subject to majority bank group approval.
As of Feb. 18, 2015, Xcel Energy Inc. and its utility subsidiaries had the following committed credit facilities available to meet liquidity needs:
(Millions of Dollars) Facility (a) Drawn (b) Available Cash Liquidity
Xcel Energy Inc. . . . . . . . . . . . . . . . . . . . . . . . . . . . . . $ 1,000.0 $ 505.0 $ 495.0 $ 0.2 $ 495.2PSCo . . . . . . . . . . . . . . . . . . . . . . . . . . . . . . . . . . . . . . 700.0 243.4 456.6 0.4 457.0NSP-Minnesota . . . . . . . . . . . . . . . . . . . . . . . . . . . . . . 500.0 139.1 360.9 1.0 361.9SPS . . . . . . . . . . . . . . . . . . . . . . . . . . . . . . . . . . . . . . . 400.0 138.0 262.0 1.0 263.0NSP-Wisconsin . . . . . . . . . . . . . . . . . . . . . . . . . . . . . . 150.0 51.0 99.0 0.9 99.9
Total. . . . . . . . . . . . . . . . . . . . . . . . . . . . . . . . . . . . . . $ 2,750.0 $ 1,076.5 $ 1,673.5 $ 3.5 $ 1,677.0(a) These credit facilities have been amended to extend the maturity to October 2019.(b) Includes outstanding commercial paper and letters of credit.
Money Pool — Xcel Energy received FERC approval to establish a utility money pool arrangement with the utility subsidiaries, subject to receipt of required state regulatory approvals. The utility money pool allows for short-term investments in and borrowings between the utility subsidiaries. Xcel Energy Inc. may make investments in the utility subsidiaries at market-based interest rates; however, the money pool arrangement does not allow the utility subsidiaries to make investments in Xcel Energy Inc. The money pool balances are eliminated in consolidation.
NSP-Minnesota, PSCo and SPS participate in the money pool pursuant to approval from their respective state regulatory commissions. NSP-Wisconsin does not participate in the money pool.
Schedule Q-3 Page 88 of 182
Sponsor: Robinson Case No. 15-00139-UT

73
Registration Statements — Xcel Energy Inc.’s Articles of Incorporation authorize the issuance of one billion shares of $2.50 par value common stock. As of Dec. 31, 2014 and 2013, Xcel Energy Inc. had approximately 506 million shares and 498 million shares of common stock outstanding, respectively. In addition, Xcel Energy Inc.’s Articles of Incorporation authorize the issuance of seven million shares of $100 par value preferred stock. Xcel Energy Inc. had no shares of preferred stock outstanding on Dec. 31, 2014 and 2013.
Xcel Energy Inc. and its subsidiaries have the following registration statements on file with the SEC, pursuant to which they may sell, from time to time, securities:
• Xcel Energy Inc. has an effective automatic shelf registration statement filed in August 2012, which does not contain a limit on issuance capacity. However, Xcel Energy Inc.’s ability to issue securities is limited by authority granted by the Board of Directors, which currently authorizes the issuance of up to an additional $900 million of debt and common equity securities.
• NSP-Minnesota has an automatic shelf registration statement filed in December 2013, which does not contain a limit on issuance capacity. However, NSP-Minnesota’s ability to issue securities is limited by authority granted by its Board of Directors, which currently authorizes the issuance of up to an additional $750 million of debt securities.
• NSP-Wisconsin has $100 million of debt securities remaining under its currently effective shelf registration statement, which was filed in December 2013.
• PSCo has an automatic shelf registration statement filed in October 2013, which does not contain a limit on issuance capacity. However, PSCo’s ability to issue securities is limited by authority granted by its Board of Directors, which currently authorizes the issuance of up to an additional $700 million of debt securities.
• SPS has $150 million of debt securities remaining under its currently effective shelf registration statement, which was filed in April 2013. SPS intends to register additional debt securities in 2015.
Long-Term Borrowings and Other Financing Instruments — See the consolidated statements of capitalization and a discussion of the long-term borrowings in Note 4 to the consolidated financial statements.
During 2014, Xcel Energy Inc. and its utility subsidiaries completed the following bond issuances:
• In March, PSCo issued $300 million of 4.30 percent first mortgage bonds due March 15, 2044; • In May, NSP-Minnesota issued $300 million of 4.125 percent first mortgage bonds due May 15, 2044;• In June, SPS issued $150 million of 3.30 percent first mortgage bonds due June 15, 2024; and• In June, NSP-Wisconsin issued $100 million of 3.30 percent first mortgage bonds due June 15, 2024.
Xcel Energy Inc. issued approximately 5.7 million shares of common stock through an ATM program for approximately $175 million during the first six months of 2014. As a result, Xcel Energy completed its ATM program as of June 30, 2014. Xcel Energy does not anticipate issuing any additional equity, beyond its DRIP and benefit programs, over the next five years based on its current capital expenditure plan.
Financing Plans — Xcel Energy issues debt and equity securities to refinance retiring maturities, reduce short-term debt, fund capital programs, infuse equity in subsidiaries, fund asset acquisitions and for other general corporate purposes.
During 2015, Xcel Energy Inc. and its utility subsidiaries anticipate issuing the following:
• Xcel Energy Inc. plans to issue approximately $500 million of senior unsecured bonds;• PSCo plans to issue approximately $250 million of first mortgage bonds;• NSP-Minnesota plans to issue approximately $600 million of first mortgage bonds;• SPS plans to issue approximately $250 million of first mortgage bonds; and• NSP-Wisconsin plans to issue approximately $100 million of first mortgage bonds.
Financing plans are subject to change, depending on capital expenditures, internal cash generation, market conditions and other factors.
Off-Balance-Sheet Arrangements
Xcel Energy does not have any off-balance-sheet arrangements, other than those currently disclosed, that have or are reasonably likely to have a current or future effect on financial condition, changes in financial condition, revenues or expenses, results of operations, liquidity, capital expenditures or capital resources that is material to investors.
Schedule Q-3 Page 89 of 182
Sponsor: Robinson Case No. 15-00139-UT

74
Earnings Guidance
Xcel Energy’s 2015 ongoing earnings guidance is $2.00 to $2.15 per share. Key assumptions related to 2015 earnings are detailed below:
• Constructive outcomes in all rate case and regulatory proceedings.• If the MPUC orders a disallowance in the Monticello prudence review, Xcel Energy would exclude the associated charge from
ongoing earnings.• Normal weather patterns are experienced for the year.• Weather-normalized retail electric utility sales are projected to increase approximately 1.0 percent.• Weather-normalized retail firm natural gas sales are projected to decline approximately 2.0 percent.• Capital rider revenue is projected to increase by $160 million to $170 million over 2014 levels. The projected capital rider
revenue reflects the transfer of the CACJA project from base rates to the rider per the settlement in the Colorado electric rate case. The settlement is pending CPUC approval.
• The change in O&M expenses is projected to be within a range of 0 percent to 2 percent from 2014 levels.• Depreciation expense is projected to increase $160 million to $180 million over 2014 levels, reflecting the originally
proposed acceleration of the amortization of the excess depreciation reserve as part of NSP-Minnesota’s moderation plan in the Minnesota electric rate case.
• Property taxes are projected to increase approximately $60 million to $70 million over 2014 levels.• Interest expense (net of AFUDC — debt) is projected to increase $40 million to $50 million over 2014 levels.• AFUDC — equity is projected to decline approximately $35 million to $45 million from 2014 levels.• The ETR is projected to be approximately 34 percent to 36 percent.• Average common stock and equivalents are projected to be approximately 508 million shares.
Long-Term EPS and Dividend Growth Rate Objectives
Xcel Energy expects to deliver an attractive total return to our shareholders through a combination of earnings growth and dividend yield, based on the following long-term objectives:
• Deliver long-term annual EPS growth of 4 percent to 6 percent, based on weather-normalized, ongoing 2014 EPS of $2.00;• Deliver annual dividend increases of 5 percent to 7 percent;• Target a dividend payout ratio of 60 percent to 70 percent of annual ongoing EPS; and• Maintain senior unsecured debt credit ratings in the BBB+ to A range.
Ongoing earnings is calculated using net income and adjusting for certain nonrecurring or infrequent items that are, in management’s view, not reflective of ongoing operations.
Item 7A — Quantitative and Qualitative Disclosures About Market Risk
See Item 7, incorporated by reference.
Item 8 — Financial Statements and Supplementary Data
See Item 15-1 for an index of financial statements included herein.
See Note 18 to the consolidated financial statements for summarized quarterly financial data.
Schedule Q-3 Page 90 of 182
Sponsor: Robinson Case No. 15-00139-UT

75
Management Report on Internal Controls Over Financial Reporting
The management of Xcel Energy Inc. is responsible for establishing and maintaining adequate internal control over financial reporting. Xcel Energy Inc.’s internal control system was designed to provide reasonable assurance to Xcel Energy Inc.’s management and board of directors regarding the preparation and fair presentation of published financial statements.
All internal control systems, no matter how well designed, have inherent limitations. Therefore, even those systems determined to be effective can provide only reasonable assurance with respect to financial statement preparation and presentation.
Xcel Energy Inc. management assessed the effectiveness of Xcel Energy Inc.’s internal control over financial reporting as of Dec. 31, 2014. In making this assessment, it used the criteria set forth by the Committee of Sponsoring Organizations of the Treadway Commission (COSO) in Internal Control — Integrated Framework (2013). Based on our assessment, we believe that, as of Dec. 31, 2014, Xcel Energy Inc.’s internal control over financial reporting is effective at the reasonable assurance level based on those criteria.
Xcel Energy Inc.’s independent registered public accounting firm has issued an audit report on the Xcel Energy Inc.’s internal control over financial reporting. Its report appears herein.
/s/ BEN FOWKE /s/ TERESA S. MADDENBen Fowke Teresa S. MaddenChairman, President and Chief Executive Officer Executive Vice President, Chief Financial OfficerFeb. 20, 2015 Feb. 20, 2015
Schedule Q-3 Page 91 of 182
Sponsor: Robinson Case No. 15-00139-UT

76
REPORT OF INDEPENDENT REGISTERED PUBLIC ACCOUNTING FIRM
To the Board of Directors and Stockholders ofXcel Energy Inc.Minneapolis, Minnesota
We have audited the accompanying consolidated balance sheets and statements of capitalization of Xcel Energy Inc. and subsidiaries (the “Company”) as of December 31, 2014 and 2013, and the related consolidated statements of income, comprehensive income, cash flows, and common stockholders’ equity for each of the three years in the period ended December 31, 2014. Our audits also included the financial statement schedules listed in the Index at Item 15. These financial statements and financial statement schedules are the responsibility of the Company’s management. Our responsibility is to express an opinion on the financial statements and financial statement schedules based on our audits.
We conducted our audits in accordance with the standards of the Public Company Accounting Oversight Board (United States). Those standards require that we plan and perform the audit to obtain reasonable assurance about whether the financial statements are free of material misstatement. An audit includes examining, on a test basis, evidence supporting the amounts and disclosures in the financial statements. An audit also includes assessing the accounting principles used and significant estimates made by management, as well as evaluating the overall financial statement presentation. We believe that our audits provide a reasonable basis for our opinion.
In our opinion, such consolidated financial statements present fairly, in all material respects, the financial position of Xcel Energy Inc. and subsidiaries as of December 31, 2014 and 2013, and the results of their operations and their cash flows for each of the three years in the period ended December 31, 2014, in conformity with accounting principles generally accepted in the United States of America. Also, in our opinion, such financial statement schedules, when considered in relation to the basic consolidated financial statements taken as a whole, present fairly, in all material respects, the information set forth therein.
We have also audited, in accordance with the standards of the Public Company Accounting Oversight Board (United States), the Company’s internal control over financial reporting as of December 31, 2014, based on the criteria established in Internal Control—Integrated Framework (2013) issued by the Committee of Sponsoring Organizations of the Treadway Commission and our report dated February 20, 2015 expressed an unqualified opinion on the Company’s internal control over financial reporting.
/s/ DELOITTE & TOUCHE LLPMinneapolis, MinnesotaFebruary 20, 2015
Schedule Q-3 Page 92 of 182
Sponsor: Robinson Case No. 15-00139-UT
77
REPORT OF INDEPENDENT REGISTERED PUBLIC ACCOUNTING FIRM
To the Board of Directors and Stockholders ofXcel Energy Inc.Minneapolis, Minnesota
We have audited the internal control over financial reporting of Xcel Energy Inc. and subsidiaries (the "Company") as of December 31, 2014, based on criteria established in Internal Control — Integrated Framework (2013) issued by the Committee of Sponsoring Organizations of the Treadway Commission. The Company’s management is responsible for maintaining effective internal control over financial reporting and for its assessment of the effectiveness of internal control over financial reporting, included in the accompanying Management Report on Internal Controls over Financial Reporting. Our responsibility is to express an opinion on the Company’s internal control over financial reporting based on our audit.
We conducted our audit in accordance with the standards of the Public Company Accounting Oversight Board (United States). Those standards require that we plan and perform the audit to obtain reasonable assurance about whether effective internal control over financial reporting was maintained in all material respects. Our audit included obtaining an understanding of internal control over financial reporting, assessing the risk that a material weakness exists, testing and evaluating the design and operating effectiveness of internal control based on the assessed risk, and performing such other procedures as we considered necessary in the circumstances. We believe that our audit provides a reasonable basis for our opinion.
A company’s internal control over financial reporting is a process designed by, or under the supervision of, the company’s principal executive and principal financial officers, or persons performing similar functions, and effected by the company’s board of directors, management, and other personnel to provide reasonable assurance regarding the reliability of financial reporting and the preparation of financial statements for external purposes in accordance with generally accepted accounting principles. A company’s internal control over financial reporting includes those policies and procedures that (1) pertain to the maintenance of records that, in reasonable detail, accurately and fairly reflect the transactions and dispositions of the assets of the company; (2) provide reasonable assurance that transactions are recorded as necessary to permit preparation of financial statements in accordance with generally accepted accounting principles, and that receipts and expenditures of the company are being made only in accordance with authorizations of management and directors of the company; and (3) provide reasonable assurance regarding prevention or timely detection of unauthorized acquisition, use, or disposition of the company’s assets that could have a material effect on the financial statements.
Because of the inherent limitations of internal control over financial reporting, including the possibility of collusion or improper management override of controls, material misstatements due to error or fraud may not be prevented or detected on a timely basis. Also, projections of any evaluation of the effectiveness of the internal control over financial reporting to future periods are subject to the risk that the controls may become inadequate because of changes in conditions, or that the degree of compliance with the policies or procedures may deteriorate.
In our opinion, the Company maintained, in all material respects, effective internal control over financial reporting as of December 31, 2014, based on the criteria established in Internal Control — Integrated Framework (2013) issued by the Committee of Sponsoring Organizations of the Treadway Commission.
We have also audited, in accordance with the standards of the Public Company Accounting Oversight Board (United States) the consolidated financial statements and financial statement schedules as of and for the year ended December 31, 2014 of the Company and our report dated February 20, 2015 expressed an unqualified opinion on those financial statements and financial statement schedules.
/s/ DELOITTE & TOUCHE LLPMinneapolis, MinnesotaFebruary 20, 2015
Schedule Q-3 Page 93 of 182
Sponsor: Robinson Case No. 15-00139-UT
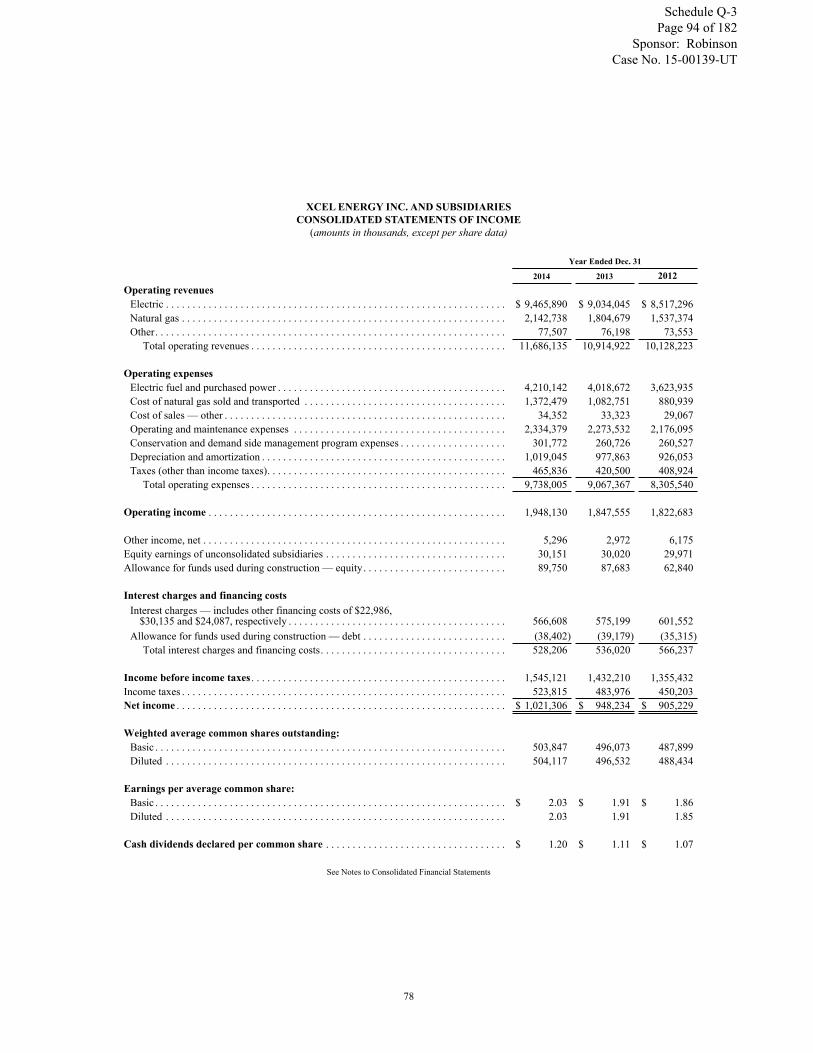
78
XCEL ENERGY INC. AND SUBSIDIARIESCONSOLIDATED STATEMENTS OF INCOME
(amounts in thousands, except per share data)
Year Ended Dec. 31
2014 2013 2012Operating revenues
Electric . . . . . . . . . . . . . . . . . . . . . . . . . . . . . . . . . . . . . . . . . . . . . . . . . . . . . . . . . . . . . . . . $ 9,465,890 $ 9,034,045 $ 8,517,296Natural gas . . . . . . . . . . . . . . . . . . . . . . . . . . . . . . . . . . . . . . . . . . . . . . . . . . . . . . . . . . . . . 2,142,738 1,804,679 1,537,374Other. . . . . . . . . . . . . . . . . . . . . . . . . . . . . . . . . . . . . . . . . . . . . . . . . . . . . . . . . . . . . . . . . . 77,507 76,198 73,553
Total operating revenues . . . . . . . . . . . . . . . . . . . . . . . . . . . . . . . . . . . . . . . . . . . . . . . . 11,686,135 10,914,922 10,128,223
Operating expensesElectric fuel and purchased power . . . . . . . . . . . . . . . . . . . . . . . . . . . . . . . . . . . . . . . . . . . 4,210,142 4,018,672 3,623,935Cost of natural gas sold and transported . . . . . . . . . . . . . . . . . . . . . . . . . . . . . . . . . . . . . . 1,372,479 1,082,751 880,939Cost of sales — other . . . . . . . . . . . . . . . . . . . . . . . . . . . . . . . . . . . . . . . . . . . . . . . . . . . . . 34,352 33,323 29,067Operating and maintenance expenses . . . . . . . . . . . . . . . . . . . . . . . . . . . . . . . . . . . . . . . . 2,334,379 2,273,532 2,176,095Conservation and demand side management program expenses . . . . . . . . . . . . . . . . . . . . 301,772 260,726 260,527Depreciation and amortization . . . . . . . . . . . . . . . . . . . . . . . . . . . . . . . . . . . . . . . . . . . . . . 1,019,045 977,863 926,053Taxes (other than income taxes). . . . . . . . . . . . . . . . . . . . . . . . . . . . . . . . . . . . . . . . . . . . . 465,836 420,500 408,924
Total operating expenses . . . . . . . . . . . . . . . . . . . . . . . . . . . . . . . . . . . . . . . . . . . . . . . . 9,738,005 9,067,367 8,305,540
Operating income . . . . . . . . . . . . . . . . . . . . . . . . . . . . . . . . . . . . . . . . . . . . . . . . . . . . . . . . 1,948,130 1,847,555 1,822,683
Other income, net . . . . . . . . . . . . . . . . . . . . . . . . . . . . . . . . . . . . . . . . . . . . . . . . . . . . . . . . . 5,296 2,972 6,175Equity earnings of unconsolidated subsidiaries . . . . . . . . . . . . . . . . . . . . . . . . . . . . . . . . . . 30,151 30,020 29,971Allowance for funds used during construction — equity. . . . . . . . . . . . . . . . . . . . . . . . . . . 89,750 87,683 62,840
Interest charges and financing costsInterest charges — includes other financing costs of $22,986,
$30,135 and $24,087, respectively . . . . . . . . . . . . . . . . . . . . . . . . . . . . . . . . . . . . . . . . . 566,608 575,199 601,552Allowance for funds used during construction — debt . . . . . . . . . . . . . . . . . . . . . . . . . . . (38,402) (39,179) (35,315)
Total interest charges and financing costs. . . . . . . . . . . . . . . . . . . . . . . . . . . . . . . . . . . 528,206 536,020 566,237
Income before income taxes . . . . . . . . . . . . . . . . . . . . . . . . . . . . . . . . . . . . . . . . . . . . . . . . 1,545,121 1,432,210 1,355,432Income taxes . . . . . . . . . . . . . . . . . . . . . . . . . . . . . . . . . . . . . . . . . . . . . . . . . . . . . . . . . . . . . 523,815 483,976 450,203Net income . . . . . . . . . . . . . . . . . . . . . . . . . . . . . . . . . . . . . . . . . . . . . . . . . . . . . . . . . . . . . . $ 1,021,306 $ 948,234 $ 905,229
Weighted average common shares outstanding:Basic . . . . . . . . . . . . . . . . . . . . . . . . . . . . . . . . . . . . . . . . . . . . . . . . . . . . . . . . . . . . . . . . . . 503,847 496,073 487,899Diluted . . . . . . . . . . . . . . . . . . . . . . . . . . . . . . . . . . . . . . . . . . . . . . . . . . . . . . . . . . . . . . . . 504,117 496,532 488,434
Earnings per average common share:Basic . . . . . . . . . . . . . . . . . . . . . . . . . . . . . . . . . . . . . . . . . . . . . . . . . . . . . . . . . . . . . . . . . . $ 2.03 $ 1.91 $ 1.86Diluted . . . . . . . . . . . . . . . . . . . . . . . . . . . . . . . . . . . . . . . . . . . . . . . . . . . . . . . . . . . . . . . . 2.03 1.91 1.85
Cash dividends declared per common share . . . . . . . . . . . . . . . . . . . . . . . . . . . . . . . . . . $ 1.20 $ 1.11 $ 1.07
See Notes to Consolidated Financial Statements
Schedule Q-3 Page 94 of 182
Sponsor: Robinson Case No. 15-00139-UT
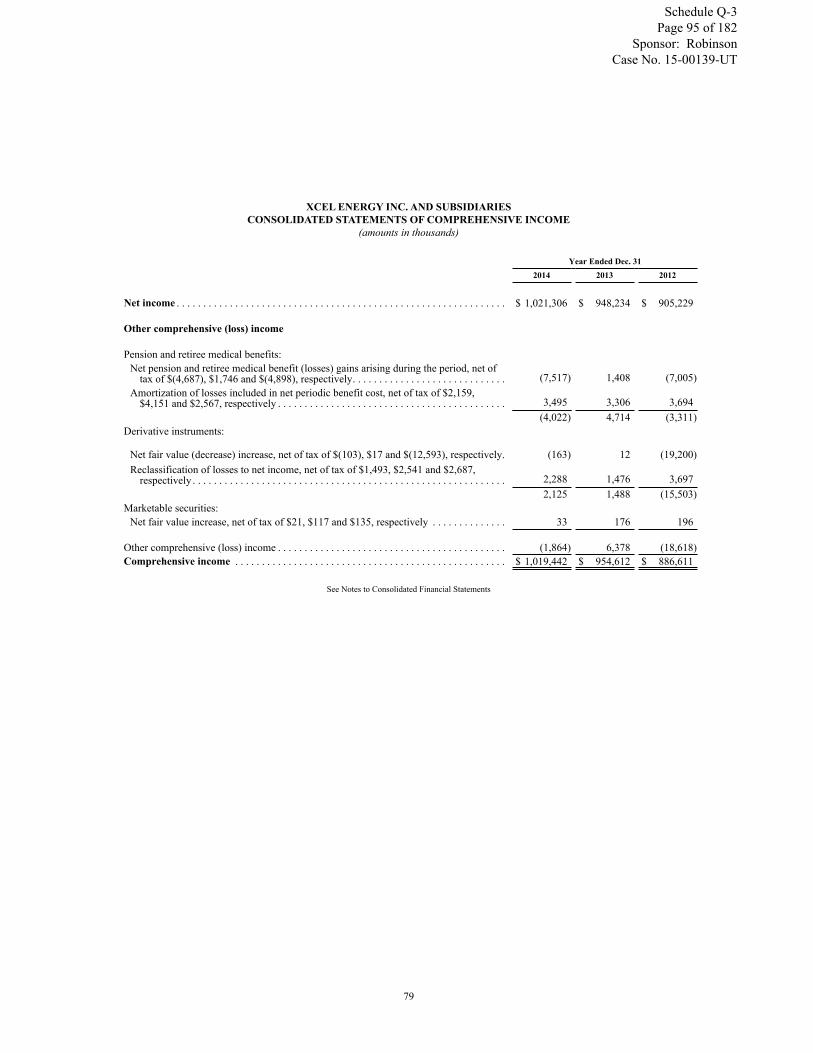
79
XCEL ENERGY INC. AND SUBSIDIARIESCONSOLIDATED STATEMENTS OF COMPREHENSIVE INCOME
(amounts in thousands)
Year Ended Dec. 312014 2013 2012
Net income . . . . . . . . . . . . . . . . . . . . . . . . . . . . . . . . . . . . . . . . . . . . . . . . . . . . . . . . . . . . . . $ 1,021,306 $ 948,234 $ 905,229
Other comprehensive (loss) income
Pension and retiree medical benefits:Net pension and retiree medical benefit (losses) gains arising during the period, net of
tax of $(4,687), $1,746 and $(4,898), respectively. . . . . . . . . . . . . . . . . . . . . . . . . . . . . (7,517) 1,408 (7,005)Amortization of losses included in net periodic benefit cost, net of tax of $2,159,
$4,151 and $2,567, respectively . . . . . . . . . . . . . . . . . . . . . . . . . . . . . . . . . . . . . . . . . . . 3,495 3,306 3,694(4,022) 4,714 (3,311)
Derivative instruments:
Net fair value (decrease) increase, net of tax of $(103), $17 and $(12,593), respectively. (163) 12 (19,200)Reclassification of losses to net income, net of tax of $1,493, $2,541 and $2,687,
respectively . . . . . . . . . . . . . . . . . . . . . . . . . . . . . . . . . . . . . . . . . . . . . . . . . . . . . . . . . . . 2,288 1,476 3,6972,125 1,488 (15,503)
Marketable securities:Net fair value increase, net of tax of $21, $117 and $135, respectively . . . . . . . . . . . . . . 33 176 196
Other comprehensive (loss) income . . . . . . . . . . . . . . . . . . . . . . . . . . . . . . . . . . . . . . . . . . . (1,864) 6,378 (18,618)Comprehensive income . . . . . . . . . . . . . . . . . . . . . . . . . . . . . . . . . . . . . . . . . . . . . . . . . . . $ 1,019,442 $ 954,612 $ 886,611
See Notes to Consolidated Financial Statements
Schedule Q-3 Page 95 of 182
Sponsor: Robinson Case No. 15-00139-UT

80
XCEL ENERGY INC. AND SUBSIDIARIESCONSOLIDATED STATEMENTS OF CASH FLOWS
(amounts in thousands)Year Ended Dec. 31
2014 2013 2012Operating activities
Net income. . . . . . . . . . . . . . . . . . . . . . . . . . . . . . . . . . . . . . . . . . . . . . . . . . . . . . . . . . . . . . . . . . . . . . . . . . . . . . . $ 1,021,306 $ 948,234 $ 905,229Adjustments to reconcile net income to cash provided by operating activities:
Depreciation and amortization. . . . . . . . . . . . . . . . . . . . . . . . . . . . . . . . . . . . . . . . . . . . . . . . . . . . . . . . . . . . . 1,036,515 1,001,843 943,702Conservation and demand side management program amortization . . . . . . . . . . . . . . . . . . . . . . . . . . . . . . . . 6,033 6,531 7,258Nuclear fuel amortization . . . . . . . . . . . . . . . . . . . . . . . . . . . . . . . . . . . . . . . . . . . . . . . . . . . . . . . . . . . . . . . . 114,542 98,089 102,651Deferred income taxes . . . . . . . . . . . . . . . . . . . . . . . . . . . . . . . . . . . . . . . . . . . . . . . . . . . . . . . . . . . . . . . . . . . 569,378 515,062 508,094Amortization of investment tax credits . . . . . . . . . . . . . . . . . . . . . . . . . . . . . . . . . . . . . . . . . . . . . . . . . . . . . . (5,543) (5,753) (6,610)Allowance for equity funds used during construction . . . . . . . . . . . . . . . . . . . . . . . . . . . . . . . . . . . . . . . . . . . (89,750) (87,683) (62,840)Equity earnings of unconsolidated subsidiaries. . . . . . . . . . . . . . . . . . . . . . . . . . . . . . . . . . . . . . . . . . . . . . . . (30,151) (30,020) (29,971)Dividends from unconsolidated subsidiaries . . . . . . . . . . . . . . . . . . . . . . . . . . . . . . . . . . . . . . . . . . . . . . . . . . 36,707 36,416 33,470Provision for bad debts . . . . . . . . . . . . . . . . . . . . . . . . . . . . . . . . . . . . . . . . . . . . . . . . . . . . . . . . . . . . . . . . . . 42,765 37,627 33,808Share-based compensation expense. . . . . . . . . . . . . . . . . . . . . . . . . . . . . . . . . . . . . . . . . . . . . . . . . . . . . . . . . 32,189 24,613 26,970Gain on sale of transmission assets . . . . . . . . . . . . . . . . . . . . . . . . . . . . . . . . . . . . . . . . . . . . . . . . . . . . . . . . . — (13,661) —Prairie Island EPU and SmartGridCity . . . . . . . . . . . . . . . . . . . . . . . . . . . . . . . . . . . . . . . . . . . . . . . . . . . . . . — — 20,766Net realized and unrealized hedging and derivative transactions . . . . . . . . . . . . . . . . . . . . . . . . . . . . . . . . . . 5,506 (4,704) (85,308)Changes in operating assets and liabilities:
Accounts receivable . . . . . . . . . . . . . . . . . . . . . . . . . . . . . . . . . . . . . . . . . . . . . . . . . . . . . . . . . . . . . . . . . . . (125,146) (108,911) (197,236)Accrued unbilled revenues . . . . . . . . . . . . . . . . . . . . . . . . . . . . . . . . . . . . . . . . . . . . . . . . . . . . . . . . . . . . . . (41,262) (23,867) 25,377Inventories. . . . . . . . . . . . . . . . . . . . . . . . . . . . . . . . . . . . . . . . . . . . . . . . . . . . . . . . . . . . . . . . . . . . . . . . . . . (20,558) (43,588) 82,658Other current assets. . . . . . . . . . . . . . . . . . . . . . . . . . . . . . . . . . . . . . . . . . . . . . . . . . . . . . . . . . . . . . . . . . . . (111,300) (18,071) (30,737)Accounts payable . . . . . . . . . . . . . . . . . . . . . . . . . . . . . . . . . . . . . . . . . . . . . . . . . . . . . . . . . . . . . . . . . . . . . (53,242) 132,441 (100,327)Net regulatory assets and liabilities . . . . . . . . . . . . . . . . . . . . . . . . . . . . . . . . . . . . . . . . . . . . . . . . . . . . . . . 195,823 141,325 5,866Other current liabilities . . . . . . . . . . . . . . . . . . . . . . . . . . . . . . . . . . . . . . . . . . . . . . . . . . . . . . . . . . . . . . . . . 137,147 126,555 42,914Pension and other employee benefit obligations . . . . . . . . . . . . . . . . . . . . . . . . . . . . . . . . . . . . . . . . . . . . . (101,457) (156,369) (183,922)
Change in other noncurrent assets . . . . . . . . . . . . . . . . . . . . . . . . . . . . . . . . . . . . . . . . . . . . . . . . . . . . . . . . . . 44,364 (9,998) (33,151)Change in other noncurrent liabilities . . . . . . . . . . . . . . . . . . . . . . . . . . . . . . . . . . . . . . . . . . . . . . . . . . . . . . . (15,674) 17,925 (3,905)
Net cash provided by operating activities. . . . . . . . . . . . . . . . . . . . . . . . . . . . . . . . . . . . . . . . . . . . . . . . . . . . . . . . . 2,648,192 2,584,036 2,004,756
Investing activitiesUtility capital/construction expenditures . . . . . . . . . . . . . . . . . . . . . . . . . . . . . . . . . . . . . . . . . . . . . . . . . . . . . . . . (3,199,791) (3,395,325) (2,570,209)Allowance for equity funds used during construction . . . . . . . . . . . . . . . . . . . . . . . . . . . . . . . . . . . . . . . . . . . . . . 89,750 87,683 62,840Proceeds from sale of transmission assets . . . . . . . . . . . . . . . . . . . . . . . . . . . . . . . . . . . . . . . . . . . . . . . . . . . . . . . — 37,118 —Proceeds from insurance recoveries. . . . . . . . . . . . . . . . . . . . . . . . . . . . . . . . . . . . . . . . . . . . . . . . . . . . . . . . . . . . 6,000 90,000 97,835Purchases of investments in external decommissioning fund . . . . . . . . . . . . . . . . . . . . . . . . . . . . . . . . . . . . . . . . (595,569) (1,481,881) (1,102,025)Proceeds from the sale of investments in external decommissioning fund . . . . . . . . . . . . . . . . . . . . . . . . . . . . . . 588,430 1,461,291 1,087,076Investment in WYCO Development LLC . . . . . . . . . . . . . . . . . . . . . . . . . . . . . . . . . . . . . . . . . . . . . . . . . . . . . . . (2,376) (7,504) (980)Change in restricted cash . . . . . . . . . . . . . . . . . . . . . . . . . . . . . . . . . . . . . . . . . . . . . . . . . . . . . . . . . . . . . . . . . . . . — — 95,287Other, net . . . . . . . . . . . . . . . . . . . . . . . . . . . . . . . . . . . . . . . . . . . . . . . . . . . . . . . . . . . . . . . . . . . . . . . . . . . . . . . . (3,695) (4,766) (2,766)
Net cash used in investing activities . . . . . . . . . . . . . . . . . . . . . . . . . . . . . . . . . . . . . . . . . . . . . . . . . . . . . . . . . . . . . (3,117,251) (3,213,384) (2,332,942)
Financing activitiesProceeds from short-term borrowings, net. . . . . . . . . . . . . . . . . . . . . . . . . . . . . . . . . . . . . . . . . . . . . . . . . . . . . . . 260,500 157,000 383,000Proceeds from issuance of long-term debt. . . . . . . . . . . . . . . . . . . . . . . . . . . . . . . . . . . . . . . . . . . . . . . . . . . . . . . 837,584 1,431,895 1,790,131Repayments of long-term debt, including reacquisition premiums. . . . . . . . . . . . . . . . . . . . . . . . . . . . . . . . . . . . (275,948) (652,451) (1,302,763)Proceeds from issuance of common stock . . . . . . . . . . . . . . . . . . . . . . . . . . . . . . . . . . . . . . . . . . . . . . . . . . . . . . . 180,798 231,767 8,050Repurchase of common stock . . . . . . . . . . . . . . . . . . . . . . . . . . . . . . . . . . . . . . . . . . . . . . . . . . . . . . . . . . . . . . . . — — (18,529)Purchase of common stock for settlement of equity awards . . . . . . . . . . . . . . . . . . . . . . . . . . . . . . . . . . . . . . . . . — — (23,307)Dividends paid . . . . . . . . . . . . . . . . . . . . . . . . . . . . . . . . . . . . . . . . . . . . . . . . . . . . . . . . . . . . . . . . . . . . . . . . . . . . (561,411) (514,042) (486,757)
Net cash provided by financing activities. . . . . . . . . . . . . . . . . . . . . . . . . . . . . . . . . . . . . . . . . . . . . . . . . . . . . . . . . 441,523 654,169 349,825
Net change in cash and cash equivalents . . . . . . . . . . . . . . . . . . . . . . . . . . . . . . . . . . . . . . . . . . . . . . . . . . . . . . . . . (27,536) 24,821 21,639Cash and cash equivalents at beginning of period . . . . . . . . . . . . . . . . . . . . . . . . . . . . . . . . . . . . . . . . . . . . . . . . . . 107,144 82,323 60,684Cash and cash equivalents at end of period . . . . . . . . . . . . . . . . . . . . . . . . . . . . . . . . . . . . . . . . . . . . . . . . . . . . . . . $ 79,608 $ 107,144 $ 82,323
Supplemental disclosure of cash flow information:Cash paid for interest (net of amounts capitalized) . . . . . . . . . . . . . . . . . . . . . . . . . . . . . . . . . . . . . . . . . . . . . . . . $ (512,602) $ (514,911) $ (563,517)Cash (paid) received for income taxes, net . . . . . . . . . . . . . . . . . . . . . . . . . . . . . . . . . . . . . . . . . . . . . . . . . . . . . . (4,542) 17,188 (9,570)
Supplemental disclosure of non-cash investing and financing transactions:Property, plant and equipment additions in accounts payable. . . . . . . . . . . . . . . . . . . . . . . . . . . . . . . . . . . . . . . . $ 417,473 $ 452,453 $ 289,802Issuance of common stock for reinvested dividends and 401(k) plans . . . . . . . . . . . . . . . . . . . . . . . . . . . . . . . . . 62,078 56,950 67,723
See Notes to Consolidated Financial Statements
Schedule Q-3 Page 96 of 182
Sponsor: Robinson Case No. 15-00139-UT

81
XCEL ENERGY INC. AND SUBSIDIARIESCONSOLIDATED BALANCE SHEETS
(amounts in thousands, except share and per share data)
Dec. 312014 2013
AssetsCurrent assets
Cash and cash equivalents . . . . . . . . . . . . . . . . . . . . . . . . . . . . . . . . . . . . . . . . . . . . . . . . . . . . . . . . . . . . . . . . . . . . . . . . . $ 79,608 $ 107,144Accounts receivable, net . . . . . . . . . . . . . . . . . . . . . . . . . . . . . . . . . . . . . . . . . . . . . . . . . . . . . . . . . . . . . . . . . . . . . . . . . . . 826,506 744,160Accrued unbilled revenues . . . . . . . . . . . . . . . . . . . . . . . . . . . . . . . . . . . . . . . . . . . . . . . . . . . . . . . . . . . . . . . . . . . . . . . . . 728,492 687,230Inventories. . . . . . . . . . . . . . . . . . . . . . . . . . . . . . . . . . . . . . . . . . . . . . . . . . . . . . . . . . . . . . . . . . . . . . . . . . . . . . . . . . . . . . 597,183 576,538Regulatory assets . . . . . . . . . . . . . . . . . . . . . . . . . . . . . . . . . . . . . . . . . . . . . . . . . . . . . . . . . . . . . . . . . . . . . . . . . . . . . . . . 444,058 417,801Derivative instruments . . . . . . . . . . . . . . . . . . . . . . . . . . . . . . . . . . . . . . . . . . . . . . . . . . . . . . . . . . . . . . . . . . . . . . . . . . . . 85,723 91,707Deferred income taxes . . . . . . . . . . . . . . . . . . . . . . . . . . . . . . . . . . . . . . . . . . . . . . . . . . . . . . . . . . . . . . . . . . . . . . . . . . . . 246,210 341,202Prepaid taxes . . . . . . . . . . . . . . . . . . . . . . . . . . . . . . . . . . . . . . . . . . . . . . . . . . . . . . . . . . . . . . . . . . . . . . . . . . . . . . . . . . . . 185,488 60,560Prepayments and other . . . . . . . . . . . . . . . . . . . . . . . . . . . . . . . . . . . . . . . . . . . . . . . . . . . . . . . . . . . . . . . . . . . . . . . . . . . . 171,112 191,698
Total current assets . . . . . . . . . . . . . . . . . . . . . . . . . . . . . . . . . . . . . . . . . . . . . . . . . . . . . . . . . . . . . . . . . . . . . . . . . . . . 3,364,380 3,218,040
Property, plant and equipment, net . . . . . . . . . . . . . . . . . . . . . . . . . . . . . . . . . . . . . . . . . . . . . . . . . . . . . . . . . . . . . . . . . . . . 28,756,916 26,122,159
Other assetsNuclear decommissioning fund and other investments . . . . . . . . . . . . . . . . . . . . . . . . . . . . . . . . . . . . . . . . . . . . . . . . . . . 1,832,640 1,755,990Regulatory assets . . . . . . . . . . . . . . . . . . . . . . . . . . . . . . . . . . . . . . . . . . . . . . . . . . . . . . . . . . . . . . . . . . . . . . . . . . . . . . . . 2,774,216 2,509,218Derivative instruments . . . . . . . . . . . . . . . . . . . . . . . . . . . . . . . . . . . . . . . . . . . . . . . . . . . . . . . . . . . . . . . . . . . . . . . . . . . . 53,775 84,842Other . . . . . . . . . . . . . . . . . . . . . . . . . . . . . . . . . . . . . . . . . . . . . . . . . . . . . . . . . . . . . . . . . . . . . . . . . . . . . . . . . . . . . . . . . . 175,957 217,241
Total other assets. . . . . . . . . . . . . . . . . . . . . . . . . . . . . . . . . . . . . . . . . . . . . . . . . . . . . . . . . . . . . . . . . . . . . . . . . . . . . . 4,836,588 4,567,291Total assets. . . . . . . . . . . . . . . . . . . . . . . . . . . . . . . . . . . . . . . . . . . . . . . . . . . . . . . . . . . . . . . . . . . . . . . . . . . . . . . . . $ 36,957,884 $ 33,907,490
Liabilities and EquityCurrent liabilities
Current portion of long-term debt. . . . . . . . . . . . . . . . . . . . . . . . . . . . . . . . . . . . . . . . . . . . . . . . . . . . . . . . . . . . . . . . . . . . $ 257,726 $ 280,763Short-term debt . . . . . . . . . . . . . . . . . . . . . . . . . . . . . . . . . . . . . . . . . . . . . . . . . . . . . . . . . . . . . . . . . . . . . . . . . . . . . . . . . . 1,019,500 759,000Accounts payable . . . . . . . . . . . . . . . . . . . . . . . . . . . . . . . . . . . . . . . . . . . . . . . . . . . . . . . . . . . . . . . . . . . . . . . . . . . . . . . . 1,173,006 1,261,238Regulatory liabilities. . . . . . . . . . . . . . . . . . . . . . . . . . . . . . . . . . . . . . . . . . . . . . . . . . . . . . . . . . . . . . . . . . . . . . . . . . . . . . 410,729 274,769Taxes accrued . . . . . . . . . . . . . . . . . . . . . . . . . . . . . . . . . . . . . . . . . . . . . . . . . . . . . . . . . . . . . . . . . . . . . . . . . . . . . . . . . . . 396,615 378,766Accrued interest . . . . . . . . . . . . . . . . . . . . . . . . . . . . . . . . . . . . . . . . . . . . . . . . . . . . . . . . . . . . . . . . . . . . . . . . . . . . . . . . . 158,536 159,372Dividends payable. . . . . . . . . . . . . . . . . . . . . . . . . . . . . . . . . . . . . . . . . . . . . . . . . . . . . . . . . . . . . . . . . . . . . . . . . . . . . . . . 151,720 139,432Derivative instruments . . . . . . . . . . . . . . . . . . . . . . . . . . . . . . . . . . . . . . . . . . . . . . . . . . . . . . . . . . . . . . . . . . . . . . . . . . . . 21,632 23,382Other . . . . . . . . . . . . . . . . . . . . . . . . . . . . . . . . . . . . . . . . . . . . . . . . . . . . . . . . . . . . . . . . . . . . . . . . . . . . . . . . . . . . . . . . . . 475,119 377,776
Total current liabilities . . . . . . . . . . . . . . . . . . . . . . . . . . . . . . . . . . . . . . . . . . . . . . . . . . . . . . . . . . . . . . . . . . . . . . . . . 4,064,583 3,654,498
Deferred credits and other liabilitiesDeferred income taxes . . . . . . . . . . . . . . . . . . . . . . . . . . . . . . . . . . . . . . . . . . . . . . . . . . . . . . . . . . . . . . . . . . . . . . . . . . . . 5,852,988 5,331,046Deferred investment tax credits . . . . . . . . . . . . . . . . . . . . . . . . . . . . . . . . . . . . . . . . . . . . . . . . . . . . . . . . . . . . . . . . . . . . . 73,696 79,239Regulatory liabilities. . . . . . . . . . . . . . . . . . . . . . . . . . . . . . . . . . . . . . . . . . . . . . . . . . . . . . . . . . . . . . . . . . . . . . . . . . . . . . 1,163,429 1,059,395Asset retirement obligations . . . . . . . . . . . . . . . . . . . . . . . . . . . . . . . . . . . . . . . . . . . . . . . . . . . . . . . . . . . . . . . . . . . . . . . . 2,446,631 1,815,390Derivative instruments . . . . . . . . . . . . . . . . . . . . . . . . . . . . . . . . . . . . . . . . . . . . . . . . . . . . . . . . . . . . . . . . . . . . . . . . . . . . 183,936 209,224Customer advances . . . . . . . . . . . . . . . . . . . . . . . . . . . . . . . . . . . . . . . . . . . . . . . . . . . . . . . . . . . . . . . . . . . . . . . . . . . . . . . 256,945 275,555Pension and employee benefit obligations . . . . . . . . . . . . . . . . . . . . . . . . . . . . . . . . . . . . . . . . . . . . . . . . . . . . . . . . . . . . . 936,907 769,222Other . . . . . . . . . . . . . . . . . . . . . . . . . . . . . . . . . . . . . . . . . . . . . . . . . . . . . . . . . . . . . . . . . . . . . . . . . . . . . . . . . . . . . . . . . . 264,653 237,217
Total deferred credits and other liabilities . . . . . . . . . . . . . . . . . . . . . . . . . . . . . . . . . . . . . . . . . . . . . . . . . . . . . . . . . . 11,179,185 9,776,288
Commitments and contingenciesCapitalization
Long-term debt . . . . . . . . . . . . . . . . . . . . . . . . . . . . . . . . . . . . . . . . . . . . . . . . . . . . . . . . . . . . . . . . . . . . . . . . . . . . . . . . . . 11,499,634 10,910,754Common stock — 1,000,000,000 shares authorized of $2.50 par value; 505,733,267 and 497,971,508 shares
outstanding at Dec. 31, 2014 and 2013, respectively. . . . . . . . . . . . . . . . . . . . . . . . . . . . . . . . . . . . . . . . . . . . . . . . . . . 1,264,333 1,244,929Additional paid in capital . . . . . . . . . . . . . . . . . . . . . . . . . . . . . . . . . . . . . . . . . . . . . . . . . . . . . . . . . . . . . . . . . . . . . . . . . . 5,837,330 5,619,313Retained earnings . . . . . . . . . . . . . . . . . . . . . . . . . . . . . . . . . . . . . . . . . . . . . . . . . . . . . . . . . . . . . . . . . . . . . . . . . . . . . . . . 3,220,958 2,807,983Accumulated other comprehensive loss . . . . . . . . . . . . . . . . . . . . . . . . . . . . . . . . . . . . . . . . . . . . . . . . . . . . . . . . . . . . . . . (108,139) (106,275)
Total common stockholders’ equity . . . . . . . . . . . . . . . . . . . . . . . . . . . . . . . . . . . . . . . . . . . . . . . . . . . . . . . . . . . . . . . 10,214,482 9,565,950Total liabilities and equity . . . . . . . . . . . . . . . . . . . . . . . . . . . . . . . . . . . . . . . . . . . . . . . . . . . . . . . . . . . . . . . . . . . . . $ 36,957,884 $ 33,907,490
See Notes to Consolidated Financial Statements
Schedule Q-3 Page 97 of 182
Sponsor: Robinson Case No. 15-00139-UT

82
XCEL ENERGY INC. AND SUBSIDIARIESCONSOLIDATED STATEMENTS OF COMMON STOCKHOLDERS’ EQUITY
(amounts in thousands)
Common Stock Issued Accumulated Other
Comprehensive Loss
Total CommonStockholders’
EquityShares Par Value
AdditionalPaid InCapital
RetainedEarnings
Balance at Dec. 31, 2011 . . . . . . . . . . . . . . . . 486,494 $ 1,216,234 $ 5,327,443 $ 2,032,556 $ (94,035) $ 8,482,198
Net income . . . . . . . . . . . . . . . . . . . . . . . . . . . 905,229 905,229Other comprehensive loss. . . . . . . . . . . . . . . . (18,618) (18,618)Dividends declared on common stock . . . . . . (523,969) (523,969)Issuances of common stock . . . . . . . . . . . . . . 2,166 5,415 28,219 33,634Repurchase of common stock. . . . . . . . . . . . . (700) (1,750) (16,779) (18,529)Purchase of common stock for settlement of
equity rewards . . . . . . . . . . . . . . . . . . . . . . . (23,307) (23,307)Share-based compensation . . . . . . . . . . . . . . . 37,439 37,439Balance at Dec. 31, 2012 . . . . . . . . . . . . . . . . 487,960 $ 1,219,899 $ 5,353,015 $ 2,413,816 $ (112,653) $ 8,874,077
Net income . . . . . . . . . . . . . . . . . . . . . . . . . . . 948,234 948,234Other comprehensive income . . . . . . . . . . . . . 6,378 6,378Dividends declared on common stock . . . . . . (554,067) (554,067)Issuances of common stock . . . . . . . . . . . . . . 10,012 25,030 237,671 262,701Share-based compensation . . . . . . . . . . . . . . . 28,627 28,627Balance at Dec. 31, 2013 . . . . . . . . . . . . . . . . 497,972 $ 1,244,929 $ 5,619,313 $ 2,807,983 $ (106,275) $ 9,565,950
Net income . . . . . . . . . . . . . . . . . . . . . . . . . . . 1,021,306 1,021,306Other comprehensive loss. . . . . . . . . . . . . . . . (1,864) (1,864)Dividends declared on common stock . . . . . . (608,331) (608,331)Issuances of common stock . . . . . . . . . . . . . . 7,761 19,404 185,145 204,549Share-based compensation . . . . . . . . . . . . . . . 32,872 32,872Balance at Dec. 31, 2014 . . . . . . . . . . . . . . . . 505,733 $ 1,264,333 $ 5,837,330 $ 3,220,958 $ (108,139) $ 10,214,482
See Notes to Consolidated Financial Statements
Schedule Q-3 Page 98 of 182
Sponsor: Robinson Case No. 15-00139-UT

83
XCEL ENERGY INC. AND SUBSIDIARIESCONSOLIDATED STATEMENTS OF CAPITALIZATION
(amounts in thousands, except share and per share data)Dec. 31
2014 2013Long-Term DebtNSP-MinnesotaFirst Mortgage Bonds, Series due:
Aug. 15, 2015, 1.95%. . . . . . . . . . . . . . . . . . . . . . . . . . . . . . . . . . . . . . . . . . . . . . . . . . . . . . . . . . . . . . . . . . . . . . . . . . $ 250,000 $ 250,000March 1, 2018, 5.25% . . . . . . . . . . . . . . . . . . . . . . . . . . . . . . . . . . . . . . . . . . . . . . . . . . . . . . . . . . . . . . . . . . . . . . . . . 500,000 500,000Aug. 15, 2022, 2.15%. . . . . . . . . . . . . . . . . . . . . . . . . . . . . . . . . . . . . . . . . . . . . . . . . . . . . . . . . . . . . . . . . . . . . . . . . . 300,000 300,000May 15, 2023, 2.6% . . . . . . . . . . . . . . . . . . . . . . . . . . . . . . . . . . . . . . . . . . . . . . . . . . . . . . . . . . . . . . . . . . . . . . . . . . . 400,000 400,000July 1, 2025, 7.125% . . . . . . . . . . . . . . . . . . . . . . . . . . . . . . . . . . . . . . . . . . . . . . . . . . . . . . . . . . . . . . . . . . . . . . . . . . 250,000 250,000March 1, 2028, 6.5% . . . . . . . . . . . . . . . . . . . . . . . . . . . . . . . . . . . . . . . . . . . . . . . . . . . . . . . . . . . . . . . . . . . . . . . . . . 150,000 150,000July 15, 2035, 5.25% . . . . . . . . . . . . . . . . . . . . . . . . . . . . . . . . . . . . . . . . . . . . . . . . . . . . . . . . . . . . . . . . . . . . . . . . . . 250,000 250,000June 1, 2036, 6.25% . . . . . . . . . . . . . . . . . . . . . . . . . . . . . . . . . . . . . . . . . . . . . . . . . . . . . . . . . . . . . . . . . . . . . . . . . . . 400,000 400,000July 1, 2037, 6.2% . . . . . . . . . . . . . . . . . . . . . . . . . . . . . . . . . . . . . . . . . . . . . . . . . . . . . . . . . . . . . . . . . . . . . . . . . . . . 350,000 350,000Nov. 1, 2039, 5.35%. . . . . . . . . . . . . . . . . . . . . . . . . . . . . . . . . . . . . . . . . . . . . . . . . . . . . . . . . . . . . . . . . . . . . . . . . . . 300,000 300,000Aug. 15, 2040, 4.85%. . . . . . . . . . . . . . . . . . . . . . . . . . . . . . . . . . . . . . . . . . . . . . . . . . . . . . . . . . . . . . . . . . . . . . . . . . 250,000 250,000Aug. 15, 2042, 3.4%. . . . . . . . . . . . . . . . . . . . . . . . . . . . . . . . . . . . . . . . . . . . . . . . . . . . . . . . . . . . . . . . . . . . . . . . . . . 500,000 500,000May 15, 2044, 4.125% . . . . . . . . . . . . . . . . . . . . . . . . . . . . . . . . . . . . . . . . . . . . . . . . . . . . . . . . . . . . . . . . . . . . . . . . . 300,000 —
Other . . . . . . . . . . . . . . . . . . . . . . . . . . . . . . . . . . . . . . . . . . . . . . . . . . . . . . . . . . . . . . . . . . . . . . . . . . . . . . . . . . . . . . . . 47 48Unamortized discount . . . . . . . . . . . . . . . . . . . . . . . . . . . . . . . . . . . . . . . . . . . . . . . . . . . . . . . . . . . . . . . . . . . . . . . . . . . (11,365) (11,316)
Total. . . . . . . . . . . . . . . . . . . . . . . . . . . . . . . . . . . . . . . . . . . . . . . . . . . . . . . . . . . . . . . . . . . . . . . . . . . . . . . . . . . . . 4,188,682 3,888,732Less current maturities . . . . . . . . . . . . . . . . . . . . . . . . . . . . . . . . . . . . . . . . . . . . . . . . . . . . . . . . . . . . . . . . . . . . . . . . . . 250,013 2
Total NSP-Minnesota long-term debt. . . . . . . . . . . . . . . . . . . . . . . . . . . . . . . . . . . . . . . . . . . . . . . . . . . . . . . . . . $ 3,938,669 $ 3,888,730
PSCoFirst Mortgage Bonds, Series due:
April 1, 2014, 5.5% . . . . . . . . . . . . . . . . . . . . . . . . . . . . . . . . . . . . . . . . . . . . . . . . . . . . . . . . . . . . . . . . . . . . . . . . . . . $ — $ 275,000Sept. 1, 2017, 4.375% (a) . . . . . . . . . . . . . . . . . . . . . . . . . . . . . . . . . . . . . . . . . . . . . . . . . . . . . . . . . . . . . . . . . . . . . . . . 129,500 129,500Aug. 1, 2018, 5.8%. . . . . . . . . . . . . . . . . . . . . . . . . . . . . . . . . . . . . . . . . . . . . . . . . . . . . . . . . . . . . . . . . . . . . . . . . . . . 300,000 300,000June 1, 2019, 5.125% . . . . . . . . . . . . . . . . . . . . . . . . . . . . . . . . . . . . . . . . . . . . . . . . . . . . . . . . . . . . . . . . . . . . . . . . . . 400,000 400,000Nov. 15, 2020, 3.2%. . . . . . . . . . . . . . . . . . . . . . . . . . . . . . . . . . . . . . . . . . . . . . . . . . . . . . . . . . . . . . . . . . . . . . . . . . . 400,000 400,000Sept. 15, 2022, 2.25%. . . . . . . . . . . . . . . . . . . . . . . . . . . . . . . . . . . . . . . . . . . . . . . . . . . . . . . . . . . . . . . . . . . . . . . . . . 300,000 300,000March 15, 2023, 2.5% . . . . . . . . . . . . . . . . . . . . . . . . . . . . . . . . . . . . . . . . . . . . . . . . . . . . . . . . . . . . . . . . . . . . . . . . . 250,000 250,000Sept. 1, 2037, 6.25%. . . . . . . . . . . . . . . . . . . . . . . . . . . . . . . . . . . . . . . . . . . . . . . . . . . . . . . . . . . . . . . . . . . . . . . . . . . 350,000 350,000Aug. 1, 2038, 6.5%. . . . . . . . . . . . . . . . . . . . . . . . . . . . . . . . . . . . . . . . . . . . . . . . . . . . . . . . . . . . . . . . . . . . . . . . . . . . 300,000 300,000Aug. 15, 2041, 4.75%. . . . . . . . . . . . . . . . . . . . . . . . . . . . . . . . . . . . . . . . . . . . . . . . . . . . . . . . . . . . . . . . . . . . . . . . . . 250,000 250,000Sept. 15, 2042, 3.6%. . . . . . . . . . . . . . . . . . . . . . . . . . . . . . . . . . . . . . . . . . . . . . . . . . . . . . . . . . . . . . . . . . . . . . . . . . . 500,000 500,000March 15, 2043, 3.95% . . . . . . . . . . . . . . . . . . . . . . . . . . . . . . . . . . . . . . . . . . . . . . . . . . . . . . . . . . . . . . . . . . . . . . . . 250,000 250,000March 15, 2044, 4.30% . . . . . . . . . . . . . . . . . . . . . . . . . . . . . . . . . . . . . . . . . . . . . . . . . . . . . . . . . . . . . . . . . . . . . . . . 300,000 —
Capital lease obligations, through 2060, 11.2% — 14.3% . . . . . . . . . . . . . . . . . . . . . . . . . . . . . . . . . . . . . . . . . . . . . . . 172,209 179,444Unamortized discount . . . . . . . . . . . . . . . . . . . . . . . . . . . . . . . . . . . . . . . . . . . . . . . . . . . . . . . . . . . . . . . . . . . . . . . . . . . (11,480) (11,301)
Total. . . . . . . . . . . . . . . . . . . . . . . . . . . . . . . . . . . . . . . . . . . . . . . . . . . . . . . . . . . . . . . . . . . . . . . . . . . . . . . . . . . . . 3,890,229 3,872,643Less current maturities . . . . . . . . . . . . . . . . . . . . . . . . . . . . . . . . . . . . . . . . . . . . . . . . . . . . . . . . . . . . . . . . . . . . . . . . . . 8,178 282,143
Total PSCo long-term debt . . . . . . . . . . . . . . . . . . . . . . . . . . . . . . . . . . . . . . . . . . . . . . . . . . . . . . . . . . . . . . . . . . $ 3,882,051 $ 3,590,500
SPSFirst Mortgage Bonds, Series due:
June 15, 2024, 3.3% . . . . . . . . . . . . . . . . . . . . . . . . . . . . . . . . . . . . . . . . . . . . . . . . . . . . . . . . . . . . . . . . . . . . . . . . . . . $ 150,000 $ —Aug. 15, 2041, 4.5%. . . . . . . . . . . . . . . . . . . . . . . . . . . . . . . . . . . . . . . . . . . . . . . . . . . . . . . . . . . . . . . . . . . . . . . . . . . 400,000 400,000
Unsecured Senior E Notes, due Oct. 1, 2016, 5.6% . . . . . . . . . . . . . . . . . . . . . . . . . . . . . . . . . . . . . . . . . . . . . . . . . . . . 200,000 200,000Unsecured Senior G Notes, due Dec. 1, 2018, 8.75%. . . . . . . . . . . . . . . . . . . . . . . . . . . . . . . . . . . . . . . . . . . . . . . . . . . 250,000 250,000Unsecured Senior C and D Notes, due Oct. 1, 2033, 6% . . . . . . . . . . . . . . . . . . . . . . . . . . . . . . . . . . . . . . . . . . . . . . . . 100,000 100,000Unsecured Senior F Notes, due Oct. 1, 2036, 6%. . . . . . . . . . . . . . . . . . . . . . . . . . . . . . . . . . . . . . . . . . . . . . . . . . . . . . 250,000 250,000Unamortized discount . . . . . . . . . . . . . . . . . . . . . . . . . . . . . . . . . . . . . . . . . . . . . . . . . . . . . . . . . . . . . . . . . . . . . . . . . . . (309) (135)
Total. . . . . . . . . . . . . . . . . . . . . . . . . . . . . . . . . . . . . . . . . . . . . . . . . . . . . . . . . . . . . . . . . . . . . . . . . . . . . . . . . . . . . 1,349,691 1,199,865Less current maturities . . . . . . . . . . . . . . . . . . . . . . . . . . . . . . . . . . . . . . . . . . . . . . . . . . . . . . . . . . . . . . . . . . . . . . . . . . — —
Total SPS long-term debt . . . . . . . . . . . . . . . . . . . . . . . . . . . . . . . . . . . . . . . . . . . . . . . . . . . . . . . . . . . . . . . . . . . $ 1,349,691 $ 1,199,865See Notes to Consolidated Financial Statements
Schedule Q-3 Page 99 of 182
Sponsor: Robinson Case No. 15-00139-UT

84
XCEL ENERGY INC. AND SUBSIDIARIESCONSOLIDATED STATEMENTS OF CAPITALIZATION — (Continued)
(amounts in thousands, except share and per share data)Dec. 31
2014 2013
NSP-WisconsinFirst Mortgage Bonds, Series due:
Oct. 1, 2018, 5.25% . . . . . . . . . . . . . . . . . . . . . . . . . . . . . . . . . . . . . . . . . . . . . . . . . . . . . . . . . . . . . . . . . . . . . . . . . . . $ 150,000 $ 150,000June 15, 2024, 3.3% . . . . . . . . . . . . . . . . . . . . . . . . . . . . . . . . . . . . . . . . . . . . . . . . . . . . . . . . . . . . . . . . . . . . . . . . . . . 100,000 —Sept. 1, 2038, 6.375%. . . . . . . . . . . . . . . . . . . . . . . . . . . . . . . . . . . . . . . . . . . . . . . . . . . . . . . . . . . . . . . . . . . . . . . . . . 200,000 200,000Oct. 1, 2042, 3.7% . . . . . . . . . . . . . . . . . . . . . . . . . . . . . . . . . . . . . . . . . . . . . . . . . . . . . . . . . . . . . . . . . . . . . . . . . . . . 100,000 100,000
City of La Crosse Resource Recovery Bond, Series due Nov. 1, 2021, 6% (b) . . . . . . . . . . . . . . . . . . . . . . . . . . . . . . . . 18,600 18,600Fort McCoy System Acquisition, due Oct. 15, 2030, 7%. . . . . . . . . . . . . . . . . . . . . . . . . . . . . . . . . . . . . . . . . . . . . . . . 523 558Other . . . . . . . . . . . . . . . . . . . . . . . . . . . . . . . . . . . . . . . . . . . . . . . . . . . . . . . . . . . . . . . . . . . . . . . . . . . . . . . . . . . . . . . . 1,687 1,760Unamortized discount . . . . . . . . . . . . . . . . . . . . . . . . . . . . . . . . . . . . . . . . . . . . . . . . . . . . . . . . . . . . . . . . . . . . . . . . . . . (2,519) (2,321)
Total. . . . . . . . . . . . . . . . . . . . . . . . . . . . . . . . . . . . . . . . . . . . . . . . . . . . . . . . . . . . . . . . . . . . . . . . . . . . . . . . . . . . . 568,291 468,597Less current maturities . . . . . . . . . . . . . . . . . . . . . . . . . . . . . . . . . . . . . . . . . . . . . . . . . . . . . . . . . . . . . . . . . . . . . . . . . . 1,235 107
Total NSP-Wisconsin long-term debt. . . . . . . . . . . . . . . . . . . . . . . . . . . . . . . . . . . . . . . . . . . . . . . . . . . . . . . . . . $ 567,056 $ 468,490
Other SubsidiariesVarious Eloigne Co. Affordable Housing Project Notes, due 2015-2052, 0% — 8% . . . . . . . . . . . . . . . . . . . . . . . . . . $ 32,037 $ 37,490
Total. . . . . . . . . . . . . . . . . . . . . . . . . . . . . . . . . . . . . . . . . . . . . . . . . . . . . . . . . . . . . . . . . . . . . . . . . . . . . . . . . . . . . 32,037 37,490Less current maturities . . . . . . . . . . . . . . . . . . . . . . . . . . . . . . . . . . . . . . . . . . . . . . . . . . . . . . . . . . . . . . . . . . . . . . . . . . 1,316 1,128
Total other subsidiaries long-term debt . . . . . . . . . . . . . . . . . . . . . . . . . . . . . . . . . . . . . . . . . . . . . . . . . . . . . . . . $ 30,721 $ 36,362
Xcel Energy Inc.Unsecured Senior Notes, Series due:
May 9, 2016, 0.75% . . . . . . . . . . . . . . . . . . . . . . . . . . . . . . . . . . . . . . . . . . . . . . . . . . . . . . . . . . . . . . . . . . . . . . . . . . . $ 450,000 $ 450,000April 1, 2017, 5.613% . . . . . . . . . . . . . . . . . . . . . . . . . . . . . . . . . . . . . . . . . . . . . . . . . . . . . . . . . . . . . . . . . . . . . . . . . 253,979 253,979May 15, 2020, 4.7% . . . . . . . . . . . . . . . . . . . . . . . . . . . . . . . . . . . . . . . . . . . . . . . . . . . . . . . . . . . . . . . . . . . . . . . . . . . 550,000 550,000July 1, 2036, 6.5% . . . . . . . . . . . . . . . . . . . . . . . . . . . . . . . . . . . . . . . . . . . . . . . . . . . . . . . . . . . . . . . . . . . . . . . . . . . . 300,000 300,000Sept. 15, 2041, 4.8%. . . . . . . . . . . . . . . . . . . . . . . . . . . . . . . . . . . . . . . . . . . . . . . . . . . . . . . . . . . . . . . . . . . . . . . . . . . 250,000 250,000
Elimination of PSCo capital lease obligation with affiliates. . . . . . . . . . . . . . . . . . . . . . . . . . . . . . . . . . . . . . . . . . . . . . (69,470) (72,087)Unamortized discount . . . . . . . . . . . . . . . . . . . . . . . . . . . . . . . . . . . . . . . . . . . . . . . . . . . . . . . . . . . . . . . . . . . . . . . . . . . (6,078) (7,702)
Total. . . . . . . . . . . . . . . . . . . . . . . . . . . . . . . . . . . . . . . . . . . . . . . . . . . . . . . . . . . . . . . . . . . . . . . . . . . . . . . . . . . . . 1,728,431 1,724,190Less current maturities (including elimination of PSCo capital lease obligation) . . . . . . . . . . . . . . . . . . . . . . . . . . . . . (3,015) (2,617)
Total Xcel Energy Inc. long-term debt. . . . . . . . . . . . . . . . . . . . . . . . . . . . . . . . . . . . . . . . . . . . . . . . . . . . . . . . . $ 1,731,446 $ 1,726,807Total long-term debt . . . . . . . . . . . . . . . . . . . . . . . . . . . . . . . . . . . . . . . . . . . . . . . . . . . . . . . . . . . . . . . . . . . . $ 11,499,634 $ 10,910,754
Common Stockholders’ EquityCommon stock — 1,000,000,000 shares authorized of $2.50 par value; 505,733,267 and 497,971,508 shares
outstanding at Dec. 31, 2014 and 2013, respectively . . . . . . . . . . . . . . . . . . . . . . . . . . . . . . . . . . . . . . . . . . . . . . . . . $ 1,264,333 $ 1,244,929Additional paid in capital . . . . . . . . . . . . . . . . . . . . . . . . . . . . . . . . . . . . . . . . . . . . . . . . . . . . . . . . . . . . . . . . . . . . . . . . 5,837,330 5,619,313Retained earnings . . . . . . . . . . . . . . . . . . . . . . . . . . . . . . . . . . . . . . . . . . . . . . . . . . . . . . . . . . . . . . . . . . . . . . . . . . . . . . 3,220,958 2,807,983Accumulated other comprehensive loss . . . . . . . . . . . . . . . . . . . . . . . . . . . . . . . . . . . . . . . . . . . . . . . . . . . . . . . . . . . . . (108,139) (106,275)
Total common stockholders’ equity . . . . . . . . . . . . . . . . . . . . . . . . . . . . . . . . . . . . . . . . . . . . . . . . . . . . . . . . . . . . $ 10,214,482 $ 9,565,950
(a) Pollution control financing.(b) Resource recovery financing.
See Notes to Consolidated Financial Statements
Schedule Q-3 Page 100 of 182
Sponsor: Robinson Case No. 15-00139-UT

85
XCEL ENERGY INC. AND SUBSIDIARIESNotes to Consolidated Financial Statements
1. Summary of Significant Accounting Policies
Business and System of Accounts — Xcel Energy Inc.’s utility subsidiaries are engaged in the regulated generation, purchase, transmission, distribution and sale of electricity and in the regulated purchase, transportation, distribution and sale of natural gas. Xcel Energy’s consolidated financial statements and disclosures are presented in accordance with GAAP. All of the utility subsidiaries’ underlying accounting records also conform to the FERC uniform system of accounts or to systems required by various state regulatory commissions, which are the same in all material respects.
Principles of Consolidation — In 2014, Xcel Energy’s operations included the activity of NSP-Minnesota, NSP-Wisconsin, PSCo and SPS. These utility subsidiaries serve electric and natural gas customers in portions of Colorado, Michigan, Minnesota, New Mexico, North Dakota, South Dakota, Texas and Wisconsin. Also included in Xcel Energy’s operations are WGI, an interstate natural gas pipeline company, and WYCO, a joint venture with CIG to develop and lease natural gas pipelines, storage and compression facilities.
Xcel Energy Inc.’s nonregulated subsidiary is Eloigne, which invests in rental housing projects that qualify for low-income housing tax credits. Xcel Energy Inc. owns the following additional direct subsidiaries, some of which are intermediate holding companies with additional subsidiaries: Xcel Energy Wholesale Group Inc., Xcel Energy Markets Holdings Inc., Xcel Energy Ventures Inc., Xcel Energy Retail Holdings Inc., Xcel Energy Communications Group, Inc., Xcel Energy International Inc., Xcel Energy Transmission Holding Company, LLC, and Xcel Energy Services Inc. Xcel Energy Inc. and its subsidiaries collectively are referred to as Xcel Energy.
Xcel Energy’s consolidated financial statements include its wholly-owned subsidiaries and variable interest entities for which it is the primary beneficiary. In the consolidation process, all intercompany transactions and balances are eliminated. Xcel Energy uses the equity method of accounting for its investment in WYCO. Xcel Energy’s equity earnings in WYCO are included on the consolidated statements of income as equity earnings of unconsolidated subsidiaries. Xcel Energy has investments in several plants and transmission facilities jointly owned with nonaffiliated utilities. Xcel Energy’s proportionate share of jointly owned facilities is recorded as property, plant and equipment on the consolidated balance sheets, and Xcel Energy’s proportionate share of the operating costs associated with these facilities is included in its consolidated statements of income. See Note 5 for further discussion of jointly owned generation, transmission, and gas facilities and related ownership percentages.
Xcel Energy evaluates its arrangements and contracts with other entities, including but not limited to, investments, PPAs and fuel contracts to determine if the other party is a variable interest entity, if Xcel Energy has a variable interest and if Xcel Energy is the primary beneficiary. Xcel Energy follows accounting guidance for variable interest entities which requires consideration of the activities that most significantly impact an entity’s financial performance and power to direct those activities, when determining whether Xcel Energy is a variable interest entity’s primary beneficiary. See Note 13 for further discussion of variable interest entities.
Use of Estimates — In recording transactions and balances resulting from business operations, Xcel Energy uses estimates based on the best information available. Estimates are used for such items as plant depreciable lives or potential disallowances, AROs, certain regulatory assets and liabilities, tax provisions, uncollectible amounts, environmental costs, unbilled revenues, jurisdictional fuel and energy cost allocations and actuarially determined benefit costs. The recorded estimates are revised when better information becomes available or when actual amounts can be determined. Those revisions can affect operating results.
Regulatory Accounting — Our regulated utility subsidiaries account for certain income and expense items in accordance with accounting guidance for regulated operations. Under this guidance:
• Certain costs, which would otherwise be charged to expense or OCI, are deferred as regulatory assets based on the expected ability to recover the costs in future rates; and
• Certain credits, which would otherwise be reflected as income, are deferred as regulatory liabilities based on the expectation the amounts will be returned to customers in future rates, or because the amounts were collected in rates prior to the costs being incurred.
Estimates of recovering deferred costs and returning deferred credits are based on specific ratemaking decisions or precedent for each item. Regulatory assets and liabilities are amortized consistent with the treatment in the rate setting process.
Schedule Q-3 Page 101 of 182
Sponsor: Robinson Case No. 15-00139-UT
86
If restructuring or other changes in the regulatory environment occur, regulated utility subsidiaries may no longer be eligible to apply this accounting treatment, and may be required to eliminate regulatory assets and liabilities from their balance sheets. Such changes could have a material effect on Xcel Energy’s financial condition, results of operations and cash flows. See Note 15 for further discussion of regulatory assets and liabilities.
Revenue Recognition — Revenues related to the sale of energy are generally recorded when service is rendered or energy is delivered to customers. However, the determination of the energy sales to individual customers is based on the reading of their meter, which occurs on a systematic basis throughout the month. At the end of each month, amounts of energy delivered to customers since the date of the last meter reading are estimated and the corresponding unbilled revenue is recognized. Xcel Energy presents its revenues net of any excise or other fiduciary-type taxes or fees.
NSP-Minnesota participates in MISO, and SPS participates in SPP. The revenues and charges from these RTOs related to serving retail and wholesale electric customers comprising the native load of the NSP-System and SPS are recorded on a net basis within cost of sales. Revenues and charges for short term wholesale sales of excess energy transacted through RTOs are recorded on a gross basis in electric revenues and cost of sales.
Xcel Energy Inc.’s utility subsidiaries have various rate-adjustment mechanisms in place that provide for the recovery of natural gas, electric fuel and purchased energy costs. These cost-adjustment tariffs may increase or decrease the level of revenue collected from customers and are revised periodically for differences between the total amount collected under the clauses and the costs incurred. When applicable, under governing regulatory commission rate orders, fuel cost over-recoveries (the excess of fuel revenue billed to customers over fuel costs incurred) are deferred as regulatory liabilities and under-recoveries (the excess of fuel costs incurred over fuel revenues billed to customers) are deferred as regulatory assets.
Conservation Programs — Xcel Energy Inc.’s utility subsidiaries have implemented programs in many of their retail jurisdictions to assist customers in conserving energy and reducing peak demand on the electric and natural gas systems. These programs include efficiency and redesign programs, as well as rebates for the purchase of items such as high efficiency lighting, air conditioner controls and energy-efficient heating and cooling appliances.
The costs incurred for DSM and CIP programs are deferred if it is probable future revenue will be provided to permit recovery of the incurred cost. Recorded revenues for incentive programs designed for recovery of lost margins and/or conservation performance incentives are limited to amounts expected to be collected within 24 months from the annual period in which they are earned.
For PSCo, SPS and NSP-Minnesota, DSM and CIP program costs are recovered through a combination of base rate revenue and rider mechanisms. The revenue billed to customers recovers incurred costs for conservation programs and also incentive amounts that are designed to encourage Xcel Energy’s achievement of energy conservation goals and compensate for related lost sales margin. For these utility subsidiaries, regulatory assets are recognized to reflect the amount of costs or earned incentives that have not yet been collected from customers. NSP-Wisconsin recovers approved conservation program costs in base rate revenue.
Property, Plant and Equipment and Depreciation — Property, plant and equipment is stated at original cost. The cost of plant includes direct labor and materials, contracted work, overhead costs and AFUDC. The cost of plant retired is charged to accumulated depreciation and amortization. Amounts recovered in rates for future removal costs are recorded as regulatory liabilities. Significant additions or improvements extending asset lives are capitalized, while repairs and maintenance costs are charged to expense as incurred. Maintenance and replacement of items determined to be less than a unit of property are charged to operating expenses as incurred. Planned major maintenance activities are charged to operating expense unless the cost represents the acquisition of an additional unit of property or the replacement of an existing unit of property. Property, plant and equipment also includes costs associated with property held for future use. The depreciable lives of certain plant assets are reviewed annually and revised, if appropriate. Property, plant and equipment that is required to be decommissioned early by a regulator is reclassified as plant to be retired.
Property, plant and equipment is tested for impairment when it is determined that the carrying value of the assets may not be recoverable. A loss is recognized in the current period if it becomes probable that part of a cost of a plant under construction or recently completed plant will be disallowed for recovery from customers and a reasonable estimate of the disallowance can be made. For investments in property, plant and equipment that are abandoned and not expected to go into service, incurred costs and related deferred tax amounts are compared to the discounted estimated future rate recovery, and a loss is recognized, if necessary.
Schedule Q-3 Page 102 of 182
Sponsor: Robinson Case No. 15-00139-UT
87
Xcel Energy records depreciation expense related to its plant using the straight-line method over the plant’s useful life. Actuarial life studies are performed and submitted to the state and federal commissions for review. Upon acceptance by the various commissions, the resulting lives and net salvage rates are used to calculate depreciation. Depreciation expense, expressed as a percentage of average depreciable property, was approximately 2.7, 2.9, and 2.8 percent for the years ended Dec. 31, 2014, 2013 and 2012, respectively.
Leases — Xcel Energy evaluates a variety of contracts for lease classification at inception, including PPAs and rental arrangements for office space, vehicles and equipment. Contracts determined to contain a lease because of per unit pricing that is other than fixed or market price, terms regarding the use of a particular asset, and other factors are evaluated further to determine if the arrangement is a capital lease. See Note 13 for further discussion of leases.
AFUDC — AFUDC represents the cost of capital used to finance utility construction activity. AFUDC is computed by applying a composite financing rate to qualified CWIP. The amount of AFUDC capitalized as a utility construction cost is credited to other nonoperating income (for equity capital) and interest charges (for debt capital). AFUDC amounts capitalized are included in Xcel Energy’s rate base for establishing utility service rates. In addition to construction-related amounts, cost of capital also is recorded to reflect returns on capital used to finance conservation programs in Minnesota.
Generally, AFUDC costs are recovered from customers as the related property is depreciated. However, in some cases commissions have approved a more current recovery of the cost of capital associated with large capital projects, resulting in a lower recognition of AFUDC. In other cases, some commissions have allowed an AFUDC calculation greater than the FERC-defined AFUDC rate, resulting in higher recognition of AFUDC.
AROs — Xcel Energy Inc.’s utility subsidiaries account for AROs under accounting guidance that requires a liability for the fair value of an ARO to be recognized in the period in which it is incurred if it can be reasonably estimated, with the offsetting associated asset retirement costs capitalized as a long-lived asset. The liability is generally increased over time by applying the effective interest method of accretion, and the capitalized costs are depreciated over the useful life of the long-lived asset. Changes resulting from revisions to the timing or amount of expected asset retirement cash flows are recognized as an increase or a decrease in the ARO. Xcel Energy Inc.’s utility subsidiaries also recover through rates certain future plant removal costs in addition to AROs. The accumulated removal costs for these obligations are reflected in the balance sheets as a regulatory liability. See Note 13 for further discussion of AROs.
Nuclear Decommissioning — Nuclear decommissioning studies estimate NSP-Minnesota’s ultimate costs of decommissioning its nuclear power plants and are performed at least every three years and submitted to the MPUC and other state commissions for approval. NSP-Minnesota filed its most recent triennial nuclear decommissioning studies with the MPUC in December 2014. These studies reflect NSP-Minnesota’s plans for prompt dismantlement of the Monticello and PI facilities. These studies assume that NSP-Minnesota will store spent fuel on site pending removal to a U.S. government facility.
For rate making purposes, NSP-Minnesota recovers the total decommissioning costs related to its nuclear power plants over each facility’s expected service life based on the triennial decommissioning studies filed with the MPUC and other state commissions. The studies consider estimated future costs of decommissioning and the market value of investments in trust funds, and recommend annual funding amounts. Amounts collected in rates are deposited in the trust funds. See Note 14 for further discussion of the approved nuclear decommissioning studies and funded amounts. For financial reporting purposes, NSP-Minnesota accounts for nuclear decommissioning as an ARO as described above.
Restricted funds for the payment of future decommissioning expenditures for NSP-Minnesota’s nuclear facilities are included in the nuclear decommissioning fund on the consolidated balance sheets. See Note 11 for further discussion of the nuclear decommissioning fund.
Nuclear Fuel Expense — Nuclear fuel expense, which is recorded as NSP-Minnesota’s nuclear generating plants use fuel, includes the cost of fuel used in the current period (including AFUDC), as well as future disposal costs of spent nuclear fuel and costs associated with the end-of-life fuel segments.
Nuclear Refueling Outage Costs — Xcel Energy uses a deferral and amortization method for nuclear refueling O&M costs. This method amortizes refueling outage costs over the period between refueling outages consistent with how the costs are recovered ratably in electric rates.
Schedule Q-3 Page 103 of 182
Sponsor: Robinson Case No. 15-00139-UT

88
Income Taxes — Xcel Energy accounts for income taxes using the asset and liability method, which requires the recognition of deferred tax assets and liabilities for the expected future tax consequences of events that have been included in the financial statements. Xcel Energy defers income taxes for all temporary differences between pretax financial and taxable income, and between the book and tax bases of assets and liabilities. Xcel Energy uses the tax rates that are scheduled to be in effect when the temporary differences are expected to reverse. The effect of a change in tax rates on deferred tax assets and liabilities is recognized in income in the period that includes the enactment date.
Deferred tax assets are reduced by a valuation allowance if it is more likely than not that some portion or all of the deferred tax asset will not be realized. In making such a determination, all available evidence is considered, including scheduled reversals of deferred tax liabilities, projected future taxable income, tax planning strategies and recent financial operations.
Due to the effects of past regulatory practices, when deferred taxes were not required to be recorded due to the use of flow through accounting for ratemaking purposes, the reversal of some temporary differences are accounted for as current income tax expense. Investment tax credits are deferred and their benefits amortized over the book depreciable lives of the related property. Utility rate regulation also has resulted in the recognition of certain regulatory assets and liabilities related to income taxes, which are summarized in Note 15.
Xcel Energy follows the applicable accounting guidance to measure and disclose uncertain tax positions that it has taken or expects to take in its income tax returns. Xcel Energy recognizes a tax position in its consolidated financial statements when it is more likely than not that the position will be sustained upon examination based on the technical merits of the position. Recognition of changes in uncertain tax positions are reflected as a component of income tax.
Xcel Energy reports interest and penalties related to income taxes within the other income and interest charges sections in the consolidated statements of income.
Xcel Energy Inc. and its subsidiaries file consolidated federal income tax returns as well as combined or separate state income tax returns. Federal income taxes paid by Xcel Energy Inc. are allocated to Xcel Energy Inc.’s subsidiaries based on separate company computations of tax. A similar allocation is made for state income taxes paid by Xcel Energy Inc. in connection with combined state filings. Xcel Energy Inc. also allocates its own income tax benefits to its direct subsidiaries based on the relative positive tax liabilities of the subsidiaries.
See Note 6 for further discussion of income taxes.
Types of and Accounting for Derivative Instruments — Xcel Energy uses derivative instruments in connection with its interest rate, utility commodity price, vehicle fuel price, and commodity trading activities, including forward contracts, futures, swaps and options. All derivative instruments not designated and qualifying for the normal purchases and normal sales exception, as defined by the accounting guidance for derivatives and hedging, are recorded on the consolidated balance sheets at fair value as derivative instruments. This includes certain instruments used to mitigate market risk for the utility operations including transmission in organized markets and all instruments related to the commodity trading operations. The classification of changes in fair value for those derivative instruments is dependent on the designation of a qualifying hedging relationship. Changes in fair value of derivative instruments not designated in a qualifying hedging relationship are reflected in current earnings or as a regulatory asset or liability. The classification as a regulatory asset or liability is based on commission approved regulatory recovery mechanisms.
Gains or losses on commodity trading transactions are recorded as a component of electric operating revenues; hedging transactions for vehicle fuel costs are recorded as a component of capital projects or O&M costs; and interest rate hedging transactions are recorded as a component of interest expense. Certain utility subsidiaries are allowed to recover in electric or natural gas rates the costs of certain financial instruments purchased to reduce commodity cost volatility. For further information on derivatives entered to mitigate commodity price risk on behalf of electric and natural gas customers, see Note 11.
Cash Flow Hedges — Certain qualifying hedging relationships are designated as a hedge of a forecasted transaction, or future cash flow (cash flow hedge). Changes in the fair value of a derivative designated as a cash flow hedge, to the extent effective, are included in OCI or deferred as a regulatory asset or liability based on recovery mechanisms until earnings are affected by the hedged transaction.
Normal Purchases and Normal Sales — Xcel Energy enters into contracts for the purchase and sale of commodities for use in its business operations. Derivatives and hedging accounting guidance requires a company to evaluate these contracts to determine whether the contracts are derivatives. Certain contracts that meet the definition of a derivative may be exempted from derivative accounting if designated as normal purchases or normal sales.
Schedule Q-3 Page 104 of 182
Sponsor: Robinson Case No. 15-00139-UT

89
Xcel Energy evaluates all of its contracts at inception to determine if they are derivatives and if they meet the normal purchases and normal sales designation requirements. None of the contracts entered into within the commodity trading operations qualify for a normal purchases and normal sales designation.
See Note 11 for further discussion of Xcel Energy’s risk management and derivative activities.
Commodity Trading Operations — All applicable gains and losses related to commodity trading activities, whether or not settled physically, are shown on a net basis in electric operating revenues in the consolidated statements of income.
Xcel Energy’s commodity trading operations are conducted by NSP-Minnesota, and PSCo. Commodity trading activities are not associated with energy produced from Xcel Energy’s generation assets or energy and capacity purchased to serve native load. Commodity trading contracts are recorded at fair market value and commodity trading results include the impact of all margin-sharing mechanisms. See Note 11 for further discussion.
Fair Value Measurements — Xcel Energy presents cash equivalents, interest rate derivatives, commodity derivatives and nuclear decommissioning fund assets at estimated fair values in its consolidated financial statements. Cash equivalents are recorded at cost plus accrued interest; money market funds are measured using quoted net asset values. For interest rate derivatives, quoted prices based primarily on observable market interest rate curves are used as a primary input to establish fair value. For commodity derivatives, the most observable inputs available are generally used to determine the fair value of each contract. In the absence of a quoted price for an identical contract in an active market, Xcel Energy may use quoted prices for similar contracts or internally prepared valuation models to determine fair value. For the nuclear decommissioning fund, published trading data and pricing models, generally using the most observable inputs available, are utilized to estimate fair value for each security. See Note 11 for further discussion.
Cash and Cash Equivalents — Xcel Energy considers investments in certain instruments, including commercial paper and money market funds, with a remaining maturity of 3 months or less at the time of purchase, to be cash equivalents.
Accounts Receivable and Allowance for Bad Debts — Accounts receivable are stated at the actual billed amount net of an allowance for bad debts. Xcel Energy establishes an allowance for uncollectible receivables based on a policy that reflects its expected exposure to the credit risk of customers.
Inventory — All inventory is recorded at average cost.
RECs — RECs are marketable environmental instruments that represent proof that energy was generated from eligible renewable energy sources. RECs are awarded upon delivery of the associated energy and can be bought and sold. RECs are typically used as a form of measurement of compliance to RPS enacted by those states that are encouraging construction and consumption from renewable energy sources, but can also be sold separately from the energy produced. Utility subsidiaries acquire RECs from the generation or purchase of renewable power.
When RECs are purchased or acquired in the course of generation they are recorded as inventory at cost. The cost of RECs that are utilized for compliance purposes is recorded as electric fuel and purchased power expense. As a result of state regulatory orders, Xcel Energy reduces recoverable fuel costs for the cost of certain RECs and records that cost as a regulatory asset when the amount is recoverable in future rates.
Sales of RECs that are purchased or acquired in the course of generation are recorded in electric utility operating revenues on a gross basis. The cost of these RECs, related transaction costs, and amounts credited to customers under margin-sharing mechanisms are recorded in electric fuel and purchased power expense. The sales of RECs for trading purposes are recorded in electric utility operating revenues, net of the cost of the RECs, transaction costs, and amounts credited to customers under margin-sharing mechanisms.
Emission Allowances — Emission allowances, including the annual SO2 and NOx emission allowance entitlement received from the EPA, are recorded at cost plus associated broker commission fees. Xcel Energy follows the inventory accounting model for all emission allowances. Sales of emission allowances are included in electric utility operating revenues and the operating activities section of the consolidated statements of cash flows.
Environmental Costs — Environmental costs are recorded when it is probable Xcel Energy is liable for remediation costs and the liability can be reasonably estimated. Costs are deferred as a regulatory asset if it is probable that the costs will be recovered from customers in future rates. Otherwise, the costs are expensed. If an environmental expense is related to facilities currently in use, such as emission-control equipment, the cost is capitalized and depreciated over the life of the plant.
Schedule Q-3 Page 105 of 182
Sponsor: Robinson Case No. 15-00139-UT

90
Estimated remediation costs, excluding inflationary increases, are recorded. The estimates are based on experience, an assessment of the current situation and the technology currently available for use in the remediation. The recorded costs are regularly adjusted as estimates are revised and remediation proceeds. If other participating PRPs exist and acknowledge their potential involvement with a site, costs are estimated and recorded only for Xcel Energy’s expected share of the cost. Any future costs of restoring sites where operation may extend indefinitely are treated as a capitalized cost of plant retirement. The depreciation expense levels recoverable in rates include a provision for removal expenses, which may include final remediation costs. Removal costs recovered in rates before the related costs are incurred are classified as a regulatory liability.
See Note 13 for further discussion of environmental costs.
Benefit Plans and Other Postretirement Benefits — Xcel Energy maintains pension and postretirement benefit plans for eligible employees. Recognizing the cost of providing benefits and measuring the projected benefit obligation of these plans under applicable accounting guidance requires management to make various assumptions and estimates.
Based on the regulatory recovery mechanisms of Xcel Energy Inc.’s utility subsidiaries, certain unrecognized actuarial gains and losses and unrecognized prior service costs or credits are recorded as regulatory assets and liabilities, rather than OCI.
See Note 9 for further discussion of benefit plans and other postretirement benefits.
Guarantees — Xcel Energy recognizes, upon issuance or modification of a guarantee, a liability for the fair market value of the obligation that has been assumed in issuing the guarantee. This liability includes consideration of specific triggering events and other conditions which may modify the ongoing obligation to perform under the guarantee.
The obligation recognized is reduced over the term of the guarantee as Xcel Energy is released from risk under the guarantee. See Note 13 for specific details of issued guarantees.
Reclassifications — Certain previously reported amounts have been reclassified to conform to the current year presentation.
Subsequent Events — Management has evaluated the impact of events occurring after Dec. 31, 2014 up to the date of issuance of these consolidated financial statements. These statements contain all necessary adjustments and disclosures resulting from that evaluation.
2. Accounting Pronouncements
Recently Issued
Revenue Recognition — In May 2014, the FASB issued Revenue from Contracts with Customers, Topic 606 (ASU No. 2014-09), which provides a framework for the recognition of revenue, with the objective that recognized revenues properly reflect amounts an entity is entitled to receive in exchange for goods and services. This guidance, which includes additional disclosure requirements regarding revenue, cash flows and obligations related to contracts with customers, will be effective for interim and annual reporting periods beginning after Dec. 15, 2016. Xcel Energy is currently evaluating the impact of adopting ASU 2014-09 on its consolidated financial statements.
3. Selected Balance Sheet Data
(Thousands of Dollars) Dec. 31, 2014 Dec. 31, 2013
Accounts receivable, netAccounts receivable . . . . . . . . . . . . . . . . . . . . . . . . . . . . . . . . . . . . . . . . . . . . . . . . . . . . . . . . . . $ 884,225 $ 797,267Less allowance for bad debts . . . . . . . . . . . . . . . . . . . . . . . . . . . . . . . . . . . . . . . . . . . . . . . . . . . (57,719) (53,107)
$ 826,506 $ 744,160
(Thousands of Dollars) Dec. 31, 2014 Dec. 31, 2013
InventoriesMaterials and supplies . . . . . . . . . . . . . . . . . . . . . . . . . . . . . . . . . . . . . . . . . . . . . . . . . . . . . . . . $ 244,099 $ 225,308Fuel . . . . . . . . . . . . . . . . . . . . . . . . . . . . . . . . . . . . . . . . . . . . . . . . . . . . . . . . . . . . . . . . . . . . . . . 183,249 189,485Natural gas . . . . . . . . . . . . . . . . . . . . . . . . . . . . . . . . . . . . . . . . . . . . . . . . . . . . . . . . . . . . . . . . . 169,835 161,745
$ 597,183 $ 576,538
Schedule Q-3 Page 106 of 182
Sponsor: Robinson Case No. 15-00139-UT

91
(Thousands of Dollars) Dec. 31, 2014 Dec. 31, 2013
Property, plant and equipment, netElectric plant. . . . . . . . . . . . . . . . . . . . . . . . . . . . . . . . . . . . . . . . . . . . . . . . . . . . . . . . . . . . . . . . $ 33,203,139 $ 30,341,310Natural gas plant . . . . . . . . . . . . . . . . . . . . . . . . . . . . . . . . . . . . . . . . . . . . . . . . . . . . . . . . . . . . . 4,643,452 4,086,651Common and other property. . . . . . . . . . . . . . . . . . . . . . . . . . . . . . . . . . . . . . . . . . . . . . . . . . . . 1,611,486 1,485,547Plant to be retired (a) . . . . . . . . . . . . . . . . . . . . . . . . . . . . . . . . . . . . . . . . . . . . . . . . . . . . . . . . . . 71,534 101,279CWIP . . . . . . . . . . . . . . . . . . . . . . . . . . . . . . . . . . . . . . . . . . . . . . . . . . . . . . . . . . . . . . . . . . . . . 2,005,531 2,371,566
Total property, plant and equipment . . . . . . . . . . . . . . . . . . . . . . . . . . . . . . . . . . . . . . . . . . . 41,535,142 38,386,353Less accumulated depreciation . . . . . . . . . . . . . . . . . . . . . . . . . . . . . . . . . . . . . . . . . . . . . . . . . . (13,168,418) (12,608,305)Nuclear fuel . . . . . . . . . . . . . . . . . . . . . . . . . . . . . . . . . . . . . . . . . . . . . . . . . . . . . . . . . . . . . . . . 2,347,422 2,186,799Less accumulated amortization. . . . . . . . . . . . . . . . . . . . . . . . . . . . . . . . . . . . . . . . . . . . . . . . . . (1,957,230) (1,842,688)
$ 28,756,916 $ 26,122,159
(a) As a result of the CPUC’s 2010 approval of PSCo’s CACJA compliance plan and the December 2013 approval of PSCo’s preferred plans for applicable generating resources, PSCo has received approval for early retirement of Cherokee Unit 3 and Valmont Unit 5 between 2015 and 2017. Amounts are presented net of accumulated depreciation.
4. Borrowings and Other Financing Instruments
Short-Term Borrowings
Money Pool — Xcel Energy Inc. and its utility subsidiaries have established a money pool arrangement that allows for short-term investments in and borrowings between the utility subsidiaries. NSP-Wisconsin does not participate in the money pool. Xcel Energy Inc. may make investments in the utility subsidiaries at market-based interest rates; however, the money pool arrangement does not allow the utility subsidiaries to make investments in Xcel Energy Inc. The money pool balances are eliminated in consolidation.
Commercial Paper — Xcel Energy Inc. and its utility subsidiaries meet their short-term liquidity requirements primarily through the issuance of commercial paper and borrowings under their credit facilities. Commercial paper outstanding for Xcel Energy was as follows:
(Amounts in Millions, Except Interest Rates)Three Months Ended
Dec. 31, 2014
Borrowing limit . . . . . . . . . . . . . . . . . . . . . . . . . . . . . . . . . . . . . . . . . . . . . . . . . . . . . . . . . . . . . . . . . . . . . . . . . . . . $ 2,750Amount outstanding at period end. . . . . . . . . . . . . . . . . . . . . . . . . . . . . . . . . . . . . . . . . . . . . . . . . . . . . . . . . . . . . . 1,020Average amount outstanding . . . . . . . . . . . . . . . . . . . . . . . . . . . . . . . . . . . . . . . . . . . . . . . . . . . . . . . . . . . . . . . . . . 802Maximum amount outstanding . . . . . . . . . . . . . . . . . . . . . . . . . . . . . . . . . . . . . . . . . . . . . . . . . . . . . . . . . . . . . . . . 1,021Weighted average interest rate, computed on a daily basis . . . . . . . . . . . . . . . . . . . . . . . . . . . . . . . . . . . . . . . . . . . 0.36%Weighted average interest rate at period end. . . . . . . . . . . . . . . . . . . . . . . . . . . . . . . . . . . . . . . . . . . . . . . . . . . . . . 0.56
Year Ended Dec. 31(Amounts in Millions, Except Interest Rates) 2014 2013 2012
Borrowing limit . . . . . . . . . . . . . . . . . . . . . . . . . . . . . . . . . . . . . . . . $ 2,750 $ 2,450 $ 2,450Amount outstanding at period end . . . . . . . . . . . . . . . . . . . . . . . . . . 1,020 759 602Average amount outstanding . . . . . . . . . . . . . . . . . . . . . . . . . . . . . . 841 481 403Maximum amount outstanding . . . . . . . . . . . . . . . . . . . . . . . . . . . . . 1,200 1,160 634Weighted average interest rate, computed on a daily basis . . . . . . . 0.33% 0.31% 0.35%Weighted average interest rate at end of period . . . . . . . . . . . . . . . . 0.56 0.25 0.36
Letters of Credit — Xcel Energy Inc. and its subsidiaries use letters of credit, generally with terms of one year, to provide financial guarantees for certain operating obligations. At Dec. 31, 2014 and 2013, there were $60.5 million and $47.8 million of letters of credit outstanding, respectively, under the credit facilities. The contract amounts of these letters of credit approximate their fair value and are subject to fees.
Schedule Q-3 Page 107 of 182
Sponsor: Robinson Case No. 15-00139-UT

92
Credit Facilities — In order to use their commercial paper programs to fulfill short-term funding needs, Xcel Energy Inc. and its utility subsidiaries must have revolving credit facilities in place at least equal to the amount of their respective commercial paper borrowing limits and cannot issue commercial paper in an aggregate amount exceeding available capacity under these credit facilities. The lines of credit provide short-term financing in the form of notes payable to banks, letters of credit and back-up support for commercial paper borrowings.
Amended Credit Agreements — In October 2014, Xcel Energy Inc., NSP-Minnesota, NSP-Wisconsin, PSCo and SPS entered into amended five-year credit agreements with a syndicate of banks. The amended credit agreements have substantially the same terms and conditions as the prior credit agreements with an extension of maturity from July 2017 to October 2019. In addition, the borrowing limit for Xcel Energy Inc. has been increased to $1 billion from $800 million and the borrowing limit for SPS has been increased to $400 million from $300 million. As a result, the total borrowing limit under the amended credit agreements increased to $2.75 billion from $2.45 billion.
NSP-Minnesota, PSCo, SPS, and Xcel Energy Inc. each have the right to request an extension of the revolving termination date for two additional one-year periods. NSP-Wisconsin has the right to request an extension of the revolving termination date for an additional one-year period. All extension requests are subject to majority bank group approval.
Features of the credit facilities include:
• Xcel Energy Inc. may increase its credit facility by up to $200 million, NSP-Minnesota and PSCo may each increase their credit facilities by $100 million and SPS may increase its credit facility by $50 million. The NSP-Wisconsin credit facility cannot be increased.
• Each credit facility has a financial covenant requiring that the debt-to-total capitalization ratio of each entity be less than or equal to 65 percent. Each entity was in compliance at Dec. 31, 2014 and 2013, respectively, as evidenced by the table below:
Debt-to-Total Capitalization Ratio2014 2013
Xcel Energy . . . . . . . . . . . . . . . . . . . . . . . . . . . . . . . . . . . . . . . . . . . . . . . . . . . . . . . . 56% 56%NSP-Wisconsin . . . . . . . . . . . . . . . . . . . . . . . . . . . . . . . . . . . . . . . . . . . . . . . . . . . . . 48 47NSP-Minnesota . . . . . . . . . . . . . . . . . . . . . . . . . . . . . . . . . . . . . . . . . . . . . . . . . . . . . 48 47SPS. . . . . . . . . . . . . . . . . . . . . . . . . . . . . . . . . . . . . . . . . . . . . . . . . . . . . . . . . . . . . . . 47 49PSCo . . . . . . . . . . . . . . . . . . . . . . . . . . . . . . . . . . . . . . . . . . . . . . . . . . . . . . . . . . . . . 47 45
• If Xcel Energy Inc. or any of its utility subsidiaries do not comply with the covenant, an event of default may be declared, and if not remedied, any outstanding amounts due under the facility can be declared due by the lender.
• The Xcel Energy Inc. credit facility has a cross-default provision that provides Xcel Energy Inc. will be in default on its borrowings under the facility if it or any of its subsidiaries, except NSP-Wisconsin as long as its total assets do not comprise more than 15 percent of Xcel Energy’s consolidated total assets, default on certain indebtedness in an aggregate principal amount exceeding $75 million.
• The interest rates under these lines of credit are based on Eurodollar borrowing margins ranging from 87.5 to 175 basis points per year based on the applicable long-term credit ratings.
• The commitment fees, also based on applicable long-term credit ratings, are calculated on the unused portion of the lines of credit at a range of 7.5 to 27.5 basis points per year.
At Dec. 31, 2014, Xcel Energy Inc. and its utility subsidiaries had the following committed credit facilities available:
(Millions of Dollars) Credit Facility (a) Drawn (b) Available
Xcel Energy Inc. . . . . . . . . . . . . . . . . . . . . . . . . . . . . . . . . . . . . . . . . . . . $ 1,000.0 $ 380.5 $ 619.5PSCo . . . . . . . . . . . . . . . . . . . . . . . . . . . . . . . . . . . . . . . . . . . . . . . . . . . . 700.0 388.4 311.6NSP-Minnesota. . . . . . . . . . . . . . . . . . . . . . . . . . . . . . . . . . . . . . . . . . . . 500.0 166.1 333.9SPS . . . . . . . . . . . . . . . . . . . . . . . . . . . . . . . . . . . . . . . . . . . . . . . . . . . . . 400.0 67.0 333.0NSP-Wisconsin. . . . . . . . . . . . . . . . . . . . . . . . . . . . . . . . . . . . . . . . . . . . 150.0 78.0 72.0
Total . . . . . . . . . . . . . . . . . . . . . . . . . . . . . . . . . . . . . . . . . . . . . . . . . . . $ 2,750.0 $ 1,080.0 $ 1,670.0(a) These credit facilities have been amended to extend the maturity to October 2019.(b) Includes outstanding commercial paper and letters of credit.
Schedule Q-3 Page 108 of 182
Sponsor: Robinson Case No. 15-00139-UT

93
All credit facility bank borrowings, outstanding letters of credit and outstanding commercial paper reduce the available capacity under the respective credit facilities. Xcel Energy Inc. and its subsidiaries had no direct advances on the credit facilities outstanding at Dec. 31, 2014 and 2013.
Long-Term Borrowings and Other Financing Instruments
Generally, all real and personal property of NSP-Minnesota, NSP-Wisconsin, PSCo and SPS are subject to the liens of their first mortgage indentures. Debt premiums, discounts and expenses are amortized over the life of the related debt. The premiums, discounts and expenses associated with refinanced debt are deferred and amortized over the life of the related new issuance, in accordance with regulatory guidelines.
Maturities of long-term debt are as follows:
(Millions of Dollars)
2015 . . . . . . . . . . . . . . . . . . . . . . . . . . . . . . . . . . . . . . . . . . . . . $ 2582016 . . . . . . . . . . . . . . . . . . . . . . . . . . . . . . . . . . . . . . . . . . . . . 6562017 . . . . . . . . . . . . . . . . . . . . . . . . . . . . . . . . . . . . . . . . . . . . . 3882018 . . . . . . . . . . . . . . . . . . . . . . . . . . . . . . . . . . . . . . . . . . . . . 1,2062019 . . . . . . . . . . . . . . . . . . . . . . . . . . . . . . . . . . . . . . . . . . . . . 406
During 2014, Xcel Energy Inc. and its utility subsidiaries completed the following financings:
• In March 2014, PSCo issued $300 million of 4.3 percent first mortgage bonds due March 15, 2044;• In May 2014, NSP-Minnesota issued $300 million of 4.125 percent first mortgage bonds due May 15, 2044;• In June 2014, SPS issued $150 million of 3.30 percent first mortgage bonds due June 15, 2024; and• In June 2014, NSP-Wisconsin issued $100 million of 3.30 percent first mortgage bonds due June 15, 2024.
In connection with SPS’ issuance of $150 million of 3.30 percent first mortgage bonds due June 15, 2024, SPS concurrently took certain actions to secure its previously issued Series G Senior Notes due Dec. 1, 2018 equally and ratably with SPS’ first mortgage bonds as required pursuant to the terms of the Series G notes.
To provide the required collateralization, SPS issued $250 million of collateral 8.75 percent first mortgage bonds due Dec. 1, 2018 to the trustee under its senior unsecured indenture which secured the previously issued Series G Senior Notes, 8.75 percent due Dec. 1, 2018, equally and ratably with SPS’ first mortgage bonds.
During 2013, Xcel Energy Inc. and its utility subsidiaries completed the following financings:
• In March 2013, PSCo issued $250 million of 2.50 percent first mortgage bonds due March 15, 2023 and $250 million of 3.95 percent first mortgage bonds due March 15, 2043.
• In May 2013, Xcel Energy Inc. issued $450 million of 0.75 percent senior unsecured notes due May 9, 2016.• In May 2013, NSP-Minnesota issued $400 million of 2.60 percent first mortgage bonds due May 15, 2023.• In August 2013, SPS issued $100 million of 4.50 percent first mortgage bonds due Aug. 15, 2041. Including the $300 million
of this series previously issued, total principal outstanding for this series is $400 million.
Issuances of Common Stock — Xcel Energy Inc. issued approximately 5.7 million shares of common stock through an at-the-market (ATM) program and received cash proceeds of $172.7 million net of $1.9 million in fees and commissions during the first six months of 2014. During the year ended Dec. 31, 2013, Xcel Energy Inc. issued approximately 7.7 million shares of common stock through this program and received cash proceeds of $222.7 million net of $2.7 million in fees and commissions. Xcel Energy completed its ATM program as of June 30, 2014. The proceeds from the issuances of common stock were used to repay short-term debt, infuse equity into the utility subsidiaries and for other general corporate purposes.
Debt Redemption — On May 31, 2013, Xcel Energy Inc. redeemed the entire $400 million principal amount of its 7.60 percent junior subordinated notes. Upon redemption, Xcel Energy Inc. recognized $6.3 million of related unamortized debt issuance costs as interest charges.
Deferred Financing Costs — Other assets included deferred financing costs of approximately $85 million and $83 million, net of amortization, at Dec. 31, 2014 and 2013, respectively. Xcel Energy is amortizing these financing costs over the remaining maturity periods of the related debt.
Schedule Q-3 Page 109 of 182
Sponsor: Robinson Case No. 15-00139-UT

94
Capital Stock — Xcel Energy Inc. has 7,000,000 shares of preferred stock authorized to be issued with a $100 par value. At Dec. 31, 2014 and 2013, there were no shares of preferred stock outstanding.
The charters of PSCo and SPS authorize each subsidiary to issue 10,000,000 shares of preferred stock with par values of $0.01 and $1.00 per share, respectively. At Dec. 31, 2014 and 2013, there were no preferred shares of subsidiaries outstanding.
Xcel Energy Inc. has 1,000,000,000 shares of common stock authorized to be issued with a $2.50 par value. Outstanding shares at Dec. 31, 2014 and 2013 were 505,733,267 and 497,971,508, respectively.
Dividend and Other Capital-Related Restrictions — Xcel Energy depends on its subsidiaries to pay dividends. All of Xcel Energy Inc.’s utility subsidiaries’ dividends are subject to the FERC’s jurisdiction under the Federal Power Act, which prohibits the payment of dividends out of capital accounts; payment of dividends is allowed out of retained earnings only. Due to certain restrictive covenants, Xcel Energy Inc. is required to be current on particular interest payments before dividends can be paid.
The most restrictive dividend limitations for NSP-Minnesota, NSP-Wisconsin and SPS are imposed by their respective state regulatory commission. PSCo’s dividends are subject to the FERC’s jurisdiction under the Federal Power Act, which prohibits the payment of dividends out of capital accounts; payment of dividends is allowed out of retained earnings only.
Only NSP-Minnesota has a first mortgage indenture which places certain restrictions on the amount of cash dividends it can pay to Xcel Energy Inc., the holder of its common stock. Even with this restriction, NSP-Minnesota could have paid more than $1.6 billion and $1.4 billion in additional cash dividends to Xcel Energy Inc. at Dec. 31, 2014 and 2013, respectively.
NSP-Minnesota’s state regulatory commissions indirectly limit the amount of dividends NSP-Minnesota can pay by requiring an equity-to-total capitalization ratio between 47.1 percent and 57.5 percent. NSP-Minnesota’s equity-to-total capitalization ratio was 52.1 percent at Dec. 31, 2014 and $848 million in retained earnings was not restricted. Total capitalization for NSP-Minnesota was $9.0 billion at Dec. 31, 2014, which did not exceed the limit of $9.5 billion.
NSP-Wisconsin cannot pay annual dividends in excess of approximately $33.3 million if its calendar year average equity-to-total capitalization ratio is or falls below the state commission authorized level of 52.5 percent, as calculated consistent with PSCW requirements. NSP-Wisconsin’s calendar year average equity-to-total capitalization ratio calculated on this basis was 52.8 percent at Dec. 31, 2014 and $8.3 million in retained earnings was not restricted.
SPS’ state regulatory commissions indirectly limit the amount of dividends that SPS can pay Xcel Energy Inc. by requiring an equity-to-total capitalization ratio (excluding short-term debt) between 45.0 percent and 55.0 percent. In addition, SPS may not pay a dividend that would cause it to lose its investment grade bond rating. SPS’ equity-to-total capitalization ratio (excluding short-term debt) was 53.6 percent at Dec. 31, 2014 and $396 million in retained earnings was not restricted.
The issuance of securities by Xcel Energy Inc. generally is not subject to regulatory approval. However, utility financings and certain intra-system financings are subject to the jurisdiction of the applicable state regulatory commissions and/or the FERC under the Federal Power Act. As of Dec. 31, 2014:
• PSCo has authorization to issue up to an additional $700 million of long-term debt and up to $800 million of short-term debt.• SPS has authorization to issue up to $500 million of short-term debt and plans to file for additional long-term authorization.• NSP-Wisconsin has authorization to issue up to $150 million of short-term debt and NSPW has filed for additional long-term
debt authorization.• NSP-Minnesota has authorization to issue long-term securities provided the equity-to-total capitalization ratio remains between
47.1 percent and 57.5 percent and to issue short-term debt provided it does not exceed 15 percent of total capitalization. Total capitalization for NSP-Minnesota cannot exceed $9.5 billion.
Xcel Energy believes these authorizations are adequate and seeks additional authorization as necessary.
Schedule Q-3 Page 110 of 182
Sponsor: Robinson Case No. 15-00139-UT

95
5. Joint Ownership of Generation, Transmission and Gas Facilities
Following are the investments by Xcel Energy Inc.’s utility subsidiaries in jointly owned generation, transmission and gas facilities and the related ownership percentages as of Dec. 31, 2014:
(Thousands of Dollars)Plant inService
AccumulatedDepreciation CWIP Ownership %
NSP-MinnesotaElectric Generation:
Sherco Unit 3 . . . . . . . . . . . . . . . . . . . . . . . . . . . . . . . . . . . . . . . . . $ 591,027 $ 376,322 $ 4,508 59.0%Sherco Common Facilities Units 1, 2 and 3 . . . . . . . . . . . . . . . . . 144,799 90,022 2 80.0Sherco Substation. . . . . . . . . . . . . . . . . . . . . . . . . . . . . . . . . . . . . . 4,790 2,978 — 59.0
Electric Transmission:Grand Meadow Line and Substation . . . . . . . . . . . . . . . . . . . . . . . 10,647 1,452 — 50.0CapX2020 Transmission . . . . . . . . . . . . . . . . . . . . . . . . . . . . . . . . 775,365 89,567 259,294 50.9
Total NSP-Minnesota . . . . . . . . . . . . . . . . . . . . . . . . . . . . . . . . $ 1,526,628 $ 560,341 $ 263,804
(Thousands of Dollars)Plant inService
AccumulatedDepreciation CWIP Ownership %
NSP-WisconsinElectric Transmission:
CapX2020 Transmission . . . . . . . . . . . . . . . . . . . . . . . . . . . . . . . . $ 26,434 $ 8,082 $ 103,940 80.7%La Crosse, Wis. to Madison, Wis. . . . . . . . . . . . . . . . . . . . . . . . . . — — 9,814 50.0
Total NSP-Wisconsin . . . . . . . . . . . . . . . . . . . . . . . . . . . . . . . . $ 26,434 $ 8,082 $ 113,754
(Thousands of Dollars)Plant inService
AccumulatedDepreciation CWIP Ownership %
PSCoElectric Generation:
Hayden Unit 1 . . . . . . . . . . . . . . . . . . . . . . . . . . . . . . . . . . . . . . . . $ 98,145 $ 66,333 $ 1,405 75.5%Hayden Unit 2 . . . . . . . . . . . . . . . . . . . . . . . . . . . . . . . . . . . . . . . . 121,571 59,999 8,867 37.4Hayden Common Facilities . . . . . . . . . . . . . . . . . . . . . . . . . . . . . . 37,049 16,928 135 53.1Craig Units 1 and 2 . . . . . . . . . . . . . . . . . . . . . . . . . . . . . . . . . . . . 59,860 35,573 3,013 9.7Craig Common Facilities 1, 2 and 3 . . . . . . . . . . . . . . . . . . . . . . . 36,890 17,735 527 6.5Comanche Unit 3 . . . . . . . . . . . . . . . . . . . . . . . . . . . . . . . . . . . . . . 883,971 81,748 64 66.7Comanche Common Facilities. . . . . . . . . . . . . . . . . . . . . . . . . . . . 23,624 1,051 308 82.0
Electric Transmission:Transmission and other facilities, including substations . . . . . . . . 151,301 60,847 1,730 Various
Gas Transportation:Rifle, Colo. to Avon, Colo. . . . . . . . . . . . . . . . . . . . . . . . . . . . . . . 16,278 5,594 — 60.0
Total PSCo . . . . . . . . . . . . . . . . . . . . . . . . . . . . . . . . . . . . . . . . $ 1,428,689 $ 345,808 $ 16,049
NSP-Minnesota and PSCo have approximately 500 MW and 820 MW of jointly owned generating capacity, respectively. Each Company’s share of operating expenses and construction expenditures are included in the applicable utility accounts. Each of the respective owners is responsible for providing its own financing.
6. Income Taxes
Tax Increase Prevention Act of 2014 — In 2014, the Tax Increase Prevention Act (TIPA) was signed into law. The TIPA provides for the following:
• The R&E credit was extended for 2014;• PTCs were extended for projects that began construction before the end of 2014 with certain projects qualifying into future
years; and• 50 percent bonus depreciation was extended one year through 2014. Additionally, some longer production period property
placed in service in 2015 is also eligible for 50 percent bonus depreciation.
Schedule Q-3 Page 111 of 182
Sponsor: Robinson Case No. 15-00139-UT
96
The accounting related to the TIPA was recorded beginning in the fourth quarter of 2014 because a change in tax law is accounted for in the period of enactment.
American Taxpayer Relief Act of 2012 — In 2013, the American Taxpayer Relief Act (ATRA) was signed into law. The ATRA provided for the following:
• The top tax rate for dividends increased from 15 percent to 20 percent. The 20 percent dividend rate is now consistent with the tax rates for capital gains;
• The R&E credit was extended for 2012 and 2013;• PTCs were extended for projects that began construction before the end of 2013 with certain projects qualifying into future
years; and• 50 percent bonus depreciation was extended one year through 2013. Additionally, some longer production period property
placed in service in 2014 is also eligible for 50 percent bonus depreciation.
The accounting related to the ATRA, including the provisions related to 2012, was recorded beginning in the first quarter of 2013 because a change in tax law is accounted for in the period of enactment.
Prescription drug tax benefit — In the third quarter of 2012, Xcel Energy implemented a tax strategy related to the allocation of funding of Xcel Energy’s retiree prescription drug plan. This strategy restored a portion of the tax benefit associated with federal subsidies for prescription drug plans that had been accrued since 2004 and was expensed in 2010. As a result, Xcel Energy recognized approximately $17 million of income tax benefit.
Medicare Part D — In March 2010, the Patient Protection and Affordable Care Act was signed into law. The law includes provisions to generate tax revenue to help offset the cost of the new legislation. One of these provisions reduces the deductibility of retiree health care costs to the extent of federal subsidies received by plan sponsors that provide retiree prescription drug benefits equivalent to Medicare Part D coverage, beginning in 2013. Xcel Energy expensed approximately $17 million of previously recognized tax benefits relating to the federal subsidies during the first quarter of 2010.
Federal Tax Loss Carryback Claims — In 2012, 2013 and 2014, Xcel Energy identified certain expenses related to 2009, 2010, 2011, 2013 and 2014 that qualify for an extended carryback beyond the typical two-year carryback period. As a result of a higher tax rate in prior years, Xcel Energy recognized a tax benefit of approximately $17 million in 2014, $12 million in 2013 and $15 million in 2012.
Federal Audit — Xcel Energy files a consolidated federal income tax return. The statute of limitations applicable to Xcel Energy’s 2008 federal income tax return expired in September 2012. The statute of limitations applicable to Xcel Energy’s 2009 federal income tax return expires in March 2016. In the third quarter of 2012, the IRS commenced an examination of tax years 2010 and 2011, including the 2009 carryback claim. As of Dec. 31, 2014, the IRS had proposed an adjustment to the federal tax loss carryback claims that would result in $12 million of income tax expense for the 2009 through 2011 claims, the recently filed 2013 claim, and the anticipated claim for 2014. At Dec. 31, 2014, the IRS has begun the Appeals process; however, the outcome and timing of a resolution is uncertain.
State Audits — Xcel Energy files consolidated state tax returns based on income in its major operating jurisdictions of Colorado, Minnesota, Texas, and Wisconsin, and various other state income-based tax returns. As of Dec. 31, 2014, Xcel Energy’s earliest open tax years that are subject to examination by state taxing authorities in its major operating jurisdictions were as follows:
State Year
Colorado. . . . . . . . . . . . . . . . . . . . . . . . . . . . . . . . . . . . . . . . . . 2009Minnesota. . . . . . . . . . . . . . . . . . . . . . . . . . . . . . . . . . . . . . . . . 2009Texas . . . . . . . . . . . . . . . . . . . . . . . . . . . . . . . . . . . . . . . . . . . . 2009Wisconsin. . . . . . . . . . . . . . . . . . . . . . . . . . . . . . . . . . . . . . . . . 2010
In the first quarter of 2014, the state of Wisconsin commenced an examination of tax years 2009 through 2011. No material adjustments were proposed for those tax years. As of Dec. 31, 2014, there were no state income tax audits in progress.
Schedule Q-3 Page 112 of 182
Sponsor: Robinson Case No. 15-00139-UT

97
Unrecognized Tax Benefits — The unrecognized tax benefit balance includes permanent tax positions, which if recognized would affect the annual ETR. In addition, the unrecognized tax benefit balance includes temporary tax positions for which the ultimate deductibility is highly certain but for which there is uncertainty about the timing of such deductibility. A change in the period of deductibility would not affect the ETR but would accelerate the payment of cash to the taxing authority to an earlier period.
A reconciliation of the amount of unrecognized tax benefit is as follows:
(Millions of Dollars) Dec. 31, 2014 Dec. 31, 2013
Unrecognized tax benefit — Permanent tax positions . . . . . . . . . . . . . . . . . . . . . . . . . . . . . . . . . . . . . . . . $ 16.2 $ 12.9Unrecognized tax benefit — Temporary tax positions . . . . . . . . . . . . . . . . . . . . . . . . . . . . . . . . . . . . . . . . 50.3 28.3
Total unrecognized tax benefit . . . . . . . . . . . . . . . . . . . . . . . . . . . . . . . . . . . . . . . . . . . . . . . . . . . . . . . . . $ 66.5 $ 41.2
A reconciliation of the beginning and ending amount of unrecognized tax benefit is as follows:
(Millions of Dollars) 2014 2013 2012
Balance at Jan. 1 . . . . . . . . . . . . . . . . . . . . . . . . . . . . . . . . . . . . . . . . . . . . . . . . . . . . . . . . . $ 41.2 $ 34.5 $ 34.7Additions based on tax positions related to the current year . . . . . . . . . . . . . . . . . . . . . . . . 28.7 15.1 5.2Reductions based on tax positions related to the current year . . . . . . . . . . . . . . . . . . . . . . . (2.0) (0.4) (5.7)Additions for tax positions of prior years . . . . . . . . . . . . . . . . . . . . . . . . . . . . . . . . . . . . . . 16.0 21.6 9.6Reductions for tax positions of prior years . . . . . . . . . . . . . . . . . . . . . . . . . . . . . . . . . . . . . (6.0) (4.8) (9.3)Settlements with taxing authorities . . . . . . . . . . . . . . . . . . . . . . . . . . . . . . . . . . . . . . . . . . . (9.6) (24.8) —Lapse of applicable statutes of limitations. . . . . . . . . . . . . . . . . . . . . . . . . . . . . . . . . . . . . . (1.8) — —Balance at Dec. 31 . . . . . . . . . . . . . . . . . . . . . . . . . . . . . . . . . . . . . . . . . . . . . . . . . . . . . . . . $ 66.5 $ 41.2 $ 34.5
The unrecognized tax benefit amounts were reduced by the tax benefits associated with NOL and tax credit carryforwards. The amounts of tax benefits associated with NOL and tax credit carryforwards are as follows:
(Millions of Dollars) Dec. 31, 2014 Dec. 31, 2013
NOL and tax credit carryforwards. . . . . . . . . . . . . . . . . . . . . . . . . . . . . . . . . . . . . . . . . . . . . . . . . . . . . . . . $ (28.5) $ (27.1)
It is reasonably possible that Xcel Energy’s amount of unrecognized tax benefits could significantly change in the next 12 months as the IRS Appeals process progresses and state audits resume. As the IRS Appeals process moves closer to completion and state audits resume, it is reasonably possible that the amount of unrecognized tax benefit could decrease up to approximately $10 million.
The payable for interest related to unrecognized tax benefits is partially offset by the interest benefit associated with NOL and tax credit carryforwards. The payables for interest related to unrecognized tax benefits at Dec. 31, 2014, 2013 and 2012 were not material. No amounts were accrued for penalties related to unrecognized tax benefits as of Dec. 31, 2014, 2013 or 2012.
Other Income Tax Matters — NOL amounts represent the amount of the tax loss that is carried forward and tax credits represent the deferred tax asset. NOL and tax credit carryforwards as of Dec. 31 were as follows:
(Millions of Dollars) 2014 2013
Federal NOL carryforward . . . . . . . . . . . . . . . . . . . . . . . . . . . . . . . . . . . . . . . . . . . . . . . . . . . . . . . . . . . . . $ 1,349 $ 1,311Federal tax credit carryforwards . . . . . . . . . . . . . . . . . . . . . . . . . . . . . . . . . . . . . . . . . . . . . . . . . . . . . . . . . 327 294State NOL carryforwards. . . . . . . . . . . . . . . . . . . . . . . . . . . . . . . . . . . . . . . . . . . . . . . . . . . . . . . . . . . . . . . 1,722 1,706Valuation allowances for state NOL carryforwards. . . . . . . . . . . . . . . . . . . . . . . . . . . . . . . . . . . . . . . . . . . (53) (51)State tax credit carryforwards, net of federal detriment (a) . . . . . . . . . . . . . . . . . . . . . . . . . . . . . . . . . . . . . 19 17
(a) State tax credit carryforwards are net of federal detriment of $10 million and $9 million as of Dec. 31, 2014 and 2013.
Schedule Q-3 Page 113 of 182
Sponsor: Robinson Case No. 15-00139-UT

98
The federal carryforward periods expire between 2021 and 2034. The state carryforward periods expire between 2016 and 2034.
Total income tax expense from operations differs from the amount computed by applying the statutory federal income tax rate to income before income tax expense. The following reconciles such differences for the years ending Dec. 31:
2014 2013 2012
Federal statutory rate. . . . . . . . . . . . . . . . . . . . . . . . . . . . . . . . . . . . . . . . . . . . . . . . . . . . . . . 35.0% 35.0% 35.0%Increases (decreases) in tax from:
Tax credits recognized, net of federal income tax expense . . . . . . . . . . . . . . . . . . . . . . . . (2.6) (2.6) (2.2)Regulatory differences — utility plant items . . . . . . . . . . . . . . . . . . . . . . . . . . . . . . . . . . . (1.3) (1.6) (1.0)NOL carryback . . . . . . . . . . . . . . . . . . . . . . . . . . . . . . . . . . . . . . . . . . . . . . . . . . . . . . . . . . (0.9) (0.8) (1.1)State income taxes, net of federal income tax benefit . . . . . . . . . . . . . . . . . . . . . . . . . . . . 4.0 4.1 4.0Change in unrecognized tax benefits . . . . . . . . . . . . . . . . . . . . . . . . . . . . . . . . . . . . . . . . . 0.2 0.6 —Prescription drug tax benefit and Medicare Part D . . . . . . . . . . . . . . . . . . . . . . . . . . . . . . — — (1.2)Other, net . . . . . . . . . . . . . . . . . . . . . . . . . . . . . . . . . . . . . . . . . . . . . . . . . . . . . . . . . . . . . . (0.5) (0.9) (0.3)
Effective income tax rate . . . . . . . . . . . . . . . . . . . . . . . . . . . . . . . . . . . . . . . . . . . . . . . . . . . 33.9% 33.8% 33.2%
The components of Xcel Energy’s income tax expense for the years ending Dec. 31 were:
(Thousands of Dollars) 2014 2013 2012
Current federal tax (benefit) expense . . . . . . . . . . . . . . . . . . . . . . . . . . . . . . . . . . . . . . . . . $ (73,160) $ (46,173) $ 7,876Current state tax expense. . . . . . . . . . . . . . . . . . . . . . . . . . . . . . . . . . . . . . . . . . . . . . . . . . . 9,225 7,678 31,478Current change in unrecognized tax expense (benefit) . . . . . . . . . . . . . . . . . . . . . . . . . . . . 23,915 13,162 (1,704)Deferred federal tax expense . . . . . . . . . . . . . . . . . . . . . . . . . . . . . . . . . . . . . . . . . . . . . . . . 505,236 439,085 366,409Deferred state tax expense. . . . . . . . . . . . . . . . . . . . . . . . . . . . . . . . . . . . . . . . . . . . . . . . . . 84,787 80,907 50,741Deferred change in unrecognized tax (benefit) expense . . . . . . . . . . . . . . . . . . . . . . . . . . . (20,645) (4,930) 2,013Deferred investment tax credits. . . . . . . . . . . . . . . . . . . . . . . . . . . . . . . . . . . . . . . . . . . . . . (5,543) (5,753) (6,610)
Total income tax expense . . . . . . . . . . . . . . . . . . . . . . . . . . . . . . . . . . . . . . . . . . . . . . . . . $ 523,815 $ 483,976 $ 450,203
The components of deferred income tax expense for the years ending Dec. 31 were:
(Thousands of Dollars) 2014 2013 2012
Deferred tax expense excluding items below . . . . . . . . . . . . . . . . . . . . . . . . . . . . . . . . . . . $ 616,934 $ 588,053 $ 559,860Amortization and adjustments to deferred income taxes on income tax regulatory assets
and liabilities . . . . . . . . . . . . . . . . . . . . . . . . . . . . . . . . . . . . . . . . . . . . . . . . . . . . . . . . . . (48,674) (64,420) (63,862)Tax benefit (expense) allocated to OCI. . . . . . . . . . . . . . . . . . . . . . . . . . . . . . . . . . . . . . . . 1,117 (8,572) 12,102Other . . . . . . . . . . . . . . . . . . . . . . . . . . . . . . . . . . . . . . . . . . . . . . . . . . . . . . . . . . . . . . . . . . 1 1 (6)
Deferred tax expense. . . . . . . . . . . . . . . . . . . . . . . . . . . . . . . . . . . . . . . . . . . . . . . . . . . . . $ 569,378 $ 515,062 $ 508,094
Schedule Q-3 Page 114 of 182
Sponsor: Robinson Case No. 15-00139-UT

99
The components of Xcel Energy’s net deferred tax liability (current and noncurrent) at Dec. 31 were as follows:
(Thousands of Dollars) 2014 2013
Deferred tax liabilities: Differences between book and tax bases of property . . . . . . . . . . . . . . . . . . . . . . . . . . . . . . . . . . . . . . . . $ 6,257,191 $ 5,562,446Regulatory assets . . . . . . . . . . . . . . . . . . . . . . . . . . . . . . . . . . . . . . . . . . . . . . . . . . . . . . . . . . . . . . . . . . . . 300,762 321,636Other . . . . . . . . . . . . . . . . . . . . . . . . . . . . . . . . . . . . . . . . . . . . . . . . . . . . . . . . . . . . . . . . . . . . . . . . . . . . . 300,251 254,639
Total deferred tax liabilities . . . . . . . . . . . . . . . . . . . . . . . . . . . . . . . . . . . . . . . . . . . . . . . . . . . . . . . . . $ 6,858,204 $ 6,138,721
Deferred tax assets: NOL carryforward . . . . . . . . . . . . . . . . . . . . . . . . . . . . . . . . . . . . . . . . . . . . . . . . . . . . . . . . . . . . . . . . . . . $ 552,274 $ 532,774Tax credit carryforward. . . . . . . . . . . . . . . . . . . . . . . . . . . . . . . . . . . . . . . . . . . . . . . . . . . . . . . . . . . . . . . 346,064 311,388Rate refund . . . . . . . . . . . . . . . . . . . . . . . . . . . . . . . . . . . . . . . . . . . . . . . . . . . . . . . . . . . . . . . . . . . . . . . . 93,956 49,804Unbilled revenue - fuel costs . . . . . . . . . . . . . . . . . . . . . . . . . . . . . . . . . . . . . . . . . . . . . . . . . . . . . . . . . . . 55,021 58,908Regulatory liabilities . . . . . . . . . . . . . . . . . . . . . . . . . . . . . . . . . . . . . . . . . . . . . . . . . . . . . . . . . . . . . . . . . 49,712 40,947Environmental remediation . . . . . . . . . . . . . . . . . . . . . . . . . . . . . . . . . . . . . . . . . . . . . . . . . . . . . . . . . . . . 42,716 42,886Deferred investment tax credits. . . . . . . . . . . . . . . . . . . . . . . . . . . . . . . . . . . . . . . . . . . . . . . . . . . . . . . . . 31,886 34,231NOL and tax credit valuation allowances . . . . . . . . . . . . . . . . . . . . . . . . . . . . . . . . . . . . . . . . . . . . . . . . . (3,402) (3,263)Other . . . . . . . . . . . . . . . . . . . . . . . . . . . . . . . . . . . . . . . . . . . . . . . . . . . . . . . . . . . . . . . . . . . . . . . . . . . . . 83,199 81,202
Total deferred tax assets . . . . . . . . . . . . . . . . . . . . . . . . . . . . . . . . . . . . . . . . . . . . . . . . . . . . . . . . . . . . $ 1,251,426 $ 1,148,877Net deferred tax liability . . . . . . . . . . . . . . . . . . . . . . . . . . . . . . . . . . . . . . . . . . . . . . . . . . . . . . . . . . . . . . . $ 5,606,778 $ 4,989,844
7. Earnings Per Share
Basic EPS was computed by dividing the earnings available to Xcel Energy Inc.’s common shareholders by the weighted average number of common shares outstanding during the period. Diluted EPS was computed by dividing the earnings available to Xcel Energy Inc.’s common shareholders by the diluted weighted average number of common shares outstanding during the period. Diluted EPS reflects the potential dilution that could occur if securities or other agreements to issue common stock (i.e., common stock equivalents) were settled. The weighted average number of potentially dilutive shares outstanding used to calculate Xcel Energy Inc.’s diluted EPS is calculated using the treasury stock method.
Common Stock Equivalents — Xcel Energy Inc. currently has common stock equivalents related to certain equity awards in share-based compensation arrangements.
Common stock equivalents causing a dilutive impact to EPS include commitments to issue common stock related to time based equity compensation awards and time based employer matching contributions to certain 401(k) plan participants. In October 2013, Xcel Energy determined that it would settle 401(k) employer matching contributions in cash instead of common stock going forward for substantially all of its employees. Share-based compensation accounting for the impacted employee groups ceased in October 2013, and corresponding expense amounts recorded to equity were reclassified to a liability for expected cash settlements.
Stock equivalent units granted to Xcel Energy Inc.’s Board of Directors are included in common shares outstanding upon grant date as there is no further service, performance or market condition associated with these awards. Restricted stock, granted to settle amounts due to certain employees under the Xcel Energy Inc. Executive Annual Incentive Award Plan, is included in common shares outstanding when granted.
Share-based compensation arrangements for which there is currently no dilutive impact to EPS include the following:
• Equity awards subject to a performance condition; included in common shares outstanding when all necessary conditions for settlement have been satisfied by the end of the reporting period.
• Liability awards subject to a performance condition; any portions settled in shares are included in common shares outstanding upon settlement.
Schedule Q-3 Page 115 of 182
Sponsor: Robinson Case No. 15-00139-UT

100
The dilutive impact of common stock equivalents affecting EPS was as follows:
2014 2013 2012
(Amounts in thousands, exceptper share data) Income Shares
PerShare
Amount Income Shares
PerShare
Amount Income Shares
PerShare
Amount
Net income . . . . . . . . . . . . . . . . . . . $ 1,021,306 $ 948,234 $ 905,229Basic EPS:Earnings available to commonshareholders . . . . . . . . . . . . . . . . . . 1,021,306 503,847 $ 2.03 948,234 496,073 $ 1.91 905,229 487,899 $ 1.86Effect of dilutive securities:
Equity awards. . . . . . . . . . . . . . . . — 270 — 459 — 535Diluted EPS:Earnings available to commonshareholders . . . . . . . . . . . . . . . . . . $ 1,021,306 504,117 $ 2.03 $ 948,234 496,532 $ 1.91 $ 905,229 488,434 $ 1.85
Share Repurchase — In February 2012, Xcel Energy Inc.’s Board of Directors approved the repurchase of up to 0.7 million shares of common stock for the issuance of shares in connection with the vesting of awards under the Xcel Energy Inc. 2005 Long-Term Incentive Plan. In March 2012, Xcel Energy Inc. repurchased the approved 0.7 million shares in the open market at an average price of $26.42 per share. In addition, approximately 0.9 million shares of common stock were purchased in February 2012 through an agent independent of Xcel Energy to fulfill requirements for the employer match pursuant to the Xcel Energy 401(k) Savings Plan; the NCE Employees’ Savings and Stock Ownership Plan for Bargaining Unit Employees and Former Non-Bargaining Unit Employees; and the NCE Employee Investment Plan for Bargaining Unit Employees and Non-Bargaining Employees.
8. Share-Based Compensation
Restricted Stock — Certain employees may elect to receive shares of common or restricted stock under the Xcel Energy Inc. Executive Annual Incentive Award Plan. Restricted stock is treated as an equity award and vests and settles in equal annual installments over a three-year period. Xcel Energy Inc. reinvests dividends on the restricted stock while restrictions are in place. Restrictions also apply to the additional shares of restricted stock acquired through dividend reinvestment. If the restricted shares are forfeited, the employee is not entitled to the dividends on those shares. Restricted stock has a fair value equal to the market trading price of Xcel Energy Inc.’s stock at the grant date.
Xcel Energy Inc. granted shares of restricted stock for the years ended Dec. 31 as follows:
(Shares in Thousands) 2014 2013 2012
Granted shares . . . . . . . . . . . . . . . . . . . . . . . . . . . . . . . . . . . . . . . . . . . . . . . . . . . . . . . . . . . 46 33 33Grant date fair value . . . . . . . . . . . . . . . . . . . . . . . . . . . . . . . . . . . . . . . . . . . . . . . . . . . . . . $ 29.69 $ 28.30 $ 26.43
A summary of the changes of nonvested restricted stock for the year ended 2014 were as follows:
(Shares in Thousands) SharesWeighted Average
Grant Date Fair Value
Nonvested restricted stock at Jan. 1, 2014 . . . . . . . . . . . . . . . . . . . . . . . . . . . . . . . . . . . . . . . . . . . 62 $ 27.33Granted . . . . . . . . . . . . . . . . . . . . . . . . . . . . . . . . . . . . . . . . . . . . . . . . . . . . . . . . . . . . . . . . . . . . . . 46 29.69Vested . . . . . . . . . . . . . . . . . . . . . . . . . . . . . . . . . . . . . . . . . . . . . . . . . . . . . . . . . . . . . . . . . . . . . . . (29) 26.67Dividend equivalents . . . . . . . . . . . . . . . . . . . . . . . . . . . . . . . . . . . . . . . . . . . . . . . . . . . . . . . . . . . . 3 30.94Nonvested restricted stock at Dec. 31, 2014 . . . . . . . . . . . . . . . . . . . . . . . . . . . . . . . . . . . . . . . . . . 82 29.00
Other Equity Awards — Xcel Energy Inc.’s Board of Directors has granted equity awards under the Xcel Energy Inc. 2005 Long-Term Incentive Plan (as amended and restated in 2010). The plan allows the attachment of various vesting conditions and performance goals to the awards granted. The vesting conditions and performance goals may vary by plan year. At the end of the restricted period, such grants will be awarded if the vesting conditions and/or performance goals are met.
Commencing in 2014, certain employees were granted bundled equity awards with one portion of shares subject only to service conditions, and the other portion subject to performance conditions. Inclusive of other grants of time-based shares, a total of 0.4 million and 0.2 million time-based equity shares subject only to service conditions were granted in 2014 and 2013, respectively. Other than shares associated with these time-based awards, restricted stock and certain 401(k) employer match settlements, payout of all other employee equity awards and the lapsing of restrictions on the transfer of units are based on the achievement of performance criteria.
Schedule Q-3 Page 116 of 182
Sponsor: Robinson Case No. 15-00139-UT

101
The performance conditions for a portion of the units awarded in 2014 are based on relative TSR, measured identically to TSR liability awards granted in 2014, and measurement of performance for a portion of units awarded from 2011 to 2013 is based on EPS growth with an additional condition that Xcel Energy Inc.’s annual dividend paid on its common stock remains at a specified amount per share or greater. The performance conditions for the remaining employee equity awards are based on environmental goals. Equity awards with performance conditions awarded 2011 to 2014, plus associated dividend equivalents, will be settled or forfeited and the restricted period will lapse after three years, with potential payouts ranging from zero to 150 percent for 2011 to 2013 grants, and zero to 200 percent for 2014 grants, depending on the level of achievement.
• The 2010 awards measured on EPS growth met their targets as of Dec. 31, 2011, and were settled in shares in February 2012. • The 2010 environmental awards met their targets as of Dec. 31, 2012 and were settled in shares in February 2013. • The 2011 awards measured on EPS growth and the 2011 environmental awards met their targets as of Dec. 31, 2013 and were
settled in shares in February 2014. • The 2012 awards measured on EPS growth and the 2012 environmental awards met their targets as of Dec. 31, 2014, and will
be settled in shares in February 2015.
Equity award units granted to employees, excluding restricted stock and applicable 401(k) employer match settlements, for the years ended Dec. 31 were as follows:
(Units in Thousands) 2014 2013 2012
Granted units . . . . . . . . . . . . . . . . . . . . . . . . . . . . . . . . . . . . . . . . . . . . . . . . . . . . . . . . . . . . 588 774 591Weighted average grant date fair value . . . . . . . . . . . . . . . . . . . . . . . . . . . . . . . . . . . . . . . . $ 29.90 $ 27.65 $ 27.35
Approximately 0.5 million of these units vested during 2014 at a total fair value of $19.6 million. Approximately 0.6 million of these units vested during 2013 at a total fair value of $16.8 million. Approximately 0.1 million of these units vested during 2012 at a total fair value of $1.2 million.
A summary of the changes in the nonvested portion of these equity award units for the year ended 2014, were as follows:
(Units in Thousands) UnitsWeighted Average
Grant Date Fair Value
Nonvested Units at Jan. 1, 2014 . . . . . . . . . . . . . . . . . . . . . . . . . . . . . . . . . . . . . . . . . . . . . . . . . . . 1,312 $ 27.53Granted . . . . . . . . . . . . . . . . . . . . . . . . . . . . . . . . . . . . . . . . . . . . . . . . . . . . . . . . . . . . . . . . . . . . . . 588 29.90Forfeited . . . . . . . . . . . . . . . . . . . . . . . . . . . . . . . . . . . . . . . . . . . . . . . . . . . . . . . . . . . . . . . . . . . . . (99) 28.36Vested . . . . . . . . . . . . . . . . . . . . . . . . . . . . . . . . . . . . . . . . . . . . . . . . . . . . . . . . . . . . . . . . . . . . . . . (546) 27.34Dividend equivalents . . . . . . . . . . . . . . . . . . . . . . . . . . . . . . . . . . . . . . . . . . . . . . . . . . . . . . . . . . . . 67 28.04Nonvested Units at Dec. 31, 2014 . . . . . . . . . . . . . . . . . . . . . . . . . . . . . . . . . . . . . . . . . . . . . . . . . . 1,322 28.63
The total fair value of these nonvested equity awards as of Dec. 31, 2014 was $47.5 million and the weighted average remaining contractual life was 1.6 years.
Stock Equivalent Unit Plan — Non-employee members of the Xcel Energy Inc. Board of Directors receive annual awards of stock equivalent units, with each unit having a value equal to one share of Xcel Energy Inc. common stock. The annual grants are vested as of the date of each member’s election to the Board of Directors; there is no further service or other condition attached to the annual grants after the member has been elected to the Board. Additionally, directors may elect to receive their fees in stock equivalent units in lieu of cash, and similarly have no further service or other conditions attached. Dividends on Xcel Energy Inc.’s common stock are converted to stock equivalent units and granted based on the number of stock equivalent units held by each participant as of the dividend date. The stock equivalent units are payable as a distribution of Xcel Energy Inc.’s common stock upon a director’s termination of service.
The stock equivalent units granted for the years ended Dec. 31 were as follows:
(Units in Thousands) 2014 2013 2012
Granted units . . . . . . . . . . . . . . . . . . . . . . . . . . . . . . . . . . . . . . . . . . . . . . . . . . . . . . . . . . . . 62 69 65Grant date fair value . . . . . . . . . . . . . . . . . . . . . . . . . . . . . . . . . . . . . . . . . . . . . . . . . . . . . . $ 30.57 $ 29.52 $ 27.41
Schedule Q-3 Page 117 of 182
Sponsor: Robinson Case No. 15-00139-UT

102
A summary of the stock equivalent unit changes for the year ended 2014 are as follows:
(Units in Thousands) UnitsWeighted Average
Grant Date Fair Value
Stock equivalent units at Jan. 1, 2014 . . . . . . . . . . . . . . . . . . . . . . . . . . . . . . . . . . . . . . . . . . . . . . . 636 $ 22.98Granted . . . . . . . . . . . . . . . . . . . . . . . . . . . . . . . . . . . . . . . . . . . . . . . . . . . . . . . . . . . . . . . . . . . . . . 62 30.57Units distributed . . . . . . . . . . . . . . . . . . . . . . . . . . . . . . . . . . . . . . . . . . . . . . . . . . . . . . . . . . . . . . . (33) 21.09Dividend equivalents . . . . . . . . . . . . . . . . . . . . . . . . . . . . . . . . . . . . . . . . . . . . . . . . . . . . . . . . . . . . 25 30.80Stock equivalent units at Dec. 31, 2014 . . . . . . . . . . . . . . . . . . . . . . . . . . . . . . . . . . . . . . . . . . . . . 690 24.03
TSR Liability Awards — Xcel Energy Inc.’s Board of Directors has granted TSR liability awards under the Xcel Energy Inc. 2005 Long-Term Incentive Plan (as amended and restated effective in 2010). The plan allows Xcel Energy to attach various performance goals to the awards granted. The liability awards granted have been historically dependent on a single measure of performance, Xcel Energy Inc.’s relative TSR measured over a three-year period. For 2014 and 2013 awards, Xcel Energy Inc.’s TSR is compared to the TSR of other companies in a 23-member utilities peer group. For 2012 awards, TSR is compared to the EEI Investor-Owned Electrics Index. At the end of the three-year period, potential payouts of the awards range from zero to 200 percent, depending on Xcel Energy Inc.’s TSR compared to the applicable peer group or index.
The TSR liability awards granted for the years ended Dec. 31 were as follows:
(In Thousands) 2014 2013 2012
Awards granted . . . . . . . . . . . . . . . . . . . . . . . . . . . . . . . . . . . . . . . . . . . . . . . . . . . . . . . . . . 270 215 161
The total amounts of TSR liability awards settled during the years ended Dec. 31 were as follows:
(In Thousands) 2014 2013 2012
Awards settled . . . . . . . . . . . . . . . . . . . . . . . . . . . . . . . . . . . . . . . . . . . . . . . . . . . . . . . . . . . — 108 286Settlement amount (cash and common stock) . . . . . . . . . . . . . . . . . . . . . . . . . . . . . . . . . . . $ — $ 3,057 $ 7,554
The amount of cash used to settle Xcel Energy’s TSR liability awards was $1.5 million and $3.8 million in 2013 and 2012, respectively.
Share-Based Compensation Expense — Other than for restricted stock and certain 401(k) employer match settlements, the vesting of employee equity awards is generally predicated on the achievement of a performance condition, which is the achievement of a TSR, EPS or environmental measures target. Additionally, approximately 0.4 million and 0.2 million of equity awards were granted in 2014 and 2013, respectively, with vesting subject only to service conditions for periods up to five years. All of these instruments are considered to be equity awards, generally since the plan settlement determination (shares or cash) resides with Xcel Energy and not the participants. In addition, these awards have not been previously settled in cash and Xcel Energy plans to continue electing share settlement. The grant date fair value of equity awards is expensed over the service period as employees vest in their rights to those awards.
The TSR liability awards have been historically settled partially in cash, and therefore do not qualify as equity awards, but rather are accounted for as liabilities. As liability awards, the fair value on which ratable expense is based, as employees vest in their rights to those awards, is remeasured each period based on the current stock price and performance achievement, and final expense is based on the market value of the shares on the date the award is settled.
The compensation costs related to share-based awards for the years ended Dec. 31 were as follows:
(Thousands of Dollars) 2014 2013 2012
Compensation cost for share-based awards (a) (b) (c) . . . . . . . . . . . . . . . . . . . . . . . . . . . . . . . $ 32,189 $ 24,613 $ 26,970Tax benefit recognized in income . . . . . . . . . . . . . . . . . . . . . . . . . . . . . . . . . . . . . . . . . . . . 12,557 9,571 10,513Capitalized compensation cost for share-based awards . . . . . . . . . . . . . . . . . . . . . . . . . . . 1,887 1,698 4,270
(a) Compensation costs for share-based payment arrangements are included in O&M expense in the consolidated statements of income.(b) Included in compensation cost for share-based awards are matching contributions related to the Xcel Energy 401(k) plan, which totaled $7.4 million, $7.0 million,
and $22.2 million for the years ended 2014, 2013 and 2012, respectively.(c) In October 2013, Xcel Energy determined that it would settle the 401(k) employer match in cash instead of common stock going forward for all employee groups
except PSCo bargaining employees. Share-based compensation accounting for the impacted employee groups ceased in October 2013, and corresponding expense amounts recorded to equity were reclassified to a liability for expected cash settlements.
Schedule Q-3 Page 118 of 182
Sponsor: Robinson Case No. 15-00139-UT

103
The maximum aggregate number of shares of common stock available for issuance under the Xcel Energy Inc. 2005 Long-Term Incentive Plan (as amended and restated effective Feb. 17, 2010) is 8.3 million shares. Under the Xcel Energy Inc. Executive Annual Incentive Award Plan (as amended and restated effective Feb. 17, 2010), the total number of shares approved for issuance is 1.2 million shares.
As of Dec. 31, 2014 and 2013, there was approximately $27.8 million and $22.1 million, respectively, of total unrecognized compensation cost related to nonvested share-based compensation awards. Xcel Energy expects to recognize the amount unrecognized at Dec. 31, 2014 over a weighted average period of 1.7 years.
9. Benefit Plans and Other Postretirement Benefits
Xcel Energy offers various benefit plans to its employees. Approximately 48 percent of employees that receive benefits are represented by several local labor unions under several collective-bargaining agreements. At Dec. 31, 2014:
• NSP-Minnesota had 2,011 and NSP-Wisconsin had 402 bargaining employees covered under a collective-bargaining agreement, which expires at the end of 2016. NSP-Minnesota also had an additional 272 nuclear operation bargaining employees covered under several collective-bargaining agreements, which expire at various dates in 2015 and 2016.
• PSCo had 2,063 bargaining employees covered under a collective-bargaining agreement, which expired in May 2014. While collective bargaining is ongoing, the terms and conditions of the expired agreement are automatically extended until the parties reach an agreement or a decision is rendered by an arbitrator.
• SPS had 840 bargaining employees covered under a collective-bargaining agreement, which expired in October 2014. While collective bargaining is ongoing, the terms and conditions of the expired agreement are automatically extended until the parties reach an agreement or a decision is rendered by an arbitrator.
The plans invest in various instruments which are disclosed under the accounting guidance for fair value measurements which establishes a hierarchical framework for disclosing the observability of the inputs utilized in measuring fair value. The three levels in the hierarchy and examples of each level are as follows:
Level 1 — Quoted prices are available in active markets for identical assets as of the reporting date. The types of assets included in Level 1 are highly liquid and actively traded instruments with quoted prices.
Level 2 — Pricing inputs are other than quoted prices in active markets, but are either directly or indirectly observable as of the reporting date. The types of assets included in Level 2 are typically either comparable to actively traded securities or contracts, or priced with models using highly observable inputs.
Level 3 — Significant inputs to pricing have little or no observability as of the reporting date. The types of assets included in Level 3 are those with inputs requiring significant management judgment or estimation.
Specific valuation methods include the following:
Cash equivalents — The fair values of cash equivalents are generally based on cost plus accrued interest; money market funds are measured using quoted net asset values.
Insurance contracts — Insurance contract fair values take into consideration the value of the investments in separate accounts of the insurer, which are priced based on observable inputs.
Investments in equity securities and other funds — Equity securities are valued using quoted prices in active markets. Preferred stock is valued using recent trades and quoted prices of similar securities. The fair values for commingled funds, private equity investments and real estate investments are measured using net asset values, which take into consideration the value of underlying fund investments, as well as the other accrued assets and liabilities of a fund, in order to determine a per share market value. The investments in commingled funds may be redeemed for net asset value with proper notice. Proper notice varies by fund and can range from daily with one or two days notice to annually with 90 days notice. Private equity investments require approval of the fund for any unscheduled redemption, and such redemptions may be approved or denied by the fund at its sole discretion. Unscheduled distributions from real estate investments may be redeemed with proper notice, which is typically quarterly with 45-90 days notice; however, withdrawals from real estate investments may be delayed or discounted as a result of fund illiquidity. Based on the plan’s evaluation of its ability to redeem private equity and real estate investments, fair value measurements for private equity and real estate investments have been assigned a Level 3.
Schedule Q-3 Page 119 of 182
Sponsor: Robinson Case No. 15-00139-UT

104
Investments in debt securities — Fair values for debt securities are determined by a third party pricing service using recent trades and observable spreads from benchmark interest rates for similar securities.
Derivative Instruments — Fair values for foreign currency derivatives are determined using pricing models based on the prevailing forward exchange rate of the underlying currencies. The fair values of interest rate derivatives are based on broker quotes that utilize current market interest rate forecasts.
Pension Benefits
Xcel Energy has several noncontributory, defined benefit pension plans that cover almost all employees. Generally, benefits are based on a combination of years of service, the employee’s average pay and, in some cases, social security benefits. Xcel Energy’s policy is to fully fund into an external trust the actuarially determined pension costs recognized for ratemaking and financial reporting purposes, subject to the limitations of applicable employee benefit and tax laws.
In addition to the qualified pension plans, Xcel Energy maintains a supplemental executive retirement plan (SERP) and a nonqualified pension plan. The SERP is maintained for certain executives that were participants in the plan in 2008, when the SERP was closed to new participants. The nonqualified pension plan provides unfunded, nonqualified benefits for compensation that is in excess of the limits applicable to the qualified pension plans. The total obligations of the SERP and nonqualified plan as of Dec. 31, 2014 and 2013 were $46.5 million and $36.5 million, respectively. In 2014 and 2013, Xcel Energy recognized net benefit cost for financial reporting for the SERP and nonqualified plans of $4.7 million and $6.6 million, respectively. Benefits for these unfunded plans are paid out of Xcel Energy’s consolidated operating cash flows.
Xcel Energy bases the investment-return assumption on expected long-term performance for each of the investment types included in its pension asset portfolio. Xcel Energy considers the historical returns achieved by its asset portfolio over the past 20-year or longer period, as well as the long-term return levels projected and recommended by investment experts. Xcel Energy continually reviews its pension assumptions. The pension cost determination assumes a forecasted mix of investment types over the long-term.
• Investment returns in 2014 were above the assumed level of 7.05 percent;• Investment returns in 2013 were below the assumed level of 6.88 percent;• Investment returns in 2012 were above the assumed level of 7.10 percent; and• In 2015, Xcel Energy’s expected investment return assumption is 7.09 percent.
The assets are invested in a portfolio according to Xcel Energy’s return, liquidity and diversification objectives to provide a source of funding for plan obligations and minimize the necessity of contributions to the plan, within appropriate levels of risk. The principal mechanism for achieving these objectives is the projected allocation of assets to selected asset classes, given the long-term risk, return, and liquidity characteristics of each particular asset class. There were no significant concentrations of risk in any particular industry, index, or entity. Market volatility can impact even well-diversified portfolios and significantly affect the return levels achieved by pension assets in any year.
The following table presents the target pension asset allocations for Xcel Energy at Dec. 31 for the upcoming year:
2014 2013
Domestic and international equity securities . . . . . . . . . . . . . . . . . . . . . . . . . . . . . . . . . . . . . . . . . . . . . 37% 30%Long-duration fixed income and interest rate swap securities . . . . . . . . . . . . . . . . . . . . . . . . . . . . . . . . 27 33Short-to-intermediate fixed income securities . . . . . . . . . . . . . . . . . . . . . . . . . . . . . . . . . . . . . . . . . . . . 13 15Alternative investments . . . . . . . . . . . . . . . . . . . . . . . . . . . . . . . . . . . . . . . . . . . . . . . . . . . . . . . . . . . . . 21 20Cash . . . . . . . . . . . . . . . . . . . . . . . . . . . . . . . . . . . . . . . . . . . . . . . . . . . . . . . . . . . . . . . . . . . . . . . . . . . . 2 2
Total . . . . . . . . . . . . . . . . . . . . . . . . . . . . . . . . . . . . . . . . . . . . . . . . . . . . . . . . . . . . . . . . . . . . . . . . . . . 100% 100%
Xcel Energy’s ongoing investment strategy is based on plan-specific investment recommendations that seek to minimize potential investment and interest rate risk as a plan’s funded status increases over time. The investment recommendations result in a greater percentage of long-duration fixed income securities being allocated to specific plans having relatively higher funded status ratios and a greater percentage of growth assets being allocated to plans having relatively lower funded status ratios. The aggregate projected asset allocation presented in the table above for the master pension trust results from the plan-specific strategies.
Schedule Q-3 Page 120 of 182
Sponsor: Robinson Case No. 15-00139-UT

105
Pension Plan Assets
The following tables present, for each of the fair value hierarchy levels, Xcel Energy’s pension plan assets that are measured at fair value as of Dec. 31, 2014 and 2013:
Dec. 31, 2014(Thousands of Dollars) Level 1 Level 2 Level 3 Total
Cash equivalents . . . . . . . . . . . . . . . . . . . . . . . . . . . . . . . . . . . . . . . . . . . . . $ 193,141 $ — $ — $ 193,141Derivatives. . . . . . . . . . . . . . . . . . . . . . . . . . . . . . . . . . . . . . . . . . . . . . . . . . — 1,590 — 1,590Government securities . . . . . . . . . . . . . . . . . . . . . . . . . . . . . . . . . . . . . . . . . — 439,186 — 439,186Corporate bonds. . . . . . . . . . . . . . . . . . . . . . . . . . . . . . . . . . . . . . . . . . . . . . — 318,161 — 318,161Asset-backed securities . . . . . . . . . . . . . . . . . . . . . . . . . . . . . . . . . . . . . . . . — 3,759 — 3,759Mortgage-backed securities. . . . . . . . . . . . . . . . . . . . . . . . . . . . . . . . . . . . . — 11,047 — 11,047Common stock. . . . . . . . . . . . . . . . . . . . . . . . . . . . . . . . . . . . . . . . . . . . . . . 102,667 — — 102,667Private equity investments. . . . . . . . . . . . . . . . . . . . . . . . . . . . . . . . . . . . . . — — 151,871 151,871Commingled funds . . . . . . . . . . . . . . . . . . . . . . . . . . . . . . . . . . . . . . . . . . . — 1,826,420 — 1,826,420Real estate . . . . . . . . . . . . . . . . . . . . . . . . . . . . . . . . . . . . . . . . . . . . . . . . . . — — 54,657 54,657Securities lending collateral obligation and other . . . . . . . . . . . . . . . . . . . . — (18,728) — (18,728)
Total. . . . . . . . . . . . . . . . . . . . . . . . . . . . . . . . . . . . . . . . . . . . . . . . . . . . . . $ 295,808 $ 2,581,435 $ 206,528 $ 3,083,771
Dec. 31, 2013(Thousands of Dollars) Level 1 Level 2 Level 3 Total
Cash equivalents . . . . . . . . . . . . . . . . . . . . . . . . . . . . . . . . . . . . . . . . . . . . . $ 109,700 $ — $ — $ 109,700Derivatives. . . . . . . . . . . . . . . . . . . . . . . . . . . . . . . . . . . . . . . . . . . . . . . . . . — 29,759 — 29,759Government securities . . . . . . . . . . . . . . . . . . . . . . . . . . . . . . . . . . . . . . . . . — 230,212 — 230,212Corporate bonds. . . . . . . . . . . . . . . . . . . . . . . . . . . . . . . . . . . . . . . . . . . . . . — 547,715 — 547,715Asset-backed securities . . . . . . . . . . . . . . . . . . . . . . . . . . . . . . . . . . . . . . . . — 6,754 — 6,754Mortgage-backed securities. . . . . . . . . . . . . . . . . . . . . . . . . . . . . . . . . . . . . — 15,025 — 15,025Common stock. . . . . . . . . . . . . . . . . . . . . . . . . . . . . . . . . . . . . . . . . . . . . . . 99,346 — — 99,346Private equity investments. . . . . . . . . . . . . . . . . . . . . . . . . . . . . . . . . . . . . . — — 152,849 152,849Commingled funds . . . . . . . . . . . . . . . . . . . . . . . . . . . . . . . . . . . . . . . . . . . — 1,769,076 — 1,769,076Real estate . . . . . . . . . . . . . . . . . . . . . . . . . . . . . . . . . . . . . . . . . . . . . . . . . . — — 47,553 47,553Securities lending collateral obligation and other . . . . . . . . . . . . . . . . . . . . — 2,151 — 2,151
Total. . . . . . . . . . . . . . . . . . . . . . . . . . . . . . . . . . . . . . . . . . . . . . . . . . . . . . $ 209,046 $ 2,600,692 $ 200,402 $ 3,010,140
The following tables present the changes in Xcel Energy’s Level 3 pension plan assets for the years ended Dec. 31, 2014, 2013 and 2012:
(Thousands of Dollars) Jan. 1, 2014Net Realized
Gains (Losses)Net UnrealizedGains (Losses)
Purchases,Issuances and
Settlements, NetTransfers Out
of Level 3 Dec. 31, 2014
Private equity investments . . . . . . . . $ 152,849 $ 25,694 $ (17,573) $ (9,099) $ — $ 151,871Real estate . . . . . . . . . . . . . . . . . . . . 47,553 3,569 (2,443) 5,978 — 54,657
Total. . . . . . . . . . . . . . . . . . . . . . . . $ 200,402 $ 29,263 $ (20,016) $ (3,121) $ — $ 206,528
(Thousands of Dollars) Jan. 1, 2013Net Realized
Gains (Losses)Net UnrealizedGains (Losses)
Purchases,Issuances and
Settlements, NetTransfers Out of Level 3 (a) Dec. 31, 2013
Asset-backed securities . . . . . . . . . . $ 14,639 $ — $ — $ — $ (14,639) $ —Mortgage-backed securities . . . . . . . 39,904 — — — (39,904) —Private equity investments . . . . . . . . 158,498 22,058 (24,335) (3,372) — 152,849Real estate . . . . . . . . . . . . . . . . . . . . 64,597 (2,659) 8,690 9,317 (32,392) 47,553
Total. . . . . . . . . . . . . . . . . . . . . . . . $ 277,638 $ 19,399 $ (15,645) $ 5,945 $ (86,935) $ 200,402
(a) Transfers out of Level 3 into Level 2 were principally due to diminished use of unobservable inputs that were previously significant to these fair value measurements and were subsequently sold during 2013.
Schedule Q-3 Page 121 of 182
Sponsor: Robinson Case No. 15-00139-UT
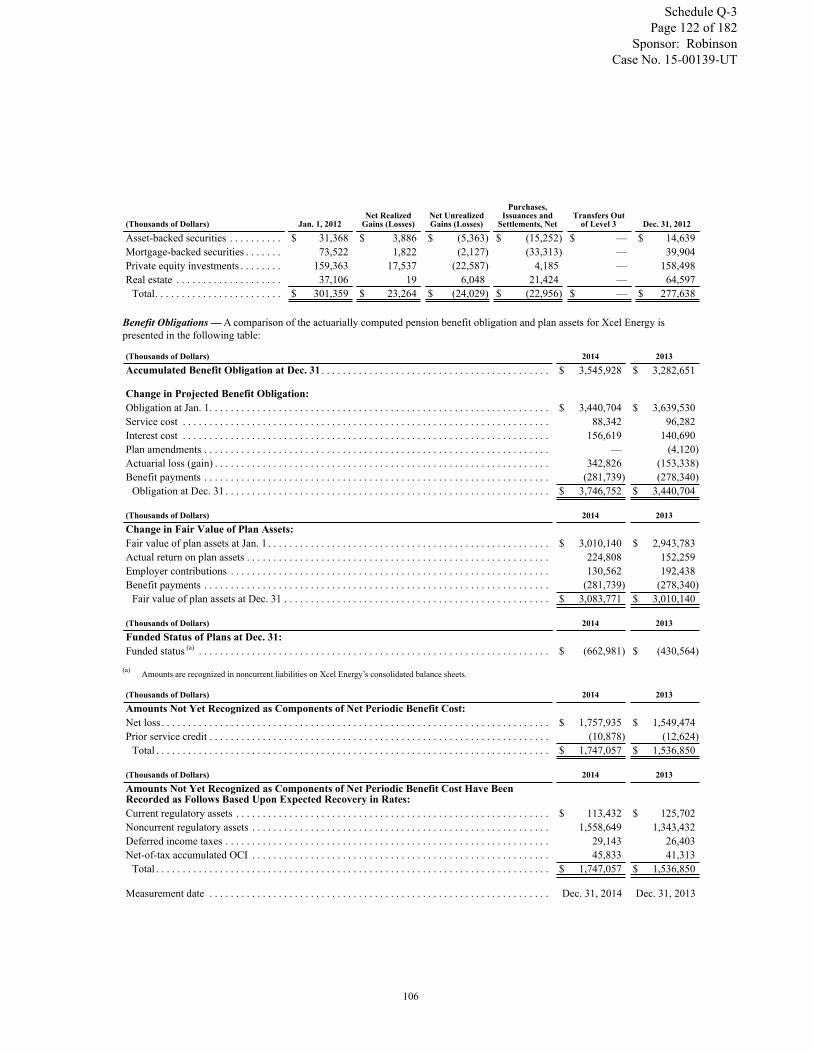
106
(Thousands of Dollars) Jan. 1, 2012Net Realized
Gains (Losses)Net UnrealizedGains (Losses)
Purchases,Issuances and
Settlements, NetTransfers Out
of Level 3 Dec. 31, 2012
Asset-backed securities . . . . . . . . . . $ 31,368 $ 3,886 $ (5,363) $ (15,252) $ — $ 14,639Mortgage-backed securities . . . . . . . 73,522 1,822 (2,127) (33,313) — 39,904Private equity investments . . . . . . . . 159,363 17,537 (22,587) 4,185 — 158,498Real estate . . . . . . . . . . . . . . . . . . . . 37,106 19 6,048 21,424 — 64,597
Total. . . . . . . . . . . . . . . . . . . . . . . . $ 301,359 $ 23,264 $ (24,029) $ (22,956) $ — $ 277,638
Benefit Obligations — A comparison of the actuarially computed pension benefit obligation and plan assets for Xcel Energy is presented in the following table:
(Thousands of Dollars) 2014 2013
Accumulated Benefit Obligation at Dec. 31 . . . . . . . . . . . . . . . . . . . . . . . . . . . . . . . . . . . . . . . . . . . $ 3,545,928 $ 3,282,651
Change in Projected Benefit Obligation:Obligation at Jan. 1. . . . . . . . . . . . . . . . . . . . . . . . . . . . . . . . . . . . . . . . . . . . . . . . . . . . . . . . . . . . . . . . $ 3,440,704 $ 3,639,530Service cost . . . . . . . . . . . . . . . . . . . . . . . . . . . . . . . . . . . . . . . . . . . . . . . . . . . . . . . . . . . . . . . . . . . . . 88,342 96,282Interest cost . . . . . . . . . . . . . . . . . . . . . . . . . . . . . . . . . . . . . . . . . . . . . . . . . . . . . . . . . . . . . . . . . . . . . 156,619 140,690Plan amendments . . . . . . . . . . . . . . . . . . . . . . . . . . . . . . . . . . . . . . . . . . . . . . . . . . . . . . . . . . . . . . . . . — (4,120)Actuarial loss (gain) . . . . . . . . . . . . . . . . . . . . . . . . . . . . . . . . . . . . . . . . . . . . . . . . . . . . . . . . . . . . . . . 342,826 (153,338)Benefit payments . . . . . . . . . . . . . . . . . . . . . . . . . . . . . . . . . . . . . . . . . . . . . . . . . . . . . . . . . . . . . . . . . (281,739) (278,340)
Obligation at Dec. 31 . . . . . . . . . . . . . . . . . . . . . . . . . . . . . . . . . . . . . . . . . . . . . . . . . . . . . . . . . . . . . $ 3,746,752 $ 3,440,704
(Thousands of Dollars) 2014 2013
Change in Fair Value of Plan Assets:Fair value of plan assets at Jan. 1 . . . . . . . . . . . . . . . . . . . . . . . . . . . . . . . . . . . . . . . . . . . . . . . . . . . . . $ 3,010,140 $ 2,943,783Actual return on plan assets . . . . . . . . . . . . . . . . . . . . . . . . . . . . . . . . . . . . . . . . . . . . . . . . . . . . . . . . . 224,808 152,259Employer contributions . . . . . . . . . . . . . . . . . . . . . . . . . . . . . . . . . . . . . . . . . . . . . . . . . . . . . . . . . . . . 130,562 192,438Benefit payments . . . . . . . . . . . . . . . . . . . . . . . . . . . . . . . . . . . . . . . . . . . . . . . . . . . . . . . . . . . . . . . . . (281,739) (278,340)
Fair value of plan assets at Dec. 31 . . . . . . . . . . . . . . . . . . . . . . . . . . . . . . . . . . . . . . . . . . . . . . . . . . $ 3,083,771 $ 3,010,140
(Thousands of Dollars) 2014 2013
Funded Status of Plans at Dec. 31:Funded status (a) . . . . . . . . . . . . . . . . . . . . . . . . . . . . . . . . . . . . . . . . . . . . . . . . . . . . . . . . . . . . . . . . . . $ (662,981) $ (430,564)
(a) Amounts are recognized in noncurrent liabilities on Xcel Energy’s consolidated balance sheets.
(Thousands of Dollars) 2014 2013
Amounts Not Yet Recognized as Components of Net Periodic Benefit Cost:Net loss . . . . . . . . . . . . . . . . . . . . . . . . . . . . . . . . . . . . . . . . . . . . . . . . . . . . . . . . . . . . . . . . . . . . . . . . . $ 1,757,935 $ 1,549,474Prior service credit . . . . . . . . . . . . . . . . . . . . . . . . . . . . . . . . . . . . . . . . . . . . . . . . . . . . . . . . . . . . . . . . (10,878) (12,624)
Total . . . . . . . . . . . . . . . . . . . . . . . . . . . . . . . . . . . . . . . . . . . . . . . . . . . . . . . . . . . . . . . . . . . . . . . . . . $ 1,747,057 $ 1,536,850
(Thousands of Dollars) 2014 2013
Amounts Not Yet Recognized as Components of Net Periodic Benefit Cost Have BeenRecorded as Follows Based Upon Expected Recovery in Rates:Current regulatory assets . . . . . . . . . . . . . . . . . . . . . . . . . . . . . . . . . . . . . . . . . . . . . . . . . . . . . . . . . . . $ 113,432 $ 125,702Noncurrent regulatory assets . . . . . . . . . . . . . . . . . . . . . . . . . . . . . . . . . . . . . . . . . . . . . . . . . . . . . . . . 1,558,649 1,343,432Deferred income taxes . . . . . . . . . . . . . . . . . . . . . . . . . . . . . . . . . . . . . . . . . . . . . . . . . . . . . . . . . . . . . 29,143 26,403Net-of-tax accumulated OCI . . . . . . . . . . . . . . . . . . . . . . . . . . . . . . . . . . . . . . . . . . . . . . . . . . . . . . . . 45,833 41,313
Total . . . . . . . . . . . . . . . . . . . . . . . . . . . . . . . . . . . . . . . . . . . . . . . . . . . . . . . . . . . . . . . . . . . . . . . . . . $ 1,747,057 $ 1,536,850
Measurement date . . . . . . . . . . . . . . . . . . . . . . . . . . . . . . . . . . . . . . . . . . . . . . . . . . . . . . . . . . . . . . . . Dec. 31, 2014 Dec. 31, 2013
Schedule Q-3 Page 122 of 182
Sponsor: Robinson Case No. 15-00139-UT

107
2014 2013
Significant Assumptions Used to Measure Benefit Obligations:Discount rate for year-end valuation . . . . . . . . . . . . . . . . . . . . . . . . . . . . . . . . . . . . . . . . . . . . . . . . . . 4.11% 4.75%Expected average long-term increase in compensation level. . . . . . . . . . . . . . . . . . . . . . . . . . . . . . . . 3.75 3.75Mortality table . . . . . . . . . . . . . . . . . . . . . . . . . . . . . . . . . . . . . . . . . . . . . . . . . . . . . . . . . . . . . . . . . . . RP 2014 RP 2000
Mortality — In 2014, the Society of Actuaries published a new mortality table and projection scale that increased the overall life expectancy of males and females. Xcel Energy has reviewed its own population through a credibility analysis and adopted the RP 2014 table with modifications based on its population and specific experience.
Cash Flows — Cash funding requirements can be impacted by changes to actuarial assumptions, actual asset levels and other calculations prescribed by the funding requirements of income tax and other pension-related regulations. Required contributions were made in 2012 through 2015 to meet minimum funding requirements.
Total voluntary and required pension funding contributions across all four of Xcel Energy’s pension plans were as follows:
• $90.0 million in January 2015;• $130.6 million in 2014;• $192.4 million in 2013; and • $198.1 million in 2012.
For future years, Xcel Energy anticipates contributions will be made as necessary.
Plan Amendments — In 2014 there were no plan amendments made which affected the projected benefit obligation. The 2013 decrease of the projected benefit obligation for plan amendments is due to fully insuring the long-term disability benefit for NSP bargaining participants. This decrease was partially offset by an increase to the projected benefit obligation resulting from a change in the discount rate basis for lump sum conversion of annuities for participants in the Xcel Energy Pension Plan.
Benefit Costs — The components of Xcel Energy’s net periodic pension cost were:
(Thousands of Dollars) 2014 2013 2012
Service cost . . . . . . . . . . . . . . . . . . . . . . . . . . . . . . . . . . . . . . . . . . . . . . . . . . . . . . . . . . . . . $ 88,342 $ 96,282 $ 86,364Interest cost . . . . . . . . . . . . . . . . . . . . . . . . . . . . . . . . . . . . . . . . . . . . . . . . . . . . . . . . . . . . . 156,619 140,690 157,035Expected return on plan assets . . . . . . . . . . . . . . . . . . . . . . . . . . . . . . . . . . . . . . . . . . . . . . (207,205) (198,452) (207,095)Amortization of prior service (credit) cost . . . . . . . . . . . . . . . . . . . . . . . . . . . . . . . . . . . . . (1,746) 5,871 21,065Amortization of net loss . . . . . . . . . . . . . . . . . . . . . . . . . . . . . . . . . . . . . . . . . . . . . . . . . . . 116,762 144,151 108,982
Net periodic pension cost . . . . . . . . . . . . . . . . . . . . . . . . . . . . . . . . . . . . . . . . . . . . . . . . . 152,772 188,542 166,351Costs not recognized due to effects of regulation . . . . . . . . . . . . . . . . . . . . . . . . . . . . . . . . (26,315) (36,724) (39,217)
Net benefit cost recognized for financial reporting. . . . . . . . . . . . . . . . . . . . . . . . . . . . . . $ 126,457 $ 151,818 $ 127,134
2014 2013 2012
Significant Assumptions Used to Measure Costs:Discount rate . . . . . . . . . . . . . . . . . . . . . . . . . . . . . . . . . . . . . . . . . . . . . . . . . . . . . . . . . . . . 4.75% 4.00% 5.00%Expected average long-term increase in compensation level . . . . . . . . . . . . . . . . . . . . . . . 3.75 3.75 4.00Expected average long-term rate of return on assets. . . . . . . . . . . . . . . . . . . . . . . . . . . . . . 7.05 6.88 7.10
Pension costs include an expected return impact for the current year that may differ from actual investment performance in the plan. The return assumption used for 2015 pension cost calculations is 7.09 percent.
Defined Contribution Plans
Xcel Energy maintains 401(k) and other defined contribution plans that cover substantially all employees. Total expense to these plans was approximately $32.4 million in 2014, $30.3 million in 2013 and $28.0 million in 2012.
Schedule Q-3 Page 123 of 182
Sponsor: Robinson Case No. 15-00139-UT

108
Postretirement Health Care Benefits
Xcel Energy has a contributory health and welfare benefit plan that provides health care and death benefits to certain Xcel Energy retirees.
• The former NSP, which includes NSP-Minnesota and NSP-Wisconsin, discontinued contributing toward health care benefits for nonbargaining employees retiring after 1998 and for bargaining employees who retired after 1999.
• Xcel Energy discontinued contributing toward health care benefits for former NCE, which includes PSCo and SPS, nonbargaining employees retiring after June 30, 2003.
• Employees of NCE who retired in 2002 continue to receive employer-subsidized health care benefits.• Nonbargaining employees of the former NCE who retired after 1998, bargaining employees of the former NCE who retired
after 1999 and nonbargaining employees of NCE who retired after June 30, 2003, are eligible to participate in the Xcel Energy health care program with no employer subsidy.
In 1993, Xcel Energy adopted accounting guidance regarding other non-pension postretirement benefits and elected to amortize the unrecognized APBO on a straight-line basis over 20 years.
Plan Assets — Certain state agencies that regulate Xcel Energy Inc.’s utility subsidiaries also have issued guidelines related to the funding of postretirement benefit costs. SPS is required to fund postretirement benefit costs for Texas and New Mexico jurisdictional amounts collected in rates. PSCo is required to fund postretirement benefit costs in irrevocable external trusts that are dedicated to the payment of these postretirement benefits. These assets are invested in a manner consistent with the investment strategy for the pension plan.
The following table presents the target postretirement asset allocations for Xcel Energy at Dec. 31 for the upcoming year:
2014 2013
Domestic and international equity securities . . . . . . . . . . . . . . . . . . . . . . . . . . . . . . . . . . . . . . . . . . . . . 25% 41%Short-to-intermediate fixed income securities . . . . . . . . . . . . . . . . . . . . . . . . . . . . . . . . . . . . . . . . . . . . 57 40Alternative investments . . . . . . . . . . . . . . . . . . . . . . . . . . . . . . . . . . . . . . . . . . . . . . . . . . . . . . . . . . . . . 13 13Cash . . . . . . . . . . . . . . . . . . . . . . . . . . . . . . . . . . . . . . . . . . . . . . . . . . . . . . . . . . . . . . . . . . . . . . . . . . . . 5 6
Total . . . . . . . . . . . . . . . . . . . . . . . . . . . . . . . . . . . . . . . . . . . . . . . . . . . . . . . . . . . . . . . . . . . . . . . . . . . 100% 100%
Xcel Energy bases its investment-return assumption for the postretirement health care fund assets on expected long-term performance for each of the investment types included in its asset portfolio. The assets are invested in a portfolio according to Xcel Energy’s return, liquidity and diversification objectives to provide a source of funding for plan obligations and minimize the necessity of contributions to the plan, within appropriate levels of risk. The principal mechanism for achieving these objectives is the projected allocation of assets to selected asset classes, given the long-term risk, return, correlation and liquidity characteristics of each particular asset class. There were no significant concentrations of risk in any particular industry, index, or entity. Market volatility can impact even well-diversified portfolios and significantly affect the return levels achieved by postretirement health care assets in any year.
The following tables present, for each of the fair value hierarchy levels, Xcel Energy’s postretirement benefit plan assets that are measured at fair value as of Dec. 31, 2014 and 2013:
Dec. 31, 2014(Thousands of Dollars) Level 1 Level 2 Level 3 Total
Cash equivalents (a) . . . . . . . . . . . . . . . . . . . . . . . . . . . . . . . . . . . . . . . . . . . $ 26,324 $ — $ — $ 26,324Derivatives . . . . . . . . . . . . . . . . . . . . . . . . . . . . . . . . . . . . . . . . . . . . . . . . . . — 186 — 186Government securities . . . . . . . . . . . . . . . . . . . . . . . . . . . . . . . . . . . . . . . . . — 48,584 — 48,584Insurance contracts. . . . . . . . . . . . . . . . . . . . . . . . . . . . . . . . . . . . . . . . . . . . — 50,351 — 50,351Corporate bonds . . . . . . . . . . . . . . . . . . . . . . . . . . . . . . . . . . . . . . . . . . . . . . — 54,207 — 54,207Asset-backed securities . . . . . . . . . . . . . . . . . . . . . . . . . . . . . . . . . . . . . . . . — 3,619 — 3,619Mortgage-backed securities . . . . . . . . . . . . . . . . . . . . . . . . . . . . . . . . . . . . . — 11,250 — 11,250Commingled funds. . . . . . . . . . . . . . . . . . . . . . . . . . . . . . . . . . . . . . . . . . . . — 282,378 — 282,378Other . . . . . . . . . . . . . . . . . . . . . . . . . . . . . . . . . . . . . . . . . . . . . . . . . . . . . . — (1,841) — (1,841)
Total. . . . . . . . . . . . . . . . . . . . . . . . . . . . . . . . . . . . . . . . . . . . . . . . . . . . . . $ 26,324 $ 448,734 $ — $ 475,058
Schedule Q-3 Page 124 of 182
Sponsor: Robinson Case No. 15-00139-UT

109
Dec. 31, 2013(Thousands of Dollars) Level 1 Level 2 Level 3 Total
Cash equivalents (a) . . . . . . . . . . . . . . . . . . . . . . . . . . . . . . . . . . . . . . . . . . . $ 20,438 $ — $ — $ 20,438Derivatives . . . . . . . . . . . . . . . . . . . . . . . . . . . . . . . . . . . . . . . . . . . . . . . . . . — (414) — (414)Government securities . . . . . . . . . . . . . . . . . . . . . . . . . . . . . . . . . . . . . . . . . — 58,421 — 58,421Insurance contracts. . . . . . . . . . . . . . . . . . . . . . . . . . . . . . . . . . . . . . . . . . . . — 52,808 — 52,808Corporate bonds . . . . . . . . . . . . . . . . . . . . . . . . . . . . . . . . . . . . . . . . . . . . . . — 51,861 — 51,861Asset-backed securities . . . . . . . . . . . . . . . . . . . . . . . . . . . . . . . . . . . . . . . . — 3,358 — 3,358Mortgage-backed securities . . . . . . . . . . . . . . . . . . . . . . . . . . . . . . . . . . . . . — 24,246 — 24,246Commingled funds. . . . . . . . . . . . . . . . . . . . . . . . . . . . . . . . . . . . . . . . . . . . — 298,258 — 298,258Other . . . . . . . . . . . . . . . . . . . . . . . . . . . . . . . . . . . . . . . . . . . . . . . . . . . . . . — (16,940) — (16,940)
Total. . . . . . . . . . . . . . . . . . . . . . . . . . . . . . . . . . . . . . . . . . . . . . . . . . . . . . $ 20,438 $ 471,598 $ — $ 492,036(a) Includes restricted cash of $1.0 million and $0.7 million at Dec. 31, 2014 and 2013, respectively.
For the year ended Dec. 31, 2014 there were no assets transferred in or out of Level 3. The following tables present the changes in Xcel Energy’s Level 3 postretirement benefit plan assets for the years ended Dec. 31, 2013 and 2012:
(Thousands of Dollars) Jan. 1, 2013Net Realized
Gains (Losses)Net UnrealizedGains (Losses)
Purchases,Issuances and
Settlements, NetTransfers Out of Level 3 (a) Dec. 31, 2013
Asset-backed securities . . . . . . . . . . $ 757 $ — $ — $ — $ (757) $ —Mortgage-backed securities. . . . . . . 39,958 — — — (39,958) —
Total. . . . . . . . . . . . . . . . . . . . . . . . $ 40,715 $ — $ — $ — $ (40,715) $ —
(a) Transfers out of Level 3 into Level 2 were principally due to diminished use of unobservable inputs that were previously significant to these fair value measurements and were subsequently sold during 2013.
(Thousands of Dollars) Jan. 1, 2012Net Realized
Gains (Losses)Net UnrealizedGains (Losses)
Purchases,Issuances and
Settlements, NetTransfers Out
of Level 3 Dec. 31, 2012
Asset-backed securities . . . . . . . . . . $ 7,867 $ (331) $ 1,481 $ (8,260) $ — $ 757Mortgage-backed securities. . . . . . . 27,253 (724) 3,301 10,128 — 39,958Private equity investments. . . . . . . . 479 — (65) (414) — —Real estate . . . . . . . . . . . . . . . . . . . . 144 — 35 (179) — —
Total. . . . . . . . . . . . . . . . . . . . . . . . $ 35,743 $ (1,055) $ 4,752 $ 1,275 $ — $ 40,715
Benefit Obligations — A comparison of the actuarially computed benefit obligation and plan assets for Xcel Energy is presented in the following table:
(Thousands of Dollars) 2014 2013
Change in Projected Benefit Obligation:Obligation at Jan. 1. . . . . . . . . . . . . . . . . . . . . . . . . . . . . . . . . . . . . . . . . . . . . . . . . . . . . . . . . . . . . . . . $ 731,428 $ 851,952Service cost . . . . . . . . . . . . . . . . . . . . . . . . . . . . . . . . . . . . . . . . . . . . . . . . . . . . . . . . . . . . . . . . . . . . . 3,457 4,079Interest cost . . . . . . . . . . . . . . . . . . . . . . . . . . . . . . . . . . . . . . . . . . . . . . . . . . . . . . . . . . . . . . . . . . . . . 34,028 32,141Medicare subsidy reimbursements . . . . . . . . . . . . . . . . . . . . . . . . . . . . . . . . . . . . . . . . . . . . . . . . . . . . 1,861 1,197Plan amendments . . . . . . . . . . . . . . . . . . . . . . . . . . . . . . . . . . . . . . . . . . . . . . . . . . . . . . . . . . . . . . . . . — (14,571)Plan participants’ contributions . . . . . . . . . . . . . . . . . . . . . . . . . . . . . . . . . . . . . . . . . . . . . . . . . . . . . . 7,148 9,580Actuarial gain . . . . . . . . . . . . . . . . . . . . . . . . . . . . . . . . . . . . . . . . . . . . . . . . . . . . . . . . . . . . . . . . . . . . (81,699) (103,359)Benefit payments . . . . . . . . . . . . . . . . . . . . . . . . . . . . . . . . . . . . . . . . . . . . . . . . . . . . . . . . . . . . . . . . . (53,354) (49,591)
Obligation at Dec. 31 . . . . . . . . . . . . . . . . . . . . . . . . . . . . . . . . . . . . . . . . . . . . . . . . . . . . . . . . . . . . . $ 642,869 $ 731,428
(Thousands of Dollars) 2014 2013
Change in Fair Value of Plan Assets:Fair value of plan assets at Jan. 1 . . . . . . . . . . . . . . . . . . . . . . . . . . . . . . . . . . . . . . . . . . . . . . . . . . . . . $ 492,036 $ 480,842Actual return on plan assets . . . . . . . . . . . . . . . . . . . . . . . . . . . . . . . . . . . . . . . . . . . . . . . . . . . . . . . . . 12,083 33,644Plan participants’ contributions . . . . . . . . . . . . . . . . . . . . . . . . . . . . . . . . . . . . . . . . . . . . . . . . . . . . . . 7,148 9,580Employer contributions . . . . . . . . . . . . . . . . . . . . . . . . . . . . . . . . . . . . . . . . . . . . . . . . . . . . . . . . . . . . 17,145 17,561Benefit payments . . . . . . . . . . . . . . . . . . . . . . . . . . . . . . . . . . . . . . . . . . . . . . . . . . . . . . . . . . . . . . . . . (53,354) (49,591)
Fair value of plan assets at Dec. 31 . . . . . . . . . . . . . . . . . . . . . . . . . . . . . . . . . . . . . . . . . . . . . . . . . . $ 475,058 $ 492,036
Schedule Q-3 Page 125 of 182
Sponsor: Robinson Case No. 15-00139-UT

110
(Thousands of Dollars) 2014 2013
Funded Status of Plans at Dec. 31:Funded status . . . . . . . . . . . . . . . . . . . . . . . . . . . . . . . . . . . . . . . . . . . . . . . . . . . . . . . . . . . . . . . . . . . . $ (167,811) $ (239,392)Noncurrent assets . . . . . . . . . . . . . . . . . . . . . . . . . . . . . . . . . . . . . . . . . . . . . . . . . . . . . . . . . . . . . . . . . 1,014 —Current liabilities . . . . . . . . . . . . . . . . . . . . . . . . . . . . . . . . . . . . . . . . . . . . . . . . . . . . . . . . . . . . . . . . . (9,110) (6,807)Noncurrent liabilities . . . . . . . . . . . . . . . . . . . . . . . . . . . . . . . . . . . . . . . . . . . . . . . . . . . . . . . . . . . . . . (159,715) (232,585)
Net postretirement amounts recognized on consolidated balance sheets . . . . . . . . . . . . . . . . . . . . . $ (167,811) $ (239,392)
(Thousands of Dollars) 2014 2013
Amounts Not Yet Recognized as Components of Net Periodic Benefit Cost:Net loss . . . . . . . . . . . . . . . . . . . . . . . . . . . . . . . . . . . . . . . . . . . . . . . . . . . . . . . . . . . . . . . . . . . . . . . . . $ 124,064 $ 195,630Prior service credit . . . . . . . . . . . . . . . . . . . . . . . . . . . . . . . . . . . . . . . . . . . . . . . . . . . . . . . . . . . . . . . . (75,610) (86,298)Transition obligation . . . . . . . . . . . . . . . . . . . . . . . . . . . . . . . . . . . . . . . . . . . . . . . . . . . . . . . . . . . . . . — 2
Total . . . . . . . . . . . . . . . . . . . . . . . . . . . . . . . . . . . . . . . . . . . . . . . . . . . . . . . . . . . . . . . . . . . . . . . . . . $ 48,454 $ 109,334
(Thousands of Dollars) 2014 2013
Amounts Not Yet Recognized as Components of Net Periodic Benefit Cost Have BeenRecorded as Follows Based Upon Expected Recovery in Rates:Current regulatory assets . . . . . . . . . . . . . . . . . . . . . . . . . . . . . . . . . . . . . . . . . . . . . . . . . . . . . . . . . . . $ 285 $ 12,102Noncurrent regulatory assets . . . . . . . . . . . . . . . . . . . . . . . . . . . . . . . . . . . . . . . . . . . . . . . . . . . . . . . . 59,697 99,071Current regulatory liabilities . . . . . . . . . . . . . . . . . . . . . . . . . . . . . . . . . . . . . . . . . . . . . . . . . . . . . . . . (892) (319)Noncurrent regulatory liabilities . . . . . . . . . . . . . . . . . . . . . . . . . . . . . . . . . . . . . . . . . . . . . . . . . . . . . (17,216) (8,858)Deferred income taxes . . . . . . . . . . . . . . . . . . . . . . . . . . . . . . . . . . . . . . . . . . . . . . . . . . . . . . . . . . . . . 2,559 2,965Net-of-tax accumulated OCI . . . . . . . . . . . . . . . . . . . . . . . . . . . . . . . . . . . . . . . . . . . . . . . . . . . . . . . . 4,021 4,373
Total . . . . . . . . . . . . . . . . . . . . . . . . . . . . . . . . . . . . . . . . . . . . . . . . . . . . . . . . . . . . . . . . . . . . . . . . . . $ 48,454 $ 109,334
Measurement date . . . . . . . . . . . . . . . . . . . . . . . . . . . . . . . . . . . . . . . . . . . . . . . . . . . . . . . . . . . . . . . . Dec. 31, 2014 Dec. 31, 2013
2014 2013
Significant Assumptions Used to Measure Benefit Obligations:Discount rate for year-end valuation . . . . . . . . . . . . . . . . . . . . . . . . . . . . . . . . . . . . . . . . . . . . . . . . . . 4.08% 4.82%Mortality table . . . . . . . . . . . . . . . . . . . . . . . . . . . . . . . . . . . . . . . . . . . . . . . . . . . . . . . . . . . . . . . . . . . RP 2014 RP 2000Health care costs trend rate — initial . . . . . . . . . . . . . . . . . . . . . . . . . . . . . . . . . . . . . . . . . . . . . . . . . . 6.50% 7.00%
Effective Jan. 1, 2015, the initial medical trend rate was decreased from 7.0 percent to 6.5 percent. The ultimate trend assumption remained at 4.5 percent. The period until the ultimate rate is reached is four years. Xcel Energy bases its medical trend assumption on the long-term cost inflation expected in the health care market, considering the levels projected and recommended by industry experts, as well as recent actual medical cost increases experienced by Xcel Energy’s retiree medical plan.
A one-percent change in the assumed health care cost trend rate would have the following effects on Xcel Energy:
One-Percentage Point(Thousands of Dollars) Increase Decrease
APBO . . . . . . . . . . . . . . . . . . . . . . . . . . . . . . . . . . . . . . . . . . . . . . . . . . . . . . . . . . . . . . . . . . . . . . . . . . $ 66,034 $ (55,588)Service and interest components . . . . . . . . . . . . . . . . . . . . . . . . . . . . . . . . . . . . . . . . . . . . . . . . . . . . . 4,432 (3,640)
Cash Flows — The postretirement health care plans have no funding requirements under income tax and other retirement-related regulations other than fulfilling benefit payment obligations, when claims are presented and approved under the plans. Additional cash funding requirements are prescribed by certain state and federal rate regulatory authorities, as discussed previously. Xcel Energy contributed $17.1 million during 2014, $17.6 million during 2013, $47.1 million during 2012 and expects to contribute approximately $12.8 million during 2015.
Plan Amendments — In 2014, there were no plan amendments made which affected the benefit obligation. The 2013 decrease of the projected Xcel Energy and PSCo postretirement health and welfare benefit obligation for plan amendments is due to changes in the participant co-pay structure for certain retiree groups.
Schedule Q-3 Page 126 of 182
Sponsor: Robinson Case No. 15-00139-UT

111
Benefit Costs — The components of Xcel Energy’s net periodic postretirement benefit costs were:
(Thousands of Dollars) 2014 2013 2012
Service cost . . . . . . . . . . . . . . . . . . . . . . . . . . . . . . . . . . . . . . . . . . . . . . . . . . . . . . . . . . . . . $ 3,457 $ 4,079 $ 4,203Interest cost . . . . . . . . . . . . . . . . . . . . . . . . . . . . . . . . . . . . . . . . . . . . . . . . . . . . . . . . . . . . . 34,028 32,141 37,861Expected return on plan assets . . . . . . . . . . . . . . . . . . . . . . . . . . . . . . . . . . . . . . . . . . . . . . (33,954) (33,011) (28,409)Amortization of transition obligation . . . . . . . . . . . . . . . . . . . . . . . . . . . . . . . . . . . . . . . . . — 825 14,320Amortization of prior service credit . . . . . . . . . . . . . . . . . . . . . . . . . . . . . . . . . . . . . . . . . . (10,688) (12,501) (7,552)Amortization of net loss . . . . . . . . . . . . . . . . . . . . . . . . . . . . . . . . . . . . . . . . . . . . . . . . . . . 11,740 22,325 16,906
Net periodic postretirement benefit cost . . . . . . . . . . . . . . . . . . . . . . . . . . . . . . . . . . . . . . 4,583 13,858 37,329Additional cost recognized due to effects of regulation . . . . . . . . . . . . . . . . . . . . . . . . . . . — — 3,891
Net benefit cost recognized for financial reporting. . . . . . . . . . . . . . . . . . . . . . . . . . . . . . $ 4,583 $ 13,858 $ 41,220
2014 2013 2012
Significant Assumptions Used to Measure Costs:Discount rate . . . . . . . . . . . . . . . . . . . . . . . . . . . . . . . . . . . . . . . . . . . . . . . . . . . . . . . . . . . . 4.82% 4.10% 5.00%Expected average long-term rate of return on assets. . . . . . . . . . . . . . . . . . . . . . . . . . . . . . 7.17 7.11 6.75
Projected Benefit Payments
The following table lists Xcel Energy’s projected benefit payments for the pension and postretirement benefit plans:
(Thousands of Dollars)
ProjectedPension Benefit
Payments
Gross ProjectedPostretirement
Health CareBenefit Payments
ExpectedMedicare Part D
Subsidies
Net ProjectedPostretirement
Health CareBenefit Payments
2015 . . . . . . . . . . . . . . . . . . . . . . . . . . . . . . . . . . . . . . . . . . . . . . $ 247,479 $ 48,398 $ 2,670 $ 45,7282016 . . . . . . . . . . . . . . . . . . . . . . . . . . . . . . . . . . . . . . . . . . . . . . 269,953 48,665 2,836 45,8292017 . . . . . . . . . . . . . . . . . . . . . . . . . . . . . . . . . . . . . . . . . . . . . . 260,182 48,519 3,005 45,5142018 . . . . . . . . . . . . . . . . . . . . . . . . . . . . . . . . . . . . . . . . . . . . . . 267,406 48,977 3,170 45,8072019 . . . . . . . . . . . . . . . . . . . . . . . . . . . . . . . . . . . . . . . . . . . . . . 269,809 48,461 3,327 45,1342020-2024 . . . . . . . . . . . . . . . . . . . . . . . . . . . . . . . . . . . . . . . . . 1,352,192 230,692 18,721 211,971
Multiemployer Plans
NSP-Minnesota and NSP-Wisconsin each contribute to several union multiemployer pension and other postretirement benefit plans, none of which are individually significant. These plans provide pension and postretirement health care benefits to certain union employees, including electrical workers, boilermakers, and other construction and facilities workers who may perform services for more than one employer during a given period and do not participate in the NSP-Minnesota and NSP-Wisconsin sponsored pension and postretirement health care plans. Contributing to these types of plans creates risk that differs from providing benefits under NSP-Minnesota and NSP-Wisconsin sponsored plans, in that if another participating employer ceases to contribute to a multiemployer plan, additional unfunded obligations may need to be funded over time by remaining participating employers.
Contributions to multiemployer plans were as follows for the years ended Dec. 31, 2014, 2013 and 2012. The average number of NSP-Minnesota union employees covered by the multiemployer pension plans decreased to approximately 1,000 in 2014 from approximately 1,100 in 2013. There were no other significant changes to the nature or magnitude of the participation of NSP-Minnesota and NSP-Wisconsin in multiemployer plans for the years presented:
(Thousands of Dollars) 2014 2013 2012
Multiemployer pension contributions:NSP-Minnesota . . . . . . . . . . . . . . . . . . . . . . . . . . . . . . . . . . . . . . . . . . . . . . . . . . . . . . . . . $ 20,254 $ 23,515 $ 14,984NSP-Wisconsin . . . . . . . . . . . . . . . . . . . . . . . . . . . . . . . . . . . . . . . . . . . . . . . . . . . . . . . . . 156 130 163
Total . . . . . . . . . . . . . . . . . . . . . . . . . . . . . . . . . . . . . . . . . . . . . . . . . . . . . . . . . . . . . . . $ 20,410 $ 23,645 $ 15,147Multiemployer other postretirement benefit contributions:
NSP-Minnesota . . . . . . . . . . . . . . . . . . . . . . . . . . . . . . . . . . . . . . . . . . . . . . . . . . . . . . . . . $ 273 $ 390 $ 197Total . . . . . . . . . . . . . . . . . . . . . . . . . . . . . . . . . . . . . . . . . . . . . . . . . . . . . . . . . . . . . . . $ 273 $ 390 $ 197
Schedule Q-3 Page 127 of 182
Sponsor: Robinson Case No. 15-00139-UT

112
10. Other Income, Net
Other income, net for the years ended Dec. 31 consisted of the following:
(Thousands of Dollars) 2014 2013 2012
Interest income . . . . . . . . . . . . . . . . . . . . . . . . . . . . . . . . . . . . . . . . . . . . . . . . . . $ 7,353 $ 8,343 $ 10,327Other nonoperating income . . . . . . . . . . . . . . . . . . . . . . . . . . . . . . . . . . . . . . . . 4,866 3,025 3,483Insurance policy expense . . . . . . . . . . . . . . . . . . . . . . . . . . . . . . . . . . . . . . . . . . (6,923) (8,292) (7,365)Other nonoperating expense . . . . . . . . . . . . . . . . . . . . . . . . . . . . . . . . . . . . . . . . — (104) (270)
Other income, net . . . . . . . . . . . . . . . . . . . . . . . . . . . . . . . . . . . . . . . . . . . . . . . $ 5,296 $ 2,972 $ 6,175
11. Fair Value of Financial Assets and Liabilities
Fair Value Measurements
The accounting guidance for fair value measurements and disclosures provides a single definition of fair value and requires certain disclosures about assets and liabilities measured at fair value. A hierarchical framework for disclosing the observability of the inputs utilized in measuring assets and liabilities at fair value is established by this guidance. The three levels in the hierarchy are as follows:
Level 1 — Quoted prices are available in active markets for identical assets or liabilities as of the reporting date. The types of assets and liabilities included in Level 1 are highly liquid and actively traded instruments with quoted prices.
Level 2 — Pricing inputs are other than quoted prices in active markets, but are either directly or indirectly observable as of the reporting date. The types of assets and liabilities included in Level 2 are typically either comparable to actively traded securities or contracts, or priced with models using highly observable inputs.
Level 3 — Significant inputs to pricing have little or no observability as of the reporting date. The types of assets and liabilities included in Level 3 are those valued with models requiring significant management judgment or estimation.
Specific valuation methods include the following:
Cash equivalents — The fair values of cash equivalents are generally based on cost plus accrued interest; money market funds are measured using quoted net asset values.
Investments in equity securities and other funds — Equity securities are valued using quoted prices in active markets. The fair values for commingled funds, international equity funds, private equity investments and real estate investments are measured using net asset values, which take into consideration the value of underlying fund investments, as well as the other accrued assets and liabilities of a fund, in order to determine a per-share market value. The investments in commingled funds and international equity funds may be redeemed for net asset value with proper notice. Proper notice varies by fund and can range from daily with one or two days notice to annually with 90 days notice. Private equity investments require approval of the fund for any unscheduled redemption, and such redemptions may be approved or denied by the fund at its sole discretion. Unscheduled distributions from real estate investments may be redeemed with proper notice, which is typically quarterly with 45-90 days notice; however, withdrawals from real estate investments may be delayed or discounted as a result of fund illiquidity. Based on Xcel Energy’s evaluation of its ability to redeem private equity and real estate investments, fair value measurements for private equity and real estate investments have been assigned a Level 3.
Investments in debt securities — Fair values for debt securities are determined by a third party pricing service using recent trades and observable spreads from benchmark interest rates for similar securities.
Interest rate derivatives — The fair values of interest rate derivatives are based on broker quotes that utilize current market interest rate forecasts.
Schedule Q-3 Page 128 of 182
Sponsor: Robinson Case No. 15-00139-UT

113
Commodity derivatives — The methods used to measure the fair value of commodity derivative forwards and options utilize forward prices and volatilities, as well as pricing adjustments for specific delivery locations, and are generally assigned a Level 2. When contractual settlements extend to periods beyond those readily observable on active exchanges or quoted by brokers, the significance of the use of less observable forecasts of long-term forward prices and volatilities on a valuation is evaluated, and may result in Level 3 classification.
Electric commodity derivatives held by NSP-Minnesota include transmission congestion instruments purchased from MISO, PJM, ERCOT, SPP and NYISO, generally referred to as FTRs. Electric commodity derivatives held by SPS include FTRs purchased from SPP. FTRs purchased from an RTO are financial instruments that entitle or obligate the holder to monthly revenues or charges based on transmission congestion across a given transmission path. The value of an FTR is derived from, and designed to offset, the cost of energy congestion, which is caused by overall transmission load and other transmission constraints. In addition to overall transmission load, congestion is also influenced by the operating schedules of power plants and the consumption of electricity pertinent to a given transmission path. Unplanned plant outages, scheduled plant maintenance, changes in the relative costs of fuels used in generation, weather and overall changes in demand for electricity can each impact the operating schedules of the power plants on the transmission grid and the value of an FTR. The valuation process for FTRs utilizes complex iterative modeling to predict the impacts of forecasted changes in these drivers of transmission system congestion on the historical pricing of FTR purchases.
If forecasted costs of electric transmission congestion increase or decrease for a given FTR path, the value of that particular FTR instrument will likewise increase or decrease. Given the limited observability of management’s forecasts for several of the inputs to this complex valuation model – including expected plant operating schedules and retail and wholesale demand, fair value measurements for FTRs have been assigned a Level 3. Non-trading monthly FTR settlements are included in the FCA as applicable in each jurisdiction, and therefore changes in the fair value of the yet to be settled portions of most FTRs are deferred as a regulatory asset or liability. Given this regulatory treatment and the limited magnitude of FTRs relative to the electric utility operations of NSP-Minnesota and SPS, the numerous unobservable quantitative inputs to the complex model used for valuation of FTRs are insignificant to the consolidated financial statements of Xcel Energy.
Non-Derivative Instruments Fair Value Measurements
The NRC requires NSP-Minnesota to maintain a portfolio of investments to fund the costs of decommissioning its nuclear generating plants. Together with all accumulated earnings or losses, the assets of the nuclear decommissioning fund are legally restricted for the purpose of decommissioning the Monticello and PI nuclear generating plants. The fund contains cash equivalents, debt securities, equity securities and other investments – all classified as available-for-sale. NSP-Minnesota uses the MPUC approved asset allocation for the escrow and investment targets by asset class for both the escrow and qualified trust.
NSP-Minnesota recognizes the costs of funding the decommissioning of its nuclear generating plants over the lives of the plants, assuming rate recovery of all costs. Given the purpose and legal restrictions on the use of nuclear decommissioning fund assets, realized and unrealized gains on fund investments over the life of the fund are deferred as an offset of NSP-Minnesota’s regulatory asset for nuclear decommissioning costs. Consequently, any realized and unrealized gains and losses on securities in the nuclear decommissioning fund, including any other-than-temporary impairments, are deferred as a component of the regulatory asset for nuclear decommissioning.
Unrealized gains for the nuclear decommissioning fund were $312.1 million and $240.3 million at Dec. 31, 2014 and 2013, respectively, and unrealized losses and amounts recorded as other-than-temporary impairments were $74.1 million and $58.5 million at Dec. 31, 2014 and 2013, respectively.
Schedule Q-3 Page 129 of 182
Sponsor: Robinson Case No. 15-00139-UT

114
The following tables present the cost and fair value of Xcel Energy’s non-derivative instruments with recurring fair value measurements in the nuclear decommissioning fund at Dec. 31, 2014 and 2013:
Dec. 31, 2014Fair Value
(Thousands of Dollars) Cost Level 1 Level 2 Level 3 Total
Nuclear decommissioning fund (a)
Cash equivalents . . . . . . . . . . . . . . . . . . . . . . . . . . . . . $ 24,184 $ 24,184 $ — $ — $ 24,184Commingled funds. . . . . . . . . . . . . . . . . . . . . . . . . . . . 470,013 — 465,615 — 465,615International equity funds . . . . . . . . . . . . . . . . . . . . . . 80,454 — 78,721 — 78,721Private equity investments . . . . . . . . . . . . . . . . . . . . . . 73,936 — — 101,237 101,237Real estate . . . . . . . . . . . . . . . . . . . . . . . . . . . . . . . . . . 43,859 — — 64,249 64,249Debt securities:
Government securities. . . . . . . . . . . . . . . . . . . . . . . 30,674 — 28,808 — 28,808U.S. corporate bonds . . . . . . . . . . . . . . . . . . . . . . . . 81,463 — 77,562 — 77,562International corporate bonds . . . . . . . . . . . . . . . . . 16,950 — 16,341 — 16,341Municipal bonds . . . . . . . . . . . . . . . . . . . . . . . . . . . 242,282 — 249,201 — 249,201Asset-backed securities . . . . . . . . . . . . . . . . . . . . . . 9,131 — 9,250 — 9,250Mortgage-backed securities . . . . . . . . . . . . . . . . . . 23,225 — 23,895 — 23,895
Equity securities:Common stock . . . . . . . . . . . . . . . . . . . . . . . . . . . . 369,751 564,858 — — 564,858Total. . . . . . . . . . . . . . . . . . . . . . . . . . . . . . . . . . . . . $ 1,465,922 $ 589,042 $ 949,393 $ 165,486 $ 1,703,921
(a) Reported in nuclear decommissioning fund and other investments on the consolidated balance sheet, which also includes $83.1 million of equity investments in unconsolidated subsidiaries and $45.6 million of miscellaneous investments.
Dec. 31, 2013Fair Value
(Thousands of Dollars) Cost Level 1 Level 2 Level 3 Total
Nuclear decommissioning fund (a)
Cash equivalents . . . . . . . . . . . . . . . . . . . . . . . . . . . . . $ 33,281 $ 33,281 $ — $ — $ 33,281Commingled funds. . . . . . . . . . . . . . . . . . . . . . . . . . . . 457,986 — 452,227 — 452,227International equity funds . . . . . . . . . . . . . . . . . . . . . . 78,812 — 81,671 — 81,671Private equity investments . . . . . . . . . . . . . . . . . . . . . . 52,143 — — 62,696 62,696Real estate . . . . . . . . . . . . . . . . . . . . . . . . . . . . . . . . . . 45,564 — — 57,368 57,368Debt securities:
Government securities. . . . . . . . . . . . . . . . . . . . . . . 34,304 — 27,628 — 27,628U.S. corporate bonds . . . . . . . . . . . . . . . . . . . . . . . . 80,275 — 83,538 — 83,538International corporate bonds . . . . . . . . . . . . . . . . . 15,025 — 15,358 — 15,358Municipal bonds . . . . . . . . . . . . . . . . . . . . . . . . . . . 241,112 — 232,016 — 232,016
Equity securities:Common stock . . . . . . . . . . . . . . . . . . . . . . . . . . . . 406,695 581,243 — — 581,243Total. . . . . . . . . . . . . . . . . . . . . . . . . . . . . . . . . . . . . $ 1,445,197 $ 614,524 $ 892,438 $ 120,064 $ 1,627,026
(a) Reported in nuclear decommissioning fund and other investments on the consolidated balance sheet, which also includes $87.1 million of equity investments in unconsolidated subsidiaries and $41.9 million of miscellaneous investments.
Schedule Q-3 Page 130 of 182
Sponsor: Robinson Case No. 15-00139-UT

115
The following tables present the changes in Level 3 nuclear decommissioning fund investments:
(Thousands of Dollars) Jan. 1, 2014 Purchases Settlements
Gains Recognized as
Regulatory Assets (a)
Transfers Outof Level 3 Dec. 31, 2014
Private equity investments . . . . . . . $ 62,696 $ 22,078 $ (286) $ 16,749 $ — $ 101,237Real estate . . . . . . . . . . . . . . . . . . . 57,368 8,088 (9,794) 8,587 — 64,249
Total . . . . . . . . . . . . . . . . . . . . . . . $ 120,064 $ 30,166 $ (10,080) $ 25,336 $ — $ 165,486
(Thousands of Dollars) Jan. 1, 2013 Purchases Settlements
Gains Recognized as
Regulatory Assets (a)
Transfers Out of Level 3 (b) Dec. 31, 2013
Private equity investments . . . . . . . $ 33,250 $ 24,201 $ — $ 5,245 $ — $ 62,696Real estate . . . . . . . . . . . . . . . . . . . 39,074 31,626 (18,622) 5,290 — 57,368Asset-backed securities . . . . . . . . . 2,067 — — — (2,067) —Mortgage-backed securities . . . . . . 30,209 — — — (30,209) —
Total . . . . . . . . . . . . . . . . . . . . . . . $ 104,600 $ 55,827 $ (18,622) $ 10,535 $ (32,276) $ 120,064
(Thousands of Dollars) Jan. 1, 2012 Purchases Settlements
Gains (Losses) Recognized as
Regulatory Assets (a)
Transfers Outof Level 3 Dec. 31, 2012
Private equity investments . . . . . . . $ 9,203 $ 20,671 $ (1,931) $ 5,307 $ — $ 33,250Real estate . . . . . . . . . . . . . . . . . . . 26,395 9,777 (3,611) 6,513 — 39,074Asset-backed securities . . . . . . . . . 16,501 — (14,450) 16 — 2,067Mortgage-backed securities . . . . . . 78,664 33,016 (79,899) (1,572) — 30,209
Total . . . . . . . . . . . . . . . . . . . . . . . $ 130,763 $ 63,464 $ (99,891) $ 10,264 $ — $ 104,600
(a) Gains and losses are deferred as a component of the regulatory asset for nuclear decommissioning.(b) Transfers out of Level 3 into Level 2 were principally due to diminished use of unobservable inputs that were previously significant to these fair value
measurements and were subsequently sold during 2013.
The following table summarizes the final contractual maturity dates of the debt securities in the nuclear decommissioning fund, by asset class, at Dec. 31, 2014:
Final Contractual Maturity
(Thousands of Dollars)Due in 1 Year
or LessDue in 1 to 5
YearsDue in 5 to 10
YearsDue after 10
Years Total
Government securities . . . . . . . . . . . . . . . $ — $ — $ — $ 28,808 $ 28,808U.S. corporate bonds . . . . . . . . . . . . . . . . 300 15,530 62,838 (1,106) 77,562International corporate bonds . . . . . . . . . — 4,212 12,129 — 16,341Municipal bonds . . . . . . . . . . . . . . . . . . . 1,893 35,048 41,530 170,730 249,201Asset-backed securities . . . . . . . . . . . . . . — — 6,389 2,861 9,250Mortgage-backed securities. . . . . . . . . . . — — — 23,895 23,895
Debt securities. . . . . . . . . . . . . . . . . . . . $ 2,193 $ 54,790 $ 122,886 $ 225,188 $ 405,057
Derivative Instruments Fair Value Measurements
Xcel Energy enters into derivative instruments, including forward contracts, futures, swaps and options, for trading purposes and to manage risk in connection with changes in interest rates, utility commodity prices and vehicle fuel prices.
Interest Rate Derivatives — Xcel Energy enters into various instruments that effectively fix the interest payments on certain floating rate debt obligations or effectively fix the yield or price on a specified benchmark interest rate for an anticipated debt issuance for a specific period. These derivative instruments are generally designated as cash flow hedges for accounting purposes.
At Dec. 31, 2014, accumulated other comprehensive losses related to interest rate derivatives included $2.8 million of net losses expected to be reclassified into earnings during the next 12 months as the related hedged interest rate transactions impact earnings, including forecasted amounts for unsettled hedges, as applicable.
Schedule Q-3 Page 131 of 182
Sponsor: Robinson Case No. 15-00139-UT

116
Wholesale and Commodity Trading Risk — Xcel Energy Inc.’s utility subsidiaries conduct various wholesale and commodity trading activities, including the purchase and sale of electric capacity, energy and energy-related instruments. Xcel Energy’s risk management policy allows management to conduct these activities within guidelines and limitations as approved by its risk management committee, which is made up of management personnel not directly involved in the activities governed by this policy.
Commodity Derivatives — Xcel Energy enters into derivative instruments to manage variability of future cash flows from changes in commodity prices in its electric and natural gas operations, as well as for trading purposes. This could include the purchase or sale of energy or energy-related products, natural gas to generate electric energy, natural gas for resale, FTRs, vehicle fuel and weather derivatives.
At Dec. 31, 2014, Xcel Energy had various vehicle fuel contracts designated as cash flow hedges extending through December 2016. Xcel Energy also enters into derivative instruments that mitigate commodity price risk on behalf of electric and natural gas customers but are not designated as qualifying hedging transactions. Changes in the fair value of non-trading commodity derivative instruments are recorded in OCI or deferred as a regulatory asset or liability. The classification as a regulatory asset or liability is based on commission approved regulatory recovery mechanisms. Xcel Energy recorded immaterial amounts to income related to the ineffectiveness of cash flow hedges for the years ended Dec. 31, 2014 and 2013.
At Dec. 31, 2014, net losses related to commodity derivative cash flow hedges recorded as a component of accumulated other comprehensive losses included $0.1 million of net losses expected to be reclassified into earnings during the next 12 months as the hedged transactions occur.
Additionally, Xcel Energy enters into commodity derivative instruments for trading purposes not directly related to commodity price risks associated with serving its electric and natural gas customers. Changes in the fair value of these commodity derivatives are recorded in electric operating revenues, net of amounts credited to customers under margin-sharing mechanisms.
The following table details the gross notional amounts of commodity forwards, options and FTRs at Dec. 31:
(Amounts in Thousands) (a)(b) 2014 2013
MWh of electricity . . . . . . . . . . . . . . . . . . . . . . . . . . . . . . . . . . . . . . . . . . . . . . . . . . . . . . . . . . . . 56,361 58,423MMBtu of natural gas . . . . . . . . . . . . . . . . . . . . . . . . . . . . . . . . . . . . . . . . . . . . . . . . . . . . . . . . . 927 9,854Gallons of vehicle fuel . . . . . . . . . . . . . . . . . . . . . . . . . . . . . . . . . . . . . . . . . . . . . . . . . . . . . . . . . 282 482
(a) Amounts are not reflective of net positions in the underlying commodities.(b) Notional amounts for options are included on a gross basis, but are weighted for the probability of exercise.
Consideration of Credit Risk and Concentrations — Xcel Energy continuously monitors the creditworthiness of the counterparties to its interest rate derivatives and commodity derivative contracts prior to settlement, and assesses each counterparty’s ability to perform on the transactions set forth in the contracts. Given this assessment, as well as an assessment of the impact of Xcel Energy’s own credit risk when determining the fair value of derivative liabilities, the impact of considering credit risk was immaterial to the fair value of unsettled commodity derivatives presented in the consolidated balance sheets.
Xcel Energy Inc. and its subsidiaries employ additional credit risk control mechanisms when appropriate, such as letters of credit, parental guarantees, standardized master netting agreements and termination provisions that allow for offsetting of positive and negative exposures. Credit exposure is monitored and, when necessary, the activity with a specific counterparty is limited until credit enhancement is provided.
Xcel Energy’s utility subsidiaries’ most significant concentrations of credit risk with particular entities or industries are contracts with counterparties to their wholesale, trading and non-trading commodity activities. At Dec. 31, 2014, four of Xcel Energy’s 10 most significant counterparties for these activities, comprising $56.2 million or 23 percent of this credit exposure, had investment grade credit ratings from S&P’s, Moody’s or Fitch Ratings. The remaining six most significant counterparties, comprising $65.6 million or 27 percent of this credit exposure at Dec. 31, 2014, were not rated by these agencies, but based on Xcel Energy’s internal analysis, had credit quality consistent with investment grade. All 10 of these significant counterparties are municipal or cooperative electric entities or other utilities.
Schedule Q-3 Page 132 of 182
Sponsor: Robinson Case No. 15-00139-UT

117
Financial Impact of Qualifying Cash Flow Hedges — The impact of qualifying interest rate and vehicle fuel cash flow hedges on Xcel Energy’s accumulated other comprehensive loss, included in the consolidated statements of common stockholders’ equity and in the consolidated statements of comprehensive income, is detailed in the following table:
(Thousands of Dollars) 2014 2013 2012
Accumulated other comprehensive loss related to cash flow hedges at Jan. 1 . . . . . . . . . . . . $ (59,753) $ (61,241) $ (45,738)After-tax net unrealized gains (losses) related to derivatives accounted for as hedges . . . . . . (163) 12 (19,200)After-tax net realized losses on derivative transactions reclassified into earnings . . . . . . . . . 2,288 1,476 3,697Accumulated other comprehensive loss related to cash flow hedges at Dec. 31 . . . . . . . . . . . $ (57,628) $ (59,753) $ (61,241)
The following tables detail the impact of derivative activity during the years ended Dec. 31, 2014, 2013 and 2012, on accumulated other comprehensive loss, regulatory assets and liabilities, and income:
Year Ended Dec. 31, 2014Pre-Tax Fair Value
Gains (Losses) RecognizedDuring the Period in:
Pre-Tax (Gains) LossesReclassified into IncomeDuring the Period from: Pre-Tax Gains
(Losses)Recognized
During the Period in Income(Thousands of Dollars)
AccumulatedOther
ComprehensiveLoss
Regulatory(Assets) andLiabilities
AccumulatedOther
ComprehensiveLoss
RegulatoryAssets and(Liabilities)
Derivatives designated as cashflow hedges
Interest rate . . . . . . . . . . . . . . . . . $ — $ — $ 3,836 (a) $ — $ —Vehicle fuel and other
commodity. . . . . . . . . . . . . . . . (266) — (55) (b) — —Total . . . . . . . . . . . . . . . . . . . . $ (266) $ — $ 3,781 $ — $ —
Other derivative instrumentsCommodity trading . . . . . . . . . . . $ — $ — $ — $ — $ 881 (c)
Electric commodity . . . . . . . . . . . — (8,306) — (9,036) (d) —Natural gas commodity . . . . . . . . — 5,166 — (13,997) (e) (13,220) (e)
Other commodity . . . . . . . . . . . . — — — — 643 (c)
Total . . . . . . . . . . . . . . . . . . . . $ — $ (3,140) $ — $ (23,033) $ (11,696)
Year Ended Dec. 31, 2013Pre-Tax Fair Value
Gains (Losses) RecognizedDuring the Period in:
Pre-Tax (Gains) LossesReclassified into IncomeDuring the Period from: Pre-Tax Gains
(Losses)Recognized
During the Periodin Income(Thousands of Dollars)
AccumulatedOther
ComprehensiveLoss
Regulatory(Assets) andLiabilities
AccumulatedOther
ComprehensiveLoss
RegulatoryAssets and(Liabilities)
Derivatives designated as cashflow hedges
Interest rate . . . . . . . . . . . . . . . . . $ — $ — $ 4,107 (a) $ — $ —Vehicle fuel and other
commodity. . . . . . . . . . . . . . . . 29 — (90) (b) — —Total . . . . . . . . . . . . . . . . . . . . $ 29 $ — $ 4,017 $ — $ —
Other derivative instrumentsCommodity trading . . . . . . . . . . . $ — $ — $ — $ — $ 11,221 (c)
Electric commodity . . . . . . . . . . . — 75,817 — (52,796) (d) —Natural gas commodity . . . . . . . . — (3,088) — 5,019 (e) (6,589) (d)
Total . . . . . . . . . . . . . . . . . . . . $ — $ 72,729 $ — $ (47,777) $ 4,632
Schedule Q-3 Page 133 of 182
Sponsor: Robinson Case No. 15-00139-UT

118
Year Ended Dec. 31, 2012Pre-Tax Fair Value
Gains (Losses) RecognizedDuring the Period in:
Pre-Tax (Gains) LossesReclassified into IncomeDuring the Period from: Pre-Tax Gains
(Losses)Recognized
During the Periodin Income(Thousands of Dollars)
AccumulatedOther
ComprehensiveLoss
Regulatory(Assets) andLiabilities
AccumulatedOther
ComprehensiveLoss
RegulatoryAssets and(Liabilities)
Derivatives designated as cashflow hedges
Interest rate . . . . . . . . . . . . . . . . . $ (31,913) $ — $ 6,582 (a) $ — $ —Vehicle fuel and other
commodity. . . . . . . . . . . . . . . . 120 — (198) (b) — —Total . . . . . . . . . . . . . . . . . . . . $ (31,793) $ — $ 6,384 $ — $ —
Other derivative instrumentsCommodity trading . . . . . . . . . . . $ — $ — $ — $ — $ 12,226 (c)
Electric commodity . . . . . . . . . . . — 44,162 — (39,999) (d) —Natural gas commodity . . . . . . . . — (10,809) — 80,902 (e) (137) (d)
Total . . . . . . . . . . . . . . . . . . . . $ — $ 33,353 $ — $ 40,903 $ 12,089
(a) Amounts are recorded to interest charges.(b) Amounts are recorded to O&M expenses.(c) Amounts are recorded to electric operating revenues. Portions of these gains and losses are subject to sharing with electric customers through margin-sharing
mechanisms and deducted from gross revenue, as appropriate.(d) Amounts are recorded to electric fuel and purchased power. These derivative settlement gains and losses are shared with electric customers through fuel and
purchased energy cost-recovery mechanisms, and reclassified out of income as regulatory assets or liabilities, as appropriate.(e) Amounts for the year ended Dec. 31, 2012 included $5.0 million of settlement losses on derivatives entered to mitigate natural gas price risk for electric
generation, recorded to electric fuel and purchased power, subject to cost-recovery mechanisms and reclassified to a regulatory asset, as appropriate. Such losses for the years ended Dec. 31, 2014 and 2013 were immaterial. The remaining settlement losses for the years ended Dec. 31, 2014, 2013 and 2012 relate to natural gas operations and are recorded to cost of natural gas sold and transported. These losses are subject to cost-recovery mechanisms and reclassified out of income to a regulatory asset, as appropriate.
Xcel Energy had no derivative instruments designated as fair value hedges during the years ended Dec. 31, 2014, 2013 and 2012. Therefore, no gains or losses from fair value hedges or related hedged transactions were recognized for these periods.
Credit Related Contingent Features — Contract provisions for derivative instruments that the utility subsidiaries enter, including those recorded to the consolidated balance sheet at fair value, as well as those accounted for as normal purchase-normal sale contracts and therefore not reflected on the balance sheet, may require the posting of collateral or settlement of the contracts for various reasons, including if the applicable utility subsidiary is unable to maintain its credit ratings. At Dec. 31, 2014, there were no derivative instruments with contract provisions that required the posting of collateral or settlement of the contracts. If the credit ratings of Xcel Energy Inc.’s utility subsidiaries were downgraded below investment grade, derivative instruments reflected in a $1.4 million gross liability position on the consolidated balance sheets at Dec. 31, 2013, would have required Xcel Energy Inc.’s utility subsidiaries to post collateral or settle outstanding contracts, including other contracts subject to master netting agreements, which would have resulted in payments of $1.4 million at Dec. 31, 2013. At Dec. 31, 2013, there was no collateral posted on these specific contracts.
Certain derivative instruments are also subject to contract provisions that contain adequate assurance clauses. These provisions allow counterparties to seek performance assurance, including cash collateral, in the event that a given utility subsidiary’s ability to fulfill its contractual obligations is reasonably expected to be impaired. Xcel Energy had no collateral posted related to adequate assurance clauses in derivative contracts as of Dec. 31, 2014 and 2013.
Schedule Q-3 Page 134 of 182
Sponsor: Robinson Case No. 15-00139-UT

119
Recurring Fair Value Measurements — The following table presents for each of the fair value hierarchy levels, Xcel Energy’s derivative assets and liabilities measured at fair value on a recurring basis at Dec. 31, 2014:
Dec. 31, 2014Fair Value Fair Value
TotalCounterparty
Netting (b)(Thousands of Dollars) Level 1 Level 2 Level 3 Total
Current derivative assetsOther derivative instruments:
Commodity trading. . . . . . . . . . . . . . . . . . . . . . . . . . $ — $ 14,326 $ 4,732 $ 19,058 $ (3,240) $ 15,818Electric commodity. . . . . . . . . . . . . . . . . . . . . . . . . . — — 62,825 62,825 (11,402) 51,423Natural gas commodity. . . . . . . . . . . . . . . . . . . . . . . — 381 — 381 (22) 359
Total current derivative assets. . . . . . . . . . . . . . . $ — $ 14,707 $ 67,557 $ 82,264 $ (14,664) 67,600PPAs (a) . . . . . . . . . . . . . . . . . . . . . . . . . . . . . . . . . . . . 18,123
Current derivative instruments . . . . . . . . . . . . . . $ 85,723Noncurrent derivative assetsOther derivative instruments:
Commodity trading. . . . . . . . . . . . . . . . . . . . . . . . . . $ — $ 17,617 $ — $ 17,617 $ (4,151) $ 13,466Total noncurrent derivative assets. . . . . . . . . . . . $ — $ 17,617 $ — $ 17,617 $ (4,151) 13,466
PPAs (a) . . . . . . . . . . . . . . . . . . . . . . . . . . . . . . . . . . . . 40,309Noncurrent derivative instruments . . . . . . . . . . . $ 53,775
Dec. 31, 2014Fair Value Fair Value
TotalCounterparty
Netting (b)(Thousands of Dollars) Level 1 Level 2 Level 3 TotalCurrent derivative liabilitiesDerivatives designated as cash flow hedges:
Vehicle fuel and other commodity . . . . . . . . . . . . . . $ — $ 118 $ — $ 118 $ — $ 118Other derivative instruments:
Commodity trading. . . . . . . . . . . . . . . . . . . . . . . . . . — 7,974 — 7,974 (7,974) —Electric commodity. . . . . . . . . . . . . . . . . . . . . . . . . . — — 11,402 11,402 (11,402) —
Natural gas commodity. . . . . . . . . . . . . . . . . . . . . . . — 548 — 548 (21) 527Total current derivative liabilities . . . . . . . . . . . . $ — $ 8,640 $ 11,402 $ 20,042 $ (19,397) 645
PPAs (a) . . . . . . . . . . . . . . . . . . . . . . . . . . . . . . . . . . . . 20,987Current derivative instruments . . . . . . . . . . . . . . $ 21,632
Noncurrent derivative liabilitiesDerivatives designated as cash flow hedges:
Vehicle fuel and other commodity . . . . . . . . . . . . . . $ — $ 102 $ — $ 102 $ — $ 102Other derivative instruments:
Commodity trading. . . . . . . . . . . . . . . . . . . . . . . . . . — 6,890 — 6,890 (6,033) 857Natural gas commodity. . . . . . . . . . . . . . . . . . . . . . . — 35 — 35 — 35
Total noncurrent derivative liabilities . . . . . . . . . $ — $ 7,027 $ — $ 7,027 $ (6,033) 994PPAs (a) . . . . . . . . . . . . . . . . . . . . . . . . . . . . . . . . . . . . 182,942
Noncurrent derivative instruments . . . . . . . . . . . $ 183,936
(a) In 2003, as a result of implementing new guidance on the normal purchase exception for derivative accounting, Xcel Energy began recording several long-term PPAs at fair value due to accounting requirements related to underlying price adjustments. As these purchases are recovered through normal regulatory recovery mechanisms in the respective jurisdictions, the changes in fair value for these contracts were offset by regulatory assets and liabilities. During 2006, Xcel Energy qualified these contracts under the normal purchase exception. Based on this qualification, the contracts are no longer adjusted to fair value and the previous carrying value of these contracts will be amortized over the remaining contract lives along with the offsetting regulatory assets and liabilities.
(b) Xcel Energy nets derivative instruments and related collateral in its consolidated balance sheet when supported by a legally enforceable master netting agreement, and all derivative instruments and related collateral amounts were subject to master netting agreements at Dec. 31, 2014. At Dec. 31, 2014, derivative assets and liabilities include no obligations to return cash collateral and rights to reclaim cash collateral of $6.6 million. The counterparty netting amounts presented exclude settlement receivables and payables and non-derivative amounts that may be subject to the same master netting agreements.
Schedule Q-3 Page 135 of 182
Sponsor: Robinson Case No. 15-00139-UT

120
The following table presents for each of the fair value hierarchy levels, Xcel Energy’s derivative assets and liabilities measured at fair value on a recurring basis at Dec. 31, 2013:
Dec. 31, 2013Fair Value Fair Value
TotalCounterparty
Netting (b)(Thousands of Dollars) Level 1 Level 2 Level 3 TotalCurrent derivative assetsDerivatives designated as cash flow hedges:
Vehicle fuel and other commodity . . . . . . . . . . . . . . $ — $ 88 $ — $ 88 $ — $ 88Other derivative instruments:
Commodity trading. . . . . . . . . . . . . . . . . . . . . . . . . . — 20,610 1,167 21,777 (7,994) 13,783Electric commodity. . . . . . . . . . . . . . . . . . . . . . . . . . — — 47,112 47,112 (8,210) 38,902Natural gas commodity. . . . . . . . . . . . . . . . . . . . . . . — 5,906 — 5,906 — 5,906
Total current derivative assets. . . . . . . . . . . . . . . . $ — $ 26,604 $ 48,279 $ 74,883 $ (16,204) 58,679PPAs (a) . . . . . . . . . . . . . . . . . . . . . . . . . . . . . . . . . . . . 33,028
Current derivative instruments . . . . . . . . . . . . . . $ 91,707Noncurrent derivative assetsDerivatives designated as cash flow hedges:
Vehicle fuel and other commodity . . . . . . . . . . . . . . $ — $ 29 $ — $ 29 $ (16) $ 13Other derivative instruments:
Commodity trading. . . . . . . . . . . . . . . . . . . . . . . . . . — 32,074 3,395 35,469 (9,071) 26,398Total noncurrent derivative assets. . . . . . . . . . . . . $ — $ 32,103 $ 3,395 $ 35,498 $ (9,087) 26,411
PPAs (a) . . . . . . . . . . . . . . . . . . . . . . . . . . . . . . . . . . . . 58,431Noncurrent derivative instruments . . . . . . . . . . . $ 84,842
Dec. 31, 2013Fair Value Fair Value
TotalCounterparty
Netting (b)(Thousands of Dollars) Level 1 Level 2 Level 3 TotalCurrent derivative liabilitiesOther derivative instruments:
Commodity trading. . . . . . . . . . . . . . . . . . . . . . . . . . $ — $ 10,546 $ 1,804 $ 12,350 $ (12,002) $ 348Electric commodity. . . . . . . . . . . . . . . . . . . . . . . . . . — — 8,210 8,210 (8,210) —
Total current derivative liabilities . . . . . . . . . . . . $ — $ 10,546 $ 10,014 $ 20,560 $ (20,212) 348PPAs (a) . . . . . . . . . . . . . . . . . . . . . . . . . . . . . . . . . . . . 23,034
Current derivative instruments . . . . . . . . . . . . . . $ 23,382Noncurrent derivative liabilitiesOther derivative instruments:
Commodity trading. . . . . . . . . . . . . . . . . . . . . . . . . . $ — $ 14,382 $ — $ 14,382 $ (9,087) $ 5,295Total noncurrent derivative liabilities . . . . . . . . . $ — $ 14,382 $ — $ 14,382 $ (9,087) 5,295
PPAs (a) . . . . . . . . . . . . . . . . . . . . . . . . . . . . . . . . . . . . 203,929Noncurrent derivative instruments . . . . . . . . . . . $ 209,224
(a) In 2003, as a result of implementing new guidance on the normal purchase exception for derivative accounting, Xcel Energy began recording several long-term PPAs at fair value due to accounting requirements related to underlying price adjustments. As these purchases are recovered through normal regulatory recovery mechanisms in the respective jurisdictions, the changes in fair value for these contracts were offset by regulatory assets and liabilities. During 2006, Xcel Energy qualified these contracts under the normal purchase exception. Based on this qualification, the contracts are no longer adjusted to fair value and the previous carrying value of these contracts will be amortized over the remaining contract lives along with the offsetting regulatory assets and liabilities.
(b) Xcel Energy nets derivative instruments and related collateral in its consolidated balance sheet when supported by a legally enforceable master netting agreement, and all derivative instruments and related collateral amounts were subject to master netting agreements at Dec. 31, 2013. At Dec. 31, 2013, derivative assets and liabilities include obligations to return cash collateral of $0.2 million and rights to reclaim cash collateral of $4.2 million. The counterparty netting amounts presented exclude settlement receivables and payables and non-derivative amounts that may be subject to the same master netting agreements.
Schedule Q-3 Page 136 of 182
Sponsor: Robinson Case No. 15-00139-UT

121
The following table presents the changes in Level 3 commodity derivatives for the years ended Dec. 31, 2014, 2013 and 2012:
Year Ended Dec. 31(Thousands of Dollars) 2014 2013 2012
Balance at Jan. 1 . . . . . . . . . . . . . . . . . . . . . . . . . . . . . . . . . . . . . . . . . . . . . . . . . . . . . $ 41,660 $ 16,649 $ 12,417Purchases . . . . . . . . . . . . . . . . . . . . . . . . . . . . . . . . . . . . . . . . . . . . . . . . . . . . . . . . . 135,008 61,474 37,595Settlements . . . . . . . . . . . . . . . . . . . . . . . . . . . . . . . . . . . . . . . . . . . . . . . . . . . . . . . . (145,974) (45,199) (44,950)Transfers out of Level 3 . . . . . . . . . . . . . . . . . . . . . . . . . . . . . . . . . . . . . . . . . . . . . . (1,093) — —Net transactions recorded during the period:
Gains recognized in earnings (a) . . . . . . . . . . . . . . . . . . . . . . . . . . . . . . . . . . . . . . 10,692 3,947 463Gains recognized as regulatory liabilities . . . . . . . . . . . . . . . . . . . . . . . . . . . . . . 15,862 4,789 11,124
Balance at Dec. 31 . . . . . . . . . . . . . . . . . . . . . . . . . . . . . . . . . . . . . . . . . . . . . . . . . . . $ 56,155 $ 41,660 $ 16,649
(a) These amounts relate to commodity derivatives held at the end of the period.
Xcel Energy recognizes transfers between levels as of the beginning of each period. The transfer of amounts from Level 3 to Level 2 in the year ended Dec. 31, 2014 was due to the valuation of certain long-term derivative contracts for which observable commodity pricing forecasts became a more significant input during the period. There were no transfers of amounts between levels for derivative instruments for the years ended Dec. 31, 2013 and 2012.
Fair Value of Long-Term Debt
As of Dec. 31, 2014 and 2013, other financial instruments for which the carrying amount did not equal fair value were as follows:
2014 2013
(Thousands of Dollars)CarryingAmount Fair Value
CarryingAmount Fair Value
Long-term debt, including current portion . . . . . . . . . . . . . . . . . . $ 11,757,360 $ 13,360,236 $ 11,191,517 $ 11,878,643
The fair value of Xcel Energy’s long-term debt is estimated based on recent trades and observable spreads from benchmark interest rates for similar securities. The fair value estimates are based on information available to management as of Dec. 31, 2014 and 2013, and given the observability of the inputs to these estimates, the fair values presented for long-term debt have been assigned a Level 2.
12. Rate Matters
NSP-Minnesota
Pending and Recently Concluded Regulatory Proceedings — MPUC
NSP-Minnesota – Minnesota 2014 Multi-Year Electric Rate Case — In November 2013, NSP-Minnesota filed a two-year electric rate case with the MPUC. The rate case is based on a requested ROE of 10.25 percent, a 52.5 percent equity ratio, a 2014 average electric rate base of $6.67 billion and an additional average rate base of $412 million in 2015. The NSP-Minnesota electric rate case initially reflected a requested increase in revenues of approximately $193 million or 6.9 percent in 2014 and an additional $98 million or 3.5 percent in 2015. The request includes a proposed rate moderation plan for 2014 and 2015.
NSP-Minnesota’s moderation plan includes the acceleration of the eight-year amortization of the excess depreciation reserve and the use of expected funds from the DOE for settlement of certain claims. These DOE refunds would be in excess of amounts needed to fund NSP-Minnesota’s decommissioning expense. The interim rate adjustments are primarily associated with ROE, Monticello LCM/EPU project costs and NSP-Minnesota’s request to amortize amounts associated with the canceled PI EPU project.
In December 2013, the MPUC approved interim rates of $127 million, effective Jan. 3, 2014, subject to refund. The MPUC determined that the costs of Sherco Unit 3 would be allowed in interim rates, and that NSP-Minnesota’s request to accelerate the depreciation reserve amortization was a permissible adjustment to its interim rate request.
Schedule Q-3 Page 137 of 182
Sponsor: Robinson Case No. 15-00139-UT
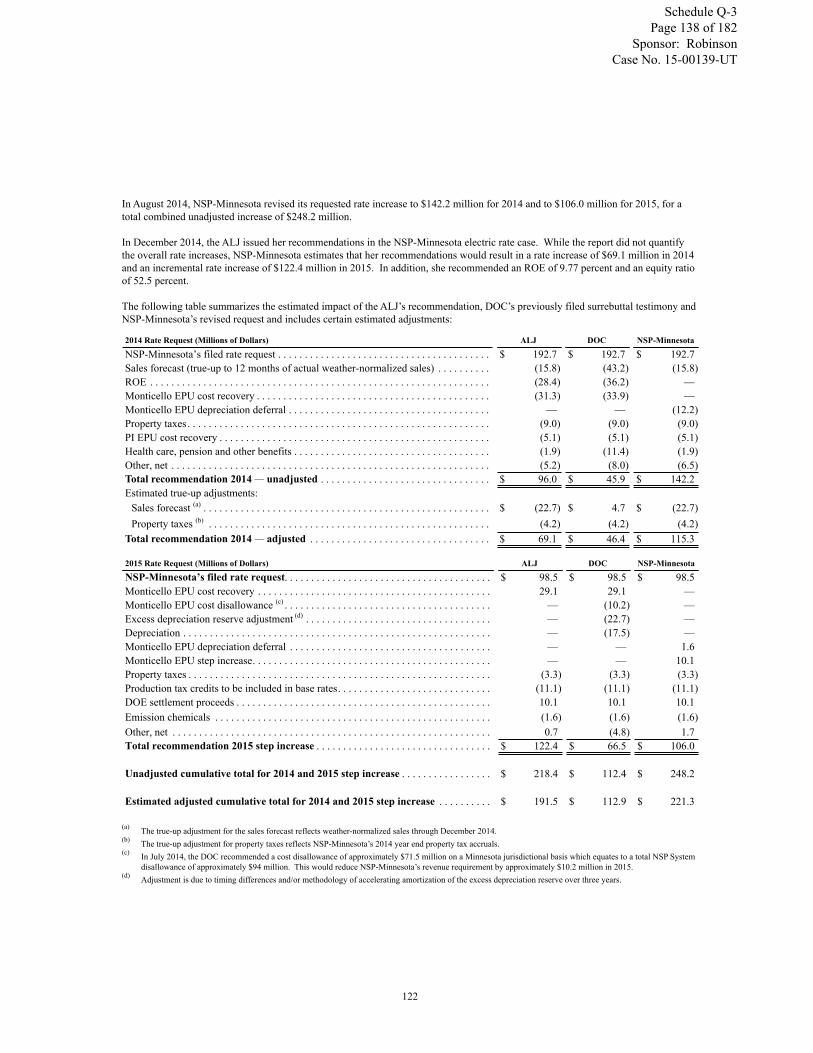
122
In August 2014, NSP-Minnesota revised its requested rate increase to $142.2 million for 2014 and to $106.0 million for 2015, for a total combined unadjusted increase of $248.2 million.
In December 2014, the ALJ issued her recommendations in the NSP-Minnesota electric rate case. While the report did not quantify the overall rate increases, NSP-Minnesota estimates that her recommendations would result in a rate increase of $69.1 million in 2014 and an incremental rate increase of $122.4 million in 2015. In addition, she recommended an ROE of 9.77 percent and an equity ratio of 52.5 percent.
The following table summarizes the estimated impact of the ALJ’s recommendation, DOC’s previously filed surrebuttal testimony and NSP-Minnesota’s revised request and includes certain estimated adjustments:
2014 Rate Request (Millions of Dollars) ALJ DOC NSP-Minnesota
NSP-Minnesota’s filed rate request . . . . . . . . . . . . . . . . . . . . . . . . . . . . . . . . . . . . . . . . $ 192.7 $ 192.7 $ 192.7Sales forecast (true-up to 12 months of actual weather-normalized sales) . . . . . . . . . . (15.8) (43.2) (15.8)ROE . . . . . . . . . . . . . . . . . . . . . . . . . . . . . . . . . . . . . . . . . . . . . . . . . . . . . . . . . . . . . . . . (28.4) (36.2) —Monticello EPU cost recovery . . . . . . . . . . . . . . . . . . . . . . . . . . . . . . . . . . . . . . . . . . . . (31.3) (33.9) —Monticello EPU depreciation deferral . . . . . . . . . . . . . . . . . . . . . . . . . . . . . . . . . . . . . . — — (12.2)Property taxes . . . . . . . . . . . . . . . . . . . . . . . . . . . . . . . . . . . . . . . . . . . . . . . . . . . . . . . . . (9.0) (9.0) (9.0)PI EPU cost recovery . . . . . . . . . . . . . . . . . . . . . . . . . . . . . . . . . . . . . . . . . . . . . . . . . . . (5.1) (5.1) (5.1)Health care, pension and other benefits . . . . . . . . . . . . . . . . . . . . . . . . . . . . . . . . . . . . . (1.9) (11.4) (1.9)Other, net . . . . . . . . . . . . . . . . . . . . . . . . . . . . . . . . . . . . . . . . . . . . . . . . . . . . . . . . . . . . (5.2) (8.0) (6.5)Total recommendation 2014 — unadjusted . . . . . . . . . . . . . . . . . . . . . . . . . . . . . . . . $ 96.0 $ 45.9 $ 142.2Estimated true-up adjustments:
Sales forecast (a) . . . . . . . . . . . . . . . . . . . . . . . . . . . . . . . . . . . . . . . . . . . . . . . . . . . . . . $ (22.7) $ 4.7 $ (22.7)Property taxes (b) . . . . . . . . . . . . . . . . . . . . . . . . . . . . . . . . . . . . . . . . . . . . . . . . . . . . . (4.2) (4.2) (4.2)
Total recommendation 2014 — adjusted . . . . . . . . . . . . . . . . . . . . . . . . . . . . . . . . . . $ 69.1 $ 46.4 $ 115.3
2015 Rate Request (Millions of Dollars) ALJ DOC NSP-Minnesota
NSP-Minnesota’s filed rate request. . . . . . . . . . . . . . . . . . . . . . . . . . . . . . . . . . . . . . . $ 98.5 $ 98.5 $ 98.5Monticello EPU cost recovery . . . . . . . . . . . . . . . . . . . . . . . . . . . . . . . . . . . . . . . . . . . . 29.1 29.1 —Monticello EPU cost disallowance (c) . . . . . . . . . . . . . . . . . . . . . . . . . . . . . . . . . . . . . . . — (10.2) —Excess depreciation reserve adjustment (d) . . . . . . . . . . . . . . . . . . . . . . . . . . . . . . . . . . . — (22.7) —Depreciation . . . . . . . . . . . . . . . . . . . . . . . . . . . . . . . . . . . . . . . . . . . . . . . . . . . . . . . . . . — (17.5) —Monticello EPU depreciation deferral . . . . . . . . . . . . . . . . . . . . . . . . . . . . . . . . . . . . . . — — 1.6Monticello EPU step increase. . . . . . . . . . . . . . . . . . . . . . . . . . . . . . . . . . . . . . . . . . . . . — — 10.1Property taxes . . . . . . . . . . . . . . . . . . . . . . . . . . . . . . . . . . . . . . . . . . . . . . . . . . . . . . . . . (3.3) (3.3) (3.3)Production tax credits to be included in base rates. . . . . . . . . . . . . . . . . . . . . . . . . . . . . (11.1) (11.1) (11.1)DOE settlement proceeds . . . . . . . . . . . . . . . . . . . . . . . . . . . . . . . . . . . . . . . . . . . . . . . . 10.1 10.1 10.1Emission chemicals . . . . . . . . . . . . . . . . . . . . . . . . . . . . . . . . . . . . . . . . . . . . . . . . . . . . (1.6) (1.6) (1.6)Other, net . . . . . . . . . . . . . . . . . . . . . . . . . . . . . . . . . . . . . . . . . . . . . . . . . . . . . . . . . . . . 0.7 (4.8) 1.7Total recommendation 2015 step increase . . . . . . . . . . . . . . . . . . . . . . . . . . . . . . . . . $ 122.4 $ 66.5 $ 106.0
Unadjusted cumulative total for 2014 and 2015 step increase . . . . . . . . . . . . . . . . . $ 218.4 $ 112.4 $ 248.2
Estimated adjusted cumulative total for 2014 and 2015 step increase . . . . . . . . . . $ 191.5 $ 112.9 $ 221.3
(a) The true-up adjustment for the sales forecast reflects weather-normalized sales through December 2014. (b) The true-up adjustment for property taxes reflects NSP-Minnesota’s 2014 year end property tax accruals.(c) In July 2014, the DOC recommended a cost disallowance of approximately $71.5 million on a Minnesota jurisdictional basis which equates to a total NSP System
disallowance of approximately $94 million. This would reduce NSP-Minnesota’s revenue requirement by approximately $10.2 million in 2015.(d) Adjustment is due to timing differences and/or methodology of accelerating amortization of the excess depreciation reserve over three years.
Schedule Q-3 Page 138 of 182
Sponsor: Robinson Case No. 15-00139-UT

123
The ALJ recommended no recovery of the Monticello EPU project costs in 2014, accepting the DOC’s argument that the EPU portion was not used and useful in 2014 and should be treated as a 2015 step project. NSP-Minnesota fully met the NRC’s requirements for the EPU as of Dec. 31, 2014. NSP-Minnesota is currently executing the power ascension plan consistent with the NRC license amendment approval and as of Dec. 31, 2014 had operated the plant using 56 MW of the additional 71 MW from the EPU. The full 71 MW of additional EPU output is expected to be attained in the first half of 2015. Although the final NRC requirements have been met, rate recovery is still subject to true-up. The ALJ recommendation does not reflect any potential adjustments for the pending Monticello prudence review.
The ALJ did not make a recommendation on the use of the surplus depreciation reserve in NSP-Minnesota’s rate moderation proposal. The table above reflects NSP-Minnesota’s filed position for the use of the proposed amortization of the surplus depreciation reserve.
The ALJ also recommended adoption of a full decoupling pilot for the residential and small C&I classes, based on actual sales, effective the month after the MPUC issues its final order in 2015. Full decoupling would eliminate the impact of weather variability on electric sales for the residential and small C&I classes for NSP-Minnesota.
NSP-Minnesota has also filed a plan for any potential refund that treats the multi-year case as a single period. In January 2015, the DOC recommended an alternative option that views each year of the multi-year case separately, which would result in lower 2015 revenues.
A current regulatory liability representing NSP-Minnesota’s best estimate of a refund obligation for 2014 associated with interim rates was recorded as of Dec. 31, 2014. The estimated amount is generally consistent with the ALJ recommendation.
The MPUC is expected to deliberate on March 26, 2015 and a final order is anticipated in the second quarter of 2015.
NSP-Minnesota – Nuclear Project Prudence Investigation — In 2013, NSP-Minnesota completed the Monticello LCM/EPU project. The multi-year project extended the life of the facility and increased the capacity from 600 to 671 MW. Monticello LCM/EPU project expenditures were approximately $665 million. Total capitalized costs were approximately $748 million, which includes AFUDC. In 2008, project expenditures were initially estimated at approximately $320 million, excluding AFUDC.
In 2013, the MPUC initiated an investigation to determine whether the final costs for the Monticello LCM/EPU project were prudent.
NSP-Minnesota filed a report to support the prudence of the incurred costs. The filing indicated the increase in costs was primarily attributable to three factors: (1) the original estimate was based on a high level conceptual design and the project scope increased as the actual conditions of the plant were incorporated into the design; (2) implementation difficulties, including the amount of work that occurred in confined and radioactive or electrically sensitive spaces and NSP-Minnesota’s and its vendors’ ability to attract and retain experienced workers; and (3) additional NRC licensing related requests over the five-plus year application process.
The cost deviation is in line with similar nuclear upgrade projects undertaken by other utilities. In addition, the project remains economically beneficial to customers. NSP-Minnesota has received all necessary licenses from the NRC for the Monticello EPU, and as of Dec. 31, 2014, has fully complied with the NRC’s license requirements for higher power levels.
In July 2014, the DOC filed testimony and recommended a disallowance of recovery of approximately $71.5 million of project costs on a Minnesota jurisdictional basis.
In August 2014, the OAG filed rebuttal testimony and recommended a disallowance of recovery of $321 million for the entire NSP System (based on a total capitalized cost of $748 million), and no return on $107 million. NSP-Minnesota believes the costs of the project were prudent and its decisions and actions do not warrant a disallowance.
In February 2015, an ALJ issued his report finding that NSP-Minnesota was imprudent in managing the project. Consistent with the DOC’s position, the ALJ proposed: (1) 85 percent of the project cost be assigned to EPU costs and applied the DOC’s cost-effectiveness test; and (2) disallowance of recovery of approximately $71.5 million of EPU costs, resulting in a reduction of $10.24 million to the 2015 revenue requirement on a Minnesota jurisdictional basis. This would equate to a total NSP System disallowance of approximately $94 million if the MPUC and other state commissions accepted this recommendation. NSP-Minnesota plans to file exceptions to the ALJ’s report with the MPUC.
Schedule Q-3 Page 139 of 182
Sponsor: Robinson Case No. 15-00139-UT

124
On Feb. 12, 2015, NSP-Minnesota, Xcel Large Industrials and the OAG filed exceptions to the ALJ’s Report, advocating their initial positions. On Feb. 17, 2015, reply comments were filed by various parties, including NSP-Minnesota. Oral arguments are scheduled to be held on March 3, 2015.
NSP-Minnesota does not expect a delay to the scheduled proceedings and a final MPUC order is anticipated in the second quarter of 2015. The MPUC decision for the Monticello prudence review is expected to be reflected in the final results of NSP-Minnesota’s pending Minnesota 2014 Multi-Year electric rate case.
NSP-Minnesota – 2015 Transmission Cost Recovery Rate Filing — In October 2014, the 2015 NSP-Minnesota TCR filing was filed with the MPUC, requesting recovery of $65.8 million of 2015 transmission investment costs not previously included in electric base rates. An MPUC decision is anticipated in the second quarter of 2015, with implementation of new rates soon after approval.
PI Nuclear Plant EPU — In 2009, the MPUC granted NSP-Minnesota a CON for an EPU project at the PI nuclear generating plant. The total estimated cost of the EPU was $294 million, of which approximately $78.9 million had been incurred through 2012, including AFUDC of approximately $12.8 million. Subsequently, NSP-Minnesota made a change of circumstances filing notifying the MPUC that there were changes in the size, timing and cost estimates for this project, revisions to economic and project design analysis and changes due to the estimated impact of revised scheduled outages. The information indicated reductions to the estimated benefit of the uprate project. As a result, NSP-Minnesota concluded that further investment in this project would not benefit customers. In February 2013, the MPUC issued an order terminating the CON for the PI EPU project.
NSP-Minnesota plans to address recovery of incurred costs in rate cases for each of the NSP-Minnesota jurisdictions. As noted, NSP-Minnesota is seeking recovery in Minnesota in its pending Minnesota 2014 Multi-Year electric rate case. In December 2014, NSP-Minnesota filed a request with the FERC for approval to recover a portion of the costs from NSP-Wisconsin through the Interchange Agreement commencing Jan. 1, 2016. The request is pending FERC action. NSP-Wisconsin plans to seek cost recovery in future rate cases. Based on the outcome of the December 2012 MPUC decision, EPU costs incurred to date were compared to the discounted value of the estimated future rate recovery based on past jurisdictional precedent, resulting in a $10.1 million pretax charge in December 2012 which is included in O&M expense for that year. The remaining PI EPU costs were deferred for future amortization corresponding with rate recovery in various NSP jurisdictions.
Pending Regulatory Proceedings — SDPUC
NSP-Minnesota – South Dakota 2015 Electric Rate Case — In June 2014, NSP-Minnesota filed a request with the SDPUC to increase South Dakota electric rates by $15.6 million annually, or 8.0 percent, effective Jan. 1, 2015. The request is based on a 2013 HTY adjusted for certain known and measurable changes for 2014 and 2015, a requested ROE of 10.25 percent, an average rate base of $433.2 million and an equity ratio of 53.86 percent. This request reflects NSP-Minnesota’s proposal to move recovery of approximately $9.0 million for certain TCR rider and Infrastructure rider projects to base rates.
Interim rates of $15.6 million, subject to refund, went into effect in January 2015. At this time, the case is in the discovery phase and further procedure scheduling may be established, as necessary during the first quarter of 2015. Final rates are anticipated to be effective mid-2015.
Electric, Purchased Gas and Resource Adjustment Clauses
CIP and CIP Rider — In December 2012, the MPUC approved reductions to the CIP financial incentive mechanisms effective for the 2013 through 2015 program years. Based on the approved savings goals, the estimated average annual electric and natural gas incentives are $30.6 million and $3.6 million, respectively.
CIP expenses are recovered through base rates and a rider that is adjusted annually.
• In December 2014, the MPUC approved NSP-Minnesota’s 2013 CIP electric and natural gas financial incentives totaling $42.7 million and $5.4 million, respectively.
• In addition, the MPUC approved NSP-Minnesota’s proposed 2014 to 2015 electric and natural gas CIP riders. NSP-Minnesota estimates 2015 recovery of $15.5 million of electric CIP expenses and $6.0 million of natural gas CIP expenses.
• This proposed recovery through the riders is in addition to an estimated $86.9 million and $3.7 million through electric and gas base rates, respectively.
Schedule Q-3 Page 140 of 182
Sponsor: Robinson Case No. 15-00139-UT

125
NSP-Minnesota – Gas Utility Infrastructure Cost (GUIC) Rider — In August 2014, NSP-Minnesota filed a GUIC rider with the MPUC for approval to recover the cost of natural gas infrastructure investments in Minnesota to improve safety and reliability. Costs include funding for pipeline assessments as well as deferred costs from NSP-Minnesota’s existing sewer separation and pipeline integrity management programs. Sewer separation costs stem from the inspection of sewer lines and the redirection of gas pipes in the event their paths are in conflict. NSP-Minnesota requested recovery of approximately $14.9 million from Minnesota gas utility customers beginning Jan. 1, 2015, including $4.8 million of deferred sewer separation and integrity management costs which is the 2015 portion of a five year amortization. In December 2014, the MPUC approved the GUIC rider for $14.7 million, with an effective date of Feb. 1, 2015.
NSP-Wisconsin
Recently Concluded Regulatory Proceedings — PSCW
NSP-Wisconsin – Wisconsin 2015 Electric Rate Case — In May 2014, NSP-Wisconsin filed a request with the PSCW to increase electric rates by $20.6 million, or 3.2 percent, effective Jan. 1, 2015. The request was for the limited purpose of updating 2015 electric rates to reflect anticipated increases in the production and transmission fixed charges and the fuel and purchased power components of the interchange agreement with NSP-Minnesota. No changes were requested to the capital structure or the 10.2 percent ROE authorized by the PSCW in the 2014 rate case. As part of an agreement with stakeholders to limit the size and scope of the case, NSP-Wisconsin also agreed to an earnings cap for 2015 only, in which 100 percent of the earnings above the authorized ROE would be refunded to customers.
In December 2014, the PSCW issued its order approving an overall increase in NSP-Wisconsin’s electric rates of approximately $14.2 million, or 2.2 percent, reflecting the updated November forecast for fuel and purchased power costs. The PSCW order was consistent with the agreement reached by the parties, as described above. The new rates were effective Jan. 1, 2015.
Pending Regulatory Proceedings — FERC
MISO ROE Complaint/ROE Adder — In November 2013, a group of customers filed a complaint at the FERC against MISO transmission owners, including NSP-Minnesota and NSP-Wisconsin. The complaint argued for a reduction in the ROE applicable to transmission formula rates in the MISO region from 12.38 percent to 9.15 percent, a prohibition on capital structures in excess of 50 percent equity, and the removal of ROE adders (including those for RTO membership and being an independent transmission company), effective Nov. 12, 2013.
In June 2014, the FERC issued an order in a different ROE proceeding adopting a new ROE methodology for electric utilities. The new ROE methodology requires electric utilities to use a two-step discounted cash flow analysis to estimate cost of equity that incorporates both short-term and long-term growth projections.
In October 2014, the FERC upheld the determination of the long-term growth rate to be used together with a short-term growth rate in its new ROE methodology. The FERC separately set the ROE complaint against the MISO transmission owners for settlement judge and hearing procedures. The FERC directed parties to apply the new ROE methodology, but denied the complaints related to equity capital structures and ROE adders. The FERC established a Nov. 12, 2013 refund effective date. The settlement judge procedures were unsuccessful. FERC action is pending. In January 2015, the ROE complaint was set for full hearing procedures, with an ALJ initial decision to be issued by November 2015 and a FERC order issued no earlier than 2016.
In November 2014, the MISO transmission owners filed a request for FERC approval of a 50 basis point RTO membership ROE adder, with collection deferred until resolution of the ROE complaint. In January 2015, the FERC approved the ROE adder, subject to the outcome of the ROE complaint. The total ROE, including the RTO membership adder, may not exceed the top of the discounted cash flow range under the new ROE methodology. In 2015, several intervenors sought rehearing of the commission order.
Schedule Q-3 Page 141 of 182
Sponsor: Robinson Case No. 15-00139-UT

126
In February 2015, a separate group of customers filed an additional complaint proposing to reduce the MISO region ROE to 8.67 percent, prior to any 50 basis point RTO adder, with a refund effective date of Feb. 12, 2015. Answers to the complaint are to be filed by March 2015.
NSP-Minnesota recorded a current liability representing the current best estimate of a refund obligation associated with the new ROE as of Dec. 31, 2014. The new FERC ROE methodology is estimated to reduce transmission revenue, net of expense, between $5 million and $7 million annually for the NSP System.
PSCo
Pending and Recently Concluded Regulatory Proceedings — CPUC
PSCo – Colorado 2014 Electric Rate Case — In 2014, PSCo filed an electric rate case with the CPUC requesting an increase in annual revenue of approximately $136.0 million, or 4.83 percent. The requested 2015 rate increase reflected approximately $100.9 million (subsequently updated to $98.7 million) for recovery of costs associated with the CACJA project. The case also requested the initiation of a CACJA rider for 2016 and 2017, which is anticipated to increase revenue recovery by approximately $34.2 million in 2016 and then decline to approximately $29.9 million in 2017. The rate filing was based on a 2015 forecast test year, a requested ROE of 10.35 percent, an electric rate base of $6.39 billion and an equity ratio of 56 percent. As part of the filing, PSCo would transfer approximately $19.9 million from the transmission rider to base rates, which would not impact customer bills. The rider would recover incremental investment and expenses associated with the CACJA project to retire certain coal plants, add pollution control equipment to other existing coal units and add natural gas generation.
In November 2014, several parties filed answer testimony, including the CPUC Staff (Staff) and the OCC. The Staff’s position was based on an ROE of 9.11 percent and a 51.24 percent equity ratio. In addition, the Staff proposed that costs associated with the CACJA project be recovered through a rider mechanism. The OCC recommended an ROE of 9.10 percent, a 52.70 percent equity ratio and that a portion of the costs associated with the CACJA project be recovered in base rates and the remainder through a rider mechanism.
In December 2014, PSCo filed rebuttal testimony, revising its requested rate increase to $107.2 million, or 3.79 percent, reflecting an ROE of 10.25 percent and updated information for both the sales and property tax forecasts. PSCo also proposed to recover all costs associated with the CACJA project through the rider beginning in 2015.
On Jan. 23, 2015, PSCo and intervenors filed a comprehensive settlement agreement, subject to CPUC approval, which would result in an overall 2015 revenue increase of approximately $53.3 million, or 1.87 percent. Key terms of the agreement include the following:
• The settlement is based on a 2013 HTY, an ROE of 9.83 percent and an equity ratio of 56 percent; • It includes the implementation of a forward-looking CACJA rider, effective Jan. 1, 2015, a forward-looking TCA rider,
effective Feb. 13, 2015 and tracking mechanisms for pension expense and property taxes; and • The agreement also includes an earnings test for 2015 through 2017, under which PSCo and customers would share in any
earnings on a 50/50 basis if the ROE recognized falls between 9.84 percent and 10.48 percent. The earnings test principles are based primarily on those established in the previous rate case.
Schedule Q-3 Page 142 of 182
Sponsor: Robinson Case No. 15-00139-UT

127
The Staff and OCC’s recommendations, PSCo’s rebuttal testimony and the terms of the settlement agreement are summarized as follows:
2015 Rate Request (Millions of Dollars) Staff OCC PSCo RebuttalSettlementAgreement
PSCo’s filed rate request . . . . . . . . . . . . . . . . . . . . . . . . . . . . . . . . . . . $ 136.0 $ 136.0 $ 136.0 $ 136.0Transfer from TCA rider to base rates . . . . . . . . . . . . . . . . . . . . . . . . . . 19.9 19.9 19.9 19.9PSCo’s filed revenue requirement deficiency. . . . . . . . . . . . . . . . . . . 155.9 155.9 155.9 155.9Lower ROE . . . . . . . . . . . . . . . . . . . . . . . . . . . . . . . . . . . . . . . . . . . . . . . (69.1) (66.5) (6.2) (27.9)Capital structure . . . . . . . . . . . . . . . . . . . . . . . . . . . . . . . . . . . . . . . . . . . (20.9) (23.7) — —Rate base adjustments (largely the removal of prepaid pension asset). . (20.8) 2.3 — —Adjustment to an HTY . . . . . . . . . . . . . . . . . . . . . . . . . . . . . . . . . . . . . . (82.5) (82.5) — (23.9)Adjustment to use 13-month average rate base. . . . . . . . . . . . . . . . . . . . (26.1) (22.0) — —Rate base adjustments for known and measurable plant through
September 2014 . . . . . . . . . . . . . . . . . . . . . . . . . . . . . . . . . . . . . . . . . . 21.9 — — —O&M expense adjustments . . . . . . . . . . . . . . . . . . . . . . . . . . . . . . . . . . . (7.2) (16.6) — —Depreciation . . . . . . . . . . . . . . . . . . . . . . . . . . . . . . . . . . . . . . . . . . . . . . — (3.8) — —Property taxes . . . . . . . . . . . . . . . . . . . . . . . . . . . . . . . . . . . . . . . . . . . . . — (12.1) (5.3) (5.3)Remove CACJA from base rates . . . . . . . . . . . . . . . . . . . . . . . . . . . . . . (62.4) — (98.7) (98.7)Updated sales forecast. . . . . . . . . . . . . . . . . . . . . . . . . . . . . . . . . . . . . . . — — (15.2) (15.2)Prepaid pension amortization . . . . . . . . . . . . . . . . . . . . . . . . . . . . . . . . . — — — 9.5Non-specified settlement adjustments . . . . . . . . . . . . . . . . . . . . . . . . . . — — — (31.7)Other, net. . . . . . . . . . . . . . . . . . . . . . . . . . . . . . . . . . . . . . . . . . . . . . . . . 0.1 0.1 (2.1) (2.1)Total base rate (decrease) increase . . . . . . . . . . . . . . . . . . . . . . . . . . . (111.1) (68.9) 28.4 (39.4)CACJA rider mechanism . . . . . . . . . . . . . . . . . . . . . . . . . . . . . . . . . . . . 54.2 — 98.7 97.0TCA rider mechanism — 2015 forecast test year. . . . . . . . . . . . . . . . . . — — — 15.6Transfer from TCA rider to base rates . . . . . . . . . . . . . . . . . . . . . . . . . . (19.9) (19.9) (19.9) (19.9)Total revenue impact. . . . . . . . . . . . . . . . . . . . . . . . . . . . . . . . . . . . . . . $ (76.8) $ (88.8) $ 107.2 $ 53.3
In addition to the revenue reflected in the table above, PSCo estimates that it will defer approximately $3.1 million of additional expenses in 2015 as a result of the settlement.
In its original rate case request, PSCo proposed to shorten the depreciable lives for certain assets, which would have resulted in a material increase in depreciation expense. As a result of the settlement, PSCo will not implement the depreciation changes, but will instead file a standalone case to address depreciation, amortization and decommissioning in early 2016. The results of the depreciation case will become effective as part of the 2018 electric rate case.
Settlement rates became effective Feb. 13, 2015 on an interim basis, subject to refund, and the CPUC is expected to issue a final decision regarding the settlement in the first quarter of 2015.
PSCo – Manufacturer’s Sales Tax Refund — PSCo has deferred 2012-2014 annual property taxes in excess of $76.7 million as part of its multi-year rate plan with the CPUC. To the extent that PSCo was successful in the manufacturer’s sales tax refund lawsuit against the Colorado Department of Revenue, PSCo was to credit such refunds first against certain legal fees, and then against the unamortized deferred property tax balance at the end of 2014.
On June 30, 2014, the Colorado Supreme Court ruled against PSCo’s claim that it was due refunds for the payment of sales taxes on purchases of certain equipment from December 1998 to December 2001. As a result of the adverse ruling, PSCo was required to reduce its 2014 property tax deferral by $10 million, as this amount will not be recovered in electric rates.
PSCo – Annual Electric Earnings Test — As part of an annual earnings test, PSCo must share with customers a portion of any annual earnings that exceed PSCo’s authorized ROE threshold of 10 percent for 2012-2014. In April 2014, PSCo filed its 2013 earnings test with the CPUC proposing a refund obligation of $45.7 million to electric customers. This tariff was approved by the CPUC in July 2014. As of Dec. 31, 2014, PSCo has also recognized management’s best estimate of the expected customer refund obligation for the 2014 earnings test of $74.0 million. PSCo will file its 2014 earnings test with the CPUC in April 2015. The final sharing obligation will be based on the CPUC-approved tariff and could vary from the current estimate.
Schedule Q-3 Page 143 of 182
Sponsor: Robinson Case No. 15-00139-UT

128
SmartGridCity (SGC) Cost Recovery — PSCo requested recovery of $45 million of capital costs and $4 million of annual O&M costs incurred to develop and operate SGC as part of its 2010 electric rate case. In 2011, the CPUC allowed recovery of approximately $28 million of the capital cost and all of the O&M costs. PSCo subsequently requested recovery of the remaining capital investment in SGC, which the CPUC denied in April 2013. Based on the ALJ’s previous recommended decision to deny recovery, PSCo recognized a $10.7 million pre-tax charge in 2012, representing the net book value of the disallowed investment, which was included in O&M expense.
Electric, Purchased Gas and Resource Adjustment Clauses
DSM and the DSMCA — The CPUC approved higher savings goals and a lower financial incentive mechanism for PSCo’s electric DSM energy efficiency programs starting in 2015. Energy efficiency and DSM costs are recovered through a combination of the DSMCA riders and base rates. DSMCA riders are adjusted biannually to capture program costs, performance incentives, and any over- or under-recoveries are trued-up in the following year. Savings goals were 384 GWh in 2014 and are 400 GWh in 2015 with incentives awarded in the year following plan achievements. PSCo is able to earn $5 million upon reaching its annual savings goal along with an incentive on five percent of net economic benefits up to a maximum annual incentive of $30 million.
The CPUC approved the 2014 PSCo electric and gas DSM budget of $87.8 million and $12.3 million, respectively. In October 2014, PSCo filed its 2015-2016 DSM plan, which proposes a 2015 DSM electric budget of $81.6 million and a gas budget of $13.1 million and a 2016 DSM electric budget of $78.7 million and gas budget of $13.6 million. A decision by the ALJ is expected in the second quarter of 2015.
REC Sharing — In 2011, the CPUC approved margin sharing on stand-alone REC transactions at 10 percent to PSCo and 90 percent to customers for 2014. In 2012, the CPUC approved an annual margin sharing on the first $20 million of margins on hybrid REC trades of 80 percent to the customers and 20 percent to PSCo. Margins in excess of the $20 million are to be shared 90 percent to the customers and 10 percent to PSCo. The CPUC authorized PSCo to return to customers unspent carbon offset funds by crediting the RESA regulatory asset balance. PSCo credited to the RESA regulatory asset balance approximately $0.6 million and $21.7 million in 2014 and 2013, respectively. The cumulative credit to the RESA regulatory asset balance was $105.1 million and $104.5 million at Dec. 31, 2014 and Dec. 31, 2013, respectively. The credits include the customers’ share of REC trading margins and the unspent share of carbon offset funds.
In September 2014, an ALJ issued a decision approving a settlement between PSCo, the CPUC Staff, and intervenors to extend the current sharing mechanism without modification through 2017.
Recently Concluded Regulatory Proceedings — FERC
PSCo Transmission Formula Rate Cases — In April 2012, PSCo filed with the FERC to revise the wholesale transmission formula rates from an HTY formula rate to a forecast transmission formula rate and to establish formula ancillary services rates. PSCo proposed that the formula rates be updated annually to reflect changes in costs, subject to a true-up. The request would increase PSCo’s wholesale transmission and ancillary services revenue by approximately $2.0 million annually.
In June 2012, the FERC issued an order accepting the proposed transmission and ancillary services formula rates, suspending the increase to November 2012, subject to refund, and setting the case for settlement judge or hearing procedures. Several wholesale customers then filed a complaint with the FERC seeking to have the transmission formula rate ROE reduced from 10.25 to 9.15 percent effective July 1, 2012.
In September 2014, PSCo and its transmission customers filed a settlement to resolve the ROE issue in the transmission rate filing and complaint. The FERC approved the settlement in October 2014, providing a 9.72 percent ROE effective retroactive to July 1, 2012 for the PSCo transmission formula rate. Refunds were provided to customers in December 2014.
PSCo – Production Formula Rate ROE Complaint — In August 2013, PSCo’s wholesale production customers filed a complaint with the FERC, and requested it reduce the stated ROEs ranging from 10.1 percent through 10.4 percent to 9.04 percent in the PSCo production sales formula rates effective Sept. 1, 2013. In September 2014, PSCo and its wholesale customers filed a settlement to resolve the complaint along with the pending transmission formula rate ROE matters. The FERC approved the settlement in October 2014, providing a 9.72 percent ROE effective for the PSCo production formula rate. Refunds were provided to customers in December 2014.
Schedule Q-3 Page 144 of 182
Sponsor: Robinson Case No. 15-00139-UT

129
SPS
Pending and Recently Concluded Regulatory Proceedings — PUCT
SPS – Texas 2015 Electric Rate Case — In December 2014, SPS filed a retail electric, non-fuel rate case in Texas with each of its Texas municipalities and the PUCT seeking an overall increase in annual revenue of approximately $64.75 million, or 6.7 percent. The filing is based on an HTY ended June 2014, adjusted for known and measurable changes, an ROE of 10.25 percent, an electric rate base of approximately $1.56 billion and an equity ratio of 53.97 percent.
As part of its request, SPS is seeking a waiver of the PUCT post-test year adjustment rule which would allow for inclusion of $442 million (SPS total company) additional capital investment for the period July 1, 2014 through Dec. 31, 2014.
The following table summarizes the net request:
(Millions of Dollars) Request
Investment for capital expenditures — post-test year adjustments . . . . . . . . . . . . . . . . . . . . . . . . . . . . . . . . . . $ 29.60Depreciation expense . . . . . . . . . . . . . . . . . . . . . . . . . . . . . . . . . . . . . . . . . . . . . . . . . . . . . . . . . . . . . . . . . . . . . 13.90Wholesale load reductions . . . . . . . . . . . . . . . . . . . . . . . . . . . . . . . . . . . . . . . . . . . . . . . . . . . . . . . . . . . . . . . . . 12.00Purchased power capacity costs. . . . . . . . . . . . . . . . . . . . . . . . . . . . . . . . . . . . . . . . . . . . . . . . . . . . . . . . . . . . . 3.20Other, net . . . . . . . . . . . . . . . . . . . . . . . . . . . . . . . . . . . . . . . . . . . . . . . . . . . . . . . . . . . . . . . . . . . . . . . . . . . . . . 6.05
Total. . . . . . . . . . . . . . . . . . . . . . . . . . . . . . . . . . . . . . . . . . . . . . . . . . . . . . . . . . . . . . . . . . . . . . . . . . . . . . . . . $ 64.75
The next steps in the procedural schedule are expected to be as follows:
• Intervenor Direct Testimony — April 1, 2015;• Staff Direct Testimony — April 8, 2015;• Staff and Intervenor Cross-Rebuttal Testimony — April 22, 2015;• Rebuttal Testimony — April 24, 2015; and• Evidentiary Hearing — May 11, 2015.
The parties have agreed the rates will be effective June 11, 2015. A PUCT decision is anticipated in the second half of 2015.
SPS – Texas 2014 Electric Rate Case — In January 2014, SPS filed a retail electric rate case in Texas seeking a net increase in annual revenue of approximately $52.7 million, or 5.8 percent. The net increase reflected a base rate increase, revenue credits transferred from base rates to rate riders or the fuel clause, and resetting the TCRF to zero when the final base rates become effective. In April 2014, SPS revised its request to a net increase of $48.1 million.
The rate filing was based on an HTY ending June 2013, a requested ROE of 10.40 percent, an electric rate base of approximately $1.27 billion and an equity ratio of 53.89 percent. The requested rate increase reflected an increase in depreciation expense of approximately $16 million.
In September 2014, SPS, PUCT staff, and intervenors filed a non-unanimous settlement agreement which would increase SPS’ rates by $37 million, or 3.5 percent, retroactive to June 1, 2014. Starting Oct. 1, 2014, SPS began collecting the rate increase through interim rates subject to refund. SPS expects to recover the rate increase for June through September 2014 through a separate surcharge, for which it has recognized approximately $15.4 million of revenue in 2014.
The settlement includes an ROE of 9.7 percent solely for the purpose of calculating the AFUDC and determining baselines in future filings for the TCRF. In October 2014, the ALJs approved the stipulation and recommended that SPS file to implement the surcharge following the PUCT’s final order.
Schedule Q-3 Page 145 of 182
Sponsor: Robinson Case No. 15-00139-UT

130
Although the parties to the settlement agreement have not prepared a calculation of the $37 million increase and do not agree about which specific costs are included, or not, in the agreed settlement revenue requirement, SPS’ reconciliation of its original request to the settlement increase is as follows:
(Millions of Dollars) Settlement Agreement
Base rate increase request, January 2014. . . . . . . . . . . . . . . . . . . . . . . . . . . . . . . . . . . . . . . . . . . . . . . . . . . . . . . . . $ 81.5Revisions for updated information. . . . . . . . . . . . . . . . . . . . . . . . . . . . . . . . . . . . . . . . . . . . . . . . . . . . . . . . . . . . . . (4.6)Revised request, April 2014. . . . . . . . . . . . . . . . . . . . . . . . . . . . . . . . . . . . . . . . . . . . . . . . . . . . . . . . . . . . . . . . . . . 76.9Remove proposed increase in depreciation . . . . . . . . . . . . . . . . . . . . . . . . . . . . . . . . . . . . . . . . . . . . . . . . . . . . . . . (16.0)Remove adjustment allocators for certain wholesale load reduction. . . . . . . . . . . . . . . . . . . . . . . . . . . . . . . . . . . . (12.0)Revised amortizations (rate case expenses, pension and other post-employment benefits expense and gain on
sale to Lubbock) . . . . . . . . . . . . . . . . . . . . . . . . . . . . . . . . . . . . . . . . . . . . . . . . . . . . . . . . . . . . . . . . . . . . . . . . . . (9.0)Non-specified settlement adjustments . . . . . . . . . . . . . . . . . . . . . . . . . . . . . . . . . . . . . . . . . . . . . . . . . . . . . . . . . . . (2.9)Settlement base rate increase . . . . . . . . . . . . . . . . . . . . . . . . . . . . . . . . . . . . . . . . . . . . . . . . . . . . . . . . . . . . . . . . . . $ 37.0
In December 2014, the PUCT approved the settlement and authorized SPS to file to implement the surcharge. In January 2015, SPS filed an application to implement a surcharge of approximately $15.6 million, including interest, to be recovered from March through June 2015, subject to a true-up. A hearing was held in February 2015 and a decision is expected in the first quarter of 2015.
Electric, Purchased Gas and Resource Adjustment Clauses
TCRF Rider — In November 2013, SPS filed with the PUCT to implement the TCRF for Texas retail customers. The requested increase in revenues was $13 million. The PUCT issued an order allowing the TCRF to go into effect on an interim basis effective Jan. 1, 2014. In May 2014, the ALJ terminated the interim TCRF due to a settlement in principle being reached with intervenors and the PUCT staff in the pending Texas electric rate case. In July 2014, the PUCT approved the settlement agreement between the parties allowing SPS to recover $4 million annually through the TCRF. In September 2014, SPS filed a proposal with the PUCT to refund approximately $3.7 million during November 2014 for interim rates collected in excess of the final rates approved. Under a settlement among the parties, SPS implemented the refund in November 2014, pending PUCT approval. The PUCT approved the refund on Dec. 18, 2014.
Pending Regulatory Proceedings — NMPRC
SPS – New Mexico 2014 Electric Rate Case — In December 2012, SPS filed an electric rate case in New Mexico with the NMPRC for an increase in annual revenue of approximately $45.9 million effective in 2014. The rate filing was based on a 2014 FTY, a requested ROE of 10.65 percent, an electric rate base of $479.8 million and an equity ratio of 53.89 percent.
In September 2013, SPS filed rebuttal testimony, revising its requested rate increase to $32.5 million, based on updated information and an ROE of 10.25 percent. The request reflected a base and fuel increase of $20.9 million, an increase of rider revenue of $12.1 million and a decrease to other of $0.5 million.
In March 2014, the NMPRC approved an overall increase of approximately $33.1 million. The increase reflects a base rate increase of $12.7 million and rider recovery of $18.1 million for renewable energy costs, both based on an ROE of 9.96 percent and an equity ratio of 53.89 percent. Final rates were effective April 5, 2014. In April 2014, the NMAG filed a request for rehearing. The rehearing request was denied by the NMPRC. In June 2014, the NMAG filed an appeal of the NMPRC’s denial to the New Mexico Supreme Court. A decision is expected by the second quarter of 2016.
Pending and Recently Concluded Regulatory Proceedings — FERC
SPS – Wholesale Rate Complaints — In April 2012, Golden Spread, a wholesale cooperative customer, filed a rate complaint alleging that the base ROE included in the SPS production formula rate of 10.25 percent, and the SPS transmission base formula rate ROE of 10.77 percent, are unjust and unreasonable. In July 2013, Golden Spread filed a second complaint, again asking that the base ROE in the SPS production and transmission formula rates be reduced to 9.15 and 9.65 percent, respectively.
In June 2014, the FERC issued orders consolidating the Golden Spread ROE complaints and setting them for settlement judge procedures and hearings and indicated the parties should apply the new two-step discounted cash flow ROE methodology to the proceedings. The FERC established effective dates for the refunds as April 20, 2012 and July 19, 2013. Settlement judge procedures were unsuccessful and the complaints were set for hearing procedures, with an initial ALJ decision to be issued by Nov. 25, 2015 and a final FERC order to be issued no earlier than 2016. In January 2015, Golden Spread filed testimony requesting that wholesale production and transmission formula rates be reduced to 8.78 percent and 9.28 percent, respectively, for the period April 20, 2012 to July 18, 2013, and reduced to 8.51 percent and 9.01 percent, respectively, for the period July 19, 2013 to Oct. 19, 2014.
Schedule Q-3 Page 146 of 182
Sponsor: Robinson Case No. 15-00139-UT

131
Golden Spread, along with certain New Mexico cooperatives and the West Texas Municipal Power Agency, separately filed a third rate complaint in October 2014, requesting that the base ROE in the SPS production and transmission formula rates be reduced to 8.61 percent and 9.11 percent, respectively. The complainants requested a refund effective date of Oct. 20, 2014. In January 2015, the FERC issued an order setting the third complaint for hearing procedures and granting the complainants’ requested refund effective date.
SPS – FERC Complaint Case Orders — In August 2013, the FERC issued an order on rehearing related to a 2004 complaint case brought by Golden Spread and PNM and an Order on Initial Decision in a subsequent 2006 production rate case filed by SPS.
The original complaint included two key components: 1) PNM’s claim regarding inappropriate allocation of fuel costs and 2) a base rate complaint, including the appropriate demand-related cost allocator. The FERC previously determined that the allocation of fuel costs and the demand-related cost allocator utilized by SPS was appropriate.
In the August 2013 Orders, the FERC clarified its previous ruling on the allocation of fuel costs and reaffirmed that the refunds in question should only apply to firm requirements customers and not PNM’s contractual load. The FERC also reversed its prior demand-related cost allocator decision. The FERC stated that it had erred in its initial analysis and concluded that the SPS system was a 3CP rather than a 12CP system.
In September 2013, SPS filed a request for rehearing of the FERC ruling on the CP allocation and refund decisions. SPS asserted that the FERC applied an improper burden of proof and that precedent did not support retroactive refunds. PNM also requested rehearing of the FERC decision not to reverse its prior ruling. In October 2013, the FERC issued orders further considering the requests for rehearing, which are currently pending. As of Dec. 31, 2013, SPS had accrued $44.5 million related to the August 2013 Orders and an additional $5.9 million of principal and interest was accrued during 2014.
On Jan. 30, 2015, SPS filed to revise the production formula rates for six of its wholesale customers, including Golden Spread, effective Feb. 1, 2015. The filing proposes several modifications, including a reduction in wholesale depreciation rates and the use of a 12CP demand-related cost allocator. If approved, principal and interest accruals from the August 2013 Orders would cease as of the effective date. FERC action is pending.
Sale of Texas Transmission Assets — In March 2013, SPS reached an agreement to sell certain segments of SPS’ transmission lines and two related substations to Sharyland. In 2013, SPS received all necessary regulatory approvals for the transaction. In December 2013, SPS received $37.1 million and recognized a pre-tax gain of $13.6 million and regulatory liabilities for jurisdictional gain sharing of $7.2 million. The gain is reflected in the consolidated statement of income as a reduction to O&M expenses. In December 2014, Golden Spread submitted a preliminary challenge asserting that the gain should be shared with wholesale transmission customers. SPS has disputed this claim. It is uncertain if the matter will result in a formal proceeding with the FERC.
13. Commitments and Contingencies
Commitments
Capital Commitments — Xcel Energy has made commitments in connection with a portion of its projected capital expenditures. Xcel Energy’s capital commitments primarily relate to the following major projects:
PSCo Gas Transmission Integrity Management Programs – PSCo is proactively identifying and addressing the safety and reliability of natural gas transmission pipelines. The pipeline integrity efforts include primarily system renewal projects.
NSP-Minnesota Wind Projects — In October 2013, the MPUC approved two projects totaling 350 MW that will be owned by NSP-Minnesota. In 2014, the NDPSC approved the prudence of the Border Winds Project. The Pleasant Valley wind farm in Minnesota and the Border Winds wind farm projects in North Dakota are anticipated to be operational in late 2015.
SPS Transmission NTC — SPS has accepted NTCs for several hundred miles of transmission line and related substation projects based on needs identified through SPP’s various planning processes, including those associated with economics, reliability, generator interconnection or the load addition processes. Most significant is the TUCO to Yoakum County to Hobbs Plant, a 345 KV transmission line. This line will connect the TUCO substation near Lubbock, Texas with the Yoakum County substation, continuing on to the Hobbs Plant substation near Hobbs, N.M. SPS anticipates filing CCNs for this line in Texas and in New Mexico in mid-2015. The line is scheduled to be in service in 2020.
Fuel Contracts — Xcel Energy has entered into various long-term commitments for the purchase and delivery of a significant portion of its current coal, nuclear fuel and natural gas requirements. These contracts expire in various years between 2015 and 2060. Xcel Energy is required to pay additional amounts depending on actual quantities shipped under these agreements.
Schedule Q-3 Page 147 of 182
Sponsor: Robinson Case No. 15-00139-UT

132
The estimated minimum purchases for Xcel Energy under these contracts as of Dec. 31, 2014 are as follows:
(Millions of Dollars) Coal Nuclear fuelNatural gas
supply
Natural gasstorage and
transportation
2015. . . . . . . . . . . . . . . . . . . . . . . . . . . . . . . . . . . . . . . . . . . . $ 900.7 $ 90.3 $ 374.2 $ 280.02016. . . . . . . . . . . . . . . . . . . . . . . . . . . . . . . . . . . . . . . . . . . . 659.8 121.8 158.8 221.42017. . . . . . . . . . . . . . . . . . . . . . . . . . . . . . . . . . . . . . . . . . . . 359.6 121.0 161.9 171.72018. . . . . . . . . . . . . . . . . . . . . . . . . . . . . . . . . . . . . . . . . . . . 73.3 65.6 212.3 122.72019. . . . . . . . . . . . . . . . . . . . . . . . . . . . . . . . . . . . . . . . . . . . 44.0 128.5 221.7 114.5Thereafter . . . . . . . . . . . . . . . . . . . . . . . . . . . . . . . . . . . . . . . 387.3 641.4 732.7 1,152.5
Total . . . . . . . . . . . . . . . . . . . . . . . . . . . . . . . . . . . . . . . . . . $ 2,424.7 $ 1,168.6 $ 1,861.6 $ 2,062.8
Additional expenditures for fuel and natural gas storage and transportation will be required to meet expected future electric generation and natural gas needs. Xcel Energy’s risk of loss, in the form of increased costs from market price changes in fuel, is mitigated through the use of natural gas and energy cost-rate adjustment mechanisms, which provide for pass-through of most fuel, storage and transportation costs to customers.
PPAs — NSP Minnesota, PSCo and SPS have entered into PPAs with other utilities and energy suppliers with expiration dates through 2033 for purchased power to meet system load and energy requirements and meet operating reserve obligations. In general, these agreements provide for energy payments, based on actual energy delivered and capacity payments. Certain PPAs accounted for as executory contracts also contain minimum energy purchase commitments. Capacity and energy payments are typically contingent on the independent power producing entity meeting certain contract obligations, including plant availability requirements. Certain contractual payments are adjusted based on market indices. The effects of price adjustments on our financial results are mitigated through purchased energy cost recovery mechanisms.
Included in electric fuel and purchased power expenses for PPAs accounted for as executory contracts were payments for capacity of $229.8 million, $217.0 million and $261.9 million in 2014, 2013 and 2012, respectively. At Dec. 31, 2014, the estimated future payments for capacity and energy that the utility subsidiaries of Xcel Energy are obligated to purchase pursuant to these executory contracts, subject to availability, are as follows:
(Millions of Dollars) Capacity Energy (a)
2015 . . . . . . . . . . . . . . . . . . . . . . . . . . . . . . . . . . . . . . . . . . . . . . . . . . . . . . . . . . . . . . . . . . . . . . . . . $ 245.3 $ 132.92016 . . . . . . . . . . . . . . . . . . . . . . . . . . . . . . . . . . . . . . . . . . . . . . . . . . . . . . . . . . . . . . . . . . . . . . . . . 206.5 104.12017 . . . . . . . . . . . . . . . . . . . . . . . . . . . . . . . . . . . . . . . . . . . . . . . . . . . . . . . . . . . . . . . . . . . . . . . . . 178.0 91.32018 . . . . . . . . . . . . . . . . . . . . . . . . . . . . . . . . . . . . . . . . . . . . . . . . . . . . . . . . . . . . . . . . . . . . . . . . . 140.1 93.22019 . . . . . . . . . . . . . . . . . . . . . . . . . . . . . . . . . . . . . . . . . . . . . . . . . . . . . . . . . . . . . . . . . . . . . . . . . 92.1 98.7Thereafter . . . . . . . . . . . . . . . . . . . . . . . . . . . . . . . . . . . . . . . . . . . . . . . . . . . . . . . . . . . . . . . . . . . . . 433.7 767.9
Total . . . . . . . . . . . . . . . . . . . . . . . . . . . . . . . . . . . . . . . . . . . . . . . . . . . . . . . . . . . . . . . . . . . . . . . . $ 1,295.7 $ 1,288.1
(a) Excludes contingent energy payments for renewable energy PPAs.
Additional energy payments under these PPAs and PPAs accounted for as operating leases will be required to meet expected future electric demand.
Leases — Xcel Energy leases a variety of equipment and facilities used in the normal course of business. Three of these leases qualify as capital leases and are accounted for accordingly. The assets and liabilities at the inception of a capital lease are recorded at the lower of fair market value or the present value of future lease payments and are amortized over the term of the contract.
WYCO was formed as a joint venture with CIG to develop and lease natural gas pipeline, storage, and compression facilities. Xcel Energy Inc. has a 50 percent ownership interest in WYCO. WYCO leases the facilities to CIG, and CIG operates the facilities, providing natural gas storage services to PSCo under a service arrangement.
PSCo accounts for its Totem natural gas storage service arrangement with CIG as a capital lease. As a result, PSCo had $138.9 million and $144.2 million of capital lease obligations recorded for the arrangement as of Dec. 31, 2014 and 2013, respectively. Xcel Energy Inc. eliminates 50 percent of the capital lease obligation related to WYCO in the consolidated balance sheet along with an equal amount of Xcel Energy Inc.’s equity investment in WYCO.
Schedule Q-3 Page 148 of 182
Sponsor: Robinson Case No. 15-00139-UT

133
PSCo records amortization for its capital leases as cost of natural gas sold and transported on the consolidated statements of income. Total amortization expenses under capital lease assets were approximately $7.2 million, $6.3 million and $5.7 million for 2014, 2013 and 2012, respectively. Following is a summary of property held under capital leases:
(Millions of Dollars) 2014 2013
Gas storage facilities . . . . . . . . . . . . . . . . . . . . . . . . . . . . . . . . . . . . . . . . . . . . . . . . . . . . . . . . . . . . $ 200.5 $ 200.5Gas pipeline . . . . . . . . . . . . . . . . . . . . . . . . . . . . . . . . . . . . . . . . . . . . . . . . . . . . . . . . . . . . . . . . . . . 20.7 20.7Property held under capital leases . . . . . . . . . . . . . . . . . . . . . . . . . . . . . . . . . . . . . . . . . . . . . . . . . . 221.2 221.2Accumulated depreciation . . . . . . . . . . . . . . . . . . . . . . . . . . . . . . . . . . . . . . . . . . . . . . . . . . . . . . . . (49.0) (41.8)Total property held under capital leases, net . . . . . . . . . . . . . . . . . . . . . . . . . . . . . . . . . . . . . . . . . . $ 172.2 $ 179.4
The remainder of the leases, primarily for office space, railcars, generating facilities, trucks, aircraft, cars and power-operated equipment, are accounted for as operating leases. Total expenses under operating lease obligations for Xcel Energy were approximately $271.9 million, $242.1 million and $217.8 million for 2014, 2013 and 2012, respectively. These expenses include capacity payments for PPAs accounted for as operating leases of $228.2 million, $197.7 million and $174.4 million in 2014, 2013 and 2012, respectively, recorded to electric fuel and purchased power expenses.
Included in the future commitments under operating leases are estimated future capacity payments under PPAs that have been accounted for as operating leases in accordance with the applicable accounting guidance.
Future commitments under operating and capital leases are:
(Millions of Dollars)Operating
Leases
PPA (a) (b)
OperatingLeases
TotalOperating
Leases Capital Leases
2015 . . . . . . . . . . . . . . . . . . . . . . . . . . . . . . . . . . . . . . . . . $ 26.2 $ 228.3 $ 254.5 $ 17.82016 . . . . . . . . . . . . . . . . . . . . . . . . . . . . . . . . . . . . . . . . . 23.6 215.4 239.0 17.12017 . . . . . . . . . . . . . . . . . . . . . . . . . . . . . . . . . . . . . . . . . 18.4 210.0 228.4 15.02018 . . . . . . . . . . . . . . . . . . . . . . . . . . . . . . . . . . . . . . . . . 17.3 211.3 228.6 14.72019 . . . . . . . . . . . . . . . . . . . . . . . . . . . . . . . . . . . . . . . . . 21.8 213.3 235.1 14.5Thereafter . . . . . . . . . . . . . . . . . . . . . . . . . . . . . . . . . . . . 132.9 1,785.1 1,918.0 273.1
Total minimum obligation. . . . . . . . . . . . . . . . . . . . . . . 352.2Interest component of obligation. . . . . . . . . . . . . . . . . . . (249.5)
Present value of minimum obligation . . . . . . . . . . . $ 102.7 (c)
(a) Amounts do not include PPAs accounted for as executory contracts.(b) PPA operating leases contractually expire through 2033.(c) Future commitments exclude certain amounts related to Xcel Energy’s 50 percent ownership interest in WYCO.
Variable Interest Entities — The accounting guidance for consolidation of variable interest entities requires enterprises to consider the activities that most significantly impact an entity’s financial performance, and power to direct those activities, when determining whether an enterprise is a variable interest entity’s primary beneficiary.
PPAs —Under certain PPAs, NSP-Minnesota, PSCo and SPS purchase power from independent power producing entities for which the utility subsidiaries are required to reimburse natural gas or biomass fuel costs, or to participate in tolling arrangements under which the utility subsidiaries procure the natural gas required to produce the energy that they purchase. These specific PPAs create a variable interest in the associated independent power producing entity.
Xcel Energy has determined that certain independent power producing entities are variable interest entities. Xcel Energy is not subject to risk of loss from the operations of these entities, and no significant financial support has been, or is in the future, required to be provided other than contractual payments for energy and capacity set forth in the PPAs.
Xcel Energy has evaluated each of these variable interest entities for possible consolidation, including review of qualitative factors such as the length and terms of the contract, control over O&M, control over dispatch of electricity, historical and estimated future fuel and electricity prices, and financing activities. Xcel Energy has concluded that these entities are not required to be consolidated in its consolidated financial statements because it does not have the power to direct the activities that most significantly impact the entities’ economic performance. The Xcel Energy utility subsidiaries had approximately 3,698 MW and 3,338 MW of capacity under long-term PPAs as of Dec. 31, 2014, and 2013, respectively, with entities that have been determined to be variable interest entities. These agreements have expiration dates through the year 2033.
Schedule Q-3 Page 149 of 182
Sponsor: Robinson Case No. 15-00139-UT
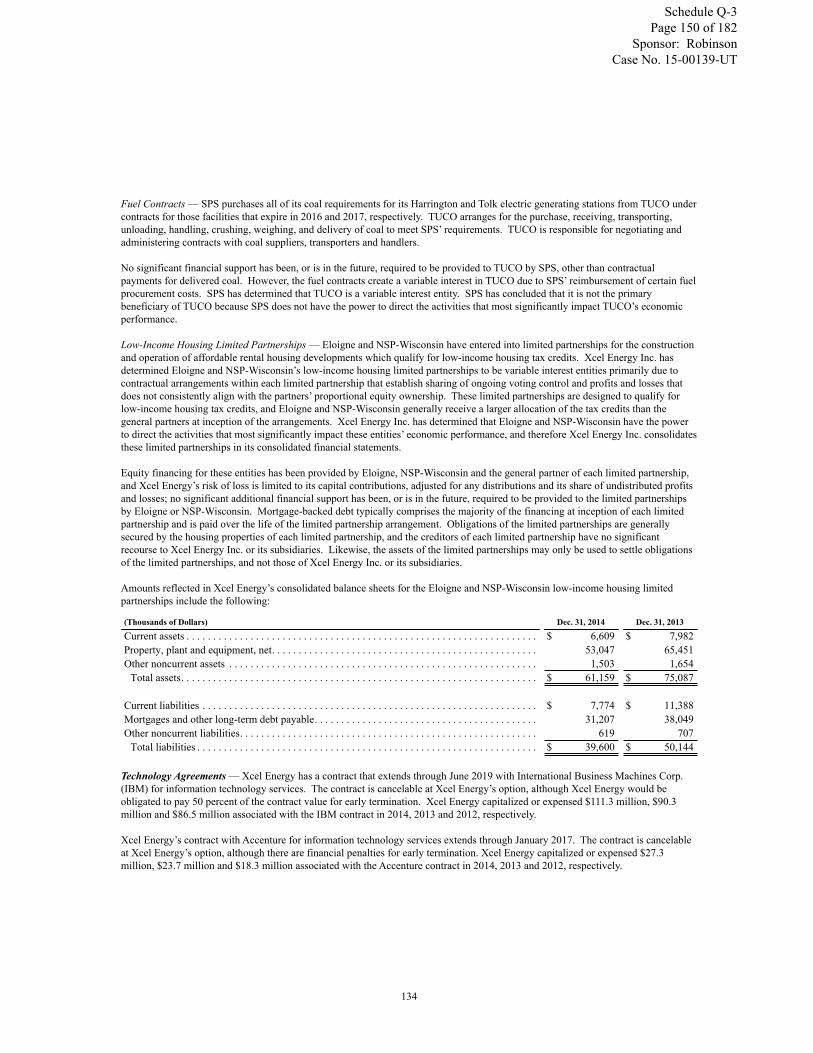
134
Fuel Contracts — SPS purchases all of its coal requirements for its Harrington and Tolk electric generating stations from TUCO under contracts for those facilities that expire in 2016 and 2017, respectively. TUCO arranges for the purchase, receiving, transporting, unloading, handling, crushing, weighing, and delivery of coal to meet SPS’ requirements. TUCO is responsible for negotiating and administering contracts with coal suppliers, transporters and handlers.
No significant financial support has been, or is in the future, required to be provided to TUCO by SPS, other than contractual payments for delivered coal. However, the fuel contracts create a variable interest in TUCO due to SPS’ reimbursement of certain fuel procurement costs. SPS has determined that TUCO is a variable interest entity. SPS has concluded that it is not the primary beneficiary of TUCO because SPS does not have the power to direct the activities that most significantly impact TUCO’s economic performance.
Low-Income Housing Limited Partnerships — Eloigne and NSP-Wisconsin have entered into limited partnerships for the construction and operation of affordable rental housing developments which qualify for low-income housing tax credits. Xcel Energy Inc. has determined Eloigne and NSP-Wisconsin’s low-income housing limited partnerships to be variable interest entities primarily due to contractual arrangements within each limited partnership that establish sharing of ongoing voting control and profits and losses that does not consistently align with the partners’ proportional equity ownership. These limited partnerships are designed to qualify for low-income housing tax credits, and Eloigne and NSP-Wisconsin generally receive a larger allocation of the tax credits than the general partners at inception of the arrangements. Xcel Energy Inc. has determined that Eloigne and NSP-Wisconsin have the power to direct the activities that most significantly impact these entities’ economic performance, and therefore Xcel Energy Inc. consolidates these limited partnerships in its consolidated financial statements.
Equity financing for these entities has been provided by Eloigne, NSP-Wisconsin and the general partner of each limited partnership, and Xcel Energy’s risk of loss is limited to its capital contributions, adjusted for any distributions and its share of undistributed profits and losses; no significant additional financial support has been, or is in the future, required to be provided to the limited partnerships by Eloigne or NSP-Wisconsin. Mortgage-backed debt typically comprises the majority of the financing at inception of each limited partnership and is paid over the life of the limited partnership arrangement. Obligations of the limited partnerships are generally secured by the housing properties of each limited partnership, and the creditors of each limited partnership have no significant recourse to Xcel Energy Inc. or its subsidiaries. Likewise, the assets of the limited partnerships may only be used to settle obligations of the limited partnerships, and not those of Xcel Energy Inc. or its subsidiaries.
Amounts reflected in Xcel Energy’s consolidated balance sheets for the Eloigne and NSP-Wisconsin low-income housing limited partnerships include the following:
(Thousands of Dollars) Dec. 31, 2014 Dec. 31, 2013
Current assets . . . . . . . . . . . . . . . . . . . . . . . . . . . . . . . . . . . . . . . . . . . . . . . . . . . . . . . . . . . . . . . . . . $ 6,609 $ 7,982Property, plant and equipment, net. . . . . . . . . . . . . . . . . . . . . . . . . . . . . . . . . . . . . . . . . . . . . . . . . . 53,047 65,451Other noncurrent assets . . . . . . . . . . . . . . . . . . . . . . . . . . . . . . . . . . . . . . . . . . . . . . . . . . . . . . . . . . 1,503 1,654
Total assets. . . . . . . . . . . . . . . . . . . . . . . . . . . . . . . . . . . . . . . . . . . . . . . . . . . . . . . . . . . . . . . . . . . $ 61,159 $ 75,087
Current liabilities . . . . . . . . . . . . . . . . . . . . . . . . . . . . . . . . . . . . . . . . . . . . . . . . . . . . . . . . . . . . . . . $ 7,774 $ 11,388Mortgages and other long-term debt payable. . . . . . . . . . . . . . . . . . . . . . . . . . . . . . . . . . . . . . . . . . 31,207 38,049Other noncurrent liabilities. . . . . . . . . . . . . . . . . . . . . . . . . . . . . . . . . . . . . . . . . . . . . . . . . . . . . . . . 619 707
Total liabilities . . . . . . . . . . . . . . . . . . . . . . . . . . . . . . . . . . . . . . . . . . . . . . . . . . . . . . . . . . . . . . . . $ 39,600 $ 50,144
Technology Agreements — Xcel Energy has a contract that extends through June 2019 with International Business Machines Corp. (IBM) for information technology services. The contract is cancelable at Xcel Energy’s option, although Xcel Energy would be obligated to pay 50 percent of the contract value for early termination. Xcel Energy capitalized or expensed $111.3 million, $90.3 million and $86.5 million associated with the IBM contract in 2014, 2013 and 2012, respectively.
Xcel Energy’s contract with Accenture for information technology services extends through January 2017. The contract is cancelable at Xcel Energy’s option, although there are financial penalties for early termination. Xcel Energy capitalized or expensed $27.3 million, $23.7 million and $18.3 million associated with the Accenture contract in 2014, 2013 and 2012, respectively.
Schedule Q-3 Page 150 of 182
Sponsor: Robinson Case No. 15-00139-UT

135
Committed minimum payments under these obligations are as follows:
(Millions of Dollars)IBM
AgreementAccentureAgreement
2015 . . . . . . . . . . . . . . . . . . . . . . . . . . . . . . . . . . . . . . . . . . . . . . . . . . . . . . . . . . . . . . . . . . . . . . . . . $ 33.0 $ 9.02016 . . . . . . . . . . . . . . . . . . . . . . . . . . . . . . . . . . . . . . . . . . . . . . . . . . . . . . . . . . . . . . . . . . . . . . . . . 31.9 8.92017 . . . . . . . . . . . . . . . . . . . . . . . . . . . . . . . . . . . . . . . . . . . . . . . . . . . . . . . . . . . . . . . . . . . . . . . . . 32.0 —2018 . . . . . . . . . . . . . . . . . . . . . . . . . . . . . . . . . . . . . . . . . . . . . . . . . . . . . . . . . . . . . . . . . . . . . . . . . 31.5 —2019 . . . . . . . . . . . . . . . . . . . . . . . . . . . . . . . . . . . . . . . . . . . . . . . . . . . . . . . . . . . . . . . . . . . . . . . . . 15.7 —Thereafter . . . . . . . . . . . . . . . . . . . . . . . . . . . . . . . . . . . . . . . . . . . . . . . . . . . . . . . . . . . . . . . . . . . . . — —
Guarantees and Indemnifications
Xcel Energy Inc. and its subsidiaries provide guarantees and bond indemnities under specified agreements or transactions. The guarantees and bond indemnities issued by Xcel Energy Inc. guarantee payment or performance by its subsidiaries. As a result, Xcel Energy Inc.’s exposure under the guarantees and bond indemnities is based upon the net liability of the relevant subsidiary under the specified agreements or transactions. Most of the guarantees and bond indemnities issued by Xcel Energy Inc. and its subsidiaries limit the exposure to a maximum amount stated in the guarantees and bond indemnities. As of Dec. 31, 2014 and 2013, Xcel Energy Inc. and its subsidiaries had no assets held as collateral related to their guarantees, bond indemnities and indemnification agreements.
Guarantees and Surety Bonds
The following table presents guarantees and bond indemnities issued and outstanding as of Dec. 31, 2014:
(Millions of Dollars) GuarantorGuarantee
AmountCurrent
ExposureTriggering
Event
Guarantee of customer loans for the Farm Rewiring Program (a) . NSP-Wisconsin $ 1.0 $ 0.2 (e)
Guarantee of the indemnification obligations of Xcel Energy Services Inc. under the aircraft leases (b) . . . . . . . . . . . . . . . . . . Xcel Energy Inc. 8.1 — (f)
Guarantee of residual value of assets under the Bank of Tokyo-Mitsubishi Capital Corporation Equipment Leasing Agreement (c) . . . . . . . . . . . . . . . . . . . . . . . . . . . . . . . . . . . . . . . NSP-Minnesota 4.8 — (g)
Total guarantees issued . . . . . . . . . . . . . . . . . . . . . . . . . . . . . . . . $ 13.9 $ 0.2Guarantee performance and payment of surety bonds for Xcel
Energy Inc. and its subsidiaries (d) . . . . . . . . . . . . . . . . . . . . . . . Xcel Energy Inc. $ 31.4 (i) (h)
(a) The term of this guarantee expires in 2018, which is the final scheduled repayment date for the loans. As of Dec. 31, 2014, no claims had been made by the lender.
(b) The term of this guarantee expires in 2017 when the associated leases expire.(c) The terms of this guarantee expires in 2019 when the associated lease expires.(d) The surety bonds primarily relate to workers compensation benefits and utility projects. The workers compensation bonds are renewed annually and the project
based bonds expire in conjunction with the completion of the related projects.(e) The debtor becomes the subject of bankruptcy or other insolvency proceedings.(f) Nonperformance and/or nonpayment.(g) Actual fair value of leased assets is less than the guaranteed residual value amount at the end of the lease term.(h) Failure of Xcel Energy Inc. or one of its subsidiaries to perform under the agreement that is the subject of the relevant bond. In addition, per the indemnity
agreement between Xcel Energy Inc. and the various surety companies, the surety companies have the discretion to demand that collateral be posted.(i) Due to the magnitude of projects associated with the surety bonds, the total current exposure of this indemnification cannot be determined. Xcel Energy Inc.
believes the exposure to be significantly less than the total amount of the outstanding bonds.
Indemnification Agreements
Xcel Energy Inc. and its subsidiaries provide indemnifications through contracts entered into in the normal course of business. These are primarily indemnifications against adverse litigation outcomes in connection with underwriting agreements, as well as breaches of representations and warranties, including corporate existence, transaction authorization and income tax matters with respect to assets sold. Xcel Energy Inc.’s and its subsidiaries’ obligations under these agreements may be limited in terms of duration and amount. The maximum potential amount of future payments under these indemnifications cannot be reasonably estimated as the obligated amounts of these indemnifications often are not explicitly stated.
Schedule Q-3 Page 151 of 182
Sponsor: Robinson Case No. 15-00139-UT

136
Environmental Contingencies
Xcel Energy has been or is currently involved with the cleanup of contamination from certain hazardous substances at several sites. In many situations, the subsidiary involved believes it will recover some portion of these costs through insurance claims. Additionally, where applicable, the subsidiary involved is pursuing, or intends to pursue, recovery from other PRPs and through the regulated rate process. New and changing federal and state environmental mandates can also create added financial liabilities for Xcel Energy, which are normally recovered through the regulated rate process. To the extent any costs are not recovered through the options listed above, Xcel Energy would be required to recognize an expense.
Site Remediation — Various federal and state environmental laws impose liability, without regard to the legality of the original conduct, where hazardous substances or other regulated materials have been released to the environment. Xcel Energy Inc.’s subsidiaries may sometimes pay all or a portion of the cost to remediate sites where past activities of their predecessors or other parties have caused environmental contamination. Environmental contingencies could arise from various situations, including sites of former MGPs operated by Xcel Energy Inc.’s subsidiaries or their predecessors, or other entities; and third-party sites, such as landfills, for which one or more of Xcel Energy Inc.’s subsidiaries are alleged to be a PRP that sent hazardous materials and wastes to that site.
MGP Sites
Ashland MGP Site — NSP-Wisconsin has been named a PRP for contamination at a site in Ashland, Wis. The Ashland/Northern States Power Lakefront Superfund Site (the Ashland site) includes property owned by NSP-Wisconsin, which was a site previously operated by a predecessor company as a MGP facility (the Upper Bluff), and two other properties: an adjacent city lakeshore park area (Kreher Park), on which an unaffiliated third party previously operated a sawmill and conducted wood treating operations; and an area of Lake Superior’s Chequamegon Bay adjoining the park (the Sediments).
The EPA issued its Record of Decision (ROD) in 2010, which describes the preferred remedy the EPA has selected for the cleanup of the Ashland site. For the Sediments at the Ashland Site, the ROD preferred remedy is a hybrid remedy involving both dry excavation and wet conventional dredging methodologies (the Hybrid Remedy). The ROD also identifies the possibility of a wet conventional dredging only remedy for the Sediments (the Wet Dredge), contingent upon the completion of a successful Wet Dredge pilot study.
In 2011, the EPA issued special notice letters identifying several entities, including NSP-Wisconsin, as PRPs, for future remediation at the Ashland site. As a result of settlement negotiations with NSP-Wisconsin, the EPA agreed to segment the Ashland site into separate areas. The first area (Phase I Project Area) includes soil and groundwater in Kreher Park and the Upper Bluff. The second area includes the Sediments.
In October 2012, a settlement among the EPA, the WDNR, the Bad River and Red Cliff Bands of the Lake Superior Tribe of Chippewa Indians and NSP-Wisconsin was approved by the U.S. District Court for the Western District of Wisconsin. This settlement resolves claims against NSP-Wisconsin for its alleged responsibility for the remediation of the Phase I Project Area. Under the terms of the settlement, NSP-Wisconsin agreed to perform the remediation of the Phase I Project Area, but does not admit any liability with respect to the Ashland site. Demolition activities occurred at the Ashland site in 2013. The final design for the soil, including excavation and treatment, as well as containment wall remedies was submitted to the EPA in April 2014 and work commenced in May 2014. A preliminary design for the groundwater remedy was also submitted to the EPA in April 2014 and those activities are expected to commence in 2015. Based on these updated designs, the cost estimate for the cleanup of the Phase I Project Area is approximately $54 million, of which approximately $28 million has already been spent. The settlement also resolves claims by the federal, state and tribal trustees against NSP-Wisconsin for alleged natural resource damages at the Ashland site, including both the Phase I Project Area and the Sediments. Fieldwork to address the Phase I Project Area at the Ashland site began at the end of 2012 and continues.
Negotiations are ongoing between the EPA and NSP-Wisconsin regarding who will pay for or perform the cleanup of the Sediments and what remedy will be implemented at the site to address the Sediments. It is NSP-Wisconsin’s view that the Hybrid Remedy is not safe or feasible to implement. The EPA’s ROD for the Ashland site includes estimates that the cost of the Hybrid Remedy is between $63 million and $77 million, with a potential deviation in such estimated costs of up to 50 percent higher to 30 percent lower. In November 2013, NSP-Wisconsin submitted a revised Wet Dredge pilot study work plan proposal to the EPA. In May 2014, NSP-Wisconsin entered into a final administrative order on consent for the Wet Dredge pilot study with the EPA. In September 2014, the EPA granted an extension of time to perform the pilot in the summer of 2015.
Schedule Q-3 Page 152 of 182
Sponsor: Robinson Case No. 15-00139-UT

137
In August 2012, NSP-Wisconsin also filed litigation against other PRPs for their share of the cleanup costs for the Ashland site. Trial for this matter is scheduled for April-May of 2015. Negotiations between the EPA, NSP-Wisconsin and several of the other PRPs regarding the PRPs’ fair share of the cleanup costs for the Ashland site are also ongoing. A settlement in principle has been reached with two PRPs, Wisconsin Central Ltd. and Soo Line Railroad Co. (collectively, the “Railroad PRPs”), the EPA and NSP-Wisconsin resolving claims relating to the Railroad PRPs’ share of the costs of cleanup at the Ashland site. Under the agreement, the Railroad PRPs have agreed to contribute $10.5 million to the costs of the cleanup at the Ashland site. The agreement is currently subject to a 30-day public comment period and must be entered by the U.S. District Court for the Western District of Wisconsin before it will become final. It is anticipated that the agreement will be entered in the first quarter of 2015. As discussed below, existing PSCW policy requires that any payments received from PRPs be used to reduce the amount of the cleanup costs ultimately recovered from customers.
At Dec. 31, 2014 and 2013, NSP-Wisconsin had recorded a liability of $107.6 million and $104.6 million, respectively, for the Ashland site based upon potential remediation and design costs together with estimated outside legal and consultant costs; of which $28.9 million and $25.2 million, respectively, was considered a current liability. NSP-Wisconsin’s potential liability, the actual cost of remediation and the time frame over which the amounts may be paid are subject to change. NSP-Wisconsin also continues to work to identify and access state and federal funds to apply to the ultimate remediation cost of the entire site. Unresolved issues or factors that could result in higher or lower NSP-Wisconsin remediation costs for the Ashland site include the cleanup approach implemented for the Sediments, which party implements the cleanup, the timing of when the cleanup is implemented, potential contributions by other PRPs and whether federal or state funding may be directed to help offset remediation costs at the Ashland site.
NSP-Wisconsin has deferred the estimated site remediation costs, as a regulatory asset, based on an expectation that the PSCW will continue to allow NSP-Wisconsin to recover payments for environmental remediation from its customers. The PSCW has consistently authorized in NSP-Wisconsin rates recovery of all remediation costs incurred at the Ashland site, and has authorized recovery of MGP remediation costs by other Wisconsin utilities. Under the established PSCW policy, external MGP remediation costs are subject to deferral in the Wisconsin retail jurisdiction and are reviewed for prudence as part of the Wisconsin retail rate case process. Any payments received from insurance carriers or PRPs are recorded as a reduction of the regulatory asset. Once deferred MGP remediation costs are determined by the PSCW to be prudent, utilities are allowed to recover those deferred costs in natural gas rates, typically over a four- to six-year amortization period. The PSCW historically has not allowed utilities to recover their carrying costs on unamortized regulatory assets for MGP remediation.
In the 2013 rate case decision, the PSCW recognized the potential magnitude of the future liability for the cleanup at the Ashland site and granted an exception to its existing policy at the request of NSP-Wisconsin. The elements of this exception include: (1) approval to begin recovery of estimated Phase 1 Project costs beginning on Jan. 1, 2013; (2) approval to amortize these estimated costs over a ten-year period; and (3) approval to apply a three percent carrying cost to the unamortized regulatory asset. In the 2014 rate case decision, the PSCW continued the cost recovery treatment with respect to the 2013 and 2014 cleanup costs for the Phase I Project Area. The PSCW determined the timing of the cleanup of the Sediments was uncertain and declined NSP-Wisconsin’s request to begin cost recovery for this portion of the cleanup in 2014 rates. However, the PSCW allowed NSP-Wisconsin to increase its 2014 amortization expense related to the cleanup by an additional $1.1 million to offset the need for a rate decrease for the natural gas utility.
Other MGP Sites — Xcel Energy is currently involved in investigating and/or remediating several other MGP sites where hazardous or other regulated materials may have been deposited. Xcel Energy has identified eight sites across all of its service territories where former MGP activities have or may have resulted in site contamination and are under current investigation and/or remediation. At some or all of these MGP sites, there are other parties that may have responsibility for some portion of any remediation. Xcel Energy anticipates that the majority of the remediation at these sites will continue through at least 2015. Xcel Energy had accrued $2.1 million and $5.1 million for all of these sites at Dec. 31, 2014 and 2013, respectively. There may be insurance recovery and/or recovery from other PRPs that will offset any costs incurred. Xcel Energy anticipates that any amounts spent will be fully recovered from customers.
Environmental Requirements
Water and WasteAsbestos Removal — Some of Xcel Energy’s facilities contain asbestos. Most asbestos will remain undisturbed until the facilities that contain it are demolished or removed. Xcel Energy has recorded an estimate for final removal of the asbestos as an ARO. It may be necessary to remove some asbestos to perform maintenance or make improvements to other equipment. The cost of removing asbestos as part of other work is not expected to be material and is recorded as incurred as operating expenses for maintenance projects, capital expenditures for construction projects or removal costs for demolition projects.
Schedule Q-3 Page 153 of 182
Sponsor: Robinson Case No. 15-00139-UT
138
Federal Clean Water Act (CWA) Effluent Limitations Guidelines (ELG) — In June 2013, the EPA published a proposed ELG rule for power plants that use coal, natural gas, oil or nuclear materials as fuel and discharge treated effluent to surface waters as well as utility-owned landfills that receive coal combustion residuals. The final rule is now expected in September 2015. Under the current proposed rule, facilities would need to comply as soon as possible after July 2017, but no later than July 2022. The impact of this rule on Xcel Energy is uncertain at this time.
Federal CWA Section 316(b) — Section 316(b) of the federal CWA requires the EPA to regulate cooling water intake structures to assure that these structures reflect the best technology available for minimizing adverse environmental impacts to aquatic species. The EPA published the final 316(b) rule in August 2014. The rule prescribes technology for protecting fish that get stuck on plant intake screens (known as impingement) and describes a process for site-specific determinations by each state for sites that must protect the small aquatic organisms that pass through the intake screens into the plant cooling systems (known as entrainment). For Xcel Energy, these requirements will primarily impact plants within the NSP-Minnesota service territory. The timing of compliance with the requirements will vary from plant-to-plant since the new rule does not have a final compliance deadline. Xcel Energy estimates the likely cost for complying with impingement requirements is approximately $46 million with the majority needed for NSP-Minnesota. Xcel Energy believes at least three NSP-Minnesota plants could be required by state regulators to make improvements to reduce entrainment. The exact cost of the entrainment improvements is uncertain, but could be up to $145 million depending on the outcome of certain entrainment studies and cost-benefit analyses. Xcel Energy anticipates these costs will be fully recoverable in rates.
Federal CWA Waters of the United States Rule — In April 2014, the EPA and the U.S. Army Corps of Engineers issued a proposed rule that significantly expands the types of water bodies regulated under the CWA. If finalized as proposed, this rule could delay the siting of new pipelines, transmission lines and distribution lines, increase project costs and expand permitting and reporting requirements. The ultimate impact of the proposed rule will depend on the specific requirements of the final rule and cannot be determined at this time. A final rule is not anticipated before the second quarter of 2015.
Coal Ash Regulation — Xcel Energy’s operations are subject to federal and state laws that impose requirements for handling, storage, treatment and disposal of solid waste. In 2010, the EPA published a proposed rule on the regulation of coal combustion byproducts (coal ash) as hazardous or nonhazardous waste. The EPA issued a pre-publication version of the final rule in December 2014, which once promulgated will impose new rules to regulate coal ash as a nonhazardous solid waste. Xcel Energy’s costs for the management and disposal of coal ash will not significantly increase under the new rule.
AirGHG Emission Standard for Existing Sources — In June 2014, the EPA published its proposed rule on GHG emission standards for existing power plants. Comments were due to the EPA on Dec. 1, 2014 and a final rule is anticipated in mid-summer 2015. Following adoption of the final rule, states must develop implementation plans by June 2016, with the possibility of an extension to June 2017 (June 2018 if submitting a joint plan with other states). Among other things, the proposed rule would require that state plans include enforceable measures to ensure emissions from existing power plants in the state achieve the EPA’s state-specific interim (2020-2029) and final (2030 and thereafter) emission performance targets. The plan will likely require additional emission reductions in states in which Xcel Energy operates. It is not possible to evaluate the impact of existing source standards until the EPA promulgates a final rule and states have adopted their applicable state plans.
GHG NSPS Proposal — In January 2014, the EPA re-proposed a GHG NSPS for newly constructed power plants which would set performance standards (maximum carbon dioxide emission rates) for coal- and natural gas-fired power plants. For coal power plants, the NSPS requires an emissions level equivalent to partial carbon capture and storage (CCS) technology; for gas-fired power plants, the NSPS reflects emissions levels from combined cycle technology with no CCS. The EPA continues to propose that the NSPS not apply to modified or reconstructed existing power plants. In addition, installation of control equipment on existing plants would not constitute a “modification” to those plants under the NSPS program. A final rule is anticipated in mid-summer 2015. It is not possible to evaluate the impact of the re-proposed NSPS until its final requirements are known.
GHG NSPS for Modified and Reconstructed Power Plants — In June 2014, the EPA published a proposed NSPS that would apply to GHG emissions from power plants that are modified or reconstructed. A final rule is anticipated in mid-summer 2015. A modification is a change to an existing source that increases the maximum achievable hourly rate of emissions. A reconstruction involves the replacement of components at a unit to the extent that the capital cost of the new components exceeds 50 percent of the capital cost of an entirely new comparable unit. The proposed standards would not require installation of CCS technology. Instead, the proposed standard for coal-fired power plants would require a combination of best operating practices and equipment upgrades. The proposal for gas-fired power plants would require emissions standards based on efficient combined cycle technology. It is not possible to evaluate the impact of these proposed standards until the final requirements are known. In addition, it is not clear whether these requirements, once adopted, would apply to future changes at Xcel Energy’s power plants.
Schedule Q-3 Page 154 of 182
Sponsor: Robinson Case No. 15-00139-UT

139
CSAPR — CSAPR addresses long range transport of PM and ozone by requiring reductions in SO2 and NOx from utilities in the eastern half of the United States using an emissions trading program. For Xcel Energy, the rule applies in Minnesota, Wisconsin and Texas.
In August 2012, the D.C. Circuit vacated the CSAPR and remanded it back to the EPA. The D.C. Circuit stated the EPA must continue administering CSAPR’s predecessor rule pending adoption of a valid replacement. In April 2014, the U.S. Supreme Court reversed and remanded the case to the D.C. Circuit. The Supreme Court held that the EPA’s rule design did not violate the CAA and that states had received adequate opportunity to develop their own plans. Because the D.C. Circuit overturned the CSAPR on two over-arching issues, there are many other issues the D.C. Circuit did not rule on that will now need to be considered on remand. In October 2014, the D.C. Circuit granted the EPA’s request to begin to implement CSAPR by imposing its 2012 compliance obligations starting in January 2015. In addition, the D.C. Circuit set a briefing schedule and plans to hear arguments on the remaining issues in the case in February 2015. While the litigation continues, the EPA will begin to administer the CSAPR in 2015.
Multiple changes to the SPS system since 2011 will substantially reduce estimated costs of complying with the CSAPR. These include the addition of 700 MW of wind power, the construction of Jones Units 3 and 4 to meet reserve requirements and provide quick start capability, reduced wholesale load and new PPAs, installation of NOx combustion controls on Tolk Units 1 and 2 and completion of certain transmission projects. As a result, SPS estimates compliance with the CSAPR in 2015 will cost approximately $7 million.
NSP-Minnesota can operate within its CSAPR emission allowance allocations, particularly given the cessation of coal operations at Black Dog Units 3 and 4 before mid-April 2015. NSP-Wisconsin can operate within its CSAPR emission allowance allocation for SO2 due to cessation of coal combustion at Bay Front Unit 5. NSP-Wisconsin anticipates compliance with the CSAPR for NOx in 2015 through operational changes or allowance purchases. CSAPR compliance in 2015 is not expected to have a material impact on the results of operations, financial position or cash flows.
EGU Mercury and Air Toxics Standards (MATS) Rule — The final EGU MATS rule became effective in April 2012. The EGU MATS rule sets emission limits for acid gases, mercury and other hazardous air pollutants and requires coal-fired utility facilities greater than 25 MW to demonstrate compliance within three to four years of the effective date. Xcel Energy expects to comply with the EGU MATS rule through a combination of mercury and other emission control projects. In 2014, the U.S. Supreme Court decided to review the D.C. Circuit’s decision that upheld the MATS standard. It is not yet known what impact the Supreme Court’s decision may have on the MATS standard or its implementation schedule. Xcel Energy believes EGU MATS costs will be recoverable through regulatory mechanisms and does not expect a material impact on results of operations, financial position or cash flows.
Minnesota Mercury Legislation — NSP-Minnesota installed sorbent control systems at the Sherco Unit 3 and A.S. King generating plants and completed installation of mercury controls on Sherco Units 1 and 2. Installation costs through Dec. 31, 2014 were $12.9 million for the mercury controls on the units and NSP-Minnesota believes these costs will be recoverable through regulatory mechanisms.
Industrial Boiler (IB) MACT Rules — In 2011, the EPA finalized IB MACT rules to regulate boilers and process heaters fueled with coal, biomass and liquid fuels, which would apply to NSP-Wisconsin’s Bay Front Units 1 and 2. The controls to meet the requirements were substantially complete as of Dec. 31, 2014, with final work targeted to be finished in May 2015. The final capital cost is estimated to be approximately $21 million.
Regional Haze Rules — The regional haze program is designed to address widespread, regionally homogeneous haze that results from emissions from a multitude of sources. In 2005, the EPA amended the BART requirements of its regional haze rules, which require the installation and operation of emission controls for industrial facilities emitting air pollutants that reduce visibility in certain national parks and wilderness areas. In their first regional haze SIP, Colorado, Minnesota and Texas identified the Xcel Energy facilities that will have to reduce SO2, NOx and PM emissions under BART and set emissions limits for those facilities.
PSCoIn 2011, the Colorado Air Quality Control Commission approved a SIP (the Colorado SIP) that included the CACJA emission reduction plan as satisfying regional haze requirements for the facilities included in the CACJA plan. In addition, the Colorado SIP included a BART determination for Comanche Units 1 and 2. The EPA approved the Colorado SIP in 2012. Installation of emission controls at Pawnee was completed in 2014 at a cost of $272.6 million. Installation of the emission controls at Hayden Unit 1 is scheduled for 2015 and Hayden Unit 2 is scheduled for 2016 at an estimated combined cost of $84.6 million. PSCo anticipates these costs will be fully recoverable in rates.
Schedule Q-3 Page 155 of 182
Sponsor: Robinson Case No. 15-00139-UT

140
In March 2013, WildEarth Guardians petitioned the U.S. Court of Appeals for the 10th Circuit to review the EPA’s decision approving the Colorado SIP. WildEarth Guardians has stated it will challenge the BART determination made for Comanche Units 1 and 2. In comments before the EPA, WildEarth Guardians urged that current emission limitations be made more stringent or that SCR be added to the units. In September 2014, the EPA filed a request with the Court to remand the case to the EPA for additional explanation of the EPA’s decision approving the BART determination for Comanche Units 1 and 2. In October 2014, the Court granted the EPA’s request and vacated the current briefing schedule. The EPA has provided required status reports.
In 2010, two environmental groups petitioned the DOI to certify that 12 coal-fired boilers and one coal-fired cement kiln in Colorado are contributing to visibility problems in Rocky Mountain National Park. The following PSCo plants are named in the petition: Cherokee, Hayden, Pawnee and Valmont. The groups allege the Colorado BART rule is inadequate to satisfy the CAA mandate of ensuring reasonable further progress towards restoring natural visibility conditions in the park. It is not known when the DOI will rule on the petition.
NSP-MinnesotaIn 2009, the MPCA approved a SIP (the Minnesota SIP) and submitted it to the EPA for approval. The MPCA’s source-specific BART limits for Sherco Units 1 and 2 require combustion controls for NOx and scrubber upgrades for SO2. The MPCA concluded SCRs should not be required because the minor visibility benefits derived from SCRs do not outweigh the substantial costs. The combustion controls were installed first and the scrubber upgrades were completed in December 2014. These emission controls cost $46.6 million. NSP-Minnesota anticipates these costs will be fully recoverable in rates.
After the CSAPR was adopted in 2011, the MPCA supplemented its Minnesota SIP, determining that CSAPR meets BART requirements, but also implementing its source-specific BART determination for Sherco Units 1 and 2 from the 2009 Minnesota SIP. In June 2012, the EPA approved the Minnesota SIP for EGUs and also approved the source-specific emission limits for Sherco Units 1 and 2 as strengthening the Minnesota SIP, but avoided characterizing them as BART limits.
In August 2012, the National Parks Conservation Association, Sierra Club, Voyageurs National Park Association, Friends of the Boundary Waters Wilderness, Minnesota Center for Environmental Advocacy and Fresh Energy appealed the EPA’s approval of the Minnesota SIP to the U.S. Court of Appeals for the Eighth Circuit (Eighth Circuit). NSP-Minnesota and other regulated parties were denied intervention. In June 2013, the Eighth Circuit ordered this case to be held in abeyance until the U.S. Supreme Court decided the CSAPR case. In October 2014, the Eighth Circuit set a briefing schedule that will be completed in early 2015. An argument date has not been set. If this litigation ultimately results in further EPA proceedings concerning the Minnesota SIP, such proceedings may consider whether SCRs should be required for Sherco Units 1 and 2.
SPSHarrington Units 1 and 2 are potentially subject to BART. Texas developed a SIP (the Texas SIP) that finds the CAIR equal to BART for EGUs. As a result, no additional controls beyond CAIR compliance would be required. In May 2012, the EPA deferred its review of the Texas SIP in its final rule allowing states to find that CSAPR compliance meets BART requirements for EGUs. In December 2014, the EPA proposed to approve the BART portion of the Texas SIP, with the exception that the EPA would substitute CSAPR compliance for Texas’ reliance on CAIR. The EPA currently plans to issue its final rule in August 2015.
In May 2014, the EPA issued a request for information under the CAA related to SO2 control equipment at Tolk Units 1 and 2. In its December 2014 proposal, the EPA plans to disapprove the reasonable progress portions of the Texas SIP and instead adopt a Federal Implementation Plan. For SPS, the EPA proposed to require dry scrubbers on both Tolk units to reduce SO2 emissions to help achieve reasonable progress goals the EPA would establish for Texas and Oklahoma national parks and wilderness areas. As proposed, the dry scrubbers would need to be installed and operating within five years of the EPA’s final action, currently expected in August 2015. SPS plans to file comments objecting to the installation of dry scrubbers on the units. Whether dry scrubbers are required is dependent on the EPA’s final decision. If required, they would cost approximately $600 million, with an annual operating cost of approximately $10.4 million.
Reasonably Attributable Visibility Impairment (RAVI) — RAVI is intended to address observable impairment from a specific source such as distinct, identifiable plumes from a source’s stack to a national park. In 2009, the DOI certified that a portion of the visibility impairment in Voyageurs and Isle Royale National Parks is reasonably attributable to emissions from NSP-Minnesota’s Sherco Units 1 and 2. The EPA is required to make its own determination whether there is RAVI-type impairment in these parks and examine which sources may cause or contribute to any RAVI impact that is identified. After studying the national parks and evaluating multiple sources, if the EPA finds that Sherco Units 1 and 2 cause or contribute to RAVI in the national parks, the EPA would then evaluate whether the level of controls required by the MPCA is appropriate. The EPA has stated it plans to issue a separate notice on the issue of BART for Sherco Units 1 and 2 under the RAVI program.
Schedule Q-3 Page 156 of 182
Sponsor: Robinson Case No. 15-00139-UT

141
In December 2012, a lawsuit against the EPA was filed in the U.S. District Court for the District of Minnesota by the following organizations: National Parks Conservation Association, Minnesota Center for Environmental Advocacy, Friends of the Boundary Waters Wilderness, Voyageurs National Park Association, Fresh Energy and Sierra Club. The lawsuit alleges the EPA has failed to perform a nondiscretionary duty to determine BART for Sherco Units 1 and 2 under the RAVI program. The EPA filed an answer denying the allegations. The District Court denied NSP-Minnesota’s motion to intervene in July 2013. NSP-Minnesota appealed this decision to the Eighth Circuit, which on July 23, 2014, reversed the District Court and found that NSP-Minnesota has standing and a right to intervene.
In June 2014, the EPA and the plaintiffs lodged a consent decree with the District Court. The public comment period on the draft consent decree has been completed. The EPA is evaluating comments and will determine whether to enter the consent decree with the District Court. The draft consent decree would establish a schedule whereby the EPA would issue a proposal on Feb. 27, 2015, or 30 days after the District Court enters the consent decree if the decree is entered after Feb. 27, 2015. The proposal would provide the EPA’s analysis of whether visibility impairment in the national parks is reasonably attributable to Sherco Units 1 and 2. If the EPA determines that it is, the draft consent decree requires the EPA to make a final RAVI BART determination for these units by Aug. 31, 2015. If the EPA determines that it is not, the EPA would not determine BART for Sherco Units 1 and 2. NSP-Minnesota filed comments opposing the proposed consent decree and will object to its entry given NSP-Minnesota’s right to intervene in the litigation and thus participate in the negotiation of any purported settlement of the case.
Revisions to the National Ambient Air Quality Standards (NAAQS) for PM — In December 2012, the EPA lowered the primary health-based NAAQS for annual average fine PM and retained the current daily standard for fine PM. In areas where Xcel Energy operates power plants, current monitored air concentrations are below the level of the final annual primary standard. In December 2014, the EPA issued its final designations, which did not include areas in any states in which Xcel Energy operates.
Revisions to the NAAQS for Ozone — In December 2014, the EPA proposed to revise the NAAQS for ozone by lowering the eight-hour standard from 0.075 parts per million (ppm) to a level within the range of 0.065-0.070 ppm. The EPA is also taking comment on a level for the standard as low as 0.060 ppm. In areas where Xcel Energy operates, current monitored air quality concentrations are above the proposed level of 0.070 ppm in the Texas panhandle and in the Denver Metropolitan Area. In addition, current monitored air quality concentrations are above the proposed level of 0.065 ppm in the Twin Cities Metropolitan Area in Minnesota. Current monitored air quality concentrations in areas of Wisconsin where Xcel Energy operates are below the range of the proposed standard. The EPA is expected to adopt a new ozone standard in a final rule to be issued in October 2015. Depending on the level of the standard, impacted states would study the sources of the nonattainment and make emission reduction plans to attain the standards. These plans would be due to the EPA in 2020 or 2021. Such plans could include installation of further NOx controls on power plants. It is not possible to evaluate the impact of this proposal until the final standard is adopted, the designation of nonattainment areas is made in late 2017 based on air quality data years 2014-2016, and any required state plans are developed.
PSCo NOV — In 2002, PSCo received an NOV from the EPA alleging violations of the New Source Review (NSR) requirements of the CAA at the Comanche Station and Pawnee Generating Station in Colorado. The NOV alleges that various maintenance, repair and replacement projects at the plants in the mid to late 1990s should have required a permit under the NSR process. PSCo believes it has acted in full compliance with the CAA and NSR process. PSCo also believes that the projects identified in the NOV fit within the routine maintenance, repair and replacement exemption contained within the NSR regulations or are otherwise not subject to the NSR requirements. PSCo disagrees with the assertions contained in the NOV and intends to vigorously defend its position. It is not known whether any costs would be incurred as a result of this NOV.
NSP-Minnesota NOV — In 2011, NSP-Minnesota received an NOV from the EPA alleging violations of the NSR requirements of the CAA at the Sherco plant and Black Dog plant in Minnesota. The NOV alleges that various maintenance, repair and replacement projects at the plants in the mid-2000s should have required a permit under the NSR process. NSP-Minnesota believes it has acted in full compliance with the CAA and NSR process. NSP-Minnesota also believes that the projects identified in the NOV fit within the routine maintenance, repair and replacement exemption contained within the NSR regulations or are otherwise not subject to the NSR requirements. NSP-Minnesota disagrees with the assertions contained in the NOV and intends to vigorously defend its position. It is not known whether any costs would be incurred as a result of this NOV.
Schedule Q-3 Page 157 of 182
Sponsor: Robinson Case No. 15-00139-UT

142
Asset Retirement Obligations
Recorded AROs — AROs have been recorded for property related to the following: electric production (nuclear, steam, wind, other and hydro), electric distribution and transmission, natural gas production, natural gas transmission and distribution, and general property. The electric production obligations include asbestos, ash-containment facilities, radiation sources, storage tanks, control panels and decommissioning. The asbestos recognition associated with the electric production includes certain plants at NSP-Minnesota, NSP-Wisconsin, PSCo and SPS. NSP-Minnesota also recorded asbestos recognition for its general office building. This asbestos abatement removal obligation originated in 1973 with the CAA, which applied to the demolition of buildings or removal of equipment containing asbestos that can become airborne on removal. AROs also have been recorded for NSP-Minnesota, NSP-Wisconsin, PSCo and SPS steam production related to ash-containment facilities such as bottom ash ponds, evaporation ponds and solid waste landfills. The origination dates on the ARO recognition for ash-containment facilities at steam plants were the in-service dates of the various facilities. NSP-Minnesota and PSCo have also recorded AROs for the retirement and removal of assets at certain wind production facilities for which the land is leased and removal is required by contract, with the origination dates being the in-service date of the various facilities.
Xcel Energy has recognized an ARO for the retirement costs of natural gas mains and lines at NSP-Minnesota, NSP-Wisconsin and PSCo and an ARO for the retirement of above ground gas gathering, extraction and wells related to gas storage facilities at PSCo. In addition, an ARO was recognized for the removal of electric transmission and distribution equipment at NSP-Minnesota, NSP-Wisconsin, PSCo and SPS, which consists of many small potential obligations associated with PCBs, mineral oil, storage tanks, treated poles, lithium batteries, mercury and street lighting lamps. The electric and common general AROs include small obligations related to storage tanks, radiation sources and office buildings. These assets have numerous in-service dates for which it is difficult to assign the obligation to a particular year. Therefore, the obligation was measured using an average service life.
In December 2014, the EPA issued a pre-publication version of a final rule imposing requirements for activities involving coal ash waste. The ruling, once effective, will not result in the creation of a new legal obligation and Xcel Energy’s estimated cash flows for the closure of coal ash landfills and impoundments are not expected to significantly increase as a result of the ruling.
For the nuclear assets, the ARO associated with the decommissioning of the NSP-Minnesota nuclear generating plants, Monticello and PI, originated with the in-service date of the facility. See Note 14 for further discussion of nuclear obligations.
A reconciliation of Xcel Energy’s AROs for the years ended Dec. 31, 2014 and 2013 is as follows:
(Thousands of Dollars)
BeginningBalance
Jan. 1, 2014Liabilities
Recognized AccretionCash FlowRevisions
EndingBalance
Dec. 31, 2014 (a)
Electric plantNuclear production decommissioning . . . . . . . . . . . . . . . . . . . $1,628,298 $ — $ 86,284 $ 323,365 $ 2,037,947Steam and other production ash containment . . . . . . . . . . . . . 79,353 — 3,354 44,893 127,600Steam and other production asbestos . . . . . . . . . . . . . . . . . . . . 50,827 747 2,972 15,152 69,698Wind production. . . . . . . . . . . . . . . . . . . . . . . . . . . . . . . . . . . . 37,464 — 1,676 (880) 38,260Electric distribution . . . . . . . . . . . . . . . . . . . . . . . . . . . . . . . . . 12,186 — 444 (37) 12,593Other. . . . . . . . . . . . . . . . . . . . . . . . . . . . . . . . . . . . . . . . . . . . . 3,551 705 137 212 4,605Natural gas plantGas transmission and distribution . . . . . . . . . . . . . . . . . . . . . . 1,198 20,935 76 127,755 149,964Other. . . . . . . . . . . . . . . . . . . . . . . . . . . . . . . . . . . . . . . . . . . . . 575 2,865 24 461 3,925Common and other propertyCommon general plant asbestos . . . . . . . . . . . . . . . . . . . . . . . . 480 — 25 — 505Common miscellaneous . . . . . . . . . . . . . . . . . . . . . . . . . . . . . . 1,458 — 53 23 1,534
Total liability . . . . . . . . . . . . . . . . . . . . . . . . . . . . . . . . . . . . . $1,815,390 $ 25,252 $ 95,045 $ 510,944 $ 2,446,631
(a) There were no ARO liabilities settled during the year ended Dec. 31, 2014.
The aggregate fair value of NSP-Minnesota’s legally restricted assets, for purposes of funding future nuclear decommissioning, was $1.7 billion as of Dec. 31, 2014, consisting of external investment funds.
Schedule Q-3 Page 158 of 182
Sponsor: Robinson Case No. 15-00139-UT

143
(Thousands of Dollars)
BeginningBalance
Jan. 1, 2013Liabilities
RecognizedLiabilities
Settled AccretionCash FlowRevisions
EndingBalance
Dec. 31, 2013
Electric plantNuclear production decommissioning . . . . . . . . . $1,546,358 $ — $ — $ 81,940 $ — $1,628,298Steam and other production ash containment . . . . 61,735 — — 2,105 15,513 79,353Steam and other production asbestos . . . . . . . . . . 45,461 — (1,059) 2,551 3,874 50,827Wind production . . . . . . . . . . . . . . . . . . . . . . . . . . 35,864 — — 1,600 — 37,464Electric distribution. . . . . . . . . . . . . . . . . . . . . . . . 24,150 — — 708 (12,672) 12,186Other . . . . . . . . . . . . . . . . . . . . . . . . . . . . . . . . . . . 3,152 — — 240 159 3,551Natural gas plantGas transmission and distribution . . . . . . . . . . . . . 1,258 — — 81 (141) 1,198Other . . . . . . . . . . . . . . . . . . . . . . . . . . . . . . . . . . . — 575 — — — 575Common and other propertyCommon general plant asbestos . . . . . . . . . . . . . . 1,197 — — 66 (783) 480Common miscellaneous . . . . . . . . . . . . . . . . . . . . 621 — — 59 778 1,458
Total liability. . . . . . . . . . . . . . . . . . . . . . . . . . . . $1,719,796 $ 575 $ (1,059) $ 89,350 $ 6,728 $1,815,390
The aggregate fair value of NSP-Minnesota’s legally restricted assets, for purposes of funding future nuclear decommissioning, was $1.6 billion as of Dec. 31, 2013, consisting of external investment funds.
Indeterminate AROs — PSCo has certain underground natural gas storage facilities that have special closure requirements for which the final removal date cannot be determined; therefore, an ARO has not been recorded for these facilities.
Removal Costs — Xcel Energy records a regulatory liability for the plant removal costs of generation, transmission and distribution facilities of its utility subsidiaries that are recovered currently in rates. Generally, the accrual of future non-ARO removal obligations is not required. However, long-standing ratemaking practices approved by applicable state and federal regulatory commissions have allowed provisions for such costs in historical depreciation rates. These removal costs have accumulated over a number of years based on varying rates as authorized by the appropriate regulatory entities. Given the long time periods over which the amounts were accrued and the changing of rates over time, the utility subsidiaries have estimated the amount of removal costs accumulated through historic depreciation expense based on current factors used in the existing depreciation rates.
The accumulated balances by entity were as follows at Dec. 31:
(Millions of Dollars) 2014 2013
NSP-Minnesota . . . . . . . . . . . . . . . . . . . . . . . . . . . . . . . . . . . . . . . . . . . . . . . . . . . . . . . . . . . . . . . . $ 396 $ 378NSP-Wisconsin. . . . . . . . . . . . . . . . . . . . . . . . . . . . . . . . . . . . . . . . . . . . . . . . . . . . . . . . . . . . . . . . . 123 116PSCo. . . . . . . . . . . . . . . . . . . . . . . . . . . . . . . . . . . . . . . . . . . . . . . . . . . . . . . . . . . . . . . . . . . . . . . . . 366 359SPS . . . . . . . . . . . . . . . . . . . . . . . . . . . . . . . . . . . . . . . . . . . . . . . . . . . . . . . . . . . . . . . . . . . . . . . . . . 68 53
Total Xcel Energy . . . . . . . . . . . . . . . . . . . . . . . . . . . . . . . . . . . . . . . . . . . . . . . . . . . . . . . . . . . . . $ 953 $ 906
Nuclear Insurance
NSP-Minnesota’s public liability for claims resulting from any nuclear incident is limited to $13.6 billion under the Price-Anderson amendment to the Atomic Energy Act. NSP-Minnesota has secured $375 million of coverage for its public liability exposure with a pool of insurance companies. The remaining $13.2 billion of exposure is funded by the Secondary Financial Protection Program, available from assessments by the federal government in case of a nuclear accident. NSP-Minnesota is subject to assessments of up to $127.3 million per reactor per accident for each of its three licensed reactors, to be applied for public liability arising from a nuclear incident at any licensed nuclear facility in the United States. The maximum funding requirement is $19.0 million per reactor during any one year. These maximum assessment amounts are both subject to inflation adjustment by the NRC and state premium taxes. The NRC’s last adjustment was effective September 2013.
Schedule Q-3 Page 159 of 182
Sponsor: Robinson Case No. 15-00139-UT

144
NSP-Minnesota purchases insurance for property damage and site decontamination cleanup costs from Nuclear Electric Insurance Ltd. (NEIL). The coverage limits are $2.3 billion for each of NSP-Minnesota’s two nuclear plant sites. NEIL also provides business interruption insurance coverage, including the cost of replacement power obtained during certain prolonged accidental outages of nuclear generating units. Premiums are expensed over the policy term. All companies insured with NEIL are subject to retroactive premium adjustments if losses exceed accumulated reserve funds. Capital has been accumulated in the reserve funds of NEIL to the extent that NSP-Minnesota would have no exposure for retroactive premium assessments in case of a single incident under the business interruption and the property damage insurance coverage. However, in each calendar year, NSP-Minnesota could be subject to maximum assessments of approximately $17.9 million for business interruption insurance and $43.6 million for property damage insurance if losses exceed accumulated reserve funds.
Legal Contingencies
Xcel Energy is involved in various litigation matters that are being defended and handled in the ordinary course of business. The assessment of whether a loss is probable or is a reasonable possibility, and whether the loss or a range of loss is estimable, often involves a series of complex judgments about future events. Management maintains accruals for such losses that are probable of being incurred and subject to reasonable estimation. Management is sometimes unable to estimate an amount or range of a reasonably possible loss in certain situations, including but not limited to when (1) the damages sought are indeterminate, (2) the proceedings are in the early stages, or (3) the matters involve novel or unsettled legal theories. In such cases, there is considerable uncertainty regarding the timing or ultimate resolution of such matters, including a possible eventual loss. For current proceedings not specifically reported herein, management does not anticipate that the ultimate liabilities, if any, arising from such current proceedings would have a material effect on Xcel Energy’s financial statements. Unless otherwise required by GAAP, legal fees are expensed as incurred.
Employment, Tort and Commercial Litigation
Exelon Wind (formerly John Deere Wind) Complaint — Several lawsuits in Texas state and federal courts and regulatory proceedings have arisen out of a dispute concerning SPS’ payments for energy and capacity produced from the Exelon Wind subsidiaries’ projects. There are two main areas of dispute. First, Exelon Wind claims that it established legally enforceable obligations (LEOs) for each of its 12 wind facilities in 2005 through 2008 that require SPS to buy power based on SPS’ forecasted avoided cost as determined in 2005 through 2008. Although SPS has refused to accept Exelon Wind’s LEOs, SPS accepts that it must take energy from Exelon Wind under SPS’ PUCT-approved Qualifying Facilities (QF) Tariff. Second, Exelon Wind has raised various challenges to SPS’ PUCT-approved QF Tariff, which became effective in August 2010. On Jan.16, 2015, Exelon Wind filed motions to dismiss or notices of non-suits for its state and federal lawsuits regarding the QF tariff, and for its state and federal lawsuits and regulatory proceedings regarding the LEOs. Later in January, the PUCT and state and federal courts issued orders dismissing the cases. The only remaining proceedings are pending before the FERC (one regarding the QF Tariff and the other regarding the LEOs).
SPS believes the likelihood of loss in these proceedings is remote based primarily on existing case law and while it is not possible to estimate the amount or range of reasonably possible loss in the event of an adverse outcome, SPS believes such loss would not be material based upon its belief that it would be permitted to recover such costs, if needed, through its various fuel clause mechanisms. No accrual has been recorded for this matter.
Pacific Northwest FERC Refund Proceeding — In July 2001, the FERC ordered a preliminary hearing to determine whether there were unjust and unreasonable charges for spot market bilateral sales in the Pacific Northwest for December 2000 through June 2001. PSCo supplied energy to the Pacific Northwest markets during this period and has been a participant in the hearings. In September 2001, the presiding ALJ concluded that prices in the Pacific Northwest during the referenced period were the result of a number of factors, including the shortage of supply, excess demand, drought and increased natural gas prices. Under these circumstances, the ALJ concluded that the prices in the Pacific Northwest markets were not unreasonable or unjust and no refunds should be ordered. Subsequent to the ruling, the FERC has allowed the parties to request additional evidence. Parties have claimed that the total amount of transactions with PSCo subject to refund is $34 million. In June 2003, the FERC issued an order terminating the proceeding without ordering further proceedings. Certain purchasers filed appeals of the FERC’s orders in this proceeding with the Ninth Circuit.
In an order issued in August 2007, the Ninth Circuit remanded the proceeding back to the FERC and indicated that the FERC should consider other rulings addressing overcharges in the California organized markets. The Ninth Circuit denied a petition for rehearing in April 2009, and the mandate was issued.
The FERC issued an order on remand establishing principles for the review proceeding in October 2011. In September 2012, the City of Seattle filed its direct case against PSCo and other Pacific Northwest sellers claiming refunds for the period January 2000 through June 2001. The City of Seattle indicated that for the period June 2000 through June 2001 PSCo had sales to the City of Seattle of approximately $50 million. The City of Seattle did not identify specific instances of unlawful market activity by PSCo, but rather based its claim for refunds on market dysfunction in the Western markets. PSCo submitted its answering case in December 2012.
Schedule Q-3 Page 160 of 182
Sponsor: Robinson Case No. 15-00139-UT

145
In April 2013, the FERC issued an order on rehearing. The FERC confirmed that the City of Seattle would be able to attempt to obtain refunds back from January 2000, but reaffirmed the transaction-specific standard that the City of Seattle and other complainants would have to comply with to obtain refunds. In addition, the FERC rejected the imposition of any market-wide remedies. Although the FERC order on rehearing established the period for which the City of Seattle could seek refunds as January 2000 through June 2001, it is unclear what claim the City of Seattle has against PSCo prior to June 2000. In the proceeding, the City of Seattle does not allege specific misconduct or tariff violations by PSCo but instead asserts generally that the rates charged by PSCo and other sellers were excessive.
A hearing in this case was held before a FERC ALJ and concluded in October 2013. In March 2014, the FERC ALJ issued an initial decision which rejected all of the City of Seattle’s claims against PSCo and other respondents. With respect to the period Jan. 1, 2000 through Dec. 24, 2000, the FERC ALJ rejected the City of Seattle’s assertion that any of the sales made to the City of Seattle resulted in an excessive burden to the City of Seattle, the applicable legal standard for the City of Seattle’s challenges during this period. With respect to the period Dec. 25, 2000 through June 20, 2001, the FERC ALJ concluded that the City of Seattle had failed to establish a causal link between any contracts and any claimed unlawful market activity, the standard required by the FERC in its remand order. The City of Seattle contested the FERC ALJ’s initial decision by filing a brief on exceptions to the FERC. PSCo filed a brief answering the City of Seattle’s exception. This matter is now pending a decision by the FERC.
Preliminary calculations of the City of Seattle’s claim for refunds from PSCo are approximately $28 million excluding interest. PSCo has concluded that a loss is reasonably possible with respect to this matter; however, given the surrounding uncertainties, PSCo is currently unable to estimate the amount or range of reasonably possible loss in the event of an adverse outcome of this matter. In making this assessment, PSCo considered two factors. First, notwithstanding PSCo’s view that the City of Seattle has failed to apply the standard that the FERC has established in this proceeding, and the recognition that this case raises a novel issue and the FERC’s standard has been challenged on appeal to the Ninth Circuit, the outcome of such an appeal cannot be predicted with any certainty. Second, PSCo would expect to make equitable arguments against refunds even if the City of Seattle were to establish that it was overcharged for transactions. If a loss were sustained, PSCo would attempt to recover those losses from other PRPs. No accrual has been recorded for this matter.
Biomass Fuel Handling Reimbursement — NSP-Minnesota has a PPA through which it procures energy from Fibrominn, LLC (Fibrominn). Under this agreement, NSP-Minnesota is charged for certain costs of transporting biomass fuels that are delivered to Fibrominn’s generation facility. Fibrominn has demanded additional cost reimbursement for certain transportation costs incurred since 2007, as well as reimbursement for similar costs in future periods. Fibrominn claims that it is entitled to reimbursement from NSP-Minnesota for past transportation costs of approximately $20 million. NSP-Minnesota has evaluated Fibrominn’s claim and based on the terms of the PPA with Fibrominn and its current understanding of the facts, NSP-Minnesota disputes the validity of Fibrominn’s claim, on the ground that, among other things, it seeks to impose contractual obligations on NSP-Minnesota that are neither supported by the terms nor the intent of the PPA. NSP-Minnesota has concluded that a loss is reasonably possible with respect to this matter; however, given the surrounding uncertainties, NSP-Minnesota is currently unable to determine the amount of reasonably possible loss. If a loss were sustained, NSP-Minnesota would attempt to recover these fuel-related costs in rates. No accrual has been recorded for this matter.
Nuclear Power Operations and Waste Disposal
Nuclear Waste Disposal Litigation — In 1998, NSP-Minnesota filed a complaint in the U.S. Court of Federal Claims against the United States requesting breach of contract damages for the DOE’s failure to begin accepting spent nuclear fuel by Jan. 31, 1998, as required by the contract between the United States and NSP-Minnesota. NSP-Minnesota sought contract damages in this lawsuit through Dec. 31, 2004. In September 2007, the Court awarded NSP-Minnesota $116.5 million in damages. In August 2007, NSP-Minnesota filed a second complaint; this lawsuit claimed damages for the period Jan. 1, 2005 through Dec. 31, 2008.
In July 2011, the United States and NSP-Minnesota executed a settlement agreement resolving both lawsuits, providing an initial $100 million payment from the United States to NSP-Minnesota, and providing a method by which NSP-Minnesota can recover its spent fuel storage costs through 2013, estimated to be an additional $100 million. In January 2014, the United States proposed, and NSP-Minnesota accepted, an extension to the settlement agreement which will allow NSP-Minnesota to recover spent fuel storage costs through 2016. The extension does not address costs for used fuel storage after 2016; such costs could be the subject of future litigation. In December 2014, NSP-Minnesota received a settlement payment of $32.8 million. NSP-Minnesota has received a total of $214.7 million of settlement proceeds as of Dec. 31, 2014. Amounts received from the installments, except for approved reductions such as legal costs, will be subsequently returned to customers through a reduction of future rate increases or credited through another regulatory mechanism.
Other Contingencies
See Note 12 for further discussion.
Schedule Q-3 Page 161 of 182
Sponsor: Robinson Case No. 15-00139-UT

146
14. Nuclear Obligations
Fuel Disposal — NSP-Minnesota is responsible for temporarily storing used or spent nuclear fuel from its nuclear plants. The DOE is responsible for permanently storing spent fuel from NSP-Minnesota’s nuclear plants as well as from other U.S. nuclear plants, but no such facility is yet available. NSP-Minnesota has funded its portion of the DOE’s permanent disposal program since 1981. The fuel disposal fees were based on a charge of 0.1 cent per KWh sold to customers from nuclear generation. Effective May 2014, the DOE set the fee to zero.
Fuel expense includes the DOE fuel disposal assessments of approximately $5 million in 2014, $10 million in 2013 and $12 million in 2012. In total, NSP-Minnesota paid approximately $452.1 million to the DOE through Dec. 31, 2014. See Note 13 — Nuclear Waste Disposal Litigation for further discussion.
NSP-Minnesota has its own temporary on-site storage facilities for spent fuel at its Monticello and PI nuclear plants, which consist of storage pools and dry cask facilities at both sites. The amount of spent fuel storage capacity is determined by the NRC and the MPUC. The Monticello dry-cask storage facility currently stores 15 of the 30 authorized canisters, and the PI dry-cask storage facility currently stores 38 of the 64 authorized casks. Other alternatives for spent fuel storage are being investigated until a DOE facility is available.
Regulatory Plant Decommissioning Recovery — Decommissioning activities related to NSP-Minnesota’s nuclear facilities are planned to begin at the end of each unit’s operating license and be completed by 2091. NSP-Minnesota’s current operating licenses allow continued use of its Monticello nuclear plant until 2030 and its PI nuclear plant until 2033 for Unit 1 and 2034 for Unit 2.
Future decommissioning costs of nuclear facilities are estimated through periodic studies that assess the costs and timing of planned nuclear decommissioning activities for each unit. The MPUC most recently approved NSP-Minnesota’s 2011 nuclear decommissioning study in November 2012. This cost study quantified decommissioning costs in 2011 dollars and utilized escalation rates of 3.63 percent per year for plant removal activities, and 2.63 percent for spent fuel management and site restoration activities over a 60-year decommissioning scenario.
In December 2014, NSP-Minnesota submitted its most recent nuclear decommissioning filing to the MPUC, which included an update to the decommissioning cost study and requested an annual funding requirement of $14.0 million starting in 2016. A decision on the filing is expected in late 2015 or early 2016.
The total obligation for decommissioning is expected to be funded 100 percent by the external decommissioning trust fund when decommissioning commences. NSP-Minnesota’s most recently approved decommissioning study resulted in an annual funding requirement of $14.2 million to be recovered in utility customer rates. This cost study assumes the external decommissioning fund will earn an after-tax return between 4.57 percent and 5.53 percent. Realized and unrealized gains on fund investments are deferred as an offset of NSP-Minnesota’s regulatory asset for nuclear decommissioning costs.
As of Dec. 31, 2014, NSP-Minnesota has accumulated $1.7 billion of assets held in external decommissioning trusts. The following table summarizes the funded status of NSP-Minnesota’s decommissioning obligation based on parameters established in the most recently approved decommissioning study. Xcel Energy believes future decommissioning costs, if necessary, will continue to be recovered in customer rates. The amounts presented below were prepared on a regulatory basis, and are not recorded in the financial statements for the ARO.
Regulatory Basis(Thousands of Dollars) 2014 2013
Estimated decommissioning cost obligation from most recently approved study (2011 dollars). . . . . . $ 2,694,079 $ 2,694,079Effect of escalating costs (to 2014 and 2013 dollars, respectively, at 3.63/2.63 percent). . . . . . . . . . . . 289,907 189,924Estimated decommissioning cost obligation (in current dollars) . . . . . . . . . . . . . . . . . . . . . . . . . . . . . . 2,983,986 2,884,003Effect of escalating costs to payment date (3.63/2.63 percent) . . . . . . . . . . . . . . . . . . . . . . . . . . . . . . . . 5,597,302 5,697,285Estimated future decommissioning costs (undiscounted) . . . . . . . . . . . . . . . . . . . . . . . . . . . . . . . . . . . . 8,581,288 8,581,288Effect of discounting obligation (using average risk-free interest rate of 2.82 percent and 4.19
percent for 2014 and 2013, respectively). . . . . . . . . . . . . . . . . . . . . . . . . . . . . . . . . . . . . . . . . . . . . . . (5,044,470) (6,215,050)Discounted decommissioning cost obligation . . . . . . . . . . . . . . . . . . . . . . . . . . . . . . . . . . . . . . . . . . $ 3,536,818 $ 2,366,238
Assets held in external decommissioning trust . . . . . . . . . . . . . . . . . . . . . . . . . . . . . . . . . . . . . . . . . . . . $ 1,703,921 $ 1,627,026Underfunding of external decommissioning fund compared to the discounted decommissioning
obligation . . . . . . . . . . . . . . . . . . . . . . . . . . . . . . . . . . . . . . . . . . . . . . . . . . . . . . . . . . . . . . . . . . . . . . . 1,832,897 739,212
Schedule Q-3 Page 162 of 182
Sponsor: Robinson Case No. 15-00139-UT

147
Decommissioning expenses recognized as a result of regulation include the following components:
(Thousands of Dollars) 2014 2013 2012
Annual decommissioning recorded as depreciation expense: (a)
Externally funded . . . . . . . . . . . . . . . . . . . . . . . . . . . . . . . . . . . . . . . . . . . . . . . . . . . . . $ 7,138 $ 6,402 $ —Internally funded (including interest costs) . . . . . . . . . . . . . . . . . . . . . . . . . . . . . . . . . — — (1,251)
Net decommissioning expense recorded . . . . . . . . . . . . . . . . . . . . . . . . . . . . . . . . . . $ 7,138 $ 6,402 $ (1,251)(a) Decommissioning expense does not include depreciation of the capitalized nuclear asset retirement costs.
The reduction to expense for internally-funded portions in 2012 was a direct result of the 2008 decommissioning study jurisdictional allocation and 100 percent external funding approval, effectively unwinding the remaining internal fund over the previously licensed operating life of the unit (2010 for Monticello, 2013 for PI Unit 1 and 2014 for PI Unit 2). Due to the immaterial amount remaining in the internal fund, the entire remaining amount was unwound for PI 1 and 2 in 2012. As of Dec. 31, 2013, there was no balance remaining in the internally funded decommissioning account. The 2011 nuclear decommissioning filing approved in 2012 has been used for the regulatory presentation.
15. Regulatory Assets and Liabilities
Xcel Energy Inc. and subsidiaries prepare their consolidated financial statements in accordance with the applicable accounting guidance, as discussed in Note 1. Under this guidance, regulatory assets and liabilities are created for amounts that regulators may allow to be collected, or may require to be paid back to customers in future electric and natural gas rates. Any portion of Xcel Energy’s business that is not regulated cannot establish regulatory assets and liabilities. If changes in the utility industry or the business of Xcel Energy no longer allow for the application of regulatory accounting guidance under GAAP, Xcel Energy would be required to recognize the write-off of regulatory assets and liabilities in net income or OCI.
The components of regulatory assets shown on the consolidated balance sheets at Dec. 31, 2014 and 2013 are:
(Thousands of Dollars) See Note(s)Remaining
Amortization Period Dec. 31, 2014 Dec. 31, 2013Regulatory Assets Current Noncurrent Current NoncurrentPension and retiree medical obligations (a) . . . . . . . . . . . . 9 Various $ 95,054 $ 1,402,360 $ 118,179 $ 1,192,808Recoverable deferred taxes on AFUDC recorded in plant 1 Plant lives — 395,329 — 359,215Contract valuation adjustments (b). . . . . . . . . . . . . . . . . . . 1, 11 Term of related contract 17,730 144,273 3,620 153,393Net AROs (c) . . . . . . . . . . . . . . . . . . . . . . . . . . . . . . . . . . . 1, 13, 14 Plant lives — 189,056 — 160,544Conservation programs (d) . . . . . . . . . . . . . . . . . . . . . . . . . 1 One to six years 61,866 58,174 55,088 63,275Environmental remediation costs . . . . . . . . . . . . . . . . . . . 1, 13 Various 4,594 149,812 4,735 119,175Renewable resources and environmental initiatives . . . . . 13 One to four years 24,891 29,902 46,076 37,858Depreciation differences . . . . . . . . . . . . . . . . . . . . . . . . . . 1 One to seventeen years 10,700 104,743 10,918 95,844Purchased power contract costs . . . . . . . . . . . . . . . . . . . . 13 Term of related contract 858 69,908 — 68,182Losses on reacquired debt. . . . . . . . . . . . . . . . . . . . . . . . . 4 Term of related debt 5,258 31,276 5,525 36,534Nuclear refueling outage costs . . . . . . . . . . . . . . . . . . . . . 1 One to two years 62,499 19,745 86,333 36,477Gas pipeline inspection and remediation costs . . . . . . . . . 12 Various 9,981 21,869 5,416 33,884Recoverable purchased natural gas and electric energy
costs . . . . . . . . . . . . . . . . . . . . . . . . . . . . . . . . . . . . . . . 1 One to two years 68,841 4,745 42,288 15,495State commission adjustments . . . . . . . . . . . . . . . . . . . . . 1 Plant lives 571 26,092 444 14,204PI EPU (e). . . . . . . . . . . . . . . . . . . . . . . . . . . . . . . . . . . . . . 12 Pending rate cases 8,743 67,379 — 69,668Property tax. . . . . . . . . . . . . . . . . . . . . . . . . . . . . . . . . . . . One to three years 28,024 31,429 18,427 30,626Other . . . . . . . . . . . . . . . . . . . . . . . . . . . . . . . . . . . . . . . . . Various 44,448 28,124 20,752 22,036
Total regulatory assets . . . . . . . . . . . . . . . . . . . . . . . . . . $ 444,058 $ 2,774,216 $ 417,801 $ 2,509,218
(a) Includes $282.4 million and $303.3 million for the regulatory recognition of the NSP-Minnesota pension expense of which $23.8 million and $23.2 million is included in the current asset at Dec. 31, 2014 and 2013, respectively. Also included are $26.1 million and $17.7 million of regulatory assets related to the nonqualified pension plan of which $2.5 million and $2.2 million is included in the current asset at Dec. 31, 2014 and 2013, respectively.
(b) Includes the fair value of certain long-term PPAs used to meet energy capacity requirements and valuation adjustments on natural gas commodity purchases.(c) Includes amounts recorded for future recovery of AROs, less amounts recovered through nuclear decommissioning accruals and gains from decommissioning
investments.(d) Includes costs for conservation programs, as well as incentives allowed in certain jurisdictions.(e) For the canceled PI EPU project, NSP-Minnesota has addressed recovery of incurred costs in the pending multi-year rate case.
Schedule Q-3 Page 163 of 182
Sponsor: Robinson Case No. 15-00139-UT

148
The components of regulatory liabilities shown on the consolidated balance sheets at Dec. 31, 2014 and 2013 are:
(Thousands of Dollars) See Note(s)Remaining
Amortization Period Dec. 31, 2014 Dec. 31, 2013Regulatory Liabilities Current Noncurrent Current NoncurrentPlant removal costs . . . . . . . . . . . . . . . . . . . . . . . . . . . . . . 1, 13 Plant lives $ — $ 953,660 $ — $ 906,403Deferred electric and steam production and natural gas
costs . . . . . . . . . . . . . . . . . . . . . . . . . . . . . . . . . . . . . . . 1 Less than one year 88,527 — 96,574 —DOE settlement. . . . . . . . . . . . . . . . . . . . . . . . . . . . . . . . . 12 One to two years 49,492 — 44,208 1,131Investment tax credit deferrals . . . . . . . . . . . . . . . . . . . . . 1, 6 Various — 52,666 — 56,535Deferred income tax adjustment . . . . . . . . . . . . . . . . . . . . 1, 6 Various — 48,622 — 43,581Conservation programs (b) . . . . . . . . . . . . . . . . . . . . . . . . . 1, 12 Less than one year 103,351 — 19,531 —Contract valuation adjustments (a) . . . . . . . . . . . . . . . . . . . 1, 11 Term of related contract 55,751 2,521 54,455 6,849Gain from asset sales . . . . . . . . . . . . . . . . . . . . . . . . . . . . 12 One to three years 2,893 4,472 12,859 4,568Renewable resources and environmental initiatives . . . . . 12, 13 Various 10,427 10,376 2,499 1,412Low income discount program . . . . . . . . . . . . . . . . . . . . . Less than one year 3,355 — 6,229 —PSCo earnings test . . . . . . . . . . . . . . . . . . . . . . . . . . . . . . 12 One to two years 57,127 42,819 22,891 19,203Pipeline inspection . . . . . . . . . . . . . . . . . . . . . . . . . . . . . . Various 13,970 642 — —Excess depreciation reserve . . . . . . . . . . . . . . . . . . . . . . . Various 10,999 — — —Other . . . . . . . . . . . . . . . . . . . . . . . . . . . . . . . . . . . . . . . . . Various 14,837 47,651 15,523 19,713
Total regulatory liabilities . . . . . . . . . . . . . . . . . . . . . . . $ 410,729 $ 1,163,429 $ 274,769 $ 1,059,395
(a) Includes the fair value of certain long-term PPAs used to meet energy capacity requirements and valuation adjustments on natural gas commodity purchases.(b) Includes costs for conservation programs, as well as incentives allowed in certain jurisdictions.
At Dec. 31, 2014 and 2013, approximately $323 million and $306 million of Xcel Energy’s regulatory assets represented past expenditures not currently earning a return, respectively. This amount primarily includes PI EPU costs, recoverable purchased natural gas and electric energy costs and certain expenditures associated with renewable resources and environmental initiatives.
16. Other Comprehensive Income
Changes in accumulated other comprehensive (loss) income, net of tax, for the years ended Dec. 31, 2014 and 2013 were as follows:
Year Ended Dec. 31, 2014
(Thousands of Dollars)
Gains andLosses on Cash
Flow Hedges
UnrealizedGains and Losses
on MarketableSecurities
Defined BenefitPension and
PostretirementItems Total
Accumulated other comprehensive (loss) income at Jan. 1 . . . . . . . . . $ (59,753) $ 77 $ (46,599) $ (106,275)Other comprehensive (loss) income before reclassifications. . . . . . . (163) 33 (7,517) (7,647)Losses reclassified from net accumulated other comprehensive loss 2,288 — 3,495 5,783
Net current period other comprehensive income (loss) . . . . . . . . . . . . 2,125 33 (4,022) (1,864)Accumulated other comprehensive (loss) income at Dec. 31 . . . . . . . $ (57,628) $ 110 $ (50,621) $ (108,139)
Year Ended Dec. 31, 2013
(Thousands of Dollars)
Gains andLosses on Cash
Flow Hedges
UnrealizedGains and Losses
on MarketableSecurities
Defined BenefitPension and
PostretirementItems Total
Accumulated other comprehensive loss at Jan. 1. . . . . . . . . . . . . . . . . $ (61,241) $ (99) $ (51,313) $ (112,653)OCI before reclassifications. . . . . . . . . . . . . . . . . . . . . . . . . . . . . . . . 12 176 1,408 1,596Losses reclassified from net accumulated other comprehensive loss 1,476 — 3,306 4,782
Net current period OCI. . . . . . . . . . . . . . . . . . . . . . . . . . . . . . . . . . . . . 1,488 176 4,714 6,378Accumulated other comprehensive (loss) income at Dec. 31 . . . . . . . $ (59,753) $ 77 $ (46,599) $ (106,275)
Schedule Q-3 Page 164 of 182
Sponsor: Robinson Case No. 15-00139-UT

149
Reclassifications from accumulated other comprehensive loss for the years ended Dec. 31, 2014 and 2013 were as follows:
Amounts Reclassified from Accumulated Other Comprehensive Loss
(Thousands of Dollars)Year Ended
Dec. 31, 2014Year Ended
Dec. 31, 2013
(Gains) losses on cash flow hedges:Interest rate derivatives . . . . . . . . . . . . . . . . . . . . . . . . . . . . . . . . . . . . . . . . . . $ 3,836 (a) $ 4,107 (a)
Vehicle fuel derivatives . . . . . . . . . . . . . . . . . . . . . . . . . . . . . . . . . . . . . . . . . . (55) (b) (90) (b)
Total, pre-tax . . . . . . . . . . . . . . . . . . . . . . . . . . . . . . . . . . . . . . . . . . . . . . . . . . . . . 3,781 4,017Tax benefit . . . . . . . . . . . . . . . . . . . . . . . . . . . . . . . . . . . . . . . . . . . . . . . . . . . . (1,493) (2,541)
Total, net of tax . . . . . . . . . . . . . . . . . . . . . . . . . . . . . . . . . . . . . . . . . . . . . . . . . . . 2,288 1,476Defined benefit pension and postretirement (gains) losses:
Amortization of net loss . . . . . . . . . . . . . . . . . . . . . . . . . . . . . . . . . . . . . . . . . . 5,998 (c) 7,077 (c)
Prior service (credit) cost . . . . . . . . . . . . . . . . . . . . . . . . . . . . . . . . . . . . . . . . . (344) (c) 372 (c)
Transition obligation . . . . . . . . . . . . . . . . . . . . . . . . . . . . . . . . . . . . . . . . . . . . — (c) 8 (c)
Total, pre-tax . . . . . . . . . . . . . . . . . . . . . . . . . . . . . . . . . . . . . . . . . . . . . . . . . . . . . 5,654 7,457Tax benefit . . . . . . . . . . . . . . . . . . . . . . . . . . . . . . . . . . . . . . . . . . . . . . . . . . . . (2,159) (4,151)
Total, net of tax . . . . . . . . . . . . . . . . . . . . . . . . . . . . . . . . . . . . . . . . . . . . . . . . . . . 3,495 3,306Total amounts reclassified, net of tax . . . . . . . . . . . . . . . . . . . . . . . . . . . . . . . . . . . $ 5,783 $ 4,782
(a) Included in interest charges.(b) Included in O&M expenses.(c) Included in the computation of net periodic pension and postretirement benefit costs. See Note 9 for details regarding these benefit plans.
17. Segments and Related Information
The regulated electric utility operating results of NSP-Minnesota, NSP-Wisconsin, PSCo and SPS, as well as the regulated natural gas utility operating results of NSP-Minnesota, NSP-Wisconsin and PSCo are each separately and regularly reviewed by Xcel Energy’s chief operating decision maker. Xcel Energy evaluates performance by each utility subsidiary based on profit or loss generated from the product or service provided. These segments are managed separately because the revenue streams are dependent upon regulated rate recovery, which is separately determined for each segment.
Xcel Energy has the following reportable segments: regulated electric utility, regulated natural gas utility and all other.
• Xcel Energy’s regulated electric utility segment generates, transmits and distributes electricity in Minnesota, Wisconsin, Michigan, North Dakota, South Dakota, Colorado, Texas and New Mexico. In addition, this segment includes sales for resale and provides wholesale transmission service to various entities in the United States. Regulated electric utility also includes commodity trading operations.
• Xcel Energy’s regulated natural gas utility segment transports, stores and distributes natural gas primarily in portions of Minnesota, Wisconsin, North Dakota, Michigan and Colorado.
• Revenues from operating segments not included above are below the necessary quantitative thresholds and are therefore included in the all other category. Those primarily include steam revenue, appliance repair services, nonutility real estate activities, revenues associated with processing solid waste into refuse-derived fuel and investments in rental housing projects that qualify for low-income housing tax credits.
Xcel Energy had equity investments in unconsolidated subsidiaries of $83.1 million and $87.1 million as of Dec. 31, 2014 and 2013, respectively, included in the regulated natural gas utility segment.
Asset and capital expenditure information is not provided for Xcel Energy’s reportable segments because as an integrated electric and natural gas utility, Xcel Energy operates significant assets that are not dedicated to a specific business segment, and reporting assets and capital expenditures by business segment would require arbitrary and potentially misleading allocations which may not necessarily reflect the assets that would be required for the operation of the business segments on a stand-alone basis.
To report income from operations for regulated electric and regulated natural gas utility segments, the majority of costs are directly assigned to each segment. However, some costs, such as common depreciation, common O&M expenses and interest expense are allocated based on cost causation allocators. A general allocator is used for certain general and administrative expenses, including office supplies, rent, property insurance and general advertising.
The accounting policies of the segments are the same as those described in Note 1.
Schedule Q-3 Page 165 of 182
Sponsor: Robinson Case No. 15-00139-UT

150
(Thousands of Dollars)RegulatedElectric
RegulatedNatural Gas All Other
ReconcilingEliminations
ConsolidatedTotal
2014Operating revenues from external customers . . . . . . . $ 9,465,890 $ 2,142,738 $ 77,507 $ — $ 11,686,135Intersegment revenues . . . . . . . . . . . . . . . . . . . . . . . . . 1,774 5,893 — (7,667) —
Total revenues . . . . . . . . . . . . . . . . . . . . . . . . . . . . . . $ 9,467,664 $ 2,148,631 $ 77,507 $ (7,667) $ 11,686,135
Depreciation and amortization . . . . . . . . . . . . . . . . . . $ 866,746 $ 144,661 $ 7,638 $ — $ 1,019,045Interest charges and financing costs . . . . . . . . . . . . . . 397,824 43,940 86,442 — 528,206Income tax expense (benefit). . . . . . . . . . . . . . . . . . . . 512,551 76,418 (65,154) — 523,815Net income. . . . . . . . . . . . . . . . . . . . . . . . . . . . . . . . . . 890,535 128,559 2,212 — 1,021,306
(Thousands of Dollars)RegulatedElectric
RegulatedNatural Gas All Other
ReconcilingEliminations
ConsolidatedTotal
2013Operating revenues from external customers . . . . . . . $ 9,034,045 $ 1,804,679 $ 76,198 $ — $ 10,914,922Intersegment revenues . . . . . . . . . . . . . . . . . . . . . . . . . 1,332 2,717 — (4,049) —
Total revenues . . . . . . . . . . . . . . . . . . . . . . . . . . . . . . $ 9,035,377 $ 1,807,396 $ 76,198 $ (4,049) $ 10,914,922
Depreciation and amortization . . . . . . . . . . . . . . . . . . $ 840,833 $ 128,186 $ 8,844 $ — $ 977,863Interest charges and financing costs . . . . . . . . . . . . . . 386,198 44,927 104,895 — 536,020Income tax expense (benefit). . . . . . . . . . . . . . . . . . . . 495,044 25,543 (36,611) — 483,976Net income (loss). . . . . . . . . . . . . . . . . . . . . . . . . . . . . 850,572 123,702 (26,040) — 948,234
(Thousands of Dollars)RegulatedElectric
RegulatedNatural Gas All Other
ReconcilingEliminations
ConsolidatedTotal
2012Operating revenues from external customers . . . . . . . $ 8,517,296 $ 1,537,374 $ 73,553 $ — $ 10,128,223Intersegment revenues . . . . . . . . . . . . . . . . . . . . . . . . . 1,169 1,425 — (2,594) —
Total revenues . . . . . . . . . . . . . . . . . . . . . . . . . . . . . . $ 8,518,465 $ 1,538,799 $ 73,553 $ (2,594) $ 10,128,223
Depreciation and amortization . . . . . . . . . . . . . . . . . . $ 801,649 $ 115,038 $ 9,366 $ — $ 926,053Interest charges and financing costs . . . . . . . . . . . . . . 397,457 49,456 119,324 — 566,237Income tax expense (benefit). . . . . . . . . . . . . . . . . . . . 465,626 50,322 (65,745) — 450,203Net income (loss). . . . . . . . . . . . . . . . . . . . . . . . . . . . . 851,929 98,061 (44,761) — 905,229
18. Summarized Quarterly Financial Data (Unaudited)
Quarter Ended(Amounts in thousands, except per share data) March 31, 2014 June 30, 2014 Sept. 30, 2014 Dec. 31, 2014
Operating revenues . . . . . . . . . . . . . . . . . . . . . . . . . . . . . . . . . . . . $ 3,202,604 $ 2,685,096 $ 2,869,807 $ 2,928,628Operating income . . . . . . . . . . . . . . . . . . . . . . . . . . . . . . . . . . . . . 493,992 397,208 665,680 391,250Net income . . . . . . . . . . . . . . . . . . . . . . . . . . . . . . . . . . . . . . . . . . 261,221 195,164 368,582 196,339EPS total — basic . . . . . . . . . . . . . . . . . . . . . . . . . . . . . . . . . . . . . $ 0.52 $ 0.39 $ 0.73 $ 0.39EPS total — diluted. . . . . . . . . . . . . . . . . . . . . . . . . . . . . . . . . . . . 0.52 0.39 0.73 0.39Cash dividends declared per common share . . . . . . . . . . . . . . . . . 0.30 0.30 0.30 0.30
Quarter Ended(Amounts in thousands, except per share data) March 31, 2013 June 30, 2013 Sept. 30, 2013 Dec. 31, 2013
Operating revenues . . . . . . . . . . . . . . . . . . . . . . . . . . . . . . . . . . . . $ 2,782,849 $ 2,578,913 $ 2,822,338 $ 2,730,822Operating income . . . . . . . . . . . . . . . . . . . . . . . . . . . . . . . . . . . . . 454,624 402,236 665,113 325,582Net income . . . . . . . . . . . . . . . . . . . . . . . . . . . . . . . . . . . . . . . . . . 236,570 196,857 364,752 150,055EPS total — basic . . . . . . . . . . . . . . . . . . . . . . . . . . . . . . . . . . . . . $ 0.48 $ 0.40 $ 0.73 $ 0.30EPS total — diluted. . . . . . . . . . . . . . . . . . . . . . . . . . . . . . . . . . . . 0.48 0.40 0.73 0.30Cash dividends declared per common share . . . . . . . . . . . . . . . . . 0.27 0.28 0.28 0.28
Schedule Q-3 Page 166 of 182
Sponsor: Robinson Case No. 15-00139-UT

151
Item 9 — Changes in and Disagreements with Accountants on Accounting and Financial Disclosure
None.
Item 9A — Controls and Procedures
Disclosure Controls and Procedures
Xcel Energy maintains a set of disclosure controls and procedures designed to ensure that information required to be disclosed in reports that it files or submits under the Securities Exchange Act of 1934 is recorded, processed, summarized, and reported within the time periods specified in SEC rules and forms. In addition, the disclosure controls and procedures ensure that information required to be disclosed is accumulated and communicated to management, including the chief executive officer (CEO) and chief financial officer (CFO), allowing timely decisions regarding required disclosure. As of Dec. 31, 2014, based on an evaluation carried out under the supervision and with the participation of Xcel Energy’s management, including the CEO and CFO, of the effectiveness of its disclosure controls and the procedures, the CEO and CFO have concluded that Xcel Energy’s disclosure controls and procedures were effective.
Internal Control Over Financial Reporting
No change in Xcel Energy’s internal control over financial reporting has occurred during the most recent fiscal quarter that has materially affected, or is reasonably likely to materially affect, Xcel Energy’s internal control over financial reporting. Xcel Energy maintains internal control over financial reporting to provide reasonable assurance regarding the reliability of the financial reporting. Xcel Energy has evaluated and documented its controls in process activities, general computer activities, and on an entity-wide level. During the year and in preparation for issuing its report for the year ended Dec. 31, 2014 on internal controls under section 404 of the Sarbanes-Oxley Act of 2002, Xcel Energy conducted testing and monitoring of its internal control over financial reporting. Based on the control evaluation, testing and remediation performed, Xcel Energy did not identify any material control weaknesses, as defined under the standards and rules issued by the Public Company Accounting Oversight Board and as approved by the SEC and as indicated in Management Report on Internal Controls herein.
Item 9B — Other Information
None.
PART III
Item 10 — Directors, Executive Officers and Corporate Governance
Information required under this Item with respect to Directors and Corporate Governance is set forth in Xcel Energy Inc.’s Proxy Statement for its 2015 Annual Meeting of Shareholders, which is incorporated by reference. Information with respect to Executive Officers is included in Item 1 to this report.
Item 11 — Executive Compensation
Information required under this Item is set forth in Xcel Energy Inc.’s Proxy Statement for its 2015 Annual Meeting of Shareholders, which is incorporated by reference.
Item 12 — Security Ownership of Certain Beneficial Owners and Management and Related Stockholder Matters
Information required under this Item is contained in Xcel Energy Inc.’s Proxy Statement for its 2015 Annual Meeting of Shareholders, which is incorporated by reference.
Item 13 — Certain Relationships and Related Transactions, and Director Independence
Information required under this Item is contained in Xcel Energy Inc.’s Proxy Statement for its 2015 Annual Meeting of Shareholders, which is incorporated by reference.
Item 14 — Principal Accountant Fees and Services
Information required under this Item is contained in Xcel Energy Inc.’s Proxy Statement for its 2015 Annual Meeting of Shareholders, which is incorporated by reference.
Schedule Q-3 Page 167 of 182
Sponsor: Robinson Case No. 15-00139-UT

152
PART IV
Item 15 — Exhibits, Financial Statement Schedules
1. Consolidated Financial Statements: Management Report on Internal Controls Over Financial Reporting — For the year ended Dec. 31, 2014. Report of Independent Registered Public Accounting Firm — Financial Statements Report of Independent Registered Public Accounting Firm — Internal Controls Over Financial Reporting Consolidated Statements of Income — For the three years ended Dec. 31, 2014, 2013 and 2012.
Consolidated Statements of Comprehensive Income — For the three years ended Dec. 31, 2014, 2013 and 2012. Consolidated Statements of Cash Flows — For the three years ended Dec. 31, 2014, 2013 and 2012. Consolidated Balance Sheets — As of Dec. 31, 2014 and 2013.
Consolidated Statements of Common Stockholders’ Equity — For the three years ended Dec. 31, 2014, 2013 and 2012.Consolidated Statements of Capitalization — As of Dec. 31, 2014 and 2013.
2. Schedule I — Condensed Financial Information of Registrant. Schedule II — Valuation and Qualifying Accounts and Reserves for the years ended Dec. 31, 2014, 2013 and 2012. 3. Exhibits* Indicates incorporation by reference+ Executive Compensation Arrangements and Benefit Plans Covering Executive Officers and Directorst Certain portions of this agreement have been omitted pursuant to a request for confidential treatment and have been filed
separately with the SEC.
Xcel Energy Inc.1.01* Equity Distribution Agreement, dated March 5, 2013, between Xcel Energy Inc. and Barclays Capital Inc. (Exhibit 1.1 to
Form 8-K dated March 5, 2013 (file no. 001-03034)).1.02* Equity Distribution Agreement, dated March 5, 2013, between Xcel Energy Inc. and Merrill Lynch, Pierce, Fenner &
Smith Incorporated (Exhibit 1.2 to Form 8-K dated March 5, 2013 (file no. 001-03034)).1.03* Equity Distribution Agreement, dated March 5, 2013, between Xcel Energy Inc. and Morgan Stanley & Co. LLC (Exhibit
1.3 to Form 8-K dated March 5, 2013 (file no. 001-03034)).
PSCo2.01* t Purchase and Sale Agreement by and between Riverside Energy Center, LLC and Calpine Development Holdings, Inc., as
Sellers, and PSCo, as Purchaser, dated as of April 2, 2010 (excluding certain schedules and exhibits referred to in theagreement, as amended, which the Registrant agrees to furnish supplemental to the SEC upon request) (Exhibit 2.01 toForm 10-Q for the quarter ended June 30, 2010 (file no. 001-03034)).
Xcel Energy Inc.3.01* Amended and Restated Articles of Incorporation of Xcel Energy Inc., as filed on May 17, 2012 (Exhibit 3.01 to Form 8-K
dated May 16, 2012 (file no. 001-03034)).3.02* Restated By-Laws of Xcel Energy Inc. (Exhibit 3.01 to Form 8-K dated Aug. 12, 2008 (file no. 001-03034)).
Xcel Energy Inc.4.01* Indenture dated Dec. 1, 2000, between Xcel Energy Inc. and Wells Fargo Bank Minnesota, National Association, as
Trustee. (Exhibit 4.01 to Form 8-K (file no. 001-03034) dated Dec. 14, 2000).4.02* Supplemental Indenture No. 3 dated June 1, 2006 between Xcel Energy Inc. and Wells Fargo Bank, National Association,
as Trustee, creating $300 million principal amount of 6.5 percent Senior Notes, Series due 2036 (Exhibit 4.01 to CurrentReport on Form 8-K (file no. 001-03034) dated June 6, 2006).
4.03* Supplemental Indenture No. 4 dated March 30, 2007 between Xcel Energy Inc. and Wells Fargo Bank, NationalAssociation, as Trustee, creating $253.979 million aggregate principal amount of 5.613 percent Senior Notes, Series due2017 (Exhibit 4.01 to Form 8-K (file no. 001-03034) dated March 30, 2007).
4.04* Junior Subordinated Indenture, dated as of Jan. 1, 2008, by and between Xcel Energy Inc. and Wells Fargo Bank, NationalAssociation, as Trustee (Exhibit 4.01 to Form 8-K (file no. 001-03034) dated Jan. 16, 2008).
Schedule Q-3 Page 168 of 182
Sponsor: Robinson Case No. 15-00139-UT

153
4.05* Supplemental Indenture No. 1, dated Jan. 16, 2008, by and between Xcel Energy Inc. and Wells Fargo Bank, NationalAssociation, as Trustee, creating $400 million principal amount of 7.6 percent Junior Subordinated Notes, Series due2068 (Exhibit 4.02 to Form 8-K (file no. 001-03034) dated Jan. 16, 2008).
4.06* Replacement Capital Covenant, dated Jan. 16, 2008 (Exhibit 4.03 to Form 8-K (file no. 001-03034) dated Jan. 16, 2008).4.07* Supplemental Indenture No. 5 dated as of May 1, 2010 between Xcel Energy Inc. and Wells Fargo Bank, National
Association, as Trustee, creating $550 million principal amount of 4.70 percent Senior Notes, Series due May 15, 2020(Exhibit 4.01 to Form 8-K (file no. 001-03034) dated May 10, 2010).
4.08* Supplemental Indenture No. 6 dated as of Sept. 1, 2011 between Xcel Energy Inc. and Wells Fargo Bank, NationalAssociation, as Trustee, creating $250 million principal amount of 4.80 percent Senior Notes, Series due September 15,2041 (Exhibit 4.01 to Form 8-K dated Sept. 12, 2011 (file no. 001-03034)).
4.09* Supplemental Indenture No. 7 dated as of May 1, 2013 between Xcel Energy and Wells Fargo Bank, NA, as Trustee,creating $450 million principal amount of 0.75 percent Senior Notes, Series due May 9, 2016 (Exhibit 4.01 to Form 8-Kdated May 9, 2013 (file no. 001-03034)).
NSP-Minnesota4.10* Supplemental and Restated Trust Indenture, dated May 1, 1988, from NSP-Minnesota to Harris Trust and Savings Bank,
as Trustee, providing for the issuance of First Mortgage Bonds (Exhibit 4.02 to Form 10-K of NSP-Minnesota for the yearended December 31, 1988 (file no. 001-03034)). Supplemental Indentures between NSP-Minnesota and said Trustee,dated as follows:
Supplemental Trust Indenture dated June 1, 1995, creating $250 million principal amount of 7.125 percent First MortgageBonds, Series due July 1, 2025 (Exhibit 4.01 to Form 8-K (file no. 001-03034) dated June 28, 1995).
Supplemental Trust Indenture dated April 1, 1997, creating $100 million principal amount of 8.5 percent First MortgageBonds, Series due Sept. 1, 2019 and $27.9 million principal amount of 8.5 percent First Mortgage Bonds, Series dueMarch 1, 2019 (Exhibit 4.47 to Form 10-K (file no. 001-03034) dated Dec. 31, 1997).
Supplemental Trust Indenture dated March 1, 1998, creating $150 million principal amount of 6.5 percent First MortgageBonds, Series due March 1, 2028 (Exhibit 4.01 to Form 8-K (file no. 001-03034) dated March 11, 1998).
4.11* Supplemental Trust Indenture dated Aug. 1, 2000 (Assignment and Assumption of Trust Indenture) (Exhibit 4.51 to NSP-Minnesota Form 10-12G (file no. 000-31709) dated Oct. 5, 2000).
4.12* Indenture, dated July 1, 1999, between NSP-Minnesota and Norwest Bank Minnesota, NA, as Trustee, providing for theissuance of Sr. Debt Securities. (Exhibit 4.01 to NSP-Minnesota Form 8-K (file no. 001-03034) dated July 21, 1999).
4.13* Supplemental Indenture, dated Aug. 18, 2000, supplemental to the Indenture dated July 1, 1999, among Xcel Energy,NSP-Minnesota and Wells Fargo Bank Minnesota, NA, as Trustee (Assignment and Assumption of Indenture)(Exhibit 4.63 to NSP-Minnesota Form 10-12G (file no. 000-31709) dated Oct. 5, 2000).
4.14* Supplemental Trust Indenture dated July 1, 2002 between NSP-Minnesota and BNY Midwest Trust Company, assuccessor Trustee, creating $69 million principal amount of 8.5 percent First Mortgage Bonds, Series due April 1, 2030(Exhibit 4.06 to NSP-Minnesota Quarterly Report on Form 10-Q (file no. 001-31387) dated Sept. 30, 2002).
4.15* Supplemental Trust Indenture dated July 1, 2005 between NSP-Minnesota and BNY Midwest Trust Company, assuccessor Trustee, creating $250 million principal amount of 5.25 percent First Mortgage Bonds, Series due July 15, 2035(Exhibit 4.01 to NSP-Minnesota Current Report on Form 8-K (file no. 001-31387) dated July 14, 2005).
4.16* Supplemental Trust Indenture dated May 1, 2006 between NSP-Minnesota and BNY Midwest Trust Company, assuccessor Trustee, creating $400 million principal amount of 6.25 percent First Mortgage Bonds, Series due June 1, 2036(Exhibit 4.01 to NSP-Minnesota Current Report on Form 8-K (file no. 001-31387) dated May 18, 2006).
4.17* Supplemental Trust Indenture, dated June 1, 2007, between NSP-Minnesota and BNY Midwest Trust Company, assuccessor Trustee (Exhibit 4.01 to NSP-Minnesota Form 8-K (file no. 001-31387) dated June 19, 2007).
4.18* Supplemental Trust Indenture dated March 1, 2008 between NSP-Minnesota and The Bank of New York Trust Company,NA, as successor Trustee (Exhibit 4.01 to NSP-Minnesota Form 8-K (file no. 001-31387) dated March 11, 2008).
4.19* Supplemental Trust Indenture dated as of Nov. 1, 2009 between NSP-Minnesota and The Bank of New York Mellon TrustCo., NA, as successor Trustee, creating $300 million principal amount of 5.35 percent First Mortgage Bonds, Series dueNov. 1, 2039 (Exhibit 4.01 to NSP-Minnesota Form 8-K (file no. 001-31387) dated Nov. 16, 2009).
4.20* Supplemental Trust Indenture dated as of Aug. 1, 2010 between NSP-Minnesota and The Bank of New York Mellon TrustCompany, NA, as successor Trustee, creating $250 million principal amount of 1.950 percent First Mortgage Bonds,Series due Aug. 15, 2015 and $250 million principal amount of 4.850 percent First Mortgage Bonds, Series due Aug. 15,2040 (Exhibit 4.01 to NSP-Minnesota Form 8-K dated Aug. 4, 2010 (file no. 001-31387)).
4.21* Supplemental Trust Indenture dated as of Aug. 1, 2012 between NSP-Minnesota and The Bank of New York Mellon TrustCompany, NA, as successor Trustee, creating $300 million principal amount of 2.15 percent First Mortgage Bonds, Seriesdue Aug. 15, 2022 and $500 million principal amount of 3.40 percent First Mortgage Bonds, Series due Aug. 15, 2042(Exhibit 4.01 to NSP-Minnesota Form 8-K dated Aug. 13, 2012 (file no. 001-31387)).
4.22* Supplemental Trust Indenture dated as of May 1, 2013 between NSP-Minnesota and The Bank of New York Mellon TrustCompany, N.A., as successor Trustee, creating $400 million principal amount of 2.60 percent First Mortgage Bonds,Series due May 15, 2023 (Exhibit 4.01 to NSP-Minnesota Form 8-K dated May 20, 2013 (file no. 001-31387)).
Schedule Q-3 Page 169 of 182
Sponsor: Robinson Case No. 15-00139-UT

154
4.23* Supplemental Trust Indenture dated as of May 1, 2014 between NSP-Minnesota and The Bank of New York Mellon TrustCompany, N.A., as successor Trustee, creating $300 million principal amount of 4.125 percent First Mortgage Bonds,Series due May 15, 2044. (Exhibit 4.01 to NSP-Minnesota Form 8-K dated May 13, 2014 (file no. 001-31387)).
NSP-Wisconsin4.24* Supplemental and Restated Trust Indenture, dated March 1, 1991, between NSP-Wisconsin and First Wisconsin Trust
company, providing for the issuance of First Mortgage Bonds (Exhibit 4.01 to Registration Statement 33-39831).4.25* Supplemental Trust Indenture, dated April 1, 1991 (Exhibit 4.01 to Form 10-Q (file no. 001-03140) for the quarter ended
March 31, 1991).4.26* Supplemental Trust Indenture, dated Dec. 1, 1996, between NSP-Wisconsin and Firstar Trust Company, as
Trustee (Exhibit 4.01 to Form 8-K (file no. 001-03140) dated Dec. 12, 1996).4.27* Trust Indenture dated Sept. 1, 2000, between NSP-Wisconsin and Firstar Bank, NA as Trustee (Exhibit 4.01 to Form 8-K
(file no. 001-03140) dated Sept. 25, 2000).4.28* Supplemental Trust Indenture dated Sept. 1, 2003 between NSP-Wisconsin and U.S. Bank National Association,
supplementing indentures dated April 1, 1947 and March 1, 1991 (Exhibit 4.05 to Xcel Energy Form 10-Q (fileno. 001-03034) for the quarter ended September 30, 2003).
4.29* Supplemental Trust Indenture dated as of Sept. 1, 2008 between NSP-Wisconsin and U.S. Bank National Association, assuccessor Trustee, creating $200 million principal amount of 6.375 percent First Mortgage Bonds, Series due Sept. 1,2038 (Exhibit 4.01 of Form 8-K of NSP-Wisconsin dated Sept. 3, 2008 (file no. 001-03140)).
4.30* Supplemental Trust Indenture dated as of Oct. 1, 2012 between NSP-Wisconsin and U.S. Bank National Association, assuccessor Trustee, creating $100 million principal amount of 3.700 percent First Mortgage Bonds, Series due Oct. 1, 2042(Exhibit 4.01 of Form 8-K of NSP-Wisconsin dated Oct. 10, 2012 (file no. 001-03140)).
4.31* Supplemental Trust Indenture dated as of June 1, 2014 between NSP-Wisconsin and U.S. Bank National Association, assuccessor Trustee, creating $100 million principal amount of 3.30 percent First Mortgage Bonds, Series due June 15,2024. (Exhibit 4.01 of Form 8-K of NSP-Wisconsin dated June 23, 2014 (file no. 001-03140)).
PSCo4.32* Indenture, dated as of Oct. 1, 1993, between PSCo and Morgan Guaranty Trust Company of New York, as trustee,
providing for the issuance of First Collateral Trust Bonds (Form 10-Q, Sept. 30, 1993 — Exhibit 4(a)).4.33* Indentures supplemental to Indenture dated as of Oct. 1, 1993, between PSCo and Morgan Guaranty Trust Company of
New York, as trustee:
Dated as of Previous Filing: Form; Date or file no.Exhibit
No.
Nov. 1, 1993 S-3, (33-51167) 4(b)(2)Jan. 1, 1994 10-K, 1993 4(b)(3)Sept. 2, 1994 8-K, September 1994 4(b)Nov. 1, 1996 10-K, 1996 (001-03280) 4(b)(3)Feb. 1, 1997 10-Q, March 31, 1997 (001-03280) 4(a)April 1, 1998 10-Q, March 31,1998 (001-03280) 4(b)Aug. 15, 2002 10-Q, Sept. 30, 2002 (001-03280) 4.03Aug. 1, 2005 8-K, Aug. 18, 2005 (001-03280) 4.02
4.34* Indenture dated July 1, 1999, between PSCo and The Bank of New York, providing for the issuance of Senior DebtSecurities and First Supplemental Indenture dated July 15, 1999, between PSCo and The Bank of New York (Exhibits 4.1and 4.2 to Form 8-K (file no. 001-03280) dated July 13, 1999).
4.35* Financing Agreement between Adams County, Colorado and PSCo, dated as of Aug. 1, 2005 relating to $129.5 millionAdams County, Colorado Pollution Control Refunding Revenue Bonds, 2005 Series A (Exhibit 4.01 to PSCo CurrentReport on Form 8-K, dated Aug. 18, 2005, file no. 001-03280).
4.36* Supplemental Indenture, dated Aug. 1, 2007, between PSCo and U.S. Bank Trust National Association, as successorTrustee (Exhibit 4.01 to PSCo Form 8-K (file no. 001-03280) dated Aug. 8, 2007).
4.37* Supplemental Indenture dated as of Aug. 1, 2008, between PSCo and U.S. Bank Trust National Association, as successorTrustee, creating $300 million principal amount of 5.80 percent First Mortgage Bonds, Series No. 18 due 2018 and $300million principal amount of 6.50 percent First Mortgage Bonds, Series No. 19 due 2038 (Exhibit 4.01 of Form 8-K ofPSCo dated Aug. 6, 2008 (file no. 001-03280)).
4.38* Supplemental Indenture dated as of May 1, 2009 between PSCo and U.S. Bank Trust National Association, as successorTrustee, creating $400 million principal amount of 5.125 percent First Mortgage Bonds, Series No. 20 due 2019(Exhibit 4.01 of Form 8-K of PSCo dated May 28, 2009 (file no. 001-03280)).
Schedule Q-3 Page 170 of 182
Sponsor: Robinson Case No. 15-00139-UT

155
4.39* Supplemental Indenture dated as of Nov. 1, 2010 between PSCo and U.S. Bank National Association, as successorTrustee, creating $400 million principal amount of 3.200 percent First Mortgage Bonds, Series No. 21 due 2020(Exhibit 4.01 of Form 8-K of PSCo dated Nov. 8, 2010 (file no. 001-03280)).
4.40* Supplemental Indenture dated as of Aug. 1, 2011 between PSCo and U.S. Bank National Association, as successorTrustee, creating $250 million principal amount of 4.75 percent First Mortgage Bonds, Series No. 22 due 2041 (Exhibit4.01 to Form 8-K of PSCo dated Aug. 9, 2011 (file no. 001-03280)).
4.41* Supplemental Indenture dated as of Sept. 1, 2012 between PSCo and U.S. Bank National Association, as successorTrustee, creating $300 million principal amount of 2.25 percent First Mortgage Bonds, Series No. 23 due 2022 and $500million principal amount of 3.60 percent First Mortgage Bonds, Series No. 24 due 2042 (Exhibit 4.01 to PSCo’s Form 8-Kdated Sept. 11, 2012 (file no. 001-03280)).
4.42* Supplemental Indenture dated as of March 1, 2013 between PSCo and U.S. Bank National Association, as successorTrustee, creating $250 million principal amount of 2.50 percent First Mortgage Bonds, Series No. 25 due 2023 and $250million principal amount of 3.95 percent First Mortgage Bonds, Series No. 26 due 2043 (Exhibit 4.01 to Form 8-K ofPSCo dated March 26, 2013 (file no. 001-03280)).
4.43* Supplemental Indenture dated as of March 1, 2014 between PSCo and U.S. Bank National Association, as successorTrustee, creating $300 million principal amount of 4.30 percent First Mortgage Bonds, Series No. 27 due 2044. (Exhibit4.01 to Form 8-K of PSCo dated March 10, 2014 (file no. 001-03280)).
SPS4.44* Indenture dated Feb. 1, 1999 between SPS and The Chase Manhattan Bank (Exhibit 99.2 to Form 8-K (file
no. 001-03789) dated Feb. 25, 1999).4.45* Third Supplemental Indenture dated Oct. 1, 2003 to the indenture dated Feb. 1, 1999 between SPS and JPMorgan Chase
Bank, as successor Trustee, creating $100 million principal amount of Series C and Series D Notes, 6 percent due 2033(Exhibit 4.04 to Xcel Energy Form 10-Q (file no. 001-03034) for the quarter ended September 30, 2003).
4.46* Fourth Supplemental Indenture dated Oct. 1, 2006 between SPS and The Bank of New York, as successor Trustee(Exhibit 4.01 to Form 8-K (file no. 001-03789) dated Oct. 3, 2006).
4.47* Red River Authority for Texas Indenture of Trust dated July 1, 1991 (Form 10-K, Aug. 31, 1991 — Exhibit 4(b)).4.48* Fifth Supplemental Indenture dated as of Nov. 1, 2008 between SPS and The Bank of New York Mellon Trust Company,
NA, as successor Trustee, creating $250 million principal amount of Series G Senior Notes, 8.75 percent due 2018(Exhibit 4.01 of Form 8-K of SPS, dated Nov. 14, 2008 (file no. 001- 03789))
4.49* Indenture dated as of Aug. 1, 2011 between SPS and U.S. Bank National Association, as Trustee (Exhibit 4.01 to Form 8-K dated Aug. 10, 2011 (file no. 001-03789)).
4.50* Supplemental Indenture dated as of Aug. 3, 2011 between SPS and U.S. Bank National Association, as Trustee, creating$200 million principal amount of 4.50 percent First Mortgage Bonds, Series No. 1 due 2041 (Exhibit 4.02 to Form 8-Kdated Aug. 10, 2011 (file no. 001-03789)).
4.51* Sixth Supplemental Indenture dated as of June 1, 2014 between SPS and The Bank of New York Mellon Trust Company,N.A., as successor Trustee. (Exhibit 4.03 to SPS’ Form 8-K dated June 2, 2014 (file no. 001-03789)).
4.52* Supplemental Indenture No. 2 dated as of June 1, 2014 between SPS and U.S. Bank National Association, as Trustee.(Exhibit 4.06 to SPS’ Form 8-K dated June 2, 2014 (file no. 001-03789)).
4.53* Supplemental Indenture No. 3 dated as of June 1, 2014 between SPS and U.S. Bank National Association, as Trustee,creating $150 million principal amount of 3.30 percent First Mortgage Bonds, Series No. 3 due 2024. (Exhibit 4.02 toSPS’ Form 8-K dated June 9, 2014 (file no. 001-03789)).
Xcel Energy Inc.10.01*+ Xcel Energy Inc. Nonqualified Pension Plan (2009 Restatement) (Exhibit 10.02 to Form 10-K of Xcel Energy (file
no. 001-03034) for the year ended Dec. 31, 2008).10.02*+ Xcel Energy Senior Executive Severance and Chang-in-Control Policy (2009 Amendment and Restatement)
(Exhibit 10.05 to Form 10-K of Xcel Energy (file no. 001-03034) for the year ended Dec. 31, 2008).10.03*+ Xcel Energy Inc. Non-Employee Directors Deferred Compensation Plan as amended and restated Jan. 1, 2009
(Exhibit 10.08 to Form 10-K of Xcel Energy (file no. 001-03034) for the year ended Dec. 31, 2008).10.04* Form of Services Agreement between Xcel Energy Services Inc. and utility companies (Exhibit H-1 to Form U5B (file
no. 001-03034) dated Nov. 16, 2000).10.05*+ Xcel Energy Inc. Supplemental Executive Retirement Plan as amended and restated Jan. 1, 2009 (Exhibit 10.17 to
Form 10-K of Xcel Energy (file no. 001-03034) for the year ended Dec. 31, 2008).10.06*+ Amendment dated Aug. 26, 2009 to the Xcel Energy Senior Executive Severance and Change-in-Control Policy
(Exhibit 10.06 to Form 10-Q of Xcel Energy (file no. 001-03034) for the quarter ended Sept. 30, 2009).10.07*+ Xcel Energy Inc. Executive Annual Incentive Award Plan Form of Restricted Stock Agreement (Exhibit 10.08 to Form 10-
Q of Xcel Energy (file no. 001-03034) for the quarter ended Sept. 30, 2009).10.08*+ Xcel Energy Inc. Executive Annual Incentive Award Plan (as amended and restated effective Feb. 17, 2010) (incorporated
by reference to Appendix A to Schedule 14A, Definitive Proxy Statement to Xcel Energy Inc. (file no. 001-03034) datedApril 6, 2010).
Schedule Q-3 Page 171 of 182
Sponsor: Robinson Case No. 15-00139-UT
156
10.09*+ Xcel Energy Inc. 2010 Executive Annual Discretionary Award Plan (Exhibit 10.24 to Form 10-K of Xcel Energy (file no.001-03034) for the year ended Dec. 31, 2009).
10.10*+ Xcel Energy Inc. 2005 Long-Term Incentive Plan (as amended and restated effective Feb. 17, 2010) (incorporated byreference to Appendix B to Schedule 14A, Definitive Proxy Statement to Xcel Energy Inc. (file no. 001-03034) datedApril 6, 2010).
10.11*+ Xcel Energy Inc. 2010 Executive Annual Discretionary Award Plan (as amended and restated effective Dec. 15, 2010)(Exhibit 10.23 to Form 10-K of Xcel Energy (file no. 001-03034) for the year ended Dec. 31, 2010).
10.12*+ Xcel Energy Inc. 2005 Long-Term Incentive Plan Form of Bonus Stock Agreement (Exhibit 10.24 to Form 10-K of XcelEnergy (file no. 001-03034) for the year ended Dec. 31, 2010).
10.13*+ Xcel Energy Inc. 2005 Long-Term Incentive Plan Form of Performance Share Agreement (Exhibit 10.25 to Form 10-K ofXcel Energy (file no. 001-03034) for the year ended Dec. 31, 2010).
10.14a*+ Xcel Energy Inc. 2005 Long-Term Incentive Plan Form of Restricted Stock Unit Agreement (Exhibit 10.26 to Form 10-Kof Xcel Energy (file no. 001-03034) for the year ended Dec. 31, 2010).
10.14b*+ Xcel Energy Inc. 2005 Long-Term Incentive Plan Form of Time-Based Restricted Stock Unit Agreement (Exhibit 10.14bto Form 10-K of Xcel Energy (file no. 001-03034) for the year ended Dec. 31, 2012).
10.15*+ Stock Equivalent Plan for Non-Employee Directors of Xcel Energy Inc. as amended and restated effective Feb. 23, 2011(Appendix A to the Xcel Energy Definitive Proxy Statement (file no. 001-03034) filed April 5, 2011).
10.16*+ Xcel Energy Inc. Nonqualified Deferred Compensation Plan (2009 Restatement) (Exhibit 10.07 to Form 10-K of XcelEnergy (file no. 001-03034) for the year ended Dec. 31, 2008).
10.17*+ First Amendment effective Nov. 29, 2011 to the Xcel Energy Inc. Nonqualified Deferred Compensation Plan (2009Restatement) (Exhibit 10.17 to Form 10-K of Xcel Energy (file no. 001-03034) for the year ended Dec. 31, 2011).
10.18*+ Second Amendment dated Oct. 26, 2011 to the Xcel Energy Senior Executive Severance and Change-in-Control Policy(Exhibit 10.18 to Form 10-K of Xcel Energy (file no. 001-03034) for the year ended Dec. 31, 2011).
10.19*+ First Amendment dated Feb. 20, 2013 to the Xcel Energy Inc. Executive Annual Incentive Award Plan (as amended andrestated effective Feb. 17, 2010) (Exhibit 10.01 to Form 10-Q of Xcel Energy (file no. 001-03034) for the quarter endedMarch 31, 2013).
10.20*+ Fourth Amendment dated Feb. 20, 2013 to the Xcel Energy Senior Executive Severance and Change-in-Control Policy(Exhibit 10.02 to Form 10-Q of Xcel Energy (file no. 001-03034) for the quarter ended March 31, 2013).
10.21*+ First Amendment dated May 21, 2013 to the Xcel Energy Inc. 2005 Long-Term Incentive Plan (as amended and restatedeffective Feb. 17, 2010) (Exhibit 10.21 to Form 10-K of Xcel Energy (file no. 001-03034) for the year ended Dec. 31,2013).
10.22*+ Second Amendment dated May 21, 2013 to the Xcel Energy Inc. Nonqualified Deferred Compensation Plan (2009Restatement) (Exhibit 10.22 to Form 10-K of Xcel Energy (file no. 001-03034) for the year ended Dec. 31, 2013).
10.23*+ Xcel Energy Inc. 2005 Long-Term Incentive Plan Form of Long-Term Incentive Award Agreement (Exhibit 10.23 to Form 10-K of Xcel Energy (file no. 001-03034) for the year ended Dec. 31, 2013).
10.24*+ Amended and Restated Credit Agreement, dated as of Oct. 14, 2014 among Xcel Energy Inc., as Borrower, the severallenders from time to time parties thereto, JPMorgan Chase Bank, N.A., as Administrative Agent, Bank of America, N.A.,and Barclays Bank Plc, as Syndication Agents, and Wells Fargo Bank, National Association, as Documentation Agent(Exhibit 99.01 to Form 8-K of Xcel Energy, dated Oct. 14, 2014 (file no. 001-03034)).
NSP-Minnesota10.25*
Ownership and Operating Agreement, dated March 11, 1982, between NSP-Minnesota, Southern Minnesota MunicipalPower Agency and United Minnesota Municipal Power Agency concerning Sherburne County Generating Unit No. 3(Exhibit 10.01 to Form 10-Q for the quarter ended Sept. 30, 1994 (file no. 001-03034)).
10.26* Restated Interchange Agreement dated Jan. 16, 2001 between NSP-Wisconsin and NSP-Minnesota (Exhibit 10.01 to NSP-Wisconsin Form S-4 (file no. 333-112033) dated Jan. 21, 2004).
10.27* Amended and Restated Credit Agreement, dated as of Oct. 14, 2014 among NSP-Minnesota, as Borrower, the severallenders from time to time parties thereto, JPMorgan Chase Bank, N.A., as Administrative Agent, Bank of America, N.A.,and Barclays Bank Plc, as Syndication Agents, and Wells Fargo Bank, National Association, as Documentation Agent(Exhibit 99.02 to Form 8-K of Xcel Energy, dated Oct. 14, 2014 (file no. 001-03034)).
NSP-Wisconsin10.28* Restated Interchange Agreement dated Jan. 16, 2001 between NSP-Wisconsin and NSP-Minnesota (Exhibit 10.01 to
Form S-4 (file no. 333-112033) dated Jan. 21, 2004).10.29* Amended and Restated Credit Agreement, dated as of Oct. 14, 2014 among NSP-Wisconsin, as Borrower, the several
lenders from time to time parties thereto, JPMorgan Chase Bank, N.A., as Administrative Agent, Bank of America, N.A.,and Barclays Bank Plc, as Syndication Agents, and Wells Fargo Bank, National Association, as Documentation Agent(Exhibit 99.05 to Form 8-K of Xcel Energy, dated Oct. 14, 2014 (file no. 001-03034)).
Schedule Q-3 Page 172 of 182
Sponsor: Robinson Case No. 15-00139-UT

157
PSCo10.30* Amended and Restated Coal Supply Agreement entered into Oct. 1, 1984 but made effective as of Jan. 1, 1976 between
PSCo and Amax Inc. on behalf of its division, Amax Coal Co. (Form 10-K (file no. 001-03280) Dec. 31, 1984 —Exhibit 10(c)(1)).
10.31* First Amendment to Amended and Restated Coal Supply Agreement entered into May 27, 1988 but made effective Jan. 1,1988 between PSCo and Amax Coal Co. (Form 10-K (file no. 001-03280) Dec. 31, 1988 — Exhibit 10(c)(2)).
10.32* Proposed Settlement Agreement excerpts, as filed with the CPUC (Exhibit 99.02 to Form 8-K of Xcel Energy (fileno. 001-03034) dated Dec. 3, 2004).
10.33* Settlement Agreement among PSCo and Concerned Environmental and Community Parties, dated Dec. 3, 2004(Exhibit 99.03 to Form 8-K of Xcel Energy (file no. 001-03034) dated Dec. 3, 2004).
10.34* Amended and Restated Credit Agreement, dated as of Oct. 14, 2014 among PSCo, as Borrower, the several lenders fromtime to time parties thereto, JPMorgan Chase Bank, N.A., as Administrative Agent, Bank of America, N.A., and BarclaysBank Plc, as Syndication Agents, and Wells Fargo Bank, National Association, as Documentation Agent (Exhibit 99.03 toForm 8-K of Xcel Energy, dated Oct. 14, 2014 (file no. 001-03034)).
SPS10.35* Coal Supply Agreement (Harrington Station) between SPS and TUCO, dated May 1, 1979 (Form 8-K (file
no. 001-03789), May 14, 1979 — Exhibit 3).10.36* Master Coal Service Agreement between Swindell-Dressler Energy Supply Co. and TUCO, dated July 1, 1978 (Form 8-K
(file no. 001-03789), May 14, 1979 — Exhibit 5(A)).10.37* Guaranty of Master Coal Service Agreement between Swindell-Dressler Energy Supply Co. and TUCO (Form 8-K (file
no. 001-03789) May 14, 1979 — Exhibit 5(B)).10.38* Coal Supply Agreement (Tolk Station) between SPS and TUCO dated April 30, 1979, as amended Nov. 1, 1979 and
Dec. 30, 1981 (Form 10-Q for the quarter ended Feb. 28, 1982 (file no. 001-03789) — Exhibit 10(b)).10.39* Master Coal Service Agreement between Wheelabrator Coal Services Co. and TUCO dated Dec. 30, 1981, as amended
Nov. 1, 1979 and Dec. 30, 1981 (Form 10-Q for the quarter ended Feb. 28, 1982 (file no. 001-03789) — Exhibit 10(c)).10.40* Power Purchase Agreement dated May 23, 1997 between Borger Energy Associates, L.P, and SPS.
10.41* Amended and Restated Credit Agreement, dated as of Oct. 14, 2014 among SPS, as Borrower, the several lenders fromtime to time parties thereto, JPMorgan Chase Bank, N.A., as Administrative Agent, Bank of America, N.A., and BarclaysBank Plc, as Syndication Agents, and Wells Fargo Bank, National Association, as Documentation Agent (Exhibit 99.04 toForm 8-K of Xcel Energy, dated Oct. 14, 2014 (file no. 001-03034)).
Xcel Energy Inc.Statement of Computation of Ratio of Earnings to Fixed Charges.Subsidiaries of Xcel Energy Inc.Consent of Independent Registered Public Accounting Firm.Powers of Attorney.Principal Executive Officer’s certification pursuant to 18 U.S. C. Section 1350, as adopted pursuant to Section 302 of theSarbanes-Oxley Act of 2002.Principal Financial Officer’s certification pursuant to 18 U.S. C. Section 1350, as adopted pursuant to Section 302 of theSarbanes-Oxley Act of 2002.Certification pursuant to 18 U.S.C. Section 1350, as adopted pursuant to Section 906 of the Sarbanes-Oxley Act of 2002.Statement pursuant to Private Securities Litigation Reform Act of 1995.
101 The following materials from Xcel Energy Inc.’s Annual Report on Form 10-K for the year ended Dec. 31, 2014 areformatted in XBRL (eXtensible Business Reporting Language): (i) the Consolidated Statements of Income, (ii) theConsolidated Statements of Comprehensive Income, (iii) the Consolidated Statements of Cash Flows, (iv) theConsolidated Balance Sheets, (v) the Consolidated Statements of Common Stockholders’ Equity, (vi) ConsolidatedStatements of Capitalization, (vii) Notes to Consolidated Financial Statements, (viii) document and entity information,(ix) Schedule I, and (x) Schedule II.
12.0121.0123.0124.0131.01
31.02
32.0199.01
Schedule Q-3 Page 173 of 182
Sponsor: Robinson Case No. 15-00139-UT

158
SCHEDULE I
XCEL ENERGY INC.CONDENSED STATEMENTS OF INCOME AND COMPREHENSIVE INCOME
(amounts in thousands, except per share data)
Year Ended Dec. 312014 2013 2012
IncomeEquity earnings of subsidiaries. . . . . . . . . . . . . . . . . . . . . . . . . . . . . . . . . . . . . . . . . . . . . . $ 1,077,714 $ 1,018,783 $ 976,395
Total income. . . . . . . . . . . . . . . . . . . . . . . . . . . . . . . . . . . . . . . . . . . . . . . . . . . . . . . . . . 1,077,714 1,018,783 976,395Expenses and other deductions
Operating expenses. . . . . . . . . . . . . . . . . . . . . . . . . . . . . . . . . . . . . . . . . . . . . . . . . . . . . . . 19,756 18,513 15,948Other income . . . . . . . . . . . . . . . . . . . . . . . . . . . . . . . . . . . . . . . . . . . . . . . . . . . . . . . . . . . (537) (206) (652)Interest charges and financing costs . . . . . . . . . . . . . . . . . . . . . . . . . . . . . . . . . . . . . . . . . . 84,830 102,914 116,731
Total expenses and other deductions . . . . . . . . . . . . . . . . . . . . . . . . . . . . . . . . . . . . . . . 104,049 121,221 132,027Income before income taxes . . . . . . . . . . . . . . . . . . . . . . . . . . . . . . . . . . . . . . . . . . . . . . . . . 973,665 897,562 844,368Income tax benefit. . . . . . . . . . . . . . . . . . . . . . . . . . . . . . . . . . . . . . . . . . . . . . . . . . . . . . . . . (47,641) (50,672) (60,861)Net income . . . . . . . . . . . . . . . . . . . . . . . . . . . . . . . . . . . . . . . . . . . . . . . . . . . . . . . . . . . . . . $ 1,021,306 $ 948,234 $ 905,229
Other Comprehensive IncomePension and retiree medical benefits, net of tax of $(2,528), $5,897 and $(2,331),
respectively . . . . . . . . . . . . . . . . . . . . . . . . . . . . . . . . . . . . . . . . . . . . . . . . . . . . . . . . . . . . $ (4,022) $ 4,714 $ (3,311)Derivative instruments, net of tax of $1,390, $2,558 and $(9,906), respectively . . . . . . . . . 2,125 1,488 (15,503)Other, net of tax of $21, $117 and $135, respectively . . . . . . . . . . . . . . . . . . . . . . . . . . . . . 33 176 196Other comprehensive (loss) income . . . . . . . . . . . . . . . . . . . . . . . . . . . . . . . . . . . . . . . . . . . (1,864) 6,378 (18,618)Comprehensive income . . . . . . . . . . . . . . . . . . . . . . . . . . . . . . . . . . . . . . . . . . . . . . . . . . . . $ 1,019,442 $ 954,612 $ 886,611
Weighted average common shares outstanding:Basic . . . . . . . . . . . . . . . . . . . . . . . . . . . . . . . . . . . . . . . . . . . . . . . . . . . . . . . . . . . . . . . . . . 503,847 496,073 487,899Diluted . . . . . . . . . . . . . . . . . . . . . . . . . . . . . . . . . . . . . . . . . . . . . . . . . . . . . . . . . . . . . . . . 504,117 496,532 488,434
Earnings per average common share:Basic . . . . . . . . . . . . . . . . . . . . . . . . . . . . . . . . . . . . . . . . . . . . . . . . . . . . . . . . . . . . . . . . . . $ 2.03 $ 1.91 $ 1.86Diluted . . . . . . . . . . . . . . . . . . . . . . . . . . . . . . . . . . . . . . . . . . . . . . . . . . . . . . . . . . . . . . . . 2.03 1.91 1.85
Cash dividends declared per common share . . . . . . . . . . . . . . . . . . . . . . . . . . . . . . . . . . 1.20 1.11 1.07
See Notes to Condensed Financial Statements
Schedule Q-3 Page 174 of 182
Sponsor: Robinson Case No. 15-00139-UT

159
XCEL ENERGY INC.CONDENSED STATEMENTS OF CASH FLOWS
(amounts in thousands)
Year Ended Dec. 312014 2013 2012
Operating activitiesNet cash provided by operating activities . . . . . . . . . . . . . . . . . . . . . . . . . . . . . . . . . . . $ 842,832 $ 545,177 $ 815,209
Investing activitiesCapital contributions to subsidiaries. . . . . . . . . . . . . . . . . . . . . . . . . . . . . . . . . . . . . . . . . . (422,459) (535,653) (366,783)Investments in the utility money pool . . . . . . . . . . . . . . . . . . . . . . . . . . . . . . . . . . . . . . . . (1,148,000) (1,778,000) (640,000)Return of investments in the utility money pool . . . . . . . . . . . . . . . . . . . . . . . . . . . . . . . . 1,204,000 1,706,000 658,000
Net cash used in investing activities . . . . . . . . . . . . . . . . . . . . . . . . . . . . . . . . . . . . . . . (366,459) (607,653) (348,783)Financing activities
(Repayment of) proceeds from short-term borrowings, net . . . . . . . . . . . . . . . . . . . . . . . . (95,500) 297,000 52,000Proceeds from issuance of long-term debt . . . . . . . . . . . . . . . . . . . . . . . . . . . . . . . . . . . . . — 447,595 —Repayment of long-term debt . . . . . . . . . . . . . . . . . . . . . . . . . . . . . . . . . . . . . . . . . . . . . . . — (400,000) —Proceeds from issuance of common stock . . . . . . . . . . . . . . . . . . . . . . . . . . . . . . . . . . . . . 180,798 231,767 8,050Repurchase of common stock. . . . . . . . . . . . . . . . . . . . . . . . . . . . . . . . . . . . . . . . . . . . . . . — — (18,529)Purchase of common stock for settlement of equity awards . . . . . . . . . . . . . . . . . . . . . . . — — (23,307)Dividends paid . . . . . . . . . . . . . . . . . . . . . . . . . . . . . . . . . . . . . . . . . . . . . . . . . . . . . . . . . . (561,411) (514,042) (486,757)
Net cash (used in) provided by financing activities. . . . . . . . . . . . . . . . . . . . . . . . . . . . (476,113) 62,320 (468,543)Net change in cash and cash equivalents . . . . . . . . . . . . . . . . . . . . . . . . . . . . . . . . . . . . . . . 260 (156) (2,117)Cash and cash equivalents at beginning of period . . . . . . . . . . . . . . . . . . . . . . . . . . . . . . . . 446 602 2,719Cash and cash equivalents at end of period . . . . . . . . . . . . . . . . . . . . . . . . . . . . . . . . . . . . . $ 706 $ 446 $ 602
See Notes to Condensed Financial Statements
Schedule Q-3 Page 175 of 182
Sponsor: Robinson Case No. 15-00139-UT

160
XCEL ENERGY INC.CONDENSED BALANCE SHEETS
(amounts in thousands)
Dec. 312014 2013
AssetsCash and cash equivalents . . . . . . . . . . . . . . . . . . . . . . . . . . . . . . . . . . . . . . . . . . . . . . . . . . . . . . . . . $ 706 $ 446Accounts receivable from subsidiaries . . . . . . . . . . . . . . . . . . . . . . . . . . . . . . . . . . . . . . . . . . . . . . . 270,921 240,450Other current assets . . . . . . . . . . . . . . . . . . . . . . . . . . . . . . . . . . . . . . . . . . . . . . . . . . . . . . . . . . . . . . 47,424 51,086
Total current assets . . . . . . . . . . . . . . . . . . . . . . . . . . . . . . . . . . . . . . . . . . . . . . . . . . . . . . . . . . . . . 319,051 291,982Investment in subsidiaries . . . . . . . . . . . . . . . . . . . . . . . . . . . . . . . . . . . . . . . . . . . . . . . . . . . . . . . . . 12,206,575 11,613,032Other assets . . . . . . . . . . . . . . . . . . . . . . . . . . . . . . . . . . . . . . . . . . . . . . . . . . . . . . . . . . . . . . . . . . . . 114,518 105,073
Total other assets . . . . . . . . . . . . . . . . . . . . . . . . . . . . . . . . . . . . . . . . . . . . . . . . . . . . . . . . . . . . . . . 12,321,093 11,718,105Total assets . . . . . . . . . . . . . . . . . . . . . . . . . . . . . . . . . . . . . . . . . . . . . . . . . . . . . . . . . . . . . . . . . $ 12,640,144 $ 12,010,087
Liabilities and EquityDividends payable . . . . . . . . . . . . . . . . . . . . . . . . . . . . . . . . . . . . . . . . . . . . . . . . . . . . . . . . . . . . . . . $ 151,720 $ 139,432Short-term debt . . . . . . . . . . . . . . . . . . . . . . . . . . . . . . . . . . . . . . . . . . . . . . . . . . . . . . . . . . . . . . . . . 380,500 476,000Other current liabilities . . . . . . . . . . . . . . . . . . . . . . . . . . . . . . . . . . . . . . . . . . . . . . . . . . . . . . . . . . . 65,314 6,954
Total current liabilities. . . . . . . . . . . . . . . . . . . . . . . . . . . . . . . . . . . . . . . . . . . . . . . . . . . . . . . . . . . 597,534 622,386Other liabilities. . . . . . . . . . . . . . . . . . . . . . . . . . . . . . . . . . . . . . . . . . . . . . . . . . . . . . . . . . . . . . . . . . 30,227 25,475
Total other liabilities . . . . . . . . . . . . . . . . . . . . . . . . . . . . . . . . . . . . . . . . . . . . . . . . . . . . . . . . . . . . 30,227 25,475Commitments and contingenciesCapitalizationLong-term debt. . . . . . . . . . . . . . . . . . . . . . . . . . . . . . . . . . . . . . . . . . . . . . . . . . . . . . . . . . . . . . . . . . 1,797,901 1,796,276Common stockholders’ equity . . . . . . . . . . . . . . . . . . . . . . . . . . . . . . . . . . . . . . . . . . . . . . . . . . . . . . 10,214,482 9,565,950
Total capitalization . . . . . . . . . . . . . . . . . . . . . . . . . . . . . . . . . . . . . . . . . . . . . . . . . . . . . . . . . . . . . 12,012,383 11,362,226Total liabilities and equity . . . . . . . . . . . . . . . . . . . . . . . . . . . . . . . . . . . . . . . . . . . . . . . . . . . . . $ 12,640,144 $ 12,010,087
See Notes to Condensed Financial Statements
Schedule Q-3 Page 176 of 182
Sponsor: Robinson Case No. 15-00139-UT

161
NOTES TO CONDENSED FINANCIAL STATEMENTS
Incorporated by reference are Xcel Energy’s consolidated statements of common stockholders’ equity and OCI in Part II, Item 8.
Basis of Presentation — The condensed financial information of Xcel Energy Inc. is presented to comply with Rule 12-04 of Regulation S-X. Xcel Energy Inc.’s investments in subsidiaries are presented under the equity method of accounting. Under this method, the assets and liabilities of subsidiaries are not consolidated. The investments in net assets of the subsidiaries are recorded in the balance sheets. The income from operations of the subsidiaries is reported on a net basis as equity in income of subsidiaries.
As a holding company with no business operations, Xcel Energy Inc.’s assets consist primarily of investments in its utility subsidiaries. Xcel Energy Inc.’s material cash inflows are only from dividends and other payments received from its utility subsidiaries and the proceeds raised from the sale of debt and equity securities. The ability of its utility subsidiaries to make dividend and other payments is subject to the availability of funds after taking into account their respective funding requirements, the terms of their respective indebtedness, the regulations of the FERC under the Federal Power Act, and applicable state laws. Management does not expect maintaining these requirements to have an impact on Xcel Energy Inc.’s ability to pay dividends at the current level in the foreseeable future. Each of its utility subsidiaries, however, is legally distinct and has no obligation, contingent or otherwise, to make funds available to Xcel Energy Inc.
Related Party Transactions — Xcel Energy Inc. presents its related party receivables net of payables. Accounts receivable and payable with affiliates at Dec. 31 were:
2014 2013
(Thousands of Dollars)Accounts
ReceivableAccountsPayable
AccountsReceivable
AccountsPayable
NSP-Minnesota . . . . . . . . . . . . . . . . . . . . . . . . . . . . . . . . . . . . . . . . . . . . . . $ 79,390 $ — $ 57,596 $ —NSP-Wisconsin . . . . . . . . . . . . . . . . . . . . . . . . . . . . . . . . . . . . . . . . . . . . . . 20,117 — 6,933 —PSCo . . . . . . . . . . . . . . . . . . . . . . . . . . . . . . . . . . . . . . . . . . . . . . . . . . . . . . 38,646 — 74,739 —SPS . . . . . . . . . . . . . . . . . . . . . . . . . . . . . . . . . . . . . . . . . . . . . . . . . . . . . . . 28,062 — 5,705 —Xcel Energy Services Inc. . . . . . . . . . . . . . . . . . . . . . . . . . . . . . . . . . . . . . . 75,954 — 60,138 —Xcel Energy Ventures Inc.. . . . . . . . . . . . . . . . . . . . . . . . . . . . . . . . . . . . . . 20,082 — 20,194 —Other subsidiaries of Xcel Energy Inc. . . . . . . . . . . . . . . . . . . . . . . . . . . . . 8,670 — 15,145 —
$ 270,921 $ — $ 240,450 $ —
Dividends — Cash dividends paid to Xcel Energy Inc. by its subsidiaries were $857 million, $606 million and $757 million for the years ended Dec. 31, 2014, 2013 and 2012, respectively. These cash receipts are included in operating cash flows of the condensed statements of cash flows.
Money Pool — Xcel Energy received FERC approval to establish a utility money pool arrangement with the utility subsidiaries, subject to receipt of required state regulatory approvals. The utility money pool allows for short-term investments in and borrowings between the utility subsidiaries. Xcel Energy Inc. may make investments in the utility subsidiaries at market-based interest rates; however, the money pool arrangement does not allow the utility subsidiaries to make investments in Xcel Energy Inc. The following tables present money pool lending for Xcel Energy Inc.:
(Amounts in Millions, Except Interest Rates)Three Months Ended
Dec. 31, 2014
Lending limit . . . . . . . . . . . . . . . . . . . . . . . . . . . . . . . . . . . . . . . . . . . . . . . . . . . . . . . . . . . . . . . . . . . . . . . . . . . . . . . $ 250Loan outstanding at period end . . . . . . . . . . . . . . . . . . . . . . . . . . . . . . . . . . . . . . . . . . . . . . . . . . . . . . . . . . . . . . . . . 16Average loan outstanding. . . . . . . . . . . . . . . . . . . . . . . . . . . . . . . . . . . . . . . . . . . . . . . . . . . . . . . . . . . . . . . . . . . . . . 2Maximum loan outstanding . . . . . . . . . . . . . . . . . . . . . . . . . . . . . . . . . . . . . . . . . . . . . . . . . . . . . . . . . . . . . . . . . . . . 21Weighted average interest rate, computed on a daily basis . . . . . . . . . . . . . . . . . . . . . . . . . . . . . . . . . . . . . . . . . . . . 0.30%Weighted average interest rate at end of period. . . . . . . . . . . . . . . . . . . . . . . . . . . . . . . . . . . . . . . . . . . . . . . . . . . . . 0.45Money pool interest income. . . . . . . . . . . . . . . . . . . . . . . . . . . . . . . . . . . . . . . . . . . . . . . . . . . . . . . . . . . . . . . . . . . . $ —
Schedule Q-3 Page 177 of 182
Sponsor: Robinson Case No. 15-00139-UT

162
(Amounts in Millions, Except Interest Rates)Year Ended
Dec. 31, 2014Year Ended
Dec. 31, 2013Year Ended
Dec. 31, 2012
Lending limit . . . . . . . . . . . . . . . . . . . . . . . . . . . . . . . . . . . . . . . . . . . . . $ 250 $ 250 $ 250Loan outstanding at period end. . . . . . . . . . . . . . . . . . . . . . . . . . . . . . . . 16 72 —Average loan outstanding . . . . . . . . . . . . . . . . . . . . . . . . . . . . . . . . . . . . 25.0 88.2 26.1Maximum loan outstanding . . . . . . . . . . . . . . . . . . . . . . . . . . . . . . . . . . 250 243 226Weighted average interest rate, computed on a daily basis . . . . . . . . . . 0.22% 0.30% 0.33%Weighted average interest rate at end of period . . . . . . . . . . . . . . . . . . . 0.45 0.25 N/AMoney pool interest income . . . . . . . . . . . . . . . . . . . . . . . . . . . . . . . . . . $ 0.1 $ 0.3 $ 0.1
See Xcel Energy’s notes to the consolidated financial statements in Part II, Item 8 for other disclosures.
Schedule Q-3 Page 178 of 182
Sponsor: Robinson Case No. 15-00139-UT

163
SCHEDULE II
XCEL ENERGY INC. AND SUBSIDIARIESVALUATION AND QUALIFYING ACCOUNTSYEARS ENDED DEC. 31, 2014, 2013 AND 2012
(amounts in thousands)
Additions
Balance atJan. 1
Charged toCosts andExpenses
Charged toOther
Accounts(a)
Deductions from
Reserves(b)(c) Balance atDec. 31
Allowance for bad debts:2014. . . . . . . . . . . . . . . . . . . . . . . . . . . . . . . . . . . . . . . . $ 53,107 $ 42,765 $ 14,067 $ 52,220 $ 57,7192013. . . . . . . . . . . . . . . . . . . . . . . . . . . . . . . . . . . . . . . . 51,394 37,627 14,469 50,383 53,1072012. . . . . . . . . . . . . . . . . . . . . . . . . . . . . . . . . . . . . . . . 58,565 33,808 16,033 57,012 51,394NOL and tax credit valuation allowances:2014. . . . . . . . . . . . . . . . . . . . . . . . . . . . . . . . . . . . . . . . $ 3,263 $ 139 $ — $ — $ 3,4022013. . . . . . . . . . . . . . . . . . . . . . . . . . . . . . . . . . . . . . . . 3,314 — — 51 3,2632012. . . . . . . . . . . . . . . . . . . . . . . . . . . . . . . . . . . . . . . . 5,683 32 — 2,401 3,314
(a) Recovery of amounts previously written off as related to allowance for bad debts.(b) Principally bad debts written off as related to allowance for bad debts.(c) Reductions to valuation allowances for NOL and tax credit carryforwards primarily due to changes in tax laws, expirations of certain carryforwards and
identification of various tax planning strategies.
Schedule Q-3 Page 179 of 182
Sponsor: Robinson Case No. 15-00139-UT

164
SIGNATURES
Pursuant to the requirements of Section 13 or 15(d) of the Securities Exchange Act of 1934, the registrant has duly caused this annual report to be signed on its behalf by the undersigned thereunto duly authorized.
XCEL ENERGY INC.
Feb. 20, 2015 By: /s/ TERESA S. MADDENTeresa S. MaddenExecutive Vice President, Chief Financial Officer(Principal Financial Officer)
Pursuant to the requirements of the Securities Exchange Act of 1934, this report has been signed below by the following persons on behalf of the registrant and in the capacities on the date indicated above.
/s/ BEN FOWKE Chairman, President, Chief Executive Officer and DirectorBen Fowke (Principal Executive Officer)
/s/ TERESA S. MADDEN Executive Vice President, Chief Financial OfficerTeresa S. Madden (Principal Financial Officer)
/s/ JEFFREY S. SAVAGE Senior Vice President, ControllerJeffrey S. Savage (Principal Accounting Officer)
* DirectorGail Koziara Boudreaux
* DirectorRichard K. Davis
* DirectorAlbert F. Moreno
* DirectorRichard T. O’Brien
* DirectorChristopher J. Policinski
* DirectorA. Patricia Sampson
* DirectorJames J. Sheppard
* DirectorDavid A. Westerlund
* DirectorKim Williams
* DirectorTimothy V. Wolf
*By: /s/ TERESA S. MADDEN Attorney-in-FactTeresa S. Madden
Schedule Q-3 Page 180 of 182
Sponsor: Robinson Case No. 15-00139-UT

Shareholder InformationHEADQUARTERS414 Nicollet Mall, Minneapolis, Minn. 55401
INTERNET ADDRESSxcelenergy.com
STOCK TRANSFER AGENTWells Fargo Shareowner Services 1110 Centre Pointe Curve, Suite 101 Mendota Heights, Minn. 55120 Telephone: 1-877-778-6786, toll free
REPORTS AVAILABLE ONLINEFinancial reports, including filings with the Securities and Exchange Commission and Xcel Energy’s Report to Shareholders, are available online at xcelenergy.com; click on Investor Relations. Other information about Xcel Energy, including our Code of Conduct, Guidelines on Corporate Governance, Corporate Responsibility Report and Committee Charters, also are available at xcelenergy.com.
STOCK EXCHANGE LISTINGS AND TICKER SYMBOLCommon stock is listed on the New York Stock Exchange (NYSE) under the ticker symbol XEL. In newspaper listings, it appears as XcelEngy.
INVESTOR RELATIONSInternet address: xcelenergy.com or contact Paul Johnson, Vice President, Investor Relations, at 612-215-4535.
SHAREHOLDER SERVICESInternet address: xcelenergy.com or contact Tara Heine, Assistant Corporate Secretary, at 612-215-5391, or email [email protected].
CORPORATE GOVERNANCEXcel Energy has filed with the Securities and Exchange Commission certifications of its Chief Executive Officer and Chief Financial Officer pursuant to section 302 of the Sarbanes-Oxley Act of 2002 as exhibits to its Annual Report on Form 10-K for 2014. It has also filed with the New York Stock Exchange the CEO certification for 2014 required by section 303A.12(a) of the New York Stock Exchange’s rules relating to compliance with the New York Stock Exchange’s corporate governance listing standards.
To contact the Board of Directors, send an email to [email protected].
You also may direct questions to the Corporate Secretary’s Department at [email protected].
Fiscal agentsXCEL ENERGY INC.Transfer Agent, Registrar, Dividend Distribution, Common Stock Wells Fargo Shareowner Services, 1110 Centre Pointe Curve, Suite 101, Mendota Heights, Minn. 55120
Trustee - Bonds Wells Fargo Bank Minnesota, N.A., Corporate Trust Services, 150 East 42nd Street, 40th floor, New York, N.Y. 10017
Xcel Energy DirectorsGail Koziara Boudreaux 2, 4 Former CEO of UnitedHealthcare and Former Executive Vice President of UnitedHealth Group
Richard K. Davis 3 Lead Independent Director Chairman, President and CEO U.S. Bancorp
Ben Fowke Chairman, President and CEO Xcel Energy Inc.
Albert F. Moreno 1, 4
Retired Senior Vice President and General Counsel Levi Strauss & Co.
Richard T. O’Brien 1, 4 President and CEO Boart Longyear Limited
Christopher J. Policinski 2, 3 President and CEO Land O’ Lakes, Inc.
A. Patricia Sampson 1, 3 CEO, President and Owner The Sampson Group, Inc.
James J. Sheppard 2, 4 Independent Consultant Former Senior Vice President and Chief Nuclear Officer Southern California Edison
David A. Westerlund 2, 3 Retired Executive Vice President, Administration and Corporate Secretary Ball Corporation
Kim Williams 1, 3 Retired Partner Wellington Management Company LLP
Timothy V. Wolf 1, 4 President Wolf Interests, Inc.
Board Committees:1. Audit2. Governance, Compensation
and Nominating3. Finance4. Operations, Nuclear, Environmental
and Safety
Schedule Q-3 Page 181 of 182
Sponsor: Robinson Case No. 15-00139-UT

xcelenergy.com | © 2015 Xcel Energy Inc. | Xcel Energy is a registered trademark of Xcel Energy Inc. | Northern States Power Company-Minnesota, Northern States Power Company-Wisconsin, Public Service Company of Colorado
and Southwestern Public Service Company, Xcel Energy Companies. | 15-02-017
Schedule Q-3 Page 182 of 182
Sponsor: Robinson Case No. 15-00139-UT

UNITED STATESSECURITIES AND EXCHANGE COMMISSION
Washington, D.C. 20549
FORM 10-K(Mark One)
ANNUAL REPORT PURSUANT TO SECTION 13 OR 15(d) OF THE SECURITIES EXCHANGE ACT OF 1934
For the fiscal year ended December 31, 2014 or
TRANSITION REPORT PURSUANT TO SECTION 13 OR 15(d) OF THE SECURITIES EXCHANGE ACT OF 1934
Commission file number: 001-03789
SOUTHWESTERN PUBLIC SERVICE COMPANY(Exact name of registrant as specified in its charter)
New Mexico 75-0575400State or other jurisdiction of incorporation or organization (I.R.S. Employer Identification No.)
Tyler at Sixth, Amarillo, Texas 79101(Address of principal executive offices)
Registrant’s telephone number, including area code: 303-571-7511Securities registered pursuant to Section 12(b) of the Act: None
Securities registered pursuant to Section 12(g) of the Act: None
Indicate by check mark if the registrant is a well-known seasoned issuer, as defined in Rule 405 of the Securities Act. Yes No
Indicate by check mark if the registrant is not required to file reports pursuant to Section 13 or Section 15(d) of the Act. Yes No
Indicate by check mark whether the registrant (1) has filed all reports required to be filed by Section 13 or 15(d) of the Securities Exchange Act of 1934 during the preceding 12 months (or for such shorter period that the registrant was required to file such reports), and (2) has been subject to such filing requirements for the past 90 days. Yes No
Indicate by check mark whether the registrant has submitted electronically and posted on its corporate Website, if any, every Interactive Data File required to be submitted and posted pursuant to Rule 405 and Regulation S-T (§232.405 of this chapter) during the preceding 12 months (or for such shorter period that the registrant was required to submit and post such files). Yes No
Indicate by check mark if disclosure of delinquent filers pursuant to Item 405 of Regulations S-K (§229.405 of this chapter) is not contained herein, and will not be contained, to the best of the registrant’s knowledge, in definitive proxy or information statements incorporated by reference in Part III of this Form 10-K or any amendment to this Form 10-K.
Indicate by check mark whether the registrant is a large accelerated filer, an accelerated filer, a non-accelerated filer, or a smaller reporting company. See the definitions of “large accelerated filer,” “accelerated filer” and “smaller reporting company” in Rule 12b-2 of the Exchange Act
Large accelerated filer Accelerated filer Non-accelerated filer Smaller Reporting Company
(Do not check if a smaller reporting company)
Indicate by check mark whether the registrant is a shell company (as defined in Rule 12b-2 of the Act). Yes No
As of Feb. 23, 2015, 100 shares of common stock, par value $1 per share, were outstanding, all of which were held by Xcel Energy Inc., a Minnesota corporation.
DOCUMENTS INCORPORATED BY REFERENCE
Xcel Energy Inc.’s Definitive Proxy Statement for its 2015 Annual Meeting of Shareholders is incorporated by reference into Part III of this Form 10-K.
Southwestern Public Service Company meets the conditions set forth in General Instruction I(1)(a) and (b) of Form 10-K and is therefore filing this form with the reduced disclosure format permitted by General Instruction I(2).
Schedule Q-4 Page 1 of 187
Sponsor: Robinson Case No. 15-00139-UT

2
TABLE OF CONTENTSIndex
PART I
PART II
PART III
PART IV
This Form 10-K is filed by SPS. SPS is a wholly owned subsidiary of Xcel Energy Inc. Additional information on Xcel Energy is available on various filings with the SEC. This report should be read in its entirety.
3Item 1 — Business 3
DEFINITION OF ABBREVIATIONS AND INDUSTRY TERMS 3COMPANY OVERVIEW 5ELECTRIC UTILITY OPERATIONS 5
Public Utility Regulation 5Capacity and Demand 6Energy Sources and Related Transmission Initiatives 6Fuel Supply and Costs 7Fuel Sources 7Renewable Energy Sources 8Wholesale Commodity Marketing Operations 8Summary of Recent Federal Regulatory Developments 8Electric Operating Statistics 10Natural Gas Facilities Used for Electric Generation 11
GENERAL 11ENVIRONMENTAL MATTERS 12EMPLOYEES 12
Item 1A — Risk Factors 12Item 1B — Unresolved Staff Comments 21Item 2 — Properties 21Item 3 — Legal Proceedings 22Item 4 — Mine Safety Disclosures 22
22Item 5 — Market for Registrant’s Common Equity, Related Stockholder Matters and Issuer Purchases of Equity Securities 22Item 6 — Selected Financial Data 22Item 7 — Management’s Discussion and Analysis of Financial Condition and Results of Operations 22Item 7A — Quantitative and Qualitative Disclosures About Market Risk 25Item 8 — Financial Statements and Supplementary Data 26Item 9 — Changes in and Disagreements with Accountants on Accounting and Financial Disclosure 70Item 9A — Controls and Procedures 70Item 9B — Other Information 71
71Item 10 — Directors, Executive Officers and Corporate Governance 71Item 11 — Executive Compensation 71Item 12 — Security Ownership of Certain Beneficial Owners and Management and Related Stockholder Matters 71Item 13 — Certain Relationships and Related Transactions, and Director Independence 71Item 14 — Principal Accountant Fees and Services 71
72Item 15 — Exhibits, Financial Statement Schedules 72
SIGNATURES 76
Schedule Q-4 Page 2 of 187
Sponsor: Robinson Case No. 15-00139-UT

3
PART IItem l — Business
DEFINITION OF ABBREVIATIONS AND INDUSTRY TERMS
Xcel Energy Inc.’s Subsidiaries and Affiliates (current and former)NCE New Century Energies, Inc.NSP-Minnesota Northern States Power Company, a Minnesota corporationNSP-Wisconsin Northern States Power Company, a Wisconsin corporationPSCo Public Service Company of ColoradoSPS Southwestern Public Service CompanyUtility subsidiaries NSP-Minnesota, NSP-Wisconsin, PSCo and SPSXcel Energy Xcel Energy Inc. and its subsidiaries
Federal and State Regulatory AgenciesCFTC Commodity Futures Trading CommissionD.C. Circuit United States Court of Appeals for the District of Columbia CircuitDOT United States Department of TransportationEPA United States Environmental Protection AgencyFERC Federal Energy Regulatory CommissionIRS Internal Revenue ServiceNERC North American Electric Reliability CouncilNMAG New Mexico Attorney GeneralNMPRC New Mexico Public Regulation CommissionPNM Public Service Company of New MexicoPUCT Public Utility Commission of TexasSEC Securities and Exchange Commission
Electric and Resource Adjustment ClausesDCRF Distribution cost recovery factorDRC Deferred renewable cost riderDSM Demand side managementEE Energy efficiencyEECRF Energy efficiency cost recovery factorFCA Fuel clause adjustmentFPPCAC Fuel and purchased power cost adjustment clauseOATT Open access transmission tariffPCRF Power cost recovery factorTCRF Transmission cost recovery factor (recovers transmission infrastructure improvement costs and
changes in wholesale transmission charges)
Other Terms and AbbreviationsAFUDC Allowance for funds used during constructionAPBO Accumulated postretirement benefit obligationARO Asset retirement obligationASU FASB Accounting Standards UpdateBART Best available retrofit technologyC&I Commercial and IndustrialCAA Clean Air ActCAIR Clean Air Interstate RuleCCN Certificate of convenience and necessityCO2 Carbon dioxideCP Coincident peakCSAPR Cross-State Air Pollution Rule
Table of Contents
Schedule Q-4 Page 3 of 187
Sponsor: Robinson Case No. 15-00139-UT

4
CWIP Construction work in progressETR Effective tax rateERCOT Electric Reliability Council of TexasFASB Financial Accounting Standards BoardFTR Financial transmission rightGAAP Generally accepted accounting principlesGHG Greenhouse gasHTY Historic test yearMISO Midcontinent Independent System Operator, Inc.Moody’s Moody’s Investor ServicesNative load Customer demand of retail and wholesale customers whereby a utility has an obligation to serve
under statute or long-term contract.NOL Net operating lossNOV Notice of violationNOx Nitrogen oxideNSPS New source performance standardNTC Notifications to constructO&M Operating and maintenanceOCI Other comprehensive incomePCB Polychlorinated biphenylPJM PJM Interconnection, LLCPM Particulate matterPPA Purchased power agreementPRP Potentially responsible partyPTC Production tax creditPV PhotovoltaicQF Qualifying facilitiesREC Renewable energy creditROE Return on equityROFR Right of first refusalRPS Renewable portfolio standardsRTO Regional Transmission OrganizationSIP State implementation planSharyland Sharyland Distribution and Transmission Services, LLCSO2 Sulfur dioxideSPP Southwest Power Pool, Inc.Standard & Poor’s Standard & Poor’s Ratings Services
MeasurementsKV KilovoltsKWh Kilowatt hoursMMBtu Million British thermal unitsMW MegawattsMWh Megawatt hours
Table of Contents
Schedule Q-4 Page 4 of 187
Sponsor: Robinson Case No. 15-00139-UT
5
COMPANY OVERVIEW
SPS was incorporated in 1921 under the laws of New Mexico. SPS is a utility engaged primarily in the generation, purchase, transmission, distribution, and sale of electricity in portions of Texas and New Mexico. The wholesale customers served by SPS comprised approximately 31 percent of its total KWh sold in 2014. SPS provides electric utility service to approximately 386,000 retail customers in Texas and New Mexico. Approximately 72 percent of SPS’ retail electric operating revenues were derived from operations in Texas during 2014. Although SPS’ large commercial and industrial electric retail customers are comprised of many diversified industries, a significant portion of SPS’ large commercial and industrial electric sales include the following industries: oil and gas extraction, as well as petroleum and coal products. For small commercial and industrial customers, significant electric retail sales include the following industries: oil and gas extraction and crop related agricultural industries. Generally, SPS’ earnings contribute approximately five percent to 15 percent of Xcel Energy’s consolidated net income.
SPS’ corporate strategy focuses on four core objectives: improving utility performance; driving operational excellence; providing options and solutions to customers; and investing for the future.
ELECTRIC UTILITY OPERATIONS
Public Utility Regulation
Summary of Regulatory Agencies and Areas of Jurisdiction — The PUCT and NMPRC regulate SPS’ retail electric operations and have jurisdiction over its retail rates and services and the construction of transmission or generation in their respective states. The municipalities in which SPS operates in Texas have original jurisdiction over SPS’ rates in those communities. Each municipality can deny SPS’ rate increases. SPS can then appeal municipal rate decisions to the PUCT, which hears all municipal rate denials in one hearing. The NMPRC also has jurisdiction over the issuance of securities. SPS is regulated by the FERC with respect to its wholesale electric operations, accounting practices, wholesale sales for resale, the transmission of electricity in interstate commerce, compliance with NERC electric reliability standards, asset transactions and mergers, and natural gas transactions in interstate commerce. SPS has received authorization from the FERC to make wholesale electric sales at market-based prices.
Fuel, Purchased Energy and Conservation Cost-Recovery Mechanisms — SPS has several retail adjustment clauses that recover fuel, purchased energy and other resource costs:
• DCRF — The DCRF rider recovers distribution costs in Texas.• DRC — The DRC rider previously recovered deferred costs associated with renewable energy programs in New Mexico.• EECRF — The EECRF rider recovers costs associated with providing energy efficiency programs in Texas.• EE rider — The EE rider recovers costs associated with providing energy efficiency programs in New Mexico.• FPPCAC — The FPPCAC adjusts monthly to recover the difference between the actual fuel and purchased power costs and the
amount included in base rates of SPS’ New Mexico retail jurisdiction.• PCRF — The PCRF rider allows recovery of certain purchased power costs in Texas.• RPS — The RPS rider recovers deferred costs associated with renewable energy programs in New Mexico.• TCRF — The TCRF rider recovers transmission infrastructure improvement costs and changes in wholesale transmission
charges in Texas.
Fuel and purchased energy costs are recovered in Texas through a fixed fuel and purchased energy recovery factor, which is part of SPS’ retail electric tariff. SO2 and NOx allowance revenues and costs are also recovered through the fixed fuel and purchased energy recovery factor. The regulations allow retail fuel factors to change up to three times per year.
The fixed fuel and purchased energy recovery factor provides for the over- or under-recovery of fuel and purchased energy expenses. Regulations also require refunding or surcharging over- or under- recovery amounts, including interest, when they exceed four percent of the utility’s annual fuel and purchased energy costs on a rolling 12-month basis, if this condition is expected to continue.
PUCT regulations require periodic examination of SPS’ fuel and purchased energy costs, the efficient use of fuel and purchased energy, fuel acquisition and management policies and purchased energy commitments. SPS is required to file an application for the PUCT to retrospectively review fuel and purchased energy costs at least every three years.
Table of Contents
Schedule Q-4 Page 5 of 187
Sponsor: Robinson Case No. 15-00139-UT

6
NMPRC regulations require SPS to request authority to continue collecting its fuel and purchased power costs through a fuel adjustment clause every four years. The NMPRC previously granted SPS authority to use a fuel adjustment clause through November 2014, and allows its continued use while a new application is pending. In November 2014, SPS filed an application with the NMPRC to continue use of the fuel adjustment clause for an additional four years. Hearings are scheduled for May 2015.
SPS recovers fuel and purchased energy costs from its wholesale customers through a monthly wholesale fuel and purchased economic energy cost adjustment clause accepted for filing by the FERC.
Capacity and Demand
Uninterrupted system peak demand for SPS for each of the last three years and the forecast for 2015, assuming normal weather, is listed below.
System Peak Demand (in MW)2012 2013 2014 2015 Forecast
5,265 5,056 4,871 4,982
The peak demand for the SPS system typically occurs in the summer. The 2014 uninterrupted system peak demand for SPS occurred on Aug. 7, 2014. The 2014 peak demand decreased due to cooler summer weather.
Energy Sources and Related Transmission Initiatives
SPS expects to use existing electric generating stations, power purchases, DSM and new generation options to meet its net dependable system capacity requirements.
Purchased Power — SPS has contracts to purchase power from other utilities and independent power producers. Long-term purchased power contracts typically require a periodic payment to secure the capacity and a charge for the associated energy actually purchased. SPS also makes short-term purchases to meet system load and energy requirements, to replace generation from company-owned units under maintenance or during outages, to meet operating reserve obligations or to obtain energy at a lower cost.
Purchased Transmission Services — SPS has contractual arrangements with SPP and regional transmission service providers, including PSCo, to deliver power and energy to its native load customers, which are retail and wholesale load obligations with terms of more than one year.
SPP Integrated Market (IM) — In February 2014, the FERC granted SPS approval to make sales to the SPP IM at market-based rates. Further, In February and March, respectively, SPS was granted interim approval for revised QF tariff pricing in Texas and New Mexico to be consistent with the new market and to coincide with the start of the IM. The SPP IM began operations in March 2014 and operates in the day ahead and real time energy and ancillary services market. In April 2014, the FERC approved SPS’ filings to modify its wholesale power sales contracts to allow recovery of SPP IM charges and revenues through the SPP wholesale FCA.
Transmission NTCs — As a member of SPP, SPS accepts NTCs for electric transmission line and substation projects to be built within the SPP footprint. SPS has accepted NTCs for projects with an estimated capital cost of approximately $1.9 billion and will continue to review new NTCs for acceptance as they are issued. These projects generally span several years to plan, site, procure and develop. The NMPRC and the PUCT must approve the siting and routing of any SPP identified transmission line NTC projects that require permitting approval. Projects identified through SPP NTCs may have costs allocated to other SPP members in accordance with the SPP OATT. Costs allocated to SPS are permissible for recovery through the NMPRC, the PUCT and the FERC processes.
High Priority Incremental Load Study ReportIn April 2014, the SPP Board of Directors approved the High Priority Incremental Load Study Report, a reliability assessment that evaluated the anticipated transmission needs of certain parts of the SPP resulting from expected load growth in the area. As a result of this study, SPS has received NTCs and conditional NTCs for 44 new transmission projects to be placed into service by 2020. SPS is developing plans for these projects in preparation of submitting CCNs to the PUCT and the NMPRC. These projects are intended to provide regional reliability benefits as well as the ability to serve the increase in load in southeastern New Mexico.
Table of Contents
Schedule Q-4 Page 6 of 187
Sponsor: Robinson Case No. 15-00139-UT

7
TUCO substation to Woodward, Okla. 345 KV transmission lineThe TUCO to Woodward District extra high voltage interchange is a 345 KV transmission line. SPS constructed the line to just inside the Oklahoma state line, and Oklahoma Gas and Electric Company (OGE) built from there to Woodward, Okla. SPS’ investment in the TUCO to Woodward line and substation is approximately $206 million and is expected to be recovered from SPP members, including SPS, in accordance with the SPP tariff. The line was placed into service in September 2014.
Hitchland substation to Woodward, Okla. 345 KV transmission lineThe Hitchland substation to Woodward, Okla. line is a 345 KV double circuit transmission line and associated substation facilities in the Oklahoma and Texas Panhandle. SPS built the first 30 miles to Beaver County, Okla. and OGE completed the line from there to Woodward, Okla. SPS’ investment for the Hitchland to Woodward line and substation is approximately $58 million and is expected to be recovered from SPP members in accordance with the SPP tariff. The line was placed into service in May 2014.
Potash Junction substation to Roadrunner substation 345 KV transmission lineIn April 2014, SPS filed a CCN with the NMPRC for a new 345 KV transmission line from the Potash Junction substation to the Roadrunner substation, both near Carlsbad, N.M. The proposed line would run 40 miles and cost an estimated $54 million. The NMPRC approved the CCN in December 2014. The line is anticipated to be placed into service in the fourth quarter of 2015.
Resource Plans — SPS is required to develop and implement a renewable portfolio plan in which 15 percent of its energy to serve its New Mexico retail customers is produced by renewable resources in 2015. SPS primarily fulfills its renewable portfolio requirements through PPAs.
Fuel Supply and Costs
The following table shows the delivered cost per MMBtu of each significant category of fuel consumed for owned electric generation, the percentage of total fuel requirements represented by each category of fuel and the total weighted average cost of all fuels.
Coal Natural Gas Weighted AverageOwned Fuel CostSPS Generating Plants Cost Percent Cost Percent
2014 $ 2.07 71% $ 4.76 29% $ 2.852013 2.14 71 3.97 29 2.682012 1.87 67 2.99 33 2.24
See Item 1A for further discussion of fuel supply and costs.
Fuel Sources
Coal — SPS purchases all of the coal requirements for its two coal facilities, Harrington and Tolk electric generating stations, from TUCO. TUCO arranges for the purchase, receiving, transporting, unloading, handling, crushing, weighing and delivery of coal to meet SPS’ requirements. TUCO is responsible for negotiating and administering contracts with coal suppliers, transporters and handlers. The coal supply contract with TUCO expires in 2016 for Harrington and Tolk. SPS normally maintains approximately 43 days of coal inventory. As of Dec. 31, 2014 and 2013, coal inventories at SPS were approximately 17 and 42 days supply, respectively. At Dec. 31, 2014, coal inventories were below optimal levels due to railcar congestion. TUCO has coal agreements to supply 87 percent of SPS’ estimated coal requirements in 2015, and a declining percentage of the requirements in subsequent years. SPS’ general coal purchasing objective is to contract for approximately 100 percent of requirements for the first year, 67 percent of requirements in year two, and 33 percent of requirements in year three.
Natural gas — SPS uses both firm and interruptible natural gas supply and standby oil in combustion turbines and certain boilers. Natural gas for SPS’ power plants is procured under contracts to provide an adequate supply of fuel; which typically is purchased with terms of one year or less. The transportation and storage contracts expire in various years from 2015 to 2033. All of the natural gas supply contracts have variable pricing that is tied to various natural gas indices.
Most transportation contract pricing is based on FERC and Railroad Commission of Texas approved transportation tariff rates. Certain natural gas supply and transportation agreements include obligations for the purchase and/or delivery of specified volumes of natural gas or to make payments in lieu of delivery. SPS’ commitments related to gas supply contracts were approximately $3 million and $21 million and commitments related to gas transportation and storage contracts were approximately $222 million and $201 million at Dec. 31, 2014 and 2013, respectively.
Table of Contents
Schedule Q-4 Page 7 of 187
Sponsor: Robinson Case No. 15-00139-UT
8
SPS has limited on-site fuel oil storage facilities and primarily relies on the spot market for incremental supplies.
Renewable Energy Sources
SPS’ renewable energy portfolio includes wind and solar power from both owned generating facilities and PPAs. As of Dec. 31, 2014, SPS is in compliance with mandated RPS, which require generation from renewable resources of approximately four percent and 10 percent of Texas and New Mexico electric retail sales, respectively.
• Renewable energy comprised 14.7 percent and 12.7 percent of SPS’ energy for 2014 and 2013, respectively. • Wind energy comprised 14.0 percent and 12.1 percent of SPS’ energy for 2014 and 2013, respectively. • Solar power comprised approximately 0.4 percent of SPS’ energy for both 2014 and 2013.
SPS also offers customer-focused renewable energy initiatives. Windsource allows customers in New Mexico to purchase a portion or all of their electricity from renewable sources. The number of Windsource participants remained consistent at approximately 900 in 2013 and 2014. Windsource sales were approximately 4,400 MWh in 2013 and 3,900 MWh in 2014.
Additionally, to encourage the growth of solar energy on the system in New Mexico, customers are offered incentives to install solar panels on their homes and businesses under the Solar*Rewards program. Over 315 PV systems with approximately 20.8 MW of aggregate capacity and over 115 PV systems with approximately 7.6 MW of aggregate capacity have been installed in New Mexico under this program as of Dec. 31, 2014 and 2013, respectively.
Wind — SPS acquires its wind energy from independent power producers (IPP) and qualified facilities (QF) contracts with wind farm owners, primarily located in the Texas Panhandle area of Texas and New Mexico. SPS currently has 37 of these agreements in place, with facilities ranging in size from under two MW to 250 MW for a total capacity greater than 1,800 MW. SPS had approximately 1,500 MW and 1,000 MW of wind energy on its system at the end of 2014 and 2013, respectively. In addition to receiving purchased wind energy under these agreements, SPS also typically receives wind RECs, which are used to meet state renewable resource requirements. The average cost per MWh of wind energy under the IPP contracts and QF contracts was approximately $26 for both 2014 and 2013. The cost per MWh of wind energy varies by contract and may be influenced by a number of factors including regulation, state-specific renewable resource requirements and the year of contract execution. Generally, contracts executed in 2014 continued to benefit from improvements in technology, excess capacity among manufacturers, and motivation to commence new construction prior to the expiration of the Federal PTCs in 2014, with certain projects qualifying into future years.
Wholesale Commodity Marketing Operations
SPS conducts various wholesale marketing operations, including the purchase and sale of electric capacity, energy and energy related products. SPS uses physical and financial instruments to minimize commodity price and credit risk and hedge sales and purchases.
See additional discussion under Item 7A for further discussion.
Summary of Recent Federal Regulatory Developments
The FERC has jurisdiction over rates for electric transmission service in interstate commerce and electricity sold at wholesale, asset transactions and mergers, accounting practices and certain other activities of SPS, including enforcement of NERC mandatory electric reliability standards. State and local agencies have jurisdiction over many of SPS’ activities, including regulation of retail rates and environmental matters. In addition to the matters discussed below, see Note 10 to the accompanying financial statements for a discussion of other regulatory matters.
FERC Order, New ROE Policy — In June 2014, the FERC adopted a new two-step ROE methodology for electric utilities. In October 2014, the FERC upheld the determination of the long-term growth rate to be used in its new ROE methodology. Several parties sought rehearing of the June 2014 order and therefore the new FERC policy may be subject to additional changes.
Table of Contents
Schedule Q-4 Page 8 of 187
Sponsor: Robinson Case No. 15-00139-UT

9
FERC Order 1000, Transmission Planning and Cost Allocation (Order 1000) — In 2011, the FERC issued a final ruling, Order 1000, adopting new requirements for transmission planning, cost allocation and development to be effective prospectively. Order 1000 requires:
• The development of tariffs that provide for joint regional transmission planning and cost allocation for all FERC-jurisdictional utilities within a region;
• The coordination between regions for the development of interregional plans for transmission planning and cost allocation; • Each public utility transmission provider to amend its Open Access Transmission Tariff to describe procedures that provide
for the consideration of transmission needs driven by public policy requirements in the local and regional transmission planning processes; and
• The removal of ROFR provisions from FERC-jurisdictional wholesale transmission contracts and tariffs that presently grant the incumbent transmission owner a federal ROFR to build certain types of transmission projects in its service area.
SPP has submitted multiple compliance filings with the FERC to implement the Order 1000 requirements. Some of the new compliance provisions that were filed have already been approved but others remain under review by the FERC.
In August 2014, the D.C. Circuit denied all appeals and upheld Order 1000 in its entirety and indicated that challenges to the removal of federal ROFR provisions from individual contracts or tariffs could be considered in individual compliance filings. The FERC’s decisions to remove federal ROFR provisions in certain SPP agreements were appealed to federal courts of appeal in 2014, and those appeals are pending. The removal of a federal ROFR would eliminate rights that SPS currently has under the SPP tariffs to build certain transmission projects within its footprint.
In 2014, SPP filed compliance plans that would allow the RTO to recognize state law ROFRs in any selection process for Order 1000 transmission projects. In 2015, the FERC issued orders on rehearing on the compliance filing that would continue to allow SPP the authority to recognize state ROFRs. SPS believes it has a state ROFR in Texas.
Order 1000 could create opportunities for third parties to build and own certain regional transmission projects that had previously been reserved for the SPP transmission owners, potentially reducing SPS’s financial return on new investments in electric transmission facilities. The ultimate impact of Order 1000 on future SPS transmission investment is not known at this time.
NERC Critical Infrastructure Protection (CIP) Requirements — The FERC has approved version 5 of NERC’s CIP standards. Requirements must be applied to high and medium impact assets by April 1, 2016 and to low impact assets by April 1, 2017. SPS is currently in the process of evaluating the new requirements and identifying initiatives needed to meet the compliance deadlines.
NERC Physical Security Requirements — In November 2014, the FERC approved NERC’s proposed CIP standard related to physical security for bulk electric system facilities. The new standard will become enforceable in October 2015 with staggered milestone deliverable dates through 2016. SPS is currently in the process of developing and performing the initial risk assessment in accordance with the requirements of the standard, which will provide a basis to estimate the cost of protections necessary to meet the standard. The additional cost for compliance is anticipated to be recoverable through rates.
SPP and MISO Complaints Regarding RTO Joint Operating Agreement (JOA) — SPP and MISO have a longstanding dispute regarding the interpretation of their JOA, which is intended to coordinate RTO operations along the MISO/SPP system boundary. SPP and MISO disagree over MISO’s authority to transmit power over SPP transmission facilities between the traditional MISO region in the Midwest and the Entergy system. Several cases have been filed with the FERC by MISO and SPP. In June 2014, the FERC accepted a proposed tariff change by MISO to recover transmission charges imposed by SPP retroactive to January 2014, and set the issues for settlement judge and hearing procedures. If SPP is successful in charging MISO for use of the SPP system, the NSP System would experience higher costs from MISO, which could be material, but SPS would collect revenues from SPP. The outcome of the JOA disputes, and the potential impact on SPS, are uncertain at this time.
Table of Contents
Schedule Q-4 Page 9 of 187
Sponsor: Robinson Case No. 15-00139-UT

10
Electric Operating Statistics
Electric Sales Statistics
Year Ended Dec. 312014 2013 2012
Electric sales (Millions of KWh)Residential 3,549 3,564 3,542Large commercial and industrial 10,262 9,893 9,707Small commercial and industrial 4,741 4,743 4,708Public authorities and other 556 568 575
Total retail 19,108 18,768 18,532Sales for resale 8,563 9,200 9,281
Total energy sold 27,671 27,968 27,813
Number of customers at end of periodResidential 302,922 301,169 299,352Large commercial and industrial 214 214 209Small commercial and industrial 76,553 75,592 74,706Public authorities and other 6,323 6,256 6,262
Total retail 386,012 383,231 380,529Wholesale 7 30 31
Total customers 386,019 383,261 380,560
Electric revenues (Thousands of Dollars)Residential $ 363,841 $ 330,487 $ 309,474Large commercial and industrial 516,648 445,043 379,722Small commercial and industrial 379,558 351,851 314,526Public authorities and other 46,916 43,059 40,432
Total retail 1,306,963 1,170,440 1,044,154Wholesale 493,127 416,793 408,491Other electric revenues 137,280 119,854 87,410
Total electric revenues $ 1,937,370 $ 1,707,087 $ 1,540,055
KWh sales per retail customer 49,501 48,973 48,701Revenue per retail customer $ 3,386 $ 3,054 $ 2,744Residential revenue per KWh 10.25¢ 9.27¢ 8.74¢Large commercial and industrial revenue per KWh 5.03 4.50 3.91Small commercial and industrial revenue per KWh 8.01 7.42 6.68Total retail revenue per KWh 6.84 6.24 5.63Wholesale revenue per KWh 5.76 4.53 4.40
Table of Contents
Schedule Q-4 Page 10 of 187
Sponsor: Robinson Case No. 15-00139-UT
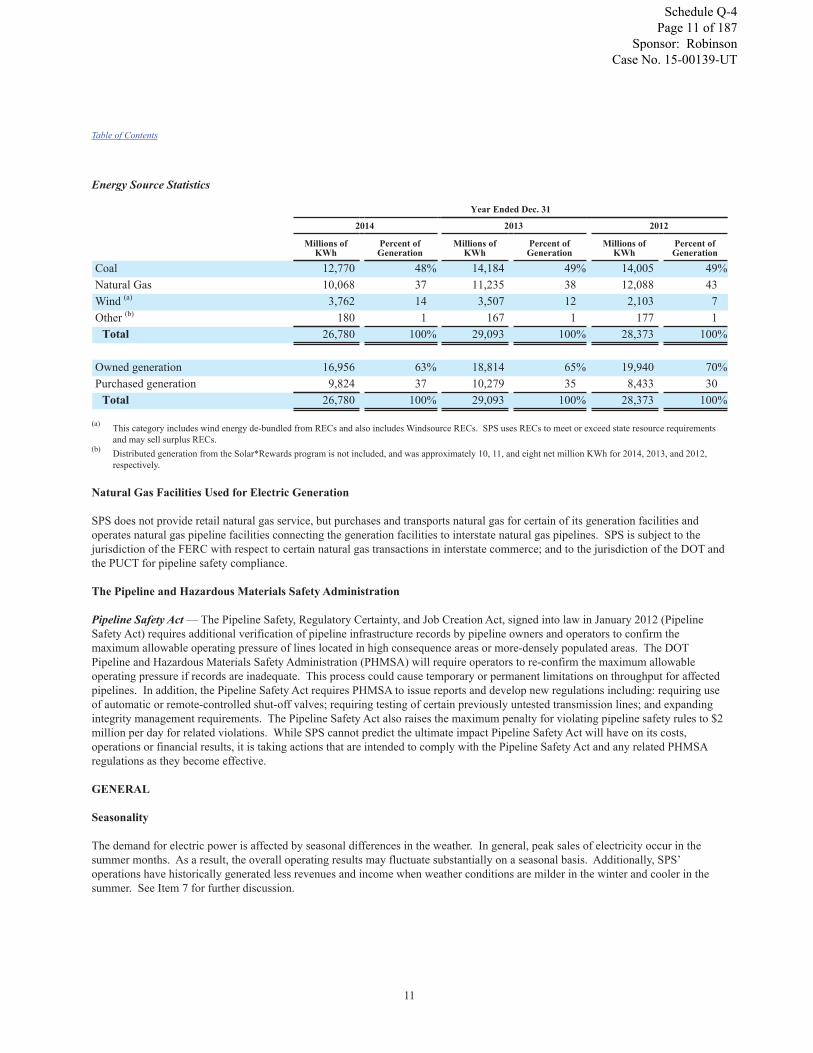
11
Energy Source Statistics
Year Ended Dec. 31
2014 2013 2012
Millions ofKWh
Percent ofGeneration
Millions ofKWh
Percent ofGeneration
Millions ofKWh
Percent ofGeneration
Coal 12,770 48% 14,184 49% 14,005 49%Natural Gas 10,068 37 11,235 38 12,088 43Wind (a) 3,762 14 3,507 12 2,103 7Other (b) 180 1 167 1 177 1
Total 26,780 100% 29,093 100% 28,373 100%
Owned generation 16,956 63% 18,814 65% 19,940 70%Purchased generation 9,824 37 10,279 35 8,433 30
Total 26,780 100% 29,093 100% 28,373 100%
(a) This category includes wind energy de-bundled from RECs and also includes Windsource RECs. SPS uses RECs to meet or exceed state resource requirements and may sell surplus RECs.
(b) Distributed generation from the Solar*Rewards program is not included, and was approximately 10, 11, and eight net million KWh for 2014, 2013, and 2012, respectively.
Natural Gas Facilities Used for Electric Generation
SPS does not provide retail natural gas service, but purchases and transports natural gas for certain of its generation facilities and operates natural gas pipeline facilities connecting the generation facilities to interstate natural gas pipelines. SPS is subject to the jurisdiction of the FERC with respect to certain natural gas transactions in interstate commerce; and to the jurisdiction of the DOT and the PUCT for pipeline safety compliance.
The Pipeline and Hazardous Materials Safety Administration
Pipeline Safety Act — The Pipeline Safety, Regulatory Certainty, and Job Creation Act, signed into law in January 2012 (Pipeline Safety Act) requires additional verification of pipeline infrastructure records by pipeline owners and operators to confirm the maximum allowable operating pressure of lines located in high consequence areas or more-densely populated areas. The DOT Pipeline and Hazardous Materials Safety Administration (PHMSA) will require operators to re-confirm the maximum allowable operating pressure if records are inadequate. This process could cause temporary or permanent limitations on throughput for affected pipelines. In addition, the Pipeline Safety Act requires PHMSA to issue reports and develop new regulations including: requiring use of automatic or remote-controlled shut-off valves; requiring testing of certain previously untested transmission lines; and expanding integrity management requirements. The Pipeline Safety Act also raises the maximum penalty for violating pipeline safety rules to $2 million per day for related violations. While SPS cannot predict the ultimate impact Pipeline Safety Act will have on its costs, operations or financial results, it is taking actions that are intended to comply with the Pipeline Safety Act and any related PHMSA regulations as they become effective.
GENERAL
Seasonality
The demand for electric power is affected by seasonal differences in the weather. In general, peak sales of electricity occur in the summer months. As a result, the overall operating results may fluctuate substantially on a seasonal basis. Additionally, SPS’ operations have historically generated less revenues and income when weather conditions are milder in the winter and cooler in the summer. See Item 7 for further discussion.
Table of Contents
Schedule Q-4 Page 11 of 187
Sponsor: Robinson Case No. 15-00139-UT

12
Competition
SPS is a vertically integrated utility, subject to traditional cost-of-service regulation. However, SPS is subject to different public policies that promote competition and the development of energy markets. SPS’ industrial and large commercial customers have the ability to own or operate facilities to generate their own electricity. In addition, customers may have the option of substituting other fuels, such as natural gas, steam or chilled water for heating, cooling and manufacturing purposes, or the option of relocating their facilities to a lower cost region. Customers also have the opportunity to supply their own power with on-site solar generation (typically rooftop solar) and in most jurisdictions can currently avoid paying for most of the fixed production, transmission and distribution costs incurred to serve them.
The FERC has continued to promote competitive wholesale markets through open access transmission and other means. As a result, SPS can purchase generation resources from competing wholesale suppliers and use the transmission systems of Xcel Energy Inc.’s utility subsidiaries on a comparable basis to serve their native load. State public utilities commissions, including the NMPRC, have created resource planning programs that promote competition in the acquisition of electricity generation resources used to provide service to retail customers. In addition, FERC Order 1000 seeks to establish competition for construction and operation of certain new electric transmission facilities. SPS has franchise agreements with certain cities subject to periodic renewal. If a city elected not to renew the franchise agreement, it could seek alternative means for its citizens to access electric power or gas, such as municipalization. Several states, including New Mexico, have policies designed to promote the development of solar and other distributed energy resources through significant incentive policies; with these incentives and federal tax subsidies, distributed generating resources are potential competitors to SPS’ electric service business. While facing these challenges, SPS believes its rates and services are competitive with currently available alternatives.
ENVIRONMENTAL MATTERS
SPS’ facilities are regulated by federal and state environmental agencies. These agencies have jurisdiction over air emissions, water quality, wastewater discharges, solid wastes and hazardous substances. Various company activities require registrations, permits, licenses, inspections and approvals from these agencies. SPS has received all necessary authorizations for the construction and continued operation of its generation, transmission and distribution systems. SPS’ facilities have been designed and constructed to operate in compliance with applicable environmental standards. However, it is not possible to determine when or to what extent additional facilities or modifications of existing or planned facilities will be required as a result of changes to environmental regulations, interpretations or enforcement policies or what effect future laws or regulations may have upon SPS’ operations. See Notes 10 and 11 to the financial statements for further discussion.
There are significant future environmental regulations under consideration to encourage the use of clean energy technologies and regulate emissions of GHGs to address climate change. SPS has undertaken a number of initiatives to meet current requirements and prepare for potential future regulations, reduce GHG emissions and respond to state renewable and energy efficiency goals. If these future environmental regulations do not provide credit for the investments we have already made to reduce GHG emissions, or if they require additional initiatives or emission reductions, then their requirements would potentially impose additional substantial costs. We believe, based on prior state commission practice, we would recover the cost of these initiatives through rates.
EMPLOYEES
As of Dec. 31, 2014, SPS had 1,281 full-time employees and one part-time employee, of which 840 were covered under collective-bargaining agreements. See Note 7 to the financial statements for further discussion.
Item 1A — Risk Factors
Like other companies in our industry, Xcel Energy, which includes SPS, is subject to a variety of risks, many of which are beyond our control. Important risks that may adversely affect the business, financial condition, and results of operations are further described below. These risks should be carefully considered together with the other information set forth in this report and in future reports that Xcel Energy files with the SEC.
Table of Contents
Schedule Q-4 Page 12 of 187
Sponsor: Robinson Case No. 15-00139-UT

13
Oversight of Risk and Related Processes
A key accountability of the Board of Directors is to identify, manage and mitigate material risk. Our Board employs an effective process for doing so, combining management and Board risk oversight. The guidelines on corporate governance and Board committee charters define the scope of review and inquiry for the Board and its committees regarding risk management. As provided below, management and each committee has responsibility for overseeing aspects of risk management and mitigation of the risk.
Management identifies and analyzes risks to determine materiality and other attributes such as timing, probability and controllability, broadly considering our business, the utility industry, the domestic and global economy and the environment. Identification and analysis occurs formally through a key risk assessment process conducted by senior management, the financial disclosure process, the hazard risk management process and internal auditing and compliance with financial and operational controls. Management also identifies and analyzes risk through its business planning process and development of goals and key performance indicators, which include risk identification to determine barriers to implementing our strategy. At the same time, the business planning process identifies areas in which there is a potential for a business area to take inappropriate risk to meet goals and determines how to prevent inappropriate risk-taking.
At a threshold level, we have developed a robust compliance program and promote a culture of compliance, including tone at the top, which mitigates risk. The process for risk mitigation includes adherence to our code of conduct and other compliance policies, operation of formal risk management structures and groups, and overall business management to mitigate the risks inherent in the implementation strategy. Building on this culture of compliance, we manage and further mitigate risks through operation of formal risk management structures and groups, including management councils, risk committees and the services of internal corporate areas such as internal audit, the corporate controller and legal services.
Management communicates regularly with the Board and key stakeholders regarding risk. Senior management presents a periodic assessment of key risks to the Board. The presentation of the key risks and the discussion provides the Board with information on the risks management believes are material, including the earnings impact, timing, likelihood and controllability. Management also provides information to the Board in presentations and communications over the course of the year.
The Board has assigned several important aspects of its governance and oversight to four standing committees to ensure issues and risks are well understood and effectively managed. While the Board as a whole reviews management’s key risk assessment and analyzes areas of potential future risk to Xcel Energy, the committees provide focused oversight of specific risks assigned to them. This provides robust and comprehensive risk management that is critical to successful execution of corporate strategy.
Risks Associated with Our Business
Environmental Risks
We are subject to environmental laws and regulations, with which compliance could be difficult and costly.
We are subject to environmental laws and regulations that affect many aspects of our past, present and future operations, including air emissions, water quality, wastewater discharges and the generation, transport and disposal of solid wastes and hazardous substances. These laws and regulations require us to obtain and comply with a wide variety of environmental requirements including those for protected natural and cultural resources (such as wetlands, endangered species and other protected wildlife, and archaeological and historical resources), licenses, permits, inspections and other approvals. Environmental laws and regulations can also require us to restrict or limit the output of certain facilities or the use of certain fuels, install pollution control equipment at our facilities, clean up spills and other contamination and correct environmental hazards. Environmental regulations may also lead to shutdown of existing facilities, either due to the difficulty in assuring compliance or that the costs of compliance no longer makes operation of the units economic. Both public officials and private individuals may seek to enforce the applicable environmental laws and regulations against us. We may be required to pay all or a portion of the cost to remediate (i.e., cleanup) sites where our past activities, or the activities of certain other parties, caused environmental contamination. At Dec. 31, 2014, these sites included third party sites, such as landfills, for which we are alleged to be a PRP that sent hazardous materials and wastes.
We are also subject to mandates to provide customers with clean energy, renewable energy and energy conservation offerings. Failure to meet the requirements of these mandates may result in fines or penalties, which could have a material effect on our results of operations. If our regulators do not allow us to recover all or a part of the cost of capital investment or the O&M costs incurred to comply with the mandates, it could have a material effect on our results of operations, financial position or cash flows.
Table of Contents
Schedule Q-4 Page 13 of 187
Sponsor: Robinson Case No. 15-00139-UT

14
In addition, existing environmental laws or regulations may be revised, and new laws or regulations seeking to protect the environment may be adopted or become applicable to us, including but not limited to, regulation of mercury, NOx, SO2, CO2 and other GHGs, particulates and cooling water intake systems. We may also incur additional unanticipated obligations or liabilities under existing environmental laws and regulations.
We are subject to physical and financial risks associated with climate change.
There is a growing consensus that emissions of GHGs are linked to global climate change. Climate change creates physical and financial risk. Physical risks from climate change include changes in weather conditions, changes in precipitation and extreme weather events.
Our customers’ energy needs vary with weather conditions, primarily temperature and humidity. For residential customers, heating and cooling represent their largest energy use. To the extent weather conditions are affected by climate change, customers’ energy use could increase or decrease. Increased energy use due to weather changes may require us to invest in additional generating assets, transmission and other infrastructure to serve increased load. Decreased energy use due to weather changes may affect our financial condition, through decreased revenues. Extreme weather conditions in general require more system backup, adding to costs, and can contribute to increased system stress, including service interruptions. Weather conditions outside of our service territory could also have an impact on our revenues. We buy and sell electricity depending upon system needs and market opportunities. Extreme weather conditions creating high energy demand may raise electricity prices, which would increase the cost of energy we provide to our customers.
Severe weather impacts our service territories, primarily when thunderstorms, tornadoes and snow or ice storms occur. To the extent the frequency of extreme weather events increases, this could increase our cost of providing service. Changes in precipitation resulting in droughts or water shortages could adversely affect our operations, principally our fossil generating units. A negative impact to water supplies due to long-term drought conditions could adversely impact our ability to provide electricity to customers, as well as increase the price they pay for energy. We may not recover all costs related to mitigating these physical and financial risks.
To the extent climate change impacts a region’s economic health, it may also impact our revenues. Our financial performance is tied to the health of the regional economies we serve. The price of energy, as a factor in a region’s cost of living as well as an important input into the cost of goods and services, has an impact on the economic health of our communities. The cost of additional regulatory requirements, such as a tax on GHGs, regulation of CO2 emissions under section 111(d) of the CAA, or additional environmental regulation could impact the availability of goods and prices charged by our suppliers which would normally be borne by consumers through higher prices for energy and purchased goods. To the extent financial markets view climate change and emissions of GHGs as a financial risk, this could negatively affect our ability to access capital markets or cause us to receive less than ideal terms and conditions.
Financial Risks
Our profitability depends in part on our ability to recover costs from our customers and there may be changes in circumstances or in the regulatory environment that impair our ability to recover costs from our customers.
We are subject to comprehensive regulation by federal and state utility regulatory agencies. The state utility commissions regulate many aspects of our utility operations, including siting and construction of facilities, customer service and the rates that we can charge customers. The FERC has jurisdiction, among other things, over wholesale rates for electric transmission service and the sale of electric energy in interstate commerce.
The profitability of our operations is dependent on our ability to recover the costs of providing energy and utility services to our customers and earn a return on our capital investment in our utility operations. We provide service at rates approved by one or more regulatory commissions. These rates are generally regulated and based on an analysis of our costs incurred in a test year. Thus, the rates we are allowed to charge may or may not match our costs at any given time. While rate regulation is premised on providing an opportunity to earn a reasonable rate of return on invested capital, in a continued low interest rate environment there has been pressure pushing down ROE. There can also be no assurance that the applicable regulatory commission will judge all of our costs to have been prudent or that the regulatory process in which rates are determined will always result in rates that will produce full recovery of such costs. Rising fuel costs could increase the risk that we will not be able to fully recover our fuel costs from our customers. Furthermore, there could be changes in the regulatory environment that would impair our ability to recover costs historically collected from our customers.
Table of Contents
Schedule Q-4 Page 14 of 187
Sponsor: Robinson Case No. 15-00139-UT

15
Management currently believes these prudently incurred costs are recoverable given the existing regulatory mechanisms in place. However, adverse regulatory rulings or the imposition of additional regulations, including additional environmental or climate change regulation, could have an adverse impact on our results of operations and hence could materially and adversely affect our ability to meet our financial obligations, including debt payments.
Any reductions in our credit ratings could increase our financing costs and the cost of maintaining certain contractual relationships.
We cannot be assured that any of our current ratings will remain in effect for any given period of time or that a rating will not be lowered or withdrawn entirely by a rating agency. In addition, our credit ratings may change as a result of the differing methodologies or change in the methodologies used by the various rating agencies. Any downgrade could lead to higher borrowing costs. Also, we may enter into certain procurement and derivative contracts that require the posting of collateral or settlement of applicable contracts if credit ratings fall below investment grade.
We are subject to capital market and interest rate risks.
Utility operations require significant capital investment in property, plant and equipment. As a result, we frequently need to access the debt and equity capital markets. Any disruption in capital markets could have a material impact on our ability to fund our operations. Capital markets are global in nature and are impacted by numerous issues and events throughout the world economy. Capital market disruption events, and resulting broad financial market distress could prevent us from issuing new securities or cause us to issue securities with less than ideal terms and conditions, such as higher interest rates.
Higher interest rates on short-term borrowings with variable interest rates or on incremental commercial paper issuances could also have an adverse effect on our operating results. Changes in interest rates may also impact the fair value of the debt securities in the master pension trust, as well as our ability to earn a return on short-term investments of excess cash.
We are subject to credit risks.
Credit risk includes the risk that our retail customers will not pay their bills, which may lead to a reduction in liquidity and an eventual increase in bad debt expense. Retail credit risk is comprised of numerous factors including the price of products and services provided, the overall economy and local economies in the geographic areas we serve, including local unemployment rates.
Credit risk also includes the risk that various counterparties that owe us money or product will breach their obligations. Should the counterparties to these arrangements fail to perform, we may be forced to enter into alternative arrangements. In that event, our financial results could be adversely affected and we could incur losses.
One alternative available to address counterparty credit risk is to transact on liquid commodity exchanges. The credit risk is then socialized through the exchange central clearinghouse function. While exchanges do remove counterparty credit risk, all participants are subject to margin requirements, which create an additional need for liquidity to post margin as exchange positions change value daily. The Dodd-Frank Wall Street Reform and Consumer Protection Act (Dodd-Frank Act) requires broad clearing of financial swap transactions through a central counterparty, which could lead to additional margin requirements that would impact our liquidity. However, we have taken advantage of an exception to mandatory clearing afforded to commercial end-users who are not classified as a major swap participant. The Board of Directors has authorized Xcel Energy and its subsidiaries to take advantage of this end-user exception. In addition, the CFTC’s rules permit us to deal in utility operations-related swaps with utility special entities and not be required to register as a swap dealer provided that our aggregate gross notional amount of swap dealing activity (including utility operations-related swaps) does not exceed the general de minimis threshold and provided that we have not exceeded the special entity de minimis threshold (excluding utility operations-related swaps) of $25 million for the preceding 12 months. Our current level of financial swap activity with special entities is significantly below this special entity de minimis threshold; therefore, we will not be classified as a swap dealer in our special entity activity. Swap transactions with non-special entities have a much higher level of activity considered to be de minimis, currently $8 billion, and our level of activity is well under this limit; therefore, we will not be classified as a swap dealer under the Dodd-Frank Act. We are currently reporting all of our swap transactions as part of the Dodd-Frank Act.
Table of Contents
Schedule Q-4 Page 15 of 187
Sponsor: Robinson Case No. 15-00139-UT

16
We may at times have direct credit exposure in our short-term wholesale and commodity trading activity to various financial institutions trading for their own accounts or issuing collateral support on behalf of other counterparties. We may also have some indirect credit exposure due to participation in organized markets, such as SPP, PJM and MISO, in which any credit losses are socialized to all market participants.
We do have additional indirect credit exposures to various domestic and foreign financial institutions in the form of letters of credit provided as security by power suppliers under various long-term physical purchased power contracts. If any of the credit ratings of the letter of credit issuers were to drop below the designated investment grade rating stipulated in the underlying long-term purchased power contracts, the supplier would need to replace that security with an acceptable substitute. If the security were not replaced, the party could be in technical default under the contract, which would enable us to exercise our contractual rights.
Increasing costs associated with our defined benefit retirement plans and other employee benefits may adversely affect our results of operations, financial position or liquidity.
We have defined benefit pension and postretirement plans that cover substantially all of our employees. Assumptions related to future costs, return on investments, interest rates and other actuarial assumptions have a significant impact on our funding requirements related to these plans. These estimates and assumptions may change based on economic conditions, actual stock and bond market performance, changes in interest rates and changes in governmental regulations. In addition, the Pension Protection Act changed the minimum funding requirements for defined benefit pension plans with modifications to these funding requirements that allowed additional flexibility in the timing of contributions. Therefore, our funding requirements and related contributions may change in the future. Also, the payout of a significant percentage of pension plan liabilities in a single year due to high retirements or employees leaving the company could trigger settlement accounting and could require the company to recognize material incremental pension expense related to unrecognized plan losses in the year these liabilities are paid.
Increasing costs associated with health care plans may adversely affect our results of operations.
Our self-insured costs of health care benefits for eligible employees have increased in recent years. Increasing levels of large individual health care claims and overall health care claims could have an adverse impact on our operating results, financial position and liquidity. We believe that our employee benefit costs, including costs related to health care plans for our employees and former employees, will continue to rise. Changes in industry standards utilized by management in key assumptions (e.g., mortality tables) could have a significant impact on future liabilities and benefit costs. Legislation related to health care could also significantly change our benefit programs and costs.
Operational Risks
We are subject to commodity risks and other risks associated with energy markets and energy production.
We engage in wholesale sales and purchases of electric capacity, energy and energy-related products as well as natural gas. As a result we are subject to market supply and commodity price risk. Commodity price changes can affect the value of our commodity trading derivatives. We mark certain derivatives to estimated fair market value on a daily basis (mark-to-market accounting). Actual settlements can vary significantly from estimated fair values recorded to the financial statements, and significant changes from the assumptions underlying our fair value estimates could cause significant earnings variability.
If we encounter market supply shortages or our suppliers are otherwise unable to meet their contractual obligations, we may be unable to fulfill our contractual obligations to our customers at previously authorized or anticipated costs. Any such disruption, if significant, would cause us to seek alternative supply services at potentially higher costs or suffer increased liability for unfulfilled contractual obligations. Any significantly higher energy or fuel costs relative to corresponding sales commitments would have a negative impact on our cash flows and could potentially result in economic losses. Potential market supply shortages may not be fully resolved through alternative supply sources and such interruptions may cause short-term disruptions in our ability to provide electric services to our customers. The impact of these cost and reliability issues depends on our operating conditions such as generation fuels mix, availability of water for cooling, availability of fuel transportation including rail shipments of coal, electric generation capacity, transmission, natural gas pipeline capacity, etc.
Table of Contents
Schedule Q-4 Page 16 of 187
Sponsor: Robinson Case No. 15-00139-UT

17
Our utility operations are subject to long-term planning risks.
Our utility operations file long-term resource plans with our regulators. These plans are based on numerous assumptions over the planning horizon such as: sales growth, customer usage, economic activity, costs, regulatory mechanisms, impact of technology, the installation of distributed generation, customer behavioral response and continuation of the existing utility business model. Given the uncertainty in these planning assumptions, there is a risk that the magnitude and timing of resource additions and demand may not coincide. SPS’ aging infrastructure may pose a risk to system reliability and expose us to premature financial obligations. SPS is engaged in significant and ongoing infrastructure investment programs.
In addition, large industrial customers may leave our system and invest in their own on-site distributed generation or seek law changes to give them the authority to purchase directly from other suppliers or organized markets. The recent low natural gas price environment has caused some customers to consider their options in this area, particularly customers with industrial processes using steam. Wholesale customers may purchase directly from other suppliers and procure only transmission service from us. These circumstances provide for greater long-term planning uncertainty related to future load growth. Similarly, distributed solar generation may become an economic competitive threat to our load growth in the future. However, we believe the economics, absent significant subsidies, do not support such a trend in the near term unless a state mandates the purchase of such generation. Some states have considered such legislation.
Our natural gas transmission operations involve numerous risks that may result in accidents and other operating risks and costs.
Our natural gas transmission activities include a variety of inherent hazards and operating risks, such as leaks, explosions and mechanical problems, which could cause substantial financial losses. In addition, these risks could result in loss of human life, significant damage to property, environmental pollution, impairment of our operations and substantial losses to us. We maintain insurance against some, but not all, of these risks and losses.
The occurrence of any of these events not fully covered by insurance could have a material effect on our financial position and results of operations. For our natural gas transmission lines located near populated areas the level of potential damages resulting from these risks is greater.
Additionally, the operating or other costs that may be required in order to comply with potential new regulations, including the Pipeline Safety Act, could be significant. The Pipeline Safety Act requires verification of pipeline infrastructure records by intrastate and interstate pipeline owners and operators to confirm the maximum allowable operating pressure of lines located in high consequence areas or more-densely populated areas. We have programs in place to comply with the Pipeline Safety Act and for systematic infrastructure monitoring and renewal over time. A significant incident could increase regulatory scrutiny and result in penalties and higher costs of operations.
As we are a subsidiary of Xcel Energy Inc. we may be negatively affected by events impacting the credit or liquidity of Xcel Energy Inc. and its affiliates.
If Xcel Energy Inc. were to become obligated to make payments under various guarantees and bond indemnities or to fund its other contingent liabilities, or if either Standard & Poor’s or Moody’s were to downgrade Xcel Energy Inc.’s credit rating below investment grade, Xcel Energy Inc. may be required to provide credit enhancements in the form of cash collateral, letters of credit or other security to satisfy part or potentially all of these exposures. If either Standard & Poor’s or Moody’s were to downgrade Xcel Energy Inc.’s debt securities below investment grade, it would increase Xcel Energy Inc.’s cost of capital and restrict its access to the capital markets. This could limit Xcel Energy Inc.’s ability to contribute equity or make loans to us, or may cause Xcel Energy Inc. to seek additional or accelerated funding from us in the form of dividends. If such event were to occur, we may need to seek alternative sources of funds to meet our cash needs.
As of Dec. 31, 2014, Xcel Energy Inc. and its utility subsidiaries had approximately $11.5 billion of long-term debt and $1.3 billion of short-term debt and current maturities. Xcel Energy Inc. provides various guarantees and bond indemnities supporting some of its subsidiaries by guaranteeing the payment or performance by these subsidiaries for specified agreements or transactions.
Table of Contents
Schedule Q-4 Page 17 of 187
Sponsor: Robinson Case No. 15-00139-UT

18
Xcel Energy also has other contingent liabilities resulting from various tax disputes and other matters. Xcel Energy Inc.’s exposure under the guarantees is based upon the net liability of the relevant subsidiary under the specified agreements or transactions. The majority of Xcel Energy Inc.’s guarantees limit its exposure to a maximum amount that is stated in the guarantees. As of Dec. 31, 2014, Xcel Energy had guarantees outstanding with a maximum stated amount of approximately $13.9 million and $0.2 million of exposure. Xcel Energy also had additional guarantees of $31.4 million at Dec. 31, 2014 for performance and payment of surety bonds for the benefit of itself and its subsidiaries, with total exposure that cannot be estimated at this time. If Xcel Energy Inc. were to become obligated to make payments under these guarantees and bond indemnities or become obligated to fund other contingent liabilities, it could limit Xcel Energy Inc.’s ability to contribute equity or make loans to us, or may cause Xcel Energy Inc. to seek additional or accelerated funding from us in the form of dividends. If such event were to occur, we may need to seek alternative sources of funds to meet our cash needs.
We are a wholly owned subsidiary of Xcel Energy Inc. Xcel Energy Inc. can exercise substantial control over our dividend policy and business and operations and may exercise that control in a manner that may be perceived to be adverse to our interests.
All of the members of our Board of Directors, as well as many of our executive officers, are officers of Xcel Energy Inc. Our Board makes determinations with respect to a number of significant corporate events, including the payment of our dividends.
We have historically paid quarterly dividends to Xcel Energy Inc. In 2014, 2013 and 2012 we paid $83.5 million, $69.6 million and $66.6 million of dividends to Xcel Energy Inc., respectively. If Xcel Energy Inc.’s cash requirements increase, our Board of Directors could decide to increase the dividends we pay to Xcel Energy Inc. to help support Xcel Energy Inc.’s cash needs. This could adversely affect our liquidity. The most restrictive dividend limitation for SPS is imposed by its state regulatory commissions. State regulatory commissions indirectly limit the amount of dividends that SPS can pay Xcel Energy Inc., by requiring a minimum equity-to-total capitalization ratio. See Item 5 for further discussion on dividend limitations.
Public Policy Risks
We may be subject to legislative and regulatory responses to climate change and emissions, with which compliance could be difficult and costly.
Increased public awareness and concern regarding climate change may result in more regional and/or federal requirements to reduce or mitigate the effects of GHGs. Legislative and regulatory responses related to climate change and new interpretations of existing laws through climate change litigation create financial risk as our electric generating facilities may be subject to additional regulation under climate change laws at either the state or federal level in the future. The EPA is regulating GHGs under the CAA. The EPA has regulated GHG emissions from motor vehicles and has proposed regulations to reduce GHG emissions from existing power plants that are expected to become final in 2015, with state plans to achieve the EPA’s goals due by 2017. Such regulations could impose substantial costs on our system. The EPA has also proposed regulations that would establish NSPS for any new fossil fuel-fired power plants that may be built which may be adopted in 2015. If adopted, these regulations could significantly increase the cost of building new generating plants.
The United States continues to participate in international negotiations related to the United Nations Framework Convention on Climate Change (UNFCCC). In 2014, the United States and China jointly announced GHG emissions goals. Further, the 20th Conference of the Parties (COP) to the UNFCCC concluded with the objective of developing an agreement among countries on emission reductions at the 2015 COP. This could result in additional GHG regulation or reduction goals in the United States.
We have been, and in the future may be subject to climate change lawsuits. An adverse outcome in any of these cases could require substantial capital expenditures and could possibly require payment of substantial penalties or damages. Defense costs associated with such litigation can also be significant. Such payments or expenditures could affect results of operations, cash flows and financial condition if such costs are not recovered through regulated rates.
Table of Contents
Schedule Q-4 Page 18 of 187
Sponsor: Robinson Case No. 15-00139-UT

19
There are many uncertainties regarding when and in what form climate change legislation or regulations will be imposed. The impact of legislation and regulations will depend on a number of factors, including what GHG emission reduction goals are set, what flexibility is allowed to meet the goals, how and whether early action to reduce GHG emissions is credited, whether GHG sources in other sectors of the economy are regulated, the degree to which GHG offsets are recognized as compliance options, how any emission allowances would be allocated to specific sources and the indirect impact of carbon regulation on natural gas and coal prices. In addition, international treaties or accords could have an impact to the extent they lead to future federal or state regulations. Another important factor is our ability to recover the costs incurred to comply with any regulatory requirements in a timely manner. If our regulators do not allow us to recover all or a part of the cost of capital investment or the O&M costs incurred to comply with the mandates, it could have a material effect on our results of operations
We are also subject to a significant number of proposed and potential rules that will impact our coal-fired and other generation facilities. These include rules associated with emissions of SO2 and NOx, mercury, regional haze, ozone and particulate matter, water discharges and ash management. The costs of investment to comply with these rules could be substantial and in some cases would lead to early retirement of coal units. We may not be able to timely recover all costs related to complying with regulatory requirements imposed on us.
Increased risks of regulatory penalties could negatively impact our business.
The Energy Act increased civil penalty authority for violation of FERC statutes, rules and orders. The FERC can now impose penalties of up to $1 million per violation per day. In addition, NERC electric reliability standards are now mandatory and subject to potential financial penalties by regional entities, the NERC or the FERC for violations. If a serious reliability incident did occur, it could have a material effect on our operations or financial results. Some states have the authority to impose substantial penalties in the event of non-compliance.
We attempt to mitigate the risk of regulatory penalties through formal training on such prohibited practices and a compliance function that reviews our interaction with the markets under FERC and CFTC jurisdictions. However, there is no guarantee our compliance program will be sufficient to ensure against violations.
Macroeconomic Risks
Economic conditions impact our business.
Our operations are affected by local, national and worldwide economic conditions both positively and negatively. Growth in our customer base is correlated with economic conditions. While the number of customers is growing, sales growth is relatively modest due to an increased focus on energy efficiency including federal standards for appliance and lighting efficiency and distributed generation, primarily solar PV. Instability in the financial markets also may affect the cost of capital and our ability to raise capital, which are discussed in the capital market risk section above.
Economic conditions may be impacted by insufficient financial sector liquidity leading to potential increased unemployment, which may impact customers’ ability to pay timely, increase customer bankruptcies, and may lead to increased bad debt.
Further, worldwide economic activity has an impact on the demand for basic commodities needed for utility infrastructure, such as steel, copper, aluminum, etc., which may impact our ability to acquire sufficient supplies. Additionally, the cost of those commodities may be higher than expected.
Table of Contents
Schedule Q-4 Page 19 of 187
Sponsor: Robinson Case No. 15-00139-UT

20
Our operations could be impacted by war, acts of terrorism, threats of terrorism or disruptions in normal operating conditions due to localized or regional events.
Our generation plants, fuel storage facilities, transmission and distribution facilities and information systems may be targets of terrorist activities that could disrupt our ability to produce or distribute some portion of our energy products. Any such disruption could result in a decrease in revenues and additional costs to repair and insure our assets. These disruptions could have a material impact on our financial condition and results of operations. The potential for terrorism has subjected our operations to increased risks and could have a material effect on our business. We have already incurred increased costs for security and capital expenditures in response to these risks. In addition, we may experience additional capital and operating costs to implement security for our plants, such as additional physical plant security and additional security personnel. We have also already incurred increased costs for compliance with NERC reliability standards associated with critical infrastructure protection, and may experience additional capital and operating costs to comply with the NERC critical infrastructure protection standards as they are implemented and clarified.
The insurance industry has also been affected by these events and the availability of insurance may decrease. In addition, the insurance we are able to obtain may have higher deductibles, higher premiums and more restrictive policy terms.
A disruption of the regional electric transmission grid, interstate natural gas pipeline infrastructure or other fuel sources, could negatively impact our business. Because our generation and transmission systems are part of an interconnected system, we face the risk of possible loss of business due to a disruption caused by the actions of a neighboring utility or an event (severe storm, severe temperature extremes, generator or transmission facility outage, pipeline rupture, railroad disruption, sudden and significant increase or decrease in wind generation, or any disruption of work force such as may be caused by flu or other epidemic) within our operating systems or on a neighboring system. Any such disruption could result in a significant decrease in revenues and significant additional costs to repair assets, which could have a material impact on our financial condition and results.
The degree to which we are able to maintain day-to-day operations in response to unforeseen events will in part determine the financial impact of certain events on our financial condition and results. It is difficult to predict the magnitude of such events and associated impacts.
A cyber incident or cyber security breach could have a material effect on our business.
We operate in an industry that requires the continued operation of sophisticated information technology systems and network infrastructure. In addition, we use our systems and infrastructure to create, collect, use, disclose, store, dispose of and otherwise process sensitive information, including company data, customer energy usage data, and personal information regarding customers, employees and their dependents, contractors and other individuals.
Our generation, transmission, distribution and fuel storage facilities, information technology systems and other infrastructure or physical assets, as well as the information processed in our systems (e.g., information about our customers, employees, operations, infrastructure and assets) could be affected by cyber security incidents, including those caused by human error. Our industry has begun to see an increased volume and sophistication of cyber security incidents from international activist organizations, Nation States, and individuals. Cyber security incidents could harm our businesses by limiting our generating, transmitting and distributing capabilities, delaying our development and construction of new facilities or capital improvement projects to existing facilities, disrupting our customer operations, or exposing us to liability. Our generation, transmission systems and natural gas pipelines are part of an interconnected system. Therefore, a disruption caused by the impact of a cyber security incident of the regional electric transmission grid, natural gas pipeline infrastructure or other fuel sources of our third party service providers’ operations, could also negatively impact our business. In addition, such an event would likely receive regulatory scrutiny at both the federal and state level. We are unable to quantify the potential impact of cyber security threats or subsequent related actions. These potential cyber security incidents and corresponding regulatory action could result in a material decrease in revenues and may cause significant additional costs (e.g., penalties, third party claims, repairs, insurance or compliance) and potentially disrupt our supply and markets for natural gas, oil and other fuels.
We maintain security measures designed to protect our information technology systems, network infrastructure and other assets. However, these assets and the information they process may be vulnerable to cyber security incidents, including the resulting disability, or failures of assets or unauthorized access to assets or information. If our technology systems were to fail or be breached, or those of our third-party service providers, we may be unable to fulfill critical business functions, including effectively maintaining certain internal controls over financial reporting. We are unable to quantify the potential impact of cyber security incidents on our business.
Table of Contents
Schedule Q-4 Page 20 of 187
Sponsor: Robinson Case No. 15-00139-UT

21
Rising energy prices could negatively impact our business.
While we have fuel clause recovery mechanisms, higher fuel costs could significantly impact our results of operations if costs are not recovered. In addition, higher fuel costs could reduce customer demand and/or increase bad debt expense, which could also have a material impact on our results of operations. Delays in the timing of the collection of fuel cost recoveries as compared with expenditures for fuel purchases could have an impact on our cash flows. Low fuel costs could have a positive impact on sales although, low oil prices could negatively impact oil and gas production activities. We are unable to predict future prices or the ultimate impact of such prices on our results of operations or cash flows.
Our operating results may fluctuate on a seasonal and quarterly basis and can be adversely affected by milder weather.
Our electric utility business is seasonal, and weather patterns can have a material impact on our operating performance. Demand for electricity is often greater in the summer and winter months associated with cooling and heating. Accordingly, our operations have historically generated less revenues and income when weather conditions are milder in the winter and cooler in the summer. Unusually mild winters and summers could have an adverse effect on our financial condition, results of operations, or cash flows.
Item 1B — Unresolved Staff Comments
None.
Item 2 — Properties
Virtually all of the utility plant property of SPS is subject to the lien of its first mortgage bond indenture.
Electric Utility Generating Stations:
Station, Location and Unit Fuel Installed
Summer 2014 Net Dependable
Capability (MW)
Steam:Harrington-Amarillo, Texas, 3 Units Coal 1976-1980 1,018Tolk-Muleshoe, Texas, 2 Units Coal 1982-1985 1,067Cunningham-Hobbs, N.M., 2 Units Natural Gas 1957-1965 254Jones-Lubbock, Texas, 2 Units Natural Gas 1971-1974 486Maddox-Hobbs, N.M., 1 Unit Natural Gas 1967 112Nichols-Amarillo, Texas, 3 Units Natural Gas 1960-1968 457Plant X-Earth, Texas, 4 Units Natural Gas 1952-1964 411Combustion Turbine:Carlsbad-Carlsbad, N.M., 1 Unit Natural Gas 1968 10Cunningham-Hobbs, N.M., 2 Units Natural Gas 1998 212Jones-Lubbock, Texas, 2 Units Natural Gas 2011-2013 338Maddox-Hobbs, N.M., 1 Unit Natural Gas 1963-1976 61
Total 4,426
Electric utility overhead and underground transmission and distribution lines (measured in conductor miles) at Dec. 31, 2014:
Conductor Miles
345 KV 8,110230 KV 9,312115 KV 12,378Less than 115 KV 23,294
SPS had 433 electric utility transmission and distribution substations at Dec. 31, 2014.
Table of Contents
Schedule Q-4 Page 21 of 187
Sponsor: Robinson Case No. 15-00139-UT

22
Item 3 — Legal Proceedings
SPS is involved in various litigation matters that are being defended and handled in the ordinary course of business. The assessment of whether a loss is probable or is a reasonable possibility, and whether the loss or a range of loss is estimable, often involves a series of complex judgments about future events. Management maintains accruals for such losses that are probable of being incurred and subject to reasonable estimation. Management is sometimes unable to estimate an amount or range of a reasonably possible loss in certain situations, including but not limited to when (1) the damages sought are indeterminate, (2) the proceedings are in the early stages, or (3) the matters involve novel or unsettled legal theories. In such cases, there is considerable uncertainty regarding the timing or ultimate resolution of such matters, including a possible eventual loss.
Additional Information
See Note 11 to the financial statements for further discussion of legal claims and environmental proceedings. See Item 1 and Note 10 to the financial statements for a discussion of proceedings involving utility rates and other regulatory matters.
Item 4 — Mine Safety Disclosures
None.
PART II
Item 5 — Market for Registrant’s Common Equity, Related Stockholder Matters and Issuer Purchases of Equity Securities
SPS is a wholly owned subsidiary of Xcel Energy Inc. and there is no market for its common equity securities. SPS has dividend restrictions imposed by FERC rules and state regulatory commissions:
• Dividends are subject to the FERC’s jurisdiction under the Federal Power Act, which prohibits the payment of dividends out of capital accounts; payment of dividends is allowed out of retained earnings only.
• The most restrictive dividend limitation for SPS is imposed by its state regulatory commissions. SPS’ state regulatory commissions indirectly limit the amount of dividends that SPS can pay Xcel Energy Inc. by requiring an equity-to-total capitalization ratio (excluding short-term debt) between 45.0 percent and 55.0 percent. In addition, SPS may not pay a dividend that would cause it to lose its investment grade bond rating. SPS’ equity-to-total capitalization ratio (excluding short-term debt) was 53.6 percent at Dec. 31, 2014 and $396 million in retained earnings was not restricted.
See Note 4 to the financial statements for further discussion of SPS’ dividend policy.
The dividends declared during 2014 and 2013 were as follows:
(Thousands of Dollars) 2014 2013
First quarter $ 18,181 $ 17,113Second quarter 24,368 17,475Third quarter 22,866 18,218Fourth quarter 27,828 18,083
Item 6 — Selected Financial Data
This is omitted per conditions set forth in general instructions I (1)(a) and (b) of Form 10-K for wholly owned subsidiaries (reduced disclosure format).
Item 7 — Management’s Discussion and Analysis of Financial Condition and Results of Operations
Discussion of financial condition and liquidity for SPS is omitted per conditions set forth in general instructions I(1)(a) and (b) of Form 10-K for wholly owned subsidiaries. It is replaced with management’s narrative analysis of the results of operations set forth in general instructions I(2)(a) of Form 10-K for wholly owned subsidiaries (reduced disclosure format).
Table of Contents
Schedule Q-4 Page 22 of 187
Sponsor: Robinson Case No. 15-00139-UT

23
Financial Review
The following discussion and analysis by management focuses on those factors that had a material effect on SPS’ financial condition, results of operations, and cash flows during the periods presented, or are expected to have a material impact in the future. It should be read in conjunction with the accompanying financial statements and the related notes to the financial statements.
Ongoing electric revenues and ongoing electric margins are financial measures not recognized under GAAP. We use these non-GAAP financial measures to evaluate and provide details of earnings results. We believe that these non-GAAP measures are useful to investors to evaluate financial performance. These non-GAAP financial measures should not be considered as alternatives to measures calculated and reported in accordance with GAAP.
Forward-Looking Statements
Except for the historical statements contained in this report, the matters discussed in the following discussion and analysis are forward-looking statements that are subject to certain risks, uncertainties and assumptions. Such forward-looking statements are intended to be identified in this document by the words “anticipate,” “believe,” “estimate,” “expect,” “intend,” “may,” “objective,” “outlook,” “plan,” “project,” “possible,” “potential,” “should,” and similar expressions. Actual results may vary materially. Forward-looking statements speak only as of the date they are made, and we do not undertake any obligation to update them to reflect changes that occur after that date. Factors that could cause actual results to differ materially include, but are not limited to: general economic conditions, including inflation rates, monetary fluctuations and their impact on capital expenditures and the ability of SPS to obtain financing on favorable terms; business conditions in the energy industry, including the risk of a slowdown in the U.S. economy or delay in growth recovery; trade, fiscal, taxation and environmental policies in areas where SPS has a financial interest; customer business conditions; actions of credit rating agencies; competitive factors, including the extent and timing of the entry of additional competition in the markets served by SPS; unusual weather; effects of geopolitical events, including war and acts of terrorism; cyber security threats and data security breaches; state, federal and foreign legislative and regulatory initiatives that affect cost and investment recovery, have an impact on rates or have an impact on asset operation or ownership or impose environmental compliance conditions; structures that affect the speed and degree to which competition enters the electric market; costs and other effects of legal and administrative proceedings, settlements, investigations and claims; financial or regulatory accounting policies imposed by regulatory bodies; availability or cost of capital; employee work force factors; and the other risk factors listed from time to time by SPS in reports filed with the SEC, including “Risk Factors” in Item 1A of this Annual Report on Form 10-K and Exhibit 99.01 hereto.
Results of Operations
SPS’ net income was approximately $129.9 million for 2014, compared with net income of approximately $95.2 million for 2013. Electric rate increases in Texas and New Mexico and weather-normalized sales growth offset higher O&M and depreciation expenses.
Electric Revenues and Margins
Electric fuel and purchased power expenses tend to vary with changing retail and wholesale sales requirements and unit cost changes in fuel and purchased power. The design of fuel and purchased power cost recovery mechanisms of the Texas and New Mexico jurisdictions may not allow for complete recovery of all expenses and, therefore, changes in fuel or purchased power costs can impact earnings. The following table details the electric revenues and margin:
(Millions of Dollars) 2014 2013
Electric revenues $ 1,937 $ 1,707Electric fuel and purchased power (1,192) (1,059)
Electric margin $ 745 $ 648
Table of Contents
Schedule Q-4 Page 23 of 187
Sponsor: Robinson Case No. 15-00139-UT

24
The following tables summarize the components of the changes in electric revenues and electric margin for the year ended Dec. 31:
Electric Revenues
(Millions of Dollars) 2014 vs. 2013
Retail rate increases (Texas and New Mexico) $ 58Trading 55Fuel and purchased power cost recovery 50Transmission revenue 23Non-fuel riders 15Demand revenue 6Sales mix 3Estimated impact of weather (4)Other, net (2)
Total increase in ongoing electric revenues 204FERC complaint case orders (a) 26
Total increase in GAAP electric revenues $ 230
Electric Margin
(Millions of Dollars) 2014 vs. 2013
Retail rate increases (Texas and New Mexico) $ 58Non-fuel riders 15Transmission revenue 14Demand revenue 6Sales mix 3Purchased capacity costs (12)Renewable energy credits (10)Estimated impact of weather (4)Other, net 1
Total increase in ongoing electric margin 71FERC complaint case orders (a) 26
Total increase in GAAP electric margin $ 97
(a) As a result of two orders issued by the FERC in August 2013, a pretax charge of approximately $36 million ($32 million in electric revenues, of which $6 million relates to 2013 and $26 million relates to periods prior to 2013, and $4 million in interest charges) was recorded in 2013. See Note 10 to financial statements.
Non-Fuel Operating Expense and Other Items
O&M Expenses — O&M expenses increased $23.3 million, or 9.2 percent for 2014 compared with 2013. The following summarizes the components of the changes for the year ended Dec. 31:
(Millions of Dollars) 2014 vs. 2013
2013 gain on sale of transmission assets $ 14Plant generation costs 3Transmission costs 2Employee benefits 2Other, net 2
Total increase in O&M expenses $ 23• Gain on sale of transmission assets relates to the 2013 gain associated with the sale of certain transmission assets to
Sharyland. See Note 10 to financial statements.
Table of Contents
Schedule Q-4 Page 24 of 187
Sponsor: Robinson Case No. 15-00139-UT

25
Depreciation and Amortization — Depreciation and amortization expenses increased $13.7 million, or 11.3 percent for 2014 compared with 2013. The increase is primarily attributable to higher amortization as a result of regulatory outcomes.
Taxes (Other Than Income Taxes) — Taxes (other than income taxes) increased $4.3 million, or 8.8 percent for 2014 compared with 2013. The increase is primarily due to higher property taxes.
AFUDC, Equity and Debt — AFUDC increased $2.6 million for 2014 compared with 2013. The increase was primarily due to the expansion of transmission facilities.
Interest Charges — Interest charges increased $2.4 million, or 3.0 percent, for 2014 compared with 2013. The increase was primarily due to higher long-term debt levels, partially offset by lower interest rates, and interest associated with the customer refund based on the August 2013 FERC orders.
Income Taxes — Income tax expense increased $21.4 million for 2014 compared with 2013. The increase in income tax expense is primarily due to higher pretax earnings in 2014. The ETR was 36.7 percent for 2014, compared with 36.1 percent for 2013.
Item 7A — Quantitative and Qualitative Disclosures About Market Risk
Derivatives, Risk Management and Market Risk
SPS is exposed to a variety of market risks in the normal course of business. Market risk is the potential loss that may occur as a result of adverse changes in the market or fair value of a particular instrument or commodity. All financial and commodity-related instruments, including derivatives, are subject to market risk. See Note 9 to the financial statements for further discussion of market risks associated with derivatives.
SPS is exposed to the impact of adverse changes in price for energy and energy-related products, which is partially mitigated by the use of commodity derivatives. In addition to ongoing monitoring and maintaining credit policies intended to minimize overall credit risk, when necessary, management takes steps to mitigate changes in credit and concentration risks associated with its derivatives and other contracts, including parental guarantees and requests of collateral. While SPS expects that the counterparties will perform under the contracts underlying its derivatives, the contracts expose SPS to some credit and nonperformance risk.
Though no material non-performance risk currently exists with the counterparties to SPS’ commodity derivative contracts, distress in the financial markets may in the future impact that risk to the extent it impacts those counterparties. Distress in the financial markets may also impact the fair value of the securities in the master pension trust, as well as SPS’ ability to earn a return on short-term investments of excess cash.
Commodity Price Risk — SPS is exposed to commodity price risk in its electric operations. Commodity price risk is managed by entering into short- and long-term physical purchase and sales contracts for electric capacity, energy and energy-related products. Commodity price risk is also managed through the use of financial derivative instruments. SPS’ risk management policy allows it to manage commodity price risk to the extent such exposure exists.
Wholesale and Commodity Trading Risk — SPS conducts wholesale and commodity trading activities, including the purchase and sale of electric capacity, energy and energy-related instruments. SPS’ risk management policy allows management to conduct these activities within guidelines and limitations as approved by its risk management committee, which is made up of management personnel not directly involved in the activities governed by this policy.
Interest Rate Risk — SPS is subject to the risk of fluctuating interest rates in the normal course of business. SPS’ risk management policy allows interest rate risk to be managed through the use of fixed rate debt, floating rate debt and interest rate derivatives such as swaps, caps, collars and put or call options.
At Dec. 31, 2014 and 2013, a 100 basis point change in the benchmark rate on SPS’ variable rate debt would impact annual pretax interest expense by approximately $0.5 million and $1.2 million, respectively. See Note 9 to the financial statements for a discussion of SPS’ interest rate derivatives.
Table of Contents
Schedule Q-4 Page 25 of 187
Sponsor: Robinson Case No. 15-00139-UT
26
Credit Risk — SPS is also exposed to credit risk. Credit risk relates to the risk of loss resulting from counterparties’ nonperformance on their contractual obligations. SPS maintains credit policies intended to minimize overall credit risk and actively monitors these policies to reflect changes and scope of operations.
At Dec. 31, 2014, a 10 percent increase in commodity prices would have resulted in a decrease in credit exposure of $0.1 million, while a decrease in prices of 10 percent would have resulted in an increase in credit exposure of $0.1 million. At Dec. 31, 2013, a 10 percent increase in commodity prices would have resulted in an increase in credit exposure of $2.2 million, while a decrease in prices of 10 percent would have resulted in an increase in credit exposure of $0.1 million.
SPS conducts standard credit reviews for all counterparties. SPS employs additional credit risk control mechanisms when appropriate, such as letters of credit, parental guarantees, standardized master netting agreements and termination provisions that allow for offsetting of positive and negative exposures. Credit exposure is monitored and, when necessary, the activity with a specific counterparty is limited until credit enhancement is provided. Distress in the financial markets could increase SPS’ credit risk.
Fair Value Measurements
SPS follows accounting and disclosure guidance on fair value measurements that contains a hierarchy for inputs used in measuring fair value and requires disclosure of the observability of the inputs used in these measurements. See Note 9 to the financial statements for further discussion of the fair value hierarchy and the amounts of assets and liabilities measured at fair value that have been assigned to Level 3.
Commodity Derivatives — SPS continuously monitors the creditworthiness of the counterparties to its commodity derivative contracts and assesses each counterparty’s ability to perform on the transactions set forth in the contracts. Given this assessment and the typically short duration of these contracts, the impact of discounting commodity derivative assets for counterparty credit risk was not material to the fair value of commodity derivative assets at Dec. 31, 2014. SPS also assesses the impact of its own credit risk when determining the fair value of commodity derivative liabilities. The impact of discounting commodity derivative liabilities for credit risk was immaterial to the fair value of commodity derivative liabilities at Dec. 31, 2014.
Commodity derivative assets and liabilities assigned to Level 3 consist of FTRs. Determining the fair value of FTRs requires numerous management forecasts that vary in observability, including various forward commodity prices, retail and wholesale demand, generation and resulting transmission system congestion. Given the limited observability of management’s forecasts for several of these inputs, these instruments have been assigned a Level 3. Level 3 commodity derivatives assets and liabilities included $25.8 million and $9.9 million of estimated fair values, respectively, for FTRs held at Dec. 31, 2014.
Item 8 — Financial Statements and Supplementary Data
See 15-1 in Part IV for an index of financial statements included herein.
See Note 15 to the financial statements for summarized quarterly financial data.
Table of Contents
Schedule Q-4 Page 26 of 187
Sponsor: Robinson Case No. 15-00139-UT

27
Management Report on Internal Controls Over Financial Reporting
The management of SPS is responsible for establishing and maintaining adequate internal control over financial reporting. SPS’ internal control system was designed to provide reasonable assurance to Xcel Energy Inc.’s and SPS’ management and board of directors regarding the preparation and fair presentation of published financial statements.
All internal control systems, no matter how well designed, have inherent limitations. Therefore, even those systems determined to be effective can provide only reasonable assurance with respect to financial statement preparation and presentation.
SPS management assessed the effectiveness of SPS’ internal control over financial reporting as of Dec. 31, 2014. In making this assessment, it used the criteria set forth by the Committee of Sponsoring Organizations of the Treadway Commission (COSO) in Internal Control — Integrated Framework (2013). Based on our assessment, we believe that, as of Dec. 31, 2014, SPS’ internal control over financial reporting is effective at the reasonable assurance level based on those criteria.
/s/ BEN FOWKE /s/ TERESA S. MADDENBen Fowke Teresa S. MaddenChairman and Chief Executive Officer Executive Vice President, Chief Financial OfficerFeb. 23, 2015 Feb. 23, 2015
Table of Contents
Schedule Q-4 Page 27 of 187
Sponsor: Robinson Case No. 15-00139-UT

28
REPORT OF INDEPENDENT REGISTERED PUBLIC ACCOUNTING FIRM
To the Board of Directors and Stockholder of
Southwestern Public Service Company
We have audited the accompanying balance sheets and statements of capitalization of Southwestern Public Service Company (the “Company”) as of December 31, 2014 and 2013, and the related statements of income, comprehensive income, cash flows, and common stockholder’s equity for each of the three years in the period ended December 31, 2014. Our audits also included the financial statement schedule listed in the Index at Item 15. These financial statements and financial statement schedule are the responsibility of the Company’s management. Our responsibility is to express an opinion on the financial statements and financial statement schedule based on our audits.
We conducted our audits in accordance with the standards of the Public Company Accounting Oversight Board (United States). Those standards require that we plan and perform the audit to obtain reasonable assurance about whether the financial statements are free of material misstatement. The Company is not required to have, nor were we engaged to perform, an audit of its internal control over financial reporting. Our audits included consideration of internal control over financial reporting as a basis for designing audit procedures that are appropriate in the circumstances, but not for the purpose of expressing an opinion on the effectiveness of the Company’s internal control over financial reporting. Accordingly, we express no such opinion. An audit also includes examining, on a test basis, evidence supporting the amounts and disclosures in the financial statements, assessing the accounting principles used and significant estimates made by management, as well as evaluating the overall financial statement presentation. We believe that our audits provide a reasonable basis for our opinion.
In our opinion, such financial statements present fairly, in all material respects, the financial position of Southwestern Public Service Company as of December 31, 2014 and 2013, and the results of its operations and its cash flows for each of the three years in the period ended December 31, 2014, in conformity with accounting principles generally accepted in the United States of America. Also, in our opinion, such financial statement schedule, when considered in relation to the basic financial statements taken as a whole, presents fairly, in all material respects the information set forth therein.
/s/ DELOITTE & TOUCHE LLPMinneapolis, MinnesotaFebruary 23, 2015
Table of Contents
Schedule Q-4 Page 28 of 187
Sponsor: Robinson Case No. 15-00139-UT

29
SOUTHWESTERN PUBLIC SERVICE CO.STATEMENTS OF INCOME
(amounts in thousands of dollars)
Year Ended Dec. 312014 2013 2012
Operating revenues $ 1,937,370 $ 1,707,087 $ 1,540,055
Operating expensesElectric fuel and purchased power 1,192,176 1,059,330 889,567Operating and maintenance expenses 277,217 253,880 251,853Demand side management program expenses 12,350 12,420 12,891Depreciation and amortization 135,632 121,907 113,743Taxes (other than income taxes) 53,871 49,533 46,246
Total operating expenses 1,671,246 1,497,070 1,314,300
Operating income 266,124 210,017 225,755
Other (expense) income, net (59) 140 46Allowance for funds used during construction — equity 12,118 10,186 7,272
Interest charges and financing costsInterest charges — includes other financing costs of
$3,038, $3,031 and $2,996, respectively 80,218 77,866 69,074Allowance for funds used during construction — debt (7,089) (6,461) (4,599)
Total interest charges and financing costs 73,129 71,405 64,475
Income before income taxes 205,054 148,938 168,598Income taxes 75,202 53,761 62,229Net income $ 129,852 $ 95,177 $ 106,369
See Notes to Financial Statements
Table of Contents
Schedule Q-4 Page 29 of 187
Sponsor: Robinson Case No. 15-00139-UT

30
SOUTHWESTERN PUBLIC SERVICE CO.STATEMENTS OF COMPREHENSIVE INCOME
(amounts in thousands of dollars)
Year Ended Dec. 312014 2013 2012
Net income $ 129,852 $ 95,177 $ 106,369Other comprehensive incomeDerivative instruments:
Reclassification of losses to net income, net of tax of$96, $97 and $97, respectively 172 171 172
Other comprehensive income 172 171 172Comprehensive income $ 130,024 $ 95,348 $ 106,541
See Notes to Financial Statements
Table of Contents
Schedule Q-4 Page 30 of 187
Sponsor: Robinson Case No. 15-00139-UT

31
SOUTHWESTERN PUBLIC SERVICE CO.STATEMENTS OF CASH FLOWS
(amounts in thousands of dollars)
Year Ended Dec. 312014 2013 2012
Operating activitiesNet income $ 129,852 $ 95,177 $ 106,369Adjustments to reconcile net income to cash provided by operating activities:
Depreciation and amortization 137,947 124,069 115,917Demand side management program amortization 1,673 1,673 1,811Deferred income taxes 123,517 36,475 54,119Amortization of investment tax credits (341) (341) (327)Allowance for equity funds used during construction (12,118) (10,186) (7,272)Provision for bad debts 4,137 3,437 2,915Gain on sale of transmission assets — (13,661) —Net derivative losses 268 268 269Changes in operating assets and liabilities:
Accounts receivable 9,045 (36,184) (3,429)Accrued unbilled revenues (20,080) (10,315) 5,250Inventories (6,093) (7,443) 4,238Prepayments and other (11,905) 4,456 (3,901)Accounts payable 11,428 20,650 (13,730)Net regulatory assets and liabilities (973) 620 24,243Other current liabilities 12,665 51,880 1,780Pension and other employee benefit obligations (2,246) (17,968) (13,706)
Change in other noncurrent assets 2,836 (2,281) (1,541)Change in other noncurrent liabilities 7,166 (2,689) (1,912)
Net cash provided by operating activities 386,778 237,637 271,093
Investing activitiesUtility capital/construction expenditures (554,936) (584,736) (384,626)Allowance for equity funds used during construction 12,118 10,186 7,272Proceeds from sale of transmission assets — 37,118 —Investments in utility money pool arrangement (105,000) (12,000) (217,000)Receipts from utility money pool arrangement 105,000 12,000 217,000Other, net — — —
Net cash used in investing activities (542,818) (537,432) (377,354)
Financing activities(Repayment of) proceeds from short-term borrowings, net (47,000) 75,000 9,000Proceeds from issuance of long-term debt 148,123 94,626 108,678Borrowings under utility money pool arrangement 458,000 767,000 265,000Repayments under utility money pool arrangement (480,000) (729,000) (270,000)Capital contributions from parent 160,000 162,277 60,024Dividends paid to parent (83,498) (69,579) (66,609)
Net cash provided by financing activities 155,625 300,324 106,093
Net change in cash and cash equivalents (415) 529 (168)Cash and cash equivalents at beginning of year 1,011 482 650Cash and cash equivalents at end of year $ 596 $ 1,011 $ 482
Supplemental disclosure of cash flow information:Cash paid for interest (net of amounts capitalized) $ (70,748) $ (67,209) $ (61,268)Cash received (paid) for income taxes, net 42,679 (16,721) (13,763)
Supplemental disclosure of non-cash investing transactions:Property, plant and equipment additions in accounts payable $ 33,164 $ 23,305 $ 38,751
See Notes to Financial Statements
Table of Contents
Schedule Q-4 Page 31 of 187
Sponsor: Robinson Case No. 15-00139-UT

32
SOUTHWESTERN PUBLIC SERVICE CO.BALANCE SHEETS
(amounts in thousands, except share and per share data)
Dec. 312014 2013
AssetsCurrent assets
Cash and cash equivalents $ 596 $ 1,011Accounts receivable, net 71,626 70,951Accounts receivable from affiliates 1,983 15,840Accrued unbilled revenues 129,287 109,207Inventories 43,231 37,138Regulatory assets 52,006 27,595Derivative instruments 23,776 17,826Deferred income taxes 51,854 85,362Prepayments and other 31,476 19,571
Total current assets 405,835 384,501
Property, plant and equipment, net 3,743,141 3,284,030
Other assetsRegulatory assets 323,305 290,415Derivative instruments 33,164 41,056Other 15,859 17,068
Total other assets 372,328 348,539Total assets $ 4,521,304 $ 4,017,070
Liabilities and EquityCurrent liabilities
Short-term debt $ 37,000 $ 84,000Borrowings under utility money pool arrangement 16,000 38,000Accounts payable 160,762 143,879Accounts payable to affiliates 19,790 15,387Regulatory liabilities 87,723 83,759Taxes accrued 27,208 23,584Accrued interest 17,057 16,883Dividends payable 27,828 18,082Derivative instruments 3,565 3,583Other 80,211 75,355
Total current liabilities 477,144 502,512
Deferred credits and other liabilitiesDeferred income taxes 849,145 757,778Regulatory liabilities 115,188 81,504Asset retirement obligations 26,031 19,375Derivative instruments 30,643 34,207Pension and employee benefit obligations 103,670 55,087Other 9,320 3,051
Total deferred credits and other liabilities 1,133,997 951,002
Commitments and contingenciesCapitalization
Long-term debt 1,349,691 1,199,865Common stock — 200 shares authorized of $1.00 par value; 100 shares outstanding at
Dec. 31, 2014 and 2013, respectively — —Additional paid in capital 1,165,463 1,005,463Retained earnings 395,998 359,389Accumulated other comprehensive loss (989) (1,161)
Total common stockholder’s equity 1,560,472 1,363,691Total liabilities and equity $ 4,521,304 $ 4,017,070
See Notes to Financial Statements
Table of Contents
Schedule Q-4 Page 32 of 187
Sponsor: Robinson Case No. 15-00139-UT

33
SOUTHWESTERN PUBLIC SERVICE CO.STATEMENTS OF COMMON STOCKHOLDER’S EQUITY
(amounts in thousands of dollars, except share data)
Common Stock Issued AccumulatedOther
ComprehensiveIncome (Loss)
TotalCommon
Stockholder’sEquityShares Par Value
AdditionalPaid InCapital
RetainedEarnings
Balance at Dec. 31, 2011 100 $ — $ 783,162 $ 295,201 $ (1,504) $ 1,076,859Net income 106,369 106,369Other comprehensive income 172 172Common dividends declared to parent (66,469) (66,469)Contribution of capital by parent 60,024 60,024Balance at Dec. 31, 2012 100 $ — $ 843,186 $ 335,101 $ (1,332) $ 1,176,955Net income 95,177 95,177Other comprehensive income 171 171Common dividends declared to parent (70,889) (70,889)Contribution of capital by parent 162,277 162,277Balance at Dec. 31, 2013 100 $ — $ 1,005,463 $ 359,389 $ (1,161) $ 1,363,691Net income 129,852 129,852Other comprehensive income 172 172Common dividends declared to parent (93,243) (93,243)Contribution of capital by parent 160,000 160,000Balance at Dec. 31, 2014 100 $ — $ 1,165,463 $ 395,998 $ (989) $ 1,560,472
See Notes to Financial Statements
Table of Contents
Schedule Q-4 Page 33 of 187
Sponsor: Robinson Case No. 15-00139-UT

34
SOUTHWESTERN PUBLIC SERVICE CO.STATEMENTS OF CAPITALIZATION
(amounts in thousands of dollars, except share data)
Dec. 312014 2013
Long-Term DebtFirst Mortgage Bonds, Series due: June 15, 2024, 3.3% $ 150,000 $ — Aug. 15, 2041, 4.5% 400,000 400,000Unsecured Senior E Notes, due Oct. 1, 2016, 5.6% 200,000 200,000Unsecured Senior G Notes, due Dec. 1, 2018, 8.75% 250,000 250,000Unsecured Senior C and D Notes, due Oct. 1, 2033, 6% 100,000 100,000Unsecured Senior F Notes, due Oct. 1, 2036, 6% 250,000 250,000Unamortized (discount) premium (309) (135)
Total 1,349,691 1,199,865Less current maturities — —
Total long-term debt $ 1,349,691 $ 1,199,865
Common Stockholder’s EquityCommon stock — 200 shares authorized of $1.00 par value,
100 shares outstanding at Dec. 31, 2014 and 2013, respectively $ — $ —Additional paid in capital 1,165,463 1,005,463Retained earnings 395,998 359,389Accumulated other comprehensive loss (989) (1,161)
Total common stockholder’s equity $ 1,560,472 $ 1,363,691
See Notes to Financial Statements
Table of Contents
Schedule Q-4 Page 34 of 187
Sponsor: Robinson Case No. 15-00139-UT

35
NOTES TO FINANCIAL STATEMENTS
1. Summary of Significant Accounting Policies
Business and System of Accounts — SPS is engaged in the regulated generation, purchase, transmission, distribution and sale of electricity. SPS’ financial statements and disclosures are presented in accordance with GAAP. All of SPS’ underlying accounting records also conform to the FERC uniform system of accounts or to systems required by various state regulatory commissions, which are the same in all material respects.
Variable Interest Entities — SPS evaluates its arrangements and contracts with other entities, including but not limited to, PPAs and fuel contracts to determine if the other party is a variable interest entity, if SPS has a variable interest and if SPS is the primary beneficiary. SPS follows accounting guidance for variable interest entities which requires consideration of the activities that most significantly impact an entity’s financial performance and power to direct those activities, when determining whether SPS is a variable interest entity’s primary beneficiary. See Note 11 for further discussion of variable interest entities.
Use of Estimates — In recording transactions and balances resulting from business operations, SPS uses estimates based on the best information available. Estimates are used for such items as plant depreciable lives or potential disallowances, AROs, certain regulatory assets and liabilities, tax provisions, uncollectible amounts, environmental costs, unbilled revenues, jurisdictional fuel and energy cost allocations and actuarially determined benefit costs. The recorded estimates are revised when better information becomes available or when actual amounts can be determined. Those revisions can affect operating results.
Regulatory Accounting — SPS accounts for certain income and expense items in accordance with accounting guidance for regulated operations. Under this guidance:
• Certain costs, which would otherwise be charged to expense or OCI, are deferred as regulatory assets based on the expected ability to recover the costs in future rates; and
• Certain credits, which would otherwise be reflected as income, are deferred as regulatory liabilities based on the expectation the amounts will be returned to customers in future rates, or because the amounts were collected in rates prior to the costs being incurred.
Estimates of recovering deferred costs and returning deferred credits are based on specific ratemaking decisions or precedent for each item. Regulatory assets and liabilities are amortized consistent with the treatment in the rate setting process.
If restructuring or other changes in the regulatory environment occur, SPS may no longer be eligible to apply this accounting treatment, and may be required to eliminate regulatory assets and liabilities from its balance sheet. Such changes could have a material effect on SPS’ financial condition, results of operations and cash flows. See Note 12 for further discussion of regulatory assets and liabilities.
Revenue Recognition — Revenues related to the sale of energy are generally recorded when service is rendered or energy is delivered to customers. However, the determination of the energy sales to individual customers is based on the reading of their meter, which occurs on a systematic basis throughout the month. At the end of each month, amounts of energy delivered to customers since the date of the last meter reading are estimated and the corresponding unbilled revenue is recognized. SPS presents its revenues net of any excise or other fiduciary-type taxes or fees.
SPS participates in SPP. The revenues and charges from SPP related to serving retail and wholesale electric customers comprising the native load of SPS are recorded on a net basis within cost of sales. Revenues and charges for short-term wholesale sales of excess energy transacted through SPP are recorded on a gross basis in electric revenues and cost of sales.
SPS has various rate-adjustment mechanisms in place that provide for the recovery of electric fuel costs and purchased energy costs. These cost-adjustment tariffs may increase or decrease the level of revenue collected from customers and are revised periodically for differences between the total amount collected under the clauses and the costs incurred. When applicable, under governing regulatory commission rate orders, fuel cost over-recoveries (the excess of fuel revenue billed to customers over fuel costs incurred) are deferred as regulatory liabilities and under-recoveries (the excess of fuel costs incurred over fuel revenues billed to customers) are deferred as regulatory assets.
Table of Contents
Schedule Q-4 Page 35 of 187
Sponsor: Robinson Case No. 15-00139-UT

36
Conservation Programs — SPS has implemented programs in its jurisdictions to assist customers in conserving energy and reducing peak demand on the electric system. These programs include commercial motor, air conditioner and lighting upgrades, as well as residential rebates for participation in air conditioner interruption and home weatherization.
The costs incurred for some DSM programs are deferred as permitted by the applicable regulatory jurisdiction. For those programs, costs are deferred if it is probable future revenue will be provided to permit recovery of the incurred cost. Recorded revenues for incentive programs designed for recovery of lost margins and/or conservation performance incentives are limited to amounts expected to be collected within 24 months from the annual period in which they are earned. SPS recovers approved conservation program costs in base rate revenue or through a rider.
Property, Plant and Equipment and Depreciation — Property, plant and equipment is stated at original cost. The cost of plant includes direct labor and materials, contracted work, overhead costs and AFUDC. The cost of plant retired is charged to accumulated depreciation and amortization. Amounts recovered in rates for future removal costs are recorded as regulatory liabilities. Significant additions or improvements extending asset lives are capitalized, while repairs and maintenance costs are charged to expense as incurred. Maintenance and replacement of items determined to be less than a unit of property are charged to operating expenses as incurred. Planned major maintenance activities are charged to operating expense unless the cost represents the acquisition of an additional unit of property or the replacement of an existing unit of property. Property, plant and equipment also includes costs associated with property held for future use. The depreciable lives of certain plant assets are reviewed annually and revised, if appropriate. Property, plant and equipment that is required to be decommissioned early by a regulator is reclassified as plant to be retired.
Property, plant and equipment is tested for impairment when it is determined that the carrying value of the assets may not be recoverable. A loss is recognized in the current period if it becomes probable that part of a cost of a plant under construction or recently completed plant will be disallowed for recovery from customers and a reasonable estimate of the disallowance can be made. For investments in property, plant and equipment that are abandoned and not expected to go into service, incurred costs and related deferred tax amounts are compared to the discounted estimated future rate recovery, and a loss is recognized, if necessary.
SPS records depreciation expense related to its plant using the straight-line method over the plant’s useful life. Actuarial life studies are performed and submitted to the state and federal commissions for review. Upon acceptance by the various commissions, the resulting lives and net salvage rates are used to calculate depreciation. Depreciation expense, expressed as a percentage of average depreciable property, was 2.5, 2.6 and 2.7 percent for the years ended Dec. 31, 2014, 2013 and 2012, respectively.
Leases — SPS evaluates a variety of contracts for lease classification at inception, including PPAs and rental arrangements for office space, vehicles, and equipment. Contracts determined to contain a lease because of per unit pricing that is other than fixed or market price, terms regarding the use of a particular asset, and other factors are evaluated further to determine if the arrangement is a capital lease. See Note 11 for further discussion of leases.
AFUDC — AFUDC represents the cost of capital used to finance utility construction activity. AFUDC is computed by applying a composite financing rate to qualified CWIP. The amount of AFUDC capitalized as a utility construction cost is credited to other nonoperating income (for equity capital) and interest charges (for debt capital). AFUDC amounts capitalized are included in SPS’ rate base for establishing utility service rates.
AROs — SPS accounts for AROs under accounting guidance that requires a liability for the fair value of an ARO to be recognized in the period in which it is incurred if it can be reasonably estimated, with the offsetting associated asset retirement costs capitalized as a long-lived asset. The liability is generally increased over time by applying the effective interest method of accretion, and the capitalized costs are depreciated over the useful life of the long-lived asset. Changes resulting from revisions to the timing or amount of expected asset retirement cash flows are recognized as an increase or a decrease in the ARO. SPS also recovers through rates certain future plant removal costs in addition to AROs. The accumulated removal costs for these obligations are reflected in the balance sheets as a regulatory liability. See Note 11 for further discussion of AROs.
Income Taxes — SPS accounts for income taxes using the asset and liability method, which requires the recognition of deferred tax assets and liabilities for the expected future tax consequences of events that have been included in the financial statements. SPS defers income taxes for all temporary differences between pretax financial and taxable income, and between the book and tax bases of assets and liabilities. SPS uses the tax rates that are scheduled to be in effect when the temporary differences are expected to reverse. The effect of a change in tax rates on deferred tax assets and liabilities is recognized in income in the period that includes the enactment date.
Table of Contents
Schedule Q-4 Page 36 of 187
Sponsor: Robinson Case No. 15-00139-UT

37
Deferred tax assets are reduced by a valuation allowance if it is more likely than not that some portion or all of the deferred tax asset will not be realized. In making such a determination, all available evidence is considered, including scheduled reversals of deferred tax liabilities, projected future taxable income, tax planning strategies and recent financial operations.
Due to the effects of past regulatory practices, when deferred taxes were not required to be recorded due to the use of flow through accounting for rate making purposes, the reversal of some temporary differences are accounted for as current income tax expense. Investment tax credits are deferred and their benefits amortized over the book depreciable lives of the related property. Utility rate regulation also has resulted in the recognition of certain regulatory assets and liabilities related to income taxes, which are summarized in Note 12.
SPS follows the applicable accounting guidance to measure and disclose uncertain tax positions that it has taken or expects to take in its income tax returns. SPS recognizes a tax position in its financial statements when it is more likely than not that the position will be sustained upon examination based on the technical merits of the position. Recognition of changes in uncertain tax positions are reflected as a component of income tax.
SPS reports interest and penalties related to income taxes within the other income and interest charges sections in the statements of income.
Xcel Energy Inc. and its subsidiaries, including SPS, file consolidated federal income tax returns as well as combined or separate state income tax returns. Federal income taxes paid by Xcel Energy Inc. are allocated to Xcel Energy Inc.’s subsidiaries based on separate company computations of tax. A similar allocation is made for state income taxes paid by Xcel Energy Inc. in connection with combined state filings. Xcel Energy Inc. also allocates its own income tax benefits to its direct subsidiaries which are recorded directly in equity by the subsidiaries based on the relative positive tax liabilities of the subsidiaries.
See Note 6 for further discussion of income taxes.
Types of and Accounting for Derivative Instruments — SPS uses derivative instruments in connection with its utility commodity price and interest rate activities, including forward contracts, futures, swaps and options. All derivative instruments not designated and qualifying for the normal purchases and normal sales exception, as defined by the accounting guidance for derivatives and hedging, are recorded on the balance sheets at fair value as derivative instruments. This includes certain instruments used to mitigate market risk for the utility operations including transmission in organized markets. The classification of changes in fair value for those derivative instruments is dependent on the designation of a qualifying hedging relationship. Changes in fair value of derivative instruments not designated in a qualifying hedging relationship are reflected in current earnings or as a regulatory asset or liability. The classification as a regulatory asset or liability is based on expected recovery of derivative instrument settlements through fuel and purchased energy cost recovery mechanisms.
Interest rate hedging transactions are recorded as a component of interest expense. For further information on derivatives entered to mitigate market risk associated with transmission in organized markets, see Note 9.
Cash Flow Hedges — Certain qualifying hedging relationships are designated as a hedge of a forecasted transaction or future cash flow (cash flow hedge). Changes in the fair value of a derivative designated as a cash flow hedge, to the extent effective, are included in OCI, or deferred as a regulatory asset or liability based on recovery mechanisms until earnings are affected by the hedged transaction.
Normal Purchases and Normal Sales — SPS enters into contracts for the purchase and sale of commodities for use in its business operations. Derivatives and hedging accounting guidance requires a company to evaluate these contracts to determine whether the contracts are derivatives. Certain contracts that meet the definition of a derivative may be exempted from derivative accounting if designated as normal purchases or normal sales.
SPS evaluates all of its contracts at inception to determine if they are derivatives and if they meet the normal purchases and normal sales designation requirements. None of the contracts entered into within the commodity trading operations qualify for a normal purchases and normal sales designation.
See Note 9 for further discussion of SPS’ risk management and derivative activities.
Table of Contents
Schedule Q-4 Page 37 of 187
Sponsor: Robinson Case No. 15-00139-UT

38
Fair Value Measurements — SPS presents cash equivalents, interest rate derivatives and commodity derivatives at estimated fair values in its financial statements. Cash equivalents are recorded at cost plus accrued interest; money market funds are measured using quoted net asset values. For interest rate derivatives, quoted prices based primarily on observable market interest rate curves are used as a primary input to establish fair value. For commodity derivatives, the most observable inputs available are generally used to determine the fair value of each contract. In the absence of a quoted price for an identical contract in an active market, SPS may use quoted prices for similar contracts or internally prepared valuation models to determine fair value. See Note 9 for further discussion.
Cash and Cash Equivalents — SPS considers investments in certain instruments, including commercial paper and money market funds, with a remaining maturity of three months or less at the time of purchase, to be cash equivalents.
Accounts Receivable and Allowance for Bad Debts — Accounts receivable are stated at the actual billed amount net of an allowance for bad debts. SPS establishes an allowance for uncollectible receivables based on a policy that reflects its expected exposure to the credit risk of customers.
Inventory — All inventory is recorded at average cost.
RECs — RECs are marketable environmental instruments that represent proof that energy was generated from eligible renewable energy sources. RECs are awarded upon delivery of the associated energy and can be bought and sold. RECs are typically used as a form of measurement of compliance to RPS enacted by those states that are encouraging construction and consumption from renewable energy sources, but can also be sold separately from the energy produced. SPS acquires RECs from the generation or purchase of renewable power.
When RECs are purchased or acquired in the course of generation they are recorded as inventory at cost. The cost of RECs that are utilized for compliance purposes is recorded as electric fuel and purchased power expense. As a result of certain state regulatory orders, SPS reduces recoverable fuel costs for the cost of certain RECs and records that cost as a regulatory asset when the amount is recoverable in future rates. Sales of RECs that are purchased or acquired in the course of generation are recorded in electric utility operating revenues on a gross basis. The cost of these RECs, related transaction costs, and amounts credited to customers under margin-sharing mechanisms are recorded in electric fuel and purchased power expense.
Emission Allowances — Emission allowances, including the annual SO2 and NOx emission allowance entitlement received from the EPA, are recorded at cost plus associated broker commission fees. SPS follows the inventory accounting model for all emission allowances. Sales of emission allowances are included in electric utility operating revenues and the operating activities section of the statements of cash flows.
Environmental Costs — Environmental costs are recorded when it is probable SPS is liable for remediation costs and the liability can be reasonably estimated. Costs are deferred as a regulatory asset if it is probable that the costs will be recovered from customers in future rates. Otherwise, the costs are expensed. If an environmental expense is related to facilities currently in use, such as emission-control equipment, the cost is capitalized and depreciated over the life of the plant.
Estimated remediation costs, excluding inflationary increases, are recorded. The estimates are based on experience, an assessment of the current situation and the technology currently available for use in the remediation. The recorded costs are regularly adjusted as estimates are revised and remediation proceeds. If other participating PRPs exist and acknowledge their potential involvement with a site, costs are estimated and recorded only for SPS’ expected share of the cost. Any future costs of restoring sites where operation may extend indefinitely are treated as a capitalized cost of plant retirement. The depreciation expense levels recoverable in rates include a provision for removal expenses, which may include final remediation costs. Removal costs recovered in rates before the related costs are incurred are classified as a regulatory liability.
See Note 11 for further discussion of environmental costs.
Benefit Plans and Other Postretirement Benefits — SPS maintains pension and postretirement benefit plans for eligible employees. Recognizing the cost of providing benefits and measuring the projected benefit obligation of these plans under applicable accounting guidance requires management to make various assumptions and estimates.
Based on regulatory recovery mechanisms, certain unrecognized actuarial gains and losses and unrecognized prior service costs or credits are recorded as regulatory assets and liabilities, rather than OCI.
Table of Contents
Schedule Q-4 Page 38 of 187
Sponsor: Robinson Case No. 15-00139-UT

39
See Note 7 for further discussion of benefit plans and other postretirement benefits.
Guarantees — SPS recognizes, upon issuance or modification of a guarantee, a liability for the fair market value of the obligation that has been assumed in issuing the guarantee. This liability includes consideration of specific triggering events and other conditions which may modify the ongoing obligation to perform under the guarantee.
The obligation recognized is reduced over the term of the guarantee as SPS is released from risk under the guarantee. See Note 11 for specific details of issued guarantees.
Segment Information — SPS has only one reportable segment. SPS is a wholly owned subsidiary of Xcel Energy Inc. and operates in the regulated electric utility industry providing wholesale and retail electric service in the states of Texas and New Mexico. Operating results from the regulated electric utility segment serve as the primary basis for the chief operating decision maker to evaluate the performance of SPS.
Subsequent Events — Management has evaluated the impact of events occurring after Dec. 31, 2014 up to the date of issuance of these financial statements. These statements contain all necessary adjustments and disclosures resulting from that evaluation.
2. Accounting Pronouncements
Recently Issued
Revenue Recognition — In May 2014, the FASB issued Revenue from Contracts with Customers, Topic 606 (ASU No. 2014-09), which provides a framework for the recognition of revenue, with the objective that recognized revenues properly reflect amounts an entity is entitled to receive in exchange for goods and services. This guidance, which includes additional disclosure requirements regarding revenue, cash flows and obligations related to contracts with customers, will be effective for interim and annual reporting periods beginning after Dec. 15, 2016. SPS is currently evaluating the impact of adopting ASU 2014-09 on its financial statements.
3. Selected Balance Sheet Data
(Thousands of Dollars) Dec. 31, 2014 Dec. 31, 2013
Accounts receivable, netAccounts receivable $ 77,465 $ 76,426Less allowance for bad debts (5,839) (5,475)
$ 71,626 $ 70,951
(Thousands of Dollars) Dec. 31, 2014 Dec. 31, 2013
InventoriesMaterials and supplies $ 24,738 $ 21,600Fuel 18,493 15,538
$ 43,231 $ 37,138
(Thousands of Dollars) Dec. 31, 2014 Dec. 31, 2013
Property, plant and equipment, netElectric plant $ 5,376,606 $ 4,714,398Construction work in progress 238,519 388,323
Total property, plant and equipment 5,615,125 5,102,721Less accumulated depreciation (1,871,984) (1,818,691)
$ 3,743,141 $ 3,284,030
Table of Contents
Schedule Q-4 Page 39 of 187
Sponsor: Robinson Case No. 15-00139-UT

40
4. Borrowings and Other Financing Instruments
Short-Term Borrowings
Money Pool — Xcel Energy Inc. and its utility subsidiaries have established a money pool arrangement that allows for short-term investments in and borrowings between the utility subsidiaries. Xcel Energy Inc. may make investments in the utility subsidiaries at market-based interest rates; however, the money pool arrangement does not allow the utility subsidiaries to make investments in Xcel Energy Inc. Money pool borrowings for SPS were as follows:
(Amounts in Millions, Except Interest Rates)Three Months Ended
Dec. 31, 2014
Borrowing limit $ 100Amount outstanding at period end 16Average amount outstanding —Maximum amount outstanding 16Weighted average interest rate, computed on a daily basis 0.35%Weighted average interest rate at period end 0.45
(Amounts in Millions, Except Interest Rates)Twelve Months
Ended Dec. 31, 2014Twelve Months
Ended Dec. 31, 2013Twelve Months
Ended Dec. 31, 2012
Borrowing limit $ 100 $ 100 $ 100Amount outstanding at period end 16 38 —Average amount outstanding 9 46 10Maximum amount outstanding 100 100 63Weighted average interest rate, computed on a daily basis 0.22% 0.29% 0.33%Weighted average interest rate at end of period 0.45 0.25 N/A
Commercial Paper — SPS meets its short-term liquidity requirements primarily through the issuance of commercial paper and borrowings under its credit facility. Commercial paper outstanding for SPS was as follows:
(Amounts in Millions, Except Interest Rates)Three Months Ended
Dec. 31, 2014
Borrowing limit $ 400Amount outstanding at period end 37Average amount outstanding 22Maximum amount outstanding 54Weighted average interest rate, computed on a daily basis 0.31%Weighted average interest rate at period end 0.47
(Amounts in Millions, Except Interest Rates)Twelve Months
Ended Dec. 31, 2014Twelve Months
Ended Dec. 31, 2013Twelve Months
Ended Dec. 31, 2012
Borrowing limit $ 400 $ 300 $ 300Amount outstanding at period end 37 84 9Average amount outstanding 83 32 18Maximum amount outstanding 241 140 106Weighted average interest rate, computed on a daily basis 0.26% 0.30% 0.39%Weighted average interest rate at end of period 0.47 0.27 0.36
Letters of Credit — SPS may use letters of credit, generally with terms of one-year, to provide financial guarantees for certain operating obligations. At Dec. 31, 2014, there were $30.0 million of letters of credit outstanding under the credit facility. At Dec. 31, 2013, there were $25.5 million letters of credit outstanding under the credit facility. The contract amounts of these letters of credit approximate their fair value and are subject to fees.
Table of Contents
Schedule Q-4 Page 40 of 187
Sponsor: Robinson Case No. 15-00139-UT

41
Credit Facility — In order to use its commercial paper program to fulfill short-term funding needs, SPS must have a revolving credit facility in place at least equal to the amount of its commercial paper borrowing limit and cannot issue commercial paper in an aggregate amount exceeding available capacity under this credit facility. The line of credit provides short-term financing in the form of notes payable to banks, letters of credit and back-up support for commercial paper borrowings.
Amended Credit Agreement — In October 2014, SPS entered into an amended five-year credit agreement with a syndicate of banks. The amended credit agreement has substantially the same terms and conditions as the prior credit agreement with an increased borrowing limit and an extension of maturity from July 2017 to October 2019. The borrowing limit for SPS has been increased to $400 million from $300 million.
SPS has the right to request an extension of the revolving termination date for two additional one-year periods. All extension requests are subject to majority bank group approval.
Other features of SPS’ credit facility include:
• The credit facility may be increased by up to $50 million.• The credit facility has a financial covenant requiring that SPS’ debt-to-total capitalization ratio be less than or equal to 65
percent. SPS was in compliance as its debt-to-total capitalization ratio was 47 percent and 49 percent at Dec. 31, 2014 and 2013, respectively. If SPS does not comply with the covenant, an event of default may be declared, and if not remedied, any outstanding amounts due under the facility can be declared due by the lender.
• The credit facility has a cross-default provision that provides SPS will be in default on its borrowings under the facility if SPS or any of its future significant subsidiaries whose total assets exceed 15 percent of SPS’ total assets, default on certain indebtedness in an aggregate principal amount exceeding $75 million.
• The interest rates under the line of credit are based on Eurodollar borrowing margins ranging from 87.5 to 175 basis points per year based on the applicable long-term credit ratings.
• The commitment fees, also based on applicable long-term credit ratings, are calculated on the unused portion of the lines of credit at a range of 7.5 to 27.5 basis points per year.
At Dec. 31, 2014, SPS had the following committed credit facility available (in millions):
Credit Facility (a) Drawn (b) Available
$ 400.0 $ 67.0 $ 333.0
(a) These credit facilities have been amended to extend the maturity to October 2019.(b) Includes outstanding commercial paper and letters of credit.
All credit facility bank borrowings, outstanding letters of credit and outstanding commercial paper reduce the available capacity under the credit facility. SPS had no direct advances on the credit facility outstanding at Dec. 31, 2014 and 2013.
Long-Term Borrowings and Other Financing Instruments
Generally, all real and personal property of SPS is subject to the lien of its first mortgage indenture. Debt premiums, discounts and expenses are amortized over the life of the related debt. The premiums, discounts and expenses associated with refinanced debt are deferred and amortized over the life of the related new issuance, in accordance with regulatory guidelines.
In June 2014, SPS issued $150 million of 3.30 percent first mortgage bonds due June 15, 2024. In August 2013, SPS issued $100 million of 4.50 percent first mortgage bonds due Aug. 15, 2041. Including the $300 million of this series previously issued, total principal outstanding for this series is $400 million.
In connection with SPS’ issuance of $150 million of 3.30 percent first mortgage bonds due June 15, 2024, SPS concurrently took certain actions to secure its previously issued Series G Senior Notes due Dec. 1, 2018 equally and ratably with SPS’ first mortgage bonds as required pursuant to the terms of the Series G notes.
To provide the required collateralization, SPS issued $250 million of collateral 8.75 percent first mortgage bonds due Dec. 1, 2018 to the trustee under its senior unsecured indenture which secured the previously issued Series G Senior Notes, 8.75 percent due Dec. 1, 2018, equally and ratably with SPS’ first mortgage bonds.
Table of Contents
Schedule Q-4 Page 41 of 187
Sponsor: Robinson Case No. 15-00139-UT

42
During the next five years, SPS has long-term debt maturities of $200 million and $250 million due in 2016 and 2018, respectively.
Deferred Financing Costs — Other assets included deferred financing costs of approximately $10.9 million and $10.3 million, net of amortization, at Dec. 31, 2014 and 2013, respectively. SPS is amortizing these financing costs over the remaining maturity periods of the related debt.
Dividend Restrictions — SPS’ dividends are subject to the FERC’s jurisdiction under the Federal Power Act, which prohibits the payment of dividends out of capital accounts; payment of dividends is allowed out of retained earnings only.
The most restrictive dividend limitation for SPS is imposed by its state regulatory commissions. SPS’ state regulatory commissions indirectly limit the amount of dividends that SPS can pay Xcel Energy Inc. by requiring an equity-to-total capitalization ratio (excluding short-term debt) between 45.0 percent and 55.0 percent. In addition, SPS may not pay a dividend that would cause it to lose its investment grade bond rating. SPS’ equity-to-total capitalization ratio (excluding short-term debt) was 53.6 percent at Dec. 31, 2014 and $396 million in retained earnings was not restricted.
5. Preferred Stock
SPS has authorized the issuance of preferred stock.
PreferredShares
Authorized Par Value
PreferredShares
Outstanding
10,000,000 $ 1.00 None
6. Income Taxes
Tax Increase Prevention Act of 2014 — In 2014, the Tax Increase Prevention Act (TIPA) was signed into law. The TIPA provides for the following:
• The R&E credit was extended for 2014;• PTCs were extended for projects that began construction before the end of 2014 with certain projects qualifying into future
years; and• 50 percent bonus depreciation was extended one year through 2014. Additionally, some longer production period property
placed in service in 2015 is also eligible for 50 percent bonus depreciation.
The accounting related to the TIPA was recorded beginning in the fourth quarter of 2014 because a change in tax law is accounted for in the period of enactment.
American Taxpayer Relief Act of 2012 — In 2013, the American Taxpayer Relief Act (ATRA) was signed into law. The ATRA provided for the following:
• The top tax rate for dividends increased from 15 percent to 20 percent. The 20 percent dividend rate is now consistent with the tax rates for capital gains;
• The R&E credit was extended for 2012 and 2013;• PTCs were extended for projects that began construction before the end of 2013 with certain projects qualifying into future
years; and• 50 percent bonus depreciation was extended one year through 2013. Additionally, some longer production period property
placed in service in 2014 is also eligible for 50 percent bonus depreciation.
The accounting related to the ATRA, including the provisions related to 2012, was recorded beginning in the first quarter of 2013 because a change in tax law is accounted for in the period of enactment.
Table of Contents
Schedule Q-4 Page 42 of 187
Sponsor: Robinson Case No. 15-00139-UT

43
Federal Audit — SPS is a member of the Xcel Energy affiliated group that files a consolidated federal income tax return. The statute of limitations applicable to Xcel Energy’s 2008 federal income tax return expired in September 2012. The statute of limitations applicable to Xcel Energy’s 2009 federal income tax return expires in March 2016. In the third quarter of 2012, the IRS commenced an examination of tax years 2010 and 2011, including the 2009 carryback claim. As of Dec. 31, 2014, the IRS had proposed an adjustment to the federal tax loss carryback claims that would result in $12 million of income tax expense for the 2009 through 2011 claims, the recently filed 2013 claim, and the anticipated claim for 2014. SPS is not expected to accrue any income tax expense related to this adjustment. At Dec. 31, 2014, the IRS has begun the Appeals process; however, the outcome and timing of a resolution are uncertain.
State Audits — SPS is a member of the Xcel Energy affiliated group that files consolidated state income tax returns. As of Dec. 31, 2014, SPS’ earliest open tax year that is subject to examination by state taxing authorities under applicable statutes of limitations is 2009. There are currently no state income tax audits in progress.
Unrecognized Tax Benefits — The unrecognized tax benefit balance includes permanent tax positions, which if recognized would affect the annual ETR. In addition, the unrecognized tax benefit balance includes temporary tax positions for which the ultimate deductibility is highly certain but for which there is uncertainty about the timing of such deductibility. A change in the period of deductibility would not affect the ETR but would accelerate the payment of cash to the taxing authority to an earlier period.
A reconciliation of the amount of unrecognized tax benefit is as follows:
(Millions of Dollars) Dec. 31, 2014 Dec. 31, 2013
Unrecognized tax benefit — Permanent tax positions $ 1.5 $ 1.2Unrecognized tax benefit — Temporary tax positions 11.7 2.9
Total unrecognized tax benefit $ 13.2 $ 4.1
A reconciliation of the beginning and ending amount of unrecognized tax benefit is as follows:
(Millions of Dollars) 2014 2013 2012
Balance at Jan. 1 $ 4.1 $ 3.9 $ 4.8Additions based on tax positions related to the current year 8.6 1.6 1.1Reductions based on tax positions related to the current year — — (1.6)Additions for tax positions of prior years 2.3 3.1 0.8Reductions for tax positions of prior years (0.3) (0.3) (1.2)Settlements with taxing authorities (0.2) (4.2) —Lapse of applicable statutes of limitations (1.3) — —Balance at Dec. 31 $ 13.2 $ 4.1 $ 3.9
The unrecognized tax benefit amounts were reduced by the tax benefits associated with NOL and tax credit carryforwards. The amounts of tax benefits associated with NOL and tax credit carryforwards are as follows:
(Millions of Dollars) Dec. 31, 2014 Dec. 31, 2013
NOL and tax credit carryforwards $ (4.8) $ (2.4)
It is reasonably possible that SPS’ amount of unrecognized tax benefits could significantly change in the next 12 months as the IRS Appeals process progresses and state audits resume. As the IRS Appeals process moves closer to completion and state audits resume, it is reasonably possible that the amount of unrecognized tax benefit could decrease up to approximately $2 million.
The payable for interest related to unrecognized tax benefits is partially offset by the interest benefit associated with NOL and tax credit carryforwards. The payables for interest related to unrecognized tax benefits at Dec. 31, 2014, 2013 and 2012 were not material. No amounts were accrued for penalties related to unrecognized tax benefits as of Dec. 31, 2014, 2013 or 2012.
Table of Contents
Schedule Q-4 Page 43 of 187
Sponsor: Robinson Case No. 15-00139-UT

44
Other Income Tax Matters — NOL amounts represent the amount of the tax loss that is carried forward and tax credits represent the deferred tax asset. NOL and tax credit carryforwards as of Dec. 31 were as follows:
(Millions of Dollars) 2014 2013
Federal NOL carryforward $ 192.4 $ 168.7Federal tax credit carryforwards 2.1 1.7State NOL carryforwards 58.5 23.6
The federal carryforward periods expire between 2021 and 2034. The state carryforward periods expire between 2016 and 2034.
Total income tax expense from operations differs from the amount computed by applying the statutory federal income tax rate to income before income tax expense. The following reconciles such differences for the years ending Dec. 31:
2014 2013 2012
Federal statutory rate 35.0% 35.0% 35.0%Increases (decreases) in tax from:
State income taxes, net of federal income tax benefit 3.4 2.0 2.2Change in unrecognized tax benefits 0.2 0.7 —Regulatory differences — utility plant items (1.6) (1.1) (0.4)Tax credits recognized (0.4) (0.4) (0.2)Other, net 0.1 (0.1) 0.3
Effective income tax rate 36.7% 36.1% 36.9%
The components of income tax expense for the years ending Dec. 31 were:
(Thousands of Dollars) 2014 2013 2012
Current federal tax expense (benefit) $ (57,201) $ 14,947 $ 6,549Current state tax expense 2,512 2,943 2,712Current change in unrecognized tax benefit 6,715 (263) (824)Deferred federal tax expense 121,882 33,489 50,189Deferred state tax expense 8,025 1,754 3,069Deferred change in unrecognized tax (benefits) expense (6,390) 1,232 861Deferred investment tax credits (341) (341) (327)
Total income tax expense $ 75,202 $ 53,761 $ 62,229
The components of deferred income tax expense for the years ending Dec. 31 were:
(Thousands of Dollars) 2014 2013 2012
Deferred tax expense excluding items below $ 124,875 $ 38,333 $ 55,749Amortization and adjustments to deferred income taxes on income tax regulatory assets
and liabilities (1,262) (1,761) (1,533)Tax expense allocated to other comprehensive income (96) (97) (97)
Deferred tax expense $ 123,517 $ 36,475 $ 54,119
Table of Contents
Schedule Q-4 Page 44 of 187
Sponsor: Robinson Case No. 15-00139-UT

45
The components of the net deferred tax liability (current and noncurrent) at Dec. 31 were as follows:
(Thousands of Dollars) 2014 2013
Deferred tax liabilities:Differences between book and tax bases of property $ 842,847 $ 705,416Employee benefits 50,696 52,081Other 28,591 30,066
Total deferred tax liabilities $ 922,134 $ 787,563Deferred tax assets:
NOL carryforward $ 71,956 $ 61,330Rate refund 18,405 17,192Unbilled revenue - fuel costs 10,866 13,316Regulatory liabilities 10,794 9,724Deferred fuel costs 6,006 6,877Other 6,816 6,708
Total deferred tax assets $ 124,843 $ 115,147Net deferred tax liability $ 797,291 $ 672,416
7. Benefit Plans and Other Postretirement Benefits
Consistent with the process for rate recovery of pension and postretirement benefits for its employees, SPS accounts for its participation in, and related costs of, pension and other postretirement benefit plans sponsored by Xcel Energy Inc. as multiple employer plans. SPS is responsible for its share of cash contributions, plan costs and obligations and is entitled to its share of plan assets; accordingly, SPS accounts for its pro rata share of these plans, including pension expense and contributions, resulting in accounting consistent with that of a single employer plan exclusively for SPS employees.
Xcel Energy, which includes SPS, offers various benefit plans to its employees. Approximately 66 percent of employees that receive benefits are represented by several local labor unions under several collective-bargaining agreements. At Dec. 31, 2014, SPS had 840 bargaining employees covered under a collective-bargaining agreement, which expired in October 2014. While collective bargaining is ongoing, the terms and conditions of the expired agreement are automatically extended until the parties reach an agreement or a decision is rendered by an arbitrator.
The plans invest in various instruments which are disclosed under the accounting guidance for fair value measurements which establishes a hierarchical framework for disclosing the observability of the inputs utilized in measuring fair value. The three levels in the hierarchy and examples of each level are as follows:
Level 1 — Quoted prices are available in active markets for identical assets as of the reporting date. The types of assets included in Level 1 are highly liquid and actively traded instruments with quoted prices.
Level 2 — Pricing inputs are other than quoted prices in active markets, but are either directly or indirectly observable as of the reporting date. The types of assets included in Level 2 are typically either comparable to actively traded securities or contracts, or priced with models using highly observable inputs.
Level 3 — Significant inputs to pricing have little or no observability as of the reporting date. The types of assets included in Level 3 are those with inputs requiring significant management judgment or estimation.
Specific valuation methods include the following:
Cash equivalents — The fair values of cash equivalents are generally based on cost plus accrued interest; money market funds are measured using quoted net asset values.
Insurance contracts — Insurance contract fair values take into consideration the value of the investments in separate accounts of the insurer, which are priced based on observable inputs.
Table of Contents
Schedule Q-4 Page 45 of 187
Sponsor: Robinson Case No. 15-00139-UT
46
Investments in equity securities and other funds — Equity securities are valued using quoted prices in active markets. The fair values for commingled funds, private equity investments and real estate investments are measured using net asset values, which take into consideration the value of underlying fund investments, as well as the other accrued assets and liabilities of a fund, in order to determine a per share market value. The investments in commingled funds may be redeemed for net asset value with proper notice. Proper notice varies by fund and can range from daily with one or two days notice to annually with 90 days notice. Private equity investments require approval of the fund for any unscheduled redemption, and such redemptions may be approved or denied by the fund at its sole discretion. Unscheduled distributions from real estate investments may be redeemed with proper notice, which is typically quarterly with 45-90 days notice; however, withdrawals from real estate investments may be delayed or discounted as a result of fund illiquidity. Based on the plan’s evaluation of its ability to redeem private equity and real estate investments, fair value measurements for private equity and real estate investments have been assigned a Level 3.
Investments in debt securities — Fair values for debt securities are determined by a third party pricing service using recent trades and observable spreads from benchmark interest rates for similar securities.
Derivative Instruments — Fair values for foreign currency derivatives are determined using pricing models based on the prevailing forward exchange rate of the underlying currencies. The fair values of interest rate derivatives are based on broker quotes that utilize current market interest rate forecasts.
Pension Benefits
Xcel Energy, which includes SPS, has several noncontributory, defined benefit pension plans that cover almost all employees. Generally, benefits are based on a combination of years of service, the employee’s average pay and, in some cases, social security benefits. Xcel Energy Inc.’s and SPS’ policy is to fully fund into an external trust the actuarially determined pension costs recognized for ratemaking and financial reporting purposes, subject to the limitations of applicable employee benefit and tax laws.
In addition to the qualified pension plans, Xcel Energy maintains a supplemental executive retirement plan (SERP) and a nonqualified pension plan. The SERP is maintained for certain executives that were participants in the plan in 2008, when the SERP was closed to new participants. The nonqualified pension plan provides unfunded, nonqualified benefits for compensation that is in excess of the limits applicable to the qualified pension plans. The total obligations of the SERP and nonqualified plan as of Dec. 31, 2014 and 2013 were $46.5 million and $36.5 million, respectively, of which $3.1 million and $2.8 million were attributable to SPS. In 2014 and 2013, Xcel Energy recognized net benefit cost for financial reporting for the SERP and nonqualified plans of $4.7 million and $6.6 million, respectively, of which $0.2 million and $0.3 million were attributable to SPS. Benefits for these unfunded plans are paid out of Xcel Energy’s consolidated operating cash flows.
Xcel Energy Inc. and SPS base the investment-return assumption on expected long-term performance for each of the investment types included in the pension asset portfolio and consider the historical returns achieved by the asset portfolio over the past 20-year or longer period, as well as the long-term return levels projected and recommended by investment experts. Xcel Energy Inc. and SPS continually review the pension assumptions. The pension cost determination assumes a forecasted mix of investment types over the long-term.
• Investment returns in 2014 were above the assumed levels of 6.90 percent;• Investment returns in 2013 were below the assumed level of 6.49 percent;• Investment returns in 2012 were above the assumed level of 6.68 percent; and • In 2015, SPS’ expected investment-return assumption is 7.22 percent.
The assets are invested in a portfolio according to Xcel Energy Inc.’s and SPS’ return, liquidity and diversification objectives to provide a source of funding for plan obligations and minimize the necessity of contributions to the plan, within appropriate levels of risk. The principal mechanism for achieving these objectives is the projected allocation of assets to selected asset classes, given the long-term risk, return, and liquidity characteristics of each particular asset class. There were no significant concentrations of risk in any particular industry, index, or entity. Market volatility can impact even well-diversified portfolios and significantly affect the return levels achieved by pension assets in any year.
Table of Contents
Schedule Q-4 Page 46 of 187
Sponsor: Robinson Case No. 15-00139-UT

47
The following table presents the target pension asset allocations for SPS at Dec. 31 for the upcoming year:
2014 2013
Domestic and international equity securities 39% 29%Long-duration fixed income and interest rate swap securities 23 36Short-to-intermediate term fixed income securities 14 14Alternative investments 22 19Cash 2 2
Total 100% 100%
The ongoing investment strategy is based on plan-specific investment recommendations that seek to minimize potential investment and interest rate risk as a plan’s funded status increases over time. The investment recommendations result in a greater percentage of long-duration fixed income securities being allocated to specific plans having relatively higher funded status ratios and a greater percentage of growth assets being allocated to plans having relatively lower funded status ratios. The aggregate projected asset allocation presented in the table above for the master pension trust results from the plan-specific strategies.
Pension Plan Assets
The following tables present, for each of the fair value hierarchy levels, SPS’ pension plan assets that are measured at fair value as of Dec. 31, 2014 and 2013:
Dec. 31, 2014(Thousands of Dollars) Level 1 Level 2 Level 3 Total
Cash equivalents $ 17,181 $ — $ — $ 17,181Derivatives — 748 — 748Government securities — 68,058 — 68,058Corporate bonds — 46,531 — 46,531Asset-backed securities — 494 — 494Mortgage-backed securities — 1,451 — 1,451Common stock 13,439 — — 13,439Private equity investments — — 18,331 18,331Commingled funds — 233,232 — 233,232Real estate — — 6,689 6,689Securities lending collateral obligation and other — (3,885) — (3,885)
Total $ 30,620 $ 346,629 $ 25,020 $ 402,269
Dec. 31, 2013(Thousands of Dollars) Level 1 Level 2 Level 3 Total
Cash equivalents $ 17,354 $ — $ — $ 17,354Derivatives — 4,200 — 4,200Government securities — 26,649 — 26,649Corporate bonds — 79,635 — 79,635Asset-backed securities — 889 — 889Mortgage-backed securities — 1,939 — 1,939Common stock 12,813 — — 12,813Private equity investments — — 18,222 18,222Commingled funds — 223,322 — 223,322Real estate — — 5,755 5,755Securities lending collateral obligation and other — 2,615 — 2,615
Total $ 30,167 $ 339,249 $ 23,977 $ 393,393
Table of Contents
Schedule Q-4 Page 47 of 187
Sponsor: Robinson Case No. 15-00139-UT

48
The following tables present the changes in SPS’ Level 3 pension plan assets for the years ended Dec. 31, 2014, 2013 and 2012:
(Thousands of Dollars) Jan. 1, 2014Net Realized
Gains (Losses)Net UnrealizedGains (Losses)
Purchases,Issuances and
Settlements, NetTransfers Out
of Level 3 Dec. 31, 2014
Private equity investments $ 18,222 $ 3,101 $ (1,894) $ (1,098) $ — $ 18,331Real estate 5,755 431 (219) 722 — 6,689
Total $ 23,977 $ 3,532 $ (2,113) $ (376) $ — $ 25,020
(Thousands of Dollars) Jan. 1, 2013Net Realized
Gains (Losses)Net UnrealizedGains (Losses)
Purchases,Issuances and
Settlements, NetTransfers Out of Level 3 (a) Dec. 31, 2013
Asset-backed securities $ 1,755 $ — $ — $ — $ (1,755) $ —Mortgage-backed securities 4,331 — — — (4,331) —Private equity investments 17,049 2,630 (1,055) (402) — 18,222Real estate 6,969 (322) 1,475 1,128 (3,495) 5,755
Total $ 30,104 $ 2,308 $ 420 $ 726 $ (9,581) $ 23,977
(a) Transfers out of Level 3 into Level 2 were principally due to diminished use of unobservable inputs that were previously significant to these fair value measurements and were subsequently sold during 2013.
(Thousands of Dollars) Jan. 1, 2012Net Realized
Gains (Losses)Net UnrealizedGains (Losses)
Purchases,Issuances and
Settlements, NetTransfers Out
of Level 3 Dec. 31, 2012
Asset-backed securities $ 4,018 $ 531 $ (741) $ (2,053) $ — $ 1,755Mortgage-backed securities 7,907 245 (265) (3,556) — 4,331Private equity investments 16,159 1,886 (2,296) 1,300 — 17,049Real estate 3,586 2 551 2,830 — 6,969
Total $ 31,670 $ 2,664 $ (2,751) $ (1,479) $ — $ 30,104
Benefit Obligations — A comparison of the actuarially computed pension benefit obligation and plan assets for SPS is presented in the following table:
(Thousands of Dollars) 2014 2013
Accumulated Benefit Obligation at Dec. 31 $ 458,793 $ 402,509
Change in Projected Benefit Obligation:Obligation at Jan. 1 $ 434,307 $ 454,184Service cost 9,184 9,615Interest cost 20,444 17,908Actuarial loss (gain) 63,209 (27,185)Transfer (to) from other plan (1,939) 3,625Benefit payments (24,515) (23,840)Obligation at Dec. 31 $ 500,690 $ 434,307
(Thousands of Dollars) 2014 2013
Change in Fair Value of Plan Assets:Fair value of plan assets at Jan. 1 $ 393,393 $ 376,138Actual return on plan assets 30,159 15,455Employer contributions 4,869 22,015Transfer (to) from other plan (1,637) 3,625Benefit payments (24,515) (23,840)Fair value of plan assets at Dec. 31 $ 402,269 $ 393,393
Table of Contents
Schedule Q-4 Page 48 of 187
Sponsor: Robinson Case No. 15-00139-UT

49
(Thousands of Dollars) 2014 2013
Funded Status of Plans at Dec. 31:Funded status (a) $ (98,421) $ (40,914)
(a) Amounts are recognized in noncurrent liabilities on SPS’ balance sheets.
(Thousands of Dollars) 2014 2013
Amounts Not Yet Recognized as Components of Net Periodic Benefit Cost:Net loss $ 252,063 $ 208,594Prior service cost 39 93
Total $ 252,102 $ 208,687
(Thousands of Dollars) 2014 2013
Amounts Not Yet Recognized as Components of Net Periodic Benefit Cost Have BeenRecorded as Follows Based Upon Expected Recovery in Rates:Current regulatory assets $ 14,437 $ 15,843Noncurrent regulatory assets 237,665 192,844
Total $ 252,102 $ 208,687
Measurement date Dec. 31, 2014 Dec. 31, 2013
2014 2013
Significant Assumptions Used to Measure Benefit Obligations:Discount rate for year-end valuation 4.11% 4.75%Expected average long-term increase in compensation level 3.75 3.75Mortality table RP 2014 RP 2000
Mortality — In 2014, the Society of Actuaries published a new mortality table and projection scale that increased the overall life expectancy of males and females. SPS has reviewed its own population through a credibility analysis and adopted the RP 2014 table with modifications based on its population and specific experience.
Cash Flows — Cash funding requirements can be impacted by changes to actuarial assumptions, actual asset levels and other calculations prescribed by the funding requirements of income tax and other pension-related regulations. Required contributions were made in 2012 through 2015 to meet minimum funding requirements.
Total voluntary and required pension funding contributions across all four of Xcel Energy’s pension plans were as follows:
• $90.0 million in January 2015, of which $11.6 million was attributable to SPS;• $130.6 million in 2014, of which $4.9 million was attributable to SPS;• $192.4 million in 2013, of which $22.0 million was attributable to SPS; and • $198.1 million in 2012, of which $13.1 million was attributable to SPS.
For future years, Xcel Energy and SPS anticipate contributions will be made as necessary.
Plan Amendments — In 2014 and 2013, there were no plan amendments made which affected the benefit obligation.
Table of Contents
Schedule Q-4 Page 49 of 187
Sponsor: Robinson Case No. 15-00139-UT

50
Benefit Costs — The components of SPS’ net periodic pension cost were:
(Thousands of Dollars) 2014 2013 2012
Service cost $ 9,184 $ 9,615 $ 8,520Interest cost 20,444 17,908 19,697Expected return on plan assets (26,179) (23,970) (24,928)Amortization of prior service cost 54 870 1,438Amortization of net loss 13,326 17,148 12,897
Net periodic pension cost 16,829 21,571 17,624Credits (costs) not recognized due to effects of regulation 3,170 (1,269) (4,300)
Net benefit cost recognized for financial reporting $ 19,999 $ 20,302 $ 13,324
2014 2013 2012
Significant Assumptions Used to Measure Costs:Discount rate 4.75% 4.00% 5.00%Expected average long-term increase in compensation level 3.75 3.75 4.00Expected average long-term rate of return on assets 6.90 6.49 6.68
In addition to the benefit costs in the table above, for the pension plans sponsored by Xcel Energy Inc., costs are allocated to SPS based on Xcel Energy Services Inc. employees’ labor costs. Amounts allocated to SPS were $4.1 million, $4.9 million and $4.1 million in 2014, 2013 and 2012, respectively. Pension costs include an expected return impact for the current year that may differ from actual investment performance in the plan. The return assumption used for 2015 pension cost calculations is 7.22 percent. The cost calculation uses a market-related valuation of pension assets. Xcel Energy, including SPS, uses a calculated value method to determine the market-related value of the plan assets. The market-related value begins with the fair market value of assets as of the beginning of the year. The market-related value is determined by adjusting the fair market value of assets to reflect the investment gains and losses (the difference between the actual investment return and the expected investment return on the market-related value) during each of the previous five years at the rate of 20 percent per year. As these differences between actual investment returns and the expected investment returns are incorporated into the market-related value, the differences are recognized over the expected average remaining years of service for active employees.
Defined Contribution Plans
Xcel Energy, which includes SPS, maintains 401(k) and other defined contribution plans that cover substantially all employees. The expense to these plans for SPS was approximately $2.6 million in 2014, $2.4 million in 2013 and $2.3 million in 2012.
Postretirement Health Care Benefits
Xcel Energy, which includes SPS, has a contributory health and welfare benefit plan that provides health care and death benefits to certain retirees. Xcel Energy discontinued contributing toward health care benefits for former NCE, which includes SPS, nonbargaining employees retiring after June 30, 2003. Employees of NCE who retired in 2002 continue to receive employer-subsidized health care benefits. Nonbargaining employees of the former NCE who retired after 1998, bargaining employees of the former NCE who retired after 1999 and nonbargaining employees of NCE who retired after June 30, 2003, are eligible to participate in the Xcel Energy health care program with no employer subsidy.
In 1993, Xcel Energy Inc. and SPS adopted accounting guidance regarding other non-pension postretirement benefits and elected to amortize the unrecognized APBO on a straight-line basis over 20 years.
Regulatory agencies for nearly all retail and wholesale utility customers have allowed rate recovery of accrued postretirement benefit costs.
Plan Assets — Certain state agencies that regulate Xcel Energy Inc.’s utility subsidiaries also have issued guidelines related to the funding of postretirement benefit costs. SPS is required to fund postretirement benefit costs for Texas and New Mexico jurisdictional amounts collected in rates. These assets are invested in a manner consistent with the investment strategy for the pension plan.
Table of Contents
Schedule Q-4 Page 50 of 187
Sponsor: Robinson Case No. 15-00139-UT

51
The following table presents the target postretirement asset allocations for Xcel Energy Inc. and SPS at Dec. 31 for the upcoming year:
2014 2013
Domestic and international equity securities 25% 41%Short-to-intermediate fixed income securities 57 40Alternative investments 13 13Cash 5 6
Total 100% 100%
Xcel Energy Inc. and SPS base investment-return assumptions for the postretirement health care fund assets on expected long-term performance for each of the investment types included in the asset portfolio. Assumptions and target allocations are determined at the master trust level. The investment mix at each of Xcel Energy Inc.’s utility subsidiaries may vary from the investment mix of the total asset portfolio. The assets are invested in a portfolio according to Xcel Energy Inc.’s and SPS’ return, liquidity and diversification objectives to provide a source of funding for plan obligations and minimize the necessity of contributions to the plan, within appropriate levels of risk. The principal mechanism for achieving these objectives is the projected allocation of assets to selected asset classes, given the long-term risk, return, correlation and liquidity characteristics of each particular asset class. There were no significant concentrations of risk in any particular industry, index, or entity. Market volatility can impact even well-diversified portfolios and significantly affect the return levels achieved by postretirement health care assets in any year.
The following tables present, for each of the fair value hierarchy levels, SPS’ proportionate allocation of the total postretirement benefit plan assets that are measured at fair value as of Dec. 31, 2014 and 2013:
Dec. 31, 2014(Thousands of Dollars) Level 1 Level 2 Level 3 Total
Cash equivalents (a) $ 2,513 $ — $ — $ 2,513Derivatives — 18 — 18Government securities — 4,639 — 4,639Insurance contracts — 4,807 — 4,807Corporate bonds — 5,175 — 5,175Asset-backed securities — 345 — 345Mortgage-backed securities — 1,074 — 1,074Commingled funds — 26,960 — 26,960Other — (175) — (175)
Total $ 2,513 $ 42,843 $ — $ 45,356
Dec. 31, 2013(Thousands of Dollars) Level 1 Level 2 Level 3 Total
Cash equivalents (a) $ 1,941 $ — $ — $ 1,941Derivatives — (38) — (38)Government securities — 5,549 — 5,549Insurance contracts — 5,016 — 5,016Corporate bonds — 4,926 — 4,926Asset-backed securities — 319 — 319Mortgage-backed securities — 2,303 — 2,303Commingled funds — 28,331 — 28,331Other — (1,609) — (1,609)
Total $ 1,941 $ 44,797 $ — $ 46,738
(a) Includes restricted cash of $0.1 million at Dec. 31, 2014 and 2013.
Table of Contents
Schedule Q-4 Page 51 of 187
Sponsor: Robinson Case No. 15-00139-UT

52
For the year ended Dec. 31, 2014 there were no assets transferred in or out of Level 3. The following tables present the changes in SPS’ Level 3 postretirement benefit plan assets for the years ended Dec. 31, 2013 and 2012:
(Thousands of Dollars) Jan. 1, 2013Net Realized
Gains (Losses)Net UnrealizedGains (Losses)
Purchases,Issuances and
Settlements, NetTransfers Out of Level 3 (a) Dec. 31, 2013
Asset-backed securities $ 73 $ — $ — $ — $ (73) $ —Mortgage-backed securities 3,841 — — — (3,841) —
Total $ 3,914 $ — $ — $ — $ (3,914) $ —
(a) Transfers out of Level 3 into Level 2 were principally due to diminished use of unobservable inputs that were previously significant to these fair value measurements and were subsequently sold during 2013.
(Thousands of Dollars) Jan. 1, 2012Net Realized
Gains (Losses)Net UnrealizedGains (Losses)
Purchases,Issuances and
Settlements, NetTransfers Out
of Level 3 Dec. 31, 2012
Asset-backed securities $ 730 $ (32) $ 179 $ (804) $ — $ 73Mortgage-backed securities 2,535 (70) 377 999 — 3,841
Total $ 3,265 $ (102) $ 556 $ 195 $ — $ 3,914
Benefit Obligations — A comparison of the actuarially computed benefit obligation and plan assets for SPS is presented in the following table:
(Thousands of Dollars) 2014 2013
Change in Projected Benefit Obligation:Obligation at Jan. 1 $ 54,982 $ 59,260Service cost 1,246 1,368Interest cost 2,572 2,352Medicare subsidy reimbursements 18 63Plan participants’ contributions 728 698Actuarial gain (11,828) (5,215)Benefit payments (3,376) (3,544)Obligation at Dec. 31 $ 44,342 $ 54,982
(Thousands of Dollars) 2014 2013
Change in Fair Value of Plan Assets:Fair value of plan assets at Jan. 1 $ 46,738 $ 46,222Actual return on plan assets 1,073 3,228Plan participants’ contributions 728 698Employer contributions 193 134Benefit payments (3,376) (3,544)Fair value of plan assets at Dec. 31 $ 45,356 $ 46,738
(Thousands of Dollars) 2014 2013
Funded Status of Plans at Dec. 31:Funded status (a) $ 1,014 $ (8,244)
(a) Amounts are recognized in noncurrent assets and noncurrent liabilities on SPS’ balance sheet as of Dec. 31, 2014 and 2013, respectively.
(Thousands of Dollars) 2014 2013
Amounts Not Yet Recognized as Components of Net Periodic Benefit Credit:Net gain $ (14,677) $ (5,344)Prior service credit (3,432) (3,833)
Total $ (18,109) $ (9,177)
Table of Contents
Schedule Q-4 Page 52 of 187
Sponsor: Robinson Case No. 15-00139-UT

53
(Thousands of Dollars) 2014 2013
Amounts Not Yet Recognized as Components of Net Periodic Benefit Credit Have BeenRecorded as Follows Based Upon Expected Recovery in Rates:Current regulatory liabilities $ (892) $ (319)Noncurrent regulatory liabilities (17,217) (8,858)
Total $ (18,109) $ (9,177)
Measurement date Dec. 31, 2014 Dec. 31, 2013
2014 2013
Significant Assumptions Used to Measure Benefit Obligations:Discount rate for year-end valuation 4.08% 4.82%Mortality table RP 2014 RP 2000Health care costs trend rate — initial 6.50% 7.00%
Effective Jan. 1, 2015, the initial medical trend rate was decreased from 7.0 percent to 6.5 percent. The ultimate trend assumption remained at 4.5 percent. The period until the ultimate rate is reached is four years. Xcel Energy Inc. and SPS base the medical trend assumption on the long-term cost inflation expected in the health care market, considering the levels projected and recommended by industry experts, as well as recent actual medical cost increases experienced by the retiree medical plan.
A one-percent change in the assumed health care cost trend rate would have the following effects on SPS:
One-Percentage Point(Thousands of Dollars) Increase Decrease
APBO $ 4,555 $ (3,834)Service and interest components 451 (371)
Cash Flows — The postretirement health care plans have no funding requirements under income tax and other retirement-related regulations other than fulfilling benefit payment obligations, when claims are presented and approved under the plans. Additional cash funding requirements are prescribed by certain state and federal rate regulatory authorities, as discussed previously. Xcel Energy, which includes SPS, contributed $17.1 million, $17.6 million and $47.1 million during 2014, 2013 and 2012, respectively, of which $0.2 million, $0.1 million and $4.4 million were attributable to SPS. Xcel Energy expects to contribute approximately $12.8 million during 2015, of which amounts attributable to SPS will be zero.
Plan Amendments — In 2014 and 2013, there were no plan amendments made which affected the benefit obligation.
Benefit Costs — The components of SPS’ net periodic postretirement benefit costs were:
(Thousands of Dollars) 2014 2013 2012
Service cost $ 1,246 $ 1,368 $ 1,259Interest cost 2,572 2,352 2,831Expected return on plan assets (3,247) (3,183) (2,701)Amortization of transition obligation — — 1,545Amortization of prior service credit (401) (484) (148)Amortization of net (gain) loss (321) (6) 1,256
Net periodic postretirement benefit (credit) cost $ (151) $ 47 $ 4,042
2014 2013 2012
Significant Assumptions Used to Measure Costs:Discount rate 4.82% 4.10% 5.00%Expected average long-term rate of return on assets 7.20 7.11 6.75
In addition to the benefit costs in the table above, for the postretirement health care plans sponsored by Xcel Energy Inc., costs are allocated to SPS based on Xcel Energy Services Inc. employees’ labor costs.
Table of Contents
Schedule Q-4 Page 53 of 187
Sponsor: Robinson Case No. 15-00139-UT
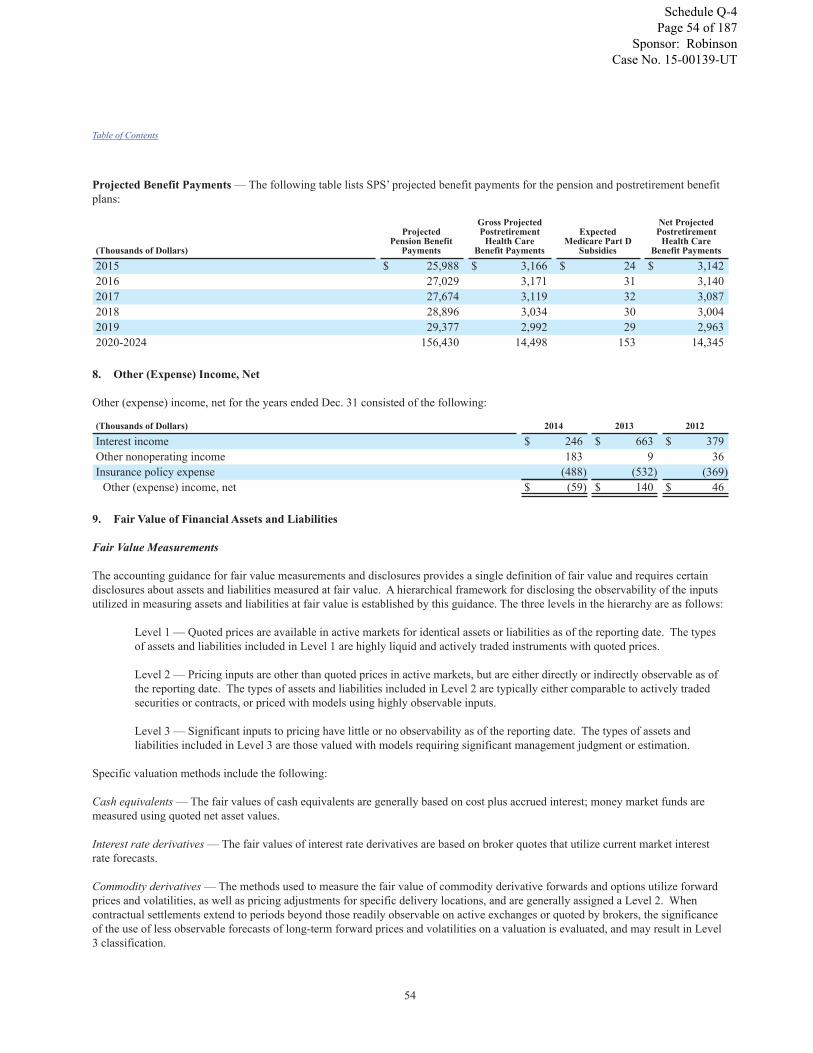
54
Projected Benefit Payments — The following table lists SPS’ projected benefit payments for the pension and postretirement benefit plans:
(Thousands of Dollars)
ProjectedPension Benefit
Payments
Gross ProjectedPostretirement
Health CareBenefit Payments
ExpectedMedicare Part D
Subsidies
Net ProjectedPostretirement
Health CareBenefit Payments
2015 $ 25,988 $ 3,166 $ 24 $ 3,1422016 27,029 3,171 31 3,1402017 27,674 3,119 32 3,0872018 28,896 3,034 30 3,0042019 29,377 2,992 29 2,9632020-2024 156,430 14,498 153 14,345
8. Other (Expense) Income, Net
Other (expense) income, net for the years ended Dec. 31 consisted of the following:
(Thousands of Dollars) 2014 2013 2012
Interest income $ 246 $ 663 $ 379Other nonoperating income 183 9 36Insurance policy expense (488) (532) (369)
Other (expense) income, net $ (59) $ 140 $ 46
9. Fair Value of Financial Assets and Liabilities
Fair Value Measurements
The accounting guidance for fair value measurements and disclosures provides a single definition of fair value and requires certain disclosures about assets and liabilities measured at fair value. A hierarchical framework for disclosing the observability of the inputs utilized in measuring assets and liabilities at fair value is established by this guidance. The three levels in the hierarchy are as follows:
Level 1 — Quoted prices are available in active markets for identical assets or liabilities as of the reporting date. The types of assets and liabilities included in Level 1 are highly liquid and actively traded instruments with quoted prices.
Level 2 — Pricing inputs are other than quoted prices in active markets, but are either directly or indirectly observable as of the reporting date. The types of assets and liabilities included in Level 2 are typically either comparable to actively traded securities or contracts, or priced with models using highly observable inputs.
Level 3 — Significant inputs to pricing have little or no observability as of the reporting date. The types of assets and liabilities included in Level 3 are those valued with models requiring significant management judgment or estimation.
Specific valuation methods include the following:
Cash equivalents — The fair values of cash equivalents are generally based on cost plus accrued interest; money market funds are measured using quoted net asset values.
Interest rate derivatives — The fair values of interest rate derivatives are based on broker quotes that utilize current market interest rate forecasts.
Commodity derivatives — The methods used to measure the fair value of commodity derivative forwards and options utilize forward prices and volatilities, as well as pricing adjustments for specific delivery locations, and are generally assigned a Level 2. When contractual settlements extend to periods beyond those readily observable on active exchanges or quoted by brokers, the significance of the use of less observable forecasts of long-term forward prices and volatilities on a valuation is evaluated, and may result in Level 3 classification.
Table of Contents
Schedule Q-4 Page 54 of 187
Sponsor: Robinson Case No. 15-00139-UT
55
Electric commodity derivatives held by SPS include transmission congestion instruments purchased from SPP, generally referred to as FTRs. FTRs purchased from an RTO are financial instruments that entitle or obligate the holder to monthly revenues or charges based on transmission congestion across a given transmission path. The value of an FTR is derived from, and designed to offset, the cost of energy congestion, which is caused by overall transmission load and other transmission constraints. In addition to overall transmission load, congestion is also influenced by the operating schedules of power plants and the consumption of electricity pertinent to a given transmission path. Unplanned plant outages, scheduled plant maintenance, changes in the relative costs of fuels used in generation, weather and overall changes in demand for electricity can each impact the operating schedules of the power plants on the transmission grid and the value of an FTR. The valuation process for FTRs utilizes complex iterative modeling to predict the impacts of forecasted changes in these drivers of transmission system congestion on the historical pricing of FTR purchases.
If forecasted costs of electric transmission congestion increase or decrease for a given FTR path, the value of that particular FTR instrument will likewise increase or decrease. Given the limited observability of management’s forecasts for several of the inputs to this complex valuation model - including expected plant operating schedules and retail and wholesale demand, fair value measurements for FTRs have been assigned a Level 3. Non-trading monthly FTR settlements are expected to be recovered through fuel and purchased energy cost recovery mechanisms, and therefore changes in the fair value of the yet to be settled portions of FTRs are deferred as a regulatory asset or liability. Given this regulatory treatment and the limited magnitude of FTRs relative to the electric utility operations of SPS, the numerous unobservable quantitative inputs to the complex model used for valuation of FTRs are insignificant to the financial statements of SPS.
Derivative Instruments Fair Value Measurements
SPS enters into derivative instruments, including forward contracts, for trading purposes and to manage risk in connection with changes in interest rates and electric utility commodity prices.
Interest Rate Derivatives — SPS may enter into various instruments that effectively fix the interest payments on certain floating rate debt obligations or effectively fix the yield or price on a specified benchmark interest rate for an anticipated debt issuance for a specific period. These derivative instruments are generally designated as cash flow hedges for accounting purposes.
At Dec. 31, 2014, accumulated other comprehensive losses related to interest rate derivatives included $0.2 million of net losses expected to be reclassified into earnings during the next 12 months as the related hedged interest rate transactions impact earnings, including forecasted amounts for unsettled hedges, as applicable.
Wholesale and Commodity Trading Risk — SPS conducts various wholesale and commodity trading activities, including the purchase and sale of electric capacity, energy and energy-related instruments. SPS’ risk management policy allows management to conduct these activities within guidelines and limitations as approved by its risk management committee, which is made up of management personnel not directly involved in the activities governed by this policy.
Commodity Derivatives — SPS enters into derivative instruments to manage variability of future cash flows from changes in commodity prices in its electric utility operations. This could include the purchase or sale of energy or energy-related products and FTRs.
The following table details the gross notional amounts of commodity FTRs at Dec. 31, 2014 and 2013:
(Amounts in Thousands) (a) Dec. 31, 2014 Dec. 31, 2013
MWh of electricity 6,930 5,989
(a) Amounts are not reflective of net positions in the underlying commodities.
Consideration of Credit Risk and Concentrations — SPS continuously monitors the creditworthiness of the counterparties to its interest rate derivatives and commodity derivative contracts prior to settlement, and assesses each counterparty’s ability to perform on the transactions set forth in the contracts. Given this assessment, as well as an assessment of the impact of SPS’ own credit risk when determining the fair value of derivative liabilities, the impact of considering credit risk was immaterial to the fair value of unsettled commodity derivatives presented in the consolidated balance sheets.
Table of Contents
Schedule Q-4 Page 55 of 187
Sponsor: Robinson Case No. 15-00139-UT

56
SPS employs additional credit risk control mechanisms when appropriate, such as letters of credit, parental guarantees, standardized master netting agreements and termination provisions that allow for offsetting of positive and negative exposures. Credit exposure is monitored and, when necessary, the activity with a specific counterparty is limited until credit enhancement is provided.
SPS’ most significant concentrations of credit risk with particular entities or industries are contracts with counterparties to its wholesale, trading and non-trading commodity activities. At Dec. 31, 2014, one of SPS’ eight most significant counterparties for these activities, comprising $15.2 million or 16 percent of this credit exposure, had an investment grade credit rating from Standard & Poor’s, Moody’s or Fitch Ratings. Six of the eight most significant counterparties, comprising $44.4 million or 47 percent of this credit exposure, were not rated by these agencies, but based on SPS’ internal analysis, had credit quality consistent with investment grade. Another of these significant counterparties, comprising $1.7 million or 2 percent of this credit exposure, had credit quality less than investment grade, based on SPS’ internal analysis. All eight of these significant counterparties are municipal or cooperative electric entities, or other utilities.
Financial Impact of Qualifying Cash Flow Hedges — The impact of qualifying interest rate cash flow hedges on SPS’ accumulated other comprehensive loss, included in the statements of common stockholder’s equity and in the statements of comprehensive income, is detailed in the following table:
(Thousands of Dollars) 2014 2013 2012
Accumulated other comprehensive loss related to cash flow hedges at Jan. 1 $ (1,161) $ (1,332) $ (1,504)After-tax net realized losses on derivative transactions reclassified into earnings 172 171 172Accumulated other comprehensive loss related to cash flow hedges at Dec. 31 $ (989) $ (1,161) $ (1,332)
Pre-tax losses related to interest rate derivatives reclassified from accumulated other comprehensive loss into earnings were $0.3 million for each of the years ended Dec. 31, 2014, 2013 and 2012.
Changes in the fair value of FTRs resulting in pre-tax net losses of $3.9 million and pre-tax net gains of $9.9 million for the years ended Dec. 31, 2014 and 2013, respectively, were reclassified as regulatory assets and liabilities. The classification as a regulatory asset or liability is based on expected recovery of FTR settlements through fuel and purchased energy cost recovery mechanisms.
FTR settlement losses of $8.2 million were recognized for the year ended Dec. 31, 2014, recorded to electric fuel and purchased power. These derivative settlement gains and losses are shared with electric customers through fuel and purchased energy cost-recovery mechanisms, and reclassified out of income as regulatory assets or liabilities, as appropriate.
SPS had no derivative instruments designated as fair value hedges during the years ended Dec. 31, 2014, 2013 and 2012. Therefore, no gains or losses from fair value hedges or related hedged transactions were recognized for these periods.
Table of Contents
Schedule Q-4 Page 56 of 187
Sponsor: Robinson Case No. 15-00139-UT

57
Recurring Fair Value Measurements — The following table presents for each of the fair value hierarchy levels, SPS’ derivative assets and liabilities measured at fair value on a recurring basis at Dec. 31, 2014:
Dec. 31, 2014Fair Value Fair Value
TotalCounterparty
Netting (b)(Thousands of Dollars) Level 1 Level 2 Level 3 TotalCurrent derivative assetsOther derivative instruments:
Electric commodity $ — $ — $ 25,774 $ 25,774 $ (9,890) $ 15,884Total current derivative assets $ — $ — $ 25,774 $ 25,774 $ (9,890) 15,884
PPAs (a) 7,892Current derivative instruments $ 23,776
Noncurrent derivative assetsPPAs (a) $ 33,164
Noncurrent derivative instruments $ 33,164Current derivative liabilitiesOther derivative instruments:
Electric commodity $ — $ — $ 9,890 $ 9,890 $ (9,890) $ —Total current derivative liabilities $ — $ — $ 9,890 $ 9,890 $ (9,890) —
PPAs (a) 3,565Current derivative instruments $ 3,565
Noncurrent derivative liabilitiesPPAs (a) $ 30,643
Noncurrent derivative instruments $ 30,643
(a) In 2003, as a result of implementing new guidance on the normal purchase exception for derivative accounting, SPS began recording several long-term PPAs at fair value due to accounting requirements related to underlying price adjustments. As these purchases are recovered through normal regulatory recovery mechanisms in the respective jurisdictions, the changes in fair value for these contracts were offset by regulatory assets and liabilities. During 2006, SPS qualified these contracts under the normal purchase exception. Based on this qualification, the contracts are no longer adjusted to fair value and the previous carrying value of these contracts will be amortized over the remaining contract lives along with the offsetting regulatory assets and liabilities.
(b) SPS nets derivative instruments and related collateral in its consolidated balance sheet when supported by a legally enforceable master netting agreement, and all derivative instruments and related collateral amounts were subject to master netting agreements at Dec. 31, 2014. At Dec. 31, 2014, derivative assets and liabilities include no obligations to return cash collateral or rights to reclaim cash collateral. The counterparty netting amounts presented exclude settlement receivables and payables and non-derivative amounts that may be subject to the same master netting agreements.
Table of Contents
Schedule Q-4 Page 57 of 187
Sponsor: Robinson Case No. 15-00139-UT

58
The following table presents for each of the fair value hierarchy levels, SPS’ derivative assets and liabilities measured at fair value on a recurring basis at Dec. 31, 2013:
Dec. 31, 2013Fair Value Fair Value
TotalCounterparty
Netting (b)(Thousands of Dollars) Level 1 Level 2 Level 3 TotalCurrent derivative assetsOther derivative instruments:
Electric commodity $ — $ — $ 16,420 $ 16,420 $ (6,487) $ 9,933Total current derivative assets $ — $ — $ 16,420 $ 16,420 $ (6,487) 9,933
PPAs (a) 7,893Current derivative instruments $ 17,826
Noncurrent derivative assetsPPAs (a) $ 41,056
Noncurrent derivative instruments $ 41,056Current derivative liabilitiesOther derivative instruments:
Electric commodity $ — $ — $ 6,487 $ 6,487 $ (6,487) $ —Total current derivative liabilities $ — $ — $ 6,487 $ 6,487 $ (6,487) —
PPAs (a) 3,583Current derivative instruments $ 3,583
Noncurrent derivative liabilitiesPPAs (a) $ 34,207
Noncurrent derivative instruments $ 34,207
(a) In 2003, as a result of implementing new guidance on the normal purchase exception for derivative accounting, SPS began recording several long-term PPAs at fair value due to accounting requirements related to underlying price adjustments. As these purchases are recovered through normal regulatory recovery mechanisms in the respective jurisdictions, the changes in fair value for these contracts were offset by regulatory assets and liabilities. During 2006, SPS qualified these contracts under the normal purchase exception. Based on this qualification, the contracts are no longer adjusted to fair value and the previous carrying value of these contracts will be amortized over the remaining contract lives along with the offsetting regulatory assets and liabilities.
(b) SPS nets derivative instruments and related collateral in its consolidated balance sheet when supported by a legally enforceable master netting agreement, and all derivative instruments and related collateral amounts were subject to master netting agreements at Dec. 31, 2013. At Dec. 31, 2013, derivative assets and liabilities include no obligations to return cash collateral or rights to reclaim cash collateral. The counterparty netting amounts presented exclude settlement receivables and payables and non-derivative amounts that may be subject to the same master netting agreements.
The following table presents the changes in Level 3 commodity derivatives for the years ended Dec. 31, 2014 and 2013:
Year Ended Dec. 31(Thousands of Dollars) 2014 2013
Balance at Jan. 1 $ 9,933 $ —Purchases 50,244 9,933Settlements (44,283) —
Net transactions recorded during the period:Losses recognized as regulatory assets (10) —
Balance at Dec. 31 $ 15,884 $ 9,933
SPS recognizes transfers between levels as of the beginning of each period. There were no transfers of amounts between levels for derivative instruments for the years ended Dec. 31, 2014 and 2013.
Table of Contents
Schedule Q-4 Page 58 of 187
Sponsor: Robinson Case No. 15-00139-UT

59
Fair Value of Long-Term Debt
As of Dec. 31, 2014 and 2013, other financial instruments for which the carrying amount did not equal fair value were as follows:
2014 2013
(Thousands of Dollars)CarryingAmount Fair Value
CarryingAmount Fair Value
Long-term debt, including current portion $ 1,349,691 $ 1,572,414 $ 1,199,865 $ 1,307,035
The fair value of SPS’ long-term debt is estimated based on recent trades and observable spreads from benchmark interest rates for similar securities. The fair value estimates are based on information available to management as of Dec. 31, 2014 and 2013, and given the observability of the inputs to these estimates, the fair values presented for long-term debt have been assigned a Level 2.
10. Rate Matters
Pending and Recently Concluded Regulatory Proceedings — PUCT
Texas 2015 Electric Rate Case — In December 2014, SPS filed a retail electric, non-fuel rate case in Texas with each of its Texas municipalities and the PUCT seeking an overall increase in annual revenue of approximately $64.75 million, or 6.7 percent. The filing is based on an HTY ended June 2014, adjusted for known and measurable changes, an ROE of 10.25 percent, an electric rate base of approximately $1.56 billion and an equity ratio of 53.97 percent.
As part of its request, SPS is seeking a waiver of the PUCT post-test year adjustment rule which would allow for inclusion of $442 million (total company) additional capital investment for the period July 1, 2014 through Dec. 31, 2014.
The following table summarizes the net request:
(Millions of Dollars) Request
Investment for capital expenditures — post-test year adjustments $ 29.60Depreciation expense 13.90Wholesale load reductions 12.00Purchased power capacity costs 3.20Other, net 6.05
Total $ 64.75
The next steps in the procedural schedule are expected to be as follows:
• Intervenor Direct Testimony — April 1, 2015;• Staff Direct Testimony — April 8, 2015;• Staff and Intervenor Cross-Rebuttal Testimony — April 22, 2015;• Rebuttal Testimony — April 24, 2015; and• Evidentiary Hearing — May 11, 2015.
The parties have agreed the rates will be effective June 11, 2015. A PUCT decision is anticipated in the second half of 2015.
Texas 2014 Electric Rate Case — In January 2014, SPS filed a retail electric rate case in Texas seeking a net increase in annual revenue of approximately $52.7 million, or 5.8 percent. The net increase reflected a base rate increase, revenue credits transferred from base rates to rate riders or the fuel clause, and resetting the TCRF to zero when the final base rates become effective. In April 2014, SPS revised its request to a net increase of $48.1 million.
The rate filing was based on an HTY ending June 2013, a requested ROE of 10.40 percent, an electric rate base of approximately $1.27 billion and an equity ratio of 53.89 percent. The requested rate increase reflected an increase in depreciation expense of approximately $16 million.
Table of Contents
Schedule Q-4 Page 59 of 187
Sponsor: Robinson Case No. 15-00139-UT

60
In September 2014, SPS, PUCT staff, and intervenors filed a non-unanimous settlement agreement which would increase SPS’ rates by $37 million, or 3.5 percent, retroactive to June 1, 2014. Starting Oct. 1, 2014, SPS began collecting the rate increase through interim rates subject to refund. SPS expects to recover the rate increase for June through September 2014 through a separate surcharge, for which it has recognized approximately $15.4 million of revenue in 2014.
The settlement includes an ROE of 9.7 percent solely for the purpose of calculating the AFUDC and determining baselines in future filings for the TCRF. In October 2014, the ALJs approved the stipulation and recommended that SPS file to implement the surcharge following the PUCT’s final order.
Although the parties to the settlement agreement have not prepared a calculation of the $37 million increase and do not agree about which specific costs are included, or not, in the agreed settlement revenue requirement, SPS’ reconciliation of its original request to the settlement increase is as follows:
(Millions of Dollars) Settlement Agreement
Base rate increase request, January 2014 $ 81.5Revisions for updated information (4.6)Revised request, April 2014 76.9Remove proposed increase in depreciation (16.0)Remove adjustment allocators for certain wholesale load reduction (12.0)Revised amortizations (rate case expenses, pension and other post-employment benefits expense and gain onsale to Lubbock) (9.0)Non-specified settlement adjustments (2.9)Settlement base rate increase $ 37.0
In December 2014, the PUCT approved the settlement and authorized SPS to file to implement the surcharge. In January 2015, SPS filed an application to implement a surcharge of approximately $15.6 million, including interest, to be recovered from March through June 2015, subject to a true-up. A hearing was held in February 2015 and a decision is expected in the first quarter of 2015.
Electric, Purchased Gas and Resource Adjustment Clauses
TCRF Rider — In November 2013, SPS filed with the PUCT to implement the TCRF for Texas retail customers. The requested increase in revenues was $13 million. The PUCT issued an order allowing the TCRF to go into effect on an interim basis effective Jan. 1, 2014. In May 2014, the ALJ terminated the interim TCRF due to a settlement in principle being reached with intervenors and the PUCT staff in the pending Texas electric rate case. In July 2014, the PUCT approved the settlement agreement between the parties allowing SPS to recover $4 million annually through the TCRF. In September 2014, SPS filed a proposal with the PUCT to refund approximately $3.7 million during November 2014 for interim rates collected in excess of the final rates approved. Under a settlement among the parties, SPS implemented the refund in November 2014, pending PUCT approval. The PUCT approved the refund on Dec. 18, 2014.
Pending Regulatory Proceedings — NMPRC
New Mexico 2014 Electric Rate Case — In December 2012, SPS filed an electric rate case in New Mexico with the NMPRC for an increase in annual revenue of approximately $45.9 million effective in 2014. The rate filing was based on a 2014 FTY, a requested ROE of 10.65 percent, an electric rate base of $479.8 million and an equity ratio of 53.89 percent.
In September 2013, SPS filed rebuttal testimony, revising its requested rate increase to $32.5 million, based on updated information and an ROE of 10.25 percent. The request reflected a base and fuel increase of $20.9 million, an increase of rider revenue of $12.1 million and a decrease to other of $0.5 million.
In March 2014, the NMPRC approved an overall increase of approximately $33.1 million. The increase reflects a base rate increase of $12.7 million and rider recovery of $18.1 million for renewable energy costs, both based on an ROE of 9.96 percent and an equity ratio of 53.89 percent. Final rates were effective April 5, 2014. In April 2014, the NMAG filed a request for rehearing. The rehearing request was denied by the NMPRC. In June 2014, the NMAG filed an appeal of the NMPRC’s denial to the New Mexico Supreme Court. A decision is expected by the second quarter of 2016.
Table of Contents
Schedule Q-4 Page 60 of 187
Sponsor: Robinson Case No. 15-00139-UT

61
Pending and Recently Concluded Regulatory Proceedings — FERC
Wholesale Rate Complaints — In April 2012, Golden Spread Electric Cooperative, Inc. (Golden Spread), a wholesale cooperative customer, filed a rate complaint alleging that the base ROE included in the SPS production formula rate of 10.25 percent, and the SPS transmission base formula rate ROE of 10.77 percent, are unjust and unreasonable. In July 2013, Golden Spread filed a second complaint, again asking that the base ROE in the SPS production and transmission formula rates be reduced to 9.15 and 9.65 percent, respectively.
In June 2014, the FERC issued an order in a different ROE proceeding adopting a new ROE methodology for electric utilities. The new ROE methodology requires electric utilities to use a two-step discounted cash flow analysis to estimate cost of equity that incorporates both short-term and long-term growth projections.
The FERC also issued orders consolidating the Golden Spread ROE complaints and setting them for settlement judge procedures and hearings and indicated the parties should apply the new two-step discounted cash flow ROE methodology to the proceedings. The FERC established effective dates for the refunds as April 20, 2012 and July 19, 2013. Settlement judge procedures were unsuccessful and the complaints were set for hearing procedures, with an initial ALJ decision to be issued by Nov. 25, 2015 and a final FERC order to be issued no earlier than 2016. In January 2015, Golden Spread filed testimony requesting that wholesale production and transmission formula rates be reduced to 8.78 percent and 9.28 percent, respectively, for the period April 20, 2012 to July 18, 2013, and reduced to 8.51 percent and 9.01 percent, respectively, for the period July 19, 2013 to Oct. 19, 2014.
Golden Spread, along with certain New Mexico cooperatives and the West Texas Municipal Power Agency, separately filed a third rate complaint in October 2014, requesting that the base ROE in the SPS production and transmission formula rates be reduced to 8.61 percent and 9.11 percent, respectively. The complainants requested a refund effective date of Oct. 20, 2014. In January 2015, the FERC issued an order setting the third complaint for hearing procedures and granting the complainants’ requested refund effective date.
FERC Complaint Case Orders — In August 2013, the FERC issued an order on rehearing related to a 2004 complaint case brought by Golden Spread and PNM and an Order on Initial Decision in a subsequent 2006 production rate case filed by SPS.
The original complaint included two key components: 1) PNM’s claim regarding inappropriate allocation of fuel costs and 2) a base rate complaint, including the appropriate demand-related cost allocator. The FERC previously determined that the allocation of fuel costs and the demand-related cost allocator utilized by SPS was appropriate.
In the August 2013 Orders, the FERC clarified its previous ruling on the allocation of fuel costs and reaffirmed that the refunds in question should only apply to firm requirements customers and not PNM’s contractual load. The FERC also reversed its prior demand-related cost allocator decision. The FERC stated that it had erred in its initial analysis and concluded that the SPS system was a 3CP rather than a 12CP system.
In September 2013, SPS filed a request for rehearing of the FERC ruling on the CP allocation and refund decisions. SPS asserted that the FERC applied an improper burden of proof and that precedent did not support retroactive refunds. PNM also requested rehearing of the FERC decision not to reverse its prior ruling. In October 2013, the FERC issued orders further considering the requests for rehearing, which are currently pending. As of Dec. 31, 2013, SPS had accrued $44.5 million related to the August 2013 Orders and an additional $5.9 million of principal and interest was accrued during 2014.
On Jan. 30, 2015, SPS filed to revise the production formula rates for six of its wholesale customers, including Golden Spread, effective Feb. 1, 2015. The filing proposes several modifications, including a reduction in wholesale depreciation rates and the use of a 12CP demand-related cost allocator. If approved, principal and interest accruals from the August 2013 Orders would cease as of the effective date. FERC action is pending.
Sale of Texas Transmission Assets — In March 2013, SPS reached an agreement to sell certain segments of SPS’ transmission lines and two related substations to Sharyland. In 2013, SPS received all necessary regulatory approvals for the transaction. In December 2013, SPS received $37.1 million and recognized a pre-tax gain of $13.6 million and regulatory liabilities for jurisdictional gain sharing of $7.2 million. The gain is reflected in the statement of income as a reduction to O&M expenses. In December 2014, Golden Spread submitted a preliminary challenge asserting that the gain should be shared with wholesale transmission customers. SPS has disputed this claim. It is uncertain if the matter will result in a formal proceeding with the FERC.
Table of Contents
Schedule Q-4 Page 61 of 187
Sponsor: Robinson Case No. 15-00139-UT

62
Request for Waiver of SPP Tariff — In July 2014, SPS filed a request for the FERC to grant SPS a waiver of an SPP tariff regarding the billing of SPP administrative and transmission expansion charges for certain loads that left the SPS system at the end of 2013 through a sale of transmission assets to Sharyland. Under the SPP tariff provisions, SPP assesses these charges based on prior year load. Absent the waiver, SPS would be billed approximately $2.9 million by SPP in 2014 for loads that are no longer served by SPS. SPP has intervened to oppose the waiver request and Sharyland has intervened to support the waiver request. FERC action is pending.
11. Commitments and Contingencies
Commitments
Capital Commitments — SPS has made commitments in connection with a portion of its projected capital expenditures. SPS’ capital commitments primarily relate to transmission project plans.
Transmission NTC — SPS has accepted NTCs for several hundred miles of transmission line and related substation projects based on needs identified through SPP’s various planning processes, including those associated with economics, reliability, generator interconnection or the load addition processes. Most significant is the TUCO to Yoakum County to Hobbs Plant, a 345 KV transmission line. This line will connect the TUCO substation near Lubbock, Texas with the Yoakum County substation, continuing on to the Hobbs Plant substation near Hobbs, N.M. SPS anticipates filing CCNs for this line in Texas and in New Mexico in mid-2015. The line is scheduled to be in service in 2020.
Fuel Contracts — SPS has entered into various long-term commitments for the purchase and delivery of a significant portion of its current coal and natural gas requirements. These contracts expire in various years between 2015 and 2033. SPS is required to pay additional amounts depending on actual quantities shipped under these agreements.
The estimated minimum purchases for SPS under these contracts as of Dec. 31, 2014, are as follows:
(Millions of Dollars) CoalNatural gas
supply
Natural gasstorage and
transportation2015 $ 258.0 $ 3.3 $ 31.02016 225.1 — 30.82017 114.9 — 22.12018 — — 20.62019 — — 21.5Thereafter — — 95.9
Total $ 598.0 $ 3.3 $ 221.9
Additional expenditures for fuel and natural gas storage and transportation will be required to meet expected future electric generation needs. SPS’ risk of loss, in the form of increased costs from market price changes in fuel, is mitigated through the cost-rate adjustment mechanisms, which provide for pass-through of most fuel, storage and transportation costs to customers.
PPAs — SPS has entered into PPAs with other utilities and energy suppliers with expiration dates through 2033 for purchased power to meet system load and energy requirements and meet operating reserve obligations. In general, these contracts provide for energy payments, based on actual energy delivered and capacity payments. Capacity payments are typically contingent on the independent power producing entity meeting certain contract obligations, including plant availability requirements. Certain contractual payments are adjusted based on market indices. The effects of price adjustments on our financial results are mitigated through purchased energy cost recovery mechanisms.
Table of Contents
Schedule Q-4 Page 62 of 187
Sponsor: Robinson Case No. 15-00139-UT

63
Included in electric fuel and purchased power expenses for PPAs accounted for as executory contracts, were payments for capacity of $52.4 million, $38.4 million and $36.2 million in 2014, 2013 and 2012, respectively. At Dec. 31, 2014, the estimated future payments for capacity that SPS is obligated to purchase pursuant to these executory contracts, subject to availability, are as follows:
(Millions of Dollars)
2015 $ 56.62016 57.12017 58.32018 59.62019 19.5Thereafter 36.1
Total (a) $ 287.2
(a) Excludes contingent energy payments for renewable energy PPAs.
Additional energy payments under these PPAs and PPAs accounted for as operating leases will be required to meet expected future electric demand.
Leases — SPS leases a variety of equipment and facilities used in the normal course of business. These leases, primarily for office space, generating facilities, trucks, aircraft, cars and power-operated equipment, are accounted for as operating leases. Total expenses under operating lease obligations were approximately $63.1 million, $64.2 million and $59.9 million for 2014, 2013 and 2012, respectively. These expenses included capacity payments for PPAs accounted for as operating leases of $57.1 million, $59.0 million and $56.0 million in 2014, 2013 and 2012, respectively, recorded to electric fuel and purchased power expenses.
Included in the future commitments under operating leases are estimated future capacity payments under PPAs that have been accounted for as operating leases in accordance with the applicable accounting guidance. Future commitments under operating leases are:
(Millions of Dollars)Operating
Leases
PPA (a) (b)
OperatingLeases
TotalOperating
Leases2015 $ 3.3 $ 52.0 $ 55.32016 3.4 49.0 52.42017 2.4 49.0 51.42018 2.0 49.0 51.02019 1.9 49.0 50.9Thereafter 11.4 671.8 683.2
(a) Amounts do not include PPAs accounted for as executory contracts.(b) PPA operating leases contractually expire through 2033.
Variable Interest Entities — The accounting guidance for consolidation of variable interest entities requires enterprises to consider the activities that most significantly impact an entity’s financial performance, and power to direct those activities, when determining whether an enterprise is a variable interest entity’s primary beneficiary.
PPAs — Under certain PPAs, SPS purchases power from independent power producing entities for which SPS is required to reimburse natural gas fuel costs, or to participate in tolling arrangements under which SPS procures the natural gas required to produce the energy that it purchases. These specific PPAs create a variable interest in the associated independent power producing entity.
SPS has determined that certain independent power producing entities are variable interest entities. SPS is not subject to risk of loss from the operations of these entities, and no significant financial support has been, or is in the future required to be provided other than contractual payments for energy and capacity set forth in the PPAs.
Table of Contents
Schedule Q-4 Page 63 of 187
Sponsor: Robinson Case No. 15-00139-UT

64
SPS has evaluated each of these variable interest entities for possible consolidation, including review of qualitative factors such as the length and terms of the contract, control over O&M, control over dispatch of electricity, historical and estimated future fuel and electricity prices, and financing activities. SPS has concluded that these entities are not required to be consolidated in its financial statements because it does not have the power to direct the activities that most significantly impact the entities’ economic performance. SPS had approximately 827 MW of capacity under long-term PPAs as of Dec. 31, 2014 and 2013, with entities that have been determined to be variable interest entities. These agreements have expiration dates through the year 2033.
Fuel Contracts — SPS purchases all of its coal requirements for its Harrington and Tolk electric generating stations from TUCO under contracts for those facilities that expire in 2016 and 2017, respectively. TUCO arranges for the purchase, receiving, transporting, unloading, handling, crushing, weighing, and delivery of coal to meet SPS’ requirements. TUCO is responsible for negotiating and administering contracts with coal suppliers, transporters and handlers.
No significant financial support has been, or is in the future, required to be provided to TUCO by SPS, other than contractual payments for delivered coal. However, the fuel contracts create a variable interest in TUCO due to SPS’ reimbursement of certain fuel procurement costs. SPS has determined that TUCO is a variable interest entity. SPS has concluded that it is not the primary beneficiary of TUCO because SPS does not have the power to direct the activities that most significantly impact TUCO’s economic performance.
Environmental Contingencies
SPS has been or is currently involved with the cleanup of contamination from certain hazardous substances at several sites. In many situations, SPS believes it will recover some portion of these costs through insurance claims. Additionally, where applicable, SPS is pursuing, or intends to pursue, recovery from other PRPs and through the regulated rate process. New and changing federal and state environmental mandates can also create added financial liabilities for SPS, which are normally recovered through the regulated rate process. To the extent any costs are not recovered through the options listed above, SPS would be required to recognize an expense.
Site Remediation — Various federal and state environmental laws impose liability, without regard to the legality of the original conduct, where hazardous substances or other regulated materials have been released to the environment. SPS may sometimes pay all or a portion of the cost to remediate sites where past activities of SPS or other parties have caused environmental contamination. Environmental contingencies could arise from various situations, including sites of former manufactured gas plants operated by SPS, its predecessors, or other entities; and third-party sites, such as landfills, for which SPS is alleged to be a PRP that sent hazardous materials and wastes to that site.
Environmental Requirements
Water and WasteAsbestos Removal — Some of SPS’ facilities contain asbestos. Most asbestos will remain undisturbed until the facilities that contain it are demolished or removed. SPS has recorded an estimate for final removal of the asbestos as an ARO. It may be necessary to remove some asbestos to perform maintenance or make improvements to other equipment. The cost of removing asbestos as part of other work is not expected to be material and is recorded as incurred as operating expenses for maintenance projects, capital expenditures for construction projects or removal costs for demolition projects.
Federal Clean Water Act (CWA) Effluent Limitations Guidelines (ELG) — In June 2013, the EPA published a proposed ELG rule for power plants that use coal, natural gas, oil or nuclear materials as fuel and discharge treated effluent to surface waters as well as utility-owned landfills that receive coal combustion residuals. The final rule is now expected in September 2015. Under the current proposed rule, facilities would need to comply as soon as possible after July 2017, but no later than July 2022. The impact of this rule on SPS is uncertain at this time.
Federal CWA Waters of the United States Rule — In April 2014, the EPA and the U.S. Army Corps of Engineers issued a proposed rule that significantly expands the types of water bodies regulated under the CWA. If finalized as proposed, this rule could delay the siting of new pipelines, transmission lines and distribution lines, increase project costs and expand permitting and reporting requirements. The ultimate impact of the proposed rule will depend on the specific requirements of the final rule and cannot be determined at this time. A final rule is not anticipated before the second quarter of 2015.
Table of Contents
Schedule Q-4 Page 64 of 187
Sponsor: Robinson Case No. 15-00139-UT
65
Coal Ash Regulation — SPS’ operations are subject to federal and state laws that impose requirements for handling, storage, treatment and disposal of solid waste. In 2010, the EPA published a proposed rule on the regulation of coal combustion byproducts (coal ash) as hazardous or nonhazardous waste. The EPA issued a pre-publication version of the final rule in December 2014, which once promulgated will impose new rules to regulate coal ash as a nonhazardous solid waste. SPS’ costs for the management and disposal of coal ash will not significantly increase under the new rule.
AirGHG Emission Standard for Existing Sources — In June 2014, the EPA published its proposed rule on GHG emission standards for existing power plants. Comments were due to the EPA on Dec. 1, 2014 and a final rule is anticipated in mid-summer 2015. Following adoption of the final rule, states must develop implementation plans by June 2016, with the possibility of an extension to June 2017 (June 2018 if submitting a joint plan with other states). Among other things, the proposed rule would require that state plans include enforceable measures to ensure emissions from existing power plants in the state achieve the EPA’s state-specific interim (2020-2029) and final (2030 and thereafter) emission performance targets. The plan will likely require additional emission reductions in states in which SPS operates. It is not possible to evaluate the impact of existing source standards until the EPA promulgates a final rule and states have adopted their applicable state plans.
GHG NSPS Proposal — In January 2014, the EPA re-proposed a GHG NSPS for newly constructed power plants which would set performance standards (maximum carbon dioxide emission rates) for coal- and natural gas-fired power plants. For coal power plants, the NSPS requires an emissions level equivalent to partial carbon capture and storage (CCS) technology; for gas-fired power plants, the NSPS reflects emissions levels from combined cycle technology with no CCS. The EPA continues to propose that the NSPS not apply to modified or reconstructed existing power plants. In addition, installation of control equipment on existing plants would not constitute a “modification” to those plants under the NSPS program. A final rule is anticipated in mid-summer 2015. It is not possible to evaluate the impact of the re-proposed NSPS until its final requirements are known.
GHG NSPS for Modified and Reconstructed Power Plants — In June 2014, the EPA published a proposed NSPS that would apply to GHG emissions from power plants that are modified or reconstructed. A final rule is anticipated in mid-summer 2015. A modification is a change to an existing source that increases the maximum achievable hourly rate of emissions. A reconstruction involves the replacement of components at a unit to the extent that the capital cost of the new components exceeds 50 percent of the capital cost of an entirely new comparable unit. The proposed standards would not require installation of CCS technology. Instead, the proposed standard for coal-fired power plants would require a combination of best operating practices and equipment upgrades. The proposal for gas-fired power plants would require emissions standards based on efficient combined cycle technology. It is not possible to evaluate the impact of these proposed standards until the final requirements are known. In addition, it is not clear whether these requirements, once adopted, would apply to future changes at SPS’ power plants.
CSAPR — CSAPR addresses long range transport of PM and ozone by requiring reductions in SO2 and NOx from utilities in the eastern half of the United States, including Texas, using an emissions trading program.
In August 2012, the D.C. Circuit vacated the CSAPR and remanded it back to the EPA. The D.C. Circuit stated the EPA must continue administering CSAPR’s predecessor rule pending adoption of a valid replacement. In April 2014, the U.S. Supreme Court reversed and remanded the case to the D.C. Circuit. The Supreme Court held that the EPA’s rule design did not violate the CAA and that states had received adequate opportunity to develop their own plans. Because the D.C. Circuit overturned the CSAPR on two over-arching issues, there are many other issues the D.C. Circuit did not rule on that will now need to be considered on remand. In October 2014, the D.C. Circuit granted the EPA’s request to begin to implement CSAPR by imposing its 2012 compliance obligations starting in January 2015. In addition, the D.C. Circuit set a briefing schedule and plans to hear arguments on the remaining issues in the case in February 2015. While the litigation continues, the EPA will begin to administer the CSAPR in 2015.
Multiple changes to the SPS system since 2011 will substantially reduce estimated costs of complying with the CSAPR. These include the addition of 700 MW of wind power, the construction of Jones Units 3 and 4 to meet reserve requirements and provide quick start capability, reduced wholesale load and new PPAs, installation of NOx combustion controls on Tolk Units 1 and 2 and completion of certain transmission projects. As a result, SPS estimates compliance with the CSAPR in 2015 will cost approximately $7 million.
Table of Contents
Schedule Q-4 Page 65 of 187
Sponsor: Robinson Case No. 15-00139-UT

66
Electric Generating Unit (EGU) Mercury and Air Toxics Standards (MATS) Rule — The final EGU MATS rule became effective in April 2012. The EGU MATS rule sets emission limits for acid gases, mercury and other hazardous air pollutants and requires coal-fired utility facilities greater than 25 MW to demonstrate compliance within three to four years of the effective date. SPS expects to comply with the EGU MATS rule through a combination of mercury and other emission control projects. In 2014, the U.S. Supreme Court decided to review the D.C. Circuit’s decision that upheld the MATS standard. It is not yet known what impact the Supreme Court’s decision may have on the MATS standard or its implementation schedule. SPS believes EGU MATS costs will be recoverable through regulatory mechanisms and does not expect a material impact on results of operations, financial position or cash flows.
Regional Haze Rules — The regional haze program is designed to address widespread, regionally homogeneous haze that results from emissions from a multitude of sources. In 2005, the EPA amended the BART requirements of its regional haze rules, which require the installation and operation of emission controls for industrial facilities emitting air pollutants that reduce visibility in certain national parks and wilderness areas. In its first regional haze SIP, Texas identified the SPS facilities that will have to reduce SO2, NOx and PM emissions under BART and set emissions limits for those facilities.
Harrington Units 1 and 2 are potentially subject to BART. Texas developed a SIP that finds the CAIR equal to BART for EGUs. As a result, no additional controls beyond CAIR compliance would be required. In May 2012, the EPA deferred its review of the SIP in its final rule allowing states to find that CSAPR compliance meets BART requirements for EGUs. In December 2014, the EPA proposed to approve the BART portion of the SIP, with the exception that the EPA would substitute CSAPR compliance for Texas’ reliance on CAIR. The EPA currently plans to issue its final rule in August 2015.
In May 2014, the EPA issued a request for information under the CAA related to SO2 control equipment at Tolk Units 1 and 2. In its December 2014 proposal, the EPA plans to disapprove the reasonable progress portions of the SIP and instead adopt a Federal Implementation Plan. For SPS, the EPA proposed to require dry scrubbers on both Tolk units to reduce SO2 emissions to help achieve reasonable progress goals the EPA would establish for Texas and Oklahoma national parks and wilderness areas. As proposed, the dry scrubbers would need to be installed and operating within five years of the EPA’s final action, currently expected in August 2015. SPS plans to file comments objecting to the installation of dry scrubbers on the units. Whether dry scrubbers are required is dependent on the EPA’s final decision. If required, they would cost approximately $600 million, with an annual operating cost of approximately $10.4 million.
Revisions to the National Ambient Air Quality Standards (NAAQS) for PM — In December 2012, the EPA lowered the primary health-based NAAQS for annual average fine PM and retained the current daily standard for fine PM. In areas where SPS operates power plants, current monitored air concentrations are below the level of the final annual primary standard. In December 2014, the EPA issued its final designations, which did not include areas in any states in which SPS operates.
Revisions to the NAAQS for Ozone — In December 2014, the EPA proposed to revise the NAAQS for ozone by lowering the eight-hour standard from 0.075 parts per million (ppm) to a level within the range of 0.065-0.070 ppm. The EPA is also taking comment on a level for the standard as low as 0.060 ppm. In areas where SPS operates, current monitored air quality concentrations are above the proposed level of 0.070 ppm in the Texas panhandle. The EPA is expected to adopt a new ozone standard in a final rule to be issued in October 2015. Depending on the level of the standard, impacted states would study the sources of the nonattainment and make emission reduction plans to attain the standards. These plans would be due to the EPA in 2020 or 2021. Such plans could include installation of further NOx controls on power plants. It is not possible to evaluate the impact of this proposal until the final standard is adopted, the designation of nonattainment areas is made in late 2017 based on air quality data years 2014-2016, and any required state plans are developed.
Asset Retirement Obligations
Recorded AROs — AROs have been recorded for property related to the following: electric steam production, electric distribution and transmission, and general property. The electric production obligations include asbestos, ash-containment facilities, storage tanks and control panels. The asbestos recognition associated with the electric production includes certain plants. This asbestos abatement removal obligation originated in 1973 with the CAA, which applied to the demolition of buildings or removal of equipment containing asbestos that can become airborne on removal. AROs also have been recorded for steam production related to ash-containment facilities such as bottom ash ponds, evaporation ponds and solid waste landfills. The origination dates on the ARO recognition for ash-containment facilities at steam plants were the in-service dates of the various facilities.
Table of Contents
Schedule Q-4 Page 66 of 187
Sponsor: Robinson Case No. 15-00139-UT
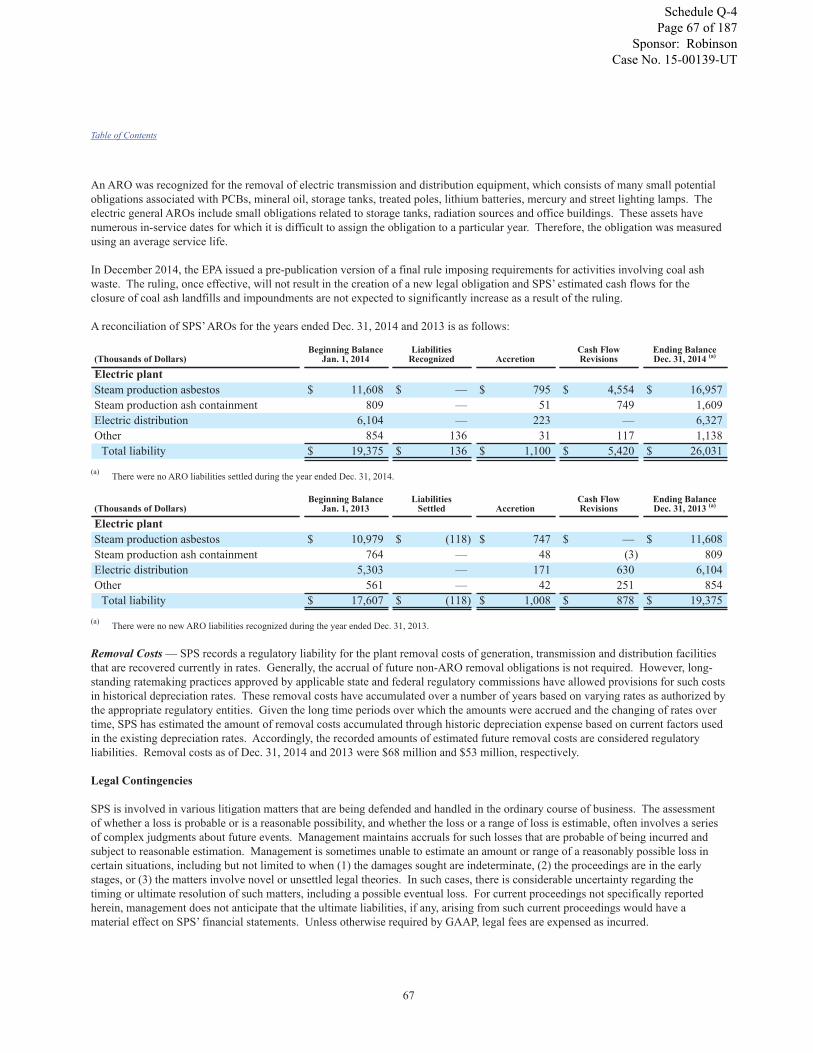
67
An ARO was recognized for the removal of electric transmission and distribution equipment, which consists of many small potential obligations associated with PCBs, mineral oil, storage tanks, treated poles, lithium batteries, mercury and street lighting lamps. The electric general AROs include small obligations related to storage tanks, radiation sources and office buildings. These assets have numerous in-service dates for which it is difficult to assign the obligation to a particular year. Therefore, the obligation was measured using an average service life.
In December 2014, the EPA issued a pre-publication version of a final rule imposing requirements for activities involving coal ash waste. The ruling, once effective, will not result in the creation of a new legal obligation and SPS’ estimated cash flows for the closure of coal ash landfills and impoundments are not expected to significantly increase as a result of the ruling.
A reconciliation of SPS’ AROs for the years ended Dec. 31, 2014 and 2013 is as follows:
(Thousands of Dollars)Beginning Balance
Jan. 1, 2014Liabilities
Recognized AccretionCash FlowRevisions
Ending Balance Dec. 31, 2014 (a)
Electric plantSteam production asbestos $ 11,608 $ — $ 795 $ 4,554 $ 16,957Steam production ash containment 809 — 51 749 1,609Electric distribution 6,104 — 223 — 6,327Other 854 136 31 117 1,138
Total liability $ 19,375 $ 136 $ 1,100 $ 5,420 $ 26,031
(a) There were no ARO liabilities settled during the year ended Dec. 31, 2014.
(Thousands of Dollars)Beginning Balance
Jan. 1, 2013Liabilities
Settled AccretionCash FlowRevisions
Ending Balance Dec. 31, 2013 (a)
Electric plantSteam production asbestos $ 10,979 $ (118) $ 747 $ — $ 11,608Steam production ash containment 764 — 48 (3) 809Electric distribution 5,303 — 171 630 6,104Other 561 — 42 251 854
Total liability $ 17,607 $ (118) $ 1,008 $ 878 $ 19,375
(a) There were no new ARO liabilities recognized during the year ended Dec. 31, 2013.
Removal Costs — SPS records a regulatory liability for the plant removal costs of generation, transmission and distribution facilities that are recovered currently in rates. Generally, the accrual of future non-ARO removal obligations is not required. However, long-standing ratemaking practices approved by applicable state and federal regulatory commissions have allowed provisions for such costs in historical depreciation rates. These removal costs have accumulated over a number of years based on varying rates as authorized by the appropriate regulatory entities. Given the long time periods over which the amounts were accrued and the changing of rates over time, SPS has estimated the amount of removal costs accumulated through historic depreciation expense based on current factors used in the existing depreciation rates. Accordingly, the recorded amounts of estimated future removal costs are considered regulatory liabilities. Removal costs as of Dec. 31, 2014 and 2013 were $68 million and $53 million, respectively.
Legal Contingencies
SPS is involved in various litigation matters that are being defended and handled in the ordinary course of business. The assessment of whether a loss is probable or is a reasonable possibility, and whether the loss or a range of loss is estimable, often involves a series of complex judgments about future events. Management maintains accruals for such losses that are probable of being incurred and subject to reasonable estimation. Management is sometimes unable to estimate an amount or range of a reasonably possible loss in certain situations, including but not limited to when (1) the damages sought are indeterminate, (2) the proceedings are in the early stages, or (3) the matters involve novel or unsettled legal theories. In such cases, there is considerable uncertainty regarding the timing or ultimate resolution of such matters, including a possible eventual loss. For current proceedings not specifically reported herein, management does not anticipate that the ultimate liabilities, if any, arising from such current proceedings would have a material effect on SPS’ financial statements. Unless otherwise required by GAAP, legal fees are expensed as incurred.
Table of Contents
Schedule Q-4 Page 67 of 187
Sponsor: Robinson Case No. 15-00139-UT
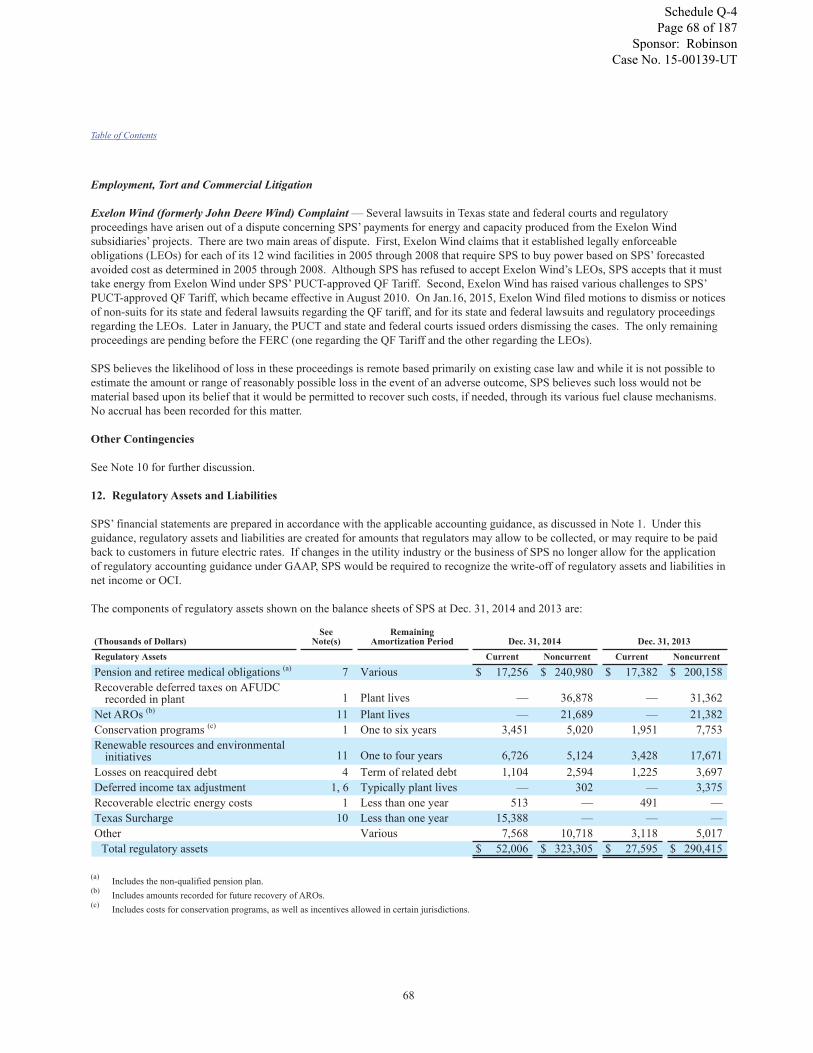
68
Employment, Tort and Commercial Litigation
Exelon Wind (formerly John Deere Wind) Complaint — Several lawsuits in Texas state and federal courts and regulatory proceedings have arisen out of a dispute concerning SPS’ payments for energy and capacity produced from the Exelon Wind subsidiaries’ projects. There are two main areas of dispute. First, Exelon Wind claims that it established legally enforceable obligations (LEOs) for each of its 12 wind facilities in 2005 through 2008 that require SPS to buy power based on SPS’ forecasted avoided cost as determined in 2005 through 2008. Although SPS has refused to accept Exelon Wind’s LEOs, SPS accepts that it must take energy from Exelon Wind under SPS’ PUCT-approved QF Tariff. Second, Exelon Wind has raised various challenges to SPS’ PUCT-approved QF Tariff, which became effective in August 2010. On Jan.16, 2015, Exelon Wind filed motions to dismiss or notices of non-suits for its state and federal lawsuits regarding the QF tariff, and for its state and federal lawsuits and regulatory proceedings regarding the LEOs. Later in January, the PUCT and state and federal courts issued orders dismissing the cases. The only remaining proceedings are pending before the FERC (one regarding the QF Tariff and the other regarding the LEOs).
SPS believes the likelihood of loss in these proceedings is remote based primarily on existing case law and while it is not possible to estimate the amount or range of reasonably possible loss in the event of an adverse outcome, SPS believes such loss would not be material based upon its belief that it would be permitted to recover such costs, if needed, through its various fuel clause mechanisms. No accrual has been recorded for this matter.
Other Contingencies
See Note 10 for further discussion.
12. Regulatory Assets and Liabilities
SPS’ financial statements are prepared in accordance with the applicable accounting guidance, as discussed in Note 1. Under this guidance, regulatory assets and liabilities are created for amounts that regulators may allow to be collected, or may require to be paid back to customers in future electric rates. If changes in the utility industry or the business of SPS no longer allow for the application of regulatory accounting guidance under GAAP, SPS would be required to recognize the write-off of regulatory assets and liabilities in net income or OCI.
The components of regulatory assets shown on the balance sheets of SPS at Dec. 31, 2014 and 2013 are:
(Thousands of Dollars)See
Note(s)Remaining
Amortization Period Dec. 31, 2014 Dec. 31, 2013Regulatory Assets Current Noncurrent Current Noncurrent
Pension and retiree medical obligations (a) 7 Various $ 17,256 $ 240,980 $ 17,382 $ 200,158Recoverable deferred taxes on AFUDC
recorded in plant 1 Plant lives — 36,878 — 31,362Net AROs (b) 11 Plant lives — 21,689 — 21,382Conservation programs (c) 1 One to six years 3,451 5,020 1,951 7,753Renewable resources and environmental
initiatives 11 One to four years 6,726 5,124 3,428 17,671Losses on reacquired debt 4 Term of related debt 1,104 2,594 1,225 3,697Deferred income tax adjustment 1, 6 Typically plant lives — 302 — 3,375Recoverable electric energy costs 1 Less than one year 513 — 491 —Texas Surcharge 10 Less than one year 15,388 — — —Other Various 7,568 10,718 3,118 5,017
Total regulatory assets $ 52,006 $ 323,305 $ 27,595 $ 290,415
(a) Includes the non-qualified pension plan.(b) Includes amounts recorded for future recovery of AROs.(c) Includes costs for conservation programs, as well as incentives allowed in certain jurisdictions.
Table of Contents
Schedule Q-4 Page 68 of 187
Sponsor: Robinson Case No. 15-00139-UT

69
The components of regulatory liabilities shown on the balance sheets of SPS at Dec. 31, 2014 and 2013 are:
(Thousands of Dollars)See
Note(s)Remaining
Amortization Period Dec. 31, 2014 Dec. 31, 2013Regulatory Liabilities Current Noncurrent Current Noncurrent
Plant removal costs 11 Plant lives $ — $ 68,106 $ — $ 53,006Deferred electric energy costs 1 Less than one year 53,971 — 55,395 —
Contract valuation adjustments (a) 1, 9Term of relatedcontract 20,211 2,521 14,243 6,849
Gain from asset sales 10 Various 2,577 4,468 11,172 4,201Conservation programs (b) 1 Less than one year 1,425 — 1,465 —Other Various 9,539 40,093 1,484 17,448
Total regulatory liabilities $ 87,723 $ 115,188 $ 83,759 $ 81,504
(a) Includes the fair value of certain long-term PPAs used to meet energy capacity requirements.(b) Includes costs for conservation programs as well as incentives allowed in certain jurisdictions.
At Dec. 31, 2014 and 2013, approximately $53 million and $30 million of SPS’ regulatory assets represented past expenditures not currently earning a return, respectively. This amount primarily includes certain expenditures associated with renewable resources and environmental initiatives.
13. Other Comprehensive Income
Changes in accumulated other comprehensive loss, net of tax, for the years ended Dec. 31, 2014 and 2013 were as follows:
Gains and Losses on Cash Flow Hedges
(Thousands of Dollars)Year Ended
Dec. 31, 2014Year Ended
Dec. 31, 2013
Accumulated other comprehensive loss at Jan. 1 $ (1,161) $ (1,332)Losses reclassified from net accumulated other comprehensive loss 172 171
Net current period OCI 172 171Accumulated other comprehensive loss at Dec. 31 $ (989) $ (1,161)
Reclassifications from accumulated other comprehensive loss for the years ended Dec. 31, 2014 and 2013 were as follows:
Amounts Reclassified from AccumulatedOther Comprehensive Loss
(Thousands of Dollars)Year Ended
Dec. 31, 2014Year Ended
Dec. 31, 2013
Losses on cash flow hedges:Interest rate derivatives $ 268 (a) $ 268 (a)
Total, pre-tax 268 268Tax benefit (96) (97)
Total amounts reclassified, net of tax $ 172 $ 171
(a) Included in interest charges.
14. Related Party Transactions
Xcel Energy Services Inc. provides management, administrative and other services for the subsidiaries of Xcel Energy Inc., including SPS. The services are provided and billed to each subsidiary in accordance with service agreements executed by each subsidiary. SPS uses the service provided by Xcel Energy Services Inc. whenever possible. Costs are charged directly to the subsidiary and are allocated if they cannot be directly assigned.
Xcel Energy Inc., NSP-Minnesota, PSCo and SPS have established a utility money pool arrangement with the utility subsidiaries. See Note 4 for further discussion of this borrowing arrangement.
Table of Contents
Schedule Q-4 Page 69 of 187
Sponsor: Robinson Case No. 15-00139-UT

70
The table below contains significant affiliate transactions among the companies and related parties for the years ended Dec. 31:
(Thousands of Dollars) 2014 2013 2012
Operating revenues:Electric $ 23 $ 1,331 $ 6,539
Operating expenses:Purchased power 9,614 8,136 9,271Other operating expenses — paid to Xcel Energy Services Inc. 145,917 127,669 117,277
Interest expense 73 178 76Interest income 3 — 10
Accounts receivable and payable with affiliates at Dec. 31 were:
2014 2013
(Thousands of Dollars)Accounts
ReceivableAccountsPayable
AccountsReceivable
AccountsPayable
NSP-Minnesota $ 1,983 $ — $ 3,462 $ —NSP-Wisconsin — 31 — 26PSCo — 5,803 — 1,056Other subsidiaries of Xcel Energy Inc. — 13,956 12,378 14,305
$ 1,983 $ 19,790 $ 15,840 $ 15,387
15. Summarized Quarterly Financial Data (Unaudited)
Quarter Ended(Thousands of Dollars) March 31, 2014 June 30, 2014 Sept. 30, 2014 Dec. 31, 2014
Operating revenues $ 448,400 $ 492,536 $ 552,779 $ 443,655Operating income 42,576 59,000 118,769 45,779Net income 18,735 28,035 66,937 16,145
Quarter Ended(Thousands of Dollars) March 31, 2013 June 30, 2013 Sept. 30, 2013 Dec. 31, 2013
Operating revenues $ 374,257 $ 461,831 $ 481,407 $ 389,592Operating income 33,059 58,469 74,653 43,836Net income 12,584 28,206 35,037 19,350
Item 9 — Changes in and Disagreements with Accountants on Accounting and Financial Disclosure
None.
Item 9A — Controls and Procedures
Disclosure Controls and Procedures
SPS maintains a set of disclosure controls and procedures designed to ensure that information required to be disclosed in the reports that it files or submits under the Securities Exchange Act of 1934 is recorded, processed, summarized, and reported within the time periods specified in SEC rules and forms. In addition, the disclosure controls and procedures ensure that information required to be disclosed is accumulated and communicated to management, including the chief executive officer (CEO) and chief financial officer (CFO), allowing timely decisions regarding required disclosure. As of Dec. 31, 2014, based on an evaluation carried out under the supervision and with the participation of SPS’ management, including the CEO and CFO, of the effectiveness of its disclosure controls and the procedures, the CEO and CFO have concluded that SPS’ disclosure controls and procedures were effective.
Table of Contents
Schedule Q-4 Page 70 of 187
Sponsor: Robinson Case No. 15-00139-UT

71
Internal Control Over Financial Reporting
No change in SPS’ internal control over financial reporting has occurred during SPS’ most recent fiscal quarter that has materially affected, or is reasonably likely to materially affect, SPS’ internal control over financial reporting. SPS maintains internal control over financial reporting to provide reasonable assurance regarding the reliability of the financial reporting. SPS has evaluated and documented its controls in process activities, general computer activities, and on an entity-wide level. During the year and in preparation for issuing its report for the year ended Dec. 31, 2014, on internal controls under section 404 of the Sarbanes-Oxley Act of 2002, SPS conducted testing and monitoring of its internal control over financial reporting. Based on the control evaluation, testing and remediation performed, SPS did not identify any material control weaknesses, as defined under the standards and rules issued by the Public Company Accounting Oversight Board and as approved by the SEC and as indicated in Management Report on Internal Controls herein.
This annual report does not include an attestation report of SPS’ independent registered public accounting firm regarding internal control over financial reporting. Management’s report was not subject to attestation by SPS’ independent registered public accounting firm pursuant to the rules of the SEC that permit SPS to provide only management’s report in this annual report.
Item 9B — Other Information
None.
PART III
Items 10, 11, 12 and 13 of Part III of Form 10-K have been omitted from this report for SPS in accordance with conditions set forth in general instructions I (1) (a) and (b) of Form 10-K for wholly-owned subsidiaries.
Item 10 — Directors, Executive Officers and Corporate Governance
Item 11 — Executive Compensation
Item 12 — Security Ownership of Certain Beneficial Owners and Management and Related Stockholder Matters
Item 13 — Certain Relationships and Related Transactions, and Director Independence
Item 14 — Principal Accountant Fees and Services
Information required under this Item is contained in Xcel Energy Inc.’s Proxy Statement for its 2015 Annual Meeting of Shareholders, which is incorporated by reference.
Table of Contents
Schedule Q-4 Page 71 of 187
Sponsor: Robinson Case No. 15-00139-UT

72
PART IV
Item 15 — Exhibits, Financial Statement Schedules
1. Financial StatementsManagement Report on Internal Controls Over Financial Reporting — For the year ended Dec. 31, 2014.Report of Independent Registered Public Accounting Firm — Financial StatementsStatements of Income — For the three years ended Dec. 31, 2014, 2013 and 2012.Statements of Comprehensive Income — For the three years ended Dec. 31, 2014, 2013 and 2012.Statements of Cash Flows — For the three years ended Dec. 31, 2014, 2013 and 2012.Balance Sheets — As of Dec. 31, 2014 and 2013.Statements of Common Stockholder’s Equity — For the three years ended Dec. 31, 2014, 2013 and 2012.Statements of Capitalization — As of Dec. 31, 2014 and 2013.
2. Schedule II — Valuation and Qualifying Accounts and Reserves for the years ended Dec. 31, 2014, 2013 and 2012.
3. Exhibits
* Indicates incorporation by reference+ Executive Compensation Arrangements and Benefit Plans Covering Executive Officers and Directors
3.01* Amended and Restated Articles of Incorporation dated Sept. 30, 1997 (Exhibit 3(a)(2) to Form 10-K(file no. 001-03789) dated March 3, 1998).
3.02* By-Laws of SPS as Amended and Restated on Sept. 26, 2013. (Exhibit 3.02 to Form 10-Q/A for the quarter ended Sept. 30, 2013 (file no. 001-03789)).
4.01* Indenture dated Feb. 1, 1999 between SPS and The Chase Manhattan Bank (Exhibit 99.2 to Form 8-K (file no.001-03789) dated Feb. 25, 1999).
4.02* Third Supplemental Indenture dated Oct. 1, 2003 to the indenture dated Feb. 1, 1999 between SPS and JPMorgan ChaseBank, as successor Trustee, creating $100 million principal amount of Series C and Series D Notes, 6 percent due 2033(Exhibit 4.04 to Xcel Energy Form 10-Q (file no. 001-03034) for the quarter ended Sept. 30, 2003).
4.03* Fourth Supplemental Indenture dated Oct. 1, 2006 between SPS and The Bank of New York, as successor Trustee(Exhibit 4.01 to Form 8-K (file no. 001-03789) dated Oct. 3, 2006).
4.04* Red River Authority for Texas Indenture of Trust dated July 1, 1991 (Form 10-K, Aug. 31, 1991 -Exhibit 4(b)).4.05* Fifth Supplemental Indenture dated as of Nov. 1, 2008 between SPS and The Bank of New York Mellon Trust Company,
N.A., as successor Trustee, creating $250 million principal amount of Series G Senior Notes, 8.75 percent due2018 (Exhibit 4.01 of Form 8-K of SPS, dated Nov. 14, 2008 (file no. 001-03789)).
4.06* Indenture dated as of Aug. 1, 2011 between SPS and U.S, Bank National Association, as Trustee (Exhibit 4.01 to Form 8-K dated Aug. 10, 2011 (file no. 001-03789)).
4.07* Supplemental Indenture dated as of Aug. 3, 2011 between SPS and U.S. Bank National Association, as Trustee, creating$200 million principal amount of 4.50 percent First Mortgage Bonds, Series No. 1 due 2041 (Exhibit 4.02 to Form 8-Kdated Aug. 10, 2011 (file no. 001-03789)).
4.08* Sixth Supplemental Indenture dated as of June 1, 2014 between SPS and The Bank of New York Mellon Trust Company,N.A., as successor Trustee. (Exhibit 4.03 to SPS’ Form 8-K dated June 2, 2014 (file no. 001-03789)).
4.09* Supplemental Indenture No. 2 dated as of June 1, 2014 between SPS and U.S. Bank National Association, as Trustee.(Exhibit 4.06 to SPS’ Form 8-K dated June 2, 2014 (file no. 001-03789)).
4.10* Supplemental Indenture No. 3 dated as of June 1, 2014 between SPS and U.S. Bank National Association, as Trustee,creating $150 million principal amount of 3.30 percent First Mortgage Bonds, Series No. 3 due 2024. (Exhibit 4.02 toSPS’ Form 8-K dated June 9, 2014 (file no. 001-03789)).
10.01*+ Xcel Energy Inc. Nonqualified Pension Plan (2009 Restatement) (Exhibit 10.02 to Form 10-K of Xcel Energy (file no.001-03034) for the year ended Dec. 31, 2008).
10.02*+ Xcel Energy Senior Executive Severance Change-in-Control Policy (2009 Amendment and Restatement) (Exhibit 10.05to Form 10-K of Xcel Energy (file no. 001-03034) for the year ended Dec. 31, 2008).
10.03*+ Xcel Energy Inc. Non-Employee Directors Deferred Compensation Plan as amended and restated on Jan. 1, 2009(Exhibit 10.08 to Form 10-K of Xcel Energy (file no. 001-03034) for the year ended Dec. 31, 2008).
10.04*+ Form of Services Agreement between Xcel Energy Services Inc. and utility companies (Exhibit H-1 to Form U5B (fileno. 001-03034) dated Nov. 16, 2000).
Table of Contents
Schedule Q-4 Page 72 of 187
Sponsor: Robinson Case No. 15-00139-UT

73
10.05*+ Xcel Energy Inc. Supplemental Executive Retirement Plan as amended and restated Jan. 1, 2009 (Exhibit 10.17 toForm 10-K of Xcel Energy (file no. 001-03034) for the year ended Dec. 31, 2008).
10.06* Coal Supply Agreement (Harrington Station) between SPS and TUCO, dated May 1, 1979 (Form 8-K (file no.001-03789) May 14, 1979 — Exhibit 3).
10.07* Master Coal Service Agreement between Swindell-Dressler Energy Supply Co. and TUCO, dated July 1, 1978 (Form 8-K(file no. 001-03789) May 14, 1979 — Exhibit 5(A)).
10.08* Guaranty of Master Coal Service Agreement between Swindell-Dressler Energy Supply Co. and TUCO (Form 8-K (fileno. 001-03789) May 14, 1979 — Exhibit 5(B)).
10.09* Coal Supply Agreement (Tolk Station) between SPS and TUCO dated April 30, 1979, as amended Nov. 1, 1979 andDec. 30, 1981 (Form 10-Q for the quarter ended Feb. 28, 1982 (file no. 001-03789) — Exhibit 10(b)).
10.10* Master Coal Service Agreement between Wheelabrator Coal Services Co. and TUCO dated Dec. 30, 1981, as amendedNov. 1, 1979 and Dec. 30, 1981 (Form 10-Q fo4r the quarter ended Feb. 28, 1982 (file no. 001-03789) — Exhibit 10(c)).
10.11* Power Purchase Agreement dated May 23, 1997 between Borger Energy Associates, L.P, and SPS.10.12*+ Amendment dated Aug. 26, 2009 to the Xcel Energy Senior Executive Severance and Change-in-Control
Policy (Exhibit 10.06 to Form 10-Q of Xcel Energy (file no. 001-03034) for the quarter ended Sept. 30, 2009).10.13*+ Xcel Energy Executive Annual Incentive Award Plan Form of Restricted Stock Agreement (Exhibit 10.08 to Form 10-Q
of Xcel Energy (file no. 001-03034) for the quarter ended Sept. 30, 2009).10.14*+ Xcel Energy Inc. Executive Annual Incentive Award Plan (as amended and restated effective Feb. 17, 2010) (incorporated
by reference to Appendix A to Schedule 14A, Definitive Proxy Statement to Xcel Energy (file no. 001-03034) dated April6, 2010).
10.15*+ Xcel Energy Inc. 2010 Executive Annual Discretionary Award Plan (Exhibit 10.24 to Form 10-K of Xcel Energy (file no.001-03034) for the year ended Dec. 31, 2009).
10.16*+ Xcel Energy Inc. 2005 Long-Term Incentive Plan (as amended and restated effective Feb. 17, 2010) (incorporated byreference to Appendix B to Schedule 14A, Definitive Proxy Statement to Xcel Energy (file no. 001-03034) dated April 6,2010).
10.17*+ Xcel Energy Inc. 2010 Executive Annual Discretionary Award Plan (as amended and restated effective Dec. 15, 2010)(Exhibit 10.23 to Form 10-K of Xcel Energy (file no. 001-03034) for the year ended Dec. 31, 2010).
10.18*+ Xcel Energy Inc. 2005 Long-Term Incentive Plan Form of Bonus Stock Agreement (Exhibit 10.24 to Form 10-K of XcelEnergy (file no. 001-03034) for the year ended Dec. 31, 2010).
10.19*+Xcel Energy Inc. 2005 Long-Term Incentive Plan Form of Performance Share Agreement (Exhibit 10.25 to Form 10-K ofXcel Energy (file no. 001-03034) for the year ended Dec. 31, 2010).
10.20a*+ Xcel Energy Inc. 2005 Long-Term Incentive Plan Form of Restricted Stock Unit Agreement (Exhibit 10.26 to Form 10-Kof Xcel Energy (file no. 001-03034) for the year ended Dec. 31, 2010).
10.20b*+ Xcel Energy Inc. 2005 Long-Term Incentive Plan Form of Time-Based Restricted Stock Unit Agreement (Exhibit 10.14bto Form 10-K of Xcel Energy (file no. 001-03034) for the year ended Dec. 31, 2012).
10.21*+ Stock Equivalent Plan for Non-Employee Directors of Xcel Energy Inc. as amended and restated effective Feb. 23, 2011(Appendix A to the Xcel Energy Definitive Proxy Statement (file no. 001-03034) filed Apr. 5, 2011).
10.22*+ Xcel Energy Inc. Nonqualified Deferred Compensation Plan (2009 Restatement) (Exhibit 10.07 to Form 10-K of XcelEnergy (file no. 001-03034) for the year ended Dec. 31, 2008).
10.23*+ Second Amendment dated Oct. 26, 2011 to the Xcel Energy Senior Executive Severance and Change-in-Control Policy(Exhibit 10.18 to Form 10-K of Xcel Energy (file no. 001-03034) for the year ended Dec. 31, 2011).
10.24*+ First Amendment effective Nov. 29, 2011 to the Xcel Energy Inc. Nonqualified Deferred Compensation Plan (2009Restatement) (Exhibit 10.17 to Form 10-K of Xcel Energy (file no. 001-03034) for the year ended Dec. 31, 2011).
10.25*+ First Amendment dated Feb. 20, 2013 to the Xcel Energy Inc. Executive Annual Incentive Award Plan (as amended andrestated effective Feb. 17, 2010) (Exhibit 10.01 to Form 10-Q of Xcel Energy (file no. 001-03034) for the quarter endedMarch 31, 2013).
10.26*+ Fourth Amendment dated Feb. 20, 2013 to the Xcel Energy Senior Executive Severance and Change-in-Control Policy(Exhibit 10.02 to Form 10-Q of Xcel Energy (file no. 001-03034) for the quarter ended March 31, 2013).
10.27*+ First Amendment dated May 21, 2013 to the Xcel Energy Inc. 2005 Long Term Incentive Plan (as amended and restatedeffective Feb. 17, 2010) (Exhibit 10.21 to Form 10-Q of Xcel Energy (file no. 001-03034) for the year ended Dec. 31,2013).
10.28*+ Second Amendment dated May 21, 2013 to the Xcel Energy Inc. Nonqualified Deferred Compensation Plan (2009Restatement) (Exhibit 10.22 to Form 10-Q of Xcel Energy (file no. 001-03034) for the year ended Dec. 31, 2013).
10.29*+ Xcel Energy Inc. 2005 Long-Term Incentive Plan Form of Long-Term Incentive Award Agreement (Exhibit 10.23 toForm 10-K of Xcel Energy (file no. 001-03034) for the year ended Dec. 31, 2013).
Table of Contents
Schedule Q-4 Page 73 of 187
Sponsor: Robinson Case No. 15-00139-UT

74
10.30* Amended and Restated Credit Agreement, dated as of Oct. 14, 2014 among SPS, as Borrower, the several lenders fromtime to time parties thereto, JPMorgan Chase Bank, N.A., as Administrative Agent, Bank of America, N.A., and BarclaysBank Plc, as Syndication Agents, and Wells Fargo Bank, National Association, as Documentation Agent (Exhibit 99.04 toForm 8-K of Xcel Energy, dated Oct. 14, 2014 (file no. 001-03034)).Statement of Computation of Ratio of Earnings to Fixed Charges.Consent of Independent Registered Public Accounting Firm.Principal Executive Officer’s certification pursuant to 18 U.S.C. Section 1350, as adopted pursuant to Section 302 of theSarbanes-Oxley Act of 2002.Principal Financial Officer’s certification pursuant to 18 U.S.C. Section 1350, as adopted pursuant to Section 302 of theSarbanes-Oxley Act of 2002.Certification pursuant to 18 U.S.C. Section 1350, as adopted pursuant to Section 906 of the Sarbanes-Oxley Act of 2002.Statement pursuant to Private Securities Litigation Reform Act of 1995.
101 The following materials from SPS’ Annual Report on Form 10-K for the year ended Dec. 31, 2014 are formatted in XBRL(eXtensible Business Reporting Language): (i) the Statements of Income, (ii) the Statements of Comprehensive Income,(iii) the Statements of Cash Flows, (iv) the Balance Sheets, (v) the Statements of Stockholder’s Equity, (vi) the Statementsof Capitalization, (vii) Notes to Financial Statements, (viii) document and entity information, and (ix) Schedule II.
Table of Contents
12.0123.0131.01
31.02
32.0199.01
Schedule Q-4 Page 74 of 187
Sponsor: Robinson Case No. 15-00139-UT

75
SCHEDULE II
SOUTHWESTERN PUBLIC SERVICE CO.VALUATION AND QUALIFYING ACCOUNTSYEARS ENDED DEC. 31, 2014, 2013 AND 2012
(amounts in thousands)
Additions
Balance at Jan. 1
Charged toCosts andExpenses
Charged toOther
Accounts(a)
Deductionsfrom
Reserves (b) Balance at Dec. 31
Allowance for bad debts:2014 $ 5,475 $ 4,137 $ 1,089 $ 4,862 $ 5,8392013 4,722 3,437 1,076 3,760 5,4752012 5,380 2,915 1,202 4,775 4,722
(a) Recovery of amounts previously written off.(b) Principally bad debts written off.
Table of Contents
Schedule Q-4 Page 75 of 187
Sponsor: Robinson Case No. 15-00139-UT

76
SIGNATURES
Pursuant to the requirements of Section 13 or 15(d) of the Securities Exchange Act of 1934, the registrant has duly caused this annual report to be signed on its behalf by the undersigned thereunto duly authorized.
SOUTHWESTERN PUBLIC SERVICE COMPANY
Feb. 23, 2015 /s/ TERESA S. MADDENTeresa S. MaddenExecutive Vice President, Chief Financial Officer and Director(Principal Financial Officer)
Pursuant to the requirements of the Securities Exchange Act of 1934, this report has been signed below by the following persons on behalf of the registrant and in the capacities on the date indicated above.
/s/ BEN FOWKE /s/ DAVID T. HUDSONBen Fowke David T. HudsonChairman, Chief Executive Officer and Director President and Director(Principal Executive Officer)
/s/ TERESA S. MADDEN /s/ JEFFREY S. SAVAGETeresa S. Madden Jeffrey S. SavageExecutive Vice President, Chief Financial Officer andDirector
Senior Vice President, Controller
(Principal Financial Officer) (Principal Accounting Officer)
/s/ MARVIN E. MCDANIEL, JR.Marvin E. McDaniel, Jr.Director
SUPPLEMENTAL INFORMATION TO BE FURNISHED WITH REPORTS FILED PURSUANT TO SECTION 15(D) OF THE ACT BY REGISTRANTS WHICH HAVE NOT REGISTERED SECURITIES PURSUANT TO SECTION 12 OF THE ACT
SPS has not sent, and does not expect to send, an annual report or proxy statement to its security holder.
Table of Contents
Schedule Q-4 Page 76 of 187
Sponsor: Robinson Case No. 15-00139-UT
UNITED STATESSECURITIES AND EXCHANGE COMMISSION
Washington, D.C. 20549
FORM 10-Q(Mark One)
QUARTERLY REPORT PURSUANT TO SECTION 13 OR 15(d) OF THE SECURITIESEXCHANGE ACT OF 1934
For the quarterly period ended March 31, 2014 or
TRANSITION REPORT PURSUANT TO SECTION 13 OR 15(d) OF THE SECURITIESEXCHANGE ACT OF 1934
Commission File Number: 001-03789
Southwestern Public Service Company(Exact name of registrant as specified in its charter)
New Mexico 75-0575400(State or other jurisdiction of incorporation or organization) (I.R.S. Employer Identification No.)
Tyler at Sixth Amarillo, Texas 79101
(Address of principal executive offices) (Zip Code)
(303) 571-7511(Registrant’s telephone number, including area code)
Indicate by check mark whether the registrant (1) has filed all reports required to be filed by Section 13 or 15(d) of the Securities Exchange Act of 1934 during the preceding 12 months (or for such shorter period that the registrant was required to file such reports), and (2) has been subject to such filing requirements for the past 90 days. Yes No
Indicate by check mark whether the registrant has submitted electronically and posted on its corporate Web site, if any, every Interactive Data File required to be submitted and posted pursuant to Rule 405 and Regulation S-T (§232.405 of this chapter) during the preceding 12 months (or for such shorter period that the registrant was required to submit and post such files). Yes No
Indicate by check mark whether the registrant is a large accelerated filer, an accelerated filer, a non-accelerated filer, or a smaller reporting company. See the definitions of “large accelerated filer,” “accelerated filer” and “smaller reporting company” in Rule 12b-2 of the Exchange Act.
Large accelerated filer Accelerated filer Non-accelerated filer Smaller reporting company
(Do not check if smaller reporting company)
Indicate by check mark whether the registrant is a shell company (as defined in Rule 12b-2 of the Exchange Act). Yes No
Indicate the number of shares outstanding of each of the issuer’s classes of common stock, as of the latest practicable date.
Class Outstanding at May 5, 2014
Common Stock, $1 par value 100 shares
Southwestern Public Service Company meets the conditions set forth in General Instruction H (1)(a) and (b) of Form 10-Q and is therefore filing this Form 10-Q with the reduced disclosure format specified in General Instruction H (2) to such Form 10-Q.
Schedule Q-4 Page 77 of 187
Sponsor: Robinson Case No. 15-00139-UT

2
TABLE OF CONTENTS
PART I — FINANCIAL INFORMATIONItem l —Item 2 —Item 4 — PART II — OTHER INFORMATIONItem 1 —Item 1A —Item 4 —Item 5 —Item 6 —
Certifications Pursuant to Section 302 1Certifications Pursuant to Section 906 1Statement Pursuant to Private Litigation 1
This Form 10-Q is filed by Southwestern Public Service Company, a New Mexico corporation (SPS). SPS is a wholly owned subsidiary of Xcel Energy Inc. Xcel Energy Inc. wholly owns the following subsidiaries: Northern States Power Company, a Minnesota corporation (NSP-Minnesota); Northern States Power Company, a Wisconsin corporation (NSP-Wisconsin); Public Service Company of Colorado, a Colorado corporation (PSCo); and SPS. NSP-Minnesota, NSP-Wisconsin, PSCo and SPS are also referred to collectively as utility subsidiaries. Additional information on Xcel Energy Inc. and its subsidiaries (collectively, Xcel Energy) is available on various filings with the Securities and Exchange Commission (SEC).
Financial Statements (Unaudited) 3Management’s Discussion and Analysis of Financial Condition and Results of Operations 19Controls and Procedures 22
Legal Proceedings 23Risk Factors 23Mine Safety Disclosures 23Other Information 23Exhibits 23
SIGNATURES 24
Schedule Q-4 Page 78 of 187
Sponsor: Robinson Case No. 15-00139-UT

3
PART 1 — FINANCIAL INFORMATIONItem 1 — FINANCIAL STATEMENTS
SOUTHWESTERN PUBLIC SERVICE COMPANYSTATEMENTS OF INCOME (UNAUDITED)
(amounts in thousands)
Three Months Ended March 312014 2013
Operating revenues $ 448,400 $ 374,257
Operating expensesElectric fuel and purchased power 289,204 231,234Operating and maintenance expenses 69,398 64,570Demand side management program expenses 3,064 3,040Depreciation and amortization 30,512 30,205Taxes (other than income taxes) 13,646 12,149
Total operating expenses 405,824 341,198
Operating income 42,576 33,059
Other income (expense), net 41 (48)Allowance for funds used during construction — equity 3,640 2,622
Interest charges and financing costsInterest charges — includes other financing costs of
$730 and $736, respectively 19,281 17,773Allowance for funds used during construction — debt (2,127) (1,609)
Total interest charges and financing costs 17,154 16,164
Income before income taxes 29,103 19,469Income taxes 10,368 6,885Net income $ 18,735 $ 12,584
See Notes to Financial Statements
Table of Contents
Schedule Q-4 Page 79 of 187
Sponsor: Robinson Case No. 15-00139-UT

4
SOUTHWESTERN PUBLIC SERVICE COMPANYSTATEMENTS OF COMPREHENSIVE INCOME (UNAUDITED)
(amounts in thousands)
Three Months Ended March 31 2014 2013
Net income $ 18,735 $ 12,584Other comprehensive income Derivative instruments: Reclassification of losses to net income, net of tax of $24 for each of the three months ended
March 31, 2014 and 2013 43 42Other comprehensive income 43 42Comprehensive income $ 18,778 $ 12,626
See Notes to Financial Statements
Table of Contents
Schedule Q-4 Page 80 of 187
Sponsor: Robinson Case No. 15-00139-UT

5
SOUTHWESTERN PUBLIC SERVICE COMPANYSTATEMENTS OF CASH FLOWS (UNAUDITED)
(amounts in thousands)
Three Months Ended March 31 2014 2013Operating activities
Net income $ 18,735 $ 12,584Adjustments to reconcile net income to cash provided by operating activities:
Depreciation and amortization 31,059 30,724Demand side management program amortization 418 418Deferred income taxes 22,166 10,433Amortization of investment tax credits (85) (82)Allowance for equity funds used during construction (3,640) (2,622)Net derivative losses 66 66Changes in operating assets and liabilities:
Accounts receivable 12,526 4,777Accrued unbilled revenues (2,413) (7,384)Inventories 5,131 6,856Prepayments and other (15,455) (10,870)Accounts payable 9,454 11,987Net regulatory assets and liabilities (16,994) (7,047)Other current liabilities 3,908 6,556Pension and other employee benefit obligations (3,513) (20,739)
Change in other noncurrent assets 2,951 (2,593)Change in other noncurrent liabilities 1,758 (2,683)
Net cash provided by operating activities 66,072 30,381
Investing activities Utility capital/construction expenditures (137,637) (106,376)Allowance for equity funds used during construction 3,640 2,622Investments in utility money pool arrangement (10,000) (12,000)Repayments from utility money pool arrangement 10,000 12,000
Net cash used in investing activities (133,997) (103,754)
Financing activities (Repayments of) proceeds from short-term borrowings, net (15,000) 7,000Borrowings under utility money pool arrangement 231,000 49,000Repayments under utility money pool arrangement (169,000) (29,000)Capital contributions from parent 40,000 65,000Dividends paid to parent (18,082) (16,773)
Net cash provided by financing activities 68,918 75,227
Net change in cash and cash equivalents 993 1,854Cash and cash equivalents at beginning of period 1,011 482Cash and cash equivalents at end of period $ 2,004 $ 2,336
Supplemental disclosure of cash flow information: Cash paid for interest (net of amounts capitalized) $ (7,570) $ (5,171)Cash (paid) received for income taxes, net (2,522) 1,015
Supplemental disclosure of non-cash investing transactions: Property, plant and equipment additions in accounts payable $ 30,938 $ 31,586
See Notes to Financial Statements
Table of Contents
Schedule Q-4 Page 81 of 187
Sponsor: Robinson Case No. 15-00139-UT

6
SOUTHWESTERN PUBLIC SERVICE COMPANYBALANCE SHEETS (UNAUDITED)
(amounts in thousands, except share and per share data)
March 31, 2014 Dec. 31, 2013Assets Current assets
Cash and cash equivalents $ 2,004 $ 1,011Accounts receivable, net 67,734 70,951Accounts receivable from affiliates 6,531 15,840Accrued unbilled revenues 111,620 109,207Inventories 32,007 37,138Regulatory assets 30,416 27,595Derivative instruments 13,684 17,826Deferred income taxes 69,655 85,362Prepayments and other 35,026 19,571
Total current assets 368,677 384,501
Property, plant and equipment, net 3,395,274 3,284,030
Other assets Regulatory assets 282,654 290,415Derivative instruments 39,083 41,056Other 14,671 17,068
Total other assets 336,408 348,539Total assets $ 4,100,359 $ 4,017,070
Liabilities and Equity Current liabilities
Short-term debt $ 69,000 $ 84,000Borrowings under utility money pool arrangement 100,000 38,000Accounts payable 162,544 143,879Accounts payable to affiliates 13,809 15,387Regulatory liabilities 60,633 83,759Taxes accrued 16,262 23,584Accrued interest 25,853 16,883Dividends payable 18,181 18,082Derivative instruments 3,574 3,583Other 77,036 75,355
Total current liabilities 546,892 502,512
Deferred credits and other liabilities Deferred income taxes 765,720 757,778Regulatory liabilities 74,258 81,504Asset retirement obligations 19,644 19,375Derivative instruments 33,316 34,207Pension and employee benefit obligations 51,574 55,087Other 4,730 3,051
Total deferred credits and other liabilities 949,242 951,002
Commitments and contingenciesCapitalization
Long-term debt 1,199,937 1,199,865Common stock — 200 shares authorized of $1.00 par value; 100 shares outstanding at
March 31, 2014 and Dec. 31, 2013, respectively — —Additional paid in capital 1,045,463 1,005,463Retained earnings 359,943 359,389Accumulated other comprehensive loss (1,118) (1,161)
Total common stockholder’s equity 1,404,288 1,363,691Total liabilities and equity $ 4,100,359 $ 4,017,070
See Notes to Financial Statements
Table of Contents
Schedule Q-4 Page 82 of 187
Sponsor: Robinson Case No. 15-00139-UT

7
SOUTHWESTERN PUBLIC SERVICE COMPANYNotes to Financial Statements (UNAUDITED)
In the opinion of management, the accompanying unaudited financial statements contain all adjustments necessary to present fairly, in accordance with accounting principles generally accepted in the United States of America (GAAP), the financial position of SPS as of March 31, 2014, and Dec. 31, 2013; the results of its operations, including the components of net income and comprehensive income, for the three months ended March 31, 2014 and 2013; and its cash flows for the three months ended March 31, 2014 and 2013. All adjustments are of a normal, recurring nature, except as otherwise disclosed. Management has also evaluated the impact of events occurring after March 31, 2014 up to the date of issuance of these financial statements. These statements contain all necessary adjustments and disclosures resulting from that evaluation. The Dec. 31, 2013 balance sheet information has been derived from the audited 2013 financial statements included in the SPS Annual Report on Form 10-K for the year ended Dec. 31, 2013. These notes to the financial statements have been prepared pursuant to the rules and regulations of the SEC for Quarterly Reports on Form 10-Q. Certain information and note disclosures normally included in financial statements prepared in accordance with GAAP on an annual basis have been condensed or omitted pursuant to such rules and regulations. For further information, refer to the financial statements and notes thereto included in the SPS Annual Report on Form 10-K for the year ended Dec. 31, 2013, filed with the SEC on Feb. 24, 2014. Due to the seasonality of SPS’ electric sales, interim results are not necessarily an appropriate base from which to project annual results.
1. Summary of Significant Accounting Policies
The significant accounting policies set forth in Note 1 to the financial statements in the SPS Annual Report on Form 10-K for the year ended Dec. 31, 2013, appropriately represent, in all material respects, the current status of accounting policies and are incorporated herein by reference.
2. Accounting Pronouncements
Recently issued accounting pronouncements that have been adopted in the current period did not materially impact the financial statements, and no material impact is expected from accounting pronouncements issued and pending implementation.
3. Selected Balance Sheet Data
(Thousands of Dollars) March 31, 2014 Dec. 31, 2013
Accounts receivable, netAccounts receivable $ 73,543 $ 76,426Less allowance for bad debts (5,809) (5,475)
$ 67,734 $ 70,951
(Thousands of Dollars) March 31, 2014 Dec. 31, 2013
InventoriesMaterials and supplies $ 24,011 $ 21,600Fuel 7,996 15,538
$ 32,007 $ 37,138
(Thousands of Dollars) March 31, 2014 Dec. 31, 2013
Property, plant and equipment, netElectric plant $ 4,789,975 $ 4,714,398Construction work in progress 445,751 388,323
Total property, plant and equipment 5,235,726 5,102,721Less accumulated depreciation (1,840,452) (1,818,691)
$ 3,395,274 $ 3,284,030
4. Income Taxes
Except to the extent noted below, the circumstances set forth in Note 6 to the financial statements included in SPS’ Annual Report on Form 10-K for the year ended Dec. 31, 2013 appropriately represent, in all material respects, the current status of other income tax matters, and are incorporated herein by reference.
Table of Contents
Schedule Q-4 Page 83 of 187
Sponsor: Robinson Case No. 15-00139-UT

8
Federal Audit — SPS is a member of the Xcel Energy affiliated group that files a consolidated federal income tax return. The statute of limitations applicable to Xcel Energy’s 2008 federal income tax return expired in September 2012. The statute of limitations applicable to Xcel Energy’s 2009 federal income tax return expires in June 2015. In the third quarter of 2012, the Internal Revenue Service (IRS) commenced an examination of tax years 2010 and 2011, including the 2009 carryback claim. As of March 31, 2014, the IRS had proposed an adjustment to the federal tax loss carryback claims that would result in $10 million of income tax expense for the 2009 through 2011 claims and the anticipated claim for 2013. SPS is not expected to accrue any income tax expense related to this adjustment. Xcel Energy is continuing to work through the audit process, but the outcome and timing of a resolution is uncertain.
State Audits — SPS is a member of the Xcel Energy affiliated group that files consolidated state income tax returns. As of March 31, 2014, SPS’ earliest open tax year that is subject to examination by state taxing authorities under applicable statutes of limitations is 2009. There are currently no state income tax audits in progress.
Unrecognized Tax Benefits — The unrecognized tax benefit balance includes permanent tax positions, which if recognized would affect the annual effective tax rate (ETR). In addition, the unrecognized tax benefit balance includes temporary tax positions for which the ultimate deductibility is highly certain but for which there is uncertainty about the timing of such deductibility. A change in the period of deductibility would not affect the ETR but would accelerate the payment of cash to the taxing authority to an earlier period.
A reconciliation of the amount of unrecognized tax benefit is as follows:
(Millions of Dollars) March 31, 2014 Dec. 31, 2013
Unrecognized tax benefit — Permanent tax positions $ 0.2 $ 1.2Unrecognized tax benefit — Temporary tax positions 2.3 2.9
Total unrecognized tax benefit $ 2.5 $ 4.1
The unrecognized tax benefit amounts were reduced by the tax benefits associated with net operating loss (NOL) and tax credit carryforwards. The amounts of tax benefits associated with NOL and tax credit carryforwards are as follows:
(Millions of Dollars) March 31, 2014 Dec. 31, 2013
NOL and tax credit carryforwards $ (1.3) $ (2.4)
It is reasonably possible that SPS’ amount of unrecognized tax benefits could significantly change in the next 12 months as the IRS audit progresses and state audits resume. As the IRS examination moves closer to completion, the change in the unrecognized tax benefit is not expected to be material.
The payable for interest related to unrecognized tax benefits is partially offset by the interest benefit associated with NOL and tax credit carryforwards. The payables for interest related to unrecognized tax benefits at March 31, 2014 and Dec. 31, 2013 were not material. No amounts were accrued for penalties related to unrecognized tax benefits as of March 31, 2014 or Dec. 31, 2013.
5. Rate Matters
Except to the extent noted below, the circumstances set forth in Note 10 to the financial statements included in SPS’ Annual Report on Form 10-K for the year ended Dec. 31, 2013 appropriately represent, in all material respects, the current status of other rate matters, and are incorporated herein by reference.
Pending Regulatory Proceedings — Public Utility Commission of Texas (PUCT)
Texas 2014 Electric Rate Case — In January 2014, SPS filed a retail electric rate case in Texas with each of its Texas municipalities and the PUCT for a net increase in annual revenue of approximately $52.7 million, or 5.8 percent. The net increase reflected a base rate increase, revenue credits transferred from base rates to rate riders or the fuel clause, and resetting the Transmission Cost Recovery Factor (TCRF) to zero when the final base rates become effective.
The rate filing was based on a historic test year ending June 2013, a requested return on equity (ROE) of 10.40 percent, an electric rate base of approximately $1.27 billion and an equity ratio of 53.89 percent. The requested rate increase reflected an increase in depreciation expense of approximately $16 million.
Table of Contents
Schedule Q-4 Page 84 of 187
Sponsor: Robinson Case No. 15-00139-UT

9
In April 2014, SPS revised its requested rate increase to approximately $48.1 million, or 5.3 percent, based on updated information. The following table summarizes SPS’ revised request:
(Millions of Dollars) SPS Request
Adjusted base rate increase $ 76.9Resetting TCRF (12.9)Credit to customers for gain on sale to Lubbock moved to a rider (4.9)Adjusted net increase in base revenue 59.1Fuel clause offsets (11.0)Adjusted retail customer net bill impact $ 48.1
The PUCT has suspended SPS’ proposed rates through Oct. 31, 2014. If the PUCT has not issued a final order by July 11, 2014, then SPS’ current rates will not change, but final rates, when approved by the PUCT, will be made effective retroactive to July 12, 2014. SPS, intervenors and other parties have commenced settlement negotiations.
Next steps in the procedural schedule are as follows:
• Intervenor testimony — May 22, 2014;• PUCT Staff testimony — May 29, 2014;• Cross-rebuttal testimony — June 12, 2014;• Rebuttal testimony — June 16, 2014; • Evidentiary hearing — June 25, 2014; and• A PUCT decision and implementation of final rates are anticipated in the third quarter of 2014.
Electric, Purchased Gas and Resource Adjustment Clauses
TCRF Rider — In November 2013, SPS filed with the PUCT to implement the TCRF for Texas retail customers. The requested increase in revenues is $13 million. The PUCT issued an order allowing the TCRF to go into effect on an interim basis effective Jan. 1, 2014. In April and May 2014, several parties including both intervenors and the PUCT Staff filed testimony recommending various reductions or modifications to the proposed TCRF.
Next steps in the procedural schedule are as follows:
• SPS Rebuttal testimony — May 8, 2014; and• Evidentiary hearings — May 15 - May 16, 2014.
Recently Concluded Regulatory Proceedings — New Mexico Public Regulation Commission (NMPRC)
New Mexico 2014 Electric Rate Case — In December 2012, SPS filed an electric rate case in New Mexico with the NMPRC for an increase in annual revenue of approximately $45.9 million effective in 2014. The rate filing was based on a 2014 forecast test year, a requested ROE of 10.65 percent, an electric rate base of $479.8 million and an equity ratio of 53.89 percent.
In September 2013, SPS filed rebuttal testimony, revising its requested rate increase to $32.5 million, based on updated information and an ROE of 10.25 percent. This reflects a base and fuel increase of $20.9 million, an increase of rider revenue of $12.1 million and a decrease to other of $0.5 million.
In March 2014, the NMPRC approved an overall increase of approximately $33.1 million. The increase includes: an ROE of 9.96 percent, an equity ratio of 53.89 percent, allowance of the prepaid pension asset in rate base of approximately $2.4 million, allowance of certain non-labor operating and maintenance (O&M) escalations and recovery of approximately $18.1 million of renewable energy costs through rider revenue instead of base revenue. As a result of a change in the amount of fuel costs recovered through base rates, SPS will no longer be required to credit customers for $2.3 million through the fuel clause adjustment (FCA). Final rates were effective April 5, 2014. On April 25, 2014, the New Mexico Attorney General filed a request for rehearing. The rehearing request is pending with the NMPRC, which has until May 15, 2014 to grant or deny the request.
Table of Contents
Schedule Q-4 Page 85 of 187
Sponsor: Robinson Case No. 15-00139-UT

10
The following table summarizes the NMPRC’s approval from SPS’ revised request:
(Millions of Dollars) NMPRC Approval
SPS revised request, September 2013 $ 32.5Fuel clause adjustment credit — non-renewable energy costs 2.3SPS revised request, fuel adjusted 34.8ROE (9.96 percent) (1.2)Rate rider adjustment — renewable energy costs 6.0Base rate reduction for rate rider — renewable energy costs (6.0)Other, net (0.5)Approved increase, March 2014 $ 33.1
Means of recovery:Base revenue $ 12.7Rider revenue 18.1Fuel clause 2.3
$ 33.1
Pending Regulatory Proceedings — Federal Energy Regulatory Commission (FERC)
2004 FERC Complaint Case Orders — In August 2013, the FERC issued an order on rehearing related to a 2004 Complaint case brought by Golden Spread Electric Cooperative, Inc. (Golden Spread), a wholesale cooperative customer, and Public Service Company of New Mexico (PNM) and an Order on Initial Decision in a subsequent 2006 rate case filed by SPS.
The original Complaint included two key components: 1) PNM’s claim regarding inappropriate allocation of fuel costs and 2) a base rate complaint, including the appropriate demand-related cost allocator. The FERC previously determined that the allocation of fuel costs and the demand-related cost allocator utilized by SPS was appropriate.
In the August 2013 Orders, the FERC clarified its previous ruling on the allocation of fuel costs and reaffirmed that the refunds in question should only apply to firm requirements customers and not PNM’s contractual load. The FERC also reversed its prior demand-related cost allocator decision. The FERC stated that it had erred in its initial analysis and concluded that the SPS system was a 3 coincident peak (CP) rather than a 12CP system.
As of Dec. 31, 2013, SPS had accrued $44.5 million related to these case orders and an additional $1.9 million of principal and interest was accrued during the first quarter of 2014. Pending the timing and resolution of this matter, the annual impact to revenues through 2014 could be up to $6 million and decreasing to $4 million on June 1, 2015.
In September 2013, SPS filed a request for rehearing of the FERC ruling on the CP allocation and refund decisions. SPS asserted that the FERC applied an improper burden of proof and that precedent did not support retroactive refunds. PNM also requested rehearing of the FERC decision not to reverse its prior ruling.
In October 2013, the FERC issued orders further considering the requests for rehearing. These matters are currently pending the FERC’s action. If unsuccessful in its rehearing request, SPS will have the opportunity to file rate cases with the FERC and its retail jurisdictions seeking to change all customers to a 3CP allocation method.
6. Commitments and Contingencies
Except to the extent noted below and in Note 5, the circumstances set forth in Notes 10 and 11 to the financial statements in SPS’ Annual Report on Form 10-K for the year ended Dec. 31, 2013, appropriately represent, in all material respects, the current status of commitments and contingent liabilities and are incorporated herein by reference. The following include commitments, contingencies and unresolved contingencies that are material to SPS’ financial position.
Table of Contents
Schedule Q-4 Page 86 of 187
Sponsor: Robinson Case No. 15-00139-UT

11
Purchased Power Agreements (PPAs)
Under certain PPAs, SPS purchases power from independent power producing entities that own natural gas fueled power plants for which SPS is required to reimburse natural gas fuel costs, or to participate in tolling arrangements under which SPS procures the natural gas required to produce the energy that it purchases. These specific PPAs create a variable interest in the associated independent power producing entity.
SPS had approximately 827 megawatts (MW) of capacity under long-term PPAs as of each of March 31, 2014 and Dec. 31, 2013 with entities that have been determined to be variable interest entities. SPS has concluded that these entities are not required to be consolidated in its financial statements because it does not have the power to direct the activities that most significantly impact the entities’ economic performance. These agreements have expiration dates through the year 2033.
Indemnification Agreements
In connection with the sale of certain Texas electric transmission assets to Sharyland Distribution and Transmission Services, LLC in 2013, SPS agreed to indemnify the purchaser for losses arising out of any breach of the representations, warranties and covenants under the related asset purchase agreement and for losses arising out of certain other matters, including pre-closing liabilities. SPS’ indemnification obligation is capped at $37.1 million, in the aggregate. The indemnification provisions for most representations and warranties expire in December 2014. The remaining representations and warranties, which relate to due organization and transaction authorization, survive indefinitely. As of March 31, 2014 and Dec. 31, 2013, SPS has recorded a $0.4 million liability related to this indemnity.
Environmental Contingencies
Environmental Requirements
Water and wasteFederal Clean Water Act Effluent Limitations Guidelines (ELG) — In June 2013, the U.S. Environmental Protection Agency (EPA) published a proposed ELG rule for power plants that use coal, natural gas, oil or nuclear materials as fuel and discharge treated effluent to surface waters as well as utility-owned landfills that receive coal combustion residuals. The final rule is now expected in September 2015. Under the current proposed rule, facilities would need to comply as soon as possible after July 2017 but no later than July 2022. The impact of this rule on SPS is uncertain at this time.
AirCross-State Air Pollution Rule (CSAPR) — In 2011, the EPA issued the CSAPR to address long range transport of particulate matter (PM) and ozone by requiring reductions in sulfur dioxide (SO2) and nitrous oxide (NOx) from utilities in the eastern half of the United States, including Texas. The CSAPR would set more stringent requirements than the proposed Clean Air Transport Rule and require plants in Texas to reduce their SO2 and annual NOx emissions. The rule would also create an emissions trading program.
In August 2012, the United States Court of Appeals for the District of Columbia Circuit (D.C. Circuit) vacated the CSAPR and remanded it back to the EPA. The D.C. Circuit stated the EPA must continue administering the Clean Air Interstate Rule (CAIR) pending adoption of a valid replacement. In April 2014, the U.S. Supreme Court reversed and remanded the case to the D.C. Circuit. The Court held that the EPA’s rule design did not violate the Clean Air Act and that states had received adequate opportunity to develop their own plans. Because the D.C. Circuit overturned the CSAPR on two over-arching issues, there are many other issues the D.C. Circuit did not rule on that will now need to be considered on remand. Because it is not yet known how the litigation over the remaining issues will be resolved, it is not yet known what requirements may be imposed in the future, or their timing.
As the EPA continues administering the CAIR while the CSAPR or a replacement rule is pending, SPS expects to comply with the CAIR as described below.
CAIR — In 2005, the EPA issued the CAIR to further regulate SO2 and NOx emissions. Under the CAIR’s cap and trade structure, companies can comply through capital investments in emission controls or purchase of emission allowances from other utilities making reductions on their systems. In the SPS region, installation of low-NOx combustion control technology was completed in 2012 on Tolk Unit 1. SPS plans to install the same combustion control technology on Tolk Unit 2 in the second quarter of 2014. These installations will reduce or eliminate SPS’ need to purchase NOx emission allowances. SPS had sufficient SO2 allowances to comply with the CAIR in 2013 and has sufficient allowances through 2015. At March 31, 2014, the estimated annual CAIR NOx allowance cost for SPS did not have a material impact on the results of operations, financial position or cash flows.
Table of Contents
Schedule Q-4 Page 87 of 187
Sponsor: Robinson Case No. 15-00139-UT

12
Regional Haze Rules — In 2005, the EPA amended the best available retrofit technology (BART) requirements of its regional haze rules, which require the installation and operation of emission controls for industrial facilities emitting air pollutants that reduce visibility in certain national parks and wilderness areas. In its first regional haze state implementation plan (SIP), Texas identified the SPS facilities that will have to reduce SO2, NOx and PM emissions under BART and set emissions limits for those facilities.
Harrington Units 1 and 2 are potentially subject to BART. Texas developed a SIP that finds the CAIR equal to BART for electric generating units (EGUs). As a result, no additional controls beyond CAIR compliance would be required. In May 2012, the EPA deferred its review of the SIP in its final rule allowing states to find that CSAPR compliance meets BART requirements for EGUs. It is not yet known how the U.S. Supreme Court’s April 2014 decision on the CSAPR may impact the EPA’s approval of the SIP.
Legal Contingencies
SPS is involved in various litigation matters that are being defended and handled in the ordinary course of business. The assessment of whether a loss is probable or is a reasonable possibility, and whether the loss or a range of loss is estimable, often involves a series of complex judgments about future events. Management maintains accruals for such losses that are probable of being incurred and subject to reasonable estimation. Management is sometimes unable to estimate an amount or range of a reasonably possible loss in certain situations, including but not limited to when (1) the damages sought are indeterminate, (2) the proceedings are in the early stages, or (3) the matters involve novel or unsettled legal theories. In such cases, there is considerable uncertainty regarding the timing or ultimate resolution of such matters, including a possible eventual loss. For current proceedings not specifically reported herein, management does not anticipate that the ultimate liabilities, if any, arising from such current proceedings would have a material effect on SPS’ financial statements. Unless otherwise required by GAAP, legal fees are expensed as incurred.
Employment, Tort and Commercial Litigation
Exelon Wind (formerly John Deere Wind) Complaint — Several lawsuits in Texas state and federal courts and regulatory proceedings have arisen out of a dispute concerning SPS’ payments for energy and capacity produced from the Exelon Wind subsidiaries’ projects. There are two main areas of dispute. First, Exelon Wind claims that it established legally enforceable obligations (LEOs) for each of its 12 wind facilities in 2005 through 2008 that require SPS to buy power based on SPS’ forecasted avoided cost as determined in 2005 through 2008. Although SPS has refused to accept Exelon Wind’s LEOs, SPS accepts that it must take energy from Exelon Wind under SPS’ PUCT-approved Qualifying Facilities (QF) Tariff. Second, Exelon Wind has raised various challenges to SPS’ PUCT-approved QF Tariff, which became effective in August 2010. The state and federal lawsuits and regulatory proceedings are in various stages of litigation, including a pending appeal by SPS in the Fifth Circuit Court of Appeals. SPS believes the likelihood of loss in these lawsuits and proceedings is remote based primarily on existing case law and while it is not possible to estimate the amount or range of reasonably possible loss in the event of an adverse outcome, SPS believes such loss would not be material based upon its belief that it would be permitted to recover such costs, if needed, through its various fuel clause mechanisms. No accrual has been recorded for this matter.
7. Borrowings and Other Financing Instruments
Short-Term Borrowings
Money Pool — Xcel Energy Inc. and its utility subsidiaries have established a money pool arrangement that allows for short-term investments in and borrowings between the utility subsidiaries. Xcel Energy Inc. may make investments in the utility subsidiaries at market-based interest rates; however, the money pool arrangement does not allow the utility subsidiaries to make investments in Xcel Energy Inc. Money pool borrowings for SPS were as follows:
(Amounts in Millions, Except Interest Rates)Three Months Ended
March 31, 2014Twelve Months Ended
Dec. 31, 2013
Borrowing limit $ 100 $ 100Amount outstanding at period end 100 38Average amount outstanding 30 46Maximum amount outstanding 100 100Weighted average interest rate, computed on a daily basis 0.21% 0.15%Weighted average interest rate at period end 0.21 0.25
Table of Contents
Schedule Q-4 Page 88 of 187
Sponsor: Robinson Case No. 15-00139-UT

13
Commercial Paper — SPS meets its short-term liquidity requirements primarily through the issuance of commercial paper and borrowings under its credit facility. Commercial paper outstanding for SPS was as follows:
(Amounts in Millions, Except Interest Rates)Three Months Ended
March 31, 2014Twelve Months Ended
Dec. 31, 2013
Borrowing limit $ 300 $ 300Amount outstanding at period end 69 84Average amount outstanding 103 32Maximum amount outstanding 158 140Weighted average interest rate, computed on a daily basis 0.25% 0.30%Weighted average interest rate at period end 0.24 0.27
Letters of Credit — SPS may use letters of credit, generally with terms of one year, to provide financial guarantees for certain operating obligations. At March 31, 2014 and Dec. 31, 2013, there were $21.0 million and $25.5 million letters of credit outstanding, respectively, under the credit facility. The contract amounts of these letters of credit approximate their fair value and are subject to fees.
Credit Facility — In order to use its commercial paper program to fulfill short-term funding needs, SPS must have a revolving credit facility in place at least equal to the amount of its commercial paper borrowing limit and cannot issue commercial paper in an aggregate amount exceeding available capacity under this credit facility. The line of credit provides short-term financing in the form of notes payable to banks, letters of credit and back-up support for commercial paper borrowings.
At March 31, 2014, SPS had the following committed credit facility available (in millions):
Credit Facility (a) Drawn (b) Available
$ 300.0 $ 90.0 $ 210.0
(a) Credit facility expires in July 2017.(b) Includes outstanding commercial paper and letters of credit.
All credit facility bank borrowings, outstanding letters of credit and outstanding commercial paper reduce the available capacity under the credit facility. SPS had no direct advances on the credit facility outstanding at March 31, 2014 and Dec. 31, 2013.
8. Fair Value of Financial Assets and Liabilities
Fair Value Measurements
The accounting guidance for fair value measurements and disclosures provides a single definition of fair value and requires certain disclosures about assets and liabilities measured at fair value. A hierarchical framework for disclosing the observability of the inputs utilized in measuring assets and liabilities at fair value is established by this guidance. The three levels in the hierarchy are as follows:
Level 1 — Quoted prices are available in active markets for identical assets or liabilities as of the reporting date. The types of assets and liabilities included in Level 1 are highly liquid and actively traded instruments with quoted prices.
Level 2 — Pricing inputs are other than quoted prices in active markets, but are either directly or indirectly observable as of the reporting date. The types of assets and liabilities included in Level 2 are typically either comparable to actively traded securities or contracts, or priced with models using highly observable inputs.
Level 3 — Significant inputs to pricing have little or no observability as of the reporting date. The types of assets and liabilities included in Level 3 are those valued with models requiring significant management judgment or estimation.
Specific valuation methods include the following:
Cash equivalents — The fair values of cash equivalents are generally based on cost plus accrued interest; money market funds are measured using quoted net asset values.
Interest rate derivatives — The fair values of interest rate derivatives are based on broker quotes that utilize current market interest rate forecasts.
Table of Contents
Schedule Q-4 Page 89 of 187
Sponsor: Robinson Case No. 15-00139-UT

14
Commodity derivatives — The methods used to measure the fair value of commodity derivative forwards and options utilize forward prices and volatilities, as well as pricing adjustments for specific delivery locations, and are generally assigned a Level 2. When contractual settlements extend to periods beyond those readily observable on active exchanges or quoted by brokers, the significance of the use of less observable forecasts of long-term forward prices and volatilities on a valuation is evaluated, and may result in Level 3 classification.
Electric commodity derivatives held by SPS include transmission congestion instruments purchased from the Southwest Power Pool, Inc. (SPP), generally referred to as financial transmission rights (FTRs). FTRs purchased from a regional transmission organization (RTO) are financial instruments that entitle or obligate the holder to monthly revenues or charges based on transmission congestion across a given transmission path. The value of an FTR is derived from, and designed to offset, the cost of energy congestion, which is caused by overall transmission load and other transmission constraints. In addition to overall transmission load, congestion is also influenced by the operating schedules of power plants and the consumption of electricity pertinent to a given transmission path. Unplanned plant outages, scheduled plant maintenance, changes in the relative costs of fuels used in generation, weather and overall changes in demand for electricity can each impact the operating schedules of the power plants on the transmission grid and the value of an FTR. The valuation process for FTRs utilizes complex iterative modeling to predict the impacts of forecasted changes in these drivers of transmission system congestion on the historical pricing of FTR purchases.
If forecasted costs of electric transmission congestion increase or decrease for a given FTR path, the value of that particular FTR instrument will likewise increase or decrease. Given the limited observability of management’s forecasts for several of the inputs to this complex valuation model - including expected plant operating schedules and retail and wholesale demand, fair value measurements for FTRs have been assigned a Level 3. Non-trading monthly FTR settlements are expected to be recovered through fuel and purchased energy cost recovery mechanisms, and therefore changes in the fair value of the yet to be settled portions of FTRs are deferred as a regulatory asset or liability. Given this regulatory treatment and the limited magnitude of FTRs relative to the electric utility operations of SPS, the numerous unobservable quantitative inputs to the complex model used for valuation of FTRs are insignificant to the financial statements of SPS.
Derivative Instruments Fair Value Measurements
SPS enters into derivative instruments, including forward contracts, for trading purposes and to manage risk in connection with changes in interest rates and electric utility commodity prices.
Interest Rate Derivatives — SPS may enter into various instruments that effectively fix the interest payments on certain floating rate debt obligations or effectively fix the yield or price on a specified benchmark interest rate for an anticipated debt issuance for a specific period. These derivative instruments are generally designated as cash flow hedges for accounting purposes.
At March 31, 2014, accumulated other comprehensive losses related to interest rate derivatives included $0.2 million of net losses expected to be reclassified into earnings during the next 12 months as the related hedged interest rate transactions impact earnings, including forecasted amounts for unsettled hedges, as applicable.
Wholesale and Commodity Trading Risk — SPS conducts various wholesale and commodity trading activities, including the purchase and sale of electric capacity, energy and energy-related instruments. SPS’ risk management policy allows management to conduct these activities within guidelines and limitations as approved by its risk management committee, which is made up of management personnel not directly involved in the activities governed by this policy.
Commodity Derivatives — SPS enters into derivative instruments to manage variability of future cash flows from changes in commodity prices in its electric utility operations, as well as for trading purposes. This could include the purchase or sale of energy or energy-related products and FTRs.
The following table details the gross notional amounts of commodity FTRs at March 31, 2014 and Dec. 31, 2013:
(Amounts in Thousands) (a) March 31, 2014 Dec. 31, 2013
Megawatt hours of electricity 3,989 5,989
(a) Amounts are not reflective of net positions in the underlying commodities.
Pre-tax losses related to interest rate derivatives reclassified from accumulated other comprehensive loss into earnings were $0.1 million for each of the three months ended March 31, 2014 and 2013.
Table of Contents
Schedule Q-4 Page 90 of 187
Sponsor: Robinson Case No. 15-00139-UT

15
During the three months ended March 31, 2014, changes in the fair value of FTRs resulting in pre-tax net losses of $1.4 million were recognized as regulatory assets and liabilities. The classification as a regulatory asset or liability is based on expected recovery of FTR settlements through fuel and purchased energy cost recovery mechanisms.
FTR settlement gains of $2.8 million were recognized for the three months ended March 31, 2014, recorded to electric fuel and purchased power. These derivative settlement gains and losses are shared with electric customers through fuel and purchased energy cost-recovery mechanisms, and reclassified out of income as regulatory assets or liabilities, as appropriate.
SPS had no derivative instruments designated as fair value hedges during the three months ended March 31, 2014 and 2013. Therefore, no gains or losses from fair value hedges or related hedged transactions were recognized for these periods.
Consideration of Credit Risk and Concentrations — SPS continuously monitors the creditworthiness of the counterparties to its interest rate derivatives and commodity derivative contracts prior to settlement, and assesses each counterparty’s ability to perform on the transactions set forth in the contracts. Given this assessment, as well as an assessment of the impact of SPS’ own credit risk when determining the fair value of derivative liabilities, the impact of considering credit risk was immaterial to the fair value of unsettled commodity derivatives presented in the balance sheets.
SPS employs additional credit risk control mechanisms when appropriate, such as letters of credit, parental guarantees, standardized master netting agreements and termination provisions that allow for offsetting of positive and negative exposures. Credit exposure is monitored and, when necessary, the activity with a specific counterparty is limited until credit enhancement is provided.
SPS’ most significant concentrations of credit risk with particular entities or industries are contracts with counterparties to its wholesale, trading and non-trading commodity and transmission activities. At March 31, 2014, three of SPS’ 10 most significant counterparties for these activities, comprising $16.4 million or 17 percent of this credit exposure, had investment grade credit ratings from Standard & Poor’s Ratings Services, Moody’s Investor Services or Fitch Ratings. The remaining seven significant counterparties, comprising $46.6 million or 48 percent of this credit exposure, were not rated by these agencies, but based on SPS’ internal analysis, had credit quality consistent with investment grade. All 10 of these significant counterparties are RTOs, municipal or cooperative electric entities or other utilities.
Table of Contents
Schedule Q-4 Page 91 of 187
Sponsor: Robinson Case No. 15-00139-UT

16
Recurring Fair Value Measurements — The following table presents for each of the fair value hierarchy levels, SPS’ derivative assets and liabilities measured at fair value on a recurring basis at March 31, 2014:
March 31, 2014Fair Value Fair Value
TotalCounterparty
Netting (b)(Thousands of Dollars) Level 1 Level 2 Level 3 TotalCurrent derivative assetsOther derivative instruments:
Electric commodity $ — $ — $ 10,433 $ 10,433 $ (4,642) $ 5,791Total current derivative assets $ — $ — $ 10,433 $ 10,433 $ (4,642) 5,791
PPAs (a) 7,893Current derivative instruments $ 13,684
Noncurrent derivative assetsPPAs (a) $ 39,083
Noncurrent derivative instruments $ 39,083Current derivative liabilitiesOther derivative instruments:
Electric commodity $ — $ — $ 4,642 $ 4,642 $ (4,642) $ —Total current derivative liabilities $ — $ — $ 4,642 $ 4,642 $ (4,642) —
PPAs (a) 3,574Current derivative instruments $ 3,574
Noncurrent derivative liabilitiesPPAs (a) $ 33,316
Noncurrent derivative instruments $ 33,316
(a) In 2003, as a result of implementing new guidance on the normal purchase exception for derivative accounting, SPS began recording several long-term PPAs at fair value due to accounting requirements related to underlying price adjustments. As these purchases are recovered through normal regulatory recovery mechanisms in the respective jurisdictions, the changes in fair value for these contracts were offset by regulatory assets and liabilities. During 2006, SPS qualified these contracts under the normal purchase exception. Based on this qualification, the contracts are no longer adjusted to fair value and the previous carrying value of these contracts will be amortized over the remaining contract lives along with the offsetting regulatory assets and liabilities.
(b) SPS nets derivative instruments and related collateral in its balance sheet when supported by a legally enforceable master netting agreement, and all derivative instruments and related collateral amounts were subject to master netting agreements at March 31, 2014. At March 31, 2014, derivative assets and liabilities include no obligations to return cash collateral or rights to reclaim cash collateral. The counterparty netting amounts presented exclude settlement receivables and payables and non-derivative amounts that may be subject to the same master netting agreements.
Table of Contents
Schedule Q-4 Page 92 of 187
Sponsor: Robinson Case No. 15-00139-UT

17
The following table presents for each of the fair value hierarchy levels, SPS’ derivative assets and liabilities measured at fair value on a recurring basis at Dec. 31, 2013:
Dec. 31, 2013Fair Value Fair Value
TotalCounterparty
Netting (b)(Thousands of Dollars) Level 1 Level 2 Level 3 TotalCurrent derivative assetsOther derivative instruments:
Electric commodity $ — $ — $ 16,420 $ 16,420 $ (6,487) $ 9,933Total current derivative assets $ — $ — $ 16,420 $ 16,420 $ (6,487) 9,933
PPAs (a) 7,893Current derivative instruments $ 17,826
Noncurrent derivative assetsPPAs (a) $ 41,056
Noncurrent derivative instruments $ 41,056Current derivative liabilitiesOther derivative instruments:
Electric commodity $ — $ — $ 6,487 $ 6,487 $ (6,487) $ —Total current derivative liabilities $ — $ — $ 6,487 $ 6,487 $ (6,487) —
PPAs (a) 3,583Current derivative instruments $ 3,583
Noncurrent derivative liabilitiesPPAs (a) $ 34,207
Noncurrent derivative instruments $ 34,207
(a) In 2003, as a result of implementing new guidance on the normal purchase exception for derivative accounting, SPS began recording several long-term PPAs at fair value due to accounting requirements related to underlying price adjustments. As these purchases are recovered through normal regulatory recovery mechanisms in the respective jurisdictions, the changes in fair value for these contracts were offset by regulatory assets and liabilities. During 2006, SPS qualified these contracts under the normal purchase exception. Based on this qualification, the contracts are no longer adjusted to fair value and the previous carrying value of these contracts will be amortized over the remaining contract lives along with the offsetting regulatory assets and liabilities.
(b) SPS nets derivative instruments and related collateral in its balance sheet when supported by a legally enforceable master netting agreement, and all derivative instruments and related collateral amounts were subject to master netting agreements at Dec. 31, 2013. At Dec. 31, 2013, derivative assets and liabilities include no obligations to return cash collateral or rights to reclaim cash collateral. The counterparty netting amounts presented exclude settlement receivables and payables and non-derivative amounts that may be subject to the same master netting agreements.
The following table presents the changes in Level 3 commodity derivatives for the three months ended March 31, 2014, and there were no Level 3 commodity derivatives during the three months ended March 31, 2013:
(Thousands of Dollars) 2014
Balance at Jan. 1 $ 9,933Purchases 1,056Settlements (1,101)Net transactions recorded during the period:
Losses recognized as regulatory assets and liabilities (4,097)Balance at March 31 $ 5,791
SPS recognizes transfers between levels as of the beginning of each period. There were no transfers of amounts between levels for derivative instruments for the three months ended March 31, 2014 and 2013.
Fair Value of Long-Term Debt
As of March 31, 2014 and Dec. 31, 2013, other financial instruments for which the carrying amount did not equal fair value were as follows:
March 31, 2014 Dec. 31, 2013
(Thousands of Dollars)CarryingAmount Fair Value
CarryingAmount Fair Value
Long-term debt, including current portion $ 1,199,937 $ 1,361,503 $ 1,199,865 $ 1,307,035
Table of Contents
Schedule Q-4 Page 93 of 187
Sponsor: Robinson Case No. 15-00139-UT

18
The fair value of SPS’ long-term debt is estimated based on recent trades and observable spreads from benchmark interest rates for similar securities. The fair value estimates are based on information available to management as of March 31, 2014 and Dec. 31, 2013, and given the observability of the inputs to these estimates, the fair values presented for long-term debt have been assigned a Level 2.
9. Other Income (Expense), Net
Other income (expense), net consisted of the following:
Three Months Ended March 31(Thousands of Dollars) 2014 2013
Interest income $ 187 $ 113Other nonoperating income — 3Insurance policy expense (144) (164)Other nonoperating expense (2) —
Other income (expense), net $ 41 $ (48)
10. Benefit Plans and Other Postretirement Benefits
Components of Net Periodic Benefit Cost (Credit)
Three Months Ended March 312014 2013 2014 2013
(Thousands of Dollars) Pension BenefitsPostretirement Health
Care Benefits
Service cost $ 2,296 $ 2,404 $ 312 $ 342Interest cost 5,111 4,477 643 588Expected return on plan assets (6,545) (5,993) (812) (796)Amortization of prior service cost (credit) 14 218 (100) (121)Amortization of net loss (gain) 3,332 4,287 (80) (2)
Net periodic benefit cost (credit) 4,208 5,393 (37) 11Credits (costs) not recognized due to the effects of regulation 707 (1,075) — —
Net benefit cost (credit) recognized for financial reporting $ 4,915 $ 4,318 $ (37) $ 11
In January 2014, contributions of $130.0 million were made across three of Xcel Energy’s pension plans, of which $4.4 million was attributable to SPS. Xcel Energy does not expect additional pension contributions during 2014.
11. Other Comprehensive Income
Changes in accumulated other comprehensive loss, net of tax, for the three months ended March 31, 2014 and 2013 were as follows:
Gains and Losses onCash Flow Hedges
(Thousands of Dollars)Three Months Ended
March 31, 2014Three Months Ended
March 31, 2013
Accumulated other comprehensive loss at Jan. 1 $ (1,161) $ (1,332)Losses reclassified from net accumulated other comprehensive loss 43 42
Net current period other comprehensive income 43 42Accumulated other comprehensive loss at March 31 $ (1,118) $ (1,290)
Table of Contents
Schedule Q-4 Page 94 of 187
Sponsor: Robinson Case No. 15-00139-UT

19
Reclassifications from accumulated other comprehensive loss for the three months ended March 31, 2014 and 2013 were as follows:
Amounts Reclassified from Accumulated Other Comprehensive Loss
(Thousands of Dollars)Three Months Ended
March 31, 2014Three Months Ended
March 31, 2013
Losses on cash flow hedges: Interest rate derivatives $ 67 (a) $ 66 (a)
Total, pre-tax 67 66 Tax benefit (24) (24)
Total amounts reclassified, net of tax $ 43 $ 42
(a) Included in interest charges.
Item 2 — MANAGEMENT’S DISCUSSION AND ANALYSIS OF FINANCIAL CONDITION AND RESULTS OF OPERATIONS
Discussion of financial condition and liquidity for SPS is omitted per conditions set forth in general instructions H (1) (a) and (b) of Form 10-Q for wholly owned subsidiaries. It is replaced with management’s narrative analysis of the results of operations set forth in general instructions H (2) (a) of Form 10-Q for wholly owned subsidiaries (reduced disclosure format).
Financial Review
The following discussion and analysis by management focuses on those factors that had a material effect on SPS’ financial condition, results of operations, and cash flows during the periods presented, or are expected to have a material impact in the future. It should be read in conjunction with the accompanying unaudited financial statements and the related notes to the financial statements. Due to the seasonality of SPS’ electric sales, such interim results are not necessarily an appropriate base from which to project annual results.
Forward-Looking Statements
Except for the historical statements contained in this report, the matters discussed in the following discussion and analysis are forward-looking statements that are subject to certain risks, uncertainties and assumptions. Such forward-looking statements are intended to be identified in this document by the words “anticipate,” “believe,” “estimate,” “expect,” “intend,” “may,” “objective,” “outlook,” “plan,” “project,” “possible,” “potential,” “should” and similar expressions. Actual results may vary materially. Forward-looking statements speak only as of the date they are made, and we do not undertake any obligation to update them to reflect changes that occur after that date. Factors that could cause actual results to differ materially include, but are not limited to: general economic conditions, including inflation rates, monetary fluctuations and their impact on capital expenditures and the ability of SPS to obtain financing on favorable terms; business conditions in the energy industry, including the risk of a slow down in the U.S. economy or delay in growth recovery; trade, fiscal, taxation and environmental policies in areas where SPS has a financial interest; customer business conditions; actions of credit rating agencies; competitive factors, including the extent and timing of the entry of additional competition in the markets served by SPS; unusual weather; effects of geopolitical events, including war and acts of terrorism; state, federal and foreign legislative and regulatory initiatives that affect cost and investment recovery, have an impact on rates or have an impact on asset operation or ownership or impose environmental compliance conditions; structures that affect the speed and degree to which competition enters the electric market; costs and other effects of legal and administrative proceedings, settlements, investigations and claims; financial or regulatory accounting policies imposed by regulatory bodies; availability or cost of capital; employee work force factors; and the other risk factors listed from time to time by SPS in reports filed with the SEC, including “Risk Factors” in Item 1A of SPS’ Form 10-K for the year ended Dec. 31, 2013, and Item 1A and Exhibit 99.01 to this Quarterly Report on Form 10-Q for the quarter ended March 31, 2014.
Results of Operations
SPS’ net income was approximately $18.7 million for the three months ended March 31, 2014, compared with net income of approximately $12.6 million for the same period in 2013. The increase was primarily due to the positive impact of higher electric rates and interim transmission rider revenue in Texas, partially offset by increased O&M expenses.
Table of Contents
Schedule Q-4 Page 95 of 187
Sponsor: Robinson Case No. 15-00139-UT

20
Electric Revenues and Margin
Electric fuel and purchased power expenses tend to vary with changing retail and wholesale sales requirements and unit cost changes in fuel and purchased power. The design of fuel and purchased power cost recovery mechanisms of the Texas and New Mexico jurisdictions may not allow for complete recovery of all expenses and, therefore, changes in fuel or purchased power costs can impact earnings. The following tables detail the electric revenues and margin:
Three Months Ended March 31(Millions of Dollars) 2014 2013
Electric revenues $ 448 $ 374Electric fuel and purchased power (289) (231)
Electric margin $ 159 $ 143
The following tables summarize the components of the changes in electric revenues and electric margin for the three months ended March 31:
Electric Revenues
(Millions of Dollars) 2014 vs. 2013
Fuel and purchased power cost recovery $ 41Transmission revenue 11Retail rate increase (Texas) 10Trading 5Demand revenue 4Estimated impact of weather 3Retail sales growth 2Firm wholesale (3)Other, net 1
Total increase in electric revenues $ 74
Electric Margin
(Millions of Dollars) 2014 vs. 2013
Retail rate increase (Texas) $ 10Transmission revenue, net of costs 4Demand revenue 4Estimated impact of weather 3Retail sales growth 2Firm wholesale (4)Other, net (3)
Total increase in electric margin $ 16
Non-Fuel Operating Expense and Other Items
O&M Expenses — O&M expenses increased $4.8 million, or 7.5 percent, for the three months ended March 31, 2014 compared with the same period in 2013. The following table summarizes the changes in O&M expenses:
(Millions of Dollars) 2014 vs. 2013
Employee benefits $ 2Electric distribution costs 1Plant generation costs 1Other, net 1
Total increase in O&M expenses $ 5
Table of Contents
Schedule Q-4 Page 96 of 187
Sponsor: Robinson Case No. 15-00139-UT

21
Depreciation and Amortization — Depreciation and amortization increased $0.3 million, or 1.0 percent, for the three months ended March 31, 2014 compared with the same period in 2013. The increase is primarily due to normal system expansion.
Taxes (Other Than Income Taxes) — Taxes (other than income taxes) increased $1.5 million, or 12.3 percent, for the three months ended March 31, 2014 compared with the same period in 2013. The increase is primarily due to an increase in property taxes in Texas.
Allowance for Funds Used During Construction, Equity and Debt (AFUDC) — AFUDC increased $1.5 million for the three months ended March 31, 2014 compared with the same period in 2013. The increase is primarily due to the expansion of transmission facilities.
Interest Charges — Interest charges increased $1.5 million, or 8.5 percent, for the three months ended March 31, 2014 compared with the same period in 2013. The increase is primarily due to higher long-term debt levels, partially offset by lower interest rates.
Income Taxes — Income tax expense increased $3.5 million for the three months ended March 31, 2014 compared with the same period in 2013. The increase in income tax expense was primarily due to higher pretax earnings in 2014. The ETR was 35.6 percent for the three months ended March 31, 2014, compared with 35.4 percent for the same period in 2013.
Public Utility Regulation
SPP Integrated Market (IM) — SPP has operated a regional energy imbalance market since 2007. SPS has recovered related charges and revenues in its retail and wholesale rates. In 2012 and 2013, the FERC approved proposed revisions to the SPP tariff to allow SPP to operate a day ahead/real time energy and ancillary services market similar to the regional market operated by Midcontinent Independent Transmission System Operator, Inc. (MISO). The SPP IM began operations on March 1, 2014. SPS submitted filings to the FERC to modify its wholesale power sales contracts to allow recovery of SPP IM charges and revenues through the SPP wholesale FCA. SPS also requested approval to make sales to the SPP IM at market-based rates, which the FERC approved in February 2014. The FERC approved the FCA tariff filings in April 2014, which were made effective retroactive to March 1, 2014. SPS has also filed changes to its QF tariffs in Texas and New Mexico to allow retail FCA treatment of SPP IM charges and revenues.
Summary of Recent Federal Regulatory Developments
The FERC has jurisdiction over rates for electric transmission service in interstate commerce and electricity sold at wholesale, accounting practices and certain other activities of SPS, including enforcement of North American Electric Reliability Corporation (NERC) mandatory electric reliability standards. State and local agencies have jurisdiction over many of SPS’ activities, including regulation of retail rates and environmental matters. See additional discussion in the summary of recent federal regulatory developments and public utility regulation sections of the SPS Annual Report on Form 10-K for the year ended Dec. 31, 2013. In addition to the matters discussed below, see Note 5 to the financial statements for a discussion of other regulatory matters.
FERC Order 1000, Transmission Planning and Cost Allocation (Order 1000) — In 2011, the FERC issued Order 1000 adopting new requirements for transmission planning, cost allocation and development to be effective prospectively. In Order 1000, the FERC required utilities to develop tariffs that provide for joint regional transmission planning and cost allocation for all FERC-jurisdictional utilities within a region. In addition, Order 1000 required that regions coordinate to develop interregional plans for transmission planning and cost allocation. A key provision of Order 1000 is a requirement that FERC-jurisdictional wholesale transmission tariffs exclude provisions that would grant the incumbent transmission owner a federal Right of First Refusal (ROFR) to build certain types of transmission projects in its service area. Various parties appealed Order 1000 final rules to the D.C. Circuit Court of Appeals. The date for a Court decision in the appeal is uncertain.
The removal of a federal ROFR would eliminate rights that SPS currently has under the SPP tariff to build certain transmission projects within their footprints. Rather, the FERC required that the opportunity to build such projects would extend to competitive transmission developers. Compliance with Order 1000 for SPS will occur through the SPP tariff. SPP made its initial compliance filings to incorporate new provisions into its tariffs regarding regional planning and cost allocation.
Transmission-only subsidiaries (TransCo)Xcel Energy anticipates forming a TransCo that could bid for projects subject to a competitive bidding process in SPP.
Table of Contents
Schedule Q-4 Page 97 of 187
Sponsor: Robinson Case No. 15-00139-UT

22
SPSThe FERC issued its initial order on SPP’s Order 1000 regional compliance filing in July 2013. The FERC identified several areas that will require a further compliance filing by SPP to address regional compliance issues. Among other things, the FERC rejected SPP’s proposal to retain a ROFR for new transmission projects with operational voltages between 100 KV and 300 KV. Requests for rehearing of the FERC’s July 2013 order were filed in August 2013 and are pending the FERC’s action. The further SPP regional compliance filing was filed in November 2013. The SPP regional compliance tariffs went into effect March 1, 2014, subject to the outcome of the additional FERC proceedings. The SPP interregional compliance filing was submitted in July 2013 and is pending the FERC’s action. With respect to ROFR rights of incumbent utilities, Xcel Energy believes that Texas statutes protect the right of incumbent utilities operating outside of ERCOT to construct and own transmission interconnected to their systems, though this view is disputed by some parties. The State of New Mexico does not have legislation protecting ROFR rights for incumbent utilities.
NERC Critical Infrastructure Protection (CIP) Requirements — The FERC has approved version 5 of NERC’s CIP standards. Requirements must be applied to high and medium impact assets by April 1, 2016 and to low impact assets by April 1, 2017. Xcel Energy is currently in the process of evaluating the new requirements and identifying initiatives needed to meet the compliance deadlines. Compliance is anticipated to require activities across the organization, including Business Systems, Transmission, Energy Supply and Security Services.
On March 7, 2014, FERC issued an order directing NERC to develop a new critical infrastructure protection standard related to physical security. The order directs NERC to file this standard for approval with FERC within 90 days. NERC has prepared a draft of the proposed standard for industry review and comment. The NERC Board of Trustees will consider industry input and votes on the standards and submit a final standard to FERC no later than June 5, 2014. Xcel Energy is participating in the standard development process and will submit its comments on the proposal to NERC. Xcel Energy is also in the process of evaluating the potential impact on the company as the standard is being developed.
SPP and MISO Complaints Regarding RTO Joint Operating Agreement (JOA) — SPP and MISO have a longstanding dispute regarding the interpretation of their JOA, which is intended to coordinate RTO operations along the MISO/SPP system boundary. SPP and MISO disagree over MISO’s authority to transmit power over SPP transmission facilities between the traditional MISO region in the Midwest and the Entergy system. Several cases have been filed with the FERC by MISO and SPP. In March 2014, FERC issued an order setting all of the cases for settlement judge proceedings, or hearings if settlement fails. The Xcel Energy utilities have intervened in the various dockets, arguing that non-firm use by MISO should not be subject to SPP transmission charges. If SPP is successful in charging MISO for use of the SPP system, the NSP System would experience higher costs from MISO, which could be material, but SPS would collect revenues from SPP. The outcome of the JOA disputes, and the potential impact on SPS, are uncertain at this time. The settlement judge process began in April 2014.
Item 4 — CONTROLS AND PROCEDURES
Disclosure Controls and Procedures
SPS maintains a set of disclosure controls and procedures designed to ensure that information required to be disclosed in the reports that it files or submits under the Securities Exchange Act of 1934 is recorded, processed, summarized, and reported within the time periods specified in SEC rules and forms. In addition, the disclosure controls and procedures ensure that information required to be disclosed is accumulated and communicated to management, including the chief executive officer (CEO) and chief financial officer (CFO), allowing timely decisions regarding required disclosure. As of March. 31, 2014, based on an evaluation carried out under the supervision and with the participation of SPS’ management, including the CEO and CFO, of the effectiveness of its disclosure controls and the procedures, the CEO and CFO have concluded that SPS’ disclosure controls and procedures were effective.
Internal Control Over Financial Reporting
No change in SPS’ internal control over financial reporting has occurred during SPS’ most recent fiscal quarter that has materially affected, or is reasonably likely to materially affect, SPS’ internal control over financial reporting.
Table of Contents
Schedule Q-4 Page 98 of 187
Sponsor: Robinson Case No. 15-00139-UT

23
Part II — OTHER INFORMATION
Item 1 — LEGAL PROCEEDINGS
SPS is involved in various litigation matters that are being defended and handled in the ordinary course of business. The assessment of whether a loss is probable or is a reasonable possibility, and whether the loss or a range of loss is estimable, often involves a series of complex judgments about future events. Management maintains accruals for such losses that are probable of being incurred and subject to reasonable estimation. Management is sometimes unable to estimate an amount or range of a reasonably possible loss in certain situations, including but not limited to when (1) the damages sought are indeterminate, (2) the proceedings are in the early stages, or (3) the matters involve novel or unsettled legal theories. In such cases, there is considerable uncertainty regarding the timing or ultimate resolution of such matters, including a possible eventual loss.
Additional Information
See Note 6 to the financial statements for further discussion of legal claims and environmental proceedings. See Note 5 to the financial statements for discussion of proceedings involving utility rates and other regulatory matters.
Item 1A — RISK FACTORS
SPS’ risk factors are documented in Item 1A of Part I of its Annual Report on Form 10-K for the year ended Dec. 31, 2013, which is incorporated herein by reference.
Item 4 — MINE SAFETY DISCLOSURES
None.
Item 5 — OTHER INFORMATION
None.
Item 6 — EXHIBITS
* Indicates incorporation by reference
3.01* Amended and Restated Articles of Incorporation of SPS dated Sept. 30, 1997 (Exhibit 3(a)(2) to Form 10-K (file no.001-03789) dated March 3, 1998).
3.02* By-Laws of SPS as Amended and Restated on Sept. 26, 2013. (Exhibit 3.02 to Form 10-Q/A for the quarter ended Sept. 30, 2013 (file no. 001-03789)).Principal Executive Officer’s certifications pursuant to 18 U.S.C. Section 1350, as adopted pursuant to Section 302 of theSarbanes-Oxley Act of 2002.Principal Financial Officer’s certifications pursuant to 18 U.S.C. Section 1350, as adopted pursuant to Section 302 of theSarbanes-Oxley Act of 2002.Certification pursuant to 18 U.S.C. Section 1350, as adopted pursuant to Section 906 of the Sarbanes-Oxley Act of 2002.Statement pursuant to Private Securities Litigation Reform Act of 1995.
101 The following materials from SPS’ Quarterly Report on Form 10-Q for the quarter ended March 31, 2014 are formatted inXBRL (eXtensible Business Reporting Language): (i) the Statements of Income, (ii) the Statements of ComprehensiveIncome (iii) the Statements of Cash Flows, (iv) the Balance Sheets, (v) Notes to Financial Statements, and (vi) document andentity information.
Table of Contents
31.01
31.02
32.0199.01
Schedule Q-4 Page 99 of 187
Sponsor: Robinson Case No. 15-00139-UT

24
SIGNATURES
Pursuant to the requirements of the Securities Exchange Act of 1934, the registrant has duly caused this report to be signed on its behalf by the undersigned thereunto duly authorized.
Southwestern Public Service Company
May 5, 2014 By: /s/ JEFFREY S. SAVAGE Jeffrey S. Savage Vice President and Controller /s/ TERESA S. MADDEN Teresa S. Madden Senior Vice President, Chief Financial Officer and Director
Table of Contents
Schedule Q-4 Page 100 of 187
Sponsor: Robinson Case No. 15-00139-UT

UNITED STATESSECURITIES AND EXCHANGE COMMISSION
Washington, D.C. 20549
FORM 10-Q(Mark One)
QUARTERLY REPORT PURSUANT TO SECTION 13 OR 15(d) OF THE SECURITIESEXCHANGE ACT OF 1934
For the quarterly period ended June 30, 2014 or
TRANSITION REPORT PURSUANT TO SECTION 13 OR 15(d) OF THE SECURITIESEXCHANGE ACT OF 1934
Commission File Number: 001-03789
Southwestern Public Service Company(Exact name of registrant as specified in its charter)
New Mexico 75-0575400(State or other jurisdiction of incorporation or organization) (I.R.S. Employer Identification No.)
Tyler at Sixth Amarillo, Texas 79101
(Address of principal executive offices) (Zip Code)
(303) 571-7511(Registrant’s telephone number, including area code)
Indicate by check mark whether the registrant (1) has filed all reports required to be filed by Section 13 or 15(d) of the Securities Exchange Act of 1934 during the preceding 12 months (or for such shorter period that the registrant was required to file such reports), and (2) has been subject to such filing requirements for the past 90 days. Yes No
Indicate by check mark whether the registrant has submitted electronically and posted on its corporate Web site, if any, every Interactive Data File required to be submitted and posted pursuant to Rule 405 and Regulation S-T (§232.405 of this chapter) during the preceding 12 months (or for such shorter period that the registrant was required to submit and post such files). Yes No
Indicate by check mark whether the registrant is a large accelerated filer, an accelerated filer, a non-accelerated filer, or a smaller reporting company. See the definitions of “large accelerated filer,” “accelerated filer” and “smaller reporting company” in Rule 12b-2 of the Exchange Act.
Large accelerated filer Accelerated filer Non-accelerated filer Smaller reporting company
(Do not check if smaller reporting company)
Indicate by check mark whether the registrant is a shell company (as defined in Rule 12b-2 of the Exchange Act). Yes No
Indicate the number of shares outstanding of each of the issuer’s classes of common stock, as of the latest practicable date.
Class Outstanding at Aug. 1, 2014
Common Stock, $1 par value 100 shares
Southwestern Public Service Company meets the conditions set forth in General Instruction H (1)(a) and (b) of Form 10-Q and is therefore filing this Form 10-Q with the reduced disclosure format specified in General Instruction H (2) to such Form 10-Q.
Schedule Q-4 Page 101 of 187
Sponsor: Robinson Case No. 15-00139-UT

2
TABLE OF CONTENTS
PART I — FINANCIAL INFORMATIONItem l —Item 2 —Item 4 — PART II — OTHER INFORMATIONItem 1 —Item 1A —Item 4 —Item 5 —Item 6 —
Certifications Pursuant to Section 302 1Certifications Pursuant to Section 906 1Statement Pursuant to Private Litigation 1
This Form 10-Q is filed by Southwestern Public Service Company, a New Mexico corporation (SPS). SPS is a wholly owned subsidiary of Xcel Energy Inc. Xcel Energy Inc. wholly owns the following subsidiaries: Northern States Power Company, a Minnesota corporation (NSP-Minnesota); Northern States Power Company, a Wisconsin corporation (NSP-Wisconsin); Public Service Company of Colorado, a Colorado corporation (PSCo); and SPS. NSP-Minnesota, NSP-Wisconsin, PSCo and SPS are also referred to collectively as utility subsidiaries. Additional information on Xcel Energy Inc. and its subsidiaries (collectively, Xcel Energy) is available on various filings with the Securities and Exchange Commission (SEC).
Financial Statements (Unaudited) 3Management’s Discussion and Analysis of Financial Condition and Results of Operations 21Controls and Procedures 25
Legal Proceedings 25Risk Factors 26Mine Safety Disclosures 26Other Information 26Exhibits 26
SIGNATURES 27
Schedule Q-4 Page 102 of 187
Sponsor: Robinson Case No. 15-00139-UT

3
PART 1 — FINANCIAL INFORMATIONItem 1 — FINANCIAL STATEMENTS
SOUTHWESTERN PUBLIC SERVICE COMPANYSTATEMENTS OF INCOME (UNAUDITED)
(amounts in thousands)
Three Months Ended June 30 Six Months Ended June 302014 2013 2014 2013
Operating revenues $ 492,536 $ 461,831 $ 940,936 $ 836,088
Operating expenses Electric fuel and purchased power 314,146 289,012 603,350 520,246Operating and maintenance expenses 68,963 67,451 138,361 132,021Demand side management program expenses 2,849 3,210 5,913 6,250Depreciation and amortization 35,071 31,055 65,583 61,260Taxes (other than income taxes) 12,507 12,634 26,153 24,783
Total operating expenses 433,536 403,362 839,360 744,560
Operating income 59,000 58,469 101,576 91,528
Other (expense) income, net (129) 105 (88) 57Allowance for funds used during construction — equity 2,895 2,200 6,535 4,822
Interest charges and financing costs Interest charges — includes other financing costs of
$731, $739, $1,461 and $1,475, respectively 19,645 17,844 38,926 35,617Allowance for funds used during construction — debt (1,721) (1,410) (3,848) (3,019)
Total interest charges and financing costs 17,924 16,434 35,078 32,598
Income before income taxes 43,842 44,340 72,945 63,809Income taxes 15,807 16,134 26,175 23,019Net income $ 28,035 $ 28,206 $ 46,770 $ 40,790
See Notes to Financial Statements
Table of Contents
Schedule Q-4 Page 103 of 187
Sponsor: Robinson Case No. 15-00139-UT

4
SOUTHWESTERN PUBLIC SERVICE COMPANYSTATEMENTS OF COMPREHENSIVE INCOME (UNAUDITED)
(amounts in thousands)
Three Months Ended June 30 Six Months Ended June 30 2014 2013 2014 2013
Net income $ 28,035 $ 28,206 $ 46,770 $ 40,790Other comprehensive income Derivative instruments: Reclassification of losses to net income, net of tax of $24 and $48 for each
of the three and six months ended June 30, 2014 and 2013, respectively 42 43 85 85Other comprehensive income 42 43 85 85Comprehensive income $ 28,077 $ 28,249 $ 46,855 $ 40,875
See Notes to Financial Statements
Table of Contents
Schedule Q-4 Page 104 of 187
Sponsor: Robinson Case No. 15-00139-UT

5
SOUTHWESTERN PUBLIC SERVICE COMPANYSTATEMENTS OF CASH FLOWS (UNAUDITED)
(amounts in thousands)
Six Months Ended June 30 2014 2013Operating activities
Net income $ 46,770 $ 40,790Adjustments to reconcile net income to cash provided by operating activities:
Depreciation and amortization 66,692 62,304Demand side management program amortization 837 837Deferred income taxes 51,678 26,501Amortization of investment tax credits (170) (164)Allowance for equity funds used during construction (6,535) (4,822)Net derivative losses 133 133Changes in operating assets and liabilities:
Accounts receivable (15,131) (19,542)Accrued unbilled revenues (33,034) (36,171)Inventories 2,022 3,102Prepayments and other (12,786) 4,764Accounts payable 16,949 24,335Net regulatory assets and liabilities (34,055) (27,545)Other current liabilities 1,536 4,724Pension and other employee benefit obligations (3,122) (19,816)
Change in other noncurrent assets 3,558 (3,714)Change in other noncurrent liabilities 2,198 (2,915)
Net cash provided by operating activities 87,540 52,801
Investing activities Utility capital/construction expenditures (281,398) (254,309)Allowance for equity funds used during construction 6,535 4,822Investments in utility money pool arrangement (22,000) (12,000)Repayments from utility money pool arrangement 22,000 12,000
Net cash used in investing activities (274,863) (249,487)
Financing activities Proceeds from short-term borrowings, net 15,000 40,000Proceeds from issuance of long-term debt 148,510 —Borrowings under utility money pool arrangement 382,000 280,000Repayments under utility money pool arrangement (420,000) (214,000)Capital contributions from parent 100,000 125,000Dividends paid to parent (36,264) (33,886)
Net cash provided by financing activities 189,246 197,114
Net change in cash and cash equivalents 1,923 428Cash and cash equivalents at beginning of period 1,011 482Cash and cash equivalents at end of period $ 2,934 $ 910
Supplemental disclosure of cash flow information: Cash paid for interest (net of amounts capitalized) $ (33,668) $ (31,165)Cash received (paid) for income taxes, net 8,705 (1,669)
Supplemental disclosure of non-cash investing transactions: Property, plant and equipment additions in accounts payable $ 22,423 $ 46,739
See Notes to Financial Statements
Table of Contents
Schedule Q-4 Page 105 of 187
Sponsor: Robinson Case No. 15-00139-UT

6
SOUTHWESTERN PUBLIC SERVICE COMPANYBALANCE SHEETS (UNAUDITED)
(amounts in thousands, except share and per share data)
June 30, 2014 Dec. 31, 2013Assets Current assets
Cash and cash equivalents $ 2,934 $ 1,011Accounts receivable, net 91,724 70,951Accounts receivable from affiliates 10,198 15,840Accrued unbilled revenues 142,241 109,207Inventories 35,116 37,138Regulatory assets 31,833 27,595Derivative instruments 41,835 17,826Deferred income taxes 64,313 85,362Prepayments and other 32,357 19,571
Total current assets 452,551 384,501
Property, plant and equipment, net 3,520,730 3,284,030
Other assets Regulatory assets 278,777 290,415Derivative instruments 37,110 41,056Other 14,795 17,068
Total other assets 330,682 348,539Total assets $ 4,303,963 $ 4,017,070
Liabilities and Equity Current liabilities
Short-term debt $ 99,000 $ 84,000Borrowings under utility money pool arrangement — 38,000Accounts payable 163,733 143,879Accounts payable to affiliates 11,600 15,387Regulatory liabilities 77,796 83,759Taxes accrued 17,722 23,584Accrued interest 17,122 16,883Dividends payable 24,369 18,082Derivative instruments 3,565 3,583Other 78,628 75,355
Total current liabilities 493,535 502,512
Deferred credits and other liabilities Deferred income taxes 791,162 757,778Regulatory liabilities 92,382 81,504Asset retirement obligations 19,917 19,375Derivative instruments 32,425 34,207Pension and employee benefit obligations 51,965 55,087Other 5,064 3,051
Total deferred credits and other liabilities 992,915 951,002
Commitments and contingenciesCapitalization
Long-term debt 1,349,518 1,199,865Common stock — 200 shares authorized of $1.00 par value; 100 shares outstanding at
June 30, 2014 and Dec. 31, 2013, respectively — —Additional paid in capital 1,105,463 1,005,463Retained earnings 363,608 359,389Accumulated other comprehensive loss (1,076) (1,161)
Total common stockholder’s equity 1,467,995 1,363,691Total liabilities and equity $ 4,303,963 $ 4,017,070
See Notes to Financial Statements
Table of Contents
Schedule Q-4 Page 106 of 187
Sponsor: Robinson Case No. 15-00139-UT

7
SOUTHWESTERN PUBLIC SERVICE COMPANYNotes to Financial Statements (UNAUDITED)
In the opinion of management, the accompanying unaudited financial statements contain all adjustments necessary to present fairly, in accordance with accounting principles generally accepted in the United States of America (GAAP), the financial position of SPS as of June 30, 2014, and Dec. 31, 2013; the results of its operations, including the components of net income and comprehensive income, for the three and six months ended June 30, 2014 and 2013; and its cash flows for the six months ended June 30, 2014 and 2013. All adjustments are of a normal, recurring nature, except as otherwise disclosed. Management has also evaluated the impact of events occurring after June 30, 2014 up to the date of issuance of these financial statements. These statements contain all necessary adjustments and disclosures resulting from that evaluation. The Dec. 31, 2013 balance sheet information has been derived from the audited 2013 financial statements included in the SPS Annual Report on Form 10-K for the year ended Dec. 31, 2013. These notes to the financial statements have been prepared pursuant to the rules and regulations of the SEC for Quarterly Reports on Form 10-Q. Certain information and note disclosures normally included in financial statements prepared in accordance with GAAP on an annual basis have been condensed or omitted pursuant to such rules and regulations. For further information, refer to the financial statements and notes thereto included in the SPS Annual Report on Form 10-K for the year ended Dec. 31, 2013, filed with the SEC on Feb. 24, 2014. Due to the seasonality of SPS’ electric sales, interim results are not necessarily an appropriate base from which to project annual results.
1. Summary of Significant Accounting Policies
The significant accounting policies set forth in Note 1 to the financial statements in the SPS Annual Report on Form 10-K for the year ended Dec. 31, 2013, appropriately represent, in all material respects, the current status of accounting policies and are incorporated herein by reference.
2. Accounting Pronouncements
Recently Issued
Revenue Recognition - In May 2014, the Financial Accounting Standards Board issued Revenue from Contracts with Customers, Topic 606 (Accounting Standards Update (ASU) No. 2014-09), which provides a framework for the recognition of revenue, with the objective that recognized revenues properly reflect amounts an entity is entitled to receive in exchange for goods and services. This guidance, which includes additional disclosure requirements regarding revenue, cash flows and obligations related to contracts with customers, will be effective for interim and annual reporting periods beginning after Dec. 15, 2016. SPS is currently evaluating the impact of adopting ASU 2014-09 on its financial statements.
3. Selected Balance Sheet Data
(Thousands of Dollars) June 30, 2014 Dec. 31, 2013
Accounts receivable, netAccounts receivable $ 97,260 $ 76,426Less allowance for bad debts (5,536) (5,475)
$ 91,724 $ 70,951
(Thousands of Dollars) June 30, 2014 Dec. 31, 2013
InventoriesMaterials and supplies $ 24,299 $ 21,600Fuel 10,817 15,538
$ 35,116 $ 37,138
(Thousands of Dollars) June 30, 2014 Dec. 31, 2013
Property, plant and equipment, netElectric plant $ 4,991,826 $ 4,714,398Construction work in progress 353,482 388,323
Total property, plant and equipment 5,345,308 5,102,721Less accumulated depreciation (1,824,578) (1,818,691)
$ 3,520,730 $ 3,284,030
Table of Contents
Schedule Q-4 Page 107 of 187
Sponsor: Robinson Case No. 15-00139-UT

8
4. Income Taxes
Except to the extent noted below, the circumstances set forth in Note 6 to the financial statements included in SPS’ Annual Report on Form 10-K for the year ended Dec. 31, 2013 appropriately represent, in all material respects, the current status of other income tax matters, and are incorporated herein by reference.
Federal Audit — SPS is a member of the Xcel Energy affiliated group that files a consolidated federal income tax return. The statute of limitations applicable to Xcel Energy’s 2008 federal income tax return expired in September 2012. The statute of limitations applicable to Xcel Energy’s 2009 federal income tax return expires in June 2015. In the third quarter of 2012, the Internal Revenue Service (IRS) commenced an examination of tax years 2010 and 2011, including a 2009 carryback claim. As of June 30, 2014, the IRS had proposed an adjustment to several federal tax loss carryback claims that would result in $10 million of income tax expense for the 2009 through 2011 claims and the anticipated claim for 2013. SPS is not expected to accrue any income tax expense related to this adjustment. Xcel Energy is continuing to work through the audit process, but the outcome and timing of a resolution is uncertain.
State Audits — SPS is a member of the Xcel Energy affiliated group that files consolidated state income tax returns. As of June 30, 2014, SPS’ earliest open tax year that is subject to examination by state taxing authorities under applicable statutes of limitations is 2009. There are currently no state income tax audits in progress.
Unrecognized Tax Benefits — The unrecognized tax benefit balance includes permanent tax positions, which if recognized would affect the annual effective tax rate (ETR). In addition, the unrecognized tax benefit balance includes temporary tax positions for which the ultimate deductibility is highly certain but for which there is uncertainty about the timing of such deductibility. A change in the period of deductibility would not affect the ETR but would accelerate the payment of cash to the taxing authority to an earlier period.
A reconciliation of the amount of unrecognized tax benefit is as follows:
(Millions of Dollars) June 30, 2014 Dec. 31, 2013
Unrecognized tax benefit — Permanent tax positions $ 0.2 $ 1.2Unrecognized tax benefit — Temporary tax positions 2.5 2.9
Total unrecognized tax benefit $ 2.7 $ 4.1
The unrecognized tax benefit amounts were reduced by the tax benefits associated with net operating loss (NOL) and tax credit carryforwards. The amounts of tax benefits associated with NOL and tax credit carryforwards are as follows:
(Millions of Dollars) June 30, 2014 Dec. 31, 2013
NOL and tax credit carryforwards $ (1.7) $ (2.4)
It is reasonably possible that SPS’ amount of unrecognized tax benefits could significantly change in the next 12 months as the IRS audit progresses and state audits resume. As the IRS examination moves closer to completion, the change in the unrecognized tax benefit is not expected to be material.
The payable for interest related to unrecognized tax benefits is partially offset by the interest benefit associated with NOL and tax credit carryforwards. The payables for interest related to unrecognized tax benefits at June 30, 2014 and Dec. 31, 2013 were not material. No amounts were accrued for penalties related to unrecognized tax benefits as of June 30, 2014 or Dec. 31, 2013.
5. Rate Matters
Except to the extent noted below, the circumstances set forth in Note 10 to the financial statements included in SPS’ Annual Report on Form 10-K for the year ended Dec. 31, 2013 appropriately represent, in all material respects, the current status of other rate matters, and are incorporated herein by reference.
Table of Contents
Schedule Q-4 Page 108 of 187
Sponsor: Robinson Case No. 15-00139-UT

9
Pending Regulatory Proceedings — Public Utility Commission of Texas (PUCT)
Texas 2014 Electric Rate Case — In January 2014, SPS filed a retail electric rate case in Texas with each of its Texas municipalities and the PUCT for a net increase in annual revenue of approximately $52.7 million, or 5.8 percent. The net increase reflected a base rate increase, revenue credits transferred from base rates to rate riders or the fuel clause, and resetting the Transmission Cost Recovery Factor (TCRF) to zero when the final base rates become effective. In April 2014, SPS revised its request to a net increase of $48.1 million, based on updated information.
The rate filing is based on a historic test year ending June 2013, a requested return on equity (ROE) of 10.40 percent, an electric rate base of approximately $1.27 billion and an equity ratio of 53.89 percent. The requested rate increase reflected an increase in depreciation expense of approximately $16 million.
SPS, intervenors, and other parties have commenced settlement negotiations. A final settlement is anticipated to be filed with the PUCT in the third quarter of 2014. A final decision is anticipated later this year and final rates are expected to be effective retroactive to June 1, 2014.
Electric, Purchased Gas and Resource Adjustment Clauses
TCRF Rider — In November 2013, SPS filed with the PUCT to implement the TCRF for Texas retail customers. The requested increase in revenues was $13 million. The PUCT issued an order allowing the TCRF to go into effect on an interim basis effective Jan. 1, 2014. In July 2014, the PUCT approved a settlement agreement between the parties allowing SPS to recover $4 million annually through the TCRF. As of June 30, 2014, SPS had recorded an accrual for estimated refunds.
Recently Concluded Regulatory Proceedings — New Mexico Public Regulation Commission (NMPRC)
New Mexico 2014 Electric Rate Case — In December 2012, SPS filed an electric rate case in New Mexico with the NMPRC for an increase in annual revenue of approximately $45.9 million effective in 2014. The rate filing was based on a 2014 forecast test year, a requested ROE of 10.65 percent, an electric rate base of $479.8 million and an equity ratio of 53.89 percent.
In September 2013, SPS filed rebuttal testimony, revising its requested rate increase to $32.5 million, based on updated information and an ROE of 10.25 percent. The request reflected a base and fuel increase of $20.9 million, an increase of rider revenue of $12.1 million and a decrease to other of $0.5 million.
In March 2014, the NMPRC approved an overall increase of approximately $33.1 million. The increase reflects a base rate increase of $12.7 million and rider recovery of $18.1 million for renewable energy costs, both based on an ROE of 9.96 percent and an equity ratio of 53.89 percent. Final rates were effective April 5, 2014. In April 2014, the New Mexico Attorney General (NMAG) filed a request for rehearing. The rehearing request was denied by the NMPRC. In June 2014, the NMAG filed an appeal of the NMPRC’s denial to the New Mexico Supreme Court. A decision is expected in 2015.
The following table summarizes the NMPRC’s approval from SPS’ revised request:
(Millions of Dollars) NMPRC Approval
SPS revised request, September 2013 $ 32.5Fuel clause adjustment credit — non-renewable energy costs 2.3SPS revised request, fuel adjusted 34.8ROE (9.96 percent) (1.2)Rate rider adjustment — renewable energy costs 6.0Base rate reduction for rate rider — renewable energy costs (6.0)Other, net (0.5)Approved increase, March 2014 $ 33.1
Means of recovery:Base revenue $ 12.7Rider revenue 18.1Fuel clause 2.3
$ 33.1
Table of Contents
Schedule Q-4 Page 109 of 187
Sponsor: Robinson Case No. 15-00139-UT

10
Pending Regulatory Proceedings — Federal Energy Regulatory Commission (FERC)
Wholesale Rate Complaints — In April 2012, Golden Spread Electric Cooperative, Inc. (Golden Spread) filed a rate complaint alleging that the base ROE included in the SPS production formula rate of 10.25 percent, and the SPS transmission base formula rate ROE of 10.77 percent, are unjust and unreasonable. In July 2013, Golden Spread filed a second complaint, again asking that the base ROE in the SPS production and transmission formula rates be reduced to 9.15 and 9.65 percent, respectively.
In June 2014, the FERC issued an order in a different ROE proceeding adopting a new ROE methodology for electric utilities. The new ROE methodology requires electric utilities to use a two-step discounted cash flow analysis to estimate cost of equity that incorporates both short-term and long-term growth projections, instead of only short-term growth. The FERC also issued orders consolidating the Golden Spread complaints and setting them for settlement judge procedures and hearings and indicated the parties should apply the new ROE methodology to this proceeding. The effective dates of the refunds are April 20, 2012 and July 19, 2013. The first settlement conference was held in July 2014 and further settlement conferences are anticipated. SPS continues to evaluate the impact of the new FERC ROE methodology. In July 2014, SPS requested rehearing of the June 2014 orders.
2004 FERC Complaint Case Orders — In August 2013, the FERC issued an order on rehearing related to a 2004 Complaint case brought by Golden Spread, a wholesale cooperative customer, and Public Service Company of New Mexico (PNM) and an Order on Initial Decision in a subsequent 2006 rate case filed by SPS.
The original Complaint included two key components: 1) PNM’s claim regarding inappropriate allocation of fuel costs and 2) a base rate complaint, including the appropriate demand-related cost allocator. The FERC previously determined that the allocation of fuel costs and the demand-related cost allocator utilized by SPS was appropriate.
In the August 2013 Orders, the FERC clarified its previous ruling on the allocation of fuel costs and reaffirmed that the refunds in question should only apply to firm requirements customers and not PNM’s contractual load. The FERC also reversed its prior demand-related cost allocator decision. The FERC stated that it had erred in its initial analysis and concluded that the SPS system was a 3 coincident peak (CP) rather than a 12CP system.
As of Dec. 31, 2013, SPS had accrued $44.5 million related to these case orders and an additional $3.9 million of principal and interest was accrued during the first six months of 2014. Pending the timing and resolution of this matter, the annual impact to revenues through 2014 could be up to $6 million and decreasing to $4 million on June 1, 2015.
In September 2013, SPS filed a request for rehearing of the FERC ruling on the CP allocation and refund decisions. SPS asserted that the FERC applied an improper burden of proof and that precedent did not support retroactive refunds. PNM also requested rehearing of the FERC decision not to reverse its prior ruling.
In October 2013, the FERC issued orders further considering the requests for rehearing. These matters are currently pending the FERC’s action. If unsuccessful in its rehearing request, SPS will have the opportunity to file rate cases with the FERC and its retail jurisdictions seeking to change all customers to a 3CP allocation method.
6. Commitments and Contingencies
Except to the extent noted below and in Note 5, the circumstances set forth in Notes 10 and 11 to the financial statements in SPS’ Annual Report on Form 10-K for the year ended Dec. 31, 2013, appropriately represent, in all material respects, the current status of commitments and contingent liabilities and are incorporated herein by reference. The following include commitments, contingencies and unresolved contingencies that are material to SPS’ financial position.
Purchased Power Agreements (PPAs)
Under certain PPAs, SPS purchases power from independent power producing entities that own natural gas fueled power plants for which SPS is required to reimburse natural gas fuel costs, or to participate in tolling arrangements under which SPS procures the natural gas required to produce the energy that it purchases. These specific PPAs create a variable interest in the associated independent power producing entity.
Table of Contents
Schedule Q-4 Page 110 of 187
Sponsor: Robinson Case No. 15-00139-UT

11
SPS had approximately 827 megawatts (MW) of capacity under long-term PPAs as of each of June 30, 2014 and Dec. 31, 2013 with entities that have been determined to be variable interest entities. SPS has concluded that these entities are not required to be consolidated in its financial statements because it does not have the power to direct the activities that most significantly impact the entities’ economic performance. These agreements have expiration dates through 2033.
Indemnification Agreements
In connection with the sale of certain Texas electric transmission assets to Sharyland Distribution and Transmission Services, LLC in 2013, SPS agreed to indemnify the purchaser for losses arising out of any breach of the representations, warranties and covenants under the related asset purchase agreement and for losses arising out of certain other matters, including pre-closing liabilities. SPS’ indemnification obligation is capped at $37.1 million, in the aggregate. The indemnification provisions for most representations and warranties expire in December 2014. The remaining representations and warranties, which relate to due organization and transaction authorization, survive indefinitely. As of June 30, 2014 and Dec. 31, 2013, SPS has recorded a $0.4 million liability related to this indemnity.
Environmental Contingencies
Environmental Requirements
Water and wasteFederal Clean Water Act (CWA) Effluent Limitations Guidelines (ELG) — In June 2013, the U.S. Environmental Protection Agency (EPA) published a proposed ELG rule for power plants that use coal, natural gas, oil or nuclear materials as fuel and discharge treated effluent to surface waters as well as utility-owned landfills that receive coal combustion residuals. The final rule is now expected in September 2015. Under the current proposed rule, facilities would need to comply as soon as possible after July 2017 but no later than July 2022. The impact of this rule on SPS is uncertain at this time.
Federal CWA Waters of the United States Rule — In April 2014, the EPA and the U.S. Army Corps of Engineers issued a proposed rule that significantly expands the types of water bodies regulated under the CWA. If finalized as proposed, this rule could delay the siting of new pipelines, transmission lines and distribution lines, increase project costs and expand permitting and reporting requirements. The ultimate impact of the proposed rule will depend on the specific requirements of the final rule and cannot be determined at this time. A final rule is not anticipated before the first quarter of 2015.
AirEPA Greenhouse Gas (GHG) Permitting — In 2011, new EPA permitting requirements became effective for GHG emissions of new and modified large stationary sources, which were applicable to the construction of new power plants or power plant modifications that increase emissions above a certain threshold. These rules were upheld by the United States Court of Appeals for the District of Columbia Circuit (D.C. Circuit), but in June 2014 the U.S. Supreme Court reversed the EPA’s GHG emission thresholds for this program. The Supreme Court decided the EPA could not adopt GHG thresholds that would require permitting for new and modified large stationary sources. However, the Supreme Court also decided if a new or modified stationary source becomes subject to the permitting requirements by exceeding emission thresholds for other pollutants, then GHG emissions may be evaluated as part of the permitting process. SPS is unable to determine the cost of compliance with these new EPA requirements as it is not clear whether these requirements will apply to future changes at SPS’ power plants.
GHG Emission Standard for Existing Sources — In June 2014, the EPA published its proposed rule on GHG emission standards for existing power plants. Comments are due to the EPA on Oct. 16, 2014 and a final rule is anticipated in June 2015. Following adoption of the final rule, states must develop implementation plans by June 2016, with the possibility of an extension to June 2017 (June 2018 if submitting a joint plan with other states). Among other things, the proposed rule would require that state plans include enforceable measures to ensure emissions from existing power plants in the state achieve the EPA’s state-specific interim (2020-2029) and final (2030 and thereafter) emission performance targets. The plan will likely require additional emission reductions in states in which SPS operates. It is not possible to evaluate the impact of existing source standards until the EPA promulgates a final rule and states have adopted their applicable state plans.
Table of Contents
Schedule Q-4 Page 111 of 187
Sponsor: Robinson Case No. 15-00139-UT

12
GHG New Source Performance Standard (NSPS) Proposal — In January 2014, the EPA re-proposed a GHG NSPS for newly constructed power plants which would set performance standards (maximum carbon dioxide emission rates) for coal- and natural gas-fired power plants. For coal power plants, the NSPS requires an emissions level equivalent to partial carbon capture and storage (CCS) technology; for gas-fired power plants, the NSPS reflects emissions levels from combined cycle technology with no CCS. The EPA continues to propose that the NSPS not apply to modified or reconstructed existing power plants. In addition, installation of control equipment on existing plants would not constitute a “modification” to those plants under the NSPS program. It is not possible to evaluate the impact of the re-proposed NSPS until its final requirements are known.
GHG NSPS for Modified and Reconstructed Power Plants — In June 2014, the EPA published a proposed NSPS that would apply to GHG emissions from power plants that are modified or reconstructed. Comments are due to the EPA on Oct. 16, 2014 and a final rule is anticipated in June 2015. A modification is a change to an existing source that increases the maximum achievable hourly rate of emissions. A reconstruction involves the replacement of components at a unit to the extent that the capital cost of the new components exceeds 50 percent of the capital cost of an entirely new comparable unit. The proposed standards are not based on and would not require installation of CCS technology. Instead, the proposed standard for coal-fired power plants would require a combination of best operating practices and equipment upgrades. The proposal for gas-fired power plants would require emissions standards based on efficient combined cycle technology. It is not possible to evaluate the impact of these proposed standards until the final requirements are known. In addition, it is not clear whether these requirements, once adopted, would apply to future changes at SPS’ power plants.
Cross-State Air Pollution Rule (CSAPR) — In 2011, the EPA issued the CSAPR to address long range transport of particulate matter (PM) and ozone by requiring reductions in sulfur dioxide (SO2) and nitrous oxide (NOx) from utilities in the eastern half of the United States, including Texas. The CSAPR would set more stringent requirements than the proposed Clean Air Transport Rule and require plants in Texas to reduce their SO2 and annual NOx emissions. The rule would also create an emissions trading program.
In August 2012, the D.C. Circuit vacated the CSAPR and remanded it back to the EPA. The D.C. Circuit stated the EPA must continue administering the Clean Air Interstate Rule (CAIR) pending adoption of a valid replacement. In April 2014, the U.S. Supreme Court reversed and remanded the case to the D.C. Circuit. The Supreme Court held that the EPA’s rule design did not violate the Clean Air Act (CAA) and that states had received adequate opportunity to develop their own plans. Because the D.C. Circuit overturned the CSAPR on two over-arching issues, there are many other issues the D.C. Circuit did not rule on that will now need to be considered on remand. In June 2014, the EPA filed a motion with the D.C. Circuit asking it to lift the stay of the CSAPR. The EPA requested CSAPR’s 2012 compliance obligations be imposed starting in January 2015. The D.C. Circuit has not yet ruled on the motion to lift the stay. Because it is not yet known how the litigation over the remaining issues will be resolved or how the D.C. Circuit will rule on the motion to lift the stay, it is not yet known what requirements may be imposed in the future, or their timing.
As the EPA continues administering the CAIR while the CSAPR or a replacement rule is pending, SPS expects to comply with the CAIR as described below.
CAIR — In 2005, the EPA issued the CAIR to further regulate SO2 and NOx emissions. Under the CAIR’s cap and trade structure, companies can comply through capital investments in emission controls or purchase of emission allowances from other utilities making reductions on their systems. In the SPS region, installation of low-NOx combustion control technology was completed in 2012 on Tolk Unit 1 and in 2014 on Tolk Unit 2. These installations will reduce or eliminate SPS’ need to purchase NOx emission allowances. SPS had sufficient SO2 allowances to comply with the CAIR in 2013 and has sufficient allowances through 2015. At June 30, 2014, the estimated annual CAIR NOx allowance cost for SPS did not have a material impact on the results of operations, financial position or cash flows.
Regional Haze Rules — The regional haze program is designed to address widespread, regionally homogeneous haze that results from emissions from a multitude of sources. In 2005, the EPA amended the best available retrofit technology (BART) requirements of its regional haze rules, which require the installation and operation of emission controls for industrial facilities emitting air pollutants that reduce visibility in certain national parks and wilderness areas. In its first regional haze state implementation plan (SIP), Texas identified the SPS facilities that will have to reduce SO2, NOx and PM emissions under BART and set emissions limits for those facilities.
Harrington Units 1 and 2 are potentially subject to BART. Texas developed a SIP that finds the CAIR equal to BART for electric generating units (EGUs). As a result, no additional controls beyond CAIR compliance would be required. In May 2012, the EPA deferred its review of the SIP in its final rule allowing states to find that CSAPR compliance meets BART requirements for EGUs. It is not yet known how the U.S. Supreme Court’s April 2014 decision on the CSAPR, or the EPA’s June 2014 motion requesting the D.C. Circuit lift its stay of the CSAPR, may impact the EPA’s approval of the BART requirements in the SIP.
Table of Contents
Schedule Q-4 Page 112 of 187
Sponsor: Robinson Case No. 15-00139-UT

13
In May 2014, the EPA issued a request for information under the CAA related to SO2 control equipment at Tolk Units 1 and 2. The EPA stated it is conducting an analysis of the cost and feasibility of SO2 controls on certain sources, including the Tolk facility, as part of its review of the SIP. The EPA has preliminarily identified Tolk as a contributor to haze in the Wichita Mountains Wildlife Refuge in Oklahoma, and is planning further analysis of SO2 control options. The EPA plans to make a proposal in November 2014 that could include SO2 emission controls at Tolk and anticipates issuing a final decision in August 2015. The costs and timing of potential additional SO2 controls at Tolk are dependent on the EPA’s proposal and final decision, neither of which is yet known.
Legal Contingencies
SPS is involved in various litigation matters that are being defended and handled in the ordinary course of business. The assessment of whether a loss is probable or is a reasonable possibility, and whether the loss or a range of loss is estimable, often involves a series of complex judgments about future events. Management maintains accruals for such losses that are probable of being incurred and subject to reasonable estimation. Management is sometimes unable to estimate an amount or range of a reasonably possible loss in certain situations, including but not limited to when (1) the damages sought are indeterminate, (2) the proceedings are in the early stages, or (3) the matters involve novel or unsettled legal theories. In such cases, there is considerable uncertainty regarding the timing or ultimate resolution of such matters, including a possible eventual loss. For current proceedings not specifically reported herein, management does not anticipate that the ultimate liabilities, if any, arising from such current proceedings would have a material effect on SPS’ financial statements. Unless otherwise required by GAAP, legal fees are expensed as incurred.
Employment, Tort and Commercial Litigation
Exelon Wind (formerly John Deere Wind) Complaint — Several lawsuits in Texas state and federal courts and regulatory proceedings have arisen out of a dispute concerning SPS’ payments for energy and capacity produced from the Exelon Wind subsidiaries’ projects. There are two main areas of dispute. First, Exelon Wind claims that it established legally enforceable obligations (LEOs) for each of its 12 wind facilities in 2005 through 2008 that require SPS to buy power based on SPS’ forecasted avoided cost as determined in 2005 through 2008. Although SPS has refused to accept Exelon Wind’s LEOs, SPS accepts that it must take energy from Exelon Wind under SPS’ PUCT-approved Qualifying Facilities (QF) Tariff. Second, Exelon Wind has raised various challenges to SPS’ PUCT-approved QF Tariff, which became effective in August 2010. The state and federal lawsuits and regulatory proceedings are in various stages of litigation, including a pending appeal by SPS in the Fifth Circuit Court of Appeals. SPS believes the likelihood of loss in these lawsuits and proceedings is remote based primarily on existing case law and while it is not possible to estimate the amount or range of reasonably possible loss in the event of an adverse outcome, SPS believes such loss would not be material based upon its belief that it would be permitted to recover such costs, if needed, through its various fuel clause mechanisms. No accrual has been recorded for this matter.
7. Borrowings and Other Financing Instruments
Short-Term Borrowings
Money Pool — Xcel Energy Inc. and its utility subsidiaries have established a money pool arrangement that allows for short-term investments in and borrowings between the utility subsidiaries. Xcel Energy Inc. may make investments in the utility subsidiaries at market-based interest rates; however, the money pool arrangement does not allow the utility subsidiaries to make investments in Xcel Energy Inc. Money pool borrowings for SPS were as follows:
(Amounts in Millions, Except Interest Rates)Three Months Ended
June 30, 2014Twelve Months Ended
Dec. 31, 2013
Borrowing limit $ 100 $ 100Amount outstanding at period end — 38Average amount outstanding 6 46Maximum amount outstanding 54 100Weighted average interest rate, computed on a daily basis 0.23% 0.15%Weighted average interest rate at period end N/A 0.25
Table of Contents
Schedule Q-4 Page 113 of 187
Sponsor: Robinson Case No. 15-00139-UT

14
Commercial Paper — SPS meets its short-term liquidity requirements primarily through the issuance of commercial paper and borrowings under its credit facility. Commercial paper outstanding for SPS was as follows:
(Amounts in Millions, Except Interest Rates)Three Months Ended
June 30, 2014Twelve Months Ended
Dec. 31, 2013
Borrowing limit $ 300 $ 300Amount outstanding at period end 99 84Average amount outstanding 165 32Maximum amount outstanding 241 140Weighted average interest rate, computed on a daily basis 0.25% 0.30%Weighted average interest rate at period end 0.27 0.27
Letters of Credit — SPS may use letters of credit, generally with terms of one year, to provide financial guarantees for certain operating obligations. At June 30, 2014 and Dec. 31, 2013, there were $41.0 million and $25.5 million letters of credit outstanding, respectively, under the credit facility. The contract amounts of these letters of credit approximate their fair value and are subject to fees.
Credit Facility — In order to use its commercial paper program to fulfill short-term funding needs, SPS must have a revolving credit facility in place at least equal to the amount of its commercial paper borrowing limit and cannot issue commercial paper in an aggregate amount exceeding available capacity under this credit facility. The line of credit provides short-term financing in the form of notes payable to banks, letters of credit and back-up support for commercial paper borrowings.
At June 30, 2014, SPS had the following committed credit facility available (in millions):
Credit Facility (a) Drawn (b) Available
$ 300.0 $ 140.0 $ 160.0
(a) Credit facility expires in July 2017.(b) Includes outstanding commercial paper and letters of credit.
All credit facility bank borrowings, outstanding letters of credit and outstanding commercial paper reduce the available capacity under the credit facility. SPS had no direct advances on the credit facility outstanding at June 30, 2014 and Dec. 31, 2013.
Long-Term Borrowings
In June 2014, SPS issued $150 million of 3.30 percent first mortgage bonds due June 15, 2024.
In connection with SPS’ issuance of $150 million of 3.30 percent first mortgage bonds due June 15, 2024, SPS issued $250 million of collateral 8.75 percent first mortgage bonds due Dec. 1, 2018 to the trustee under its senior unsecured indenture in order to secure its previously issued Series G Senior Notes, 8.75 percent due Dec. 1, 2018, equally and ratably with SPS’ first mortgage bonds as required by the terms of such Series G Senior Notes. 8. Fair Value of Financial Assets and Liabilities
Fair Value Measurements
The accounting guidance for fair value measurements and disclosures provides a single definition of fair value and requires certain disclosures about assets and liabilities measured at fair value. A hierarchical framework for disclosing the observability of the inputs utilized in measuring assets and liabilities at fair value is established by this guidance. The three levels in the hierarchy are as follows:
Level 1 — Quoted prices are available in active markets for identical assets or liabilities as of the reporting date. The types of assets and liabilities included in Level 1 are highly liquid and actively traded instruments with quoted prices.
Level 2 — Pricing inputs are other than quoted prices in active markets, but are either directly or indirectly observable as of the reporting date. The types of assets and liabilities included in Level 2 are typically either comparable to actively traded securities or contracts, or priced with models using highly observable inputs.
Table of Contents
Schedule Q-4 Page 114 of 187
Sponsor: Robinson Case No. 15-00139-UT

15
Level 3 — Significant inputs to pricing have little or no observability as of the reporting date. The types of assets and liabilities included in Level 3 are those valued with models requiring significant management judgment or estimation.
Specific valuation methods include the following:
Cash equivalents — The fair values of cash equivalents are generally based on cost plus accrued interest; money market funds are measured using quoted net asset values.
Interest rate derivatives — The fair values of interest rate derivatives are based on broker quotes that utilize current market interest rate forecasts.
Commodity derivatives — The methods used to measure the fair value of commodity derivative forwards and options utilize forward prices and volatilities, as well as pricing adjustments for specific delivery locations, and are generally assigned a Level 2. When contractual settlements extend to periods beyond those readily observable on active exchanges or quoted by brokers, the significance of the use of less observable forecasts of long-term forward prices and volatilities on a valuation is evaluated, and may result in Level 3 classification.
Electric commodity derivatives held by SPS include transmission congestion instruments purchased from the Southwest Power Pool, Inc. (SPP), generally referred to as financial transmission rights (FTRs). FTRs purchased from a regional transmission organization (RTO) are financial instruments that entitle or obligate the holder to monthly revenues or charges based on transmission congestion across a given transmission path. The value of an FTR is derived from, and designed to offset, the cost of energy congestion, which is caused by overall transmission load and other transmission constraints. In addition to overall transmission load, congestion is also influenced by the operating schedules of power plants and the consumption of electricity pertinent to a given transmission path. Unplanned plant outages, scheduled plant maintenance, changes in the relative costs of fuels used in generation, weather and overall changes in demand for electricity can each impact the operating schedules of the power plants on the transmission grid and the value of an FTR. The valuation process for FTRs utilizes complex iterative modeling to predict the impacts of forecasted changes in these drivers of transmission system congestion on the historical pricing of FTR purchases.
If forecasted costs of electric transmission congestion increase or decrease for a given FTR path, the value of that particular FTR instrument will likewise increase or decrease. Given the limited observability of management’s forecasts for several of the inputs to this complex valuation model - including expected plant operating schedules and retail and wholesale demand, fair value measurements for FTRs have been assigned a Level 3. Non-trading monthly FTR settlements are expected to be recovered through fuel and purchased energy cost recovery mechanisms, and therefore changes in the fair value of the yet to be settled portions of FTRs are deferred as a regulatory asset or liability. Given this regulatory treatment and the limited magnitude of FTRs relative to the electric utility operations of SPS, the numerous unobservable quantitative inputs to the complex model used for valuation of FTRs are insignificant to the financial statements of SPS.
Derivative Instruments Fair Value Measurements
SPS enters into derivative instruments, including forward contracts, for trading purposes and to manage risk in connection with changes in interest rates and electric utility commodity prices.
Interest Rate Derivatives — SPS may enter into various instruments that effectively fix the interest payments on certain floating rate debt obligations or effectively fix the yield or price on a specified benchmark interest rate for an anticipated debt issuance for a specific period. These derivative instruments are generally designated as cash flow hedges for accounting purposes.
At June 30, 2014, accumulated other comprehensive losses related to interest rate derivatives included $0.2 million of net losses expected to be reclassified into earnings during the next 12 months as the related hedged interest rate transactions impact earnings, including forecasted amounts for unsettled hedges, as applicable.
Wholesale and Commodity Trading Risk — SPS conducts various wholesale and commodity trading activities, including the purchase and sale of electric capacity, energy and energy-related instruments. SPS’ risk management policy allows management to conduct these activities within guidelines and limitations as approved by its risk management committee, which is made up of management personnel not directly involved in the activities governed by this policy.
Table of Contents
Schedule Q-4 Page 115 of 187
Sponsor: Robinson Case No. 15-00139-UT

16
Commodity Derivatives — SPS enters into derivative instruments to manage variability of future cash flows from changes in commodity prices in its electric utility operations, as well as for trading purposes. This could include the purchase or sale of energy or energy-related products and FTRs.
The following table details the gross notional amounts of commodity FTRs at June 30, 2014 and Dec. 31, 2013:
(Amounts in Thousands) (a) June 30, 2014 Dec. 31, 2013
Megawatt hours of electricity 16,190 5,989
(a) Amounts are not reflective of net positions in the underlying commodities.
Pre-tax losses related to interest rate derivatives reclassified from accumulated other comprehensive loss into earnings were $0.1 million for each of the three and six months ended June 30, 2014 and 2013.
During the three and six months ended June 30, 2014, changes in the fair value of FTRs resulting in pre-tax net losses of $1.0 million and $2.4 million, respectively, were recognized as regulatory assets and liabilities. The classification as a regulatory asset or liability is based on expected recovery of FTR settlements through fuel and purchased energy cost recovery mechanisms.
FTR settlement losses of $1.9 million and gains of $0.9 million were recognized for the three and six months ended June 30, 2014, respectively, recorded to electric fuel and purchased power. These derivative settlement gains and losses are shared with electric customers through fuel and purchased energy cost-recovery mechanisms, and reclassified out of income as regulatory assets or liabilities, as appropriate.
SPS had no derivative instruments designated as fair value hedges during the three and six months ended June 30, 2014 and 2013. Therefore, no gains or losses from fair value hedges or related hedged transactions were recognized for these periods.
Consideration of Credit Risk and Concentrations — SPS continuously monitors the creditworthiness of the counterparties to its interest rate derivatives and commodity derivative contracts prior to settlement, and assesses each counterparty’s ability to perform on the transactions set forth in the contracts. Given this assessment, as well as an assessment of the impact of SPS’ own credit risk when determining the fair value of derivative liabilities, the impact of considering credit risk was immaterial to the fair value of unsettled commodity derivatives presented in the balance sheets.
SPS employs additional credit risk control mechanisms when appropriate, such as letters of credit, parental guarantees, standardized master netting agreements and termination provisions that allow for offsetting of positive and negative exposures. Credit exposure is monitored and, when necessary, the activity with a specific counterparty is limited until credit enhancement is provided.
SPS’ most significant concentrations of credit risk with particular entities or industries are contracts with counterparties to its wholesale, trading and non-trading commodity and transmission activities. At June 30, 2014, one of SPS’ eight most significant counterparties for these activities, comprising $20.6 million or 19 percent of this credit exposure, had investment grade credit ratings from Standard & Poor’s Ratings Services, Moody’s Investor Services or Fitch Ratings. The remaining seven significant counterparties, comprising $47.6 million or 45 percent of this credit exposure, were not rated by these agencies, but based on SPS’ internal analysis, had credit quality consistent with investment grade. All eight of these significant counterparties are RTOs, municipal or cooperative electric entities or other utilities.
Table of Contents
Schedule Q-4 Page 116 of 187
Sponsor: Robinson Case No. 15-00139-UT

17
Recurring Fair Value Measurements — The following table presents for each of the fair value hierarchy levels, SPS’ derivative assets and liabilities measured at fair value on a recurring basis at June 30, 2014:
June 30, 2014
Fair ValueFair Value
TotalCounterparty
Netting (b)(Thousands of Dollars) Level 1 Level 2 Level 3 Total
Current derivative assetsOther derivative instruments:
Electric commodity $ — $ — $ 57,572 $ 57,572 $ (23,630) $ 33,942Total current derivative assets $ — $ — $ 57,572 $ 57,572 $ (23,630) 33,942
PPAs (a) 7,893Current derivative instruments $ 41,835
Noncurrent derivative assets PPAs (a) $ 37,110
Noncurrent derivative instruments $ 37,110Current derivative liabilitiesOther derivative instruments:
Electric commodity $ — $ — $ 23,630 $ 23,630 $ (23,630) $ —Total current derivative liabilities $ — $ — $ 23,630 $ 23,630 $ (23,630) —
PPAs (a) 3,565Current derivative instruments $ 3,565
Noncurrent derivative liabilities PPAs (a) $ 32,425
Noncurrent derivative instruments $ 32,425
(a) In 2003, as a result of implementing new guidance on the normal purchase exception for derivative accounting, SPS began recording several long-term PPAs at fair value due to accounting requirements related to underlying price adjustments. As these purchases are recovered through normal regulatory recovery mechanisms in the respective jurisdictions, the changes in fair value for these contracts were offset by regulatory assets and liabilities. During 2006, SPS qualified these contracts under the normal purchase exception. Based on this qualification, the contracts are no longer adjusted to fair value and the previous carrying value of these contracts will be amortized over the remaining contract lives along with the offsetting regulatory assets and liabilities.
(b) SPS nets derivative instruments and related collateral in its balance sheet when supported by a legally enforceable master netting agreement, and all derivative instruments and related collateral amounts were subject to master netting agreements at June 30, 2014. At June 30, 2014, derivative assets and liabilities include no obligations to return cash collateral or rights to reclaim cash collateral. The counterparty netting amounts presented exclude settlement receivables and payables and non-derivative amounts that may be subject to the same master netting agreements.
Table of Contents
Schedule Q-4 Page 117 of 187
Sponsor: Robinson Case No. 15-00139-UT

18
The following table presents for each of the fair value hierarchy levels, SPS’ derivative assets and liabilities measured at fair value on a recurring basis at Dec. 31, 2013:
Dec. 31, 2013
Fair ValueFair Value
TotalCounterparty
Netting (b)(Thousands of Dollars) Level 1 Level 2 Level 3 Total
Current derivative assetsOther derivative instruments:
Electric commodity $ — $ — $ 16,420 $ 16,420 $ (6,487) $ 9,933Total current derivative assets $ — $ — $ 16,420 $ 16,420 $ (6,487) 9,933
PPAs (a) 7,893Current derivative instruments $ 17,826
Noncurrent derivative assets PPAs (a) $ 41,056
Noncurrent derivative instruments $ 41,056Current derivative liabilitiesOther derivative instruments:
Electric commodity $ — $ — $ 6,487 $ 6,487 $ (6,487) $ —Total current derivative liabilities $ — $ — $ 6,487 $ 6,487 $ (6,487) —
PPAs (a) 3,583Current derivative instruments $ 3,583
Noncurrent derivative liabilitiesPPAs (a) $ 34,207
Noncurrent derivative instruments $ 34,207
(a) In 2003, as a result of implementing new guidance on the normal purchase exception for derivative accounting, SPS began recording several long-term PPAs at fair value due to accounting requirements related to underlying price adjustments. As these purchases are recovered through normal regulatory recovery mechanisms in the respective jurisdictions, the changes in fair value for these contracts were offset by regulatory assets and liabilities. During 2006, SPS qualified these contracts under the normal purchase exception. Based on this qualification, the contracts are no longer adjusted to fair value and the previous carrying value of these contracts will be amortized over the remaining contract lives along with the offsetting regulatory assets and liabilities.
(b) SPS nets derivative instruments and related collateral in its balance sheet when supported by a legally enforceable master netting agreement, and all derivative instruments and related collateral amounts were subject to master netting agreements at Dec. 31, 2013. At Dec. 31, 2013, derivative assets and liabilities include no obligations to return cash collateral or rights to reclaim cash collateral. The counterparty netting amounts presented exclude settlement receivables and payables and non-derivative amounts that may be subject to the same master netting agreements.
The following tables present the changes in Level 3 commodity derivatives for the three and six months ended June 30, 2014, and there were no Level 3 commodity derivatives during the three and six months ended June 30, 2013:
(Thousands of Dollars)Three Months Ended
June 30, 2014
Balance at April 1 $ 5,791Purchases 38,419Settlements (13,554)Net transactions recorded during the period:
Gains recognized as regulatory assets and liabilities 3,286Balance at June 30 $ 33,942
Table of Contents
Schedule Q-4 Page 118 of 187
Sponsor: Robinson Case No. 15-00139-UT
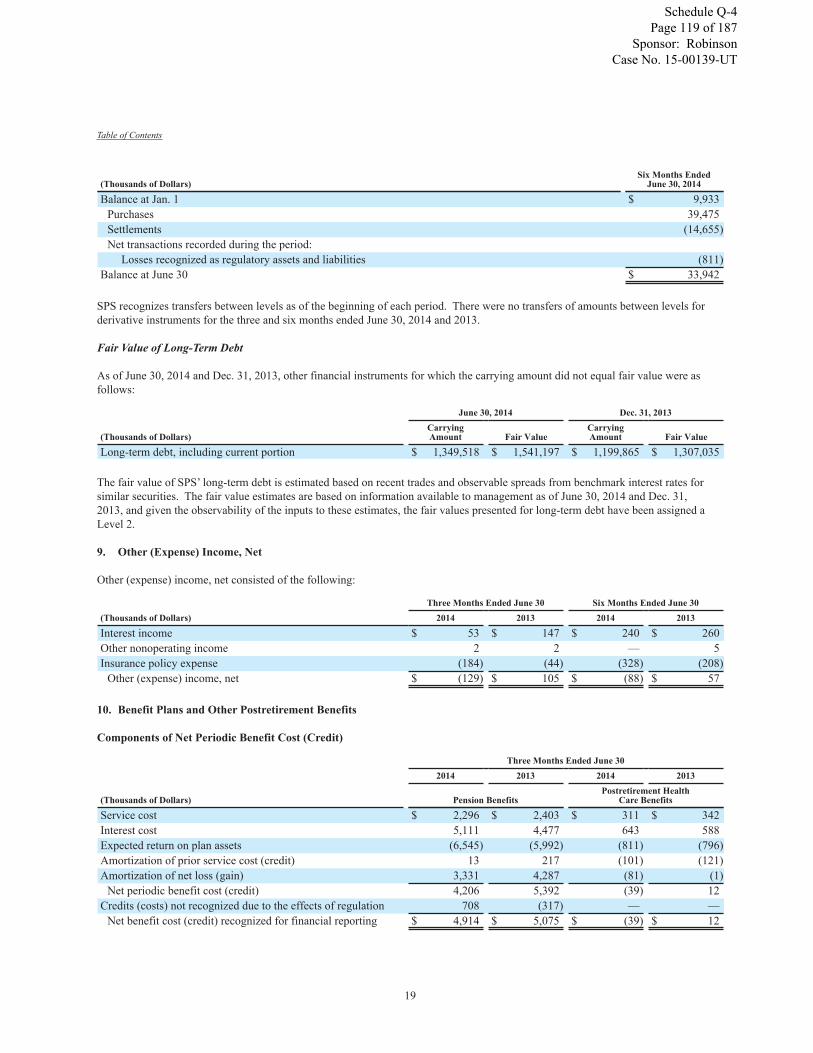
19
(Thousands of Dollars)Six Months Ended
June 30, 2014
Balance at Jan. 1 $ 9,933Purchases 39,475Settlements (14,655)Net transactions recorded during the period:
Losses recognized as regulatory assets and liabilities (811)Balance at June 30 $ 33,942
SPS recognizes transfers between levels as of the beginning of each period. There were no transfers of amounts between levels for derivative instruments for the three and six months ended June 30, 2014 and 2013.
Fair Value of Long-Term Debt
As of June 30, 2014 and Dec. 31, 2013, other financial instruments for which the carrying amount did not equal fair value were as follows:
June 30, 2014 Dec. 31, 2013
(Thousands of Dollars)CarryingAmount Fair Value
CarryingAmount Fair Value
Long-term debt, including current portion $ 1,349,518 $ 1,541,197 $ 1,199,865 $ 1,307,035
The fair value of SPS’ long-term debt is estimated based on recent trades and observable spreads from benchmark interest rates for similar securities. The fair value estimates are based on information available to management as of June 30, 2014 and Dec. 31, 2013, and given the observability of the inputs to these estimates, the fair values presented for long-term debt have been assigned a Level 2.
9. Other (Expense) Income, Net
Other (expense) income, net consisted of the following:
Three Months Ended June 30 Six Months Ended June 30(Thousands of Dollars) 2014 2013 2014 2013
Interest income $ 53 $ 147 $ 240 $ 260Other nonoperating income 2 2 — 5Insurance policy expense (184) (44) (328) (208)
Other (expense) income, net $ (129) $ 105 $ (88) $ 57
10. Benefit Plans and Other Postretirement Benefits
Components of Net Periodic Benefit Cost (Credit)
Three Months Ended June 302014 2013 2014 2013
(Thousands of Dollars) Pension BenefitsPostretirement Health
Care Benefits
Service cost $ 2,296 $ 2,403 $ 311 $ 342Interest cost 5,111 4,477 643 588Expected return on plan assets (6,545) (5,992) (811) (796)Amortization of prior service cost (credit) 13 217 (101) (121)Amortization of net loss (gain) 3,331 4,287 (81) (1)
Net periodic benefit cost (credit) 4,206 5,392 (39) 12Credits (costs) not recognized due to the effects of regulation 708 (317) — —
Net benefit cost (credit) recognized for financial reporting $ 4,914 $ 5,075 $ (39) $ 12
Table of Contents
Schedule Q-4 Page 119 of 187
Sponsor: Robinson Case No. 15-00139-UT

20
Six Months Ended June 302014 2013 2014 2013
(Thousands of Dollars) Pension BenefitsPostretirement Health
Care Benefits
Service cost $ 4,592 $ 4,807 $ 623 $ 684Interest cost 10,222 8,954 1,286 1,176Expected return on plan assets (13,090) (11,985) (1,623) (1,592)Amortization of prior service cost (credit) 27 435 (201) (242)Amortization of net loss (gain) 6,663 8,574 (161) (3)
Net periodic benefit cost (credit) 8,414 10,785 (76) 23Credits (costs) not recognized due to the effects of regulation 1,415 (1,392) — —
Net benefit cost (credit) recognized for financial reporting $ 9,829 $ 9,393 $ (76) $ 23
In January 2014, contributions of $130.0 million were made across three of Xcel Energy’s pension plans, of which $4.4 million was attributable to SPS. Xcel Energy does not expect additional pension contributions during 2014.
11. Other Comprehensive Income
Changes in accumulated other comprehensive loss, net of tax, for the three and six months ended June 30, 2014 and 2013 were as follows:
Gains and Losses onCash Flow Hedges
(Thousands of Dollars)Three Months Ended
June 30, 2014Three Months Ended
June 30, 2013
Accumulated other comprehensive loss at April 1 $ (1,118) $ (1,290)Losses reclassified from net accumulated other comprehensive loss 42 43
Net current period other comprehensive income 42 43Accumulated other comprehensive loss at June 30 $ (1,076) $ (1,247)
Gains and Losses onCash Flow Hedges
(Thousands of Dollars)Six Months Ended
June 30, 2014Six Months Ended
June 30, 2013
Accumulated other comprehensive loss at Jan. 1 $ (1,161) $ (1,332)Losses reclassified from net accumulated other comprehensive loss 85 85
Net current period other comprehensive income 85 85Accumulated other comprehensive loss at June 30 $ (1,076) $ (1,247)
Reclassifications from accumulated other comprehensive loss for the three and six months ended June 30, 2014 and 2013 were as follows:
Amounts Reclassified from Accumulated Other Comprehensive Loss
(Thousands of Dollars)Three Months Ended
June 30, 2014Three Months Ended
June 30, 2013
Losses on cash flow hedges:Interest rate derivatives $ 66 (a) $ 67 (a)
Total, pre-tax 66 67Tax benefit (24) (24)
Total amounts reclassified, net of tax $ 42 $ 43
Table of Contents
Schedule Q-4 Page 120 of 187
Sponsor: Robinson Case No. 15-00139-UT

21
Amounts Reclassified from Accumulated Other Comprehensive Loss
(Thousands of Dollars)Six Months Ended
June 30, 2014Six Months Ended
June 30, 2013
Losses on cash flow hedges:Interest rate derivatives $ 133 (a) $ 133 (a)
Total, pre-tax 133 133Tax benefit (48) (48)
Total amounts reclassified, net of tax $ 85 $ 85
(a) Included in interest charges.
Item 2 — MANAGEMENT’S DISCUSSION AND ANALYSIS OF FINANCIAL CONDITION AND RESULTS OF OPERATIONS
Discussion of financial condition and liquidity for SPS is omitted per conditions set forth in general instructions H (1) (a) and (b) of Form 10-Q for wholly owned subsidiaries. It is replaced with management’s narrative analysis of the results of operations set forth in general instructions H (2) (a) of Form 10-Q for wholly owned subsidiaries (reduced disclosure format).
Financial Review
The following discussion and analysis by management focuses on those factors that had a material effect on SPS’ financial condition, results of operations, and cash flows during the periods presented, or are expected to have a material impact in the future. It should be read in conjunction with the accompanying unaudited financial statements and the related notes to the financial statements. Due to the seasonality of SPS’ electric sales, such interim results are not necessarily an appropriate base from which to project annual results.
Forward-Looking Statements
Except for the historical statements contained in this report, the matters discussed in the following discussion and analysis are forward-looking statements that are subject to certain risks, uncertainties and assumptions. Such forward-looking statements are intended to be identified in this document by the words “anticipate,” “believe,” “estimate,” “expect,” “intend,” “may,” “objective,” “outlook,” “plan,” “project,” “possible,” “potential,” “should” and similar expressions. Actual results may vary materially. Forward-looking statements speak only as of the date they are made, and we do not undertake any obligation to update them to reflect changes that occur after that date. Factors that could cause actual results to differ materially include, but are not limited to: general economic conditions, including inflation rates, monetary fluctuations and their impact on capital expenditures and the ability of SPS to obtain financing on favorable terms; business conditions in the energy industry, including the risk of a slow down in the U.S. economy or delay in growth recovery; trade, fiscal, taxation and environmental policies in areas where SPS has a financial interest; customer business conditions; actions of credit rating agencies; competitive factors, including the extent and timing of the entry of additional competition in the markets served by SPS; unusual weather; effects of geopolitical events, including war and acts of terrorism; state, federal and foreign legislative and regulatory initiatives that affect cost and investment recovery, have an impact on rates or have an impact on asset operation or ownership or impose environmental compliance conditions; structures that affect the speed and degree to which competition enters the electric market; costs and other effects of legal and administrative proceedings, settlements, investigations and claims; financial or regulatory accounting policies imposed by regulatory bodies; availability or cost of capital; employee work force factors; and the other risk factors listed from time to time by SPS in reports filed with the SEC, including “Risk Factors” in Item 1A of SPS’ Form 10-K for the year ended Dec. 31, 2013, and Item 1A and Exhibit 99.01 to this Quarterly Report on Form 10-Q for the quarter ended June 30, 2014.
Results of Operations
SPS’ net income was approximately $46.8 million for the six months ended June 30, 2014, compared with net income of approximately $40.8 million for the same period in 2013. The increase was primarily due to the positive impact of higher electric rates in Texas and New Mexico and weather-normalized sales growth (which is adjusted against a 30-year average of actual historical weather conditions), partially offset by increased O&M expenses and depreciation.
Table of Contents
Schedule Q-4 Page 121 of 187
Sponsor: Robinson Case No. 15-00139-UT

22
Electric Revenues and Margin
Electric fuel and purchased power expenses tend to vary with changing retail and wholesale sales requirements and unit cost changes in fuel and purchased power. The design of fuel and purchased power cost recovery mechanisms of the Texas and New Mexico jurisdictions may not allow for complete recovery of all expenses and, therefore, changes in fuel or purchased power costs can impact earnings. The following tables detail the electric revenues and margin:
Six Months Ended June 30(Millions of Dollars) 2014 2013
Electric revenues $ 941 $ 836Electric fuel and purchased power (603) (520)
Electric margin $ 338 $ 316
The following tables summarize the components of the changes in electric revenues and electric margin for the six months ended June 30:
Electric Revenues
(Millions of Dollars) 2014 vs. 2013
Fuel and purchased power cost recovery $ 47Retail rate increases (a) 21Transmission revenue 20Trading 14Demand revenue 5Sales mix 5Retail sales growth, excluding weather impact 3Firm wholesale (11)Other, net 1
Total increase in electric revenues $ 105
Electric Margin
(Millions of Dollars) 2014 vs. 2013
Retail rate increases (a) $ 21Transmission revenue, net of costs 12Demand revenue 5Sales mix 5Retail sales growth, excluding weather impact 3Firm wholesale (11)Purchased capacity costs (7)Texas wind renewable energy credits (6)Fuel handling and procurement (3)Other, net 3
Total increase in electric margin $ 22
(a) Retail rates in New Mexico were implemented in 2014. In addition, retail rates in Texas were implemented in the second quarter of 2013.
Table of Contents
Schedule Q-4 Page 122 of 187
Sponsor: Robinson Case No. 15-00139-UT

23
Non-Fuel Operating Expense and Other Items
Operating and Maintenance (O&M) Expenses — O&M expenses increased $6.3 million, or 4.8 percent, for the six months ended June 30, 2014 compared with the same period in 2013. The following table summarizes the changes in O&M expenses:
(Millions of Dollars) 2014 vs. 2013
Plant generation costs $ 3Employee benefits 2Electric and gas distribution expenses 1
Total increase in O&M expenses $ 6
Depreciation and Amortization — Depreciation and amortization increased $4.3 million, or 7.1 percent, for the six months ended June 30, 2014 compared with the same period in 2013. The increase is primarily due to normal system expansion and a change in amortization as a result of regulatory outcomes.
Taxes (Other Than Income Taxes) — Taxes (other than income taxes) increased $1.4 million, or 5.5 percent, for the six months ended June 30, 2014 compared with the same period in 2013. The increase is primarily due to an increase in property and general taxes.
Allowance for Funds Used During Construction, Equity and Debt (AFUDC) — AFUDC increased $2.5 million for the six months ended June 30, 2014 compared with the same period in 2013. The increase is primarily due to the expansion of transmission facilities.
Interest Charges — Interest charges increased $3.3 million, or 9.3 percent, for the six months ended June 30, 2014 compared with the same period in 2013. The increase is primarily due to higher long-term debt levels, partially offset by lower interest rates.
Income Taxes — Income tax expense increased $3.2 million for the six months ended June 30, 2014 compared with the same period in 2013. The increase in income tax expense is primarily due to higher pretax earnings in 2014. The ETR was 35.9 percent for the six months ended June 30, 2014, compared with 36.1 percent for the same period in 2013.
Public Utility Regulation
SPP Integrated Market (IM) — SPP has operated a regional energy imbalance market since 2007. SPS has recovered related charges and revenues in its retail and wholesale rates. In 2012 and 2013, the FERC approved proposed revisions to the SPP tariff to allow SPP to operate a day ahead and real time energy and ancillary services market similar to the regional market operated by Midcontinent Independent System Operator, Inc (MISO). The SPP IM began operations on March 1, 2014. SPS submitted filings to the FERC to modify its wholesale power sales contracts to allow recovery of SPP IM charges and revenues through the SPP wholesale fuel clause adjustment (FCA). SPS also requested approval to make sales to the SPP IM at market-based rates, which the FERC approved in February 2014. The FERC approved the FCA tariff filings in April 2014. SPS has also filed changes to its QF tariffs in Texas and New Mexico to revise the pricing applied to QF purchases to be consistent with the new market. In February 2014, SPS was granted interim approval of the revised QF tariff in Texas to coincide with the start of the IM. The New Mexico revised QF tariff was approved in March 2014. SPS Transmission Notifications to Construct (NTCs) — In April 2014, the SPP Board of Directors approved the High Priority Incremental Load Study Report, a reliability assessment that evaluated the anticipated transmission needs of certain parts of the SPP resulting from expected load growth in the area. As a result of this study, SPS has received NTCs and conditional NTCs for 44 new transmission projects to be placed into service by 2020. SPS is in the process of evaluating these projects and their costs internally before submitting certificates of convenience and necessity (CCNs) to the PUCT and the NMPRC. These projects are intended to provide regional reliability benefits as well as the ability to serve the increase in load in Southeast New Mexico.
In April 2014, SPS filed a CCN with the NMPRC for a new 345 kilovolt transmission line from the Potash Junction substation to the Roadrunner substation, both near Carlsbad, N.M. The proposed line would run 40 miles and cost an estimated $53 million. Approval for the CCN is pending.
Table of Contents
Schedule Q-4 Page 123 of 187
Sponsor: Robinson Case No. 15-00139-UT

24
Summary of Recent Federal Regulatory Developments
The FERC has jurisdiction over rates for electric transmission service in interstate commerce and electricity sold at wholesale, accounting practices and certain other activities of SPS, including enforcement of North American Electric Reliability Corporation (NERC) mandatory electric reliability standards. State and local agencies have jurisdiction over many of SPS’ activities, including regulation of retail rates and environmental matters. See additional discussion in the summary of recent federal regulatory developments and public utility regulation sections of the SPS Annual Report on Form 10-K for the year ended Dec. 31, 2013. In addition to the matters discussed below, see Note 5 to the financial statements for a discussion of other regulatory matters.
FERC Order 1000, Transmission Planning and Cost Allocation (Order 1000) — In 2011, the FERC issued Order 1000 adopting new requirements for transmission planning, cost allocation and development to be effective prospectively. In Order 1000, the FERC required utilities to develop tariffs that provide for joint regional transmission planning and cost allocation for all FERC-jurisdictional utilities within a region. In addition, Order 1000 required that regions coordinate to develop interregional plans for transmission planning and cost allocation. A key provision of Order 1000 is a requirement that FERC-jurisdictional wholesale transmission tariffs exclude provisions that would grant the incumbent transmission owner a federal Right of First Refusal (ROFR) to build certain types of transmission projects in its service area.
The removal of a federal ROFR would eliminate rights that SPS currently has under the SPP tariffs to build certain transmission projects within its footprint. In Order 1000, FERC instead required that the opportunity to build such projects would extend to competitive transmission developers. SPP made its initial compliance filings to incorporate new provisions into their tariffs regarding regional planning and cost allocation. Various parties appealed Order 1000 final rules to the D.C. Circuit. The date for a Court decision in the appeal is uncertain.
The FERC ruled on the initial regional compliance filings for SPP, directing further compliance changes and thus the SPP regional compliance filings remain pending action by the FERC. Initial filings to address interregional planning and cost allocation requirements with other regions were made by SPP and are pending action by the FERC.
Xcel Energy believes that Texas statutes protect the ROFR of incumbent utilities operating outside of the Electric Reliability Council of Texas (ERCOT) region to construct and own transmission interconnected to their systems, though this view is disputed by some parties. The State of New Mexico does not have legislation establishing ROFR rights for incumbent utilities. The FERC issued its initial order on SPP’s Order 1000 regional compliance filing in July 2013. The FERC identified several areas that required a further compliance filing by SPP to address regional compliance issues. Among other things, the FERC rejected SPP’s proposal to retain a ROFR for new transmission projects with operational voltages between 100 KV and 300 KV. Requests for rehearing of the FERC’s July 2013 order were filed in August 2013 and are pending the FERC’s action. The SPP regional compliance filing was filed in November 2013 and is currently pending. The SPP regional compliance tariffs went into effect March 1, 2014, subject to the outcome of the additional FERC proceedings. The SPP interregional compliance filing was submitted in July 2013 and is pending the FERC’s action.
NERC Critical Infrastructure Protection (CIP) Requirements — The FERC has approved version 5 of NERC’s CIP standards. Requirements must be applied to high and medium impact assets by April 1, 2016 and to low impact assets by April 1, 2017. SPS is currently in the process of evaluating the new requirements and identifying initiatives needed to meet the compliance deadlines.
NERC Physical Security Requirements — In July 2014, the FERC issued a notice of proposed rulemaking (NOPR) generally proposing to adopt NERC’s proposed CIP standard related to physical security for bulk electric system facilities. However, the FERC proposed a modification to the standard that would allow certain governmental authorities, including FERC, to revise an entity’s list of critical facilities. The new standard would likely be effective in 2015. SPS is currently in the process of evaluating and identifying the critical facilities impacted to better determine the cost of protections necessary to meet the standard. The additional cost for compliance is anticipated to be recoverable through rates.
Table of Contents
Schedule Q-4 Page 124 of 187
Sponsor: Robinson Case No. 15-00139-UT

25
SPP and MISO Complaints Regarding RTO Joint Operating Agreement (JOA) — SPP and MISO have a longstanding dispute regarding the interpretation of their JOA, which is intended to coordinate RTO operations along the MISO/SPP system boundary. SPP and MISO disagree over MISO’s authority to transmit power over SPP transmission facilities between the traditional MISO region in the Midwest and the Entergy system. Several cases have been filed with the FERC by MISO and SPP. In March 2014, FERC issued an order setting all of the cases for settlement judge proceedings, or hearings if settlement fails. The Xcel Energy utilities have intervened in the various dockets, arguing that non-firm use by MISO should not be subject to SPP transmission charges. If SPP is successful in charging MISO for use of the SPP system, the NSP System would experience higher costs from MISO, which could be material, but SPS would collect revenues from SPP. The outcome of the JOA disputes, and the potential impact on Xcel Energy, are uncertain at this time. In June 2014, the FERC accepted a proposed tariff change by MISO to recover transmission charges imposed by SPP retroactive to Jan. 29, 2014, and set the issues for settlement judge and hearing procedures.
FERC Order 745 Vacated, Demand Response Compensation in Organized Wholesale Energy Markets (Order 745) — In 2011, the FERC issued a final rule requiring that demand resources participating in organized wholesale markets (such as SPP) be paid the locational marginal price for avoided energy consumption. Numerous parties objected to the rule. On appeal, the D.C. Circuit Court of Appeals vacated and remanded FERC’s order. The Court found that the order was an impermissible intrusion by the FERC into retail electric matters reserved to the states. The FERC has requested rehearing en banc (review by the entire appeals court panel) and that request remains pending. After issuance of the Court’s decision, FirstEnergy Service Company (FirstEnergy) filed a complaint requesting FERC to require PJM Interconnection, LLC (PJM) to remove all portions of the PJM Tariff allowing or requiring PJM to include demand response as suppliers to PJM’s wholesale markets. This complaint also remains pending. Neither the Court’s vacatur of Order 745 nor FirstEnergy’s complaint against PJM have material implications for SPS at this time. However, these actions create uncertainty regarding future participation of demand resources in the SPP wholesale organized market. Item 4 — CONTROLS AND PROCEDURES
Disclosure Controls and Procedures
SPS maintains a set of disclosure controls and procedures designed to ensure that information required to be disclosed in the reports that it files or submits under the Securities Exchange Act of 1934 is recorded, processed, summarized, and reported within the time periods specified in SEC rules and forms. In addition, the disclosure controls and procedures ensure that information required to be disclosed is accumulated and communicated to management, including the chief executive officer (CEO) and chief financial officer (CFO), allowing timely decisions regarding required disclosure. As of June 30, 2014, based on an evaluation carried out under the supervision and with the participation of SPS’ management, including the CEO and CFO, of the effectiveness of its disclosure controls and the procedures, the CEO and CFO have concluded that SPS’ disclosure controls and procedures were effective.
Internal Control Over Financial Reporting
No change in SPS’ internal control over financial reporting has occurred during SPS’ most recent fiscal quarter that has materially affected, or is reasonably likely to materially affect, SPS’ internal control over financial reporting.
Part II — OTHER INFORMATION
Item 1 — LEGAL PROCEEDINGS
SPS is involved in various litigation matters that are being defended and handled in the ordinary course of business. The assessment of whether a loss is probable or is a reasonable possibility, and whether the loss or a range of loss is estimable, often involves a series of complex judgments about future events. Management maintains accruals for such losses that are probable of being incurred and subject to reasonable estimation. Management is sometimes unable to estimate an amount or range of a reasonably possible loss in certain situations, including but not limited to when (1) the damages sought are indeterminate, (2) the proceedings are in the early stages, or (3) the matters involve novel or unsettled legal theories. In such cases, there is considerable uncertainty regarding the timing or ultimate resolution of such matters, including a possible eventual loss.
Additional Information
See Note 6 to the financial statements for further discussion of legal claims and environmental proceedings. See Note 5 to the financial statements for discussion of proceedings involving utility rates and other regulatory matters.
Table of Contents
Schedule Q-4 Page 125 of 187
Sponsor: Robinson Case No. 15-00139-UT

26
Item 1A — RISK FACTORS
SPS’ risk factors are documented in Item 1A of Part I of its Annual Report on Form 10-K for the year ended Dec. 31, 2013, which is incorporated herein by reference.
Item 4 — MINE SAFETY DISCLOSURES
None.
Item 5 — OTHER INFORMATION
None.
Item 6 — EXHIBITS
* Indicates incorporation by reference
3.01* Amended and Restated Articles of Incorporation of SPS dated Sept. 30, 1997 (Exhibit 3(a)(2) to Form 10-K (file no.001-03789) dated March 3, 1998).
3.02* By-Laws of SPS as Amended and Restated on Sept. 26, 2013. (Exhibit 3.02 to Form 10-Q/A for the quarter ended Sept. 30, 2013 (file no. 001-03789)).
4.01* Fifth Supplemental Indenture dated as of November 1, 2008 between SPS and The Bank of New York Mellon TrustCompany, N.A., as successor Trustee. (Exhibit 4.02 to SPS’ Form 8-K dated June 2, 2014 (file no. 001-03789)).
4.02* Sixth Supplemental Indenture dated as of June 1, 2014 between SPS and The Bank of New York Mellon Trust Company,N.A., as successor Trustee. (Exhibit 4.03 to SPS’ Form 8-K dated June 2, 2014 (file no. 001-03789)).
4.03* Supplemental Indenture No. 2 dated as of June 1, 2014 between SPS and U.S. Bank National Association, as Trustee.(Exhibit 4.06 to SPS’ Form 8-K dated June 2, 2014 (file no. 001-03789)).
4.04* Supplemental Indenture No. 3 dated as of June 1, 2014 between SPS and U.S. Bank National Association, as Trustee,creating $150 million principal amount of 3.30 percent First Mortgage Bonds, Series No. 3 due 2024. (Exhibit 4.02 to SPS’Form 8-K dated June 9, 2014 (file no. 001-03789)).Principal Executive Officer’s certifications pursuant to 18 U.S.C. Section 1350, as adopted pursuant to Section 302 of theSarbanes-Oxley Act of 2002.Principal Financial Officer’s certifications pursuant to 18 U.S.C. Section 1350, as adopted pursuant to Section 302 of theSarbanes-Oxley Act of 2002.Certification pursuant to 18 U.S.C. Section 1350, as adopted pursuant to Section 906 of the Sarbanes-Oxley Act of 2002.Statement pursuant to Private Securities Litigation Reform Act of 1995.
101 The following materials from SPS’ Quarterly Report on Form 10-Q for the quarter ended June 30, 2014 are formatted inXBRL (eXtensible Business Reporting Language): (i) the Statements of Income, (ii) the Statements of ComprehensiveIncome (iii) the Statements of Cash Flows, (iv) the Balance Sheets, (v) Notes to Financial Statements, and (vi) document andentity information.
Table of Contents
31.01
31.02
32.0199.01
Schedule Q-4 Page 126 of 187
Sponsor: Robinson Case No. 15-00139-UT

27
SIGNATURES
Pursuant to the requirements of the Securities Exchange Act of 1934, the registrant has duly caused this report to be signed on its behalf by the undersigned thereunto duly authorized.
Southwestern Public Service Company
Aug. 1, 2014 By: /s/ JEFFREY S. SAVAGE Jeffrey S. Savage Vice President and Controller /s/ TERESA S. MADDEN Teresa S. Madden Senior Vice President, Chief Financial Officer and Director
Table of Contents
Schedule Q-4 Page 127 of 187
Sponsor: Robinson Case No. 15-00139-UT

1
Exhibit 31.01
CERTIFICATION
I, David T. Hudson, certify that:
1. I have reviewed this report on Form 10-Q of Southwestern Public Service Company;
2. Based on my knowledge, this report does not contain any untrue statement of a material fact or omit to state a material fact necessary to make the statements made, in light of the circumstances under which such statements were made, not misleading with respect to the period covered by this report;
3. Based on my knowledge, the financial statements, and other financial information included in this report, fairly present in all material respects the financial condition, results of operations and cash flows of the registrant as of, and for, the periods presented in this report;
4. The registrant’s other certifying officer and I are responsible for establishing and maintaining disclosure controls and procedures (as defined in Exchange Act Rules 13a-15(e) and 15d-15(e)) and internal control over financial reporting (as defined in Exchange Act Rules 13a-15(f) and 15d-15(f)) for the registrant and have:
a. Designed such disclosure controls and procedures, or caused such disclosure controls and procedures to be designed under our supervision, to ensure that material information relating to the registrant is made known to us by others within those entities, particularly during the period in which this report is being prepared;
b. Designed such internal control over financial reporting, or caused such internal control over financial reporting to be designed under our supervision, to provide reasonable assurance regarding the reliability of financial reporting and the preparation of financial statements for external purposes in accordance with generally accepted accounting principles;
c. Evaluated the effectiveness of the registrant’s disclosure controls and procedures and presented in this report our conclusions about the effectiveness of the disclosure controls and procedures, as of the end of the period covered by this report based on such evaluation; and
d. Disclosed in this report any change in the registrant’s internal control over financial reporting that occurred during the registrant’s most recent fiscal quarter (the registrant’s fourth fiscal quarter in the case of an annual report) that has materially affected, or is reasonably likely to materially affect, the registrant’s internal control over financial reporting; and
5. The registrant’s other certifying officer and I have disclosed, based on our most recent evaluation of internal control over financial reporting, to the registrant’s auditors and the audit committee of the registrant’s board of directors (or persons performing the equivalent functions):
a. All significant deficiencies and material weaknesses in the design or operation of internal control over financial reporting which are reasonably likely to adversely affect the registrant’s ability to record, process, summarize and report financial information; and
b. Any fraud, whether or not material, that involves management or other employees who have a significant role in the registrant’s internal control over financial reporting.
Date: Aug. 1, 2014
/s/ DAVID T. HUDSON David T. Hudson President, Chief Executive Officer and Director
Schedule Q-4 Page 128 of 187
Sponsor: Robinson Case No. 15-00139-UT

2
Exhibit 31.02
CERTIFICATION
I, Teresa S. Madden, certify that:
1. I have reviewed this report on Form 10-Q of Southwestern Public Service Company;
2. Based on my knowledge, this report does not contain any untrue statement of a material fact or omit to state a material fact necessary to make the statements made, in light of the circumstances under which such statements were made, not misleading with respect to the period covered by this report;
3. Based on my knowledge, the financial statements, and other financial information included in this report, fairly present in all material respects the financial condition, results of operations and cash flows of the registrant as of, and for, the periods presented in this report;
4. The registrant’s other certifying officer and I are responsible for establishing and maintaining disclosure controls and procedures (as defined in Exchange Act Rules 13a-15(e) and 15d-15(e)) and internal control over financial reporting (as defined in Exchange Act Rules 13a-15(f) and 15d-15(f)) for the registrant and have:
a. Designed such disclosure controls and procedures, or caused such disclosure controls and procedures to be designed under our supervision, to ensure that material information relating to the registrant is made known to us by others within those entities, particularly during the period in which this report is being prepared;
b. Designed such internal control over financial reporting, or caused such internal control over financial reporting to be designed under our supervision, to provide reasonable assurance regarding the reliability of financial reporting and the preparation of financial statements for external purposes in accordance with generally accepted accounting principles;
c. Evaluated the effectiveness of the registrant’s disclosure controls and procedures and presented in this report our conclusions about the effectiveness of the disclosure controls and procedures, as of the end of the period covered by this report based on such evaluation; and
d. Disclosed in this report any change in the registrant’s internal control over financial reporting that occurred during the registrant’s most recent fiscal quarter (the registrant’s fourth fiscal quarter in the case of an annual report) that has materially affected, or is reasonably likely to materially affect, the registrant’s internal control over financial reporting; and
5. The registrant’s other certifying officer and I have disclosed, based on our most recent evaluation of internal control over financial reporting, to the registrant’s auditors and the audit committee of the registrant’s board of directors (or persons performing the equivalent functions):
a. All significant deficiencies and material weaknesses in the design or operation of internal control over financial reporting which are reasonably likely to adversely affect the registrant’s ability to record, process, summarize and report financial information; and
b. Any fraud, whether or not material, that involves management or other employees who have a significant role in the registrant’s internal control over financial reporting
Date: Aug. 1, 2014
/s/ TERESA S. MADDEN Teresa S. Madden Senior Vice President, Chief Financial Officer and Director
Schedule Q-4 Page 129 of 187
Sponsor: Robinson Case No. 15-00139-UT

1
Exhibit 32.01
OFFICER CERTIFICATION
CERTIFICATION PURSUANT TO18 U.S.C. SECTION 1350,
AS ADOPTED PURSUANT TOSECTION 906 OF THE SARBANES-OXLEY ACT OF 2002
In connection with the Quarterly Report of Southwestern Public Service Company (SPS) on Form 10-Q for the quarter ended June 30, 2014, as filed with the SEC on the date hereof (Form 10-Q), each of the undersigned officers of SPS certifies, pursuant to 18 U.S.C. Section 1350, as adopted pursuant to Section 906 of the Sarbanes-Oxley Act of 2002, that, to such officer’s knowledge:
(1) The Form 10-Q fully complies with the requirements of Section 13(a) or 15(d) of the Securities Exchange Act of 1934; and
(2) The information contained in the Form 10-Q fairly presents, in all material respects, the financial condition and results of operations of SPS as of the dates and for the periods expressed in the Form 10-Q.
Date: Aug. 1, 2014
/s/ DAVID T. HUDSON David T. Hudson President, Chief Executive Officer and Director /s/ TERESA S. MADDEN Teresa S. Madden Senior Vice President, Chief Financial Officer and Director
The foregoing certification is being furnished solely pursuant to 18 U.S.C. Section 1350 and is not being filed as part of the Report or as a separate disclosure document.
A signed original of this written statement required by Section 906, or other document authenticating, acknowledging or otherwise adopting the signature that appears in typed form within the electronic version of this written statement required by Section 906, has been provided to SPS and will be retained by SPS and furnished to the SEC or its staff upon request.
Schedule Q-4 Page 130 of 187
Sponsor: Robinson Case No. 15-00139-UT

1
Exhibit 99.01
SPS Cautionary Factors
The Private Securities Litigation Reform Act provides a “safe harbor” for forward-looking statements to encourage such disclosures without the threat of litigation, providing those statements are identified as forward-looking and are accompanied by meaningful, cautionary statements identifying important factors that could cause the actual results to differ materially from those projected in the statement. Forward-looking statements are made in written documents and oral presentations of SPS, Xcel Energy Inc. or any of its other subsidiaries. These statements are based on management’s beliefs as well as assumptions and information currently available to management. Such forward-looking statements are intended to be identified in this document by the words “anticipate,” “believe,” “estimate,” “expect,” “intend,” “may,” “objective,” “outlook,” “plan,” “project,” “possible,” “potential,” “should” and similar expressions. In addition to any assumptions and other factors referred to specifically in connection with such forward-looking statements, factors that could cause SPS’ actual results to differ materially from those contemplated in any forward-looking statements include, among others, the following:
• Economic conditions, including inflation rates, monetary fluctuations and their impact on capital expenditures;• The risk of a significant slowdown in growth or decline in the U.S. economy, the risk of delay in growth recovery in the
U.S. economy or the risk of increased cost for insurance premiums, security and other items as a consequence of past or future terrorist attacks;
• Trade, monetary, fiscal, taxation and environmental policies of governments, agencies and similar organizations in geographic areas where SPS has a financial interest;
• Customer business conditions, including demand for their products or services and supply of labor and materials used in creating their products and services;
• Financial or regulatory accounting principles or policies imposed by the FASB, the SEC, the FERC and similar entities with regulatory oversight;
• Availability or cost of capital such as changes in: interest rates; market perceptions of the utility industry, SPS, Xcel Energy Inc. or any of its other subsidiaries; or security ratings;
• Factors affecting utility operations such as unusual weather conditions; catastrophic weather-related damage; unscheduled generation outages, maintenance or repairs; unanticipated changes to fossil fuel or natural gas supply costs or availability due to higher demand, shortages, transportation problems or other developments; environmental incidents; cyber incidents; or electric transmission or natural gas pipeline constraints;
• Employee workforce factors, including loss or retirement of key executives, collective-bargaining agreements with union employees, or work stoppages;
• Increased competition in the utility industry or additional competition in the markets served by SPS, Xcel Energy Inc. and its other subsidiaries;
• State and federal legislative and regulatory initiatives that affect cost and investment recovery, have an impact on rate structures and affect the speed and degree to which competition enters the electric market; industry restructuring initiatives; transmission system operation and/or administration initiatives; recovery of investments made under traditional regulation; nature of competitors entering the industry; retail wheeling; a new pricing structure; and former customers entering the generation market;
• Environmental laws and regulations, including legislation and regulations relating to climate change, and the associated cost of compliance;
• Rate-setting policies or procedures of regulatory entities, including environmental externalities, which are values established by regulators assigning environmental costs to each method of electricity generation when evaluating generation resource options;
• Social attitudes regarding the utility and power industries;• Cost and other effects of legal and administrative proceedings, settlements, investigations and claims;• Technological developments that result in competitive disadvantages and create the potential for impairment of existing
assets;• Risks associated with implementation of new technologies; and• Other business or investment considerations that may be disclosed from time to time in SEC filings, including “Risk
Factors” in Item 1A of SPS’ Form 10-K for the year ended Dec. 31, 2013, or in other publicly disseminated written documents.
SPS undertakes no obligation to publicly update or revise any forward-looking statements, whether as a result of new information, future events or otherwise. The foregoing review of factors should not be construed as exhaustive.
Schedule Q-4 Page 131 of 187
Sponsor: Robinson Case No. 15-00139-UT

UNITED STATESSECURITIES AND EXCHANGE COMMISSION
Washington, D.C. 20549
FORM 10-Q(Mark One)
QUARTERLY REPORT PURSUANT TO SECTION 13 OR 15(d) OF THE SECURITIESEXCHANGE ACT OF 1934
For the quarterly period ended Sept. 30, 2014 or
TRANSITION REPORT PURSUANT TO SECTION 13 OR 15(d) OF THE SECURITIESEXCHANGE ACT OF 1934
Commission File Number: 001-03789
Southwestern Public Service Company(Exact name of registrant as specified in its charter)
New Mexico 75-0575400(State or other jurisdiction of incorporation or organization) (I.R.S. Employer Identification No.)
Tyler at Sixth Amarillo, Texas 79101
(Address of principal executive offices) (Zip Code)
(303) 571-7511(Registrant’s telephone number, including area code)
Indicate by check mark whether the registrant (1) has filed all reports required to be filed by Section 13 or 15(d) of the Securities Exchange Act of 1934 during the preceding 12 months (or for such shorter period that the registrant was required to file such reports), and (2) has been subject to such filing requirements for the past 90 days. Yes No
Indicate by check mark whether the registrant has submitted electronically and posted on its corporate Web site, if any, every Interactive Data File required to be submitted and posted pursuant to Rule 405 and Regulation S-T (§232.405 of this chapter) during the preceding 12 months (or for such shorter period that the registrant was required to submit and post such files). Yes No
Indicate by check mark whether the registrant is a large accelerated filer, an accelerated filer, a non-accelerated filer, or a smaller reporting company. See the definitions of “large accelerated filer,” “accelerated filer” and “smaller reporting company” in Rule 12b-2 of the Exchange Act.
Large accelerated filer Accelerated filer Non-accelerated filer Smaller reporting company
(Do not check if smaller reporting company)
Indicate by check mark whether the registrant is a shell company (as defined in Rule 12b-2 of the Exchange Act). Yes No
Indicate the number of shares outstanding of each of the issuer’s classes of common stock, as of the latest practicable date.
Class Outstanding at Nov. 3, 2014
Common Stock, $1 par value 100 shares
Southwestern Public Service Company meets the conditions set forth in General Instruction H (1)(a) and (b) of Form 10-Q and is therefore filing this Form 10-Q with the reduced disclosure format specified in General Instruction H (2) to such Form 10-Q.
Schedule Q-4 Page 132 of 187
Sponsor: Robinson Case No. 15-00139-UT

2
TABLE OF CONTENTS
PART I — FINANCIAL INFORMATIONItem l —Item 2 —Item 4 — PART II — OTHER INFORMATIONItem 1 —Item 1A —Item 4 —Item 5 —Item 6 —
Certifications Pursuant to Section 302 1Certifications Pursuant to Section 906 1Statement Pursuant to Private Litigation 1
This Form 10-Q is filed by Southwestern Public Service Company, a New Mexico corporation (SPS). SPS is a wholly owned subsidiary of Xcel Energy Inc. Xcel Energy Inc. wholly owns the following subsidiaries: Northern States Power Company, a Minnesota corporation (NSP-Minnesota); Northern States Power Company, a Wisconsin corporation (NSP-Wisconsin); Public Service Company of Colorado, a Colorado corporation (PSCo); and SPS. NSP-Minnesota, NSP-Wisconsin, PSCo and SPS are also referred to collectively as utility subsidiaries. Additional information on Xcel Energy Inc. and its subsidiaries (collectively, Xcel Energy) is available on various filings with the Securities and Exchange Commission (SEC).
Financial Statements (Unaudited) 3Management’s Discussion and Analysis of Financial Condition and Results of Operations 22Controls and Procedures 26
Legal Proceedings 26Risk Factors 27Mine Safety Disclosures 27Other Information 27Exhibits 27
SIGNATURES 28
Schedule Q-4 Page 133 of 187
Sponsor: Robinson Case No. 15-00139-UT

3
PART 1 — FINANCIAL INFORMATIONItem 1 — FINANCIAL STATEMENTS
SOUTHWESTERN PUBLIC SERVICE COMPANYSTATEMENTS OF INCOME (UNAUDITED)
(amounts in thousands)
Three Months Ended Sept. 30 Nine Months Ended Sept. 302014 2013 2014 2013
Operating revenues $ 552,779 $ 481,407 $ 1,493,715 $ 1,317,495
Operating expenses Electric fuel and purchased power 315,524 293,831 918,874 814,077Operating and maintenance expenses 66,833 66,288 205,194 198,309Demand side management program expenses 3,455 2,966 9,368 9,216Depreciation and amortization 34,207 30,315 99,790 91,575Taxes (other than income taxes) 13,991 13,354 40,144 38,137
Total operating expenses 434,010 406,754 1,273,370 1,151,314
Operating income 118,769 74,653 220,345 166,181
Other income (expense), net 66 (115) (22) (58)Allowance for funds used during construction — equity 3,147 2,150 9,682 6,972
Interest charges and financing costs Interest charges — includes other financing costs of
$768, $773, $2,229 and $2,248, respectively 20,479 22,892 59,405 58,509Allowance for funds used during construction — debt (1,846) (1,387) (5,694) (4,406)
Total interest charges and financing costs 18,633 21,505 53,711 54,103
Income before income taxes 103,349 55,183 176,294 118,992Income taxes 36,412 20,146 62,587 43,165Net income $ 66,937 $ 35,037 $ 113,707 $ 75,827
See Notes to Financial Statements
Table of Contents
Schedule Q-4 Page 134 of 187
Sponsor: Robinson Case No. 15-00139-UT

4
SOUTHWESTERN PUBLIC SERVICE COMPANYSTATEMENTS OF COMPREHENSIVE INCOME (UNAUDITED)
(amounts in thousands)
Three Months Ended Sept. 30 Nine Months Ended Sept. 30 2014 2013 2014 2013
Net income $ 66,937 $ 35,037 $ 113,707 $ 75,827Other comprehensive income Derivative instruments: Reclassification of losses to net income, net of tax of $24 and $72 for each
of the three and nine months ended Sept. 30, 2014 and 2013, respectively 44 44 129 129Other comprehensive income 44 44 129 129Comprehensive income $ 66,981 $ 35,081 $ 113,836 $ 75,956
See Notes to Financial Statements
Table of Contents
Schedule Q-4 Page 135 of 187
Sponsor: Robinson Case No. 15-00139-UT

5
SOUTHWESTERN PUBLIC SERVICE COMPANYSTATEMENTS OF CASH FLOWS (UNAUDITED)
(amounts in thousands)
Nine Months Ended Sept. 30 2014 2013Operating activities
Net income $ 113,707 $ 75,827Adjustments to reconcile net income to cash provided by operating activities:
Depreciation and amortization 101,514 93,171Demand side management program amortization 1,255 1,255Deferred income taxes 88,008 36,831Amortization of investment tax credits (255) (245)Allowance for equity funds used during construction (9,682) (6,972)Net derivative losses 201 201Changes in operating assets and liabilities:
Accounts receivable (10,982) (32,999)Accrued unbilled revenues (22,164) (25,860)Inventories (6,257) (5,558)Prepayments and other (672) (7,046)Accounts payable 5,777 21,281Net regulatory assets and liabilities (11,550) (11,629)Other current liabilities 29,426 62,149Pension and other employee benefit obligations (2,535) (18,923)
Change in other noncurrent assets 2,684 (1,580)Change in other noncurrent liabilities 2,204 (2,221)
Net cash provided by operating activities 280,679 177,682
Investing activities Utility capital/construction expenditures (412,976) (423,435)Allowance for equity funds used during construction 9,682 6,972Investments in utility money pool arrangement (94,000) (12,000)Repayments from utility money pool arrangement 91,000 12,000
Net cash used in investing activities (406,294) (416,463)
Financing activities Repayments of short-term borrowings, net (84,000) (9,000)Proceeds from issuance of long-term debt 148,241 94,809Borrowings under utility money pool arrangement 433,000 565,000Repayments under utility money pool arrangement (471,000) (485,000)Capital contributions from parent 160,000 124,935Dividends paid to parent (60,632) (51,361)
Net cash provided by financing activities 125,609 239,383
Net change in cash and cash equivalents (6) 602Cash and cash equivalents at beginning of period 1,011 482Cash and cash equivalents at end of period $ 1,005 $ 1,084
Supplemental disclosure of cash flow information: Cash paid for interest (net of amounts capitalized) $ (41,604) $ (41,273)Cash received (paid) for income taxes, net 26,539 (18,719)
Supplemental disclosure of non-cash investing transactions: Property, plant and equipment additions in accounts payable $ 19,538 $ 25,143
See Notes to Financial Statements
Table of Contents
Schedule Q-4 Page 136 of 187
Sponsor: Robinson Case No. 15-00139-UT

6
SOUTHWESTERN PUBLIC SERVICE COMPANYBALANCE SHEETS (UNAUDITED)
(amounts in thousands, except share and per share data)
Sept. 30, 2014 Dec. 31, 2013Assets Current assets
Cash and cash equivalents $ 1,005 $ 1,011Accounts receivable, net 90,316 70,951Accounts receivable from affiliates 7,457 15,840Investments in utility money pool arrangement 3,000 —Accrued unbilled revenues 131,371 109,207Inventories 43,395 37,138Regulatory assets 44,090 27,595Derivative instruments 30,132 17,826Deferred income taxes 53,344 85,362Prepayments and other 20,243 19,571
Total current assets 424,353 384,501
Property, plant and equipment, net 3,616,190 3,284,030
Other assets Regulatory assets 274,816 290,415Derivative instruments 35,137 41,056Other 15,831 17,068
Total other assets 325,784 348,539Total assets $ 4,366,327 $ 4,017,070
Liabilities and Equity Current liabilities
Short-term debt $ — $ 84,000Borrowings under utility money pool arrangement — 38,000Accounts payable 147,580 143,879Accounts payable to affiliates 13,696 15,387Regulatory liabilities 88,364 83,759Taxes accrued 31,558 23,584Accrued interest 27,377 16,883Dividends payable 22,866 18,082Derivative instruments 3,565 3,583Other 81,868 75,355
Total current liabilities 416,874 502,512
Deferred credits and other liabilities Deferred income taxes 818,465 757,778Regulatory liabilities 100,488 81,504Asset retirement obligations 20,194 19,375Derivative instruments 31,534 34,207Pension and employee benefit obligations 52,552 55,087Other 4,504 3,051
Total deferred credits and other liabilities 1,027,737 951,002
Commitments and contingenciesCapitalization
Long-term debt 1,349,604 1,199,865Common stock — 200 shares authorized of $1.00 par value; 100 shares outstanding at
Sept. 30, 2014 and Dec. 31, 2013, respectively — —Additional paid in capital 1,165,463 1,005,463Retained earnings 407,681 359,389Accumulated other comprehensive loss (1,032) (1,161)
Total common stockholder’s equity 1,572,112 1,363,691Total liabilities and equity $ 4,366,327 $ 4,017,070
See Notes to Financial Statements
Table of Contents
Schedule Q-4 Page 137 of 187
Sponsor: Robinson Case No. 15-00139-UT

7
SOUTHWESTERN PUBLIC SERVICE COMPANYNotes to Financial Statements (UNAUDITED)
In the opinion of management, the accompanying unaudited financial statements contain all adjustments necessary to present fairly, in accordance with accounting principles generally accepted in the United States of America (GAAP), the financial position of SPS as of Sept. 30, 2014, and Dec. 31, 2013; the results of its operations, including the components of net income and comprehensive income, for the three and nine months ended Sept. 30, 2014 and 2013; and its cash flows for the nine months ended Sept. 30, 2014 and 2013. All adjustments are of a normal, recurring nature, except as otherwise disclosed. Management has also evaluated the impact of events occurring after Sept. 30, 2014 up to the date of issuance of these financial statements. These statements contain all necessary adjustments and disclosures resulting from that evaluation. The Dec. 31, 2013 balance sheet information has been derived from the audited 2013 financial statements included in the SPS Annual Report on Form 10-K for the year ended Dec. 31, 2013. These notes to the financial statements have been prepared pursuant to the rules and regulations of the SEC for Quarterly Reports on Form 10-Q. Certain information and note disclosures normally included in financial statements prepared in accordance with GAAP on an annual basis have been condensed or omitted pursuant to such rules and regulations. For further information, refer to the financial statements and notes thereto included in the SPS Annual Report on Form 10-K for the year ended Dec. 31, 2013, filed with the SEC on Feb. 24, 2014. Due to the seasonality of SPS’ electric sales, interim results are not necessarily an appropriate base from which to project annual results.
1. Summary of Significant Accounting Policies
The significant accounting policies set forth in Note 1 to the financial statements in the SPS Annual Report on Form 10-K for the year ended Dec. 31, 2013, appropriately represent, in all material respects, the current status of accounting policies and are incorporated herein by reference.
2. Accounting Pronouncements
Recently Issued
Revenue Recognition — In May 2014, the Financial Accounting Standards Board issued Revenue from Contracts with Customers, Topic 606 (Accounting Standards Update (ASU) No. 2014-09), which provides a framework for the recognition of revenue, with the objective that recognized revenues properly reflect amounts an entity is entitled to receive in exchange for goods and services. This guidance, which includes additional disclosure requirements regarding revenue, cash flows and obligations related to contracts with customers, will be effective for interim and annual reporting periods beginning after Dec. 15, 2016. SPS is currently evaluating the impact of adopting ASU 2014-09 on its financial statements.
3. Selected Balance Sheet Data
(Thousands of Dollars) Sept. 30, 2014 Dec. 31, 2013
Accounts receivable, netAccounts receivable $ 96,110 $ 76,426Less allowance for bad debts (5,794) (5,475)
$ 90,316 $ 70,951
(Thousands of Dollars) Sept. 30, 2014 Dec. 31, 2013
InventoriesMaterials and supplies $ 23,770 $ 21,600Fuel 19,625 15,538
$ 43,395 $ 37,138
(Thousands of Dollars) Sept. 30, 2014 Dec. 31, 2013
Property, plant and equipment, netElectric plant $ 5,200,187 $ 4,714,398Construction work in progress 264,894 388,323
Total property, plant and equipment 5,465,081 5,102,721Less accumulated depreciation (1,848,891) (1,818,691)
$ 3,616,190 $ 3,284,030
Table of Contents
Schedule Q-4 Page 138 of 187
Sponsor: Robinson Case No. 15-00139-UT

8
4. Income Taxes
Except to the extent noted below, the circumstances set forth in Note 6 to the financial statements included in SPS’ Annual Report on Form 10-K for the year ended Dec. 31, 2013 appropriately represent, in all material respects, the current status of other income tax matters, and are incorporated herein by reference.
Federal Audit — SPS is a member of the Xcel Energy affiliated group that files a consolidated federal income tax return. The statute of limitations applicable to Xcel Energy’s 2008 federal income tax return expired in September 2012. The statute of limitations applicable to Xcel Energy’s 2009 federal income tax return expires in June 2015. In the third quarter of 2012, the Internal Revenue Service (IRS) commenced an examination of tax years 2010 and 2011, including a 2009 carryback claim. As of Sept. 30, 2014, the IRS had proposed an adjustment to several federal tax loss carryback claims that would result in $10 million of income tax expense for the 2009 through 2011 claims and the anticipated claim for 2013. SPS is not expected to accrue any income tax expense related to this adjustment. Xcel Energy is continuing to work through the audit process, but the outcome and timing of a resolution is uncertain.
State Audits — SPS is a member of the Xcel Energy affiliated group that files consolidated state income tax returns. As of Sept. 30, 2014, SPS’ earliest open tax year that is subject to examination by state taxing authorities under applicable statutes of limitations is 2009. There are currently no state income tax audits in progress.
Unrecognized Tax Benefits — The unrecognized tax benefit balance includes permanent tax positions, which if recognized would affect the annual effective tax rate (ETR). In addition, the unrecognized tax benefit balance includes temporary tax positions for which the ultimate deductibility is highly certain but for which there is uncertainty about the timing of such deductibility. A change in the period of deductibility would not affect the ETR but would accelerate the payment of cash to the taxing authority to an earlier period.
A reconciliation of the amount of unrecognized tax benefit is as follows:
(Millions of Dollars) Sept. 30, 2014 Dec. 31, 2013
Unrecognized tax benefit — Permanent tax positions $ 0.4 $ 1.2Unrecognized tax benefit — Temporary tax positions 2.9 2.9
Total unrecognized tax benefit $ 3.3 $ 4.1
The unrecognized tax benefit amounts were reduced by the tax benefits associated with net operating loss (NOL) and tax credit carryforwards. The amounts of tax benefits associated with NOL and tax credit carryforwards are as follows:
(Millions of Dollars) Sept. 30, 2014 Dec. 31, 2013
NOL and tax credit carryforwards $ (2.4) $ (2.4)
It is reasonably possible that SPS’ amount of unrecognized tax benefits could significantly change in the next 12 months as the IRS audit progresses and state audits resume. As the IRS examination moves closer to completion, the change in the unrecognized tax benefit is not expected to be material.
The payable for interest related to unrecognized tax benefits is partially offset by the interest benefit associated with NOL and tax credit carryforwards. The payables for interest related to unrecognized tax benefits at Sept. 30, 2014 and Dec. 31, 2013 were not material. No amounts were accrued for penalties related to unrecognized tax benefits as of Sept. 30, 2014 or Dec. 31, 2013.
5. Rate Matters
Except to the extent noted below, the circumstances set forth in Note 10 to the financial statements included in SPS’ Annual Report on Form 10-K for the year ended Dec. 31, 2013 appropriately represent, in all material respects, the current status of other rate matters, and are incorporated herein by reference.
Table of Contents
Schedule Q-4 Page 139 of 187
Sponsor: Robinson Case No. 15-00139-UT

9
Pending Regulatory Proceedings — Public Utility Commission of Texas (PUCT)
Texas 2014 Electric Rate Case — In January 2014, SPS filed a retail electric rate case in Texas with each of its Texas municipalities and the PUCT for a net increase in annual revenue of approximately $52.7 million, or 5.8 percent. The net increase reflected a base rate increase, revenue credits transferred from base rates to rate riders or the fuel clause, and resetting the Transmission Cost Recovery Factor (TCRF) to zero when the final base rates become effective. In April 2014, SPS revised its request to a net increase of $48.1 million.
The rate filing was based on a historic test year ending June 2013, a requested return on equity (ROE) of 10.40 percent, an electric rate base of approximately $1.27 billion and an equity ratio of 53.89 percent. The requested rate increase reflected an increase in depreciation expense of approximately $16 million.
In September 2014, SPS, PUCT staff, and intervenors filed a non-unanimous settlement agreement, subject to PUCT approval, which would increase SPS’ rates by $37 million, or 3.5 percent, retroactive to June 1, 2014. Starting Oct. 1, 2014, SPS began collecting the rate increase through interim rates subject to refund. SPS expects to recover the rate increase for the months of June through September through a separate surcharge to be implemented by the first quarter of 2015. Based on the anticipated outcome of the rate case, SPS recognized approximately $13.3 million of revenue in the third quarter of 2014 for the surcharge.
The settlement includes an ROE of 9.7 percent solely for the purpose of calculating the allowance for funds used during construction (AFUDC) and determining baselines in future filings for the TCRF. In October 2014, the administrative law judges (ALJs) approved the stipulation and recommended that SPS file to implement the surcharge following the PUCT's final order. The PUCT is expected to rule on the settlement in 2014.
Although the parties to the settlement agreement have not prepared a calculation of the $37 million increase and do not agree about which specific costs are included, or not, in the agreed settlement revenue requirement, SPS’ reconciliation of its original request to the settlement increase is as follows:
(Millions of Dollars) Settlement Agreement
Base rate increase request, January 2014 $ 81.5Revisions for updated information (4.6)Revised request, April 2014 76.9Remove proposed increase in depreciation (16.0)Remove adjustment allocators for certain wholesale load reduction (12.0)Revised amortizations (rate case expenses, pension and other post-employment benefits expense and gain onsale to Lubbock) (9.0)Non-specified settlement adjustments (2.9)Settlement base rate increase $ 37.0
Electric, Purchased Gas and Resource Adjustment Clauses
TCRF Rider — In November 2013, SPS filed with the PUCT to implement the TCRF for Texas retail customers. The requested increase in revenues was $13 million. The PUCT issued an order allowing the TCRF to go into effect on an interim basis effective Jan. 1, 2014. In May 2014, the ALJ terminated the interim TCRF due to a settlement in principle being reached with intervenors and the PUCT staff in the pending Texas electric rate case. In July 2014, the PUCT approved the settlement agreement between the parties allowing SPS to recover $4 million annually through the TCRF. In September 2014, SPS filed a proposal with the PUCT to refund approximately $3.7 million during November 2014 for interim rates collected in excess of the final rates approved. PUCT approval of the refund is pending. As of Sept. 30, 2014, SPS had recorded an accrual for the proposed refund.
Recently Concluded Regulatory Proceedings — New Mexico Public Regulation Commission (NMPRC)
New Mexico 2014 Electric Rate Case — In December 2012, SPS filed an electric rate case in New Mexico with the NMPRC for an increase in annual revenue of approximately $45.9 million effective in 2014. The rate filing was based on a 2014 forecast test year, a requested ROE of 10.65 percent, an electric rate base of $479.8 million and an equity ratio of 53.89 percent.
In September 2013, SPS filed rebuttal testimony, revising its requested rate increase to $32.5 million, based on updated information and an ROE of 10.25 percent. The request reflected a base and fuel increase of $20.9 million, an increase of rider revenue of $12.1 million and a decrease to other of $0.5 million.
Table of Contents
Schedule Q-4 Page 140 of 187
Sponsor: Robinson Case No. 15-00139-UT

10
In March 2014, the NMPRC approved an overall increase of approximately $33.1 million. The increase reflects a base rate increase of $12.7 million and rider recovery of $18.1 million for renewable energy costs, both based on an ROE of 9.96 percent and an equity ratio of 53.89 percent. Final rates were effective April 5, 2014. In April 2014, the New Mexico Attorney General (NMAG) filed a request for rehearing. The rehearing request was denied by the NMPRC. In June 2014, the NMAG filed an appeal of the NMPRC’s denial to the New Mexico Supreme Court. A decision is expected by the second quarter of 2016.
Pending Regulatory Proceedings — Federal Energy Regulatory Commission (FERC)
Wholesale Rate Complaints — In April 2012, Golden Spread Electric Cooperative, Inc. (Golden Spread), a wholesale cooperative customer, filed a rate complaint alleging that the base ROE included in the SPS production formula rate of 10.25 percent, and the SPS transmission base formula rate ROE of 10.77 percent, are unjust and unreasonable. In July 2013, Golden Spread filed a second complaint, again asking that the base ROE in the SPS production and transmission formula rates be reduced to 9.15 and 9.65 percent, respectively.
In June 2014, the FERC issued an order in a different ROE proceeding adopting a new ROE methodology for electric utilities. The new ROE methodology requires electric utilities to use a two-step discounted cash flow analysis to estimate cost of equity that incorporates both short-term and long-term growth projections, instead of only short-term growth.
The FERC also issued orders consolidating the Golden Spread ROE complaints and setting them for settlement judge procedures and hearings and indicated the parties should apply the new ROE methodology to the proceedings. The FERC established effective dates for the refunds as April 20, 2012 and July 19, 2013. The complaints remain in settlement judge proceedings. In October 2014, the FERC upheld the determination of the long term growth rate to be used together with a short term growth rate in its new ROE methodology.
Golden Spread, along with certain New Mexico cooperatives and the West Texas Municipal Power Agency, filed a third rate complaint on Oct. 20, 2014, requesting that the base ROE in the SPS production and transmission formula rates be reduced to 8.61 percent and 9.11 percent, respectively. The complainants requested a refund effective date of Oct. 20, 2014, and that the new complaint be consolidated with the two prior complaints. FERC action is pending.
2004 FERC Complaint Case Orders — In August 2013, the FERC issued an order on rehearing related to a 2004 complaint case brought by Golden Spread and Public Service Company of New Mexico (PNM) and an Order on Initial Decision in a subsequent 2006 production rate case filed by SPS.
The original complaint included two key components: 1) PNM’s claim regarding inappropriate allocation of fuel costs and 2) a base rate complaint, including the appropriate demand-related cost allocator. The FERC previously determined that the allocation of fuel costs and the demand-related cost allocator utilized by SPS was appropriate.
In the August 2013 Orders, the FERC clarified its previous ruling on the allocation of fuel costs and reaffirmed that the refunds in question should only apply to firm requirements customers and not PNM’s contractual load. The FERC also reversed its prior demand-related cost allocator decision. The FERC stated that it had erred in its initial analysis and concluded that the SPS system was a 3 coincident peak (CP) rather than a 12CP system.
In September 2013, SPS filed a request for rehearing of the FERC ruling on the CP allocation and refund decisions. SPS asserted that the FERC applied an improper burden of proof and that precedent did not support retroactive refunds. PNM also requested rehearing of the FERC decision not to reverse its prior ruling.
In October 2013, the FERC issued orders further considering the requests for rehearing. These matters are currently pending the FERC’s action. If unsuccessful in its rehearing request, SPS will have the opportunity to file rate cases with the FERC and its retail jurisdictions seeking to change all customers to a 3CP allocation method.
As of Dec. 31, 2013, SPS had accrued $44.5 million related to the August 2013 Orders and an additional $4.0 million of principal and interest was accrued during the first nine months of 2014. Pending the timing and resolution of this matter, the annual impact to revenues through 2014 could be up to $6 million and decreasing to $4 million on June 1, 2015.
Table of Contents
Schedule Q-4 Page 141 of 187
Sponsor: Robinson Case No. 15-00139-UT

11
Request for Waiver of Southwest Power Pool, Inc. (SPP) Tariff — In July 2014, SPS filed a request for the FERC to grant SPS a waiver of an SPP tariff regarding the billing of SPP administrative and transmission expansion charges for certain loads that left the SPS system at the end of 2013 through a sale of transmission assets to Sharyland Distribution and Transmission Services, LLC (Sharyland). Under the SPP tariff provisions, SPP assesses these charges based on prior year load. Absent the waiver, SPS would be billed approximately $2.9 million by SPP in 2014 for loads that are no longer served by SPS. SPP has intervened to oppose the waiver request and Sharyland has intervened to support the waiver request. FERC action is pending.
6. Commitments and Contingencies
Except to the extent noted below and in Note 5, the circumstances set forth in Notes 10 and 11 to the financial statements in SPS’ Annual Report on Form 10-K for the year ended Dec. 31, 2013, appropriately represent, in all material respects, the current status of commitments and contingent liabilities and are incorporated herein by reference. The following include commitments, contingencies and unresolved contingencies that are material to SPS’ financial position.
Purchased Power Agreements (PPAs)
Under certain PPAs, SPS purchases power from independent power producing entities that own natural gas fueled power plants for which SPS is required to reimburse natural gas fuel costs, or to participate in tolling arrangements under which SPS procures the natural gas required to produce the energy that it purchases. These specific PPAs create a variable interest in the associated independent power producing entity.
SPS had approximately 827 megawatts (MW) of capacity under long-term PPAs as of Sept. 30, 2014 and Dec. 31, 2013 with entities that have been determined to be variable interest entities. SPS has concluded that these entities are not required to be consolidated in its financial statements because it does not have the power to direct the activities that most significantly impact the entities’ economic performance. These agreements have expiration dates through 2033.
Indemnification Agreements
In connection with the sale of certain Texas electric transmission assets to Sharyland Distribution and Transmission Services, LLC in 2013, SPS agreed to indemnify the purchaser for losses arising out of any breach of the representations, warranties and covenants under the related asset purchase agreement and for losses arising out of certain other matters, including pre-closing liabilities. SPS’ indemnification obligation is capped at $37.1 million, in the aggregate. The indemnification provisions for most representations and warranties expire in December 2014. The remaining representations and warranties, which relate to due organization and transaction authorization, survive indefinitely. As of Sept. 30, 2014 and Dec. 31, 2013, SPS has recorded a $0.4 million liability related to this indemnity.
Environmental Contingencies
Environmental Requirements
Water and wasteFederal Clean Water Act (CWA) Effluent Limitations Guidelines (ELG) — In June 2013, the U.S. Environmental Protection Agency (EPA) published a proposed ELG rule for power plants that use coal, natural gas, oil or nuclear materials as fuel and discharge treated effluent to surface waters as well as utility-owned landfills that receive coal combustion residuals. The final rule is now expected in September 2015. Under the current proposed rule, facilities would need to comply as soon as possible after July 2017, but no later than July 2022. The impact of this rule on SPS is uncertain at this time.
Federal CWA Waters of the United States Rule — In April 2014, the EPA and the U.S. Army Corps of Engineers issued a proposed rule that significantly expands the types of water bodies regulated under the CWA. If finalized as proposed, this rule could delay the siting of new pipelines, transmission lines and distribution lines, increase project costs and expand permitting and reporting requirements. The ultimate impact of the proposed rule will depend on the specific requirements of the final rule and cannot be determined at this time. A final rule is not anticipated before the first quarter of 2015.
Table of Contents
Schedule Q-4 Page 142 of 187
Sponsor: Robinson Case No. 15-00139-UT

12
AirEPA Greenhouse Gas (GHG) Permitting — In 2011, new EPA permitting requirements became effective for GHG emissions of new and modified large stationary sources, which were applicable to the construction of new power plants or power plant modifications that increase emissions above a certain threshold. These rules were upheld by the United States Court of Appeals for the District of Columbia Circuit (D.C. Circuit), but in June 2014 the U.S. Supreme Court reversed the EPA’s GHG emission thresholds for this program. The Supreme Court decided the EPA could not adopt GHG thresholds that would require permitting for new and modified large stationary sources. However, the Supreme Court also decided if a new or modified stationary source becomes subject to the permitting requirements by exceeding emission thresholds for other pollutants, then GHG emissions may be evaluated as part of the permitting process. SPS is unable to determine the cost of compliance with these new EPA requirements as it is not clear whether these requirements will apply to future changes at SPS’ power plants.
GHG Emission Standard for Existing Sources — In June 2014, the EPA published its proposed rule on GHG emission standards for existing power plants. Comments are due to the EPA on Dec. 1, 2014 and a final rule is anticipated in June 2015. Following adoption of the final rule, states must develop implementation plans by June 2016, with the possibility of an extension to June 2017 (June 2018 if submitting a joint plan with other states). Among other things, the proposed rule would require that state plans include enforceable measures to ensure emissions from existing power plants in the state achieve the EPA’s state-specific interim (2020-2029) and final (2030 and thereafter) emission performance targets. The plan will likely require additional emission reductions in states in which SPS operates. It is not possible to evaluate the impact of existing source standards until the EPA promulgates a final rule and states have adopted their applicable state plans.
GHG New Source Performance Standard (NSPS) Proposal — In January 2014, the EPA re-proposed a GHG NSPS for newly constructed power plants which would set performance standards (maximum carbon dioxide emission rates) for coal- and natural gas-fired power plants. For coal power plants, the NSPS requires an emissions level equivalent to partial carbon capture and storage (CCS) technology; for gas-fired power plants, the NSPS reflects emissions levels from combined cycle technology with no CCS. The EPA continues to propose that the NSPS not apply to modified or reconstructed existing power plants. In addition, installation of control equipment on existing plants would not constitute a “modification” to those plants under the NSPS program. It is not possible to evaluate the impact of the re-proposed NSPS until its final requirements are known.
GHG NSPS for Modified and Reconstructed Power Plants — In June 2014, the EPA published a proposed NSPS that would apply to GHG emissions from power plants that are modified or reconstructed. A final rule is anticipated in June 2015. A modification is a change to an existing source that increases the maximum achievable hourly rate of emissions. A reconstruction involves the replacement of components at a unit to the extent that the capital cost of the new components exceeds 50 percent of the capital cost of an entirely new comparable unit. The proposed standards would not require installation of CCS technology. Instead, the proposed standard for coal-fired power plants would require a combination of best operating practices and equipment upgrades. The proposal for gas-fired power plants would require emissions standards based on efficient combined cycle technology. It is not possible to evaluate the impact of these proposed standards until the final requirements are known. In addition, it is not clear whether these requirements, once adopted, would apply to future changes at SPS’ power plants.
Cross-State Air Pollution Rule (CSAPR) — In 2011, the EPA issued the CSAPR to address long range transport of particulate matter (PM) and ozone by requiring reductions in sulfur dioxide (SO2) and nitrous oxide (NOx) from utilities in the eastern half of the United States, including Texas. The CSAPR set more stringent requirements than the proposed Clean Air Transport Rule and requires plants in Texas to reduce their SO2 and annual NOx emissions. The rule also creates an emissions trading program.
In August 2012, the D.C. Circuit vacated the CSAPR and remanded it back to the EPA. The D.C. Circuit stated the EPA must continue administering the Clean Air Interstate Rule (CAIR) pending adoption of a valid replacement. In April 2014, the U.S. Supreme Court reversed and remanded the case to the D.C. Circuit. The Supreme Court held that the EPA’s rule design did not violate the Clean Air Act (CAA) and that states had received adequate opportunity to develop their own plans. Because the D.C. Circuit overturned the CSAPR on two over-arching issues, there are many other issues the D.C. Circuit did not rule on that will now need to be considered on remand. In June 2014, the EPA filed a motion with the D.C. Circuit asking it to lift the stay of the CSAPR. The EPA requested the CSAPR’s 2012 compliance obligations be imposed starting in January 2015. The D.C. Circuit granted the EPA’s motion in October 2014. In addition, the D.C. Circuit set a briefing schedule and plans to hear arguments on the remaining issues in the case in March 2015.
Table of Contents
Schedule Q-4 Page 143 of 187
Sponsor: Robinson Case No. 15-00139-UT

13
Multiple changes to the SPS system since 2011 will substantially reduce estimated costs of complying with the CSAPR. These include the addition of 700 MW of wind power, the construction of Jones Units 3 and 4 to meet reserve requirements and provide quick start capability, reduced wholesale load and new PPAs, installation of NOx combustion controls on Tolk Units 1 and 2 and completion of certain transmission projects. As a result, SPS estimates compliance with the CSAPR in 2015 will cost approximately $7 million.
The EPA will begin to administer the CSAPR in 2015, which will replace the CAIR. In 2014, SPS expects to comply with the CAIR as described below.
CAIR — In 2005, the EPA issued the CAIR to further regulate SO2 and NOx emissions. Under the CAIR’s cap and trade structure, companies can comply through capital investments in emission controls or purchase of emission allowances from other utilities making reductions on their systems. In the SPS region, installation of low-NOx combustion control technology was completed in 2012 on Tolk Unit 1 and in 2014 on Tolk Unit 2. These installations will reduce or eliminate SPS’ need to purchase NOx emission allowances. At Sept. 30, 2014, the estimated annual CAIR NOx allowance cost for SPS did not have a material impact on the results of operations, financial position or cash flows. SPS has sufficient SO2 allowances to comply with the CAIR through 2015.
Regional Haze Rules — The regional haze program is designed to address widespread, regionally homogeneous haze that results from emissions from a multitude of sources. In 2005, the EPA amended the best available retrofit technology (BART) requirements of its regional haze rules, which require the installation and operation of emission controls for industrial facilities emitting air pollutants that reduce visibility in certain national parks and wilderness areas. In its first regional haze state implementation plan (SIP), Texas identified the SPS facilities that will have to reduce SO2, NOx and PM emissions under BART and set emissions limits for those facilities.
Harrington Units 1 and 2 are potentially subject to BART. Texas developed a SIP that finds the CAIR equal to BART for electric generating units (EGUs). As a result, no additional controls beyond CAIR compliance would be required. In May 2012, the EPA deferred its review of the SIP in its final rule allowing states to find that CSAPR compliance meets BART requirements for EGUs. It is not yet known how the U.S. Supreme Court’s April 2014 decision on the CSAPR, or the D.C. Circuit’s decision to lift its stay of the CSAPR, may impact the EPA’s approval of the BART requirements in the SIP.
In May 2014, the EPA issued a request for information under the CAA related to SO2 control equipment at Tolk Units 1 and 2. The EPA stated it is conducting an analysis of the cost and feasibility of SO2 controls on certain sources, including the Tolk facility, as part of its review of the SIP. The EPA has preliminarily identified Tolk as a contributor to haze in the Wichita Mountains Wildlife Refuge in Oklahoma, and is planning further analysis of SO2 control options. The EPA plans to make a proposal in November 2014 that could include SO2 emission controls at Tolk and anticipates issuing a final decision in August 2015. The costs and timing of potential additional SO2 controls at Tolk are dependent on the EPA’s proposal and final decision, neither of which is yet known.
Revisions to National Ambient Air Quality Standards (NAAQS) for PM — In December 2012, the EPA lowered the primary health-based NAAQS for annual average fine PM and retained the current daily standard for fine PM. In areas where SPS operates power plants, current monitored air concentrations are below the level of the final annual primary standard. In August 2014, EPA issued its proposed designations, which did not include areas in any states in which SPS operates. The EPA is expected to finalize its designation of non-compliant locations by December 2014. States would then study the sources of the nonattainment and make emission reduction plans to attain the standards. It is not possible to evaluate the impact of this regulation further until the final designations have been made.
Legal Contingencies
SPS is involved in various litigation matters that are being defended and handled in the ordinary course of business. The assessment of whether a loss is probable or is a reasonable possibility, and whether the loss or a range of loss is estimable, often involves a series of complex judgments about future events. Management maintains accruals for such losses that are probable of being incurred and subject to reasonable estimation. Management is sometimes unable to estimate an amount or range of a reasonably possible loss in certain situations, including but not limited to when (1) the damages sought are indeterminate, (2) the proceedings are in the early stages, or (3) the matters involve novel or unsettled legal theories. In such cases, there is considerable uncertainty regarding the timing or ultimate resolution of such matters, including a possible eventual loss. For current proceedings not specifically reported herein, management does not anticipate that the ultimate liabilities, if any, arising from such current proceedings would have a material effect on SPS’ financial statements. Unless otherwise required by GAAP, legal fees are expensed as incurred.
Table of Contents
Schedule Q-4 Page 144 of 187
Sponsor: Robinson Case No. 15-00139-UT

14
Employment, Tort and Commercial Litigation
Exelon Wind (formerly John Deere Wind) Complaint — Several lawsuits in Texas state and federal courts and regulatory proceedings have arisen out of a dispute concerning SPS’ payments for energy and capacity produced from the Exelon Wind subsidiaries’ projects. There are two main areas of dispute. First, Exelon Wind claims that it established legally enforceable obligations (LEOs) for each of its 12 wind facilities in 2005 through 2008 that require SPS to buy power based on SPS’ forecasted avoided cost as determined in 2005 through 2008. Although SPS has refused to accept Exelon Wind’s LEOs, SPS accepts that it must take energy from Exelon Wind under SPS’ PUCT-approved Qualifying Facilities (QF) Tariff. Second, Exelon Wind has raised various challenges to SPS’ PUCT-approved QF Tariff, which became effective in August 2010. The state and federal lawsuits and regulatory proceedings are in various stages of litigation. On Sept. 8, 2014, the Fifth Circuit Court of Appeals (Fifth Circuit) ruled that federal courts do not have jurisdiction to hear Exelon Wind’s challenge to the PUCT’s decision that Exelon Wind is ineligible to establish LEOs for the six wind facilities that were the subject of the PUCT’s order. The Fifth Circuit also ruled that the PUCT’s requirement that only QF’s providing firm energy are eligible to establish LEOs is valid. Exelon Wind filed a motion for rehearing with the Fifth Circuit on Sept. 22, 2014. On Oct. 10, 2014, the Fifth Circuit denied Exelon Wind’s motion for rehearing. SPS believes the likelihood of loss in these lawsuits and proceedings is remote based primarily on existing case law and while it is not possible to estimate the amount or range of reasonably possible loss in the event of an adverse outcome, SPS believes such loss would not be material based upon its belief that it would be permitted to recover such costs, if needed, through its various fuel clause mechanisms. No accrual has been recorded for this matter.
7. Borrowings and Other Financing Instruments
Short-Term Borrowings
Money Pool — Xcel Energy Inc. and its utility subsidiaries have established a money pool arrangement that allows for short-term investments in and borrowings between the utility subsidiaries. Xcel Energy Inc. may make investments in the utility subsidiaries at market-based interest rates; however, the money pool arrangement does not allow the utility subsidiaries to make investments in Xcel Energy Inc. Money pool borrowings for SPS were as follows:
(Amounts in Millions, Except Interest Rates)Three Months Ended
Sept. 30, 2014Twelve Months Ended
Dec. 31, 2013
Borrowing limit $ 100 $ 100Amount outstanding at period end — 38Average amount outstanding 1 46Maximum amount outstanding 22 100Weighted average interest rate, computed on a daily basis 0.26% 0.15%Weighted average interest rate at period end N/A 0.25
Commercial Paper — SPS meets its short-term liquidity requirements primarily through the issuance of commercial paper and borrowings under its credit facility. Commercial paper outstanding for SPS was as follows:
(Amounts in Millions, Except Interest Rates)Three Months Ended
Sept. 30, 2014Twelve Months Ended
Dec. 31, 2013
Borrowing limit $ 300 $ 300Amount outstanding at period end — 84Average amount outstanding 43 32Maximum amount outstanding 106 140Weighted average interest rate, computed on a daily basis 0.26% 0.30%Weighted average interest rate at period end N/A 0.27
Letters of Credit — SPS uses letters of credit, generally with terms of one year, to provide financial guarantees for certain operating obligations. At Sept. 30, 2014 and Dec. 31, 2013, there were $41.0 million and $25.5 million of letters of credit outstanding, respectively, under the credit facility. The contract amounts of these letters of credit approximate their fair value and are subject to fees.
Table of Contents
Schedule Q-4 Page 145 of 187
Sponsor: Robinson Case No. 15-00139-UT

15
Credit Facility — In order to use its commercial paper program to fulfill short-term funding needs, SPS must have a revolving credit facility in place at least equal to the amount of its commercial paper borrowing limit and cannot issue commercial paper in an aggregate amount exceeding available capacity under this credit facility. The line of credit provides short-term financing in the form of notes payable to banks, letters of credit and back-up support for commercial paper borrowings.
At Sept. 30, 2014, SPS had the following committed credit facility available (in millions of dollars):
Credit Facility (a) Drawn (b) Available
$ 300.0 $ 41.0 $ 259.0
(a) Credit facility has been amended to expire in October 2019.(b) Includes outstanding letters of credit.
All credit facility bank borrowings, outstanding letters of credit and outstanding commercial paper reduce the available capacity under the credit facility. SPS had no direct advances on the credit facility outstanding at Sept. 30, 2014 and Dec. 31, 2013.
Amended Credit Agreement — On Oct. 14, 2014, SPS entered into an amended five-year credit agreement with a syndicate of banks. The amended credit agreement has substantially the same terms and conditions as the prior credit agreement with an increased borrowing limit and an extension of maturity from July 2017 to October 2019. The borrowing limit for SPS has been increased to $400 million from $300 million. The Eurodollar borrowing margin on the line of credit ranges from 87.5 to 175 basis points per year based on applicable long-term credit ratings. The commitment fee, calculated on the unused portion of the line of credit, ranges from 7.5 to 27.5 basis points per year, also based on applicable long-term credit ratings.
SPS has the right to request an extension of the revolving termination date for two additional one-year periods, subject to majority bank group approval.
Long-Term Borrowings
In June 2014, SPS issued $150 million of 3.30 percent first mortgage bonds due June 15, 2024.
In connection with SPS’ issuance of $150 million of 3.30 percent first mortgage bonds due June 15, 2024, SPS issued $250 million of collateral 8.75 percent first mortgage bonds due Dec. 1, 2018 to the trustee under its senior unsecured indenture in order to secure its previously issued Series G Senior Notes, 8.75 percent due Dec. 1, 2018, equally and ratably with SPS’ first mortgage bonds as required by the terms of such Series G Senior Notes.
8. Fair Value of Financial Assets and Liabilities
Fair Value Measurements
The accounting guidance for fair value measurements and disclosures provides a single definition of fair value and requires certain disclosures about assets and liabilities measured at fair value. A hierarchical framework for disclosing the observability of the inputs utilized in measuring assets and liabilities at fair value is established by this guidance. The three levels in the hierarchy are as follows:
Level 1 — Quoted prices are available in active markets for identical assets or liabilities as of the reporting date. The types of assets and liabilities included in Level 1 are highly liquid and actively traded instruments with quoted prices.
Level 2 — Pricing inputs are other than quoted prices in active markets, but are either directly or indirectly observable as of the reporting date. The types of assets and liabilities included in Level 2 are typically either comparable to actively traded securities or contracts, or priced with models using highly observable inputs.
Level 3 — Significant inputs to pricing have little or no observability as of the reporting date. The types of assets and liabilities included in Level 3 are those valued with models requiring significant management judgment or estimation.
Specific valuation methods include the following:
Cash equivalents — The fair values of cash equivalents are generally based on cost plus accrued interest; money market funds are measured using quoted net asset values.
Table of Contents
Schedule Q-4 Page 146 of 187
Sponsor: Robinson Case No. 15-00139-UT
16
Interest rate derivatives — The fair values of interest rate derivatives are based on broker quotes that utilize current market interest rate forecasts.
Commodity derivatives — The methods used to measure the fair value of commodity derivative forwards and options utilize forward prices and volatilities, as well as pricing adjustments for specific delivery locations, and are generally assigned a Level 2. When contractual settlements extend to periods beyond those readily observable on active exchanges or quoted by brokers, the significance of the use of less observable forecasts of long-term forward prices and volatilities on a valuation is evaluated, and may result in Level 3 classification.
Electric commodity derivatives held by SPS include transmission congestion instruments purchased from the Southwest Power Pool, Inc. (SPP), generally referred to as financial transmission rights (FTRs). FTRs purchased from a regional transmission organization (RTO) are financial instruments that entitle or obligate the holder to monthly revenues or charges based on transmission congestion across a given transmission path. The value of an FTR is derived from, and designed to offset, the cost of energy congestion, which is caused by overall transmission load and other transmission constraints. In addition to overall transmission load, congestion is also influenced by the operating schedules of power plants and the consumption of electricity pertinent to a given transmission path. Unplanned plant outages, scheduled plant maintenance, changes in the relative costs of fuels used in generation, weather and overall changes in demand for electricity can each impact the operating schedules of the power plants on the transmission grid and the value of an FTR. The valuation process for FTRs utilizes complex iterative modeling to predict the impacts of forecasted changes in these drivers of transmission system congestion on the historical pricing of FTR purchases.
If forecasted costs of electric transmission congestion increase or decrease for a given FTR path, the value of that particular FTR instrument will likewise increase or decrease. Given the limited observability of management’s forecasts for several of the inputs to this complex valuation model - including expected plant operating schedules and retail and wholesale demand, fair value measurements for FTRs have been assigned a Level 3. Non-trading monthly FTR settlements are expected to be recovered through fuel and purchased energy cost recovery mechanisms, and therefore changes in the fair value of the yet to be settled portions of FTRs are deferred as a regulatory asset or liability. Given this regulatory treatment and the limited magnitude of FTRs relative to the electric utility operations of SPS, the numerous unobservable quantitative inputs to the complex model used for valuation of FTRs are insignificant to the financial statements of SPS.
Derivative Instruments Fair Value Measurements
SPS enters into derivative instruments, including forward contracts, for trading purposes and to manage risk in connection with changes in interest rates and electric utility commodity prices.
Interest Rate Derivatives — SPS may enter into various instruments that effectively fix the interest payments on certain floating rate debt obligations or effectively fix the yield or price on a specified benchmark interest rate for an anticipated debt issuance for a specific period. These derivative instruments are generally designated as cash flow hedges for accounting purposes.
At Sept. 30, 2014, accumulated other comprehensive losses related to interest rate derivatives included $0.2 million of net losses expected to be reclassified into earnings during the next 12 months as the related hedged interest rate transactions impact earnings, including forecasted amounts for unsettled hedges, as applicable.
Wholesale and Commodity Trading Risk — SPS conducts various wholesale and commodity trading activities, including the purchase and sale of electric capacity, energy and energy-related instruments. SPS’ risk management policy allows management to conduct these activities within guidelines and limitations as approved by its risk management committee, which is made up of management personnel not directly involved in the activities governed by this policy.
Commodity Derivatives — SPS enters into derivative instruments to manage variability of future cash flows from changes in commodity prices in its electric utility operations, as well as for trading purposes. This could include the purchase or sale of energy or energy-related products and FTRs.
The following table details the gross notional amounts of commodity FTRs at Sept. 30, 2014 and Dec. 31, 2013:
(Amounts in Thousands) Sept. 30, 2014 Dec. 31, 2013
Megawatt hours of electricity 10,880 5,989
Table of Contents
Schedule Q-4 Page 147 of 187
Sponsor: Robinson Case No. 15-00139-UT

17
Impact of Derivative Activities on Income and Accumulated Other Comprehensive Loss — Pre-tax losses related to interest rate derivatives reclassified from accumulated other comprehensive loss into earnings were $0.1 million for the three months ended Sept. 30, 2014 and 2013, and $0.2 million for the nine months ended Sept. 30, 2014 and 2013.
During the three and nine months ended Sept. 30, 2014, changes in the fair value of FTRs resulting in pre-tax net losses of $1.2 million and $3.6 million, respectively, were recognized as regulatory assets and liabilities. The classification as a regulatory asset or liability is based on expected recovery of FTR settlements through fuel and purchased energy cost recovery mechanisms.
FTR settlement losses of $1.2 million and $0.3 million were recognized for the three and nine months ended Sept. 30, 2014, respectively, recorded to electric fuel and purchased power. These derivative settlement gains and losses are shared with electric customers through fuel and purchased energy cost-recovery mechanisms, and reclassified out of income as regulatory assets or liabilities, as appropriate.
SPS had no derivative instruments designated as fair value hedges during the three and nine months ended Sept. 30, 2014 and 2013. Therefore, no gains or losses from fair value hedges or related hedged transactions were recognized for these periods.
Consideration of Credit Risk and Concentrations — SPS continuously monitors the creditworthiness of the counterparties to its interest rate derivatives and commodity derivative contracts prior to settlement, and assesses each counterparty’s ability to perform on the transactions set forth in the contracts. Given this assessment, as well as an assessment of the impact of SPS’ own credit risk when determining the fair value of derivative liabilities, the impact of considering credit risk was immaterial to the fair value of unsettled commodity derivatives presented in the balance sheets.
SPS employs additional credit risk control mechanisms when appropriate, such as letters of credit, parental guarantees, standardized master netting agreements and termination provisions that allow for offsetting of positive and negative exposures. Credit exposure is monitored and, when necessary, the activity with a specific counterparty is limited until credit enhancement is provided.
SPS’ most significant concentrations of credit risk with particular entities or industries are contracts with counterparties to its wholesale, trading and non-trading commodity and transmission activities. At Sept. 30, 2014, two of SPS’ eight most significant counterparties for these activities, comprising $19.7 million or 17 percent of this credit exposure, had investment grade credit ratings from Standard & Poor’s Ratings Services, Moody’s Investor Services or Fitch Ratings. The remaining six significant counterparties, comprising $58.1 million or 50 percent of this credit exposure, were not rated by these agencies, but based on SPS’ internal analysis, had credit quality consistent with investment grade. All eight of these significant counterparties are RTOs, municipal or cooperative electric entities or other utilities.
Table of Contents
Schedule Q-4 Page 148 of 187
Sponsor: Robinson Case No. 15-00139-UT

18
Recurring Fair Value Measurements — The following table presents for each of the fair value hierarchy levels, SPS’ derivative assets and liabilities measured at fair value on a recurring basis at Sept. 30, 2014:
Sept. 30, 2014Fair Value Fair Value
TotalCounterparty
Netting (b)(Thousands of Dollars) Level 1 Level 2 Level 3 Total
Current derivative assetsOther derivative instruments:
Electric commodity $ — $ — $ 37,826 $ 37,826 $ (15,586) $ 22,240Total current derivative assets $ — $ — $ 37,826 $ 37,826 $ (15,586) 22,240
PPAs (a) 7,892Current derivative instruments $ 30,132
Noncurrent derivative assetsPPAs (a) $ 35,137
Noncurrent derivative instruments $ 35,137Current derivative liabilitiesOther derivative instruments:
Electric commodity $ — $ — $ 15,586 $ 15,586 $ (15,586) $ —Total current derivative liabilities $ — $ — $ 15,586 $ 15,586 $ (15,586) —
PPAs (a) 3,565Current derivative instruments $ 3,565
Noncurrent derivative liabilitiesPPAs (a) $ 31,534
Noncurrent derivative instruments $ 31,534
(a) In 2003, as a result of implementing new guidance on the normal purchase exception for derivative accounting, SPS began recording several long-term PPAs at fair value due to accounting requirements related to underlying price adjustments. As these purchases are recovered through normal regulatory recovery mechanisms in the respective jurisdictions, the changes in fair value for these contracts were offset by regulatory assets and liabilities. During 2006, SPS qualified these contracts under the normal purchase exception. Based on this qualification, the contracts are no longer adjusted to fair value and the previous carrying value of these contracts will be amortized over the remaining contract lives along with the offsetting regulatory assets and liabilities.
(b) SPS nets derivative instruments and related collateral in its balance sheet when supported by a legally enforceable master netting agreement, and all derivative instruments and related collateral amounts were subject to master netting agreements at Sept. 30, 2014. At Sept. 30, 2014, derivative assets and liabilities include no obligations to return cash collateral or rights to reclaim cash collateral. The counterparty netting amounts presented exclude settlement receivables and payables and non-derivative amounts that may be subject to the same master netting agreements.
Table of Contents
Schedule Q-4 Page 149 of 187
Sponsor: Robinson Case No. 15-00139-UT

19
The following table presents for each of the fair value hierarchy levels, SPS’ derivative assets and liabilities measured at fair value on a recurring basis at Dec. 31, 2013:
Dec. 31, 2013Fair Value Fair Value
TotalCounterparty
Netting (b)(Thousands of Dollars) Level 1 Level 2 Level 3 Total
Current derivative assetsOther derivative instruments:
Electric commodity $ — $ — $ 16,420 $ 16,420 $ (6,487) $ 9,933Total current derivative assets $ — $ — $ 16,420 $ 16,420 $ (6,487) 9,933
PPAs (a) 7,893Current derivative instruments $ 17,826
Noncurrent derivative assetsPPAs (a) $ 41,056
Noncurrent derivative instruments $ 41,056Current derivative liabilitiesOther derivative instruments:
Electric commodity $ — $ — $ 6,487 $ 6,487 $ (6,487) $ —Total current derivative liabilities $ — $ — $ 6,487 $ 6,487 $ (6,487) —
PPAs (a) 3,583Current derivative instruments $ 3,583
Noncurrent derivative liabilitiesPPAs (a) $ 34,207
Noncurrent derivative instruments $ 34,207
(a) In 2003, as a result of implementing new guidance on the normal purchase exception for derivative accounting, SPS began recording several long-term PPAs at fair value due to accounting requirements related to underlying price adjustments. As these purchases are recovered through normal regulatory recovery mechanisms in the respective jurisdictions, the changes in fair value for these contracts were offset by regulatory assets and liabilities. During 2006, SPS qualified these contracts under the normal purchase exception. Based on this qualification, the contracts are no longer adjusted to fair value and the previous carrying value of these contracts will be amortized over the remaining contract lives along with the offsetting regulatory assets and liabilities.
(b) SPS nets derivative instruments and related collateral in its balance sheet when supported by a legally enforceable master netting agreement, and all derivative instruments and related collateral amounts were subject to master netting agreements at Dec. 31, 2013. At Dec. 31, 2013, derivative assets and liabilities include no obligations to return cash collateral or rights to reclaim cash collateral. The counterparty netting amounts presented exclude settlement receivables and payables and non-derivative amounts that may be subject to the same master netting agreements.
The following tables present the changes in Level 3 commodity derivatives for the three and nine months ended Sept. 30, 2014, and there were no Level 3 commodity derivatives during the three and nine months ended Sept. 30, 2013:
(Thousands of Dollars)Three Months Ended
Sept. 30, 2014
Balance at July 1 $ 33,942Purchases 4,429Settlements (8,346)Net transactions recorded during the period:
Losses recognized as regulatory assets and liabilities (7,785)Balance at Sept. 30 $ 22,240
(Thousands of Dollars)Nine Months Ended
Sept. 30, 2014
Balance at Jan. 1 $ 9,933Purchases 43,904Settlements (23,001)Net transactions recorded during the period:
Losses recognized as regulatory assets and liabilities (8,596)Balance at Sept. 30 $ 22,240
Table of Contents
Schedule Q-4 Page 150 of 187
Sponsor: Robinson Case No. 15-00139-UT

20
SPS recognizes transfers between levels as of the beginning of each period. There were no transfers of amounts between levels for derivative instruments for the three and nine months ended Sept. 30, 2014 and 2013.
Fair Value of Long-Term Debt
As of Sept. 30, 2014 and Dec. 31, 2013, other financial instruments for which the carrying amount did not equal fair value were as follows:
Sept. 30, 2014 Dec. 31, 2013
(Thousands of Dollars)CarryingAmount Fair Value
CarryingAmount Fair Value
Long-term debt, including current portion $ 1,349,604 $ 1,524,990 $ 1,199,865 $ 1,307,035
The fair value of SPS’ long-term debt is estimated based on recent trades and observable spreads from benchmark interest rates for similar securities. The fair value estimates are based on information available to management as of Sept. 30, 2014 and Dec. 31, 2013, and given the observability of the inputs to these estimates, the fair values presented for long-term debt have been assigned a Level 2.
9. Other Income (Expense), Net
Other income (expense), net consisted of the following:
Three Months Ended Sept. 30 Nine Months Ended Sept. 30(Thousands of Dollars) 2014 2013 2014 2013
Interest income $ 73 $ 48 $ 313 $ 308Other nonoperating income 1 1 1 6Insurance policy expense (8) (164) (336) (372)
Other income (expense), net $ 66 $ (115) $ (22) $ (58)
10. Benefit Plans and Other Postretirement Benefits
Components of Net Periodic Benefit Cost (Credit)
Three Months Ended Sept. 302014 2013 2014 2013
(Thousands of Dollars) Pension BenefitsPostretirement Health
Care Benefits
Service cost $ 2,296 $ 2,404 $ 312 $ 342Interest cost 5,111 4,477 643 588Expected return on plan assets (6,545) (5,993) (812) (796)Amortization of prior service cost (credit) 14 218 (100) (121)Amortization of net loss (gain) 3,332 4,287 (80) (2)
Net periodic benefit cost (credit) 4,208 5,393 (37) 11Credits recognized due to the effects of regulation 707 62 — —
Net benefit cost (credit) recognized for financial reporting $ 4,915 $ 5,455 $ (37) $ 11
Table of Contents
Schedule Q-4 Page 151 of 187
Sponsor: Robinson Case No. 15-00139-UT

21
Nine Months Ended Sept. 302014 2013 2014 2013
(Thousands of Dollars) Pension BenefitsPostretirement Health
Care Benefits
Service cost $ 6,888 $ 7,211 $ 935 $ 1,026Interest cost 15,333 13,431 1,929 1,764Expected return on plan assets (19,635) (17,978) (2,435) (2,388)Amortization of prior service cost (credit) 41 653 (301) (363)Amortization of net loss (gain) 9,995 12,861 (241) (5)
Net periodic benefit cost (credit) 12,622 16,178 (113) 34Credits recognized (costs not recognized) due to the effects ofregulation 2,122 (1,330) — —
Net benefit cost (credit) recognized for financial reporting $ 14,744 $ 14,848 $ (113) $ 34
In January 2014, contributions of $130.0 million were made across three of Xcel Energy’s pension plans, of which $4.4 million was attributable to SPS. Xcel Energy does not expect additional pension contributions during 2014.
11. Other Comprehensive Income
Changes in accumulated other comprehensive loss, net of tax, for the three and nine months ended Sept. 30, 2014 and 2013 were as follows:
Gains and Losses onCash Flow Hedges
(Thousands of Dollars)Three Months Ended
Sept. 30, 2014Three Months Ended
Sept. 30, 2013
Accumulated other comprehensive loss at July 1 $ (1,076) $ (1,247)Losses reclassified from net accumulated other comprehensive loss 44 44
Net current period other comprehensive income 44 44Accumulated other comprehensive loss at Sept. 30 $ (1,032) $ (1,203)
Gains and Losses onCash Flow Hedges
(Thousands of Dollars)Nine Months Ended
Sept. 30, 2014Nine Months Ended
Sept. 30, 2013
Accumulated other comprehensive loss at Jan. 1 $ (1,161) $ (1,332)Losses reclassified from net accumulated other comprehensive loss 129 129
Net current period other comprehensive income 129 129Accumulated other comprehensive loss at Sept. 30 $ (1,032) $ (1,203)
Reclassifications from accumulated other comprehensive loss for the three and nine months ended Sept. 30, 2014 and 2013 were as follows:
Amounts Reclassified from Accumulated Other Comprehensive Loss
(Thousands of Dollars)Three Months Ended
Sept. 30, 2014Three Months Ended
Sept. 30, 2013
Losses on cash flow hedges:Interest rate derivatives $ 68 (a) $ 68 (a)
Total, pre-tax 68 68Tax benefit (24) (24)
Total amounts reclassified, net of tax $ 44 $ 44
Table of Contents
Schedule Q-4 Page 152 of 187
Sponsor: Robinson Case No. 15-00139-UT

22
Amounts Reclassified from Accumulated Other Comprehensive Loss
(Thousands of Dollars)Nine Months Ended
Sept. 30, 2014Nine Months Ended
Sept. 30, 2013
Losses on cash flow hedges:Interest rate derivatives $ 201 (a) $ 201 (a)
Total, pre-tax 201 201Tax benefit (72) (72)
Total amounts reclassified, net of tax $ 129 $ 129
(a) Included in interest charges.
Item 2 — MANAGEMENT’S DISCUSSION AND ANALYSIS OF FINANCIAL CONDITION AND RESULTS OF OPERATIONS
Discussion of financial condition and liquidity for SPS is omitted per conditions set forth in general instructions H (1) (a) and (b) of Form 10-Q for wholly owned subsidiaries. It is replaced with management’s narrative analysis of the results of operations set forth in general instructions H (2) (a) of Form 10-Q for wholly owned subsidiaries (reduced disclosure format).
Financial Review
The following discussion and analysis by management focuses on those factors that had a material effect on SPS’ financial condition, results of operations, and cash flows during the periods presented, or are expected to have a material impact in the future. It should be read in conjunction with the accompanying unaudited financial statements and the related notes to the financial statements. Due to the seasonality of SPS’ electric sales, such interim results are not necessarily an appropriate base from which to project annual results.
Forward-Looking Statements
Except for the historical statements contained in this report, the matters discussed in the following discussion and analysis are forward-looking statements that are subject to certain risks, uncertainties and assumptions. Such forward-looking statements are intended to be identified in this document by the words “anticipate,” “believe,” “estimate,” “expect,” “intend,” “may,” “objective,” “outlook,” “plan,” “project,” “possible,” “potential,” “should” and similar expressions. Actual results may vary materially. Forward-looking statements speak only as of the date they are made, and we do not undertake any obligation to update them to reflect changes that occur after that date. Factors that could cause actual results to differ materially include, but are not limited to: general economic conditions, including inflation rates, monetary fluctuations and their impact on capital expenditures and the ability of SPS to obtain financing on favorable terms; business conditions in the energy industry, including the risk of a slow down in the U.S. economy or delay in growth recovery; trade, fiscal, taxation and environmental policies in areas where SPS has a financial interest; customer business conditions; actions of credit rating agencies; competitive factors, including the extent and timing of the entry of additional competition in the markets served by SPS; unusual weather; effects of geopolitical events, including war and acts of terrorism; state, federal and foreign legislative and regulatory initiatives that affect cost and investment recovery, have an impact on rates or have an impact on asset operation or ownership or impose environmental compliance conditions; structures that affect the speed and degree to which competition enters the electric market; costs and other effects of legal and administrative proceedings, settlements, investigations and claims; financial or regulatory accounting policies imposed by regulatory bodies; availability or cost of capital; employee work force factors; and the other risk factors listed from time to time by SPS in reports filed with the SEC, including “Risk Factors” in Item 1A of SPS’ Form 10-K for the year ended Dec. 31, 2013, and Item 1A and Exhibit 99.01 to this Quarterly Report on Form 10-Q for the quarter ended Sept. 30, 2014.
Results of Operations
SPS’ net income was approximately $113.7 million for the nine months ended Sept. 30, 2014, compared with net income of approximately $75.8 million for the same period in 2013. The increase was primarily due to the positive impact of higher electric rates in Texas and New Mexico and weather-normalized sales growth (which is adjusted against a 30-year average of actual weather conditions), partially offset by increased depreciation, operating and maintenance (O&M) expenses and interest charges.
Table of Contents
Schedule Q-4 Page 153 of 187
Sponsor: Robinson Case No. 15-00139-UT

23
Electric Revenues and Margin
Electric fuel and purchased power expenses tend to vary with changing retail and wholesale sales requirements and unit cost changes in fuel and purchased power. The design of fuel and purchased power cost recovery mechanisms of the Texas and New Mexico jurisdictions may not allow for complete recovery of all expenses and, therefore, changes in fuel or purchased power costs can impact earnings. The following tables detail the electric revenues and margin:
Nine Months Ended Sept. 30(Millions of Dollars) 2014 2013
Electric revenues $ 1,494 $ 1,317Electric fuel and purchased power (919) (814)
Electric margin $ 575 $ 503
The following tables summarize the components of the changes in electric revenues and electric margin for the nine months ended Sept. 30:
Electric Revenues
(Millions of Dollars) 2014 vs. 2013
Retail rate increases (a) $ 43Fuel and purchased power cost recovery 39Trading 36Transmission revenue 17Non-fuel riders 11Demand revenue 4Sales mix 3Firm wholesale 2Estimated impact of weather (3)Other, net (1)
Total increase in electric revenues $ 1512004 FERC complaint case order (b) 26
Total increase in GAAP electric revenues $ 177
Electric Margin
(Millions of Dollars) 2014 vs. 2013
Retail rate increases (a) $ 43Non-fuel riders 11Transmission revenue, net of costs 7Demand revenue 4Sales mix 3Firm wholesale 2Purchased capacity costs (11)Texas wind renewable energy credits (9)Estimated impact of weather (3)Other, net (1)
Total increase in electric margin $ 462004 FERC complaint case order (b) 26
Total increase in GAAP electric revenues $ 72
(a) Retail rates were implemented in New Mexico and Texas.(b) As a result of two orders issued by FERC in August 2013, a pretax charge of approximately $35 million ($31 million in electric revenues, of which $5 million
relates to 2013 and $26 million relates to periods prior to 2013, and $4 million in interest charges) was recorded in 2013.
Table of Contents
Schedule Q-4 Page 154 of 187
Sponsor: Robinson Case No. 15-00139-UT

24
Non-Fuel Operating Expense and Other Items
O&M Expenses — O&M expenses increased $6.9 million, or 3.5 percent, for the nine months ended Sept. 30, 2014 compared with the same period in 2013. The following table summarizes the changes in O&M expenses:
(Millions of Dollars) 2014 vs. 2013
Plant generation costs $ 3Transmission cost increases 1Employee benefits 1Other, net 2
Total increase in O&M expenses $ 7
Depreciation and Amortization — Depreciation and amortization increased $8.2 million, or 9.0 percent, for the nine months ended Sept. 30, 2014 compared with the same period in 2013. The increase is primarily due to normal system expansion and a change in amortization as a result of regulatory outcomes.
Taxes (Other Than Income Taxes) — Taxes (other than income taxes) increased $2.0 million, or 5.3 percent, for the nine months ended Sept. 30, 2014 compared with the same period in 2013. The increase is primarily due to an increase in property and general taxes.
AFUDC — AFUDC increased $4.0 million for the nine months ended Sept. 30, 2014 compared with the same period in 2013. The increase is primarily due to the expansion of transmission facilities.
Interest Charges — Interest charges increased $0.9 million, or 1.5 percent, for the nine months ended Sept. 30, 2014 compared with the same period in 2013. The increase is primarily due to higher long-term debt levels, partially offset by lower interest rates.
Income Taxes — Income tax expense increased $19.4 million for the nine months ended Sept. 30, 2014 compared with the same period in 2013. The increase in income tax expense is primarily due to higher pretax earnings in 2014. The ETR was 35.5 percent for the nine months ended Sept. 30, 2014, compared with 36.6 percent for the same period in 2013.
Public Utility Regulation
SPP Integrated Market (IM) — In 2012 and 2013, the FERC approved proposed revisions to the SPP tariff to allow SPP to operate a day ahead and real time energy and ancillary services market. The SPP IM began operations on March 1, 2014. SPS submitted filings to the FERC to modify its wholesale power sales contracts to allow recovery of SPP IM charges and revenues through the SPP wholesale fuel clause adjustment (FCA). The FERC approved the FCA tariff filings in April 2014. SPS also requested approval to make sales to the SPP IM at market-based rates, which the FERC approved in February 2014. SPS has also filed changes to its QF tariffs in Texas and New Mexico to revise the pricing applied to QF purchases to be consistent with the new market. In February 2014, SPS was granted interim approval of the revised QF tariff in Texas to coincide with the start of the IM. The New Mexico revised QF tariff was approved in March 2014.
Transmission Notifications to Construct (NTCs) — In April 2014, the SPP Board of Directors approved the High Priority Incremental Load Study Report, a reliability assessment that evaluated the anticipated transmission needs of certain parts of the SPP resulting from expected load growth in the area. As a result of this study, SPS has received NTCs and conditional NTCs for 44 new transmission projects to be placed into service by 2020. SPS is in the process of evaluating these projects and their costs internally before submitting certificates of convenience and necessity (CCNs) to the PUCT and the NMPRC. These projects are intended to provide regional reliability benefits as well as the ability to serve the increase in load in Southeastern New Mexico.
TUCO substation to Woodward, Okla. 345 kilovolt (KV) transmission lineThe TUCO to Woodward District extra high voltage interchange is a 345 KV transmission line. SPS constructed the line to just inside the Oklahoma state line, and Oklahoma Gas and Electric Company (OGE) built from there to Woodward, Okla. SPS’ investment in the TUCO to Woodward line and substation is approximately $205 million and is expected to be recovered from SPP members, including SPS, in accordance with the SPP open access transmission tariff (OATT) and the ratemaking process. The line was placed into service in September 2014.
Table of Contents
Schedule Q-4 Page 155 of 187
Sponsor: Robinson Case No. 15-00139-UT

25
Hitchland substation to Woodward, Okla. 345 KV transmission lineThe Hitchland substation to Woodward, Okla. line is a 345 KV double circuit transmission line and associated substation facilities in the Oklahoma and Texas Panhandle. SPS built the first 30 miles and OGE completed the line from there to Woodward, Okla. SPS’ investment for the Hitchland to Woodward line and substation is approximately $59 million and is expected to be recovered from SPP members in accordance with the SPP OATT and the ratemaking process. The line was placed into service in May 2014.
Potash Junction substation to Roadrunner substation 345 KV transmission lineIn April 2014, SPS filed a CCN with the NMPRC for a new 345 KV transmission line from the Potash Junction substation to the Roadrunner substation, both near Carlsbad, N.M. The proposed line would run 40 miles and cost an estimated $54 million. Approval for the CCN is pending. A hearing has been scheduled for November 2014.
Summary of Recent Federal Regulatory Developments
The FERC has jurisdiction over rates for electric transmission service in interstate commerce and electricity sold at wholesale, accounting practices and certain other activities of SPS, including enforcement of North American Electric Reliability Corporation (NERC) mandatory electric reliability standards. State and local agencies have jurisdiction over many of SPS’ activities, including regulation of retail rates and environmental matters. See additional discussion in the summary of recent federal regulatory developments and public utility regulation sections of the SPS Annual Report on Form 10-K for the year ended Dec. 31, 2013. In addition to the matters discussed below, see Note 5 to the financial statements for a discussion of other regulatory matters.
FERC Order, New ROE Policy — In June 2014, the FERC adopted a new two-step ROE methodology for electric utilities. In October 2014, the FERC upheld the determination of the long term growth rate to be used in its new ROE methodology. Several parties sought rehearing of the June 2014 order and therefore the new FERC policy may be subject to additional changes.
FERC Order 1000, Transmission Planning and Cost Allocation (Order 1000) — In 2011, the FERC issued a final ruling, Order 1000, adopting new requirements for transmission planning, cost allocation and development to be effective prospectively. In Order 1000, the FERC required utilities to develop tariffs that provide for joint regional transmission planning and cost allocation for all FERC-jurisdictional utilities within a region. In addition, Order 1000 required that regions coordinate to develop interregional plans for transmission planning and cost allocation. A key provision of Order 1000 is a requirement that FERC-jurisdictional wholesale transmission tariffs exclude provisions that would grant the incumbent transmission owner a federal Right of First Refusal (ROFR) to build certain types of transmission projects in its service area. Various parties filed appeals of Order 1000 with the D.C. Circuit. In August 2014, the court denied all appeals and upheld Order 1000 in its entirety. The court indicated, however, that challenges to removal of federal ROFR provisions from individual contracts or tariffs could be considered in individual compliance filings.
The removal of a federal ROFR would eliminate rights that SPS currently has under the SPP tariffs to build certain transmission projects within its footprint. In Order 1000, FERC instead required that the opportunity to build such projects would extend to competitive transmission developers. SPP made its initial compliance filings to incorporate new provisions into their tariffs regarding regional planning and cost allocation. Subsequently, the FERC ruled on the initial regional compliance filings, directing further compliance changes. The SPP regional compliance filings remain pending further action by the FERC.
Initial filings to address interregional planning and cost allocation requirements with other regions were also made by SPP and are pending initial action by the FERC.
SPS believes that Texas statutes protect the ROFR of incumbent utilities operating outside of the ERCOT region to construct and own transmission interconnected to their systems, though this view is disputed by some parties. The State of New Mexico does not have legislation establishing ROFR rights for incumbent utilities.
Regional planning and cost allocationThe FERC issued its initial order on SPP’s Order 1000 regional compliance filing in July 2013. The FERC identified several areas that required a further compliance filing by SPP to address regional compliance issues. Among other things, the FERC rejected SPP’s proposal to retain a ROFR for new transmission projects with operational voltages between 100 KV and 300 KV. Requests for rehearing of the FERC’s July 2013 order were filed in August 2013 and are pending the FERC’s action. The SPP regional compliance filing was filed in November 2013 and is currently pending FERC action. The SPP regional compliance tariffs went into effect March 1, 2014, subject to the outcome of the additional FERC proceedings.
Interregional planning and cost allocationThe SPP interregional compliance filing was submitted in July 2013 and is pending initial FERC action.
Table of Contents
Schedule Q-4 Page 156 of 187
Sponsor: Robinson Case No. 15-00139-UT

26
NERC Critical Infrastructure Protection (CIP) Requirements — The FERC has approved version 5 of NERC’s CIP standards. Requirements must be applied to high and medium impact assets by April 1, 2016 and to low impact assets by April 1, 2017. SPS is currently in the process of evaluating the new requirements and identifying initiatives needed to meet the compliance deadlines.
NERC Physical Security Requirements — In July 2014, the FERC issued a notice of proposed rulemaking generally proposing to adopt NERC’s proposed CIP standard related to physical security for bulk electric system facilities. However, the FERC proposed a modification to the standard that would allow certain governmental authorities, including FERC, to revise an entity’s list of critical facilities. SPS expects prompt action by FERC to finalize the rule with a likely effective date in 2015. SPS is currently in the process of evaluating and identifying the critical facilities impacted to better determine the cost of protections necessary to meet the standard. The additional cost for compliance is anticipated to be recoverable through rates.
SPP and Midcontinent Independent Transmission System Operator, Inc. (MISO) Complaints Regarding RTO Joint Operating Agreement (JOA) — SPP and MISO have a longstanding dispute regarding the interpretation of their JOA, which is intended to coordinate RTO operations along the MISO/SPP system boundary. SPP and MISO disagree over MISO’s authority to transmit power over SPP transmission facilities between the traditional MISO region in the Midwest and the Entergy system. Several cases have been filed with the FERC by MISO and SPP. In March 2014, FERC issued an order setting all of the cases for settlement judge proceedings, or hearings if settlement fails. If SPP is successful in charging MISO for use of the SPP system, the NSP System would experience higher costs from MISO, which could be material, but SPS would collect revenues from SPP. The outcome of the JOA disputes, and the potential impact on Xcel Energy, are uncertain at this time. In June 2014, the FERC accepted a proposed tariff change by MISO to recover transmission charges imposed by SPP retroactive to Jan. 29, 2014, and set the issues for settlement judge and hearing procedures which are still underway.
Item 4 — CONTROLS AND PROCEDURES
Disclosure Controls and Procedures
SPS maintains a set of disclosure controls and procedures designed to ensure that information required to be disclosed in the reports that it files or submits under the Securities Exchange Act of 1934 is recorded, processed, summarized, and reported within the time periods specified in SEC rules and forms. In addition, the disclosure controls and procedures ensure that information required to be disclosed is accumulated and communicated to management, including the chief executive officer (CEO) and chief financial officer (CFO), allowing timely decisions regarding required disclosure. As of Sept. 30, 2014, based on an evaluation carried out under the supervision and with the participation of SPS’ management, including the CEO and CFO, of the effectiveness of its disclosure controls and the procedures, the CEO and CFO have concluded that SPS’ disclosure controls and procedures were effective.
Internal Control Over Financial Reporting
No change in SPS’ internal control over financial reporting has occurred during SPS’ most recent fiscal quarter that has materially affected, or is reasonably likely to materially affect, SPS’ internal control over financial reporting.
Part II — OTHER INFORMATION
Item 1 — LEGAL PROCEEDINGS
SPS is involved in various litigation matters that are being defended and handled in the ordinary course of business. The assessment of whether a loss is probable or is a reasonable possibility, and whether the loss or a range of loss is estimable, often involves a series of complex judgments about future events. Management maintains accruals for such losses that are probable of being incurred and subject to reasonable estimation. Management is sometimes unable to estimate an amount or range of a reasonably possible loss in certain situations, including but not limited to when (1) the damages sought are indeterminate, (2) the proceedings are in the early stages, or (3) the matters involve novel or unsettled legal theories. In such cases, there is considerable uncertainty regarding the timing or ultimate resolution of such matters, including a possible eventual loss.
Additional Information
See Note 6 to the financial statements for further discussion of legal claims and environmental proceedings. See Note 5 to the financial statements for discussion of proceedings involving utility rates and other regulatory matters.
Table of Contents
Schedule Q-4 Page 157 of 187
Sponsor: Robinson Case No. 15-00139-UT

27
Item 1A — RISK FACTORS
SPS’ risk factors are documented in Item 1A of Part I of its Annual Report on Form 10-K for the year ended Dec. 31, 2013, which is incorporated herein by reference. There have been no material changes from the risk factors previously disclosed in the Form 10-K.
Item 4 — MINE SAFETY DISCLOSURES
None.
Item 5 — OTHER INFORMATION
None.
Item 6 — EXHIBITS
* Indicates incorporation by reference
3.01* Amended and Restated Articles of Incorporation of SPS dated Sept. 30, 1997 (Exhibit 3(a)(2) to Form 10-K (file no.001-03789) dated March 3, 1998).
3.02* By-Laws of SPS as Amended and Restated on Sept. 26, 2013. (Exhibit 3.02 to Form 10-Q/A for the quarter ended Sept. 30, 2013 (file no. 001-03789)).
10.01* Amended and Restated Credit Agreement, dated as of Oct. 14, 2014 among SPS, as Borrower, the several lenders from timeto time parties thereto, JPMorgan Chase Bank, N.A., as Administrative Agent, Bank of America, N.A., and Barclays BankPlc, as Syndication Agents, and Wells Fargo Bank, National Association, as Documentation Agent (Incorporated byreference to Exhibit 99.04 to Form 8-K, dated Oct. 14, 2014 (file no. 001-03789)).Principal Executive Officer’s certifications pursuant to 18 U.S.C. Section 1350, as adopted pursuant to Section 302 of theSarbanes-Oxley Act of 2002.Principal Financial Officer’s certifications pursuant to 18 U.S.C. Section 1350, as adopted pursuant to Section 302 of theSarbanes-Oxley Act of 2002.Certification pursuant to 18 U.S.C. Section 1350, as adopted pursuant to Section 906 of the Sarbanes-Oxley Act of 2002.Statement pursuant to Private Securities Litigation Reform Act of 1995.
101 The following materials from SPS’ Quarterly Report on Form 10-Q for the quarter ended Sept. 30, 2014 are formatted inXBRL (eXtensible Business Reporting Language): (i) the Statements of Income, (ii) the Statements of ComprehensiveIncome (iii) the Statements of Cash Flows, (iv) the Balance Sheets, (v) Notes to Financial Statements, and (vi) documentand entity information.
Table of Contents
31.01
31.02
32.0199.01
Schedule Q-4 Page 158 of 187
Sponsor: Robinson Case No. 15-00139-UT

28
SIGNATURES
Pursuant to the requirements of the Securities Exchange Act of 1934, the registrant has duly caused this report to be signed on its behalf by the undersigned thereunto duly authorized.
Southwestern Public Service Company
Nov. 3, 2014 By: /s/ JEFFREY S. SAVAGE Jeffrey S. Savage Vice President and Controller /s/ TERESA S. MADDEN Teresa S. Madden Senior Vice President, Chief Financial Officer and Director
Table of Contents
Schedule Q-4 Page 159 of 187
Sponsor: Robinson Case No. 15-00139-UT

1
Exhibit 31.01
CERTIFICATION
I, David T. Hudson, certify that:
1. I have reviewed this report on Form 10-Q of Southwestern Public Service Company;
2. Based on my knowledge, this report does not contain any untrue statement of a material fact or omit to state a material fact necessary to make the statements made, in light of the circumstances under which such statements were made, not misleading with respect to the period covered by this report;
3. Based on my knowledge, the financial statements, and other financial information included in this report, fairly present in all material respects the financial condition, results of operations and cash flows of the registrant as of, and for, the periods presented in this report;
4. The registrant’s other certifying officer and I are responsible for establishing and maintaining disclosure controls and procedures (as defined in Exchange Act Rules 13a-15(e) and 15d-15(e)) and internal control over financial reporting (as defined in Exchange Act Rules 13a-15(f) and 15d-15(f)) for the registrant and have:
a. Designed such disclosure controls and procedures, or caused such disclosure controls and procedures to be designed under our supervision, to ensure that material information relating to the registrant is made known to us by others within those entities, particularly during the period in which this report is being prepared;
b. Designed such internal control over financial reporting, or caused such internal control over financial reporting to be designed under our supervision, to provide reasonable assurance regarding the reliability of financial reporting and the preparation of financial statements for external purposes in accordance with generally accepted accounting principles;
c. Evaluated the effectiveness of the registrant’s disclosure controls and procedures and presented in this report our conclusions about the effectiveness of the disclosure controls and procedures, as of the end of the period covered by this report based on such evaluation; and
d. Disclosed in this report any change in the registrant’s internal control over financial reporting that occurred during the registrant’s most recent fiscal quarter (the registrant’s fourth fiscal quarter in the case of an annual report) that has materially affected, or is reasonably likely to materially affect, the registrant’s internal control over financial reporting; and
5. The registrant’s other certifying officer and I have disclosed, based on our most recent evaluation of internal control over financial reporting, to the registrant’s auditors and the audit committee of the registrant’s board of directors (or persons performing the equivalent functions):
a. All significant deficiencies and material weaknesses in the design or operation of internal control over financial reporting which are reasonably likely to adversely affect the registrant’s ability to record, process, summarize and report financial information; and
b. Any fraud, whether or not material, that involves management or other employees who have a significant role in the registrant’s internal control over financial reporting.
Date: Nov. 3, 2014
/s/ DAVID T. HUDSON David T. Hudson President, Chief Executive Officer and Director
Schedule Q-4 Page 160 of 187
Sponsor: Robinson Case No. 15-00139-UT

2
Exhibit 31.02
CERTIFICATION
I, Teresa S. Madden, certify that:
1. I have reviewed this report on Form 10-Q of Southwestern Public Service Company;
2. Based on my knowledge, this report does not contain any untrue statement of a material fact or omit to state a material fact necessary to make the statements made, in light of the circumstances under which such statements were made, not misleading with respect to the period covered by this report;
3. Based on my knowledge, the financial statements, and other financial information included in this report, fairly present in all material respects the financial condition, results of operations and cash flows of the registrant as of, and for, the periods presented in this report;
4. The registrant’s other certifying officer and I are responsible for establishing and maintaining disclosure controls and procedures (as defined in Exchange Act Rules 13a-15(e) and 15d-15(e)) and internal control over financial reporting (as defined in Exchange Act Rules 13a-15(f) and 15d-15(f)) for the registrant and have:
a. Designed such disclosure controls and procedures, or caused such disclosure controls and procedures to be designed under our supervision, to ensure that material information relating to the registrant is made known to us by others within those entities, particularly during the period in which this report is being prepared;
b. Designed such internal control over financial reporting, or caused such internal control over financial reporting to be designed under our supervision, to provide reasonable assurance regarding the reliability of financial reporting and the preparation of financial statements for external purposes in accordance with generally accepted accounting principles;
c. Evaluated the effectiveness of the registrant’s disclosure controls and procedures and presented in this report our conclusions about the effectiveness of the disclosure controls and procedures, as of the end of the period covered by this report based on such evaluation; and
d. Disclosed in this report any change in the registrant’s internal control over financial reporting that occurred during the registrant’s most recent fiscal quarter (the registrant’s fourth fiscal quarter in the case of an annual report) that has materially affected, or is reasonably likely to materially affect, the registrant’s internal control over financial reporting; and
5. The registrant’s other certifying officer and I have disclosed, based on our most recent evaluation of internal control over financial reporting, to the registrant’s auditors and the audit committee of the registrant’s board of directors (or persons performing the equivalent functions):
a. All significant deficiencies and material weaknesses in the design or operation of internal control over financial reporting which are reasonably likely to adversely affect the registrant’s ability to record, process, summarize and report financial information; and
b. Any fraud, whether or not material, that involves management or other employees who have a significant role in the registrant’s internal control over financial reporting
Date: Nov. 3, 2014
/s/ TERESA S. MADDEN Teresa S. Madden Senior Vice President, Chief Financial Officer and Director
Schedule Q-4 Page 161 of 187
Sponsor: Robinson Case No. 15-00139-UT

1
Exhibit 32.01
OFFICER CERTIFICATION
CERTIFICATION PURSUANT TO18 U.S.C. SECTION 1350,
AS ADOPTED PURSUANT TOSECTION 906 OF THE SARBANES-OXLEY ACT OF 2002
In connection with the Quarterly Report of Southwestern Public Service Company (SPS) on Form 10-Q for the quarter ended Sept. 30, 2014, as filed with the SEC on the date hereof (Form 10-Q), each of the undersigned officers of SPS certifies, pursuant to 18 U.S.C. Section 1350, as adopted pursuant to Section 906 of the Sarbanes-Oxley Act of 2002, that, to such officer’s knowledge:
(1) The Form 10-Q fully complies with the requirements of Section 13(a) or 15(d) of the Securities Exchange Act of 1934; and
(2) The information contained in the Form 10-Q fairly presents, in all material respects, the financial condition and results of operations of SPS as of the dates and for the periods expressed in the Form 10-Q.
Date: Nov. 3, 2014
/s/ DAVID T. HUDSON David T. Hudson President, Chief Executive Officer and Director /s/ TERESA S. MADDEN Teresa S. Madden Senior Vice President, Chief Financial Officer and Director
The foregoing certification is being furnished solely pursuant to 18 U.S.C. Section 1350 and is not being filed as part of the Report or as a separate disclosure document.
A signed original of this written statement required by Section 906, or other document authenticating, acknowledging or otherwise adopting the signature that appears in typed form within the electronic version of this written statement required by Section 906, has been provided to SPS and will be retained by SPS and furnished to the SEC or its staff upon request.
Schedule Q-4 Page 162 of 187
Sponsor: Robinson Case No. 15-00139-UT

1
Exhibit 99.01
SPS Cautionary Factors
The Private Securities Litigation Reform Act provides a “safe harbor” for forward-looking statements to encourage such disclosures without the threat of litigation, providing those statements are identified as forward-looking and are accompanied by meaningful, cautionary statements identifying important factors that could cause the actual results to differ materially from those projected in the statement. Forward-looking statements are made in written documents and oral presentations of SPS, Xcel Energy Inc. or any of its other subsidiaries. These statements are based on management’s beliefs as well as assumptions and information currently available to management. Such forward-looking statements are intended to be identified in this document by the words “anticipate,” “believe,” “estimate,” “expect,” “intend,” “may,” “objective,” “outlook,” “plan,” “project,” “possible,” “potential,” “should” and similar expressions. In addition to any assumptions and other factors referred to specifically in connection with such forward-looking statements, factors that could cause SPS’ actual results to differ materially from those contemplated in any forward-looking statements include, among others, the following:
• Economic conditions, including inflation rates, monetary fluctuations and their impact on capital expenditures;• The risk of a significant slowdown in growth or decline in the U.S. economy, the risk of delay in growth recovery in the
U.S. economy or the risk of increased cost for insurance premiums, security and other items as a consequence of past or future terrorist attacks;
• Trade, monetary, fiscal, taxation and environmental policies of governments, agencies and similar organizations in geographic areas where SPS has a financial interest;
• Customer business conditions, including demand for their products or services and supply of labor and materials used in creating their products and services;
• Financial or regulatory accounting principles or policies imposed by the FASB, the SEC, the FERC and similar entities with regulatory oversight;
• Availability or cost of capital such as changes in: interest rates; market perceptions of the utility industry, SPS, Xcel Energy Inc. or any of its other subsidiaries; or security ratings;
• Factors affecting utility operations such as unusual weather conditions; catastrophic weather-related damage; unscheduled generation outages, maintenance or repairs; unanticipated changes to fossil fuel or natural gas supply costs or availability due to higher demand, shortages, transportation problems or other developments; environmental incidents; cyber incidents; or electric transmission or natural gas pipeline constraints;
• Employee workforce factors, including loss or retirement of key executives, collective-bargaining agreements with union employees, or work stoppages;
• Increased competition in the utility industry or additional competition in the markets served by SPS, Xcel Energy Inc. and its other subsidiaries;
• State and federal legislative and regulatory initiatives that affect cost and investment recovery, have an impact on rate structures and affect the speed and degree to which competition enters the electric market; industry restructuring initiatives; transmission system operation and/or administration initiatives; recovery of investments made under traditional regulation; nature of competitors entering the industry; retail wheeling; a new pricing structure; and former customers entering the generation market;
• Environmental laws and regulations, including legislation and regulations relating to climate change, and the associated cost of compliance;
• Rate-setting policies or procedures of regulatory entities, including environmental externalities, which are values established by regulators assigning environmental costs to each method of electricity generation when evaluating generation resource options;
• Social attitudes regarding the utility and power industries;• Cost and other effects of legal and administrative proceedings, settlements, investigations and claims;• Technological developments that result in competitive disadvantages and create the potential for impairment of existing
assets;• Risks associated with implementation of new technologies; and• Other business or investment considerations that may be disclosed from time to time in SEC filings, including “Risk
Factors” in Item 1A of SPS’ Form 10-K for the year ended Dec. 31, 2013, or in other publicly disseminated written documents.
SPS undertakes no obligation to publicly update or revise any forward-looking statements, whether as a result of new information, future events or otherwise. The foregoing review of factors should not be construed as exhaustive.
Schedule Q-4 Page 163 of 187
Sponsor: Robinson Case No. 15-00139-UT

UNITED STATESSECURITIES AND EXCHANGE COMMISSION
Washington, D.C. 20549
FORM 10-Q(Mark One)
QUARTERLY REPORT PURSUANT TO SECTION 13 OR 15(d) OF THE SECURITIESEXCHANGE ACT OF 1934
For the quarterly period ended March 31, 2015 or
TRANSITION REPORT PURSUANT TO SECTION 13 OR 15(d) OF THE SECURITIESEXCHANGE ACT OF 1934
Commission File Number: 001-03789
Southwestern Public Service Company(Exact name of registrant as specified in its charter)
New Mexico 75-0575400(State or other jurisdiction of incorporation or organization) (I.R.S. Employer Identification No.)
Tyler at Sixth Amarillo, Texas 79101
(Address of principal executive offices) (Zip Code)
(303) 571-7511(Registrant’s telephone number, including area code)
Indicate by check mark whether the registrant (1) has filed all reports required to be filed by Section 13 or 15(d) of the Securities Exchange Act of 1934 during the preceding 12 months (or for such shorter period that the registrant was required to file such reports), and (2) has been subject to such filing requirements for the past 90 days. Yes No
Indicate by check mark whether the registrant has submitted electronically and posted on its corporate Web site, if any, every Interactive Data File required to be submitted and posted pursuant to Rule 405 and Regulation S-T (§232.405 of this chapter) during the preceding 12 months (or for such shorter period that the registrant was required to submit and post such files). Yes No
Indicate by check mark whether the registrant is a large accelerated filer, an accelerated filer, a non-accelerated filer, or a smaller reporting company. See the definitions of “large accelerated filer,” “accelerated filer” and “smaller reporting company” in Rule 12b-2 of the Exchange Act.
Large accelerated filer Accelerated filer Non-accelerated filer Smaller reporting company
(Do not check if smaller reporting company)
Indicate by check mark whether the registrant is a shell company (as defined in Rule 12b-2 of the Exchange Act). Yes No
Indicate the number of shares outstanding of each of the issuer’s classes of common stock, as of the latest practicable date.
Class Outstanding at May 4, 2015
Common Stock, $1 par value 100 shares
Southwestern Public Service Company meets the conditions set forth in General Instruction H (1)(a) and (b) of Form 10-Q and is therefore filing this Form 10-Q with the reduced disclosure format specified in General Instruction H (2) to such Form 10-Q.
Schedule Q-4 Page 164 of 187
Sponsor: Robinson Case No. 15-00139-UT

2
TABLE OF CONTENTS
PART I — FINANCIAL INFORMATIONItem l — Financial Statements (Unaudited)Item 2 — Management’s Discussion and Analysis of Financial Condition and Results of OperationsItem 4 — Controls and Procedures PART II — OTHER INFORMATIONItem 1 — Legal ProceedingsItem 1A — Risk FactorsItem 4 — Mine Safety DisclosuresItem 5 — Other InformationItem 6 — Exhibits SIGNATURES Certifications Pursuant to Section 302 1Certifications Pursuant to Section 906 1Statement Pursuant to Private Litigation 1
This Form 10-Q is filed by Southwestern Public Service Company, a New Mexico corporation (SPS). SPS is a wholly owned subsidiary of Xcel Energy Inc. Xcel Energy Inc. wholly owns the following subsidiaries: Northern States Power Company, a Minnesota corporation (NSP-Minnesota); Northern States Power Company, a Wisconsin corporation (NSP-Wisconsin); Public Service Company of Colorado, a Colorado corporation (PSCo); and SPS. NSP-Minnesota, NSP-Wisconsin, PSCo and SPS are also referred to collectively as utility subsidiaries. Additional information on Xcel Energy Inc. and its subsidiaries (collectively, Xcel Energy) is available on various filings with the Securities and Exchange Commission (SEC).
31922
2222222323
24
Schedule Q-4 Page 165 of 187
Sponsor: Robinson Case No. 15-00139-UT

Table of Contents
3
PART 1 — FINANCIAL INFORMATIONItem 1 — FINANCIAL STATEMENTS
SOUTHWESTERN PUBLIC SERVICE COMPANYSTATEMENTS OF INCOME (UNAUDITED)
(amounts in thousands)
Three Months Ended March 312015 2014
Operating revenues $ 423,829 $ 448,400
Operating expensesElectric fuel and purchased power 245,799 289,204Operating and maintenance expenses 73,897 69,398Demand side management program expenses 3,669 3,064Depreciation and amortization 35,739 30,512Taxes (other than income taxes) 14,966 13,646
Total operating expenses 374,070 405,824
Operating income 49,759 42,576
Other (expense) income, net (56) 41Allowance for funds used during construction — equity 1,705 3,640
Interest charges and financing costsInterest charges — includes other financing costs of
$774 and $730, respectively 20,884 19,281Allowance for funds used during construction — debt (1,061) (2,127)
Total interest charges and financing costs 19,823 17,154
Income before income taxes 31,585 29,103Income taxes 11,338 10,368Net income $ 20,247 $ 18,735
See Notes to Financial Statements
Schedule Q-4 Page 166 of 187
Sponsor: Robinson Case No. 15-00139-UT

Table of Contents
4
SOUTHWESTERN PUBLIC SERVICE COMPANYSTATEMENTS OF COMPREHENSIVE INCOME (UNAUDITED)
(amounts in thousands)
Three Months Ended March 31 2015 2014
Net income $ 20,247 $ 18,735Other comprehensive income Derivative instruments: Reclassification of losses to net income, net of tax of $24 for each of the three months ended March 31,
2015 and 2014, respectively 42 43Other comprehensive income 42 43Comprehensive income $ 20,289 $ 18,778
See Notes to Financial Statements
Schedule Q-4 Page 167 of 187
Sponsor: Robinson Case No. 15-00139-UT

Table of Contents
5
SOUTHWESTERN PUBLIC SERVICE COMPANYSTATEMENTS OF CASH FLOWS (UNAUDITED)
(amounts in thousands)
Three Months Ended March 31 2015 2014Operating activities
Net income $ 20,247 $ 18,735Adjustments to reconcile net income to cash provided by operating activities:
Depreciation and amortization 36,310 31,059Demand side management program amortization 418 418Deferred income taxes 3,617 22,166Amortization of investment tax credits (85) (85)Allowance for equity funds used during construction (1,705) (3,640)Net derivative losses 66 66Changes in operating assets and liabilities:
Accounts receivable (12,719) 12,526Accrued unbilled revenues 26,906 (2,413)Inventories 11,482 5,131Prepayments and other (12,485) (15,455)Accounts payable (21,160) 9,454Net regulatory assets and liabilities 29,566 (16,994)Other current liabilities 12,521 3,908Pension and other employee benefit obligations (10,954) (3,513)
Change in other noncurrent assets 301 2,951Change in other noncurrent liabilities 378 1,758
Net cash provided by operating activities 82,704 66,072
Investing activities Utility capital/construction expenditures (126,622) (137,637)Allowance for equity funds used during construction 1,705 3,640Investments in utility money pool arrangement (9,000) (10,000)Repayments from utility money pool arrangement 9,000 10,000
Net cash used in investing activities (124,917) (133,997)
Financing activities Proceeds from (repayment of) short-term borrowings, net 86,000 (15,000)Borrowings under utility money pool arrangement 41,000 231,000Repayments under utility money pool arrangement (57,000) (169,000)Capital contributions from parent — 40,000Dividends paid to parent (27,828) (18,082)
Net cash provided by financing activities 42,172 68,918
Net change in cash and cash equivalents (41) 993Cash and cash equivalents at beginning of period 596 1,011Cash and cash equivalents at end of period $ 555 $ 2,004
Supplemental disclosure of cash flow information: Cash paid for interest (net of amounts capitalized) $ (8,870) $ (7,570)Cash paid for income taxes, net (19,004) (2,522)
Supplemental disclosure of non-cash investing transactions: Property, plant and equipment additions in accounts payable $ 28,426 $ 30,938
See Notes to Financial Statements
Schedule Q-4 Page 168 of 187
Sponsor: Robinson Case No. 15-00139-UT
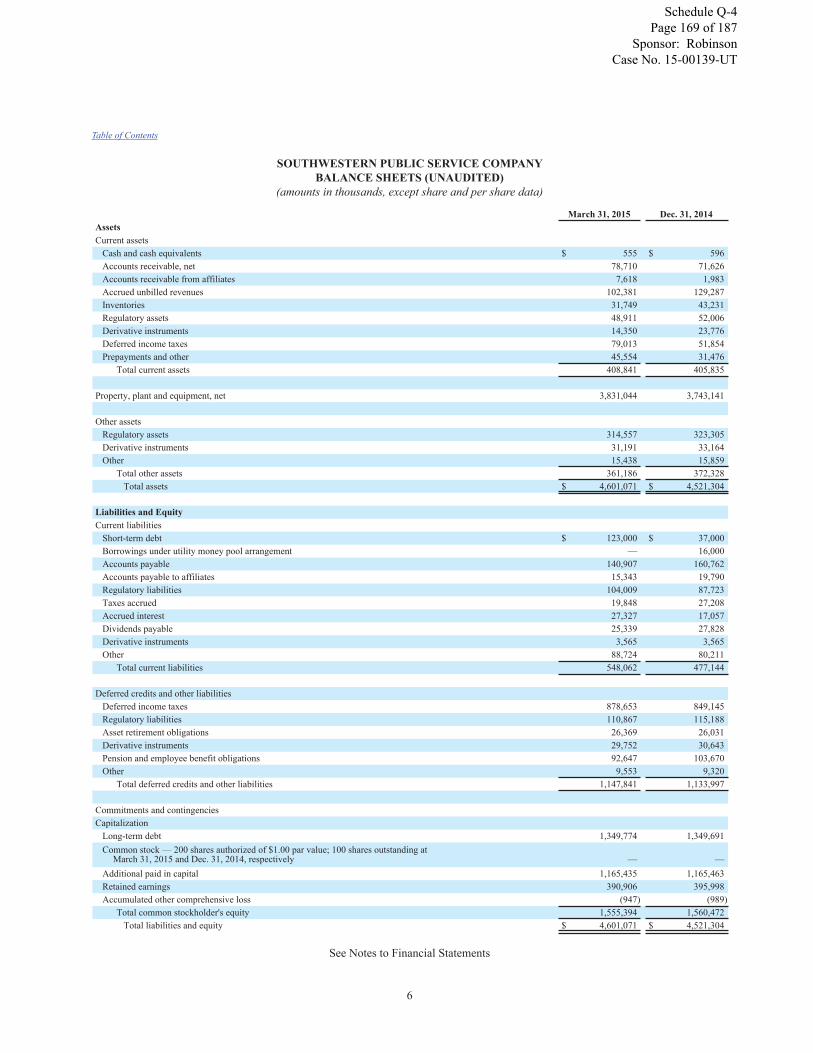
Table of Contents
6
SOUTHWESTERN PUBLIC SERVICE COMPANYBALANCE SHEETS (UNAUDITED)
(amounts in thousands, except share and per share data)
March 31, 2015 Dec. 31, 2014Assets Current assets
Cash and cash equivalents $ 555 $ 596Accounts receivable, net 78,710 71,626Accounts receivable from affiliates 7,618 1,983Accrued unbilled revenues 102,381 129,287Inventories 31,749 43,231Regulatory assets 48,911 52,006Derivative instruments 14,350 23,776Deferred income taxes 79,013 51,854Prepayments and other 45,554 31,476
Total current assets 408,841 405,835
Property, plant and equipment, net 3,831,044 3,743,141
Other assets Regulatory assets 314,557 323,305Derivative instruments 31,191 33,164Other 15,438 15,859
Total other assets 361,186 372,328Total assets $ 4,601,071 $ 4,521,304
Liabilities and Equity Current liabilities
Short-term debt $ 123,000 $ 37,000Borrowings under utility money pool arrangement — 16,000Accounts payable 140,907 160,762Accounts payable to affiliates 15,343 19,790Regulatory liabilities 104,009 87,723Taxes accrued 19,848 27,208Accrued interest 27,327 17,057Dividends payable 25,339 27,828Derivative instruments 3,565 3,565Other 88,724 80,211
Total current liabilities 548,062 477,144
Deferred credits and other liabilities Deferred income taxes 878,653 849,145Regulatory liabilities 110,867 115,188Asset retirement obligations 26,369 26,031Derivative instruments 29,752 30,643Pension and employee benefit obligations 92,647 103,670Other 9,553 9,320
Total deferred credits and other liabilities 1,147,841 1,133,997
Commitments and contingenciesCapitalization
Long-term debt 1,349,774 1,349,691Common stock — 200 shares authorized of $1.00 par value; 100 shares outstanding at
March 31, 2015 and Dec. 31, 2014, respectively — —Additional paid in capital 1,165,435 1,165,463Retained earnings 390,906 395,998Accumulated other comprehensive loss (947) (989)
Total common stockholder's equity 1,555,394 1,560,472Total liabilities and equity $ 4,601,071 $ 4,521,304
See Notes to Financial Statements
Schedule Q-4 Page 169 of 187
Sponsor: Robinson Case No. 15-00139-UT

Table of Contents
7
SOUTHWESTERN PUBLIC SERVICE COMPANYNotes to Financial Statements (UNAUDITED)
In the opinion of management, the accompanying unaudited financial statements contain all adjustments necessary to present fairly, in accordance with accounting principles generally accepted in the United States of America (GAAP), the financial position of SPS as of March 31, 2015, and Dec. 31, 2014; the results of its operations, including the components of net income and comprehensive income, for the three months ended March 31, 2015 and 2014; and its cash flows for the three months ended March 31, 2015 and 2014. All adjustments are of a normal, recurring nature, except as otherwise disclosed. Management has also evaluated the impact of events occurring after March 31, 2015 up to the date of issuance of these financial statements. These statements contain all necessary adjustments and disclosures resulting from that evaluation. The Dec. 31, 2014 balance sheet information has been derived from the audited 2014 financial statements included in the SPS Annual Report on Form 10-K for the year ended Dec. 31, 2014. These notes to the financial statements have been prepared pursuant to the rules and regulations of the SEC for Quarterly Reports on Form 10-Q. Certain information and note disclosures normally included in financial statements prepared in accordance with GAAP on an annual basis have been condensed or omitted pursuant to such rules and regulations. For further information, refer to the financial statements and notes thereto included in the SPS Annual Report on Form 10-K for the year ended Dec. 31, 2014, filed with the SEC on Feb. 23, 2015. Due to the seasonality of SPS’ electric sales, interim results are not necessarily an appropriate base from which to project annual results.
1. Summary of Significant Accounting Policies
The significant accounting policies set forth in Note 1 to the financial statements in the SPS Annual Report on Form 10-K for the year ended Dec. 31, 2014, appropriately represent, in all material respects, the current status of accounting policies and are incorporated herein by reference.
2. Accounting Pronouncements
Recently Issued
Revenue Recognition — In May 2014, the Financial Accounting Standards Board (FASB) issued Revenue from Contracts with Customers, Topic 606 (Accounting Standards Update (ASU) No. 2014-09), which provides a framework for the recognition of revenue, with the objective that recognized revenues properly reflect amounts an entity is entitled to receive in exchange for goods and services. This guidance, which includes additional disclosure requirements regarding revenue, cash flows and obligations related to contracts with customers, is effective for interim and annual reporting periods beginning after Dec. 15, 2016. In April 2015, the FASB tentatively decided to defer the effective date by one year, making the guidance effective for interim and annual reporting periods beginning after Dec. 15, 2017. This tentative decision will be exposed for public input in an upcoming proposed ASU with a 30-day comment period. SPS is currently evaluating the impact of adopting ASU 2014-09 on its financial statements.
Consolidation — In February 2015, the FASB issued Amendments to the Consolidation Analysis, Topic 810 (ASU No. 2015-02), which reduces the number of consolidation models and amends certain consolidation principles related to variable interest entities. This guidance will be effective for interim and annual reporting periods beginning after Dec. 15. 2015, and early adoption is permitted. SPS is currently evaluating the impact of adopting ASU 2015-02 on its financial statements.
Presentation of Debt Issuance Costs — In April 2015, the FASB issued Simplifying the Presentation of Debt Issuance Costs, Subtopic 835-30 (ASU No. 2015-03), which amends existing guidance to require the presentation of debt issuance costs on the balance sheet as a deduction from the carrying amount of the related debt, instead of an asset. This guidance will be effective for interim and annual reporting periods beginning after Dec. 15, 2015, and early adoption is permitted. Other than the prescribed reclassification of assets to an offset of debt on the balance sheets, SPS does not expect the implementation of ASU 2015-03 to have a material impact on its financial statements.
3. Selected Balance Sheet Data
(Thousands of Dollars) March 31, 2015 Dec. 31, 2014
Accounts receivable, netAccounts receivable $ 84,817 $ 77,465Less allowance for bad debts (6,107) (5,839)
$ 78,710 $ 71,626
Schedule Q-4 Page 170 of 187
Sponsor: Robinson Case No. 15-00139-UT

Table of Contents
8
(Thousands of Dollars) March 31, 2015 Dec. 31, 2014
InventoriesMaterials and supplies $ 25,500 $ 24,738Fuel 6,249 18,493
$ 31,749 $ 43,231
(Thousands of Dollars) March 31, 2015 Dec. 31, 2014
Property, plant and equipment, netElectric plant $ 5,480,750 $ 5,376,606Construction work in progress 248,921 238,519
Total property, plant and equipment 5,729,671 5,615,125Less accumulated depreciation (1,898,627) (1,871,984)
$ 3,831,044 $ 3,743,141
4. Income Taxes
Except to the extent noted below, Note 6 to the financial statements included in SPS’ Annual Report on Form 10-K for the year ended Dec. 31, 2014 appropriately represents, in all material respects, the current status of other income tax matters, and are incorporated herein by reference.
Federal Audit — SPS is a member of the Xcel Energy affiliated group that files a consolidated federal income tax return. The statute of limitations applicable to Xcel Energy’s 2009 federal income tax return expires in March 2016. In the third quarter of 2012, the Internal Revenue Service (IRS) commenced an examination of tax years 2010 and 2011, including a 2009 carryback claim. As of March 31, 2015, the IRS had proposed an adjustment to several federal tax loss carryback claims that would result in $12 million of income tax expense for the 2009 through 2011 claims, the recently filed 2013 claim, and the anticipated claim for 2014. SPS is not expected to accrue any income tax expense related to this adjustment. As of March 31, 2015, the IRS has begun the appeals process; however, the outcome and timing of a resolution are uncertain.
State Audits — SPS is a member of the Xcel Energy affiliated group that files consolidated state income tax returns. As of March 31, 2015, SPS’ earliest open tax year that is subject to examination by state taxing authorities under applicable statutes of limitations is 2009. There are currently no state income tax audits in progress.
Unrecognized Tax Benefits — The unrecognized tax benefit balance includes permanent tax positions, which if recognized would affect the annual effective tax rate (ETR). In addition, the unrecognized tax benefit balance includes temporary tax positions for which the ultimate deductibility is highly certain but for which there is uncertainty about the timing of such deductibility. A change in the period of deductibility would not affect the ETR but would accelerate the payment of cash to the taxing authority to an earlier period.
A reconciliation of the amount of unrecognized tax benefit is as follows:
(Millions of Dollars) March 31, 2015 Dec. 31, 2014
Unrecognized tax benefit — Permanent tax positions $ 1.5 $ 1.5Unrecognized tax benefit — Temporary tax positions 12.3 11.7
Total unrecognized tax benefit $ 13.8 $ 13.2
The unrecognized tax benefit amounts were reduced by the tax benefits associated with net operating loss (NOL) and tax credit carryforwards. The amounts of tax benefits associated with NOL and tax credit carryforwards are as follows:
(Millions of Dollars) March 31, 2015 Dec. 31, 2014
NOL and tax credit carryforwards $ (5.5) $ (4.8)
It is reasonably possible that SPS’ amount of unrecognized tax benefits could significantly change in the next 12 months as the IRS appeals process progresses and state audits resume. As the IRS examination moves closer to completion, it is reasonably possible that the amount of unrecognized tax benefit could decrease up to approximately $2 million.
Schedule Q-4 Page 171 of 187
Sponsor: Robinson Case No. 15-00139-UT

Table of Contents
9
The payable for interest related to unrecognized tax benefits is partially offset by the interest benefit associated with NOL and tax credit carryforwards. The payables for interest related to unrecognized tax benefits at March 31, 2015 and Dec. 31, 2014 were not material. No amounts were accrued for penalties related to unrecognized tax benefits as of March 31, 2015 or Dec. 31, 2014.
5. Rate Matters
Except to the extent noted below, the circumstances set forth in Note 10 to the financial statements included in SPS’ Annual Report on Form 10-K for the year ended Dec. 31, 2014 appropriately represent, in all material respects, the current status of other rate matters, and are incorporated herein by reference.
Pending Regulatory Proceedings — Public Utility Commission of Texas (PUCT)
Texas 2015 Electric Rate Case — In December 2014, SPS filed a retail electric, non-fuel rate case in Texas seeking an overall increase in annual revenue of approximately $64.8 million, or 6.7 percent. The filing was based on a historic test year ending June 2014, adjusted for known and measurable changes, a return on equity (ROE) of 10.25 percent, an electric rate base of approximately $1.6 billion and an equity ratio of 53.97 percent. In March 2015, SPS revised its requested increase to $58.9 million based on updated information.
As part of its request, SPS is seeking a waiver of the PUCT post-test year adjustment rule which would allow for inclusion of $392 million (SPS total company) additional capital investment for the period July 1, 2014 through Dec. 31, 2014.
The following table summarizes the net request:
(Millions of Dollars) Request
Investment for capital expenditures — post-test year adjustments $ 23.7Depreciation expense 13.9Wholesale load reductions 12.0Purchased power capacity costs 3.2Other, net 6.1 Total $ 58.9
In April 2015, a revised procedural schedule was established. The next steps are expected to be as follows:
• Intervenor Direct Testimony — May 15, 2015;• Staff Direct Testimony — May 22, 2015;• Staff and Intervenor Cross-Rebuttal Testimony — June 8, 2015;• Rebuttal Testimony — June 10, 2015; and• Evidentiary Hearing — June 24, 2015.
The parties have agreed the rates will be effective June 11, 2015. A PUCT decision is anticipated in the second half of 2015.
Pending and Recently Concluded Regulatory Proceedings — Federal Energy Regulatory Commission (FERC)
Wholesale Rate Complaints — In April 2012, Golden Spread Electric Cooperative, Inc. (Golden Spread), a wholesale cooperative customer, filed a rate complaint alleging that the base ROE included in the SPS production formula rate for Golden Spread of 10.25 percent, and the SPS transmission base formula rate ROE of 10.77 percent, are unjust and unreasonable. In July 2013, Golden Spread filed a second complaint, again asking that the base ROE in the SPS production formula rate for Golden Spread and transmission formula rates be reduced to 9.15 and 9.65 percent, respectively. In June 2014, the FERC issued orders consolidating the Golden Spread ROE complaints and setting the complaints for settlement judge or hearing procedures.
Schedule Q-4 Page 172 of 187
Sponsor: Robinson Case No. 15-00139-UT

Table of Contents
10
The FERC established effective dates for the refunds as April 20, 2012 (first refund period) and July 19, 2013 (second refund period). Settlement judge procedures were unsuccessful and the complaints were set for hearings. In the first quarter of 2015, Golden Spread, SPS and FERC staff filed their initial testimonies recommending the following ROEs:
RefundPeriod
ProductionROE
Transmission ROE (a)
Golden Spread 1 8.78% 9.28%2 8.51 9.01
SPS 1 10.25 10.392 10.25 11.20
FERC Staff 1 8.97 9.472 8.64 9.14
(a) Includes a Southwest Power Pool, Inc. (SPP) Regional Transmission Organization (RTO) membership adder up to 50 basis points.
Hearings are scheduled for July 2015. An initial administrative law judge (ALJ) decision is expected to be issued by Nov. 25, 2015, and a final FERC order to be issued no earlier than 2016.
A third rate complaint was filed in October 2014 by Golden Spread, along with certain New Mexico cooperatives and the West Texas Municipal Power Agency, requesting that the ROE in the SPS production formula rates for Golden Spread and the New Mexico cooperatives and SPS transmission formula rate, which includes an SPP RTO membership adder up to 50 basis points, be reduced to 8.61 percent and 9.11 percent, respectively. The complainants requested a refund effective date of Oct. 20, 2014. In January 2015, the FERC issued an order setting the third complaint for hearing procedures and granting the complainants’ requested refund effective date. A hearing is scheduled for October 2015, with an ALJ initial decision expected in January 2016, and a final FERC order following later in 2016.
SPS recorded a current liability representing the current best estimate of a refund obligation associated with potential ROE adjustments as of March 31, 2015, and is reducing transmission and production revenues, net of expense, between $4 million and $6 million annually.
2004 FERC Complaint Case Orders — In August 2013, the FERC issued an order related to a 2004 complaint case brought by Golden Spread and Public Service Company of New Mexico (PNM) and an Order on Initial Decision in a subsequent 2006 production rate case filed by SPS.
The original complaint included two key components: 1) PNM’s claim regarding inappropriate allocation of fuel costs and 2) a base rate complaint, including the appropriate demand-related cost allocator. The FERC previously determined that the allocation of fuel costs and the demand-related cost allocator utilized by SPS was appropriate.
In the August 2013 Orders, the FERC clarified its previous ruling on the allocation of fuel costs and reaffirmed that the refunds in question should only apply to firm requirements customers and not PNM’s contractual load. The FERC also reversed its prior demand-related cost allocator decision. The FERC stated that it had erred in its initial analysis and concluded that the SPS system was a 3 coincident peak (CP) rather than a 12 CP system.
In September 2013, SPS filed a request for rehearing of the FERC ruling on the CP allocation and refund decisions. SPS asserted that the FERC applied an improper burden of proof and that precedent did not support retroactive refunds. PNM also requested rehearing of the FERC decision not to reverse its prior ruling. In October 2013, the FERC issued orders further considering the requests for rehearing, which are currently pending. As of Dec. 31, 2014, SPS had accrued $50.4 million related to the August 2013 Orders and an additional $1.8 million of principal and interest was accrued during 2015.
2015 Formula Rate Change Filing — In January 2015, SPS filed to revise the production formula rates for six of its wholesale customers, including Golden Spread, effective Feb. 1, 2015. The filing proposes several modifications, including a reduction in wholesale depreciation rates and the use of a 12 CP demand-related cost allocator for all wholesale customers. On March 31, 2015, the FERC accepted this filing, effective July 1, 2015, subject to refund and settlement judge or hearing procedures. The parties are engaged in settlement judge procedures.
Schedule Q-4 Page 173 of 187
Sponsor: Robinson Case No. 15-00139-UT

Table of Contents
11
6. Commitments and Contingencies
Except to the extent noted below and in Note 5, Notes 10 and 11 to the financial statements in SPS’ Annual Report on Form 10-K for the year ended Dec. 31, 2014, appropriately represent, in all material respects, the current status of commitments and contingent liabilities and are incorporated herein by reference. The following include commitments, contingencies and unresolved contingencies that are material to SPS’ financial position.
Purchased Power Agreements (PPAs)
Under certain PPAs, SPS purchases power from independent power producing entities that own natural gas fueled power plants for which SPS is required to reimburse natural gas fuel costs, or to participate in tolling arrangements under which SPS procures the natural gas required to produce the energy that it purchases. These specific PPAs create a variable interest in the associated independent power producing entity.
SPS had approximately 827 megawatts (MW) of capacity under long-term PPAs as of March 31, 2015 and Dec. 31, 2014, with entities that have been determined to be variable interest entities. SPS has concluded that these entities are not required to be consolidated in its financial statements because it does not have the power to direct the activities that most significantly impact the entities’ economic performance. These agreements have expiration dates through 2033.
Environmental Contingencies
Environmental Requirements
Water and WasteCoal Ash Regulation — SPS’s operations are subject to federal and state laws that impose requirements for handling, storage, treatment, and disposal of solid waste. On April 17, 2015, the U.S. Environmental Protection Agency (EPA) published a final rule regulating the management and disposal of coal combustion byproducts (coal ash) as a nonhazardous waste. SPS’s costs to manage and dispose of coal ash will not significantly increase under the new rule.
AirCross-State Air Pollution Rule (CSAPR) — CSAPR addresses long range transport of particulate matter (PM) and ozone by requiring reductions in sulfur dioxide (SO2) and nitrous oxide (NOx) from utilities in the eastern half of the United States, including Texas, using an emissions trading program.
In August 2012, the United States District Court of Appeals for the District of Columbia Circuit (D.C. Circuit) vacated the CSAPR and remanded it back to the EPA. The D.C. Circuit stated the EPA must continue administering the Clean Air Interstate Rule (CAIR) pending adoption of a valid replacement. In April 2014, the U.S. Supreme Court reversed and remanded the case to the D.C. Circuit. The Supreme Court held that the EPA’s rule design did not violate the Clean Air Act (CAA) and that states had received adequate opportunity to develop their own plans. Because the D.C. Circuit overturned the CSAPR on two over-arching issues, there are many other issues the D.C. Circuit did not rule on that will now need to be considered on remand. An opinion is expected late summer 2015. In October 2014, the D.C. Circuit granted the EPA’s request to begin to implement CSAPR by imposing its 2012 compliance obligations starting in January 2015. While the litigation continues, the EPA will administer the CSAPR in 2015.
Multiple changes to the SPS system since 2011 will substantially reduce estimated costs of complying with the CSAPR. These include the addition of 700 MW of wind power, the construction of Jones Units 3 and 4, reduced wholesale load, new PPAs, installation of NOx combustion controls on Tolk Units 1 and 2 and completion of certain transmission projects. As a result, SPS estimates compliance with the CSAPR in 2015 will cost approximately $7 million. CSAPR compliance in 2015 is not expected to have a material impact on the results of operations, financial position or cash flows.
Regional Haze Rules — The regional haze program is designed to address widespread haze that results from emissions from a multitude of sources. In 2005, the EPA amended the best available retrofit technology (BART) requirements of its regional haze rules, which require the installation and operation of emission controls for industrial facilities emitting air pollutants that reduce visibility in certain national parks and wilderness areas. In its first regional haze state implementation plan (SIP), Texas identified the SPS facilities that will have to reduce SO2, NOx and PM emissions under BART and set emissions limits for those facilities.
Schedule Q-4 Page 174 of 187
Sponsor: Robinson Case No. 15-00139-UT

Table of Contents
12
Harrington Units 1 and 2 are potentially subject to BART. Texas developed a SIP that finds the CAIR equal to BART for electric generating units (EGUs). As a result, no additional controls beyond CAIR compliance would be required. In May 2012, the EPA deferred its review of the SIP in its final rule allowing states to find that CSAPR compliance meets BART requirements for EGUs. In December 2014, the EPA proposed to approve the BART portion of the SIP, with the exception that the EPA would substitute CSAPR compliance for Texas’ reliance on CAIR. The EPA currently plans to issue its final rule in August 2015.
In May 2014, the EPA issued a request for information under the CAA related to SO2 control equipment at Tolk Units 1 and 2. In December 2014, the EPA proposed to disapprove the reasonable progress portions of the SIP and instead adopt a Federal Implementation Plan. For SPS, the EPA proposed to require dry scrubbers on both Tolk units to reduce SO2 emissions to help achieve reasonable progress goals the EPA would establish for Texas and Oklahoma national parks and wilderness areas. As proposed, the dry scrubbers would need to be installed and operating within five years of the EPA’s final action, currently expected in August 2015. SPS filed comments in April 2015, opposing the proposal. Whether dry scrubbers are required is dependent on the EPA’s final decision. If required, they would cost approximately $600 million, with an annual operating cost of approximately $10.4 million.
Legal Contingencies
SPS is involved in various litigation matters that are being defended and handled in the ordinary course of business. The assessment of whether a loss is probable or is a reasonable possibility, and whether the loss or a range of loss is estimable, often involves a series of complex judgments about future events. Management maintains accruals for such losses that are probable of being incurred and subject to reasonable estimation. Management is sometimes unable to estimate an amount or range of a reasonably possible loss in certain situations, including but not limited to when (1) the damages sought are indeterminate, (2) the proceedings are in the early stages, or (3) the matters involve novel or unsettled legal theories. In such cases, there is considerable uncertainty regarding the timing or ultimate resolution of such matters, including a possible eventual loss. For current proceedings not specifically reported herein, management does not anticipate that the ultimate liabilities, if any, arising from such current proceedings would have a material effect on SPS’ financial statements. Unless otherwise required by GAAP, legal fees are expensed as incurred.
Employment, Tort and Commercial Litigation
Exelon Wind (formerly John Deere Wind) Complaint — Several lawsuits in Texas state and federal courts and regulatory proceedings have arisen out of a dispute concerning SPS’ payments for energy and capacity produced from the Exelon Wind subsidiaries’ projects. There are two main areas of dispute. First, Exelon Wind claims that it established legally enforceable obligations (LEOs) for each of its 12 wind facilities in 2005 through 2008 that require SPS to buy power based on SPS’ forecasted avoided cost as determined in 2005 through 2008. Although SPS has refused to accept Exelon Wind’s LEOs, SPS accepts that it must take energy from Exelon Wind under SPS’ PUCT-approved Qualifying Facilities (QF) Tariff. Second, Exelon Wind has raised various challenges to SPS’ PUCT-approved QF Tariff, which became effective in August 2010. On Jan.16, 2015, Exelon Wind filed motions to dismiss or notices of non-suits for its state and federal lawsuits regarding the QF tariff, and for its state and federal lawsuits and regulatory proceedings regarding the LEOs. Later in January, the PUCT and state and federal courts issued orders dismissing the cases. On April 28, 2015, Exelon Wind filed a notice of withdrawal of its complaint regarding the LEOs, which will become effective on May 13, 2015. The only remaining proceeding is pending before the FERC, and involves the QF Tariff.
SPS believes the likelihood of loss in these proceedings is remote based primarily on existing case law and while it is not possible to estimate the amount or range of reasonably possible loss in the event of an adverse outcome, SPS believes such loss would not be material based upon its belief that it would be permitted to recover such costs, if needed, through its various fuel clause mechanisms. No accrual has been recorded for this matter.
Schedule Q-4 Page 175 of 187
Sponsor: Robinson Case No. 15-00139-UT

Table of Contents
13
7. Borrowings and Other Financing Instruments
Short-Term Borrowings
Money Pool — Xcel Energy Inc. and its utility subsidiaries have established a money pool arrangement that allows for short-term investments in and borrowings between the utility subsidiaries. Xcel Energy Inc. may make investments in the utility subsidiaries at market-based interest rates; however, the money pool arrangement does not allow the utility subsidiaries to make investments in Xcel Energy Inc. Money pool borrowings for SPS were as follows:
(Amounts in Millions, Except Interest Rates)Three Months Ended
March 31, 2015Twelve Months Ended
Dec. 31, 2014
Borrowing limit $ 100 $ 100Amount outstanding at period end — 16Average amount outstanding 2 9Maximum amount outstanding 31 100Weighted average interest rate, computed on a daily basis 0.56% 0.22%Weighted average interest rate at period end N/A 0.45
Commercial Paper — SPS meets its short-term liquidity requirements primarily through the issuance of commercial paper and borrowings under its credit facility. Commercial paper outstanding for SPS was as follows:
(Amounts in Millions, Except Interest Rates)Three Months Ended
March 31, 2015Twelve Months Ended
Dec. 31, 2014
Borrowing limit $ 400 $ 400Amount outstanding at period end 123 37Average amount outstanding 103 83Maximum amount outstanding 144 241Weighted average interest rate, computed on a daily basis 0.44% 0.26%Weighted average interest rate at period end 0.56 0.47
Letters of Credit — SPS uses letters of credit, generally with terms of one year, to provide financial guarantees for certain operating obligations. At March 31, 2015 and Dec. 31, 2014, there were $30 million of letters of credit outstanding under the credit facility. The contract amounts of these letters of credit approximate their fair value and are subject to fees.
Credit Facility — In order to use its commercial paper program to fulfill short-term funding needs, SPS must have a revolving credit facility in place at least equal to the amount of its commercial paper borrowing limit and cannot issue commercial paper in an aggregate amount exceeding available capacity under this credit facility. The line of credit provides short-term financing in the form of notes payable to banks, letters of credit and back-up support for commercial paper borrowings.
At March 31, 2015, SPS had the following committed credit facility available (in millions of dollars):
Credit Facility (a) Drawn (b) Available
$ 400 $ 153 $ 247
(a) This credit facility expires in October 2019.(b) Includes outstanding commercial paper and letters of credit.
All credit facility bank borrowings, outstanding letters of credit and outstanding commercial paper reduce the available capacity under the credit facility. SPS had no direct advances on the credit facility outstanding at March 31, 2015 and Dec. 31, 2014.
Schedule Q-4 Page 176 of 187
Sponsor: Robinson Case No. 15-00139-UT

Table of Contents
14
8. Fair Value of Financial Assets and Liabilities
Fair Value Measurements
The accounting guidance for fair value measurements and disclosures provides a single definition of fair value and requires certain disclosures about assets and liabilities measured at fair value. A hierarchical framework for disclosing the observability of the inputs utilized in measuring assets and liabilities at fair value is established by this guidance. The three levels in the hierarchy are as follows:
Level 1 — Quoted prices are available in active markets for identical assets or liabilities as of the reporting date. The types of assets and liabilities included in Level 1 are highly liquid and actively traded instruments with quoted prices.
Level 2 — Pricing inputs are other than quoted prices in active markets, but are either directly or indirectly observable as of the reporting date. The types of assets and liabilities included in Level 2 are typically either comparable to actively traded securities or contracts, or priced with models using highly observable inputs.
Level 3 — Significant inputs to pricing have little or no observability as of the reporting date. The types of assets and liabilities included in Level 3 are those valued with models requiring significant management judgment or estimation.
Specific valuation methods include the following:
Cash equivalents — The fair values of cash equivalents are generally based on cost plus accrued interest; money market funds are measured using quoted net asset values.
Interest rate derivatives — The fair values of interest rate derivatives are based on broker quotes that utilize current market interest rate forecasts.
Commodity derivatives — The methods used to measure the fair value of commodity derivative forwards and options utilize forward prices and volatilities, as well as pricing adjustments for specific delivery locations, and are generally assigned a Level 2. When contractual settlements extend to periods beyond those readily observable on active exchanges or quoted by brokers, the significance of the use of less observable forecasts of long-term forward prices and volatilities on a valuation is evaluated, and may result in Level 3 classification.
Electric commodity derivatives held by SPS include transmission congestion instruments purchased from the SPP, generally referred to as financial transmission rights (FTRs). FTRs purchased from a RTO are financial instruments that entitle or obligate the holder to monthly revenues or charges based on transmission congestion across a given transmission path. The value of an FTR is derived from, and designed to offset, the cost of energy congestion, which is caused by overall transmission load and other transmission constraints. In addition to overall transmission load, congestion is also influenced by the operating schedules of power plants and the consumption of electricity pertinent to a given transmission path. Unplanned plant outages, scheduled plant maintenance, changes in the relative costs of fuels used in generation, weather and overall changes in demand for electricity can each impact the operating schedules of the power plants on the transmission grid and the value of an FTR. The valuation process for FTRs utilizes complex iterative modeling to predict the impacts of forecasted changes in these drivers of transmission system congestion on the historical pricing of FTR purchases.
If forecasted costs of electric transmission congestion increase or decrease for a given FTR path, the value of that particular FTR instrument will likewise increase or decrease. Given the limited observability of management’s forecasts for several of the inputs to this complex valuation model - including expected plant operating schedules and retail and wholesale demand, fair value measurements for FTRs have been assigned a Level 3. Non-trading monthly FTR settlements are expected to be recovered through fuel and purchased energy cost recovery mechanisms, and therefore changes in the fair value of the yet to be settled portions of FTRs are deferred as a regulatory asset or liability. Given this regulatory treatment and the limited magnitude of FTRs relative to the electric utility operations of SPS, the numerous unobservable quantitative inputs to the complex model used for valuation of FTRs are insignificant to the financial statements of SPS.
Derivative Instruments Fair Value Measurements
SPS enters into derivative instruments, including forward contracts, for trading purposes and to manage risk in connection with changes in interest rates and electric utility commodity prices.
Schedule Q-4 Page 177 of 187
Sponsor: Robinson Case No. 15-00139-UT

Table of Contents
15
Interest Rate Derivatives — SPS may enter into various instruments that effectively fix the interest payments on certain floating rate debt obligations or effectively fix the yield or price on a specified benchmark interest rate for an anticipated debt issuance for a specific period. These derivative instruments are generally designated as cash flow hedges for accounting purposes.
At March 31, 2015, accumulated other comprehensive losses related to interest rate derivatives included $0.2 million of net losses expected to be reclassified into earnings during the next 12 months as the related hedged interest rate transactions impact earnings, including forecasted amounts for unsettled hedges, as applicable.
Wholesale and Commodity Trading Risk — SPS conducts various wholesale and commodity trading activities, including the purchase and sale of electric capacity, energy and energy-related instruments. SPS’ risk management policy allows management to conduct these activities within guidelines and limitations as approved by its risk management committee, which is made up of management personnel not directly involved in the activities governed by this policy.
Commodity Derivatives — SPS enters into derivative instruments to manage variability of future cash flows from changes in commodity prices in its electric utility operations, as well as for trading purposes. This could include the purchase or sale of energy or energy-related products and FTRs.
The following table details the gross notional amounts of commodity FTRs at March 31, 2015 and Dec. 31, 2014:
(Amounts in Thousands) (a) March 31, 2015 Dec. 31, 2014
Megawatt hours of electricity 2,954 6,930
(a) Amounts are not reflective of net positions in the underlying commodities.
Impact of Derivative Activities on Income and Accumulated Other Comprehensive Loss — Pre-tax losses related to interest rate derivatives reclassified from accumulated other comprehensive loss into earnings were $0.1 million for the three months ended March 31, 2015 and 2014.
During the three months ended March 31, 2015 and 2014, changes in the fair value of FTRs resulting in pre-tax net losses of $0.8 million and $1.4 million, respectively, were recognized as regulatory assets and liabilities. The classification as a regulatory asset or liability is based on expected recovery of FTR settlements through fuel and purchased energy cost recovery mechanisms.
FTR settlement losses of $0.1 million were recognized for the three months ended March 31, 2015, recorded to electric fuel and purchased power. For the three months ended March 31, 2014, FTR settlement gains of $2.8 million were recognized and recorded to electric fuel and purchased power. These derivative settlement gains and losses are shared with electric customers through fuel and purchased energy cost-recovery mechanisms, and reclassified out of income as regulatory assets or liabilities, as appropriate.
SPS had no derivative instruments designated as fair value hedges during the three months ended March 31, 2015 and 2014. Therefore, no gains or losses from fair value hedges or related hedged transactions were recognized for these periods.
Consideration of Credit Risk and Concentrations — SPS continuously monitors the creditworthiness of the counterparties to its interest rate derivatives and commodity derivative contracts prior to settlement, and assesses each counterparty’s ability to perform on the transactions set forth in the contracts. Given this assessment, as well as an assessment of the impact of SPS’ own credit risk when determining the fair value of derivative liabilities, the impact of considering credit risk was immaterial to the fair value of unsettled commodity derivatives presented in the balance sheets.
SPS employs additional credit risk control mechanisms when appropriate, such as letters of credit, parental guarantees, standardized master netting agreements and termination provisions that allow for offsetting of positive and negative exposures. Credit exposure is monitored and, when necessary, the activity with a specific counterparty is limited until credit enhancement is provided.
Schedule Q-4 Page 178 of 187
Sponsor: Robinson Case No. 15-00139-UT

Table of Contents
16
SPS’ most significant concentrations of credit risk with particular entities or industries are contracts with counterparties to its wholesale, trading and non-trading commodity and transmission activities. At March 31, 2015, one of SPS’ eight most significant counterparties for these activities, comprising $7.8 million or 9 percent of this credit exposure, had investment grade credit ratings from Standard & Poor’s Ratings Services, Moody’s Investor Services or Fitch Ratings. Six of the eight most significant counterparties, comprising $44.7 million or 50 percent of this credit exposure, were not rated by these agencies, but based on SPS’ internal analysis, had credit quality consistent with investment grade. Another of these significant counterparties, comprising $1.0 million or 1 percent of this credit exposure, had credit quality less than investment grade, based on SPS' internal analysis. All eight of these significant counterparties are RTOs, municipal or cooperative electric entities or other utilities.
Recurring Fair Value Measurements — The following table presents for each of the fair value hierarchy levels, SPS’ derivative assets and liabilities measured at fair value on a recurring basis at March 31, 2015:
March 31, 2015Fair Value Fair Value
TotalCounterparty
Netting (b)(Thousands of Dollars) Level 1 Level 2 Level 3 Total
Current derivative assetsOther derivative instruments:
Electric commodity $ — $ — $ 10,338 $ 10,338 $ (3,880) $ 6,458Total current derivative assets $ — $ — $ 10,338 $ 10,338 $ (3,880) 6,458
PPAs (a) 7,892Current derivative instruments $ 14,350
Noncurrent derivative assetsPPAs (a) $ 31,191
Noncurrent derivative instruments $ 31,191Current derivative liabilitiesOther derivative instruments:
Electric commodity $ — $ — $ 3,881 $ 3,881 $ (3,881) $ —Total current derivative liabilities $ — $ — $ 3,881 $ 3,881 $ (3,881) —
PPAs (a) 3,565Current derivative instruments $ 3,565
Noncurrent derivative liabilitiesPPAs (a) $ 29,752
Noncurrent derivative instruments $ 29,752
(a) In 2003, as a result of implementing new guidance on the normal purchase exception for derivative accounting, SPS began recording several long-term PPAs at fair value due to accounting requirements related to underlying price adjustments. As these purchases are recovered through normal regulatory recovery mechanisms in the respective jurisdictions, the changes in fair value for these contracts were offset by regulatory assets and liabilities. During 2006, SPS qualified these contracts under the normal purchase exception. Based on this qualification, the contracts are no longer adjusted to fair value and the previous carrying value of these contracts will be amortized over the remaining contract lives along with the offsetting regulatory assets and liabilities.
(b) SPS nets derivative instruments and related collateral in its balance sheet when supported by a legally enforceable master netting agreement, and all derivative instruments and related collateral amounts were subject to master netting agreements at March 31, 2015. At March 31, 2015, derivative assets and liabilities include no obligations to return cash collateral or rights to reclaim cash collateral. The counterparty netting amounts presented exclude settlement receivables and payables and non-derivative amounts that may be subject to the same master netting agreements.
Schedule Q-4 Page 179 of 187
Sponsor: Robinson Case No. 15-00139-UT
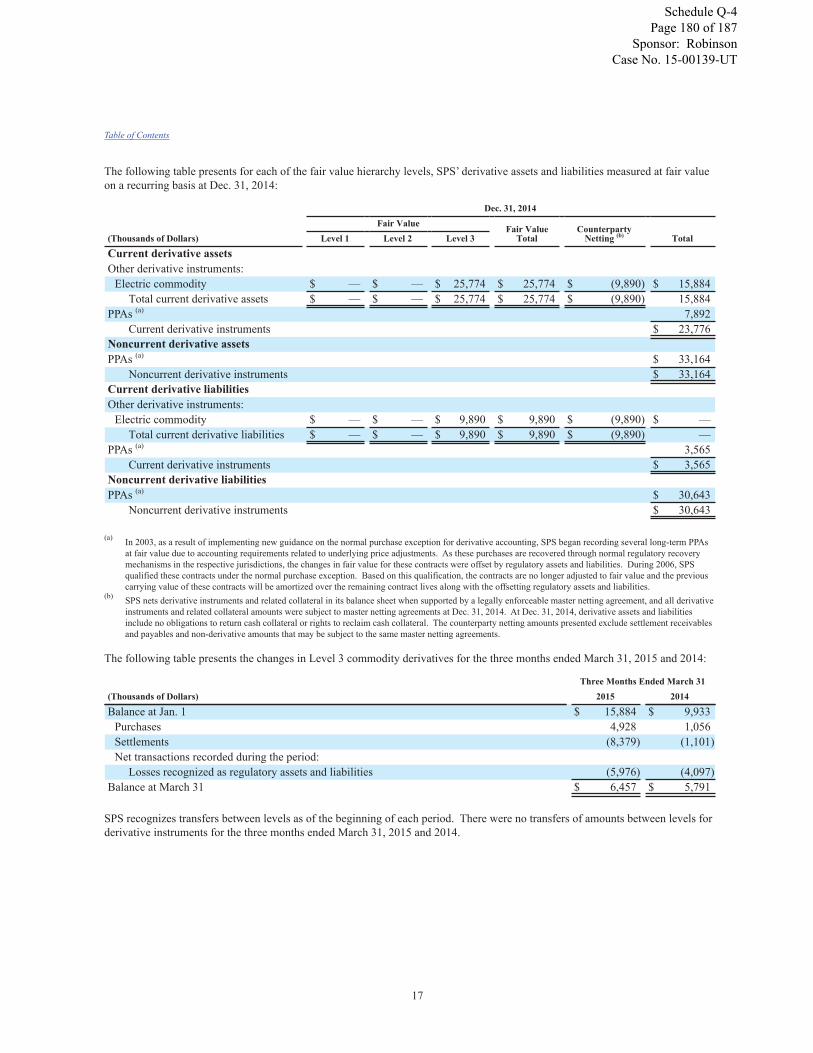
Table of Contents
17
The following table presents for each of the fair value hierarchy levels, SPS’ derivative assets and liabilities measured at fair value on a recurring basis at Dec. 31, 2014:
Dec. 31, 2014Fair Value Fair Value
TotalCounterparty
Netting (b)(Thousands of Dollars) Level 1 Level 2 Level 3 Total
Current derivative assetsOther derivative instruments:
Electric commodity $ — $ — $ 25,774 $ 25,774 $ (9,890) $ 15,884Total current derivative assets $ — $ — $ 25,774 $ 25,774 $ (9,890) 15,884
PPAs (a) 7,892Current derivative instruments $ 23,776
Noncurrent derivative assetsPPAs (a) $ 33,164
Noncurrent derivative instruments $ 33,164Current derivative liabilitiesOther derivative instruments:
Electric commodity $ — $ — $ 9,890 $ 9,890 $ (9,890) $ —Total current derivative liabilities $ — $ — $ 9,890 $ 9,890 $ (9,890) —
PPAs (a) 3,565Current derivative instruments $ 3,565
Noncurrent derivative liabilitiesPPAs (a) $ 30,643
Noncurrent derivative instruments $ 30,643
(a) In 2003, as a result of implementing new guidance on the normal purchase exception for derivative accounting, SPS began recording several long-term PPAs at fair value due to accounting requirements related to underlying price adjustments. As these purchases are recovered through normal regulatory recovery mechanisms in the respective jurisdictions, the changes in fair value for these contracts were offset by regulatory assets and liabilities. During 2006, SPS qualified these contracts under the normal purchase exception. Based on this qualification, the contracts are no longer adjusted to fair value and the previous carrying value of these contracts will be amortized over the remaining contract lives along with the offsetting regulatory assets and liabilities.
(b) SPS nets derivative instruments and related collateral in its balance sheet when supported by a legally enforceable master netting agreement, and all derivative instruments and related collateral amounts were subject to master netting agreements at Dec. 31, 2014. At Dec. 31, 2014, derivative assets and liabilities include no obligations to return cash collateral or rights to reclaim cash collateral. The counterparty netting amounts presented exclude settlement receivables and payables and non-derivative amounts that may be subject to the same master netting agreements.
The following table presents the changes in Level 3 commodity derivatives for the three months ended March 31, 2015 and 2014:
Three Months Ended March 31(Thousands of Dollars) 2015 2014
Balance at Jan. 1 $ 15,884 $ 9,933Purchases 4,928 1,056Settlements (8,379) (1,101)Net transactions recorded during the period:
Losses recognized as regulatory assets and liabilities (5,976) (4,097)Balance at March 31 $ 6,457 $ 5,791
SPS recognizes transfers between levels as of the beginning of each period. There were no transfers of amounts between levels for derivative instruments for the three months ended March 31, 2015 and 2014.
Schedule Q-4 Page 180 of 187
Sponsor: Robinson Case No. 15-00139-UT

Table of Contents
18
Fair Value of Long-Term Debt
As of March 31, 2015 and Dec. 31, 2014, other financial instruments for which the carrying amount did not equal fair value were as follows:
March 31, 2015 Dec. 31, 2014
(Thousands of Dollars)CarryingAmount Fair Value
CarryingAmount Fair Value
Long-term debt, including current portion $ 1,349,774 $ 1,596,427 $ 1,349,691 $ 1,572,414
The fair value of SPS’ long-term debt is estimated based on recent trades and observable spreads from benchmark interest rates for similar securities. The fair value estimates are based on information available to management as of March 31, 2015 and Dec. 31, 2014, and given the observability of the inputs to these estimates, the fair values presented for long-term debt have been assigned a Level 2.
9. Other (Expense) Income, Net
Other (expense) income, net consisted of the following:
Three Months Ended March 31(Thousands of Dollars) 2015 2014
Interest income $ 32 $ 187Other nonoperating income 45 —Insurance policy expense (133) (144)Other nonoperating expense — (2)
Other (expense) income, net $ (56) $ 41
10. Benefit Plans and Other Postretirement Benefits
Components of Net Periodic Benefit Cost (Credit)
Three Months Ended March 312015 2014 2015 2014
(Thousands of Dollars) Pension BenefitsPostretirement Health
Care Benefits
Service cost $ 2,752 $ 2,296 $ 239 $ 312Interest cost 5,046 5,111 436 643Expected return on plan assets (7,153) (6,545) (635) (812)Amortization of prior service cost (credit) 10 14 (100) (100)Amortization of net loss (gain) 3,772 3,332 (160) (80)
Net periodic benefit cost (credit) 4,427 4,208 (220) (37)Credits recognized due to the effects of regulation 713 707 — —
Net benefit cost (credit) recognized for financial reporting $ 5,140 $ 4,915 $ (220) $ (37)
In January 2015, contributions of $90.0 million were made across four of Xcel Energy’s pension plans, of which $11.6 million was attributable to SPS. Xcel Energy does not expect additional pension contributions during 2015.
Schedule Q-4 Page 181 of 187
Sponsor: Robinson Case No. 15-00139-UT
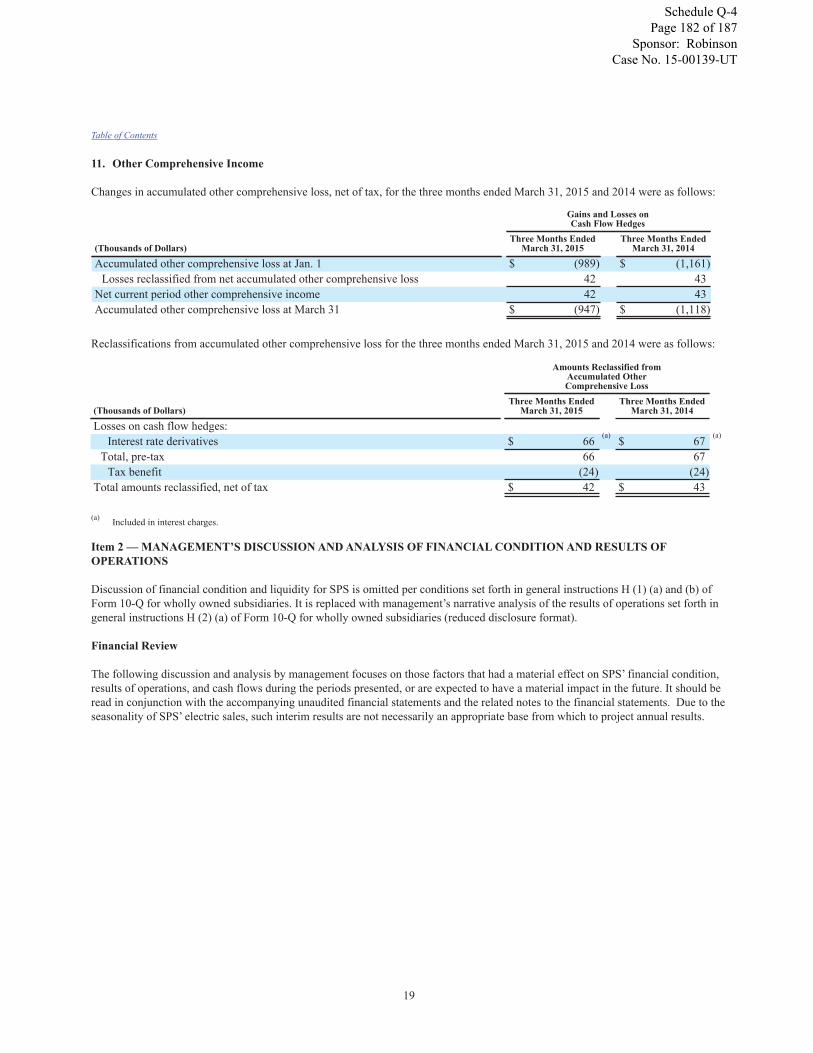
Table of Contents
19
11. Other Comprehensive Income
Changes in accumulated other comprehensive loss, net of tax, for the three months ended March 31, 2015 and 2014 were as follows:
Gains and Losses onCash Flow Hedges
(Thousands of Dollars)Three Months Ended
March 31, 2015Three Months Ended
March 31, 2014
Accumulated other comprehensive loss at Jan. 1 $ (989) $ (1,161)Losses reclassified from net accumulated other comprehensive loss 42 43
Net current period other comprehensive income 42 43Accumulated other comprehensive loss at March 31 $ (947) $ (1,118)
Reclassifications from accumulated other comprehensive loss for the three months ended March 31, 2015 and 2014 were as follows:
Amounts Reclassified from Accumulated Other Comprehensive Loss
(Thousands of Dollars)Three Months Ended
March 31, 2015Three Months Ended
March 31, 2014
Losses on cash flow hedges:Interest rate derivatives $ 66 (a) $ 67 (a)
Total, pre-tax 66 67Tax benefit (24) (24)
Total amounts reclassified, net of tax $ 42 $ 43
(a) Included in interest charges.
Item 2 — MANAGEMENT’S DISCUSSION AND ANALYSIS OF FINANCIAL CONDITION AND RESULTS OF OPERATIONS
Discussion of financial condition and liquidity for SPS is omitted per conditions set forth in general instructions H (1) (a) and (b) of Form 10-Q for wholly owned subsidiaries. It is replaced with management’s narrative analysis of the results of operations set forth in general instructions H (2) (a) of Form 10-Q for wholly owned subsidiaries (reduced disclosure format).
Financial Review
The following discussion and analysis by management focuses on those factors that had a material effect on SPS’ financial condition, results of operations, and cash flows during the periods presented, or are expected to have a material impact in the future. It should be read in conjunction with the accompanying unaudited financial statements and the related notes to the financial statements. Due to the seasonality of SPS’ electric sales, such interim results are not necessarily an appropriate base from which to project annual results.
Schedule Q-4 Page 182 of 187
Sponsor: Robinson Case No. 15-00139-UT

Table of Contents
20
Forward-Looking Statements
Except for the historical statements contained in this report, the matters discussed in the following discussion and analysis are forward-looking statements that are subject to certain risks, uncertainties and assumptions. Such forward-looking statements are intended to be identified in this document by the words “anticipate,” “believe,” “estimate,” “expect,” “intend,” “may,” “objective,” “outlook,” “plan,” “project,” “possible,” “potential,” “should” and similar expressions. Actual results may vary materially. Forward-looking statements speak only as of the date they are made, and we do not undertake any obligation to update them to reflect changes that occur after that date. Factors that could cause actual results to differ materially include, but are not limited to: general economic conditions, including inflation rates, monetary fluctuations and their impact on capital expenditures and the ability of SPS to obtain financing on favorable terms; business conditions in the energy industry, including the risk of a slowdown in the U.S. economy or delay in growth recovery; trade, fiscal, taxation and environmental policies in areas where SPS has a financial interest; customer business conditions; actions of credit rating agencies; competitive factors, including the extent and timing of the entry of additional competition in the markets served by SPS; unusual weather; effects of geopolitical events, including war and acts of terrorism; cyber security threats and data security breaches; state, federal and foreign legislative and regulatory initiatives that affect cost and investment recovery, have an impact on rates or have an impact on asset operation or ownership or impose environmental compliance conditions; structures that affect the speed and degree to which competition enters the electric market; costs and other effects of legal and administrative proceedings, settlements, investigations and claims; financial or regulatory accounting policies imposed by regulatory bodies; availability or cost of capital; employee work force factors; and the other risk factors listed from time to time by SPS in reports filed with the SEC, including “Risk Factors” in Item 1A of SPS’ Form 10-K for the year ended Dec. 31, 2014, and Item 1A and Exhibit 99.01 to this Quarterly Report on Form 10-Q for the quarter ended March 31, 2015.
Results of Operations
SPS’ net income was approximately $20.2 million for the three months ended March 31, 2015, compared with net income of approximately $18.7 million for the same period in 2014. The increase was primarily due to the positive impact of higher electric rates in Texas and New Mexico, partially offset by increased depreciation and operating and maintenance (O&M) expenses.
Electric Revenues and Margin
Electric fuel and purchased power expenses tend to vary with changing retail and wholesale sales requirements and unit cost changes in fuel and purchased power. The design of fuel and purchased power cost recovery mechanisms of the Texas and New Mexico jurisdictions may not allow for complete recovery of all expenses and, therefore, changes in fuel or purchased power costs can impact earnings. The following tables detail the electric revenues and margin:
Three Months Ended March 31(Millions of Dollars) 2015 2014
Electric revenues $ 424 $ 448Electric fuel and purchased power (246) (289)
Electric margin $ 178 $ 159
The following tables summarize the components of the changes in electric revenues and electric margin for the three months ended March 31:
Electric Revenues
(Millions of Dollars) 2015 vs. 2014
Fuel and purchased power cost recovery $ (56)Estimated impact of weather (3)Retail rate increases (Texas and New Mexico) 13Trading 10Transmission revenue 5Demand revenue 3Non-fuel riders 1Other, net 3
Total decrease in electric revenues $ (24)
Schedule Q-4 Page 183 of 187
Sponsor: Robinson Case No. 15-00139-UT

Table of Contents
21
Electric Margin
(Millions of Dollars) 2015 vs. 2014
Retail rate increases (Texas and New Mexico) $ 13Transmission revenue, net of costs 7Demand revenue 3Non-fuel riders 1Texas wind renewable energy credits (3)Estimated impact of weather (3)Other, net 1
Total increase in electric margin $ 19
Non-Fuel Operating Expense and Other Items
O&M Expenses — O&M expenses increased $4.5 million, or 6.5 percent, for the three months ended March 31, 2015 compared with the same period in 2014. The following table summarizes the changes in O&M expenses:
(Millions of Dollars) 2015 vs. 2014
Plant generation costs $ 2Transmission cost increases 1Employee benefits 1Other, net 1
Total increase in O&M expenses $ 5
Depreciation and Amortization — Depreciation and amortization increased $5.2 million, or 17.1 percent, for the three months ended March 31, 2015 compared with the same period in 2014. The increase is primarily due to normal system expansion.
Taxes (Other Than Income Taxes) — Taxes (other than income taxes) increased $1.3 million, or 9.7 percent, for the three months ended March 31, 2015 compared with the same period in 2014. The increase is primarily due to an increase in property and general taxes.
Allowance for Funds Used During Construction (AFUDC) — AFUDC decreased $3.0 million for the three months ended March 31, 2015 compared with the same period in 2014. The decrease is primarily due to the decrease of transmission facilities construction.
Interest Charges — Interest charges increased $1.6 million, or 8.3 percent, for the three months ended March 31, 2015 compared with the same period in 2014. The increase is primarily due to higher long-term debt levels, partially offset by lower interest rates.
Income Taxes — Income tax expense increased $1.0 million for the three months ended March 31, 2015 compared with the same period in 2014. The increase in income tax expense is primarily due to higher pre-tax earnings and decreased permanent plant-related adjustments in 2015. The ETR was 35.9 percent for the three months ended March 31, 2015, compared with 35.6 percent for the same period in 2014.
Public Utility Regulation
Transmission Notifications to Construct (NTC) — As a member of SPP, SPS accepts NTCs for electric transmission line and substation projects to be built within the SPP footprint. SPS has accepted NTCs for projects with an estimated capital cost of approximately $1.9 billion and will continue to review new NTCs for acceptance as they are issued. These projects generally span several years to plan, site, procure and develop. The New Mexico Public Regulatory Commission (NMPRC) and the PUCT must approve the siting and routing of any SPP identified transmission line NTC projects that require permitting approval. Projects identified through SPP NTCs may have costs allocated to other SPP members in accordance with the SPP Open Access Transmission Tariff (OATT). Costs allocated to SPS are permissible for recovery through the NMPRC, the PUCT and the FERC processes.
Chaves County, N.M. Solar Contracts — In March 2015, SPS entered into two purchased energy contracts with NextEra Resources for the purchase of solar generated electricity from two 70 MW projects to be constructed in Chaves County, N.M.. The two 25-year contracts are subject to regulatory approval and they are now pending review and approval by the NMPRC. The purchased energy will be recovered from customers through SPS’ fuel and purchased energy cost recovery mechanisms.
Schedule Q-4 Page 184 of 187
Sponsor: Robinson Case No. 15-00139-UT

Table of Contents
22
Summary of Recent Federal Regulatory Developments
The FERC has jurisdiction over rates for electric transmission service in interstate commerce and electricity sold at wholesale, asset transactions and mergers, accounting practices and certain other activities of SPS, including enforcement of North American Electric Reliability Corporation mandatory electric reliability standards. State and local agencies have jurisdiction over many of SPS’ activities, including regulation of retail rates and environmental matters. See additional discussion in the summary of recent federal regulatory developments and public utility regulation sections of the SPS Annual Report on Form 10-K for the year ended Dec. 31, 2014. In addition to the matters discussed below, see Note 5 to the financial statements for a discussion of other regulatory matters.
FERC Order, New ROE Policy — In June 2014, the FERC adopted a new two-step ROE methodology for electric utilities. In October 2014, the FERC upheld the determination of the long-term growth rate to be used in its new ROE methodology. In March 2015, the FERC issued an order on rehearing upholding use of the new ROE methodology.
Item 4 — CONTROLS AND PROCEDURES
Disclosure Controls and Procedures
SPS maintains a set of disclosure controls and procedures designed to ensure that information required to be disclosed in the reports that it files or submits under the Securities Exchange Act of 1934 is recorded, processed, summarized, and reported within the time periods specified in SEC rules and forms. In addition, the disclosure controls and procedures ensure that information required to be disclosed is accumulated and communicated to management, including the chief executive officer (CEO) and chief financial officer (CFO), allowing timely decisions regarding required disclosure. As of March 31, 2015, based on an evaluation carried out under the supervision and with the participation of SPS’ management, including the CEO and CFO, of the effectiveness of its disclosure controls and the procedures, the CEO and CFO have concluded that SPS’ disclosure controls and procedures were effective.
Internal Control Over Financial Reporting
No change in SPS’ internal control over financial reporting has occurred during SPS’ most recent fiscal quarter that has materially affected, or is reasonably likely to materially affect, SPS’ internal control over financial reporting.
Part II — OTHER INFORMATION
Item 1 — LEGAL PROCEEDINGS
SPS is involved in various litigation matters that are being defended and handled in the ordinary course of business. The assessment of whether a loss is probable or is a reasonable possibility, and whether the loss or a range of loss is estimable, often involves a series of complex judgments about future events. Management maintains accruals for such losses that are probable of being incurred and subject to reasonable estimation. Management is sometimes unable to estimate an amount or range of a reasonably possible loss in certain situations, including but not limited to when (1) the damages sought are indeterminate, (2) the proceedings are in the early stages, or (3) the matters involve novel or unsettled legal theories. In such cases, there is considerable uncertainty regarding the timing or ultimate resolution of such matters, including a possible eventual loss.
Additional Information
See Note 6 to the financial statements for further discussion of legal claims and environmental proceedings. See Note 5 to the financial statements for discussion of proceedings involving utility rates and other regulatory matters.
Item 1A — RISK FACTORS
SPS’ risk factors are documented in Item 1A of Part I of its Annual Report on Form 10-K for the year ended Dec. 31, 2014, which is incorporated herein by reference. There have been no material changes from the risk factors previously disclosed in the Form 10-K.
Item 4 — MINE SAFETY DISCLOSURES
None.
Schedule Q-4 Page 185 of 187
Sponsor: Robinson Case No. 15-00139-UT

Table of Contents
23
Item 5 — OTHER INFORMATION
None.
Item 6 — EXHIBITS
* Indicates incorporation by reference
3.01* Amended and Restated Articles of Incorporation of SPS dated Sept. 30, 1997 (Exhibit 3(a)(2) to Form 10-K (file no.001-03789) dated March 3, 1998).
3.02* By-Laws of SPS as Amended and Restated on Sept. 26, 2013. (Exhibit 3.02 to Form 10-Q/A for the quarter ended Sept. 30, 2013 (file no. 001-03789)).
31.01 Principal Executive Officer’s certifications pursuant to 18 U.S.C. Section 1350, as adopted pursuant to Section 302 of theSarbanes-Oxley Act of 2002.
31.02 Principal Financial Officer’s certifications pursuant to 18 U.S.C. Section 1350, as adopted pursuant to Section 302 of theSarbanes-Oxley Act of 2002.
32.01 Certification pursuant to 18 U.S.C. Section 1350, as adopted pursuant to Section 906 of the Sarbanes-Oxley Act of 2002.99.01 Statement pursuant to Private Securities Litigation Reform Act of 1995.101 The following materials from SPS’ Quarterly Report on Form 10-Q for the quarter ended March 31, 2015 are formatted in
XBRL (eXtensible Business Reporting Language): (i) the Statements of Income, (ii) the Statements of ComprehensiveIncome (iii) the Statements of Cash Flows, (iv) the Balance Sheets, (v) Notes to Financial Statements, and (vi) documentand entity information.
Schedule Q-4 Page 186 of 187
Sponsor: Robinson Case No. 15-00139-UT

Table of Contents
24
SIGNATURES
Pursuant to the requirements of the Securities Exchange Act of 1934, the registrant has duly caused this report to be signed on its behalf by the undersigned thereunto duly authorized.
Southwestern Public Service Company
May 4, 2015 By: /s/ JEFFREY S. SAVAGE Jeffrey S. Savage Senior Vice President, Controller
(Principal Accounting Officer) /s/ TERESA S. MADDEN Teresa S. Madden Executive Vice President, Chief Financial Officer and Director
(Principal Financial Officer)
Schedule Q-4 Page 187 of 187
Sponsor: Robinson Case No. 15-00139-UT

THIS FILING IS
Item 1: An Initial (Original)Submission
OR Resubmission No. ____X
FERC FINANCIAL REPORTFERC FORM No. 1: Annual Report of
Major Electric Utilities, Licensees and Others and Supplemental
Form 3-Q: Quarterly Financial Report
These reports are mandatory under the Federal Power Act, Sections 3, 4(a), 304 and 309, and
18 CFR 141.1 and 141.400. Failure to report may result in criminal fines, civil penalties and
other sanctions as provided by law. The Federal Energy Regulatory Commission does not
consider these reports to be of confidential nature
OMB No.1902-0021
OMB No.1902-0029
OMB No.1902-0205
(Expires 11/30/2016)
(Expires 11/30/2016)
(Expires 11/30/2016)
Form 1 Approved
Form 1-F Approved
Form 3-Q Approved
FERC FORM No.1/3-Q (REV. 02-04)
Exact Legal Name of Respondent (Company) Year/Period of Report
End of 2014/Q4Southwestern Public Service Company1
Schedule Q-5 Page 1 of 300
Sponsor: Robinson Case No. 15-00139-UT
INSTRUCTIONS FOR FILING FERC FORM NOS. 1 and 3-Q
GENERAL INFORMATION
I. Purpose
FERC Form No. 1 (FERC Form 1) is an annual regulatory requirement for Major electric utilities, licensees and others(18 C.F.R. § 141.1). FERC Form No. 3-Q ( FERC Form 3-Q)is a quarterly regulatory requirement which supplements theannual financial reporting requirement (18 C.F.R. § 141.400). These reports are designed to collect financial andoperational information from electric utilities, licensees and others subject to the jurisdiction of the Federal EnergyRegulatory Commission. These reports are also considered to be non-confidential public use forms.
II. Who Must Submit
Each Major electric utility, licensee, or other, as classified in the Commission’s Uniform System of AccountsPrescribed for Public Utilities and Licensees Subject To the Provisions of The Federal Power Act (18 C.F.R. Part 101),must submit FERC Form 1 (18 C.F.R. § 141.1), and FERC Form 3-Q (18 C.F.R. § 141.400).
Note: Major means having, in each of the three previous calendar years, sales or transmission service thatexceeds one of the following:
(1) one million megawatt hours of total annual sales, (2) 100 megawatt hours of annual sales for resale, (3) 500 megawatt hours of annual power exchanges delivered, or (4) 500 megawatt hours of annual wheeling for others (deliveries plus losses).
III. What and Where to Submit
(a) Submit FERC Forms 1 and 3-Q electronically through the forms submission software. Retain one copy of each reportfor your files. Any electronic submission must be created by using the forms submission software provided free by theCommission at its web site: http://www.ferc.gov/docs-filing/eforms/form-1/elec-subm-soft.asp. The software isused to submit the electronic filing to the Commission via the Internet.
(b) The Corporate Officer Certification must be submitted electronically as part of the FERC Forms 1 and 3-Q filings.
(c) Submit immediately upon publication, by either eFiling or mail, two (2) copies to the Secretary of the Commission, thelatest Annual Report to Stockholders. Unless eFiling the Annual Report to Stockholders, mail the stockholders report tothe Secretary of the Commission at:
Secretary Federal Energy Regulatory Commission 888 First Street, NE Washington, DC 20426
(d) For the CPA Certification Statement, submit within 30 days after filing the FERC Form 1, a letter or report (notapplicable to filers classified as Class C or Class D prior to January 1, 1984). The CPA Certification Statement can beeither eFiled or mailed to the Secretary of the Commission at the address above.
FERC FORM 1 & 3-Q (ED. 03-07) i
2
Schedule Q-5 Page 2 of 300
Sponsor: Robinson Case No. 15-00139-UT

The CPA Certification Statement should:
a) Attest to the conformity, in all material aspects, of the below listed (schedules and pages) with theCommission's applicable Uniform System of Accounts (including applicable notes relating thereto and theChief Accountant's published accounting releases), and
b) Be signed by independent certified public accountants or an independent licensed public accountantcertified or licensed by a regulatory authority of a State or other political subdivision of the U. S. (See 18C.F.R. §§ 41.10-41.12 for specific qualifications.)
Reference Schedules Pages
Comparative Balance Sheet 110-113 Statement of Income 114-117 Statement of Retained Earnings 118-119 Statement of Cash Flows 120-121 Notes to Financial Statements 122-123
e) The following format must be used for the CPA Certification Statement unless unusual circumstances or conditions,explained in the letter or report, demand that it be varied. Insert parenthetical phrases only when exceptions arereported.
“In connection with our regular examination of the financial statements of for the year ended on which we havereported separately under date of , we have also reviewed schedules
of FERC Form No. 1 for the year filed with the Federal Energy Regulatory Commission, forconformity in all material respects with the requirements of the Federal Energy Regulatory Commission as set forth in itsapplicable Uniform System of Accounts and published accounting releases. Our review for this purpose included suchtests of the accounting records and such other auditing procedures as we considered necessary in the circumstances.
Based on our review, in our opinion the accompanying schedules identified in the preceding paragraph(except as noted below) conform in all material respects with the accounting requirements of the Federal EnergyRegulatory Commission as set forth in its applicable Uniform System of Accounts and published accounting releases.”
The letter or report must state which, if any, of the pages above do not conform to the Commission’s requirements. Describe the discrepancies that exist.
(f) Filers are encouraged to file their Annual Report to Stockholders, and the CPA Certification Statement using eFiling. To further that effort, new selections, “Annual Report to Stockholders,” and “CPA Certification Statement” have beenadded to the dropdown “pick list” from which companies must choose when eFiling. Further instructions are found on theCommission’s website at http://www.ferc.gov/help/how-to.asp.
(g) Federal, State and Local Governments and other authorized users may obtain additional blank copies ofFERC Form 1 and 3-Q free of charge from http://www.ferc.gov/docs-filing/eforms/form-1/form-1.pdf andhttp://www.ferc.gov/docs-filing/eforms.asp#3Q-gas .
IV. When to Submit:
FERC Forms 1 and 3-Q must be filed by the following schedule:
FERC FORM 1 & 3-Q (ED. 03-07) ii
3
Schedule Q-5 Page 3 of 300
Sponsor: Robinson Case No. 15-00139-UT

a) FERC Form 1 for each year ending December 31 must be filed by April 18th of the following year (18 CFR § 141.1), and
b) FERC Form 3-Q for each calendar quarter must be filed within 60 days after the reporting quarter (18 C.F.R. §141.400).
V. Where to Send Comments on Public Reporting Burden.
The public reporting burden for the FERC Form 1 collection of information is estimated to average 1,144hours per response, including the time for reviewing instructions, searching existing data sources, gathering andmaintaining the data-needed, and completing and reviewing the collection of information. The public reporting burden forthe FERC Form 3-Q collection of information is estimated to average 150 hours per response.
Send comments regarding these burden estimates or any aspect of these collections of information, includingsuggestions for reducing burden, to the Federal Energy Regulatory Commission, 888 First Street NE, Washington, DC20426 (Attention: Information Clearance Officer); and to the Office of Information and Regulatory Affairs, Office ofManagement and Budget, Washington, DC 20503 (Attention: Desk Officer for the Federal Energy RegulatoryCommission). No person shall be subject to any penalty if any collection of information does not display a valid controlnumber (44 U.S.C. § 3512 (a)).
FERC FORM 1 & 3-Q (ED. 03-07) iii
4
Schedule Q-5 Page 4 of 300
Sponsor: Robinson Case No. 15-00139-UT

GENERAL INSTRUCTIONS
I. Prepare this report in conformity with the Uniform System of Accounts (18 CFR Part 101) (USofA). Interpretall accounting words and phrases in accordance with the USofA.
II. Enter in whole numbers (dollars or MWH) only, except where otherwise noted. (Enter cents for averages andfigures per unit where cents are important. The truncating of cents is allowed except on the four basic financial statementswhere rounding is required.) The amounts shown on all supporting pages must agree with the amounts entered on thestatements that they support. When applying thresholds to determine significance for reporting purposes, use for balancesheet accounts the balances at the end of the current reporting period, and use for statement of income accounts thecurrent year's year to date amounts.
III Complete each question fully and accurately, even if it has been answered in a previous report. Enter theword "None" where it truly and completely states the fact.
IV. For any page(s) that is not applicable to the respondent, omit the page(s) and enter "NA," "NONE," or "NotApplicable" in column (d) on the List of Schedules, pages 2 and 3.
V. Enter the month, day, and year for all dates. Use customary abbreviations. The "Date of Report" included in theheader of each page is to be completed only for resubmissions (see VII. below).
VI. Generally, except for certain schedules, all numbers, whether they are expected to be debits or credits, mustbe reported as positive. Numbers having a sign that is different from the expected sign must be reported by enclosing thenumbers in parentheses.
VII For any resubmissions, submit the electronic filing using the form submission software only. Please explainthe reason for the resubmission in a footnote to the data field.
VIII. Do not make references to reports of previous periods/years or to other reports in lieu of required entries,except as specifically authorized.
IX. Wherever (schedule) pages refer to figures from a previous period/year, the figures reported must be basedupon those shown by the report of the previous period/year, or an appropriate explanation given as to why the differentfigures were used.
Definitions for statistical classifications used for completing schedules for transmission system reporting are as follows:
FNS - Firm Network Transmission Service for Self. "Firm" means service that can not be interrupted for economic reasonsand is intended to remain reliable even under adverse conditions. "Network Service" is Network Transmission Service asdescribed in Order No. 888 and the Open Access Transmission Tariff. "Self" means the respondent.
FNO - Firm Network Service for Others. "Firm" means that service cannot be interrupted for economic reasons and isintended to remain reliable even under adverse conditions. "Network Service" is Network Transmission Service asdescribed in Order No. 888 and the Open Access Transmission Tariff.
LFP - for Long-Term Firm Point-to-Point Transmission Reservations. "Long-Term" means one year or longer and” firm"means that service cannot be interrupted for economic reasons and is intended to remain reliable even under adverseconditions. "Point-to-Point Transmission Reservations" are described in Order No. 888 and the Open AccessTransmission Tariff. For all transactions identified as LFP, provide in a footnote the
FERC FORM 1 & 3-Q (ED. 03-07) iv
5
Schedule Q-5 Page 5 of 300
Sponsor: Robinson Case No. 15-00139-UT

termination date of the contract defined as the earliest date either buyer or seller can unilaterally cancel the contract.
OLF - Other Long-Term Firm Transmission Service. Report service provided under contracts which do not conform to theterms of the Open Access Transmission Tariff. "Long-Term" means one year or longer and “firm” means that servicecannot be interrupted for economic reasons and is intended to remain reliable even under adverse conditions. For alltransactions identified as OLF, provide in a footnote the termination date of the contract defined as the earliest date eitherbuyer or seller can unilaterally get out of the contract.
SFP - Short-Term Firm Point-to-Point Transmission Reservations. Use this classification for all firm point-to-pointtransmission reservations, where the duration of each period of reservation is less than one-year.
NF - Non-Firm Transmission Service, where firm means that service cannot be interrupted for economic reasons and isintended to remain reliable even under adverse conditions.
OS - Other Transmission Service. Use this classification only for those services which can not be placed in theabove-mentioned classifications, such as all other service regardless of the length of the contract and service FERC Form.Describe the type of service in a footnote for each entry.
AD - Out-of-Period Adjustments. Use this code for any accounting adjustments or "true-ups" for service provided in priorreporting periods. Provide an explanation in a footnote for each adjustment.
DEFINITIONSI. Commission Authorization (Comm. Auth.) -- The authorization of the Federal Energy Regulatory Commission, or anyother Commission. Name the commission whose authorization was obtained and give date of the authorization.
II. Respondent -- The person, corporation, licensee, agency, authority, or other Legal entity or instrumentality in whosebehalf the report is made.
FERC FORM 1 & 3-Q (ED. 03-07) v
6
Schedule Q-5 Page 6 of 300
Sponsor: Robinson Case No. 15-00139-UT

EXCERPTS FROM THE LAW
Federal Power Act, 16 U.S.C. § 791a-825r
Sec. 3. The words defined in this section shall have the following meanings for purposes of this Act, to with:
(3) ’Corporation' means any corporation, joint-stock company, partnership, association, business trust,organized group of persons, whether incorporated or not, or a receiver or receivers, trustee or trustees of any of theforegoing. It shall not include 'municipalities, as hereinafter defined;
(4) 'Person' means an individual or a corporation;
(5) 'Licensee, means any person, State, or municipality Licensed under the provisions of section 4 of this Act,and any assignee or successor in interest thereof;
(7) 'municipality means a city, county, irrigation district, drainage district, or other political subdivision oragency of a State competent under the Laws thereof to carry and the business of developing, transmitting, unitizing, ordistributing power; ......
(11) "project' means. a complete unit of improvement or development, consisting of a power house, all waterconduits, all dams and appurtenant works and structures (including navigation structures) which are a part of said unit, andall storage, diverting, or fore bay reservoirs directly connected therewith, the primary line or lines transmitting power therefrom to the point of junction with the distribution system or with the interconnected primary transmission system, allmiscellaneous structures used and useful in connection with said unit or any part thereof, and all water rights,rights-of-way, ditches, dams, reservoirs, Lands, or interest in Lands the use and occupancy of which are necessary orappropriate in the maintenance and operation of such unit;
"Sec. 4. The Commission is hereby authorized and empowered
(a) To make investigations and to collect and record data concerning the utilization of the water 'resources of any region tobe developed, the water-power industry and its relation to other industries and to interstate or foreign commerce, andconcerning the location, capacity, development -costs, and relation to markets of power sites; ... to the extent theCommission may deem necessary or useful for the purposes of this Act."
"Sec. 304. (a) Every Licensee and every public utility shall file with the Commission such annual and other periodic orspecial* reports as the Commission may be rules and regulations or other prescribe as necessary or appropriate to assistthe Commission in the -proper administration of this Act. The Commission may prescribe the manner and FERC Form inwhich such reports salt be made, and require from such persons specific answers to all questions upon which theCommission may need information. The Commission may require that such reports shall include, among other things, fullinformation as to assets and Liabilities, capitalization, net investment, and reduction thereof, gross receipts, interest dueand paid, depreciation, and other reserves, cost of project and other facilities, cost of maintenance and operation of theproject and other facilities, cost of renewals and replacement of the project works and other facilities, depreciation,generation, transmission, distribution, delivery, use, and sale of electric energy. The Commission may require any suchperson to make adequate provision for currently determining such costs and other facts. Such reports shall be made underoath unless the Commission otherwise specifies*.10
FERC FORM 1 & 3-Q (ED. 03-07) vi
7
Schedule Q-5 Page 7 of 300
Sponsor: Robinson Case No. 15-00139-UT

"Sec. 309. The Commission shall have power to perform any and all acts, and to prescribe, issue, make, and rescind suchorders, rules and regulations as it may find necessary or appropriate to carry out the provisions of this Act. Among otherthings, such rules and regulations may define accounting, technical, and trade terms used in this Act; and may prescribethe FERC Form or FERC Forms of all statements, declarations, applications, and reports to be filed with the Commission,the information which they shall contain, and the time within which they shall be field..."
General Penalties
The Commission may assess up to $1 million per day per violation of its rules and regulations. SeeFPA § 316(a) (2005), 16 U.S.C. § 825o(a).
FERC FORM 1 & 3-Q (ED. 03-07) vii
8
Schedule Q-5 Page 8 of 300
Sponsor: Robinson Case No. 15-00139-UT

IDENTIFICATION
FERC FORM NO. 1/3-Q:REPORT OF MAJOR ELECTRIC UTILITIES, LICENSEES AND OTHER
Jeffery S. Savage
Tyler at Sixth (P.O. Box 1261), Amarillo, TX 79170
2014/Q4
414 Nicollet Mall, Minneapolis, MN 55401
01 Exact Legal Name of Respondent
(1) An Original (2) A ResubmissionX
02 Year/Period of Report
End ofSouthwestern Public Service Company
03 Previous Name and Date of Change (if name changed during year)
04 Address of Principal Office at End of Period (Street, City, State, Zip Code)
05 Name of Contact Person 06 Title of Contact Person
07 Address of Contact Person (Street, City, State, Zip Code)
08 Telephone of Contact Person,IncludingArea Code
09 This Report Is 10 Date of Report(Mo, Da, Yr)
01 Name
02 Title
03 Signature 04 Date Signed
(Mo, Da, Yr)
Title 18, U.S.C. 1001 makes it a crime for any person to knowingly and willingly to make to any Agency or Department of the United States anyfalse, fictitious or fraudulent statements as to any matter within its jurisdiction.
/ /
Jeffery S. Savage Senior V. P., and Controller
(612) 330-5658 04/13/2015
Jeffery S. Savage
Senior V. P. and Controller 04/13/2015
ANNUAL CORPORATE OFFICER CERTIFICATIONThe undersigned officer certifies that:
I have examined this report and to the best of my knowledge, information, and belief all statements of fact contained in this report are correct statementsof the business affairs of the respondent and the financial statements, and other financial information contained in this report, conform in all materialrespects to the Uniform System of Accounts.
FERC FORM No.1/3-Q (REV. 02-04) Page 1
9
Schedule Q-5 Page 9 of 300
Sponsor: Robinson Case No. 15-00139-UT

Name of Respondent This Report Is:(1) An Original(2) A Resubmission
Date of Report(Mo, Da, Yr)
Year/Period of Report
End of
LIST OF SCHEDULES (Electric Utility)
Southwestern Public Service CompanyX
04/13/20152014/Q4
Line No.
Title of Schedule ReferencePage No.
Remarks
(c)(b)(a)
Enter in column (c) the terms "none," "not applicable," or "NA," as appropriate, where no information or amounts have been reported forcertain pages. Omit pages where the respondents are "none," "not applicable," or "NA".
101General Information 1
102Control Over Respondent 2
N/A103Corporations Controlled by Respondent 3
104Officers 4
105Directors 5
106(a)(b)Information on Formula Rates 6
108-109Important Changes During the Year 7
110-113Comparative Balance Sheet 8
114-117Statement of Income for the Year 9
118-119Statement of Retained Earnings for the Year 10
120-121Statement of Cash Flows 11
122-123Notes to Financial Statements 12
122(a)(b)Statement of Accum Comp Income, Comp Income, and Hedging Activities 13
200-201Summary of Utility Plant & Accumulated Provisions for Dep, Amort & Dep 14
N/A202-203Nuclear Fuel Materials 15
204-207Electric Plant in Service 16
N/A213Electric Plant Leased to Others 17
N/A214Electric Plant Held for Future Use 18
216Construction Work in Progress-Electric 19
219Accumulated Provision for Depreciation of Electric Utility Plant 20
N/A224-225Investment of Subsidiary Companies 21
227Materials and Supplies 22
228(ab)-229(ab)Allowances 23
N/A230Extraordinary Property Losses 24
N/A230Unrecovered Plant and Regulatory Study Costs 25
231Transmission Service and Generation Interconnection Study Costs 26
232Other Regulatory Assets 27
233Miscellaneous Deferred Debits 28
234Accumulated Deferred Income Taxes 29
250-251Capital Stock 30
N/A253Other Paid-in Capital 31
254Capital Stock Expense 32
256-257Long-Term Debt 33
261Reconciliation of Reported Net Income with Taxable Inc for Fed Inc Tax 34
262-263Taxes Accrued, Prepaid and Charged During the Year 35
266-267Accumulated Deferred Investment Tax Credits 36
FERC FORM NO. 1 (ED. 12-96) Page 2
10
Schedule Q-5 Page 10 of 300
Sponsor: Robinson Case No. 15-00139-UT

LIST OF SCHEDULES (Electric Utility) (continued)
Name of Respondent This Report Is:(1) An Original(2) A Resubmission
Date of Report(Mo, Da, Yr)
Year/Period of Report
End ofSouthwestern Public Service CompanyX
04/13/20152014/Q4
Line No.
Title of Schedule ReferencePage No.
Remarks
(c)(b)(a)
Enter in column (c) the terms "none," "not applicable," or "NA," as appropriate, where no information or amounts have been reported forcertain pages. Omit pages where the respondents are "none," "not applicable," or "NA".
269Other Deferred Credits 37
272-273Accumulated Deferred Income Taxes-Accelerated Amortization Property 38
274-275Accumulated Deferred Income Taxes-Other Property 39
276-277Accumulated Deferred Income Taxes-Other 40
278Other Regulatory Liabilities 41
300-301Electric Operating Revenues 42
N/A302Regional Transmission Service Revenues (Account 457.1) 43
304Sales of Electricity by Rate Schedules 44
310-311Sales for Resale 45
320-323Electric Operation and Maintenance Expenses 46
326-327Purchased Power 47
328-330Transmission of Electricity for Others 48
N/A331Transmission of Electricity by ISO/RTOs 49
332Transmission of Electricity by Others 50
335Miscellaneous General Expenses-Electric 51
336-337Depreciation and Amortization of Electric Plant 52
350-351Regulatory Commission Expenses 53
352-353Research, Development and Demonstration Activities 54
354-355Distribution of Salaries and Wages 55
N/A356Common Utility Plant and Expenses 56
397Amounts included in ISO/RTO Settlement Statements 57
398Purchase and Sale of Ancillary Services 58
400Monthly Transmission System Peak Load 59
N/A400aMonthly ISO/RTO Transmission System Peak Load 60
401Electric Energy Account 61
401Monthly Peaks and Output 62
402-403Steam Electric Generating Plant Statistics 63
N/A406-407Hydroelectric Generating Plant Statistics 64
N/A408-409Pumped Storage Generating Plant Statistics 65
N/A410-411Generating Plant Statistics Pages 66
FERC FORM NO. 1 (ED. 12-96) Page 3
11
Schedule Q-5 Page 11 of 300
Sponsor: Robinson Case No. 15-00139-UT

LIST OF SCHEDULES (Electric Utility) (continued)
Name of Respondent This Report Is:(1) An Original(2) A Resubmission
Date of Report(Mo, Da, Yr)
Year/Period of Report
End ofSouthwestern Public Service CompanyX
04/13/20152014/Q4
Line No.
Title of Schedule ReferencePage No.
Remarks
(c)(b)(a)
Enter in column (c) the terms "none," "not applicable," or "NA," as appropriate, where no information or amounts have been reported forcertain pages. Omit pages where the respondents are "none," "not applicable," or "NA".
422-423Transmission Line Statistics Pages 67
424-425Transmission Lines Added During the Year 68
426-427Substations 69
429Transactions with Associated (Affiliated) Companies 70
450Footnote Data 71
Stockholders' Reports Check appropriate box:Two copies will be submitted
No annual report to stockholders is prepared
FERC FORM NO. 1 (ED. 12-96) Page 4
12
Schedule Q-5 Page 12 of 300
Sponsor: Robinson Case No. 15-00139-UT

Name of Respondent This Report Is:(1) An Original(2) A Resubmission
Date of Report(Mo, Da, Yr)
Year/Period of Report
End of
GENERAL INFORMATION
Southwestern Public Service Company X04/13/2015 2014/Q4
New Mexico, 1921
Jeffrey S. Savage
Senior Vice President and Controller
414 Nicollet Mall, Suite 400 1800 Larimer Street
Minneapolis, MN 55401 Denver, CO 80202
1. Provide name and title of officer having custody of the general corporate books of account and address ofoffice where the general corporate books are kept, and address of office where any other corporate books of accountare kept, if different from that where the general corporate books are kept.
2. Provide the name of the State under the laws of which respondent is incorporated, and date of incorporation.If incorporated under a special law, give reference to such law. If not incorporated, state that fact and give the typeof organization and the date organized.
3. If at any time during the year the property of respondent was held by a receiver or trustee, give (a) name of receiver or trustee, (b) date such receiver or trustee took possession, (c) the authority by which the receivership ortrusteeship was created, and (d) date when possession by receiver or trustee ceased.
4. State the classes or utility and other services furnished by respondent during the year in each State in whichthe respondent operated.
5. Have you engaged as the principal accountant to audit your financial statements an accountant who is notthe principal accountant for your previous year's certified financial statements?
(1) Yes...Enter the date when such independent accountant was initially engaged: (2) NoX
Not Applicable
Southwestern Public Service Company (SPS) is an operating utility engaged primarily in the generation,purchase, transmission, distribution, and sale of electricity with operations in the states of Texas andNew Mexico.
FERC FORM No.1 (ED. 12-87) PAGE 101
13
Schedule Q-5 Page 13 of 300
Sponsor: Robinson Case No. 15-00139-UT

Name of Respondent This Report Is:(1) An Original(2) A Resubmission
Date of Report(Mo, Da, Yr)
Year/Period of Report
End of
CONTROL OVER RESPONDENT
Southwestern Public Service Company X04/13/2015 2014/Q4
1. If any corporation, business trust, or similar organization or a combination of such organizations jointly heldcontrol over the repondent at the end of the year, state name of controlling corporation or organization, manner inwhich control was held, and extent of control. If control was in a holding company organization, show the chainof ownership or control to the main parent company or organization. If control was held by a trustee(s), state name of trustee(s), name of beneficiary or beneficiearies for whom trust was maintained, and purpose of the trust.
Southwestern Public Service Company (SPS) is a wholly-owned subsidiary of Xcel Energy Inc.
Page 102FERC FORM NO. 1 (ED. 12-96)
14
Schedule Q-5 Page 14 of 300
Sponsor: Robinson Case No. 15-00139-UT

Name of Respondent This Report Is:(1) An Original(2) A Resubmission
Date of Report(Mo, Da, Yr)
Year/Period of Report
End of
CORPORATIONS CONTROLLED BY RESPONDENT
Southwestern Public Service CompanyX
04/13/20152014/Q4
Line No.
Name of Company Controlled Kind of Business Percent VotingStock Owned
(c)(b)(a)
FootnoteRef.(d)
1. Report below the names of all corporations, business trusts, and similar organizations, controlled directly or indirectly by respondentat any time during the year. If control ceased prior to end of year, give particulars (details) in a footnote.2. If control was by other means than a direct holding of voting rights, state in a footnote the manner in which control was held, namingany intermediaries involved.3. If control was held jointly with one or more other interests, state the fact in a footnote and name the other interests.
Definitions1. See the Uniform System of Accounts for a definition of control.2. Direct control is that which is exercised without interposition of an intermediary.3. Indirect control is that which is exercised by the interposition of an intermediary which exercises direct control.4. Joint control is that in which neither interest can effectively control or direct action without the consent of the other, as where thevoting control is equally divided between two holders, or each party holds a veto power over the other. Joint control may exist by mutualagreement or understanding between two or more parties who together have control within the meaning of the definition of control in theUniform System of Accounts, regardless of the relative voting rights of each party.
1
2
3
4
5
6
7
8
9
10
11
12
13
14
15
16
17
18
19
20
21
22
23
24
25
26
27
FERC FORM NO. 1 (ED. 12-96) Page 103
15
Schedule Q-5 Page 15 of 300
Sponsor: Robinson Case No. 15-00139-UT

Name of Respondent This Report Is:(1) An Original(2) A Resubmission
Date of Report(Mo, Da, Yr)
Year/Period of Report
End of
OFFICERS
Southwestern Public Service CompanyX
04/13/20152014/Q4
Line No.
Title Name of Officer Salaryfor Year
(c)(b)(a)
1. Report below the name, title and salary for each executive officer whose salary is $50,000 or more. An "executive officer" of arespondent includes its president, secretary, treasurer, and vice president in charge of a principal business unit, division or function(such as sales, administration or finance), and any other person who performs similar policy making functions.2. If a change was made during the year in the incumbent of any position, show name and total remuneration of the previousincumbent, and the date the change in incumbency was made.
Chairman of the Board 141,146Ben Fowke 1
President and Chief Executive Officer 250,000David Hudson 2
Senior Vice President, Chief Financial Officer 67,748Teresa S. Madden 3
Senior Vice President, General Counsel 50,312Scott M. Wilensky 4
Senior Vice President 63,784Marvin E. McDaniel, Jr. 5
Senior Vice President 50,633David M. Sparby 6
Senior Vice President 62,896Kent T. Larson 7
8
Salaries represent SPS's allocation of 9
officers' salaries greater than $50,000 for the period 10
of time that was served as an officer to SPS. 11
12
13
14
15
16
17
18
19
20
21
22
23
24
25
26
27
28
29
30
31
32
33
34
35
36
37
38
39
40
41
42
43
44
FERC FORM NO. 1 (ED. 12-96) Page 104
16
Schedule Q-5 Page 16 of 300
Sponsor: Robinson Case No. 15-00139-UT

Schedule Page: 104 Line No.: 6 Column: bEffective December 31, 2014 David Sparby resigned as the Chief Executive Officer, butcontinured as President. Effective January 1, 2015 Ben Fowke was elected Chief ExecutiveOfficer.
Name of Respondent
Southwestern Public Service Company
This Report is:(1) X An Original(2) A Resubmission
Date of Report(Mo, Da, Yr)
04/13/2015
Year/Period of Report
2014/Q4
FOOTNOTE DATA
FERC FORM NO. 1 (ED. 12-87) Page 450.1
17
Schedule Q-5 Page 17 of 300
Sponsor: Robinson Case No. 15-00139-UT

Name of Respondent This Report Is:(1) An Original(2) A Resubmission
Date of Report(Mo, Da, Yr)
Year/Period of Report
End of
DIRECTORS
Southwestern Public Service CompanyX
04/13/20152014/Q4
Line Name (and Title) of Director Principal Business Address(b)(a)No.
1. Report below the information called for concerning each director of the respondent who held office at any time during the year. Include in column (a), abbreviatedtitles of the directors who are officers of the respondent.2. Designate members of the Executive Committee by a triple asterisk and the Chairman of the Executive Committee by a double asterisk.
Tyler at Sixth, Amarillo, TX 79170David Hudson, President 1
414 Nicollet Mall, Suite 500, Minneapolis, MN 55401Ben Fowke, Chairman, Chief Executive Officer 2
414 Nicollet Mall, Suite 500, Minneapolis, MN 55401Teresa S. Madden, Executive Vice President, CFO 3
414 Nicollet Mall, Suite 500, Minneapolis, MN 55401Marvin E. McDaniel, Executive Vice President 4
5
6
7
8
9
10
11
12
13
14
15
16
17
18
19
20
21
22
23
24
25
26
27
28
29
30
31
32
33
34
35
36
37
38
39
40
41
42
43
44
45
46
47
48
FERC FORM NO. 1 (ED. 12-95) Page 105
18
Schedule Q-5 Page 18 of 300
Sponsor: Robinson Case No. 15-00139-UT

Name of Respondent This Report Is:(1) An Original(2) A Resubmission
Date of Report(Mo, Da, Yr)
Year/Period of Report
End of
INFORMATION ON FORMULA RATES
Southwestern Public Service CompanyX
04/13/20152014/Q4
Line No. FERC Rate Schedule or Tariff Number FERC Proceeding
Does the respondent have formula rates? Yes
No
X
1. Please list the Commission accepted formula rates including FERC Rate Schedule or Tariff Number and FERC proceeding (i.e. Docket No)accepting the rate(s) or changes in the accepted rate.
FERC Rate Schedule/Tariff Number FERC Proceeding
See footnote 1
2
3
4
5
6
7
8
9
10
11
12
13
14
15
16
17
18
19
20
21
22
23
24
25
26
27
28
29
30
31
32
33
34
35
36
37
38
39
40
41
FERC FORM NO. 1 (NEW. 12-08) Page 106
19
Schedule Q-5 Page 19 of 300
Sponsor: Robinson Case No. 15-00139-UT

Schedule Page: 106 Line No.: 1 Column: aFERC Rate Schedule or Tariff Number FERC Proceeding
FERC Electric Tariff, First Revised Volume No. 1. ER08-313-005 - SPS filing to implement a transmission(Xcel Energy Operating Companies Joint Open formula rate. (Accession No. 20071210-0247.)Access Transmission Tariff, Attachment O - Commission Order approving uncontested settlementSouthwestern Public Service Company Formulaic to implement a transmission formula rate, except theRates.) issue of classifying radial transmission facilities, issued
December 2, 2009, effective January 1, 2009 - 129 FERC ¶ 61,193 (2009) (Accession No. 20091202-3038.)
FERC Electric Tariff, First Revised Volume No. 1. ER08-313-002, 003, 004; ER08-923-001, 002, 003;(Xcel Energy Operating Companies Joint Open ER08-1307-001, 002; ER08-1308-002, 003, 006; ER08-Access Transmission Tariff, Attachment O - 1357-001, 002; ER08-1358-001, 002; ER08-1359-001,Southwestern Public Service Company Formulaic 002 - Settlement filed June 30, 2010 resolving all the Rates.) remaining issues in the above dockets. Specifically,
issues regarding the classification of certain SPStransmission facilities referred to as radial lines(Accession No. 20100701-0022.)Commission Order approving settlement, issued August 26, 2010 - 132 FERC ¶ 61,170 (2010)(Accession No. 20100826-3005.)
FERC Electric Tariff, Second Revised Volume No. 1, ER10-2075 - Baseline Electronic Tariff Filing of the Xcel0.0.0 A (Xcel Energy Operating Companies JointOpen Transmission Tariff, Attachment O - Energy Operating Companies Joint Open Access Southwestern Public Service Company Formulaic Transmission Tariff, Second Revised Volume No. 1 andRates.) Related Tariff Records (Accession No. 20100730-5185.)Compliance Filing - corrected certificates of Amended filing on September 28, 2010 (Accession No.concurrence to the Xcel Energy Operating 20100928-5287.)Companies Joint OATT. Letter order accepting filing and amendment issued
October 25, 2010 effective July 30, 2010 (Accession No. 20101025-3018.)
FERC Electric Tariff, Second Revised Volume No. 1, ER11-114 - SPS submitted revised tariff records0.1.0 A (Xcel Energy Operating Companies Joint contained in Attachment O-SPS to the Xcel EnergyOpen Access Transmission Tariff, Attachment O - Operating Companies Joint OATT. Certain terms andSouthwestern Public Service Company Formulaic conditions of the settlement filed June 30, 2010 in Rates.) Docket ER08-313 referenced above required changes
to the SPS Transmission Formulaic Rates compared tothe formula template currently on file (Accession No. 20101014-5060.)Letter order approving the revised tariff sheets issuedDecember 21, 2010 (Accession No. 20101221-3035.)
FERC Electric Tariff, Second Revised Volume No. 1, ER11-3505 - SPS submitted revised Attachment O-SPS0.2.0 A (Xcel Energy Operating Companies Joint formula rate template. The revised template convertsOpen Access Transmission Tariff, Attachment O - the SPP Base Plan revenue requirement calculationSouthwestern Public Service Company Formulaic from a historical basis to a projected basis along with aRates.) corresponding true-up to actual costs. The SPP Base
Plan Upgrade revenue requirement is a component ofof the SPS Annual Transmission Revenue Requirement(Accession No. 20110503-5076.)Letter order approving the revised tariff sheets issuedJuly 1, 2011 effective July 5, 2011 (Accession No. 20110701-3027.)
Second Revised FERC Rate Schedule No. 102 ER10-260 - SPS submitted revisions to Interconnection (Public Service Company of New Mexico) Agreement between SPS and Public Service Company of
New Mexico and to change the rates for interruptiblepower from a fixed production rate to a formula rate(Accession No. 20100204-0004.)Letter order issued January 5, 2010 accepting revisedInterconnection Agreement and formula rate effectiveNovember 1, 2009 (Accession No. 20100105-3030.)
Name of Respondent
Southwestern Public Service Company
This Report is:(1) X An Original(2) A Resubmission
Date of Report(Mo, Da, Yr)
04/13/2015
Year/Period of Report
2014/Q4
FOOTNOTE DATA
FERC FORM NO. 1 (ED. 12-87) Page 450.1
20
Schedule Q-5 Page 20 of 300
Sponsor: Robinson Case No. 15-00139-UT
FERC Electric Rate Schedule No. 102, 0.0.0 A ER11-3442 - Revised Formula Rate Template for(Public Service Company of New Mexico) Interruptible Power Service to Public Service Company
of New Mexico (Accession No. 20110427-5155.)Letter order issued June 21, 2011 accepting the revisedformula rate template effective January 1, 2010(Accession No. 20110621-3042.)
SPS FERC Third Revised Rate Schedule Nos. 114, EL05-19-000, et al., and ER05-168-000, et al. 115, 116, and 117. (Central Valley Electric Offer of settlement dated January 19, 2010Cooperative, Inc., Farmers Electric Cooperative of (Accession No. 20100119-0048.)New Mexico, Inc., Lea County Electric Cooperative, Commission Order approving uncontested settlement Inc., and Roosevelt County Electric Cooperative, issued on June 22, 2010 - 131 FERC ¶ 61,260 (2010)Inc., respectively. Referred to as the New Mexico (Accession No. 20100622-3002.)Cooperatives.)
FERC Electric Rate Schedule No. 114, 0.0.0 A ER11-4082 - Revised Formula Rate Template for Full(Central Valley Electric Cooperative, Inc.) Requirements Power Service to Central Valley
Electric Cooperative, Inc. (Accession No. 20110721-5000.)Letter Order issued September 8, 2011 accepting thethe revised formula rate, effective October 1, 2011.(Accession No. 20110908-3004.)
FERC Electric Rate Schedule No. 115, 0.0.0 A ER11-4083 - Revised Formula Rate Template for Full(Farmers Electric Cooperative of New Mexico, Inc.) Requirements Power Service to Farmers
Electric Cooperative, Inc. (Accession No. 20110721-5000.)Letter Order issued September 8, 2011 accepting thethe revised formula rate, effective October 1, 2011.(Accession No. 20110908-3004.)
FERC Electric Rate Schedule No. 116, 0.0.0 A ER11-4084 - Revised Formula Rate Template for Full(Lea County Electric Cooperative, Inc.) Requirements Power Service to Lea County
Electric Cooperative, Inc. (Accession No. 20110721-5000.)Letter Order issued September 8, 2011 accepting thethe revised formula rate, effective October 1, 2011.(Accession No. 20110908-3004.)
FERC Electric Rate Schedule No. 117, 0.0.0 A ER11-4085 - Revised Formula Rate Template for Full(Roosevelt County Electric Cooperative, Inc.) Requirements Power Service to Roosevelt County
Electric Cooperative, Inc. (Accession No. 20110721-5000.)Letter Order issued September 8, 2011 accepting thethe revised formula rate, effective October 1, 2011.(Accession No. 20110908-3004.)
SPS FERC Electric Rate Schedule Second Revised EL05-19-000, et al., and ER05-168-000, et al. No. 118. (Wholesale Full Requirements Service to Offer of settlement dated July 7, 2010 (Accession No.Cap Rock Energy Corporation, now Sharyland 20100708-0001.)Utilities.) Commission Order approving uncontested settlement
issued on December 20, 2010 - 133 FERC ¶ 61,243(2010)(Accession No. 20101220-3044.)
FERC Electric Rate Schedule No. 118, 0.0.0 A ER11-2921 - Revised Formula Rate Template for Full(Sharyland Utilities) Requirements Power Service to Sharyland Utilities
(Accession No. 20110218-5139.)Letter Order issued April 18, 2011 accepting the revisedformula rate template, effective August 1, 2010.(Accession No. 20110418-3029.)
FERC Electric Rate Schedule No. 132 EL05-19-000, ER05-168-000 and ER06-274-000 -(Golden Spread Electric Cooperative) Offer of uncontested partial settlement (Accession No.
20071204-0162.)Commission Order approving uncontested partial settlement subject to modification issued on April 21, 2008 - 123 FERC ¶ 61,054 (2008) (Accession No. 20080421-3030.)
Name of Respondent
Southwestern Public Service Company
This Report is:(1) X An Original(2) A Resubmission
Date of Report(Mo, Da, Yr)
04/13/2015
Year/Period of Report
2014/Q4
FOOTNOTE DATA
FERC FORM NO. 1 (ED. 12-87) Page 450.2
21
Schedule Q-5 Page 21 of 300
Sponsor: Robinson Case No. 15-00139-UT

FERC Electric Rate Schedule No. 132 ER10-1426 - Revised Formula Rate Template for(Golden Spread Electric Cooperative) Partial Requirements Service to Golden Spread
Electric Cooperative, Inc. (Accession No. 20100611-0216.)Letter order issued August 3, 2010 accepting the revisedformula rate template, effective July 1, 2008 (AccessionNo. 20100803-3036.)
FERC Electric Rate Schedule No. 132, 0.0.0 A ER11-3228 - Revised Formula Rate Template for(Golden Spread Electric Cooperative) Partial Requirements Service to Golden Spread
Electric Cooperative, Inc. (Accession No. 20110330-5101.)Letter Order issued May 4, 2011 accepting the revisedformula rate template, effective January 1, 2010 (Accession No. 20110504-3040.)
First Revised FERC Electric Rate Schedule No. 137 ER10-515 - Revised Formula Rate Template for Full (West Texas Municipal Power Agency) Requirements Service to West Texas Municipal Power
Agency (Accession No. 20091231-0038.)Letter order issued February 18, 2010 accepting the Revised Transaction Agreement & Master Power andSale Agreement, including the formula rate template,effective January 1, 2010 (Accession No. 20100218-3058.)(Accession No. 20100218-3058.)
FERC Electric Rate Schedule No. 137, 0.0.0 A ER11-3598 - Revised Formula Rate Template for Total(West Texas Municipal Power Agency) Requirements Power Service to West Texas Municipal
Power Agency (Accession No. 20110519-5016.)Letter Order issued June 24, 2011 accepting the revisedformula rate template, effective January 1, 2010 (Accession No. 20110624-3044.)
FERC Electric Rate Schedule No. 135, 0.0.0 A ER12-1122 - Expanded Electric Rate Schedule for Partial(Golden Spread Electric Cooperative, Inc.) Revenue Requirements to Golden Spread Electric
(Accession No. 20120221-5133.)Letter Order issued April 17, 2012 accepting the expanded
service and formula rate template, effective April 20, 2012(Accession No. 20120417-3003.)
FERC Electric Rate Schedule No. 114, 0.1.0 A ER13-1451 - Revised Formula Rate Template for Full(Central Valley Electric Cooperative, Inc.) Requirements Power Service to Central Valley
Electric Cooperative, Inc. (Accession No. 20130510-5095.)Letter Order issued July 2, 2013 accepting the revisedformula rate template, effective January 1, 2012(Accession No. 20130702-3018.)
FERC Electric Rate Schedule No. 116, 0.1.0 A ER13-1452 - Revised Formula Rate Template for Full(Lea County Electric Cooperative, Inc.) Requirements Power Service to Lea County
Electric Cooperative, Inc. (Accession No. 20130510-5096.)Letter Order issued July 2, 2013 accepting the revisedformula rate template, effective January 1, 2012(Accession No. 20130702-3019.)
FERC Electric Rate Schedule No. 117, 0.1.0 A ER13-1453 - Revised Formula Rate Template for Full(Roosevelt County Electric Cooperative, Inc.) Requirements Power Service to Roosevelt County
Electric Cooperative, Inc. (Accession No. 20130510-5097.)Letter Order issued July 2, 2013 accepting the revisedformula rate template, effective January 1, 2012(Accession No. 20130702-3021.)
FERC Electric Rate Schedule No. 118. 0.1.0 A ER13-1454 - Revised Formula Rate Template for Full(Sharyland Utilities) Requirements Power Service to Sharyland Utilities
(Accession No. 20130510-5098.)Letter Order issued July 2, 2013 accepting the revisedformula rate template, effective January 1, 2012(Accession No. 20130702-3020.)
Name of Respondent
Southwestern Public Service Company
This Report is:(1) X An Original(2) A Resubmission
Date of Report(Mo, Da, Yr)
04/13/2015
Year/Period of Report
2014/Q4
FOOTNOTE DATA
FERC FORM NO. 1 (ED. 12-87) Page 450.3
22
Schedule Q-5 Page 22 of 300
Sponsor: Robinson Case No. 15-00139-UT

FERC Electric Rate Schedule No. 135, 0.1.0 A ER13-1455 - Revised Formula Rate Template for Full(Golden Spread Electric Cooperative) Requirements Power Service to Golden Spread
Electric Cooperative, Inc. (Accession No. 20130510-5099.)Letter Order issued July 2, 2013 accepting the revisedformula rate template, effective January 1, 2012(Accession No. 20130702-3022.)
FERC Electric Rate Schedule No. 137, 0.1.0 A ER13-1456 - Revised Formula Rate Template for Full(West Texas Municipal Power Agency) Requirements Power Service to West Texas Municipal
Power Agency (Accession No. 20130510-5100.)Letter Order issued July 2, 2013 accepting the revisedformula rate template, effective January 1, 2012(Accession No. 20130702-3023.)
FERC Electric Rate Schedule No. 115, 0.1.0 A ER13-1458 - Revised Formula Rate Template for Full(Farmers Electric Cooperative of New Mexico, Inc.) Requirements Power Service to Farmers
Electric Cooperative, Inc. (Accession No. 20130510-5102.)Letter Order issued July 2, 2013 accepting the revisedformula rate template, effective January 1, 2012(Accession No. 20130702-3024.)
FERC Electric Rate Schedule No. 114, 0.2.0 A ER14-186 - Revised Formula Rate Template for (Central Valley Electric Cooperative, Inc.) Requirements Power Service to Central Valley
Electric Cooperative, Inc. (Accession No. 20131028-5001.)Letter Order issued December 27, 2013 accepting therevised formula rate template, effective January 1, 2013(Accession No. 20131227-3017.)
FERC Electric Rate Schedule No. 115, 0.2.0 A ER14-187 - Revised Formula Rate Template for (Farmers Electric Cooperative of New Mexico, Inc.) Requirements Power Service to Farmers
Electric Cooperative, Inc. (Accession No. 20131028-5002.)Letter Order issued December 27, 2013 accepting therevised formula rate template, effective January 1, 2013(Accession No. 20131227-3018.)
FERC Electric Rate Schedule No. 116, 0.2.0 A ER14-188 - Revised Formula Rate Template for (Lea County Electric Cooperative, Inc.) Requirements Power Service to Lea County
Electric Cooperative, Inc. (Accession No. 20131028-5003.)Letter Order issued December 27, 2013 accepting therevised formula rate template, effective January 1, 2013(Accession No. 20131227-3019.)
FERC Electric Rate Schedule No. 117, 0.2.0 A ER14-189 - Revised Formula Rate Template for (Roosevelt County Electric Cooperative, Inc.) Requirements Power Service to Roosevelt County
Electric Cooperative, Inc. (Accession No. 20131028-5004.)Letter Order issued December 27, 2013 accepting therevised formula rate template, effective January 1, 2013(Accession No. 20131227-3020.)
FERC Electric Rate Schedule No. 118, 0.2.0 A ER14-190 - Revised Formula Rate Template for (Sharyland Utilities) Requirements Power Service to Sharyland Utilities
(Accession No. 20131028-5005.)Letter Order issued December 27, 2013 accepting therevised formula rate template, effective January 1, 2013(Accession No. 20131227-3021.)
FERC Electric Rate Schedule No. 135, 0.2.0 A ER14-192 - Revised Formula Rate Template for (Golden Spread Electric Cooperative) Requirements Power Service to Golden Spread
Electric Cooperative, Inc. (Accession No. 20131028-5007.)Commission Order approving revised formula ratetemplate issued December 27, 2013 - 145 FERC ¶ 61,281 (2013) (Accession No. 20131227-3016.)
FERC Electric Rate Schedule No. 137, 0.2.0 A ER14-191 - Revised Formula Rate Template for (West Texas Municipal Power Agency) Requirements Power Service to West Texas Municipal
Name of Respondent
Southwestern Public Service Company
This Report is:(1) X An Original(2) A Resubmission
Date of Report(Mo, Da, Yr)
04/13/2015
Year/Period of Report
2014/Q4
FOOTNOTE DATA
FERC FORM NO. 1 (ED. 12-87) Page 450.4
23
Schedule Q-5 Page 23 of 300
Sponsor: Robinson Case No. 15-00139-UT

Power Agency (Accession No. 20131028-5006.)Letter Order issued December 27, 2013 accepting therevised formula rate template, effective January 1, 2013(Accession No. 20131227-3022.)
FERC Electric Rate Schedule No. 135, 0.3.0 A ER14-2921 - Revised Wholesale Fuel Cost and Economic(Golden Spread Electric Cooperative) Purchased Power Adjustment Clause and Revised
Formula Rate Template for Partial Requirements Power Service to Golden Spread Electric Cooperative, Inc.(Accession No. 20140922-5086.)Amended filing (Accession No. 20141007-5134.)Letter Order issued November 19, 2014 acceptingrevised template, effective March 1, 2014 (Accession No.20141119-3046.)
FERC Electric Rate Schedule Nos. 114, 115, 116, ER14-2923 - Revised Wholesale Fuel Cost and Economic 117, and 137, 0.3.0 A Purchased Power Adjustment Clause and Revised (Central Valley Electric Cooperative, Farmers' Electric Formula Rate Template for Requirements Power Service Cooperative of New Mexico, Lea County Electric to Central Valley Electric Cooperative, Inc., Farmers’Cooperative, Roosevelt County Electric Cooperative, Electric Cooperative of New Mexico, Inc., Lea CountyWest Texas Municipal Power Agency) Electric Cooperative, Inc., Roosevelt County Electric
Cooperative, Inc., and West Texas Municipal PowerAgency(Accession No. 20140922-5088.)Amended filing (Accession No. 20141007-5136.)Letter Order issued November 19, 2014 acceptingrevised template, effective March 1, 2014 (Accession No. 20141119-3045.)
FERC Electric Rate Schedule Nos. 114, 115, 116, ER15-561 - Revised Formula Rate Template for 117, and 137, 0.1.0 A Requirements Power Service to Central Valley Electric(Central Valley Electric Cooperative, Farmers' Electric Cooperative, Inc., Farmers’ Cooperative of New Cooperative of New Mexico, Lea County Electric Mexico, Inc., Lea County Electric Cooperative, Inc., Cooperative, Roosevelt County Electric Cooperative, Roosevelt County Electric Cooperative, Inc., and WestWest Texas Municipal Power Agency) Texas Municipal Power Agency (Accession No.
20141203-5058.)Letter Order issued January 28, 2015 acceptingrevised template, effective January 1, 2014(Accession No. 20150128-3055.)
FERC Electric Rate Schedule No. 135, 0.1.0 A ER15-562 - Revised Formula Rate Template for (Golden Spread Electric Cooperative) Partial Requirements Power Service to Golden Spread
Electric Cooperative, Inc. (Accession No. 20141203-5059.)Letter Order issued January 28, 2015 acceptingrevised template, effective January 1, 2014(Accession No. 20150128-3054.)
Name of Respondent
Southwestern Public Service Company
This Report is:(1) X An Original(2) A Resubmission
Date of Report(Mo, Da, Yr)
04/13/2015
Year/Period of Report
2014/Q4
FOOTNOTE DATA
FERC FORM NO. 1 (ED. 12-87) Page 450.5
24
Schedule Q-5 Page 24 of 300
Sponsor: Robinson Case No. 15-00139-UT

Name of Respondent This Report Is:(1) An Original(2) A Resubmission
Date of Report(Mo, Da, Yr)
Year/Period of Report
End ofSouthwestern Public Service CompanyX
04/13/20152014/Q4
Line No. \ Filed DateAccession No.
DateDocket No. Description
Formula Rate FERC RateSchedule Number orTariff Number
INFORMATION ON FORMULA RATES
Does the respondent file with the Commission annual (or more frequent) Yes
NoX
2. If yes, provide a listing of such filings as contained on the Commission's eLibrary website
FERC Rate Schedule/Tariff Number FERC Proceeding
filings containing the inputs to the formula rate(s)?
Document
12/01/2014 ER08-313-000 See footnoteSee footnote 1
2
3
4
5
6
05/29/201420140529-5118 EL05-19-000 See footnoteSee footnote 7
ER05-168-000 8
9
10
11
12
13
05/29/201420140529-5123 EL05-19-000 See footnoteSee footnote 14
ER05-168-000 15
ER10-515-000 16
17
18
19
20
21
22
23
24
25
26
27
28
29
30
31
32
33
34
35
36
37
38
39
40
41
42
43
44
45
46
FERC FORM NO. 1 (NEW. 12-08) Page 106a
25
Schedule Q-5 Page 25 of 300
Sponsor: Robinson Case No. 15-00139-UT

Schedule Page: 1061 Line No.: 1 Column: d
Schedule Page: 1061 Line No.: 7 Column: d
Schedule Page: 1061 Line No.: 14 Column: d
Name of Respondent
Southwestern Public Service Company
This Report is:(1) X An Original(2) A Resubmission
Date of Report(Mo, Da, Yr)
04/13/2015
Year/Period of Report
2014/Q4
FOOTNOTE DATA
FERC FORM NO. 1 (ED. 12-87) Page 450.1
26
Schedule Q-5 Page 26 of 300
Sponsor: Robinson Case No. 15-00139-UT

Name of Respondent This Report Is:(1) An Original(2) A Resubmission
Date of Report(Mo, Da, Yr)
Year/Period of Report
End ofSouthwestern Public Service CompanyX
04/13/20152014/Q4
Line No. Page No(s). Schedule Column Line No
INFORMATION ON FORMULA RATES
1. If a respondent does not submit such filings then indicate in a footnote to the applicable Form 1 schedule where formula rate inputs differ from
Formula Rate Variances
amounts reported in the Form 1.2. The footnote should provide a narrative description explaining how the "rate" (or billing) was derived if different from the reported amount in the
Form 1.3. The footnote should explain amounts excluded from the ratebase or where labor or other allocation factors, operating expenses, or other items
impacting formula rate inputs differ from amounts reported in Form 1 schedule amounts.4. Where the Commission has provided guidance on formula rate inputs, the specific proceeding should be noted in the footnote.
1
2
3
4
5
6
7
8
9
10
11
12
13
14
15
16
17
18
19
20
21
22
23
24
25
26
27
28
29
30
31
32
33
34
35
36
37
38
39
40
41
42
43
44
FERC FORM NO. 1 (NEW. 12-08) Page 106b
27
Schedule Q-5 Page 27 of 300
Sponsor: Robinson Case No. 15-00139-UT

Name of Respondent This Report Is:(1) An Original(2) A Resubmission
Date of Report Year/Period of ReportEnd of
IMPORTANT CHANGES DURING THE QUARTER/YEAR
Southwestern Public Service Company X04/13/2015
2014/Q4
PAGE 108 INTENTIONALLY LEFT BLANKSEE PAGE 109 FOR REQUIRED INFORMATION.
Give particulars (details) concerning the matters indicated below. Make the statements explicit and precise, and number them inaccordance with the inquiries. Each inquiry should be answered. Enter "none," "not applicable," or "NA" where applicable. Ifinformation which answers an inquiry is given elsewhere in the report, make a reference to the schedule in which it appears.1. Changes in and important additions to franchise rights: Describe the actual consideration given therefore and state from whom thefranchise rights were acquired. If acquired without the payment of consideration, state that fact.2. Acquisition of ownership in other companies by reorganization, merger, or consolidation with other companies: Give names ofcompanies involved, particulars concerning the transactions, name of the Commission authorizing the transaction, and reference toCommission authorization.3. Purchase or sale of an operating unit or system: Give a brief description of the property, and of the transactions relating thereto,and reference to Commission authorization, if any was required. Give date journal entries called for by the Uniform System of Accountswere submitted to the Commission.4. Important leaseholds (other than leaseholds for natural gas lands) that have been acquired or given, assigned or surrendered: Giveeffective dates, lengths of terms, names of parties, rents, and other condition. State name of Commission authorizing lease and givereference to such authorization.5. Important extension or reduction of transmission or distribution system: State territory added or relinquished and date operationsbegan or ceased and give reference to Commission authorization, if any was required. State also the approximate number ofcustomers added or lost and approximate annual revenues of each class of service. Each natural gas company must also state majornew continuing sources of gas made available to it from purchases, development, purchase contract or otherwise, giving location andapproximate total gas volumes available, period of contracts, and other parties to any such arrangements, etc.6. Obligations incurred as a result of issuance of securities or assumption of liabilities or guarantees including issuance of short-termdebt and commercial paper having a maturity of one year or less. Give reference to FERC or State Commission authorization, asappropriate, and the amount of obligation or guarantee.7. Changes in articles of incorporation or amendments to charter: Explain the nature and purpose of such changes or amendments.8. State the estimated annual effect and nature of any important wage scale changes during the year.9. State briefly the status of any materially important legal proceedings pending at the end of the year, and the results of any suchproceedings culminated during the year.10. Describe briefly any materially important transactions of the respondent not disclosed elsewhere in this report in which an officer,director, security holder reported on Page 104 or 105 of the Annual Report Form No. 1, voting trustee, associated company or knownassociate of any of these persons was a party or in which any such person had a material interest.11. (Reserved.)12. If the important changes during the year relating to the respondent company appearing in the annual report to stockholders areapplicable in every respect and furnish the data required by Instructions 1 to 11 above, such notes may be included on this page.13. Describe fully any changes in officers, directors, major security holders and voting powers of the respondent that may haveoccurred during the reporting period.14. In the event that the respondent participates in a cash management program(s) and its proprietary capital ratio is less than 30percent please describe the significant events or transactions causing the proprietary capital ratio to be less than 30 percent, and theextent to which the respondent has amounts loaned or money advanced to its parent, subsidiary, or affiliated companies through acash management program(s). Additionally, please describe plans, if any to regain at least a 30 percent proprietary ratio.
FERC FORM NO. 1 (ED. 12-96) Page 108
28
Schedule Q-5 Page 28 of 300
Sponsor: Robinson Case No. 15-00139-UT

The following important changes have been accumulated during 2014:
1. Franchise
City State Consideration ExpirationTimberCreek Canyon Texas 4% of Electric Revenue 8/31/2034Lea County New Mexico 0% of Electric Revenue 8/20/2015Eunice New Mexico 2% of Electric Revenue 4/27/2039Jal New Mexico 2% of Electric Revenue 6/08/2039Pampa Texas 5% of Electric Revenue 3/31/2034Petersburg Texas 5% of Electric Revenue 3/30/2034Carlsbad New Mexico 2% of Electric Revenue 11/24/2039Tucumcari New Mexico 3% of Electric Revenue 10/08/2039
2. Acquisitions
None
3. Purchase or sale of an operating system
None
4. Important leaseholds acquired or given, assigned or surrendered
None
5. Important extension or reduction of transmission or distribution system
None
6. Obligations incurred as a result of securities or assumption of liabilities
See Note 2 of the Financial Statements on page 123 for disclosures regarding short-termborrowings, long-term debt and other financing instruments.
Short-term borrowings are authorized by the New Mexico Public Regulation Commission CaseNo. 014-00178-UT.
7. Changes in articles of incorporation and amendments to charter
None
8. Wage scale changes
Non-Union Employees – Merit base increase of 3.00 percent effective March 16, 2014.
9. Legal proceedings
Name of Respondent
Southwestern Public Service Company
This Report is:(1) X An Original(2) A Resubmission
Date of Report(Mo, Da, Yr)
04/13/2015
Year/Period of Report
2014/Q4
IMPORTANT CHANGES DURING THE QUARTER/YEAR (Continued)
FERC FORM NO. 1 (ED. 12-96) Page 109.1
29
Schedule Q-5 Page 29 of 300
Sponsor: Robinson Case No. 15-00139-UT

See Note 8 of the Financial Statements on page 122 for further information on materiallegal proceedings.
10. Other materially important transactions with associates
None
11. (Reserved)
12. Important changes
None
13. Changes in officers, directors, major security holders and voting powers
Effective December 31, 2013, C. Riley Hill resigned as Director, President and ChiefExecutive Officer.
Effective January 1, 2014, David T. Hudson was elected as Director, President and ChiefExecutive Officer.
Effective May 21, 2014, Brian J. Van Abel was elected as Assistant Treasurer.
Effective December 31, 2014, David Sparby resigned as Director, Senior Vice President.
Effective December 31, 2014, David T. Hudson resigned as Chief Executive Officer.
Effective January 1, 2015, Marvin E. McDaniel, Jr. was elected as Director, Executive VicePresident.
Effective January 1, 2015, Ben Fowke was elected as Chief Executive Officer.
14. Cash management programs
None
Name of Respondent
Southwestern Public Service Company
This Report is:(1) X An Original(2) A Resubmission
Date of Report(Mo, Da, Yr)
04/13/2015
Year/Period of Report
2014/Q4
IMPORTANT CHANGES DURING THE QUARTER/YEAR (Continued)
FERC FORM NO. 1 (ED. 12-96) Page 109.2
30
Schedule Q-5 Page 30 of 300
Sponsor: Robinson Case No. 15-00139-UT

Name of Respondent This Report Is:(1) An Original(2) A Resubmission
X
Date of Report(Mo, Da, Yr)
Year/Period of Report
End of
COMPARATIVE BALANCE SHEET (ASSETS AND OTHER DEBITS)
LineNo.
Title of Account(a)
Ref.Page No.
(b)
Current YearEnd of Quarter/Year
Balance(c)
Prior YearEnd Balance
12/31(d)
Southwestern Public Service Company04/13/2015 2014/Q4
UTILITY PLANT 1
5,372,176,653 4,709,992,638200-201Utility Plant (101-106, 114) 2
238,518,687 388,322,705200-201Construction Work in Progress (107) 3
5,610,695,340 5,098,315,343TOTAL Utility Plant (Enter Total of lines 2 and 3) 4
1,939,872,108 1,871,521,798200-201(Less) Accum. Prov. for Depr. Amort. Depl. (108, 110, 111, 115) 5
3,670,823,232 3,226,793,545Net Utility Plant (Enter Total of line 4 less 5) 6
0 0202-203Nuclear Fuel in Process of Ref., Conv.,Enrich., and Fab. (120.1) 7
0 0Nuclear Fuel Materials and Assemblies-Stock Account (120.2) 8
0 0Nuclear Fuel Assemblies in Reactor (120.3) 9
0 0Spent Nuclear Fuel (120.4) 10
0 0Nuclear Fuel Under Capital Leases (120.6) 11
0 0202-203(Less) Accum. Prov. for Amort. of Nucl. Fuel Assemblies (120.5) 12
0 0Net Nuclear Fuel (Enter Total of lines 7-11 less 12) 13
3,670,823,232 3,226,793,545Net Utility Plant (Enter Total of lines 6 and 13) 14
0 0Utility Plant Adjustments (116) 15
0 0Gas Stored Underground - Noncurrent (117) 16
OTHER PROPERTY AND INVESTMENTS 17
4,429,030 4,405,212Nonutility Property (121) 18
217,684 175,059(Less) Accum. Prov. for Depr. and Amort. (122) 19
0 0Investments in Associated Companies (123) 20
0 0224-225Investment in Subsidiary Companies (123.1) 21
(For Cost of Account 123.1, See Footnote Page 224, line 42) 22
0 0228-229Noncurrent Portion of Allowances 23
0 0Other Investments (124) 24
0 0Sinking Funds (125) 25
0 0Depreciation Fund (126) 26
0 0Amortization Fund - Federal (127) 27
0 0Other Special Funds (128) 28
0 0Special Funds (Non Major Only) (129) 29
33,163,997 41,056,389Long-Term Portion of Derivative Assets (175) 30
0 0Long-Term Portion of Derivative Assets – Hedges (176) 31
37,375,343 45,286,542TOTAL Other Property and Investments (Lines 18-21 and 23-31) 32
CURRENT AND ACCRUED ASSETS 33
0 0Cash and Working Funds (Non-major Only) (130) 34
0 0Cash (131) 35
0 25,000Special Deposits (132-134) 36
101,700 132,300Working Fund (135) 37
494,489 879,054Temporary Cash Investments (136) 38
0 0Notes Receivable (141) 39
58,099,156 55,465,632Customer Accounts Receivable (142) 40
36,408,221 32,883,782Other Accounts Receivable (143) 41
5,838,702 5,474,877(Less) Accum. Prov. for Uncollectible Acct.-Credit (144) 42
0 0Notes Receivable from Associated Companies (145) 43
1,983,037 15,839,511Accounts Receivable from Assoc. Companies (146) 44
18,493,107 15,537,703227Fuel Stock (151) 45
0 0227Fuel Stock Expenses Undistributed (152) 46
0 0227Residuals (Elec) and Extracted Products (153) 47
20,282,317 19,721,528227Plant Materials and Operating Supplies (154) 48
297,522 228,615227Merchandise (155) 49
0 0227Other Materials and Supplies (156) 50
0 0202-203/227Nuclear Materials Held for Sale (157) 51
4,158,647 1,649,495228-229Allowances (158.1 and 158.2) 52
FERC FORM NO. 1 (REV. 12-03) Page 110
31
Schedule Q-5 Page 31 of 300
Sponsor: Robinson Case No. 15-00139-UT

Name of Respondent This Report Is:(1) An Original(2) A Resubmission
X
Date of Report(Mo, Da, Yr)
Year/Period of Report
End of
COMPARATIVE BALANCE SHEET (ASSETS AND OTHER DEBITS)
LineNo.
Title of Account(a)
Ref.Page No.
(b)
Current YearEnd of Quarter/Year
Balance(c)
Prior YearEnd Balance
12/31(d)
Southwestern Public Service Company04/13/2015 2014/Q4
(Continued)
0 0(Less) Noncurrent Portion of Allowances 53
0 0227Stores Expense Undistributed (163) 54
0 0Gas Stored Underground - Current (164.1) 55
0 0Liquefied Natural Gas Stored and Held for Processing (164.2-164.3) 56
13,265,449 6,292,323Prepayments (165) 57
0 0Advances for Gas (166-167) 58
111,980 26,095Interest and Dividends Receivable (171) 59
695,669 691,454Rents Receivable (172) 60
129,287,055 109,206,648Accrued Utility Revenues (173) 61
2,092 4,808Miscellaneous Current and Accrued Assets (174) 62
56,939,825 58,882,096Derivative Instrument Assets (175) 63
33,163,997 41,056,389(Less) Long-Term Portion of Derivative Instrument Assets (175) 64
0 0Derivative Instrument Assets - Hedges (176) 65
0 0(Less) Long-Term Portion of Derivative Instrument Assets - Hedges (176 66
301,617,567 270,934,778Total Current and Accrued Assets (Lines 34 through 66) 67
DEFERRED DEBITS 68
10,889,526 10,277,803Unamortized Debt Expenses (181) 69
0 0230aExtraordinary Property Losses (182.1) 70
0 0230bUnrecovered Plant and Regulatory Study Costs (182.2) 71
364,010,014 305,729,169232Other Regulatory Assets (182.3) 72
0 0Prelim. Survey and Investigation Charges (Electric) (183) 73
0 0Preliminary Natural Gas Survey and Investigation Charges 183.1) 74
0 0Other Preliminary Survey and Investigation Charges (183.2) 75
0 0Clearing Accounts (184) 76
0 0Temporary Facilities (185) 77
12,572,467 14,123,787233Miscellaneous Deferred Debits (186) 78
0 0Def. Losses from Disposition of Utility Plt. (187) 79
0 0352-353Research, Devel. and Demonstration Expend. (188) 80
3,697,325 4,921,894Unamortized Loss on Reaquired Debt (189) 81
201,826,157 188,171,676234Accumulated Deferred Income Taxes (190) 82
0 0Unrecovered Purchased Gas Costs (191) 83
592,995,489 523,224,329Total Deferred Debits (lines 69 through 83) 84
4,602,811,631 4,066,239,194TOTAL ASSETS (lines 14-16, 32, 67, and 84) 85
FERC FORM NO. 1 (REV. 12-03) Page 111
32
Schedule Q-5 Page 32 of 300
Sponsor: Robinson Case No. 15-00139-UT

Schedule Page: 110 Line No.: 52 Column: c
The balance is comprised of Texas Renewable Energy Credit Allowances of $4,158,647.
Schedule Page: 110 Line No.: 52 Column: d
The balance is comprised of Texas Renewable Energy Credit Allowances of $1,649,495.
Schedule Page: 110 Line No.: 57 Column: cSPS’ Prepayments (Account No. 165) balance at Dec. 31, 2014, includes $7,185,543 for income taxes. This balance waslargely driven by an overpayment for 2014 income taxes, which SPS expects will be settled in 2015 as the Xcel Energyextensions and tax returns are filed, and a reserve for the Internal Revenue Service audit which is currently pendingAppeals.
Name of Respondent
Southwestern Public Service Company
This Report is:(1) X An Original(2) A Resubmission
Date of Report(Mo, Da, Yr)
04/13/2015
Year/Period of Report
2014/Q4
FOOTNOTE DATA
FERC FORM NO. 1 (ED. 12-87) Page 450.1
33
Schedule Q-5 Page 33 of 300
Sponsor: Robinson Case No. 15-00139-UT

Year/Period of ReportName of Respondent This Report is:(1) An Original(2) A Resubmission
x
Date of Report(mo, da, yr)
end of
LineNo.
Title of Account(a)
Ref.Page No.
(b)
Current YearEnd of Quarter/Year
Balance(c)
Prior YearEnd Balance
12/31(d)
Southwestern Public Service Company04/13/2015 2014/Q4
COMPARATIVE BALANCE SHEET (LIABILITIES AND OTHER CREDITS)
PROPRIETARY CAPITAL 1
100100Common Stock Issued (201) 2 250-251
00Preferred Stock Issued (204) 3 250-251
00Capital Stock Subscribed (202, 205) 4
00Stock Liability for Conversion (203, 206) 5
1,014,495,9821,174,495,982Premium on Capital Stock (207) 6
00Other Paid-In Capital (208-211) 7 253
00Installments Received on Capital Stock (212) 8 252
00(Less) Discount on Capital Stock (213) 9 254
9,033,4359,033,435(Less) Capital Stock Expense (214) 10 254b
359,388,776395,997,589Retained Earnings (215, 215.1, 216) 11 118-119
00Unappropriated Undistributed Subsidiary Earnings (216.1) 12 118-119
00(Less) Reaquired Capital Stock (217) 13 250-251
00 Noncorporate Proprietorship (Non-major only) (218) 14
-1,160,703-988,781Accumulated Other Comprehensive Income (219) 15 122(a)(b)
1,363,690,7201,560,471,455Total Proprietary Capital (lines 2 through 15) 16
LONG-TERM DEBT 17
400,000,000550,000,000Bonds (221) 18 256-257
00(Less) Reaquired Bonds (222) 19 256-257
00Advances from Associated Companies (223) 20 256-257
800,000,000800,000,000Other Long-Term Debt (224) 21 256-257
9,754,5019,553,199Unamortized Premium on Long-Term Debt (225) 22
9,889,7259,862,610(Less) Unamortized Discount on Long-Term Debt-Debit (226) 23
1,199,864,7761,349,690,589Total Long-Term Debt (lines 18 through 23) 24
OTHER NONCURRENT LIABILITIES 25
00Obligations Under Capital Leases - Noncurrent (227) 26
00Accumulated Provision for Property Insurance (228.1) 27
438,050281,558Accumulated Provision for Injuries and Damages (228.2) 28
51,574,000101,189,000Accumulated Provision for Pensions and Benefits (228.3) 29
2,433,5561,153,776Accumulated Miscellaneous Operating Provisions (228.4) 30
05,352,890Accumulated Provision for Rate Refunds (229) 31
34,207,46230,642,736Long-Term Portion of Derivative Instrument Liabilities 32
00Long-Term Portion of Derivative Instrument Liabilities - Hedges 33
19,375,46326,030,921Asset Retirement Obligations (230) 34
108,028,531164,650,881Total Other Noncurrent Liabilities (lines 26 through 34) 35
CURRENT AND ACCRUED LIABILITIES 36
84,000,00037,000,000Notes Payable (231) 37
150,840,020163,839,495Accounts Payable (232) 38
38,000,00016,000,000Notes Payable to Associated Companies (233) 39
15,387,13519,790,289Accounts Payable to Associated Companies (234) 40
11,157,4609,855,516Customer Deposits (235) 41
22,765,49426,653,357Taxes Accrued (236) 42 262-263
16,865,81417,056,910Interest Accrued (237) 43
18,082,32027,827,975Dividends Declared (238) 44
00Matured Long-Term Debt (239) 45
FERC FORM NO. 1 (rev. 12-03) Page 112
34
Schedule Q-5 Page 34 of 300
Sponsor: Robinson Case No. 15-00139-UT

Year/Period of ReportName of Respondent This Report is:(1) An Original(2) A Resubmission
x
Date of Report(mo, da, yr)
end of
LineNo.
Title of Account(a)
Ref.Page No.
(b)
Current YearEnd of Quarter/Year
Balance(c)
Prior YearEnd Balance
12/31(d)
Southwestern Public Service Company04/13/2015 2014/Q4
(continued)COMPARATIVE BALANCE SHEET (LIABILITIES AND OTHER CREDITS)
00Matured Interest (240) 46
5,152,5074,663,504Tax Collections Payable (241) 47
49,326,73451,931,875Miscellaneous Current and Accrued Liabilities (242) 48
00Obligations Under Capital Leases-Current (243) 49
37,790,11934,207,462Derivative Instrument Liabilities (244) 50
34,207,46230,642,736(Less) Long-Term Portion of Derivative Instrument Liabilities 51
00Derivative Instrument Liabilities - Hedges (245) 52
00(Less) Long-Term Portion of Derivative Instrument Liabilities-Hedges 53
415,160,141378,183,647Total Current and Accrued Liabilities (lines 37 through 53) 54
DEFERRED CREDITS 55
31,1272,940Customer Advances for Construction (252) 56
1,108,540767,876Accumulated Deferred Investment Tax Credits (255) 57 266-267
00Deferred Gains from Disposition of Utility Plant (256) 58
5,019,7218,240,745Other Deferred Credits (253) 59 269
112,257,291134,804,684Other Regulatory Liabilities (254) 60 278
00Unamortized Gain on Reaquired Debt (257) 61
975,9891,662,999Accum. Deferred Income Taxes-Accel. Amort.(281) 62 272-277
777,583,248918,459,116Accum. Deferred Income Taxes-Other Property (282) 63
82,519,11085,876,699Accum. Deferred Income Taxes-Other (283) 64
979,495,0261,149,815,059Total Deferred Credits (lines 56 through 64) 65
4,066,239,1944,602,811,631TOTAL LIABILITIES AND STOCKHOLDER EQUITY (lines 16, 24, 35, 54 and 65) 66
FERC FORM NO. 1 (rev. 12-03) Page 113
35
Schedule Q-5 Page 35 of 300
Sponsor: Robinson Case No. 15-00139-UT

Name of Respondent This Report Is:(1) An Original(2) A Resubmission
Date of Report(Mo, Da, Yr)
Year/Period of Report
End of
STATEMENT OF INCOME
Southwestern Public Service CompanyX
04/13/20152014/Q4
Line
(c)(b)(a)Title of Account
No.
TotalCurrent Year to
Date Balance forQuarter/Year
(d)
(Ref.)Page No.
Quarterly1. Report in column (c) the current year to date balance. Column (c) equals the total of adding the data in column (g) plus the data in column (i) plus thedata in column (k). Report in column (d) similar data for the previous year. This information is reported in the annual filing only.2. Enter in column (e) the balance for the reporting quarter and in column (f) the balance for the same three month period for the prior year.3. Report in column (g) the quarter to date amounts for electric utility function; in column (i) the quarter to date amounts for gas utility, and in column (k)the quarter to date amounts for other utility function for the current year quarter.4. Report in column (h) the quarter to date amounts for electric utility function; in column (j) the quarter to date amounts for gas utility, and in column (l)the quarter to date amounts for other utility function for the prior year quarter.5. If additional columns are needed, place them in a footnote.
Annual or Quarterly if applicable5. Do not report fourth quarter data in columns (e) and (f)6. Report amounts for accounts 412 and 413, Revenues and Expenses from Utility Plant Leased to Others, in another utility columnin a similar manner toa utility department. Spread the amount(s) over lines 2 thru 26 as appropriate. Include these amounts in columns (c) and (d) totals.7. Report amounts in account 414, Other Utility Operating Income, in the same manner as accounts 412 and 413 above.
Current 3 MonthsEnded
Quarterly OnlyNo 4th Quarter
(e)
Prior 3 MonthsEnded
Quarterly OnlyNo 4th Quarter
(f)
TotalPrior Year to
Date Balance forQuarter/Year
UTILITY OPERATING INCOME 1
1,928,484,384 1,710,072,386300-301Operating Revenues (400) 2
Operating Expenses 3
1,402,372,891 1,278,972,950320-323Operation Expenses (401) 4
74,093,601 67,942,119320-323Maintenance Expenses (402) 5
114,493,394 107,840,835336-337Depreciation Expense (403) 6
-791,285 -927,831336-337Depreciation Expense for Asset Retirement Costs (403.1) 7
10,387,666 9,682,066336-337Amort. & Depl. of Utility Plant (404-405) 8
336-337Amort. of Utility Plant Acq. Adj. (406) 9
Amort. Property Losses, Unrecov Plant and Regulatory Study Costs (407) 10
Amort. of Conversion Expenses (407) 11
8,663,597 2,493,416Regulatory Debits (407.3) 12
361,631 133,907(Less) Regulatory Credits (407.4) 13
53,884,830 49,533,187262-263Taxes Other Than Income Taxes (408.1) 14
-57,693,429 8,671,653262-263Income Taxes - Federal (409.1) 15
2,722,867 3,624,956262-263 - Other (409.1) 16
231,390,850 152,120,665234, 272-277Provision for Deferred Income Taxes (410.1) 17
101,515,361 114,699,461234, 272-277(Less) Provision for Deferred Income Taxes-Cr. (411.1) 18
-340,664 -340,664266Investment Tax Credit Adj. - Net (411.4) 19
4,898,862(Less) Gains from Disp. of Utility Plant (411.6) 20
Losses from Disp. of Utility Plant (411.7) 21
604,655 429,606(Less) Gains from Disposition of Allowances (411.8) 22
2,176 448,307Losses from Disposition of Allowances (411.9) 23
1,099,746 1,007,789Accretion Expense (411.10) 24
1,737,804,593 1,560,907,612TOTAL Utility Operating Expenses (Enter Total of lines 4 thru 24) 25
190,679,791 149,164,774Net Util Oper Inc (Enter Tot line 2 less 25) Carry to Pg117,line 27 26
FERC FORM NO. 1/3-Q (REV. 02-04) Page 114
36
Schedule Q-5 Page 36 of 300
Sponsor: Robinson Case No. 15-00139-UT

Name of Respondent This Report Is:(1) An Original(2) A Resubmission
Date of Report(Mo, Da, Yr)
Year/Period of Report
End of
STATEMENT OF INCOME FOR THE YEAR (Continued)
Southwestern Public Service CompanyX
04/13/20152014/Q4
Line Previous Year to Date(in dollars)
(k)(j)(g)
ELECTRIC UTILITY
No.Current Year to Date
(in dollars)
OTHER UTILITY
(l)
GAS UTILITYPrevious Year to Date
(in dollars)Current Year to Date
(in dollars)Previous Year to Date
(in dollars)Current Year to Date
(in dollars)(h) (i)
9. Use page 122 for important notes regarding the statement of income for any account thereof.10. Give concise explanations concerning unsettled rate proceedings where a contingency exists such that refunds of a material amount may need to bemade to the utility's customers or which may result in material refund to the utility with respect to power or gas purchases. State for each year effectedthe gross revenues or costs to which the contingency relates and the tax effects together with an explanation of the major factors which affect the rightsof the utility to retain such revenues or recover amounts paid with respect to power or gas purchases.11 Give concise explanations concerning significant amounts of any refunds made or received during the year resulting from settlement of any rateproceeding affecting revenues received or costs incurred for power or gas purches, and a summary of the adjustments made to balance sheet, income,and expense accounts.12. If any notes appearing in the report to stokholders are applicable to the Statement of Income, such notes may be included at page 122.13. Enter on page 122 a concise explanation of only those changes in accounting methods made during the year which had an effect on net income,including the basis of allocations and apportionments from those used in the preceding year. Also, give the appropriate dollar effect of such changes.14. Explain in a footnote if the previous year's/quarter's figures are different from that reported in prior reports.15. If the columns are insufficient for reporting additional utility departments, supply the appropriate account titles report the information in a footnote tothis schedule.
1
1,928,484,384 1,710,072,386 2
3
1,402,372,891 1,278,972,950 4
74,093,601 67,942,119 5
114,493,394 107,840,835 6
-791,285 -927,831 7
10,387,666 9,682,066 8
9
10
11
8,663,597 2,493,416 12
361,631 133,907 13
53,884,830 49,533,187 14
-57,693,429 8,671,653 15
2,722,867 3,624,956 16
231,390,850 152,120,665 17
101,515,361 114,699,461 18
-340,664 -340,664 19
4,898,862 20
21
604,655 429,606 22
2,176 448,307 23
1,099,746 1,007,789 24
1,737,804,593 1,560,907,612 25
190,679,791 149,164,774 26
FERC FORM NO. 1 (ED. 12-96) Page 115
37
Schedule Q-5 Page 37 of 300
Sponsor: Robinson Case No. 15-00139-UT

Name of Respondent This Report Is:(1) An Original(2) A Resubmission
Date of Report(Mo, Da, Yr)
Year/Period of Report
End of
STATEMENT OF INCOME FOR THE YEAR (continued)
Southwestern Public Service CompanyX
04/13/20152014/Q4
Line
Previous Year(c)(b)(a)
Title of Account
No.
Current Year
TOTAL
(d)
(Ref.)Page No.
Current 3 MonthsEnded
Quarterly OnlyNo 4th Quarter
(e)
Prior 3 MonthsEnded
Quarterly OnlyNo 4th Quarter
(f)
190,679,791 149,164,774Net Utility Operating Income (Carried forward from page 114) 27
Other Income and Deductions 28
Other Income 29
Nonutilty Operating Income 30
Revenues From Merchandising, Jobbing and Contract Work (415) 31
(Less) Costs and Exp. of Merchandising, Job. & Contract Work (416) 32
241,909 272,510Revenues From Nonutility Operations (417) 33
134,769 150,286(Less) Expenses of Nonutility Operations (417.1) 34
Nonoperating Rental Income (418) 35
119Equity in Earnings of Subsidiary Companies (418.1) 36
191,472 593,697Interest and Dividend Income (419) 37
12,108,648 10,186,309Allowance for Other Funds Used During Construction (419.1) 38
193,128 8,981Miscellaneous Nonoperating Income (421) 39
3,603,887 13,660,815Gain on Disposition of Property (421.1) 40
16,204,275 24,572,026TOTAL Other Income (Enter Total of lines 31 thru 40) 41
Other Income Deductions 42
Loss on Disposition of Property (421.2) 43
Miscellaneous Amortization (425) 44
1,817,315 825,430 Donations (426.1) 45
-41,245 -55,094 Life Insurance (426.2) 46
-61,010 314,580 Penalties (426.3) 47
719,597 638,050 Exp. for Certain Civic, Political & Related Activities (426.4) 48
807,974 1,018,496 Other Deductions (426.5) 49
3,242,631 2,741,462TOTAL Other Income Deductions (Total of lines 43 thru 49) 50
Taxes Applic. to Other Income and Deductions 51
21,865 30,242262-263Taxes Other Than Income Taxes (408.2) 52
577,801 6,374,398262-263Income Taxes-Federal (409.2) 53
28,350 186,802262-263Income Taxes-Other (409.2) 54
4,813,640 102,111234, 272-277Provision for Deferred Inc. Taxes (410.2) 55
4,781,577 2,279,734234, 272-277(Less) Provision for Deferred Income Taxes-Cr. (411.2) 56
Investment Tax Credit Adj.-Net (411.5) 57
(Less) Investment Tax Credits (420) 58
660,079 4,413,819TOTAL Taxes on Other Income and Deductions (Total of lines 52-58) 59
12,301,565 17,416,745Net Other Income and Deductions (Total of lines 41, 50, 59) 60
Interest Charges 61
75,120,649 69,543,149Interest on Long-Term Debt (427) 62
1,090,735 937,639Amort. of Debt Disc. and Expense (428) 63
1,224,570 1,224,570Amortization of Loss on Reaquired Debt (428.1) 64
(Less) Amort. of Premium on Debt-Credit (429) 65
(Less) Amortization of Gain on Reaquired Debt-Credit (429.1) 66
73,221 177,897Interest on Debt to Assoc. Companies (430) 67
2,709,069 5,982,919Other Interest Expense (431) 68
7,089,201 6,461,274(Less) Allowance for Borrowed Funds Used During Construction-Cr. (432) 69
73,129,043 71,404,900Net Interest Charges (Total of lines 62 thru 69) 70
129,852,313 95,176,619Income Before Extraordinary Items (Total of lines 27, 60 and 70) 71
Extraordinary Items 72
Extraordinary Income (434) 73
(Less) Extraordinary Deductions (435) 74
Net Extraordinary Items (Total of line 73 less line 74) 75
262-263Income Taxes-Federal and Other (409.3) 76
Extraordinary Items After Taxes (line 75 less line 76) 77
129,852,313 95,176,619Net Income (Total of line 71 and 77) 78
FERC FORM NO. 1/3-Q (REV. 02-04) Page 117
38
Schedule Q-5 Page 38 of 300
Sponsor: Robinson Case No. 15-00139-UT

Schedule Page: 114 Line No.: 4 Column: c
Includes $12,350,000 of Demand Side Management program expenses.Schedule Page: 114 Line No.: 4 Column: d
Includes $12,420,000 of Demand Side Management program expenses.
Schedule Page: 114 Line No.: 12 Column: c
NM Lg Cust Cap Amortization $3,975,564 TX Restructure Recoverable Meter 34,898 NM DG Amortization 4,639,884 NM WREGIS Amortization 13,252
$8,663,598
Schedule Page: 114 Line No.: 12 Column: d
NM DRC Rider Amortization $2,403,308 TX Restructure Recoverable Meter 34,898 NM DG Amortization 40,814 NM WREGIS REC Amortization 14,396
$2,493,416
Schedule Page: 114 Line No.: 13 Column: c
ARO Reg Credits Electric ($307,682)Amortization of the Capital RL (53,949)
($361,631)
Schedule Page: 114 Line No.: 13 Column: d
ARO Reg Credits Electric ($79,958)Amortization of the Capital RL (53,949)
($133,907)
Schedule Page: 114 Line No.: 22 Column: c
Gain-Disposition of SO2 Allowances $380 SO2 Texas Retail Sharing (205)SO2 New Mexico Retail Sharing (71)Gain-Disposition of REC Allowances 604,551
$604,655
Schedule Page: 114 Line No.: 22 Column: d
Gain-Disposition of SO2 Allowances $251 SO2 Texas Retail Sharing (123)SO2 New Mexico Retail Sharing (42)Gain-Disposition of REC Allowances 429,520
$429,606
Schedule Page: 114 Line No.: 22 Column: g
Gain-Disposition of SO2 Allowances $380 SO2 Texas Retail Sharing (205)
Name of Respondent
Southwestern Public Service Company
This Report is:(1) X An Original(2) A Resubmission
Date of Report(Mo, Da, Yr)
04/13/2015
Year/Period of Report
2014/Q4
FOOTNOTE DATA
FERC FORM NO. 1 (ED. 12-87) Page 450.1
39
Schedule Q-5 Page 39 of 300
Sponsor: Robinson Case No. 15-00139-UT

SO2 New Mexico Retail Sharing (71)Gain-Disposition of REC Allowances 604,551
$604,655
Schedule Page: 114 Line No.: 22 Column: h
Gain-Disposition of SO2 Allowances $251 SO2 Texas Retail Sharing (123)SO2 New Mexico Retail Sharing (42)Gain-Disposition of REC Allowances 429,520
$429,606
Schedule Page: 114 Line No.: 23 Column: cLoss - Disposition REC Allowances Schedule Page: 114 Line No.: 23 Column: dLoss - Disposition REC Allowances Schedule Page: 114 Line No.: 40 Column: d
Amount NoteCash Proceeds (Account 131) $37,117,614 Net Plant Sold (Account 102) (7,663,616) See pages 204-207Reserve Adjustment on Assets to be Removed (Account 108) (1,930,762) See page 219Plant Adjustment on Assets to be Removed (Account 101) (1,675,830) See pages 204-207RWIP Costs to Relocate Autotransformers (Account 108) (695,500) See page 219RWIP Costs to Remove Transmission Assets (Account 108) (3,535,164) See page 219Legal/Transaction Costs Included Within RWIP (Account 108) (257,901) See page 219Other Legal/Transaction Costs (Accounts 921 and 566) (173,530) See pages 320-323Indemnification Costs (Account 232) (370,000)Net Pre-tax Gain Prior to Regulatory Sharing (Account 421.1) 20,815,311
Gain Shared with Texas Ratepayers (Account 254) (5,743,843) See page 278Gain Shared with New Mexico Ratepayers (Account 254) (1,410,653) See page 278Total Gain Shared with Ratepayers (7,154,496)
Net Pre-tax Gain Retained by SPS (Account 421.1) $13,660,815
In March 2013, SPS reached an agreement to sell certain segments of SPS' transmission lines and tworelated substations to Sharyland. In 2013, SPS received all necessary regulatory approvals for thetransaction. On Dec. 30, 2013, SPS received $37,117,614 and recognized a pre-tax gain of$13,660,815. The gain is reflected in the statement of income as a non-operating Gain onDisposition of Property (Account 421.1). Regulatory liabilities were recorded for jurisdictionalgain sharing of $7,154,496.
Schedule Page: 114 Line No.: 46 Column: c
Income on Company-owned life insurance
Schedule Page: 114 Line No.: 46 Column: d
Income on Company-owned life insurance
Schedule Page: 114 Line No.: 47 Column: cUnnatural balance due to a reduction to the provision for penalties.
Name of Respondent
Southwestern Public Service Company
This Report is:(1) X An Original(2) A Resubmission
Date of Report(Mo, Da, Yr)
04/13/2015
Year/Period of Report
2014/Q4
FOOTNOTE DATA
FERC FORM NO. 1 (ED. 12-87) Page 450.2
40
Schedule Q-5 Page 40 of 300
Sponsor: Robinson Case No. 15-00139-UT

Name of Respondent This Report Is:(1) An Original(2) A Resubmission
Date of Report(Mo, Da, Yr)
Year/Period of Report
End of
STATEMENT OF RETAINED EARNINGS
Southwestern Public Service CompanyX
04/13/20152014/Q4
Line
CurrentQuarter/YearYear to Date
Balance
(c)(b)(a)
ItemContra Primary
No.
Account Affected
1. Do not report Lines 49-53 on the quarterly version.2. Report all changes in appropriated retained earnings, unappropriated retained earnings, year to date, and unappropriatedundistributed subsidiary earnings for the year.3. Each credit and debit during the year should be identified as to the retained earnings account in which recorded (Accounts 433, 436- 439 inclusive). Show the contra primary account affected in column (b)4. State the purpose and amount of each reservation or appropriation of retained earnings.5. List first account 439, Adjustments to Retained Earnings, reflecting adjustments to the opening balance of retained earnings. Followby credit, then debit items in that order.6. Show dividends for each class and series of capital stock.7. Show separately the State and Federal income tax effect of items shown in account 439, Adjustments to Retained Earnings.8. Explain in a footnote the basis for determining the amount reserved or appropriated. If such reservation or appropriation is to berecurrent, state the number and annual amounts to be reserved or appropriated as well as the totals eventually to be accumulated.9. If any notes appearing in the report to stockholders are applicable to this statement, include them on pages 122-123.
PreviousQuarter/YearYear to Date
Balance
(d)
UNAPPROPRIATED RETAINED EARNINGS (Account 216) 335,100,554 359,388,776 1 Balance-Beginning of Period
2 Changes
3 Adjustments to Retained Earnings (Account 439)
4
5
6
7
8
9 TOTAL Credits to Retained Earnings (Acct. 439)
10
11
12
13
14
15 TOTAL Debits to Retained Earnings (Acct. 439) 95,176,621 129,852,313 16 Balance Transferred from Income (Account 433 less Account 418.1)
17 Appropriations of Retained Earnings (Acct. 436)
18
19
20
21
22 TOTAL Appropriations of Retained Earnings (Acct. 436)
23 Dividends Declared-Preferred Stock (Account 437)
24
25
26
27
28
29 TOTAL Dividends Declared-Preferred Stock (Acct. 437)
30 Dividends Declared-Common Stock (Account 438)( 70,888,399) -93,243,500 31 Dividends Declared-Common Stock (Account 438)
32
33
34
35( 70,888,399) -93,243,500 36 TOTAL Dividends Declared-Common Stock (Acct. 438)
37 Transfers from Acct 216.1, Unapprop. Undistrib. Subsidiary Earnings 359,388,776 395,997,589 38 Balance - End of Period (Total 1,9,15,16,22,29,36,37)
APPROPRIATED RETAINED EARNINGS (Account 215)
39
40
FERC FORM NO. 1/3-Q (REV. 02-04) Page 118
41
Schedule Q-5 Page 41 of 300
Sponsor: Robinson Case No. 15-00139-UT

Name of Respondent This Report Is:(1) An Original(2) A Resubmission
Date of Report(Mo, Da, Yr)
Year/Period of Report
End of
STATEMENT OF RETAINED EARNINGS
Southwestern Public Service CompanyX
04/13/20152014/Q4
Line
CurrentQuarter/YearYear to Date
Balance
(c)(b)(a)
ItemContra Primary
No.
Account Affected
1. Do not report Lines 49-53 on the quarterly version.2. Report all changes in appropriated retained earnings, unappropriated retained earnings, year to date, and unappropriatedundistributed subsidiary earnings for the year.3. Each credit and debit during the year should be identified as to the retained earnings account in which recorded (Accounts 433, 436- 439 inclusive). Show the contra primary account affected in column (b)4. State the purpose and amount of each reservation or appropriation of retained earnings.5. List first account 439, Adjustments to Retained Earnings, reflecting adjustments to the opening balance of retained earnings. Followby credit, then debit items in that order.6. Show dividends for each class and series of capital stock.7. Show separately the State and Federal income tax effect of items shown in account 439, Adjustments to Retained Earnings.8. Explain in a footnote the basis for determining the amount reserved or appropriated. If such reservation or appropriation is to berecurrent, state the number and annual amounts to be reserved or appropriated as well as the totals eventually to be accumulated.9. If any notes appearing in the report to stockholders are applicable to this statement, include them on pages 122-123.
PreviousQuarter/YearYear to Date
Balance
(d)
41
42
43
44
45 TOTAL Appropriated Retained Earnings (Account 215)
APPROP. RETAINED EARNINGS - AMORT. Reserve, Federal (Account 215.1)
46 TOTAL Approp. Retained Earnings-Amort. Reserve, Federal (Acct. 215.1)
47 TOTAL Approp. Retained Earnings (Acct. 215, 215.1) (Total 45,46) 359,388,776 395,997,589 48 TOTAL Retained Earnings (Acct. 215, 215.1, 216) (Total 38, 47) (216.1)
UNAPPROPRIATED UNDISTRIBUTED SUBSIDIARY EARNINGS (Account
Report only on an Annual Basis, no Quarterly
49 Balance-Beginning of Year (Debit or Credit)
50 Equity in Earnings for Year (Credit) (Account 418.1)
51 (Less) Dividends Received (Debit)
52
53 Balance-End of Year (Total lines 49 thru 52)
FERC FORM NO. 1/3-Q (REV. 02-04) Page 119
42
Schedule Q-5 Page 42 of 300
Sponsor: Robinson Case No. 15-00139-UT

(1) Codes to be used:(a) Net Proceeds or Payments;(b)Bonds, debentures and other long-term debt; (c) Include commercial paper; and (d) Identify separately such items asinvestments, fixed assets, intangibles, etc.(2) Information about noncash investing and financing activities must be provided in the Notes to the Financial statements. Also provide a reconciliation between "Cash and CashEquivalents at End of Period" with related amounts on the Balance Sheet.(3) Operating Activities - Other: Include gains and losses pertaining to operating activities only. Gains and losses pertaining to investing and financing activities should be reportedin those activities. Show in the Notes to the Financials the amounts of interest paid (net of amount capitalized) and income taxes paid.(4) Investing Activities: Include at Other (line 31) net cash outflow to acquire other companies. Provide a reconciliation of assets acquired with liabilities assumed in the Notes tothe Financial Statements. Do not include on this statement the dollar amount of leases capitalized per the USofA General Instruction 20; instead provide a reconciliation of thedollar amount of leases capitalized with the plant cost.
Name of Respondent This Report Is:(1) An Original(2) A Resubmission
Date of Report(Mo, Da, Yr)
Year/Period of Report
End of
STATEMENT OF CASH FLOWS
Southwestern Public Service CompanyX
04/13/20152014/Q4
Line Description (See Instruction No. 1 for Explanation of Codes) Current Year to DateQuarter/Year
(b)(a)No.
Previous Year to DateQuarter/Year
(c) 1 Net Cash Flow from Operating Activities:
95,176,619 129,852,313 2 Net Income (Line 78(c) on page 117)
3 Noncash Charges (Credits) to Income:
107,963,418 114,856,940 4 Depreciation and Depletion
2,162,209 2,315,304 5 Amortization of Premium, Discount and Debt Expense
4,032,855 9,975,312 6 Amortization of Regulatory Assets and Liabilities
9,682,066 10,431,625 7 Amortization of Software and Others
35,243,581 129,907,552 8 Deferred Income Taxes (Net)
-340,664 -340,664 9 Investment Tax Credit Adjustment (Net)
-30,147,702 8,062,336 10 Net (Increase) Decrease in Receivables
-5,793,328 -3,585,100 11 Net (Increase) Decrease in Inventory
-1,649,495 -2,509,152 12 Net (Increase) Decrease in Allowances Inventory
27,590,562 12,400,554 13 Net Increase (Decrease) in Payables and Accrued Expenses
15,363,287 -5,509,513 14 Net (Increase) Decrease in Other Regulatory Assets
-8,885,811 6,879,480 15 Net Increase (Decrease) in Other Regulatory Liabilities
10,186,309 12,118,203 16 (Less) Allowance for Other Funds Used During Construction
17 (Less) Undistributed Earnings from Subsidiary Companies
-10,315,081 -20,080,407 18 Change in Accrued Utility Revenues
43,994,466 -2,987,645 19 Change in Other Current Assets and Liabilities
-13,392,666 268,149 20 Net Gains and Losses
-22,859,964 8,958,587 21 Change in Other Noncurrent Liabilities and Deferred Amounts
237,638,043 386,777,468 22 Net Cash Provided by (Used in) Operating Activities (Total 2 thru 21)
23
24 Cash Flows from Investment Activities:
25 Construction and Acquisition of Plant (including land):
-584,735,846 -554,936,347 26 Gross Additions to Utility Plant (less nuclear fuel)
27 Gross Additions to Nuclear Fuel
28 Gross Additions to Common Utility Plant
29 Gross Additions to Nonutility Plant
-10,186,309 -12,118,203 30 (Less) Allowance for Other Funds Used During Construction
31 Other (provide details in footnote):
32
33
-574,549,537 -542,818,144 34 Cash Outflows for Plant (Total of lines 26 thru 33)
35
36 Acquisition of Other Noncurrent Assets (d)
37 Proceeds from Disposal of Noncurrent Assets (d)
38
39 Investments in and Advances to Assoc. and Subsidiary Companies
40 Contributions and Advances from Assoc. and Subsidiary Companies
41 Disposition of Investments in (and Advances to)
42 Associated and Subsidiary Companies
43
44 Purchase of Investment Securities (a)
45 Proceeds from Sales of Investment Securities (a)
FERC FORM NO. 1 (ED. 12-96) Page 120
43
Schedule Q-5 Page 43 of 300
Sponsor: Robinson Case No. 15-00139-UT

(1) Codes to be used:(a) Net Proceeds or Payments;(b)Bonds, debentures and other long-term debt; (c) Include commercial paper; and (d) Identify separately such items asinvestments, fixed assets, intangibles, etc.(2) Information about noncash investing and financing activities must be provided in the Notes to the Financial statements. Also provide a reconciliation between "Cash and CashEquivalents at End of Period" with related amounts on the Balance Sheet.(3) Operating Activities - Other: Include gains and losses pertaining to operating activities only. Gains and losses pertaining to investing and financing activities should be reportedin those activities. Show in the Notes to the Financials the amounts of interest paid (net of amount capitalized) and income taxes paid.(4) Investing Activities: Include at Other (line 31) net cash outflow to acquire other companies. Provide a reconciliation of assets acquired with liabilities assumed in the Notes tothe Financial Statements. Do not include on this statement the dollar amount of leases capitalized per the USofA General Instruction 20; instead provide a reconciliation of thedollar amount of leases capitalized with the plant cost.
Name of Respondent This Report Is:(1) An Original(2) A Resubmission
Date of Report(Mo, Da, Yr)
Year/Period of Report
End of
STATEMENT OF CASH FLOWS
Southwestern Public Service CompanyX
04/13/20152014/Q4
Line Description (See Instruction No. 1 for Explanation of Codes) Current Year to DateQuarter/Year
(b)(a)No.
Previous Year to DateQuarter/Year
(c) 46 Loans Made or Purchased
47 Collections on Loans
37,117,614 48 Proceeds from Sale of Transmission Assets
49 Net (Increase) Decrease in Receivables
50 Net (Increase ) Decrease in Inventory
51 Net (Increase) Decrease in Allowances Held for Speculation
52 Net Increase (Decrease) in Payables and Accrued Expenses
53 Other (provide details in footnote):
-12,000,000 -105,000,000 54 Investment in Utility Money Pool
12,000,000 105,000,000 55 Repayments from Money Pool
56 Net Cash Provided by (Used in) Investing Activities
-537,431,923 -542,818,144 57 Total of lines 34 thru 55)
58
59 Cash Flows from Financing Activities:
60 Proceeds from Issuance of:
94,625,509 148,123,356 61 Long-Term Debt (b)
62 Preferred Stock
63 Common Stock
162,276,538 160,000,000 64 Capital Contributions from Parent
767,000,000 458,000,000 65 Borrowings Under Utility Money Pool
66 Net Increase in Short-Term Debt (c)
67 Other (provide details in footnote):
68
69
1,023,902,047 766,123,356 70 Cash Provided by Outside Sources (Total 61 thru 69)
71
72 Payments for Retirement of:
73 Long-term Debt (b)
74 Preferred Stock
75 Common Stock
-729,000,000 -480,000,000 76 Repayments Under Utility Money Pool
77
75,000,000 -47,000,000 78 Net Decrease in Short-Term Debt (c)
79
80 Dividends on Preferred Stock
-69,578,882 -83,497,845 81 Dividends on Common Stock
82 Net Cash Provided by (Used in) Financing Activities
300,323,165 155,625,511 83 (Total of lines 70 thru 81)
84
85 Net Increase (Decrease) in Cash and Cash Equivalents
529,285 -415,165 86 (Total of lines 22,57 and 83)
87
482,069 1,011,354 88 Cash and Cash Equivalents at Beginning of Period
89
1,011,354 596,189 90 Cash and Cash Equivalents at End of period
FERC FORM NO. 1 (ED. 12-96) Page 121
44
Schedule Q-5 Page 44 of 300
Sponsor: Robinson Case No. 15-00139-UT

Schedule Page: 120 Line No.: 6 Column: b
Schedule Page: 120 Line No.: 6 Column: c
Schedule Page: 120 Line No.: 10 Column: bIncludes provision for bad debts of $4,136,560. Schedule Page: 120 Line No.: 10 Column: c Includes provision for bad debts of $3,436,961. Schedule Page: 120 Line No.: 20 Column: bDerivatives were $268,149. Schedule Page: 120 Line No.: 20 Column: c
Schedule Page: 120 Line No.: 21 Column: b
Schedule Page: 120 Line No.: 21 Column: c
Schedule Page: 120 Line No.: 90 Column: b
Schedule Page: 120 Line No.: 90 Column: c
Name of Respondent
Southwestern Public Service Company
This Report is:(1) X An Original(2) A Resubmission
Date of Report(Mo, Da, Yr)
04/13/2015
Year/Period of Report
2014/Q4
FOOTNOTE DATA
FERC FORM NO. 1 (ED. 12-87) Page 450.1
45
Schedule Q-5 Page 45 of 300
Sponsor: Robinson Case No. 15-00139-UT

Name of Respondent This Report Is:(1) An Original(2) A Resubmission
Date of Report Year/Period of ReportEnd of
NOTES TO FINANCIAL STATEMENTS
Southwestern Public Service Company X04/13/2015 2014/Q4
PAGE 122 INTENTIONALLY LEFT BLANKSEE PAGE 123 FOR REQUIRED INFORMATION.
1. Use the space below for important notes regarding the Balance Sheet, Statement of Income for the year, Statement of RetainedEarnings for the year, and Statement of Cash Flows, or any account thereof. Classify the notes according to each basic statement,providing a subheading for each statement except where a note is applicable to more than one statement.2. Furnish particulars (details) as to any significant contingent assets or liabilities existing at end of year, including a brief explanation ofany action initiated by the Internal Revenue Service involving possible assessment of additional income taxes of material amount, or ofa claim for refund of income taxes of a material amount initiated by the utility. Give also a brief explanation of any dividends in arrearson cumulative preferred stock.3. For Account 116, Utility Plant Adjustments, explain the origin of such amount, debits and credits during the year, and plan ofdisposition contemplated, giving references to Cormmission orders or other authorizations respecting classification of amounts as plantadjustments and requirements as to disposition thereof.4. Where Accounts 189, Unamortized Loss on Reacquired Debt, and 257, Unamortized Gain on Reacquired Debt, are not used, givean explanation, providing the rate treatment given these items. See General Instruction 17 of the Uniform System of Accounts.5. Give a concise explanation of any retained earnings restrictions and state the amount of retained earnings affected by suchrestrictions.6. If the notes to financial statements relating to the respondent company appearing in the annual report to the stockholders areapplicable and furnish the data required by instructions above and on pages 114-121, such notes may be included herein.7. For the 3Q disclosures, respondent must provide in the notes sufficient disclosures so as to make the interim information notmisleading. Disclosures which would substantially duplicate the disclosures contained in the most recent FERC Annual Report may beomitted.8. For the 3Q disclosures, the disclosures shall be provided where events subsequent to the end of the most recent year have occurredwhich have a material effect on the respondent. Respondent must include in the notes significant changes since the most recentlycompleted year in such items as: accounting principles and practices; estimates inherent in the preparation of the financial statements;status of long-term contracts; capitalization including significant new borrowings or modifications of existing financing agreements; andchanges resulting from business combinations or dispositions. However were material contingencies exist, the disclosure of suchmatters shall be provided even though a significant change since year end may not have occurred.9. Finally, if the notes to the financial statements relating to the respondent appearing in the annual report to the stockholders areapplicable and furnish the data required by the above instructions, such notes may be included herein.
FERC FORM NO. 1 (ED. 12-96) Page 122
46
Schedule Q-5 Page 46 of 300
Sponsor: Robinson Case No. 15-00139-UT

1. Summary of Significant Accounting Policies
Business and System of Accounts — Southwestern Public Service Company (SPS) is principally engaged in the regulated generation,purchase, transmission, distribution and sale of electricity. SPS is subject to regulation by the Federal Energy Regulatory Commission(FERC) and state utility commissions.
Basis of Accounting — The accompanying financial statements were prepared in accordance with the accounting requirements of theFERC as set forth in the Uniform System of Accounts and published accounting releases, which is a comprehensive basis ofaccounting other than Generally Accepted Accounting Principles (GAAP). The following areas represent the significant differencesbetween the Uniform System of Accounts and GAAP:
• Current maturities of long-term debt are included as long-term debt, while GAAP requires such maturities to be classified ascurrent liabilities.
• Accumulated deferred income taxes are shown as long-term assets and liabilities at their gross amounts in the FERCpresentation, in contrast to the GAAP presentation as net current and long-term assets and liabilities.
• Regulatory assets and liabilities are classified as current and noncurrent for GAAP presentation, while FERC requires allregulatory assets and liabilities to be classified as noncurrent deferred debits.
• Unrecognized tax benefits are recorded for temporary adjustments in accounts established for accumulated deferred incometaxes in the FERC presentation, in contrast to its GAAP presentation as taxes accrued and noncurrent other liabilities.
• Removal costs for future removal obligations are classified as accumulated depreciation within the utility plant accounts in theFERC presentation and regulatory liabilities in the GAAP presentation.
• Certain commodity trading purchases and sales transactions are presented gross as expenses and revenues for FERCpresentation; however the net margin is reported as net sales for GAAP presentation.
• Various expenses such as donations, lobbying, and other non-regulatory expenses are presented as other income anddeductions for FERC presentation and reported as operating expenses for GAAP presentation.
• Income tax expense related to utility operations is shown as a component of utility operating expenses in the FERCpresentation, in contrast to its GAAP presentation as a below-the-line deduction from operating income.
• For certain capital projects where there is recovery of a return on construction work in progress (CWIP), certain amounts ofallowance for funds used during construction (AFUDC) are not recognized in CWIP for GAAP. While for FERCpresentation, they are recorded in CWIP but the benefit is deferred as a liability and amortized over the life of the property asa reduction of costs.
Name of Respondent
Southwestern Public Service Company
This Report is:(1) X An Original(2) A Resubmission
Date of Report(Mo, Da, Yr)
04/13/2015
Year/Period of Report
2014/Q4
NOTES TO FINANCIAL STATEMENTS (Continued)
FERC FORM NO. 1 (ED. 12-88) Page 123.1
47
Schedule Q-5 Page 47 of 300
Sponsor: Robinson Case No. 15-00139-UT

If GAAP were followed, these financial statement line items would have values greater/(lesser) than those shown by FERCpresentation of:
Use of Estimates — In recording transactions and balances resulting from business operations, SPS uses estimates based on the bestinformation available. Estimates are used for such items as plant depreciable lives or potential disallowances, asset retirementobligations (AROs), certain regulatory assets and liabilities, tax provisions, uncollectible amounts, environmental costs, unbilledrevenues, jurisdictional fuel and energy cost allocations and actuarially determined benefit costs. The recorded estimates are revisedwhen better information becomes available or when actual amounts can be determined. Those revisions can affect operating results.
Regulatory Accounting — SPS accounts for certain income and expense items in accordance with accounting guidance for regulatedoperations. Under this guidance:
• Certain costs, which would otherwise be charged to expense or other comprehensive income (OCI), are deferred as regulatoryassets based on the expected ability to recover the costs in future rates; and
• Certain credits, which would otherwise be reflected as income, are deferred as regulatory liabilities based on the expectationthe amounts will be returned to customers in future rates, or because the amounts were collected in rates prior to the costsbeing incurred.
Estimates of recovering deferred costs and returning deferred credits are based on specific ratemaking decisions or precedent for eachitem. Regulatory assets and liabilities are amortized consistent with the treatment in the rate setting process.
If restructuring or other changes in the regulatory environment occur, SPS may no longer be eligible to apply this accounting treatment,and may be required to eliminate regulatory assets and liabilities from its balance sheet. Such changes could have a material effect onSPS’ financial condition, results of operations and cash flows. See Note 9 for further discussion of regulatory assets and liabilities.
Revenue Recognition — Revenues related to the sale of energy are generally recorded when service is rendered or energy is deliveredto customers. However, the determination of the energy sales to individual customers is based on the reading of their meter, whichoccurs on a systematic basis throughout the month. At the end of each month, amounts of energy delivered to customers since the dateof the last meter reading are estimated and the corresponding unbilled revenue is recognized. SPS presents its revenues net of anyexcise or other fiduciary-type taxes or fees.
SPS participates in Southwest Power Pool, Inc. (SPP). The revenues and charges for energy transacted through SPP are recordedbased upon our evaluation ever 15 minutes as to whether we are a net seller or a net buyer based upon the total volumes. The real timeand day-ahead market are each evaluated separately. If SPS is a net seller, the transactions are recorded on a net basis in electricrevenues. If SPS is a net buyer, the transaction is recorded on a net basis in cost of sales.
Name of Respondent
Southwestern Public Service Company
This Report is:(1) X An Original(2) A Resubmission
Date of Report(Mo, Da, Yr)
04/13/2015
Year/Period of Report
2014/Q4
NOTES TO FINANCIAL STATEMENTS (Continued)
FERC FORM NO. 1 (ED. 12-88) Page 123.2
48
Schedule Q-5 Page 48 of 300
Sponsor: Robinson Case No. 15-00139-UT

SPS has various rate-adjustment mechanisms in place that provide for the recovery of electric fuel costs and purchased energy costs. These cost-adjustment tariffs may increase or decrease the level of revenue collected from customers and are revised periodically fordifferences between the total amount collected under the clauses and the costs incurred. When applicable, under governing regulatorycommission rate orders, fuel cost over-recoveries (the excess of fuel revenue billed to customers over fuel costs incurred) are deferredas regulatory liabilities and under-recoveries (the excess of fuel costs incurred over fuel revenues billed to customers) are deferred asregulatory assets.
Conservation Programs — SPS has implemented programs in its jurisdictions to assist customers in conserving energy and reducingpeak demand on the electric system. These programs include commercial motor, air conditioner and lighting upgrades, as well asresidential rebates for participation in air conditioner interruption and home weatherization.
The costs incurred for some demand side management (DSM) programs are deferred as permitted by the applicable regulatoryjurisdiction. For those programs, costs are deferred if it is probable future revenue will be provided to permit recovery of the incurredcost. Recorded revenues for incentive programs designed for recovery of lost margins and/or conservation performance incentives arelimited to amounts expected to be collected within 24 months from the annual period in which they are earned. SPS recovers approvedconservation program costs in base rate revenue or through a rider.
Property, Plant and Equipment and Depreciation — Property, plant and equipment is stated at original cost. The cost of plantincludes direct labor and materials, contracted work, overhead costs and applicable interest expense. The cost of plant retired ischarged to accumulated depreciation and amortization. Significant additions or improvements extending asset lives are capitalized,while repairs and maintenance costs are charged to expense as incurred. Maintenance and replacement of items determined to be lessthan a unit of property are charged to operating expenses as incurred. Planned major maintenance activities are charged to operatingexpense unless the cost represents the acquisition of an additional unit of property or the replacement of an existing unit of property. Property, plant and equipment also includes costs associated with property held for future use. The depreciable lives of certain plantassets are reviewed annually and revised, if appropriate. Property, plant and equipment that is required to be decommissioned early bya regulator is reclassified as plant to be retired.
Property, plant and equipment is tested for impairment when it is determined that the carrying value of the assets may not berecoverable. A loss is recognized in the current period if it becomes probable that part of a cost of a plant under construction orrecently completed plant will be disallowed for recovery from customers and a reasonable estimate of the disallowance can be made. For investments in property, plant and equipment that are abandoned and not expected to go into service, incurred costs and relateddeferred tax amounts are compared to the discounted estimated future rate recovery, and a loss is recognized, if necessary.
SPS records depreciation expense related to its plant using the straight-line method over the plant’s useful life. Actuarial life studiesare performed and submitted to the state and federal commissions for review. Upon acceptance by the various commissions, theresulting lives and net salvage rates are used to calculate depreciation. Depreciation expense, expressed as a percentage of averagedepreciable property, was 2.5 and 2.6 percent for the years ended Dec. 31, 2014 and 2013, respectively.
Leases — SPS evaluates a variety of contracts for lease classification at inception, including PPAs and rental arrangements for officespace, vehicles, and equipment. Contracts determined to contain a lease because of per unit pricing that is other than fixed or marketprice, terms regarding the use of a particular asset, and other factors are evaluated further to determine if the arrangement is a capitallease. See Note 8 for further discussion of leases.
AFUDC — AFUDC represents the cost of capital used to finance utility construction activity. AFUDC is computed by applying acomposite financing rate to qualified construction work in progress (CWIP). The amount of AFUDC capitalized as a utilityconstruction cost is credited to other nonoperating income (for equity capital) and interest charges (for debt capital). AFUDC amountscapitalized are included in SPS’ rate base for establishing utility service rates.
Name of Respondent
Southwestern Public Service Company
This Report is:(1) X An Original(2) A Resubmission
Date of Report(Mo, Da, Yr)
04/13/2015
Year/Period of Report
2014/Q4
NOTES TO FINANCIAL STATEMENTS (Continued)
FERC FORM NO. 1 (ED. 12-88) Page 123.3
49
Schedule Q-5 Page 49 of 300
Sponsor: Robinson Case No. 15-00139-UT

AROs — SPS accounts for AROs under accounting guidance that requires a liability for the fair value of an ARO to be recognized inthe period in which it is incurred if it can be reasonably estimated, with the offsetting associated asset retirement costs capitalized as along-lived asset. The liability is generally increased over time by applying the effective interest method of accretion, and thecapitalized costs are depreciated over the useful life of the long-lived asset. Changes resulting from revisions to the timing or amountof expected asset retirement cash flows are recognized as an increase or a decrease in the ARO. SPS also recovers through ratescertain future plant removal costs in addition to AROs. The recording of the obligation for regulated operations has no incomestatement impact due to the deferral of the amounts through the establishment of a regulatory asset and recovery in rates. See Note 8for further discussion of AROs.
Income Taxes — SPS accounts for income taxes using the asset and liability method, which requires the recognition of deferred taxassets and liabilities for the expected future tax consequences of events that have been included in the financial statements. SPS defersincome taxes for all temporary differences between pretax financial and taxable income, and between the book and tax bases of assetsand liabilities. SPS uses the tax rates that are scheduled to be in effect when the temporary differences are expected to reverse. Theeffect of a change in tax rates on deferred tax assets and liabilities is recognized in income in the period that includes the enactmentdate.
Deferred tax assets are reduced by a valuation allowance if it is more likely than not that some portion or all of the deferred tax assetwill not be realized. In making such a determination, all available evidence is considered, including scheduled reversals of deferredtax liabilities, projected future taxable income, tax planning strategies and recent financial operations.
Due to the effects of past regulatory practices, when deferred taxes were not required to be recorded due to the use of flow throughaccounting for rate making purposes, the reversal of some temporary differences are accounted for as current income tax expense. Investment tax credits are deferred and their benefits amortized over the book depreciable lives of the related property. Utility rateregulation also has resulted in the recognition of certain regulatory assets and liabilities related to income taxes, which are summarizedin Note 9.
SPS follows the applicable accounting guidance to measure and disclose uncertain tax positions that it has taken or expects to take inits income tax returns. SPS recognizes a tax position in its financial statements when it is more likely than not that the position will besustained upon examination based on the technical merits of the position. Recognition of changes in uncertain tax positions arereflected as a component of income tax.
Interest and penalties are recorded separately to their respective line items in the income statement.
Xcel Energy Inc. and its subsidiaries, including SPS, file consolidated federal income tax returns as well as combined or separate stateincome tax returns. Federal income taxes paid by Xcel Energy Inc. are allocated to Xcel Energy Inc.’s subsidiaries based on separatecompany computations of tax. A similar allocation is made for state income taxes paid by Xcel Energy Inc. in connection withcombined state filings. Xcel Energy Inc. also allocates its own income tax benefits to its direct subsidiaries which are recorded directlyin equity by the subsidiaries based on the relative positive tax liabilities of the subsidiaries.
See Note 4 for further discussion of income taxes.
Types of and Accounting for Derivative Instruments — SPS uses derivative instruments in connection with its utility commodityprice and interest rate activities, including forward contracts, futures, swaps and options. All derivative instruments not designated andqualifying for the normal purchases and normal sales exception, as defined by the accounting guidance for derivatives and hedging, arerecorded on the balance sheets at fair value as derivative instruments. This includes certain instruments used to mitigate market riskfor the utility operations including transmission in organized markets. The classification of changes in fair value for those derivativeinstruments is dependent on the designation of a qualifying hedging relationship. Changes in fair value of derivative instruments notdesignated in a qualifying hedging relationship are reflected in current earnings or as a regulatory asset or liability. The classificationas a regulatory asset or liability is based on expected recovery of derivative instrument settlements through fuel and purchased energycost recovery mechanisms.
Interest rate hedging transactions are recorded as a component of interest expense. For further information on derivatives entered tomitigate market risk associated with transmission in organized markets, see Note 6.
Name of Respondent
Southwestern Public Service Company
This Report is:(1) X An Original(2) A Resubmission
Date of Report(Mo, Da, Yr)
04/13/2015
Year/Period of Report
2014/Q4
NOTES TO FINANCIAL STATEMENTS (Continued)
FERC FORM NO. 1 (ED. 12-88) Page 123.4
50
Schedule Q-5 Page 50 of 300
Sponsor: Robinson Case No. 15-00139-UT
Cash Flow Hedges — Certain qualifying hedging relationships are designated as a hedge of a forecasted transaction or future cashflow (cash flow hedge). Changes in the fair value of a derivative designated as a cash flow hedge, to the extent effective, are includedin OCI, or deferred as a regulatory asset or liability based on recovery mechanisms until earnings are affected by the hedgedtransaction.
Normal Purchases and Normal Sales — SPS enters into contracts for the purchase and sale of commodities for use in its businessoperations. Derivatives and hedging accounting guidance requires a company to evaluate these contracts to determine whether thecontracts are derivatives. Certain contracts that meet the definition of a derivative may be exempted from derivative accounting ifdesignated as normal purchases or normal sales.
SPS evaluates all of its contracts at inception to determine if they are derivatives and if they meet the normal purchases and normalsales designation requirements. None of the contracts entered into within the commodity trading operations qualify for a normalpurchases and normal sales designation.
See Note 6 for further discussion of SPS’ risk management and derivative activities.
Commodity Trading Operations — Pursuant to the joint operating agreement (JOA) approved by the FERC, some of the commoditytrading margins from SPS are apportioned to Northern States Power Company, a Minnesota corporation (NSP-Minnesota) and PublicService Company of Colorado (PSCo). Commodity trading activities are not associated with energy produced from SPS’ generationassets or energy and capacity purchased to serve native load. Commodity trading contracts are recorded at fair market value andcommodity trading results include the impact of all margin-sharing mechanisms. See Note 6 for further discussion.
Fair Value Measurements — SPS presents cash equivalents, interest rate derivatives and commodity derivatives at estimated fairvalues in its financial statements. Cash equivalents are recorded at cost plus accrued interest; money market funds are measured usingquoted net asset values. For interest rate derivatives, quoted prices based primarily on observable market interest rate curves are usedas a primary input to establish fair value. For commodity derivatives, the most observable inputs available are generally used todetermine the fair value of each contract. In the absence of a quoted price for an identical contract in an active market, SPS may usequoted prices for similar contracts or internally prepared valuation models to determine fair value. See Note 6 for further discussion.
Cash and Cash Equivalents — SPS considers investments in certain instruments, including commercial paper and money marketfunds, with a remaining maturity of three months or less at the time of purchase, to be cash equivalents.
Accounts Receivable and Allowance for Bad Debts — Accounts receivable are stated at the actual billed amount net of an allowancefor bad debts. SPS establishes an allowance for uncollectible receivables based on a policy that reflects its expected exposure to thecredit risk of customers.
Inventory — All inventory is recorded at average cost.
Renewable Energy Credits (RECs) — RECs are marketable environmental instruments that represent proof that energy was generatedfrom eligible renewable energy sources. RECs are awarded upon delivery of the associated energy and can be bought and sold. RECsare typically used as a form of measurement of compliance to renewable portfolio standards (RPS) enacted by those states that areencouraging construction and consumption from renewable energy sources, but can also be sold separately from the energy produced. SPS acquires RECs from the generation or purchase of renewable power.
When RECs are purchased or acquired in the course of generation they are recorded as inventory at cost. The cost of RECs that areutilized for compliance purposes is recorded as electric fuel and purchased power expense. As a result of certain state regulatoryorders, SPS reduces recoverable fuel costs for the cost of certain RECs and records that cost as a regulatory asset when the amount isrecoverable in future rates. Sales of RECs that are purchased or acquired in the course of generation are recorded in electric utilityoperating revenues on a gross basis. The cost of these RECs, related transaction costs, and amounts credited to customers undermargin-sharing mechanisms are recorded in electric fuel and purchased power expense.
Name of Respondent
Southwestern Public Service Company
This Report is:(1) X An Original(2) A Resubmission
Date of Report(Mo, Da, Yr)
04/13/2015
Year/Period of Report
2014/Q4
NOTES TO FINANCIAL STATEMENTS (Continued)
FERC FORM NO. 1 (ED. 12-88) Page 123.5
51
Schedule Q-5 Page 51 of 300
Sponsor: Robinson Case No. 15-00139-UT

Emission Allowances — Emission allowances, including the annual sulfur dioxide (SO2) and nitrogen oxide ( NOx) emission
allowance entitlement received from the United States Environmental Protection Agency (EPA), are recorded at cost plus associatedbroker commission fees. SPS follows the inventory accounting model for all emission allowances. Sales of emission allowances areincluded in electric utility operating revenues and the operating activities section of the statements of cash flows.
Environmental Costs — Environmental costs are recorded when it is probable SPS is liable for remediation costs and the liability canbe reasonably estimated. Costs are deferred as a regulatory asset if it is probable that the costs will be recovered from customers infuture rates. Otherwise, the costs are expensed. If an environmental expense is related to facilities currently in use, such asemission-control equipment, the cost is capitalized and depreciated over the life of the plant.
Estimated remediation costs, excluding inflationary increases, are recorded. The estimates are based on experience, an assessment ofthe current situation and the technology currently available for use in the remediation. The recorded costs are regularly adjusted asestimates are revised and remediation proceeds. If other participating potentially responsible parties (PRPs) exist and acknowledgetheir potential involvement with a site, costs are estimated and recorded only for SPS’ expected share of the cost. Any future costs ofrestoring sites where operation may extend indefinitely are treated as a capitalized cost of plant retirement. The depreciation expenselevels recoverable in rates include a provision for removal expenses, which may include final remediation costs.
See Note 8 for further discussion of environmental costs.
Benefit Plans and Other Postretirement Benefits — SPS maintains pension and postretirement benefit plans for eligible employees. Recognizing the cost of providing benefits and measuring the projected benefit obligation of these plans under applicable accountingguidance requires management to make various assumptions and estimates.
Based on regulatory recovery mechanisms, certain unrecognized actuarial gains and losses and unrecognized prior service costs orcredits are recorded as regulatory assets and liabilities, rather than OCI.
See Note 5 for further discussion of benefit plans and other postretirement benefits.
Guarantees — SPS recognizes, upon issuance or modification of a guarantee, a liability for the fair market value of the obligation thathas been assumed in issuing the guarantee. This liability includes consideration of specific triggering events and other conditionswhich may modify the ongoing obligation to perform under the guarantee.
The obligation recognized is reduced over the term of the guarantee as SPS is released from risk under the guarantee. See Note 6 forspecific details of issued guarantees.
Subsequent Events — Management has evaluated the impact of events occurring after Dec. 31, 2014 up to Feb. 23, 2015, the date thatSPS’ GAAP financial statements were issued and has updated such evaluation for disclosure purposes through April 13, 2015. Thesefinancial statements include all necessary adjustments and disclosures resulting from these evaluations.
Name of Respondent
Southwestern Public Service Company
This Report is:(1) X An Original(2) A Resubmission
Date of Report(Mo, Da, Yr)
04/13/2015
Year/Period of Report
2014/Q4
NOTES TO FINANCIAL STATEMENTS (Continued)
FERC FORM NO. 1 (ED. 12-88) Page 123.6
52
Schedule Q-5 Page 52 of 300
Sponsor: Robinson Case No. 15-00139-UT

2. Borrowings and Other Financing Instruments
Short-Term Borrowings
Money Pool — Xcel Energy Inc. and its utility subsidiaries have established a money pool arrangement that allows for short-terminvestments in and borrowings between the utility subsidiaries. Xcel Energy Inc. may make investments in the utility subsidiaries atmarket-based interest rates; however, the money pool arrangement does not allow the utility subsidiaries to make investments in XcelEnergy Inc. Money pool borrowings for SPS were as follows:
(Amounts in Millions, Except Interest Rates)Twelve Months Ended
Dec. 31, 2014Twelve Months Ended
Dec. 31, 20 13
Borrowing limit $ 100 $ 100Amount outstanding at period end 16 38Average amount outstanding 9 46Maximum amount outstanding 100 100Weighted average interest rate, computed on a daily basis 0.22 % 0.29 %Weighted average interest rate at end of period 0.45 0.25
Commercial Paper — SPS meets its short-term liquidity requirements primarily through the issuance of commercial paper andborrowings under its credit facility. Commercial paper outstanding for SPS was as follows:
(Amounts in Millions, Except Interest Rates)Twelve Months Ended
Dec. 31, 2014Twelve Months Ended
Dec. 31, 20 13
Borrowing limit $ 400 $ 300Amount outstanding at period end 37 84Average amount outstanding 83 32Maximum amount outstanding 241 140Weighted average interest rate, computed on a daily basis 0.26 % 0.30 %Weighted average interest rate at end of period 0.47 0.27
Letters of Credit — SPS may use letters of credit, generally with terms of one-year, to provide financial guarantees for certainoperating obligations. At Dec. 31, 2014, there were $30.0 million of letters of credit outstanding under the credit facility. At Dec. 31,2013, there were $25.5 million letters of credit outstanding under the credit facility. The contract amounts of these letters of creditapproximate their fair value and are subject to fees.
Credit Facility — In order to use its commercial paper program to fulfill short-term funding needs, SPS must have a revolving creditfacility in place at least equal to the amount of its commercial paper borrowing limit and cannot issue commercial paper in anaggregate amount exceeding available capacity under this credit facility. The line of credit provides short-term financing in the formof notes payable to banks, letters of credit and back-up support for commercial paper borrowings.
Amended Credit Agreement — In October 2014, SPS entered into an amended five-year credit agreement with a syndicate of banks. The amended credit agreement has substantially the same terms and conditions as the prior credit agreement with an increasedborrowing limit and an extension of maturity from July 2017 to October 2019. The borrowing limit for SPS has been increased to$400 million from $300 million.
SPS has the right to request an extension of the revolving termination date for two additional one-year periods. All extension requestsare subject to majority bank group approval.
Name of Respondent
Southwestern Public Service Company
This Report is:(1) X An Original(2) A Resubmission
Date of Report(Mo, Da, Yr)
04/13/2015
Year/Period of Report
2014/Q4
NOTES TO FINANCIAL STATEMENTS (Continued)
FERC FORM NO. 1 (ED. 12-88) Page 123.7
53
Schedule Q-5 Page 53 of 300
Sponsor: Robinson Case No. 15-00139-UT

Other features of SPS’ credit facility include:
• The credit facility may be increased by up to $50 million.• The credit facility has a financial covenant requiring that SPS’ debt-to-total capitalization ratio be less than or equal to 65
percent. SPS was in compliance as its debt-to-total capitalization ratio was 47 percent and 49 percent at Dec. 31, 2014 and2013, respectively. If SPS does not comply with the covenant, an event of default may be declared, and if not remedied, anyoutstanding amounts due under the facility can be declared due by the lender.
• The credit facility has a cross-default provision that provides SPS will be in default on its borrowings under the facility if SPSor any of its future significant subsidiaries whose total assets exceed 15 percent of SPS’ total assets, default on certainindebtedness in an aggregate principal amount exceeding $75 million.
• The interest rates under the line of credit are based on Eurodollar borrowing margins ranging from 87.5 to 175 basis pointsper year based on the applicable long-term credit ratings.
• The commitment fees, also based on applicable long-term credit ratings, are calculated on the unused portion of the lines ofcredit at a range of 7.5 to 27.5 basis points per year.
At Dec. 31, 2014, SPS had the following committed credit facility available (in millions):
C re dit Fac ili ty (a ) Dr aw n ( b ) A vail able
$ 400.0 $ 67.0 $ 333.0
(a ) Th ese credi t fac ili tie s have bee n amende d to e xten d the mat uri ty to O ct ober 2019.(b) Inc ludes outstanding c omme rcia l pa per a nd le tte rs of c re dit.
All credit facility bank borrowings, outstanding letters of credit and outstanding commercial paper reduce the available capacity underthe credit facility. SPS had no direct advances on the credit facility outstanding at Dec. 31, 2014 and 2013.
Long-Term Borrowings and Other Financing Instruments
Generally, all real and personal property of SPS is subject to the lien of its first mortgage indenture. Debt premiums, discounts andexpenses are amortized over the life of the related debt. The premiums, discounts and expenses associated with refinanced debt aredeferred and amortized over the life of the related new issuance, in accordance with regulatory guidelines.
In June 2014, SPS issued $150 million of 3.30 percent first mortgage bonds due June 15, 2024. In August 2013, SPS issued $100million of 4.50 percent first mortgage bonds due Aug. 15, 2041. Including the $300 million of this series previously issued, totalprincipal outstanding for this series is $400 million.
In connection with SPS’ issuance of $150 million of 3.30 percent first mortgage bonds due June 15, 2024, SPS concurrently tookcertain actions to secure its previously issued Series G Senior Notes due Dec. 1, 2018 equally and ratably with SPS’ first mortgagebonds as required pursuant to the terms of the Series G notes.
To provide the required collateralization, SPS issued $250 million of collateral 8.75 percent first mortgage bonds due Dec. 1, 2018 tothe trustee under its senior unsecured indenture which secured the previously issued Series G Senior Notes, 8.75 percent due Dec. 1,2018, equally and ratably with SPS’ first mortgage bonds.
During the next five years, SPS has long-term debt maturities of $200 million and $250 million due in 2016 and 2018, respectively.
Deferred Financing Costs — Deferred debits included deferred financing costs of approximately $10.9 million and $10.3 million, netof amortization, at Dec. 31, 2014 and 2013, respectively. SPS is amortizing these financing costs over the remaining maturity periodsof the related debt.
Dividend Restrictions — SPS’ dividends are subject to the FERC’s jurisdiction under the Federal Power Act, which prohibits thepayment of dividends out of capital accounts; payment of dividends is allowed out of retained earnings only.
Name of Respondent
Southwestern Public Service Company
This Report is:(1) X An Original(2) A Resubmission
Date of Report(Mo, Da, Yr)
04/13/2015
Year/Period of Report
2014/Q4
NOTES TO FINANCIAL STATEMENTS (Continued)
FERC FORM NO. 1 (ED. 12-88) Page 123.8
54
Schedule Q-5 Page 54 of 300
Sponsor: Robinson Case No. 15-00139-UT

The most restrictive dividend limitation for SPS is imposed by its state regulatory commissions. SPS’ state regulatory commissionsindirectly limit the amount of dividends that SPS can pay Xcel Energy Inc. by requiring an equity-to-total capitalization ratio(excluding short-term debt) between 45.0 percent and 55.0 percent. In addition, SPS may not pay a dividend that would cause it tolose its investment grade bond rating. SPS’ equity-to-total capitalization ratio (excluding short-term debt) was 53.6 percent at Dec. 31,2014 and $396 million in retained earnings was not restricted.
3. Preferred Stock
SPS has authorized the issuance of preferred stock.
Prefe rr edSh ar es
A uth orize d Par V al ue
PreferredSh are s
Ou tstand in g
10,000,000 $ 1.00 None
4. Income Taxes
Tax Increase Prevention Act of 2014 — In 2014, the Tax Increase Prevention Act (TIPA) was signed into law. The TIPA providesfor the following:
••••• The research and experimentation (R&E) credit was extended for 2014;• Production tax credit (PTCs) were extended for projects that began construction before the end of 2014 with certain projects
qualifying into future years; and• 50 percent bonus depreciation was extended one year through 2014. Additionally, some longer production period property
placed in service in 2015 is also eligible for 50 percent bonus depreciation.
The accounting related to the TIPA was recorded beginning in the fourth quarter of 2014 because a change in tax law is accounted forin the period of enactment.
American Taxpayer Relief Act of 2012 — In 2013, the American Taxpayer Relief Act (ATRA) was signed into law. The ATRAprovided for the following:
• The top tax rate for dividends increased from 15 percent to 20 percent. The 20 percent dividend rate is now consistent withthe tax rates for capital gains;
• The R&E credit was extended for 2012 and 2013;• PTCs were extended for projects that began construction before the end of 2013 with certain projects qualifying into future
years; and• 50 percent bonus depreciation was extended one year through 2013. Additionally, some longer production period property
placed in service in 2014 is also eligible for 50 percent bonus depreciation.
The accounting related to the ATRA, including the provisions related to 2012, was recorded beginning in the first quarter of 2013because a change in tax law is accounted for in the period of enactment.
Federal Audit — SPS is a member of the Xcel Energy affiliated group that files a consolidated federal income tax return. The statuteof limitations applicable to Xcel Energy’s 2008 federal income tax return expired in September 2012. The statute of limitationsapplicable to Xcel Energy’s 2009 federal income tax return expires in March 2016. In the third quarter of 2012, the Internal RevenueService (IRS) commenced an examination of tax years 2010 and 2011, including the 2009 carryback claim. As of Dec. 31, 2014, theIRS had proposed an adjustment to the federal tax loss carryback claims that would result in $12 million of income tax expense for the2009 through 2011 claims, the recently filed 2013 claim, and the anticipated claim for 2014. SPS is not expected to accrue any incometax expense related to this adjustment. At Dec. 31, 2014, the IRS has begun the Appeals process; however, the outcome and timing of aresolution are uncertain.
Name of Respondent
Southwestern Public Service Company
This Report is:(1) X An Original(2) A Resubmission
Date of Report(Mo, Da, Yr)
04/13/2015
Year/Period of Report
2014/Q4
NOTES TO FINANCIAL STATEMENTS (Continued)
FERC FORM NO. 1 (ED. 12-88) Page 123.9
55
Schedule Q-5 Page 55 of 300
Sponsor: Robinson Case No. 15-00139-UT

State Audits — SPS is a member of the Xcel Energy affiliated group that files consolidated state income tax returns. As of Dec. 31,2014, SPS’ earliest open tax year that is subject to examination by state taxing authorities under applicable statutes of limitations is2009. There are currently no state income tax audits in progress.
Unrecognized Tax Benefits — The unrecognized tax benefit balance includes permanent tax positions, which if recognized wouldaffect the annual effective tax rate (ETR). In addition, the unrecognized tax benefit balance includes temporary tax positions for whichthe ultimate deductibility is highly certain but for which there is uncertainty about the timing of such deductibility. A change in theperiod of deductibility would not affect the ETR but would accelerate the payment of cash to the taxing authority to an earlier period.
A reconciliation of the amount of unrecognized tax benefit is as follows:
(Mill ions of Dollars) Dec. 31, 2014 Dec. 3 1, 2013
Unrecognized tax benefit — Permanent tax positions $ 1.5 $ 1.2Unrecognized tax benefit — Temporary tax positions 11.7 2.9
Total unrecognized tax benefit $ 13.2 $ 4.1
A reconciliation of the beginning and ending amount of unrecognized tax benefit is as follows:
(Mill ionsof Dollars) 2014 2013
Balance at Jan. 1 $ 4.1 $ 3.9Additions based on tax positions related to the current year 8.6 1.6Reductions based on tax positions related to the current year — —Additions for tax positions of prior years 2.3 3.1Reductions for tax positions of prior years (0.3) (0.3)Settlements with taxing authorities (0.2) (4.2)Lapse of applicable statutes of limitations (1.3) —
Balance at Dec. 31 $ 13.2 $ 4.1
The unrecognized tax benefit amounts were reduced by the tax benefits associated with net operating loss (NOL) and tax creditcarryforwards. The amounts of tax benefits associated with NOL and tax credit carryforwards are as follows:
(Mill ions of Dol lars) 2014 2013
NOL and tax credit carryforwards $ (4.8) $ (2.4)
It is reasonably possible that SPS’ amount of unrecognized tax benefits could significantly change in the next 12 months as theIRS Appeals process progresses and state audits resume. As the IRS Appeals process moves closer to completion and state auditsresume, it is reasonably possible that the amount of unrecognized tax benefit could decrease up to approximately $2 million.
The payable for interest related to unrecognized tax benefits is partially offset by the interest benefit associated with NOL and taxcredit carryforwards. The payables for interest related to unrecognized tax benefits at Dec. 31, 2014 and 2013 were not material. Noamounts were accrued for penalties related to unrecognized tax benefits as of Dec. 31, 2014 or 2013.
Uncertainty in Income Taxes — The FERC has not fully adopted the accounting guidance for uncertainty in income taxes. Accordingly, SPS has recorded its unrecognized tax benefits for temporary adjustments, including net operating loss and tax creditcarryforwards, in accounts established for accumulated deferred income taxes.
Name of Respondent
Southwestern Public Service Company
This Report is:(1) X An Original(2) A Resubmission
Date of Report(Mo, Da, Yr)
04/13/2015
Year/Period of Report
2014/Q4
NOTES TO FINANCIAL STATEMENTS (Continued)
FERC FORM NO. 1 (ED. 12-88) Page 123.10
56
Schedule Q-5 Page 56 of 300
Sponsor: Robinson Case No. 15-00139-UT

Other Income Tax Matters — NOL amounts represent the amount of the tax loss that is carried forward and tax credits represent thedeferred tax asset. NOL and tax credit carryforwards as of Dec. 31 were as follows:
(Mill ionsof Dollars) 2014 2013
Federal NOL carryforward $ 182.4 $ 172.8Federal tax credit carryforwards 2.4 1.9
State NOL carryforwards 58.5 23.6
The federal carryforward periods expire between 2021 and 2034. The state carryforward periods expire between 2016 and 2034.
Total income tax expense from operations differs from the amount computed by applying the statutory federal income tax rate toincome before income tax expense. The following reconciles such differences for the years ending Dec. 31:
2014 2013
Federal statutory rate 35.0 % 35.0 %Increases (decreases) in tax from:
State income taxes, net of federal income tax benefit 3.4 2.0Regulatory differences — utility plant items (1.6) (1.1)Tax credits recognized (0.4) (0.4)Other, net 0.3 0.6
Effective income tax rate 36.7 % 36.1 %
The components of income tax expense for the years ending Dec. 31 were:
(Thousands of Dollars) 2 014 2013
Current federal tax expense (benefit) $ (57,202) $ 14,947Current state tax expense 2,512 2,942
Current change in unrecognized tax expense 325 969
Deferred federal tax expense 121,883 33,489
Deferred state tax expense 8,025 1,755
Deferred investment tax credits (341) (341)
Total income tax expense $ 75,202 $ 53,761
The components of deferred income tax expense for the years ending Dec. 31 were:
(Thousands of Dollars) 2014 2013
Deferred tax expense excluding items below $ 131,266 $ 37,100Amortization and adjustments to deferred income taxes on income tax regulatory assets and
liabilities (1,262) (1,760)
Tax expense allocated to other comprehensive income (96) (96)
Deferred tax expense $ 129,908 $ 35,244
Name of Respondent
Southwestern Public Service Company
This Report is:(1) X An Original(2) A Resubmission
Date of Report(Mo, Da, Yr)
04/13/2015
Year/Period of Report
2014/Q4
NOTES TO FINANCIAL STATEMENTS (Continued)
FERC FORM NO. 1 (ED. 12-88) Page 123.11
57
Schedule Q-5 Page 57 of 300
Sponsor: Robinson Case No. 15-00139-UT

The components of the accumulated deferred income taxes at Dec. 31 were as follows:
(Thousands of Dollars) 2 014 2013
Deferred tax liabilities:Differences between book and tax bases of property $ 915,686 $ 771,472Employee benefits 61,148 63,153Other 29,165 26,453
Total deferred tax liabilities $ 1,005,999 $ 861,078Deferred tax assets:
Difference between book and tax bases of property $ 69,481 $ 64,059NOL carryforward 68,446 62,773Rate refund 18,405 17,192Unbilled revenue - fuel costs 10,866 13,317Regulatory liabilities 10,794 5,660Employee benefits 10,452 11,072Deferred fuel costs 6,006 6,878Other 7,376 7,221
Total deferred tax assets $ 201,826 $ 188,172Net deferred tax liability $ 804,173 $ 672,906
5. Benefit Plans and Other Postretirement Benefits
Consistent with the process for rate recovery of pension and postretirement benefits for its employees, SPS accounts for itsparticipation in, and related costs of, pension and other postretirement benefit plans sponsored by Xcel Energy Inc. as multipleemployer plans. SPS is responsible for its share of cash contributions, plan costs and obligations and is entitled to its share of planassets; accordingly, SPS accounts for its pro rata share of these plans, including pension expense and contributions, resulting inaccounting consistent with that of a single employer plan exclusively for SPS employees.
Xcel Energy, which includes SPS, offers various benefit plans to its employees. Approximately 66 percent of employees that receivebenefits are represented by several local labor unions under several collective-bargaining agreements. At Dec. 31, 2014, SPS had 840bargaining employees covered under a collective-bargaining agreement, which expired in October 2014. While collective bargainingis ongoing, the terms and conditions of the expired agreement are automatically extended until the parties reach an agreement or adecision is rendered by an arbitrator.
The plans invest in various instruments which are disclosed under the accounting guidance for fair value measurements whichestablishes a hierarchical framework for disclosing the observability of the inputs utilized in measuring fair value. The three levels inthe hierarchy and examples of each level are as follows:
Level 1 — Quoted prices are available in active markets for identical assets as of the reporting date. The types of assetsincluded in Level 1 are highly liquid and actively traded instruments with quoted prices.
Level 2 — Pricing inputs are other than quoted prices in active markets, but are either directly or indirectly observable as ofthe reporting date. The types of assets included in Level 2 are typically either comparable to actively traded securities orcontracts, or priced with models using highly observable inputs.
Level 3 — Significant inputs to pricing have little or no observability as of the reporting date. The types of assets included inLevel 3 are those with inputs requiring significant management judgment or estimation.
Specific valuation methods include the following:
Cash equivalents — The fair values of cash equivalents are generally based on cost plus accrued interest; money market funds aremeasured using quoted net asset values.
Name of Respondent
Southwestern Public Service Company
This Report is:(1) X An Original(2) A Resubmission
Date of Report(Mo, Da, Yr)
04/13/2015
Year/Period of Report
2014/Q4
NOTES TO FINANCIAL STATEMENTS (Continued)
FERC FORM NO. 1 (ED. 12-88) Page 123.12
58
Schedule Q-5 Page 58 of 300
Sponsor: Robinson Case No. 15-00139-UT

Insurance contracts — Insurance contract fair values take into consideration the value of the investments in separate accounts of theinsurer, which are priced based on observable inputs.
Investments in equity securities and other funds — Equity securities are valued using quoted prices in active markets. The fair valuesfor commingled funds, private equity investments and real estate investments are measured using net asset values, which take intoconsideration the value of underlying fund investments, as well as the other accrued assets and liabilities of a fund, in order todetermine a per share market value. The investments in commingled funds may be redeemed for net asset value with proper notice. Proper notice varies by fund and can range from daily with one or two days notice to annually with 90 days notice. Private equityinvestments require approval of the fund for any unscheduled redemption, and such redemptions may be approved or denied by thefund at its sole discretion. Unscheduled distributions from real estate investments may be redeemed with proper notice, which istypically quarterly with 45-90 days notice; however, withdrawals from real estate investments may be delayed or discounted as a resultof fund illiquidity. Based on the plan’s evaluation of its ability to redeem private equity and real estate investments, fair valuemeasurements for private equity and real estate investments have been assigned a Level 3.
Investments in debt securities — Fair values for debt securities are determined by a third party pricing service using recent trades andobservable spreads from benchmark interest rates for similar securities.
Derivative Instruments — Fair values for foreign currency derivatives are determined using pricing models based on the prevailingforward exchange rate of the underlying currencies. The fair values of interest rate derivatives are based on broker quotes that utilizecurrent market interest rate forecasts.
Pension Benefits
Xcel Energy, which includes SPS, has several noncontributory, defined benefit pension plans that cover almost all employees. Generally, benefits are based on a combination of years of service, the employee’s average pay and, in some cases, social securitybenefits. Xcel Energy Inc.’s and SPS’ policy is to fully fund into an external trust the actuarially determined pension costs recognizedfor ratemaking and financial reporting purposes, subject to the limitations of applicable employee benefit and tax laws.
In addition to the qualified pension plans, Xcel Energy maintains a supplemental executive retirement plan (SERP) and a nonqualifiedpension plan. The SERP is maintained for certain executives that were participants in the plan in 2008, when the SERP was closed tonew participants. The nonqualified pension plan provides unfunded, nonqualified benefits for compensation that is in excess of thelimits applicable to the qualified pension plans. The total obligations of the SERP and nonqualified plan as of Dec. 31, 2014 and 2013were $46.5 million and $36.5 million, respectively, of which $3.1 million and $2.8 million were attributable to SPS. In 2014 and2013, Xcel Energy recognized net benefit cost for financial reporting for the SERP and nonqualified plans of $4.7 million and $6.6million, respectively, of which $0.2 million and $0.3 million were attributable to SPS. Benefits for these unfunded plans are paid outof Xcel Energy’s consolidated operating cash flows.
Xcel Energy Inc. and SPS base the investment-return assumption on expected long-term performance for each of the investment typesincluded in the pension asset portfolio and consider the historical returns achieved by the asset portfolio over the past 20-year or longerperiod, as well as the long-term return levels projected and recommended by investment experts. Xcel Energy Inc. and SPScontinually review the pension assumptions. The pension cost determination assumes a forecasted mix of investment types over thelong-term.
• Investment returns in 2014 were above the assumed levels of 6.90 percent;• Investment returns in 2013 were below the assumed level of 6.49 percent; and• In 2015, SPS’ expected investment-return assumption is 7.22 percent.
Name of Respondent
Southwestern Public Service Company
This Report is:(1) X An Original(2) A Resubmission
Date of Report(Mo, Da, Yr)
04/13/2015
Year/Period of Report
2014/Q4
NOTES TO FINANCIAL STATEMENTS (Continued)
FERC FORM NO. 1 (ED. 12-88) Page 123.13
59
Schedule Q-5 Page 59 of 300
Sponsor: Robinson Case No. 15-00139-UT
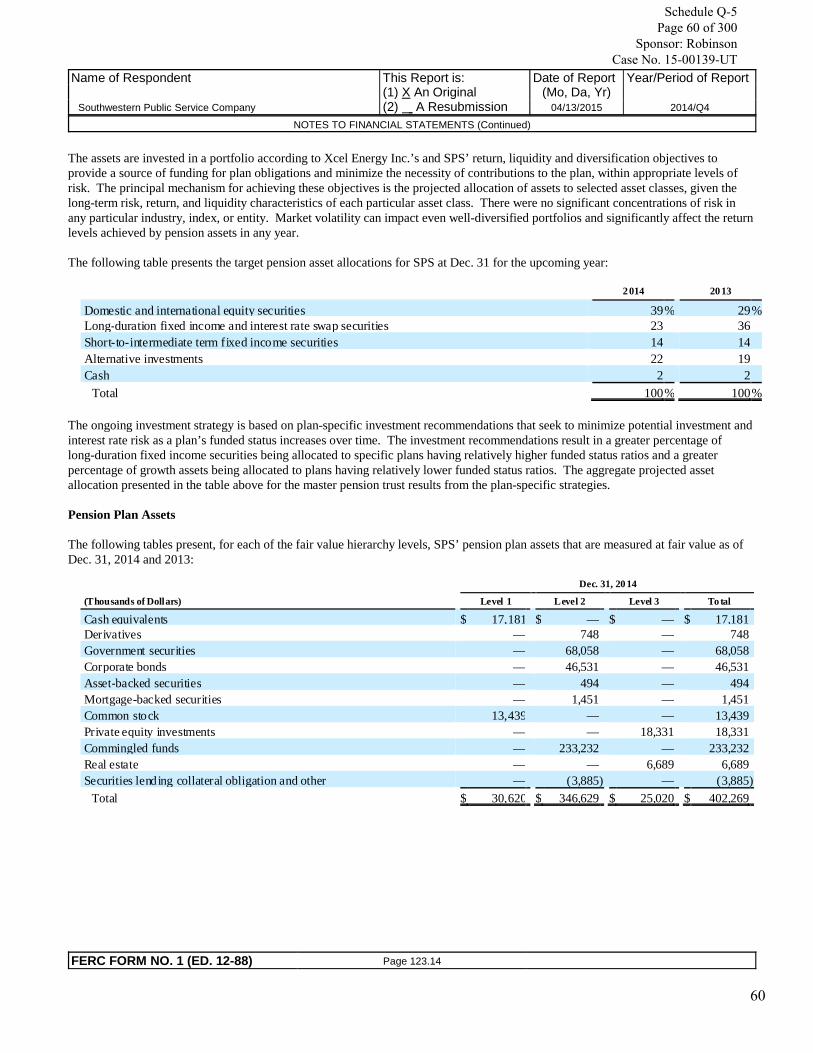
The assets are invested in a portfolio according to Xcel Energy Inc.’s and SPS’ return, liquidity and diversification objectives toprovide a source of funding for plan obligations and minimize the necessity of contributions to the plan, within appropriate levels ofrisk. The principal mechanism for achieving these objectives is the projected allocation of assets to selected asset classes, given thelong-term risk, return, and liquidity characteristics of each particular asset class. There were no significant concentrations of risk inany particular industry, index, or entity. Market volatility can impact even well-diversified portfolios and significantly affect the returnlevels achieved by pension assets in any year.
The following table presents the target pension asset allocations for SPS at Dec. 31 for the upcoming year:
2014 2013
Domestic and international equity securities 39% 29%Long-duration fixed income and interest rate swap securities 23 36Short-to-intermediate term fixed income securities 14 14Alternative investments 22 19Cash 2 2
Total 100% 100%
The ongoing investment strategy is based on plan-specific investment recommendations that seek to minimize potential investment andinterest rate risk as a plan’s funded status increases over time. The investment recommendations result in a greater percentage oflong-duration fixed income securities being allocated to specific plans having relatively higher funded status ratios and a greaterpercentage of growth assets being allocated to plans having relatively lower funded status ratios. The aggregate projected assetallocation presented in the table above for the master pension trust results from the plan-specific strategies.
Pension Plan Assets
The following tables present, for each of the fair value hierarchy levels, SPS’ pension plan assets that are measured at fair value as ofDec. 31, 2014 and 2013:
Dec. 31, 20 14
(Thousands of Dollars) Level 1 Level 2 Level 3 To tal
Cash equivalents $ 17,181 $ — $ — $ 17,181Derivatives — 748 — 748Government securities — 68,058 — 68,058Corporate bonds — 46,531 — 46,531Asset-backed securities — 494 — 494Mortgage-backed securities — 1,451 — 1,451Common stock 13,439 — — 13,439Private equity investments — — 18,331 18,331Commingled funds — 233,232 — 233,232Real estate — — 6,689 6,689Securities lending collateral obligation and other — (3,885) — (3,885)
Total $ 30,620 $ 346,629 $ 25,020 $ 402,269
Name of Respondent
Southwestern Public Service Company
This Report is:(1) X An Original(2) A Resubmission
Date of Report(Mo, Da, Yr)
04/13/2015
Year/Period of Report
2014/Q4
NOTES TO FINANCIAL STATEMENTS (Continued)
FERC FORM NO. 1 (ED. 12-88) Page 123.14
60
Schedule Q-5 Page 60 of 300
Sponsor: Robinson Case No. 15-00139-UT

Dec. 31, 20 13
(Thousands of Dollars) Level 1 Level 2 Level 3 To tal
Cash equivalents $ 17,354 $ — $ — $ 17,354Derivatives — 4,200 — 4,200Government securities — 26,649 — 26,649Corporate bonds — 79,635 — 79,635Asset-backed securities — 889 — 889Mortgage-backed securities — 1,939 — 1,939Common stock 12,813 — — 12,813Private equity investments — — 18,222 18,222Commingled funds — 223,322 — 223,322Real estate — — 5,755 5,755Securities lending collateral obligation and other — 2,615 — 2,615
Total $ 30,167 $ 339,249 $ 23,977 $ 393,393
The following tables present the changes in SPS’ Level 3 pension plan assets for the years ended Dec. 31, 2014 and 2013:
(Thousands of Dollars) Jan. 1, 2 014Net Rea lized
Gains (Losses)Net Unrea lized Gains (Losses)
Purchases,Issuances and
Settlements, Net
Transfers Out of Level 3 Dec. 31, 2014
Private equity investments $ 18,222 $ 3,101 $ (1,894) $ (1,098) $ — $ 18,331Real estate 5,755 431 (219) 722 — 6,689
Total $ 23,977 $ 3,532 $ (2,113) $ (376) $ — $ 25,020
(Thousands of Dollars) Jan. 1, 2 013Net Rea lized
Gains (Losses)Net Unrea lized Gains (Losses)
Purchases,Issuances and
Settlements, Net
Transfers Out of Level 3 (a) Dec. 31, 2013
Asset-backed securities $ 1,755 $ — $ — $ — $ (1,755) $ —Mortgage-backed securities 4,331 — — — (4,331) —Private equity investments 17,049 2,630 (1,055) (402) — 18,222Real estate 6,969 (322) 1,475 1,128 (3,495) 5,755
Total $ 30,104 $ 2,308 $ 420 $ 726 $ (9,581) $ 23,977
Transfers out of Level 3 into Level 2 were principally due to diminish ed use of u nobservable inputs that were previously sign ificant to these fai r value measurements and were subsequent ly sold during 2013.
Name of Respondent
Southwestern Public Service Company
This Report is:(1) X An Original(2) A Resubmission
Date of Report(Mo, Da, Yr)
04/13/2015
Year/Period of Report
2014/Q4
NOTES TO FINANCIAL STATEMENTS (Continued)
FERC FORM NO. 1 (ED. 12-88) Page 123.15
61
Schedule Q-5 Page 61 of 300
Sponsor: Robinson Case No. 15-00139-UT

Benefit Obligations — A comparison of the actuarially computed pension benefit obligation and plan assets for SPS is presented in thefollowing table:
(Thousands of Dollars) 2 014 20 13
Accumulated Benefit Obligation at Dec. 31 $ 458,793 $ 402,509
Change in Projected Benefit Obligation:Obligation at Jan. 1 $ 434,307 $ 454,184Service cost 9,184 9,615Interest cost 20,444 17,908Actuarial loss (gain) 63,209 (27,185)Transfer (to) from other plan (1,939) 3,625Benefit payments (24,515) (23,840)
Obligation at Dec. 31 $ 500,690 $ 434,307
(T housand s of Doll ars) 2 014 20 13
Change in Fair Value of Plan Assets:Fair value of plan assets a t Jan. 1 $ 393,393 $ 376,138Actual return on plan assets 30,159 15,455Employer contr ibutions 4,869 22,015Transfer (to) from other plan (1,637) 3,625Benefit payments (24,515) (23,840)Fair value of plan assets a t Dec. 31 $ 402,269 $ 393,393
(T housands of Dollars) 2 014 20 13
Amounts Not Yet Recognized as Components of Net Periodic Benefit C ost:Net loss $ 252,063 $ 208,594Prior service cost 39 93
Total $ 252,102 $ 208,687
2 014 20 13
Significant Assumptions Used to Measure Benefit Obligations:Discount rate for year-end valuation 4.11% 4.75%Expected average long-term increase in compensation level 3.75 3.75Mortality table RP 2014 RP 2000
Name of Respondent
Southwestern Public Service Company
This Report is:(1) X An Original(2) A Resubmission
Date of Report(Mo, Da, Yr)
04/13/2015
Year/Period of Report
2014/Q4
NOTES TO FINANCIAL STATEMENTS (Continued)
FERC FORM NO. 1 (ED. 12-88) Page 123.16
62
Schedule Q-5 Page 62 of 300
Sponsor: Robinson Case No. 15-00139-UT

Mortality — In 2014, the Society of Actuaries published a new mortality table and projection scale that increased the overall lifeexpectancy of males and females. SPS has reviewed its own population through a credibility analysis and adopted the RP 2014 tablewith modifications based on its population and specific experience.
Cash Flows — Cash funding requirements can be impacted by changes to actuarial assumptions, actual asset levels and othercalculations prescribed by the funding requirements of income tax and other pension-related regulations. Required contributions weremade in 2013 through 2015 to meet minimum funding requirements.
Total voluntary and required pension funding contributions across all four of Xcel Energy’s pension plans were as follows:
• $90.0 million in January 2015, of which $11.6 million was attributable to SPS;• $130.6 million in 2014, of which $4.9 million was attributable to SPS; and• $192.4 million in 2013, of which $22.0 million was attributable to SPS.
For future years, Xcel Energy and SPS anticipate contributions will be made as necessary.
Plan Amendments — In 2014 and 2013, there were no plan amendments made which affected the benefit obligation.
Benefit Costs — The components of SPS’ net periodic pension cost were:
(Thousands of Dollars) 2014 2013
Service cost $ 9,184 $ 9,615Interest cost 20,444 17,908Expected return on plan assets (26,179) (23,970)Amortization of prior service cost 54 870Amortization of net loss 13,326 17,148
Net periodic pension cost 16,829 21,571Credits (costs) not recognized due to effects of regulation 3,170 (1,269)
Net benefit cost recognized for financial reporting $ 19,999 $ 20,302
2014 2013
Significant Assumptions Used to Measure Costs:Discount rate 4.75% 4.00 %Expected average long-term increase in compensation level 3.75 3.75Expected average long-term rate of return on assets 6.90 6.49
Name of Respondent
Southwestern Public Service Company
This Report is:(1) X An Original(2) A Resubmission
Date of Report(Mo, Da, Yr)
04/13/2015
Year/Period of Report
2014/Q4
NOTES TO FINANCIAL STATEMENTS (Continued)
FERC FORM NO. 1 (ED. 12-88) Page 123.17
63
Schedule Q-5 Page 63 of 300
Sponsor: Robinson Case No. 15-00139-UT

In addition to the benefit costs in the table above, for the pension plans sponsored by Xcel Energy Inc., costs are allocated to SPSbased on Xcel Energy Services Inc. employees’ labor costs. Amounts allocated to SPS were $4.1 million and $4.9 million in 2014 and2013, respectively. Pension costs include an expected return impact for the current year that may differ from actual investmentperformance in the plan. The return assumption used for 2015 pension cost calculations is 7.22 percent. The cost calculation uses amarket-related valuation of pension assets. Xcel Energy, including SPS, uses a calculated value method to determine themarket-related value of the plan assets. The market-related value begins with the fair market value of assets as of the beginning of theyear. The market-related value is determined by adjusting the fair market value of assets to reflect the investment gains and losses (thedifference between the actual investment return and the expected investment return on the market-related value) during each of theprevious five years at the rate of 20 percent per year. As these differences between actual investment returns and the expectedinvestment returns are incorporated into the market-related value, the differences are recognized over the expected average remainingyears of service for active employees.
Defined Contribution Plans
Xcel Energy, which includes SPS, maintains 401(k) and other defined contribution plans that cover substantially all employees. Theexpense to these plans for SPS was approximately $2.6 million in 2014 and $2.4 million in 2013.
Postretirement Health Care Benefits
Xcel Energy, which includes SPS, has a contributory health and welfare benefit plan that provides health care and death benefits tocertain retirees. Xcel Energy discontinued contributing toward health care benefits for former New Century Energies (NCE), whichincludes SPS, nonbargaining employees retiring after June 30, 2003. Employees of New Century Energies, Inc. (NCE) who retired in2002 continue to receive employer-subsidized health care benefits. Nonbargaining employees of the former NCE who retired after1998, bargaining employees of the former NCE who retired after 1999 and nonbargaining employees of NCE who retired after June30, 2003, are eligible to participate in the Xcel Energy health care program with no employer subsidy.
In 1993, Xcel Energy Inc. and SPS adopted accounting guidance regarding other non-pension postretirement benefits and elected toamortize the unrecognized accumulated postretirement benefit obligation (APBO) on a straight-line basis over 20 years.
Regulatory agencies for nearly all retail and wholesale utility customers have allowed rate recovery of accrued postretirement benefitcosts.
Plan Assets — Certain state agencies that regulate Xcel Energy Inc.’s utility subsidiaries also have issued guidelines related to thefunding of postretirement benefit costs. SPS is required to fund postretirement benefit costs for Texas and New Mexico jurisdictionalamounts collected in rates. These assets are invested in a manner consistent with the investment strategy for the pension plan.
The following table presents the target postretirement asset allocations for Xcel Energy Inc. and SPS at Dec. 31 for the upcoming year:
2014 2013
Domestic and international equity securities 25% 41%Short-to-intermediate fixed income securities 57 40Alternative investments 13 13Cash 5 6
Total 100% 100%
Name of Respondent
Southwestern Public Service Company
This Report is:(1) X An Original(2) A Resubmission
Date of Report(Mo, Da, Yr)
04/13/2015
Year/Period of Report
2014/Q4
NOTES TO FINANCIAL STATEMENTS (Continued)
FERC FORM NO. 1 (ED. 12-88) Page 123.18
64
Schedule Q-5 Page 64 of 300
Sponsor: Robinson Case No. 15-00139-UT

Xcel Energy Inc. and SPS base investment-return assumptions for the postretirement health care fund assets on expected long-termperformance for each of the investment types included in the asset portfolio. Assumptions and target allocations are determined at themaster trust level. The investment mix at each of Xcel Energy Inc.’s utility subsidiaries may vary from the investment mix of the totalasset portfolio. The assets are invested in a portfolio according to Xcel Energy Inc.’s and SPS’ return, liquidity and diversificationobjectives to provide a source of funding for plan obligations and minimize the necessity of contributions to the plan, withinappropriate levels of risk. The principal mechanism for achieving these objectives is the projected allocation of assets to selected assetclasses, given the long-term risk, return, correlation and liquidity characteristics of each particular asset class. There were nosignificant concentrations of risk in any particular industry, index, or entity. Market volatility can impact even well-diversifiedportfolios and significantly affect the return levels achieved by postretirement health care assets in any year.
The following tables present, for each of the fair value hierarchy levels, SPS’ proportionate allocation of the total postretirementbenefit plan assets that are measured at fair value as of Dec. 31, 2014 and 2013:
Dec. 31, 20 14
(T housands of Dollars) Level 1 L evel 2 Level 3 To tal
Cash equivalents (a) $ 2,513 $ — $ — $ 2,513Derivatives — 18 — 18Government securities — 4,639 — 4,639Insurance contracts — 4,807 — 4,807Corporate bonds — 5,175 — 5,175Asset-backed securities — 345 — 345Mortgage-backed securities — 1,074 — 1,074Commingled funds — 26,960 — 26,960Other — (175) — (175)
Total $ 2,513 $ 42,843 $ — $ 45,356
Dec. 31, 2013
(Thousands of Dollars) Level 1 Level 2 Level 3 To tal
Cash equivalents (a) $ 1,941 $ — $ — $ 1,941Derivatives — (38) — (38)Government securities — 5,549 — 5,549Insurance contracts — 5,016 — 5,016Corporate bonds — 4,926 — 4,926Asset-backed securities — 319 — 319Mortgage-backed securities — 2,303 — 2,303Commingled funds — 28,331 — 28,331Other — (1,609) — (1,609)
Total $ 1,941 $ 44,797 $ — $ 46,738
(a)Includes restricted cash of $0.1 mil lion at Dec. 31, 2014 and 2 013.
Name of Respondent
Southwestern Public Service Company
This Report is:(1) X An Original(2) A Resubmission
Date of Report(Mo, Da, Yr)
04/13/2015
Year/Period of Report
2014/Q4
NOTES TO FINANCIAL STATEMENTS (Continued)
FERC FORM NO. 1 (ED. 12-88) Page 123.19
65
Schedule Q-5 Page 65 of 300
Sponsor: Robinson Case No. 15-00139-UT

For the year ended Dec. 31, 2014 there were no assets transferred in or out of Level 3. The following tables present the changes inSPS’ Level 3 postretirement benefit plan assets for the year ended Dec. 31, 2013:
(Thousands of Dollars) Jan. 1, 2013Net Rea lized
Gains (Losses)Net Unrea lized Gains (Losses)
Purchases,Issuances and
Settlements, Net
Transfers Out of Level 3 (a) Dec. 31, 2013
Asset-backed securities $ 73 $ — $ — $ — $ (73) $ —Mortgage-backed securities 3,841 — — — (3,841) —
Total $ 3,914 $ — $ — $ — $ (3,914) $ —
(a)Transfers out of Level 3 into Level 2 were principally due to diminished use of unobservable inputs that were previously significant to these fair value measuremen ts and were subsequen tly sold during 2013.
Benefit Obligations — A comparison of the actuarially computed benefit obligation and plan assets for SPS is presented in thefollowing table:
(T housands of Dollars) 2 014 20 13
Change in Projected Benefit Obligation:Obligation at Jan. 1 $ 54,982 $ 59,260Service co st 1,246 1,368Interest co st 2,572 2,352Medicare subsidy reimbursements 18 63Plan par ticip ants’ contributions 728 698Actuar ial gain (11,828) (5,215)Benefit payments (3,376) (3,544)
Obligation at D ec. 31 $ 44,342 $ 54,982
(T housands of Doll ars) 2 014 20 13
Change in Fair Value of Plan Assets:Fair value of plan assets at Jan. 1 $ 46,738 $ 46,222Actual return on plan assets 1,073 3,228Plan particip ants’ contributions 728 698Employer contributions 193 134Benefit payments (3,376) (3,544)
Fair value of plan assets at Dec. 31 $ 45,356 $ 46,738
(Thousands of Dollars) 2 014 20 13
Funded Status of Plans at Dec. 31:Funded status (a) $ 1,014 $ (8,244)
(a)Amounts are recogn ized in noncurrent assets and noncurrent liabilit ies on SPS’ balance sheet as of Dec. 31, 2014 and 2013, respectively.
Name of Respondent
Southwestern Public Service Company
This Report is:(1) X An Original(2) A Resubmission
Date of Report(Mo, Da, Yr)
04/13/2015
Year/Period of Report
2014/Q4
NOTES TO FINANCIAL STATEMENTS (Continued)
FERC FORM NO. 1 (ED. 12-88) Page 123.20
66
Schedule Q-5 Page 66 of 300
Sponsor: Robinson Case No. 15-00139-UT

(T housands of Dollars) 2 014 20 13
Amounts Not Yet Recognized as Components of Net Periodic Benefit C redit:Net gain $ (14,677) $ (5,344)Prior service credit (3,432) (3,833)
Total $ (18,109) $ (9,177)
2014 2013
Significant Assumptions Used to Measure Benefit Obligations:Discount rate for year-end valuation 4.08% 4.82%Mortality table RP 2014 RP 2000Health care costs trend rate — initial 6.50% 7.00%
Effective Jan. 1, 2015, the initial medical trend rate was decreased from 7.0 percent to 6.5 percent. The ultimate trend assumptionremained at 4.5 percent. The period until the ultimate rate is reached is four years. Xcel Energy Inc. and SPS base the medical trendassumption on the long-term cost inflation expected in the health care market, considering the levels projected and recommended byindustry experts, as well as recent actual medical cost increases experienced by the retiree medical plan.
A one-percent change in the assumed health care cost trend rate would have the following effects on SPS:
One-Percentage Point
(Thousands of Dollars) Increase Decrease
APBO $ 4,555 $ (3,834)Service and interest components 451 (371)
Cash Flows — The postretirement health care plans have no funding requirements under income tax and other retirement-relatedregulations other than fulfilling benefit payment obligations, when claims are presented and approved under the plans. Additional cashfunding requirements are prescribed by certain state and federal rate regulatory authorities, as discussed previously. Xcel Energy,which includes SPS, contributed $17.1 million and $17.6 million during 2014 and 2013, respectively, of which $0.2 million and $0.1million were attributable to SPS. Xcel Energy expects to contribute approximately $12.8 million during 2015, of which amountsattributable to SPS will be zero.
Plan Amendments — In 2014 and 2013, there were no plan amendments made which affected the benefit obligation.
Benefit Costs — The components of SPS’ net periodic postretirement benefit costs were:
(Thousands of Dollars) 2014 2013
Service co st $ 1,246 $ 1,368Interest co st 2,572 2,352Expected return on plan assets (3,247) (3,183)Amortization of transition obligation — —Amortization of prior service credit (401) (484)Amortization of net (gain) loss (321) (6)
Net periodic postretirement benefit (cred it) cost $ (151) $ 47
2014 2013
Signif icant Assumptions Used to Measure C osts:Discount rate 4.82 % 4.10 %Expected average long -term rate of return on assets 7.20 7.11
Name of Respondent
Southwestern Public Service Company
This Report is:(1) X An Original(2) A Resubmission
Date of Report(Mo, Da, Yr)
04/13/2015
Year/Period of Report
2014/Q4
NOTES TO FINANCIAL STATEMENTS (Continued)
FERC FORM NO. 1 (ED. 12-88) Page 123.21
67
Schedule Q-5 Page 67 of 300
Sponsor: Robinson Case No. 15-00139-UT

In addition to the benefit costs in the table above, for the postretirement health care plans sponsored by Xcel Energy Inc., costs areallocated to SPS based on Xcel Energy Services Inc. employees’ labor costs.
Projected Benefit Payments — The following table lists SPS’ projected benefit payments for the pension and postretirement benefitplans:
(Thousands of Dollars)
ProjectedPension Benefit
Payments
Gross ProjectedPostretirement
Health Care Benefit Pa yments
ExpectedMedicare Part D
Subsidies
Net ProjectedPostretirement Health Ca re
Benefit Payments
2015 $ 25,988 $ 3,166 $ 24 $ 3,1422016 27,029 3,171 31 3,1402017 27,674 3,119 32 3,0872018 28,896 3,034 30 3,0042019 29,377 2,992 29 2,9632020-2024 156,430 14,498 153 14,345
6. Fair Value of Financial Assets and Liabilities
Fair Value Measurements
The accounting guidance for fair value measurements and disclosures provides a single definition of fair value and requires certaindisclosures about assets and liabilities measured at fair value. A hierarchical framework for disclosing the observability of the inputsutilized in measuring assets and liabilities at fair value is established by this guidance. The three levels in the hierarchy are as follows:
Level 1 — Quoted prices are available in active markets for identical assets or liabilities as of the reporting date. The types ofassets and liabilities included in Level 1 are highly liquid and actively traded instruments with quoted prices.
Level 2 — Pricing inputs are other than quoted prices in active markets, but are either directly or indirectly observable as ofthe reporting date. The types of assets and liabilities included in Level 2 are typically either comparable to actively tradedsecurities or contracts, or priced with models using highly observable inputs.
Level 3 — Significant inputs to pricing have little or no observability as of the reporting date. The types of assets andliabilities included in Level 3 are those valued with models requiring significant management judgment or estimation.
Specific valuation methods include the following:
Cash equivalents — The fair values of cash equivalents are generally based on cost plus accrued interest; money market funds aremeasured using quoted net asset values.
Interest rate derivatives — The fair values of interest rate derivatives are based on broker quotes that utilize current market interestrate forecasts.
Name of Respondent
Southwestern Public Service Company
This Report is:(1) X An Original(2) A Resubmission
Date of Report(Mo, Da, Yr)
04/13/2015
Year/Period of Report
2014/Q4
NOTES TO FINANCIAL STATEMENTS (Continued)
FERC FORM NO. 1 (ED. 12-88) Page 123.22
68
Schedule Q-5 Page 68 of 300
Sponsor: Robinson Case No. 15-00139-UT

Commodity derivatives — The methods used to measure the fair value of commodity derivative forwards and options utilize forwardprices and volatilities, as well as pricing adjustments for specific delivery locations, and are generally assigned a Level 2. Whencontractual settlements extend to periods beyond those readily observable on active exchanges or quoted by brokers, the significanceof the use of less observable forecasts of long-term forward prices and volatilities on a valuation is evaluated, and may result in Level 3classification.
Electric commodity derivatives held by SPS include transmission congestion instruments purchased from SPP, generally referred to asfinancial transmission rights (FTRs). FTRs purchased from an regional transmission organization (RTO) are financial instruments thatentitle or obligate the holder to monthly revenues or charges based on transmission congestion across a given transmission path. Thevalue of an FTR is derived from, and designed to offset, the cost of energy congestion, which is caused by overall transmission loadand other transmission constraints. In addition to overall transmission load, congestion is also influenced by the operating schedules ofpower plants and the consumption of electricity pertinent to a given transmission path. Unplanned plant outages, scheduled plantmaintenance, changes in the relative costs of fuels used in generation, weather and overall changes in demand for electricity can eachimpact the operating schedules of the power plants on the transmission grid and the value of an FTR. The valuation process for FTRsutilizes complex iterative modeling to predict the impacts of forecasted changes in these drivers of transmission system congestion onthe historical pricing of FTR purchases.
If forecasted costs of electric transmission congestion increase or decrease for a given FTR path, the value of that particular FTRinstrument will likewise increase or decrease. Given the limited observability of management’s forecasts for several of the inputs tothis complex valuation model - including expected plant operating schedules and retail and wholesale demand, fair valuemeasurements for FTRs have been assigned a Level 3. Non-trading monthly FTR settlements are expected to be recovered throughfuel and purchased energy cost recovery mechanisms, and therefore changes in the fair value of the yet to be settled portions of FTRsare deferred as a regulatory asset or liability. Given this regulatory treatment and the limited magnitude of FTRs relative to the electricutility operations of SPS, the numerous unobservable quantitative inputs to the complex model used for valuation of FTRs areinsignificant to the financial statements of SPS.
Derivative Instruments Fair Value Measurements
SPS enters into derivative instruments, including forward contracts, for trading purposes and to manage risk in connection withchanges in interest rates and electric utility commodity prices.
Interest Rate Derivatives — SPS may enter into various instruments that effectively fix the interest payments on certain floating ratedebt obligations or effectively fix the yield or price on a specified benchmark interest rate for an anticipated debt issuance for aspecific period. These derivative instruments are generally designated as cash flow hedges for accounting purposes.
At Dec. 31, 2014, accumulated other comprehensive losses related to interest rate derivatives included $0.2 million of net lossesexpected to be reclassified into earnings during the next 12 months as the related hedged interest rate transactions impact earnings,including forecasted amounts for unsettled hedges, as applicable.
Wholesale and Commodity Trading Risk — SPS conducts various wholesale and commodity trading activities, including the purchaseand sale of electric capacity, energy and energy-related instruments. SPS’ risk management policy allows management to conductthese activities within guidelines and limitations as approved by its risk management committee, which is made up of managementpersonnel not directly involved in the activities governed by this policy.
Commodity Derivatives — SPS enters into derivative instruments to manage variability of future cash flows from changes incommodity prices in its electric utility operations. This could include the purchase or sale of energy or energy-related products andFTRs.
Name of Respondent
Southwestern Public Service Company
This Report is:(1) X An Original(2) A Resubmission
Date of Report(Mo, Da, Yr)
04/13/2015
Year/Period of Report
2014/Q4
NOTES TO FINANCIAL STATEMENTS (Continued)
FERC FORM NO. 1 (ED. 12-88) Page 123.23
69
Schedule Q-5 Page 69 of 300
Sponsor: Robinson Case No. 15-00139-UT

The following table details the gross notional amounts of commodity FTRs at Dec. 31, 2014 and 2013:
Consideration of Credit Risk and Concentrations — SPS continuously monitors the creditworthiness of the counterparties to itsinterest rate derivatives and commodity derivative contracts prior to settlement, and assesses each counterparty’s ability to perform onthe transactions set forth in the contracts. Given this assessment, as well as an assessment of the impact of SPS’ own credit risk whendetermining the fair value of derivative liabilities, the impact of considering credit risk was immaterial to the fair value of unsettledcommodity derivatives presented in the balance sheets.
SPS employs additional credit risk control mechanisms when appropriate, such as letters of credit, parental guarantees, standardizedmaster netting agreements and termination provisions that allow for offsetting of positive and negative exposures. Credit exposure ismonitored and, when necessary, the activity with a specific counterparty is limited until credit enhancement is provided.
SPS’ most significant concentrations of credit risk with particular entities or industries are contracts with counterparties to itswholesale, trading and non-trading commodity activities. At Dec. 31, 2014, one of SPS’ eight most significant counterparties for theseactivities, comprising $15.2 million or 16 percent of this credit exposure, had an investment grade credit rating from Standard &Poor’s rating services, Moody’s Investor Services or Fitch Ratings. Six of the eight most significant counterparties, comprising $44.4million or 47 percent of this credit exposure, were not rated by these agencies, but based on SPS’ internal analysis, had credit qualityconsistent with investment grade. Another of these significant counterparties, comprising $1.7 million or 2 percent of this creditexposure, had credit quality less than investment grade, based on SPS’ internal analysis. All eight of these significant counterpartiesare municipal or cooperative electric entities, or other utilities.
Financial Impact of Qualifying Cash Flow Hedges — The impact of qualifying interest rate cash flow hedges on SPS’ accumulatedother comprehensive loss, included in the statements of common stockholder’s equity and in the statements of comprehensive income,is detailed in the following table:
(T housands of Dollars) 2014 2013
Accumulated other comprehensive loss related to cash flow hedges at Jan. 1 $ (1,161) $ (1,332)After-tax net realized losses on derivative transactions reclassif ied into earnings 172 171Accumulated other comprehensive loss related to cash flow hedges at Dec. 31 $ (989) $ (1,161)
Pre-tax losses related to interest rate derivatives reclassified from accumulated other comprehensive loss into earnings were $0.3million for both of the years ended Dec. 31, 2014 and 2013.
Changes in the fair value of FTRs resulting in pre-tax net losses of $3.9 million and pre-tax net gains of $9.9 million for the yearsended Dec. 31, 2014 and 2013, respectively, were reclassified as regulatory assets and liabilities. The classification as a regulatoryasset or liability is based on expected recovery of FTR settlements through fuel and purchased energy cost recovery mechanisms.
FTR settlement losses of $8.2 million were recognized for the year ended Dec. 31, 2014, recorded to electric fuel and purchasedpower. These derivative settlement gains and losses are shared with electric customers through fuel and purchased energycost-recovery mechanisms, and reclassified out of income as regulatory assets or liabilities, as appropriate.
SPS had no derivative instruments designated as fair value hedges during the years ended Dec. 31, 2014 and 2013. Therefore, nogains or losses from fair value hedges or related hedged transactions were recognized for these periods.
Name of Respondent
Southwestern Public Service Company
This Report is:(1) X An Original(2) A Resubmission
Date of Report(Mo, Da, Yr)
04/13/2015
Year/Period of Report
2014/Q4
NOTES TO FINANCIAL STATEMENTS (Continued)
FERC FORM NO. 1 (ED. 12-88) Page 123.24
70
Schedule Q-5 Page 70 of 300
Sponsor: Robinson Case No. 15-00139-UT

Recurring Fair Value Measurements — The following table presents for each of the fair value hierarchy levels, SPS’ derivativeassets and liabilities measured at fair value on a recurring basis at Dec. 31, 2014:
Name of Respondent
Southwestern Public Service Company
This Report is:(1) X An Original(2) A Resubmission
Date of Report(Mo, Da, Yr)
04/13/2015
Year/Period of Report
2014/Q4
NOTES TO FINANCIAL STATEMENTS (Continued)
FERC FORM NO. 1 (ED. 12-88) Page 123.25
71
Schedule Q-5 Page 71 of 300
Sponsor: Robinson Case No. 15-00139-UT

The following table presents for each of the fair value hierarchy levels, SPS’ derivative assets and liabilities measured at fair value on arecurring basis at Dec. 31, 2013:
The following table presents the changes in Level 3 commodity derivatives for the years ended Dec. 31, 2014 and 2013:
Year Ended Dec. 31
(Thousands of Do llars) 2014 2013
Balance at Jan. 1 $ 9,933 $ —Purchases 50,244 9,933Settlements (44,283) —
Net transactions recorded during the period:Losses recognized as regulatory assets (10) —
Balance at Dec. 31 $ 15,884 $ 9,933
SPS recognizes transfers between levels as of the beginning of each period. There were no transfers of amounts between levels forderivative instruments for the years ended Dec. 31, 2014 and 2013.
Name of Respondent
Southwestern Public Service Company
This Report is:(1) X An Original(2) A Resubmission
Date of Report(Mo, Da, Yr)
04/13/2015
Year/Period of Report
2014/Q4
NOTES TO FINANCIAL STATEMENTS (Continued)
FERC FORM NO. 1 (ED. 12-88) Page 123.26
72
Schedule Q-5 Page 72 of 300
Sponsor: Robinson Case No. 15-00139-UT

Fair Value of Long-Term Debt
As of Dec. 31, 2014 and 2013, other financial instruments for which the carrying amount did not equal fair value were as follows:
2014 2013
(Thousands of Dollars)CarryingAmount Fair Value
Ca rryingAmount Fa ir Value
Long-term debt, including current portion $ 1,349,691 $ 1,572,414 $ 1,199,865 $ 1,307,035
The fair value of SPS’ long-term debt is estimated based on recent trades and observable spreads from benchmark interest rates forsimilar securities. The fair value estimates are based on information available to management as of Dec. 31, 2014 and 2013, and giventhe observability of the inputs to these estimates, the fair values presented for long-term debt have been assigned a Level 2.
7. Rate Matters
Pending and Recently Concluded Regulatory Proceedings — Public Utility Commission of Texas (PUCT)
Texas 2015 Electric Rate Case — In December 2014, SPS filed a retail electric, non-fuel rate case in Texas with each of its Texasmunicipalities and the PUCT seeking an overall increase in annual revenue of approximately $64.75 million, or 6.7 percent. The filingis based on a historical test year (HTY) ended June 2014, adjusted for known and measurable changes, an return of equity (ROE) of10.25 percent, an electric rate base of approximately $1.56 billion and an equity ratio of 53.97 percent.
As part of its request, SPS is seeking a waiver of the PUCT post-test year adjustment rule which would allow for inclusion of $442million (total company) additional capital investment for the period July 1, 2014 through Dec. 31, 2014.
The following table summarizes the net request:
(Mill ions of Dol lars) Request
Investment for capital expenditures — post-test year adjustments $ 29.60Depreciation expense 13.90Wholesale load reductions 12.00Purchased power capacity costs 3.20Other, net 6.05
Total $ 64.75
The next steps in the procedural schedule are expected to be as follows:
• Intervenor Direct Testimony — April 1, 2015;• Staff Direct Testimony — April 8, 2015;• Staff and Intervenor Cross-Rebuttal Testimony — April 22, 2015;• Rebuttal Testimony — April 24, 2015; and• Evidentiary Hearing — May 11, 2015.
The parties have agreed the rates will be effective June 11, 2015. A PUCT decision is anticipated in the second half of 2015.
Texas 2014 Electric Rate Case — In January 2014, SPS filed a retail electric rate case in Texas seeking a net increase in annualrevenue of approximately $52.7 million, or 5.8 percent. The net increase reflected a base rate increase, revenue credits transferredfrom base rates to rate riders or the fuel clause, and resetting the transmission cost recovery factor (TCRF) to zero when the final baserates become effective. In April 2014, SPS revised its request to a net increase of $48.1 million.
Name of Respondent
Southwestern Public Service Company
This Report is:(1) X An Original(2) A Resubmission
Date of Report(Mo, Da, Yr)
04/13/2015
Year/Period of Report
2014/Q4
NOTES TO FINANCIAL STATEMENTS (Continued)
FERC FORM NO. 1 (ED. 12-88) Page 123.27
73
Schedule Q-5 Page 73 of 300
Sponsor: Robinson Case No. 15-00139-UT

The rate filing was based on an HTY ending June 2013, a requested ROE of 10.40 percent, an electric rate base of approximately$1.27 billion and an equity ratio of 53.89 percent. The requested rate increase reflected an increase in depreciation expense ofapproximately $16 million.
In September 2014, SPS, PUCT staff, and intervenors filed a non-unanimous settlement agreement which would increase SPS’ rates by$37 million, or 3.5 percent, retroactive to June 1, 2014. Starting Oct. 1, 2014, SPS began collecting the rate increase through interimrates subject to refund. SPS expects to recover the rate increase for June through September 2014 through a separate surcharge, forwhich it has recognized approximately $15.4 million of revenue in 2014.
The settlement includes an ROE of 9.7 percent solely for the purpose of calculating the AFUDC and determining baselines in futurefilings for the TCRF. In October 2014, the ALJs approved the stipulation and recommended that SPS file to implement the surchargefollowing the PUCT’s final order.
Although the parties to the settlement agreement have not prepared a calculation of the $37 million increase and do not agree aboutwhich specific costs are included, or not, in the agreed settlement revenue requirement, SPS’ reconciliation of its original request to thesettlement increase is as follows:
(Mill ions of Dol lars ) Settlement Agreement
Base rate increase request, January 2014 $ 81.5Revisions for updated information (4.6)Revised request, April 2014 76.9Remove proposed increase in depreciation (16.0)Remove adjustment allocators for certain wholesale load reduction (12.0)Revised amortizations (rate case expenses, pension and other post-employment benefits expense and gain on sale to Lubbock) (9.0)
Non-specified settlement adjustments (2.9)Settlement base rate increase $ 37.0
In December 2014, the PUCT approved the settlement and authorized SPS to file to implement the surcharge. In January 2015, SPSfiled an application to implement a surcharge of approximately $15.6 million, including interest, to be recovered from March throughJune 2015, subject to a true-up. The PUCT approved SPS to implement the surcharge effective March 1, 2015.
Electric, Purchased Gas and Resource Adjustment Clauses
TCRF Rider — In November 2013, SPS filed with the PUCT to implement the TCRF for Texas retail customers. The requestedincrease in revenues was $13 million. The PUCT issued an order allowing the TCRF to go into effect on an interim basis effectiveJan. 1, 2014. In May 2014, the ALJ terminated the interim TCRF due to a settlement in principle being reached with intervenors andthe PUCT staff in the pending Texas electric rate case. In July 2014, the PUCT approved the settlement agreement between the partiesallowing SPS to recover $4 million annually through the TCRF. In September 2014, SPS filed a proposal with the PUCT to refundapproximately $3.7 million during November 2014 for interim rates collected in excess of the final rates approved. Under a settlementamong the parties, SPS implemented the refund in November 2014, pending PUCT approval. The PUCT approved the refund on Dec.18, 2014.
Pending Regulatory Proceedings — New Mexico Public Regulation Commission (NMPRC)
New Mexico 2014 Electric Rate Case — In December 2012, SPS filed an electric rate case in New Mexico with the NMPRC for anincrease in annual revenue of approximately $45.9 million effective in 2014. The rate filing was based on a 2014 FTY, a requestedROE of 10.65 percent, an electric rate base of $479.8 million and an equity ratio of 53.89 percent.
In September 2013, SPS filed rebuttal testimony, revising its requested rate increase to $32.5 million, based on updated informationand an ROE of 10.25 percent. The request reflected a base and fuel increase of $20.9 million, an increase of rider revenue of $12.1million and a decrease to other of $0.5 million.
Name of Respondent
Southwestern Public Service Company
This Report is:(1) X An Original(2) A Resubmission
Date of Report(Mo, Da, Yr)
04/13/2015
Year/Period of Report
2014/Q4
NOTES TO FINANCIAL STATEMENTS (Continued)
FERC FORM NO. 1 (ED. 12-88) Page 123.28
74
Schedule Q-5 Page 74 of 300
Sponsor: Robinson Case No. 15-00139-UT

In March 2014, the NMPRC approved an overall increase of approximately $33.1 million. The increase reflects a base rate increase of$12.7 million and rider recovery of $18.1 million for renewable energy costs, both based on an ROE of 9.96 percent and an equityratio of 53.89 percent. Final rates were effective April 5, 2014. In April 2014, the New Mexico Attorney General (NMAG) filed arequest for rehearing. The rehearing request was denied by the NMPRC. In June 2014, the NMAG filed an appeal of the NMPRC’sdenial to the New Mexico Supreme Court. A decision is expected by the second quarter of 2016.
Pending and Recently Concluded Regulatory Proceedings — FERC
Wholesale Rate Complaints — In April 2012, Golden Spread Electric Cooperative, Inc. (Golden Spread), a wholesale cooperativecustomer, filed a rate complaint alleging that the base ROE included in the SPS production formula rate of 10.25 percent, and the SPStransmission base formula rate ROE of 10.77 percent, are unjust and unreasonable. In July 2013, Golden Spread filed a secondcomplaint, again asking that the base ROE in the SPS production and transmission formula rates be reduced to 9.15 and 9.65 percent,respectively.
In June 2014, the FERC issued an order in a different ROE proceeding adopting a new ROE methodology for electric utilities. Thenew ROE methodology requires electric utilities to use a two-step discounted cash flow analysis to estimate cost of equity thatincorporates both short-term and long-term growth projections.
The FERC also issued orders consolidating the Golden Spread ROE complaints and setting them for settlement judge procedures andhearings and indicated the parties should apply the new two-step discounted cash flow ROE methodology to the proceedings. TheFERC established effective dates for the refunds as April 20, 2012 and July 19, 2013. Settlement judge procedures were unsuccessfuland the complaints were set for hearing procedures, with an initial administrative law judge (ALJ) decision to be issued by Nov. 25,2015 and a final FERC order to be issued no earlier than 2016. In January 2015, Golden Spread filed testimony requesting thatwholesale production and transmission formula rates be reduced to 8.78 percent and 9.28 percent, respectively, for the period April 20,2012 to July 18, 2013, and reduced to 8.51 percent and 9.01 percent, respectively, for the period July 19, 2013 to Oct. 19, 2014.
Golden Spread, along with certain New Mexico cooperatives and the West Texas Municipal Power Agency, separately filed a thirdrate complaint in October 2014, requesting that the base ROE in the SPS production and transmission formula rates be reduced to 8.61percent and 9.11 percent, respectively. The complainants requested a refund effective date of Oct. 20, 2014. In January 2015, theFERC issued an order setting the third complaint for hearing procedures and granting the complainants’ requested refund effectivedate.
FERC Complaint Case Orders — In August 2013, the FERC issued an order on rehearing related to a 2004 complaint case brought byGolden Spread and Public Service Company of New Mexico (PNM) and an Order on Initial Decision in a subsequent 2006 productionrate case filed by SPS.
The original complaint included two key components: 1) PNM’s claim regarding inappropriate allocation of fuel costs and 2) a baserate complaint, including the appropriate demand-related cost allocator. The FERC previously determined that the allocation of fuelcosts and the demand-related cost allocator utilized by SPS was appropriate.
In the August 2013 Orders, the FERC clarified its previous ruling on the allocation of fuel costs and reaffirmed that the refunds inquestion should only apply to firm requirements customers and not PNM’s contractual load. The FERC also reversed its priordemand-related cost allocator decision. The FERC stated that it had erred in its initial analysis and concluded that the SPS system wasa 3CP rather than a 12CP system.
In September 2013, SPS filed a request for rehearing of the FERC ruling on the coincident peak (CP) allocation and refund decisions. SPS asserted that the FERC applied an improper burden of proof and that precedent did not support retroactive refunds. PNM alsorequested rehearing of the FERC decision not to reverse its prior ruling. In October 2013, the FERC issued orders further consideringthe requests for rehearing, which are currently pending. As of Dec. 31, 2013, SPS had accrued $44.5 million related to the August2013 Orders and an additional $5.9 million of principal and interest was accrued during 2014.
Name of Respondent
Southwestern Public Service Company
This Report is:(1) X An Original(2) A Resubmission
Date of Report(Mo, Da, Yr)
04/13/2015
Year/Period of Report
2014/Q4
NOTES TO FINANCIAL STATEMENTS (Continued)
FERC FORM NO. 1 (ED. 12-88) Page 123.29
75
Schedule Q-5 Page 75 of 300
Sponsor: Robinson Case No. 15-00139-UT

On Jan. 30, 2015, SPS filed to revise the production formula rates for six of its wholesale customers, including Golden Spread,effective Feb. 1, 2015. The filing proposes several modifications, including a reduction in wholesale depreciation rates and the use ofa 12CP demand-related cost allocator. On March 31, 2015, the FERC accepted this filing, effective July 1, 2015, subject to refund andsettlement judge procedures.
Sale of Texas Transmission Assets — In March 2013, SPS reached an agreement to sell certain segments of SPS’ transmission linesand two related substations to Sharyland Distribution and Transmission Services, LLC (Sharyland). In 2013, SPS received allnecessary regulatory approvals for the transaction. In December 2013, SPS received $37.1 million and recognized a pre-tax gain of$13.6 million and regulatory liabilities for jurisdictional gain sharing of $7.2 million. The gain is reflected in the statement of incomeas a reduction to operating expenses. In December 2014, Golden Spread submitted a preliminary challenge asserting that the gainshould be shared with wholesale transmission customers. SPS has disputed this claim. It is uncertain if the matter will result in aformal proceeding with the FERC.
Request for Waiver of SPP Tariff — In July 2014, SPS filed a request for the FERC to grant SPS a waiver of an SPP tariff regardingthe billing of SPP administrative and transmission expansion charges for certain loads that left the SPS system at the end of 2013through a sale of transmission assets to Sharyland. Under the SPP tariff provisions, SPP assesses these charges based on prior yearload. Absent the waiver, SPS would be billed approximately $2.9 million by SPP in 2014 for loads that are no longer served by SPS. SPP has intervened to oppose the waiver request and Sharyland has intervened to support the waiver request. FERC action is pending.
8. Commitments and Contingencies
Commitments
Capital Commitments — SPS has made commitments in connection with a portion of its projected capital expenditures. SPS’ capitalcommitments primarily relate to transmission project plans.
Transmission Notifications to Construct ( NTC) — SPS has accepted NTCs for several hundred miles of transmission line and relatedsubstation projects based on needs identified through SPP’s various planning processes, including those associated with economics,reliability, generator interconnection or the load addition processes. Most significant is the TUCO to Yoakum County to Hobbs Plant,a 345 kilovolt (KV) transmission line. This line will connect the TUCO substation near Lubbock, Texas with the Yoakum Countysubstation, continuing on to the Hobbs Plant substation near Hobbs, N.M. SPS anticipates filing certificate of convenience andnecessity (CCNs) for this line in Texas and in New Mexico in mid-2015. The line is scheduled to be in service in 2020.
Fuel Contracts — SPS has entered into various long-term commitments for the purchase and delivery of a significant portion of itscurrent coal and natural gas requirements. These contracts expire in various years between 2015 and 2033. SPS is required to payadditional amounts depending on actual quantities shipped under these agreements.
The estimated minimum purchases for SPS under these contracts as of Dec. 31, 2014, are as follows:
(Mill ions of Dol lars ) CoalNatural gas
supply
Natural gass torage and
transportation2015 $ 258.0 $ 3.3 $ 31.02016 225.1 — 30.82017 114.9 — 22.12018 — — 20.62019 — — 21.5Thereafter — — 95.9
Total $ 598.0 $ 3.3 $ 221.9
Additional expenditures for fuel and natural gas storage and transportation will be required to meet expected future electric generationneeds. SPS’ risk of loss, in the form of increased costs from market price changes in fuel, is mitigated through the cost-rate adjustmentmechanisms, which provide for pass-through of most fuel, storage and transportation costs to customers.
Name of Respondent
Southwestern Public Service Company
This Report is:(1) X An Original(2) A Resubmission
Date of Report(Mo, Da, Yr)
04/13/2015
Year/Period of Report
2014/Q4
NOTES TO FINANCIAL STATEMENTS (Continued)
FERC FORM NO. 1 (ED. 12-88) Page 123.30
76
Schedule Q-5 Page 76 of 300
Sponsor: Robinson Case No. 15-00139-UT

PPAs — SPS has entered into PPAs with other utilities and energy suppliers with expiration dates through 2033 for purchased powerto meet system load and energy requirements and meet operating reserve obligations. In general, these contracts provide for energypayments, based on actual energy delivered and capacity payments. Capacity payments are typically contingent on the independentpower producing entity meeting certain contract obligations, including plant availability requirements. Certain contractual paymentsare adjusted based on market indices. The effects of price adjustments on our financial results are mitigated through purchased energycost recovery mechanisms.
Included in electric fuel and purchased power expenses for PPAs accounted for as executory contracts, were payments for capacity of$52.4 million and $38.4 million in 2014 and 2013, respectively. At Dec. 31, 2014, the estimated future payments for capacity that SPSis obligated to purchase pursuant to these executory contracts, subject to availability, are as follows:
(Mill ions of Dollars)
2015 $ 56.62016 57.12017 58.32018 59.62019 19.5Thereafter 36.1
Total (a) $ 287.2
(a) Excludes contingent energy p ayments for renewable energy PPAs.
Additional energy payments under these PPAs and PPAs accounted for as operating leases will be required to meet expected futureelectric demand.
Leases — SPS leases a variety of equipment and facilities used in the normal course of business. These leases, primarily for officespace, generating facilities, trucks, aircraft, cars and power-operated equipment, are accounted for as operating leases. Total expensesunder operating lease obligations were approximately $63.1 million and $64.2 million for 2014 and 2013, respectively. Theseexpenses included capacity payments for PPAs accounted for as operating leases of $57.1 million and $59.0 million in 2014 and 2013,respectively, recorded to electric fuel and purchased power expenses.
Included in the future commitments under operating leases are estimated future capacity payments under PPAs that have beenaccounted for as operating leases in accordance with the applicable accounting guidance. Future commitments under operating leasesare:
(Mill ions of Dollars)Operating
Leases
PPA (a) (b)
OperatingLeases
TotalOperating
Leases
2015 $ 3.3 $ 52.0 $ 55.32016 3.4 49.0 52.42017 2.4 49.0 51.42018 2.0 49.0 51.02019 1.9 49.0 50.9Thereafter 11.4 671.8 683.2
(a)Amounts do not include PPAs accou nted for as executory contracts.
(b)PPA operating leases contractually expire through 2033.
Name of Respondent
Southwestern Public Service Company
This Report is:(1) X An Original(2) A Resubmission
Date of Report(Mo, Da, Yr)
04/13/2015
Year/Period of Report
2014/Q4
NOTES TO FINANCIAL STATEMENTS (Continued)
FERC FORM NO. 1 (ED. 12-88) Page 123.31
77
Schedule Q-5 Page 77 of 300
Sponsor: Robinson Case No. 15-00139-UT

Environmental Contingencies
SPS has been or is currently involved with the cleanup of contamination from certain hazardous substances at several sites. In manysituations, SPS believes it will recover some portion of these costs through insurance claims. Additionally, where applicable, SPS ispursuing, or intends to pursue, recovery from other PRPs and through the regulated rate process. New and changing federal and stateenvironmental mandates can also create added financial liabilities for SPS, which are normally recovered through the regulated rateprocess. To the extent any costs are not recovered through the options listed above, SPS would be required to recognize an expense.
Site Remediation — Various federal and state environmental laws impose liability, without regard to the legality of the originalconduct, where hazardous substances or other regulated materials have been released to the environment. SPS may sometimes pay allor a portion of the cost to remediate sites where past activities of SPS or other parties have caused environmental contamination. Environmental contingencies could arise from various situations, including sites of former manufactured gas plants operated by SPS,its predecessors, or other entities; and third-party sites, such as landfills, for which SPS is alleged to be a PRP that sent hazardousmaterials and wastes to that site.
Environmental Requirements
Water and WasteAsbestos Removal — Some of SPS’ facilities contain asbestos. Most asbestos will remain undisturbed until the facilities that contain itare demolished or removed. SPS has recorded an estimate for final removal of the asbestos as an ARO. It may be necessary to removesome asbestos to perform maintenance or make improvements to other equipment. The cost of removing asbestos as part of other workis not expected to be material and is recorded as incurred as operating expenses for maintenance projects, capital expenditures forconstruction projects or removal costs for demolition projects.
Federal Clean Water Act (CWA) Effluent Limitations Guidelines (ELG) — In June 2013, the EPA published a proposed ELG rulefor power plants that use coal, natural gas, oil or nuclear materials as fuel and discharge treated effluent to surface waters as well asutility-owned landfills that receive coal combustion residuals. The final rule is now expected in September 2015. Under the currentproposed rule, facilities would need to comply as soon as possible after July 2017, but no later than July 2022. The impact of this ruleon SPS is uncertain at this time.
Federal CWA Waters of the United States Rule — In April 2014, the EPA and the U.S. Army Corps of Engineers issued a proposedrule that significantly expands the types of water bodies regulated under the CWA. If finalized as proposed, this rule could delay thesiting of new pipelines, transmission lines and distribution lines, increase project costs and expand permitting and reportingrequirements. The ultimate impact of the proposed rule will depend on the specific requirements of the final rule and cannot bedetermined at this time. A final rule is not anticipated before the second quarter of 2015.
Coal Ash Regulation — SPS’ operations are subject to federal and state laws that impose requirements for handling, storage, treatmentand disposal of solid waste. In 2010, the EPA published a proposed rule on the regulation of coal combustion byproducts (coal ash) ashazardous or nonhazardous waste. The EPA issued a pre-publication version of the final rule in December 2014, which oncepromulgated will impose new rules to regulate coal ash as a nonhazardous solid waste. SPS’ costs for the management and disposal ofcoal ash will not significantly increase under the new rule.
AirGreenhouse Gas (GHG) Emission Standard for Existing Sources — In June 2014, the EPA published its proposed rule on GHGemission standards for existing power plants. Comments were due to the EPA on Dec. 1, 2014 and a final rule is anticipated inmid-summer 2015. Following adoption of the final rule, states must develop implementation plans by June 2016, with the possibilityof an extension to June 2017 (June 2018 if submitting a joint plan with other states). Among other things, the proposed rule wouldrequire that state plans include enforceable measures to ensure emissions from existing power plants in the state achieve the EPA’sstate-specific interim (2020-2029) and final (2030 and thereafter) emission performance targets. The plan will likely require additionalemission reductions in states in which SPS operates. It is not possible to evaluate the impact of existing source standards until the EPApromulgates a final rule and states have adopted their applicable state plans.
Name of Respondent
Southwestern Public Service Company
This Report is:(1) X An Original(2) A Resubmission
Date of Report(Mo, Da, Yr)
04/13/2015
Year/Period of Report
2014/Q4
NOTES TO FINANCIAL STATEMENTS (Continued)
FERC FORM NO. 1 (ED. 12-88) Page 123.32
78
Schedule Q-5 Page 78 of 300
Sponsor: Robinson Case No. 15-00139-UT

GHG New Source Performance Standard (NSPS) Proposal — In January 2014, the EPA re-proposed a GHG NSPS for newlyconstructed power plants which would set performance standards (maximum carbon dioxide emission rates) for coal- and naturalgas-fired power plants. For coal power plants, the NSPS requires an emissions level equivalent to partial carbon capture and storage(CCS) technology; for gas-fired power plants, the NSPS reflects emissions levels from combined cycle technology with no CCS. TheEPA continues to propose that the NSPS not apply to modified or reconstructed existing power plants. In addition, installation ofcontrol equipment on existing plants would not constitute a “modification” to those plants under the NSPS program. A final rule isanticipated in mid-summer 2015. It is not possible to evaluate the impact of the re-proposed NSPS until its final requirements areknown.
GHG NSPS for Modified and Reconstructed Power Plants — In June 2014, the EPA published a proposed NSPS that would apply toGHG emissions from power plants that are modified or reconstructed. A final rule is anticipated in mid-summer 2015. A modificationis a change to an existing source that increases the maximum achievable hourly rate of emissions. A reconstruction involves thereplacement of components at a unit to the extent that the capital cost of the new components exceeds 50 percent of the capital cost ofan entirely new comparable unit. The proposed standards would not require installation of CCS technology. Instead, the proposedstandard for coal-fired power plants would require a combination of best operating practices and equipment upgrades. The proposalfor gas-fired power plants would require emissions standards based on efficient combined cycle technology. It is not possible toevaluate the impact of these proposed standards until the final requirements are known. In addition, it is not clear whether theserequirements, once adopted, would apply to future changes at SPS’ power plants.
Cross-State Air Pollution Rule (CSAPR) — CSAPR addresses long range transport of particular matter (PM) and ozone by requiringreductions in SO2 and NOx from utilities in the eastern half of the United States, including Texas, using an emissions trading program.
In August 2012, the United States Court of Appeals for the District of Columbia Circuit (D.C. Circuit) vacated the CSAPR andremanded it back to the EPA. The D.C. Circuit stated the EPA must continue administering CSAPR’s predecessor rule pendingadoption of a valid replacement. In April 2014, the U.S. Supreme Court reversed and remanded the case to the D.C. Circuit. TheSupreme Court held that the EPA’s rule design did not violate the CAA and that states had received adequate opportunity to developtheir own plans. Because the D.C. Circuit overturned the CSAPR on two over-arching issues, there are many other issues the D.C.Circuit did not rule on that will now need to be considered on remand. In October 2014, the D.C. Circuit granted the EPA’s request tobegin to implement CSAPR by imposing its 2012 compliance obligations starting in January 2015. In addition, the D.C. Circuit set abriefing schedule and plans to hear arguments on the remaining issues in the case in February 2015. While the litigation continues, theEPA will begin to administer the CSAPR in 2015.
Multiple changes to the SPS system since 2011 will substantially reduce estimated costs of complying with the CSAPR. These includethe addition of 700 MW of wind power, the construction of Jones Units 3 and 4 to meet reserve requirements and provide quick startcapability, reduced wholesale load and new PPAs, installation of NOx combustion controls on Tolk Units 1 and 2 and completion ofcertain transmission projects. As a result, SPS estimates compliance with the CSAPR in 2015 will cost approximately $7 million.
Electric Generating Unit (EGU) Mercury and Air Toxics Standards (MATS) Rule — The final EGU MATS rule became effective inApril 2012. The EGU MATS rule sets emission limits for acid gases, mercury and other hazardous air pollutants and requirescoal-fired utility facilities greater than 25 MW to demonstrate compliance within three to four years of the effective date. SPS expectsto comply with the EGU MATS rule through a combination of mercury and other emission control projects. In 2014, the U.S.Supreme Court decided to review the D.C. Circuit’s decision that upheld the MATS standard. It is not yet known what impact theSupreme Court’s decision may have on the MATS standard or its implementation schedule. SPS believes EGU MATS costs will berecoverable through regulatory mechanisms and does not expect a material impact on results of operations, financial position or cashflows.
Regional Haze Rules — The regional haze program is designed to address widespread, regionally homogeneous haze that results fromemissions from a multitude of sources. In 2005, the EPA amended the best available retrofit technology (BART) requirements of itsregional haze rules, which require the installation and operation of emission controls for industrial facilities emitting air pollutants thatreduce visibility in certain national parks and wilderness areas. In its first regional haze state implemented plan (SIP), Texas identifiedthe SPS facilities that will have to reduce SO2, NOx and PM emissions under BART and set emissions limits for those facilities.
Name of Respondent
Southwestern Public Service Company
This Report is:(1) X An Original(2) A Resubmission
Date of Report(Mo, Da, Yr)
04/13/2015
Year/Period of Report
2014/Q4
NOTES TO FINANCIAL STATEMENTS (Continued)
FERC FORM NO. 1 (ED. 12-88) Page 123.33
79
Schedule Q-5 Page 79 of 300
Sponsor: Robinson Case No. 15-00139-UT

Harrington Units 1 and 2 are potentially subject to BART. Texas developed a SIP that finds the Clean Air Interstate Rule (CAIR)equal to BART for EGUs. As a result, no additional controls beyond CAIR compliance would be required. In May 2012, the EPAdeferred its review of the SIP in its final rule allowing states to find that CSAPR compliance meets BART requirements for EGUs. InDecember 2014, the EPA proposed to approve the BART portion of the SIP, with the exception that the EPA would substitute CSAPRcompliance for Texas’ reliance on CAIR. The EPA currently plans to issue its final rule in August 2015.
In May 2014, the EPA issued a request for information under the CAA related to SO2 control equipment at Tolk Units 1 and 2. In its
December 2014 proposal, the EPA plans to disapprove the reasonable progress portions of the SIP and instead adopt a FederalImplementation Plan. For SPS, the EPA proposed to require dry scrubbers on both Tolk units to reduce SO2 emissions to help achieve
reasonable progress goals the EPA would establish for Texas and Oklahoma national parks and wilderness areas. As proposed, the dryscrubbers would need to be installed and operating within five years of the EPA’s final action, currently expected in August 2015. SPSplans to file comments objecting to the installation of dry scrubbers on the units. Whether dry scrubbers are required is dependent onthe EPA’s final decision. If required, they would cost approximately $600 million, with an annual operating cost of approximately$10.4 million.
Revisions to the National Ambient Air Quality Standards (NAAQS) for PM — In December 2012, the EPA lowered the primaryhealth-based NAAQS for annual average fine PM and retained the current daily standard for fine PM. In areas where SPS operatespower plants, current monitored air concentrations are below the level of the final annual primary standard. In December 2014, theEPA issued its final designations, which did not include areas in any states in which SPS operates.
Revisions to the NAAQS for Ozone — In December 2014, the EPA proposed to revise the NAAQS for ozone by lowering theeight-hour standard from 0.075 parts per million (ppm) to a level within the range of 0.065-0.070 ppm. The EPA is also takingcomment on a level for the standard as low as 0.060 ppm. In areas where SPS operates, current monitored air quality concentrationsare above the proposed level of 0.070 ppm in the Texas panhandle. The EPA is expected to adopt a new ozone standard in a final ruleto be issued in October 2015. Depending on the level of the standard, impacted states would study the sources of the nonattainmentand make emission reduction plans to attain the standards. These plans would be due to the EPA in 2020 or 2021. Such plans couldinclude installation of further NOx controls on power plants. It is not possible to evaluate the impact of this proposal until the finalstandard is adopted, the designation of nonattainment areas is made in late 2017 based on air quality data years 2014-2016, and anyrequired state plans are developed.
Asset Retirement Obligations
Recorded AROs — AROs have been recorded for property related to the following: electric steam production, electric distribution andtransmission, and general property. The electric production obligations include asbestos, ash-containment facilities, storage tanks andcontrol panels. The asbestos recognition associated with the electric production includes certain plants. This asbestos abatementremoval obligation originated in 1973 with the Clean Air Act (CAA), which applied to the demolition of buildings or removal ofequipment containing asbestos that can become airborne on removal. AROs also have been recorded for steam production related toash-containment facilities such as bottom ash ponds, evaporation ponds and solid waste landfills. The origination dates on the AROrecognition for ash-containment facilities at steam plants were the in-service dates of the various facilities.
An ARO was recognized for the removal of electric transmission and distribution equipment, which consists of many small potentialobligations associated with Polychlorinated biphenyl (PCBs), mineral oil, storage tanks, treated poles, lithium batteries, mercury andstreet lighting lamps. The electric general AROs include small obligations related to storage tanks, radiation sources and officebuildings. These assets have numerous in-service dates for which it is difficult to assign the obligation to a particular year. Therefore,the obligation was measured using an average service life.
In December 2014, the EPA issued a pre-publication version of a final rule imposing requirements for activities involving coal ashwaste. The ruling, once effective, will not result in the creation of a new legal obligation and SPS’ estimated cash flows for the closureof coal ash landfills and impoundments are not expected to significantly increase as a result of the ruling.
Name of Respondent
Southwestern Public Service Company
This Report is:(1) X An Original(2) A Resubmission
Date of Report(Mo, Da, Yr)
04/13/2015
Year/Period of Report
2014/Q4
NOTES TO FINANCIAL STATEMENTS (Continued)
FERC FORM NO. 1 (ED. 12-88) Page 123.34
80
Schedule Q-5 Page 80 of 300
Sponsor: Robinson Case No. 15-00139-UT

A reconciliation of SPS’ AROs for the years ended Dec. 31, 2014 and 2013 is as follows:
(T housands of Dollars)Begin nin g Bal ance
Jan. 1, 2 014Liab ili ti es
Recogn ized AccretionCash Flow Revisions
E nd ing B alance Dec. 31, 201 4 (a)
Electric plantSteam production asbestos $ 11,608 $ — $ 795 $ 4,554 $ 16,957Electr ic distribution 6,104 — 223 — 6,327Steam production ash containment 809 — 51 749 1,609Steam and other production miscellaneous 628 136 23 117 904Electr ic transmission 25 — 1 — 26General 201 — 7 — 208
Total liability $ 19,375 $ 136 $ 1,100 $ 5,420 $ 26,031
(a)Th ere were no AR O li abi liti es settl ed during t he year ended Dec. 31, 2014.
(T housands of Dollars)Begin nin g Bal ance
Jan. 1, 2 013Liab ili ti es
Settl ed AccretionCash Flow Revisions
E nd ing B alance Dec. 31, 2013 (a)
Electric plantSteam production asbestos $ 10,979 $ (11 8) $ 747 $ — $ 11,608Steam production ash containment 764 — 48 (3) 809Steam production miscellaneous 291 — 23 314 628Electr ic distribution 5,303 — 171 630 6,104Electr ic transmission 225 — 16 (216) 25General 45 — 3 153 201
Total liability $ 17,607 $ (11 8) $ 1,008 $ 878 $ 19,375
(a)Th ere were no n ew AR O liabilit ies recognized duri ng the year ended Dec. 31, 20 13.
Legal Contingencies
SPS is involved in various litigation matters that are being defended and handled in the ordinary course of business. The assessment ofwhether a loss is probable or is a reasonable possibility, and whether the loss or a range of loss is estimable, often involves a series ofcomplex judgments about future events. Management maintains accruals for such losses that are probable of being incurred andsubject to reasonable estimation. Management is sometimes unable to estimate an amount or range of a reasonably possible loss incertain situations, including but not limited to when (1) the damages sought are indeterminate, (2) the proceedings are in the earlystages, or (3) the matters involve novel or unsettled legal theories. In such cases, there is considerable uncertainty regarding the timingor ultimate resolution of such matters, including a possible eventual loss. For current proceedings not specifically reported herein,management does not anticipate that the ultimate liabilities, if any, arising from such current proceedings would have a material effecton SPS’ financial statements. Unless otherwise required by GAAP, legal fees are expensed as incurred.
Employment, Tort and Commercial Litigation
Exelon Wind (formerly John Deere Wind) Complaint — Several lawsuits in Texas state and federal courts and regulatoryproceedings have arisen out of a dispute concerning SPS’ payments for energy and capacity produced from the Exelon Windsubsidiaries’ projects. There are two main areas of dispute. First, Exelon Wind claims that it established legally enforceableobligations (LEOs) for each of its 12 wind facilities in 2005 through 2008 that require SPS to buy power based on SPS’ forecastedavoided cost as determined in 2005 through 2008. Although SPS has refused to accept Exelon Wind’s LEOs, SPS accepts that it musttake energy from Exelon Wind under SPS’ PUCT-approved qualifying facilities (QF) Tariff. Second, Exelon Wind has raised variouschallenges to SPS’ PUCT-approved QF Tariff, which became effective in August 2010. On Jan.16, 2015, Exelon Wind filed motionsto dismiss or notices of non-suits for its state and federal lawsuits regarding the QF tariff, and for its state and federal lawsuits andregulatory proceedings regarding the LEOs. Later in January, the PUCT and state and federal courts issued orders dismissing thecases. The only remaining proceedings are pending before the FERC (one regarding the QF Tariff and the other regarding the LEOs).
Name of Respondent
Southwestern Public Service Company
This Report is:(1) X An Original(2) A Resubmission
Date of Report(Mo, Da, Yr)
04/13/2015
Year/Period of Report
2014/Q4
NOTES TO FINANCIAL STATEMENTS (Continued)
FERC FORM NO. 1 (ED. 12-88) Page 123.35
81
Schedule Q-5 Page 81 of 300
Sponsor: Robinson Case No. 15-00139-UT

SPS believes the likelihood of loss in these proceedings is remote based primarily on existing case law and while it is not possible toestimate the amount or range of reasonably possible loss in the event of an adverse outcome, SPS believes such loss would not bematerial based upon its belief that it would be permitted to recover such costs, if needed, through its various fuel clause mechanisms. No accrual has been recorded for this matter.
Other Contingencies
See Note 7 for further discussion.
9. Regulatory Assets and Liabilities
SPS’ financial statements are prepared in accordance with the applicable accounting guidance, as discussed in Note 1. Under thisguidance, regulatory assets and liabilities are created for amounts that regulators may allow to be collected, or may require to be paidback to customers in future electric rates. If changes in the utility industry or the business of SPS no longer allow for the application ofregulatory accounting guidance under GAAP, SPS would be required to recognize the write-off of regulatory assets and liabilities innet income or OCI.
The components of regulatory assets shown on the balance sheets of SPS at Dec. 31, 2014 and 2013 are:
Name of Respondent
Southwestern Public Service Company
This Report is:(1) X An Original(2) A Resubmission
Date of Report(Mo, Da, Yr)
04/13/2015
Year/Period of Report
2014/Q4
NOTES TO FINANCIAL STATEMENTS (Continued)
FERC FORM NO. 1 (ED. 12-88) Page 123.36
82
Schedule Q-5 Page 82 of 300
Sponsor: Robinson Case No. 15-00139-UT

The components of regulatory liabilities shown on the balance sheets of SPS at Dec. 31, 2014 and 2013 are:
At Dec. 31, 2014 and 2013, approximately $53 million and $30 million of SPS’ regulatory assets represented past expenditures notcurrently earning a return, respectively. This amount primarily includes certain expenditures associated with renewable resources andenvironmental initiatives.
10. Other Comprehensive Income
Changes in accumulated other comprehensive loss, net of tax, for the years ended Dec. 31, 2014 and 2013 were as follows:
Gains and Losses on Cash Flow Hedges
(Thousands of Do llars)Yea r Ended
Dec. 31, 2014Year Ended
Dec. 31, 201 3
Accumulated other comprehensive loss at Jan. 1 $ (1,161) $ (1,332)Losses reclassified from net accumulated other comprehensive loss 172 171
Net current period OCI 172 171Accumulated other comprehensive loss at Dec. 31 $ (989) $ (1,161)
Reclassifications from accumulated other comprehensive loss for the years ended Dec. 31, 2014 and 2013 were as follows:
Amounts Reclassified from AccumulatedOther Comprehensive Loss
(Thousands of Dollars)Year Ended
Dec. 31, 2014Year Ended Dec. 31, 2013
Losses on cash flow hedges:Interest rate derivatives $ 268 (a) $ 268 (a)
Total, pre-tax 268 268Tax benefit (96) (97)
Total amounts reclassified, net of tax $ 172 $ 171
(a) Included in interest charges.
Name of Respondent
Southwestern Public Service Company
This Report is:(1) X An Original(2) A Resubmission
Date of Report(Mo, Da, Yr)
04/13/2015
Year/Period of Report
2014/Q4
NOTES TO FINANCIAL STATEMENTS (Continued)
FERC FORM NO. 1 (ED. 12-88) Page 123.37
83
Schedule Q-5 Page 83 of 300
Sponsor: Robinson Case No. 15-00139-UT

11. Related Party Transactions
Xcel Energy Services Inc. provides management, administrative and other services for the subsidiaries of Xcel Energy Inc., includingSPS. The services are provided and billed to each subsidiary in accordance with service agreements executed by each subsidiary. SPSuses the service provided by Xcel Energy Services Inc. whenever possible. Costs are charged directly to the subsidiary and areallocated if they cannot be directly assigned.
Xcel Energy Inc., NSP-Minnesota, PSCo and SPS have established a utility money pool arrangement with the utility subsidiaries. SeeNote 2 for further discussion of this borrowing arrangement.
The table below contains significant affiliate transactions among the companies and related parties for the years ended Dec. 31:
(T housands of Dollars) 2014 2013
Operating revenues:Electr ic $ 23 $ 1,331
Operating expenses:Purchased power 9,614 8,136Other operating expenses — paid to Xcel Energy Services Inc. 145,917 127,669
Interest expense 73 178Interest income 3 —
Accounts receivable and payable with affiliates at Dec. 31 were:
2014 2013
(Thousands of Dollars)Accounts
ReceivableAccountsPayable
AccountsReceivable
AccountsPayable
NSP-Minnesota $ 1,983 $ — $ 3,462 $ —NSP-Wisconsin — 31 — 26PSCo — 5,803 — 1,056Other subsidiaries of Xcel Energy Inc. — 13,956 12,378 14,305
$ 1,983 $ 19,790 $ 15,840 $ 15,387
12. Supplementary Cash Flow Data
(Thousands of Dollars) 2014 2013
Supplemental disclosure of cash flow information:Cash paid for interest (net of amounts capitalized) (70,748)$ (67,209)$ Cash received (paid) for income taxes, net 42,679 (16,721)
Supplemental disclosure of non-cash investing transactions:Property, plant and equipment additions in accounts payable 33,164$ 23,305$
Twelve Months Ended Dec. 31
Name of Respondent
Southwestern Public Service Company
This Report is:(1) X An Original(2) A Resubmission
Date of Report(Mo, Da, Yr)
04/13/2015
Year/Period of Report
2014/Q4
NOTES TO FINANCIAL STATEMENTS (Continued)
FERC FORM NO. 1 (ED. 12-88) Page 123.38
84
Schedule Q-5 Page 84 of 300
Sponsor: Robinson Case No. 15-00139-UT

Name of Respondent This Report Is:(1) An Original(2) A Resubmission
Date of Report(Mo, Da, Yr)
Year/Period of Report
End of
STATEMENTS OF ACCUMULATED COMPREHENSIVE INCOME, COMPREHENSIVE INCOME, AND HEDGING ACTIVITIES
Southwestern Public Service CompanyX
04/13/20152014/Q4
Line No.
1. Report in columns (b),(c),(d) and (e) the amounts of accumulated other comprehensive income items, on a net-of-tax basis, where appropriate. 2. Report in columns (f) and (g) the amounts of other categories of other cash flow hedges. 3. For each category of hedges that have been accounted for as "fair value hedges", report the accounts affected and the related amounts in a footnote.4. Report data on a year-to-date basis.
OtherAdjustments
(e)
Foreign CurrencyHedges
(d)
Minimum PensionLiability adjustment
(net amount)(c)
Unrealized Gains andLosses on Available-for-Sale Securities
(b)
Item
(a)
Balance of Account 219 at Beginning of
Preceding Year
1
Preceding Qtr/Yr to Date Reclassifications
from Acct 219 to Net Income
2
Preceding Quarter/Year to Date Changes in
Fair Value
3
Total (lines 2 and 3) 4
Balance of Account 219 at End of
Preceding Quarter/Year
5
Balance of Account 219 at Beginning of
Current Year
6
Current Qtr/Yr to Date Reclassifications
from Acct 219 to Net Income
7
Current Quarter/Year to Date Changes in
Fair Value
8
Total (lines 7 and 8) 9
Balance of Account 219 at End of Current
Quarter/Year
10
FERC FORM NO. 1 (NEW 06-02) Page 122a
85
Schedule Q-5 Page 85 of 300
Sponsor: Robinson Case No. 15-00139-UT

Other Cash FlowHedges[Specify]
(g)
Other Cash FlowHedges
Interest Rate Swaps
(f)
Name of Respondent This Report Is:(1) An Original(2) A Resubmission
Date of Report(Mo, Da, Yr)
Year/Period of Report
End of
STATEMENTS OF ACCUMULATED COMPREHENSIVE INCOME, COMPREHENSIVE INCOME, AND HEDGING ACTIVITIES
Southwestern Public Service CompanyX
04/13/20152014/Q4
Line No.
TotalComprehensive
Income
(j)
Net Income (CarriedForward from
Page 117, Line 78)
(i)
Totals for eachcategory of items
recorded in Account 219
(h)
( 1,331,832)( 1,331,832) 1
171,129 171,129 2
3
95,176,619 95,347,748 171,129 171,129 4
( 1,160,703)( 1,160,703) 5
( 1,160,703)( 1,160,703) 6
171,922 171,922 7
8
129,852,313 130,024,235 171,922 171,922 9
( 988,781)( 988,781) 10
FERC FORM NO. 1 (NEW 06-02) Page 122b
86
Schedule Q-5 Page 86 of 300
Sponsor: Robinson Case No. 15-00139-UT

Name of Respondent This Report Is:(1) An Original(2) A Resubmission
Date of Report(Mo, Da, Yr)
Year/Period of Report
End of
SUMMARY OF UTILITY PLANT AND ACCUMULATED PROVISIONS
Southwestern Public Service CompanyX
04/13/20152014/Q4
Line No.
(b)(a)
Classification Electric
(c)
FOR DEPRECIATION. AMORTIZATION AND DEPLETION
Total Company for the Current Year/Quarter Ended
Report in Column (c) the amount for electric function, in column (d) the amount for gas function, in column (e), (f), and (g) report other (specify) and incolumn (h) common function.
Utility Plant 1
In Service 2
4,641,030,383 4,641,030,383Plant in Service (Classified) 3
Property Under Capital Leases 4
Plant Purchased or Sold 5
731,146,270 731,146,270Completed Construction not Classified 6
Experimental Plant Unclassified 7
5,372,176,653 5,372,176,653Total (3 thru 7) 8
Leased to Others 9
Held for Future Use 10
238,518,687 238,518,687Construction Work in Progress 11
Acquisition Adjustments 12
5,610,695,340 5,610,695,340Total Utility Plant (8 thru 12) 13
1,939,872,108 1,939,872,108Accum Prov for Depr, Amort, & Depl 14
3,670,823,232 3,670,823,232Net Utility Plant (13 less 14) 15
Detail of Accum Prov for Depr, Amort & Depl 16
In Service: 17
1,847,769,462 1,847,769,462Depreciation 18
Amort & Depl of Producing Nat Gas Land/Land Right 19
Amort of Underground Storage Land/Land Rights 20
92,102,646 92,102,646Amort of Other Utility Plant 21
1,939,872,108 1,939,872,108Total In Service (18 thru 21) 22
Leased to Others 23
Depreciation 24
Amortization and Depletion 25
Total Leased to Others (24 & 25) 26
Held for Future Use 27
Depreciation 28
Amortization 29
Total Held for Future Use (28 & 29) 30
Abandonment of Leases (Natural Gas) 31
Amort of Plant Acquisition Adj 32
1,939,872,108 1,939,872,108Total Accum Prov (equals 14) (22,26,30,31,32) 33
FERC FORM NO. 1 (ED. 12-89) Page 200
87
Schedule Q-5 Page 87 of 300
Sponsor: Robinson Case No. 15-00139-UT

(g)
Common
(h)
Name of Respondent This Report Is:(1) An Original(2) A Resubmission
Date of Report(Mo, Da, Yr)
Year/Period of Report
End of
SUMMARY OF UTILITY PLANT AND ACCUMULATED PROVISIONS
Southwestern Public Service CompanyX
04/13/20152014/Q4
Line No.
FOR DEPRECIATION. AMORTIZATION AND DEPLETION
Gas Other (Specify)
(d) (e) (f)
Other (Specify)Other (Specify)
1
2
3
4
5
6
7
8
9
10
11
12
13
14
15
16
17
18
19
20
21
22
23
24
25
26
27
28
29
30
31
32
33
FERC FORM NO. 1 (ED. 12-89) Page 201
88
Schedule Q-5 Page 88 of 300
Sponsor: Robinson Case No. 15-00139-UT

Schedule Page: 200 Line No.: 21 Column: cThe amortization of other utility plant within account 111 includes the following:
Intangible Plant $68,244,512 Other Production 570 Steam Production 2,479,189 Transmission 15,573,075 Distribution 1,346,415 General 4,458,885 Total $92,102,646
Name of Respondent
Southwestern Public Service Company
This Report is:(1) X An Original(2) A Resubmission
Date of Report(Mo, Da, Yr)
04/13/2015
Year/Period of Report
2014/Q4
FOOTNOTE DATA
FERC FORM NO. 1 (ED. 12-87) Page 450.1
89
Schedule Q-5 Page 89 of 300
Sponsor: Robinson Case No. 15-00139-UT

Name of Respondent This Report Is:(1) An Original(2) A Resubmission
Date of Report(Mo, Da, Yr)
Year/Period of Report
End of
NUCLEAR FUEL MATERIALS (Account 120.1 through 120.6 and 157)
Southwestern Public Service CompanyX
04/13/20152014/Q4
Line No.
Description of item Balance
(c)(b)(a)
Changes during YearBeginning of Year Additions
1. Report below the costs incurred for nuclear fuel materials in process of fabrication, on hand, in reactor, and in cooling; owned by therespondent.2. If the nuclear fuel stock is obtained under leasing arrangements, attach a statement showing the amount of nuclear fuel leased, thequantity used and quantity on hand, and the costs incurred under such leasing arrangements.
Nuclear Fuel in process of Refinement, Conv, Enrichment & Fab (120.1) 1
Fabrication 2
Nuclear Materials 3
Allowance for Funds Used during Construction 4
(Other Overhead Construction Costs, provide details in footnote) 5
SUBTOTAL (Total 2 thru 5) 6
Nuclear Fuel Materials and Assemblies 7
In Stock (120.2) 8
In Reactor (120.3) 9
SUBTOTAL (Total 8 & 9) 10
Spent Nuclear Fuel (120.4) 11
Nuclear Fuel Under Capital Leases (120.6) 12
(Less) Accum Prov for Amortization of Nuclear Fuel Assem (120.5) 13
TOTAL Nuclear Fuel Stock (Total 6, 10, 11, 12, less 13) 14
Estimated net Salvage Value of Nuclear Materials in line 9 15
Estimated net Salvage Value of Nuclear Materials in line 11 16
Est Net Salvage Value of Nuclear Materials in Chemical Processing 17
Nuclear Materials held for Sale (157) 18
Uranium 19
Plutonium 20
Other (provide details in footnote): 21
TOTAL Nuclear Materials held for Sale (Total 19, 20, and 21) 22
FERC FORM NO. 1 (ED. 12-89) Page 202
90
Schedule Q-5 Page 90 of 300
Sponsor: Robinson Case No. 15-00139-UT

Name of Respondent This Report Is:(1) An Original(2) A Resubmission
Date of Report(Mo, Da, Yr)
Year/Period of Report
End of
NUCLEAR FUEL MATERIALS (Account 120.1 through 120.6 and 157)
Southwestern Public Service CompanyX
04/13/20152014/Q4
Line No.
Balance
(f)(e)(d)
Changes during YearEnd of YearAmortization Other Reductions (Explain in a footnote)
1
2
3
4
5
6
7
8
9
10
11
12
13
14
15
16
17
18
19
20
21
22
FERC FORM NO. 1 (ED. 12-89) Page 203
91
Schedule Q-5 Page 91 of 300
Sponsor: Robinson Case No. 15-00139-UT

Name of Respondent This Report Is:(1) An Original(2) A Resubmission
Date of Report(Mo, Da, Yr)
Year/Period of Report
End of
ELECTRIC PLANT IN SERVICE (Account 101, 102, 103 and 106)
Southwestern Public Service CompanyX
04/13/20152014/Q4
Line No.
Account Balance Additions
(c)(b)(a)Beginning of Year
1. Report below the original cost of electric plant in service according to the prescribed accounts.2. In addition to Account 101, Electric Plant in Service (Classified), this page and the next include Account 102, Electric Plant Purchased or Sold;Account 103, Experimental Electric Plant Unclassified; and Account 106, Completed Construction Not Classified-Electric.3. Include in column (c) or (d), as appropriate, corrections of additions and retirements for the current or preceding year.4. For revisions to the amount of initial asset retirement costs capitalized, included by primary plant account, increases in column (c) additions andreductions in column (e) adjustments.5. Enclose in parentheses credit adjustments of plant accounts to indicate the negative effect of such accounts.6. Classify Account 106 according to prescribed accounts, on an estimated basis if necessary, and include the entries in column (c). Also to be includedin column (c) are entries for reversals of tentative distributions of prior year reported in column (b). Likewise, if the respondent has a significant amountof plant retirements which have not been classified to primary accounts at the end of the year, include in column (d) a tentative distribution of suchretirements, on an estimated basis, with appropriate contra entry to the account for accumulated depreciation provision. Include also in column (d)
1. INTANGIBLE PLANT 1(301) Organization 2(302) Franchises and Consents 3(303) Miscellaneous Intangible Plant 77,525,694 29,299,601 4TOTAL Intangible Plant (Enter Total of lines 2, 3, and 4) 77,525,694 29,299,601 52. PRODUCTION PLANT 6A. Steam Production Plant 7(310) Land and Land Rights 11,200,043 5,511,651 8(311) Structures and Improvements 217,821,398 4,410,506 9(312) Boiler Plant Equipment 918,811,428 26,301,237 10(313) Engines and Engine-Driven Generators 11(314) Turbogenerator Units 447,278,921 9,035,776 12(315) Accessory Electric Equipment 74,070,151 449,892 13(316) Misc. Power Plant Equipment 31,566,319 49,028 14(317) Asset Retirement Costs for Steam Production -7,151,186 5,419,448 15TOTAL Steam Production Plant (Enter Total of lines 8 thru 15) 1,693,597,074 51,177,538 16B. Nuclear Production Plant 17(320) Land and Land Rights 18(321) Structures and Improvements 19(322) Reactor Plant Equipment 20(323) Turbogenerator Units 21(324) Accessory Electric Equipment 22(325) Misc. Power Plant Equipment 23(326) Asset Retirement Costs for Nuclear Production 24TOTAL Nuclear Production Plant (Enter Total of lines 18 thru 24) 25C. Hydraulic Production Plant 26(330) Land and Land Rights 27(331) Structures and Improvements 28(332) Reservoirs, Dams, and Waterways 29(333) Water Wheels, Turbines, and Generators 30(334) Accessory Electric Equipment 31(335) Misc. Power PLant Equipment 32(336) Roads, Railroads, and Bridges 33(337) Asset Retirement Costs for Hydraulic Production 34TOTAL Hydraulic Production Plant (Enter Total of lines 27 thru 34) 35D. Other Production Plant 36(340) Land and Land Rights 115,722 37(341) Structures and Improvements 14,525,626 -10,589 38(342) Fuel Holders, Products, and Accessories 5,299,103 813,432 39(343) Prime Movers 58,281,423 10,062,004 40(344) Generators 167,271,203 523,885 41(345) Accessory Electric Equipment 31,671,302 305 42(346) Misc. Power Plant Equipment 4,792,253 -1,558 43(347) Asset Retirement Costs for Other Production 136,263 44TOTAL Other Prod. Plant (Enter Total of lines 37 thru 44) 281,956,632 11,523,742 45TOTAL Prod. Plant (Enter Total of lines 16, 25, 35, and 45) 1,975,553,706 62,701,280 46
Page 204FERC FORM NO. 1 (REV. 12-05)
92
Schedule Q-5 Page 92 of 300
Sponsor: Robinson Case No. 15-00139-UT

ELECTRIC PLANT IN SERVICE (Account 101, 102, 103 and 106) (Continued)
Name of Respondent This Report Is:(1) An Original(2) A Resubmission
Date of Report(Mo, Da, Yr)
Year/Period of Report
End ofSouthwestern Public Service CompanyX
04/13/20152014/Q4
Line No.
Account Balance Additions
(c)(b)(a)Beginning of Year
3. TRANSMISSION PLANT 47(350) Land and Land Rights 74,357,405 17,379,584 48(352) Structures and Improvements 44,701,069 2,296,080 49(353) Station Equipment 548,525,669 136,607,530 50(354) Towers and Fixtures 8,263,825 51(355) Poles and Fixtures 502,109,961 287,886,721 52(356) Overhead Conductors and Devices 232,503,569 53,067,312 53(357) Underground Conduit 255,073 54(358) Underground Conductors and Devices 489,716 55(359) Roads and Trails 56(359.1) Asset Retirement Costs for Transmission Plant 25,029 57TOTAL Transmission Plant (Enter Total of lines 48 thru 57) 1,411,231,316 497,237,227 584. DISTRIBUTION PLANT 59(360) Land and Land Rights 5,804,916 1,038,328 60(361) Structures and Improvements 8,128,660 820,699 61(362) Station Equipment 163,804,441 17,001,061 62(363) Storage Battery Equipment 63(364) Poles, Towers, and Fixtures 203,035,167 15,576,735 64(365) Overhead Conductors and Devices 194,849,203 19,000,942 65(366) Underground Conduit 22,252,014 192,342 66(367) Underground Conductors and Devices 31,377,401 3,278,844 67(368) Line Transformers 170,428,398 11,341,690 68(369) Services 72,914,936 3,385,678 69(370) Meters 61,774,931 1,878,616 70(371) Installations on Customer Premises 13,086,970 33,653 71(372) Leased Property on Customer Premises 72(373) Street Lighting and Signal Systems 22,468,658 976,922 73(374) Asset Retirement Costs for Distribution Plant 5,621,099 74TOTAL Distribution Plant (Enter Total of lines 60 thru 74) 975,546,794 74,525,510 755. REGIONAL TRANSMISSION AND MARKET OPERATION PLANT 76(380) Land and Land Rights 77(381) Structures and Improvements 78(382) Computer Hardware 79(383) Computer Software 80(384) Communication Equipment 81(385) Miscellaneous Regional Transmission and Market Operation Plant 82(386) Asset Retirement Costs for Regional Transmission and Market Oper 83TOTAL Transmission and Market Operation Plant (Total lines 77 thru 83) 846. GENERAL PLANT 85(389) Land and Land Rights 1,094,208 6,574 86(390) Structures and Improvements 64,249,356 7,231,151 87(391) Office Furniture and Equipment 29,955,922 11,934,380 88(392) Transportation Equipment 69,816,223 7,587,374 89(393) Stores Equipment 460,264 90(394) Tools, Shop and Garage Equipment 21,316,288 3,638,748 91(395) Laboratory Equipment 10,863,037 25,030 92(396) Power Operated Equipment 10,136,942 849,845 93(397) Communication Equipment 59,152,749 3,039,006 94(398) Miscellaneous Equipment 2,870,581 2,533 95SUBTOTAL (Enter Total of lines 86 thru 95) 269,915,570 34,314,641 96(399) Other Tangible Property 200,929 97(399.1) Asset Retirement Costs for General Plant 98TOTAL General Plant (Enter Total of lines 96, 97 and 98) 270,116,499 34,314,641 99TOTAL (Accounts 101 and 106) 4,709,974,009 698,078,259 100(102) Electric Plant Purchased (See Instr. 8) 101(Less) (102) Electric Plant Sold (See Instr. 8) 102(103) Experimental Plant Unclassified 103TOTAL Electric Plant in Service (Enter Total of lines 100 thru 103) 4,709,974,009 698,078,259 104
Page 206FERC FORM NO. 1 (REV. 12-05)
93
Schedule Q-5 Page 93 of 300
Sponsor: Robinson Case No. 15-00139-UT

(f)
Transfers Balance atEnd of Year
Name of Respondent This Report Is:(1) An Original(2) A Resubmission
Date of Report(Mo, Da, Yr)
Year/Period of Report
End ofSouthwestern Public Service CompanyX
04/13/20152014/Q4
Line No.(g)
Adjustments
(e)
Retirements
(d)
ELECTRIC PLANT IN SERVICE (Account 101, 102, 103 and 106) (Continued)
distributions of these tentative classifications in columns (c) and (d), including the reversals of the prior years tentative account distributions of theseamounts. Careful observance of the above instructions and the texts of Accounts 101 and 106 will avoid serious omissions of the reported amount ofrespondent’s plant actually in service at end of year.7. Show in column (f) reclassifications or transfers within utility plant accounts. Include also in column (f) the additions or reductions of primary accountclassifications arising from distribution of amounts initially recorded in Account 102, include in column (e) the amounts with respect to accumulatedprovision for depreciation, acquisition adjustments, etc., and show in column (f) only the offset to the debits or credits distributed in column (f) to primaryaccount classifications.8. For Account 399, state the nature and use of plant included in this account and if substantial in amount submit a supplementary statement showingsubaccount classification of such plant conforming to the requirement of these pages.9. For each amount comprising the reported balance and changes in Account 102, state the property purchased or sold, name of vendor or purchase,and date of transaction. If proposed journal entries have been filed with the Commission as required by the Uniform System of Accounts, give also date
1 2 3
106,679,097 146,198 4 106,679,097 146,198 5
6 7
16,704,627 -7,067 8 221,136,859 1,095,045 9 933,204,431 11,908,234 10
11 451,486,436 4,828,261 12 74,312,292 207,751 13 31,436,819 178,528 14 -1,731,738 15
1,726,549,726 -7,067 18,217,819 16 17 18 19 20 21 22 23 24 25 26 27 28 29 30 31 32 33 34 35 36
115,722 37 14,515,037 38 6,100,774 11,761 39 64,821,197 3,522,230 40 167,676,352 118,736 41 31,671,607 42 4,790,695 43 136,263 44
289,827,647 3,652,727 45 2,016,377,373 -7,067 21,870,546 46
Page 205FERC FORM NO. 1 (REV. 12-05)
94
Schedule Q-5 Page 94 of 300
Sponsor: Robinson Case No. 15-00139-UT
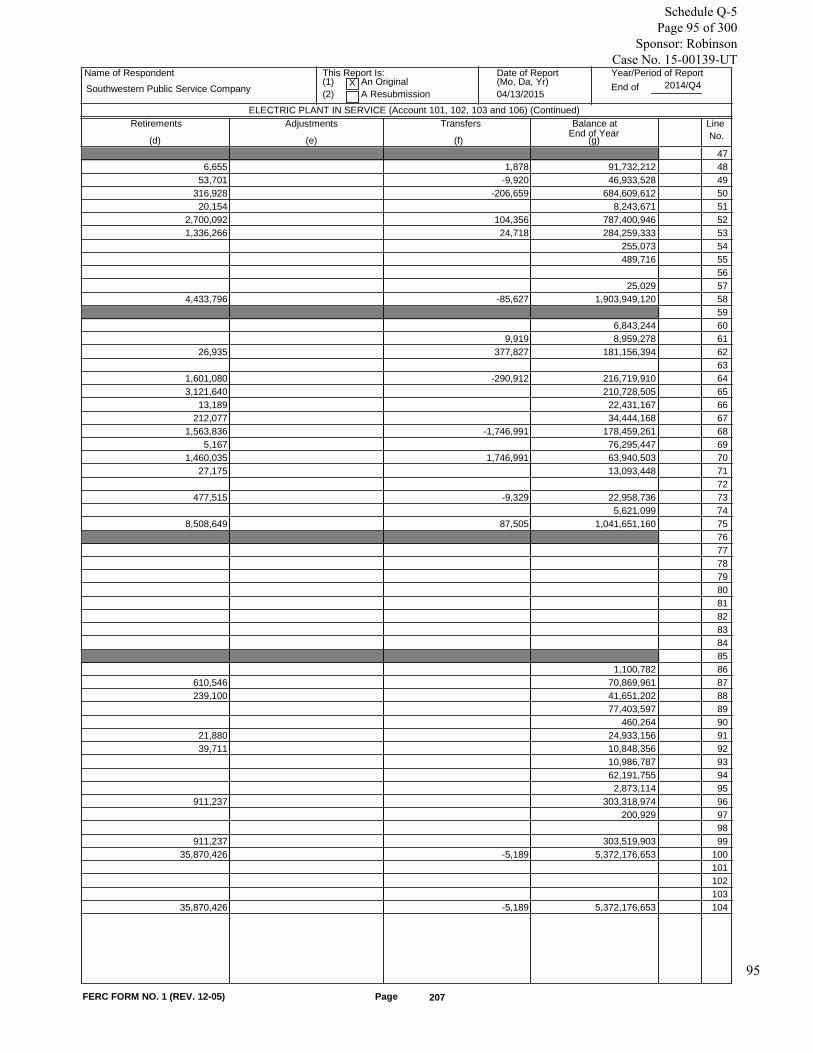
(f)
Transfers Balance atEnd of Year
Name of Respondent This Report Is:(1) An Original(2) A Resubmission
Date of Report(Mo, Da, Yr)
Year/Period of Report
End ofSouthwestern Public Service CompanyX
04/13/20152014/Q4
Line No.(g)
Adjustments
(e)
Retirements
(d)
ELECTRIC PLANT IN SERVICE (Account 101, 102, 103 and 106) (Continued)
47 91,732,212 1,878 6,655 48 46,933,528 -9,920 53,701 49 684,609,612 -206,659 316,928 50 8,243,671 20,154 51
787,400,946 104,356 2,700,092 52 284,259,333 24,718 1,336,266 53
255,073 54 489,716 55
56 25,029 57
1,903,949,120 -85,627 4,433,796 58 59
6,843,244 60 8,959,278 9,919 61
181,156,394 377,827 26,935 62 63
216,719,910 -290,912 1,601,080 64 210,728,505 3,121,640 65 22,431,167 13,189 66 34,444,168 212,077 67 178,459,261 -1,746,991 1,563,836 68 76,295,447 5,167 69 63,940,503 1,746,991 1,460,035 70 13,093,448 27,175 71
72 22,958,736 -9,329 477,515 73 5,621,099 74
1,041,651,160 87,505 8,508,649 75 76 77 78 79 80 81 82 83 84 85
1,100,782 86 70,869,961 610,546 87 41,651,202 239,100 88 77,403,597 89 460,264 90
24,933,156 21,880 91 10,848,356 39,711 92 10,986,787 93 62,191,755 94 2,873,114 95
303,318,974 911,237 96 200,929 97
98 303,519,903 911,237 99 5,372,176,653 -5,189 35,870,426 100
101 102 103
5,372,176,653 -5,189 35,870,426 104
Page 207FERC FORM NO. 1 (REV. 12-05)
95
Schedule Q-5 Page 95 of 300
Sponsor: Robinson Case No. 15-00139-UT

Schedule Page: 204 Line No.: 58 Column: bTransmission Service Production
Beginning Ending Balance Additions Retirements Transfers Balance
Account 352-Tran Str & Impr 1,794,401 (1,070,430) - - 723,971Account 353-Station Equip 28,817,950 1,313,782 - 52,765 30,184,497
Name of Respondent
Southwestern Public Service Company
This Report is:(1) X An Original(2) A Resubmission
Date of Report(Mo, Da, Yr)
04/13/2015
Year/Period of Report
2014/Q4
FOOTNOTE DATA
FERC FORM NO. 1 (ED. 12-87) Page 450.1
96
Schedule Q-5 Page 96 of 300
Sponsor: Robinson Case No. 15-00139-UT

Name of Respondent This Report Is:(1) An Original(2) A Resubmission
Date of Report(Mo, Da, Yr)
Year/Period of Report
End of
ELECTRIC PLANT LEASED TO OTHERS (Account 104)
Southwestern Public Service CompanyX
04/13/20152014/Q4
Line No.
Name of LesseeDescription of
(b)(a)
(Designate associated companieswith a double asterisk) Property Leased
CommissionAuthorization
(c)
ExpirationDate ofLease
(d)
Balance atEnd of Year
(e) 1
2
3
4
5
6
7
8
9
10
11
12
13
14
15
16
17
18
19
20
21
22
23
24
25
26
27
28
29
30
31
32
33
34
35
36
37
38
39
40
41
42
43
44
45
46
FERC FORM NO. 1 (ED. 12-95) Page 213
47 TOTAL 97
Schedule Q-5 Page 97 of 300
Sponsor: Robinson Case No. 15-00139-UT
Name of Respondent This Report Is:(1) An Original(2) A Resubmission
Date of Report(Mo, Da, Yr)
Year/Period of Report
End of
ELECTRIC PLANT HELD FOR FUTURE USE (Account 105)
Southwestern Public Service CompanyX
04/13/20152014/Q4
Line Description and Location Date Originally Included Balance atEnd of Year
(c)(b)(a)Of Property in This Account
Date Expected to be usedin Utility Service
(d)No.
1. Report separately each property held for future use at end of the year having an original cost of $250,000 or more. Group other items of property heldfor future use.2. For property having an original cost of $250,000 or more previously used in utility operations, now held for future use, give in column (a), in addition toother required information, the date that utility use of such property was discontinued, and the date the original cost was transferred to Account 105.
Land and Rights: 1
2
3
4
5
6
7
8
9
10
11
12
13
14
15
16
17
18
19
20
Other Property: 21
22
23
24
25
26
27
28
29
30
31
32
33
34
35
36
37
38
39
40
41
42
43
44
45
46
FERC FORM NO. 1 (ED. 12-96) Page 214
47 Total 0 98
Schedule Q-5 Page 98 of 300
Sponsor: Robinson Case No. 15-00139-UT

Name of Respondent This Report Is:(1) An Original(2) A Resubmission
Date of Report(Mo, Da, Yr)
Year/Period of Report
End of
CONSTRUCTION WORK IN PROGRESS - - ELECTRIC (Account 107)
Southwestern Public Service CompanyX
04/13/20152014/Q4
Line No.
Description of Project Construction work in progress -
(b)(a)Electric (Account 107)
1. Report below descriptions and balances at end of year of projects in process of construction (107)2. Show items relating to "research, development, and demonstration" projects last, under a caption Research, Development, and Demonstrating (seeAccount 107 of the Uniform System of Accounts)3. Minor projects (5% of the Balance End of the Year for Account 107 or $1,000,000, whichever is less) may be grouped.
14,871,316Miami, Z-47 Rebuild, Line 1
13,803,362GIST-III Computer Software 2
12,656,827Intercont Potash Conn 230kV, Line 3
11,462,472Pleasant Hill 345/230kV NM, Sub 4
11,452,570Pleasant Hill to Roosevelt Co NM 5
6,985,973Lynn Co. Dist. Load Conversion,Sub 6
5,235,023Bowers - Howard ROW 7
4,910,280GIST-II Computer Software,SPS 8
4,728,252Work and Asset Phase 1 SW SPS 9
4,494,885KC Substation 115kV, Line 10
4,235,493SPS 2014 TX S&E B 115kV, Line 11
4,186,213Zodiac Substation, NM, Line 12
4,163,459Miami, Z-70 Rebuild, Line 13
3,936,620Lubbock South 230/115 Auto #2,Sub 14
3,620,320SPS 2014 TX S&E B 69kV, Line 15
3,595,777KC Substation, Sub 16
3,091,353Road Runner SVC, Sub 17
3,083,591Dynamic EMS Environment Phase 18
2,838,508China Draw Sub, SVC, Sub 19
2,810,595HAR1C - ACI - Mercury Reduction 20
2,570,846Inst Pringle Int 115/34.5kV 28MVA 21
2,537,929General Ledger Ph 1 SW SP 22
2,510,683Construct Kilgore115/4.2kV 14M 23
2,412,297Purch EMS DEMS Ph2 HW SPS 24
2,342,629Chaves Ckt 2 Auto, Sub 25
2,333,562SPS 2014 S&E B 230kV, Line 26
2,237,770Inst Camex 115/13.2kV 28MVA T3 27
2,156,739Bowers-Howard 115 kV, Line 28
2,109,603115/69 kV Mobile Sub, Sub 29
2,092,885Randall County Interchange, Sub 30
1,986,854Bowers 2nd Auto, Sub 31
1,911,917Cherry St Intg Hastings-E.Plt 115kv 32
1,890,225HAR2C-H2 Cooling Tower Structure 33
1,776,957Nichols 115kV BFR - Nichols Sub 34
1,729,106Crosby County Transformer #1,Sub 35
1,684,007Inst No Loving 115/12.5kV 28MVA 36
1,646,921Purch NS T&D Network Equip SPS 37
1,639,963Reinf Dollarhide 3220-Srv Madera 38
1,638,844Inst China Draw 69/12.5kV 28MVA /s 39
1,631,217Inst NewCarlsbad 115/12.5kV 28MVA-s 40
1,625,988Eagle Creek Prog(Artesia Twn 69kV) 41
1,587,713Hitchland Add 345 kV, 60 Mvar React 42
FERC FORM NO. 1 (ED. 12-87) Page 216
43 TOTAL 238,518,687 99
Schedule Q-5 Page 99 of 300
Sponsor: Robinson Case No. 15-00139-UT

Name of Respondent This Report Is:(1) An Original(2) A Resubmission
Date of Report(Mo, Da, Yr)
Year/Period of Report
End of
CONSTRUCTION WORK IN PROGRESS - - ELECTRIC (Account 107)
Southwestern Public Service CompanyX
04/13/20152014/Q4
Line No.
Description of Project Construction work in progress -
(b)(a)Electric (Account 107)
1. Report below descriptions and balances at end of year of projects in process of construction (107)2. Show items relating to "research, development, and demonstration" projects last, under a caption Research, Development, and Demonstrating (seeAccount 107 of the Uniform System of Accounts)3. Minor projects (5% of the Balance End of the Year for Account 107 or $1,000,000, whichever is less) may be grouped.
1,473,679TOL1C-Rpl Bull Nose 1
1,460,106TOL1C-Rpl RH Pendants 2
1,430,939Inst Higg East 115/12.5kV 28MVA Sub 3
1,380,348Quahada 4 Breaker Ring Switching 4
1,367,491GMS0C-Gaines Cty Gen Project 5
1,275,611Roosevelt Co. Term for Pleasant 6
1,250,424East Plant Conv. for Hastings, Sub 7
1,222,754Crosby Co. Upgrade 115/69 Xfmr,Sub 8
1,221,445GIST Ph3 SW SPS 9
1,139,149Crobsy Co. 115kV Cap Bank, Sub 10
1,126,782Wheeler-Salt Creek, ROW 11
1,102,471Inst NewCarlsbad 115/12.5kV 28MVA 12
1,079,745Pecos Dist Add/115kV Breaker and 1 13
1,066,977Fleet New Units 2014 El Trans, SPS 14
1,034,901Portales 115kV Line Terminal, 15
16
49,668,321Minor Projects 17
18
19
20
21
22
23
24
25
26
27
28
29
30
31
32
33
34
35
36
37
38
39
40
41
42
FERC FORM NO. 1 (ED. 12-87) Page 216.1
43 TOTAL 238,518,687 100
Schedule Q-5 Page 100 of 300
Sponsor: Robinson Case No. 15-00139-UT

Name of Respondent This Report Is:(1) An Original(2) A Resubmission
Date of Report(Mo, Da, Yr)
Year/Period of Report
End of
ACCUMULATED PROVISION FOR DEPRECIATION OF ELECTRIC UTILITY PLANT (Account 108)
Southwestern Public Service CompanyX
04/13/20152014/Q4
Line No.
Item Total
(c)(b)(a) (d)
Section A. Balances and Changes During Year
(c+d+e)Electric Plant in
ServiceElectric Plant Held
for Future UseElectric Plant
Leased to Others(e)
1. Explain in a footnote any important adjustments during year.2. Explain in a footnote any difference between the amount for book cost of plant retired, Line 11, column (c), and that reported forelectric plant in service, pages 204-207, column 9d), excluding retirements of non-depreciable property.3. The provisions of Account 108 in the Uniform System of accounts require that retirements of depreciable plant be recorded whensuch plant is removed from service. If the respondent has a significant amount of plant retired at year end which has not been recordedand/or classified to the various reserve functional classifications, make preliminary closing entries to tentatively functionalize the bookcost of the plant retired. In addition, include all costs included in retirement work in progress at year end in the appropriate functionalclassifications.4. Show separately interest credits under a sinking fund or similar method of depreciation accounting.
Balance Beginning of Year 1 1,788,761,548 1,788,761,548
Depreciation Provisions for Year, Charged to 2
(403) Depreciation Expense 3 114,493,394 114,493,394
(403.1) Depreciation Expense for Asset
Retirement Costs
4 -791,285 -791,285
(413) Exp. of Elec. Plt. Leas. to Others 5
Transportation Expenses-Clearing 6 4,246,443 4,246,443
Other Clearing Accounts 7
Other Accounts (Specify, details in footnote): 8
9
TOTAL Deprec. Prov for Year (Enter Total of
lines 3 thru 9)
10 117,948,552 117,948,552
Net Charges for Plant Retired: 11
Book Cost of Plant Retired 12 35,715,023 35,715,023
Cost of Removal 13 21,129,533 21,129,533
Salvage (Credit) 14 1,072,358 1,072,358
TOTAL Net Chrgs. for Plant Ret. (Enter Total
of lines 12 thru 14)
15 55,772,198 55,772,198
Other Debit or Cr. Items (Describe, details in
footnote):
16 -3,168,440 -3,168,440
17
Book Cost or Asset Retirement Costs Retired 18
Balance End of Year (Enter Totals of lines 1,
10, 15, 16, and 18)
19 1,847,769,462 1,847,769,462
Steam Production 20
Section B. Balances at End of Year According to Functional Classification
1,033,468,719 1,033,468,719
Nuclear Production 21
Hydraulic Production-Conventional 22
Hydraulic Production-Pumped Storage 23
Other Production 24 68,736,708 68,736,708
Transmission 25 310,386,291 310,386,291
Distribution 26 319,843,848 319,843,848
Regional Transmission and Market Operation 27
General 28 115,333,896 115,333,896
TOTAL (Enter Total of lines 20 thru 28) 29 1,847,769,462 1,847,769,462
Page 219FERC FORM NO. 1 (REV. 12-05)
101
Schedule Q-5 Page 101 of 300
Sponsor: Robinson Case No. 15-00139-UT

Schedule Page: 219 Line No.: 16 Column: cNet change in RWIP $ (3,972,803)Net Transfers 933,829 Gain/Loss (3)Sharyland RWIP gain adjustments (128,680)Other (783)Total $ (3,168,440)
Schedule Page: 219 Line No.: 25 Column: c Transmission Serving Production $14,625,450
Schedule Page: 219 Line No.: 29 Column: b"Non-Legal" ARO
Balances Steam Plant $ 67,027,359 Other Production (381,895) Transmission (16,413,503) Distribution 18,729,915 General (856,287) Total (Enter Total of lines 20 thru 28) $ 68,105,589
Name of Respondent
Southwestern Public Service Company
This Report is:(1) X An Original(2) A Resubmission
Date of Report(Mo, Da, Yr)
04/13/2015
Year/Period of Report
2014/Q4
FOOTNOTE DATA
FERC FORM NO. 1 (ED. 12-87) Page 450.1
102
Schedule Q-5 Page 102 of 300
Sponsor: Robinson Case No. 15-00139-UT

Schedule Page: 219 Line No.: 29 Column: cNOTE: Amounts footnoted are based upon FERC ONLY RATES.
Section A. Balances and Changes During YearLine Item Total Electric Plant in No. (c+d+e) Service
(a) (b) (c)
1 Balance Beginning of Year $ 1,960,453,667 $ 1,960,453,667 2 Depreciation Provisions for Year, Charged
to3 (403) Depreciation Expense 129,392,096 129,392,096 4 (403.1) Depreciation Expense for Asset
Retirement Costs - -
5 (413) Exp of Elec Plt. Leas. To Others - - 6 Transportation Expenses-Clearing 4,035,815 4,035,815 7 Other Clearing Accounts - - 8 Other Accounts (Specify, details in
footnote): - -
910 Total Deprec. Prov for year (Enter Total
of lines 3 thru 9) 133,427,911 133,427,911
11 Net Charges for Plant Retired12 Book Cost of Plant Retired 35,715,023 35,715,023 13 Cost of Removal 21,129,533 21,129,533 14 Salvage (Credit) 1,072,358 1,072,358 15 Total Net Chrgs for Plant Ret. (Enter
Total of lines 12 thru 14) 55,772,198 55,772,198
16 Other Debit or Cr. Items (Describe,details in footnote):
(4,007,505) (4,007,505)
1718 Book Cost or Asset Retirement Costs
Retired - -
19 Balance End of Year (Enter Totals of lines1,10,15,16 and 18)
$ 2,034,101,875 $ 2,034,101,875
Section B. Balances at End of Year According to FunctionalClassification20 Steam Plant $ 1,226,780,547 $ 1,226,780,547 21 Nuclear Plant - - 22 Hydraulic Production-Conventional - - 23 Hydraulic Production-Pumped Storage - - 24 Other Production 78,614,633 78,614,633 25 Transmission 270,260,224 270,260,224 26 Distribution 325,551,683 325,551,683 27 Regional Transmission and Market Operation - 28 General 132,894,788 132,894,788 29 Total (Enter Total of lines 20 thru 28) $ 2,034,101,875 $ 2,034,101,875
Name of Respondent
Southwestern Public Service Company
This Report is:(1) X An Original(2) A Resubmission
Date of Report(Mo, Da, Yr)
04/13/2015
Year/Period of Report
2014/Q4
FOOTNOTE DATA
FERC FORM NO. 1 (ED. 12-87) Page 450.2
103
Schedule Q-5 Page 103 of 300
Sponsor: Robinson Case No. 15-00139-UT

Net change in RWIP $ (3,972,804)Net Transfers (31,442)Gain/Loss (3,254)Other (5)Total $ (4,007,505)*Total agrees to line 16 in the schdedule above.
"Non-Legal" ARO Balances
Steam Plant $ 76,847,258 Nuclear Plant - Hydraulic Production-Conventional - Hydraulic Production-Pumped Storage - Other Production (1,670,124)Transmission (43,123,700)Distribution (979,498)Regional Transmission and Market Operation - General (928,974)Total (Enter Total of lines 20 thru 28) $ 30,144,962
Transmission Serving Production Reserve $ 15,574,425
Name of Respondent
Southwestern Public Service Company
This Report is:(1) X An Original(2) A Resubmission
Date of Report(Mo, Da, Yr)
04/13/2015
Year/Period of Report
2014/Q4
FOOTNOTE DATA
FERC FORM NO. 1 (ED. 12-87) Page 450.3
104
Schedule Q-5 Page 104 of 300
Sponsor: Robinson Case No. 15-00139-UT

Name of Respondent This Report Is:(1) An Original(2) A Resubmission
Date of Report(Mo, Da, Yr)
Year/Period of Report
End of
INVESTMENTS IN SUBSIDIARY COMPANIES (Account 123.1)
Southwestern Public Service CompanyX
04/13/20152014/Q4
Line No.
Description of Investment Date Acquired
(c)(b)(a)
Amount of Investment atBeginning of Year
Date Of Maturity
(d)
1. Report below investments in Accounts 123.1, investments in Subsidiary Companies.2. Provide a subheading for each company and List there under the information called for below. Sub - TOTAL by company and give a TOTAL incolumns (e),(f),(g) and (h)(a) Investment in Securities - List and describe each security owned. For bonds give also principal amount, date of issue, maturity and interest rate.(b) Investment Advances - Report separately the amounts of loans or investment advances which are subject to repayment, but which are not subject tocurrent settlement. With respect to each advance show whether the advance is a note or open account. List each note giving date of issuance, maturitydate, and specifying whether note is a renewal.3. Report separately the equity in undistributed subsidiary earnings since acquisition. The TOTAL in column (e) should equal the amount entered forAccount 418.1.
1
2
3
4
5
6
7
8
9
10
11
12
13
14
15
16
17
18
19
20
21
22
23
24
25
26
27
28
29
30
31
32
33
34
35
36
37
38
39
40
41
FERC FORM NO. 1 (ED. 12-89) Page 224
42 Total Cost of Account 123.1 $ TOTAL 0 105
Schedule Q-5 Page 105 of 300
Sponsor: Robinson Case No. 15-00139-UT

Name of Respondent This Report Is:(1) An Original(2) A Resubmission
Date of Report(Mo, Da, Yr)
Year/Period of Report
End of
INVESTMENTS IN SUBSIDIARY COMPANIES (Account 123.1) (Continued)
Southwestern Public Service CompanyX
04/13/2015 2014/Q4
Line No.
Equity in Subsidiary Earnings of Year
Revenues for Year Amount of Investment atEnd of Year
Gain or Loss from InvestmentDisposed of
(e) (f) (g) (h)
4. For any securities, notes, or accounts that were pledged designate such securities, notes, or accounts in a footnote, and state the name of pledgeeand purpose of the pledge.5. If Commission approval was required for any advance made or security acquired, designate such fact in a footnote and give name of Commission,date of authorization, and case or docket number.6. Report column (f) interest and dividend revenues form investments, including such revenues form securities disposed of during the year.7. In column (h) report for each investment disposed of during the year, the gain or loss represented by the difference between cost of the investment (orthe other amount at which carried in the books of account if difference from cost) and the selling price thereof, not including interest adjustment includiblein column (f).8. Report on Line 42, column (a) the TOTAL cost of Account 123.1
1
2
3
4
5
6
7
8
9
10
11
12
13
14
15
16
17
18
19
20
21
22
23
24
25
26
27
28
29
30
31
32
33
34
35
36
37
38
39
40
41
FERC FORM NO. 1 (ED. 12-89) Page 225
42106
Schedule Q-5 Page 106 of 300
Sponsor: Robinson Case No. 15-00139-UT

Name of Respondent This Report Is:(1) An Original(2) A Resubmission
Date of Report(Mo, Da, Yr)
Year/Period of Report
End of
MATERIALS AND SUPPLIES
Southwestern Public Service CompanyX
04/13/2015 2014/Q4
Line No.
Account Balance Balance
(c)(b)(a)
Department orDepartments which
(d)
Beginning of Year End of YearUse Material
1. For Account 154, report the amount of plant materials and operating supplies under the primary functional classifications as indicated in column (a);estimates of amounts by function are acceptable. In column (d), designate the department or departments which use the class of material.2. Give an explanation of important inventory adjustments during the year (in a footnote) showing general classes of material and supplies and thevarious accounts (operating expenses, clearing accounts, plant, etc.) affected debited or credited. Show separately debit or credits to stores expenseclearing, if applicable.
15,537,703 Electric 18,493,107 1 Fuel Stock (Account 151)
2 Fuel Stock Expenses Undistributed (Account 152)
3 Residuals and Extracted Products (Account 153)
4 Plant Materials and Operating Supplies (Account 154)
7,921,533 Electric 8,270,522 5 Assigned to - Construction (Estimated)
6 Assigned to - Operations and Maintenance
10,808,205 Electric 11,133,847 7 Production Plant (Estimated)
75,183 Electric 107,839 8 Transmission Plant (Estimated)
1,216,706 Electric 1,064,205 9 Distribution Plant (Estimated)
10 Regional Transmission and Market Operation Plant
(Estimated)
-300,099 Electric -294,096 11 Assigned to - Other (provide details in footnote)
19,721,528 20,282,317 12 TOTAL Account 154 (Enter Total of lines 5 thru 11)
228,615 297,522 13 Merchandise (Account 155)
14 Other Materials and Supplies (Account 156)
15 Nuclear Materials Held for Sale (Account 157) (Not
applic to Gas Util)
16 Stores Expense Undistributed (Account 163)
17
18
19
35,487,846 39,072,946 20 TOTAL Materials and Supplies (Per Balance Sheet)
Page 227FERC FORM NO. 1 (REV. 12-05)107
Schedule Q-5 Page 107 of 300
Sponsor: Robinson Case No. 15-00139-UT

Schedule Page: 227 Line No.: 11 Column: b
Balance is comprised of miscellaneous inventory-related items (including purchase pricevariances, obsolescence and suspense items).
Schedule Page: 227 Line No.: 11 Column: c
Balance is comprised of miscellaneous inventory-related items (including purchase pricevariances, obsolescence and suspense items).
Balance includes chemical inventory (ARKAY). Beginning balance of chemical inventory asof January 1 was $0. Inventory of $78,086 was added as of June 2014 and ending balance asof December 2014 is $61,974.
Name of Respondent
Southwestern Public Service Company
This Report is:(1) X An Original(2) A Resubmission
Date of Report(Mo, Da, Yr)
04/13/2015
Year/Period of Report
2014/Q4
FOOTNOTE DATA
FERC FORM NO. 1 (ED. 12-87) Page 450.1
108
Schedule Q-5 Page 108 of 300
Sponsor: Robinson Case No. 15-00139-UT

Name of Respondent This Report Is:(1) An Original(2) A Resubmission
Date of Report(Mo, Da, Yr)
Year/Period of Report
End of
Allowances (Accounts 158.1 and 158.2)
Southwestern Public Service CompanyX
04/13/2015 2014/Q4
Line No.
SO2 Allowances Inventory Current Year
(b)(a)(Account 158.1) No. Amt.
(c)No.(d)
Amt.(e)
1. Report below the particulars (details) called for concerning allowances.2. Report all acquisitions of allowances at cost.3. Report allowances in accordance with a weighted average cost allocation method and other accounting as prescribed by GeneralInstruction No. 21 in the Uniform System of Accounts.4. Report the allowances transactions by the period they are first eligible for use: the current year’s allowances in columns (b)-(c),allowances for the three succeeding years in columns (d)-(i), starting with the following year, and allowances for the remainingsucceeding years in columns (j)-(k).5. Report on line 4 the Environmental Protection Agency (EPA) issued allowances. Report withheld portions Lines 36-40.
2015
155,431.00 83,019.00Balance-Beginning of Year 1
2
Acquired During Year: 3
Issued (Less Withheld Allow) 4
Returned by EPA 5
6
7
Purchases/Transfers: 8
9
10
11
12
13
14
Total 15
16
Relinquished During Year: 17 33,327.00 Charges to Account 509 18
Other: 19 48,094.00 20
Cost of Sales/Transfers: 21
22
23
24
25
26
27
Total 28 74,010.00 83,019.00Balance-End of Year 29
30
Sales: 31
Net Sales Proceeds(Assoc. Co.) 32
Net Sales Proceeds (Other) 33
Gains 34
Losses 35
Allowances Withheld (Acct 158.2) 1,542.00 771.00Balance-Beginning of Year 36
Add: Withheld by EPA 37
Deduct: Returned by EPA 38 771.00Cost of Sales 39 771.00 771.00Balance-End of Year 40
41
Sales: 42
Net Sales Proceeds (Assoc. Co.) 43 771.00 95Net Sales Proceeds (Other) 44
Gains 45
Losses 46
FERC FORM NO. 1 (ED. 12-95) Page 228a
109
Schedule Q-5 Page 109 of 300
Sponsor: Robinson Case No. 15-00139-UT

Name of Respondent This Report Is:(1) An Original(2) A Resubmission
Date of Report(Mo, Da, Yr)
Year/Period of Report
End of
Allowances (Accounts 158.1 and 158.2)
Southwestern Public Service CompanyX
04/13/2015 2014/Q4
Line No.
(f) (j)No. Amt.
(g)No.(h)
Amt.(i)
No. Amt. No. Amt.(k) (l) (m)
Future Years Totals
(Continued)
6. Report on Lines 5 allowances returned by the EPA. Report on Line 39 the EPA’s sales of the withheld allowances. Report on Lines43-46 the net sales proceeds and gains/losses resulting from the EPA’s sale or auction of the withheld allowances.7. Report on Lines 8-14 the names of vendors/transferors of allowances acquire and identify associated companies (See "associatedcompany" under "Definitions" in the Uniform System of Accounts).8. Report on Lines 22 - 27 the name of purchasers/ transferees of allowances disposed of an identify associated companies.9. Report the net costs and benefits of hedging transactions on a separate line under purchases/transfers and sales/transfers.10. Report on Lines 32-35 and 43-46 the net sales proceeds and gains or losses from allowance sales.
2016 2017
1 1,387,464.00 53,364.00 83,019.00 1,762,297.00
2
3
4
5 53,364.00 53,364.00
6
7
8
9
10
11
12
13
14
15
16
17
18 33,327.00
19
20 48,094.00
21
22
23
24
25
26
27
28
29 1,440,828.00 53,364.00 83,019.00 1,734,240.00
30
31
32
33
34
35
36 37,008.00 771.00 771.00 40,863.00
37 1,542.00 1,542.00
38
39 771.00 1,542.00
40 37,779.00 771.00 771.00 40,863.00
41
42
43
9 104 44 771.00 1,542.00
45
46
FERC FORM NO. 1 (ED. 12-95) Page 229a
110
Schedule Q-5 Page 110 of 300
Sponsor: Robinson Case No. 15-00139-UT

Schedule Page: 228 Line No.: 44 Column: m
The amounts recorded in FERC account 158.1 on page 110 represent the Texas portion ofRenewable Energy Credits and do not relate to EPA issued allowances.
Gain-Disposition of SO2 Allowances $380 SO2 Texas Retail Sharing (204)SO2 New Mexico Retail Sharing (70)
$104
Name of Respondent
Southwestern Public Service Company
This Report is:(1) X An Original(2) A Resubmission
Date of Report(Mo, Da, Yr)
04/13/2015
Year/Period of Report
2014/Q4
FOOTNOTE DATA
FERC FORM NO. 1 (ED. 12-87) Page 450.1
111
Schedule Q-5 Page 111 of 300
Sponsor: Robinson Case No. 15-00139-UT

Name of Respondent This Report Is:(1) An Original(2) A Resubmission
Date of Report(Mo, Da, Yr)
Year/Period of Report
End of
Allowances (Accounts 158.1 and 158.2)
Southwestern Public Service CompanyX
04/13/2015 2014/Q4
Line No.
NOx Allowances Inventory Current Year
(b)(a)(Account 158.1) No. Amt.
(c)No.(d)
Amt.(e)
1. Report below the particulars (details) called for concerning allowances.2. Report all acquisitions of allowances at cost.3. Report allowances in accordance with a weighted average cost allocation method and other accounting as prescribed by GeneralInstruction No. 21 in the Uniform System of Accounts.4. Report the allowances transactions by the period they are first eligible for use: the current year’s allowances in columns (b)-(c),allowances for the three succeeding years in columns (d)-(i), starting with the following year, and allowances for the remainingsucceeding years in columns (j)-(k).5. Report on line 4 the Environmental Protection Agency (EPA) issued allowances. Report withheld portions Lines 36-40.
2015
47,850.00Balance-Beginning of Year 1
2
Acquired During Year: 3 10.00 16,655.00 Issued (Less Withheld Allow) 4
Returned by EPA 5
6
7
Purchases/Transfers: 8
9
10
11
12
13
14
Total 15
16
Relinquished During Year: 17 11,155.00 3,944 Charges to Account 509 18
Other: 19 32,018.00 EPA Adjustment 20
Cost of Sales/Transfers: 21
22
23
24
25
26
27
Total 28 4,687.00 -3,944 16,655.00Balance-End of Year 29
30
Sales: 31
Net Sales Proceeds(Assoc. Co.) 32
Net Sales Proceeds (Other) 33
Gains 34
Losses 35
Allowances Withheld (Acct 158.2)
Balance-Beginning of Year 36
Add: Withheld by EPA 37
Deduct: Returned by EPA 38
Cost of Sales 39
Balance-End of Year 40
41
Sales: 42
Net Sales Proceeds (Assoc. Co.) 43
Net Sales Proceeds (Other) 44
Gains 45
Losses 46
FERC FORM NO. 1 (ED. 12-95) Page 228b
112
Schedule Q-5 Page 112 of 300
Sponsor: Robinson Case No. 15-00139-UT

Name of Respondent This Report Is:(1) An Original(2) A Resubmission
Date of Report(Mo, Da, Yr)
Year/Period of Report
End of
Allowances (Accounts 158.1 and 158.2)
Southwestern Public Service CompanyX
04/13/2015 2014/Q4
Line No.
(f) (j)No. Amt.
(g)No.(h)
Amt.(i)
No. Amt. No. Amt.(k) (l) (m)
Future Years Totals
(Continued)
6. Report on Lines 5 allowances returned by the EPA. Report on Line 39 the EPA’s sales of the withheld allowances. Report on Lines43-46 the net sales proceeds and gains/losses resulting from the EPA’s sale or auction of the withheld allowances.7. Report on Lines 8-14 the names of vendors/transferors of allowances acquire and identify associated companies (See "associatedcompany" under "Definitions" in the Uniform System of Accounts).8. Report on Lines 22 - 27 the name of purchasers/ transferees of allowances disposed of an identify associated companies.9. Report the net costs and benefits of hedging transactions on a separate line under purchases/transfers and sales/transfers.10. Report on Lines 32-35 and 43-46 the net sales proceeds and gains or losses from allowance sales.
2016 2017
1 47,850.00
2
3
4 16,655.00 33,320.00
5
6
7
8
9
10
11
12
13
14
15
16
17
3,944 18 11,155.00
19
20 32,018.00
21
22
23
24
25
26
27
28
-3,944 29 16,655.00 37,997.00
30
31
32
33
34
35
36
37
38
39
40
41
42
43
44
45
46
FERC FORM NO. 1 (ED. 12-95) Page 229b
113
Schedule Q-5 Page 113 of 300
Sponsor: Robinson Case No. 15-00139-UT

Schedule Page: 229 Line No.: 18 Column: mThe amount of $3,944 represents amortization of previously deferred NOx allowance costunder the NM jurisdiction. Amortization authorized in Case No. 12-000350-UT.
Name of Respondent
Southwestern Public Service Company
This Report is:(1) X An Original(2) A Resubmission
Date of Report(Mo, Da, Yr)
04/13/2015
Year/Period of Report
2014/Q4
FOOTNOTE DATA
FERC FORM NO. 1 (ED. 12-87) Page 450.1
114
Schedule Q-5 Page 114 of 300
Sponsor: Robinson Case No. 15-00139-UT

Name of Respondent This Report Is:(1) An Original(2) A Resubmission
Date of Report(Mo, Da, Yr)
Year/Period of Report
End of
EXTRAORDINARY PROPERTY LOSSES (Account 182.1)
Southwestern Public Service CompanyX
04/13/20152014/Q4
Line No.
(c)(b)(a) (d)
Description of Extraordinary Loss[Include in the description the date of
Commission Authorization to use Acc 182.1and period of amortization (mo, yr to mo, yr).]
Total Amount of Loss
LossesRecognisedDuring Year
WRITTEN OFF DURING YEAR
AccountCharged Amount
Balance at
End of Year
(f)(e)
1
2
3
4
5
6
7
8
9
10
11
12
13
14
15
16
17
18
19
FERC FORM NO. 1 (ED. 12-88) Page 230a
20 TOTAL
115
Schedule Q-5 Page 115 of 300
Sponsor: Robinson Case No. 15-00139-UT

Name of Respondent This Report Is:(1) An Original(2) A Resubmission
Date of Report(Mo, Da, Yr)
Year/Period of Report
End of
UNRECOVERED PLANT AND REGULATORY STUDY COSTS (182.2)
Southwestern Public Service CompanyX
04/13/20152014/Q4
Line No.
(c)(b)(a) (d)
Description of Unrecovered Plant Total Amount
of Charges
CostsRecognisedDuring Year
WRITTEN OFF DURING YEAR
AccountCharged Amount
Balance at
End of Year
(f)(e)
and Regulatory Study Costs [Includein the description of costs, the date of
Commission Authorization to use Acc 182.2and period of amortization (mo, yr to mo, yr)]
21
22
23
24
25
26
27
28
29
30
31
32
33
34
35
36
37
38
39
40
41
42
43
44
45
46
47
48
FERC FORM NO. 1 (ED. 12-88) Page 230b
49 TOTAL
116
Schedule Q-5 Page 116 of 300
Sponsor: Robinson Case No. 15-00139-UT

Name of Respondent This Report Is:(1) An Original(2) A Resubmission
Date of Report(Mo, Da, Yr)
Year/Period of Report
End of
Transmission Service and Generation Interconnection Study Costs
Southwestern Public Service CompanyX
04/13/20152014/Q4
Line No. Description
Costs Incurred During
(b)(a)Period Account Charged
(c)
ReimbursementsReceived During
(d)
Account CreditedWith Reimbursement
(e)
1. Report the particulars (details) called for concerning the costs incurred and the reimbursements received for performing transmission service andgenerator interconnection studies.2. List each study separately.3. In column (a) provide the name of the study.4. In column (b) report the cost incurred to perform the study at the end of period.5. In column (c) report the account charged with the cost of the study.6. In column (d) report the amounts received for reimbursement of the study costs at end of period.7. In column (e) report the account credited with the reimbursement received for performing the study.
the Period
Transmission Studies 1
5,718RB Wolves Transm load study 561.6 2
GSEC-BCEC Kelly load study ( 1,144) 143.0 3
GSEC-BCEC S Bailey load study 35,649 143.0 4
CV Irish Hills load study ( 570) 143.0 5
40,924GS-NP Hemphill Co BS load study 561.6 6
7
8
9
10
11
12
13
14
15
16
17
18
19
20
Generation Studies 21
4,786Clean line facility study 561.7 22
1,153Gen-2013-022 NM Solar Facility 561.7 23
30,283Garden City KS-DP change 561.7 24
6,396Games Wind 561.7 25
26,423Gaines Plant FS 561.7 26
998Gen-2013-027 150MW wind farm 561.7 27
998Gen-2014-007 400MW wind farm 561.7 28
250Gen-2014-33 Chaves 70MW solar 561.7 29
499Gen-2014-34 Chaves 70MW solar 561.7 30
250Gen-2014-035 Chaves 30MW solar 561.7 31
374Gen-2014-046 Chaves 125MW solar 561.7 32
826Gen-2014-037 Optima 200MW wind 561.7 33
374Gen-2014-038 Hitchland-Potter 200 561.7 34
374Gen-2014-047 Crossroads 40MW so 561.7 35
374Gen-2014-040 Castro 349MW wind 561.7 36
576Gen-2014-053 Carlisle 80MW wind 561.7 37
250Gen-2014-054 Carlisle 120MW wind 561.7 38
125Gen-2014-062 Roosevelt 200MW win 561.7 39
624Gen-2014-063 Hobbs 381MW wind 561.7 40
FERC FORM NO. 1/1-F/3-Q (NEW. 03-07) Page 231
117
Schedule Q-5 Page 117 of 300
Sponsor: Robinson Case No. 15-00139-UT
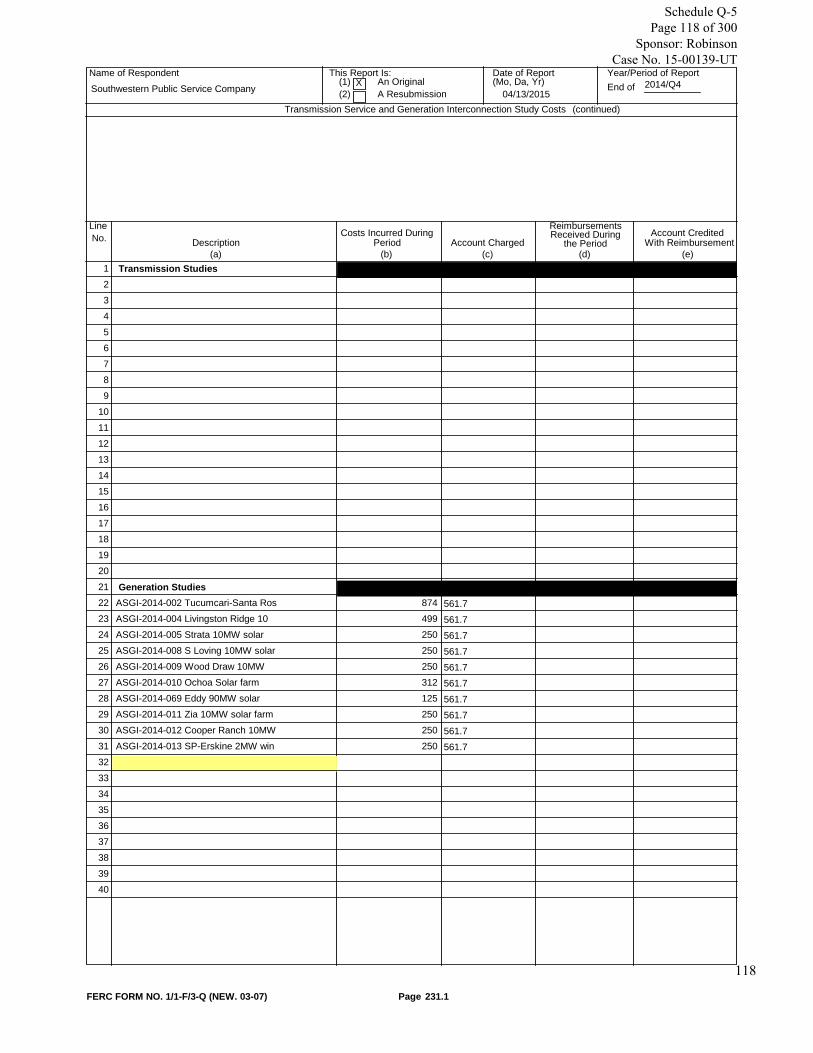
Name of Respondent This Report Is:(1) An Original(2) A Resubmission
Date of Report(Mo, Da, Yr)
Year/Period of Report
End of
Transmission Service and Generation Interconnection Study Costs
Southwestern Public Service CompanyX
04/13/20152014/Q4
Line No. Description
Costs Incurred During
(b)(a)Period Account Charged
(c)
ReimbursementsReceived During
(d)
Account CreditedWith Reimbursement
(e)the Period
(continued)
Transmission Studies 1
2
3
4
5
6
7
8
9
10
11
12
13
14
15
16
17
18
19
20
Generation Studies 21
874ASGI-2014-002 Tucumcari-Santa Ros 561.7 22
499ASGI-2014-004 Livingston Ridge 10 561.7 23
250ASGI-2014-005 Strata 10MW solar 561.7 24
250ASGI-2014-008 S Loving 10MW solar 561.7 25
250ASGI-2014-009 Wood Draw 10MW 561.7 26
312ASGI-2014-010 Ochoa Solar farm 561.7 27
125ASGI-2014-069 Eddy 90MW solar 561.7 28
250ASGI-2014-011 Zia 10MW solar farm 561.7 29
250ASGI-2014-012 Cooper Ranch 10MW 561.7 30
250ASGI-2014-013 SP-Erskine 2MW win 561.7 31
32
33
34
35
36
37
38
39
40
FERC FORM NO. 1/1-F/3-Q (NEW. 03-07) Page 231.1
118
Schedule Q-5 Page 118 of 300
Sponsor: Robinson Case No. 15-00139-UT

Schedule Page: 231.1 Line No.: 32 Column: aThe values reported in this page represent the actual costs incurred or reimbursementsreceived in the reporting period. As a result, cost and reimbursements for each study maybe reported in different reporting periods.
Name of Respondent
Southwestern Public Service Company
This Report is:(1) X An Original(2) A Resubmission
Date of Report(Mo, Da, Yr)
04/13/2015
Year/Period of Report
2014/Q4
FOOTNOTE DATA
FERC FORM NO. 1 (ED. 12-87) Page 450.1
119
Schedule Q-5 Page 119 of 300
Sponsor: Robinson Case No. 15-00139-UT

Name of Respondent This Report Is:(1) An Original(2) A Resubmission
Date of Report(Mo, Da, Yr)
Year/Period of Report
End of
OTHER REGULATORY ASSETS (Account 182.3)
Southwestern Public Service CompanyX
04/13/20152014/Q4
Line No.
Description and Purpose of Debits CREDITSWritten off Duringthe Quarter/YearAccount Charged
(d)(c)(a)
Balance at end ofCurrent Quarter/Year
(e)
Other Regulatory Assets Written off Duringthe Period
Amount
(f)
1. Report below the particulars (details) called for concerning other regulatory assets, including rate order docket number, if applicable.2. Minor items (5% of the Balance in Account 182.3 at end of period, or amounts less than $100,000 which ever is less), may begrouped by classes.3. For Regulatory Assets being amortized, show period of amortization.
Balance atBeginning of
CurrentQuarter/Year
(b)
209,670,797 253,537,664 15,609,000Various 59,475,867Pension and Employee Benefit Obligations 1
2
7,868,975 4,698,511 3,170,464926Pension and Employee Benefit Cap 3
Texas PUC Docket #42004 4
5
31,361,527 36,878,362 5,516,835AFUDC in Plant 6
- Amortized over plant life 7
8
21,381,744 21,689,426 307,682Non-Nuclear Asset Retirement Obligations 9
10
3,374,843 302,268 3,072,575254Prior Flow Thru and Excess ADIT 11
12
8,366,731 6,693,384 1,673,347908DSM Texas Historical Docket #35763 13
- Recovered in rates over 10 years through 14
base rates 15
16
291,834 72,959 218,875908DSM Texas Energy Efficiency 17
- 2010 Balance 18
Texas PUC Docket #35440 19
20
296,634 261,735 34,899407.3Texas Restructuring Meter 21
- A portion recovered in rates over 20 years 22
Texas PUC Docket #25088 23
24
2,537,802 1,736,391 801,411557Texas Regulatory REC Tracker - Layer 2 25
- Amortization Sep 2013 - Feb 2017 26
Docket #40824 27
28
6,058,468 3,200,156 2,858,312VariousTexas Regulatory REC Tracker - Layer 3 29
Docket #38147 (additions) 30
Docket #40824 (amortization) 31
32
15,387,753 15,387,7532014 Texas Surcharge 33
Docket #42004 34
35
2,607,522 2,266,117 341,405VariousNew Mexico Regulatory REC Tracker 36
Case #10-00395UT 37
38
527,678 381,467 146,211557New Mexico Regulatory REC Tracker-2009 39
- 32 month amortization ending March 2017 40
Case #12-00350-UT 41
42
2,968,360 1,850,345 3,520,530407.3 2,402,515New Mexico Distributed Generation Renewable 43
FERC FORM NO. 1/3-Q (REV. 02-04) Page 232
44 TOTAL 305,729,170 52,687,815 364,010,012 110,968,657 120
Schedule Q-5 Page 120 of 300
Sponsor: Robinson Case No. 15-00139-UT

Name of Respondent This Report Is:(1) An Original(2) A Resubmission
Date of Report(Mo, Da, Yr)
Year/Period of Report
End of
OTHER REGULATORY ASSETS (Account 182.3)
Southwestern Public Service CompanyX
04/13/20152014/Q4
Line No.
Description and Purpose of Debits CREDITSWritten off Duringthe Quarter/YearAccount Charged
(d)(c)(a)
Balance at end ofCurrent Quarter/Year
(e)
Other Regulatory Assets Written off Duringthe Period
Amount
(f)
1. Report below the particulars (details) called for concerning other regulatory assets, including rate order docket number, if applicable.2. Minor items (5% of the Balance in Account 182.3 at end of period, or amounts less than $100,000 which ever is less), may begrouped by classes.3. For Regulatory Assets being amortized, show period of amortization.
Balance atBeginning of
CurrentQuarter/Year
(b)
Energy Costs 1
- 2 year amortization ending April 2016 2
Case #12-00350-UT 3
4
490,903 513,344 2,590421 25,031Deferred Electric Cost Interest from 5
Texas Unrecovered Fuel Costs 6
7
911,057 10,408,569 100,428456.1 9,597,940Transmission Formula - Attachment O True-up 8
9
17,281 17,310 13,252407.3 13,281REC Filing Costs - WREGIS 10
Case #09-00258-UT 11
Case #12-00350-UT 12
- 2 year amortization ending April 2016 13
14
1,757,800 1,307,308 1,564,732557 1,114,240New Mexico Solar REC Costs 15
Case #10-00015-UT 16
Case #12-00350-UT 17
- 2 year anortmzation ending April 2016 18
19
3,920,333 111,683 6,764,438Various 2,955,788Large Customer RPS Cap Refund 20
Case #09-00258-UT 21
Case #12-00350-UT 22
- 2 year amortization ending April 2016 23
24
16,012 12,068 3,944509New Mexico NOx Expense 25
Case #10-00395-UT 26
Case #12-00350-UT 27
- 2 year amortization ending April 2016 28
29
412,622 605,369 132,862421 325,609New Mexico Interest for solar RECs, Large 30
Customer Cap, WREGIS and DG 31
- Amortization per Case #12-00350-UT 32
Case #12-00111-UT 33
34
97,924 5,180,907557 5,278,831New Mexico SunEd Uneconomic Costs 35
36
275,412 275,497( 85)VariousDeferred Renewable Cost Rider 37
Case #12-00111-UT 38
39
614,835 1,704,402 7,477,718Various 8,567,285DSM NM Concurrent 40
Reference A2 41
42
43
FERC FORM NO. 1/3-Q (REV. 02-04) Page 232.1
44 TOTAL 305,729,170 52,687,815 364,010,012 110,968,657 121
Schedule Q-5 Page 121 of 300
Sponsor: Robinson Case No. 15-00139-UT

Schedule Page: 232 Line No.: 1 Column: d
Account charged:184 $13,477,000 146 2,132,000 228.3 0
$15,609,000
Schedule Page: 232 Line No.: 1 Column: f
Regulatory asset - Pension $252,101,766 Regulatory asset - Non-qualified pension 1,435,897 Rounding 1
$253,537,664
'Employers' Accounting for Defined Benefit Pension and Other Postretirement Plans -- InSeptember 2006, the FASB issued accounting guidance which requires companies to fullyrecognize the funded status of each pension and other postretirement benefit plan as aliability or asset on their balance sheets with all unrecognized amounts to be recorded inother comprehensive income. Xcel Energy applied regulatory accounting treatment, whichallowed recognition of this item as a regulatory asset rather than as a charge toaccumulated other comprehensive income.
SFAS No. 158 amounts have been recorded as such based upon expected recovery in Rates.
Schedule Page: 232 Line No.: 29 Column: d
Account charged:557 $2,427,491 411.9 430,821
$2,858,312
Schedule Page: 232 Line No.: 36 Column: d
Account charged:254 $292,843 411.9 48,562
$341,405
Schedule Page: 232 Line No.: 39 Column: f
Balance was combines with Line 36 as of 12/31/2013.
Schedule Page: 232.1 Line No.: 20 Column: d
Account charged:407.3 $3,975,563 242 2,788,875
$6,764,438
Schedule Page: 232.1 Line No.: 37 Column: eAccount charged:
407.3 ($53) 456 (2)
Name of Respondent
Southwestern Public Service Company
This Report is:(1) X An Original(2) A Resubmission
Date of Report(Mo, Da, Yr)
04/13/2015
Year/Period of Report
2014/Q4
FOOTNOTE DATA
FERC FORM NO. 1 (ED. 12-87) Page 450.1
122
Schedule Q-5 Page 122 of 300
Sponsor: Robinson Case No. 15-00139-UT

557 (26) 419 (4) ($85)Schedule Page: 232.1 Line No.: 40 Column: d
Account charged:908 $7,321,967 419 463 456 108,906254 46,392
$7,477,718
Name of Respondent
Southwestern Public Service Company
This Report is:(1) X An Original(2) A Resubmission
Date of Report(Mo, Da, Yr)
04/13/2015
Year/Period of Report
2014/Q4
FOOTNOTE DATA
FERC FORM NO. 1 (ED. 12-87) Page 450.2
123
Schedule Q-5 Page 123 of 300
Sponsor: Robinson Case No. 15-00139-UT

Name of Respondent This Report Is:(1) An Original(2) A Resubmission
Date of Report(Mo, Da, Yr)
Year/Period of Report
End of
MISCELLANEOUS DEFFERED DEBITS (Account 186)
Southwestern Public Service CompanyX
04/13/20152014/Q4
Line No.
Description of Miscellaneous Debits CREDITSAccount
(c)(b)(a)
Balance atEnd of Year
(d)
Deferred Debits Amount(e)
Balance at Beginning of Year
(f)Charged
1. Report below the particulars (details) called for concerning miscellaneous deferred debits.2. For any deferred debit being amortized, show period of amortization in column (a)3. Minor item (1% of the Balance at End of Year for Account 186 or amounts less than $100,000, whichever is less) may be grouped byclasses.
4,925,013 2,435,505 2,489,508557Sharing Unrealized MTM Prop 1Margins 2
3 1,818,132 1,518,738 1,723,146 1,423,752 236Long-term Income Tax and 4
Interest Receivable 5 6
94,093 70,918 23,175928New Mexico Fuel & REC Audit 7Case #12-00350-UT - 3 year 8Amortization ending April 2017 9
10 21,839 176 410,136 388,473 181Debt Issuance Expense 11
- Amortization over life of 12issued bonds 13
14 430,744 430,744182.3Texas DSM - Earned Incentive 15
16 62,108 62,108928Texas EECRF Rate Case Costs 17
Docket #40293 18- Amortization ended Dec. 2014 19
20 1,875,480 989,436 967,795 81,751 9282012 Texas Rate Case Costs 21
Docket #42004 22- 3 year amortization ending 23May 2017 24
25 1,808,714 1,282,007 634,842 108,135 9282012 New Mexico Rate Case Costs 26
New Mexico Case No. 12-00350-UT 27- 3 year amortization ending 28April 2017 29
30 142,202 315,084 172,8822012 FERC Complaint Case Costs 31
FERC Docket #EL12-59-000 32 33
1,264,205 2,303,402 520,612 1,559,809 9282014 Texas Rate Case Costs 34Docket #42004 35
36 1,681,257 1,681,257SPS EL05-19 Surcharge 37
38 916,668 916,6682015 TX Electric Rate Case 39
Docket #43695 40 41
29,895 29,8952015 NM Retail Rate Case 42 43
1,014,000 1,014,000Prepaid Retiree Medical 44 45
15,381 15,3812015 FERC Rate Case 46
FERC FORM NO. 1 (ED. 12-94) Page 233
49 TOTAL
47 Misc. Work in Progress
48Deferred Regulatory Comm.Expenses (See pages 350 - 351)
14,123,787 12,572,467
124
Schedule Q-5 Page 124 of 300
Sponsor: Robinson Case No. 15-00139-UT

Schedule Page: 233 Line No.: 1 Column: c
This account is used to record an estimated impact of JOA allocations and estimatedrate payer sharing on a forward Mark-to-Market position. Credit balances areadjustments and are not amortizations nor write-offs.
Schedule Page: 233 Line No.: 1 Column: e
This account is used to record an estimated impact of JOA allocations and estimatedrate payer sharing on a forward Mark-to-Market position. Credit balances areadjustments and are not amortizations nor write-offs.
Name of Respondent
Southwestern Public Service Company
This Report is:(1) X An Original(2) A Resubmission
Date of Report(Mo, Da, Yr)
04/13/2015
Year/Period of Report
2014/Q4
FOOTNOTE DATA
FERC FORM NO. 1 (ED. 12-87) Page 450.1
125
Schedule Q-5 Page 125 of 300
Sponsor: Robinson Case No. 15-00139-UT
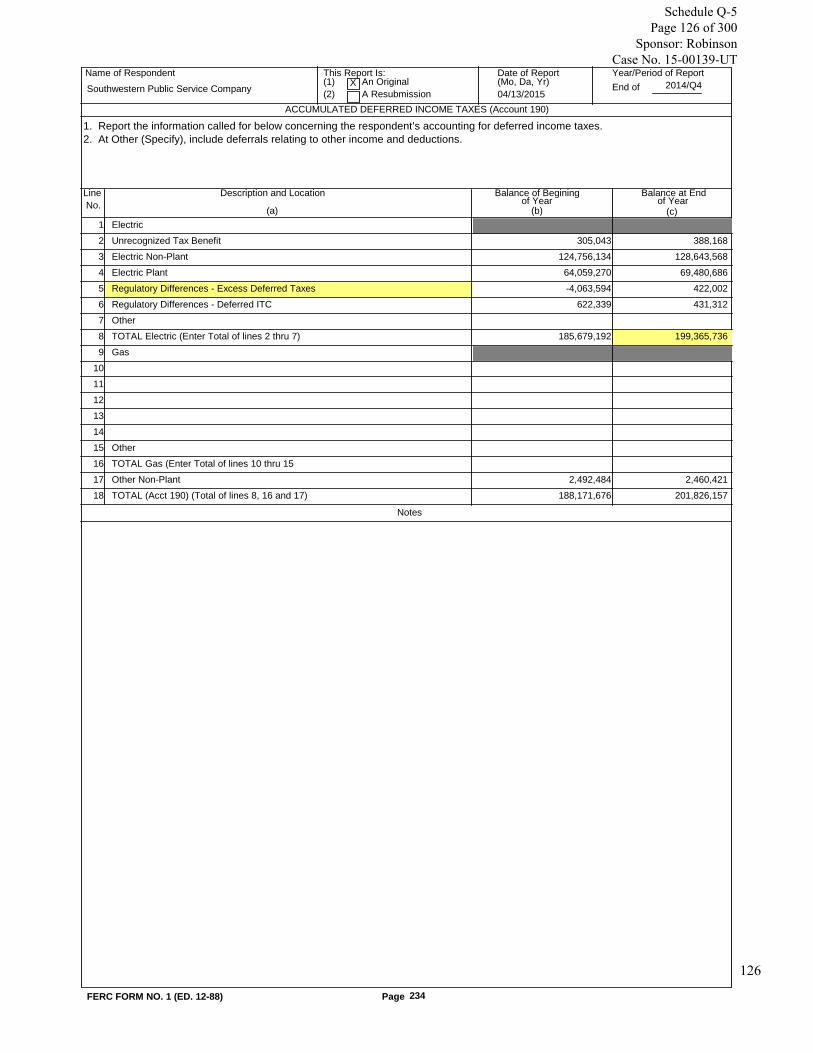
Name of Respondent This Report Is:(1) An Original(2) A Resubmission
Date of Report(Mo, Da, Yr)
Year/Period of Report
End of
ACCUMULATED DEFERRED INCOME TAXES (Account 190)
Southwestern Public Service CompanyX
04/13/20152014/Q4
Line No.
Description and Location Balance of Begining
(c)(b)(a)
Balance at Endof Year of Year
1. Report the information called for below concerning the respondent’s accounting for deferred income taxes.2. At Other (Specify), include deferrals relating to other income and deductions.
Electric 1
388,168 305,043Unrecognized Tax Benefit 2
128,643,568 124,756,134Electric Non-Plant 3
69,480,686 64,059,270Electric Plant 4
422,002 -4,063,594Regulatory Differences - Excess Deferred Taxes 5
431,312 622,339Regulatory Differences - Deferred ITC 6
Other 7
199,365,736 185,679,192TOTAL Electric (Enter Total of lines 2 thru 7) 8
Gas 9
10
11
12
13
14
Other 15
TOTAL Gas (Enter Total of lines 10 thru 15 16
2,460,421 2,492,484Other Non-Plant 17
201,826,157 188,171,676TOTAL (Acct 190) (Total of lines 8, 16 and 17) 18
Notes
FERC FORM NO. 1 (ED. 12-88) Page 234
126
Schedule Q-5 Page 126 of 300
Sponsor: Robinson Case No. 15-00139-UT

Schedule Page: 234 Line No.: 5 Column: aExcess Deferred TaxesSchedule Page: 234 Line No.: 8 Column: c
12/31/2013 12/31/2014Electric Distribution Plant $31,017,405 $33,222,141 Electric General Plant 795,874 701,673 Electric Production Plant 7,632,630 8,082,260 Electric Transmission Plant 24,460,512 27,287,999 Electric Transmission-Production Plant 152,849 186,613 Regulatory Difference - Excess Deferred Taxes (4,063,594) 422,002 Regulatory Difference - Deferred ITC 622,339 431,312 TOTAL Electric Plant $60,618,015 $70,334,000
Name of Respondent
Southwestern Public Service Company
This Report is:(1) X An Original(2) A Resubmission
Date of Report(Mo, Da, Yr)
04/13/2015
Year/Period of Report
2014/Q4
FOOTNOTE DATA
FERC FORM NO. 1 (ED. 12-87) Page 450.1
127
Schedule Q-5 Page 127 of 300
Sponsor: Robinson Case No. 15-00139-UT

Name of Respondent This Report Is:(1) An Original(2) A Resubmission
Date of Report(Mo, Da, Yr)
Year/Period of Report
End of
CAPITAL STOCKS (Account 201 and 204)
Southwestern Public Service CompanyX
04/13/20152014/Q4
Line No.
Class and Series of Stock and Number of shares
(c)(b)(a)
Call Price at End of Year
Par or StatedValue per share
(d)
Name of Stock Series Authorized by Charter
1. Report below the particulars (details) called for concerning common and preferred stock at end of year, distinguishing separateseries of any general class. Show separate totals for common and preferred stock. If information to meet the stock exchange reportingrequirement outlined in column (a) is available from the SEC 10-K Report Form filing, a specific reference to report form (i.e., year andcompany title) may be reported in column (a) provided the fiscal years for both the 10-K report and this report are compatible.2. Entries in column (b) should represent the number of shares authorized by the articles of incorporation as amended to end of year.
1.00 200Account 201: Common Stock 1
All SPS Common Stock owned by its parent, 2
Xcel Energy 3
4
5
6
200Total Common 7
8
1.00 10,000,000Account 204: Preferred Stock 9
10
11
12
13
14
10,000,000Total Preferred 15
16
17
18
19
20
21
22
23
24
25
26
27
28
29
30
31
32
33
34
35
36
37
38
39
40
41
42
FERC FORM NO. 1 (ED. 12-91) Page 250
128
Schedule Q-5 Page 128 of 300
Sponsor: Robinson Case No. 15-00139-UT

AS REACQUIRED STOCK (Account 217)
Name of Respondent This Report Is:(1) An Original(2) A Resubmission
Date of Report(Mo, Da, Yr)
Year/Period of Report
End of
CAPITAL STOCKS (Account 201 and 204) (Continued)
Southwestern Public Service CompanyX
04/13/20152014/Q4
Line No.
OUTSTANDING PER BALANCE SHEET HELD BY RESPONDENT
IN SINKING AND OTHER FUNDS
Shares(g)
Cost(h)
Shares SharesAmount
(Total amount outstanding without reductionfor amounts held by respondent)
Amount(e) (f) (i) (j)
3. Give particulars (details) concerning shares of any class and series of stock authorized to be issued by a regulatory commissionwhich have not yet been issued.4. The identification of each class of preferred stock should show the dividend rate and whether the dividends are cumulative ornon-cumulative.5. State in a footnote if any capital stock which has been nominally issued is nominally outstanding at end of year.Give particulars (details) in column (a) of any nominally issued capital stock, reacquired stock, or stock in sinking and other funds whichis pledged, stating name of pledgee and purposes of pledge.
100 100 1
2
3
4
5
6
100 100 7
8
9
10
11
12
13
14
15
16
17
18
19
20
21
22
23
24
25
26
27
28
29
30
31
32
33
34
35
36
37
38
39
40
41
42
FERC FORM NO. 1 (ED. 12-88) Page 251
129
Schedule Q-5 Page 129 of 300
Sponsor: Robinson Case No. 15-00139-UT

Name of Respondent This Report Is:(1) An Original(2) A Resubmission
Date of Report(Mo, Da, Yr)
Year/Period of Report
End ofSouthwestern Public Service CompanyX
04/13/20152014/Q4
Line Item Amount(b)(a)
OTHER PAID-IN CAPITAL (Accounts 208-211, inc.)
No.
Report below the balance at the end of the year and the information specified below for the respective other paid-in capital accounts. Provide asubheading for each account and show a total for the account, as well as total of all accounts for reconciliation with balance sheet, Page 112. Add morecolumns for any account if deemed necessary. Explain changes made in any account during the year and give the accounting entries effecting suchchange.(a) Donations Received from Stockholders (Account 208)-State amount and give brief explanation of the origin and purpose of each donation.(b) Reduction in Par or Stated value of Capital Stock (Account 209): State amount and give brief explanation of the capital change which gave rise toamounts reported under this caption including identification with the class and series of stock to which related.(c) Gain on Resale or Cancellation of Reacquired Capital Stock (Account 210): Report balance at beginning of year, credits, debits, and balance at endof year with a designation of the nature of each credit and debit identified by the class and series of stock to which related.(d) Miscellaneous Paid-in Capital (Account 211)-Classify amounts included in this account according to captions which, together with brief explanations,disclose the general nature of the transactions which gave rise to the reported amounts.
1
2
3
4
5
6
7
8
9
10
11
12
13
14
15
16
17
18
19
20
21
22
23
24
25
26
27
28
29
30
31
32
33
34
35
36
37
38
39
FERC FORM NO. 1 (ED. 12-87) Page 253
40 TOTAL
130
Schedule Q-5 Page 130 of 300
Sponsor: Robinson Case No. 15-00139-UT

Name of Respondent This Report Is:(1) An Original(2) A Resubmission
Date of Report(Mo, Da, Yr)
Year/Period of Report
End of
CAPITAL STOCK EXPENSE (Account 214)
Southwestern Public Service CompanyX
04/13/20152014/Q4
Line No.
Class and Series of Stock Balance at End of Year(b)(a)
1. Report the balance at end of the year of discount on capital stock for each class and series of capital stock.2. If any change occurred during the year in the balance in respect to any class or series of stock, attach a statement giving particulars(details) of the change. State the reason for any charge-off of capital stock expense and specify the account charged.
9,033,435Common Stock 1
2
3
4
5
6
7
8
9
10
11
12
13
14
15
16
17
18
19
20
21
FERC FORM NO. 1 (ED. 12-87) Page 254b
22 TOTAL 9,033,435
131
Schedule Q-5 Page 131 of 300
Sponsor: Robinson Case No. 15-00139-UT

Name of Respondent This Report Is:(1) An Original(2) A Resubmission
Date of Report(Mo, Da, Yr)
Year/Period of Report
End of
LONG-TERM DEBT (Account 221, 222, 223 and 224)
Southwestern Public Service CompanyX
04/13/20152014/Q4
Line No.
Class and Series of Obligation, Coupon Rate
(c)(b)(a)
Total expense, Premium or Discount
Principal AmountOf Debt issued(For new issue, give commission Authorization numbers and dates)
1. Report by balance sheet account the particulars (details) concerning long-term debt included in Accounts 221, Bonds, 222,Reacquired Bonds, 223, Advances from Associated Companies, and 224, Other long-Term Debt.2. In column (a), for new issues, give Commission authorization numbers and dates.3. For bonds assumed by the respondent, include in column (a) the name of the issuing company as well as a description of the bonds.4. For advances from Associated Companies, report separately advances on notes and advances on open accounts. Designatedemand notes as such. Include in column (a) names of associated companies from which advances were received.5. For receivers, certificates, show in column (a) the name of the court -and date of court order under which such certificates wereissued.6. In column (b) show the principal amount of bonds or other long-term debt originally issued.7. In column (c) show the expense, premium or discount with respect to the amount of bonds or other long-term debt originally issued.8. For column (c) the total expenses should be listed first for each issuance, then the amount of premium (in parentheses) or discount.Indicate the premium or discount with a notation, such as (P) or (D). The expenses, premium or discount should not be netted.9. Furnish in a footnote particulars (details) regarding the treatment of unamortized debt expense, premium or discount associated withissues redeemed during the year. Also, give in a footnote the date of the Commission’s authorization of treatment other than asspecified by the Uniform System of Accounts.
Account 221 - Bonds 1
3,848,628 200,000,0004.50% Aug 15, 2041 Secured First Mortgage Bonds 2
3,014,000 3 D
1,380,528 100,000,0004.50% Aug 15, 2041 Secured First Mortgage Bonds 4
-10,058,000 5 P
1,307,249 100,000,0004.50% Aug 15, 2041 Secured First Mortgage Bonds 6
4,088,000 7 D
1,360,054 150,000,0003.30% Jun 15, 2024 Secured First Mortgage Bonds 8
495,000 9 D
5,435,459 550,000,000Total Account 221 10
11
Account 224 - Other Long Term Debt 12
13
1,237,091 100,000,0006.00% Oct 1, 2033 Unsecured Series C and D Senior Notes 14
810,000 15 D
1,626,607 200,000,0005.60% Oct 1, 2015 Unsecured Series E Senior Notes 16
240,000 17 D
2,596,882 250,000,0006.00% Oct 1, 2036 Unsecured Series F Senior Notes 18
1,922,500 19 D
1,873,368 250,000,0008.75% Dec 1, 2018 Unsecured Series G Senior Notes 20
2,065,000 21 D
22
23
24
12,371,448 800,000,000Total Account 224 25
26
Interest on Debt to Associated Companies 27
28
29
30
31
32
FERC FORM NO. 1 (ED. 12-96) Page 256
33 TOTAL 1,350,000,000 17,806,907 132
Schedule Q-5 Page 132 of 300
Sponsor: Robinson Case No. 15-00139-UT

Name of Respondent This Report Is:(1) An Original(2) A Resubmission
Date of Report(Mo, Da, Yr)
Year/Period of Report
End of
LONG-TERM DEBT (Account 221, 222, 223 and 224) (Continued)
Southwestern Public Service CompanyX
04/13/20152014/Q4
Line No.Nominal Date
of IssueDate ofMaturity
AMORTIZATION PERIOD
Date From Date To
Outstanding(Total amount outstanding without
reduction for amounts held byrespondent)
Interest for YearAmount
(d) (e) (f) (g) (h) (i)
10. Identify separate undisposed amounts applicable to issues which were redeemed in prior years.11. Explain any debits and credits other than debited to Account 428, Amortization and Expense, or credited to Account 429, Premiumon Debt - Credit.12. In a footnote, give explanatory (details) for Accounts 223 and 224 of net changes during the year. With respect to long-termadvances, show for each company: (a) principal advanced during year, (b) interest added to principal amount, and (c) principle repaidduring year. Give Commission authorization numbers and dates.13. If the respondent has pledged any of its long-term debt securities give particulars (details) in a footnote including name of pledgeeand purpose of the pledge.14. If the respondent has any long-term debt securities which have been nominally issued and are nominally outstanding at end ofyear, describe such securities in a footnote.15. If interest expense was incurred during the year on any obligations retired or reacquired before end of year, include such interestexpense in column (i). Explain in a footnote any difference between the total of column (i) and the total of Account 427, interest onLong-Term Debt and Account 430, Interest on Debt to Associated Companies.16. Give particulars (details) concerning any long-term debt authorized by a regulatory commission but not yet issued.
/ 1
200,000,000 9,000,0008/15/20418/10/20118/15/20418/10/2011 2
3
100,000,000 4,500,0008/15/20416/12/20128/15/20416/12/2012 4
5
100,000,000 4,500,0008/15/20418/20/20138/15/20418/20/2013 6
7
150,000,000 2,777,5006/15/20246/09/20146/15/20246/09/2014 8
9
550,000,000 20,777,500 10
11
12
13
100,000,000 6,063,18110/1/203310/6/200310/1/203310/6/2003 14
15
200,000,000 11,404,96710/1/201610/6/200610/1/201610/6/2006 16
17
250,000,000 15,000,00010/1/203610/6/200610/1/203610/6/2006 18
19
250,000,000 21,875,00012/1/201811/19/200812/1/201811/19/2008 20
21
22
23
24
800,000,000 54,343,148 25
26
73,221 27
28
29
30
31
32
FERC FORM NO. 1 (ED. 12-96) Page 257
33 1,350,000,000 75,193,869 133
Schedule Q-5 Page 133 of 300
Sponsor: Robinson Case No. 15-00139-UT

Schedule Page: 256 Line No.: 8 Column: aDocket S-14-00018-UT Order dated Feb. 19, 2014
Southwest Public Service Company issued $150 million of 3.30 percent first mortgage bondsdue June 15, 2024. Southwest Public Service Company used a portion of the net proceedsfrom the sale to repay short-term borrowings and for other general corporate purposes. Schedule Page: 256 Line No.: 14 Column: iInterest at stated rate $6,000,000Interest swap loss 63,181 $6,063,181Schedule Page: 256 Line No.: 16 Column: iInterest at stated rate $11,200,000Interest swap loss 204,967 $11,404,967Schedule Page: 256 Line No.: 27 Column: iXcel Energy Services Inc. $53,532Money Pool 19,689 $73,221
Name of Respondent
Southwestern Public Service Company
This Report is:(1) X An Original(2) A Resubmission
Date of Report(Mo, Da, Yr)
04/13/2015
Year/Period of Report
2014/Q4
FOOTNOTE DATA
FERC FORM NO. 1 (ED. 12-87) Page 450.1
134
Schedule Q-5 Page 134 of 300
Sponsor: Robinson Case No. 15-00139-UT
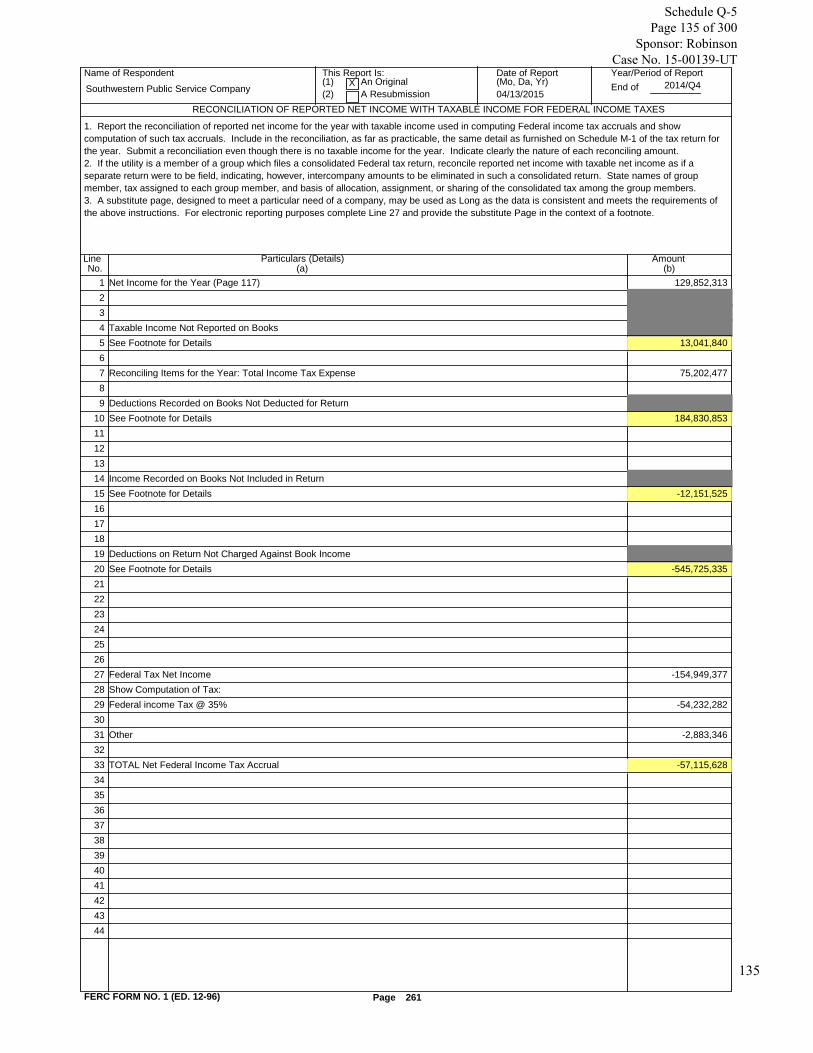
Name of Respondent This Report Is:(1) An Original(2) A Resubmission
Date of Report(Mo, Da, Yr)
Year/Period of Report
End of
RECONCILIATION OF REPORTED NET INCOME WITH TAXABLE INCOME FOR FEDERAL INCOME TAXES
Southwestern Public Service CompanyX
04/13/20152014/Q4
Particulars (Details)(b)(a)
Amount LineNo.
1. Report the reconciliation of reported net income for the year with taxable income used in computing Federal income tax accruals and showcomputation of such tax accruals. Include in the reconciliation, as far as practicable, the same detail as furnished on Schedule M-1 of the tax return forthe year. Submit a reconciliation even though there is no taxable income for the year. Indicate clearly the nature of each reconciling amount.2. If the utility is a member of a group which files a consolidated Federal tax return, reconcile reported net income with taxable net income as if aseparate return were to be field, indicating, however, intercompany amounts to be eliminated in such a consolidated return. State names of groupmember, tax assigned to each group member, and basis of allocation, assignment, or sharing of the consolidated tax among the group members.3. A substitute page, designed to meet a particular need of a company, may be used as Long as the data is consistent and meets the requirements ofthe above instructions. For electronic reporting purposes complete Line 27 and provide the substitute Page in the context of a footnote.
129,852,313Net Income for the Year (Page 117) 1
2
3
Taxable Income Not Reported on Books 4
13,041,840See Footnote for Details 5
6
75,202,477Reconciling Items for the Year: Total Income Tax Expense 7
8
Deductions Recorded on Books Not Deducted for Return 9
184,830,853See Footnote for Details 10
11
12
13
Income Recorded on Books Not Included in Return 14
-12,151,525See Footnote for Details 15
16
17
18
Deductions on Return Not Charged Against Book Income 19
-545,725,335See Footnote for Details 20
21
22
23
24
25
26
-154,949,377Federal Tax Net Income 27
Show Computation of Tax: 28
-54,232,282Federal income Tax @ 35% 29
30
-2,883,346Other 31
32
-57,115,628TOTAL Net Federal Income Tax Accrual 33
34
35
36
37
38
39
40
41
42
43
44
FERC FORM NO. 1 (ED. 12-96) Page 261
135
Schedule Q-5 Page 135 of 300
Sponsor: Robinson Case No. 15-00139-UT

Schedule Page: 261 Line No.: 5 Column: b
Taxable Income Not Reported On Books
Provision for Contributions in Aid of Construction $9,685,129 Rate Refund 3,356,711 Total to Page 261 $13,041,840
Schedule Page: 261 Line No.: 10 Column: bDeductions Recorded on Books Not Deducted For ReturnAvoided Cost Interest $11,220,215 Bad Debts 363,825 Book Depreciation Provision 125,501,017 Book Unamortized Cost of Reacquired Debt 1,224,570 Club Dues 33,000 Clearing Account Book Expense 5,574,971 Contributions Carryover 1,817,314 Deferred Compensation Plan Reserve 174,664 Environmental Remediation 92,440 ESOP Dividends 603,481 Gain/(Loss) on Disposition of Assets 327,245 Federal NOL Benefit 11,694,082 Inventory Reserve 1,026 Lobbying Expenses 700,000 Mark-to-Market Adjustment 2,489,508 Meals and Entertainment 378,000 Pension & Benefits Capitalized 313,690 Pension Expense 5,635,359 Performance Share Plan 73,516 Rate Case / Restructuring 251,387 Regulatory Asset / Liability - Transmission Attach O 9,499,076 Regulatory Asset - NM NOX 3,944 Renewable Energy Standard 4,916,119 Unrecovered REC Inventory 1,942,404 Total to Page 261 $184,830,853
Schedule Page: 261 Line No.: 15 Column: bIncome Recorded On Books Not Included In ReturnAFUDC Equity ($12,138,991)Deferred Revenue (ITC Grant Accounting) (12,534)Total to Page 261 ($12,151,525)
Schedule Page: 261 Line No.: 20 Column: b
Deductions On Return Not Charged Against Book IncomeAFUDC Debt ($7,123,097)Allowable Depreciation (407,391,520)Cost of Removal (20,332,287)Deferred Fuel Costs (2,430,358)Demand Side Management (39,347)Depletion on Royalty Income (1,047)Employee Incentive (254,399)ETI Current Year Gain/(Loss) Adjustment (62,841)Interest Expense - Deferred Fuel Revenue (22,441)Interest Income/Expense on Disputed Tax (108,220)Internally Developed Software (1,384,638)Non-Qualified Pension Plan (92,762)
Name of Respondent
Southwestern Public Service Company
This Report is:(1) X An Original(2) A Resubmission
Date of Report(Mo, Da, Yr)
04/13/2015
Year/Period of Report
2014/Q4
FOOTNOTE DATA
FERC FORM NO. 1 (ED. 12-87) Page 450.1
136
Schedule Q-5 Page 136 of 300
Sponsor: Robinson Case No. 15-00139-UT

Penalties (75,399)Post Employment Benefit - Retiree Medical (326,167)Post Employment Benefit - Worker's Compensation (1,279,780)Regulatory Asset - Texas Surcharge (15,387,752)Regulatory Liability - Refund Obligation (8,885,040)Repair Expenditures (67,622,144)TUCO Refund (364,732)Section 174 Expenditures (2,400,000)State Tax Deduction (3,285,534)Unbilled Revenue - Fuel Costs (6,825,101)Vacation Accrual (30,729)Total to Page 261 ($545,725,335)
Schedule Page: 261 Line No.: 33 Column: bSouthwestern Public Service Company is a member of an affiliated groupwhich will file a consolidated federal income tax return for the year2014. The other members of the affiliated group and the federal incometax provision of each are:
Xcel Energy Inc. (29,566,342)Northern States Power Company (Minnesota) and Subsidiaries 3,725,114 Northern States Power Company (Wisconsin) and Subsidiaries (3,896,670)Public Service Company of Colorado and Subsidiaries 8,934,894 Xcel Energy Communications Group Inc. and Subsidiaries 320,300 Xcel Energy Markets Group Inc. and Subsidiaries 744,136 Xcel Energy International Inc. 9,153 Xcel Energy Retail Holdings Inc. and Subsidiaries (11,066) Xcel Energy Transmission Holding Company, LLC andSubsidiaries
(131,339)
Xcel Energy Ventures Inc. and Subsidiaries (413,217)Xcel Energy Wholesale Group Inc. and Subsidiaries 6,014,217 Xcel Energy WYCO Inc. 7,042,260 WestGas Interstate, Inc. 36,201 Xcel Energy Services Inc. (5,495,200)
The consolidated federal income tax liability is apportioned among themember companies based on the stand-alone method. The stand-alone methodallocates the consolidated federal income tax liability among thecompanies based on the recognition of the benefits/burdens contributed byeach member to the consolidated return. Under the stand-alone method, thesum of the amounts allocated to the member companies equals theconsolidated amount.
Name of Respondent
Southwestern Public Service Company
This Report is:(1) X An Original(2) A Resubmission
Date of Report(Mo, Da, Yr)
04/13/2015
Year/Period of Report
2014/Q4
FOOTNOTE DATA
FERC FORM NO. 1 (ED. 12-87) Page 450.2
137
Schedule Q-5 Page 137 of 300
Sponsor: Robinson Case No. 15-00139-UT

Name of Respondent This Report Is:(1) An Original(2) A Resubmission
Date of Report(Mo, Da, Yr)
Year/Period of Report
End of
TAXES ACCRUED, PREPAID AND CHARGED DURING YEAR
Southwestern Public Service CompanyX
04/13/20152014/Q4
Line No.
Kind of Tax(See instruction 5)
BALANCE AT BEGINNING OF YEARTaxes Accrued(Account 236)
Prepaid Taxes(Include in Account 165)
TaxesChargedDuringYear
TaxesPaid
DuringAdjust-ments
Year(a) (b) (c) (d) (e) (f)
1. Give particulars (details) of the combined prepaid and accrued tax accounts and show the total taxes charged to operations and other accounts duringthe year. Do not include gasoline and other sales taxes which have been charged to the accounts to which the taxed material was charged. If theactual, or estimated amounts of such taxes are know, show the amounts in a footnote and designate whether estimated or actual amounts.2. Include on this page, taxes paid during the year and charged direct to final accounts, (not charged to prepaid or accrued taxes.)Enter the amounts in both columns (d) and (e). The balancing of this page is not affected by the inclusion of these taxes.3. Include in column (d) taxes charged during the year, taxes charged to operations and other accounts through (a) accruals credited to taxes accrued,(b)amounts credited to proportions of prepaid taxes chargeable to current year, and (c) taxes paid and charged direct to operations or accounts otherthan accrued and prepaid tax accounts.4. List the aggregate of each kind of tax in such manner that the total tax for each State and subdivision can readily be ascertained.
FEDERAL: 1
-45,964,317 2,083,041 -57,201,913 2,194,487Income 2
-86,285 86,285Income Tax Adjustment 3
1,8132013 Federal Unemployment 4
59,295 58,7522014 Federal Unemployment 5
541,391 541,3912013 FICA 6
7,685,353 8,183,7482014 FICA 7
-37,678,278 1,996,756 -48,873,128 2,737,691 Subtotal 8
9
STATE: 10
2,289 2,2892013 State Unemployment 11
81,018 82,9722014 State Unemployment 12
83,307 82,972 2,289 Subtotal 13
14
TEXAS: 15
3,159,116 1,642,183 2,546,824 2,128,867Income 16
-236,750 236,750Income Tax Adjustment 17
Franchise 18
9,002,741 8,809,470 914,137Use 19
13,621,880 -77,643 13,699,5242013 Property Tax 20
8,326,307 24,800,0002014 Property Tax 21
6,362,840 6,362,840Gross Receipts 22
40,472,884 1,405,433 42,678,241 16,742,528 Subtotal 23
24
NEW MEXICO: 25
126,418 -1,551 22,949 3,466Income 26
-1,978 1,978Income Tax Adjustment 27
50 50Franchise 28
7,452,751 8,744,871 553,375Use 29
2,039,722 -588 2,040,3102013 Property Tax 30
2,041,216 4,400,0002014 Property Tax 31
11,660,157 -3,529 13,169,260 3,466 2,593,685 Subtotal 32
33
34
35
36
37
38
39
40
63,071
FERC FORM NO. 1 (ED. 12-96) Page 262
TOTAL41 17,254,517 24,680,204 4,191,082 22,765,494 138
Schedule Q-5 Page 138 of 300
Sponsor: Robinson Case No. 15-00139-UT

Name of Respondent This Report Is:(1) An Original(2) A Resubmission
Date of Report(Mo, Da, Yr)
Year/Period of Report
End of
TAXES ACCRUED, PREPAID AND CHARGED DURING YEAR
Southwestern Public Service CompanyX
04/13/20152014/Q4
Line No.
Kind of Tax(See instruction 5)
BALANCE AT BEGINNING OF YEARTaxes Accrued(Account 236)
Prepaid Taxes(Include in Account 165)
TaxesChargedDuringYear
TaxesPaid
DuringAdjust-ments
Year(a) (b) (c) (d) (e) (f)
1. Give particulars (details) of the combined prepaid and accrued tax accounts and show the total taxes charged to operations and other accounts duringthe year. Do not include gasoline and other sales taxes which have been charged to the accounts to which the taxed material was charged. If theactual, or estimated amounts of such taxes are know, show the amounts in a footnote and designate whether estimated or actual amounts.2. Include on this page, taxes paid during the year and charged direct to final accounts, (not charged to prepaid or accrued taxes.)Enter the amounts in both columns (d) and (e). The balancing of this page is not affected by the inclusion of these taxes.3. Include in column (d) taxes charged during the year, taxes charged to operations and other accounts through (a) accruals credited to taxes accrued,(b)amounts credited to proportions of prepaid taxes chargeable to current year, and (c) taxes paid and charged direct to operations or accounts otherthan accrued and prepaid tax accounts.4. List the aggregate of each kind of tax in such manner that the total tax for each State and subdivision can readily be ascertained.
OKLAHOMA: 1
-13 -16,451 26,024Income 2
-18 18Income Tax Adjustment 3
13,794 13,794Franchise 4
25,007 4,314 20,694Use 5
-10,410 10,4102013 Property Tax 6
443,037 500,0002014 Property Tax 7
481,838 -31 491,265 26,024 31,104 Subtotal 8
9
KANSAS: 10
-33 -40,887 33,581Income 11
-36 36Income Tax Adjustment 12
Franchise 13
-32 32Use 14
-53,633 53,6332013 Property Tax 15
405,124 500,0002014 Property Tax 16
405,124 -69 405,484 33,581 53,665 Subtotal 17
18
LOCAL: 19
Texas County Use Tax 20
Texas City Use Tax 21
Subtotal 22
23
OTHER: 24
-66 29,676 3,094Misc. Use Tax 25
Workers Comp Tax 26
9,255,172 792,588 9,270,747 601,438City Franchise Fees 27
9,255,172 792,522 9,300,423 604,532 Subtotal 28
29
30
31
32
33
34
35
36
37
38
39
40
63,071
FERC FORM NO. 1 (ED. 12-96) Page 262.1
TOTAL41 17,254,517 24,680,204 4,191,082 22,765,494 139
Schedule Q-5 Page 139 of 300
Sponsor: Robinson Case No. 15-00139-UT

Name of Respondent This Report Is:(1) An Original(2) A Resubmission
Date of Report(Mo, Da, Yr)
Year/Period of Report
End of
TAXES ACCRUED, PREPAID AND CHARGED DURING YEAR (Continued)
Southwestern Public Service CompanyX
04/13/20152014/Q4
Line No.(Taxes accrued
BALANCE AT END OF YEARPrepaid Taxes Electric
(Account 408.1, 409.1)Extraordinary Items
(Account 409.3)Adjustments to Ret. OtherEarnings (Account 439)
(g) (h) (i) (j) (k) (l)Account 236) (Incl. in Account 165)
DISTRIBUTION OF TAXES CHARGED
5. If any tax (exclude Federal and State income taxes)- covers more then one year, show the required information separately for each tax year,identifying the year in column (a).6. Enter all adjustments of the accrued and prepaid tax accounts in column (f) and explain each adjustment in a foot- note. Designate debit adjustmentsby parentheses.7. Do not include on this page entries with respect to deferred income taxes or taxes collected through payroll deductions or otherwise pendingtransmittal of such taxes to the taxing authority.8. Report in columns (i) through (l) how the taxes were distributed. Report in column (I) only the amounts charged to Accounts 408.1 and 409.1pertaining to electric operations. Report in column (l) the amounts charged to Accounts 408.1 and 109.1 pertaining to other utility departments andamounts charged to Accounts 408.2 and 409.2. Also shown in column (l) the taxes charged to utility plant or other balance sheet accounts.9. For any tax apportioned to more than one utility department or account, state in a footnote the basis (necessity) of apportioning such tax.
1
546,659 -57,748,572 6,960,068 2
31,142 55,143 3
4
-5,869 64,621 1,270 5
6
333,032 7,850,716 498,395 7
904,964 -49,778,092 6,960,068 499,665 8
9
10
11
-57,550 140,522 1,954 12
-57,550 140,522 1,954 13
14
15
2,546,824 3,158,758 16
236,750 17
18
8,809,470 720,866 19
-77,643 20
12,000 24,788,000 16,473,693 21
6,362,840 22
8,821,470 33,856,771 20,353,317 23
24
25
26,577 -3,628 108,486 26
1,250 728 27
50 28
8,744,871 1,845,495 29
-588 30
4,400,000 2,358,784 31
8,772,698 4,396,562 108,486 4,204,279 32
33
34
35
36
37
38
39
40
FERC FORM NO. 1 (ED. 12-96) Page 263
41 7,185,543 -1,085,731 18,340,246 26,653,357
140
Schedule Q-5 Page 140 of 300
Sponsor: Robinson Case No. 15-00139-UT

Name of Respondent This Report Is:(1) An Original(2) A Resubmission
Date of Report(Mo, Da, Yr)
Year/Period of Report
End of
TAXES ACCRUED, PREPAID AND CHARGED DURING YEAR (Continued)
Southwestern Public Service CompanyX
04/13/20152014/Q4
Line No.(Taxes accrued
BALANCE AT END OF YEARPrepaid Taxes Electric
(Account 408.1, 409.1)Extraordinary Items
(Account 409.3)Adjustments to Ret. OtherEarnings (Account 439)
(g) (h) (i) (j) (k) (l)Account 236) (Incl. in Account 165)
DISTRIBUTION OF TAXES CHARGED
5. If any tax (exclude Federal and State income taxes)- covers more then one year, show the required information separately for each tax year,identifying the year in column (a).6. Enter all adjustments of the accrued and prepaid tax accounts in column (f) and explain each adjustment in a foot- note. Designate debit adjustmentsby parentheses.7. Do not include on this page entries with respect to deferred income taxes or taxes collected through payroll deductions or otherwise pendingtransmittal of such taxes to the taxing authority.8. Report in columns (i) through (l) how the taxes were distributed. Report in column (I) only the amounts charged to Accounts 408.1 and 409.1pertaining to electric operations. Report in column (l) the amounts charged to Accounts 408.1 and 109.1 pertaining to other utility departments andamounts charged to Accounts 408.2 and 409.2. Also shown in column (l) the taxes charged to utility plant or other balance sheet accounts.9. For any tax apportioned to more than one utility department or account, state in a footnote the basis (necessity) of apportioning such tax.
1
199 -16,650 42,488 2
11 7 3
13,794 4
4,314 5
-10,410 6
500,000 56,963 7
4,524 486,741 42,488 56,963 8
9
10
290 -41,177 74,501 11
23 13 12
13
-32 14
-53,633 15
499,999 94,875 16
281 405,202 74,501 94,875 17
18
19
20
21
22
23
24
-25,411 55,087 32,705 25
26
-80,730 9,351,476 1,409,599 27
-106,141 9,406,563 1,442,304 28
29
30
31
32
33
34
35
36
37
38
39
40
FERC FORM NO. 1 (ED. 12-96) Page 263.1
41 7,185,543 -1,085,731 18,340,246 26,653,357
141
Schedule Q-5 Page 141 of 300
Sponsor: Robinson Case No. 15-00139-UT

Schedule Page: 262 Line No.: 2 Column: f
Federal benefit for net operating loss carryback accrued as otheraccounts receivable (143)
$2,445,444
Federal income tax expense (409.1 and 409.2) accrued for long termincome tax receivable (186)
(362,403)
$2,083,041
Schedule Page: 262 Line No.: 2 Column: l
Federal non-operating income tax - non-utility (409.2) $546,659 $546,659
Schedule Page: 262 Line No.: 3 Column: f
Federal income tax expense (409.1 and 409.2) accrued liability foruncertain tax positions (242)
$95,847
Federal income tax expense (409.1 and 409.2) accrued liability foruncertain tax positions (253)
(182,132)
($86,285)
Schedule Page: 262 Line No.: 3 Column: l
Federal non-operating income tax - non-utility (409.2) $31,142 $31,142
Schedule Page: 262 Line No.: 5 Column: l
Federal Unemployment, FICA and State Unemployment charged tocapital, clearing and deferred accounts (107, 184, 186)
($5,952)
Federal Unemployment, FICA and Statement Unemployment charged fromother companies (408.2)
83
($5,869)
Schedule Page: 262 Line No.: 7 Column: l
Payroll Taxes Non-utility (408.2) $9,576FICA taxes charged to capital, clearing and deferred accounts(107,184, 186)
323,456
$333,032
Schedule Page: 262 Line No.: 12 Column: l
Federal Unemployment , FICA and State Unemployment charged tocapital, clearing and deferred accounts (107, 184, 186)
($57,756)
Federal Unemployment , FICA and State Unemployment charged fromother companies (408.2)
205
($57,551)
Schedule Page: 262 Line No.: 16 Column: f
State income tax expense (409.1 and 409.2) accrued for short termincome tax receivable (143)
$1,642,184
Rounding (1)
Name of Respondent
Southwestern Public Service Company
This Report is:(1) X An Original(2) A Resubmission
Date of Report(Mo, Da, Yr)
04/13/2015
Year/Period of Report
2014/Q4
FOOTNOTE DATA
FERC FORM NO. 1 (ED. 12-87) Page 450.1
142
Schedule Q-5 Page 142 of 300
Sponsor: Robinson Case No. 15-00139-UT

$1,642,183
Schedule Page: 262 Line No.: 17 Column: f
State income tax expense (409.1 and 409.2) accrued liability foruncertain tax positions (242)
($79,128)
State income tax expense (409.1 and 409.2) accrued liability foruncertain tax positions (253)
(157,622)
($236,750)
Schedule Page: 262 Line No.: 19 Column: l
Texas Use Tax follows accounts of original charges $8,809,470 $8,809,470
Schedule Page: 262 Line No.: 21 Column: lNon-Utility Property Tax (408.2) ($12,000)
($12,000)
Schedule Page: 262 Line No.: 26 Column: f
State income tax expense (409.1 and 409.2) accrued for long termincome tax payable (253)
($1,552)
Rounding 1 ($1,551)
Schedule Page: 262 Line No.: 26 Column: l
State non-operating income tax - non-utility (409.2) $26,577$26,577
Schedule Page: 262 Line No.: 27 Column: f
State income tax expense (409.1 and 409.2) accrued liability foruncertain tax positions (253)
($1,978)
($1,978)
Schedule Page: 262 Line No.: 27 Column: l
State non-operating income tax - non-utility (409.2) $1,250 $1,250
Schedule Page: 262 Line No.: 29 Column: l
New Mexico Use Tax follows accounts of original charges $8,744,871 $8,744,871
Schedule Page: 262.1 Line No.: 2 Column: f
State income tax expense (409.1 and 409.2) accrued for long termincome tax payable (253)
($13)
($13)
Schedule Page: 262.1 Line No.: 2 Column: l
Name of Respondent
Southwestern Public Service Company
This Report is:(1) X An Original(2) A Resubmission
Date of Report(Mo, Da, Yr)
04/13/2015
Year/Period of Report
2014/Q4
FOOTNOTE DATA
FERC FORM NO. 1 (ED. 12-87) Page 450.2
143
Schedule Q-5 Page 143 of 300
Sponsor: Robinson Case No. 15-00139-UT

State non-operating income tax - non-utility (409.2) $199 $199
Schedule Page: 262.1 Line No.: 3 Column: f
State income tax expense (409.1 and 409.2) accrued liability foruncertain tax positions (253)
($18)
($18)
Schedule Page: 262.1 Line No.: 3 Column: l
State non-operating income tax - non-utility (409.2) $11 $11
Schedule Page: 262.1 Line No.: 5 Column: l
Oklahoma Use Tax follows accounts of original charges $4,314 $4,314
Schedule Page: 262.1 Line No.: 11 Column: f
State income tax expense (409.1 and 409.2) accrued for long termincome tax payable (253)
($32)
Rounding (1)($33)
Schedule Page: 262.1 Line No.: 11 Column: l
State non-operating income tax - non-utility (409.2) $290 $290
Schedule Page: 262.1 Line No.: 12 Column: f
State income tax expense (409.1 and 409.2) accrued liability forunceretain tax positions (253)
($36)
($36)
Schedule Page: 262.1 Line No.: 12 Column: l
State non-operating income tax - non-utility (409.2) $23 $23
Schedule Page: 262.1 Line No.: 14 Column: l
Kansas Use Tax follows accounts of original charges ($32)($32)
Schedule Page: 262.1 Line No.: 25 Column: l
Miscellaneous Use Tax ($25,411) ($25,411)
Schedule Page: 262.1 Line No.: 27 Column: f
City Franchise Fee adjustments $792,588
Name of Respondent
Southwestern Public Service Company
This Report is:(1) X An Original(2) A Resubmission
Date of Report(Mo, Da, Yr)
04/13/2015
Year/Period of Report
2014/Q4
FOOTNOTE DATA
FERC FORM NO. 1 (ED. 12-87) Page 450.3
144
Schedule Q-5 Page 144 of 300
Sponsor: Robinson Case No. 15-00139-UT
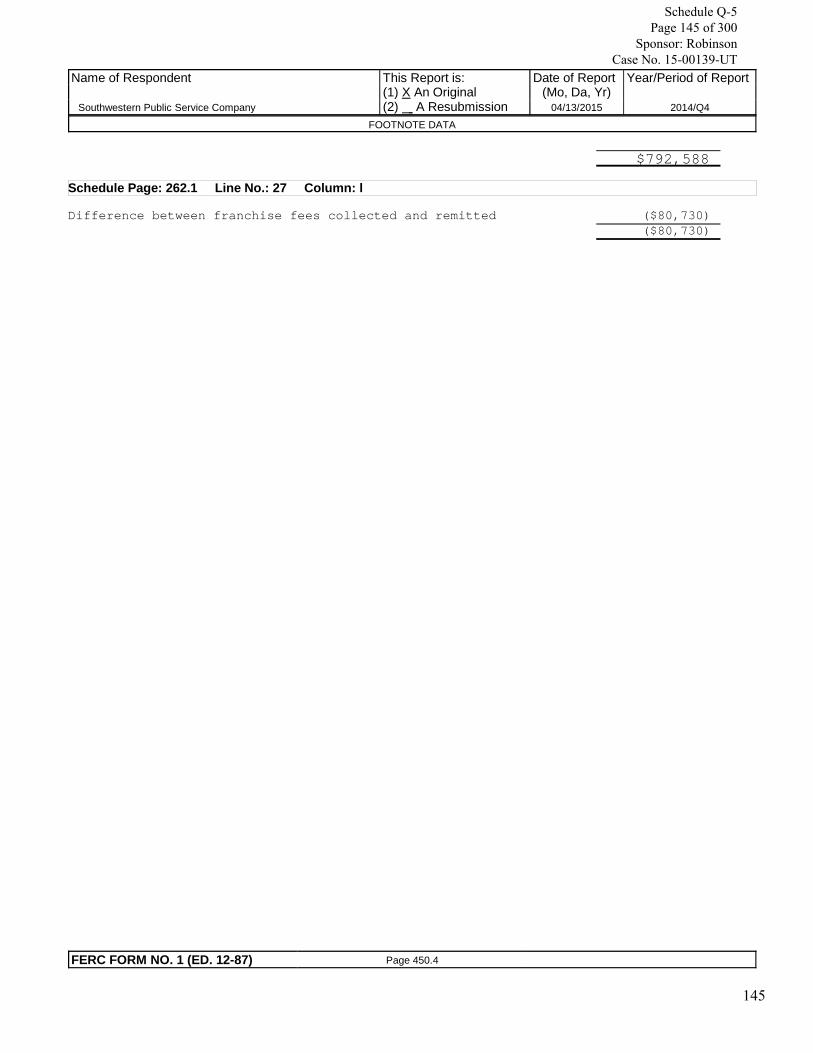
$792,588
Schedule Page: 262.1 Line No.: 27 Column: l
Difference between franchise fees collected and remitted ($80,730) ($80,730)
Name of Respondent
Southwestern Public Service Company
This Report is:(1) X An Original(2) A Resubmission
Date of Report(Mo, Da, Yr)
04/13/2015
Year/Period of Report
2014/Q4
FOOTNOTE DATA
FERC FORM NO. 1 (ED. 12-87) Page 450.4
145
Schedule Q-5 Page 145 of 300
Sponsor: Robinson Case No. 15-00139-UT
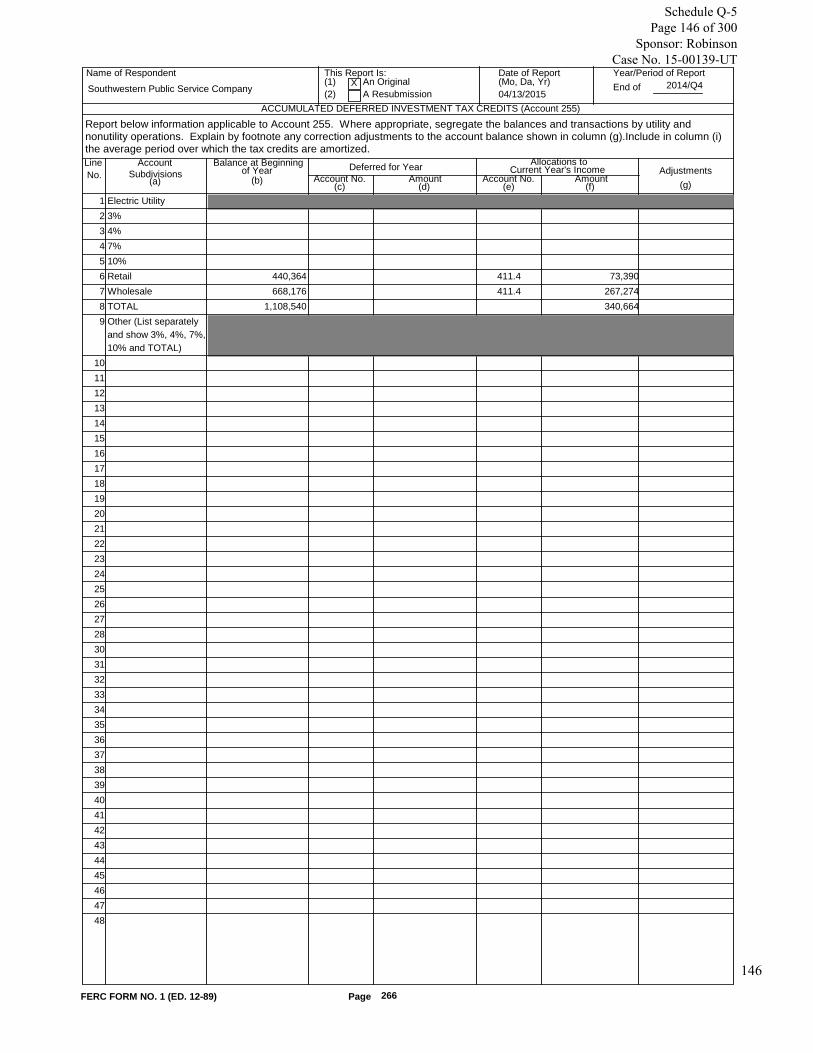
Name of Respondent This Report Is:(1) An Original(2) A Resubmission
Date of Report(Mo, Da, Yr)
Year/Period of Report
End of
ACCUMULATED DEFERRED INVESTMENT TAX CREDITS (Account 255)
Southwestern Public Service CompanyX
04/13/20152014/Q4
Line No.
Account Balance at Beginning
(c)(b)(a)
of YearSubdivisions AdjustmentsDeferred for Year Allocations toCurrent Year's Income
Account No. Amount Account No. Amount(d) (e) (f) (g)
Report below information applicable to Account 255. Where appropriate, segregate the balances and transactions by utility andnonutility operations. Explain by footnote any correction adjustments to the account balance shown in column (g).Include in column (i)the average period over which the tax credits are amortized.
Electric Utility 1
3% 2
4% 3
7% 4
10% 5
Retail 440,364 411.4 73,390 6
Wholesale 668,176 411.4 267,274 7
TOTAL 1,108,540 340,664 8
Other (List separatelyand show 3%, 4%, 7%,10% and TOTAL)
9
10
11
12
13
14
15
16
17
18
19
20
21
22
23
24
25
26
27
28
30
31
32
33
34
35
36
37
38
39
40
41
42
43
44
45
46
47
48
FERC FORM NO. 1 (ED. 12-89) Page 266
146
Schedule Q-5 Page 146 of 300
Sponsor: Robinson Case No. 15-00139-UT

Balance at End
(i)(h)
of Year
Name of Respondent This Report Is:(1) An Original(2) A Resubmission
Date of Report(Mo, Da, Yr)
Year/Period of Report
End of
ACCUMULATED DEFERRED INVESTMENT TAX CREDITS (Account 255) (continued)
Southwestern Public Service CompanyX
04/13/20152014/Q4
Line No.
ADJUSTMENT EXPLANATIONAverage Periodof Allocation
to Income
1
2
3
4
5
366,974 40 Years 6
400,902 36 Years 7
767,876 8
9
10
11
12
13
14
15
16
17
18
19
20
21
22
23
24
25
26
27
28
30
31
32
33
34
35
36
37
38
39
40
41
42
43
44
45
46
47
48
FERC FORM NO. 1 (ED. 12-89) Page 267
147
Schedule Q-5 Page 147 of 300
Sponsor: Robinson Case No. 15-00139-UT

Name of Respondent This Report Is:(1) An Original(2) A Resubmission
Date of Report(Mo, Da, Yr)
Year/Period of Report
End of
OTHER DEFFERED CREDITS (Account 253)
Southwestern Public Service CompanyX
04/13/20152014/Q4
Line No.
Description and Other DEBITS Credits
Account(c)(b)(a)
Balance atEnd of Year
(d)
Deferred Credits Amount
(e)
Balance at Beginning of Year Contra
(f)
1. Report below the particulars (details) called for concerning other deferred credits.
2. For any deferred credit being amortized, show the period of amortization.
3. Minor items (5% of the Balance End of Year for Account 253 or amounts less than $100,000, whichever is greater) may be grouped by classes.
1,051,974Deferred Comp Liabilities 1,226,637 222,013 47,350146 1
2
18,472Remediation Costs 92,001 113,529 40,000242 3
4
27,280Executive PSP Long Term 100,796 111,401 37,885920 5
6
216,913Long-term Income Tax and 618,531 485,971 84,353409 7
Interest Payable 8
9
269,483Deferred Revenue - ITC Grant 256,949 12,534417.1 10
11
364,689SPS LT Deferred Credit 263,456 628,145Various 12
13
2,067,496Miscellaneous Deferred Credit 4,158,647 2,509,151 418,000142 14
15
1,003,414Contribution for Construction , 914,650 1,918,064232 16
Pending 17
18
Resource Planning Bid Fees 30,000 30,000 19
20
Deferred Revenue for Tax LiabilitC 1,714,393 1,758,353 43,960405 21
22
Facility Attachment Deferred 42,791 1,245,537 1,202,746454 23
Revenue 24
25
26
27
28
29
30
31
32
33
34
35
36
37
38
39
40
41
42
43
44
45
46
FERC FORM NO. 1 (ED. 12-94) Page 269
47 TOTAL 7,654,061 4,433,037 8,240,745 5,019,721
148
Schedule Q-5 Page 148 of 300
Sponsor: Robinson Case No. 15-00139-UT

Schedule Page: 269 Line No.: 12 Column: c
Account charged:456.4 $167,505 254 460,640
$628,145
Name of Respondent
Southwestern Public Service Company
This Report is:(1) X An Original(2) A Resubmission
Date of Report(Mo, Da, Yr)
04/13/2015
Year/Period of Report
2014/Q4
FOOTNOTE DATA
FERC FORM NO. 1 (ED. 12-87) Page 450.1
149
Schedule Q-5 Page 149 of 300
Sponsor: Robinson Case No. 15-00139-UT

Name of Respondent This Report Is:(1) An Original(2) A Resubmission
Date of Report(Mo, Da, Yr)
Year/Period of Report
End of
ACCUMULATED DEFERRED INCOME TAXES - ACCELERATED AMORTIZATION PROPERTY (Account 281)
Southwestern Public Service CompanyX
04/13/20152014/Q4
Line No.
Account
(a) (b) (c) (d)
Balance atBeginning of Year
CHANGES DURING YEAR
Amounts Debited Amounts Credited to Account 410.1 to Account 411.1
1. Report the information called for below concerning the respondent’s accounting for deferred income taxes rating to amortizableproperty.2. For other (Specify),include deferrals relating to other income and deductions.
1 Accelerated Amortization (Account 281)
2 Electric
3 Defense Facilities
687,010 975,989 4 Pollution Control Facilities
5 Other (provide details in footnote):
6
7
687,010 975,989 8 TOTAL Electric (Enter Total of lines 3 thru 7)
9 Gas
10 Defense Facilities
11 Pollution Control Facilities
12 Other (provide details in footnote):
13
14
15 TOTAL Gas (Enter Total of lines 10 thru 14)
16
687,010 975,989 17 TOTAL (Acct 281) (Total of 8, 15 and 16)
18 Classification of TOTAL
658,537 934,707 19 Federal Income Tax
28,473 41,282 20 State Income Tax
21 Local Income Tax
FERC FORM NO. 1 (ED. 12-96) Page 272
NOTES
150
Schedule Q-5 Page 150 of 300
Sponsor: Robinson Case No. 15-00139-UT

Name of Respondent This Report Is:(1) An Original(2) A Resubmission
Date of Report(Mo, Da, Yr)
Year/Period of Report
End of
ACCUMULATED DEFERRED INCOME TAXES _ ACCELERATED AMORTIZATION PROPERTY (Account 281) (Continued)
Southwestern Public Service CompanyX
04/13/20152014/Q4
Line No.
CHANGES DURING YEAR ADJUSTMENTSBalance at
End of YearDebits CreditsAmounts Debited
to Account 410.2Amounts Credited to Account 411.2 Account
CreditedAmount
DebitedAccount Amount
(e) (f) (h) (j) (k)(g) (i)
3. Use footnotes as required.
1
2
3
1,662,999 4
5
6
7
1,662,999 8
9
10
11
12
13
14
15
16
1,662,999 17
18
1,593,244 19
69,755 20
21
FERC FORM NO. 1 (ED. 12-96) Page 273
NOTES (Continued)
151
Schedule Q-5 Page 151 of 300
Sponsor: Robinson Case No. 15-00139-UT

Schedule Page: 272 Line No.: 8 Column: b12/31/2013 410.1 12/31/2014
Electric Production Plant $975,989 $687,010 $1,662,999 TOTAL Electric Plant $975,989 $687,010 $1,662,999
Name of Respondent
Southwestern Public Service Company
This Report is:(1) X An Original(2) A Resubmission
Date of Report(Mo, Da, Yr)
04/13/2015
Year/Period of Report
2014/Q4
FOOTNOTE DATA
FERC FORM NO. 1 (ED. 12-87) Page 450.1
152
Schedule Q-5 Page 152 of 300
Sponsor: Robinson Case No. 15-00139-UT

Name of Respondent This Report Is:(1) An Original(2) A Resubmission
Date of Report(Mo, Da, Yr)
Year/Period of Report
End of
ACCUMULATED DEFFERED INCOME TAXES - OTHER PROPERTY (Account 282)
Southwestern Public Service CompanyX
04/13/20152014/Q4
Line No.
Account
(a) (b) (c) (d)
Balance atBeginning of Year
CHANGES DURING YEAR
Amounts Debited Amounts Credited to Account 410.1 to Account 411.1
1. Report the information called for below concerning the respondent’s accounting for deferred income taxes rating to property notsubject to accelerated amortization2. For other (Specify),include deferrals relating to other income and deductions.
Account 282 1
Electric 747,694,593 135,319,091 2
Gas 3
4
TOTAL (Enter Total of lines 2 thru 4) 747,694,593 135,319,091 5
Regulatory Difference - Prior -1,472,872 6
Regulatory Difference - AFUDC 31,361,527 7
8
TOTAL Account 282 (Enter Total of lines 5 thru 777,583,248 135,319,091 9
Classification of TOTAL 10
Federal Income Tax 745,391,329 124,885,380 11
State Income Tax 32,191,919 10,433,711 12
Local Income Tax 13
FERC FORM NO. 1 (ED. 12-96) Page 274
NOTES
153
Schedule Q-5 Page 153 of 300
Sponsor: Robinson Case No. 15-00139-UT

Name of Respondent This Report Is:(1) An Original(2) A Resubmission
Date of Report(Mo, Da, Yr)
Year/Period of Report
End of
ACCUMULATED DEFERRED INCOME TAXES - OTHER PROPERTY (Account 282) (Continued)
Southwestern Public Service CompanyX
04/13/20152014/Q4
Line No.
CHANGES DURING YEAR ADJUSTMENTSBalance at
End of YearDebits CreditsAmounts Debited
to Account 410.2Amounts Credited to Account 411.2 Account
CreditedAmount
DebitedAccount Amount
(e) (f) (h) (j) (k)(g) (i)
3. Use footnotes as required.
1
883,013,683282 -1 2
3
4
883,013,683 -1 5
254 -1,432,929 1,719,833254 1,759,776 6
182.3 36,878,362 55,080182.3 5,571,915 7
8
918,459,116 1,774,913 7,331,690 9
10
875,247,570 310,393 5,281,254 11
43,211,546 1,464,520 2,050,436 12
13
FERC FORM NO. 1 (ED. 12-96) Page 275
NOTES (Continued)
154
Schedule Q-5 Page 154 of 300
Sponsor: Robinson Case No. 15-00139-UT

Schedule Page: 274 Line No.: 6 Column: aPrior Flow ThroughSchedule Page: 274 Line No.: 7 Column: aAFUDC Equity Schedule Page: 274 Line No.: 9 Column: k
12/31/2013410.1 &
Adjustments 12/31/2014Electric Distribution Plant $186,062,584 $ 16,185,228 $202,247,812 Electric General Plant 44,390,605 4,017,698 48,408,303 Electric Intangible Plant 326,164 238,257 564,421 Electric Production Plant 236,163,590 9,881,522 246,045,112 Electric Transmission Plant 275,836,853 105,006,853 380,843,706 Electric Transmission-Production Plant 4,911,707 (12,104) 4,899,603 Non-Utility 3,090 1,636 4,726 Regulatory Difference - Prior Flow Thru (1,472,872) 39,943 (1,432,929)Regulatory Difference - AFUDC Equity 31,361,527 5,516,835 36,878,362 TOTAL Electric Plant $777,583,248 $140,875,868 $918,459,116
12/31/2014Total Electric Plant - Account 282 $918,459,116 Less: Non-Utility (4,726)Unblended ADIT Adjustment Total Company (77,434,010)Total Electric Plant - Account 282 - Wholesale Jurisdiction $841,020,380
Name of Respondent
Southwestern Public Service Company
This Report is:(1) X An Original(2) A Resubmission
Date of Report(Mo, Da, Yr)
04/13/2015
Year/Period of Report
2014/Q4
FOOTNOTE DATA
FERC FORM NO. 1 (ED. 12-87) Page 450.1
155
Schedule Q-5 Page 155 of 300
Sponsor: Robinson Case No. 15-00139-UT

Name of Respondent This Report Is:(1) An Original(2) A Resubmission
Date of Report(Mo, Da, Yr)
Year/Period of Report
End of
ACCUMULATED DEFFERED INCOME TAXES - OTHER (Account 283)
Southwestern Public Service CompanyX
04/13/20152014/Q4
Line No.
Account
(a) (b) (c) (d)
Balance atBeginning of Year
CHANGES DURING YEARAmounts Debited Amounts Credited to Account 410.1 to Account 411.1
1. Report the information called for below concerning the respondent’s accounting for deferred income taxes relating to amountsrecorded in Account 283.2. For other (Specify),include deferrals relating to other income and deductions.
Account 283 1
Electric 2
20,385,971 20,703,594 77,396,786Electric Non-Plant 3
3,039,966 5,122,324Electric Plant 4
5
6
7
8
20,385,971 23,743,560 82,519,110TOTAL Electric (Total of lines 3 thru 8) 9
Gas 10
11
12
13
14
15
16
TOTAL Gas (Total of lines 11 thru 16) 17
18
20,385,971 23,743,560 82,519,110TOTAL (Acct 283) (Enter Total of lines 9, 17 and 18) 19
Classification of TOTAL 20
19,554,442 22,740,781 79,154,675Federal Income Tax 21
831,529 1,002,779 3,364,435State Income Tax 22
Local Income Tax 23
FERC FORM NO. 1 (ED. 12-96) Page 276
NOTES
156
Schedule Q-5 Page 156 of 300
Sponsor: Robinson Case No. 15-00139-UT

Name of Respondent This Report Is:(1) An Original(2) A Resubmission
Date of Report(Mo, Da, Yr)
Year/Period of Report
End of
ACCUMULATED DEFERRED INCOME TAXES - OTHER (Account 283) (Continued)
Southwestern Public Service CompanyX
04/13/20152014/Q4
Line No.
CHANGES DURING YEAR ADJUSTMENTSBalance at
End of YearDebits CreditsAmounts Debited
to Account 410.2Amounts Credited to Account 411.2 Account
CreditedAmount
DebitedAccount Amount
(e) (f) (h) (j) (k)(g) (i)
3. Provide in the space below explanations for Page 276 and 277. Include amounts relating to insignificant items listed under Other.4. Use footnotes as required.
1
2
77,714,409 3
8,162,290 4
5
6
7
8
85,876,699 9
10
11
12
13
14
15
16
17
18
85,876,699 19
20
82,341,014 21
3,535,685 22
23
FERC FORM NO. 1 (ED. 12-96) Page 277
NOTES (Continued)
157
Schedule Q-5 Page 157 of 300
Sponsor: Robinson Case No. 15-00139-UT

Schedule Page: 276 Line No.: 4 Column: b12/31/2013 410.1 12/31/2014
Electric General Plant $ 12,599 $ (6,392) $ 6,207 Electric Intangible Plant 5,109,725 3,046,358 8,156,083 TOTAL Electric Plant $ 5,122,324 $ 3,039,966 $ 8,162,290
Name of Respondent
Southwestern Public Service Company
This Report is:(1) X An Original(2) A Resubmission
Date of Report(Mo, Da, Yr)
04/13/2015
Year/Period of Report
2014/Q4
FOOTNOTE DATA
FERC FORM NO. 1 (ED. 12-87) Page 450.1
158
Schedule Q-5 Page 158 of 300
Sponsor: Robinson Case No. 15-00139-UT

Name of Respondent This Report Is:(1) An Original(2) A Resubmission
Date of Report(Mo, Da, Yr)
Year/Period of Report
End of
OTHER REGULATORY LIABILITIES (Account 254)
Southwestern Public Service CompanyX
04/13/20152014/Q4
Line No.
Description and Purpose of DEBITS
CreditsAccount
(d)(c)(a)
Balance at Endof Current
Quarter/Year
(e)
Other Regulatory Liabilities Amount
(f)Credited
1. Report below the particulars (details) called for concerning other regulatory liabilities, including rate order docket number, if applicable.2. Minor items (5% of the Balance in Account 254 at end of period, or amounts less than $100,000 which ever is less), may be groupedby classes.3. For Regulatory Liabilities being amortized, show period of amortization.
Balance at Beginingof Current
Quarter/Year
(b)
622,340 191,029 431,311Deferred Investment Tax Credit 190 1
2
11,158,663 4,309,738 6,848,925Power Purchased Contract Valuation Adjustments Various 3
- Amortized over life of the contracts 4
5
26,813,525 442,800,196 28,519,814 444,506,485Texas Fuel Costs Recovered via FCR Various 6
7
28,581,219 160,577,053 25,451,424 157,447,258New Mexico Fuel Costs - NMPRC 557 8
Rule 550 - Recovered via FPPCAC 9
10
1,465,363 3,218,999 1,424,532 3,178,168DSM Texas Energy Efficiency 182.3 11
Docket #35440 12
13
630,675 630,675New Mexico Regulatory REC Tracker 182.3 14
2012 Vintage 15
Docket #10-00395-UT 16
17
7,713,721 2,361,486 26,710,314 21,358,079Attachment "O" Transmission Refund Various 18
19
9,176,532 722,003 18,108,362 9,653,833Retiree Medical Liability 228.3 20
21
5,525,800 2,718,756 2,807,044Sale of Lubbock Distribution Assets: 421.1 22
Refund Obligation 23
- Amortized over 3 years 24
Docket #42004 25
26
2,692,204 53,948 2,638,256Sale of Lubbock Distribution Assets: 407.4 27
Incremental Capital Expenditures and Other 28
Docket #37901 29
- Amortized over the life of the asset 30
31
125,629 335,011 460,640TUCO Refund 456 32
Docket #42004 33
- 15 month amortization ending July 2015 34
35
784,120 2,157,200 1,373,080Prior Flow Thru and Excess ADIT 36
37
5,318 5,389 71SO2 Reserve 38
Docket #08-00354-UT 39
40
FERC FORM NO. 1/3-Q (REV 02-04) Page 278
41 TOTAL 646,000,339 623,452,946 134,804,684 112,257,291
159
Schedule Q-5 Page 159 of 300
Sponsor: Robinson Case No. 15-00139-UT
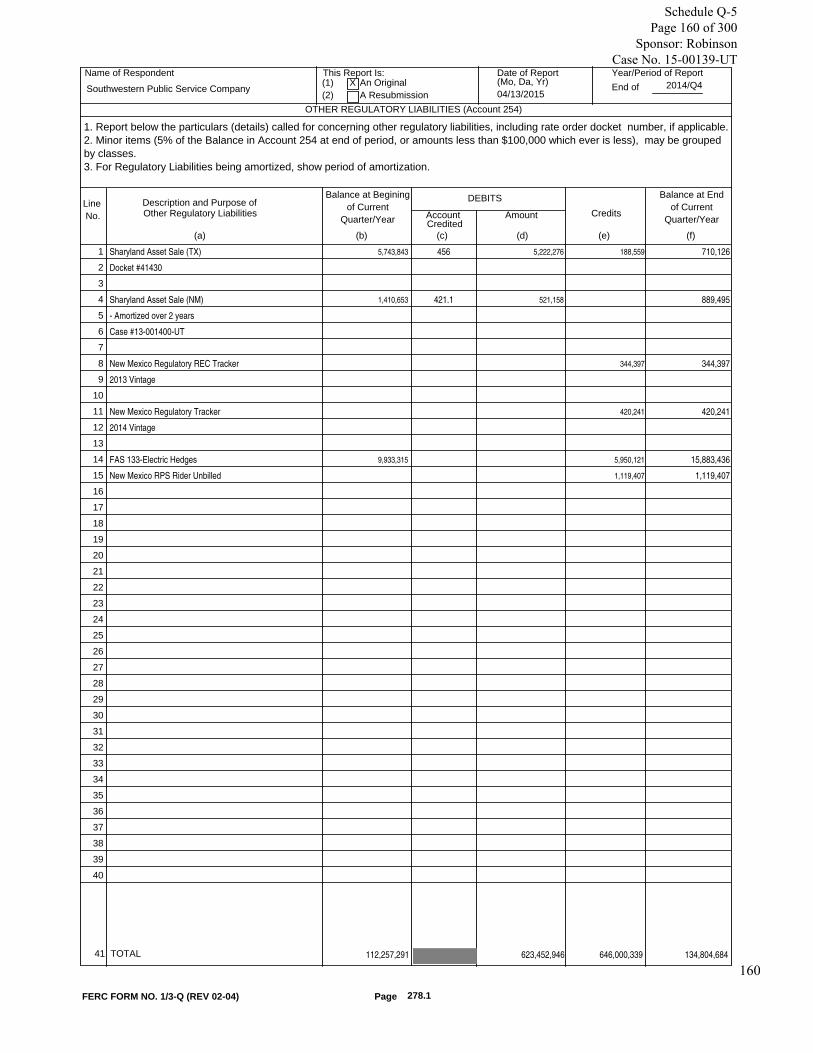
Name of Respondent This Report Is:(1) An Original(2) A Resubmission
Date of Report(Mo, Da, Yr)
Year/Period of Report
End of
OTHER REGULATORY LIABILITIES (Account 254)
Southwestern Public Service CompanyX
04/13/20152014/Q4
Line No.
Description and Purpose of DEBITS
CreditsAccount
(d)(c)(a)
Balance at Endof Current
Quarter/Year
(e)
Other Regulatory Liabilities Amount
(f)Credited
1. Report below the particulars (details) called for concerning other regulatory liabilities, including rate order docket number, if applicable.2. Minor items (5% of the Balance in Account 254 at end of period, or amounts less than $100,000 which ever is less), may be groupedby classes.3. For Regulatory Liabilities being amortized, show period of amortization.
Balance at Beginingof Current
Quarter/Year
(b)
5,743,843 5,222,276 710,126 188,559Sharyland Asset Sale (TX) 456 1
Docket #41430 2
3
1,410,653 521,158 889,495Sharyland Asset Sale (NM) 421.1 4
- Amortized over 2 years 5
Case #13-001400-UT 6
7
344,397 344,397New Mexico Regulatory REC Tracker 8
2013 Vintage 9
10
420,241 420,241New Mexico Regulatory Tracker 11
2014 Vintage 12
13
9,933,315 15,883,436 5,950,121FAS 133-Electric Hedges 14
1,119,407 1,119,407New Mexico RPS Rider Unbilled 15
16
17
18
19
20
21
22
23
24
25
26
27
28
29
30
31
32
33
34
35
36
37
38
39
40
FERC FORM NO. 1/3-Q (REV 02-04) Page 278.1
41 TOTAL 646,000,339 623,452,946 134,804,684 112,257,291
160
Schedule Q-5 Page 160 of 300
Sponsor: Robinson Case No. 15-00139-UT

Schedule Page: 278 Line No.: 3 Column: c
Account charged:175 ($3,582,654)244.1 7,892,392
$4,309,738
Schedule Page: 278 Line No.: 6 Column: c
Account charged:557 $442,800,400 411.8 (204)
$442,800,196
Schedule Page: 278 Line No.: 18 Column: c
Account charged:456 $1,315,872 182.3 1,045,613
$2,361,486
Name of Respondent
Southwestern Public Service Company
This Report is:(1) X An Original(2) A Resubmission
Date of Report(Mo, Da, Yr)
04/13/2015
Year/Period of Report
2014/Q4
FOOTNOTE DATA
FERC FORM NO. 1 (ED. 12-87) Page 450.1
161
Schedule Q-5 Page 161 of 300
Sponsor: Robinson Case No. 15-00139-UT

Name of Respondent This Report Is:(1) An Original(2) A Resubmission
Date of Report(Mo, Da, Yr)
Year/Period of Report
End of
ELECTRIC OPERATING REVENUES (Account 400)
Southwestern Public Service CompanyX
04/13/20152014/Q4
Line No.
Title of Account
(c)(b)(a)
Operating Revenues Yearto Date Quarterly/Annual
1. The following instructions generally apply to the annual version of these pages. Do not report quarterly data in columns (c), (e), (f), and (g). Unbilled revenues and MWHrelated to unbilled revenues need not be reported separately as required in the annual version of these pages.2. Report below operating revenues for each prescribed account, and manufactured gas revenues in total.3. Report number of customers, columns (f) and (g), on the basis of meters, in addition to the number of flat rate accounts; except that where separate meter readings are addedfor billing purposes, one customer should be counted for each group of meters added. The -average number of customers means the average of twelve figures at the close ofeach month.4. If increases or decreases from previous period (columns (c),(e), and (g)), are not derived from previously reported figures, explain any inconsistencies in a footnote.5. Disclose amounts of $250,000 or greater in a footnote for accounts 451, 456, and 457.2.
Operating RevenuesPrevious year (no Quarterly)
Sales of Electricity 1
330,487,417(440) Residential Sales 363,680,531 2
(442) Commercial and Industrial Sales 3
351,850,857Small (or Comm.) (See Instr. 4) 379,595,369 4
445,042,649Large (or Ind.) (See Instr. 4) 516,647,722 5
6,034,529(444) Public Street and Highway Lighting 6,470,429 6
37,024,071(445) Other Sales to Public Authorities 40,480,312 7
(446) Sales to Railroads and Railways 8
(448) Interdepartmental Sales 9
1,170,439,523TOTAL Sales to Ultimate Consumers 1,306,874,363 10
464,577,611(447) Sales for Resale 491,595,290 11
1,635,017,134TOTAL Sales of Electricity 1,798,469,653 12
40,461,171(Less) (449.1) Provision for Rate Refunds 9,003,392 13
1,594,555,963TOTAL Revenues Net of Prov. for Refunds 1,789,466,261 14
Other Operating Revenues 15
2,168,064(450) Forfeited Discounts 2,351,006 16
1,075,043(451) Miscellaneous Service Revenues 1,261,557 17
(453) Sales of Water and Water Power 18
7,414,366(454) Rent from Electric Property 7,372,059 19
(455) Interdepartmental Rents 20
10,154,954(456) Other Electric Revenues 6,084,036 21
94,703,996(456.1) Revenues from Transmission of Electricity of Others 121,949,465 22
(457.1) Regional Control Service Revenues 23
(457.2) Miscellaneous Revenues 24
25
115,516,423TOTAL Other Operating Revenues 139,018,123 26
1,710,072,386TOTAL Electric Operating Revenues 1,928,484,384 27
Page 300FERC FORM NO. 1/3-Q (REV. 12-05)
162
Schedule Q-5 Page 162 of 300
Sponsor: Robinson Case No. 15-00139-UT

Name of Respondent This Report Is:(1) An Original(2) A Resubmission
Date of Report(Mo, Da, Yr)
Year/Period of Report
End of
ELECTRIC OPERATING REVENUES (Account 400)
Southwestern Public Service CompanyX
04/13/20152014/Q4
Line No.
MEGAWATT HOURS SOLD
Previous Year (no Quarterly)Current Year (no Quarterly)
AVG.NO. CUSTOMERS PER MONTH
Year to Date Quarterly/Annual Amount Previous year (no Quarterly)
(d) (e) (f) (g)
6. Commercial and industrial Sales, Account 442, may be classified according to the basis of classification (Small or Commercial, and Large or Industrial) regularly used by therespondent if such basis of classification is not generally greater than 1000 Kw of demand. (See Account 442 of the Uniform System of Accounts. Explain basis of classificationin a footnote.)7. See pages 108-109, Important Changes During Period, for important new territory added and important rate increase or decreases.8. For Lines 2,4,5,and 6, see Page 304 for amounts relating to unbilled revenue by accounts.9. Include unmetered sales. Provide details of such Sales in a footnote.
1
3,564,148 300,439 302,220 3,548,529 2
3
4,743,178 75,311 76,159 4,741,306 4
9,892,651 209 213 10,261,927 5
47,431 117 116 47,238 6
520,373 6,147 6,175 508,571 7
8
9
18,767,781 382,223 384,883 19,107,571 10
9,525,007 30 11 9,157,820 11
28,292,788 382,253 384,894 28,265,391 12
13
28,292,788 382,253 384,894 28,265,391 14
Page 301
Line 12, column (b) includes $ of unbilled revenues.
Line 12, column (d) includes MWH relating to unbilled revenues
46,606,800
212,633
FERC FORM NO. 1/3-Q (REV. 12-05)
163
Schedule Q-5 Page 163 of 300
Sponsor: Robinson Case No. 15-00139-UT

Schedule Page: 300 Line No.: 2 Column: b
Current Year
Billed Revenue Unbilled Revenue TotalResidential 440 $353,900,849 9,779,682 $363,680,531 Small C&I 442 378,284,867 1,310,502 379,595,369 Large C&I 442 503,950,946 12,696,776 516,647,722 PSHL 444 6,431,022 39,407 6,470,429 OSPA 445 39,789,764 690,548 40,480,312 Resale 447 469,505,405 22,089,885 491,595,290
$1,751,862,853 $46,606,800 $1,798,469,653
This note applies to column b, rows 2, 4, 5, 6, 7 and 11.
Schedule Page: 300 Line No.: 2 Column: c
Previous Year
Billed Revenue Unbilled Revenue TotalResidential 440 $333,032,762 ($2,545,345) $330,487,417 Small C&I 442 347,317,968 4,532,887 351,850,857 Large C&I 442 440,077,815 4,964,834 445,042,649 PSHL 444 5,987,798 46,731 6,034,529 OSPA 445 36,623,543 400,528 37,024,071 Resale 447 453,101,386 11,476,225 464,577,611
$1,616,141,272 $18,875,862 $1,635,017,134
This note applies to column b, rows 2, 4, 5, 6, 7 and 11.
Schedule Page: 300 Line No.: 5 Column: b
Commercial and industrial sales are classified as "large" for purposes of this report ifthe customer has a minimum registered demand of 1,000 KW or more.
Schedule Page: 300 Line No.: 5 Column: c
Commercial and industrial sales are classified as "large" for purposes of this report ifthe customer has a minimum registered demand of 1,000 KW or more.
Schedule Page: 300 Line No.: 17 Column: b
Account charged:Customer Connections $717,385 Return Check Charge 167,024 Other 377,148
$1,261,557
Schedule Page: 300 Line No.: 17 Column: c
Customer Connections $852,432 Return Check Charge 156,118 Other 66,493
$1,075,043
Name of Respondent
Southwestern Public Service Company
This Report is:(1) X An Original(2) A Resubmission
Date of Report(Mo, Da, Yr)
04/13/2015
Year/Period of Report
2014/Q4
FOOTNOTE DATA
FERC FORM NO. 1 (ED. 12-87) Page 450.1
164
Schedule Q-5 Page 164 of 300
Sponsor: Robinson Case No. 15-00139-UT

Write offs of Customer Bad Debt include billings of amounts previously written off asuncollectible.
Schedule Page: 300 Line No.: 21 Column: b
Current Year
Sharyland Refund Amortization $5,221,517 Mutual Aid Revenue 225,671 Distribution Service 191,991 CIP Perform Revenue (490,801)High Voltage Direct Costs 138,168 Deferred Fuel Revenue 539,123 TUCO Refund 65,177 Miscellaneous Services 193,190
$6,084,036
Other Revenue includes the effect of sharing electric trading margins with affiliatesPublic Service Company of Colorado and Northern States Power Co. (a Minnesotacorporation).
Schedule Page: 300 Line No.: 21 Column: c
Previous Year
Shared Electric Commodity Trading Margin $2,937,625 Mutual Aid Revenue 422,872Distribution Service 327,935Distribution Interconnections (308,000)CIP Perform Revenue 139,818 Renewable Cost Rider (83,693)High Voltage Direct Costs 380,521 Deferred Fuel Revenue 6,479,237 TUCO Refund (364,732)Miscellaneous Services 223,371
$10,154,954
Other Revenue includes the effect of sharing electric trading margins with affiliatesPublic Service Company of Colorado and Northern States Power Co. (a Minnesotacorporation).
Name of Respondent
Southwestern Public Service Company
This Report is:(1) X An Original(2) A Resubmission
Date of Report(Mo, Da, Yr)
04/13/2015
Year/Period of Report
2014/Q4
FOOTNOTE DATA
FERC FORM NO. 1 (ED. 12-87) Page 450.2
165
Schedule Q-5 Page 165 of 300
Sponsor: Robinson Case No. 15-00139-UT

Name of Respondent This Report Is:(1) An Original(2) A Resubmission
Date of Report(Mo, Da, Yr)
Year/Period of Report
End ofSouthwestern Public Service CompanyX
04/13/20152014/Q4
Line No. Description of Service
(a)
REGIONAL TRANSMISSION SERVICE REVENUES (Account 457.1)
1. The respondent shall report below the revenue collected for each service (i.e., control area administration, market administration,etc.) performed pursuant to a Commission approved tariff. All amounts separately billed must be detailed below.
Balance at End of
(c)(b)
Balance at End ofQuarter 1 Quarter 2
Balance at End ofQuarter 3
(d) (e)
Balance at End ofYear
1
2
3
4
5
6
7
8
9
10
11
12
13
14
15
16
17
18
19
20
21
22
23
24
25
26
27
28
29
30
31
32
33
34
35
36
37
38
39
40
41
42
43
44
45
FERC FORM NO. 1/3-Q (NEW. 12-05) Page 302
46 TOTAL166
Schedule Q-5 Page 166 of 300
Sponsor: Robinson Case No. 15-00139-UT

Name of Respondent This Report Is:(1) An Original(2) A Resubmission
Date of Report(Mo, Da, Yr)
Year/Period of Report
End of
SALES OF ELECTRICITY BY RATE SCHEDULES
Southwestern Public Service CompanyX
04/13/20152014/Q4
Line No.
Number and Title of Rate schedule MWh Sold
(b)(a)
Revenue
(c)
Average Numberof Customers
(d)
KWh of SalesPer Customer
(e)
Revenue PerKWh Sold
(f)
1. Report below for each rate schedule in effect during the year the MWH of electricity sold, revenue, average number of customer, average Kwh percustomer, and average revenue per Kwh, excluding date for Sales for Resale which is reported on Pages 310-311.2. Provide a subheading and total for each prescribed operating revenue account in the sequence followed in "Electric Operating Revenues," Page300-301. If the sales under any rate schedule are classified in more than one revenue account, List the rate schedule and sales data under eachapplicable revenue account subheading.3. Where the same customers are served under more than one rate schedule in the same revenue account classification (such as a general residentialschedule and an off peak water heating schedule), the entries in column (d) for the special schedule should denote the duplication in number of reportedcustomers.4. The average number of customers should be the number of bills rendered during the year divided by the number of billing periods during the year (12if all billings are made monthly).5. For any rate schedule having a fuel adjustment clause state in a footnote the estimated additional revenue billed pursuant thereto.6. Report amount of unbilled revenue as of end of year for each applicable revenue account subheading.
140 45 3,111 0.1373 19,219 1 TX Residential Flood Lighting
6,561 8,927 735 0.2586 1,696,444 2 Residential Guard Lighting
5,476 6,650 823 0.1827 1,000,319 3 NM Res Area Lighting
513,319 29,793 17,230 0.0843 43,290,775 4 NM Residential Heating
591,694 57,385 10,311 0.1022 60,458,357 5 NM Residential Lighting
764,164 45,400 16,832 0.0951 72,697,616 6 TX Res Ltg Space Heat
1,643,789 154,020 10,673 0.1063 174,738,119 7 TX Residential
23,386 0.4182 9,779,682 8 Unbilled
3,548,529 302,220 11,742 0.1025 363,680,531 9 TOTAL RESIDENTIAL
10
10,654 2,830 3,765 0.1238 1,319,253 11 NM Commercial Area Lighting
11,900 1,251 9,512 0.1358 1,615,715 12 Flood Lighting
7,131 4,740 1,504 0.2617 1,865,869 13 Guard Lighting
76,052 1,012 75,150 0.0909 6,909,599 14 NM Irrigation
183,744 6 30,624,000 0.0506 9,295,843 15 NM Lrg Gen Serv Trans - 69 kV
1,341,861 20 67,093,050 0.0487 65,299,636 16 NM Lrg Gen Serv Trans - 115 kV
615,018 9 68,335,333 0.0462 28,420,117 17 TX Lrg Gen Serv Subtran - 69 kV
5,307,358 43 123,426,930 0.0459 243,364,288 18 TX Lrg Gen Serv Trans - 115 kV
1,287,173 4,475 287,636 0.0698 89,880,702 19 NM Primary General
2,175,143 4,105 529,876 0.0613 133,238,748 20 TX Primary General
308 8 38,500 0.2880 88,695 21 TX Primary Qualifying Fac
139,501 1 139,501,000 0.0530 7,399,464 22 SAS-4 Canadian River Water
39,334 1 39,334,000 0.0407 1,600,128 23 SAS-8 JM Huber
497,974 1 497,974,000 0.0459 22,832,944 24 SAS-12 WRB Refining
1,371 1 1,371,000 0.1953 267,768 25 SAS-13 Amarillo Recycling Co.
712,855 4,131 172,562 0.0828 58,989,015 26 NM Secondary General
118,857 10,022 11,860 0.0935 11,110,327 27 NM Small Secondary General
270,385 30,906 8,749 0.0956 25,862,267 28 TX Small General Service
2,167,203 12,802 169,286 0.0795 172,277,681 29 TX Secondary General
2,030 7 290,000 0.1873 380,207 30 TX Trans QF Standby - 115kV
387 1 387,000 0.5621 217,547 31 TX Trans QF Standby - 69kV
36,994 0.3786 14,007,278 32 Unbilled
15,003,233 76,372 196,449 0.0597 896,243,091 33 TOTAL COMMERCIAL &
34
35
36
37
38
39
40
19,107,571 1,306,874,363 384,883 49,645 0.0684
58,737 24,516,915 0 0 0.4174 19,048,834 1,282,357,448 384,883 49,493 0.0673
FERC FORM NO. 1 (ED. 12-95) Page 304
41 TOTAL Billed
42 Total Unbilled Rev.(See Instr. 6)43 TOTAL 167
Schedule Q-5 Page 167 of 300
Sponsor: Robinson Case No. 15-00139-UT

Name of Respondent This Report Is:(1) An Original(2) A Resubmission
Date of Report(Mo, Da, Yr)
Year/Period of Report
End of
SALES OF ELECTRICITY BY RATE SCHEDULES
Southwestern Public Service CompanyX
04/13/20152014/Q4
Line No.
Number and Title of Rate schedule MWh Sold
(b)(a)
Revenue
(c)
Average Numberof Customers
(d)
KWh of SalesPer Customer
(e)
Revenue PerKWh Sold
(f)
1. Report below for each rate schedule in effect during the year the MWH of electricity sold, revenue, average number of customer, average Kwh percustomer, and average revenue per Kwh, excluding date for Sales for Resale which is reported on Pages 310-311.2. Provide a subheading and total for each prescribed operating revenue account in the sequence followed in "Electric Operating Revenues," Page300-301. If the sales under any rate schedule are classified in more than one revenue account, List the rate schedule and sales data under eachapplicable revenue account subheading.3. Where the same customers are served under more than one rate schedule in the same revenue account classification (such as a general residentialschedule and an off peak water heating schedule), the entries in column (d) for the special schedule should denote the duplication in number of reportedcustomers.4. The average number of customers should be the number of bills rendered during the year divided by the number of billing periods during the year (12if all billings are made monthly).5. For any rate schedule having a fuel adjustment clause state in a footnote the estimated additional revenue billed pursuant thereto.6. Report amount of unbilled revenue as of end of year for each applicable revenue account subheading.
107 2 53,500 0.0660 7,059 1 TX SA-805 Amarillo Hwy Ltg
51 3 17,000 0.1361 6,941 2 TX SA-810 Street and Hwy Ltg
33,820 92 367,609 0.1303 4,406,358 3 TX Street Ltg Restricted Outdoor
13,269 19 698,368 0.1515 2,010,664 4 NM Street Lighting
-9 -4.3786 39,407 5 Unbilled
47,238 116 407,224 0.1370 6,470,429 6 TOTAL PUBLIC STREET & HWY
7
121,662 574 211,955 0.0786 9,562,969 8 NM Large Municipal & School
182,576 965 189,198 0.0704 12,861,106 9 TX Large Municipal
2,809 4 702,250 0.0730 205,070 10 TX Large School Primary
174,958 743 235,475 0.0834 14,592,198 11 TX Large School Service
10,451 1,134 9,216 0.0873 912,379 12 NM Small Municipal & School
17,749 2,755 6,442 0.0933 1,656,042 13 TX Small Municipal & School
-1,634 -0.4226 690,548 14 Unbilled
508,571 6,175 82,360 0.0796 40,480,312 15 TOTAL PUBLIC AUTHORITY
16
17
18
19
20
21
22
23
24
25
26
27
28
29
30
31
32
33
34
35
36
37
38
39
40
19,107,571 1,306,874,363 384,883 49,645 0.0684
58,737 24,516,915 0 0 0.4174 19,048,834 1,282,357,448 384,883 49,493 0.0673
FERC FORM NO. 1 (ED. 12-95) Page 304.1
41 TOTAL Billed
42 Total Unbilled Rev.(See Instr. 6)43 TOTAL 168
Schedule Q-5 Page 168 of 300
Sponsor: Robinson Case No. 15-00139-UT

Schedule Page: 304.1 Line No.: 39 Column: cSchedule Page: 304 Line No.: 39 Column: cEstimated Fuel Revenue Collected Through Fuel Clause Adjustment:
TX Residential Flood Lighting $4,609 Residential Guard Lighting 215,586 NM Res Area Lighting
(9,056)NM Residential Heating
(980,079)NM Residential Lighting
(612,593)TX Res Ltg Space Heat
25,204,849 TX Residential
54,620,940 Subtotal Residential Service $78,444,256
NM Commercial Area Lighting ($17,603)Flood Lighting
379,818 Guard Lighting
234,624 NM Irrigation
142,875 NM Large Gen Serv Trans - 69 kV
158,680,021 NM Large Gen Serv Trans - 115 kV
(479,138)TX Large Gen Serv Subtran - 69 kV
18,494,188 TX Large Gen Serv Trans - 115 kV
2,307,747 NM Primary General
41,216 TX Primary General
70,597,277 TX Primary Qualifying Fac
5,947 SAS-12 WRB Refining
14,980,128 SAS-13 Amarillo Recycling Co.
44,547 SAS-4 Canadian River Water Auth
4,537,937 SAS-8 JM Huber
1,277,969 NM Secondary General
(791,151)NM Small Secondary General
(87,562)TX Small General Service
8,967,943 TX Secondary General
Name of Respondent
Southwestern Public Service Company
This Report is:(1) X An Original(2) A Resubmission
Date of Report(Mo, Da, Yr)
04/13/2015
Year/Period of Report
2014/Q4
FOOTNOTE DATA
FERC FORM NO. 1 (ED. 12-87) Page 450.1
169
Schedule Q-5 Page 169 of 300
Sponsor: Robinson Case No. 15-00139-UT

71,862,431 TX Trans QF Standby - 115kV
11,002 TX Trans QF Standby - 69kV
12,056 Subtotal Commercial and Industrial Service $351,202,272
Schedule Page: 304.1 Line No.: 40 Column: cSchedule Page: 304 Line No.: 40 Column: cEstimated Fuel Revenue Collected Through Fuel Clause Adjustment:
TX SA-805 Amarillo Hwy Ltg $3,541 TX SA-810 Street and Hwy Ltg
1,685 TX Street Ltg Restricted Outdoor
1,116,386 NM Street Lighting
(22,998)Subtotal Public Street and Highway LightingService 1,098,614
NM Large Municipal & School(127,019)
TX Large Municipal $6,024,592 TX Large School Primary $91,451 TX Large School Service
5,776,503 NM Small Municipal & School
(6,038)TX Small Municipal & School
585,513 Subtotal Public Authority $12,345,002 Grand Total $443,090,144
Name of Respondent
Southwestern Public Service Company
This Report is:(1) X An Original(2) A Resubmission
Date of Report(Mo, Da, Yr)
04/13/2015
Year/Period of Report
2014/Q4
FOOTNOTE DATA
FERC FORM NO. 1 (ED. 12-87) Page 450.2
170
Schedule Q-5 Page 170 of 300
Sponsor: Robinson Case No. 15-00139-UT

Name of Respondent This Report Is:(1) An Original(2) A Resubmission
Date of Report(Mo, Da, Yr)
Year/Period of Report
End of
SALES FOR RESALE (Account 447)
Southwestern Public Service CompanyX
04/13/20152014/Q4
Line No.
Name of Company or Public Authority
(c)(b)(a)
FERC RateMonthly Billing
Average
(d)
Statistical
cationClassifi- Schedule or
Tariff Number Demand (MW)
(e) (f)
(Footnote Affiliations)
Actual Demand (MW)Average Average
Monthly NCP Demand Monthly CP Demand
1. Report all sales for resale (i.e., sales to purchasers other than ultimate consumers) transacted on a settlement basis other thanpower exchanges during the year. Do not report exchanges of electricity ( i.e., transactions involving a balancing of debits and creditsfor energy, capacity, etc.) and any settlements for imbalanced exchanges on this schedule. Power exchanges must be reported on thePurchased Power schedule (Page 326-327).2. Enter the name of the purchaser in column (a). Do note abbreviate or truncate the name or use acronyms. Explain in a footnote anyownership interest or affiliation the respondent has with the purchaser.3. In column (b), enter a Statistical Classification Code based on the original contractual terms and conditions of the service as follows:RQ - for requirements service. Requirements service is service which the supplier plans to provide on an ongoing basis (i.e., thesupplier includes projected load for this service in its system resource planning). In addition, the reliability of requirements service mustbe the same as, or second only to, the supplier's service to its own ultimate consumers.LF - for tong-term service. "Long-term" means five years or Longer and "firm" means that service cannot be interrupted for economicreasons and is intended to remain reliable even under adverse conditions (e.g., the supplier must attempt to buy emergency energyfrom third parties to maintain deliveries of LF service). This category should not be used for Long-term firm service which meets thedefinition of RQ service. For all transactions identified as LF, provide in a footnote the termination date of the contract defined as theearliest date that either buyer or setter can unilaterally get out of the contract. IF - for intermediate-term firm service. The same as LF service except that "intermediate-term" means longer than one year but Lessthan five years.SF - for short-term firm service. Use this category for all firm services where the duration of each period of commitment for service isone year or less.LU - for Long-term service from a designated generating unit. "Long-term" means five years or Longer. The availability and reliability ofservice, aside from transmission constraints, must match the availability and reliability of designated unit.IU - for intermediate-term service from a designated generating unit. The same as LU service except that "intermediate-term" meansLonger than one year but Less than five years.
Central Valley Elec Cooperative, Inc. 11013291RS114RQ 1
Central Valley Elec Cooperative, Inc. 000RS139RQ 2
Central Valley Elec Cooperative, Inc. 000RS140RQ 3
Farmers' Elec Cooperative Inc., of NM 516749RS115RQ 4
Farmers' Elec Cooperative Inc., of NM 000RS143RQ 5
Farmers' Elec Cooperative Inc., of NM 000RS140RQ 6
Golden Spread Electric 00500RS132RQ 7
Lea County Elec Cooperative, Inc. 162178136RS116RQ 8
Roosevelt County Elec Cooperative, Inc. 253021RS117RQ 9
Roosevelt County Elec Cooperative, Inc. 000RS141RQ 10
Roosevelt County Elec Cooperative, Inc. 000RS142RQ 11
Sharyland Utilities, L.P. 000RS118RQ 12
Tri-County Elec Cooperative 606662RS136RQ 13
West Texas Municipal Power Agency 492567511RS137RQ 14
FERC FORM NO. 1 (ED. 12-90) Page 310
0
0
0
Subtotal RQ
Subtotal non-RQ
Total
0 0
0
0
0
0
171
Schedule Q-5 Page 171 of 300
Sponsor: Robinson Case No. 15-00139-UT

Name of Respondent This Report Is:(1) An Original(2) A Resubmission
Date of Report(Mo, Da, Yr)
Year/Period of Report
End of
SALES FOR RESALE (Account 447)
Southwestern Public Service CompanyX
04/13/20152014/Q4
Line No.
Name of Company or Public Authority
(c)(b)(a)
FERC RateMonthly Billing
Average
(d)
Statistical
cationClassifi- Schedule or
Tariff Number Demand (MW)
(e) (f)
(Footnote Affiliations)
Actual Demand (MW)Average Average
Monthly NCP Demand Monthly CP Demand
1. Report all sales for resale (i.e., sales to purchasers other than ultimate consumers) transacted on a settlement basis other thanpower exchanges during the year. Do not report exchanges of electricity ( i.e., transactions involving a balancing of debits and creditsfor energy, capacity, etc.) and any settlements for imbalanced exchanges on this schedule. Power exchanges must be reported on thePurchased Power schedule (Page 326-327).2. Enter the name of the purchaser in column (a). Do note abbreviate or truncate the name or use acronyms. Explain in a footnote anyownership interest or affiliation the respondent has with the purchaser.3. In column (b), enter a Statistical Classification Code based on the original contractual terms and conditions of the service as follows:RQ - for requirements service. Requirements service is service which the supplier plans to provide on an ongoing basis (i.e., thesupplier includes projected load for this service in its system resource planning). In addition, the reliability of requirements service mustbe the same as, or second only to, the supplier's service to its own ultimate consumers.LF - for tong-term service. "Long-term" means five years or Longer and "firm" means that service cannot be interrupted for economicreasons and is intended to remain reliable even under adverse conditions (e.g., the supplier must attempt to buy emergency energyfrom third parties to maintain deliveries of LF service). This category should not be used for Long-term firm service which meets thedefinition of RQ service. For all transactions identified as LF, provide in a footnote the termination date of the contract defined as theearliest date that either buyer or setter can unilaterally get out of the contract. IF - for intermediate-term firm service. The same as LF service except that "intermediate-term" means longer than one year but Lessthan five years.SF - for short-term firm service. Use this category for all firm services where the duration of each period of commitment for service isone year or less.LU - for Long-term service from a designated generating unit. "Long-term" means five years or Longer. The availability and reliability ofservice, aside from transmission constraints, must match the availability and reliability of designated unit.IU - for intermediate-term service from a designated generating unit. The same as LU service except that "intermediate-term" meansLonger than one year but Less than five years.
American Elec Power Service Corp. N/AN/AN/AOATTSF 1
Arkansas Elec Cooperative Corporation N/AN/AN/AV6OS 2
Associated Electric Cooperative N/AN/AN/AOATTSF 3
Cargill Power Markets, LLC N/AN/AN/AWSPPOS 4
Endure Energy, LLC N/AN/AN/AWSPPOS 5
Grand River Dam Authority N/AN/AN/AOATTSF 6
Independence Power & Light Department N/AN/AN/AOATTSF 7
Kansas City Board of Public Utilities N/AN/AN/AOATTSF 8
Kansas City Power & Light N/AN/AN/AV6OS 9
Kansas City Power & Light N/AN/AN/AOATTSF 10
Kansas City Power & Light N/AN/AN/AWSPPSF 11
KCP&L Greater Missouri Operations Compy N/AN/AN/AOATTSF 12
Lincoln Electric Systems N/AN/AN/AOATTSF 13
Macquarie Energy LLC N/AN/AN/AWSPPOS 14
FERC FORM NO. 1 (ED. 12-90) Page 310.1
0
0
0
Subtotal RQ
Subtotal non-RQ
Total
0 0
0
0
0
0
172
Schedule Q-5 Page 172 of 300
Sponsor: Robinson Case No. 15-00139-UT

Name of Respondent This Report Is:(1) An Original(2) A Resubmission
Date of Report(Mo, Da, Yr)
Year/Period of Report
End of
SALES FOR RESALE (Account 447)
Southwestern Public Service CompanyX
04/13/20152014/Q4
Line No.
Name of Company or Public Authority
(c)(b)(a)
FERC RateMonthly Billing
Average
(d)
Statistical
cationClassifi- Schedule or
Tariff Number Demand (MW)
(e) (f)
(Footnote Affiliations)
Actual Demand (MW)Average Average
Monthly NCP Demand Monthly CP Demand
1. Report all sales for resale (i.e., sales to purchasers other than ultimate consumers) transacted on a settlement basis other thanpower exchanges during the year. Do not report exchanges of electricity ( i.e., transactions involving a balancing of debits and creditsfor energy, capacity, etc.) and any settlements for imbalanced exchanges on this schedule. Power exchanges must be reported on thePurchased Power schedule (Page 326-327).2. Enter the name of the purchaser in column (a). Do note abbreviate or truncate the name or use acronyms. Explain in a footnote anyownership interest or affiliation the respondent has with the purchaser.3. In column (b), enter a Statistical Classification Code based on the original contractual terms and conditions of the service as follows:RQ - for requirements service. Requirements service is service which the supplier plans to provide on an ongoing basis (i.e., thesupplier includes projected load for this service in its system resource planning). In addition, the reliability of requirements service mustbe the same as, or second only to, the supplier's service to its own ultimate consumers.LF - for tong-term service. "Long-term" means five years or Longer and "firm" means that service cannot be interrupted for economicreasons and is intended to remain reliable even under adverse conditions (e.g., the supplier must attempt to buy emergency energyfrom third parties to maintain deliveries of LF service). This category should not be used for Long-term firm service which meets thedefinition of RQ service. For all transactions identified as LF, provide in a footnote the termination date of the contract defined as theearliest date that either buyer or setter can unilaterally get out of the contract. IF - for intermediate-term firm service. The same as LF service except that "intermediate-term" means longer than one year but Lessthan five years.SF - for short-term firm service. Use this category for all firm services where the duration of each period of commitment for service isone year or less.LU - for Long-term service from a designated generating unit. "Long-term" means five years or Longer. The availability and reliability ofservice, aside from transmission constraints, must match the availability and reliability of designated unit.IU - for intermediate-term service from a designated generating unit. The same as LU service except that "intermediate-term" meansLonger than one year but Less than five years.
Nebraksa Public Power District N/AN/AN/AOATTSF 1
Oklahoma Gas & Electric Company N/AN/AN/AOATTSF 2
Public Service Company of CO N/AN/AN/AJOASF 3
Public Service Company of CO N/AN/AN/AJOAAD 4
Public Service Company of CO N/AN/AN/AWSPPSF 5
Public Service Company of NM N/AN/AN/AWSPPSF 6
Rainbow Energy Marketing Corporation N/AN/AN/AV6OS 7
Southwest Power Pool N/AN/AN/AOS 8
Southwest Power Pool N/AN/AN/AV3OS 9
Southwest Power Pool N/AN/AN/AOATTSF 10
Sunflower Electric Power Corporation N/AN/AN/AV6OS 11
Sunflower Electric Power Corporation N/AN/AN/AOATTOS 12
Sunflower Electric Power Corporation N/AN/AN/AOATTSF 13
Tenaska Power Services Company N/AN/AN/AV6OS 14
FERC FORM NO. 1 (ED. 12-90) Page 310.2
0
0
0
Subtotal RQ
Subtotal non-RQ
Total
0 0
0
0
0
0
173
Schedule Q-5 Page 173 of 300
Sponsor: Robinson Case No. 15-00139-UT

Name of Respondent This Report Is:(1) An Original(2) A Resubmission
Date of Report(Mo, Da, Yr)
Year/Period of Report
End of
SALES FOR RESALE (Account 447)
Southwestern Public Service CompanyX
04/13/20152014/Q4
Line No.
Name of Company or Public Authority
(c)(b)(a)
FERC RateMonthly Billing
Average
(d)
Statistical
cationClassifi- Schedule or
Tariff Number Demand (MW)
(e) (f)
(Footnote Affiliations)
Actual Demand (MW)Average Average
Monthly NCP Demand Monthly CP Demand
1. Report all sales for resale (i.e., sales to purchasers other than ultimate consumers) transacted on a settlement basis other thanpower exchanges during the year. Do not report exchanges of electricity ( i.e., transactions involving a balancing of debits and creditsfor energy, capacity, etc.) and any settlements for imbalanced exchanges on this schedule. Power exchanges must be reported on thePurchased Power schedule (Page 326-327).2. Enter the name of the purchaser in column (a). Do note abbreviate or truncate the name or use acronyms. Explain in a footnote anyownership interest or affiliation the respondent has with the purchaser.3. In column (b), enter a Statistical Classification Code based on the original contractual terms and conditions of the service as follows:RQ - for requirements service. Requirements service is service which the supplier plans to provide on an ongoing basis (i.e., thesupplier includes projected load for this service in its system resource planning). In addition, the reliability of requirements service mustbe the same as, or second only to, the supplier's service to its own ultimate consumers.LF - for tong-term service. "Long-term" means five years or Longer and "firm" means that service cannot be interrupted for economicreasons and is intended to remain reliable even under adverse conditions (e.g., the supplier must attempt to buy emergency energyfrom third parties to maintain deliveries of LF service). This category should not be used for Long-term firm service which meets thedefinition of RQ service. For all transactions identified as LF, provide in a footnote the termination date of the contract defined as theearliest date that either buyer or setter can unilaterally get out of the contract. IF - for intermediate-term firm service. The same as LF service except that "intermediate-term" means longer than one year but Lessthan five years.SF - for short-term firm service. Use this category for all firm services where the duration of each period of commitment for service isone year or less.LU - for Long-term service from a designated generating unit. "Long-term" means five years or Longer. The availability and reliability ofservice, aside from transmission constraints, must match the availability and reliability of designated unit.IU - for intermediate-term service from a designated generating unit. The same as LU service except that "intermediate-term" meansLonger than one year but Less than five years.
The Empire District Electric Company N/AN/AN/AOATTSF 1
The Energy Authority, Inc. N/AN/AN/AV6OS 2
The Energy Authority, Inc. N/AN/AN/AWSPPOS 3
Westar Energy N/AN/AN/AV6OS 4
Westar Energy N/AN/AN/AWSPPOS 5
Westar Energy N/AN/AN/AOATTSF 6
Western Area Power Administration N/AN/AN/AWSPPSF 7
Western Farmers Electric Cooperative N/AN/AN/AV6OS 8
Western Farmers Electric Cooperative N/AN/AN/AWSPPOS 9
Western Farmers Electric Cooperative N/AN/AN/AOATTSF 10
11
12
13
14
FERC FORM NO. 1 (ED. 12-90) Page 310.3
0
0
0
Subtotal RQ
Subtotal non-RQ
Total
0 0
0
0
0
0
174
Schedule Q-5 Page 174 of 300
Sponsor: Robinson Case No. 15-00139-UT

Name of Respondent This Report Is:(1) An Original(2) A Resubmission
Date of Report(Mo, Da, Yr)
Year/Period of Report
End of
SALES FOR RESALE (Account 447) (Continued)
Southwestern Public Service CompanyX
04/13/20152014/Q4
Line No.
MegaWatt Hours
(i)(h)(g) (j)
Demand Charges Energy Charges Other Charges
(k)
Sold (h+i+j)Total ($)
REVENUE
($) ($) ($)
OS - for other service. use this category only for those services which cannot be placed in the above-defined categories, such as allnon-firm service regardless of the Length of the contract and service from designated units of Less than one year. Describe the natureof the service in a footnote.AD - for Out-of-period adjustment. Use this code for any accounting adjustments or "true-ups" for service provided in prior reportingyears. Provide an explanation in a footnote for each adjustment.4. Group requirements RQ sales together and report them starting at line number one. After listing all RQ sales, enter "Subtotal - RQ"in column (a). The remaining sales may then be listed in any order. Enter "Subtotal-Non-RQ" in column (a) after this Listing. Enter"Total'' in column (a) as the Last Line of the schedule. Report subtotals and total for columns (9) through (k)5. In Column (c), identify the FERC Rate Schedule or Tariff Number. On separate Lines, List all FERC rate schedules or tariffs underwhich service, as identified in column (b), is provided.6. For requirements RQ sales and any type of-service involving demand charges imposed on a monthly (or Longer) basis, enter theaverage monthly billing demand in column (d), the average monthly non-coincident peak (NCP) demand in column (e), and the averagemonthly coincident peak (CP)demand in column (f). For all other types of service, enter NA in columns (d), (e) and (f). Monthly NCP demand is the maximummetered hourly (60-minute integration) demand in a month. Monthly CP demand is the metered demand during the hour (60-minuteintegration) in which the supplier's system reaches its monthly peak. Demand reported in columns (e) and (f) must be in megawatts.Footnote any demand not stated on a megawatt basis and explain.7. Report in column (g) the megawatt hours shown on bills rendered to the purchaser.8. Report demand charges in column (h), energy charges in column (i), and the total of any other types of charges, includingout-of-period adjustments, in column (j). Explain in a footnote all components of the amount shown in column (j). Report in column (k)the total charge shown on bills rendered to the purchaser.9. The data in column (g) through (k) must be subtotaled based on the RQ/Non-RQ grouping (see instruction 4), and then totaled onthe Last -line of the schedule. The "Subtotal - RQ" amount in column (g) must be reported as Requirements Sales For Resale on Page401, line 23. The "Subtotal - Non-RQ" amount in column (g) must be reported as Non-Requirements Sales For Resale on Page401,iine 24.10. Footnote entries as required and provide explanations following all required data.
25,872,050 7,481,613 6,570,477 39,924,140 724,380 1
1,808 40,096 41,904 70 2
2,130 331,533 333,663 3
9,305,626 4,012,128 3,310,042 16,627,796 259,992 4
807 13,824 14,631 31 5
734 114,322 115,056 6
62,562,708 42,210,000 3,204,392 107,977,100 1,731,648 7
37,008,906 11,233,957 9,683,023 57,925,886 1,036,123 8
4,668,341 1,713,142 1,517,308 7,898,791 129,249 9
500 9,680 10,180 19 10
514 80,025 80,539 11
-917 -52,685 -228,273 -281,875 84 12
14,049,108 4,336,998 3,553,025 21,939,131 395,152 13
101,927,006 41,727,584 28,970,412 172,625,002 2,874,194 14
FERC FORM NO. 1 (ED. 12-90) Page 311
255,395,943
56,130,372
311,526,315
7,150,942
2,006,878
9,157,820
57,169,886 425,231,944
10,232,974
67,402,860
66,363,346
491,595,290
112,666,115
0
112,666,115
175
Schedule Q-5 Page 175 of 300
Sponsor: Robinson Case No. 15-00139-UT

Name of Respondent This Report Is:(1) An Original(2) A Resubmission
Date of Report(Mo, Da, Yr)
Year/Period of Report
End of
SALES FOR RESALE (Account 447) (Continued)
Southwestern Public Service CompanyX
04/13/20152014/Q4
Line No.
MegaWatt Hours
(i)(h)(g) (j)
Demand Charges Energy Charges Other Charges
(k)
Sold (h+i+j)Total ($)
REVENUE
($) ($) ($)
OS - for other service. use this category only for those services which cannot be placed in the above-defined categories, such as allnon-firm service regardless of the Length of the contract and service from designated units of Less than one year. Describe the natureof the service in a footnote.AD - for Out-of-period adjustment. Use this code for any accounting adjustments or "true-ups" for service provided in prior reportingyears. Provide an explanation in a footnote for each adjustment.4. Group requirements RQ sales together and report them starting at line number one. After listing all RQ sales, enter "Subtotal - RQ"in column (a). The remaining sales may then be listed in any order. Enter "Subtotal-Non-RQ" in column (a) after this Listing. Enter"Total'' in column (a) as the Last Line of the schedule. Report subtotals and total for columns (9) through (k)5. In Column (c), identify the FERC Rate Schedule or Tariff Number. On separate Lines, List all FERC rate schedules or tariffs underwhich service, as identified in column (b), is provided.6. For requirements RQ sales and any type of-service involving demand charges imposed on a monthly (or Longer) basis, enter theaverage monthly billing demand in column (d), the average monthly non-coincident peak (NCP) demand in column (e), and the averagemonthly coincident peak (CP)demand in column (f). For all other types of service, enter NA in columns (d), (e) and (f). Monthly NCP demand is the maximummetered hourly (60-minute integration) demand in a month. Monthly CP demand is the metered demand during the hour (60-minuteintegration) in which the supplier's system reaches its monthly peak. Demand reported in columns (e) and (f) must be in megawatts.Footnote any demand not stated on a megawatt basis and explain.7. Report in column (g) the megawatt hours shown on bills rendered to the purchaser.8. Report demand charges in column (h), energy charges in column (i), and the total of any other types of charges, includingout-of-period adjustments, in column (j). Explain in a footnote all components of the amount shown in column (j). Report in column (k)the total charge shown on bills rendered to the purchaser.9. The data in column (g) through (k) must be subtotaled based on the RQ/Non-RQ grouping (see instruction 4), and then totaled onthe Last -line of the schedule. The "Subtotal - RQ" amount in column (g) must be reported as Requirements Sales For Resale on Page401, line 23. The "Subtotal - Non-RQ" amount in column (g) must be reported as Non-Requirements Sales For Resale on Page401,iine 24.10. Footnote entries as required and provide explanations following all required data.
31,532 31,532 230 1
2,275 2,275 35 2
3,356 3,356 96 3
53,024 53,024 956 4
57,000 57,000 800 5
4,862 4,862 82 6
925 925 4 7
96 96 5 8
194,114 194,114 2,974 9
6,727 6,727 141 10
52,604 52,604 938 11
1,023 1,023 18 12
682 682 29 13
76,629 76,629 1,191 14
FERC FORM NO. 1 (ED. 12-90) Page 311.1
255,395,943
56,130,372
311,526,315
7,150,942
2,006,878
9,157,820
57,169,886 425,231,944
10,232,974
67,402,860
66,363,346
491,595,290
112,666,115
0
112,666,115
176
Schedule Q-5 Page 176 of 300
Sponsor: Robinson Case No. 15-00139-UT

Name of Respondent This Report Is:(1) An Original(2) A Resubmission
Date of Report(Mo, Da, Yr)
Year/Period of Report
End of
SALES FOR RESALE (Account 447) (Continued)
Southwestern Public Service CompanyX
04/13/20152014/Q4
Line No.
MegaWatt Hours
(i)(h)(g) (j)
Demand Charges Energy Charges Other Charges
(k)
Sold (h+i+j)Total ($)
REVENUE
($) ($) ($)
OS - for other service. use this category only for those services which cannot be placed in the above-defined categories, such as allnon-firm service regardless of the Length of the contract and service from designated units of Less than one year. Describe the natureof the service in a footnote.AD - for Out-of-period adjustment. Use this code for any accounting adjustments or "true-ups" for service provided in prior reportingyears. Provide an explanation in a footnote for each adjustment.4. Group requirements RQ sales together and report them starting at line number one. After listing all RQ sales, enter "Subtotal - RQ"in column (a). The remaining sales may then be listed in any order. Enter "Subtotal-Non-RQ" in column (a) after this Listing. Enter"Total'' in column (a) as the Last Line of the schedule. Report subtotals and total for columns (9) through (k)5. In Column (c), identify the FERC Rate Schedule or Tariff Number. On separate Lines, List all FERC rate schedules or tariffs underwhich service, as identified in column (b), is provided.6. For requirements RQ sales and any type of-service involving demand charges imposed on a monthly (or Longer) basis, enter theaverage monthly billing demand in column (d), the average monthly non-coincident peak (NCP) demand in column (e), and the averagemonthly coincident peak (CP)demand in column (f). For all other types of service, enter NA in columns (d), (e) and (f). Monthly NCP demand is the maximummetered hourly (60-minute integration) demand in a month. Monthly CP demand is the metered demand during the hour (60-minuteintegration) in which the supplier's system reaches its monthly peak. Demand reported in columns (e) and (f) must be in megawatts.Footnote any demand not stated on a megawatt basis and explain.7. Report in column (g) the megawatt hours shown on bills rendered to the purchaser.8. Report demand charges in column (h), energy charges in column (i), and the total of any other types of charges, includingout-of-period adjustments, in column (j). Explain in a footnote all components of the amount shown in column (j). Report in column (k)the total charge shown on bills rendered to the purchaser.9. The data in column (g) through (k) must be subtotaled based on the RQ/Non-RQ grouping (see instruction 4), and then totaled onthe Last -line of the schedule. The "Subtotal - RQ" amount in column (g) must be reported as Requirements Sales For Resale on Page401, line 23. The "Subtotal - Non-RQ" amount in column (g) must be reported as Non-Requirements Sales For Resale on Page401,iine 24.10. Footnote entries as required and provide explanations following all required data.
137 137 1 1
8,329 8,329 136 2
21,658 21,658 204 3
595 595 4
6,394 6,394 100 5
-6,394 -6,394 -100 6
132,925 132,925 1,450 7
5,699,509 10,232,974 15,932,483 798,078 8
48,950,960 48,950,960 1,191,705 9
35,051 35,051 202 10
56,275 56,275 620 11
3,513 3,513 12 12
2,065 2,065 40 13
17,135 17,135 420 14
FERC FORM NO. 1 (ED. 12-90) Page 311.2
255,395,943
56,130,372
311,526,315
7,150,942
2,006,878
9,157,820
57,169,886 425,231,944
10,232,974
67,402,860
66,363,346
491,595,290
112,666,115
0
112,666,115
177
Schedule Q-5 Page 177 of 300
Sponsor: Robinson Case No. 15-00139-UT

Name of Respondent This Report Is:(1) An Original(2) A Resubmission
Date of Report(Mo, Da, Yr)
Year/Period of Report
End of
SALES FOR RESALE (Account 447) (Continued)
Southwestern Public Service CompanyX
04/13/20152014/Q4
Line No.
MegaWatt Hours
(i)(h)(g) (j)
Demand Charges Energy Charges Other Charges
(k)
Sold (h+i+j)Total ($)
REVENUE
($) ($) ($)
OS - for other service. use this category only for those services which cannot be placed in the above-defined categories, such as allnon-firm service regardless of the Length of the contract and service from designated units of Less than one year. Describe the natureof the service in a footnote.AD - for Out-of-period adjustment. Use this code for any accounting adjustments or "true-ups" for service provided in prior reportingyears. Provide an explanation in a footnote for each adjustment.4. Group requirements RQ sales together and report them starting at line number one. After listing all RQ sales, enter "Subtotal - RQ"in column (a). The remaining sales may then be listed in any order. Enter "Subtotal-Non-RQ" in column (a) after this Listing. Enter"Total'' in column (a) as the Last Line of the schedule. Report subtotals and total for columns (9) through (k)5. In Column (c), identify the FERC Rate Schedule or Tariff Number. On separate Lines, List all FERC rate schedules or tariffs underwhich service, as identified in column (b), is provided.6. For requirements RQ sales and any type of-service involving demand charges imposed on a monthly (or Longer) basis, enter theaverage monthly billing demand in column (d), the average monthly non-coincident peak (NCP) demand in column (e), and the averagemonthly coincident peak (CP)demand in column (f). For all other types of service, enter NA in columns (d), (e) and (f). Monthly NCP demand is the maximummetered hourly (60-minute integration) demand in a month. Monthly CP demand is the metered demand during the hour (60-minuteintegration) in which the supplier's system reaches its monthly peak. Demand reported in columns (e) and (f) must be in megawatts.Footnote any demand not stated on a megawatt basis and explain.7. Report in column (g) the megawatt hours shown on bills rendered to the purchaser.8. Report demand charges in column (h), energy charges in column (i), and the total of any other types of charges, includingout-of-period adjustments, in column (j). Explain in a footnote all components of the amount shown in column (j). Report in column (k)the total charge shown on bills rendered to the purchaser.9. The data in column (g) through (k) must be subtotaled based on the RQ/Non-RQ grouping (see instruction 4), and then totaled onthe Last -line of the schedule. The "Subtotal - RQ" amount in column (g) must be reported as Requirements Sales For Resale on Page401, line 23. The "Subtotal - Non-RQ" amount in column (g) must be reported as Non-Requirements Sales For Resale on Page401,iine 24.10. Footnote entries as required and provide explanations following all required data.
1,124 1,124 18 1
2,275 2,275 35 2
29,800 29,800 850 3
138,843 138,843 2,255 4
414,530 414,530 1,432 5
5,608 5,608 127 6
4,968 4,968 124 7
96,992 96,992 1,247 8
23,020 23,020 415 9
211 211 8 10
11
12
13
14
FERC FORM NO. 1 (ED. 12-90) Page 311.3
255,395,943
56,130,372
311,526,315
7,150,942
2,006,878
9,157,820
57,169,886 425,231,944
10,232,974
67,402,860
66,363,346
491,595,290
112,666,115
0
112,666,115
178
Schedule Q-5 Page 178 of 300
Sponsor: Robinson Case No. 15-00139-UT

Schedule Page: 310 Line No.: 1 Column: j Customer Charges; Margin Credits; TransmissionSchedule Page: 310 Line No.: 2 Column: j Backup Service ChargesSchedule Page: 310 Line No.: 3 Column: j Planning Reserve ChargesSchedule Page: 310 Line No.: 4 Column: jCustomer Charges; Margin Credits; TransmissionSchedule Page: 310 Line No.: 5 Column: jBackup Service ChargesSchedule Page: 310 Line No.: 6 Column: jPlanning Reserve ChargesSchedule Page: 310 Line No.: 7 Column: j Customer ChargesSchedule Page: 310 Line No.: 8 Column: jCustomer Charges; Margin Credits; TransmissionSchedule Page: 310 Line No.: 9 Column: jCustomer Charges; Margin Credits; TransmissionSchedule Page: 310 Line No.: 10 Column: jBackup Service ChargesSchedule Page: 310 Line No.: 11 Column: jPlanning Reserve ChargesSchedule Page: 310 Line No.: 12 Column: jCustomer True-Up Credits; Transmission Schedule Page: 310 Line No.: 13 Column: jCustomer Charges; Margin Credits; TransmissionSchedule Page: 310 Line No.: 14 Column: jCustomer Charges; Margin Credits; Transmission; Interval DataSchedule Page: 310.2 Line No.: 3 Column: jSouthwestern Public Service Co. & Public Service Company of Colorado are wholly-ownedsubsidiaries of Xcel Energy, Inc.Schedule Page: 310.2 Line No.: 8 Column: jSPP Loss Revenue
Name of Respondent
Southwestern Public Service Company
This Report is:(1) X An Original(2) A Resubmission
Date of Report(Mo, Da, Yr)
04/13/2015
Year/Period of Report
2014/Q4
FOOTNOTE DATA
FERC FORM NO. 1 (ED. 12-87) Page 450.1
179
Schedule Q-5 Page 179 of 300
Sponsor: Robinson Case No. 15-00139-UT

ELECTRIC OPERATION AND MAINTENANCE EXPENSES
Name of Respondent This Report Is:(1) An Original(2) A Resubmission
Date of Report(Mo, Da, Yr)
Year/Period of Report
End ofSouthwestern Public Service CompanyX
04/13/20152014/Q4
Line No.
Account Amount for
(c)(b)(a)Current Year Previous Year
Amount forIf the amount for previous year is not derived from previously reported figures, explain in footnote.
1. POWER PRODUCTION EXPENSES 1A. Steam Power Generation 2Operation 3(500) Operation Supervision and Engineering 4 2,750,576 2,514,855(501) Fuel 5 523,062,910 480,252,193(502) Steam Expenses 6 10,155,149 9,357,899(503) Steam from Other Sources 7(Less) (504) Steam Transferred-Cr. 8(505) Electric Expenses 9 11,720,251 10,768,861(506) Miscellaneous Steam Power Expenses 10 13,079,346 13,664,039(507) Rents 11 3,690,286 3,781,716(509) Allowances 12 -42 3,944TOTAL Operation (Enter Total of Lines 4 thru 12) 13 564,458,476 520,343,507Maintenance 14(510) Maintenance Supervision and Engineering 15 2,093,510 2,295,200(511) Maintenance of Structures 16 5,114,493 5,270,711(512) Maintenance of Boiler Plant 17 17,842,582 19,783,858(513) Maintenance of Electric Plant 18 14,077,028 13,047,656(514) Maintenance of Miscellaneous Steam Plant 19 11,773,065 14,321,769TOTAL Maintenance (Enter Total of Lines 15 thru 19) 20 50,900,678 54,719,194TOTAL Power Production Expenses-Steam Power (Entr Tot lines 13 & 20) 21 615,359,154 575,062,701B. Nuclear Power Generation 22Operation 23(517) Operation Supervision and Engineering 24(518) Fuel 25(519) Coolants and Water 26(520) Steam Expenses 27(521) Steam from Other Sources 28(Less) (522) Steam Transferred-Cr. 29(523) Electric Expenses 30(524) Miscellaneous Nuclear Power Expenses 31(525) Rents 32TOTAL Operation (Enter Total of lines 24 thru 32) 33Maintenance 34(528) Maintenance Supervision and Engineering 35(529) Maintenance of Structures 36(530) Maintenance of Reactor Plant Equipment 37(531) Maintenance of Electric Plant 38(532) Maintenance of Miscellaneous Nuclear Plant 39TOTAL Maintenance (Enter Total of lines 35 thru 39) 40TOTAL Power Production Expenses-Nuc. Power (Entr tot lines 33 & 40) 41C. Hydraulic Power Generation 42Operation 43(535) Operation Supervision and Engineering 44(536) Water for Power 45(537) Hydraulic Expenses 46(538) Electric Expenses 47(539) Miscellaneous Hydraulic Power Generation Expenses 48(540) Rents 49TOTAL Operation (Enter Total of Lines 44 thru 49) 50C. Hydraulic Power Generation (Continued) 51Maintenance 52(541) Mainentance Supervision and Engineering 53(542) Maintenance of Structures 54(543) Maintenance of Reservoirs, Dams, and Waterways 55(544) Maintenance of Electric Plant 56(545) Maintenance of Miscellaneous Hydraulic Plant 57TOTAL Maintenance (Enter Total of lines 53 thru 57) 58TOTAL Power Production Expenses-Hydraulic Power (tot of lines 50 & 58) 59
FERC FORM NO. 1 (ED. 12-93) Page 320
180
Schedule Q-5 Page 180 of 300
Sponsor: Robinson Case No. 15-00139-UT

ELECTRIC OPERATION AND MAINTENANCE EXPENSES (Continued)
Name of Respondent This Report Is:(1) An Original(2) A Resubmission
Date of Report(Mo, Da, Yr)
Year/Period of Report
End ofSouthwestern Public Service CompanyX
04/13/20152014/Q4
Line No.
Account Amount for
(c)(b)(a)Current Year Previous Year
Amount forIf the amount for previous year is not derived from previously reported figures, explain in footnote.
D. Other Power Generation 60Operation 61(546) Operation Supervision and Engineering 62 9,109 4,145(547) Fuel 63 6,418,499 24,538,909(548) Generation Expenses 64 294,630 390,336(549) Miscellaneous Other Power Generation Expenses 65 531,247 401,797(550) Rents 66 347,510 409,853TOTAL Operation (Enter Total of lines 62 thru 66) 67 7,600,995 25,745,040Maintenance 68(551) Maintenance Supervision and Engineering 69 160 518(552) Maintenance of Structures 70 108,512 165,694(553) Maintenance of Generating and Electric Plant 71 1,200,189 1,670,346(554) Maintenance of Miscellaneous Other Power Generation Plant 72 7,480 22,740TOTAL Maintenance (Enter Total of lines 69 thru 72) 73 1,316,341 1,859,298TOTAL Power Production Expenses-Other Power (Enter Tot of 67 & 73) 74 8,917,336 27,604,338E. Other Power Supply Expenses 75(555) Purchased Power 76 430,533,540 561,823,989(556) System Control and Load Dispatching 77 989,832 1,176,245(557) Other Expenses 78 6,007,668 9,457,906TOTAL Other Power Supply Exp (Enter Total of lines 76 thru 78) 79 437,531,040 572,458,140TOTAL Power Production Expenses (Total of lines 21, 41, 59, 74 & 79) 80 1,061,807,530 1,175,125,1792. TRANSMISSION EXPENSES 81Operation 82(560) Operation Supervision and Engineering 83 6,745,795 6,904,297
84(561.1) Load Dispatch-Reliability 85 43,266 68,600(561.2) Load Dispatch-Monitor and Operate Transmission System 86 3,050,155 3,253,849(561.3) Load Dispatch-Transmission Service and Scheduling 87(561.4) Scheduling, System Control and Dispatch Services 88 3,841,904 4,623,868(561.5) Reliability, Planning and Standards Development 89 855,273 481,418(561.6) Transmission Service Studies 90 -56,707 -5,213(561.7) Generation Interconnection Studies 91 20,589 67,695(561.8) Reliability, Planning and Standards Development Services 92 2,779,368 2,509,860(562) Station Expenses 93 1,204,172 1,459,477(563) Overhead Lines Expenses 94 889,235 914,358(564) Underground Lines Expenses 95(565) Transmission of Electricity by Others 96 88,489,074 97,026,841(566) Miscellaneous Transmission Expenses 97 2,381,113 3,445,414(567) Rents 98 1,143,107 1,186,584TOTAL Operation (Enter Total of lines 83 thru 98) 99 111,386,344 121,937,048Maintenance 100(568) Maintenance Supervision and Engineering 101 66,080 80,621(569) Maintenance of Structures 102(569.1) Maintenance of Computer Hardware 103(569.2) Maintenance of Computer Software 104(569.3) Maintenance of Communication Equipment 105(569.4) Maintenance of Miscellaneous Regional Transmission Plant 106(570) Maintenance of Station Equipment 107 2,501,763 2,503,956(571) Maintenance of Overhead Lines 108 1,763,846 1,912,488(572) Maintenance of Underground Lines 109 22,349(573) Maintenance of Miscellaneous Transmission Plant 110 9,878 33,555TOTAL Maintenance (Total of lines 101 thru 110) 111 4,341,567 4,552,969TOTAL Transmission Expenses (Total of lines 99 and 111) 112 115,727,911 126,490,017
FERC FORM NO. 1 (ED. 12-93) Page 321
181
Schedule Q-5 Page 181 of 300
Sponsor: Robinson Case No. 15-00139-UT

ELECTRIC OPERATION AND MAINTENANCE EXPENSES (Continued)
Name of Respondent This Report Is:(1) An Original(2) A Resubmission
Date of Report(Mo, Da, Yr)
Year/Period of Report
End ofSouthwestern Public Service CompanyX
04/13/20152014/Q4
Line No.
Account Amount for
(c)(b)(a)Current Year Previous Year
Amount forIf the amount for previous year is not derived from previously reported figures, explain in footnote.
3. REGIONAL MARKET EXPENSES 113Operation 114(575.1) Operation Supervision 115 191,960 175,684(575.2) Day-Ahead and Real-Time Market Facilitation 116 33,023 54,572(575.3) Transmission Rights Market Facilitation 117(575.4) Capacity Market Facilitation 118(575.5) Ancillary Services Market Facilitation 119 8,218 14,558(575.6) Market Monitoring and Compliance 120 69,044 54,071(575.7) Market Facilitation, Monitoring and Compliance Services 121 5,846,943 7,118,833(575.8) Rents 122 23,556 25,073Total Operation (Lines 115 thru 122) 123 6,172,744 7,442,791Maintenance 124(576.1) Maintenance of Structures and Improvements 125(576.2) Maintenance of Computer Hardware 126(576.3) Maintenance of Computer Software 127(576.4) Maintenance of Communication Equipment 128(576.5) Maintenance of Miscellaneous Market Operation Plant 129Total Maintenance (Lines 125 thru 129) 130TOTAL Regional Transmission and Market Op Expns (Total 123 and 130) 131 6,172,744 7,442,7914. DISTRIBUTION EXPENSES 132Operation 133(580) Operation Supervision and Engineering 134 4,841,495 4,589,116(581) Load Dispatching 135 746,113 1,197,599(582) Station Expenses 136 950,744 1,054,896(583) Overhead Line Expenses 137 850,364 9,066(584) Underground Line Expenses 138 384,224 275,730(585) Street Lighting and Signal System Expenses 139 996,072 916,768(586) Meter Expenses 140 5,037,178 4,551,417(587) Customer Installations Expenses 141 621,932 1,182,683(588) Miscellaneous Expenses 142 7,408,954 7,626,679(589) Rents 143 2,183,445 2,236,681TOTAL Operation (Enter Total of lines 134 thru 143) 144 24,020,521 23,640,635Maintenance 145(590) Maintenance Supervision and Engineering 146 292,230 307,568(591) Maintenance of Structures 147(592) Maintenance of Station Equipment 148 1,530,275 2,834,811(593) Maintenance of Overhead Lines 149 8,906,941 8,940,995(594) Maintenance of Underground Lines 150 217,669 234,392(595) Maintenance of Line Transformers 151 93,851 110,249(596) Maintenance of Street Lighting and Signal Systems 152 84,835 61,059(597) Maintenance of Meters 153 22,889 23,263(598) Maintenance of Miscellaneous Distribution Plant 154 9,988 7,357TOTAL Maintenance (Total of lines 146 thru 154) 155 11,158,678 12,519,694TOTAL Distribution Expenses (Total of lines 144 and 155) 156 35,179,199 36,160,3295. CUSTOMER ACCOUNTS EXPENSES 157Operation 158(901) Supervision 159 43,899 38,872(902) Meter Reading Expenses 160 4,952,925 5,037,605(903) Customer Records and Collection Expenses 161 6,699,742 6,617,440(904) Uncollectible Accounts 162 3,726,221 3,978,664(905) Miscellaneous Customer Accounts Expenses 163TOTAL Customer Accounts Expenses (Total of lines 159 thru 163) 164 15,422,787 15,672,581
FERC FORM NO. 1 (ED. 12-93) Page 322
182
Schedule Q-5 Page 182 of 300
Sponsor: Robinson Case No. 15-00139-UT

ELECTRIC OPERATION AND MAINTENANCE EXPENSES (Continued)
Name of Respondent This Report Is:(1) An Original(2) A Resubmission
Date of Report(Mo, Da, Yr)
Year/Period of Report
End ofSouthwestern Public Service CompanyX
04/13/20152014/Q4
Line No.
Account Amount for
(c)(b)(a)Current Year Previous Year
Amount forIf the amount for previous year is not derived from previously reported figures, explain in footnote.
6. CUSTOMER SERVICE AND INFORMATIONAL EXPENSES 165Operation 166(907) Supervision 167(908) Customer Assistance Expenses 168 14,998,300 14,766,357(909) Informational and Instructional Expenses 169 589,742 407,463(910) Miscellaneous Customer Service and Informational Expenses 170TOTAL Customer Service and Information Expenses (Total 167 thru 170) 171 15,588,042 15,173,8207. SALES EXPENSES 172Operation 173(911) Supervision 174(912) Demonstrating and Selling Expenses 175 189,227 188,033(913) Advertising Expenses 176(916) Miscellaneous Sales Expenses 177TOTAL Sales Expenses (Enter Total of lines 174 thru 177) 178 189,227 188,0338. ADMINISTRATIVE AND GENERAL EXPENSES 179Operation 180(920) Administrative and General Salaries 181 22,546,248 24,037,380(921) Office Supplies and Expenses 182 15,322,444 16,759,766(Less) (922) Administrative Expenses Transferred-Credit 183 5,970,192 7,072,975(923) Outside Services Employed 184 5,811,376 6,676,707(924) Property Insurance 185 3,749,508 3,535,916(925) Injuries and Damages 186 5,977,074 3,439,545(926) Employee Pensions and Benefits 187 34,209,322 36,689,968(927) Franchise Requirements 188(928) Regulatory Commission Expenses 189 5,815,339 5,995,932(929) (Less) Duplicate Charges-Cr. 190 1,009,082 1,211,407(930.1) General Advertising Expenses 191 1,351,158 1,336,609(930.2) Miscellaneous General Expenses 192 1,079,521 1,157,757(931) Rents 193 7,720,058 8,426,098TOTAL Operation (Enter Total of lines 181 thru 193) 194 96,602,774 99,771,296Maintenance 195(935) Maintenance of General Plant 196 224,855 442,446TOTAL Administrative & General Expenses (Total of lines 194 and 196) 197 96,827,629 100,213,742TOTAL Elec Op and Maint Expns (Total 80,112,131,156,164,171,178,197) 198 1,346,915,069 1,476,466,492
FERC FORM NO. 1 (ED. 12-93) Page 323
183
Schedule Q-5 Page 183 of 300
Sponsor: Robinson Case No. 15-00139-UT

Schedule Page: 320 Line No.: 12 Column: bThe amount of $3,944 represents amortization of previously deferred NOx allowance costunder the NM jurisdiction. Amortization authorized in Case No. 12-000350-UT. Schedule Page: 320 Line No.: 12 Column: c
2012 New Mexico Deferral True-up ($42)
Schedule Page: 320 Line No.: 78 Column: b
The total of this account includes deferred expenses related to Fuel and Renewable EnergyCertificates (RECs) as follows:Fuel $807,633 RECs 6,901,466
Schedule Page: 320 Line No.: 78 Column: c
The total of this account includes deferred expenses related to Fuel and RenewableEnergy Certificates (RECs) as follows:Fuel $1,553,042 RECs 2,336,500
Schedule Page: 320 Line No.: 90 Column: b
Credit balance results because Pension, Insurance and Taxes on Company labor billed forperforming the studies is booked to Account Nos. 408.1, 925 and 926 while the receivablerelated to performing the studies is booked to Account No. 561.6.
Schedule Page: 320 Line No.: 90 Column: c
Credit balance results because Pension, Insurance and Taxes on Company labor billed forperforming the studies is booked to Account Nos. 408.1, 925 and 926 while the receivablerelated to performing the studies is booked to Account No. 561.6.
Schedule Page: 320 Line No.: 159 Column: b
This line contains the balance for FERC 879 Distribution Op. Customer Install.
Schedule Page: 320 Line No.: 187 Column: b
Texas PUC Docket No. 38147 authorized deferral of expense to Account No. 182.3. Docket 40824 authorized amortization of 12/31/12 deferred balance. Docket No. 42004 extended the amortization period of the 12/31/12 balance; remainingbalance of $3,025,000 as of 5/31/2014 to be amortized over 36 months, which began6/1/2014. Docket No. 42004 authorizes amortization of the 2013 deferral of $3,468,975 over 36months, which began 6/1/2014. Docket No. 42004 authorizes amortization of the 2014 deferral of $196,032 through5/31/2014 to be amortized over 36 months, which began 6/1/2014.
Pension and Benefit Expense $33,519,504 Pension Tracker 494,629 Amortization 2,675,835 Pension and Benefit Expense as Reported $36,689,968
Schedule Page: 320 Line No.: 187 Column: c
Name of Respondent
Southwestern Public Service Company
This Report is:(1) X An Original(2) A Resubmission
Date of Report(Mo, Da, Yr)
04/13/2015
Year/Period of Report
2014/Q4
FOOTNOTE DATA
FERC FORM NO. 1 (ED. 12-87) Page 450.1
184
Schedule Q-5 Page 184 of 300
Sponsor: Robinson Case No. 15-00139-UT

Texas PUC Docket No. 40824 authorized deferral of expense to Account No. 182.3. Texas PUCDocket No. 40824 authorized the amortization of the 12/31/12 deferred balance of$6,600,000 over 24 months. New base rates went into effect on 5/1/13.
Pension and Benefit Expense $35,478,297 Pension Tracker (3,468,975)Amortization of 12/31/12 deferred balance 2,200,000 Pension and Benefit Expense as Reported $34,209,322
Name of Respondent
Southwestern Public Service Company
This Report is:(1) X An Original(2) A Resubmission
Date of Report(Mo, Da, Yr)
04/13/2015
Year/Period of Report
2014/Q4
FOOTNOTE DATA
FERC FORM NO. 1 (ED. 12-87) Page 450.2
185
Schedule Q-5 Page 185 of 300
Sponsor: Robinson Case No. 15-00139-UT

Name of Respondent This Report Is:(1) An Original(2) A Resubmission
Date of Report(Mo, Da, Yr)
Year/Period of Report
End of
PURCHASED POWER (Account 555)
Southwestern Public Service CompanyX
04/13/20152014/Q4
Line No.
Name of Company or Public Authority
(c)(b)(a)
FERC RateMonthly Billing
Average
(d)
Statistical
cationClassifi- Schedule or
Tariff Number Demand (MW)(e) (f)
(Footnote Affiliations)
Actual Demand (MW)Average Average
Monthly NCP Demand Monthly CP Demand
(Including power exchanges)
1. Report all power purchases made during the year. Also report exchanges of electricity (i.e., transactions involving a balancing ofdebits and credits for energy, capacity, etc.) and any settlements for imbalanced exchanges.2. Enter the name of the seller or other party in an exchange transaction in column (a). Do not abbreviate or truncate the name or useacronyms. Explain in a footnote any ownership interest or affiliation the respondent has with the seller.3. In column (b), enter a Statistical Classification Code based on the original contractual terms and conditions of the service as follows:
RQ - for requirements service. Requirements service is service which the supplier plans to provide on an ongoing basis (i.e., thesupplier includes projects load for this service in its system resource planning). In addition, the reliability of requirement service mustbe the same as, or second only to, the supplier’s service to its own ultimate consumers.
LF - for long-term firm service. "Long-term" means five years or longer and "firm" means that service cannot be interrupted foreconomic reasons and is intended to remain reliable even under adverse conditions (e.g., the supplier must attempt to buy emergencyenergy from third parties to maintain deliveries of LF service). This category should not be used for long-term firm service firm servicewhich meets the definition of RQ service. For all transaction identified as LF, provide in a footnote the termination date of the contractdefined as the earliest date that either buyer or seller can unilaterally get out of the contract.
IF - for intermediate-term firm service. The same as LF service expect that "intermediate-term" means longer than one year but lessthan five years.
SF - for short-term service. Use this category for all firm services, where the duration of each period of commitment for service is oneyear or less.
LU - for long-term service from a designated generating unit. "Long-term" means five years or longer. The availability and reliability ofservice, aside from transmission constraints, must match the availability and reliability of the designated unit.
IU - for intermediate-term service from a designated generating unit. The same as LU service expect that "intermediate-term" meanslonger than one year but less than five years.
EX - For exchanges of electricity. Use this category for transactions involving a balancing of debits and credits for energy, capacity, etc.and any settlements for imbalanced exchanges.
OS - for other service. Use this category only for those services which cannot be placed in the above-defined categories, such as allnon-firm service regardless of the Length of the contract and service from designated units of Less than one year. Describe the natureof the service in a footnote for each adjustment.
N/AN/AN/AAeolus Wnd LLC QFAD 1
N/AN/AN/AAeolus Wind LLC QFLU 2
N/AN/AN/AAmerican Electric Power Services WSPPSF 3
N/AN/AN/AAssociated Electric Cooperative, Inc. WSPPSF 4
N/AN/AN/ABlackhawk PSAAD 5
N/AN/A221Blackhawk PSALU 6
N/AN/AN/ACalpine Energy PSAAD 7
N/AN/A317Calpine Energy PSALU 8
N/AN/AN/ACaprock Wind LLC REPALU 9
N/AN/AN/ACargill Power Markets LLC WSPPSF 10
N/AN/AN/ACirrus Wind QFAD 11
N/AN/AN/ACirrus Wind QFLU 12
N/AN/AN/ACity of Burbank WSPPSF 13
N/AN/AN/ACity of Independence WSPPSF 14
FERC FORM NO. 1 (ED. 12-90) Page 326
Total
186
Schedule Q-5 Page 186 of 300
Sponsor: Robinson Case No. 15-00139-UT

Name of Respondent This Report Is:(1) An Original(2) A Resubmission
Date of Report(Mo, Da, Yr)
Year/Period of Report
End of
PURCHASED POWER (Account 555)
Southwestern Public Service CompanyX
04/13/20152014/Q4
Line No.
Name of Company or Public Authority
(c)(b)(a)
FERC RateMonthly Billing
Average
(d)
Statistical
cationClassifi- Schedule or
Tariff Number Demand (MW)(e) (f)
(Footnote Affiliations)
Actual Demand (MW)Average Average
Monthly NCP Demand Monthly CP Demand
(Including power exchanges)
1. Report all power purchases made during the year. Also report exchanges of electricity (i.e., transactions involving a balancing ofdebits and credits for energy, capacity, etc.) and any settlements for imbalanced exchanges.2. Enter the name of the seller or other party in an exchange transaction in column (a). Do not abbreviate or truncate the name or useacronyms. Explain in a footnote any ownership interest or affiliation the respondent has with the seller.3. In column (b), enter a Statistical Classification Code based on the original contractual terms and conditions of the service as follows:
RQ - for requirements service. Requirements service is service which the supplier plans to provide on an ongoing basis (i.e., thesupplier includes projects load for this service in its system resource planning). In addition, the reliability of requirement service mustbe the same as, or second only to, the supplier’s service to its own ultimate consumers.
LF - for long-term firm service. "Long-term" means five years or longer and "firm" means that service cannot be interrupted foreconomic reasons and is intended to remain reliable even under adverse conditions (e.g., the supplier must attempt to buy emergencyenergy from third parties to maintain deliveries of LF service). This category should not be used for long-term firm service firm servicewhich meets the definition of RQ service. For all transaction identified as LF, provide in a footnote the termination date of the contractdefined as the earliest date that either buyer or seller can unilaterally get out of the contract.
IF - for intermediate-term firm service. The same as LF service expect that "intermediate-term" means longer than one year but lessthan five years.
SF - for short-term service. Use this category for all firm services, where the duration of each period of commitment for service is oneyear or less.
LU - for long-term service from a designated generating unit. "Long-term" means five years or longer. The availability and reliability ofservice, aside from transmission constraints, must match the availability and reliability of the designated unit.
IU - for intermediate-term service from a designated generating unit. The same as LU service expect that "intermediate-term" meanslonger than one year but less than five years.
EX - For exchanges of electricity. Use this category for transactions involving a balancing of debits and credits for energy, capacity, etc.and any settlements for imbalanced exchanges.
OS - for other service. Use this category only for those services which cannot be placed in the above-defined categories, such as allnon-firm service regardless of the Length of the contract and service from designated units of Less than one year. Describe the natureof the service in a footnote for each adjustment.
N/AN/AN/ACity Utilities of Springfield Missouri WSPPSF 1
N/AN/AN/ADeWind Company QFAD 2
N/AN/AN/ADeWind Company QFLU 3
N/AN/AN/AEmpire District Electric WSPPSF 4
N/AN/AN/AEndure Energy WSPPOS 5
N/AN/AN/AEnergy Authority WSPPOS 6
N/AN/AN/AEnergy Authority WSPPSF 7
N/AN/AN/AEquus Energy Group OS 8
N/AN/AN/AExelon Wind LLC QFAD 9
N/AN/AN/AExelon Wind LLC QFLU 10
N/AN/AN/AGrand River Dam Authority WSPPSF 11
N/AN/AN/AICAP Energy OS 12
N/AN/AN/AKansas City Board of Public Utilities WSPPSF 13
N/AN/AN/AKansas City Power & Light WSPPSF 14
FERC FORM NO. 1 (ED. 12-90) Page 326.1
Total
187
Schedule Q-5 Page 187 of 300
Sponsor: Robinson Case No. 15-00139-UT

Name of Respondent This Report Is:(1) An Original(2) A Resubmission
Date of Report(Mo, Da, Yr)
Year/Period of Report
End of
PURCHASED POWER (Account 555)
Southwestern Public Service CompanyX
04/13/20152014/Q4
Line No.
Name of Company or Public Authority
(c)(b)(a)
FERC RateMonthly Billing
Average
(d)
Statistical
cationClassifi- Schedule or
Tariff Number Demand (MW)(e) (f)
(Footnote Affiliations)
Actual Demand (MW)Average Average
Monthly NCP Demand Monthly CP Demand
(Including power exchanges)
1. Report all power purchases made during the year. Also report exchanges of electricity (i.e., transactions involving a balancing ofdebits and credits for energy, capacity, etc.) and any settlements for imbalanced exchanges.2. Enter the name of the seller or other party in an exchange transaction in column (a). Do not abbreviate or truncate the name or useacronyms. Explain in a footnote any ownership interest or affiliation the respondent has with the seller.3. In column (b), enter a Statistical Classification Code based on the original contractual terms and conditions of the service as follows:
RQ - for requirements service. Requirements service is service which the supplier plans to provide on an ongoing basis (i.e., thesupplier includes projects load for this service in its system resource planning). In addition, the reliability of requirement service mustbe the same as, or second only to, the supplier’s service to its own ultimate consumers.
LF - for long-term firm service. "Long-term" means five years or longer and "firm" means that service cannot be interrupted foreconomic reasons and is intended to remain reliable even under adverse conditions (e.g., the supplier must attempt to buy emergencyenergy from third parties to maintain deliveries of LF service). This category should not be used for long-term firm service firm servicewhich meets the definition of RQ service. For all transaction identified as LF, provide in a footnote the termination date of the contractdefined as the earliest date that either buyer or seller can unilaterally get out of the contract.
IF - for intermediate-term firm service. The same as LF service expect that "intermediate-term" means longer than one year but lessthan five years.
SF - for short-term service. Use this category for all firm services, where the duration of each period of commitment for service is oneyear or less.
LU - for long-term service from a designated generating unit. "Long-term" means five years or longer. The availability and reliability ofservice, aside from transmission constraints, must match the availability and reliability of the designated unit.
IU - for intermediate-term service from a designated generating unit. The same as LU service expect that "intermediate-term" meanslonger than one year but less than five years.
EX - For exchanges of electricity. Use this category for transactions involving a balancing of debits and credits for energy, capacity, etc.and any settlements for imbalanced exchanges.
OS - for other service. Use this category only for those services which cannot be placed in the above-defined categories, such as allnon-firm service regardless of the Length of the contract and service from designated units of Less than one year. Describe the natureof the service in a footnote for each adjustment.
N/AN/AN/AKansas City Power & Light-Greater MO WSPPSF 1
N/AN/AN/AKODE Novus QFAD 2
N/AN/AN/AKODE Novus QFLU 3
N/AN/AN/ALea Power Partners PSAAD 4
N/AN/A604Lea Power Partners PSALU 5
N/AN/AN/ALlano Estacado Wind REPALU 6
N/AN/AN/ALubbock Power & Light PSAAD 7
N/AN/A182Lubbock Power & Light PSALU 8
N/AN/AN/AMammoth Plains REPALU 9
N/AN/AN/AMesalands QFLU 10
N/AN/AN/AMustang Energy/Golden Spread Electric REAAD 11
N/AN/A56Mustang Energy/Golden Spread Electric REALU 12
N/AN/AN/ANational Windmill Project, Inc. QFAD 13
N/AN/AN/ANational Windmill Project, Inc. QFLU 14
FERC FORM NO. 1 (ED. 12-90) Page 326.2
Total
188
Schedule Q-5 Page 188 of 300
Sponsor: Robinson Case No. 15-00139-UT

Name of Respondent This Report Is:(1) An Original(2) A Resubmission
Date of Report(Mo, Da, Yr)
Year/Period of Report
End of
PURCHASED POWER (Account 555)
Southwestern Public Service CompanyX
04/13/20152014/Q4
Line No.
Name of Company or Public Authority
(c)(b)(a)
FERC RateMonthly Billing
Average
(d)
Statistical
cationClassifi- Schedule or
Tariff Number Demand (MW)(e) (f)
(Footnote Affiliations)
Actual Demand (MW)Average Average
Monthly NCP Demand Monthly CP Demand
(Including power exchanges)
1. Report all power purchases made during the year. Also report exchanges of electricity (i.e., transactions involving a balancing ofdebits and credits for energy, capacity, etc.) and any settlements for imbalanced exchanges.2. Enter the name of the seller or other party in an exchange transaction in column (a). Do not abbreviate or truncate the name or useacronyms. Explain in a footnote any ownership interest or affiliation the respondent has with the seller.3. In column (b), enter a Statistical Classification Code based on the original contractual terms and conditions of the service as follows:
RQ - for requirements service. Requirements service is service which the supplier plans to provide on an ongoing basis (i.e., thesupplier includes projects load for this service in its system resource planning). In addition, the reliability of requirement service mustbe the same as, or second only to, the supplier’s service to its own ultimate consumers.
LF - for long-term firm service. "Long-term" means five years or longer and "firm" means that service cannot be interrupted foreconomic reasons and is intended to remain reliable even under adverse conditions (e.g., the supplier must attempt to buy emergencyenergy from third parties to maintain deliveries of LF service). This category should not be used for long-term firm service firm servicewhich meets the definition of RQ service. For all transaction identified as LF, provide in a footnote the termination date of the contractdefined as the earliest date that either buyer or seller can unilaterally get out of the contract.
IF - for intermediate-term firm service. The same as LF service expect that "intermediate-term" means longer than one year but lessthan five years.
SF - for short-term service. Use this category for all firm services, where the duration of each period of commitment for service is oneyear or less.
LU - for long-term service from a designated generating unit. "Long-term" means five years or longer. The availability and reliability ofservice, aside from transmission constraints, must match the availability and reliability of the designated unit.
IU - for intermediate-term service from a designated generating unit. The same as LU service expect that "intermediate-term" meanslonger than one year but less than five years.
EX - For exchanges of electricity. Use this category for transactions involving a balancing of debits and credits for energy, capacity, etc.and any settlements for imbalanced exchanges.
OS - for other service. Use this category only for those services which cannot be placed in the above-defined categories, such as allnon-firm service regardless of the Length of the contract and service from designated units of Less than one year. Describe the natureof the service in a footnote for each adjustment.
N/AN/AN/ANebraska Public Power WSPPSF 1
N/AN/AN/ANet Metering OS 2
N/AN/AN/AOklahoma Gas & Electric WSPPAD 3
N/AN/AN/AOklahoma Gas & Electric WSPPSF 4
N/AN/AN/AOmaha Public Power District WSPPOS 5
N/AN/AN/AOmaha Public Power District WSPPSF 6
N/AN/AN/AOrion Engineered Carbons LLC PSALU 7
N/AN/AN/APacifiCorp WSPPSF 8
N/AN/AN/APalo Duro Wind Energy LLC REPALU 9
N/AN/AN/APantex Wind QFLU 10
N/AN/AN/APleasant Hill Wind Energy LLC QFLU 11
N/AN/AN/APublic Service Company of Colorado WSPPSF 12
N/AN/AN/APublic Service Company of New Mexico WSPPSF 13
N/AN/AN/ARainbow Energy Marketing Corp WSPPSF 14
FERC FORM NO. 1 (ED. 12-90) Page 326.3
Total
189
Schedule Q-5 Page 189 of 300
Sponsor: Robinson Case No. 15-00139-UT

Name of Respondent This Report Is:(1) An Original(2) A Resubmission
Date of Report(Mo, Da, Yr)
Year/Period of Report
End of
PURCHASED POWER (Account 555)
Southwestern Public Service CompanyX
04/13/20152014/Q4
Line No.
Name of Company or Public Authority
(c)(b)(a)
FERC RateMonthly Billing
Average
(d)
Statistical
cationClassifi- Schedule or
Tariff Number Demand (MW)(e) (f)
(Footnote Affiliations)
Actual Demand (MW)Average Average
Monthly NCP Demand Monthly CP Demand
(Including power exchanges)
1. Report all power purchases made during the year. Also report exchanges of electricity (i.e., transactions involving a balancing ofdebits and credits for energy, capacity, etc.) and any settlements for imbalanced exchanges.2. Enter the name of the seller or other party in an exchange transaction in column (a). Do not abbreviate or truncate the name or useacronyms. Explain in a footnote any ownership interest or affiliation the respondent has with the seller.3. In column (b), enter a Statistical Classification Code based on the original contractual terms and conditions of the service as follows:
RQ - for requirements service. Requirements service is service which the supplier plans to provide on an ongoing basis (i.e., thesupplier includes projects load for this service in its system resource planning). In addition, the reliability of requirement service mustbe the same as, or second only to, the supplier’s service to its own ultimate consumers.
LF - for long-term firm service. "Long-term" means five years or longer and "firm" means that service cannot be interrupted foreconomic reasons and is intended to remain reliable even under adverse conditions (e.g., the supplier must attempt to buy emergencyenergy from third parties to maintain deliveries of LF service). This category should not be used for long-term firm service firm servicewhich meets the definition of RQ service. For all transaction identified as LF, provide in a footnote the termination date of the contractdefined as the earliest date that either buyer or seller can unilaterally get out of the contract.
IF - for intermediate-term firm service. The same as LF service expect that "intermediate-term" means longer than one year but lessthan five years.
SF - for short-term service. Use this category for all firm services, where the duration of each period of commitment for service is oneyear or less.
LU - for long-term service from a designated generating unit. "Long-term" means five years or longer. The availability and reliability ofservice, aside from transmission constraints, must match the availability and reliability of the designated unit.
IU - for intermediate-term service from a designated generating unit. The same as LU service expect that "intermediate-term" meanslonger than one year but less than five years.
EX - For exchanges of electricity. Use this category for transactions involving a balancing of debits and credits for energy, capacity, etc.and any settlements for imbalanced exchanges.
OS - for other service. Use this category only for those services which cannot be placed in the above-defined categories, such as allnon-firm service regardless of the Length of the contract and service from designated units of Less than one year. Describe the natureof the service in a footnote for each adjustment.
N/AN/AN/ARalls Wind Farm QFAD 1
N/AN/AN/ARalls Wind Farm QFLU 2
N/AN/AN/ASan Juan Mesa Wind Project, LLC REPAAD 3
N/AN/AN/ASan Juan Mesa Wind Project, LLC REPALU 4
N/AN/A2Sid Richardson PSALU 5
N/AN/AN/ASouthwest Power Pool SPPAD 6
N/AN/AN/ASouthwest Power Pool SPPOS 7
N/AN/AN/ASouthwestern Power Administration WSPPSF 8
N/AN/AN/ASpinning Spur, LLC REPALU 9
N/AN/AN/ASun Edison SEPALU 10
N/AN/AN/ASunflower Electric Power Corp WSPPSF 11
N/AN/AN/ASunray Wind QFAD 12
N/AN/AN/ASunray Wind QFLU 13
N/AN/AN/ASuzlon Wind QFAD 14
FERC FORM NO. 1 (ED. 12-90) Page 326.4
Total
190
Schedule Q-5 Page 190 of 300
Sponsor: Robinson Case No. 15-00139-UT

Name of Respondent This Report Is:(1) An Original(2) A Resubmission
Date of Report(Mo, Da, Yr)
Year/Period of Report
End of
PURCHASED POWER (Account 555)
Southwestern Public Service CompanyX
04/13/20152014/Q4
Line No.
Name of Company or Public Authority
(c)(b)(a)
FERC RateMonthly Billing
Average
(d)
Statistical
cationClassifi- Schedule or
Tariff Number Demand (MW)(e) (f)
(Footnote Affiliations)
Actual Demand (MW)Average Average
Monthly NCP Demand Monthly CP Demand
(Including power exchanges)
1. Report all power purchases made during the year. Also report exchanges of electricity (i.e., transactions involving a balancing ofdebits and credits for energy, capacity, etc.) and any settlements for imbalanced exchanges.2. Enter the name of the seller or other party in an exchange transaction in column (a). Do not abbreviate or truncate the name or useacronyms. Explain in a footnote any ownership interest or affiliation the respondent has with the seller.3. In column (b), enter a Statistical Classification Code based on the original contractual terms and conditions of the service as follows:
RQ - for requirements service. Requirements service is service which the supplier plans to provide on an ongoing basis (i.e., thesupplier includes projects load for this service in its system resource planning). In addition, the reliability of requirement service mustbe the same as, or second only to, the supplier’s service to its own ultimate consumers.
LF - for long-term firm service. "Long-term" means five years or longer and "firm" means that service cannot be interrupted foreconomic reasons and is intended to remain reliable even under adverse conditions (e.g., the supplier must attempt to buy emergencyenergy from third parties to maintain deliveries of LF service). This category should not be used for long-term firm service firm servicewhich meets the definition of RQ service. For all transaction identified as LF, provide in a footnote the termination date of the contractdefined as the earliest date that either buyer or seller can unilaterally get out of the contract.
IF - for intermediate-term firm service. The same as LF service expect that "intermediate-term" means longer than one year but lessthan five years.
SF - for short-term service. Use this category for all firm services, where the duration of each period of commitment for service is oneyear or less.
LU - for long-term service from a designated generating unit. "Long-term" means five years or longer. The availability and reliability ofservice, aside from transmission constraints, must match the availability and reliability of the designated unit.
IU - for intermediate-term service from a designated generating unit. The same as LU service expect that "intermediate-term" meanslonger than one year but less than five years.
EX - For exchanges of electricity. Use this category for transactions involving a balancing of debits and credits for energy, capacity, etc.and any settlements for imbalanced exchanges.
OS - for other service. Use this category only for those services which cannot be placed in the above-defined categories, such as allnon-firm service regardless of the Length of the contract and service from designated units of Less than one year. Describe the natureof the service in a footnote for each adjustment.
N/AN/AN/ASuzlon Wind QFLU 1
N/AN/AN/ATenaska Power Services Company WSPPSF 2
N/AN/AN/ATexico Wind LP REPAAD 3
N/AN/AN/ATexico Wind LP REPALU 4
N/AN/AN/AWAPA-Upper Great Plains WSPPSF 5
N/AN/AN/AWest Texas A&M University QFLU 6
N/AN/AN/AWestar Energy Inc. WSPPOS 7
N/AN/AN/AWestar Energy Inc. WSPPSF 8
N/AN/AN/AWestern Farmers Electric Coop WSPPOS 9
N/AN/AN/AWestern Farmers Electric Coop WSPPSF 10
N/AN/AN/AWildorado Wind REPALU 11
12
13
14
FERC FORM NO. 1 (ED. 12-90) Page 326.5
Total
191
Schedule Q-5 Page 191 of 300
Sponsor: Robinson Case No. 15-00139-UT

Name of Respondent This Report Is:(1) An Original(2) A Resubmission
Date of Report(Mo, Da, Yr)
Year/Period of Report
End of
PURCHASED POWER(Account 555) (Continued)
Southwestern Public Service CompanyX
04/13/20152014/Q4
Line No.
MegaWatt Hours
(i)(h)(g) (j)
Demand Charges Energy Charges Other Charges
(k)
Purchased (j+k+l)Total
COST/SETTLEMENT OF POWER
($) ($) ($)
(Including power exchanges)
POWER EXCHANGES
MegaWatt HoursReceived
MegaWatt HoursDelivered
(l) (m)of Settlement ($)
AD - for out-of-period adjustment. Use this code for any accounting adjustments or "true-ups" for service provided in prior reportingyears. Provide an explanation in a footnote for each adjustment.
4. In column (c), identify the FERC Rate Schedule Number or Tariff, or, for non-FERC jurisdictional sellers, include an appropriatedesignation for the contract. On separate lines, list all FERC rate schedules, tariffs or contract designations under which service, asidentified in column (b), is provided.5. For requirements RQ purchases and any type of service involving demand charges imposed on a monnthly (or longer) basis, enterthe monthly average billing demand in column (d), the average monthly non-coincident peak (NCP) demand in column (e), and theaverage monthly coincident peak (CP) demand in column (f). For all other types of service, enter NA in columns (d), (e) and (f). MonthlyNCP demand is the maximum metered hourly (60-minute integration) demand in a month. Monthly CP demand is the metered demandduring the hour (60-minute integration) in which the supplier's system reaches its monthly peak. Demand reported in columns (e) and (f)must be in megawatts. Footnote any demand not stated on a megawatt basis and explain.6. Report in column (g) the megawatthours shown on bills rendered to the respondent. Report in columns (h) and (i) the megawatthoursof power exchanges received and delivered, used as the basis for settlement. Do not report net exchange.7. Report demand charges in column (j), energy charges in column (k), and the total of any other types of charges, includingout-of-period adjustments, in column (l). Explain in a footnote all components of the amount shown in column (l). Report in column (m)the total charge shown on bills received as settlement by the respondent. For power exchanges, report in column (m) the settlementamount for the net receipt of energy. If more energy was delivered than received, enter a negative amount. If the settlement amount (l)include credits or charges other than incremental generation expenses, or (2) excludes certain credits or charges covered by theagreement, provide an explanatory footnote.8. The data in column (g) through (m) must be totalled on the last line of the schedule. The total amount in column (g) must bereported as Purchases on Page 401, line 10. The total amount in column (h) must be reported as Exchange Received on Page 401,line 12. The total amount in column (i) must be reported as Exchange Delivered on Page 401, line 13.9. Footnote entries as required and provide explanations following all required data.
16 16 1
13,145 38 13,183 2 817
3,112 3,112 3 77
1,230 1,230 4 26
86,105 86,105 5
20,300,921 48,578,678 68,879,599 6 1,526,513
-13,104 -13,104 7 -7
27,803,220 24,286,481 52,089,701 8 555,916
9,333,561 9,333,561 9 316,679
96,250 96,250 10 1,950
493 493 11
4,919,662 -28,898 4,890,764 12 143,821
24,018 24,018 13 397
240 240 14 3
FERC FORM NO. 1 (ED. 12-90) Page 327
12,113,628 109,458,229 495,539,421 -43,173,661 561,823,989
192
Schedule Q-5 Page 192 of 300
Sponsor: Robinson Case No. 15-00139-UT

Name of Respondent This Report Is:(1) An Original(2) A Resubmission
Date of Report(Mo, Da, Yr)
Year/Period of Report
End of
PURCHASED POWER(Account 555) (Continued)
Southwestern Public Service CompanyX
04/13/20152014/Q4
Line No.
MegaWatt Hours
(i)(h)(g) (j)
Demand Charges Energy Charges Other Charges
(k)
Purchased (j+k+l)Total
COST/SETTLEMENT OF POWER
($) ($) ($)
(Including power exchanges)
POWER EXCHANGES
MegaWatt HoursReceived
MegaWatt HoursDelivered
(l) (m)of Settlement ($)
AD - for out-of-period adjustment. Use this code for any accounting adjustments or "true-ups" for service provided in prior reportingyears. Provide an explanation in a footnote for each adjustment.
4. In column (c), identify the FERC Rate Schedule Number or Tariff, or, for non-FERC jurisdictional sellers, include an appropriatedesignation for the contract. On separate lines, list all FERC rate schedules, tariffs or contract designations under which service, asidentified in column (b), is provided.5. For requirements RQ purchases and any type of service involving demand charges imposed on a monnthly (or longer) basis, enterthe monthly average billing demand in column (d), the average monthly non-coincident peak (NCP) demand in column (e), and theaverage monthly coincident peak (CP) demand in column (f). For all other types of service, enter NA in columns (d), (e) and (f). MonthlyNCP demand is the maximum metered hourly (60-minute integration) demand in a month. Monthly CP demand is the metered demandduring the hour (60-minute integration) in which the supplier's system reaches its monthly peak. Demand reported in columns (e) and (f)must be in megawatts. Footnote any demand not stated on a megawatt basis and explain.6. Report in column (g) the megawatthours shown on bills rendered to the respondent. Report in columns (h) and (i) the megawatthoursof power exchanges received and delivered, used as the basis for settlement. Do not report net exchange.7. Report demand charges in column (j), energy charges in column (k), and the total of any other types of charges, includingout-of-period adjustments, in column (l). Explain in a footnote all components of the amount shown in column (l). Report in column (m)the total charge shown on bills received as settlement by the respondent. For power exchanges, report in column (m) the settlementamount for the net receipt of energy. If more energy was delivered than received, enter a negative amount. If the settlement amount (l)include credits or charges other than incremental generation expenses, or (2) excludes certain credits or charges covered by theagreement, provide an explanatory footnote.8. The data in column (g) through (m) must be totalled on the last line of the schedule. The total amount in column (g) must bereported as Purchases on Page 401, line 10. The total amount in column (h) must be reported as Exchange Received on Page 401,line 12. The total amount in column (i) must be reported as Exchange Delivered on Page 401, line 13.9. Footnote entries as required and provide explanations following all required data.
372 372 1 8
171 171 2
1,289,878 -16,463 1,273,415 3 97,551
391 391 4 9
18,600 18,600 5 600
77,283 77,283 6 2,264
451,134 451,134 7 14,611
325 325 8
-201,406 1,645 -199,761 9 -23,652
7,556,067 -29,355 7,526,712 10 534,956
900 900 11 9
3,300 3,300 12
380 380 13 6
110,174 110,174 14 3,592
FERC FORM NO. 1 (ED. 12-90) Page 327.1
12,113,628 109,458,229 495,539,421 -43,173,661 561,823,989
193
Schedule Q-5 Page 193 of 300
Sponsor: Robinson Case No. 15-00139-UT

Name of Respondent This Report Is:(1) An Original(2) A Resubmission
Date of Report(Mo, Da, Yr)
Year/Period of Report
End of
PURCHASED POWER(Account 555) (Continued)
Southwestern Public Service CompanyX
04/13/20152014/Q4
Line No.
MegaWatt Hours
(i)(h)(g) (j)
Demand Charges Energy Charges Other Charges
(k)
Purchased (j+k+l)Total
COST/SETTLEMENT OF POWER
($) ($) ($)
(Including power exchanges)
POWER EXCHANGES
MegaWatt HoursReceived
MegaWatt HoursDelivered
(l) (m)of Settlement ($)
AD - for out-of-period adjustment. Use this code for any accounting adjustments or "true-ups" for service provided in prior reportingyears. Provide an explanation in a footnote for each adjustment.
4. In column (c), identify the FERC Rate Schedule Number or Tariff, or, for non-FERC jurisdictional sellers, include an appropriatedesignation for the contract. On separate lines, list all FERC rate schedules, tariffs or contract designations under which service, asidentified in column (b), is provided.5. For requirements RQ purchases and any type of service involving demand charges imposed on a monnthly (or longer) basis, enterthe monthly average billing demand in column (d), the average monthly non-coincident peak (NCP) demand in column (e), and theaverage monthly coincident peak (CP) demand in column (f). For all other types of service, enter NA in columns (d), (e) and (f). MonthlyNCP demand is the maximum metered hourly (60-minute integration) demand in a month. Monthly CP demand is the metered demandduring the hour (60-minute integration) in which the supplier's system reaches its monthly peak. Demand reported in columns (e) and (f)must be in megawatts. Footnote any demand not stated on a megawatt basis and explain.6. Report in column (g) the megawatthours shown on bills rendered to the respondent. Report in columns (h) and (i) the megawatthoursof power exchanges received and delivered, used as the basis for settlement. Do not report net exchange.7. Report demand charges in column (j), energy charges in column (k), and the total of any other types of charges, includingout-of-period adjustments, in column (l). Explain in a footnote all components of the amount shown in column (l). Report in column (m)the total charge shown on bills received as settlement by the respondent. For power exchanges, report in column (m) the settlementamount for the net receipt of energy. If more energy was delivered than received, enter a negative amount. If the settlement amount (l)include credits or charges other than incremental generation expenses, or (2) excludes certain credits or charges covered by theagreement, provide an explanatory footnote.8. The data in column (g) through (m) must be totalled on the last line of the schedule. The total amount in column (g) must bereported as Purchases on Page 401, line 10. The total amount in column (h) must be reported as Exchange Received on Page 401,line 12. The total amount in column (i) must be reported as Exchange Delivered on Page 401, line 13.9. Footnote entries as required and provide explanations following all required data.
1,381 1,381 1 11
-212,425 935 -211,490 2 1,226
5,767,917 -61,807 5,706,110 3 372,807
-55,115 -55,115 4
49,574,582 105,111,210 154,685,792 5 2,703,512
7,295,104 7,295,104 6 260,076
-46,326 -4,354 -50,680 7
7,808,182 10,722,825 18,531,007 8 230,558
1,043,624 1,043,624 9 60,047
91,395 91,395 10 3,056
12,492 12,492 11
3,942,000 5,036,141 8,978,141 12 102,075
8 8 13
30,321 30,321 14 901
FERC FORM NO. 1 (ED. 12-90) Page 327.2
12,113,628 109,458,229 495,539,421 -43,173,661 561,823,989
194
Schedule Q-5 Page 194 of 300
Sponsor: Robinson Case No. 15-00139-UT

Name of Respondent This Report Is:(1) An Original(2) A Resubmission
Date of Report(Mo, Da, Yr)
Year/Period of Report
End of
PURCHASED POWER(Account 555) (Continued)
Southwestern Public Service CompanyX
04/13/20152014/Q4
Line No.
MegaWatt Hours
(i)(h)(g) (j)
Demand Charges Energy Charges Other Charges
(k)
Purchased (j+k+l)Total
COST/SETTLEMENT OF POWER
($) ($) ($)
(Including power exchanges)
POWER EXCHANGES
MegaWatt HoursReceived
MegaWatt HoursDelivered
(l) (m)of Settlement ($)
AD - for out-of-period adjustment. Use this code for any accounting adjustments or "true-ups" for service provided in prior reportingyears. Provide an explanation in a footnote for each adjustment.
4. In column (c), identify the FERC Rate Schedule Number or Tariff, or, for non-FERC jurisdictional sellers, include an appropriatedesignation for the contract. On separate lines, list all FERC rate schedules, tariffs or contract designations under which service, asidentified in column (b), is provided.5. For requirements RQ purchases and any type of service involving demand charges imposed on a monnthly (or longer) basis, enterthe monthly average billing demand in column (d), the average monthly non-coincident peak (NCP) demand in column (e), and theaverage monthly coincident peak (CP) demand in column (f). For all other types of service, enter NA in columns (d), (e) and (f). MonthlyNCP demand is the maximum metered hourly (60-minute integration) demand in a month. Monthly CP demand is the metered demandduring the hour (60-minute integration) in which the supplier's system reaches its monthly peak. Demand reported in columns (e) and (f)must be in megawatts. Footnote any demand not stated on a megawatt basis and explain.6. Report in column (g) the megawatthours shown on bills rendered to the respondent. Report in columns (h) and (i) the megawatthoursof power exchanges received and delivered, used as the basis for settlement. Do not report net exchange.7. Report demand charges in column (j), energy charges in column (k), and the total of any other types of charges, includingout-of-period adjustments, in column (l). Explain in a footnote all components of the amount shown in column (l). Report in column (m)the total charge shown on bills received as settlement by the respondent. For power exchanges, report in column (m) the settlementamount for the net receipt of energy. If more energy was delivered than received, enter a negative amount. If the settlement amount (l)include credits or charges other than incremental generation expenses, or (2) excludes certain credits or charges covered by theagreement, provide an explanatory footnote.8. The data in column (g) through (m) must be totalled on the last line of the schedule. The total amount in column (g) must bereported as Purchases on Page 401, line 10. The total amount in column (h) must be reported as Exchange Received on Page 401,line 12. The total amount in column (i) must be reported as Exchange Delivered on Page 401, line 13.9. Footnote entries as required and provide explanations following all required data.
1,020 1,020 1 24
163,728 163,728 2 5,837
-34 -34 3
2,570 2,570 4 59
2,250 2,250 5 90
182,166 182,166 6 5,231
2,890,855 2,890,855 7 97,289
104,375 104,375 8 1,801
2,647,842 2,647,842 9 142,991
347,506 -13,853 333,653 10 24,864
268,846 -3,575 265,271 11 8,581
1,246,827 1,246,827 12 24,699
106,800 106,800 13 2,200
111,543 111,543 14 3,126
FERC FORM NO. 1 (ED. 12-90) Page 327.3
12,113,628 109,458,229 495,539,421 -43,173,661 561,823,989
195
Schedule Q-5 Page 195 of 300
Sponsor: Robinson Case No. 15-00139-UT

Name of Respondent This Report Is:(1) An Original(2) A Resubmission
Date of Report(Mo, Da, Yr)
Year/Period of Report
End of
PURCHASED POWER(Account 555) (Continued)
Southwestern Public Service CompanyX
04/13/20152014/Q4
Line No.
MegaWatt Hours
(i)(h)(g) (j)
Demand Charges Energy Charges Other Charges
(k)
Purchased (j+k+l)Total
COST/SETTLEMENT OF POWER
($) ($) ($)
(Including power exchanges)
POWER EXCHANGES
MegaWatt HoursReceived
MegaWatt HoursDelivered
(l) (m)of Settlement ($)
AD - for out-of-period adjustment. Use this code for any accounting adjustments or "true-ups" for service provided in prior reportingyears. Provide an explanation in a footnote for each adjustment.
4. In column (c), identify the FERC Rate Schedule Number or Tariff, or, for non-FERC jurisdictional sellers, include an appropriatedesignation for the contract. On separate lines, list all FERC rate schedules, tariffs or contract designations under which service, asidentified in column (b), is provided.5. For requirements RQ purchases and any type of service involving demand charges imposed on a monnthly (or longer) basis, enterthe monthly average billing demand in column (d), the average monthly non-coincident peak (NCP) demand in column (e), and theaverage monthly coincident peak (CP) demand in column (f). For all other types of service, enter NA in columns (d), (e) and (f). MonthlyNCP demand is the maximum metered hourly (60-minute integration) demand in a month. Monthly CP demand is the metered demandduring the hour (60-minute integration) in which the supplier's system reaches its monthly peak. Demand reported in columns (e) and (f)must be in megawatts. Footnote any demand not stated on a megawatt basis and explain.6. Report in column (g) the megawatthours shown on bills rendered to the respondent. Report in columns (h) and (i) the megawatthoursof power exchanges received and delivered, used as the basis for settlement. Do not report net exchange.7. Report demand charges in column (j), energy charges in column (k), and the total of any other types of charges, includingout-of-period adjustments, in column (l). Explain in a footnote all components of the amount shown in column (l). Report in column (m)the total charge shown on bills received as settlement by the respondent. For power exchanges, report in column (m) the settlementamount for the net receipt of energy. If more energy was delivered than received, enter a negative amount. If the settlement amount (l)include credits or charges other than incremental generation expenses, or (2) excludes certain credits or charges covered by theagreement, provide an explanatory footnote.8. The data in column (g) through (m) must be totalled on the last line of the schedule. The total amount in column (g) must bereported as Purchases on Page 401, line 10. The total amount in column (h) must be reported as Exchange Received on Page 401,line 12. The total amount in column (i) must be reported as Exchange Delivered on Page 401, line 13.9. Footnote entries as required and provide explanations following all required data.
72 72 1
765,899 -17,718 748,181 2 21,957
11,065 11,065 3
12,067,306 12,067,306 4 402,647
75,650 401,362 477,012 5 13,486
-115,727 -168,953 -284,680 6 24,255
183,707,635 -43,389,014 140,318,621 7 2,877,713
650 650 8 13
25,367,343 539,524 25,906,867 9 712,566
12,168,523 12,168,523 10 111,430
669 669 11 11
86 86 12
473,072 -5,181 467,891 13 32,956
1,212 35 1,247 14
FERC FORM NO. 1 (ED. 12-90) Page 327.4
12,113,628 109,458,229 495,539,421 -43,173,661 561,823,989
196
Schedule Q-5 Page 196 of 300
Sponsor: Robinson Case No. 15-00139-UT

Name of Respondent This Report Is:(1) An Original(2) A Resubmission
Date of Report(Mo, Da, Yr)
Year/Period of Report
End of
PURCHASED POWER(Account 555) (Continued)
Southwestern Public Service CompanyX
04/13/20152014/Q4
Line No.
MegaWatt Hours
(i)(h)(g) (j)
Demand Charges Energy Charges Other Charges
(k)
Purchased (j+k+l)Total
COST/SETTLEMENT OF POWER
($) ($) ($)
(Including power exchanges)
POWER EXCHANGES
MegaWatt HoursReceived
MegaWatt HoursDelivered
(l) (m)of Settlement ($)
AD - for out-of-period adjustment. Use this code for any accounting adjustments or "true-ups" for service provided in prior reportingyears. Provide an explanation in a footnote for each adjustment.
4. In column (c), identify the FERC Rate Schedule Number or Tariff, or, for non-FERC jurisdictional sellers, include an appropriatedesignation for the contract. On separate lines, list all FERC rate schedules, tariffs or contract designations under which service, asidentified in column (b), is provided.5. For requirements RQ purchases and any type of service involving demand charges imposed on a monnthly (or longer) basis, enterthe monthly average billing demand in column (d), the average monthly non-coincident peak (NCP) demand in column (e), and theaverage monthly coincident peak (CP) demand in column (f). For all other types of service, enter NA in columns (d), (e) and (f). MonthlyNCP demand is the maximum metered hourly (60-minute integration) demand in a month. Monthly CP demand is the metered demandduring the hour (60-minute integration) in which the supplier's system reaches its monthly peak. Demand reported in columns (e) and (f)must be in megawatts. Footnote any demand not stated on a megawatt basis and explain.6. Report in column (g) the megawatthours shown on bills rendered to the respondent. Report in columns (h) and (i) the megawatthoursof power exchanges received and delivered, used as the basis for settlement. Do not report net exchange.7. Report demand charges in column (j), energy charges in column (k), and the total of any other types of charges, includingout-of-period adjustments, in column (l). Explain in a footnote all components of the amount shown in column (l). Report in column (m)the total charge shown on bills received as settlement by the respondent. For power exchanges, report in column (m) the settlementamount for the net receipt of energy. If more energy was delivered than received, enter a negative amount. If the settlement amount (l)include credits or charges other than incremental generation expenses, or (2) excludes certain credits or charges covered by theagreement, provide an explanatory footnote.8. The data in column (g) through (m) must be totalled on the last line of the schedule. The total amount in column (g) must bereported as Purchases on Page 401, line 10. The total amount in column (h) must be reported as Exchange Received on Page 401,line 12. The total amount in column (i) must be reported as Exchange Delivered on Page 401, line 13.9. Footnote entries as required and provide explanations following all required data.
148,700 -4,957 143,743 1 8,666
6,143 6,143 2 143
210 210 3
310,215 310,215 4 5,389
2,022 2,022 5 40
221 -4 217 6 15
36,466 36,466 7 1,106
558,006 558,006 8 18,802
8,404 8,404 9
610 610 10 10
20,088,923 20,088,923 11 655,216
12
13
14
FERC FORM NO. 1 (ED. 12-90) Page 327.5
12,113,628 109,458,229 495,539,421 -43,173,661 561,823,989
197
Schedule Q-5 Page 197 of 300
Sponsor: Robinson Case No. 15-00139-UT