Embed Size (px)
Citation preview
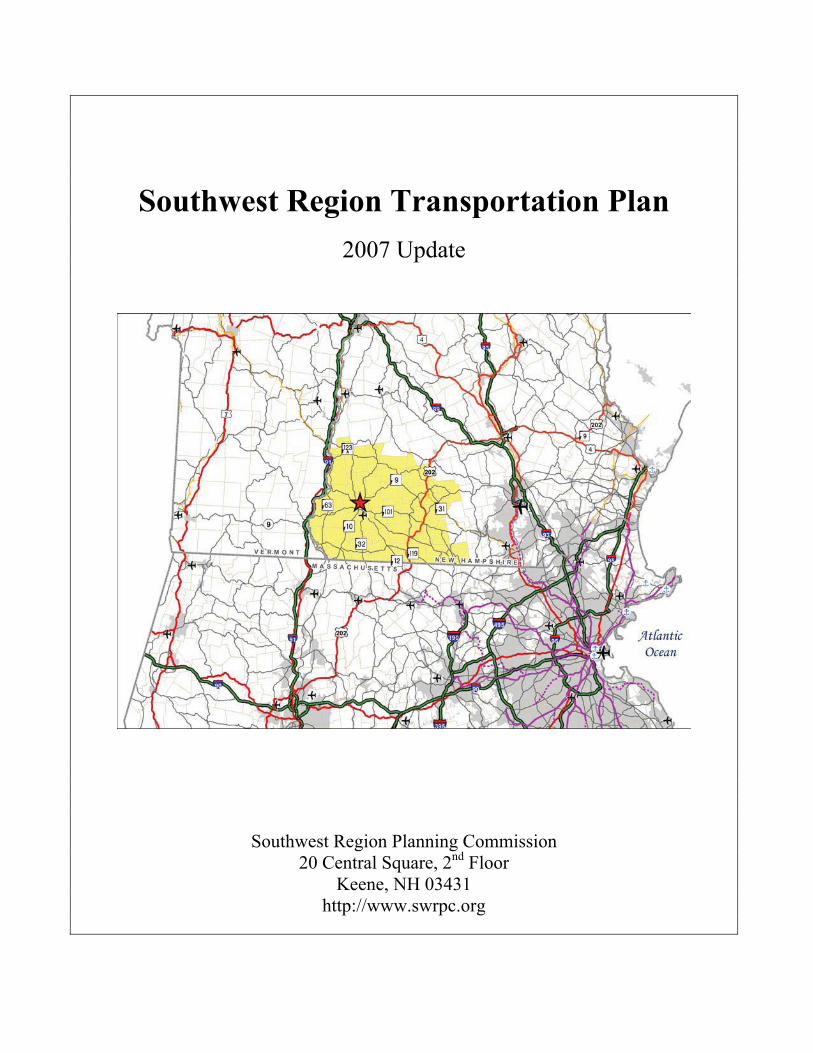
Southwest Region Transportation Plan
2007 Update
Southwest Region Planning Commission 20 Central Square, 2nd Floor
Keene, NH 03431 http://www.swrpc.org
Southwest Region Transportation Plan 2007 Update
SWRPC i
Acknowledgments The Planning Commission acknowledges the contribution of time and energy volunteered by the members of the Transportation Advisory Committee for the development of the Southwest Region Transportation Plan Update 2007. The Southwest Region Transportation Plan Update 2007 was prepared with support from the New Hampshire Department of Transportation and member municipalities of the Southwest Region Planning Commission. The contents of this Plan reflect the positions of the Southwest Region Planning Commission. The Southwest Region Planning Commission made a good faith effort to provide the best available information in this Plan. The contents of this Plan do not necessarily reflect the official views of the New Hampshire Department of Transportation or the Federal Highway Administration. This Plan is not a document of standard, specification or regulation.
Contact the Planning Commission
20 Central Square, 2nd Floor (Bank of America Building)
Keene, New Hampshire 03431
Telephone: 357-0557 FAX: 357-7440
e-Mail: [email protected] Web Site: www.swrpc.org
Southwest Region Transportation Plan 2007 Update
SWRPC ii
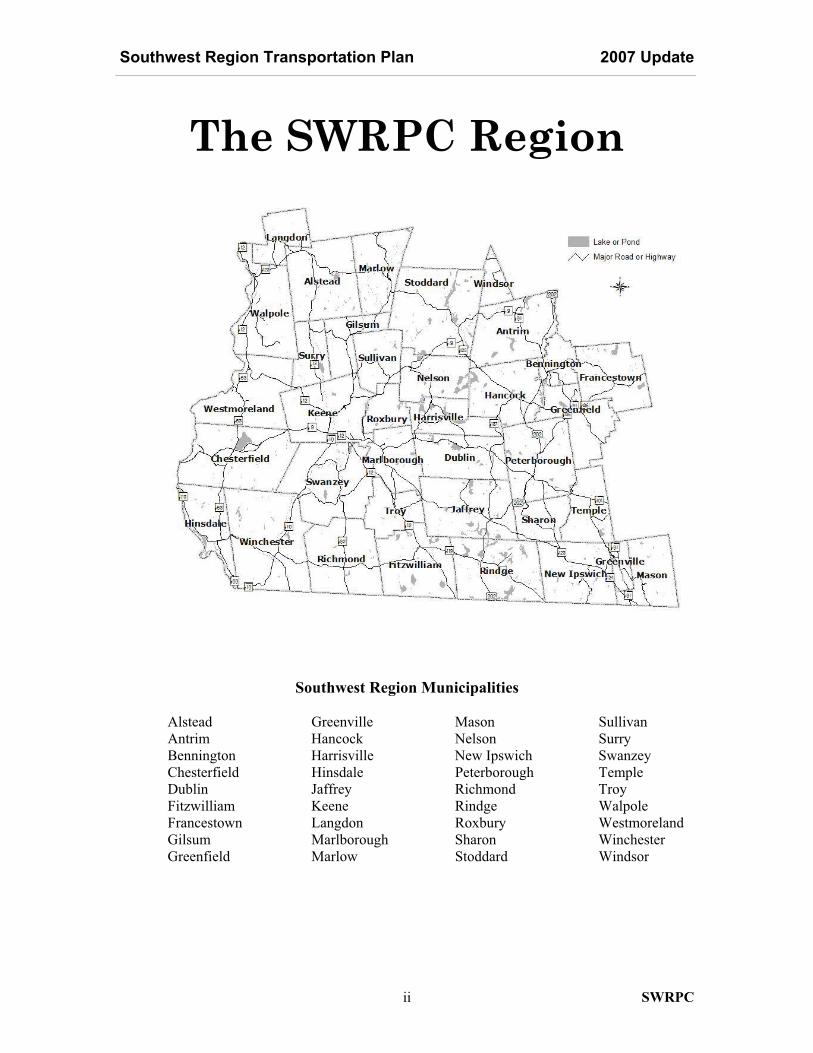
The SWRPC Region
Southwest Region Municipalities
Alstead Greenville Mason Sullivan Antrim Hancock Nelson Surry Bennington Harrisville New Ipswich Swanzey Chesterfield Hinsdale Peterborough Temple Dublin Jaffrey Richmond Troy Fitzwilliam Keene Rindge Walpole Francestown Langdon Roxbury Westmoreland Gilsum Marlborough Sharon Winchester Greenfield Marlow Stoddard Windsor
Southwest Region Transportation Plan 2007 Update
SWRPC iii
SWRPC Board of Directors
David Krisch, Chairman, Swanzey Eleanor Vander Haegen, Vice Chairman, Fitzwilliam Richard Berry, Vice Chairman, Keene Thomas Mullins, Secretary, Greenfield Lawrence Robinson, Treasurer, Marlborough
David Adams,, Troy Robert Harcke, Westmoreland Jim Coffey, New Ipswich Richard Mellor, Rindge Jill Collins, Hinsdale Ed Morrow, Peterborough John Gomarlo, Winchester William Prokop, Antrim Alton Chamberlain, Harrisville Bernie Schneckenburger, Hancock
SWRPC Transportation Advisory Committee
Kendall W. Lane, Chairman, Keene David Krisch, Vice Chairman, Swanzey
Rick Carrier, Chesterfield Ed Morrow, Peterborough Spencer Garrett, Antrim Edwin Smith, Hinsdale Doug Graham, ex officio, NH DOT District 4 Guy Swenson, Francestown Robert Mallat, Keene C.R. Willeke, ex officio, NH DOT District 4 Charles Miller, Walpole Thomas Wright, Dublin
and Steve Dubois, liaison, NH DOT Transportation Planning Bureau
SWRPC Staff
Tim Murphy, Executive Director Hope Lothrop, Office Support Specialist Jeff Porter, Assistant Director Sarah Patriquin, Planner Becky Baldwin, Office Manager Andrea Santoro, GIS Specialist Nicolás Bosonetto, Planner Natalie Shafiroff, Planner Amy Dillon, Planner Matt Suchodolski, Community Development Specialist
Southwest Region Transportation Plan 2007 Update
SWRPC iv
Table of Contents
Acknowledgements Table of Contents 1 Introduction
Purpose of the Regional Transportation Plan SWRPC and the Region Socioeconomic Trends Transportation Planning Environment Summary of Existing Conditions
2 Southwest Region Transportation System (by Mode)
Description, Travel Demand and System Performance
Roads and Highways Other Modes of Transportation Development Trends & Land Use Patterns SWRPC Regional Transportation Planning Program
3 Findings and Recommendations
Regional Connectivity Management of Existing Infrastructure Accessibility and Mobility Alternatives Roadway Improvements Safety, Security and Hazard Mitigation Public Participation SWRPC Assistance to State and Municipalities SWRPC Transportation Planning Program
Southwest Region Transportation Plan 2007 Update
SWRPC v
List of Figures
Figure 1– Urban Areas in New England, U.S. Census, 1990 - 2000.............................................. 7 Figure 2 – Land Development & Transportation Improvement Cycle............................................ 8 Figure 3 - Transportation Management Strategies .......................................................................... 9 Figure 4- Access, Mobility and Functional Classification ............................................................ 18 Figure 5 - DOT Driveway Permits 1939-2005 in Southwest Region............................................ 19 Figure 6 - State Road Classification in the Southwest Region...................................................... 20 Figure 7 - State Planning Cycle..................................................................................................... 27 Figure 8 - Traffic Growth on Major Arterials ............................................................................... 30 Figure 9 - Traffic Growth on Rural Minor Arterials ..................................................................... 30 Figure 10 - Jaffrey Traffic Volume by Highway 2000-2005 AADT ............................................ 33 Figure 11 - Keene Traffic Volume by Highway 2000-2003 AADT ............................................. 33 Figure 12 - Peterborough Traffic Volume by Highway 2000-2004 AADT.................................. 34 Figure 13 - Rindge Traffic Volume by Highway 2000-2004 AADT............................................ 34 Figure 15 - Driveway Standards in Subdivision/Site Plan Regulations ........................................ 41 Figure 16 - Road Standards in Site Plan/Subdivision Regulations................................................ 41 Figure 17-19 - Cumulative Population, Household and Housing Units Change by Corridor ....... 56 Figure 20-22 - Cumulative Population, Household and Housing Units Change by Corridor ....... 57 Figure 23-25 - Cumulative Population, Households and Housing Units Change ......................... 58
List of Tables
Table 1 – Municipal Populations..................................................................................................... 3 Table 2 - Historic Population Trend................................................................................................ 5 Table 3 - Traffic Growth Rates ....................................................................................................... 7 Table 4 - Classified Road Mileage by Municipality - 2006 .......................................................... 21 Table 5 - Traffic Volumes by Arterial Corridor ............................................................................ 31 Table 6 - Highway Block Grant Aid ............................................................................................. 39 Table 7- Rating of Master Plans and Site Plan/Subdivision Review Regulations ........................ 40 Table 8 - Airport Classifications ................................................................................................... 44 Table 9 - Miles of Frontage by Generalized Zoning District ........................................................ 52 Table 10 - Population Growth by Highway Corridor.................................................................... 55 Table 11 - Roadway Frontage by Zoning...................................................................................... 64
Appendices
A. State and Federal Transportation Legislation B. Access Management Draft Regulations C. Transportation Improvement Program D. SWRPC Plans E. Maps F. Resource List G. Southwest Region Bridge Inventory
Southwest Region Transportation Plan 2007 Update
SWRPC vi
List of Maps
1 Southwest Region Base Map 2 Roadway Functional Classification of Southwest Region Roads and Highways 3 Level of Access Control on Southwest Region State Highways 4 State Highway Classification of Southwest Region Roads and Highways 5 Southwest Region Bridges
a State Bridges b Municipal Bridges
6 Traffic Counter Locations 7 Highway Level of Service 8 Destinations and Road Congestion 9 Accident Rates on State Highways 10 State Route Pavement Conditions 11 Generalized Zoning Districts 12 Destinations and Community Centers 13 Conservation Land 14 Number of Building Permits 15 Household Density 16 Regional Multimodal Transportation 17 Central New England Regional Transportation Network 18 Commuting Patterns
a Place of Residence of Employees Working in the Southwest Region b Workplace of Southwest Region Residents
19 Road Frontage by Generalized Zoning District 20 Population Change from 1990 to 2000
a Household Density Change b Population Density Change
21 Likely Areas of Public Transit Need 22 Vermont Yankee Evacuation Area
Southwest Region Transportation Plan 2007 Update
1 SWRPC
1Introduction
� Purpose of the Regional Transportation Plan � SWRPC and the Region � Socioeconomic Trends � Transportation Planning Environment � Summary of Existing Conditions
Purpose of the Regional Transportation Plan This Regional Transportation Plan serves several related purposes: 1. Partial fulfillment of the Commission statutory mission: “… to prepare a coordinated plan
for the development of the region, taking into account present and future needs with a view toward encouraging the most appropriate use of land, such as… the facilitation of transportation…”.1 and “… to prepare a comprehensive master plan for the development of the region… including recommendations, among other things, for the use of land within the region; for the general location, extent, type of use, and character of highways, major streets, intersections, parking lots, railroads, aircraft landing areas and other purposes…”.2
2. To provide a regional context of information and policy for developing a biennial 10-Year
Transportation Improvement Program (TIP) for the Southwest Region in cooperation with local government officials and the State of New Hampshire under the federal SAFETEA-LU and pursuant to NH RSA 228:99, paragraphs III. and IV. in the development of the Statewide Ten Year Plan (TYP) (Appendix A); and
3. To facilitate a regional approach among local and State decision-makers to planning and
decisions regarding transportation, land use, economic and community development. Furthermore, as a planning document this Plan presents a synthesis of policy and technical information relevant to local, regional and state activity for the planning and management of the transportation system. Information and recommendations presented here are intended as guidance to local, regional and state activity. The Planning Commission has designed the scope and content of the Plan and Appendices to provide material appropriate to the needs of the Southwest Region of the State of New Hampshire.
1 Commission statutory mission NH RSA 36:45 2 NH RSA 36:47
Southwest Region Transportation Plan 2007 Update
2 SWRPC
1SWRPC and the Region About SWRPC
SWRPC is one of nine planning regions in the state of New Hampshire. The Southwest Region comprises 36 municipalities as shown in Map 1.3 SWRPC is incorporated by a body of Commissioners representing member municipalities; the Commission is governed by a Board of Directors elected by and from the Commissioners; and the work of the Commission is carried out by a professional staff. SWRPC also maintains four standing advisory committees to the Board of Directors in Economic Development, Brownfields Redevelopment, Natural Resources and Transportation. SWRPC conducts an annual work program in the following areas:
� Local Planning Assistance, � Community and Regional Economic Development Planning, � Municipal Master Planning, � Regional Environmental Planning, � Municipal Hazard Mitigation Planning and Emergency Operations Planning, � Regional Information System/Geographic Information System (GIS), � Information Management, and � Regional Transportation Planning.
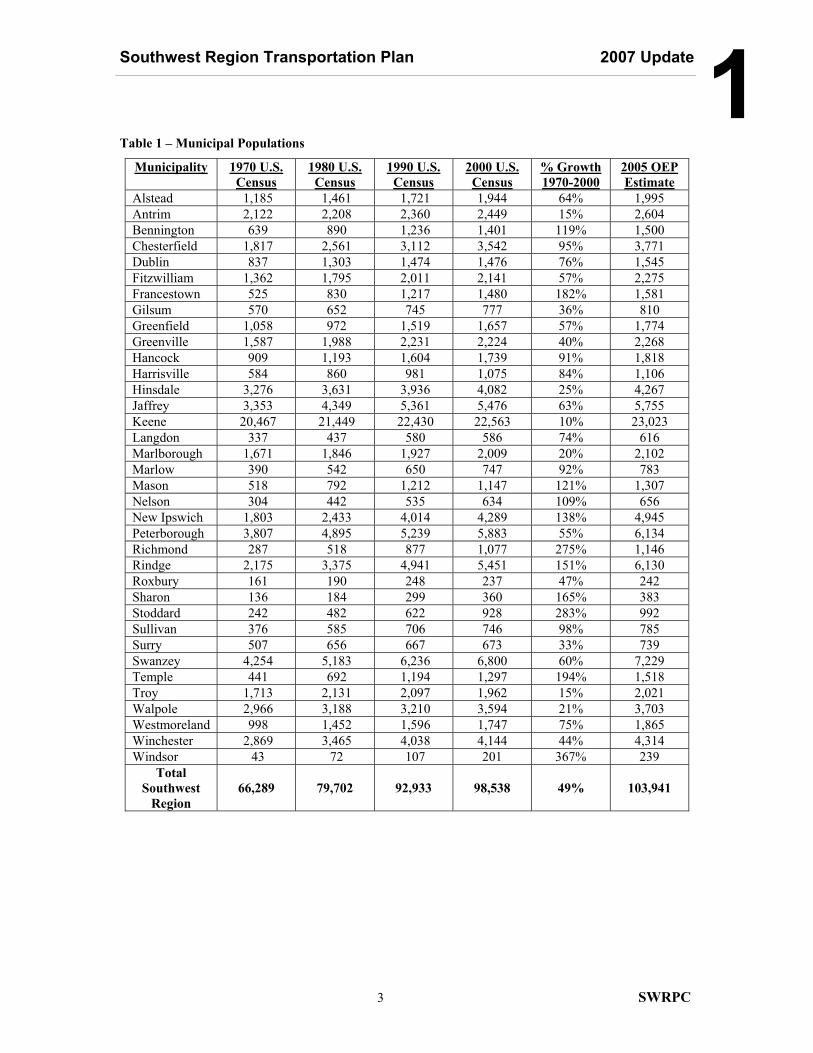
The Planning Commission’s work program is supported by a combination of annual agreements with government agencies, competitive grant awards, contracts with municipalities, contracts with other public and private entities, and municipal membership dues. The development of this Plan and the Southwest Region Transportation Improvement Program (TIP) are basic elements of the Planning Commission’s Regional Transportation Planning program supported by the NH Department of Transportation and municipal membership dues. Our Region The Southwest Region’s 36 municipalities comprise the 23 towns of Cheshire County, twelve towns of western Hillsborough County and the town of Langdon in Sullivan County (Map 1.) Over 100,000 people live in the 1,031 square-mile region, a population density of approximately 100 people per square-mile. According to the 2000 Census, town populations range from 23,023 in Keene to 239 in Windsor, with the regional average being 2,312 excluding Keene (see Table 1).
3 NH RSA 36:45 through 58 enable municipalities to form and financially support regional planning commissions;
Southwest Region Transportation Plan 2007 Update
3 SWRPC
1Table 1 – Municipal Populations
Municipality 1970 U.S. Census
1980 U.S. Census
1990 U.S. Census
2000 U.S. Census
% Growth 1970-2000
2005 OEP Estimate
Alstead 1,185 1,461 1,721 1,944 64% 1,995 Antrim 2,122 2,208 2,360 2,449 15% 2,604 Bennington 639 890 1,236 1,401 119% 1,500 Chesterfield 1,817 2,561 3,112 3,542 95% 3,771 Dublin 837 1,303 1,474 1,476 76% 1,545 Fitzwilliam 1,362 1,795 2,011 2,141 57% 2,275 Francestown 525 830 1,217 1,480 182% 1,581 Gilsum 570 652 745 777 36% 810 Greenfield 1,058 972 1,519 1,657 57% 1,774 Greenville 1,587 1,988 2,231 2,224 40% 2,268 Hancock 909 1,193 1,604 1,739 91% 1,818 Harrisville 584 860 981 1,075 84% 1,106 Hinsdale 3,276 3,631 3,936 4,082 25% 4,267 Jaffrey 3,353 4,349 5,361 5,476 63% 5,755 Keene 20,467 21,449 22,430 22,563 10% 23,023 Langdon 337 437 580 586 74% 616 Marlborough 1,671 1,846 1,927 2,009 20% 2,102 Marlow 390 542 650 747 92% 783 Mason 518 792 1,212 1,147 121% 1,307 Nelson 304 442 535 634 109% 656 New Ipswich 1,803 2,433 4,014 4,289 138% 4,945 Peterborough 3,807 4,895 5,239 5,883 55% 6,134 Richmond 287 518 877 1,077 275% 1,146 Rindge 2,175 3,375 4,941 5,451 151% 6,130 Roxbury 161 190 248 237 47% 242 Sharon 136 184 299 360 165% 383 Stoddard 242 482 622 928 283% 992 Sullivan 376 585 706 746 98% 785 Surry 507 656 667 673 33% 739 Swanzey 4,254 5,183 6,236 6,800 60% 7,229 Temple 441 692 1,194 1,297 194% 1,518 Troy 1,713 2,131 2,097 1,962 15% 2,021 Walpole 2,966 3,188 3,210 3,594 21% 3,703 Westmoreland 998 1,452 1,596 1,747 75% 1,865 Winchester 2,869 3,465 4,038 4,144 44% 4,314 Windsor 43 72 107 201 367% 239
Total Southwest
Region 66,289 79,702 92,933 98,538 49% 103,941
Southwest Region Transportation Plan 2007 Update
4 SWRPC
1The landscape is mostly forested, with rural development dispersed throughout the region and suburban development surrounding village centers. The Region’s natural and historic rural landscape is prized by residents and visitors alike and considered an invaluable asset to be protected and managed. About 18% of the Region’s land area is encumbered against development through deed restrictions, such as easements and public ownership for protection.4 There is a strong ethic in the Southwest Region for environmental protection and preservation of the visual community character. Public pressure to exercise public or private control over the rates and kinds of growth the Region might experience is persistent. Historic development patterns in the two river valleys, the Ashuelot and Contoocook (separated by the Monadnock Highlands), create a socioeconomic geography of two major sub-regions: one dominated by Keene as an employment, commercial, and population center at the intersection of NH routes 9, 10, 12, and 101 and the other being a more linear configuration of Contoocook Valley population centers of Rindge, Jaffrey, and Peterborough on the US 202 corridor. The Region’s commerce and employment is dominated by light manufacturing, business and service industries with most firms employing fewer than 10 people. The proliferation of home based businesses and cottage industries continue to be a strong trend in our region. Tourism, retail and resource extraction are also important sectors of the economy. There are an estimated 43,008 workers employed in the Region. Almost half of them work in Keene (20,306), 4,925 in Peterborough, 2,594 in Jaffrey, and the average number of jobs for the remaining towns is about 460.5 The Region has experienced two periods of rapid growth: in the early 1970’s and again in the late 1980’s. Increases of more than 100% in population, households and commercial floor space during those decades were not uncommon in some Southwest Region towns. Both episodes brought substantial increases in population, commerce and demand for access and mobility. While a strong sense of local identity defined by town boundaries prevails, there is great variety in the “personal geography” of residents. That is, the map people carry in their minds determined by where they work and shop, where they have social connections, and where they spend leisure time. The Region is as connected with Vermont and Massachusetts socio-economically as it is with the rest of New Hampshire. The Southwest Region population is as highly mobile as any in the U.S. with most of residents working and shopping outside their towns of residence. Residents travel on average 23 minutes one way to work each day with most (~80%) driving alone - and most households (~63%) have two or more cars.6 The high level of mobility of the Southwest Region’s residents and visitors is a basis for the strong regional economy and a primary criterion in many people’s definition of quality of life. The demand for personal and commercial mobility translates to demand for expansion of all transportation modes and is inextricably linked with demographic and economic trends. Personal mobility remains a growth industry throughout the country. At the beginning of the 21st Century the vast majority of people and goods are moving through rural and suburban New England by way of motor vehicles on public roads.
4 New Hampshire GIS Conservation Collaborative (NHGCC), GRANIT data, July 2006 5 Estimated figures for 1st Quarter of 2006, New Hampshire Economic & Labor Market Information Bureau 6 Census Transportation Planning Package (CTPP) 2000: Profiles for New Hampshire
Southwest Region Transportation Plan 2007 Update
5 SWRPC
1Socioeconomic Trends By the year 2025, the Southwest Region will face many challenges to maintaining the level of mobility currently enjoyed. Our population will increase in both overall size and age, necessitating a continued high level of service on the roadways as well as an expansion in non-traditional transportation services. Our transportation infrastructure will require rehabilitation at a time of decreasing funding and increasing material costs. Meanwhile, development trends will continue to create new demand for infrastructure expansion to provide personal mobility and accessibility. These projected supply and demand side trends have been acknowledged at the federal level through the passing of the SAFETEA-LU (the Safe, Accountable, Flexible and Efficient Transportation Equity Act – a Legacy for Users) legislation and at the state level through the development of the Long Range Transportation Business Plan. This update of the Southwest Region Transportation Plan is therefore necessary to keep abreast of these developments and to adequately prepare our region for continued prosperity and well being.
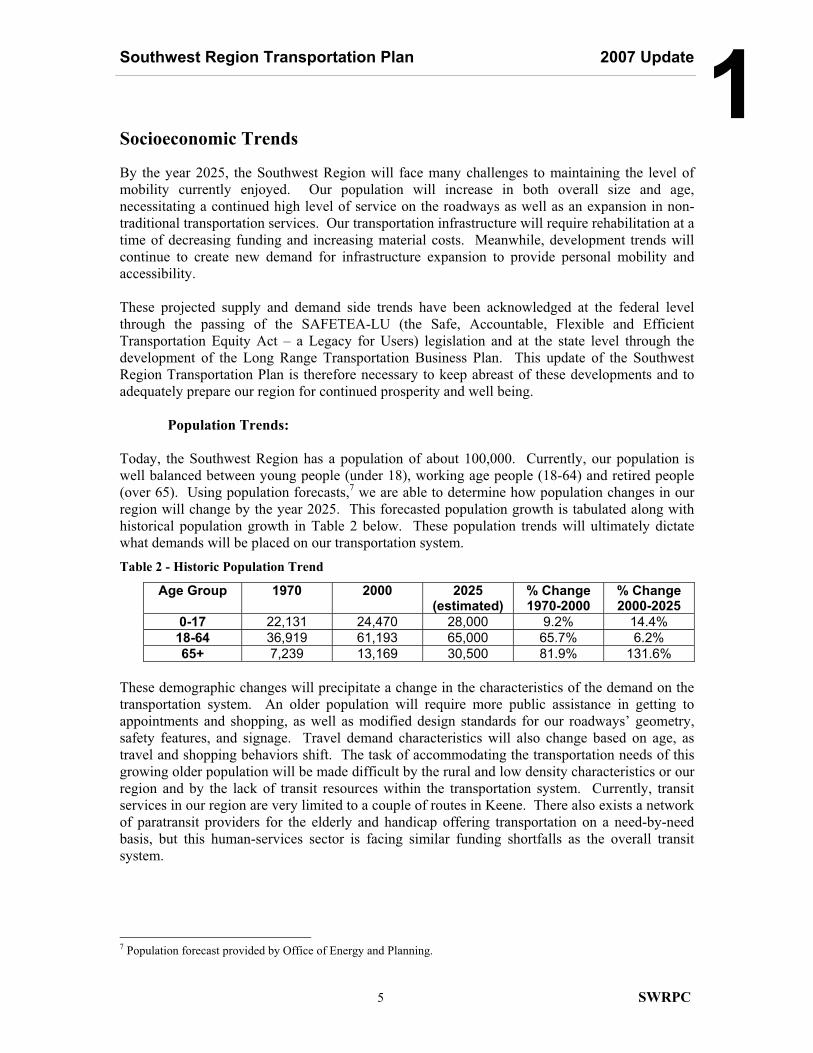
Population Trends: Today, the Southwest Region has a population of about 100,000. Currently, our population is well balanced between young people (under 18), working age people (18-64) and retired people (over 65). Using population forecasts,7 we are able to determine how population changes in our region will change by the year 2025. This forecasted population growth is tabulated along with historical population growth in Table 2 below. These population trends will ultimately dictate what demands will be placed on our transportation system. Table 2 - Historic Population Trend
Age Group 1970 2000 2025 (estimated)
% Change 1970-2000
% Change 2000-2025
0-17 22,131 24,470 28,000 9.2% 14.4% 18-64 36,919 61,193 65,000 65.7% 6.2% 65+ 7,239 13,169 30,500 81.9% 131.6%
These demographic changes will precipitate a change in the characteristics of the demand on the transportation system. An older population will require more public assistance in getting to appointments and shopping, as well as modified design standards for our roadways’ geometry, safety features, and signage. Travel demand characteristics will also change based on age, as travel and shopping behaviors shift. The task of accommodating the transportation needs of this growing older population will be made difficult by the rural and low density characteristics or our region and by the lack of transit resources within the transportation system. Currently, transit services in our region are very limited to a couple of routes in Keene. There also exists a network of paratransit providers for the elderly and handicap offering transportation on a need-by-need basis, but this human-services sector is facing similar funding shortfalls as the overall transit system.
7 Population forecast provided by Office of Energy and Planning.

Southwest Region Transportation Plan 2007 Update
6 SWRPC
1
NH DOT estimates that bythe year 2025, total funding will fall $64 million short of the needed amount to maintain the transportation system at its current level.
Transportation Funding Trends: Over the next 20 years, transportation infrastructure needs are forecasted to continue out-striping funding availability. According to NH DOT, the current Ten Year Plan (TYP)8 is 50% under funded, meaning that it will take at least 15 years to complete all the projects currently programmed. Funding for municipally owned roads, which represent 70% of the roadway network, is projected to experience even greater shortfalls.9 A milestone in our transportation system was reached in 2006, which marked the 50th anniversary of the Interstate system. It is important to note that the original infrastructure was designed with a 50 year life-span. The construction of highways and bridges are funded through state and federal road-fuel taxes.10 The majority of projects are funded by 80% federal funds which are distributed from the Highway Trust Fund. This Trust Fund has been depleted by the need to rehabilitate the various aspects of our aging infrastructure, as well as by expansion of the system in the sprawling urban areas. It’s unlikely that large capacity expansion or new road alignment projects will be constructed in our region in the next 20 years. Instead, the limited transportation funds should be used for system preservation, maintenance, and targeted enhancements to achieve a greater inter-modal efficiency and safety in our existing transportation system.
Development Trends:
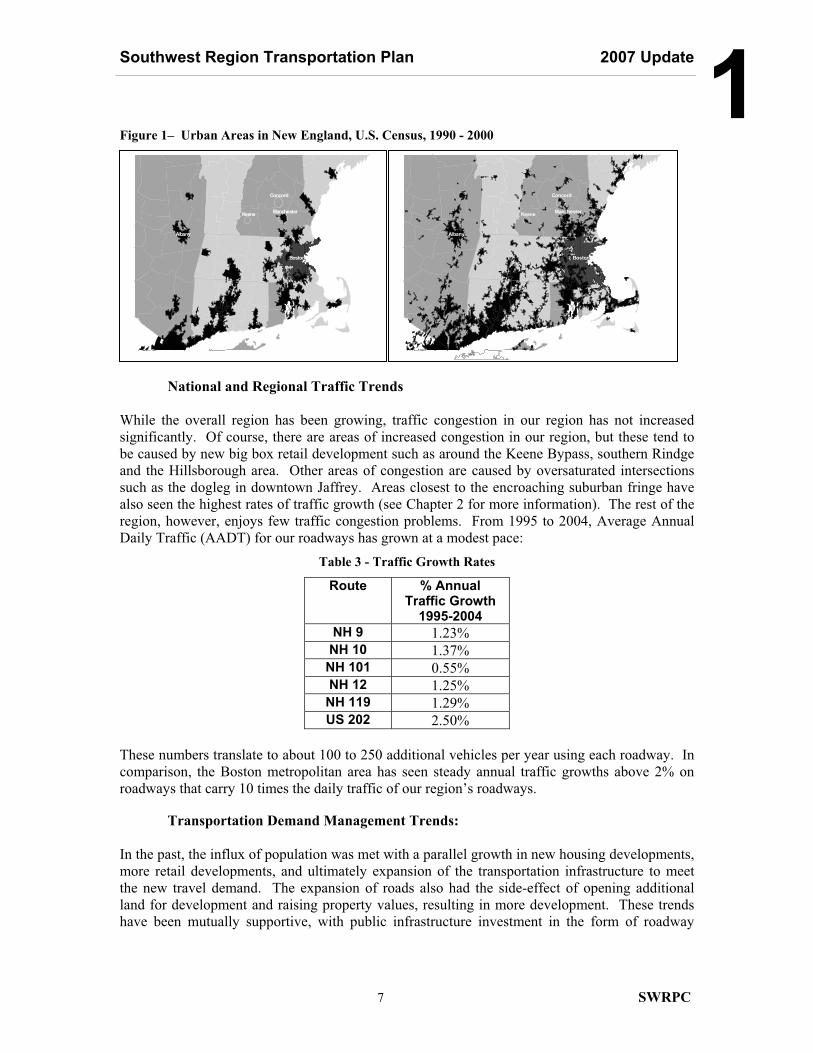
The prevailing trend in central New England is for dispersed development. Census information depicted in Figure 1 shows that the trend has been for continued suburban growth around metropolitan areas. These areas of suburban activity are spreading out from urban centers along major transportation corridors and merging with one another to form vast areas of development. This growth pressure will continue to creep from the south and the east into our region for the foreseeable future, as the suburban areas continue to expand. In the last 35 years, our region has grown by 56%, led by astounding growth in towns like Rindge (151%), Sharon (165%), New Ipswich (138%), and Temple (194%) in our southeastern section (see Table 1).
8 The TYP is a 10 year program of all federally funded transportation improvements, and is the main source for all highway and bridge projects in the state. 9 New Hampshire Long Range Business Plan, CAC Report June 2006, p. 11 10 Some NH funding also comes from vehicle registrations and tolls collected on the various turnpikes.
Southwest Region Transportation Plan 2007 Update
7 SWRPC
1Figure 1– Urban Areas in New England, U.S. Census, 1990 - 2000
National and Regional Traffic Trends While the overall region has been growing, traffic congestion in our region has not increased significantly. Of course, there are areas of increased congestion in our region, but these tend to be caused by new big box retail development such as around the Keene Bypass, southern Rindge and the Hillsborough area. Other areas of congestion are caused by oversaturated intersections such as the dogleg in downtown Jaffrey. Areas closest to the encroaching suburban fringe have also seen the highest rates of traffic growth (see Chapter 2 for more information). The rest of the region, however, enjoys few traffic congestion problems. From 1995 to 2004, Average Annual Daily Traffic (AADT) for our roadways has grown at a modest pace:
Table 3 - Traffic Growth Rates Route % Annual
Traffic Growth 1995-2004
NH 9 1.23% NH 10 1.37% NH 101 0.55% NH 12 1.25% NH 119 1.29% US 202 2.50%
These numbers translate to about 100 to 250 additional vehicles per year using each roadway. In comparison, the Boston metropolitan area has seen steady annual traffic growths above 2% on roadways that carry 10 times the daily traffic of our region’s roadways.
Transportation Demand Management Trends: In the past, the influx of population was met with a parallel growth in new housing developments, more retail developments, and ultimately expansion of the transportation infrastructure to meet the new travel demand. The expansion of roads also had the side-effect of opening additional land for development and raising property values, resulting in more development. These trends have been mutually supportive, with public infrastructure investment in the form of roadway
Keene
Concord
Manchester
Albany
Boston
Keene
Concord
Manchester
Albany
Boston
Southwest Region Transportation Plan 2007 Update
8 SWRPC
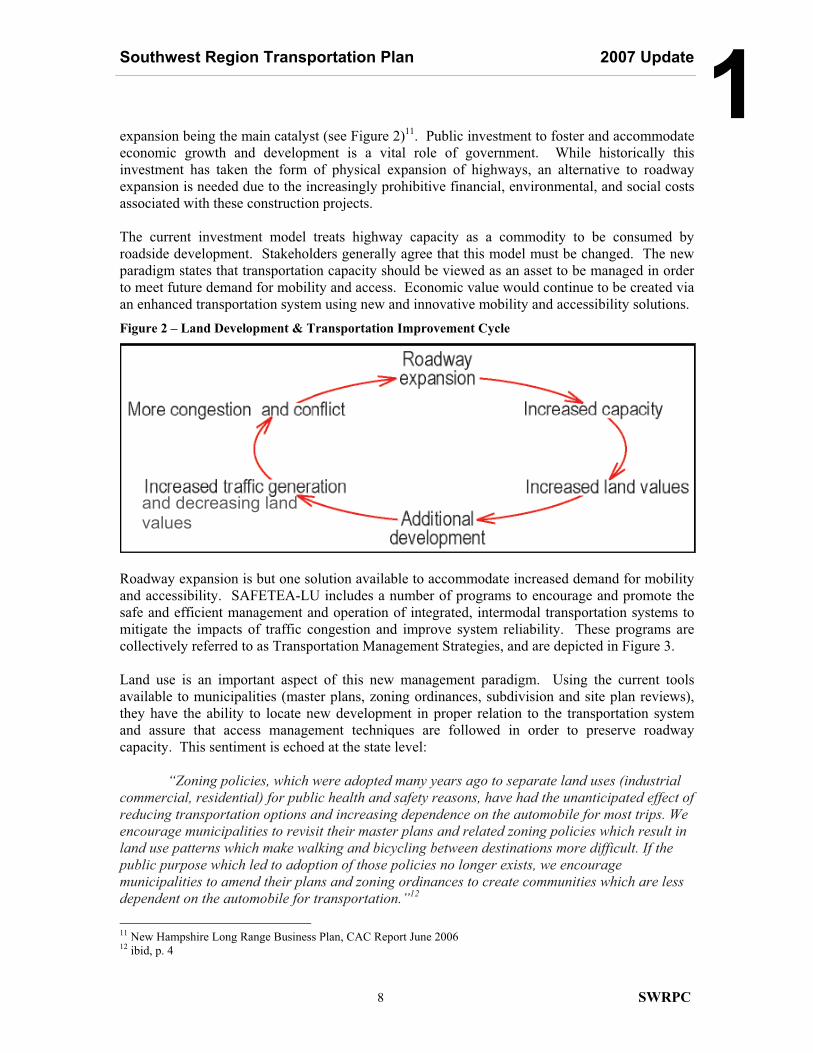
1expansion being the main catalyst (see Figure 2)11. Public investment to foster and accommodate economic growth and development is a vital role of government. While historically this investment has taken the form of physical expansion of highways, an alternative to roadway expansion is needed due to the increasingly prohibitive financial, environmental, and social costs associated with these construction projects. The current investment model treats highway capacity as a commodity to be consumed by roadside development. Stakeholders generally agree that this model must be changed. The new paradigm states that transportation capacity should be viewed as an asset to be managed in order to meet future demand for mobility and access. Economic value would continue to be created via an enhanced transportation system using new and innovative mobility and accessibility solutions. Figure 2 – Land Development & Transportation Improvement Cycle
Roadway expansion is but one solution available to accommodate increased demand for mobility and accessibility. SAFETEA-LU includes a number of programs to encourage and promote the safe and efficient management and operation of integrated, intermodal transportation systems to mitigate the impacts of traffic congestion and improve system reliability. These programs are collectively referred to as Transportation Management Strategies, and are depicted in Figure 3. Land use is an important aspect of this new management paradigm. Using the current tools available to municipalities (master plans, zoning ordinances, subdivision and site plan reviews), they have the ability to locate new development in proper relation to the transportation system and assure that access management techniques are followed in order to preserve roadway capacity. This sentiment is echoed at the state level:
“Zoning policies, which were adopted many years ago to separate land uses (industrial
commercial, residential) for public health and safety reasons, have had the unanticipated effect of reducing transportation options and increasing dependence on the automobile for most trips. We encourage municipalities to revisit their master plans and related zoning policies which result in land use patterns which make walking and bicycling between destinations more difficult. If the public purpose which led to adoption of those policies no longer exists, we encourage municipalities to amend their plans and zoning ordinances to create communities which are less dependent on the automobile for transportation.”12 11 New Hampshire Long Range Business Plan, CAC Report June 2006 12 ibid, p. 4
and decreasing land values
Southwest Region Transportation Plan 2007 Update
9 SWRPC
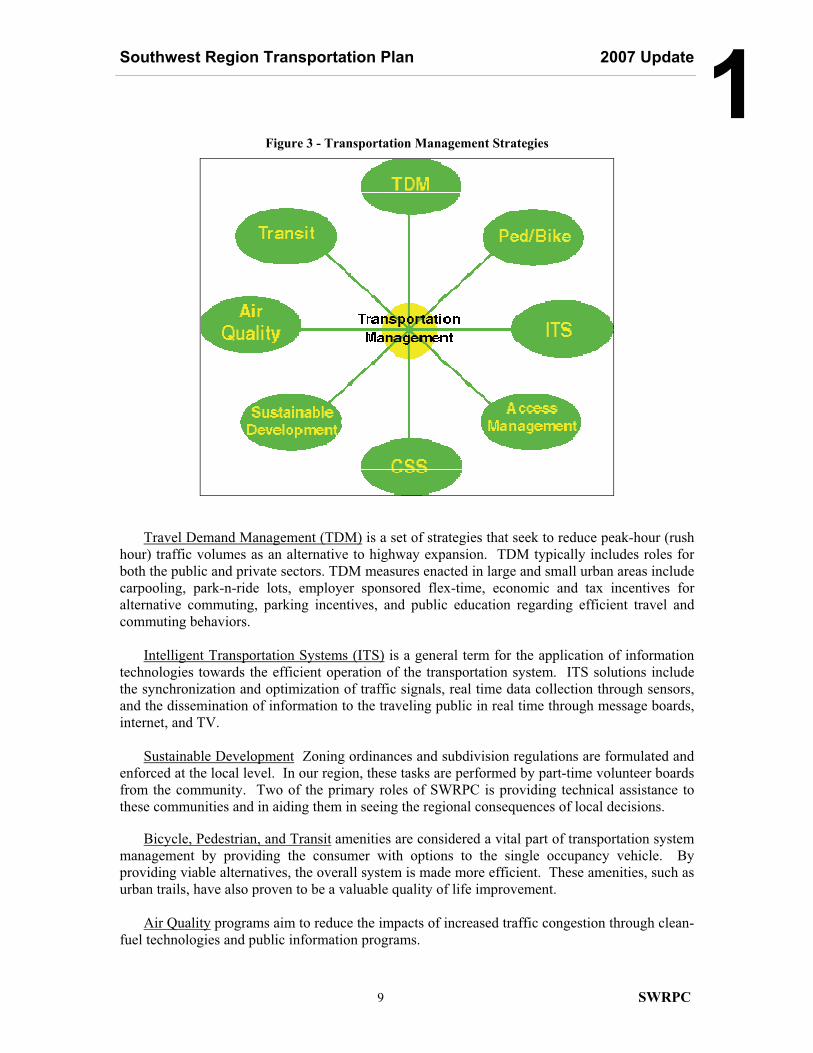
1Figure 3 - Transportation Management Strategies
Travel Demand Management (TDM) is a set of strategies that seek to reduce peak-hour (rush hour) traffic volumes as an alternative to highway expansion. TDM typically includes roles for both the public and private sectors. TDM measures enacted in large and small urban areas include carpooling, park-n-ride lots, employer sponsored flex-time, economic and tax incentives for alternative commuting, parking incentives, and public education regarding efficient travel and commuting behaviors.
Intelligent Transportation Systems (ITS) is a general term for the application of information
technologies towards the efficient operation of the transportation system. ITS solutions include the synchronization and optimization of traffic signals, real time data collection through sensors, and the dissemination of information to the traveling public in real time through message boards, internet, and TV.
Sustainable Development Zoning ordinances and subdivision regulations are formulated and
enforced at the local level. In our region, these tasks are performed by part-time volunteer boards from the community. Two of the primary roles of SWRPC is providing technical assistance to these communities and in aiding them in seeing the regional consequences of local decisions.
Bicycle, Pedestrian, and Transit amenities are considered a vital part of transportation system management by providing the consumer with options to the single occupancy vehicle. By providing viable alternatives, the overall system is made more efficient. These amenities, such as urban trails, have also proven to be a valuable quality of life improvement.
Air Quality programs aim to reduce the impacts of increased traffic congestion through clean-
fuel technologies and public information programs.
Southwest Region Transportation Plan 2007 Update
10 SWRPC
1Access Management is one tool that SWRPC has been developing for our local communities.
In cooperation with NH DOT, a Memorandum of Understanding (MOU) has been drafted, whereby NH DOT will not issue Highway Occupancy Permits (HOPs or Driveway Permits) to new developments on state highways without prior consultation with the local Planning Board. This MOU, in conjunction with sample ordinances dictating how to organize curb cuts in order to preserve arterial traffic flow, are sample land use tools that can make a difference at the local and regional level.
Context Sensitive Solutions (CSS) is a term used to describe the design process which ‘right-
sizes’ the transportation project to solve a transportation problem without destroying the socioeconomic context in which it is taking place. During this process, the local community and the DOT personnel work together to understand and conciliate the community’s livability needs versus the regional mobility needs. CSS is further defined in the Public Participation section below.
Level of Investment (LOI) is a term used to describe a matrix of optional investment strategies. Separate estimates of investment requirements for highways, bridges, and transit are generated for maintenance and improvement models and techniques. These Transportation Management strategies are often intertwined, since they all are components of the same transportation system. It is often the case where Sustainable Development includes aspects of Access Management and Bike, Pedestrian, and Transit amenities or where one project has elements of Air Quality, TDM, and Transit. These strategies should be thought of as a toolbox available to solve complex problems and compliment or enhance traditional roadway projects.
Transportation Planning Environment Providing public access to and between private properties, public services and commerce is a well-established public responsibility – the responsibility of federal, state and local government. This responsibility is predicated on the necessity for efficient movement of people and goods for our economic vitality, or more basically for the protection of health, safety and welfare of the public. Federal Policies Major maintenance and improvements to the state highway system are paid for by 20% state funds and 80% federal funds. As such, federal guidelines dictating project selection and program implementation take precedent. The watershed event in transportation planning was the federal legislation known as ISTEA (the Intermodal Surface Transportation Efficiency Act of 1991). This act instituted many of the public participation, environmental studies, and program development requirements which have made the transportation planning process more transparent. ISTEA was followed up and improved on by re-authorizing it as TEA-21 (the Transportation Equity Act of the 21st Century in 1998) and as SAFETEA-LU (the Safe, Accountable, Flexible, Efficient Transportation Equity, A Legacy for Users in 2005).
Southwest Region Transportation Plan 2007 Update
11 SWRPC
1The latest reauthorization (SAFETEA-LU Public Law 109-59, passed August 10, 2005) identifies challenges such as improving safety, reducing traffic congestion, improving efficiency in freight movement, increasing intermodal connectivity, and protecting the environment. It also acknowledges the profound influence transportation infrastructure (both its absence and presence) has on community development patterns and quality of life, and the intense competition for transportation funds. In short – federal policy has initiated a paradigm shift to arrest or mitigate the negative public effects of the transportation system. (Appendix A) SAFETEA-LU continues the requirement for the updating of transportation plans every 5 years. These long range plans should have at least a 20 year horizon, and must incorporate the following guiding factors:
1. Support the economic vitality of the metropolitan area, especially by enabling global competitiveness, productivity, and efficiency;
2. Increase the safety of the transportation system for motorized and non-motorized users;
3. Increase the security of the transportation system for motorized and non-motorized users;
4. Increase the accessibility and mobility of people and for freight;
5. Protect and enhance the environment, promote energy conservation, improve the quality
of life, and promote consistency between transportation improvements and State and local planned growth and economic development patterns;
6. Enhance the integration and connectivity of the transportation system, across and
between modes, for people and freight;
7. Promote efficient system management and operation, and;
8. Emphasize the preservation of the existing transportation system.
SAFETEA-LU further requires that the following plans be developed and implemented in order to receive special transportation funds:
� Strategic Highway Safety Plan (SHSP) should be developed at the state level. The plan must incorporate and analyze safety problems as identified in this Regional Transportation Plan.
� Coordinated Public Transit and Human Service Transportation Plan is required in order for projects and programs to receive funds from the three FTA formula programs (sections 5310, 5316 and 5317). Only projects arising from this plan are eligible to receive funding. The purpose of the Plan is to identify redundancies and gaps among public transportation and human services transportation providers (Providers) in the Southwest Region, and recommend strategies to eliminate or mitigate identified redundancies and gaps. The planning process will also foster change by bringing together Providers to share their experiences and needs, and otherwise promote improved coordination and efficiency in transportation service delivery.
Southwest Region Transportation Plan 2007 Update
12 SWRPC
1� SAFETEA-LU also expands on the emphasis to create congestion mitigation plans which
focus on operational and management practices, such as Travel Demand Management, in order to solve congestion issues in an alternative to construction projects.
State Policies Since the late 1980’s, the decision making process in NH has evolved to reflect changes to federal transportation legislation that governs the disbursement of federal funds to states. This has successfully transformed the process into a more balanced approach where political trends and traffic engineering goals are counterbalanced by community development issues Title 20 of the NH RSA defines the State’s powers and responsibilities for providing a transportation system. The Chapters of Title 20 include the authority by which the State lays out highways, regulates access to state highways, otherwise carries out maintenance of the state highway network, as well as facilities for air, rail, bicycle, and public transportation. (Appendix A) The New Hampshire Department of Transportation (NH DOT) is a vital partner in the planning and development of our region’s transportation system. NH DOT is directly responsible for upgrading, maintaining and operating state routes. NH DOT also advices and finances many of SWRPC’s transportation planning efforts, and both our staffs have developed a good institutional and professional relationships with each other. NH DOT provides guidance through its Long Range Transportation Business Plan. As of publication of this plan, the Statewide Long Range Transportation Business Plan has not been completed. Municipal Responsibilities State laws under Title 20 also prescribe municipal powers and responsibilities for municipal roads. Municipal land use control authority is linked with comprehensive community planning under NH RSA 674 regarding the powers and duties of municipal planning boards. The consideration of transportation in municipal master plans is explicit under 674:2:
“The master plan shall generally be comprised of a report or set of statements and land use and development proposals … to show as fully as is possible and practical the planning board’s recommendations for the desirable development of [the town].“ and “The master plan shall include ... the following sections … IV. A transportation section
showing the location and types of facilities for all modes of transportation required for the efficient movement of people and goods into, about, and through the municipality”.
This provision encourages equal attention to major community elements: land use, housing, transportation, public utilities and services, community facilities, recreation, and conservation of natural resources. Local transportation planning should be directly linked with future lands use plans, capital improvement programs, and economic development plans.
Southwest Region Transportation Plan 2007 Update
13 SWRPC
1Public Participation Public involvement in the decision making process is vital to achieving successful solutions to complex socio-economic problem such as modern transportation. For this reason, a thorough public participation methodology has been developed for all levels of project planning and development, and they have been codified into laws and policies. Visualization techniques, defined as techniques which make information more accessible and easier to understand, should be used to the maximum extent practicable. Transportation documents should be more illustrative and consumable to the average person. The effective presentation of plan information to the public is vital to conveying the true impacts transportation improvements will have on a community. Visualization techniques include: renderings, computer-generated simulations using photographs and video, and interactive GIS maps In SAFETEA-LU, public participation continues to be a keystone of the planning process. New language requires for consultation ‘‘as appropriate with State and local agencies responsible for land use management, natural resources, environmental protection, conservation, and historic preservation.’’13 Furthermore, an emphasis is placed on technology as a means of disseminating information. Transportation plans and listing of obligated and completed projects should be available through the internet as well as hard copy. The New Hampshire Department of Transportation has also embarked on a new philosophical approach to project development coined Context Sensitive Solutions (CSS). The end goal of the CSS process is to create projects that balance the needs of the transportation system with the environmental, social, economic and historical context in which the project takes place. CSS is a public facilitation process by which the affected community works cooperatively with transportation professionals from the outset of a project to its completion. The process is characterized by the following principles:
� Communication with all stakeholders is open, honest, early, and continuous. � A multidisciplinary team is established early, with disciplines based on the needs of the
specific project, and with the inclusion of the public. � A full range of stakeholders is involved with transportation officials in the scoping phase.
The purposes of the project and the scope are clearly defined before proceeding. � The highway development process is tailored to meet the circumstances. This process
should examine multiple alternatives that will result in a consensus of approach methods. � A commitment to the process from top agency officials and local leaders is secured. � The public involvement process, which includes informal meetings, is tailored to the
project. � The landscape, the community, and valued resources are understood before engineering
design is started. A full range of tools for communication about project alternatives is used (e.g., visualization).
NH DOT is committed to this new approach and has conducted a series of training seminars for DOT personnel as well as community participants and resource personnel. In the next 20 years, CSS will become a common place method by which transportation projects are developed. 13 (23 U.S.C. 134(i)(4) and 49 U.S.C. 5303(i)(4)).
Southwest Region Transportation Plan 2007 Update
14 SWRPC
1Transportation Improvement Program (TIP)
Federal law now requires states to maintain a schedule of federally-funded transportation projects covering a period of at least four-years. This Transportation Improvement Program must be updated at least every four years with a public planning process that includes consultation with local government and demonstrates conformity with national air quality standards and other requirements of SAFETEA-LU. Incidentally New Hampshire had established a ten-year program for transportation spending in 1987, which has been carried forward and updated pursuant to federal requirements. The Statewide Ten Year Transportation Improvement Program (TIP) schedules all projects on the State system (rail, public transportation, bicycle and pedestrian, highways and bridges) that use federal funds through a ten-year period in order of priority. The TIP may also present the scheduling of projects using non-federal funds, i.e. State and municipal funds. The State came to agreement in the early 1990’s that the Statewide TIP would begin with proposals from each regional planning commission – proposals developed in regional public processes. NH RSA Chapter 228:99 Statewide Transportation Planning and Improvement Program includes in paragraph I. “… Each metropolitan planning organization and rural regional planning commission shall provide a regional transportation improvement program (TIP) to the department of transportation no later than April 1 of each odd-numbered year.” (Figure 6) Planning continues in the implementation of the TIP through project development. Highly detailed conceptual design regarding roadway layout and right-of-way impacts but without engineering specifications of large infrastructure changes takes place in a public process. This process involves affected communities and citizens, NH DOT and other related agencies, such as regional planning commissions, US Army Corps of Engineers, U.S. Environmental Protection Agency, NH Fish and Game Department, NH Department of Environmental Services, and The NH State Historic Preservation Officer have formal roles in project development. (Appendix F) Today even final design, i.e. the preparation of construction plans, often includes public participation and feedback.

Southwest Region Transportation Plan 2007 Update
15 SWRPC
1Summary of Existing Conditions
Federal, state and local transportation planning at the beginning of the 21st Century collectively can be said to support (implicitly) the following policy guidance:
� Protect public safety and security on and off the system, for the traveling public and neighbors of the system;
� Preserve public and private investment in infrastructure, investment in commerce and
community design;
� Reduce motor vehicle emissions by reducing vehicle miles traveled and traffic congestion;
� Maximize mobility and access; minimize physical and socioeconomic barriers to access
and mobility; develop seamless integration of highway, pedestrian, public transportation, and bicycles facilities;
� Otherwise minimize environmental quality impacts including threats to ecological
integrity, human health (including psychological well-being), and cultural resources (including community character and historic resources); and
� Support community development needs/goals, such as may regard economic
redevelopment, economic expansion and local employment. Conflict between interest groups and even between public policies and administrative processes is not uncommon in a planning process attempting to simultaneously meet these criteria. Like most community planning and development, transportation planning must be a process of optimization – a process that may not allow realization of the maximum benefits of any of the criteria, but rather ensures that viable threshold states of all criteria are attained. Identifying or quantifying the threshold states of each criterion can be elusive but, and as is the strength of American democracy, it is also dynamic and able to adjust to changing needs of society. Of equal importance is the matter that the transportation system is only one element of community and must be managed in a process that is sensitive to all matters of community life. There is ongoing debate about the role of transportation in community development or, more pointedly, as a limiting factor in population and economic growth. At the federal level, TEA-21 is plain: “It is in the national interest to encourage and promote safe and efficient management, operation, and development of surface transportation systems that will serve the mobility needs of people and freight and foster economic growth and development…” (Section 1204. (a) ``(a) ``(1)). New Hampshire laws do not establish a connection between the administrative powers and processes for developing and managing a transportation system and the public benefits of the system. In the absence of explicit state guidance on the matter, the municipal planning process for establishing priorities and visions for future conditions, when carried out on a regional scale for the TIP, is the basis for a statewide plan. That begins as an assemblage of regional TIPs
Southwest Region Transportation Plan 2007 Update
16 SWRPC
1which is in turn subject to consideration and possibly revision by the NH DOT, Governor and Executive Council and the General Court. The federal policies that require state transportation planning to reduce motor vehicle emissions, improve the efficiency of existing system, enhance modes other than private motor vehicles on highways, and rely on community-based statewide planning have become the guidance for regional transportation planning. SWRPC’s transportation planning integrates these national policies in a regional community planning process. The Planning Commission’s planning process strives to design a transportation system that is responsive to community needs of today and the foreseeable future, pursuant to the six policy guidance items on the preceding page. The process begins with research of travel behavior, transportation infrastructure and other public infrastructure, socio-economic trends, natural and cultural resources, and public policy. It must be acknowledged that the availability of information in these subject areas at uniform levels of resolution and reliability is highly variable. While the Planning Commission relies heavily on data originated by state and federal agencies, the transportation planning work program continues to build in-house research and analysis capabilities to better understand conditions and trends of the past, present and near future. The SWRPC Geographic Information System is the principal information management and analysis medium. The findings of research and analysis are used in a community involvement process through the auspices of the SWRPC Transportation Advisory Committee and Board of Directors through local officials, e.g. Selectmen, Planning boards, Conservation Commissions, Road Agents and Police Chiefs. The Planning Commission’s process is consensus-based and seeks to build commitment to long-term goals to guide the biennial priority setting in the Southwest Region TIP, much as a regional capital improvement program.
Southwest Region Transportation Plan 2007 Update
SWRPC 17
2Southwest Region Transportation System � Roads and Highways
o Classification Systems o State Highway Management o System Performance Measurements and Management o Municipal Road System
� Other Modes of Transportation o Air Transportation o Rail o Freight o Pedestrian and Bicycle o Public Transportation
� Development Trends & Land Use Patterns � SWRPC Regional Transportation Planning Program
Roads and Highways Personal and commercial transportation in Southwest New Hampshire is primarily accomplished by individual vehicles traveling through the network of state highways and local roadways. As such, the bulk of funding and effort is targeted at evaluating, funding, maintaining, and expanding/modernizing this network.
Classification Systems The physical and performance characteristics of a roadway are best described through a system of classifications. In this matter, highways can easily be distinguished by purpose, ownership, funding, and engineering categories. The following descriptions and corresponding maps depict the highway network in terms of functional classifications, state classifications, ownership, and whether it is part of the National Highway System. Functional Classification As the name implies, this classification describes a roadway’s function from the perspective of the type of service they are intended to provide or purpose they serve within the highway network (see Map 2). The functional system hierarchy consists of two categories - Rural Areas and Urban Areas - classified as follows: Rural Areas: � Principal Arterial - Interstate: high volume roadway primarily serving Statewide and
Interstate travel. � Other Principal Arterial: travel between cities and towns. � Minor Arterial: alternative links between cities and towns. � Major Collector: access between local centers, serving as traffic generators to institutional,
commercial and residential uses. � Minor Collector: alternative routes to major collectors and access to individual properties. � Local: access to individual residential and commercial uses.
Southwest Region Transportation Plan 2007 Update
SWRPC 18
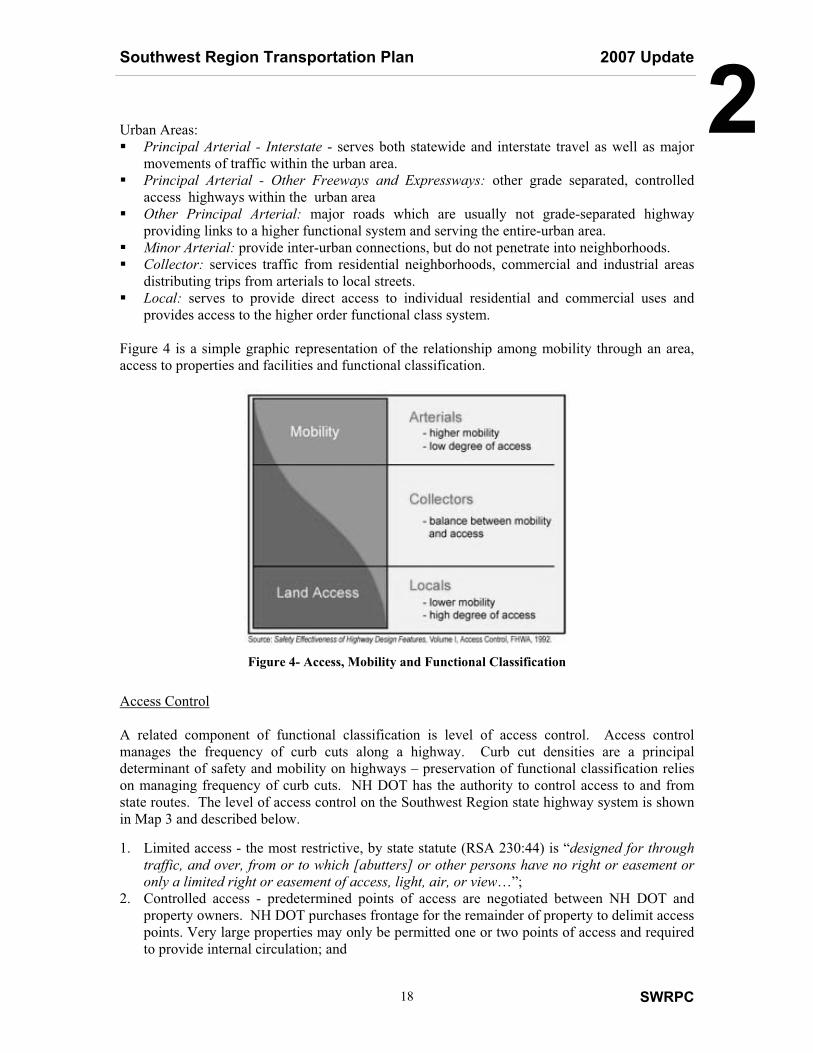
2Urban Areas: � Principal Arterial - Interstate - serves both statewide and interstate travel as well as major
movements of traffic within the urban area. � Principal Arterial - Other Freeways and Expressways: other grade separated, controlled
access highways within the urban area � Other Principal Arterial: major roads which are usually not grade-separated highway
providing links to a higher functional system and serving the entire-urban area. � Minor Arterial: provide inter-urban connections, but do not penetrate into neighborhoods. � Collector: services traffic from residential neighborhoods, commercial and industrial areas
distributing trips from arterials to local streets. � Local: serves to provide direct access to individual residential and commercial uses and
provides access to the higher order functional class system. Figure 4 is a simple graphic representation of the relationship among mobility through an area, access to properties and facilities and functional classification.
Figure 4- Access, Mobility and Functional Classification
Access Control A related component of functional classification is level of access control. Access control manages the frequency of curb cuts along a highway. Curb cut densities are a principal determinant of safety and mobility on highways – preservation of functional classification relies on managing frequency of curb cuts. NH DOT has the authority to control access to and from state routes. The level of access control on the Southwest Region state highway system is shown in Map 3 and described below. 1. Limited access - the most restrictive, by state statute (RSA 230:44) is “designed for through
traffic, and over, from or to which [abutters] or other persons have no right or easement or only a limited right or easement of access, light, air, or view…”;
2. Controlled access - predetermined points of access are negotiated between NH DOT and property owners. NH DOT purchases frontage for the remainder of property to delimit access points. Very large properties may only be permitted one or two points of access and required to provide internal circulation; and
Southwest Region Transportation Plan 2007 Update
SWRPC 19
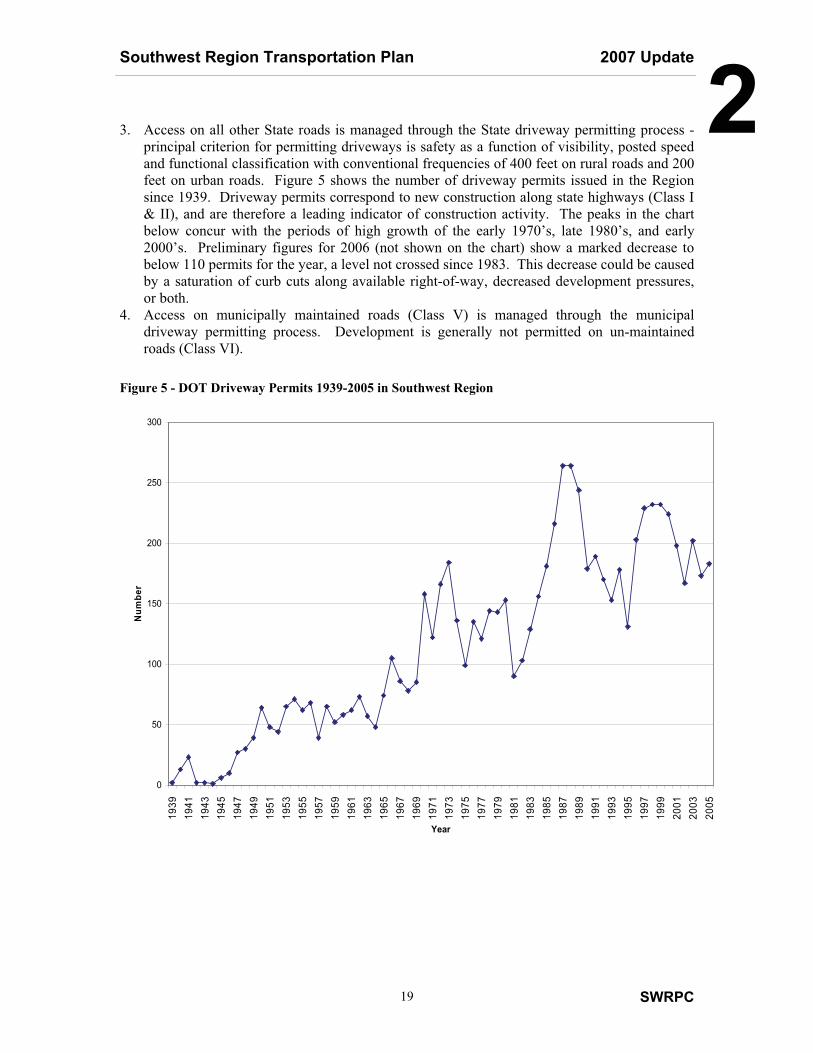
23. Access on all other State roads is managed through the State driveway permitting process -principal criterion for permitting driveways is safety as a function of visibility, posted speed and functional classification with conventional frequencies of 400 feet on rural roads and 200 feet on urban roads. Figure 5 shows the number of driveway permits issued in the Region since 1939. Driveway permits correspond to new construction along state highways (Class I & II), and are therefore a leading indicator of construction activity. The peaks in the chart below concur with the periods of high growth of the early 1970’s, late 1980’s, and early 2000’s. Preliminary figures for 2006 (not shown on the chart) show a marked decrease to below 110 permits for the year, a level not crossed since 1983. This decrease could be caused by a saturation of curb cuts along available right-of-way, decreased development pressures, or both.
4. Access on municipally maintained roads (Class V) is managed through the municipal driveway permitting process. Development is generally not permitted on un-maintained roads (Class VI).
Figure 5 - DOT Driveway Permits 1939-2005 in Southwest Region
0
50
100
150
200
250
300
1939
1941
1943
1945
1947
1949
1951
1953
1955
1957
1959
1961
1963
1965
1967
1969
1971
1973
1975
1977
1979
1981
1983
1985
1987
1989
1991
1993
1995
1997
1999
2001
2003
2005
Year
Num
ber
Southwest Region Transportation Plan 2007 Update
SWRPC 20
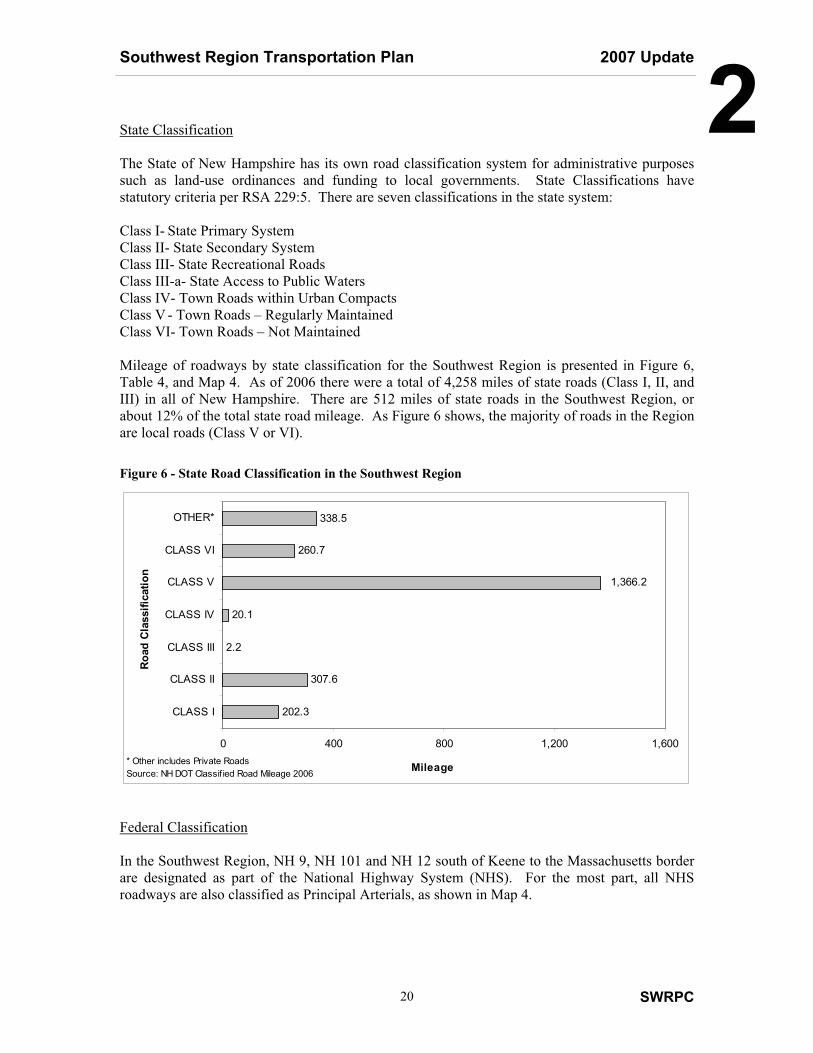
2State Classification The State of New Hampshire has its own road classification system for administrative purposes such as land-use ordinances and funding to local governments. State Classifications have statutory criteria per RSA 229:5. There are seven classifications in the state system: Class I- State Primary System Class II- State Secondary System Class III- State Recreational Roads Class III-a- State Access to Public Waters Class IV- Town Roads within Urban Compacts Class V - Town Roads – Regularly Maintained Class VI- Town Roads – Not Maintained Mileage of roadways by state classification for the Southwest Region is presented in Figure 6, Table 4, and Map 4. As of 2006 there were a total of 4,258 miles of state roads (Class I, II, and III) in all of New Hampshire. There are 512 miles of state roads in the Southwest Region, or about 12% of the total state road mileage. As Figure 6 shows, the majority of roads in the Region are local roads (Class V or VI). Figure 6 - State Road Classification in the Southwest Region
202.3
307.6
2.2
20.1
260.7
338.5
1,366.2
0 400 800 1,200 1,600
CLASS I
CLASS II
CLASS III
CLASS IV
CLASS V
CLASS VI
OTHER*
Roa
d C
lass
ifica
tion
Mileage* Other includes Private RoadsSource: NH DOT Classif ied Road Mileage 2006
Federal Classification In the Southwest Region, NH 9, NH 101 and NH 12 south of Keene to the Massachusetts border are designated as part of the National Highway System (NHS). For the most part, all NHS roadways are also classified as Principal Arterials, as shown in Map 4.
Southwest Region Transportation Plan 2007 Update
SWRPC 21
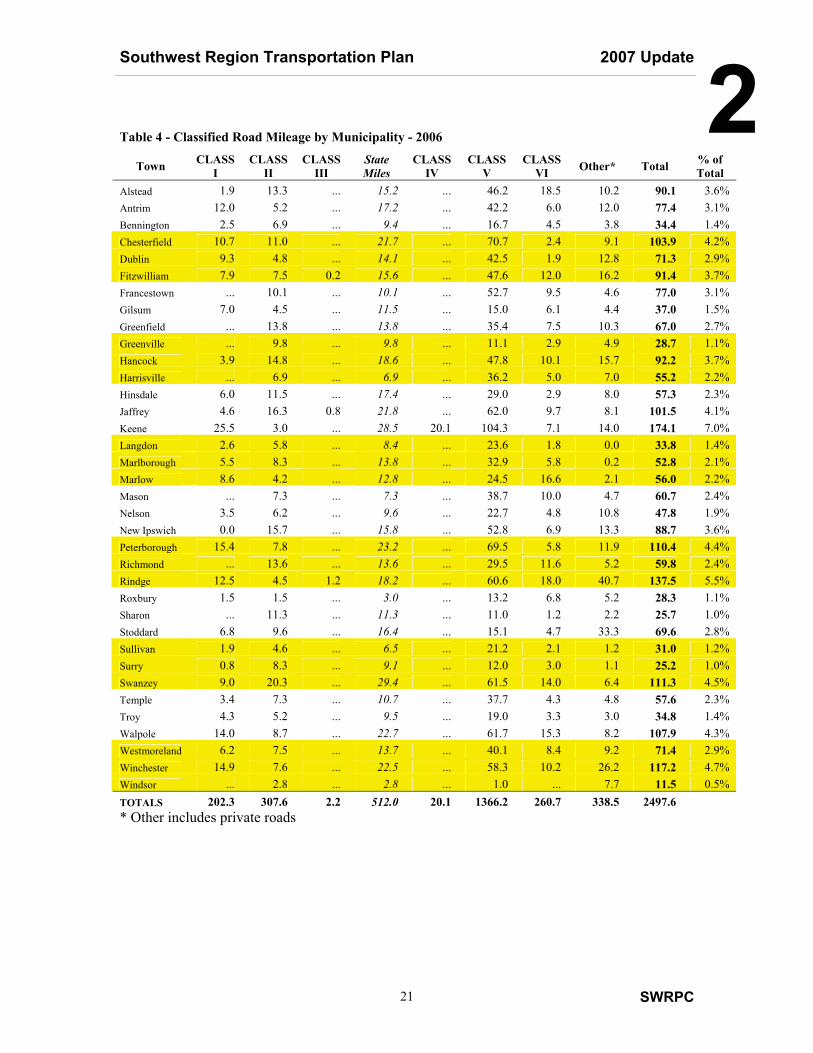
2Table 4 - Classified Road Mileage by Municipality - 2006
Town CLASS I
CLASS II
CLASS III
State Miles
CLASS IV
CLASS V
CLASS VI Other* Total % of
Total Alstead 1.9 13.3 ... 15.2 ... 46.2 18.5 10.2 90.1 3.6% Antrim 12.0 5.2 ... 17.2 ... 42.2 6.0 12.0 77.4 3.1% Bennington 2.5 6.9 ... 9.4 ... 16.7 4.5 3.8 34.4 1.4% Chesterfield 10.7 11.0 ... 21.7 ... 70.7 2.4 9.1 103.9 4.2% Dublin 9.3 4.8 ... 14.1 ... 42.5 1.9 12.8 71.3 2.9% Fitzwilliam 7.9 7.5 0.2 15.6 ... 47.6 12.0 16.2 91.4 3.7% Francestown ... 10.1 ... 10.1 ... 52.7 9.5 4.6 77.0 3.1% Gilsum 7.0 4.5 ... 11.5 ... 15.0 6.1 4.4 37.0 1.5% Greenfield ... 13.8 ... 13.8 ... 35.4 7.5 10.3 67.0 2.7% Greenville ... 9.8 ... 9.8 ... 11.1 2.9 4.9 28.7 1.1% Hancock 3.9 14.8 ... 18.6 ... 47.8 10.1 15.7 92.2 3.7% Harrisville ... 6.9 ... 6.9 ... 36.2 5.0 7.0 55.2 2.2% Hinsdale 6.0 11.5 ... 17.4 ... 29.0 2.9 8.0 57.3 2.3% Jaffrey 4.6 16.3 0.8 21.8 ... 62.0 9.7 8.1 101.5 4.1% Keene 25.5 3.0 ... 28.5 20.1 104.3 7.1 14.0 174.1 7.0% Langdon 2.6 5.8 ... 8.4 ... 23.6 1.8 0.0 33.8 1.4% Marlborough 5.5 8.3 ... 13.8 ... 32.9 5.8 0.2 52.8 2.1% Marlow 8.6 4.2 ... 12.8 ... 24.5 16.6 2.1 56.0 2.2% Mason ... 7.3 ... 7.3 ... 38.7 10.0 4.7 60.7 2.4% Nelson 3.5 6.2 ... 9.6 ... 22.7 4.8 10.8 47.8 1.9% New Ipswich 0.0 15.7 ... 15.8 ... 52.8 6.9 13.3 88.7 3.6% Peterborough 15.4 7.8 ... 23.2 ... 69.5 5.8 11.9 110.4 4.4% Richmond ... 13.6 ... 13.6 ... 29.5 11.6 5.2 59.8 2.4% Rindge 12.5 4.5 1.2 18.2 ... 60.6 18.0 40.7 137.5 5.5% Roxbury 1.5 1.5 ... 3.0 ... 13.2 6.8 5.2 28.3 1.1% Sharon ... 11.3 ... 11.3 ... 11.0 1.2 2.2 25.7 1.0% Stoddard 6.8 9.6 ... 16.4 ... 15.1 4.7 33.3 69.6 2.8% Sullivan 1.9 4.6 ... 6.5 ... 21.2 2.1 1.2 31.0 1.2% Surry 0.8 8.3 ... 9.1 ... 12.0 3.0 1.1 25.2 1.0% Swanzey 9.0 20.3 ... 29.4 ... 61.5 14.0 6.4 111.3 4.5% Temple 3.4 7.3 ... 10.7 ... 37.7 4.3 4.8 57.6 2.3% Troy 4.3 5.2 ... 9.5 ... 19.0 3.3 3.0 34.8 1.4% Walpole 14.0 8.7 ... 22.7 ... 61.7 15.3 8.2 107.9 4.3% Westmoreland 6.2 7.5 ... 13.7 ... 40.1 8.4 9.2 71.4 2.9% Winchester 14.9 7.6 ... 22.5 ... 58.3 10.2 26.2 117.2 4.7% Windsor ... 2.8 ... 2.8 ... 1.0 ... 7.7 11.5 0.5% TOTALS 202.3 307.6 2.2 512.0 20.1 1366.2 260.7 338.5 2497.6 * Other includes private roads
Southwest Region Transportation Plan 2007 Update
SWRPC 22
2State Highway Management NH Department of Transportation’s general functions, as provided in NH RSA:21-L, are: � Planning, developing, and maintaining a state transportation network which will provide for
safe and convenient movement of people and goods throughout the state by means of a system of highways, railroads, air service, mass transit, and other practicable modes of transportation in order to support state growth and economic development and promote the general welfare of the citizens of the state
� Developing and maintaining state owned land and buildings, except as otherwise provided by
law, and cooperating with the Department of Administrative Services in preparing a long-range state capital improvements plan
� Performing any regulation of transportation activities required by law which is not within the
jurisdiction of another state agency Long Range Statewide Transportation Plan NHDOT is currently developing a long-range (25 year horizon) Transportation Business Plan to set a strategic direction for future investments and policies. The overall vision preliminarily appears to be to transform the department from an infrastructure building emphasis into a more management, maintenance and operations role. This new management approach will require a new business plan, complete with a vision, goals, objectives, and performance measurements. NHDOT will of course still build roads, but the process by which projects are chosen, designed and built, will be a more inclusive and context oriented approach to assure that community character and environmental concerns are appropriately addressed in order to provide Context Sensitive Solutions to our state’s transportation needs. For more information please visit: www.NHTranPlan.com New Hampshire’s last Long Range Statewide Transportation Plan was developed in 1995 by NH DOT in a public process as required by the Intermodal Surface Transportation Efficiency Act of 1991 (ISTEA). The 1995 Long Range Statewide Transportation Plan was based on a 1993 report Transportation in the 21st Century. The 21st Century Transportation Task Force, created by the legislature, identified an efficient and effective transportation system as essential for economic prosperity, but found the State’s system incomplete. The Task Force recommended State resources be directed to repairing the existing network, creating new alternatives to the single-occupancy motor vehicle, and forging new working partnerships for change. The Plan articulates the State’s transportation goals and initiatives and as such serves as the guide for developing the State’s Ten Year Transportation Improvement Program. Through ratification of the Plan, NH DOT is committed to:
1. maintaining, enhancing and managing the existing highway network; 2. fostering an interactive and cooperative approach to integrating land use and
transportation planning initiatives; 3. improving the safety of the traveling public; 4. increasing the availability of transportation options and connectivity; 5. developing an intermodal transportation system;
Southwest Region Transportation Plan 2007 Update
SWRPC 23
26. promoting the judicious use of financial resources to enhance the intermodal transportation system, and
7. establishing public education programs. The Plan further commits the State to
� enhancing the role of the public and regional planning commissions in transportation planning,
� developing effective transportation management and monitoring systems, and � practicing financial constraint in decision-making.
NH DOT Commissioner Murray convened a Citizen Advisory Committee (CAC) in 2004 to assist the Department in the development of the Long Range Transportation Business Plan. In March 2006, the CAC released its report after 13 public meetings held throughout the state. The findings are as follows:
� Traditional capacity addition projects will not be sufficient to meet increased demand due to financial, environmental, and institutional constraints;
� A growing percentage of citizens do not drive and lack the adequate transportation services to maintain their levels of mobility;
� Transportation costs are increasingly taking a bigger percentage of household’s budgets; � Freight traffic is growing; � The present transportation funding structure cannot meet these needs.
The CAC further concluded that unless a change in the approach to how NH DOT conducts its business, the transportation network will not be able to meet future growth. Governor’s Advisory Commission on Highways In 1985 New Hampshire’s Governor Sununu established the Governor’s Advisory Commission on Highways by Executive Order 85-3. The Commission was given the responsibility of determining whether additional measures or legislative action is required to meet the needs for highway design and construction within the state. The Commission used their analyses to develop the State’s first ten-year highway project plan. The plan scheduled transportation projects over a ten year period in order of priority and served as the basis of state highway budgeting for the decade. The State’s ten-year highway project plans were developed in this manner until the passage of ISTEA in 1991. In 1992 the legislature continued the ten-year plan with the establishment of the two-year planning cycle in compliance with ISTEA (see “Federal Aid and Transportation Improvement Program” above). In 1994 the Governor’s Advisory Commission on Highways was renamed the Governor’s Advisory Commission on Intermodal Transportation (GACIT) in keeping with the intermodal goals of ISTEA and later TEA-21.
Southwest Region Transportation Plan 2007 Update
SWRPC 24
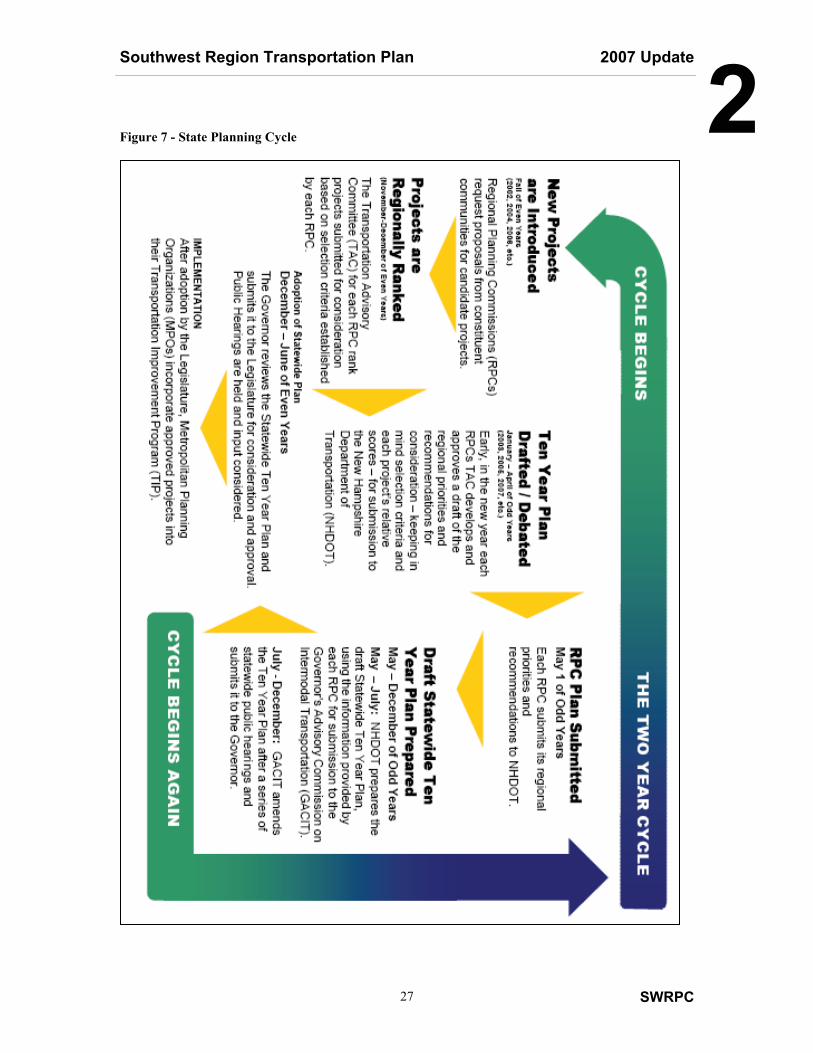
2Federal-Aid14 and the Transportation Improvement Program Federal transportation funding is disbursed to the states under the federal authorizing legislation entitled the Safe, Accountable, Flexible, Efficient Transportation Equity Act - A Legacy for Users (SAFETEA-LU). To receive federal transportation funding, SAFETEA-LU requires that each state maintain a long-term Transportation Improvement Program (TIP) which schedules all federally-funded transportation projects (and spending) in order of priority. The TIP must demonstrate action to reduce emissions, increase intermodalism and affect system management for efficiency, and the TIP must be developed through a public planning process that includes consultation with local government and participation from the public. The State came to agreement in the early 1990’s that the Statewide TIP would begin with proposals from each regional planning commission - proposals developed in regional public processes. NH RSA Chapter 228:99 Statewide Transportation Planning and Improvement Program includes in paragraph I. “… Each metropolitan planning organization and rural regional planning commission shall provide a regional transportation improvement program (TIP) to the department of transportation no later than April 1 of each odd-numbered year.” (Figure 7) In New Hampshire, the statewide community-based TIP planning process begins during the summer of each even-numbered year. New Hampshire’s nine regional planning commissions accept and develop proposals for new or revised projects within their regions. Proposed projects are evaluated by criteria developed by each regional planning commission to establish priorities for inclusion and funding in the TIP. (Appendix C) TIP projects in the Southwest Region originate with local officials, the Commission’s Transportation Advisory Committee, and NH DOT District 4 engineers. The Planning Commission’s Transportation Advisory Committee and staff compile proposals for new or revised projects into a ten-year schedule of projects. Proposals for new projects are evaluated by the Commission’s Transportation Advisory Committee and ranked for funding priority using criteria of public safety, highway capacity preservation, local support, and regional benefits. Following public review and comment, the draft is finalized by the Commission’s Board of Directors for submittal to the NH Department of Transportation. The Regional TIPs are submitted to NH DOT as recommendations for the Statewide TIP. In turn, NH DOT collates the Regional TIPs, culling lower priority projects as may be necessary to develop the TIP within expected funding levels, and adding projects developed by NH DOT which may not have been identified by the Regions. The resulting Draft Statewide 10-year TIP undergoes public review by way of public hearings held by the Governor’s Advisory Commission on Intermodal Transportation (GACIT - the Executive Council and Commissioner of NH DOT). With or without modification by GACIT, the draft is reviewed by the Governor and in turn recommended to the legislature with a request for approval for State funding. Ideally, the Statewide TIP identifies the State’s long-term transportation improvement priorities for the federal-aid infrastructure.
14 Federal-aid system is the portion of roads and bridges principally of the “Arterial” functional classification, being deemed of interstate importance that are eligible for federal funding for maintenance and improvement at a ratio of no more than 80% federal funding for the total cost of the project and the remainder being State or, infrequently, municipal funds.
Southwest Region Transportation Plan 2007 Update
SWRPC 25
2The State continues this two-year evaluation and planning cycle, however re-evaluation of the funds available to New Hampshire in recent and coming years has led to a need to restrict the addition of new projects to the TYP. New Hampshire’s 2006 legislation, which enacted the latest TYP for the years 2007 through 2016, establishes the State’s current approach: “The general court understands that the revenue projected for the plan period 2007-2016 is inadequate to fund all the projects in the plan. Without additional projects, it is estimated that with revenue increases at $5 million per year, the plan will take approximately 14 years to complete, excluding consideration of inflation on the cost of the projects. In passing this plan, it is the general court’s intent to review the plan every 2 years, pursuant to RSA 228:99 and RSA 240, but not to add projects, except for emergencies, until the funding is adequate to bring the plan within a projected 10-year completion framework.” In addition to roadway projects, NH DOT and the Commission work together to select and program transportation related enhancements under the following programs:
Transportation Enhancements (TE) - These projects are intended to provide for amenities such as trails, transportation museums, scenic areas, and other non-roadway related activities. Funding for TE projects are derived from a 10% set-aside of each state’s Surface Transportation Program funds (STP). The federal government pays for 80% of project costs. Due to the large demand for TE funds, NH DOT has declared a moratorium on funding new projects until 2009.
Congestion Mitigation and Air Quality (CMAQ) - These funds are to be used for projects
that help to alleviate poor air quality due to transportation vehicles. The federal government pays for 80% of these projects, 90% if on the interstate system, and 100% if they are for traffic signals. The Region is not eligible for these funds since we do not have an air quality problem.
Safe Routes to School - This is a new program under SAFETEA-LU. This is a 100% federally funded project, and is intended to enable and encourage children, including those with disabilities, to walk and bicycle to school; to make walking and bicycling to school safe and more appealing; and to facilitate the planning, development and implementation of projects that will improve safety, and reduce traffic, fuel consumption, and air pollution in the vicinity of schools. New Hampshire has not yet started this program at time of publication of this report. While the TIP is intended to be a schedule of projects that are eligible for federal funding, the Commission’s submittal to the Department of Transportation typically includes recommendation of projects eligible for state funds under the State-Aid and Betterment programs, as well. State-Aid The State-Aid program funds the reconstruction and rehabilitation of bridges and highways on the state system other than the federal-aid system as requested by municipalities. Municipal applications for State-Aid projects are selected on a competitive first come first serve basis -outside the TIP process. The State funds two thirds of the total project cost for highway projects and the municipality is responsible for the remaining cost. The State funds 80% of the cost of bridge projects and the municipality is responsible for the remainder. Variations on these ratios have been negotiated in the past. Municipalities have the option to manage their State Aid projects if they have the resources to do so. Municipal management offers a high level of local control over the project and may possibly expedite project completion.
Southwest Region Transportation Plan 2007 Update
SWRPC 26
2Approved projects are inserted in the State’s TIP. State Aid projects and spending in the Southwest Region are presented in Table 8. State Aid to municipalities for the construction and maintenance of town roads (Class IV and V roads) is allocated through annual Block Grants. These monies are distributed to towns based on formulas accounting for Class IV and V mileage and percent of state population and Class IV or V mileage. (Table 6) Road mileage is determined through roadway inventory conducted for each town by the Regional planning commissions. Maintenance Districts and the Betterment Program NH DOT Bureau of Highway Maintenance is responsible for routine maintenance of the state highway system. This responsibility is administered through the State’s six Maintenance District Offices. The Southwest Region is served by Maintenance District #4, from its headquarters on Base Hill Road in Swanzey. There are also twelve NH DOT District #4 “Patrol Sections” throughout the Region – each comprising two snow plows/dump trucks, miscellaneous equipment and sand/salt supply for summer and winter maintenance. Operational responsibilities of District 4 include winter maintenance (snow removal and ice control) and summer maintenance (annual pavement-resurfacing program, ditching operations, guardrail replacement, roadside mowing and tree removal, and culvert repair). The District’s administrative tasks include managing access to the highway system through the driveway permitting process, licensing the placement of utility poles within the State right-of-way, supervising the Adopt-a-Highway program, and regulating the placement of signs or other obstructions within the State right-of-way. The Districts also implement the Betterment Program for small roadway improvement projects. Betterment funds are 100% State funds allocated to Districts by the Bureau of Highway Maintenance. Betterment projects typically involve guard rail replacements or small road reconstruction for safety or maintenance improvements. These projects are developed by District Engineers and the Bureau, often at the request of the public or local officials. Betterment projects can be defined and funded within two or three years - independently of the TIP or State-Aid programs.
Southwest Region Transportation Plan 2007 Update
SWRPC 27
2Figure 7 - State Planning Cycle
Southwest Region Transportation Plan 2007 Update
SWRPC 28
2Scenic Byways The Scenic Byways program was established under the Intermodal Surface Transportation Efficiency Act of 1991 and continued under TEA-21 and SAFETEA-LU. It has both Federal and State components. The purpose of the program is to recognize and protect highway corridors that display outstanding scenic, historic, recreational, cultural, archaeological and/or natural qualities. Designation of a highway corridor as a scenic byway provides corridor municipalities with resources for protecting, enhancing, and managing byway assets. Benefits include enhanced eligibility for federal and state funding for highway improvement projects, bicycle/pedestrian projects, and certain federal community development and economic development programs. The competitive program requires corridor communities to submit a Scenic Byways application and demonstrate local support for the designation. Successful applicants must develop a Corridor Management Plan which 1) demonstrates local commitment, 2) articulates their goals and objectives for managing the intrinsic qualities of the corridor, and 3) outlines a schedule of responsibilities, description of enforcement and review mechanisms. New Hampshire’s scenic byway program is administered jointly by NH DOT and the Office of State Planning. Designated Scenic Byways in the Southwest Region include 1) NH 9 from Antrim/ Hillsborough town line (originating in Concord, NH) to NH 123 in Stoddard, 2) NH 12A Langdon/Charlestown town line to NH 123 in Alstead, and 3) NH 123 from NH 9 in Stoddard to NH 12A in Alstead.
System Performance Measurements and Management NH DOT designed and operates five management and monitoring systems to research and monitor the performance and conditions of New Hampshire’s transportation infrastructure. The products of the management systems are used by the Department of Transportation and the Regional planning commissions to support development of maintenance programs and projects for inclusion in State Aid Programs and the Ten Year Transportation Program. These management systems include:
� Traffic Research � Safety Management System � Pavement Condition � Bridge Condition � Public Transportation and Intermodalism
Traffic Research Each year, SWRPC, in partnership with NH DOT, conducts a program of traffic research during which Automatic Traffic Recorders (ATR) are set out on area roadways. These machines are attached to pneumatic tubes stretched across the pavement. ATRs can collect data such as the number of vehicles, the type of vehicle (class), its speed and direction. ATRs are set out on a rotating schedule so that every location is analyzed at least once every three years. Additionally, NH DOT has permanent counting stations throughout the area, which consists of detectors imbedded into the pavement which collect data continuously. SWRPC typically collects 7-day counts at one third of the 335 locations in the Southwest Region each year. (Map 6)
Southwest Region Transportation Plan 2007 Update
SWRPC 29
2Traffic data collected at counter stations are reported in terms of average annual daily traffic (AADT) and are used to gain an understanding of travel demand in the Region. This data is the main tool for gauging how travel patterns change throughout time. Traffic data from all counters are published by NH DOT in an annual traffic volume report; data from permanent counter locations are published monthly in NH DOT’s Automatic Traffic Recorder Reports. NH DOT uses the traffic volume data to monitor traffic congestion on state highways. Level of Service maps are created for the state highways by comparing the observed volume of traffic on the roadway to the roadway’s theoretical capacity. Using “weekday PM peak hour” traffic volumes, Level of Service maps characterize highway segments as “free flow” (no delays, no restrictions to travel at the speed limit), “stable flow with some restricted flow”, or “forced flow” (bumper-to-bumper, or stop-and-go traffic). (Map 7) Highway segments exhibiting restricted flow or forced flow are considered problem areas in need of further study. NH DOT also maintains a Statewide Transportation Model. The Model, administered through the Bureau of Transportation Planning, is used to project traffic growth and provide insight into the effectiveness of transportation alternatives in meeting future traffic demands. Travel demand in the Region has been increasing since the 1980s, as evidenced by the steady growth in annual average daily traffic on the Region’s principal highway corridors and minor arterials (NH routes 9, 10, 12, 101, 119 and US 202) as shown in Figures 8 and 9. Annual traffic growth for the period 1995-2004 on these principal highway corridors is varied, and ranges from negative growth of -2.25% on NH 119 at the Vermont SL to 4.21% per year on US 202 at the Mass. SL, with the most significant growth occurring within the US 202, NH 119, NH 12 and NH 9 corridors (Table 5). Average traffic volumes from 2000 to 2004 in the four Southwest Region population centers of Jaffrey, Keene, Peterborough and Rindge are displayed in Figures 10-13. The main areas of congestion are in the areas with high concentrations of destinations and where major routes meet. These areas are limited to Keene, Jaffrey, and Peterborough, as depicted on Map 7. Capacity analysis is used to examine the capacity of a facility during the peak a.m. and p.m. period of traffic and is reported in terms of Level of Service. Level of Service (LOS) is reported on a scale from A to F indicating delay time. Roadways and intersections are typically designed to operate at a LOS D or above. The method for estimating capacity differs for intersections (signalized and un-signalized) and roadway segments. Intersection capacity analyses are based on turning movement data. Capacity analysis at an un-signalized intersection is defined in terms of average total delay per vehicle and reported as LOS. Volume to capacity (v/c) ratios are examined in addition to LOS when evaluating the operation of signalized intersections. The v/c ratio, which represents the ratio of traffic volume to the physical capacity of the intersection, is calculated for each lane of an intersection. The closer the v/c ratio is to 1.0, the nearer the lane is to capacity. Capacity analyses have been conducted for several major intersections as part of various corridor studies. Determining capacity for two-lane highways is complex as capacity varies with terrain and passing restrictions. With the exception of NH 101 from Keene to Marlborough and from Grove St. to NH 123 in Peterborough, NH 10 from Keene to Base Hill Road in Swanzey, and US 202 from Sharon Road to NH 136 in Peterborough, all of the major state highways in the Region are operating at stable - free flow during the peak p.m. period.
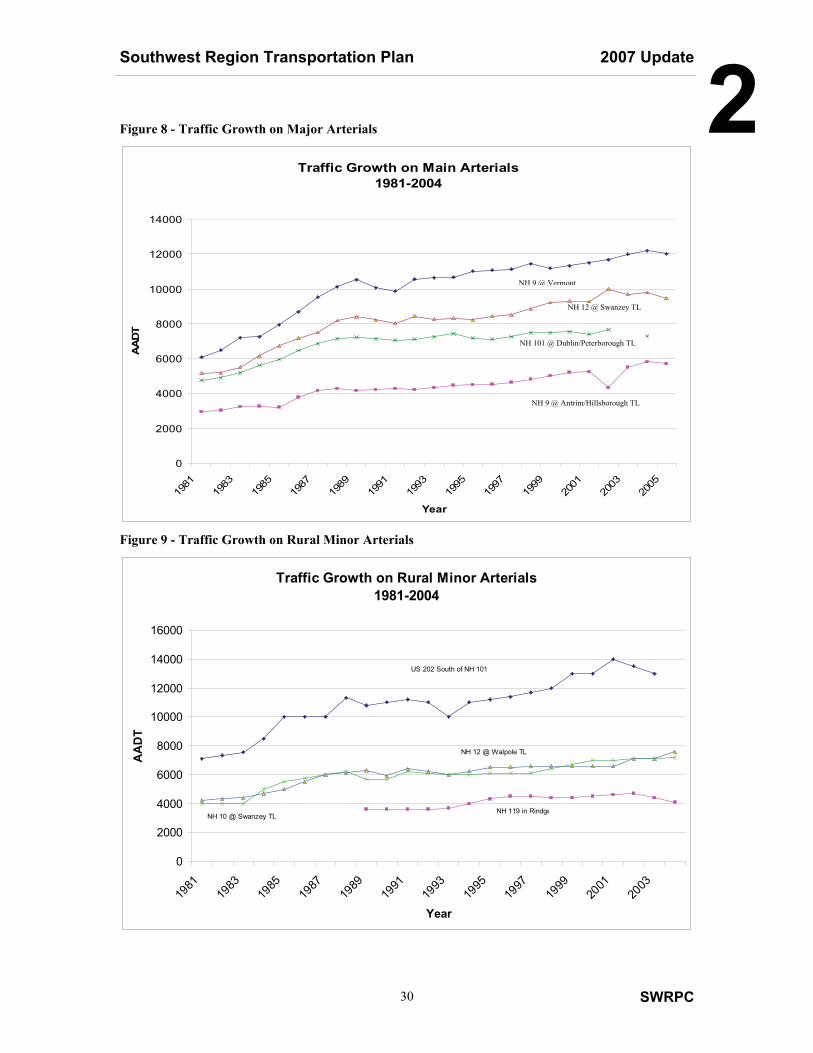
Southwest Region Transportation Plan 2007 Update
SWRPC 30
2Figure 8 - Traffic Growth on Major Arterials
Figure 9 - Traffic Growth on Rural Minor Arterials
Traffic Growth on Rural Minor Arterials1981-2004
0
2000
4000
6000
8000
10000
12000
14000
16000
1981
1983
1985
1987
1989
1991
1993
1995
1997
1999
2001
2003
Year
AA
DT
US 202 South of NH 101
NH 10 @ Swanzey TL
NH 12 @ Walpole TL
NH 119 in Rindge
Traffic Growth on Main Arterials1981-2004
0
2000
4000
6000
8000
10000
12000
14000
1981
1983
1985
1987
1989
1991
1993
1995
1997
1999
2001
2003
2005
Year
AA
DT
NH 9 @ Vermont
NH 12 @ Swanzey TL
NH 101 @ Dublin/Peterborough TL
NH 9 @ Antrim/Hillsborough TL
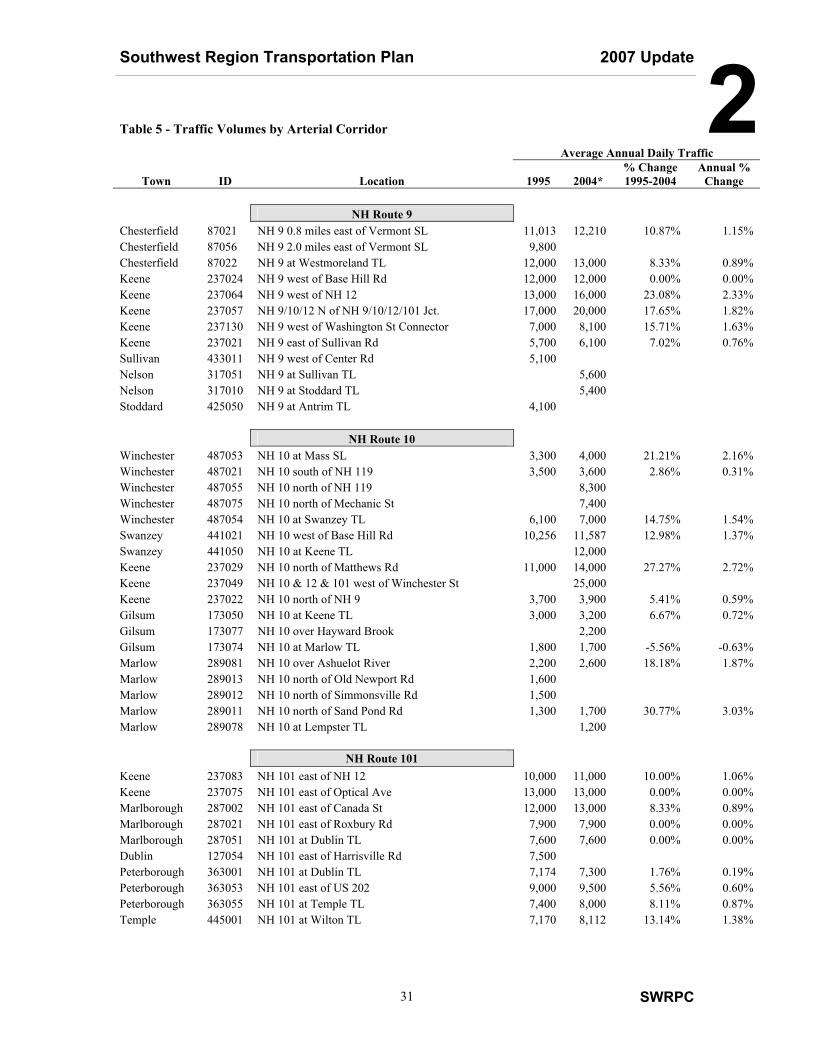
Southwest Region Transportation Plan 2007 Update
SWRPC 31
2Table 5 - Traffic Volumes by Arterial Corridor
Average Annual Daily Traffic
Town ID Location 1995 2004* % Change 1995-2004
Annual % Change
NH Route 9 Chesterfield 87021 NH 9 0.8 miles east of Vermont SL 11,013 12,210 10.87% 1.15% Chesterfield 87056 NH 9 2.0 miles east of Vermont SL 9,800 Chesterfield 87022 NH 9 at Westmoreland TL 12,000 13,000 8.33% 0.89% Keene 237024 NH 9 west of Base Hill Rd 12,000 12,000 0.00% 0.00% Keene 237064 NH 9 west of NH 12 13,000 16,000 23.08% 2.33% Keene 237057 NH 9/10/12 N of NH 9/10/12/101 Jct. 17,000 20,000 17.65% 1.82% Keene 237130 NH 9 west of Washington St Connector 7,000 8,100 15.71% 1.63% Keene 237021 NH 9 east of Sullivan Rd 5,700 6,100 7.02% 0.76% Sullivan 433011 NH 9 west of Center Rd 5,100 Nelson 317051 NH 9 at Sullivan TL 5,600 Nelson 317010 NH 9 at Stoddard TL 5,400 Stoddard 425050 NH 9 at Antrim TL 4,100 NH Route 10 Winchester 487053 NH 10 at Mass SL 3,300 4,000 21.21% 2.16% Winchester 487021 NH 10 south of NH 119 3,500 3,600 2.86% 0.31% Winchester 487055 NH 10 north of NH 119 8,300 Winchester 487075 NH 10 north of Mechanic St 7,400 Winchester 487054 NH 10 at Swanzey TL 6,100 7,000 14.75% 1.54% Swanzey 441021 NH 10 west of Base Hill Rd 10,256 11,587 12.98% 1.37% Swanzey 441050 NH 10 at Keene TL 12,000 Keene 237029 NH 10 north of Matthews Rd 11,000 14,000 27.27% 2.72% Keene 237049 NH 10 & 12 & 101 west of Winchester St 25,000 Keene 237022 NH 10 north of NH 9 3,700 3,900 5.41% 0.59% Gilsum 173050 NH 10 at Keene TL 3,000 3,200 6.67% 0.72% Gilsum 173077 NH 10 over Hayward Brook 2,200 Gilsum 173074 NH 10 at Marlow TL 1,800 1,700 -5.56% -0.63% Marlow 289081 NH 10 over Ashuelot River 2,200 2,600 18.18% 1.87% Marlow 289013 NH 10 north of Old Newport Rd 1,600 Marlow 289012 NH 10 north of Simmonsville Rd 1,500 Marlow 289011 NH 10 north of Sand Pond Rd 1,300 1,700 30.77% 3.03% Marlow 289078 NH 10 at Lempster TL 1,200
NH Route 101 Keene 237083 NH 101 east of NH 12 10,000 11,000 10.00% 1.06% Keene 237075 NH 101 east of Optical Ave 13,000 13,000 0.00% 0.00% Marlborough 287002 NH 101 east of Canada St 12,000 13,000 8.33% 0.89% Marlborough 287021 NH 101 east of Roxbury Rd 7,900 7,900 0.00% 0.00% Marlborough 287051 NH 101 at Dublin TL 7,600 7,600 0.00% 0.00% Dublin 127054 NH 101 east of Harrisville Rd 7,500 Peterborough 363001 NH 101 at Dublin TL 7,174 7,300 1.76% 0.19% Peterborough 363053 NH 101 east of US 202 9,000 9,500 5.56% 0.60% Peterborough 363055 NH 101 at Temple TL 7,400 8,000 8.11% 0.87% Temple 445001 NH 101 at Wilton TL 7,170 8,112 13.14% 1.38%
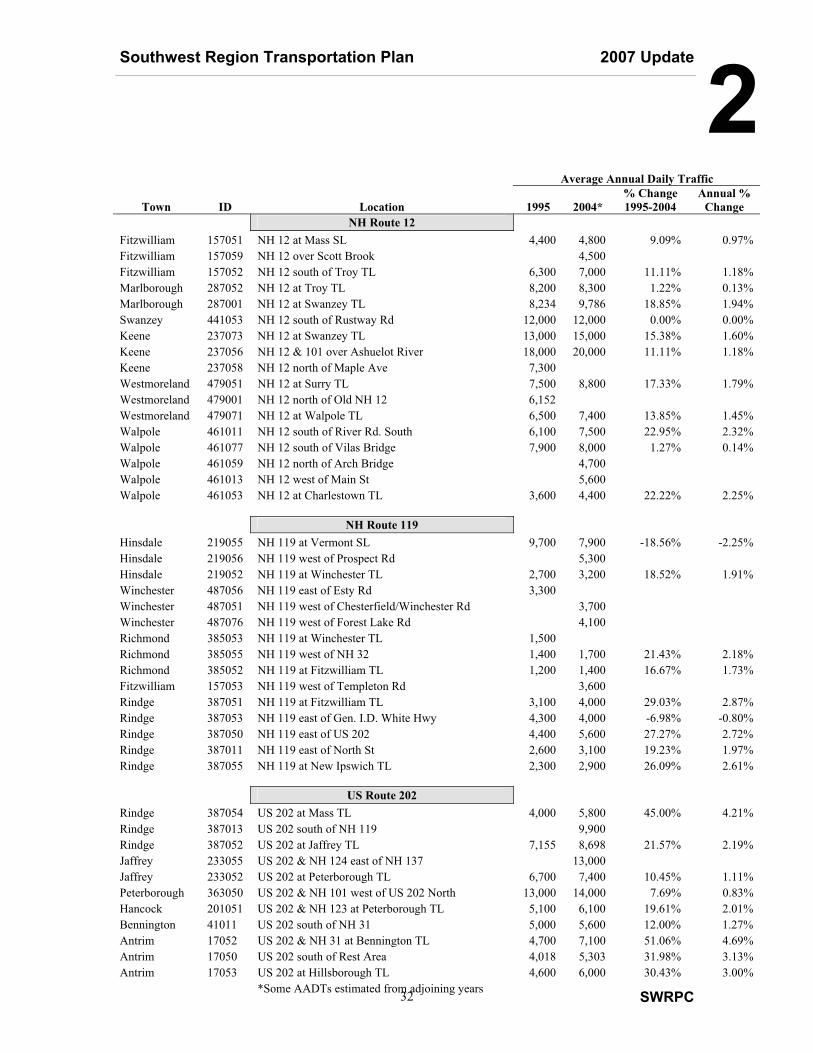
Southwest Region Transportation Plan 2007 Update
SWRPC 32
2Average Annual Daily Traffic
Town ID Location 1995 2004* % Change 1995-2004
Annual % Change
NH Route 12 Fitzwilliam 157051 NH 12 at Mass SL 4,400 4,800 9.09% 0.97% Fitzwilliam 157059 NH 12 over Scott Brook 4,500 Fitzwilliam 157052 NH 12 south of Troy TL 6,300 7,000 11.11% 1.18% Marlborough 287052 NH 12 at Troy TL 8,200 8,300 1.22% 0.13% Marlborough 287001 NH 12 at Swanzey TL 8,234 9,786 18.85% 1.94% Swanzey 441053 NH 12 south of Rustway Rd 12,000 12,000 0.00% 0.00% Keene 237073 NH 12 at Swanzey TL 13,000 15,000 15.38% 1.60% Keene 237056 NH 12 & 101 over Ashuelot River 18,000 20,000 11.11% 1.18% Keene 237058 NH 12 north of Maple Ave 7,300 Westmoreland 479051 NH 12 at Surry TL 7,500 8,800 17.33% 1.79% Westmoreland 479001 NH 12 north of Old NH 12 6,152 Westmoreland 479071 NH 12 at Walpole TL 6,500 7,400 13.85% 1.45% Walpole 461011 NH 12 south of River Rd. South 6,100 7,500 22.95% 2.32% Walpole 461077 NH 12 south of Vilas Bridge 7,900 8,000 1.27% 0.14% Walpole 461059 NH 12 north of Arch Bridge 4,700 Walpole 461013 NH 12 west of Main St 5,600 Walpole 461053 NH 12 at Charlestown TL 3,600 4,400 22.22% 2.25%
NH Route 119 Hinsdale 219055 NH 119 at Vermont SL 9,700 7,900 -18.56% -2.25% Hinsdale 219056 NH 119 west of Prospect Rd 5,300 Hinsdale 219052 NH 119 at Winchester TL 2,700 3,200 18.52% 1.91% Winchester 487056 NH 119 east of Esty Rd 3,300 Winchester 487051 NH 119 west of Chesterfield/Winchester Rd 3,700 Winchester 487076 NH 119 west of Forest Lake Rd 4,100 Richmond 385053 NH 119 at Winchester TL 1,500 Richmond 385055 NH 119 west of NH 32 1,400 1,700 21.43% 2.18% Richmond 385052 NH 119 at Fitzwilliam TL 1,200 1,400 16.67% 1.73% Fitzwilliam 157053 NH 119 west of Templeton Rd 3,600 Rindge 387051 NH 119 at Fitzwilliam TL 3,100 4,000 29.03% 2.87% Rindge 387053 NH 119 east of Gen. I.D. White Hwy 4,300 4,000 -6.98% -0.80% Rindge 387050 NH 119 east of US 202 4,400 5,600 27.27% 2.72% Rindge 387011 NH 119 east of North St 2,600 3,100 19.23% 1.97% Rindge 387055 NH 119 at New Ipswich TL 2,300 2,900 26.09% 2.61%
US Route 202
Rindge 387054 US 202 at Mass TL 4,000 5,800 45.00% 4.21% Rindge 387013 US 202 south of NH 119 9,900 Rindge 387052 US 202 at Jaffrey TL 7,155 8,698 21.57% 2.19% Jaffrey 233055 US 202 & NH 124 east of NH 137 13,000 Jaffrey 233052 US 202 at Peterborough TL 6,700 7,400 10.45% 1.11% Peterborough 363050 US 202 & NH 101 west of US 202 North 13,000 14,000 7.69% 0.83% Hancock 201051 US 202 & NH 123 at Peterborough TL 5,100 6,100 19.61% 2.01% Bennington 41011 US 202 south of NH 31 5,000 5,600 12.00% 1.27% Antrim 17052 US 202 & NH 31 at Bennington TL 4,700 7,100 51.06% 4.69% Antrim 17050 US 202 south of Rest Area 4,018 5,303 31.98% 3.13% Antrim 17053 US 202 at Hillsborough TL 4,600 6,000 30.43% 3.00% *Some AADTs estimated from adjoining years
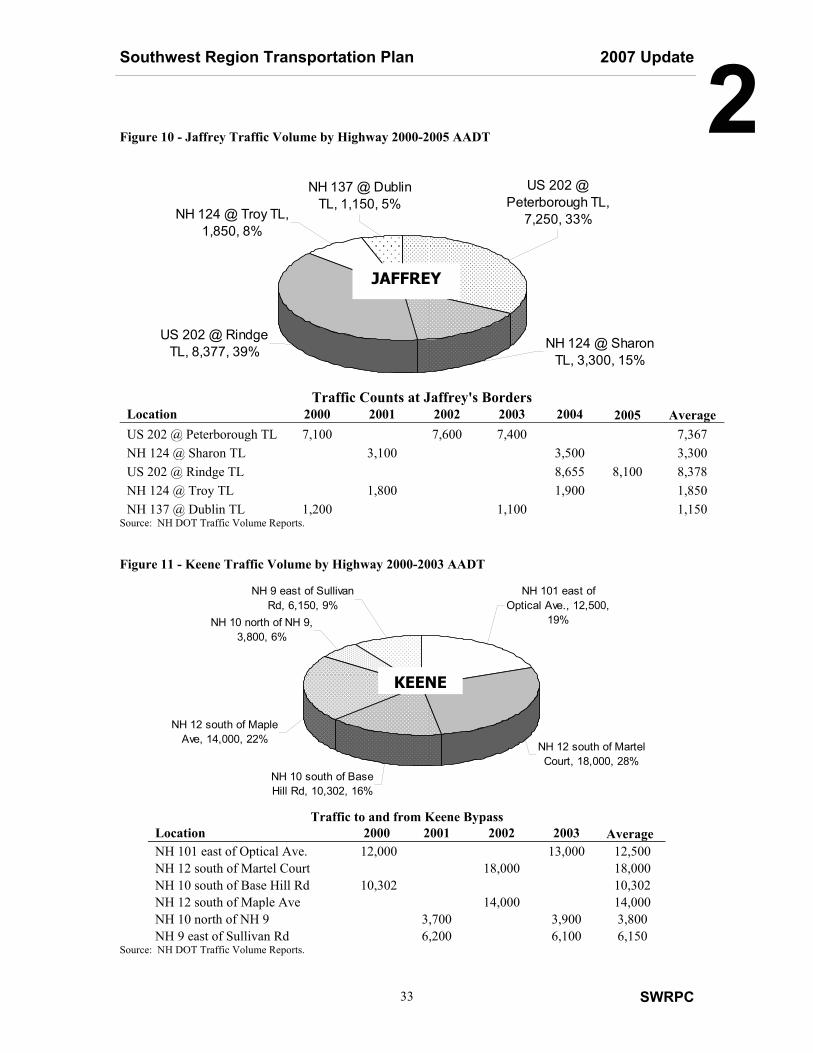
Southwest Region Transportation Plan 2007 Update
SWRPC 33
2Figure 10 - Jaffrey Traffic Volume by Highway 2000-2005 AADT
NH 137 @ Dublin TL, 1,150, 5%
NH 124 @ Troy TL, 1,850, 8%
US 202 @ Rindge TL, 8,377, 39% NH 124 @ Sharon
TL, 3,300, 15%
US 202 @ Peterborough TL,
7,250, 33%
Traffic Counts at Jaffrey's Borders
Location 2000 2001 2002 2003 2004 2005 Average US 202 @ Peterborough TL 7,100 7,600 7,400 7,367 NH 124 @ Sharon TL 3,100 3,500 3,300 US 202 @ Rindge TL 8,655 8,100 8,378 NH 124 @ Troy TL 1,800 1,900 1,850 NH 137 @ Dublin TL 1,200 1,100 1,150
Source: NH DOT Traffic Volume Reports.
Figure 11 - Keene Traffic Volume by Highway 2000-2003 AADT
NH 9 east of Sullivan Rd, 6,150, 9%
NH 10 north of NH 9, 3,800, 6%
NH 12 south of Maple Ave, 14,000, 22%
NH 10 south of Base Hill Rd, 10,302, 16%
NH 12 south of Martel Court, 18,000, 28%
NH 101 east of Optical Ave., 12,500,
19%
Traffic to and from Keene Bypass
Location 2000 2001 2002 2003 Average NH 101 east of Optical Ave. 12,000 13,000 12,500 NH 12 south of Martel Court 18,000 18,000 NH 10 south of Base Hill Rd 10,302 10,302 NH 12 south of Maple Ave 14,000 14,000 NH 10 north of NH 9 3,700 3,900 3,800 NH 9 east of Sullivan Rd 6,200 6,100 6,150
Source: NH DOT Traffic Volume Reports.
KEENE
JAFFREY
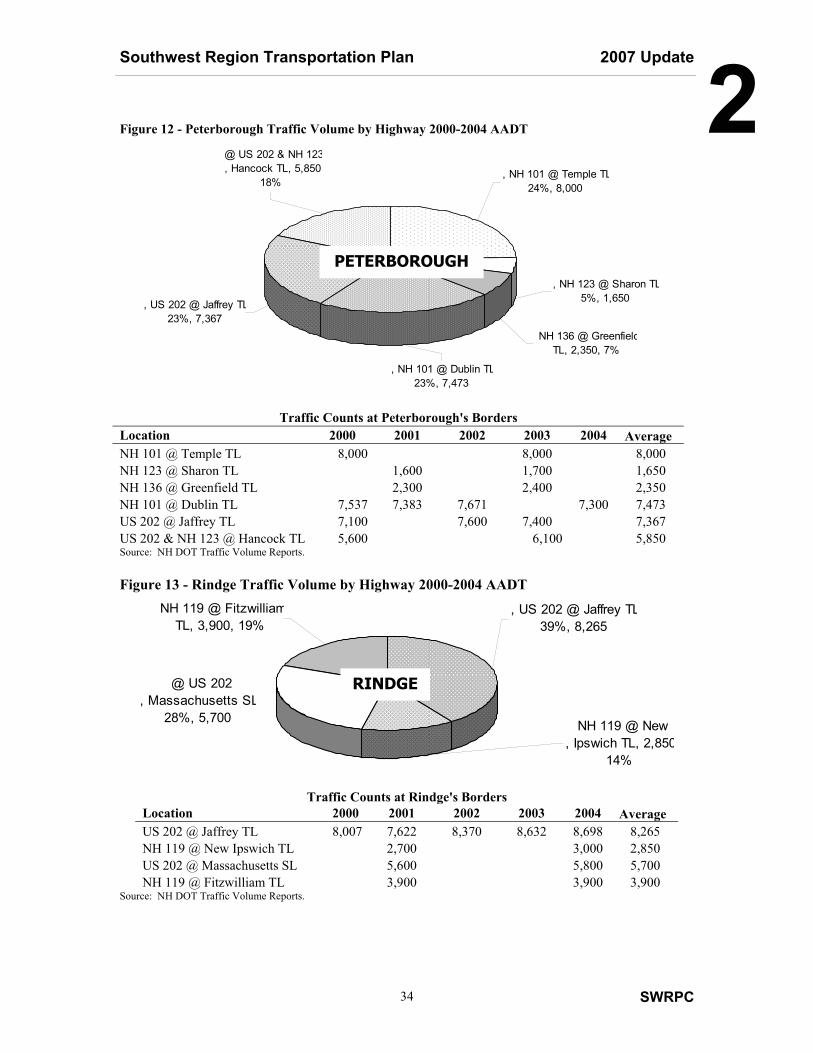
Southwest Region Transportation Plan 2007 Update
SWRPC 34
2Figure 12 - Peterborough Traffic Volume by Highway 2000-2004 AADT
, US 202 @ Jaffrey TL23%, 7,367
@ US 202 & NH 123, Hancock TL, 5,850
18%, NH 101 @ Temple TL
24%, 8,000
, NH 123 @ Sharon TL5%, 1,650
NH 136 @ GreenfieldTL, 2,350, 7%
, NH 101 @ Dublin TL23%, 7,473
Source: NH DOT Traffic Volume Reports. Figure 13 - Rindge Traffic Volume by Highway 2000-2004 AADT
, US 202 @ Jaffrey TL39%, 8,265
NH 119 @ FitzwilliamTL, 3,900, 19%
NH 119 @ New, Ipswich TL, 2,850
14%
@ US 202, Massachusetts SL
28%, 5,700
Traffic Counts at Rindge's Borders Location 2000 2001 2002 2003 2004 Average US 202 @ Jaffrey TL 8,007 7,622 8,370 8,632 8,698 8,265 NH 119 @ New Ipswich TL 2,700 3,000 2,850 US 202 @ Massachusetts SL 5,600 5,800 5,700 NH 119 @ Fitzwilliam TL 3,900 3,900 3,900
Source: NH DOT Traffic Volume Reports.
Traffic Counts at Peterborough's Borders Location 2000 2001 2002 2003 2004 Average NH 101 @ Temple TL 8,000 8,000 8,000 NH 123 @ Sharon TL 1,600 1,700 1,650 NH 136 @ Greenfield TL 2,300 2,400 2,350 NH 101 @ Dublin TL 7,537 7,383 7,671 7,300 7,473 US 202 @ Jaffrey TL 7,100 7,600 7,400 7,367 US 202 & NH 123 @ Hancock TL 5,600 6,100 5,850
PETERBOROUGH
RINDGE
Southwest Region Transportation Plan 2007 Update
SWRPC 35
2State and Municipal Bridges- Bridge Management System Bridge conditions are critical components of the highway network surface conditions. NH DOT maintains a bridge management system to monitor the condition of the State’s bridges and implement effective bridge maintenance practices. Bridges are rated based on their condition and are categorized as either being in good condition, structurally or functionally obsolete or red-listed. Maps 5a and 5b show the locations and conditions of all bridges in the Region, defined as 10’ or greater in span carrying a state or municipal highway. The Southwest Region roadway network includes 482 bridges (structure greater than ten feet in length) of which 202 are state-owned, 274 are municipally-owned, three are owned by the US Army Corps of Engineers and three are owned by railroad companies. NHDOT inspects all bridges that are deemed to be in acceptable condition every 2 years, and all other bridges on a yearly basis. DOT engineers assess each bridge’s physical condition and functionality, and make recommendations as to how to proceed. Bridges are categorized as follows;
� Structurally Deficient - A bridge which, due to its deteriorated condition, no longer meets current standards for load carrying capacity and structural integrity.
� Functionally Obsolete - A bridge which, due to the changing need of the transportation system, no longer meets current standards for deck geometry, load carrying capacity, vertical or horizontal clearances, or alignment of the approaches to the bridge.
� Red List - Bridges that require more frequent inspections due to known deficiencies, poor structural conditions, weight restrictions, or the type of construction (such as a replacement bridge installed on a temporary basis).
� Good Condition - Bridges that don’t need repairs, just scheduled maintenance. Although Red List bridges are perceived by the public as those being in the worst condition, this is not always true. The Red List identifies those bridges that require additional inspection efforts, as indicated above. Some of these bridges are historic, such as covered bridges, and will always remain on the Red List. These specific types of bridge structures have lower design and load carrying capacities as compared to newer bridges, and likely cannot be modified or rehabilitated to current design or rating capacities. While NH DOT manages to repair state owned red-listed bridges every year, older bridges are added to the list as they reach the end of their life cycle. The end result is that the list of bridges will take approximately 50 years to complete. On the municipal side, each town receives financial assistance through the State Aid Bridge Fund, and they work to fix their list of bridges. This fund is somewhat healthier, with an anticipated length of 25 years to complete the list. NH DOT Bureau of Bridge Design administers the bridge inspection program. New Hampshire’s bridges are inspected on a biennial schedule. The inspection protocol is based on structural and geometric characteristics. Bridges are categorized as either being in good condition, obsolete (in need of maintenance or low priority for replacement), or “red-listed” (in need of close monitoring and in most cases repair or replacement). Structurally obsolete bridges no longer meet current highway standards for structural integrity. Functionally obsolete bridges do not meet the needs of
Southwest Region Transportation Plan 2007 Update
SWRPC 36
2the current highway system due to geometric limitations (vertical clearance, width, or pedestrian access). Most Red-List bridges have deficiencies that require more regular monitoring. The Bureau uses a software program PONTIS to manage bridge inspection data. The software was developed by the Federal Highway Administration and has powerful analysis and modeling capabilities. The Bureau is in the process of developing additional financial modeling components to enhance the software’s capabilities. In the future, the Bureau hopes to use PONTIS to track all bridge projects and use the model to identify potential bridge repairs and appropriate improvements. Safety Management System The nature and rates of traffic accidents are a primary measure of highway safety. NH DOT maintains a database of ‘reportable accidents,’ those resulting in personal injury and/or $1000 or more of damage, and creates Accident Rate Maps for the state highways. The maps are used to identify possible safety hazards within the highway system. Accident location information, however, is limited due to variability of accident reporting by local police departments. The Accident Rate Map (Map 9) shows that the majority of highways in the Region have a very good safety record. The Accident Rate is calculated based on the number of accidents on a stretch of road per million miles of vehicle travel. For example, a road with very low traffic might be classified with a high accident rate for having 10 accidents, and another road might be classified with a low accident rate for having 50 accidents. Historically, only about 30% of reportable accidents each year were locatable – that is, there was insufficient information in the police report to identify the actual accident location; in some cases only the state highway and town were known. NH DOT and the Department of Safety are working to improve the accuracy of accident reporting, principally through the deployment of laptop computers and Geographical Information System software for state and local police for on-site reporting. In 2000, 54% of reportable accidents were locatable. A goal of the Safety Management System is to achieve locatability of at least 90% of reportable accidents. Pavement Condition Management System Pavement conditions on state routes are an important indication of the quality of our transportation system. Pavement is literally where the rubber hits the road. Poor pavement condition will affect safety and comfort. The distance required for a vehicle to a stop is directly linked to the quality of one’s tires and the quality of the pavement. High skid resistance will provide a better breaking surface during all weather conditions and also prevent your vehicle from sliding off the road. The comfort of one’s ride is similarly related to the shocks and struts in his or her car and to the quality of the road underneath. A Ride Comfort Index (RCI) is used to rate roads. This index is measured by a special sensor mounted to a DOT vehicle that measures the number of cracks and irregularities in the pavement. The ranges of index are as follows:
� 3.5-5.0 High Comfort � 2.51-3.49 - Medium Comfort
Southwest Region Transportation Plan 2007 Update
SWRPC 37
2� 0-2.5 - Low Comfort NH DOT with the Maintenance District Offices maintains a pavement management program to monitor the condition of the highway pavement. Maintaining pavement surfaces is of utmost importance in preserving the significant investment made in the highway system. Poorly maintained surfaces can create safety hazards, decrease the roadway’s capacity, increase travel times, and exacerbate other maintenance issues. The information gathered, using a specially equipped van, is used to develop an annual pavement rehabilitation program. Pavement conditions for the major state highway in the Southwest Region are displayed in Map 10. The District Maintenance Offices administer annual pavement rehabilitation programs. Pavement rehabilitation treatments range from patching to full reconstruction. Priorities for rehabilitation are developed by the District Engineer and staff based on observations by maintenance personnel and information gathered from the state’s high-tech pavement monitoring van. The Bureau of Highway Maintenance is developing a standardized pavement management analysis program to assist District Offices in developing their pavement resurfacing programs. The level of treatment prescribed for any particular roadway is often related to the roadway’s functional classification and observed traffic volume. NH DOT’s current philosophy calls for a maintenance program which keeps high traffic volume roads in good to excellent condition. Less traveled, poor condition roads are treated regularly, but full reconstruction is unlikely. The District Maintenance Offices are implementing low cost reconstruction projects to better address the deficiencies of the low volume state roads - using cost efficient alternatives to complete reconstruction approaches.
Public Transportation & Inter-Modal Management Systems NH DOT is committed to developing intermodal transportation options. As such, NH DOT Bureau of Rail and Transit maintains an inventory of public transportation facilities in the State. The Bureau recently published a State Public Transportation Map which identifies the State’s public transit system operators, intercity bus routes, rail providers and routes, Park and Ride locations, airports with scheduled service, intercity bus and rail stops, and bus and rail terminals. The Bureau also maintains a public transit ridership database of rural public transit providers.
Municipal Highways Annual Spending Transportation planning at the local level is managed and executed through municipal budgeting and Master Plans. The transportation components of municipal Master Plans are used to summarize the extent and condition of the local transportation system and identify goals for maintenance, enhancement and improvement of the system – principally as they relate to public spending and the limitation or support of land use. The approach to transportation planning and management varies among municipalities. Funding for municipal road and bridge construction, summer maintenance, snow removal, and capital equipment costs are substantial portions of municipal budgets. Road Agents (or Directors of Public Works), Boards of Selectmen and Budget Committees manage the annual highway spending.
Southwest Region Transportation Plan 2007 Update
SWRPC 38
2 Block Grant Aid Municipalities receive State appropriations for the construction and maintenance of town roads (Class IV and V roads) through the Highway Block Grant program. The amount of funding each municipality receives is based on formulas which account for 1) Class IV and V mileage and percentage of state population, and 2) equalized valuation and Class V mileage. Block Grant Aid disbursements are made to the municipalities four times a year. Municipalities may carry unused balances over to the next fiscal year. (Table 6) The New Hampshire Department of Transportation (NHDOT) is responsible for determining the actual disbursements of funds, and as such, it is important that they be provided accurate and current information regarding each municipality’s Class IV and V mileage.15 This is accomplished by municipalities reporting any changes to road status after town meeting, and by SWRPC conducting Roadway Inventory work, whereby every road segment in a municipality is measured using GPS and a distance monitoring sensor mounted on the traffic research vehicle. Highway Block Grant Aid is defined under RSA 235:23 and is distributed to municipalities by the State of New Hampshire on a yearly basis with partial disbursements made four times a year. The funds can only be used for construction, reconstruction and maintenance of each municipality’s Class IV and V highways. Highway Block Grant Aid funds represent a portion of the State’s highway revenues received in the preceding fiscal year from motor vehicle fees and gas taxes. There are two sets of funds from which allotments are made. The first, identified as Apportionment A, represents 12% of the State’s highway revenues. Apportionment A is distributed based on a combination of a municipality’s population and on the Class IV and V mileage. For the State Fiscal Year 2006 these amounts were:
� $11.13 for each person residing in a municipality � $1,274 for each mile of Class IV and V road in a municipality
The second allotment of funds, Apportionment B, is set at $400,000 for the whole state. These funds are meant to supplement Apportionment A funds for municipalities which have high roadway mileage to maintain and whose overall value of property (on an equalized basis) is very low in relationship to other communities. In FY 2006, 22 municipalities statewide will receive funds from this second distribution. A total of 4 municipalities in the Region received funds from Apportionment B in State Fiscal Year 2006. Scenic Roads Towns may designate any road other than a Class I or Class II Highways as a Scenic Road, pursuant to RSA 231-157. If designated as Scenic, any road or utility activity that will involve removal of, or damage to, trees and stone walls adjacent to the roadway requires written consent from the Planning Board, except in emergency situations. Additionally, this designation permits towns to develop specific provisions regarding the management of the Scenic Road which may
15 Highway Block Aid Funds, NHDOT website
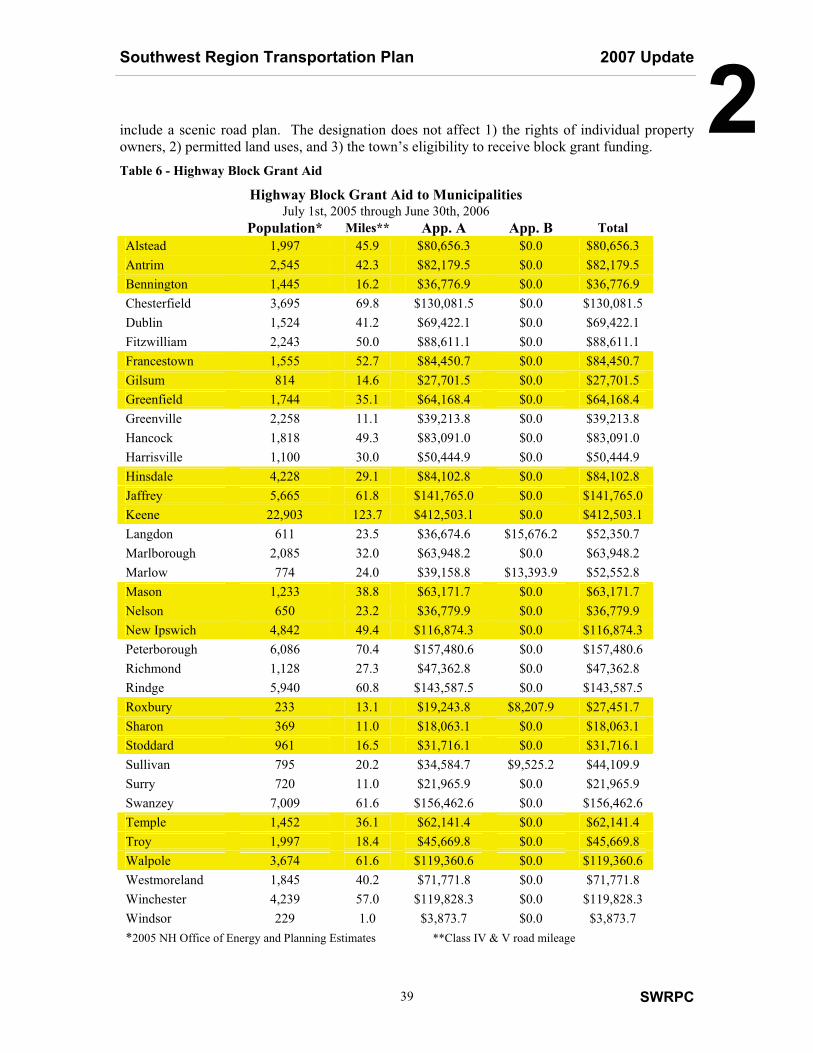
Southwest Region Transportation Plan 2007 Update
SWRPC 39
2include a scenic road plan. The designation does not affect 1) the rights of individual property owners, 2) permitted land uses, and 3) the town’s eligibility to receive block grant funding. Table 6 - Highway Block Grant Aid
Highway Block Grant Aid to Municipalities July 1st, 2005 through June 30th, 2006
Population* Miles** App. A App. B Total Alstead 1,997 45.9 $80,656.3 $0.0 $80,656.3 Antrim 2,545 42.3 $82,179.5 $0.0 $82,179.5 Bennington 1,445 16.2 $36,776.9 $0.0 $36,776.9 Chesterfield 3,695 69.8 $130,081.5 $0.0 $130,081.5 Dublin 1,524 41.2 $69,422.1 $0.0 $69,422.1 Fitzwilliam 2,243 50.0 $88,611.1 $0.0 $88,611.1 Francestown 1,555 52.7 $84,450.7 $0.0 $84,450.7 Gilsum 814 14.6 $27,701.5 $0.0 $27,701.5 Greenfield 1,744 35.1 $64,168.4 $0.0 $64,168.4 Greenville 2,258 11.1 $39,213.8 $0.0 $39,213.8 Hancock 1,818 49.3 $83,091.0 $0.0 $83,091.0 Harrisville 1,100 30.0 $50,444.9 $0.0 $50,444.9 Hinsdale 4,228 29.1 $84,102.8 $0.0 $84,102.8 Jaffrey 5,665 61.8 $141,765.0 $0.0 $141,765.0 Keene 22,903 123.7 $412,503.1 $0.0 $412,503.1 Langdon 611 23.5 $36,674.6 $15,676.2 $52,350.7 Marlborough 2,085 32.0 $63,948.2 $0.0 $63,948.2 Marlow 774 24.0 $39,158.8 $13,393.9 $52,552.8 Mason 1,233 38.8 $63,171.7 $0.0 $63,171.7 Nelson 650 23.2 $36,779.9 $0.0 $36,779.9 New Ipswich 4,842 49.4 $116,874.3 $0.0 $116,874.3 Peterborough 6,086 70.4 $157,480.6 $0.0 $157,480.6 Richmond 1,128 27.3 $47,362.8 $0.0 $47,362.8 Rindge 5,940 60.8 $143,587.5 $0.0 $143,587.5 Roxbury 233 13.1 $19,243.8 $8,207.9 $27,451.7 Sharon 369 11.0 $18,063.1 $0.0 $18,063.1 Stoddard 961 16.5 $31,716.1 $0.0 $31,716.1 Sullivan 795 20.2 $34,584.7 $9,525.2 $44,109.9 Surry 720 11.0 $21,965.9 $0.0 $21,965.9 Swanzey 7,009 61.6 $156,462.6 $0.0 $156,462.6 Temple 1,452 36.1 $62,141.4 $0.0 $62,141.4 Troy 1,997 18.4 $45,669.8 $0.0 $45,669.8 Walpole 3,674 61.6 $119,360.6 $0.0 $119,360.6 Westmoreland 1,845 40.2 $71,771.8 $0.0 $71,771.8 Winchester 4,239 57.0 $119,828.3 $0.0 $119,828.3 Windsor 229 1.0 $3,873.7 $0.0 $3,873.7 *2005 NH Office of Energy and Planning Estimates **Class IV & V road mileage
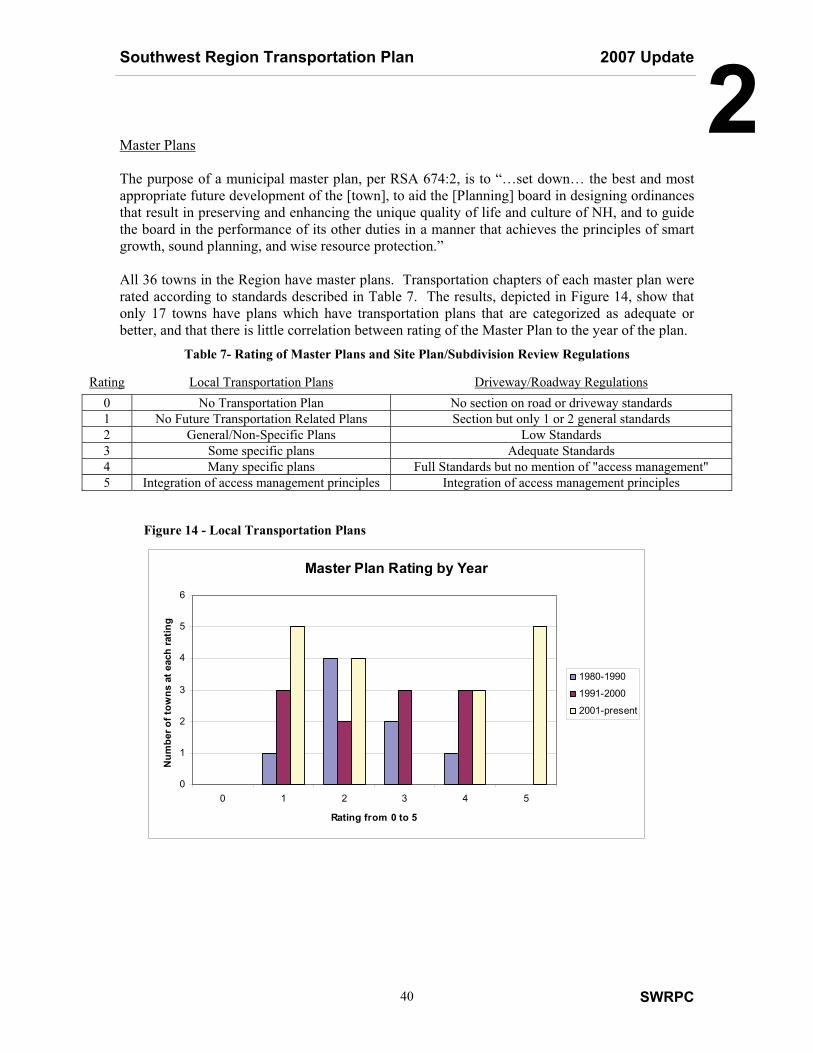
Southwest Region Transportation Plan 2007 Update
SWRPC 40
2 Master Plans The purpose of a municipal master plan, per RSA 674:2, is to “…set down… the best and most appropriate future development of the [town], to aid the [Planning] board in designing ordinances that result in preserving and enhancing the unique quality of life and culture of NH, and to guide the board in the performance of its other duties in a manner that achieves the principles of smart growth, sound planning, and wise resource protection.” All 36 towns in the Region have master plans. Transportation chapters of each master plan were rated according to standards described in Table 7. The results, depicted in Figure 14, show that only 17 towns have plans which have transportation plans that are categorized as adequate or better, and that there is little correlation between rating of the Master Plan to the year of the plan.
Table 7- Rating of Master Plans and Site Plan/Subdivision Review Regulations
Rating Local Transportation Plans Driveway/Roadway Regulations 0 No Transportation Plan No section on road or driveway standards 1 No Future Transportation Related Plans Section but only 1 or 2 general standards 2 General/Non-Specific Plans Low Standards 3 Some specific plans Adequate Standards 4 Many specific plans Full Standards but no mention of "access management" 5 Integration of access management principles Integration of access management principles
Figure 14 - Local Transportation Plans
Master Plan Rating by Year
0
1
2
3
4
5
6
0 1 2 3 4 5
Rating from 0 to 5
Num
ber o
f tow
ns a
t eac
h ra
ting
1980-1990
1991-2000
2001-present
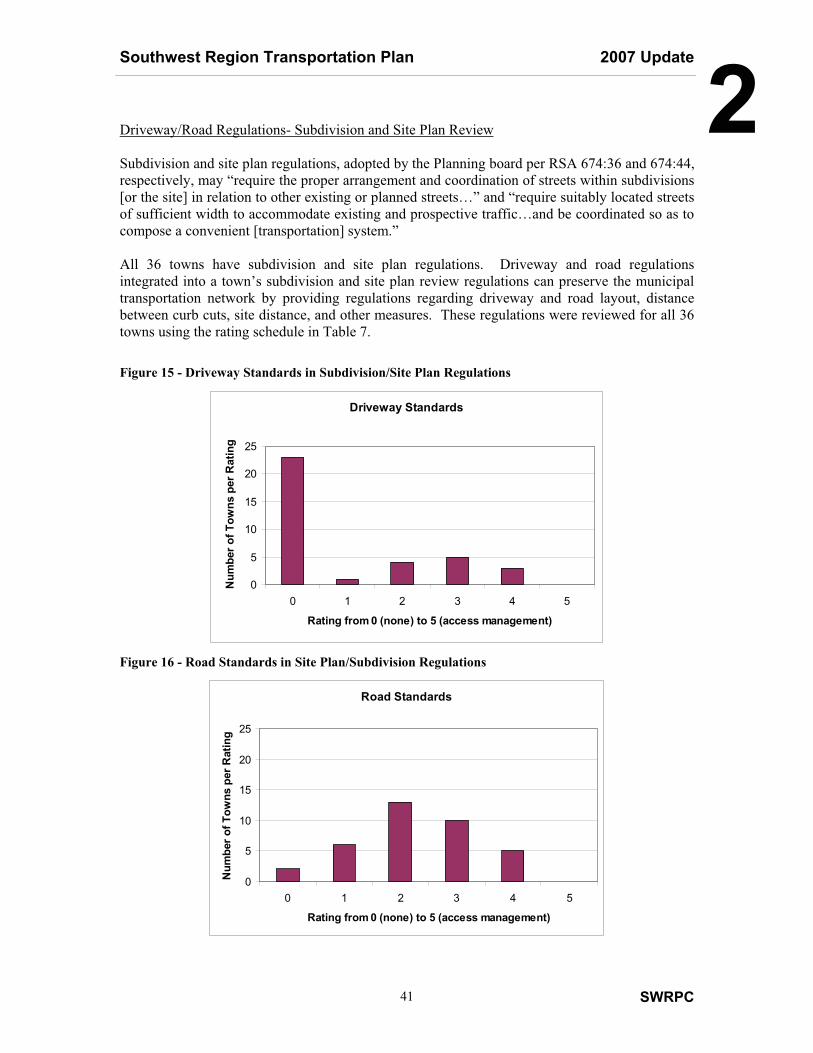
Southwest Region Transportation Plan 2007 Update
SWRPC 41
2Driveway/Road Regulations- Subdivision and Site Plan Review Subdivision and site plan regulations, adopted by the Planning board per RSA 674:36 and 674:44, respectively, may “require the proper arrangement and coordination of streets within subdivisions [or the site] in relation to other existing or planned streets…” and “require suitably located streets of sufficient width to accommodate existing and prospective traffic…and be coordinated so as to compose a convenient [transportation] system.”
All 36 towns have subdivision and site plan regulations. Driveway and road regulations integrated into a town’s subdivision and site plan review regulations can preserve the municipal transportation network by providing regulations regarding driveway and road layout, distance between curb cuts, site distance, and other measures. These regulations were reviewed for all 36 towns using the rating schedule in Table 7. Figure 15 - Driveway Standards in Subdivision/Site Plan Regulations
Driveway Standards
0
5
10
15
20
25
0 1 2 3 4 5
Rating from 0 (none) to 5 (access management)
Num
ber o
f Tow
ns p
er R
atin
g
Figure 16 - Road Standards in Site Plan/Subdivision Regulations
Road Standards
0
5
10
15
20
25
0 1 2 3 4 5
Rating from 0 (none) to 5 (access management)
Num
ber o
f Tow
ns p
er R
atin
g
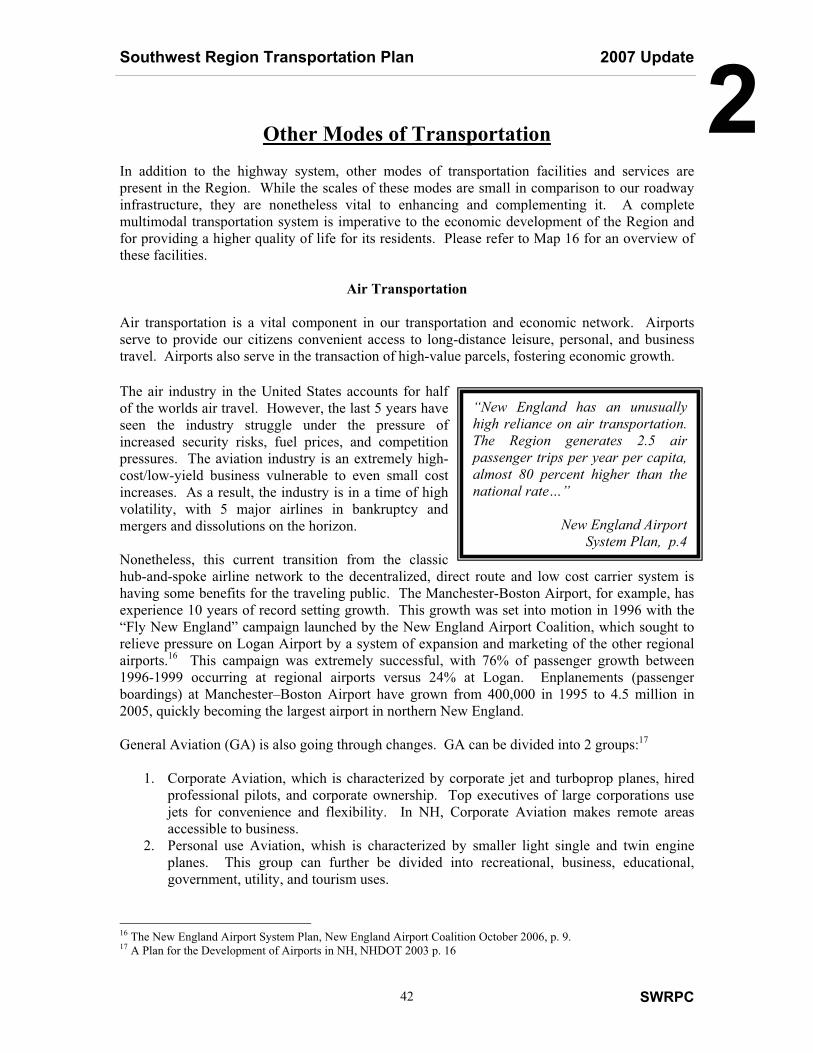
Southwest Region Transportation Plan 2007 Update
SWRPC 42
2Other Modes of Transportation In addition to the highway system, other modes of transportation facilities and services are present in the Region. While the scales of these modes are small in comparison to our roadway infrastructure, they are nonetheless vital to enhancing and complementing it. A complete multimodal transportation system is imperative to the economic development of the Region and for providing a higher quality of life for its residents. Please refer to Map 16 for an overview of these facilities.
Air Transportation Air transportation is a vital component in our transportation and economic network. Airports serve to provide our citizens convenient access to long-distance leisure, personal, and business travel. Airports also serve in the transaction of high-value parcels, fostering economic growth. The air industry in the United States accounts for half of the worlds air travel. However, the last 5 years have seen the industry struggle under the pressure of increased security risks, fuel prices, and competition pressures. The aviation industry is an extremely high-cost/low-yield business vulnerable to even small cost increases. As a result, the industry is in a time of high volatility, with 5 major airlines in bankruptcy and mergers and dissolutions on the horizon. Nonetheless, this current transition from the classic hub-and-spoke airline network to the decentralized, direct route and low cost carrier system is having some benefits for the traveling public. The Manchester-Boston Airport, for example, has experience 10 years of record setting growth. This growth was set into motion in 1996 with the “Fly New England” campaign launched by the New England Airport Coalition, which sought to relieve pressure on Logan Airport by a system of expansion and marketing of the other regional airports.16 This campaign was extremely successful, with 76% of passenger growth between 1996-1999 occurring at regional airports versus 24% at Logan. Enplanements (passenger boardings) at Manchester–Boston Airport have grown from 400,000 in 1995 to 4.5 million in 2005, quickly becoming the largest airport in northern New England. General Aviation (GA) is also going through changes. GA can be divided into 2 groups:17
1. Corporate Aviation, which is characterized by corporate jet and turboprop planes, hired professional pilots, and corporate ownership. Top executives of large corporations use jets for convenience and flexibility. In NH, Corporate Aviation makes remote areas accessible to business.
2. Personal use Aviation, whish is characterized by smaller light single and twin engine planes. This group can further be divided into recreational, business, educational, government, utility, and tourism uses.
16 The New England Airport System Plan, New England Airport Coalition October 2006, p. 9. 17 A Plan for the Development of Airports in NH, NHDOT 2003 p. 16
“New England has an unusually high reliance on air transportation. The Region generates 2.5 air passenger trips per year per capita, almost 80 percent higher than the national rate…”
New England Airport System Plan, p.4
Southwest Region Transportation Plan 2007 Update
SWRPC 43
2Statewide The NH DOT Division of Aeronautics oversees the operation, safety, maintenance and development of all airports in the state. The State’s Airport System Plan identifies system deficiencies and issues requiring prompt state action given the primary goal of preserving the State’s existing system of airports. The Plan was developed in 1993 and is currently being updated. Over the past few decades, New Hampshire has experienced a steady increase in the number of registered aircraft and aircraft operations. The State Airport System Plan anticipates continued growth in demand for private and commercial aviation in the future. The State Plan anticipates that airports within the state airport system will need to make facility improvements to accommodate the forecasted level of activity. The State Airport Plan identifies privately owned airports as an integral part of the state airport network. However, increasing development pressures, insurance costs and airport maintenance costs render private airports unstable components of the airport system. The Division of Aeronautics is examining options for the preservation of private airports in New Hampshire, such as the preparation of Airport Feasibility Studies and Master Plan’s for airports at risk of closing. Classification of Airports The Federal Aviation Administration administers all commercial airports through the National Plan of Integrated Airport System (NPIAS). These airports are significant to the national air transportation system and therefore receive federal grants from the Airport Improvement Program (AIP) in order to maintain and upgrade their infrastructure, including buildings, runways, navigation aids, and communications. This funding is the lifeblood to airports, without it, continued investment and acquisition of equipment would not occur. Within this integrated system, there are four distinct roles that airports have:
1. Primary Commercial Service - Have more than 10,000 annual passenger enplanements (also referred to as boardings) per year. Primary airports receive an annual apportionment of at least $1 million in AIP funds (when AIP funding levels meet or exceed $3.2 billion), with the amount determined by the number of enplaned passengers.
2. Non-Primary Commercial Service - Commercial service airports that have from 2,500 to
10,000 annual passengers. These airports are used mainly by general aviation and have an average of 35-based aircraft.
3. Reliever Airports - General aviation pilots often find it difficult and expensive to gain
access to congested airports, particularly large and medium hub airports. In recognition of this, the FAA has encouraged the development of high capacity general aviation airports in major metropolitan areas. These specialized airports, called relievers, provide pilots with attractive alternatives to using congested hub airports. They also provide general aviation access to the surrounding area and must have 100 or more based aircraft or 25,000 annual itinerant operations. All airports that are designated as relievers by the FAA are included in the NPIAS
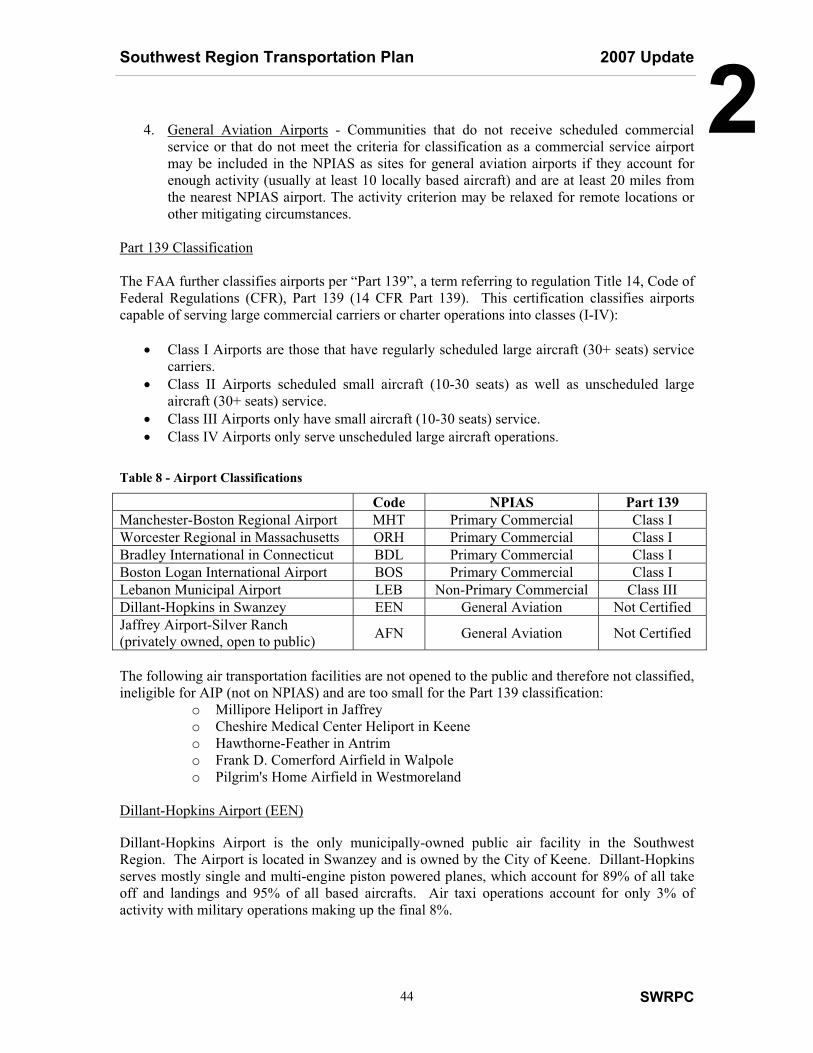
Southwest Region Transportation Plan 2007 Update
SWRPC 44
24. General Aviation Airports - Communities that do not receive scheduled commercial service or that do not meet the criteria for classification as a commercial service airport may be included in the NPIAS as sites for general aviation airports if they account for enough activity (usually at least 10 locally based aircraft) and are at least 20 miles from the nearest NPIAS airport. The activity criterion may be relaxed for remote locations or other mitigating circumstances.
Part 139 Classification The FAA further classifies airports per “Part 139”, a term referring to regulation Title 14, Code of Federal Regulations (CFR), Part 139 (14 CFR Part 139). This certification classifies airports capable of serving large commercial carriers or charter operations into classes (I-IV):
� Class I Airports are those that have regularly scheduled large aircraft (30+ seats) service carriers.
� Class II Airports scheduled small aircraft (10-30 seats) as well as unscheduled large aircraft (30+ seats) service.
� Class III Airports only have small aircraft (10-30 seats) service. � Class IV Airports only serve unscheduled large aircraft operations.
Table 8 - Airport Classifications
Code NPIAS Part 139 Manchester-Boston Regional Airport MHT Primary Commercial Class I Worcester Regional in Massachusetts ORH Primary Commercial Class I Bradley International in Connecticut BDL Primary Commercial Class I Boston Logan International Airport BOS Primary Commercial Class I Lebanon Municipal Airport LEB Non-Primary Commercial Class III Dillant-Hopkins in Swanzey EEN General Aviation Not Certified Jaffrey Airport-Silver Ranch (privately owned, open to public) AFN General Aviation Not Certified
The following air transportation facilities are not opened to the public and therefore not classified, ineligible for AIP (not on NPIAS) and are too small for the Part 139 classification:
o Millipore Heliport in Jaffrey o Cheshire Medical Center Heliport in Keene o Hawthorne-Feather in Antrim o Frank D. Comerford Airfield in Walpole o Pilgrim's Home Airfield in Westmoreland
Dillant-Hopkins Airport (EEN) Dillant-Hopkins Airport is the only municipally-owned public air facility in the Southwest Region. The Airport is located in Swanzey and is owned by the City of Keene. Dillant-Hopkins serves mostly single and multi-engine piston powered planes, which account for 89% of all take off and landings and 95% of all based aircrafts. Air taxi operations account for only 3% of activity with military operations making up the final 8%.
Southwest Region Transportation Plan 2007 Update
SWRPC 45
2The development of the Airport is directed by the City of Keene’s Airport Master Plan and the Airport Advisory Commission and administered by City staff. The City of Keene identifies the Dillant-Hopkins Airport as an important economic resource for the City and the Region. The Airport has implemented several improvements called for in the State Plan including the installation of Precision Approach Slope Indicator Approach Systems on two runways and construction of additional hangars. The Airport’s existing aircraft aprons are scheduled for reconstruction and additional perimeter fencing is required. The Airport can support a wide variety of aviation activities and has the potential to make a significant contribution to the local and regional economy. In an effort to capitalize on the Airport’s economic development potential, the Airport Development Committee recommended the following improvements: 1) changes in zoning which would allow for an environment more conducive to growth and development; 2) construction of additional hangar facilities for single, multi and jet engine aircraft; 3) creation of a marketing fund to advertise the Airport and its facilities; 4) employing a recruiter to identify and attract new tenants; and 5) establishment of a free trade zone be prepared (AAC, A New Beginning, 1997). In 1999 the City of Keene continued to explore the Airport’s development potential and commissioned a report examining the feasibility of further developing sites on and adjacent to the Dillant-Hopkins Airport for aviation use. There are currently 70 aircraft based on the field. The Airport is an uncontrolled airfield and as such only estimates the annual aircraft operations: operations are currently estimated at 60,000 - 65,000 per year. Aircraft operations in 1997 averaged 149 per day or 50,000-54,000 per year, with local general aviation representing 63% of aircraft operations. Transient general aviation, commercial, military and air taxi represent 15%, 12%, 7% and 2% of aircraft operations respectively. Annual aircraft operations and number of registered aircraft are well below the forecasts prepared for the 1991 Master Plan Update and in the State’s Airport Master Plan. The problem with attracting commuter service to Dillant-Hopkins Airport was best explained by the NH Aeronautics Commission in 1962:
“The problem of public air transportation in NH is common to the historic problem of all common carrier transportation in the state. The factors of short distances, lack of a large concentration of population to generate a volume of traffic characteristic of a strong terminal, and remote geographic location ‘at the end of the line’ without the benefit of service as an intermediate point, are magnified and aggravated by the very characteristics of air transport which dictate high speed and non-stop operation over long distances to take maximum advantage of this form of travel”18
Manchester-Boston Regional Airport (MHT) The Manchester-Boston Regional airport is the largest airport in Northern New England, it served over 4.3 million passengers in 2005 and 155 million pounds of cargo went through its terminal. Manchester-Boston Airport (MHT) provides non-stop flights to many destinations, which can also serve to connect to flights to anywhere in the country or the world. Manchester-Boston Airport is experiencing a huge growth in passenger travel, and plans are underway to expand both the number of flights and airlines as well as the infrastructure to better serve the flying public. 18 A Plan for the Development of Airports in NH, NHDOT 2003 P.10
Southwest Region Transportation Plan 2007 Update
SWRPC 46
2Passenger and cargo traffic has increased at a record pace: a 75% increase in passenger activity in 1998 and 45% increase in 1999. Air cargo traffic increased 8% in 1998 and 20% in 1999. The Airport has exceeded the year 2000 passenger traffic forecast in the 1997 Manchester Airport Master Plan Update. High passenger numbers predicted for 2000 were 794,000. Passenger enplanements exceeded 1.4 million in 1999 and are 3.7 million in 2004.19 As anticipated in the State Airport Plan, the Manchester-Boston Airport has made significant improvements to accommodate the current and forecasted levels of activity, including terminal and parking expansion. Several of the projects identified in the Manchester Airport Master Plan have been accelerated to meet travel demand. Projects underway include runway and taxiway extensions, construction of an elevated pedestrian walkway, airport access improvements, and construction of a new air traffic control tower. New planning documents are currently under development for the Manchester-Boston Airport Other Regional Airports The Southwest Region has two permitted water landing sites (Lake Nubanusit in Nelson and Thorndike Pond in Jaffrey) and one private registered airport located in Jaffrey (Silver Ranch Airport). Silver Ranch Airport is considered to be among one of the more economically viable private airports in the state. The State’s Airport Plan recommends that Jaffrey’s Silver Ranch Airport be included in the National Integrated Aviation System and that its status be upgraded to General Utility. Bradley and Logan International Airports are also important to the Regional transportation system (see Map 16). Bradley International is located north of Hartford, CT and is located 90 miles south of Keene, accessible through Interstate 91. Logan Airport is located in Boston, MA and is about 87 miles from Keene. Both airports are major hubs and provide connecting flights to most parts of the United States and the world. Park and ride service is available from Thomas Transportation of Keene to both of these airports, as well as to Manchester.
Rail Transportation Rail transportation in New Hampshire has steadily declined during the past several decades. Today, New Hampshire has approximately 450 miles of active rail road compared to 1,260 miles in the early 1900’s. Today, rail transportation (Map 16) is limited to Amtrak service from Brattleboro and Bellows Falls, VT with connections north to Burlington, VT and Montreal and south to New York, Philadelphia, and Washington. Of this system, known as the Connecticut River Main Line, only 24 miles of track are located in New Hampshire, extending from the Vermont border in Walpole to the Vermont border in Cornish. The line is privately owned by Central Vermont Railway. The Federal Railroad Administration designates this section of track as a Class III, which means the operating speed for freight trains is 40 Mph and 60 Mph for passenger trains. There are two intact railroads in the Southwest Region - one serves the Green Mountain Flier Excursion Train in North Walpole; the second is the inactive Hillsboro Branch rail line in Bennington and Greenfield. 19 New England Regional Airport System Plan, p. 29
Southwest Region Transportation Plan 2007 Update
SWRPC 47
2The Green Mountain Flier Excursion Train uses track extending from the Vermont Border in Walpole to the Vermont border in Cornish in addition to several hundred yards of spur line in North Walpole crossing the Connecticut River near the Vilas Bridge into Bellows Falls, VT. The NH DOT Bureau of Rail and Transit is responsible for railroad planning within the State and is required to maintain a State Rail Plan. The State Rail Plan articulates the State’s philosophy and policy regarding the role of rail transportation in New Hampshire and describes the extent and condition of the State’s rail industry. The 1975 State Rail Plan was updated in 1991, 1993, and 2000. The State’s policy regarding railroad transportation as articulated in the 1991 State Rail Plan is: “to promote a balanced and integrated transportation system, through the maintenance of adequate rail freight and rail passenger services to serve the needs of New Hampshire’s people and industries, and through the improvement of these services wherever and whenever it is in the State’s power to do so”. NH DOT considers rail transportation to be a vital component of an intermodal transportation system and a contributor to the State’s economic development. As such, NH DOT has committed to a policy of preserving New Hampshire’s extensive network of abandoned railroad corridors for possible active rail use in the future and assisting in securing funding for the rehabilitation of remaining active lines. Abandoned rail lines acquired by the State in the Southwest Region for interim recreational trail use20 are the Cheshire Line, the Ashuelot Line, the Fort Hill Line, and the Monadnock Line. (Map 16) The NH DOT is also promoting renewed commuter rail service in southern New Hampshire, specifically, to extend commuter rail from Lowell, Massachusetts to Nashua and other southeastern New Hampshire communities. Commuter service is available to Exeter, Durham, and Dover as a result of a State of Maine initiative to provide passenger rail service from Boston, MA to Portland, ME. There are no commuter rail options being examined in the Southwest Region, however, AMTRAK does operate the Vermonter line with stations in Brattleboro and Bellows Falls, VT which are also reachable by intercity bus from Keene. New Hampshire Integrated Transportation and Rail Advisory Council Recognizing the importance of maintaining an integrated transportation system, Governor Jeanne Shaheen established the New Hampshire Integrated Transportation and Rail Advisory Council on May 18, 2000. Representation on the Council comprises governmental agencies, private industry and the rural and metropolitan regional planning commissions. The Council is responsible for:
� “identify[ing] and address[ing] national, regional, statewide and local issues that impact highway, rail, and air transportation in New Hampshire with the goal of creating a balanced and integrated transportation system.
� provide[ing] a forum for effective participation in rail, highway, and air transportation planning processes by state agencies, businesses, and individuals involved in the intermodal transportation of people and goods.
� engage[ing] with the state in the development of a long range strategic transportation plan that integrates highway, rail, and air transportation.
20 New Hampshire’s Rail Trail network is managed by the NH Department of Resources and Economic Development Trails Bureau.

Southwest Region Transportation Plan 2007 Update
SWRPC 48
2� assist[ing] the state in optimizing use of our transportation infrastructure in the context of New Hampshire’s economy, environment, and heritage.”
Freight
With the absence of rail facilities and inland waterways in the Region, freight must move over land via truck on the existing highway system. Most truck traffic can move over the Class I and II state system, but there are limitations to overweight and double trailers.
Pedestrian and Bicycle The Southwest Region, just as most of America, has built its communities around the automobile. Pedestrian traffic has become obsolete in many rural, suburban and urban communities for several reasons: it is relatively too slow, walking along many of our roads and highway can be dangerous; while residential, retail and employment are geographically disparate. There may also be larger, social reasons for the decline of walking as a mode of personal transportation, linked with perceived quality of life in the consumer economy, and risk of exposure to the criminal element. Most of the roads and highways of the Region have been designed and maintained without regard for accommodating pedestrians. That is, there are no parallel, separate paths for pedestrians. Pedestrians must use the same space designated for cars and trucks. Traffic speeds and visibility limitations of topography, road-side vegetation, or darkness create dangerous conditions. Safe pedestrian access within the Region is limited. Several of the larger population centers (Keene, Peterborough, Winchester, Hinsdale and Jaffrey) have sidewalk networks, Keene has designed and constructed a pedestrian oriented downtown where pedestrians are buffered from traffic, traffic is restricted on side streets, and the design in general makes pedestrian right of way implicit. However, many of the Region’s village centers have inappropriately become thoroughfares for car and truck traffic, displacing pedestrians from community centers. Bicycles have not been widely used for daily transportation in the Southwest Region, however there has been a resurgence of recreational bicycle use in the area. There has been a noticeable increase in the number of bicycles around population centers and throughout the Region. The demographics of bicyclists has become quite diverse. There is strong support for designated bicycle routes to serve recreational and commuting traffic in the Southwest Region. Keene has an established bicycle network used for recreational and daily trips by residents. Peterborough is also developing a bike path through town. These village systems are integral with the Region’s Rails-to-Trails network. Opportunities for recreational hiking and biking within the Region are numerous with the presence of an extensive Rails-to-Trails system and several long distance trails, most notably, the Appalachian Trail. The Southwest Region Rails-to-Trails network comprises the abandoned Cheshire, Ashuelot, Fort Hill, Monadnock and Chesham railroads. This network connects 16 Southwest Region towns. Rail Trail development is undertaken by NH DRED, area trail user groups such as snowmobilers and cyclists, regional conservation organizations and municipalities.
Southwest Region Transportation Plan 2007 Update
SWRPC 49
2State Management In 1977, NH DOT developed and adopted a Statewide Bicycle and Pedestrian Plan. The Plan, was updated in 1995 and again in 2000 to address the increased emphasis accorded to inter-modal transportation under TEA-21. The primary goal of the Statewide Plan is “to recognize, support and encourage bicycling and walking as alternatives to motorized forms of transportation and as an element of the state’s intermodal transportation system”. By adoption of the Plan, NH DOT commits to “promoting bicycling and walking as viable modes of transportation” and providing safe and efficient facilities for bicyclists and pedestrians. NH DOT will 1) consider bicycle/pedestrian concerns in all transportation projects, 2) where conditions permit, provide pavement markings as part of normal re-striping operations to create paved shoulders where none exist now and 3) work with the state’s regional planning commissions to develop and maintain appropriate bicycle and pedestrian facilities where feasible. (Map 16) To serve inter-regional bicycling needs, NH DOT in conjunction with the nine regional planning commissions, interested citizens and the Statewide Bicycle Advisory Board developed and adopted a Statewide Bicycle Route System as part of the Bicycle and Pedestrian Plan. NH DOT is committed to identifying and improving the System where feasible within its overall transportation planning effort. Regional Bicycle networks are currently being developed by the Regional planning commissions at a higher level of resolution to “in-fill” the Statewide Bicycle Route System. TEA-21 provides federal funding for managing, enhancing and developing state bicycle and pedestrian facilities. The following Federal-aid highway funds may be used by the state for developing bicycle and pedestrian facilities: National Highway System, Surface Transportation Program, Congestion Mitigation and Air Quality, Federal Lands, Scenic Byways and Recreational Trails Funds. Funds for the development of local bicycle and pedestrian facilities are available to municipalities on a competitive basis through the Transportation Enhancement Program. Local Management Pedestrian and bicycle planning at the municipal level is administered through Municipal Master Plans. Master Plans ideally summarize the extent and condition of facilities and articulate the municipalities’ policy regarding pedestrian and bicycle opportunities within the community. Municipalities are responsible for maintaining the municipal sidewalk network (on state and local roads) and municipal trail networks. Local Recreation Committees and Conservation Commissions are often active in planning and promoting enhanced pedestrian and bicycle access. Municipal budgets serve as the primary funding source for maintaining pedestrian and bicycle facilities. In the past several decades, pedestrian and bicycle access has been incidental to road development. Recently, there has been a noticeable increase in the demand for designated safe bicycle and pedestrian facilities in many Southwest Region towns. Many communities in the Southwest Region have identified this system deficiency in their Master Plans and are committed to finding ways to improve the system. The Southwest Region population, employment and service centers support the development of a local network of sidewalks and bike trails using
Southwest Region Transportation Plan 2007 Update
SWRPC 50
2municipal funds, volunteer organization fund-raising and Transportation Enhancement funding. The City of Keene has an established bicycle network for recreational and commuter activity. The towns of Peterborough and Jaffrey are developing bike paths through town and enhancing pedestrian facilities in the town center. The towns of Antrim, Greenfield and Hinsdale are also improving pedestrian access in their town centers.
Public Transportation Public transportation in the Southwest Region consists of private bus companies, private taxi and charter transportation companies, airport shuttle services, community service shuttle providers and a fixed route public bus system in the City of Keene. The low population densities, dispersed commuter patterns, and high car ownership rates in the Region have precluded the development of regional public transportation. Community transportation services are provided by a number of organizations in Keene and the surrounding area. Some of the services are open to the public, while others are targeted toward certain special needs populations. Home Health Care and Community Services (HCS) operates a fixed route/fixed schedule public bus service in the City of Keene called the City Express. The City Express recently expanded its services from a single route to a three route system. The local shuttle route services major employment areas, residential neighborhoods and shopping centers north of Central Square in Keene. The Downtown Shuttle services the major employment areas and shopping centers to the east and west of Central Square. Further expansion depends on several variables, such as the availability of funding. Establishment of an integrated and coordinated public transit and human services transportation system in the Monadnock Region is currently being examined and pursued in stages. The Planning Commission continues to analyze the feasibility of enhanced public transit services in the City of Keene. In 2006 the commission was funded through NH Department of Transportation under FTA Section 5304 to develop a coordinated public transit-human services transportation plan. SAFETEA-LU now requires that projects receiving funds from three FTA formula programs (sections 5310, 5316 and 5317) be competitively selected based on a Coordinated Public Transit and Human Service Transportation Plan (The Coordinated Plan). The purpose of the Coordinated Plan is to identify redundancies and gaps among public transportation and human services transportation providers in the Southwest Region, and recommend strategies to eliminate or mitigate identified redundancies and gaps. The Planning Commission has also been facilitating the organization of a group to advocate the use of Travel Demand Management (TDM) strategies in the Keene-Swanzey Bypass traffic-shed. TDM is concerned with reducing peak-hour (rush hour) traffic volumes as an alternative to highway expansion. TDM typically includes roles for both the public and private sectors. In July 2000, the Commission undertook a study to examine 1) costs and benefits of the integration of enhanced transit service in the Keene area transportation system; 2) conceptual alternatives for the use of the City of Keene’s Transportation Center as an intermodal hub for public transportation in the Keene area; and 3) feasibility of developing a transit management entity inclusive of stakeholders and management resources in the Keene area. It is the intent of the study to promote working relations among NH DOT, HCS, City of Keene, the Planning
Southwest Region Transportation Plan 2007 Update
SWRPC 51
2Commission and other public and private entities (e.g., universities, public school system, large employers, and other businesses) toward the goal of developing and operating effective public transportation in the Southwest Region. “Effective public transportation” depends on 1) the establishment of an effective public transportation system within the City of Keene, 2) attainment of the necessary supply-demand service thresholds, and 3) adequate funding sources. The NH DOT Bureau of Rail and Transit acknowledges the west-east bus service deficiency and encourages the affected regional planning commissions to identify the deficiency as a priority in regional TIPs. Private Transportation Providers in the Southwest Region Vermont Transit Lines offers service to Montreal, New York and Boston with stops in Greenfield, Northampton and Springfield, Mass.; Brattleboro, Bellow Falls, White River Junction, Ascutney, Montpelier, and Burlington, Vt.; Hartford, Connecticut; and Hanover, NH. Eight trips daily leave from Keene Transportation Center with 48 to 56 riders: mostly Keene State College students and seniors. Laidlaw Transit, Inc. provides service for public schools in Cheshire County (excluding Westmoreland) including special transportation for handicapped students, sports and extra-curricular activities. Other services for Keene State and Franklin-Pierce Colleges include 12 to 15 trips daily (1600 to 2000 annually). Laidlaw employs 100 persons locally. Laidlaw also operates fixed-route/fixed-schedule bus service in Brattleboro, Vermont. Ridership levels are steady at 50 to 60 riders/day with 180 service-miles/day. Other private transportation providers include:
� Monadnock Transportation � Thomas Transportation Services, Inc. � Ideal Taxi Service � Adventure Limousine � Swanson Limousine
Southwest Region Transportation Plan 2007 Update
SWRPC 52
2Development Trends & Land Use Patterns Development trends and land use patterns have a direct impact on our transportation system. Inefficient land uses lead to inefficient and expensive transportation systems, increasing our reliability on the automobile. This in turn increases pollution and the cost and time spent commuting while degrading our quality of life.21 Land use and transportation planning should be coordinated in order to achieve the goals of the Region.
Generalized Zoning Districts Map 11 shows generalized zoning districts in the Region. The term generalized means that while towns might have differing terms for their zoning, the overall permitted uses are the same. Most of the Southwest Region’s state highways are bordered by rural residential zoning, wherein relatively large lot sizes and single family residential use are the primary intent (Map 11 and Table 9). However, many municipal zoning ordinances allow a wide range of commercial and other trip-intensive uses outright or by special exception. Zoning ordinances and site plan review regulations are the primary means by which municipalities can have a direct impact on highway capacity, safety, and congestion. Most of the highways in the Region are bordered by rural residential districts. The most direct public involvement with travel demand lies in public regulation of land use. Through zoning ordinances and subdivision and site plan review regulations, municipalities can manage the kinds and densities of uses and the dimensions of lots, including road frontage and distances between driveways. Zoning and site standards can have dramatic effects on the longevity of new investments in highway capacity and safety.
Table 9 - Miles of Frontage by Generalized Zoning District
ZONE Total Frontage
(miles) % of Total
Commercial 206 4.98% Conservation 318 7.68% Industrial 49 1.18% Institutional 6 0.15% Mixed Use 121 2.92% Medium-High Density Residential 724 17.50% Rural Residential 2,535 61.26% None 179 4.33%
Total 4,138 100%
Destinations and Community Centers Map 12 shows community centers, popular destinations (retail & work), and population densities. It clearly shows where the Regional centers are located, and their relation to our highway system. 21 NH Long Range Transportation Business Plan, CAC Report p.4.
Southwest Region Transportation Plan 2007 Update
SWRPC 53
2Conservation Land Map 13 shows the physical base upon which all transportation and development decisions take place. This map shows that a large area of the Region is covered by conservation and public lands. Conservation land is one of the most stringent development constraints, since no development can take place on these lands.
Population Growth & Household Densities
Population growth and estimated growth compiled from the US Census Bureau and NH Office Energy and Planning indicate that towns in the Southwest Region have been growing at a slow yet steady rate. This growth has been punctuated by large commercial developments within the Region such as the Monadnock Marketplace in Keene. Table 10 presents the changes in population for the period 1980-2005 by highway corridor. Figures 17-22 show the growth in population, households, and housing units in the municipalities along the main highway corridors. Significant commercial development within the Region has occurred primarily along the US 202 corridor, the NH 10 and NH 12 corridors within Swanzey and within the City of Keene. Beyond general observations, commercial development patterns are difficult to monitor. A detailed analysis of development patterns would require access to historic information extracted from local tax assessor’s digital data base combined with zoning data which is currently unavailable. Map 14 shows the number of building permits issued for new development from 2000 to 2004. This map shows the continued growth in the Region. Rindge, New Ipswich and Swanzey led in the number of permits issued, which are also the areas leading the growth in traffic. Map 15 depicts household densities in the Region. This information is gathered from Census 2000 information on block level data.
Commuter Patterns Commuter data extracted from the 2000 U.S. Census and its Census Transportation Planning Package (CTPP) datasets indicate that daily commuter traffic creates a significant component of demand for highway capacity in the Southwest Region. With the exception of the City of Keene and the Town of Peterborough, the majority of residents in the Southwest Region towns commute to other towns to work. Between 1990 and 2000, the employed civilian population over the age of 16 increased by 7% from 47,442 to 50,704.22 The distribution of employment in 2004 was 19,584 jobs in Keene, 5,096 in Peterborough, 2,425 in Jaffrey, 1,973 in Swanzey, 1,803 in Rindge and 1,291 in Walpole; and about 1,000 or less in each of the remaining 30 Southwest Region towns.23 Most workers are not employed in their town of residence. This data is shown graphically in Maps 18a and 18b. Origin and destination surveys conducted in the summer of 1998 as part of the NH 101 Corridor Study indicate that NH 101 functions primarily as a local commuter highway. Approximately 80% of the trips on NH 101 began and/or ended within one of the NH 101 Corridor Towns (Keene through Milford). Only 20% of the trips were through traffic with an origin and 22 Comprehensive Economic Development Strategy for Southwest New Hampshire, p. 25 23 2005 Economic & Labor Market Information Bureau, NH Employment Security
Southwest Region Transportation Plan 2007 Update
SWRPC 54
2destination outside of the corridor; a finding that contradicts the commonly expressed notion that NH 101 serves primarily inter-state traffic. Similar traffic flow patterns in the Region may be inferred from the traffic volume data. A 1994 transportation survey conducted in the Southwest Region further described the extent of commuter activity in the Region. According to this survey, the majority of commuters in the Southwest Region traveled to work in a single-occupancy vehicle; less than 3% of commuters surveyed reported traveling to work with someone else. Almost one-fourth of commuters surveyed traveled less than three miles to work with the average commuter living 15.5 miles from his or her place of employment. It took the average commuter 23.4 minutes to drive one-way to work. The average commuter drove a total of 155 miles per week to-and-from work.

Table 10 - Population Growth by Highway Corridor 2007 Update
21980 1990 2000 2005*
Population Change '80-'05
% Pop. Change '80-'05
1980 1990 2000 2005**Household
Change '80-'05
% Household Change '80-'05
1980 1990 2000 2005***
Housing Units
Change '80-'05
% Housing Units
Change '80-'05
Route 9 Route 9Chesterfield 2,561 3,112 3,542 3,771 1,210 47.25% 916 1,186 1,366 1,475 289 61.0% 1,003 1,527 1,632 1,791 788 78.6% ChesterfieldKeene 21,449 22,430 22,563 23,023 1,574 7.34% 7,601 8,391 8,955 9,155 764 20.4% 7,934 8,419 9,295 9,530 1,596 20.1% KeeneRoxbury 190 248 237 242 52 27.37% 65 87 89 95 8 46.2% 85 95 91 97 12 14.1% RoxburySullivan 585 706 746 785 200 34.19% 185 245 282 288 43 55.7% 201 283 294 309 108 53.7% SullivanNelson 442 535 634 656 214 48.42% 116 200 247 262 62 125.9% 171 379 404 433 262 153.2% NelsonStoddard 482 622 928 992 510 105.81% 203 251 400 433 182 113.3% 260 890 939 1,039 779 299.6% StoddardAntrim 2,208 2,360 2,449 2,604 396 17.93% 683 866 932 1,005 139 47.1% 779 1,162 1,160 1,277 498 63.9% Antrim
Total 27,917 30,013 31,099 32,073 4,156 14.9% 9,769 11,226 12,271 12,713 1,487 30.1% 10,433 12,755 13,815 14,476 4,043 38.8%
Route 10 Route 10Hinsdale 3,631 3,936 4,082 4,267 636 17.52% 1,326 1,560 1,622 1,714 154 29.3% 1,357 1,655 1,714 1,843 486 35.8% HinsdaleWinchester 3,465 4,038 4,144 4,314 849 24.50% 1,226 1,454 1,557 1,643 189 34.0% 1,342 1,673 1,741 1,873 531 39.6% WinchesterSwanzey 5,183 6,236 6,800 7,229 2,046 39.48% 1,836 2,384 2,666 2,908 524 58.4% 1,894 2,582 2,818 3,102 1,208 63.8% SwanzeyKeene 21,449 22,430 22,563 23,023 1,574 7.34% 7,601 8,391 8,955 9,155 764 20.4% 7,934 8,419 9,295 9,530 1,596 20.1% KeeneGilsum 652 745 777 810 158 24.23% 220 276 310 322 46 46.4% 237 320 323 358 121 51.1% GilsumMarlow 542 650 747 783 241 44.46% 189 243 292 310 67 64.0% 234 364 387 424 190 81.2% Marlow
Total 34,922 38,035 39,113 40,426 5,504 15.8% 12,398 14,308 15,402 16,052 1,744 29.5% 12,998 15,013 16,278 17,130 4,132 31.8%
Route 12 Route 12Fitzwilliam 1,795 2,011 2,141 2,275 480 26.74% 664 751 836 901 150 35.7% 745 1,031 1,074 1,167 422 56.6% FitzwilliamTroy 2,131 2,097 1,962 2,021 -110 -5.16% 736 793 733 769 -24 4.5% 782 867 778 831 49 6.3% TroyMarlborough 1,846 1,927 2,009 2,102 256 13.87% 658 745 829 873 128 32.7% 703 856 893 953 250 35.6% MarlboroughSwanzey 5,183 6,236 6,800 7,229 2,046 39.48% 1,836 2,384 2,666 2,908 524 58.4% 1,894 2,582 2,818 3,102 1,208 63.8% SwanzeyKeene 21,449 22,430 22,563 23,023 1,574 7.34% 7,601 8,391 8,955 9,155 764 20.4% 7,934 8,419 9,295 9,530 1,596 20.1% KeeneWestmoreland 1,452 1,596 1,747 1,865 413 28.44% 415 502 576 615 113 48.2% 451 573 618 670 219 48.6% WestmorelandWalpole 3,188 3,210 3,594 3,703 515 16.15% 1,184 1,323 1,490 1,555 232 31.3% 1,288 1,465 1,592 1,675 387 30.0% Walpole
Total 37,044 39,507 40,816 42,218 5,174 14.0% 13,094 14,889 16,085 16,776 1,887 28.1% 13,797 15,793 17,068 17,928 4,131 29.9%
Route 101 Route 101Keene 21,449 22,430 22,563 23,023 1,574 7.34% 7,601 8,391 8,955 9,155 764 20.4% 7,934 8,419 9,295 9,530 1,596 20.1% KeeneMarlborough 1,846 1,927 2,009 2,102 256 13.87% 658 745 829 873 128 32.7% 703 856 893 953 250 35.6% MarlboroughDublin 1,303 1,474 1,476 1,545 242 18.57% 422 521 560 595 74 41.0% 491 651 686 733 242 49.3% DublinPeterborough 4,895 5,239 5,883 6,134 1,239 25.31% 1,841 2,050 2,346 2,484 434 34.9% 1,952 2,242 2,509 2,701 749 38.4% PeterboroughTemple 692 1,194 1,297 1,518 826 119.36% 238 394 440 513 119 115.5% 252 429 464 552 300 119.0% Temple
Total 30,185 32,264 33,228 34,322 4,137 13.7% 10,760 12,101 13,130 13,620 1,519 26.6% 11,332 12,597 13,847 14,469 3,137 27.7%
Route 119 Route 119Hinsdale 3,631 3,936 4,082 4,267 636 17.52% 1,326 1,560 1,622 1,714 154 29.3% 1,357 1,655 1,714 1,843 486 35.8% HinsdaleWinchester 3,465 4,038 4,144 4,314 849 24.50% 1,226 1,454 1,557 1,643 189 34.0% 1,342 1,673 1,741 1,873 531 39.6% WinchesterRichmond 518 877 1,077 1,146 628 121.24% 189 307 379 409 102 116.4% 230 398 432 473 243 105.7% RichmondRindge 3,375 4,941 5,451 6,130 2,755 81.63% 948 1,298 1,502 1,712 414 80.6% 985 1,781 1,863 2,179 1,194 121.2% RindgeFitzwilliam 1,795 2,011 2,141 2,275 480 26.74% 664 751 836 901 150 35.7% 745 1,031 1,074 1,167 422 56.6% FitzwilliamNew Ipswich 2,433 4,014 4,289 4,945 2,512 103.25% 771 1,208 1,350 1,571 363 103.8% 798 1,326 1,449 1,740 942 118.0% New Ipswich
Total 15,217 19,817 21,184 23,077 7,860 51.7% 5,124 6,578 7,246 7,950 1,372 55.2% 5,457 7,864 8,273 9,275 3,818 70.0%
Route 202 Route 202Rindge 3,375 4,941 5,451 6,130 2,755 81.63% 948 1,298 1,502 1,712 414 80.6% 985 1,781 1,863 2,179 1,194 121.2% RindgeJaffrey 4,349 5,361 5,476 5,755 1,406 32.33% 1,659 2,094 2,120 2,250 156 35.6% 1,770 2,426 2,352 2,515 745 42.1% JaffreyPeterborough 4,895 5,239 5,883 6,134 1,239 25.31% 1,841 2,050 2,346 2,484 434 34.9% 1,952 2,242 2,509 2,701 749 38.4% PeterboroughHancock 1,193 1,604 1,739 1,818 625 52.39% 453 639 706 746 107 64.7% 495 723 814 873 378 76.4% HancockBennington 890 1,236 1,401 1,500 610 68.54% 322 466 552 594 128 84.5% 347 643 635 693 346 99.7% BenningtonAntrim 2,208 2,360 2,449 2,604 396 17.93% 683 866 932 1,005 139 47.1% 779 1,162 1,160 1,277 498 63.9% Antrim
Total 16,910 20,741 22,399 23,941 7,031 41.6% 5,906 7,413 8,158 8,791 1,378 48.8% 6,328 8,977 9,333 10,238 3,910 61.8%
* 2005 population from OEP estimates** 2005 households from OEP estimates
POPULATION CHANGE BY STATE ROUTE HOUSEHOLDS CHANGE BY STATE ROUTE HOUSING UNITS CHANGE BY STATE ROUTE
Z:\Transportation\TAC\06plan\populations.xls
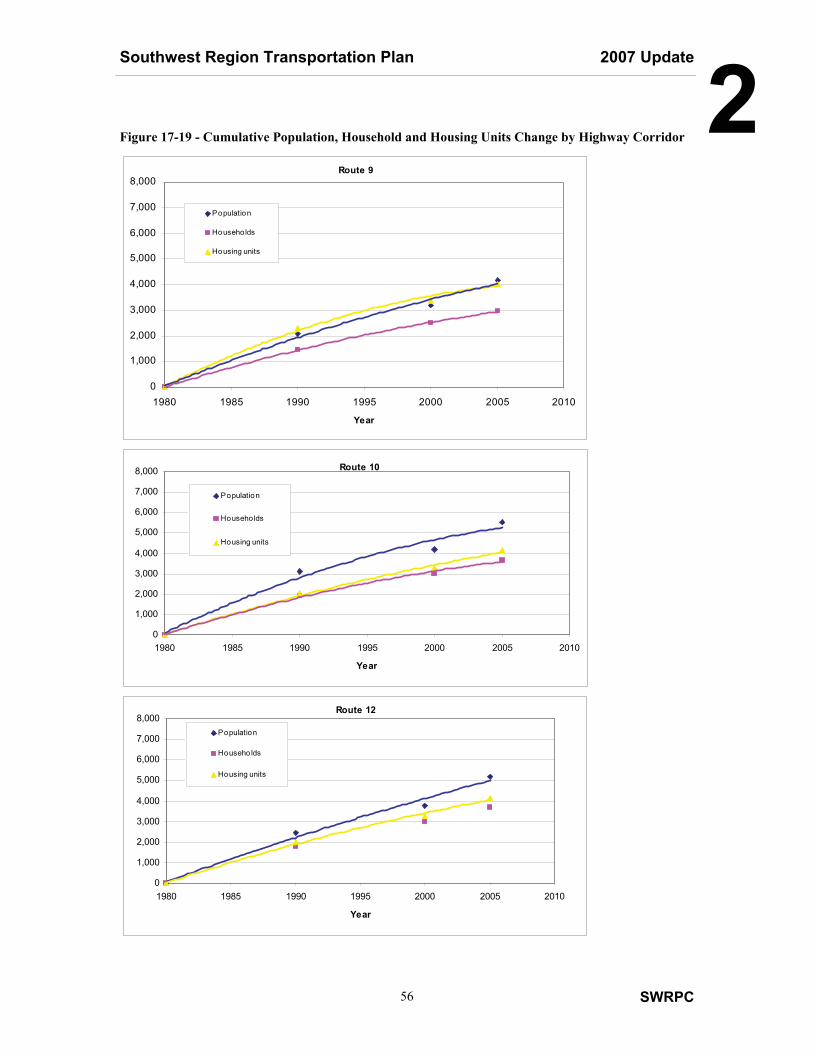
Southwest Region Transportation Plan 2007 Update
SWRPC 56
2Figure 17-19 - Cumulative Population, Household and Housing Units Change by Highway Corridor
Route 9
0
1,000
2,000
3,000
4,000
5,000
6,000
7,000
8,000
1980 1985 1990 1995 2000 2005 2010
Year
Population
Households
Housing units
Figure 18
Route 10
0
1,000
2,000
3,000
4,000
5,000
6,000
7,000
8,000
1980 1985 1990 1995 2000 2005 2010
Year
Population
Households
Housing units
Figure 19
Route 12
0
1,000
2,000
3,000
4,000
5,000
6,000
7,000
8,000
1980 1985 1990 1995 2000 2005 2010
Year
Population
Households
Housing units
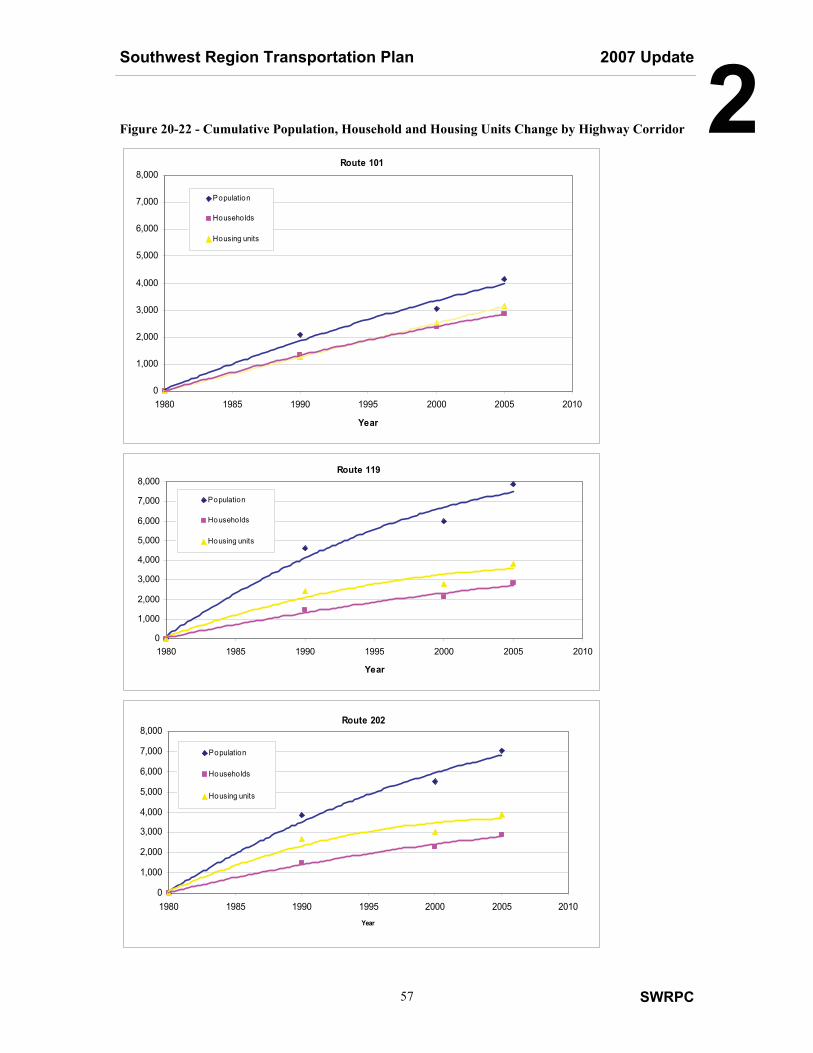
Southwest Region Transportation Plan 2007 Update
SWRPC 57
2Figure 20-22 - Cumulative Population, Household and Housing Units Change by Highway Corridor
Route 101
0
1,000
2,000
3,000
4,000
5,000
6,000
7,000
8,000
1980 1985 1990 1995 2000 2005 2010
Year
Population
Households
Housing units
Figure 21
Route 119
0
1,000
2,000
3,000
4,000
5,000
6,000
7,000
8,000
1980 1985 1990 1995 2000 2005 2010
Year
Population
Househo lds
Housing units
Figure 22
Route 202
0
1,000
2,000
3,000
4,000
5,000
6,000
7,000
8,000
1980 1985 1990 1995 2000 2005 2010Year
Population
Households
Housing units
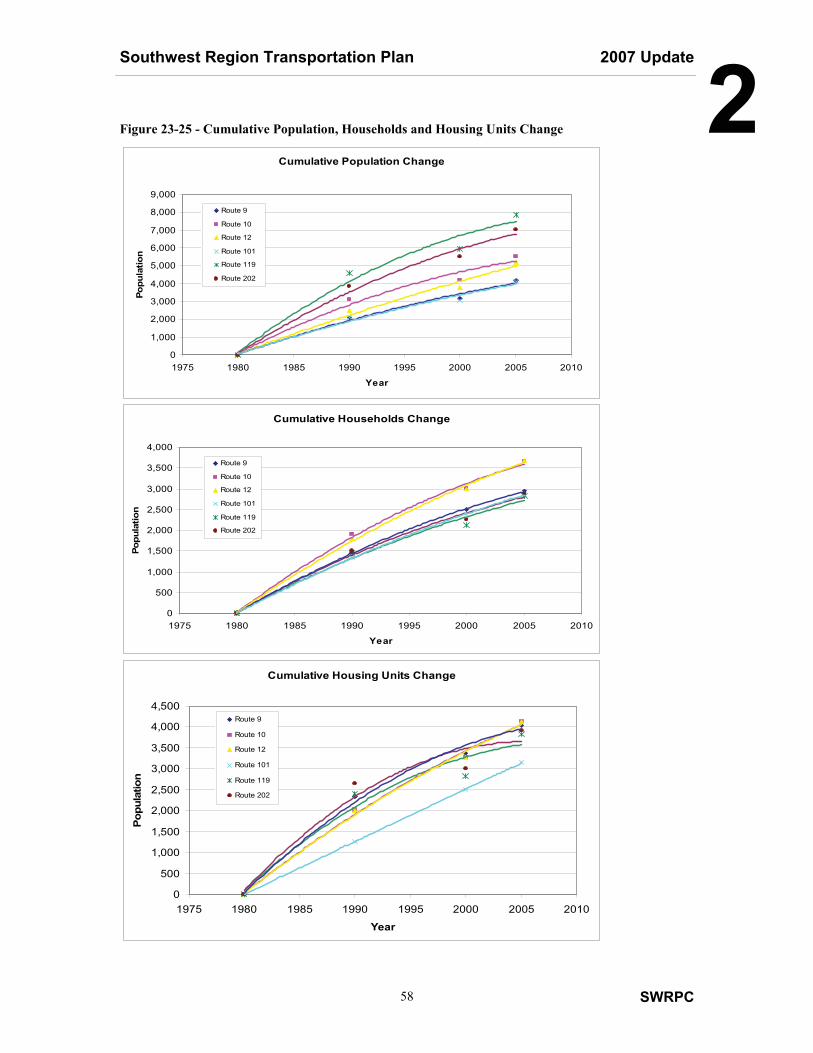
Southwest Region Transportation Plan 2007 Update
SWRPC 58
2Figure 23-25 - Cumulative Population, Households and Housing Units Change
Cumulative Population Change
0
1,000
2,000
3,000
4,000
5,000
6,000
7,000
8,000
9,000
1975 1980 1985 1990 1995 2000 2005 2010
Year
Popu
latio
n
Route 9
Route 10
Route 12
Route 101
Route 119
Route 202
Cumulative Households Change
0
500
1,000
1,500
2,000
2,500
3,000
3,500
4,000
1975 1980 1985 1990 1995 2000 2005 2010
Year
Popu
latio
n
Route 9
Route 10
Route 12
Route 101
Route 119
Route 202
Cumulative Housing Units Change
0
500
1,000
1,500
2,000
2,500
3,000
3,500
4,000
4,500
1975 1980 1985 1990 1995 2000 2005 2010
Year
Popu
latio
n
Route 9
Route 10
Route 12
Route 101
Route 119
Route 202
Southwest Region Transportation Plan 2007 Update
SWRPC 59
2
SWRPC Regional Transportation Planning Program SWRPC undertakes an annual transportation planning and research work program as a basic element of its comprehensive work program to fulfill its mission “to work in partnership with the communities of the Southwest Region to promote sound decision-making for the conservation and effective management of natural, cultural and economic resources”. SWRPC undertakes a regional transportation planning work program for the purposes of: � developing the biennial Southwest Region 10-Year Transportation Improvement Program
pursuant to state requirements under SAFETEA-LU; � supporting the development of local and regional applications for funding under the
Transportation Enhancement and Congestion Mitigation and Air Quality programs; � supporting the maintenance of a regional transportation plan; � maintaining a SWRPC Transportation Advisory Committee as a standing committee to the
SWRPC Board of Directors; � building an informed regional constituency of residents, government officials and others
regarding transportation system needs, management, impacts, and benefits; � imparting regional and statewide perspective to local transportation decision- and policy-
making; � representing local and regional perspectives to statewide transportation decision- and policy-
making; � facilitating public and private decision-making about the transportation system; and � providing the best possible information to transportation policy- and decision-makers. Ultimately, the fulfillment of this work program will contribute to the coordinated development of the Regional transportation network - a network that provides safe efficient access for passenger and freight traffic, including public transportation - a network that is compatible with local and state development goals. This work program, referred to as the Unified Planning Work Program (UPWP) is the basis for a contractual agreement between SWRPC and NH DOT for the purposes of coordinating transportation planning activity at the regional level. Organizing transportation planning work under a UPWP document is required by the federal legislation. The total cost of transportation planning activity described in the UPWP is shared by NH DOT and SWRPC: NH DOT funds 90% and a 10% match is provided by SWRPC through annual municipal membership dues.
Southwest Region Transportation Plan 2007 Update
SWRPC 60
2Traffic & Roadway Research. SWRPC conducts traffic and roadway research in three areas in close coordination with NH DOT: highway traffic counts, intersection turning movement counts and roadway inventory. This field work is directly related to the systems performance measurement and management as previously discussed. It’s also the main method for collecting information which can be used in all subsequent regional planning work. Using Automated Traffic Recorders, daily traffic is counted at up to 150 locations each year, selected by NH DOT from a set of 535 sampling stations in the Southwest Region as shown in Map 6. About 43% (231) of these stations are on state numbered routes, and the remaining are on municipal streets and roads and unnumbered state-maintained roads. Traffic counts can also be set up to collect vehicle classification and directional travel information. Turning movement counts are conducted at intersections as requested by NH DOT. These are direct observation of the movement of each vehicle passing through the target intersection during AM and PM peak times and are used for safety and intersection capacity analyses. Roadway inventory is conducted for each town in the Region on a four year cycle. Each year, towns are selected for inventory work, and the selectmen are contacted. It is the duty of the selectmen to review the existing NH DOT road inventory files and make additions, deletions and changes. Based on this information, Commission staff use GPS technology to map out every Class V and Class IV road in the town. The results are then verified by the Selectmen and submitted to NH DOT.
Information Management SWRPC staff use a Geographic Information System (GIS) as the principal information management and analytic medium for research and planning. Nearly all digital data with a spatial component can be used in the GIS. The power of this system lies in the ability to analyze disparate databases based on their spatial relationship to each other. In this matter, information regarding natural features, zoning districts, town boundaries, transportation networks, and population information can be synthesized to produce maps and data as contained in this report. SWRPC staff continually update GIS data from various sources including State of New Hampshire agencies, federal agencies, member municipalities, and neighboring states. Original data is also generated through the course of the planning work conducted at the Commission. GIS is also a powerful presentation tool, capable of creating visual representations of complex data sets for public consumption. For all these reasons, GIS will continue to be a prominent tool in the work identified under the UPWP.
Interagency Coordination In addition to collecting field data for NH DOT and sharing GIS information, SWRPC staff frequently interacts with DOT staff on project and program development. SWRPC staff will attend public meetings and generally be involved in advising DOT engineers on local issues and concerns during the conceptual and preliminary design of transportation projects within the Region. SWRPC staff are also involved at state level planning efforts.
Southwest Region Transportation Plan 2007 Update
SWRPC 61
2 Planning & Policy
The main UPWP task is the crafting of a blue print for a regional transportation network and subsequent program of required improvements. These documents are the Regional Transportation Plan (RTP) and Southwest Region Transportation Improvement Program (TIP), respectively. SWRPC staff, under the guidance of the Transportation Advisory Committee (TAC), update the Regional Plan at least every five years. This Plan serves the purpose of setting goals and policies of the Commission for the development of the regional transportation network. The TIP is then developed from suggested projects from TAC members and our local municipal officials. These projects are ranked in relation to regional priorities and sent to NH DOT for inclusion in the Statewide Ten Year Plan (TYP). SWRPC staff and TAC members coordinate with NH DOT staff to maintain the TYP by adjusting project dates and cost amounts in order to meet statewide goals and financial responsibilities.
Competitive Grants and Programs In addition to the funding and projects described in the UPWP, SWRPC is also involved in transportation planning projects such as corridor studies, multi-modal plans, transportation management and enhancements. These projects are usually funded through competitive federal grants awarded through NH DOT.
Southwest Region Transportation Plan 2007 Update
SWRPC 62
3Findings and Recommendations
� Regional Connectivity � Management of Existing Infrastructure � Accessibility and Mobility Alternatives � Roadway Improvements � Safety, Security and Hazard Mitigation � Public Participation � SWRPC Assistance to State and Municipalities � SWRPC Transportation Planning Program
Reflecting on the Planning Commission’s purposes and roles as a regional municipal membership organization and contractor to State agencies for planning research, public process and other services, the information presented in Chapters 1 and 2 might best be used to: � establish a set of needs, issues or subject areas to which the Planning Commission
recommends collective attention among Southwest Region municipalities, the Planning Commission and NH DOT;
� identify (and develop priorities among), needs for maintenance, corrections of deficiencies,
infrastructure expansion, and other changes to the infrastructure in relation to the land use and economic development needs of the region;
� identify opportunities for the Planning Commission to assist State activity and municipal
activity, including information, facilitation, and planning; and � refine and guide the SWRPC transportation planning program. In the current environment dominated by public demand for high levels of mobility and public demand to preserve community character, the Region must be judicious and deliberate in choices for the use of scarce funding. Following are six priority areas to which the SWRPC Transportation Advisory Committee recommends the collective attention of Southwest Region municipalities, SWRPC and NH DOT to ensure an informed and effective transportation planning and transportation system management:
Southwest Region Transportation Plan 2007 Update
SWRPC 63
3Regional Connectivity Recommendation: Strengthen multi-modal links to our Southeast in order to access the greater New England economy. Maintain existing regional connectivity by preserving and enhancing capacity of the arterials leading to Keene, as well as those that provide regional access and mobility. Projects: A comprehensive corridor study of NH 12 from Keene to the Mass. state line should be
undertaken. A multimodal transportation strategy should be developed for our region. Improvement projects should be scheduled into the Ten Year Plan.
Our region sits at the center of New England, but our transportation system is oriented towards Keene. As shown on Map 17, there are no interstates, rail, air, or major bus routes connecting our region to the larger Boston Metropolitan area (including Manchester, Nashua, Worcester, etc.). As the suburban and exurban and suburban development approaches from the east and southeast, more commuters are moving to the Region as seen on Map 18. Transportation projects are ongoing in eastern NH with the I-93 corridor expansion and the extension of commuter rail from Lowell, MA to Nashua and eventually Manchester. To the South, MassHighway is scheduling continued expansion and improvements on Route 2 as well as planned expansion of commuter rail along this corridor from Fitchburg to Gardner, MA. The completion in 1980 of the capacity expansion of Massachusetts State Route 140 from Routes 2 near Gardner, MA to 12 in Winchendon, MA dramatically “shortened” the distance between the greater Boston metropolitan area and the southwest Region. Economic growth will follow along these corridors, and it is imperative that our region is adequately connected to it. It is important therefore to maintain and expand links to the larger New England economy, through efforts to enhance the NH 12 and NH 101 corridor, as well as establish multimodal connectivity. Since most roads in our region do lead to Keene, congestion in the Keene area affects everyone in the region. This central node in the regional network must be maintained at a functional level. Current work regarding the bypass project should continue to be monitored. NH routes 9, 10, 119, and 202 should also be of high priority for capacity preservation since they provide regional access and mobility within the Southwest Region and central New England.
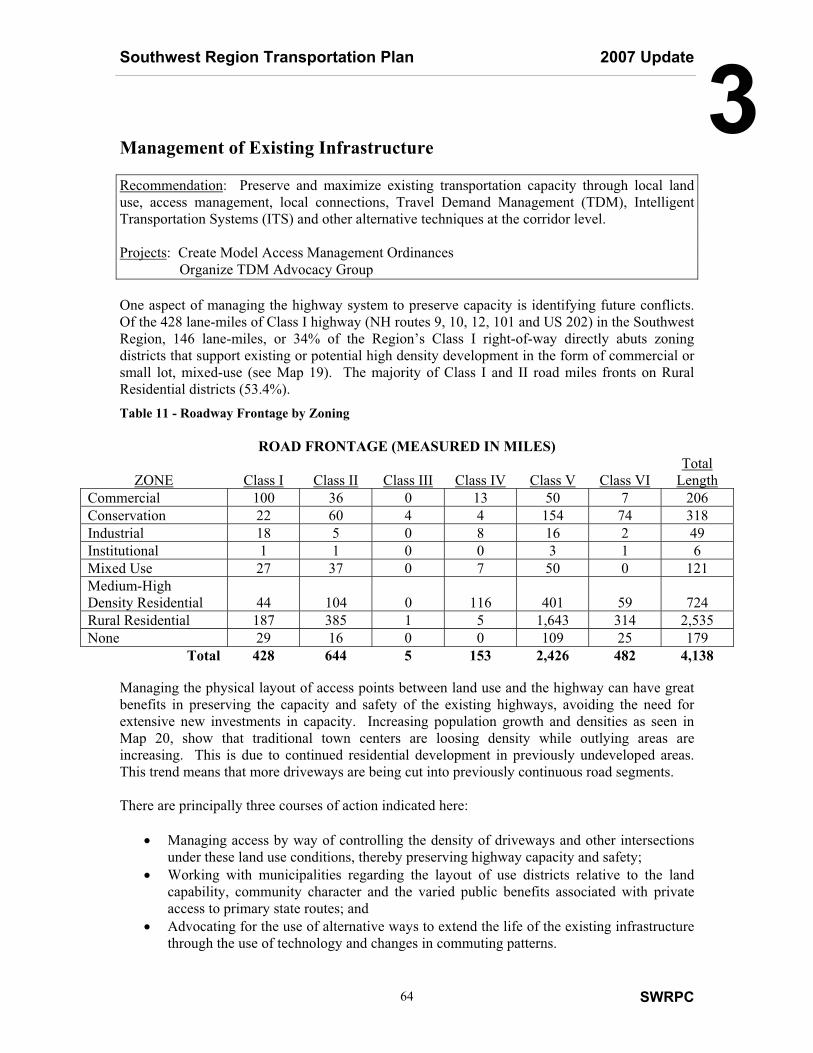
Southwest Region Transportation Plan 2007 Update
SWRPC 64
3Management of Existing Infrastructure Recommendation: Preserve and maximize existing transportation capacity through local land use, access management, local connections, Travel Demand Management (TDM), Intelligent Transportation Systems (ITS) and other alternative techniques at the corridor level. Projects: Create Model Access Management Ordinances Organize TDM Advocacy Group One aspect of managing the highway system to preserve capacity is identifying future conflicts. Of the 428 lane-miles of Class I highway (NH routes 9, 10, 12, 101 and US 202) in the Southwest Region, 146 lane-miles, or 34% of the Region’s Class I right-of-way directly abuts zoning districts that support existing or potential high density development in the form of commercial or small lot, mixed-use (see Map 19). The majority of Class I and II road miles fronts on Rural Residential districts (53.4%). Table 11 - Roadway Frontage by Zoning
ROAD FRONTAGE (MEASURED IN MILES)
ZONE Class I Class II Class III Class IV Class V Class VI Total
Length Commercial 100 36 0 13 50 7 206 Conservation 22 60 4 4 154 74 318 Industrial 18 5 0 8 16 2 49 Institutional 1 1 0 0 3 1 6 Mixed Use 27 37 0 7 50 0 121 Medium-High Density Residential 44 104 0 116 401 59 724 Rural Residential 187 385 1 5 1,643 314 2,535 None 29 16 0 0 109 25 179
Total 428 644 5 153 2,426 482 4,138 Managing the physical layout of access points between land use and the highway can have great benefits in preserving the capacity and safety of the existing highways, avoiding the need for extensive new investments in capacity. Increasing population growth and densities as seen in Map 20, show that traditional town centers are loosing density while outlying areas are increasing. This is due to continued residential development in previously undeveloped areas. This trend means that more driveways are being cut into previously continuous road segments.
There are principally three courses of action indicated here:
� Managing access by way of controlling the density of driveways and other intersections
under these land use conditions, thereby preserving highway capacity and safety; � Working with municipalities regarding the layout of use districts relative to the land
capability, community character and the varied public benefits associated with private access to primary state routes; and
� Advocating for the use of alternative ways to extend the life of the existing infrastructure through the use of technology and changes in commuting patterns.
Southwest Region Transportation Plan 2007 Update
SWRPC 65
3Accessibility and Mobility Alternatives Recommendations: Set the framework for expansion of services and infrastructure to serve the mobility and accessibility needs of those without personal transportation. Projects: Develop a Coordinated Human Services and Public Transportation Plan Work with NH DOT to establish a Regional Coordinating Council
The mobility needs of the Southwest Region are served almost exclusively by personal motorized passenger vehicles and commercial trucking of freight. Public transportation is little-developed outside of downtown Keene. Mode shift should be accomplished by generating demand for alternative modes and by using multimodal corridors.
Job growth in Keene has been strong, but there is a lack of workforce housing in the City and in the overall region. There is also a growing demographic shift towards an aging, transit dependant population. Additionally, there is a growing interest in the side benefits of transit including avoidance of highway expansion, reduction of vehicle emission in addition to providing higher levels of mobility for those without reliable access to personal transportation (See Map 21). Likewise, there is an increasing demand for facilities to support pedestrian and bicycle transportation both within densely developed centers and between them. Several communities (e.g. Dublin, Jaffrey, Keene, and Peterborough) have undertaken comprehensive design and reconstruction projects to provide safe and meaningful connections in their centers for pedestrians and bicycles – both as an alternative to automobiles and in conjunction with car trips (a park-and-walk environment). Roadway Improvements Recommendations: Continue to monitor the highway system in order to categorize and implement necessary improvements. Projects: Include necessary projects into Ten Year Plan Many of the deficiencies in the road and highway network can be addressed through maintenance of road surface and drainage systems, correcting environmental impacts, safety improvements such as minor reconstruction for intersection and roadway sight distance, and guardrails. The State highway maintenance priorities are developed through cooperation among NH DOT Maintenance District staff, NH DOT State-level Program Directors, and local officials. The decision-making for project selection and the technologies and designs deployed appear to perform well. However, State and Federal funding levels to maintenance may not support the level of need identified by NH DOT, local officials. Substandard bridges are the weakest link in our transportation network. As of May 2006 the NH DOT reported 14 State-Owned bridges in our region are red-listed. There are a total of 478 bridges in the Southwest Region (“bridges” here are structures 10 feet or greater in length). See Maps 5a and 5b for more detail.
Southwest Region Transportation Plan 2007 Update
SWRPC 66
3The Southwest Region highway network appears to have few miles or locations where insufficient capacity is observed or expected in the near future. NH DOT identifies the following road segments as congested and in need of change (see Map 7):
� US 202 - Peterborough, from NH 136 to Grove Street Extension � NH 101 - Peterborough, from Grove Street to NH 123 � NH 101 - Keene, from NH 9 to Marlborough Town Line � NH 10 - Keene, from NH 101 to West Street, Swanzey � NH 12 - Keene, from NH 101 to Swanzey Town Line
Several intersections have been observed (1998 – present) to experience Levels of Service F for one or all movements:
� NH 101 at NH 9, Keene � NH 101 at NH 10, Keene � NH 101 at NH 12, Keene � NH 101 at Swanzey Factory Road, Keene � NH 124 at NH 101, Marlborough � US 202 at NH 124, Jaffrey (dogleg) � US 202 at NH 101, Peterborough (dogleg) � US 202 at Main Street, Peterborough
Safety, Security and Hazard Mitigation Recommendations: Promote the safety and security of the transportation system, and include plans for major emergencies. Projects: Coordinate with NH DOT in creating a Strategic Highway Safety Plan (SHSP) Formalize Vermont Yankee Evacuation Plans Identify and mitigate culverts, bridges, and roadways susceptible to natural hazards Work with NH DOT and DES to streamline mitigation projects Roadways in our region have relatively low accident rates, as seen on Map 9. Continued work on identifying high accident spots and ways to mitigate these issues should be undertaken and coordinated with NH DOT. NH DOT is responsible for creating the SHSP, and we recommend including the following dangerous intersections and road segments:
� NH 101/NH 123 intersection in Peterborough � NH 119/NH 12 intersection in Fitzwilliam � NH 123/NH 124 intersection in New Ipswich � NH 12/Swanzey Factory Road intersection in Swanzey � NH 119 from US 202 in Rindge to Winchester
Security has become an issue since the last update of this plan in 2001. Terrorism and natural disasters have proven that our transportation system is both vulnerable to disruption, as well as pivotal to emergency response. Our region does have high-level targets or the potential for large-scale natural disasters. The Vermont Yankee Nuclear Power Plant resides on our southwestern
Southwest Region Transportation Plan 2007 Update
SWRPC 67
3corner in Vernon, Vermont and it poses a potential problem due to its status as a target as well as the recent increase in capacity. Map 22 depicts the major evacuation routes for residents in our region. A formalized strategy for the transportation network is needed in preparation for any potential problems. Additionally, transportation infrastructure which is susceptible to damage from natural hazards or which is incapable of handling events such as flash flooding should be mitigated. An important aspect of this element is a streamlined engineering and environmental permitting process that takes into account the immediacy of such problems. Public Participation Recommendations: Facilitate informed public choices about the development of multimodal transportation facilities. Projects: Continue to implement Context Sensitive Solutions (CSS) Develop a Public Participation Plan (PPP) SWRPC will continue to support an open, comprehensive process for the biennial 10-Year Transportation Improvement Program planning cycle. This process should be formalized through a Public Participation Plan (PPP), which will assure an approach that can provide a TIP based in consensus about priorities for system management – and commitment to those priorities in the long term from the public and stakeholders. The TIP process may not be fully understood among municipal governments, although priorities of the Southwest Region TIP have remained intact, the level of involvement may not be as high as desirable. Visualization techniques, defined as techniques which make information more accessible and easier to understand, should be used to the maximum extent practicable. The effective presentation of plan information to the public is vital to conveying the true impacts transportation improvements will have on a community. Visualization techniques include: renderings, computer-generated simulations using photographs and video, and interactive GIS maps The New Hampshire Department of Transportation has also embarked on a new philosophical approach to project development coined Context Sensitive Solutions (CSS). The end goal of the CSS process is to create projects that balance the needs of the transportation system with the environmental, social, economic and historical context in which the project takes place. SWRPC Assistance to State and Municipalities There is a demand among member municipalities for information and analysis regarding travel demand, current traffic and roadway conditions and access to State funding programs for transportation planning and improvements. At the State level, there is a need driven by federal transportation funding program requirements and the intense competition of transportation funds for accurate, high resolution information about the traffic, highway, and community parameters that effect the performance of the transportation system and demand for change. In general, SWRPC services to member municipalities take the form of research, information management, planning assistance, public facilitation, and representation of municipalities
Southwest Region Transportation Plan 2007 Update
SWRPC 68
3(individually and collectively) to higher levels of government. The Commission’s conventional scope of services to State agencies is similar. SWRPC has the capabilities to address these observed needs through field research, Geographic Information Systems and other electronic information management and analysis tools, and established relationships with municipal governments and State agencies, particularly NH DOT. SWRPC can address the observed needs through implementation of the Transportation Planning Unified Work Program supported by NH DOT and municipal membership dues as described in Chapter 3, as well as special planning studies funded through competitive grant programs or contracts with municipalities or other State agencies. SWRPC Transportation Planning Program SWRPC transportation planning program comprising the Transportation Planning Unified Work Program as described in Chapter 3 and special projects address the full range of needs identified in this Plan update. SWRPC seeks to enhance the sophistication and cost-effectiveness of the State route corridor planning approach currently in use. This includes developing accurate land use/land cover data and exploring relationships between highway performance, travel demand, development patterns, municipal zoning, and regional economic trends. SWRPC also continues to enhance public involvement and municipal access to the 10-Year Transportation Improvement Program and the Transportation Enhancement and CMAQ programs to ensure the best use of Federal and State funding for the Southwest Region. SWRPC seeks to institutionalize rural transit planning and bicycle and pedestrian planning as parts of the transportation planning program, particularly in order to better understand costs and benefits of investment in those modes regionally and locally.