Embed Size (px)
Citation preview
SouthSouthNorthsouth initiated & developed CDM projects
Presentation to the Parliamentary Portfolio Committee, Cape Town
28th August 2001
SouthSouthNorth project mission
The SouthSouthNorth (SSN) project is a capacity development initiative, learning
from the designing, developing and transaction of candidate Clean
Development Mechanism projects under the Kyoto Protocol.
What is the SSN Project?
• A project experimenting with a new as yet untried mechanism: the CDM
• for the benefit of the world community and country governments
• to build capacity through learning by doing
• 8 pilot projects have been selected in four countries
• each designed with owners
• all taken through the Kyoto cycle
• transacted
• ready to implement
SouthSouthNorth project components
• Early experience in the CDM• Bangladesh, Brazil, Indonesia, SA and Holland• South-south info exchange and tech. transfer• Development Facilitation of project ideas• Risk reduced through conservative selection
and packaging• Owner/host control timing • Monitoring, transparency and networking• Project transaction ends SSN involvement
Project selection methodology
• Existing ideas: SA country study
• Approach umbrella bodies Chamber of mines, SACOB, BSA, CAIA etc.
• Assess willingness to own projects
• Rate for priority and elimination
• Assess and decide with international SSN network…
Criteria and indicators
Eligibility1.Energy projects
2.Real and measurable benefits
2a.Contribution to Sustainable Development• Positive environmental
• Positive social
Criteria and indicators
Additionality3. Environmental
4. Financial
5. Technological
6. Investment
Criteria and indicators• Sustainable development7. Contributions to mitigation of GHGs8. Contribution to local environmental sustainability9. Contribution to employment generation10. Contribution to sustainable balance of payments11. Contribution to macro-economic sustainability12. Cost effectiveness13. Contribution to technological self reliance14. Contribution to sustainable use of natural resources
Criteria and indicators• Feasibility criteria15. Maximisation of owner/southern benefits16. Possibilities for south south info. and tech. Transfer17. Chances of success in policy/institutional environment18. Barriers to implementation (no fatal barriers)19. Possibilities for regional integration20. Project owners willingness to champion the project21. Project’s ability to wield political influence22. Project’s potential to leak23. Sectoral spread24. Local/regional replicability
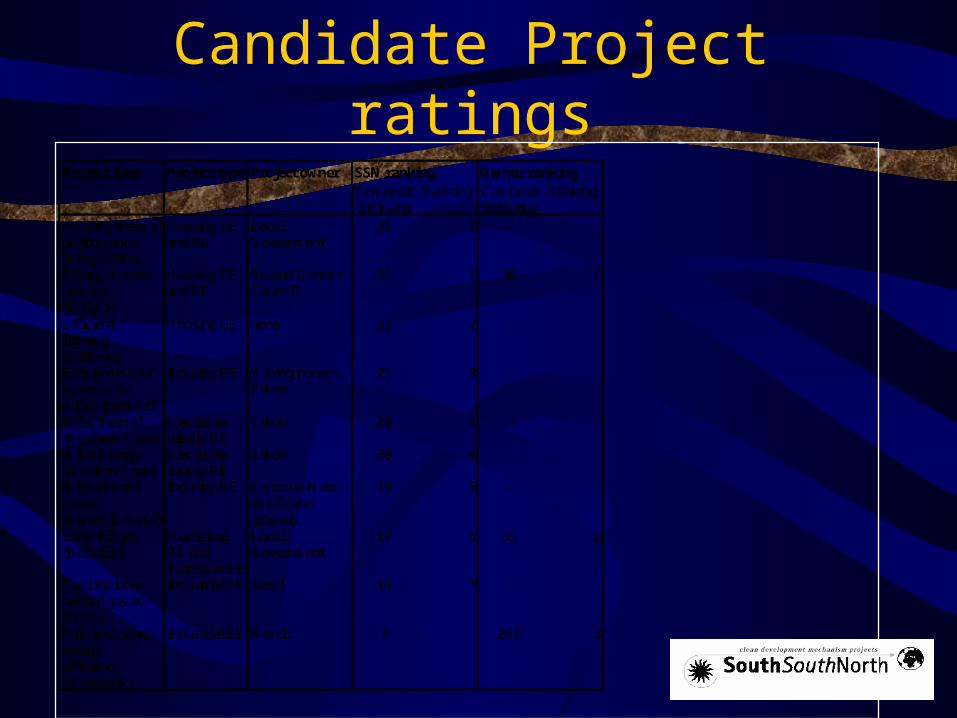
Candidate Project ratings Project Idea Project type Project owner SSN ranking Owner ranking Composit
indicator Ranking Composit
indicator Ranking
Housing thermal performance (Khayelitsha)
Housing EE and RE
Local Government
31 1 -
Energy in rural hamlets (Boland)
Housing EE and RE
Boland District Council
31 1 36 1
Efficient lighting (national)
Housing EE none 23 2 -
Efficient HVAC systems for mines (national)
Industry EE Mining houses, Eskom
21 3 -
Solar thermal (Northern Cape)
Electricity supply RE
Eskom 20 4 -
Wind Energy (Western Cape)
Electricity supply RE
Eskom 20 4 -
Mini-ethanol plants (Kwazulu-Natal)
Industry RE Kwazulu-Natal small cane growers
19 5 -
Land-fill gas (Bellville)
Municipal RE and Transport EE
Local Government
17 6 35 2
Coal replaces natural gas at SASOL
Industrial EE Sasol 15 7 -
Pulp and paper energy efficiency (Merebank)
Industrial EE Mondi ? - 26.5 3
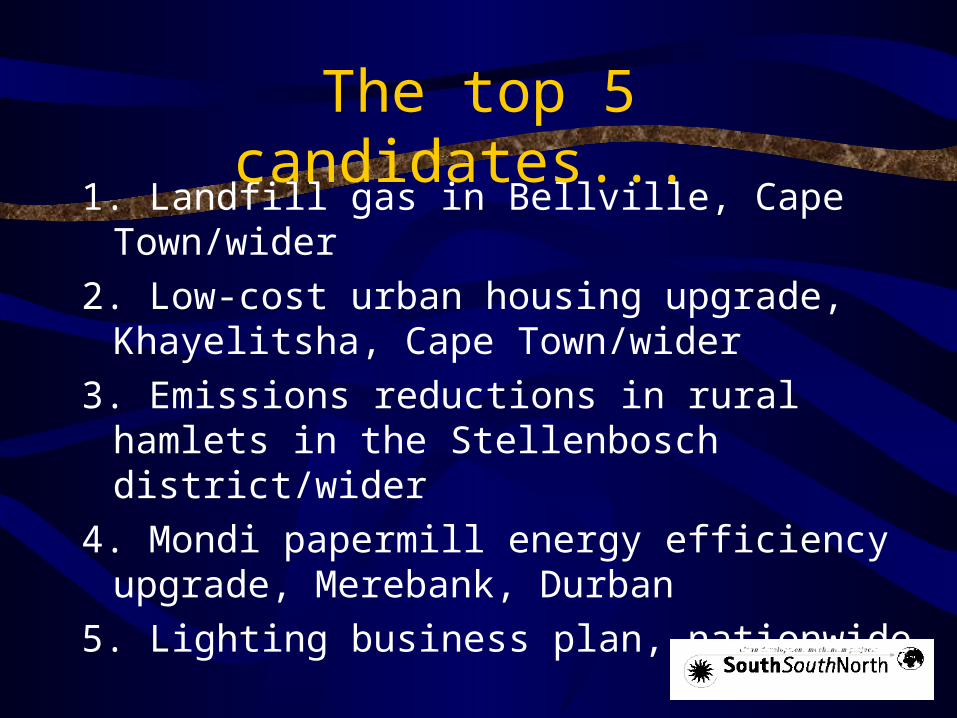
1. Landfill gas in Bellville, Cape Town/wider
2. Low-cost urban housing upgrade, Khayelitsha, Cape Town/wider
3. Emissions reductions in rural hamlets in the Stellenbosch district/wider
4. Mondi papermill energy efficiency upgrade, Merebank, Durban
5. Lighting business plan, nationwide
The top 5 candidates...
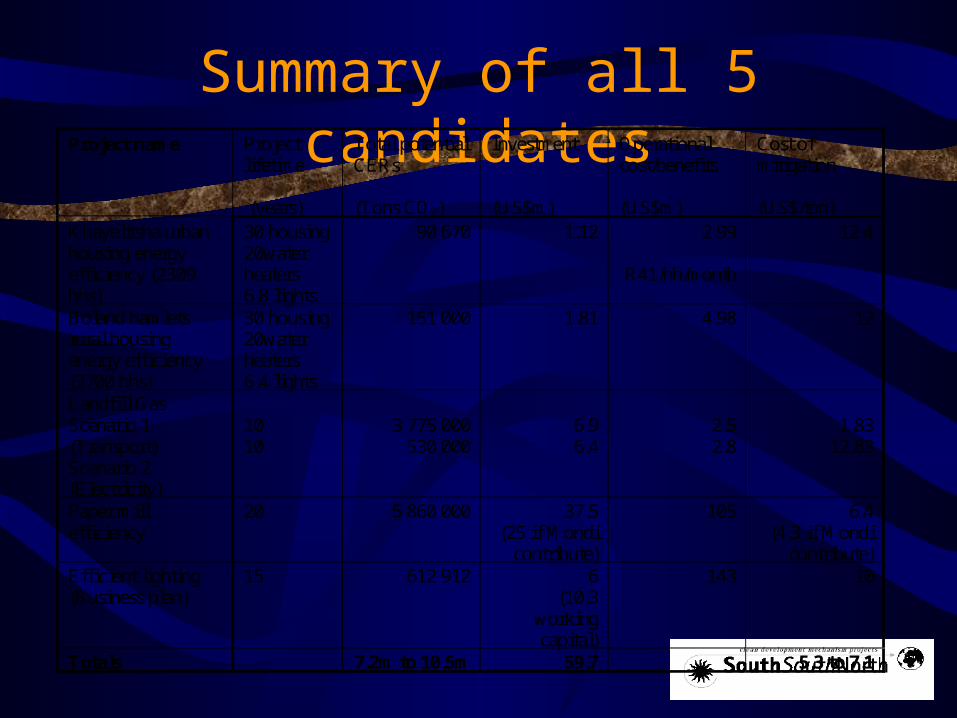
Summary of all 5 candidatesProject name Project
lifetime (years)
Total potential CERs (Tons CO2)
Investment (US$m)
Operational cost/benefits (US$m)
Cost of mitigation (US$/ton)
Khayelitsha urban housing energy efficiency (2309 hhs)
30 housing 20water heaters 6.8 lights
90 670 1.12 2.99
R41/hh/month
12.4
Boland hamlets rural housing energy efficiency (3700 hhs)
30 housing 20water heaters 6.4 lights
151 000 1.81 4.98 12
Landfill Gas Scenario 1 (Transport) Scenario 2 (Electricity)
10 10
3 775 000
530 000
6.9 6.4
2.5 2.8
1.83
12.83
Paper mill efficiency
20 5 860 000 37.5 (25 if Mondi
contribute)
105 6.4 (4.3 if Mondi
contribute) Efficient lighting (Business plan)
15 612 912 6 (10.3
working capital)
143 10
Totals 7.2m to 10.5m 59.7 5.3 to 7.1
Pilot 1: Mondi Merebank energy efficiency upgrade (project boundary)
• Mondi Merebank in South Durban Industrial Basin
• Production of plant does not change? At X1000 tons pulp/kraft/fine paper/annum
• Thermal mechanical pulping of pine logs and waste chips.
• Technology dates back to 1980s.
• Project to replace existing pulping technology
Project owners and stakeholders• owner will be Mondi Paper Ltd. • other stakeholders are:
– Project Consultants
– Equipment suppliers.
– Air pollution Control - National Government
– EIA - Provincial Government
– Permits for operation – Local Authorities
– Local Community based organizations
– Local environmental activists
– Trade unions
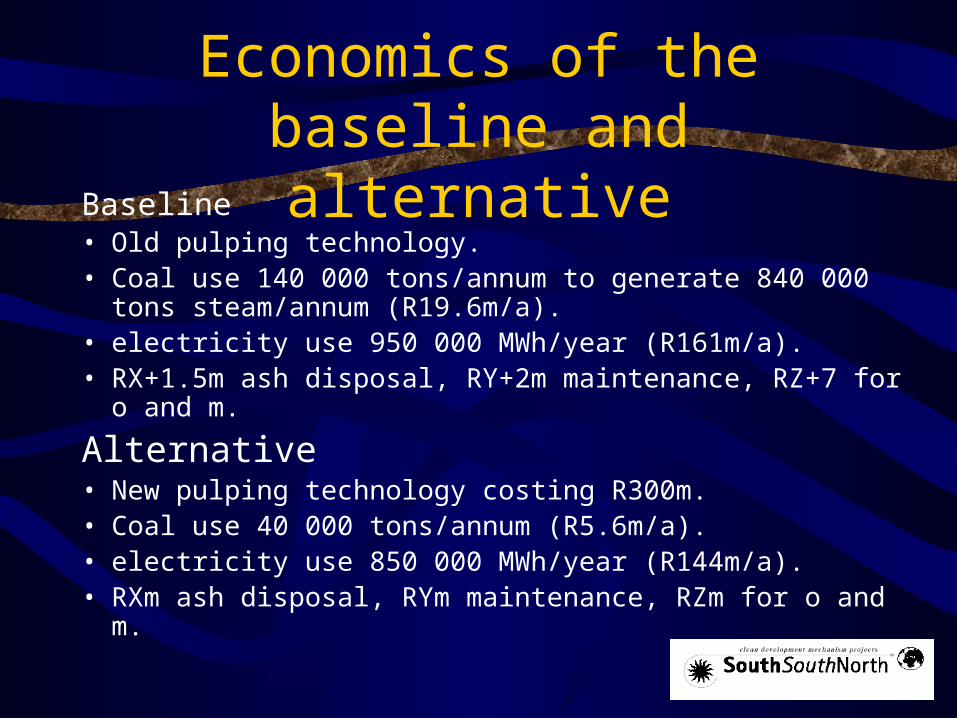
Economics of the baseline and alternative
Baseline • Old pulping technology.• Coal use 140 000 tons/annum to generate 840 000 tons
steam/annum (R19.6m/a).• electricity use 950 000 MWh/year (R161m/a). • RX+1.5m ash disposal, RY+2m maintenance, RZ+7 for o and m.
Alternative• New pulping technology costing R300m.• Coal use 40 000 tons/annum (R5.6m/a).• electricity use 850 000 MWh/year (R144m/a). • RXm ash disposal, RYm maintenance, RZm for o and m.
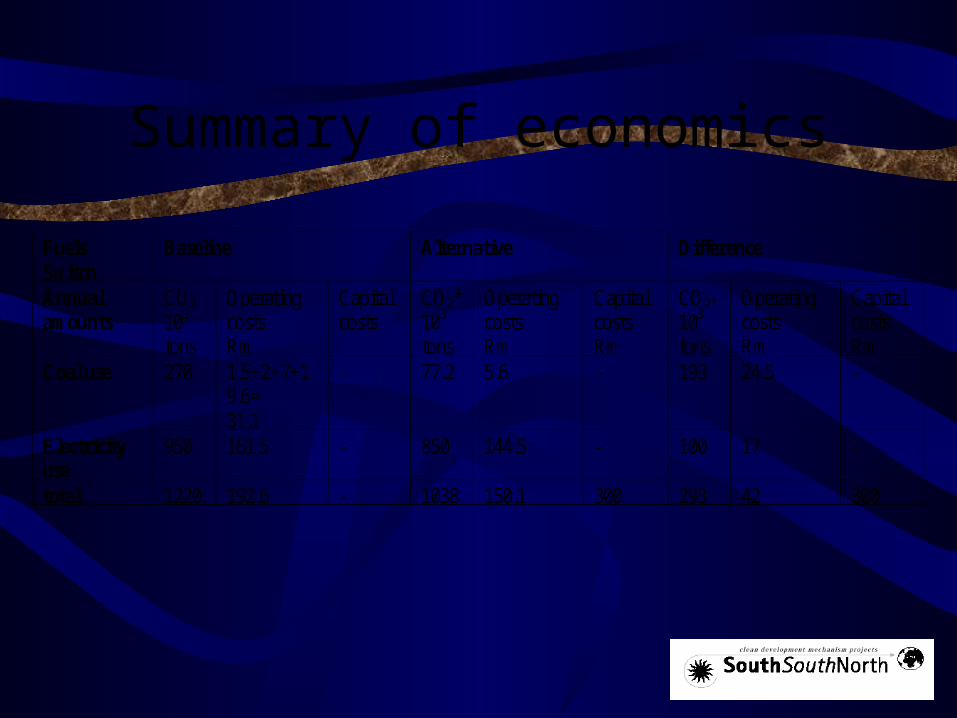
Summary of economics
FuelsSwitch
Baseline Alternative Difference
Annualamounts
CO2
103
tons
OperatingcostsRm
Capitalcosts
CO2*103
tons
OperatingcostsRm
CapitalcostsRm
CO2*
103
tons
OperatingcostsRm
CapitalcostsRm
Coal use 270 1.5+2+7+19.6=31.1
- 77.2 5.6 - 193 24.5 -
Electricityuse
950 161.5 - 850 144.5 - 100 17 -
total 1220 192.6 - 1038 150.1 300 293 42 300
Co-benefits of the project
Annual reduction of 1800 tons SO2 emissions in a sensitive area
Reduction of boiler ash to landfill
Reduction in transport of coal (Coal is transported 400 kilometres)
Reduction in transport of ash (transported approximately 20 kilometres by road)
Case for CDM investment
• Project passes preliminary additionality tests (i.e. investment payback 7>3 years)
• rated at 28 points SD and feasibility criteria• saves 293 000 tons CO2 and 1800 tons
SOx/annum• over 20 years US$6.4 and 4.2/ton CO2
depending on Mondi contribution (discount rate?)
Pilot 2a:urban housing efficiency in Khayelitsha, Cape Town
• Project boundary– The Project will be located at Kuyasa in
Khayelitsha, a new lower–middle-income residential area in the City of Cape Town
– 2309 “greenfield” low-cost houses plus services– technologies: ceilings + insulation; solar water
heaters; energy efficient lighting
Owner and stakeholders
• City of Cape Town (Tygerberg environment department;
• SEED (Sustainable Energy and Environment and Development)
• Residents of Kuyasa (Khayeitsha)
• SSN
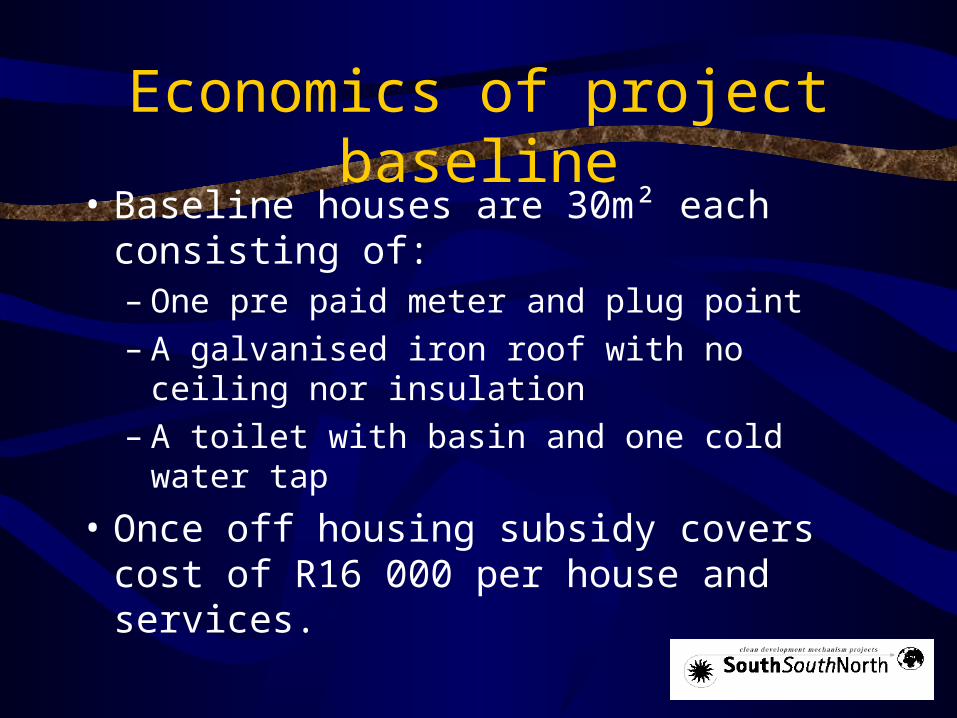
Economics of project baseline• Baseline houses are 30m² each consisting
of:– One pre paid meter and plug point– A galvanised iron roof with no ceiling nor
insulation– A toilet with basin and one cold water tap
• Once off housing subsidy covers cost of R16 000 per house and services.
Economics of alternative
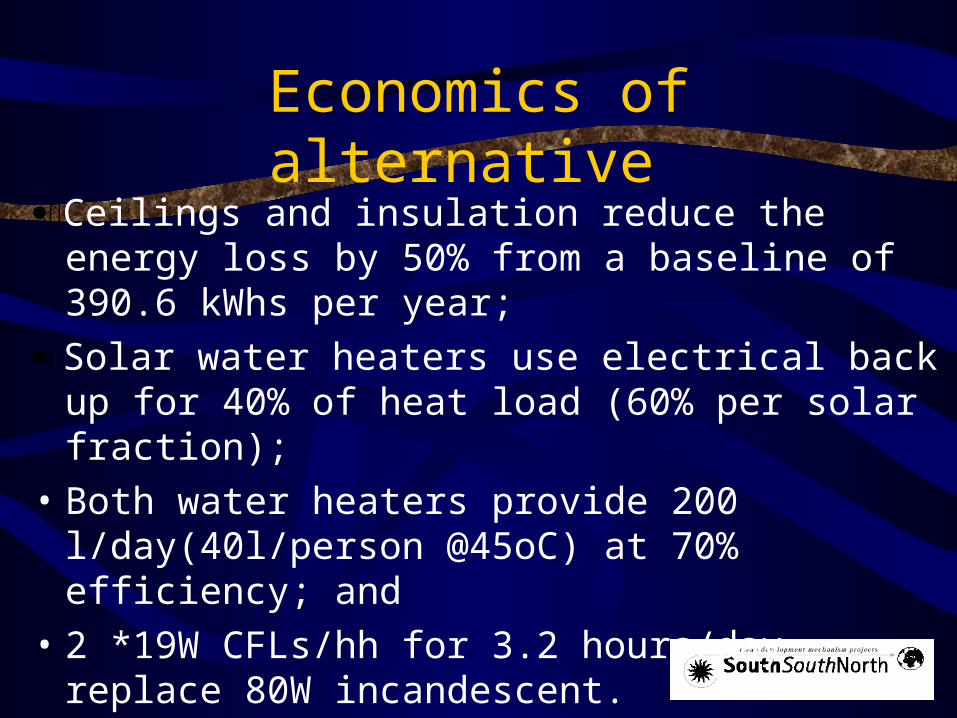
Ceilings and insulation reduce the energy loss by 50% from a baseline of 390.6 kWhs per year;
Solar water heaters use electrical back up for 40% of heat load (60% per solar fraction);
• Both water heaters provide 200 l/day(40l/person @45oC) at 70% efficiency; and
• 2 *19W CFLs/hh for 3.2 hours/day replace 80W incandescent.
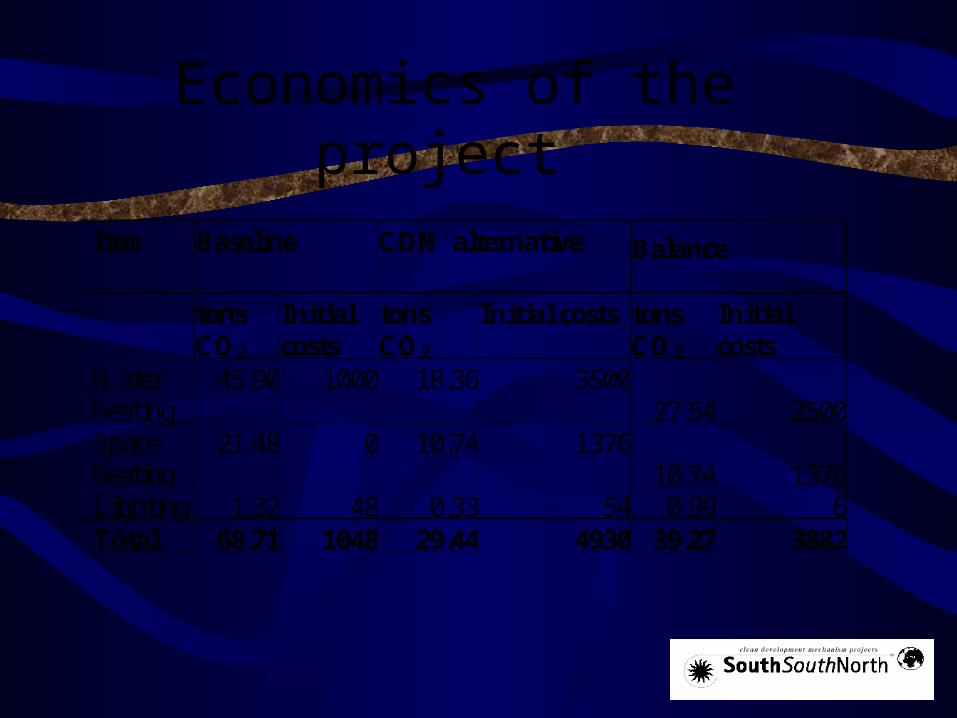
Economics of the project
Item
Baseline CDM alternative Balance
tons CO2
Initial costs
tons CO2
Initial costs tons CO2
Initial costs
Water heating
45.90 1000 18.36 3500 27.54 2500
Space heating
21.48 0 10.74 1376 10.74 1376
Lighting 1.32 48 0.33 54 0.99 6 Total 68.71 1048 29.44 4930 39.27 3882
Tons and price
• 90 670 tons over the life of the project. (This may well be curtailed by crediting periods.)
• The costs of the intervention are SAR8.97million or US$12.4 per ton.
Co-benefits
• Reduction of energy poverty(R41/hh/month)
• health (respiratory diseases)
• capacity building of emerging contractors, local municipality, residents
• contribution to sustainable human settlement development
• high potential for replicability
Pilot 2b: Rural hamlets in the Stellenbosch
district
• Project boundary– 13 settlements all within 100kms of Cape Town– 3700 new attached and semi-attached houses– 13918 farmworkers in intensive agricultural areas – owner municipality of Stellenbosch– 9 energy, waste management and building
interventions
Owners and stakeholders
• Boland district municipality
• Municipality of Stellenbosch owners
• Farmworkers
• AR Design (planning intermediaries)
• Department of housing, land affairs, minerals and energy
Economics of baseline• 30m2 freestanding houses costing R16 000/unit. • constructed of cement blocks with neither ceiling nor
insulation. • They will have IBR sheeting on the roofs.• Electricity will be the main source of energy for space
heating, cooking and water heating.• The houses will be placed along roads ordered along a
grid for maximum efficiency in pipe length.• The houses will have waterborne sewerage due to the
high water table in the Boland.
Economics of alternative• Ceilings and insulation• LPG for cooking • SWHs for water heating• Efficient lighting (CFLs)• shared walls • rammed earth walls• biolytic filtration of sewage• solid waste management to reduce disposal by
70%
Summary of economics
• Excluding components items 6 to 9 the entire suite of incremental interventions.
• Cost R14.5m and will result in 150 000 tons of CO2 per year for all 3700 households.
• Project could add R3900 to R16000 per dwelling
• Assuming a minimum 30-year life for the dwelling units and assuming a static baseline, (R14.5m/150000=R96/ton) mitigation for the interventions could be estimated at US$12 per ton CO2.
Co-benefits
• High chances for replicability• Capacity building. Includes building managerial and
technical skills• low environmental impact and health risks associated
with new building materials • Efficient waste disposal and sewerage • Slow rural to urban migration putting pressure on
housing, water, health and food• Local use of resources
Potential barriers
• Unfamiliar technologies for local government• Lack of institutional ownership of policies related to
sustainable technologies • Unimplemented policies formulated in energy and
economic terms often do not take institutional and administrative realities into account
• Incentives for electricity suppliers to increase electricity sales are sometimes contrary to least-cost energy service solutions for users and the economy
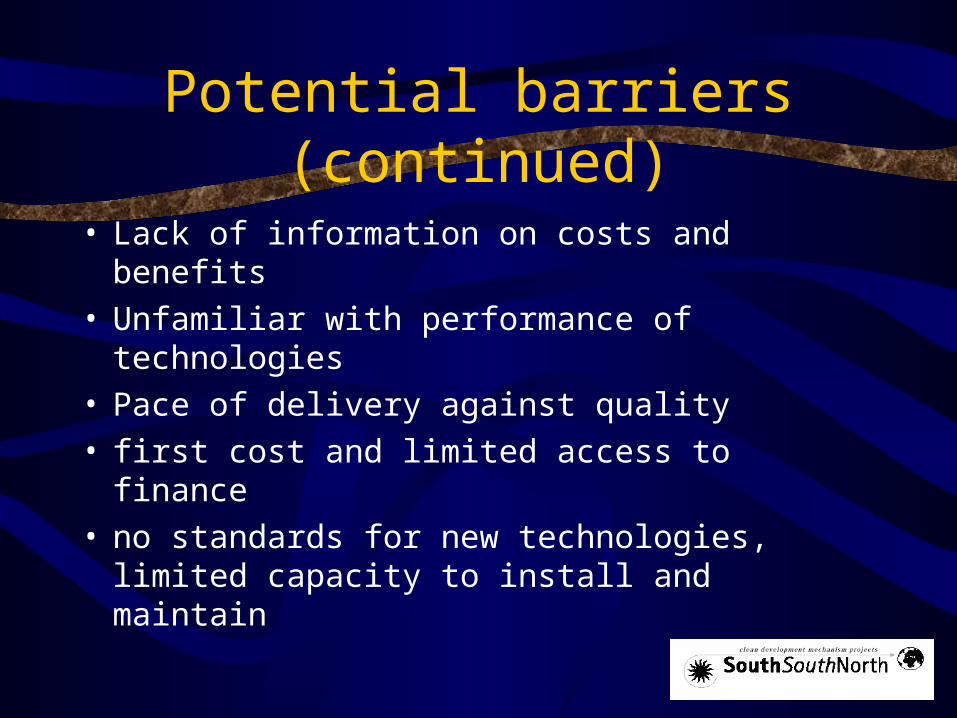
Potential barriers (continued)
• Lack of information on costs and benefits• Unfamiliar with performance of technologies• Pace of delivery against quality• first cost and limited access to finance• no standards for new technologies, limited
capacity to install and maintain
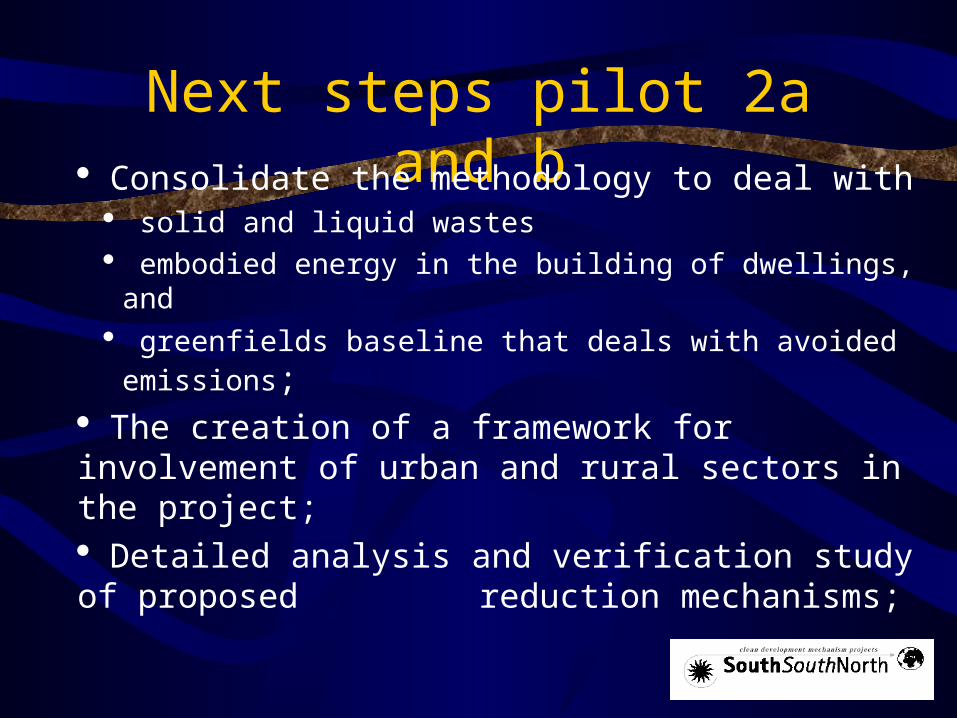
Next steps pilot 2a and b Consolidate the methodology to deal with
solid and liquid wastes embodied energy in the building of dwellings, and
greenfields baseline that deals with avoided emissions; The creation of a framework for involvement of urban and rural sectors in the project; Detailed analysis and verification study of proposed reduction mechanisms;
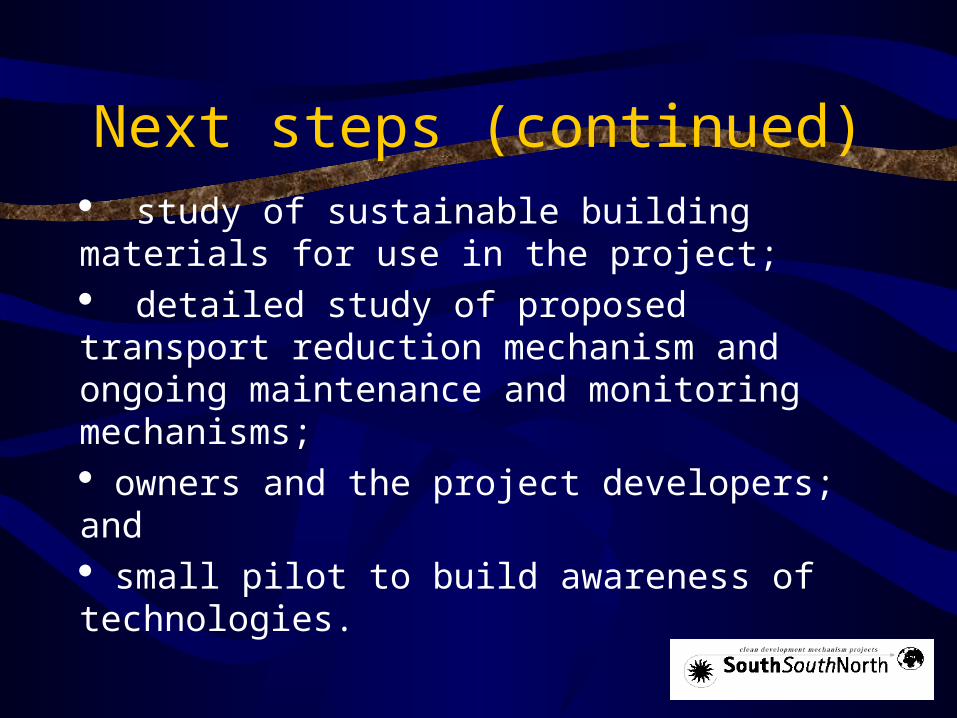
Next steps (continued) study of sustainable building materials for use in the project; detailed study of proposed transport reduction mechanism and ongoing maintenance and monitoring mechanisms; owners and the project developers; and small pilot to build awareness of technologies.
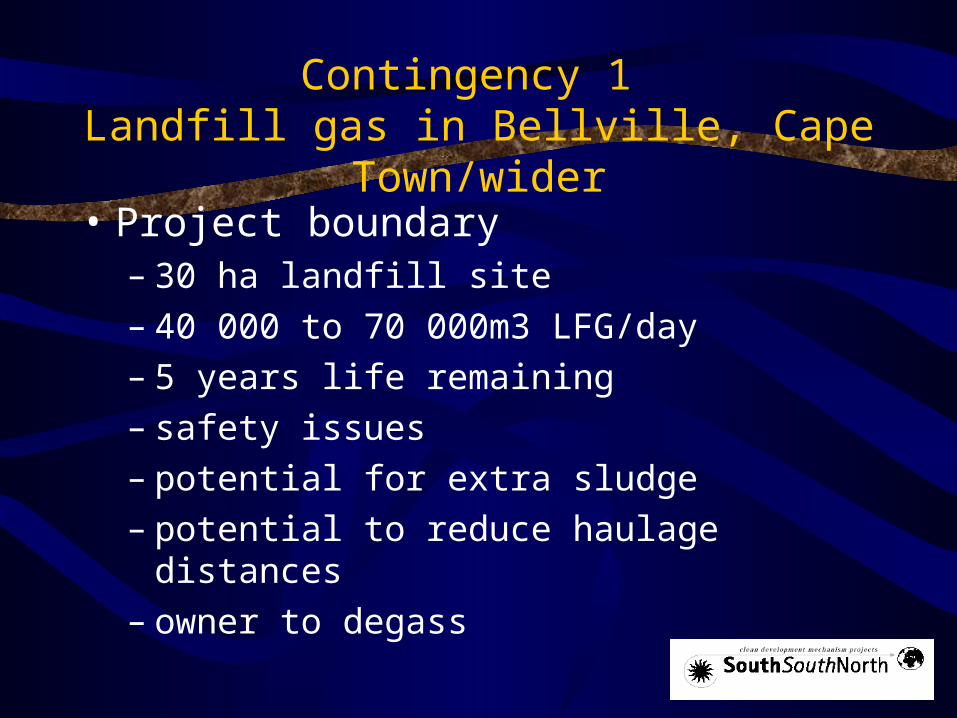
Contingency 1 Landfill gas in Bellville, Cape Town/wider
• Project boundary– 30 ha landfill site– 40 000 to 70 000m3 LFG/day– 5 years life remaining – safety issues– potential for extra sludge– potential to reduce haulage distances– owner to degass
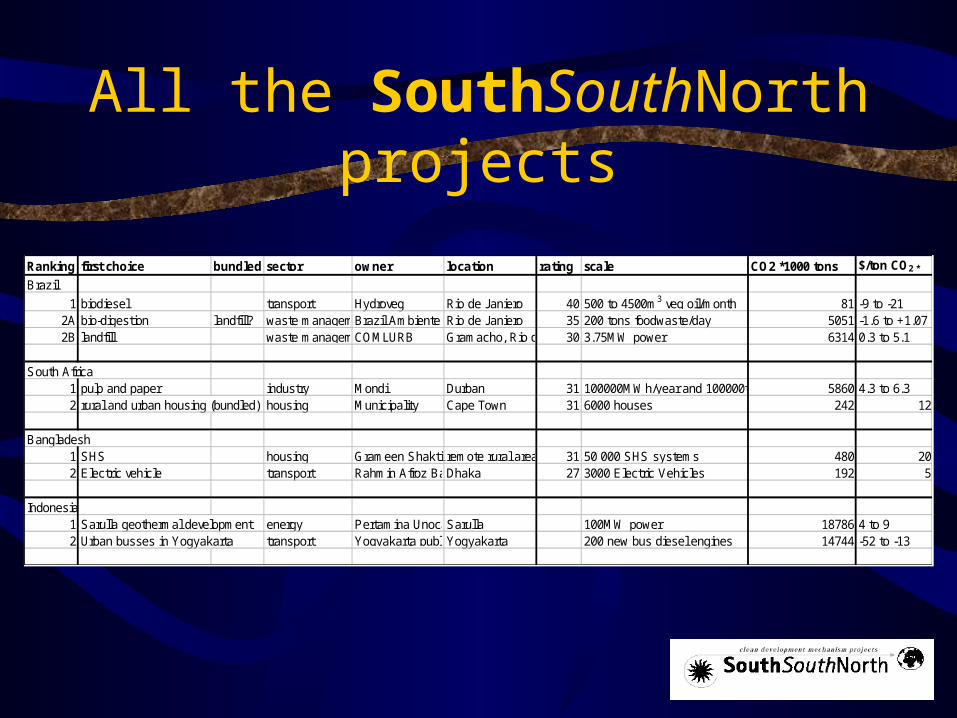
All the SouthSouthNorth projects
Ranking first choice bundled with?sector owner location rating scale CO2 *1000 tons $/ton CO2 *
Brazil
1 biodiesel transport Hydroveg Rio de Janiero 40 500 to 4500m3 veg oil/month 81 -9 to -212A bio-digestion landfill? waste management/energyBrazil Ambiente Rio de Janiero 35 200 tons foodwaste/day 5051 -1.6 to +1.072B landfill waste management/energyCOMLURB Gramacho, Rio de Janiero30 3.75MW power 6314 0.3 to 5.1
South Africa1 pulp and paper industry Mondi Durban 31 100000MWh/year and 100000tons coal/year 5860 4.3 to 6.32 rural and urban housing (bundled) housing Municipality Cape Town 31 6000 houses 242 12
Bangladesh1 SHS housing Grameen Shakti remote rural areas and islands31 50 000 SHS systems 480 202 Electric vehicle transport Rahmin Afroz Bangladesh Ltd.Dhaka 27 3000 Electric Vehicles 192 5
Indonesia1 Sarulla geothermal development energy Pertamina Unocal Geothermal Indonesia and PLNSarulla 100MW power 18786 4 to 9 2 Urban busses in Yogyakarta transport Yogyakarta public transport allianceYogyakarta 200 new bus diesel engines 14744 -52 to -13
Assumptions in estimates• Many assumptions are embedded in these estimates:
they are based on various periods; they are based on static weighted average baselines rather than more stringent benchmarks; they assume that avoided emissions can be credited in greenfield projects; they exclude the bulk of project benefits to owners; they assume no discounting of credits; and estimates could be 20% higher or lower.
Next steps
• More detailed assessment or emissions, investment requirements etc.
• risks need to be quantified;
• how do we handle baselines that reduce suppressed demand;
• institutions (OEs);
• timing….