Embed Size (px)
Citation preview

Final Stock Assessment Report
to PIRSA Fisheries
Southern Zone Rock Lobster (Jasus edwardsii)
Fishery 2004/05
A. Linnane, R. McGarvey, J. Feenstra and T.M. Ward
May 2006
SARDI Research Report Series No. RD04/0164-3
This report is the fourth version of a “living” document that is updated annually as part of SARDI Aquatic Sciences’ ongoing fishery assessment program for South Australia’s Southern Zone Rock Lobster Fishery. The report provides a synopsis of information available for the fishery and assesses the current status of the resource. The report also identifies both current and future research needs for the fishery.
1
Title: Southern Zone Rock Lobster (Jasus edwardsii) Fishery 2004/05 Sub-title: Final Stock Assessment Report to PIRSA Fisheries South Australian Research and Development Institute SARDI Aquatic Sciences 2 Hamra Avenue West Beach SA 5024 Telephone: (08) 8207 5400 Facsimile: (08) 8207 5406 http://www.sardi.sa.gov.au The authors warrant that they have taken all reasonable care in producing this report. This report has been through SARDI Aquatic Sciences internal review process, and was formally approved for release by the Chief Scientist. Although all reasonable efforts have been made to ensure quality, SARDI Aquatic Sciences does not warrant that the information in this report is free from errors or omissions. SARDI Aquatic Sciences does not accept any liability for the contents of this report or for any consequences arising from its use or any reliance placed upon it. © 2006 SARDI Aquatic Sciences This work is copyright. Apart from any use as permitted under the Copyright Act 1968, no part may be reproduced by any process without prior written permission from the authors. Printed in Adelaide, May 2006 SARDI Aquatic Sciences Publication No. RD04/0164-3 SARDI Research Report Series No. 135 Authors: A. Linnane, R. McGarvey, J. Feenstra and T.M. Ward
Reviewers: Dr. John Carragher, Dr. Simon Bryars & Mr. Sean Sloan
Approved by: Dr. Anthony Fowler
Signed:
Date: 31st May, 2006
Distribution: PIRSA Fisheries, South Australian Southern Zone Rock Lobster
Fishery Management Committee, SARDI Aquatic Sciences Library
Circulation: Public Domain
2

TABLE OF CONTENTS
ACKNOWLEDGEMENTS ...................................................................................................................5
EXECUTIVE SUMMARY ....................................................................................................................6
1 GENERAL INTRODUCTION....................................................................................................8 1.1 Overview ..............................................................................................................................8 1.2 Description of the Fishery...................................................................................................9
1.2.1 Location and Size .............................................................................................................9 1.2.2 Environmental Characteristics..........................................................................................9 1.2.3 Commercial Fishery .......................................................................................................12 1.2.4 Recreational Fishery .......................................................................................................12 1.2.5 Illegal Catch....................................................................................................................13
1.3 Management of the Fishery ..............................................................................................13 1.3.1 Management Milestones.................................................................................................14 1.3.2 Current Management Arrangements...............................................................................15 1.3.3 Management Objectives and Strategies ..........................................................................17 1.3.4 Performance Indicators and Reference Points ................................................................17 1.3.5 Management action on reaching a reference point outside the historical range. ............19
1.4 Biology of Southern Rock Lobster ...................................................................................20 1.4.1 Taxonomy and Distribution............................................................................................20 1.4.2 Stock Structure ...............................................................................................................20 1.4.3 Life History ....................................................................................................................21 1.4.4 Growth and Size at Maturity...........................................................................................22 1.4.5 Movement.......................................................................................................................23
1.5 Stock Assessment...............................................................................................................24 1.6 Current Research and Monitoring Programs.................................................................25
1.6.1 Catch and Effort Research Logbook...............................................................................25 1.6.2 Pot Sampling ..................................................................................................................26 1.6.3 Puerulus Monitoring Program ........................................................................................27 1.6.4 Octopus Predation Project ..............................................................................................28 1.6.5 By-catch Monitoring Program........................................................................................29
2 FISHERY STATISTICS ............................................................................................................31 2.1 Introduction .......................................................................................................................31 2.2 Catch, Effort and CPUE ...................................................................................................31
2.2.1 Inter-annual Patterns.......................................................................................................31 2.2.2 Within-season Patterns ...................................................................................................34 2.2.3 Patterns across MFAs .....................................................................................................40 2.2.4 Patterns across Depths ....................................................................................................43
2.3 Mean Weights ....................................................................................................................50 2.3.1 Inter-annual Pattern ........................................................................................................50 2.3.2 Within-season Patterns ...................................................................................................50 2.3.3 Patterns across MFA’s....................................................................................................51
2.4 Length Frequency..............................................................................................................53 2.5 Pre-Recruit Index ..............................................................................................................58
2.5.1 Inter-annual Patterns.......................................................................................................58 2.5.2 Within-season Patterns ...................................................................................................59 2.5.3 Patterns across MFAs .....................................................................................................60
2.6 Spawning lobsters..............................................................................................................61 2.6.1 Inter-annual Patterns.......................................................................................................61
3

2.6.2 Within-season Patterns ...................................................................................................62 2.6.3 Patterns across MFAs .....................................................................................................62
2.7 Lobster Mortalities............................................................................................................64 2.7.1 Inter-annual Patterns.......................................................................................................64 2.7.2 Within season Patterns....................................................................................................65
2.8 Octopus Catch Rates .........................................................................................................66 2.8.1 Inter-annual Patterns.......................................................................................................66 2.8.2 Within season Trends .....................................................................................................66
2.9 Changes in Fishing Patterns .............................................................................................67 2.9.1 Season Length.................................................................................................................67
2.10 Distribution of Effort ........................................................................................................68 2.11 High Grading .....................................................................................................................70
2.11.1 Inter-annual and within Season Trends......................................................................70 2.12 Settlement Index ................................................................................................................70 2.13 May Fishing Trial ..............................................................................................................72
2.13.1 CPUE .........................................................................................................................72 2.13.2 Mean Weight..............................................................................................................72 2.13.3 Lobster Mortality .......................................................................................................72 2.13.4 Discussion..................................................................................................................75
3 THE qR MODEL........................................................................................................................76 3.1 Introduction .......................................................................................................................76 3.2 Methods ..............................................................................................................................77 3.3 Results ................................................................................................................................80 3.4 Discussion...........................................................................................................................87
4 PERFORMANCE INDICATORS.............................................................................................89 4.1 Catch Rate..........................................................................................................................89 4.2 Mean Weight......................................................................................................................89 4.3 Abundance of Pre-recruits................................................................................................89 4.4 Exploitation Rate...............................................................................................................90 4.5 Egg Production ..................................................................................................................90
5 GENERAL DISCUSSION .........................................................................................................92 5.1 Information Available for the Fishery.............................................................................92 5.2 Current Status of Southern Zone Rock Lobster Fishery...............................................92 5.3 Research in Response to DEH Recommendations..........................................................94 5.4 Future Research Priorities................................................................................................96
6 BIBLIOGRAPHY.......................................................................................................................98
7 APPENDIX................................................................................................................................103
4

ACKNOWLEDGEMENTS
Research presented in this report was commissioned by PIRSA Fisheries using funds
obtained from licence fees paid by participants in the Southern Zone Rock Lobster
Fishery. SARDI Aquatic Sciences provided substantial in-kind support for the project.
The report builds on previous research by Dr. Tim Ward, Mr Jim Prescott, and Dr.
Rob Lewis. We thank Mr Peter Hawthorne, Mr Alan Jones, Mr Matthew Hoare and
Ms Kylie Howard for collecting and collating the data. The report was formally
reviewed by Dr. John Carragher, Dr. Simon Bryars (SARDI Aquatic Sciences) and
Mr. Sean Sloan (PIRSA Fisheries) and approved for release by Dr. Anthony Fowler
(SARDI Aquatic Sciences).
5

EXECUTIVE SUMMARY
1. This report is the fourth version of a “living” document that is updated annually as
part of SARDI Aquatic Sciences’ ongoing fishery assessment program for the
Southern Zone Rock Lobster Fishery (SZRLF). The report provides a synopsis of
the information available to the fishery, assesses the current status of the resource
and identifies both current and future research needs.
2. In 2004/05, a total of 1,051,520 potlifts was required to catch the 1,900 tonne
Total Allowable Commercial Catch (TACC). This reflected an increase of 0.8%
from 2003/04 but a 36% decrease in effort from 1993 (1,641,876 potlifts) when
the TACC was introduced (at 1,720 tonnes). In 2004/05, >85% of the catch was
taken in depths of <60 m.
3. In 2004/05, commercial licence holders took an average of 94 days to catch the
TACC of 1,900 tonnes, compared to 95 days in 2003/04. This was 34% less than
the average number of days (143) required by licence holders to take the 1,720
tonne TACC in 1993.
4. The annual catch per unit effort (CPUE) in 2004/05 was 1.81 kg/potlift, which is
59% above the upper limit for the reference period identified in the Management
Plan (1.14 kg/pot lift). This is likely to be an underestimate of true catch rate due
to increased levels of highgrading in the fishery in recent seasons. During
2004/05, CPUE was highest in depths >90 m, reaching 3.5 kg/potlift in December.
5. The mean weight of lobsters in 2004/05 was 846 g, which is 0.83% above the
upper limit for the reference period identified in the Management Plan (839 g).
6. The pre-recruit index for 2004/05 (calculated for November to March inclusive)
was 1.31 undersize/potlift, which is inside the range for the reference period
identified in the Management Plan (1.20-1.53 undersize/potlift).
7. Outputs from the qR model suggest that recruitment levels have been above the
average level for the fishery in each of the last six seasons.
8. Outputs from the qR model suggest that the biomass of lobsters in the SZRLF has
been increasing since 1996. In 2004/05, it was 6,530 tonnes. This represents an
increase of 64% from 1993 when the biomass was estimated at 3,986 tonnes.
6

9. Outputs from the qR model suggest that the level of egg production in the SZRLF
in 2004/05 was 1,500 billion eggs, which is 47% above the upper limit (1,019
billion in 1992) for the reference period identified in the Management Plan.
10. Outputs from the qR model suggest that the exploitation rate for 2004/05 was 0.28
which is 24% below the lower limit (0.37 in 1992) for the reference period
identified in the Management Plan.
11. Future predictions of biomass from the qR model suggest that the biomass will
increase in 2006/07 for both quotas examined (1770 and 1900 t) in response to the
high puerulus settlement in 2002/03. Biomass is predicted to decrease in 2007 due
to the low settlement in 2003/04, but will increase for the next two seasons due to
high puerulus counts in 2004/05 and 2005/06. However, future predictions of
biomass should be cautiously considered given the strong reliance fishery
dependent data.
12. Despite optimistic outputs at a zonal level, this report identifies a number of
localised downward trends based on fishery dependent data. Inshore catch rates in
MFAs 56 and 58 have decreased notably over the last two seasons in both the 0-
30 m and 31-60 m depth ranges. In addition, the catch rate of both spawning
females and undersized lobsters in both these MFAs have decreased. While
current estimates of catch rate and pre-recruit index for the zone are within the
range of the performance indicators in the Management Plan, these results indicate
that close monitoring of these indices on a finer spatial scale may be required if
localised reductions in lobster abundance is to be avoided. Overall, as >85% of the
catch in the SZRLF is taken from depths of <60 m, these results highlight the need
for fishery independent data that are currently lacking from both fishery statistics
and stock assessment model outputs.
7

1 GENERAL INTRODUCTION
1.1 Overview
This report is the fourth version of a “living” document that is updated annually as
part of SARDI Aquatic Sciences’ ongoing fishery assessment program for the
Southern Zone Rock Lobster Fishery (SZRLF). It updates the 2003/04 stock
assessment by Linnane et al. (2005c) with data from the 2004/05 fishing season.
The aims of the report are to provide a comprehensive synopsis of information
available for the SZRLF and to assess the current status of the resource.
The report is divided into seven sections.
The first section is the General Introduction that: (i) outlines the aims and structure of
the report; (ii) describes the environmental characteristics and history of the SZRLF;
(iii) outlines the management arrangements for the fishery and identifies the current
biological performance indicators and reference points; (iv) provides a synopsis of
biological and ecological knowledge of the southern rock lobster, Jasus edwardsii;
and (v) summarises previous assessments of the SZRLF.
Section two provides a synopsis of the fishery statistics for the SZRLF for the fishing
seasons between 1970/71 and 2004/05. This section examines inter-annual, within-
season and spatial patterns in catch, effort and catch-per-unit-effort (CPUE) in the
Marine Fishing Areas (MFAs) that comprise the SZRLF. It also compares inter-
annual variations in the settlement rates of puerulus with pre-recruit indices lagged by
four years. This section also analyses catch rates of octopus and dead lobsters within
the fishery.
The third section presents estimates of fisheries indicators obtained from the qR
model (McGarvey et al. 1997; McGarvey and Matthews 2001).
The fourth section uses information provided in sections two and three to assess the
status of the fishery against the biological performance indicators and reference points
defined in the SZRLF Management Plan (Zacharin 1997).
Section five is the General Discussion. It synthesises the information presented,
assesses the status of the fishery and the level of uncertainty in the assessment.
8

The sixth section is the bibliography, which provides a list of research papers and
reports that are directly relevant to research and management of the SZRLF and/or
which are cited in this report. Section seven is the Appendix.
1.2 Description of the Fishery
1.2.1 Location and Size
The Southern Zone Rock Lobster Fishery (SZRLF) includes all South Australian
waters between the mouth of the Murray River and the Victorian border and covers an
area of 22,000 km2 (Figure 1-1). It is divided into seven Marine Fishing Areas
(MFAs), but the majority of fishing occurs in four MFAs (51, 55, 56 and 58).
Figure 1-1 Marine Fishing Areas in the Southern and Northern Zones of the South Australian Rock Lobster Fishery.
1.2.2 Environmental Characteristics
Geology and Oceanography
The sea-floor in the Southern Zone consists mainly of reefs made of bryozoan or
aeolianite limestone. The limestone matrix has eroded to form ledges, crevices,
9

undercuts and holes which provide ideal habitat for lobsters. These reefs are almost
continuous separated by small stretches of sand substrate (Lewis 1981).
The salinity and temperature of the surface water over the continental shelf in the
southern zone cycles seasonally, with minimum salinity and maximum temperature
(35.2 ppt, 18ºC) during summer (Figure 1-2) and maximum salinity and minimum
temperature (35.6 ppt, 14ºC) during winter (Lewis 1981).
The water over the continental shelf is vertically well mixed during winter. However,
during summer the predominant south-easterly winds result in an upwelling of
nutrient-rich, cold water (11-12ºC) which intrudes onto the continental shelf
(Schahinger 1987). This results in an increase in productivity of phytoplankton
(Figure 1-3) which ultimately contributes to the high densities of southern rock lobster
in the SZRLF (Rochford 1977; Lewis 1981).
10

Figure 1-2 Sea-surface temperatures over the continental shelf of South Australia during late summer/early autumn, 1995. In the south-east an upwelling can be seen where cooler water
Figure 1-3 Ocean colour imagery from the SeaWiFS se
(dark blue) has moved onto the inner continental shelf.
nsor for March 2004 showing derived daily average Chlorophyll-a in mg/ m3. Areas of red are indicate production of phytoplankton.
Note the enhancement of phytoplankton production off Robe in the Otway Basin and along the SE coast (green arrow) caused by the Bonney upwelling (McClatchie and Ward 2005).
11

1.2.3 Commercial Fishery
The southern rock lobster, Jasus edwardsii, has been fished in South Australian
waters since the 1890’s, but the commercial fishery did not develop until the late
1940s and early 1950’s when overseas markets for frozen tails were first established
(Copes 1978; Lewis 1981). There has been a gradual change to live export since then
with over 90% of the current commercial catch exported live, mainly to China.
The fishery is primarily a day fishery with lobster pots set overnight and hauled at
first light. The pots are steel-framed and covered with wire mesh that incorporates a
moulded plastic neck (Figure 1-4). The catch is initially stored live in holding wells
on boats and then transferred to live holding tanks at the numerous processing
factories.
Figure 1-4 The most commonly used pot in the SZRLF.
1.2.4 Recreational Fishery
There is an important recreational fishery for lobsters in the area of the SZRLF.
Recreational fishers are allowed to use drop-nets or pots or to dive for lobsters during
the same season as commercial fishers. All recreational lobster pots must be
registered.
Recreational potters, drop netters (with registered pots) and divers were estimated to
have harvested 118 tonnes of rock lobsters, across South Australia, during the 2001
fishing season (Venema et al. 2003). This equates to 4.7% (by weight) of the
12

combined catch of commercial and recreational fishers in South Australia. This is an
underestimate of the total recreational catch of rock lobsters in South Australia as it
does not include the harvest of drop/hoop netters without registered pots, fishers using
other gear types or the catches of charter boats.
A new survey of recreational fishers was undertaken during the 2004/05 season
(Currie et al. 2006). Based on data from registered pot fishers only, the estimated
State recreational catch in the 2004/05 season was 83.17 tonnes of which 74.62 tonnes
came from the SZRLF and 8.56 tonnes from the NZRLF. The number of recreational
pot registrations in the South Australian Rock Lobster Fishery for 2004/05 was 5,656.
The number of individual pots in use was 9,827. Future estimation of the total catch
of rock lobsters by recreational fishers would be enhanced by the establishment of a
comprehensive database of all recreational fishers that take rock lobsters using all
methods (Venema et al. 2003; Currie et al. 2006).
1.2.5 Illegal Catch
Some illegal lobster fishing has, and is, undoubtedly undertaken in the SZRLF.
However, as in most fisheries, the size of the illegal catch has not been quantified The
implementation of systems for monitoring the Total Allowable Commercial Catch
(TACC) combined with the prior reporting system has reduced opportunities for the
disposal of illegal catches. It is considered unlikely that illegal fishing is currently a
significant source of fishing mortality.
1.3 Management of the Fishery
The commercial SZRLF is a limited entry fishery with a total of 181 licences in the
2004/05 fishing season. The majority of boats fish from Port MacDonnell and Robe
(Figure 1-1).
The broad statutory framework for ecologically sustainable management of this
resource is provided by the Fisheries Management Act 1982. General regulations that
govern the SZRLF are described in the Fisheries (General) Regulations 2000 and the
specific regulations are established in the Scheme of Management (Rock Lobster
Fisheries) Regulations 1991.
13

The policy, objectives and strategies to be employed for the sustainable management
of the SZRLF are described in the Management Plan for the South Australian
Southern Zone Rock Lobster Fishery (Zacharin 1997).
Recreational fishers are governed under the Fisheries (General) Regulations 2000.
1.3.1 Management Milestones
Management arrangements have evolved since the inception of the fishery with the
commercial fishery last reviewed in 1997. The major management milestones are
shown in Table 1-1.
Table 1-1 Major management milestones for the South Australian Southern Zone Rock Lobster Fishery (Zacharin 1997).
Date Management milestone
1958 Closed season for females from 1 June-31 October and for males from 1 to 31 October
1967 Pot and boat limit introduced, no new boats to operate in the then “South-Eastern Zone”
1968 Limited entry declared, compulsory commercial catch log
1978 June, July, October closed
1980 Winter closure declared. Season from 1 October to 30 April.
1984 15% pot reduction
1987 Buyback of 40 licences (2455 pots)
1993 April closed; TACC implemented for 1993/94 season at 1720 t
2001/02 TACC increased by 50 t to 1770 t
2003/04 TACC increased by 130 t to 1900; May opened on trial basis
Development and implementation of the quota management system
Seven management options were considered for the fishery (Anon. 1995). These
were: (i) individual transferable quotas, (ii) total allowable catch, (iii) reduction in the
numbers of pots, (iv) gear restrictions, (v) time and area closures, (vi) changes to the
legal minimum size, and (vii) a buyback scheme (Zacharin 1997). From these
options, the Minister for Primary Industries introduced a competitive TACC of 1,650
tonnes for the 1993 season.
14

With the TACC set for the fishery, the most difficult task of implementing the quota
management system was the development of a fair and equitable method of allocating
the TACC amongst fishers. The introduction of the quota management system was a
controversial and complex issue for both the state government and the Fishery
Management Committee to resolve. Individual transferable quotas were introduced at
the beginning of the 1993 fishing season. An outline of the evolution of current
TACC allocations is provided in Zacharin (1997).
1.3.2 Current Management Arrangements
Details of the management arrangements for 2004/05 are provided in Table 1-2. The
commercial fishery is currently managed by a combination of input and output
controls. The season extends from October 1st to April 30th of the following year.
However, in 2003/04 the month of May was also opened to fishing on a trial basis
only. May was also opened on a trial basis during the 2004/05 season. There is a
minimum legal size of 98.5 mm carapace length, prohibition on the taking of berried
females, and several sanctuaries within which lobster fishing is prohibited. The
dimensions of lobster pots, including mesh and escape gap size, are also regulated.
Fishers may use only 80 pots at any one time to take lobster.
The TACC is set each year and is divided evenly between licence holders as
individual transferable quotas (ITQ’s). The daily catch of individual boats is
monitored via catch and disposal records. The quota in 2004/05 was 1900 tonnes.
15

Table 1-2 Management arrangements for the South Australian Southern Zone Rock Lobster Fishery in 2004/05.
Control Details
Licences 181
Season October 1st to May 31st (May opened on trial basis only)
Minimum legal length (both sexes) 98.5 mm CL
Egg bearing females No retention
Dead lobsters Landed whole with tail split and dyed
Holding of live lobsters Holding on vessel, in corfs, or on land
TACC 1900 tonnes
Total pots 11,923
Pot lifts per day No restriction
Minimum pot allocation per licence 40
Maximum pot allocation per licence 100
Maximum pots to be fished per licence
80
Pot specifications Maximum diameter 1 m; maximum height 1 m, maximum weight 40 kg; single top entrance; mesh size 50 mm diameter or escape gaps 55x150 mm
Maximum vessel length No Limit
Maximum main engine BHP No Limit
Catch and effort data Daily logbook submitted monthly
Catch and disposal records Daily CDR records
16

1.3.3 Management Objectives and Strategies
Fishery management objectives and strategies are outlined in the Management Plan
for the SZRLF (Zacharin 1997). The biological and environmental objectives and
strategies are particularly relevant to this present report and are described below in
Table 1-3.
Table 1-3 Biological and environmental objectives of the Management Plan for the South Australian Southern Zone Rock lobster fishery (Zacharin 1997).
Objective Strategy
Biological
Maintain lobster population at a sustainable level across the fishery Harvest rock lobster at a size likely to provide for adequate levels of recruitment
• adopt a precautionary approach • set a TACC each year
• restrict licence no’s to ≤ 185 • control recreational catch • set Legal Minimum Length
Environmental
Minimise the environmental impact of rock lobster fishing Minimise potential conflict with other users of marine resources
• promote environmentally sensitive fishing practices
• promote actions that reduce fishery impacts
• identify the potential for conflict with other marine resource users
• determine strategies to reduce these conflicts
1.3.4 Performance Indicators and Reference Points
Information in this section of the report is taken from the Management Plan for the
SZRLF (Zacharin 1997) and has been updated by Mr Sean Sloan (PIRSA Fisheries).
Reference points are agreed quantitative measures, used to assess performance of the
fishery, based on clearly defined management objectives.
Reference points begin as conceptual criteria that capture in broad terms the
management objectives of the fishery. To implement fishery management it must be
possible to convert the conceptual reference point into a technical reference point,
which can be calculated or quantified on the basis of biological or economic
characteristics of the fishery (Caddy and Mahon 1995).
17
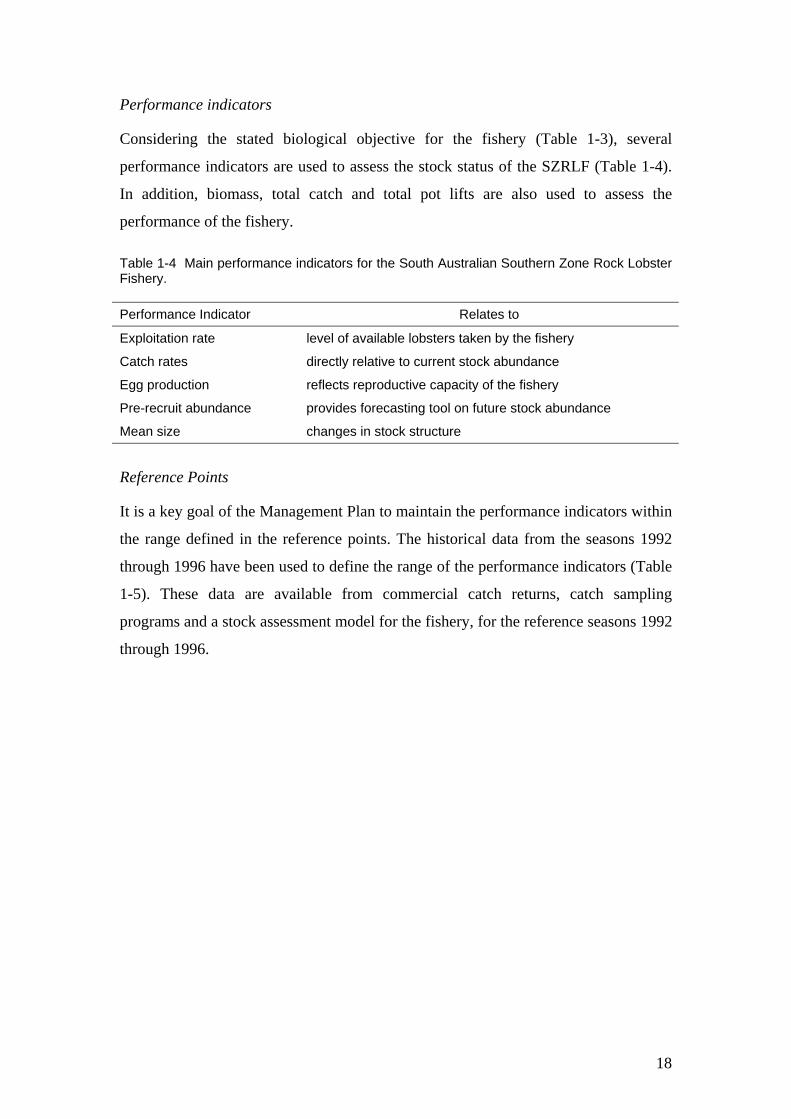
Performance indicators
Considering the stated biological objective for the fishery (Table 1-3), several
performance indicators are used to assess the stock status of the SZRLF (Table 1-4).
In addition, biomass, total catch and total pot lifts are also used to assess the
performance of the fishery.
Table 1-4 Main performance indicators for the South Australian Southern Zone Rock Lobster Fishery.
Performance Indicator Relates to
Exploitation rate level of available lobsters taken by the fishery
Catch rates directly relative to current stock abundance
Egg production reflects reproductive capacity of the fishery
Pre-recruit abundance provides forecasting tool on future stock abundance
Mean size changes in stock structure
Reference Points
It is a key goal of the Management Plan to maintain the performance indicators within
the range defined in the reference points. The historical data from the seasons 1992
through 1996 have been used to define the range of the performance indicators (Table
1-5). These data are available from commercial catch returns, catch sampling
programs and a stock assessment model for the fishery, for the reference seasons 1992
through 1996.
18

Table 1-5 Biological reference points for the South Australian Southern Zone Rock Lobster Fishery.
Reference season
Reference Point 1992 1993 1994 1995 1996 Range
Exploitation rate+ 0.37 0.41 0.40 0.42 0.44 0.37-0.44
Egg production (109)++ 1 019 (13%)
1 018 (12%)
969 (12%)
926 (11%)
895 (11%)
895-1019
Pre-recruit abundance+++ 1.47 1.32 1.53 1.44 1.20 1.20-1.53
Catch rates (kg.potlift-1) 0.9961 1.0146 1.1383 1.0568 0.9351 0.9351-1.1383
Mean size (kg)++++ 0.7943 0.8392 0.8316 0.8282 0.8388 0.7943-0.8392
+The exploitation rate is the proportion of the population harvested annually, determined from the dynamic qR method using annual catches by weight and number. ++Total egg production (including only legal size females) has been derived from the qR stock assessment model (McGarvey et al 1997). Percent of virgin in brackets. +++The pre-recruit index is undersize catch per unit of effort (CPUE) reported in commercial catch data summed over the months of November to March (inclusive). ++++Mean size of rock lobster landed across the fishery.
1.3.5 Management action on reaching a reference point outside the historical range.
When one or more of the reference points described above are reached or exceeded,
the management committee will undertake the following actions:
1. Notify the Minister for Primary Industries, Natural Resources and Regional Development and participants in the fishery as appropriate,
2. Undertake an examination of the causes and implications of ‘triggering’ a reference point,
3. Consult with the SZRLF industry and PIRSA on the need for alternative management strategies or actions, which may include:
a. changes to the TACC in subsequent years or,
b. changes to the minimum size limit, or
c. changes to the fishing season.
4. Provide a report to the Minister and industry, within three months of the initial notification, on the outcomes of a review of the effect of triggering a performance indicator.
19

1.4 Biology of Southern Rock Lobster
1.4.1 Taxonomy and Distribution
Southern rock lobster, Jasus edwardsii (Hutton 1875) (Figure 1-5), are distributed
around southern mainland Australia, Tasmania and New Zealand (Smith et al. 1980;
Booth et al. 1990). In Australia, the most northerly distribution is Geraldton in
Western Australia and Coffs harbour in northern New South Wales, however the bulk
of the population can be found in South Australia, Victoria, and Tasmania where they
occur in depths from 1 to 200 m (Brown and Phillips 1994).
Figure 1-5 Southern rock lobster, Jasus edwardsii, in reef habitat.
1.4.2 Stock Structure
Very little evidence has been found to discriminate between southern rock lobster
populations. Few genetic or morphological differences that may indicate sub-
structuring have been found in the Jasus edwardsii population from southern
mainland Australia, Tasmania and New Zealand (Smith et al 1980; Booth et al 1990;
Brasher et al. 1992). Similarly, mitochondrial DNA analysis has failed to detect any
sub-division of the population on a smaller scale and it is likely that there is some
exchange of genetic material from lobsters from south-eastern Australia to New
Zealand (Ovenden et al. 1992). The long larval phase and widespread occurrence of
larvae across the central and south Tasman Sea, in conjunction with known current
flows, point to the likely transport of phyllosoma from south-eastern Australia to New
Zealand providing genetic mixing between the two populations (Booth et al 1990).
20

The above notwithstanding, it is often useful to define spatially discrete fish stocks for
management purposes i.e. Northern and Southern Zones of the Southern Rock lobster
fishery in South Australia. In New Zealand, clustering techniques have been used to
partition rock lobster statistical areas into groups based on some characteristic of the
fishery i.e. trends in catch rates, size frequency distributions and size of maturity
(Bentley and Starr 2001). This is used to provide aggregations of statistical areas, that
to some degree, reflect fish stocks for stock assessment purposes.
1.4.3 Life History
Southern rock lobster mate from April to July. Fertilisation is external, with the male
depositing a spermatophore on the female’s sternal plates (MacDiarmid 1988). The
eggs are extruded shortly afterwards and are brooded over the winter for about 3-4
months (MacDiarmid 1989).
The larvae hatch in early spring, pass through a brief (10-14 days) nauplius phase into
a planktonic, leaf-like phase called phyllosoma. Phyllosoma have been found down
to depths of 60 m and tens to hundreds of kilometres offshore from the New Zealand
coast (Booth et al. 1991; Booth and Stewart 1992; Booth 1994; Booth et al. 1999;
Booth et al. 2002). They develop through a series of 11 stages over 12-23 months
before metamorphosing into the puerulus (settlement) stage near the continental shelf
break (Booth et al 1991; Booth and Stewart 1992; Bruce et al. 1999). The puerulus
actively swims inshore to settle onto reef habitat in depths from 50 m to the intertidal
zone (Booth et al 1991).
Geographic variation in larval production may be marked. In New Zealand, it has
been suggested that this may be due to variations in: (i) size at first maturity, (ii)
breeding female abundance and/or (iii) egg production per recruit (Booth and Stewart
1992). Additionally, phyllosoma are thought to drift passively which, coupled with
the long offshore larval period, means that oceanographic conditions, particularly
currents and eddies, may play an important part in their dispersal (Booth and Stewart
1992).
Geographic patterns in the abundance of phyllosoma may also be consistent with
those in puerulus settlement (Booth and Stewart 1992; Booth 1994). Correlations
between levels of settlement and juvenile abundance have been found at two sites in
21

New Zealand (Breen and Booth 1989; Booth and Stewart 1993). In South Australia, it
has been suggested that the strength of westerly winds, during late winter and early
spring, may play a role in the inter-annual variation in recruitment to the SZRLF
(McGarvey and Matthews 2001). In this study, both winds and recruitment were
shown to exhibit a 10-12 year periodicity, with significant correlations between
Figure 1-6 Phyllosoma collected in plankton tow from s
recruitment and westerly winds lagged by 5-7 years.
outh coast of Kangaroo Island in February 2005.
and Size at Maturity
ulting and thus increase their size incrementally
ated that there was substantial variation in growth
1.4.4 Growth
Lobsters grow through a cycle of mo
(Musgrove 2000). Male and female moult cycles are out of phase by 6 months, with
males undergoing moulting between October and November, and females during
April to June (MacDiarmid 1989).
McGarvey et al., (1999a) demonstr
rates between locations in South Australia. Growth rates also varied throughout the
life of individuals with the mean annual growth for lobsters at 100 mm carapace
length (CL) ranging from 7-20 and 5-15 mm.yr-1 for males and females respectively.
Growth rates tended to increase along the South Australian coast from south-east to
north-west and were highest in areas of low lobster density and high water
22

temperature. Growth rates also appeared to be related to depth of habitat and declined
at the rate of 1 mm (CL)/yr-1 for each 20 m increase in depth (McGarvey et al 1999a).
The size at which 50% of emales are sexually mature appears spatially variable, f
1.4.5 Movement
ovement patterns of the southern rock lobster Jasus edwardsii
st
ranging between approximately 90 mm and 115 mm (CL) (Prescott et al. 1996).
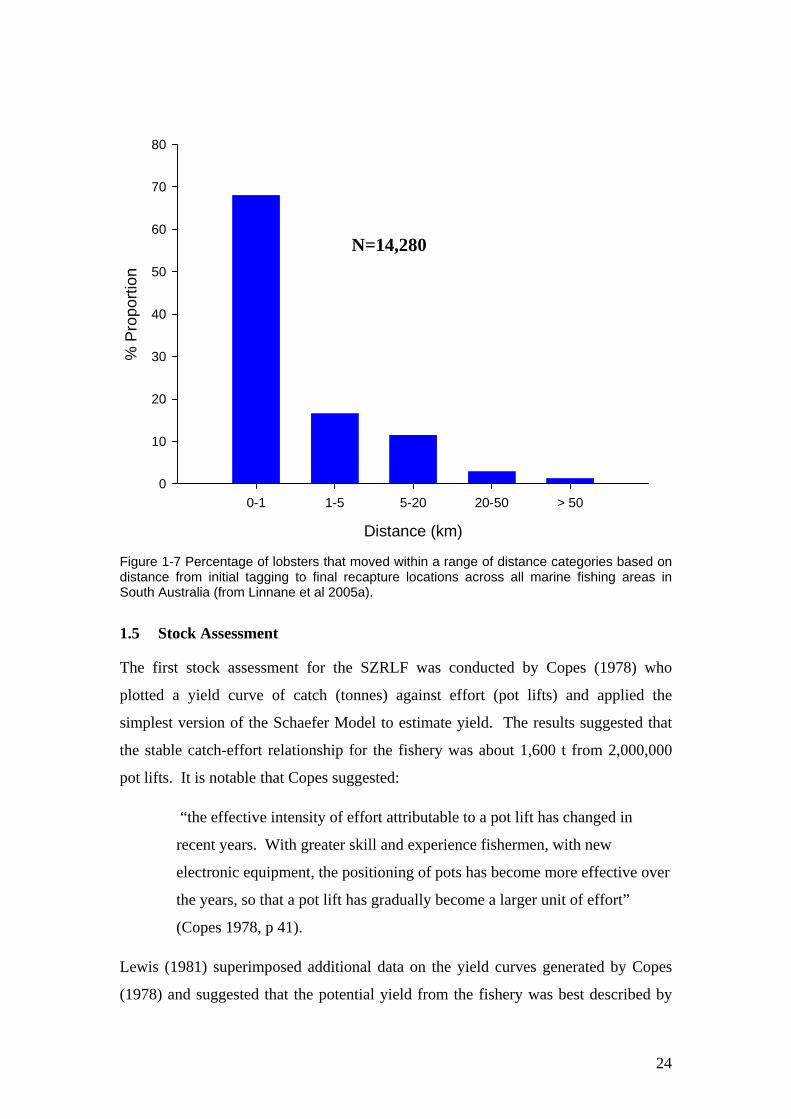
In South Australia, m
were determined from 14,280 tag-recapture events from across the State between
1993 and 2003 (Linnane et al. 2005a). In total, 68% of lobsters were recaptured
within 1 km of their release site and 85% within 5 km (Figure 1-7). The proportion of
lobsters moving >1 km in Marine Fishing Areas (MFAs) ranged from 13 to 51%.
Movement rates were noticeably high in the south-east and at Gleesons Landing
lobster sanctuary off the Yorke Peninsula (refer to Figure 1-1) but patterns of
movement differed spatially. In the south-east, lobsters moved distances of <20 km
from inshore waters to nearby offshore reefs whereas off the Yorke Peninsula
individuals moved distances >100 km from within the sanctuary to sites located on
the north-western coast of Kangaroo Island and the southern end of Eyre Peninsula.
These results support findings from an earlier tag–recapture study where mo
recaptured lobsters had moved short distances with only a small proportion having
moved distances greater than a few kilometres, up to 28 km (Lewis 1981). Similarly,
larger movements were generally in an offshore direction and were from the
Kingston-Cape Jaffa region which is adjacent to the Coorong. High site fidelity was
also found in tagging studies conducted in Tasmania with more than 90% of tagged
lobsters moving less than 5 km (Gardner et al. 2003). However, consistently greater
movement did occur from areas to the north of Tasmania. All the above studies
indicated that immature lobsters moved greater distances than mature individuals.
23
Distance (km)
0-1 1-5 5-20 20-50 > 50
% P
ropo
rtion
0
10
20
30
40
50
60
70
80
N=14,280
Figure 1-7 Percentage of lobsters that moved within a range of distance categories based on distance from initial tagging to final recapture locations across all marine fishing areas in South Australia (from Linnane et al 2005a).
1.5 Stock Assessment
The first stock assessment for the SZRLF was conducted by Copes (1978) who
plotted a yield curve of catch (tonnes) against effort (pot lifts) and applied the
simplest version of the Schaefer Model to estimate yield. The results suggested that
the stable catch-effort relationship for the fishery was about 1,600 t from 2,000,000
pot lifts. It is notable that Copes suggested:
“the effective intensity of effort attributable to a pot lift has changed in
recent years. With greater skill and experience fishermen, with new
electronic equipment, the positioning of pots has become more effective over
the years, so that a pot lift has gradually become a larger unit of effort”
(Copes 1978, p 41).
Lewis (1981) superimposed additional data on the yield curves generated by Copes
(1978) and suggested that the potential yield from the fishery was best described by
24

curves indicating a yield of between 1,600 and 1,800 tonnes. Lewis (1981) also noted
that the yield curves indicated that an effort reduction of approximately 900,000 pot
lifts would result in the same total catch. At the time the report was written (1981),
1,730,000 pot lifts resulted in a total catch of 1,700 tonnes. In 2001, 910,000 pot lifts
resulted in the same total catch as that attained in 1981.
Since the mid-1990s, the qR model (McGarvey et al 1997; McGarvey and Matthews
2001) has provided the basis for reporting against the performance indicators for the
fishery (exploitation rate and egg production). Like most stock assessment models,
the qR model has undergone a process of continuous refinement (McGarvey and
Matthews 2001). Outputs of the latest version of the qR model are presented in
section three of this present report.
1.6 Current Research and Monitoring Programs
SARDI Aquatic Sciences is contracted by PIRSA Fisheries Policy Group to: (i)
administer a daily logbook program, (ii) collate catch and effort information, (iii)
conduct pot-sampling, bycatch, puerulus and fishery independent monitoring
programs and (iii) produce annual stock assessment and status reports that assesses
the status of the SZRLF against the performance indicators defined in the
Management Plan.
1.6.1 Catch and Effort Research Logbook
Licence holders complete a compulsory daily logbook which has been amended to
accommodate changes in the fishery. During 1998, the logbook was modified to
include specific details about King crab (Pseudocarcinus gigas) fishing depth when it
was found that on some fishing trips, fishers split their gear between lobster and crab
fishing. In the 2000 fishing season, the logbook was amended and the recording of
undersize, spawning and dead lobster, along with numbers of octopus became
voluntary. Logbook returns are submitted monthly and are entered into the South
Australian Rock Lobster (SARL) database.
25
Details currently recorded in the daily logbook include:
1. the MFA within which the fishing took place, 2. depth in which the pots were set, 3. number of pots set, 4. weight of retained legal-sized lobsters - reported at the end of each trip or as a
daily estimated weight, 5. landed number of legal-sized lobsters, 6. number of undersized lobsters caught, 7. number of dead lobsters caught, 8. number of spawning lobsters caught, 9. weight of octopus caught, 10. number of octopus caught, 11. number of giant crab pots, 12. depth of giant crab pots, 13. landed weight of giant crabs, 14. landed number of giant crabs.
Validation of catch and effort logbook data in the SZRLF can be achieved by
comparing them with the catch and disposal records (CDRs) used in the quota
management system. Processor records are not used for validation as lobsters may be
transported to processors outside of the zone in which the lobsters were landed.
1.6.2 Pot Sampling
Since 1991, commercial fishers and researchers have collaborated in an at-sea pot-
sampling program. During the life of this program there were various levels of
participation, and changes to the sampling regime. The program started with
commercial fishers sampling from several (usually 3) pots each day, for the duration
of the fishing season. During the 1995 season, sampling was reduced to one week
each month over the period of the third quarter of the moon. During the following
season, sampling was done as part of an FRDC project that aimed to determine the
optimal sampling strategy required to produce quantifiable and minimum variances in
the mean lengths and catch rates (McGarvey et al. 1999b; McGarvey and Pennington
2001). This study demonstrated that the optimal design should incorporate a high
percentage of boats, with sampling done on as many days as possible from a small
fraction of the pots from each boat. During the 1997 and 1998 seasons, fishers were
encouraged to follow this sampling strategy. They were supported by research staff
who went to sea on commercial vessels to encourage more fishers to participate in the
program and to demonstrate the methods to new participants.
26

Participation in the program is neither random nor systematic and participation in the
pot sampling program varied among areas and tended to taper off as the season
progressed (Prescott et al. 1999). In addition, overall participation in the program has
decreased over the last number of seasons (Figure 1-8) although this increase slightly
to over 30 % in the 2004/05 season. Low participation in the programme may bias
catch rates and length frequencies. One solution to this problem would be to ensure
that all fishers provide detailed information from a small number of pots (3-5) on
every trip.
0
10
20
30
40
50
1999/00 2000/01 2001/02 2002/03 2003/04 2004/05
Season
% L
icen
ce h
olde
rs
Figure 1-8 Percentage of licence holders participating in the SZRLF catch sampling program over the last 6 seasons.
1.6.3 Puerulus Monitoring Program
Larval recruitment processes may be related to changes in breeding stock abundance
and seasonal, annual and geographic variation in recruitment to the fishery (Booth et
al. 2002). As a result, knowledge of these processes may ultimately improve the
usefulness of fishery assessment models.
The monthly occurrence of puerulus settlement in crevice collectors has been studied
in the SZLRF at 5 main sites since 1990 (Linnane et al. 2005c). These sites are
located at Blackfellows Caves, Livingston Beach, Beachport, Cape Jaffa and
Kingston with the collectors set in groups of 10 or 12. The annual Puerulus
Settlement Index (PSI) is calculated as the mean monthly settlement on these
27

collectors. This index is then related to annual pre-recruit index (PRI) and model
estimated recruitment lagged by three and four years respectively.
1.6.4 Octopus Predation Project
Mortality of lobsters due to predation in pots, especially by Maori octopus (Octopus
maorum) is a significant problem in the South Australian Rock Lobster Fishery
(SARLF), but has generally been considered to be unavoidable, resulting in minimal
effort being expended in determining the scale of the problem or investigating a
solution. In 1998, a project entitled “Development and assessment of methods to
reduce predation of ‘pot caught’ southern rock lobster (Jasus edwardsii) by Maori
octopus (Octopus maorum)” was initiated. This project was funded by the Fisheries
Research and Development Corporation (Project 1998/150). This project was initiated
to quantify levels of octopus predation and investigate methods for reducing rates of
lobster mortality in pots, the findings of which are published in Brock and Ward
(2004) and Brock et al. (2006 a and b). Some of the main outcomes from the study are
as follows:
• Since 1983, between 38,000 and 119,000 octopuses per annum have been taken in SARLF traps
• Over the period 1998-2003, approximately 240,000 lobsters per annum were killed in traps, representing ~4% of the total catch.
• Field studies show that over 98% of within-trap lobster mortality is attributable to octopus predation. Lobster mortality rates are positively correlated with the catch rates of octopus and lobster.
• Aquarium studies showed that octopuses were primarily attracted to traps by the presence of bait as opposed to lobsters and that octopus entry into traps was ‘fortuitous’ and mediated by speculative exploration.
• The presence of escape gaps did not significantly affect the predation rates of lobsters above the minimum legal size, but significantly reduced the retention and subsequent mortality of under-sized lobsters.
• The presence of an escape gap did not affect legal sized lobster catch rates.
• A two-chambered lobster trap was developed that in aquarium and field trials significantly reduced octopus predation on trap-caught spiny lobster by 45-48% but which also lead to reduced catch rates of legal sized lobster.
• Lobster mortality rates were positively correlated with soak-times in the Southern Zone fishery and lobster size. Minimizing soak-times is one method currently available for reducing lobster mortality rates.
28

1.6.5 By-catch Monitoring Program
A report detailing the species composition and spatio-temporal trends in by-catch
from the South Australian commercial rock lobster fishery was finalised in 2004
(Brock et al. 2004). The report identifies the main by-catch species within the fishery
and estimates catch rates of by-catch as determined during the 2001/02 and 2002/03
fishing seasons. It also compares the effectiveness of logbook and observer sampling
strategies and comments on the appropriateness of each for application within the
South Australian rock lobster fishery.
In addition to the study by Brock et al (2004), ongoing monitoring of by-catch from
the SZRLF is undertaken annually by SARDI scientists during routine onboard catch
sampling (Figure 1-9). The results indicate that over the last three seasons, by-catch
has been dominated by crustaceans (mainly velvet and hermit crabs) and temperate
reef finfish namely leatherjacket (dominated by the horseshoe leatherjacket
Meuschenia hippocrepis; Figure 1-10) and wrasse species (dominated by the blue
throat wrasse Notolabrus tetricus; Figure 1-11). The remainder of by-catch was
composed of slimy cod and other species. A risk assessment of by-catch species
associated with the SZRLF is planned as part of the new Management Plan for the
fishery.
0%
10%
20%
30%
40%
50%
60%
70%
80%
90%
100%
2002 2003 2004
Season
Perc
enta
ge o
f tot
al B
y-ca
tch
OthersSlimy Cod sp.Wrasse sp.Crustacean sp.Leatherjacket sp.
Figure 1-9 Species composition of by-catch from the SZRLF from 2002 to 2004 as determined from routine onboard catch sampling.
29

Figure 1-10 Horseshoe leatherjacket (Meuschenia hippocrepis).
Figure 1-11 Blue throat wrasse (Notolabrus tetricus).
30

2 FISHERY STATISTICS
2.1 Introduction
This section of the report summarises and analyses fishery statistics for the SZRLF
for the period between 1st January 1970 and 31sh May 2005. For ease of reference,
figures and text in this section refer to the start of season year e.g. 2004 refers to the
2004/05 fishing season. Estimates presented in this section are calculated from daily
data and differ slightly from estimates based on season totals that are presented in
other sections of this report. Daily data are used to describe the inter-annual and
within-season patterns in catch (kg), effort (potlifts), catch-per-unit-effort CPUE
(kg/potlift), mean weight (kg/lobster), undersized lobsters and spawning lobsters in
the main MFAs of the SZRLF and in four depth classes (0-30, 31-60, 61-90 and >90
metres). Data obtained from the commercial pot sampling program provide the length
frequency distributions of lobsters sub-divided by MFA and season. Estimates of
inter-annual variations in settlement of puerulus are compared with pre-recruit indices
and model estimated recruitment lagged by three and four years respectively.
2.2 Catch, Effort and CPUE
2.2.1 Inter-annual Patterns
Catch
Fishing patterns between 1970 and 1983 were highly variable and some discrepancies
exist between the published catches for this period and those extracted from the
SARL database. Estimates of absolute catch should thus also be viewed with some
caution (Figure 2-1). The highest published catch during this period was in 1971 when
approximately 2,000 tonnes were landed. The lowest published catch during this
period was 1,250 tonnes in 1976.
Between 1984 and 1990 catches remained steady at around 1,500 tonnes and then rose
to 1,940 tonnes in 1991 before declining again to 1,670 tonnes in 1993. In 1993, a
TACC of 1,720 tonnes was introduced, but only 1,668 tonnes was harvested. From
1993 to 1997, the only year in which the entire TACC was taken was 1994. The
TACC was taken from 1998 through to 2002 with a quota increase of 50 tonnes to
31

1,770 tonnes implemented in 2001. In 2003, the TACC was again increased to 1,900
tonnes. In 2004, the total reported commercial catch was 1,897 tonnes.
Effort
Estimates of effort between 1970 and 1983 should be viewed with caution (Figure
2-1). A peak in effort (2.3 million pot lifts) was recorded at the end of this period in
1983. The lowest level of effort in this period was in 1974, when 1.3 million pot lifts
were recorded.
Over the next decade, effort declined steadily from 2.3 million pot lifts in 1983 to 1.5
million in 1994. Effort then rose again to 1.7 million pot lifts in 1997, before falling
rapidly to the lowest recorded level of 854,000 pot lifts during the 2002 season. In the
2003, a total of 1,042,233 potlifts were required to catch the 1,900 tonne TACC. This
was an increase in effort of 18% from 2002 when the TACC was 1,770 tonnes. In
2004, a total of 1,051,520 potlifts were required to catch the TACC (retained at 1,900
tonnes), an increase of 0.8% from 2003.
CPUE
CPUE during the 1970s was between 0.70 and 0.90 kg/pot lift (Figure 2-2). In 1980,
the CPUE reached a pre-quota peak of 1.06 kg/pot lift and then declined to 0.77
kg/pot lift in 1983. CPUE remained steady at around 0.75 kg/pot lift from 1983-1988
before rising to 0.99 kg/pot lift in 1992 (the year prior to introduction of the TACC).
The TACC was introduced in 1993. In 1994, the CPUE had risen to 1.12 kg/pot lift
but declined to 0.93 kg/pot lift in 1996. Since then, it has increased substantially
reaching 2.1 kg/pot lift in 2002. In 2004, the annual CPUE was 1.81 kg/pot lift, the
third highest in the history of the fishery. It should be noted that this estimation does
not take into account lobsters that were high graded during the season i.e. returned to
the water due to damage or having a low size related market value.
32

Quota Introduced
0
500
1000
1500
2000
2500
70 72 74 76 78 80 82 84 86 88 90 92 94 96 98 00 02 04
Season
Cat
ch (t
onne
s)
0
500
1000
1500
2000
2500E
ffort (000's pot lifts)Catch (publ.)CatchEffort
Figure 2-1 Inter-annual trends in catch and effort in the South Australian SZRLF for seasons between 1970 and 2004.
Season
1970
1971
1972
1973
1974
1975
1976
1977
1978
1979
1980
1981
1982
1983
1984
1985
1986
1987
1988
1989
1990
1991
1992
1993
1994
1995
1996
1997
1998
1999
2000
2001
2002
2003
2004
CP
UE
(kg/
potli
ft)
0.00.20.40.60.81.01.21.41.61.82.02.2
Quota introduced
1.81 kg/potlift
Figure 2-2 Inter-annual trends in catch-per-unit-effort (CPUE) in the South Australian SZRLF for seasons between 1970 and 2004.
33

2.2.2 Within-season Patterns
Catch
Fishing in 1970 through 1979 was conducted all year round although the majority of
the catch was taken in the summer months (Figure 2-3). A seven-month fishing
season from October to April was implemented in 1980. From 1980 to 1996, the
highest catches were almost always taken in the fist six months of the season before
dropping off in April (Figure 2-4 to 2.5). Since 1999, the fishery has recorded high
monthly catches for the period from October to January, with catches declining
sharply after January as the bulk of the TACC had generally been taken by this time.
In 2003, a trial extension of the commercial fishing season until May 31st was
approved with approximately 30 tonnes landed during that month (Figure 2-6). May
was also opened in 2004 during which 16.6 tonnes were landed (refer to section 2.13).
Catches in April of both 2003 and 2004 were higher than those of 2002 (where May
was closed) reflecting a greater level of flexibility within the fishery in 2003 and 2004
to spread catch over time.
Effort
Between 1980 and 1993, fishing effort was consistently high from October to March
before dropping sharply during April (except in 1992; Figures 2-4 to 2-5). This
probably reflects a seasonal decline in catch rate and the fact that there are relatively
more fishable days during summer than at other times of the year. This trend
continued until after the introduction of quota in 1993 until 1996. Since 1998, effort
began to decline rapidly after January, which was much earlier than in previous
seasons, reflecting that the majority of the TACC had been taken by this time. In
2004, within season trends in effort, generally reflected trends in catch (Figure 2-6).
34

No v Dec Jan Feb M ar A p r M ay Jun Jul A ug Sep
1975
0
100
200
300
400
Effo
rt (
'000
s p
l)
0
100
200
300
400
No v Dec Jan Feb M ar A p r M ay Jun Jul A ug Sep t
1970C
atch
(to
nn
es
)CatchEf fort
0
100
200
300
400
No v Dec Jan Feb M ar A p r M ay Jun Jul A ug Sep
1971
Cat
ch (
ton
ne
s)
0
100
200
300
400
No v Dec Jan Feb M ar A pr M ay Jun Jul A ug Sep
1972
Cat
ch (
ton
ne
s)
0
100
200
300
400
Nov Dec Jan Feb M ar A p r M ay Jun Jul A ug Sep
1973
Cat
ch (
ton
ne
s)
0
100
200
300
400
Nov Dec Jan Feb M ar A p r M ay Jun Jul A ug Sep
1974
Cat
ch (
ton
ne
s)
No v Dec Jan Feb M ar A p r M ay Jun Jul A ug Sep
1976
0
100
200
300
400
Effo
rt (
'000
s p
l)
No v Dec Jan Feb M ar A pr M ay Jun Jul A ug Sep
1977
0
100
200
300
400
Effo
rt (
'000
s p
l)
No v Dec Jan Feb M ar A p r M ay Jun Jul A ug Sep
1978
0
100
200
300
400
Effo
rt (
'000
s p
l)
No v Dec Jan Feb M ar A p r M ay Jun Jul A ug Sep
1979
0
100
200
300
400
Effo
rt (
'000
s p
l)
Figure 2-3 Within-season trends in catch and effort in the SZRLF for the fishing seasons between 1970 and 1979.
35

0
100
200
300
Oct No v Dec Jan Feb M ar A p r
Cat
ch (
ton
ne
s)
36
Figure 2-4 Within-season trends in catch and effort in the SZRLF for the fishing seasons between 1980 and 1990.
400
1980 CatchEf fort
0
100
200
300
400
Oct No v Dec Jan Feb M ar A p r
1981
Cat
ch (
ton
ne
s)
0
100
200
300
400
Oct No v Dec Jan Feb M ar A p r
1982
Cat
ch (
ton
ne
s)
0
100
200
300
400
Oct No v Dec Jan Feb M ar A p r
1983
Cat
ch (
ton
ne
s)
0
100
200
300
400
Oct No v Dec Jan Feb M ar A p r
1985
Cat
ch (
ton
ne
s)
Oct No v Dec Jan Feb M ar A p r0
100
200
300
Effo
rt (
'000
s p
l)
1986 400
Oct No v Dec Jan Feb M ar A p r
1987
0
100
200
300
400
Effo
rt (
'000
s p
l)
Oct No v Dec Jan Feb M ar A p r
1988
0
100
200
300
400
Effo
rt (
'000
s p
l)
Oct No v Dec Jan Feb M ar A p r
1989
0
100
200
300
400
Effo
rt (
'000
s p
l)
1990
Oct No v Dec Jan Feb M ar A p r0
100
200
300
400
Effo
rt (
'000
s p
l)

0
100
200
300
400
Oct No v Dec Jan Feb M ar
Cat
ch (
ton
ne
s)
1992CatchEf fort
0
100
200
300
400
Oct No v Dec Jan Feb M ar A p r
1993
Cat
ch (
ton
ne
s)
0
100
200
300
400
Oct No v Dec Jan Feb M ar A p r
1994
Cat
ch (
ton
ne
s)
0
100
200
300
400
Oct No v Dec Jan Feb M ar A p r
1995
Cat
ch (
ton
ne
s)
0
100
200
300
400
Oct No v Dec Jan Feb M ar A p r
1996
Cat
ch (
ton
ne
s)
Oct No v Dec Jan Feb M ar A p r0
100
200
300
Effo
rt (
'000
s p
l)
1997 400
Oct No v Dec Jan Feb M ar A p r
1998
0
100
200
300
400
Effo
rt (
'000
s p
l)
Oct No v Dec Jan Feb M ar A p r
1999
0
100
200
300
400
Effo
rt (
'000
s p
l)
Oct No v Dec Jan Feb M ar A p r
2001
0
100
200
300
400
Effo
rt (
'000
s p
l)Oct No v Dec Jan Feb M ar A p r
2000
0
100
200
300
400
Effo
rt (
'000
s p
l)
Figure 2-5 Within-season trends in catch and effort in the SZRLF for the fishing seasons between 1992 and 2001.
37

2004
050
100150200250300350400450
Oct Nov Dec Jan Feb Mar Apr MayMonth
Cat
ch (t
)
0
50
100
150
200
250
300
350
400
Effort (1000's potlifts)
CATCHEFFORT
2002
050
100150200250300350400450
Oct Nov Dec Jan Feb Mar AprMonth
Cat
ch (t
)
050100150200250300350400
Effort (*1000's potlifts)
CATCHEFFORT
2003
050
100150200250300350400450
Oct Nov Dec Jan Feb Mar Apr MayMonth
Cat
ch (t
)
050100150200250300350400
Effort (*1000's potlifts)
CATCH
EFFORT
Figure 2-6 Comparison of within-season trends in catch and effort in the SZRLF for the 2002, 2003 and 2004 fishing seasons.
38

CPUE
The within-season trend in CPUE was similar during the 1970’s, 1980’s and 1990’s
(Figure 2-7). There was a distinct seasonal pattern of high CPUE during the summer
months and lower CPUE at the beginning and end of the fishing seasons. During
2004, CPUE was highest in January (2.07 kg/potlift) as in previous seasons (Figure
2-8) and thereafter decreased to 1.54 kg/potlift in May.
Month
Oct Nov Dec Jan Feb Mar Apr May Jun Jul Aug Sep
CP
UE
(kg/
pot l
ift)
0.5
1.0
1.5
1970 - 801981 - 90 1991 - 00
Figure 2-7 Within-season trends in CPUE (mean ± SE) in the SZRLF for the 1970s, 80s, 90s.
Month
Oct Nov Dec Jan Feb Mar Apr May
CPU
E (k
g/po
t lift
)
1.0
1.5
2.0
2.5
2001 200220032004
Figure 2-8 Within season trends in CPUE (mean ± SE) in the SZRLF from 2001 to 2004.
39

2.2.3 Patterns across MFAs
Catch
While fishing is typically undertaken in seven MFAs in the SZRLF, the majority of
the catch is taken in MFAs 51, 55, 56 and 58 (Figure 2-9, Figure 2-10, refer to Figure
1-1). In the 2004 season, 98.5% of the total catch came from these four MFAs. Prior
to 1983, catches were similar between MFAs 55 and 56 but since then the highest
catches have been consistently recorded in MFA 55. In 2004, catches were 689, 615
and 520 tonnes in MFAs 55, 56 and 58, respectively. The catch in MFA 51 has
declined from around 200-300 tonnes during the 1970’s to less than 100 tonnes over
the last 5 years. Data in section 2.3.3 indicates that lobsters harvested from MFA 51
are generally larger in size and thus have low market value given the preference for
smaller individuals. In 2004, just 44 tonnes were harvested in MFA 51.
Effort
The majority of fishing effort is expended in MFAs 51, 55, 56 and 58 (Figure 2-10).
The greatest relative change in effort has been in MFA 51, where effort has decreased
from ~300,000 pot lifts in 1972 to ~18,000 pot lifts in 2004. In MFA 55, effort
increased from the 1970s to a peak of ~905 000 pot lifts in 1983 and has decreased
since then to ~326,000 pot lifts in 2004. Similarly, there has been a gradual decline in
effort since the early 1980’s in MFAs 56 and 58. In 2004, effort increased in MFA 51
and MFA 58 by 11 and 7%, respectively, from 2003 figures. Effort decreased in MFA
55 by 6% and remained constant in MFA 56 from 2003 figures.
CPUE
Trends in CPUE are generally similar for the main MFAs of the SZRLF (Figure
2-11). Prior to 1998, the CPUE ranged from 0.63 – 1.28 kg/pot lift. Generally, CPUE
has tended to increase since 1970, with the highest CPUEs occurring in MFA 51 and
the lowest in MFA 58.
During the early 1990’s, CPUE in the main MFAs rose slowly until 1998, after which
CPUE increased rapidly. The CPUE in 2002 was the highest recorded for each MFA,
reaching levels of 2.0, 2.4, 2.5 and 1.6 kg/pot lift in MFAs 51, 55, 56 and 58,
respectively. Prior to the introduction of the TACC, the highest CPUE values
40

recorded for these MFAs were 1.3, 1.2, 1.0 and 0.9 kg/pot lift respectively. In 2004,
CPUE increased in MFA 51 (from 1.9 to 2.4 kg/potlift) and MFA 55 (2.0 to 2.1
kg/potlift) and decreased in MFA 56 (1.98 to 1.91 kg/potlift) compared to 2003
estimates. CPUE remained at ~1.41 kg/potlift in MFA 58.
2%
37%
33%
28%
MFA 51MFA 55MFA 56MFA 58
Figure 2-9 Proportion of the catch taken from each of the major MFAs in the SZRLF in 2004.
41

Cat
ch (t
onne
s)E
ffort (x1000 pot lifts)
0
200
400
600
800
0
200
400
600
800
1000
MFA51 Ca Yr vs MFA 51 Eff
MFA 5119
7019
7219
7419
7619
7819
8019
8219
8419
8619
8819
9019
9219
9419
9619
9820
0020
0220
04
0
200
400
600
800
0
200
400
600
800
1000MFA 55
0
200
400
600
800
0
200
400
600
800
1000
MFA 56
1970
1972
1974
1976
1978
1980
1982
1984
1986
1988
1990
1992
1994
1996
1998
2000
2002
2004
0
200
400
600
800
0
200
400
600
800
1000
MFA 58
Figure 2-10 Inter-annual trends in catch and effort in the main MFAs of the SZRLF for the fishing seasons between 1970 and 2004.
0.0
0.5
1.0
1.5
2.0
2.5MFA 51
1970
1972
1974
1976
1978
1980
1982
1984
1986
1988
1990
1992
1994
1996
1998
2000
2002
2004
0.0
0.5
1.0
1.5
2.0
2.5MFA 55
1970
1972
1974
1976
1978
1980
1982
1984
1986
1988
1990
1992
1994
1996
1998
2000
2002
2004
MFA 56
Season
CP
UE
(kg/
pot l
ift)
MFA 58
Figure 2-11 Inter-annual trends in CPUE (± SE of the mean) of the main MFAs of the SZRLF for the fishing seasons between 1970 and 2004.
42

2.2.4 Patterns across Depths
Catch by depth
During the 1970’s the majority of the catch was taken equally from the depth ranges
of 0-30 m and 31-60 m (Figure 2-12) with ~20% of the catch coming from depths >60
m. Over the next 2 decades, the proportion of the catch taken from depths >30 m
increased. This was presumably influenced by the gradual adoption of modern
technology within the fishing fleet that allowed deeper water to be fished more easily.
Over the last three fishing seasons however, >85% of the catch has been landed from
depths <60 m. In 2004, <2% of the catch was taken in depths >90 m.
In MFA 51, the majority of the catch has been taken from the 31-60 m depth range
over the last three seasons (Figure 2-13). This trend continued in 2004, with 77% of
the catch coming from this depth range. Similarly, over 60% of the catch in MFA’s 55
and 56 over the last three seasons has come from the 31-60 m depth range. In 2004,
~14% of the catch was taken in depths >60 m in MFA 55 while 8% of the catch was
taken in depths >60 m in MFA 56.
In MFA 58, >85% of the catch has come from depths <60 m over the last three
seasons. In addition, the proportion of the catch taken from the shallower depth range
of 0-30 m is higher in this MFA compared to others in the zone. Over the last four
seasons >45% of the catch has come from 0-30 m (Figure 2-13) which is a substantial
increase compared to previous years. In the 2004 season, 14% of the catch was taken
from depths > 60 m in MFA 58.
Annual CPUE by MFA and depth.
In MFA 51, annual CPUE generally increased from 1997 peaking at 1.82 and 2.12
kg/potlift in the 0-30 and 31-60m depth ranges in 2002 (Figure 2-14). CPUE
decreased in 2003 in both the 0-30m and 31-60m depth ranges to 1.68 and 1.86
kg/potlift respectively before increasing to 2.09 (0-30m) and 2.52 kg/potlift (31-60m)
in 2004. Similar trends in CPUE were observed over the same time period in MFA 55
with CPUE estimated at 1.95 and 2.05 kg/potlift in the 0-30 and 31-60m depth ranges
respectively in 2004 (Figure 2-15).
43

In MFA 56, CPUE also increased from 1997 peaking at over 2 kg/potlift in all depth
ranges in 2002 (Figure 2-16). However, since 2002, CPUE has declined in all depth
ranges in MFA 56 particularly in 0-30 and 31-60m where it decreased to 1.74 and
1.93 kg/potlift respectively in 2004. Similar trends of decreasing CPUE in shallow
depth ranges have been observed over the last two seasons in MFA 58 (Figure 2-17).
In particular, the estimate of 1.26 kg/potlift in the 0-30m depth range in MFA 58 is
the lowest on record since 1996.
Given the low percentage of overall catch taken from depths >60 m (Figure 2-12) data
used to calculate CPUE in depths ranging from 60-90m are limited and should be
treated with caution. Overall trends show a general increase in CPUE from 1997 to
2002 across all major MFAs followed by a decrease in MFAs 55 and 56, with a
marginal increase in MFA 58 (Figure 2-14 to Figure 2-17).
Within Season CPUE by depth
Seasonal CPUE patterns with depth show that after the 1980’s, CPUE increased with
depth, and that the pattern of high CPUE in summer is consistent across all depth
ranges (Figure 2-18). Since the 1980’s, the highest CPUEs in each month consistently
occurred in fishing depths > 90 m. Prior to 1980, CPUE from the depth range 61 –
90m was higher than for depths over 90 m. The increase in CPUE at depths > 90 m
since the 1980s was most likely related to improvements in fishing efficiencies
mediated by improvements in technology and boat design.
In 2004, CPUE in all depth ranges was generally highest in December/January
(Figure 2-19). Overall, CPUE was highest in the 61-90 m and > 90 m ranges, but as in
the previous seasons of 2002 and 2003, less than 20% of the overall catch was taken
in these depth ranges (Figure 2-12).
44
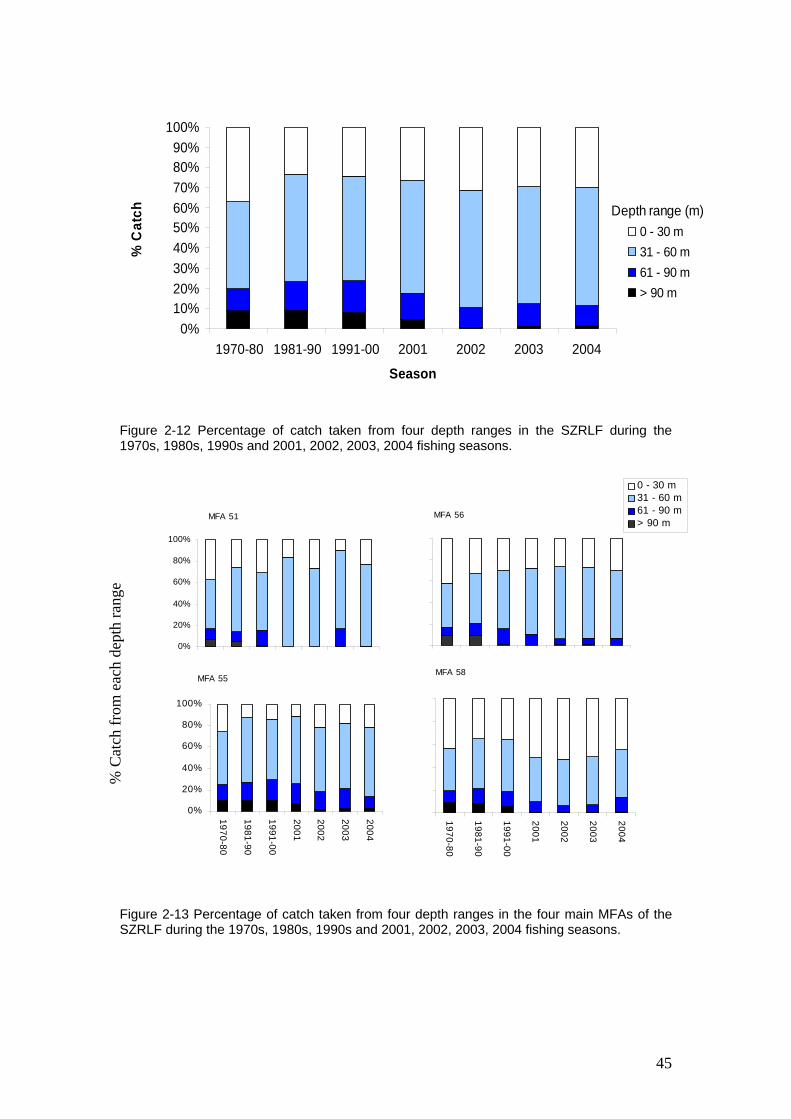
0%10%20%30%40%50%60%70%80%90%
100%
1970-80 1981-90 1991-00 2001 2002 2003 2004
Season
% C
atch
0 - 30 m31 - 60 m61 - 90 m> 90 m
Depth range (m)
Figure 2-12 Percentage of catch taken from four depth ranges in the SZRLF during the
1970s, 1980s, 1990s and 2001, 2002, 2003, 2004 fishing seasons.
igure 2-13 Percentage of catch taken from four depth ranges in the four main MFAs of the SZRLF during the 1970s, 1980s, 1990s and 2001, 2002, 2003, 2004 fishing seasons.
MFA 51
0%
20%
40%
60%
80%
100%
MFA 56
0 - 30 m31 - 60 m61 - 90 m > 90 m
MFA 55
0%
20%
40%
60%
80%
100%
1970-80
1981-90
1991-00
2001
2002
2003
2004
MFA 58
1970-80
1981-90
1991-00
2001
2002
2003
2004
% C
atch
from
eac
h de
pth
rang
e
F
45

MFA 51
0
0.5
1
1.5
2
2.5
3
3.5
1970
1972
1974
1976
1978
1980
1982
1984
1986
1988
1990
1992
1994
1996
1998
2000
2002
2004
Season
CP
UE
(kg/
potlif
t)
0-30 m31-60 m61-90 m
Figure 2-14 CPUE in various depth ranges from 1970 to 2004 in MFA 51.
MFA 55
0
0.5
1
1.5
2
2.5
3
1970
1972
1974
1976
1978
1980
1982
1984
1986
1988
1990
1992
1994
1996
1998
2000
2002
2004
Season
CP
UE
(kg/
potli
ft)
0-30 m31-60 m61-90 m
Figure 2-15 CPUE in various depth ranges from 1970 to 2004 in MFA 55.
46

MFA 56
0
0.5
1
1.5
2
2.5
3
3.5
1970
1972
1974
1976
1978
1980
1982
1984
1986
1988
1990
1992
1994
1996
1998
2000
2002
2004
Season
CP
UE
(kg/
potli
ft)
0-30 m31-60 m61-90 m
Figure 2-16 CPUE in various depth ranges from 1970 to 2004 in MFA 56.
MFA 58
0
0.5
1
1.5
2
2.5
1970
1972
1974
1976
1978
1980
1982
1984
1986
1988
1990
1992
1994
1996
1998
2000
2002
2004
Season
CP
UE
(kg/
potli
ft)
0-30 m31-60 m61-90 m
Figure 2-17 CPUE in various depth ranges from 1970 to 2004 in MFA 58.
47

1970 - 80
0.0
0.5
1.0
1.5
2.0
2.5
3.0
1981 - 90
Oct
Nov
Dec Jan
Feb
Mar Ap
rM
ay Jun
Jul
Aug
Sep
0.0
0.5
1.0
1.5
2.0
2.5
3.0
1991 - 00
2001O
ctN
ovD
ec Jan
Feb
Mar
Apr
May Jun
Jul
Aug
Sep
CP
UE
(kg
per p
otlif
t)
0 to 30 m
31 to 60 m
61 to 90 m
> 90 m
Figure 2-18 Mean CPUE (± SE of mean) in four depth ranges in the SZRLF during the 1970s, 1980s, 1990s and the 2001 fishing season.
48
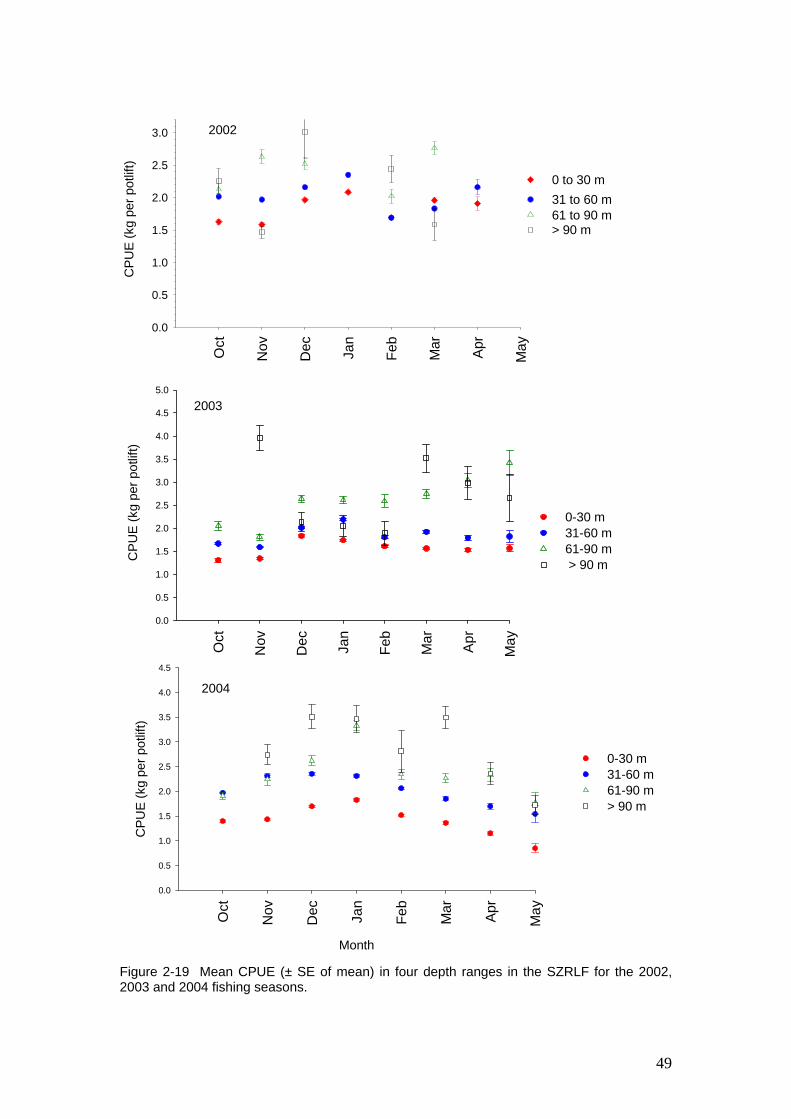
Month
Oct
Nov
Dec Jan
Feb
Mar
Apr
May
CPU
E (k
g pe
r pot
lift)
0.0
0.5
1.0
1.5
2.0
2.5
3.0
3.5
4.0
4.5
0-30 m31-60 m61-90 m> 90 m
2004
0 to 30 m 31 to 60 m61 to 90 m > 90 m
CPU
E (k
g pe
r pot
lift)
2002
Oct
Nov
Dec Jan
Feb
Mar
Apr
May
0.0
0.5
1.0
1.5
2.0
2.5
3.0
2003
Oct
Nov
Dec Jan
Feb
Mar
Apr
May
CP
UE
(kg
per p
otlif
t)
0.0
0.5
1.0
1.5
2.0
2.5
3.0
3.5
4.0
4.5
5.0
0-30 m31-60 m61-90 m > 90 m
Figure 2-19 Mean CPUE (± SE of mean) in four depth ranges in the SZRLF for the 2002, 2003 and 2004 fishing seasons.
49

2.3 Mean Weights
2.3.1 Inter-annual Pattern
The annual mean weight of lobsters remained relatively unchanged through the
1970’s and early 1980’s with the average lobster weighing around 0.87 kg (Figure
2-20). From 1982, the mean weight of lobsters decreased until 1991 when it reached
0.79 kg before rising to about 0.84 kg in the mid 1990’s. Mean lobster weight reached
an all time low of 0.76 kg in 1999 and then increased over the next 4 seasons to reach
0.85 kg in the 2003 fishing season. In 2004, it decreased marginally to 0.84 kg. In
general, the pattern of rise and fall in mean size reflects long-term patterns of
recruitment, with low mean weights resulting from influxes of small lobsters into the
fishable biomass and high mean weights resulting from several consecutive years of
low recruitment. However, highgrading (the selection of smaller sized individuals due
to higher unit value) is now a significant feature under the current quota system in the
SZRLF. The result is that fishing behaviour undoubtedly affects current annual
estimates of lobster size in the SZRLF. The practice highlights the need for fishery
independent data in order to get a robust estimate of this statistic.
2.3.2 Within-season Patterns
Since the 1970’s there has been a consistent trend of increasing lobster mean weight
as the fishing season progresses (Figure 2-21). On average, the smallest lobsters are
caught in October/November and the largest later in the fishing season. The seasonal
pattern in lobster mean weight was almost identical during the 1970’s and 1980’s.
While the trend towards larger lobsters was the same in the 1990’s, the lobster sizes
were smaller overall. Over the last four seasons, the mean weight has been lowest in
November before increasing as the season progressed. In 2004, it was lowest in
November at 0.78 kg and highest in May at 1.02 kg (Figure 2-22).
50
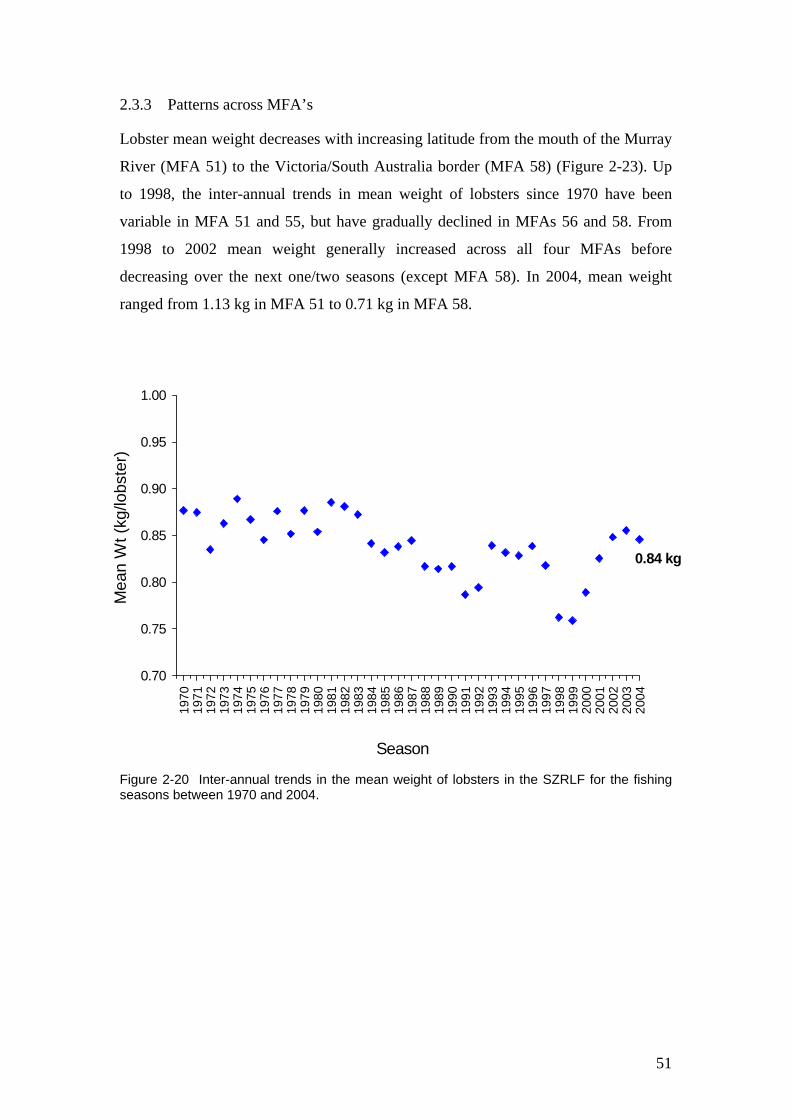
2.3.3 Patterns across MFA’s
Lobster mean weight decreases with increasing latitude from the mouth of the Murray
River (MFA 51) to the Victoria/South Australia border (MFA 58) (Figure 2-23). Up
to 1998, the inter-annual trends in mean weight of lobsters since 1970 have been
variable in MFA 51 and 55, but have gradually declined in MFAs 56 and 58. From
1998 to 2002 mean weight generally increased across all four MFAs before
decreasing over the next one/two seasons (except MFA 58). In 2004, mean weight
ranged from 1.13 kg in MFA 51 to 0.71 kg in MFA 58.
0.84 kg
Season
1970
1971
1972
1973
1974
1975
1976
1977
1978
1979
1980
1981
1982
1983
1984
1985
1986
1987
1988
1989
1990
1991
1992
1993
1994
1995
1996
1997
1998
1999
2000
2001
2002
2003
2004
Mea
n W
t (kg
/lobs
ter)
0.70
0.75
0.80
0.85
0.90
0.95
1.00
Figure 2-20 Inter-annual trends in the mean weight of lobsters in the SZRLF for the fishing seasons between 1970 and 2004.
51

Oct Nov Dec Jan Feb Mar Apr May Jun Jul Aug Sep
Mon
thly
mea
n w
eigh
t (kg
)
0.70
0.75
0.80
0.85
0.90
0.95
1.00
1970 - 801981 - 901991 - 00
Figure 2-21 Within-season trends in the mean weight (± SE of mean) of lobsters in the SZRLF for the fishing seasons between 1970 to 2000.
Month
Oct Nov Dec Jan Feb Mar Apr May
Mon
thly
mea
n w
eigh
t (kg
)
0.70
0.75
0.80
0.85
0.90
0.95
1.00
1.05
1.1020012002 20032004
Figure 2-22 Within-season trends in the mean weight (± SE of mean) of lobsters in the SZRLF for the fishing seasons 2001 – 2004.
52

MFA 56M
ean
Wei
ght (
kg/lo
bste
r)
Season
MFA 51
0.6
0.7
0.8
0.9
1.0
1.1
1.2
1.3
1.4
0.6
0.7
0.8
0.9
1.0
1.1
1.2
1.3
1.4
Figure 2-23 Inter-annual trends in the mean weights (± SE) of lobster for the main MFAs of the SZRLF for the fishing seasons between 1970 and 2004.
tary catch sampling program began, between 5,000 and
(MLS) of 98.5
2.4 Length Frequency
Since 1991, when the volun
30,000 lobsters have been measured each season. Male lobsters, which grow faster
and reach larger sizes than females, range between 70 and 200 mm CL length (Figure
2-24), whereas few females are longer than 150 mm CL (Figure 2-25).
The proportion of male lobsters greater than the Minimum Legal Size
mm CL has increased in recent seasons (Figure 2-26 and Figure 2-27). In the 1998
season, 66% of measured lobsters were >98.5 mm CL whereas in 2004 the figure was
81%. For females, the proportion of lobsters >98.5 mm CL increased from 56% in
1998 to 70% in 2004 (Figure 2-27).
1970
1972
1974
1976
1978
1980
1982
1984
1986
1988
1990
1992
1994
1996
1998
2000
2002
2004
MFA 55
1970
1972
1974
1976
1978
1980
1982
1984
1986
1988
1990
1992
1994
1996
1998
2000
2002
2004
MFA 58
53

1991 (n = 2 473)
0
1
2
3
4
1992 (n = 13 376)
0
1
2
3
4
1993 (n = 10 933)
0
1
2
3
4
1994 (n = 4 031)
0
1
2
3
4
1995 (n = 3 749)
70 80 90 100 110 120 130 140 150 160 170 180 190 2000
1
2
3
4
1996 (n = 8 370)
1997 (n = 6 935)
1998 (n = 6 331)
1999 (n =10 566)
2000 (n = 9 667)
70 80 90 100 110 120 130 140 150 160 170 180 190 200
Carapace length (mm)
Freq
uenc
y (%
)
Figure 2-24 Length frequency distributions of male lobsters in the SZRLF for the fishing seasons between 1991 and 2000.
54

Carapace length (mm)
Freq
uenc
y (%
)
1991 (n = 2 735)
0
1
2
3
4
5
1993 (n = 12 179)
0
1
2
3
4
5
1994 (n = 4 624)
0
1
2
3
4
5
1995 (n = 4 667)
70 80 90 100 110 120 130 140 150 160 170 180 190 2000
1
2
3
4
5
1996 (n = 10 755)
1997 (n = 8 311)
1998 (n = 6 985)
1999 (n =12 066)
2000 (n = 11 715)
70 80 90 100 110 120 130 140 150 160 170 180 190 200
1992 (n = 13 999)
0
1
2
3
4
5
Figure 2-25 Length frequency distributions of female lobsters in the SZRLF for the fishing seasons between 1991 and 2000.
55

Freq
uenc
y (%
)
Carapace length (mm)
MalesFemalesMinimum Legal Size(98.5mm CL)
2002 (n = 6 555)
70 80 90 100 110 120 130 140 150 160 170 180 190 2000
1
2
3
4
5
2001 (n = 10 876)
0
1
2
3
4
5
2002 (n = 5 944)
0
1
2
3
4
5
2001 (n = 9 437)
0
1
2
3
4
5
Figure 2-26 Length frequency distributions of male and female lobsters in the SZRLF for the 2001 and 2002 seasons.
56

Carapace Length (mm)
70 80 90 100 110 120 130 140 150 160 170 180 190 200
Freq
uenc
y (%
)
0
1
2
3
4
5
2003 Females (N = 11,028)
Carapace Length (mm)
70 80 90 100 110 120 130 140 150 160 170 180 190 200
Freq
uenc
y (%
)
0
1
2
3
4
5
2004 Males (N = 14,508)MLS 98.5 mm CL
Carapace Length (mm)
70 80 90 100 110 120 130 140 150 160 170 180 190 200
Freq
uenc
y (%
)
0
1
2
3
4
5
2003 Males (N = 9,752)MLS 98.5 mm CL
MLS 98.5 mm CL
Carapace Length (mm)
70 80 90 100 110 120 130 140 150 160 170 180 190 200
Freq
uenc
y (%
)
0
1
2
3
4
5
2004 Females (N = 16,767)
MLS 98.5 mm CL
Figure 2-27 Length frequency distributions of male and female lobsters in the SZRLF for the 2003 and 2004 seasons.
57

2.5 Pre-Recruit Index
2.5.1 Inter-annual Patterns
Data required to calculate a pre-recruit index (PRI - mean number of undersize rock
lobster per pot lift) have been recorded since 1983, but estimates prior to 1987 should
be treated with caution due to incomplete participation in the system. During the early
to mid 1990s the PRI as calculated from logbook data varied from 1.77 in 1991 to
1.20 in 1996 (Figure 2-28). From 1998 to 2002, the PRI remained close to, or above,
the highest previous record (1991), peaking at 2.21 undersized lobsters/pot lift in
1999. In 2004, the PRI decreased to 1.31 undersized lobsters/potlift but remained
within the reference range as identified in the Management Plan (1.2–1.52 undersized
lobsters/potlift).
Escape gaps are not currently mandatory in the SZRLF but some fishers have
voluntarily incorporated them into their pots thus affecting estimates of PRI
calculated from logbook data. PRI as calculated from voluntary catch sampling data
(Figure 2-29) indicates that PRI increased from 1997 to 2001 before decreasing over
the next two seasons. PRI increased in 2004 to 1.04 undersized individuals/potlift.
Season
1983
1984
1985
1986
1987
1988
1989
1990
1991
1992
1993
1994
1995
1996
1997
1998
1999
2000
2001
2002
2003
2004Pre
-recr
uit i
ndex
(No.
und
ersi
ze/p
otlif
t)
0.0
0.5
1.0
1.5
2.0
2.5
Figure 2-28 Inter-annual trends in pre-recruit index (± SE of mean) in the SZRLF for the fishing seasons between 1983 and 2004 as calculated from commercial logbook data.
58

Season
1994
1995
1996
1997
1998
1999
2000
2001
2002
2003
2004
Pre
-recr
uit i
ndex
(No.
und
ersi
zed/
potli
ft)
0.6
0.7
0.8
0.9
1.0
1.1
1.2
1.3
1.4
Figure 2-29 Inter-annual trends in pre-recruit index in the SZRLF for the fishing seasons between 1994 and 2004 as calculated from voluntary catch sampling data.
2.5.2 Within-season Patterns
Within fishing seasons, the PRI is consistently highest in the first four months of the
season before generally decreasing from January onwards (Figure 2-30). In 2004, the
PRI ranged between 0.85 and 1.52 undersized/potlift from October to March.
Thereafter, it declined to 0.45 undersized/potlift in May, which is consistent with
previous annual trends.
59

Month
Oct Nov Dec Jan Feb Mar Apr MayPre
-recr
uit i
ndex
(no.
und
ersi
ze p
er p
otlif
t)
0.0
0.5
1.0
1.5
2.0
2.5
1983-891990-002001200220032004
Figure 2-30 Within-season trends in the pre-recruit index (± SE of mean) in the SZRLF for the fishing seasons between 1983 and 2004.
2.5.3 Patterns across MFAs
The PRI increases with latitude between the Coorong (MFA 51) and the
Victoria/South Australia border (MFA 58) (Figure 2-31). Inter-annual trends
demonstrate that there are higher numbers of undersize lobsters caught in MFAs 56
and 58 compared to MFAs 51 and 55. The PRI for MFAs 51 and 55 varied from 0.1 –
0.8 undersize/pot lift between the 1998 and 2004 seasons compared to MFAs 56 and
58, which had PRI’s between 1.5 – 3.9 undersize/pot lift over the same time period.
The PRI has remained relatively unchanged over the last 10 years in MFAs 51 and 55.
In MFA 56, PRI reached a peak of 2.82 undersized/potlift in 1999 before decreasing
to 1.57 undersized/potlift in 2003. In 2004, PRI increased marginally in MFA 56 to
1.61 undersized/potlift. In MFA 58, PRI reached a peak of 3.93 undersized/potlift in
2002 before decreasing over the next two seasons to 3.03 undersized/potlift in 2004.
60

Season
MFA 51
MFA 55
MFA 56
MFA 58
0
1
2
3
4
1984
1986
1988
1990
1992
1994
1996
1998
2000
2002
2004
1984
1986
1988
1990
1992
1994
1996
1998
2000
2002
2004
0
1
2
3
4
Pre
-recr
uit i
ndex
(No.
und
ersi
ze p
er p
otlif
t)
Figure 2-31 Inter-annual trends in mean pre-recruit index (± SE) in the main MFAs of the SZRLF for the fishing seasons between 1983 and 2004.
2.6 Spawning lobsters
Data on lobsters in spawning condition have been recorded since 1983. As with the
PRI estimates, those prior to 1987 should be treated with caution due to incomplete
participation in the reporting program.
2.6.1 Inter-annual Patterns
The number of spawning lobsters per pot lift varied from 0.08 in 1991 to 0.52 in 1999
(Figure 2-32). Since 1991, the number of spawning lobsters/pot lift increased steadily,
with the highest catch rates of spawning lobsters occurring between 1998 and 2003. In
2004, the CPUE of spawning lobsters dropped to 0.30 spawners/potlift the lowest on
record since 1993.
61

2.6.2 Within-season Patterns
There is a strong seasonal pattern in the number of spawning lobsters/pot lift (Figure
2-33). Hatching commences in early spring and is completed by December/January.
The almost complete absence of spawning lobsters in the commercial catch after
December supports this fact. In 2004, within season catch rates of spawning lobsters
were comparable to previous seasonal trends.
2.6.3 Patterns across MFAs
As with the PRI, the catch rate of spawning lobsters increases along the coast from the
Coorong (MFA 51) to the Victoria/South Australia border (MFA 58) (Figure 2-34).
Inter-annual trends demonstrate that there are significantly higher numbers of
spawning lobsters caught in MFA 56 and 58 compared to MFAs 51 and 55. The catch
rate of spawning lobsters in MFAs 51 and 55 has varied from 0.07 – 0.32 spawning
lobsters/pot lift between the seasons 1998 – 2003 compared to MFAs 56 and 58 which
had rates between 0.45 and 0.76 spawners/pot lift over the same time period.
Generally, the catch rate has increased over time in all MFAs but the rate of increase
has been greater in MFAs 56 and 58. In 2004, the catch rate of spawning lobsters
decreased in all four MFAs. The most notable decreases were in MFAs 56 and 58
where catch rate dropped to 0.35 and 0.40 spawners/potlift respectively. These figures
are the lowest on record since 1993 for MFAs 56 and 58.
62

Season
1983
1984
1985
1986
1987
1988
1989
1990
1991
1992
1993
1994
1995
1996
1997
1998
1999
2000
2001
2002
2003
2004
No.
spa
wne
rs/p
otlif
t
0.0
0.1
0.2
0.3
0.4
0.5
0.6
Figure 2-32 Inter-annual trends in the number of spawning lobsters (± SE of mean) in the SZRLF for the fishing seasons between 1983 and 2004.
Month
Oct Nov Dec Jan Feb Mar Apr
No.
spa
wne
rs p
er p
otlif
t
0.0
0.2
0.4
0.6
0.8
1.0
1.2
1.4
1.6
1983-19891991-002001200220032004
Figure 2-33 Within-season trends in the number of spawning lobsters (± SE of mean) in the SZRLF for the fishing seasons between 1983 and 2004.
63

MFA 51
0.00.10.20.30.40.50.60.70.8
MFA 55
1984
1986
1988
1990
1992
1994
1996
1998
2000
2002
2004
0.00.10.20.30.40.50.60.70.8 MFA 58
1984
1986
1988
1990
1992
1994
1996
1998
2000
2002
2004
No.
Spa
wne
rs p
er p
otlif
t
Season
MFA 56
Figure 2-34 Inter-annual trends in the number of spawning lobsters/pot lift (± SE of mean) for the main MFAs in the SZRLF for the fishing seasons between 1983 and 2004.
2.7 Lobster Mortalities
2.7.1 Inter-annual Patterns
There has been a gradual increase in the number of dead lobsters/potlift since 1996,
although the overall numbers are relatively low ( Figure 2-35). Figures ranged from
0.14 to 0.22 dead lobsters/potlift from 1996 to 2000 before decreasing to 0.20 dead
lobsters/potlift in 2001. Since then catch rates have increased to 0.27 dead
lobsters/potlift in 2004.
64

Season
1996 1997 1998 1999 2000 2001 2002 2003 2004
Dea
d lo
bste
rs/p
otlif
t
0.12
0.14
0.16
0.18
0.20
0.22
0.24
0.26
0.28
0.30
Figure 2-35 Inter-annual trends in CPUE of dead lobsters in the SZRLF from 1996 to 2004.
2.7.2 Within season Patterns
Over the last four seasons, lobster mortality was generally highest at the start of each
season in October/November/December and decreased as the season progressed (
Figure 2-36). In 2004, lobster mortality peaked at 0.34 dead lobsters/potlift in
November before declining to a season low of 0.07 dead lobsters/potlift in May.
Month
Oct Nov Dec Jan Feb Mar Apr May
Dea
d lo
bste
rs/p
otlif
t
0.05
0.10
0.15
0.20
0.25
0.30
0.35
0.402001 2002 2003 2004
Figure 2-36 Within season trends in lobster mortality from 2001 to 2004 in the SZRLF.
65
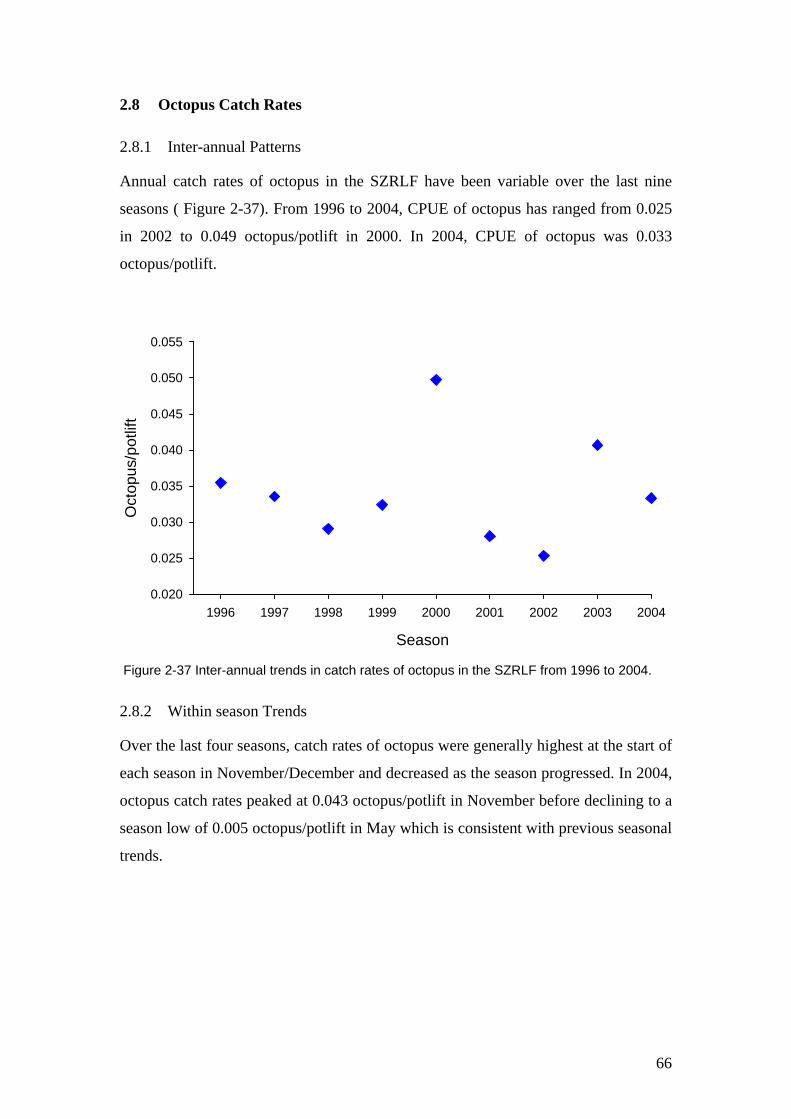
2.8 Octopus Catch Rates
2.8.1 Inter-annual Patterns
Annual catch rates of octopus in the SZRLF have been variable over the last nine
seasons ( Figure 2-37). From 1996 to 2004, CPUE of octopus has ranged from 0.025
in 2002 to 0.049 octopus/potlift in 2000. In 2004, CPUE of octopus was 0.033
Figure 2-37 Inter-
octopus/potlift.
annual trends in catch rates of octopus in the SZRLF from 1996 to 2004.
ch rates of octopus were generally highest at the start of
Season
1996 1997 1998 1999 2000 2001 2002 2003 2004
Oct
opus
/pot
lift
0.020
0.025
0.030
0.035
0.040
0.045
0.050
0.055
2.8.2 Within season Trends
Over the last four seasons, cat
each season in November/December and decreased as the season progressed. In 2004,
octopus catch rates peaked at 0.043 octopus/potlift in November before declining to a
season low of 0.005 octopus/potlift in May which is consistent with previous seasonal
trends.
66

Month
Oct Nov Dec Jan Feb Mar Apr May
Oct
opus
/pot
lift
0.00
0.01
0.02
0.03
0.04
0.05
0.06
0.07
2001 2002 2003 2004
Figure 2-38 Within season trends in octopus catch rates in the SZRLF from 2001 to 2004.
2.9 Changes in Fishing Patterns
2.9.1 Season Length
During the 1970s, individual licence-holders spent, on average, 100 days fishing each
season. From 1983, the average number of days fished each season increased to a
peak of 176 days fished/licence in 1991 (out of a total number of 210 potential fishing
days) (Figure 2-39). In 1993, the first year of the TACC, the number of days
fished/licence was 143. This rose to 153 days in 1997, but decreased over the next 5
seasons to an all-time low of 80 days in 2002. In 2003, the average number of days
fished/licence increased by 15 to 95 days which also coincided with an increase in
TACC. In 2004, the average number of days fished was 94.
67

94 days
153 days
Season
1983
1984
1985
1986
1987
1988
1989
1990
1991
1992
1993
1994
1995
1996
1997
1998
1999
2000
2001
2002
2003
2004
Mea
n nu
mbe
r of d
ays
fishe
d pe
r lic
ence
40
60
80
100
120
140
160
180
200176 days
Figure 2-39 Inter-annual trends in the average number of days fished per licence in the SZRLF between the 1994 and 2004 fishing seasons.
2.10 Distribution of Effort
There has been a significant decline in fishing effort over the last few years in the
SZRLF. The decline in effort may manifest itself in a general decrease in the number
of pot lifts across all areas and/or a contraction in the total area fished. It has been
suggested by some fishers that the latter is occurring, i.e. fishers, confident of
catching their ITQ, are fishing closer to home ports and thus are not utilising
previously fished areas.
Without spatially explicit data on the location of fishing effort it is difficult to
determine how the distribution of effort is changing. The only data available are
obtained from the pot sampling program, however, the commitment to this program
has been variable over time. In 1994, for example, 2,554 lobsters were measured
while in 2001, the figure was 10,000 lobsters. Consequently, it is difficult to
accurately infer general trends in the spatial distribution of fishing effort.
In terms of depth fished, the main trend is a reduction in effort across all depth ranges,
with a slight indication that proportionally less effort may have been expended in
depths greater than 60 m in recent years (Figure 2-40). In 2004, the majority of effort
was expended in depths of less than 60m as is consistent with trends in recent seasons.
68

MFA 55
0100200300400500600700800900
1000
83 84 85 86 87 88 89 90 91 92 93 94 95 96 97 98 99 00 01 02 03 04
0 - 30 m31 - 60 m
61 - 90 m
> 90 m
MFA 56
0
100
200
300
400
500
600
700
800
900
1000
83 84 85 86 87 88 89 90 91 92 93 94 95 96 97 98 99 00 01 02 03 04
0 - 30 m
31 - 60 m
61 - 90 m
> 90 m
MFA 58
0100200300400500600700800900
1000
83 84 85 86 87 88 89 90 91 92 93 94 95 96 97 98 99 00 01 02 03 04
Season
0 - 30 m31 - 60 m61 - 90 m> 90 m
Effo
rt (1
000s
pot
lifts
)
Figure 2-40 Total effort (pot lifts) in 4 depth ranges for MFA’s 55, 56 and 58 in the SZRLF for the 1983 – 2004 fishing seasons.
69

2.11 High Grading
2.11.1 Inter-annual and within Season Trends
Based on voluntary catch returns, there has been a general increase in the level of
highgrading (the selection of smaller sized or non-damaged individuals due to higher
unit value) within the SZRLF over the last three seasons (Figure 2-41). In 2004, a
minimum of 116.11 tonnes was highgraded compared to 161.22 tonnes in 2003.
Within season trends indicate that the level of highgrading is lowest at the start of the
season in October-December and increases as the season progresses. In 2004,
highgrading was lowest in November at 0.13 kg/potlift and highest in May at 0.57
kg/potlift.
0
0.1
0.2
0.3
0.4
0.5
0.6
0.7
0.8
Oct Nov Dec Jan Feb Mar Apr MayMonth
CP
UE
Hig
hgra
de (k
g/po
tlift) 2001 (47.37 t)
2002 (115.78 t)2003 (161.22 t)2004 (116.11 t)
Figure 2-41 Interannual and within season trends in the levels of highgrading within the SZRLF from 2001 to 2004.
2.12 Settlement Index
The five puerulus collectors in the SZRLF are located at Blackfellows Caves,
Livingstone’s Beach, Beachport, Cape Jaffa and Kingston. The annual Puerulus
Settlement Index (PSI) for the SZRLF is calculated from the mean monthly settlement
recorded on these collectors (Figure 2-42).
70

The PSI generally rose from 1991 to 1995 but declined over the next two seasons. It
peaked again in 1998 before declining to the lowest level on record in 2001. In 2002,
the PSI increased to 2.4 puerulus/collector, before decreasing to 0.78
puerulus/collector in 2003. Currently, the PSI for 2005 is 3.26 puerulus/collector, the
highest on record since sampling began. Data sampling required to estimate this index
was not complete at time of publication and this estimate may therefore change. Final
PSI estimates for 2005 will be presented in the 2005/06 Status Report for the fishery.
Lagged PSI plotted against seasonal pre-recruit index (PRI) and estimates of
recruitment from the qR model are provided in section 3.3 of this report.
0
0.5
1
1.5
2
2.5
3
3.5
4
4.5
1991
1992
1993
1994
1995
1996
1997
1998
1999
2000
2001
2002
2003
2004
2005
Season
Settl
emen
t Ind
ex (P
ueru
lus/
colle
ctor
)
Figure 2-42 Puerulus Settlement Index (PSI) (mean ± SE) in the SZRLF from 1991 to 2005 (note: data for 2005 are incomplete).
71

2.13 May Fishing Trial
In an effort to give SZRLF licence holders greater flexibility on when allocated quota
can be caught, PIRSA Fisheries conducted a May Fishing Trial during the 2004
season. The 2004 trial adds to data obtained in 2003 when the May fishing trial was
introduced. The following catch statistics were estimated from data derived from May
fishers only in order to examine any possible biological impacts of the trial.
2.13.1 CPUE
Based on May fishers only, CPUE in 2004 was lowest in October at 1.63 kg/potlift
and highest in January at 2.18 kg/potlift. The CPUE in May was 1.86 kg/potlift, the
third highest for the season. (Figure 2-43). In 2004, CPUE was highest in deeper
waters reaching 4.37 kg/potlift in depths >90 m in January. CPUE ranged between
0.99 and 2.18 kg/potlift in the lower depth ranges (Figure 2-44) of <60 m. The
observation that CPUE was highest in deeper depths is confirmed by catch/depth
profiles (Figure 2-45). From October to February over 85% of the catch on a monthly
basis was taken in depths of <60 m. During March and April the proportion of catch
taken from depths of >60 m was 37% and 32%, respectively. In May, 54% of the
catch was taken in depths >60 m.
2.13.2 Mean Weight
Based on May fishers only, mean lobster weight in 2004 generally increased as the
season progressed (Figure 2-46). Mean lobster weight in 2004 was lowest in
November at 0.75 kg and highest in May at 1.03 kg.
2.13.3 Lobster Mortality
In 2004, the CPUE of both dead lobsters and octopus generally decreased as the
season progressed ( Figure 2-36 and Figure 2-38). CPUE of dead lobsters was highest
in November at 0.34 dead lobsters/potlift and lowest in May at 0.07 dead
lobsters/potlift. Similarly, catch rates of octopus in 2004, peaked at 0.043
octopus/potlift in November before declining to a season low of 0.005 octopus/potlift
in May.
72

0
0.5
1
1.5
2
2.5
Oct Nov Dec Jan Feb Mar Apr May
Month
CPUE
(kg/
potli
ft)
Figure 2-43 Within season trends in CPUE in the SZRLF in 2004 based on data from May fishers only.
00.5
11.5
22.5
33.5
44.5
5
Oct Nov Dec Jan Feb Mar Apr May
Month
CPU
E (k
g/po
tlift)
0-30 m31-60 m 61-90 m >90 m
Figure 2-44 Within season trends in CPUE by depth in the SZRLF in 2004 based on data from May fishers only.
73

0%10%20%30%40%50%60%70%80%90%
100%
Oct Nov Dec Jan Feb Mar Apr May
Month
% C
atch
>90 m 61-90 m31-60 m0-30 m
Figure 2-45 Within season trends in the percentage of catch taken from various depth zones in the SZRLF in 2004 based on data from May fishers only.
0
0.2
0.4
0.6
0.8
1
1.2
Oct Nov Dec Jan Feb Mar Apr May
Month
Mea
n W
eigh
t (kg
)
Figure 2-46 Within season trends in mean weight in the SZRLF for 2004 based on data from May fishers only.
74

2.13.4 Discussion
Initial results from the May Fishing Trial indicate that the biological impact of May
fishing in 2004 were minimal and track closely to estimates observed in 2003. Within
season trends in catch rates of both dead and undersize lobsters were lowest in May,
as were catches of octopus. In addition, no spawning females were caught during
May, which is consistent with the seasonal trends in the reproductive biology of the
species. The final May Fishing Trial is scheduled for the 2005/06 season. This
additional data will help to consolidate findings presented in this report.
75

3 THE QR MODEL
3.1 Introduction
The qR model (McGarvey et al 1997; McGarvey and Matthews 2001) has been used
to generate estimates of performance indicators (including exploitation rate and egg
production) for the SZRLF. Outputs from the qR model have been presented in stock
assessment reports for the SZRLF since 1997 (Prescott et al. 1997a; Prescott et al.
1998; Prescott and Xiao 2001).
A recent review of the stock assessment research conducted by SARDI Aquatic
Sciences (Breen and McKoy 2002) concluded that the qR model is an appropriate tool
for assessing exploitation rate and recruitment. The model has been refined over time,
most notably during the peer review process for publication of McGarvey and
Matthews (2001). Hence, outputs from the current version of the model differ from
those presented in previous stock assessment reports (e.g. Prescott et al 1997a;
Prescott and Xiao 2001) and in the Management Plan (Zacharin 1997). The three
major changes from previous versions are: (i) the replacement of the least squares
method by normal likelihoods for the fits to catches in both number and weight; (ii)
the adoption of a Baranov rather than a simple bi-linear Schaefer catch relationship;
and (iii) the inclusion of a puerulus-based forecasting method which is used to
generate predictions of future biomass based on different assumed quota levels.
This section of the report has three objectives: (i) to use the 2004 version of the qR
model to generate annual estimates of biomass, egg production, % virgin egg
production and exploitation rate for the SZRLF using data for the period up to the end
of the 2004 fishing season; (ii) to compare estimates of recruitment obtained using the
qR model with an independent measure of pre-recruit abundance; and (iii) to predict
future estimates of biomass over a five-year period under a range of alternate quota
levels (1770, 1900, 2000 and 2100 t).
76

3.2 Methods
General qR Model
A detailed description of the qR model is provided in McGarvey and Matthews
(2001). In summary, the qR model fits to the catch in weight (Cw, in kg) and numbers
(Cn, in numbers of lobsters landed). Effort (E) is taken from logbook data and a
Baranov survival model using a Schaefer catch relationship (Cn=qEN) is assumed.
The model likelihood is written as a modified normal and fitted numerically.
Recruitment in each year is estimated as a free parameter.
Other stock assessment models (delay-difference and biomass dynamic) that fit to
catch and effort data use only catch in weight (Cw), and rely on CwPUE as a measure
of relative fishable biomass. The qR model adds catches in numbers to the fitted data
set. Catch-in-weight divided by catch-in-number gives the mean weight of an average
landed lobster, and thus, the addition of the catch-in-number time series gives
information about yearly mean size in the legal catch, otherwise available only from
length-frequency data. Because catches in weight and number constitute a 100%
sample, the quality of information obtained about changes in mean size from catch
data is far more precise than that obtained from length frequencies, which typically
constitute a 0.1% to 1.0% sample fraction. Thus, the qR model uses CwPUE as a
measure of change in abundance and mean weight as a measure of change in size
structure.
The qR model is age-based. This permits the estimation of yearly egg production,
again as total absolute number of eggs hatched annually. However, only legal-size
lobsters are estimated in the qR population description. To improve the quality of
yearly egg production estimates in the Southern Zone, where some females spawn
prior to reaching legal size, the qR estimates of yearly egg production were modified
to include one year class of undersize lobsters. This was done by (i) using the same
ogives versus age for fecundity and maturity used in previous qR model time series
estimates of SZRL egg production; (ii) taking the yearly estimated recruitment
number from the standard qR fit; and (iii) assuming the same constant natural
mortality, M, over that year. The numbers of pre-recruits of age one year younger
than those recruited in each yearly cohort, was calculated as ( 1SubLegN y - ) ( )RN y
77
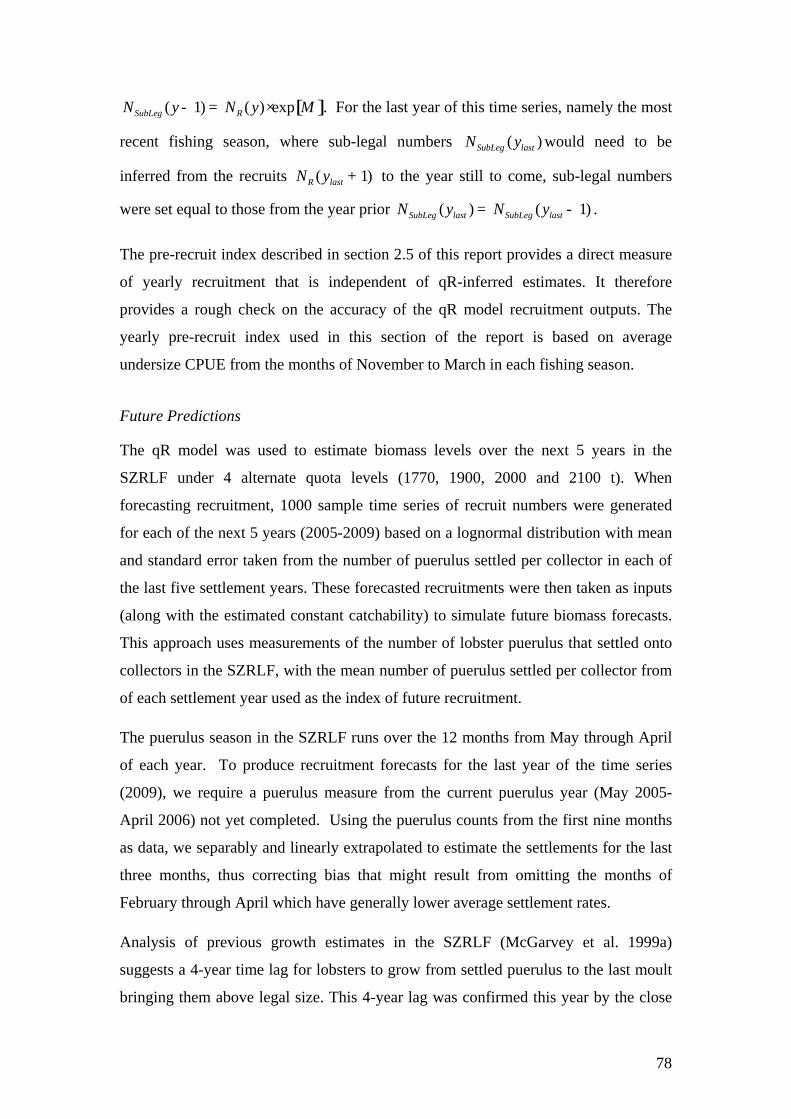
[( 1) ( ) expSubLeg RN y N y M- = × ]. For the last year of this time series, namely the most
recent fishing season, where sub-legal numbers would need to be
inferred from the recruits to the year still to come, sub-legal numbers
were set equal to those from the year prior .
( )SubLeg lastN y
( 1)R lastN y +
( ) ( 1)SubLeg last SubLeg lastN y N y= -
The pre-recruit index described in section 2.5 of this report provides a direct measure
of yearly recruitment that is independent of qR-inferred estimates. It therefore
provides a rough check on the accuracy of the qR model recruitment outputs. The
yearly pre-recruit index used in this section of the report is based on average
undersize CPUE from the months of November to March in each fishing season.
Future Predictions
The qR model was used to estimate biomass levels over the next 5 years in the
SZRLF under 4 alternate quota levels (1770, 1900, 2000 and 2100 t). When
forecasting recruitment, 1000 sample time series of recruit numbers were generated
for each of the next 5 years (2005-2009) based on a lognormal distribution with mean
and standard error taken from the number of puerulus settled per collector in each of
the last five settlement years. These forecasted recruitments were then taken as inputs
(along with the estimated constant catchability) to simulate future biomass forecasts.
This approach uses measurements of the number of lobster puerulus that settled onto
collectors in the SZRLF, with the mean number of puerulus settled per collector from
of each settlement year used as the index of future recruitment.
The puerulus season in the SZRLF runs over the 12 months from May through April
of each year. To produce recruitment forecasts for the last year of the time series
(2009), we require a puerulus measure from the current puerulus year (May 2005-
April 2006) not yet completed. Using the puerulus counts from the first nine months
as data, we separably and linearly extrapolated to estimate the settlements for the last
three months, thus correcting bias that might result from omitting the months of
February through April which have generally lower average settlement rates.
Analysis of previous growth estimates in the SZRLF (McGarvey et al. 1999a)
suggests a 4-year time lag for lobsters to grow from settled puerulus to the last moult
bringing them above legal size. This 4-year lag was confirmed this year by the close
78

yearly correlation of all three independent recruitment indices, namely from the qR
model, the pre-recruit index, and from puerulus per collector four years earlier. To
scale the relative measure of mean number of puerulus settled per collector up to a
measure of recruitment (four years later), the qR-estimates of recruitment for the 10
overlapping years when measured puerulus would reach legal size, were used. These
are the settlement years 1991-2000 (i.e., the qR-recruitment years 1995-2004).
Recruitment Forecasting Algorithm
Define a re-scaling coefficient, CP->R by
4y P R yR C Puerulus−> −= ⋅
i.e. multiply the mean observed number of puerulus per collector in year y-4
( ) by the scaling coefficient (CP->R) to give recruitment in year y (4yPuerulus − yR ).
The scaling coefficient was obtained by taking the means of both puerulus and qR-
estimated R’s over the three overlapping years, i.e.
( ) ( ){ , 1995 to 2003} / { , 1991 to 1999}P R y yC mean R y mean Puerulus y−> = = =
Then for the 5 future years (y = 2005 to 2009), the assumed mean level of forecasted
recruitment was given by 4y P R yR C Puerulus−>= ⋅ − . The yearly standard deviation for
puerulus-forecasted Ry which determines the level of yearly simulated recruitment
variation (in each of the 1000 monte carlo runs), was given as P RC −> times the
observed standard error in the estimate of puerulus per collector for that
corresponding settlement year (4 years prior).
79

Then, given a distinct puerulus-forecasted mean and standard deviation of Southern
Zone recruitment for each of the 5 years to come, the forecasted recruit number for
each year and monte carlo run was obtained by sampling from a lognormal
distribution. The coefficient of variation (CV) is obtained in the usual way as standard
deviation divided by mean in each year. For each of the 5 future years, the lognormal
distribution describing the range of forecasted values of recruitment is defined by two
parameters, μ and σ, which are derived from the mean and CV of recruitment using
the formulae { }1
2 2ln CV +1σ ⎡= ⎣ ⎤⎦ and 2
= ln(mean) -2
σμ . Then choosing
standardised normal variates, zy, one for each year, using built-in Excel routines, the
sampled recruitment in each forecast year was given by ( )expy yR zμ σ= + ⋅ . This
lognormal sampling procedure was repeated 1000 times using an Excel VBA macro
to generate 1000 forecasted future 5-year recruitment time series.
3.3 Results
Performance Indicators from the qR model
Estimates of catch in numbers and weight from the qR model fit closely with
measurements of Cn and Cw obtained from the SZRLF (Figure 3-1, Figure 3-2).
Outputs from the model indicate that the biomass in the SZRLF has been increasing
since 1996, peaking at 6,856 tonnes in 2002 (Figure 3-3). In 2004, the biomass was
estimated at 6,530 tonnes. Similarly, total egg production in the SZRLF has been
increasing over the same period. In 2004, it was 1,500 billion eggs, which equates to
16.0% of virgin egg production (Figure 3-4, Figure 3-5).
The exploitation rate has been declining in the SZRLF since 1997 (Figure 3-6) and
reached an all-time low of 0.25 in 2002. In 2004, the exploitation rate was estimated
at 0.28. As the exploitation rate quantifies the proportion of the fishable biomass
harvested each season, the overall trend in declining SZRLF exploitation rate reflects
the fact that a stable catch is being taken from an increasing fishable biomass.
80

Comparison of estimates of recruitment from the qR model with puerulus settlement and pre-recruit indices.
The recruitment estimates from the qR model suggest that recruitment levels in the
seasons 1998 through 2002 were high, averaging over 3 million recruits per annum
(Figure 3-7). In 2004, recruitment was estimated at 2.8 million. The temporal trends
in recruitment that are predicted by the qR model fit closely to estimates of pre-
recruitment index (from commercial logbook data; R2 = 0.90) and puerulus settlement
index lagged by 4 years (.R2 = 0.57).
81
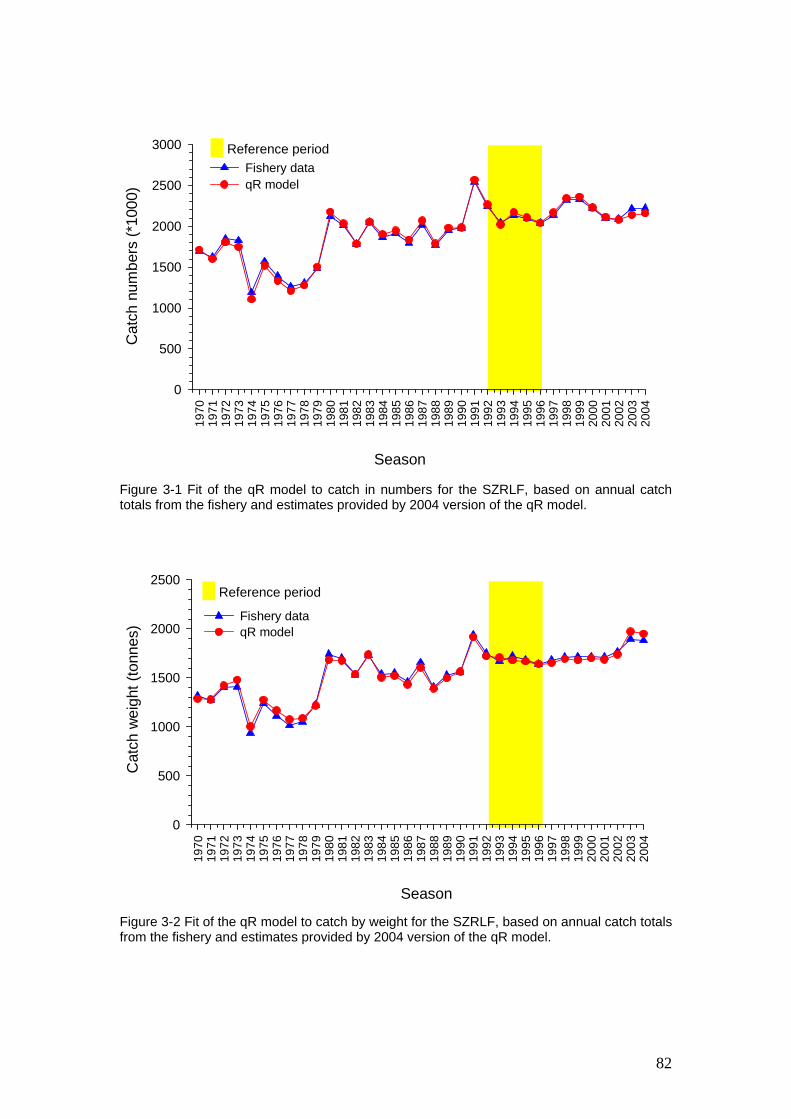
Season
1970
1971
1972
1973
1974
1975
1976
1977
1978
1979
1980
1981
1982
1983
1984
1985
1986
1987
1988
1989
1990
1991
1992
1993
1994
1995
1996
1997
1998
1999
2000
2001
2002
2003
2004
Cat
ch n
umbe
rs (*
1000
)
0
500
1000
1500
2000
2500
3000
Fishery data qR model
Reference period
Figure 3-1 Fit of the qR model to catch in numbers for the SZRLF, based on annual catch
Figure 3-2 Fit of the qR model to catch by weight for the SZRLF, based on annua
totals from the fishery and estimates provided by 2004 version of the qR model.
l catch totals from the fishery and estimates provided by 2004 version of the qR model.
Season
1970
1971
1972
1973
1974
1975
1976
1977
1978
1979
1980
1981
1982
1983
1984
1985
1986
1987
1988
1989
1990
1991
1992
1993
1994
1995
1996
1997
1998
1999
2000
2001
2002
2003
2004
Cat
ch w
eigh
t (to
nnes
)
0
500
1000
1500
2000
2500
Fishery data qR model
Reference period
82
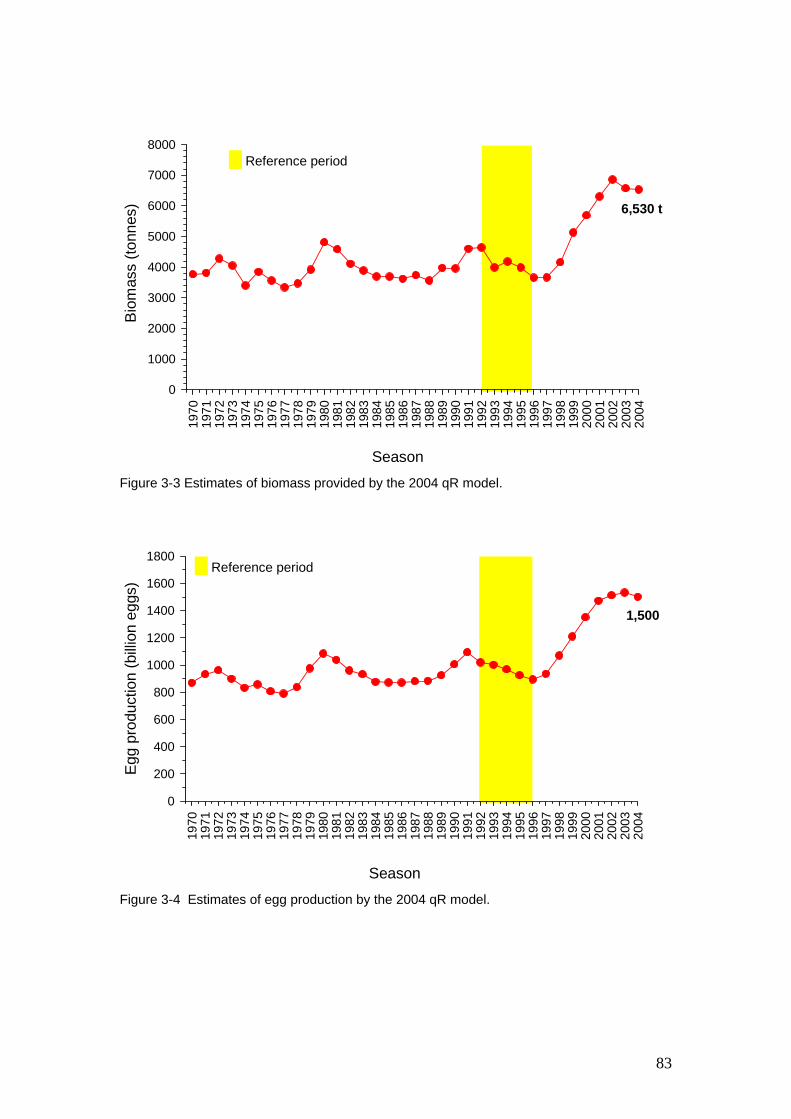
Season
1970
1971
1972
1973
1974
1975
1976
1977
1978
1979
1980
1981
1982
1983
1984
1985
1986
1987
1988
1989
1990
1991
1992
1993
1994
1995
1996
1997
1998
1999
2000
2001
2002
2003
2004
Bio
mas
s (to
nnes
)
0
1000
2000
3000
4000
5000
6000
7000
8000
6,530 t
Reference period
Figure 3-3 Estimates of biomass provided by the 2004 qR model.
Season
1970
1971
1972
1973
1974
1975
1976
1977
1978
1979
1980
1981
1982
1983
1984
1985
1986
1987
1988
1989
1990
1991
1992
1993
1994
1995
1996
1997
1998
1999
2000
2001
2002
2003
2004
Egg
prod
uctio
n (b
illion
egg
s)
0
200
400
600
800
1000
1200
1400
1600
1800
1,500
Reference period
Figure 3-4 Estimates of egg production by the 2004 qR model.
83

Season
1970
1971
1972
1973
1974
1975
1976
1977
1978
1979
1980
1981
1982
1983
1984
1985
1986
1987
1988
1989
1990
1991
1992
1993
1994
1995
1996
1997
1998
1999
2000
2001
2002
2003
2004
% o
f virg
in e
gg p
rodu
ctio
n
0.00
0.05
0.10
0.15
0.20
0.16
Reference period
Figure 3-5 Estimates of percent of virgin egg production by the 2004 qR model
Season
1969
1970
1971
1972
1973
1974
1975
1976
1977
1978
1979
1980
1981
1982
1983
1984
1985
1986
1987
1988
1989
1990
1991
1992
1993
1994
1995
1996
1997
1998
1999
2000
2001
2002
2003
2004
Exp
loita
tion
rate
(U)
0.0
0.1
0.2
0.3
0.4
0.5
0.28
Reference period
Figure 3-6 Estimates of exploitation rates obtained from the 2004 qR model
84

Season
1994 1995 1996 1997 1998 1999 2000 2001 2002 2003 2004 2005
qR R
ecru
itmen
t (m
illio
ns)
1.5
2.0
2.5
3.0
3.5
4.0
4.5P
RI (
num
ber u
nder
size
d/po
t lift
)P
SI (
puer
ulus
/col
lect
or)
0.0
0.5
1.0
1.5
2.0
2.5qR recruitmentPre-recruit index (logbook)Puerulus settlement index(4 year lag)
Figure 3-7 Estimates of annual recruitment obtained from the qR model, pre-recruit index (PRI) as undersize numbers per pot lift (Nov-Mar) obtained from logbook data and puerulus settlement index (PSI) lagged by 4 years.
85

Forecasts of biomass
The mean expected start-of-year biomass for the next four years, based on the mean
number of puerulus settled per collector, is presented in Figure 3-8. Forecasts suggest
that the biomass will increase in 2006 for both quotas examined (1770, and 1900 t) in
response to the high puerulus settlement in 2002. Biomass is predicted to decrease in
2007 under both quota levels, due to the low settlement in 2003, but will increase for
the following two seasons due to high puerulus counts in 2004 and 2005. The notable
increase in biomass in 2009 reflects one of the highest puerulus counts on record in
Figure 3-8 Estimates o
the SZRLF in 2005.
f biomass for the SZRLF and generated forecasts at different quota levels as provided by the puerulus method for the qR model.
Season
80 81 82 83 84 85 86 87 88 89 90 91 92 93 94 95 96 97 98 99 00 01 02 03 04 05 06 07 08 09
Bio
mas
s (to
nnes
)
3000
3500
4000
4500
5000
5500
6000
6500
7000
7500
8000
8500
9000
9500
10000
10500
11000
qR-Biomass 1770 tonne quota1900 " "
2004 2005 2006 2007 2008 20095000
6000
7000
8000
9000
10000
11000
12000
13000
86
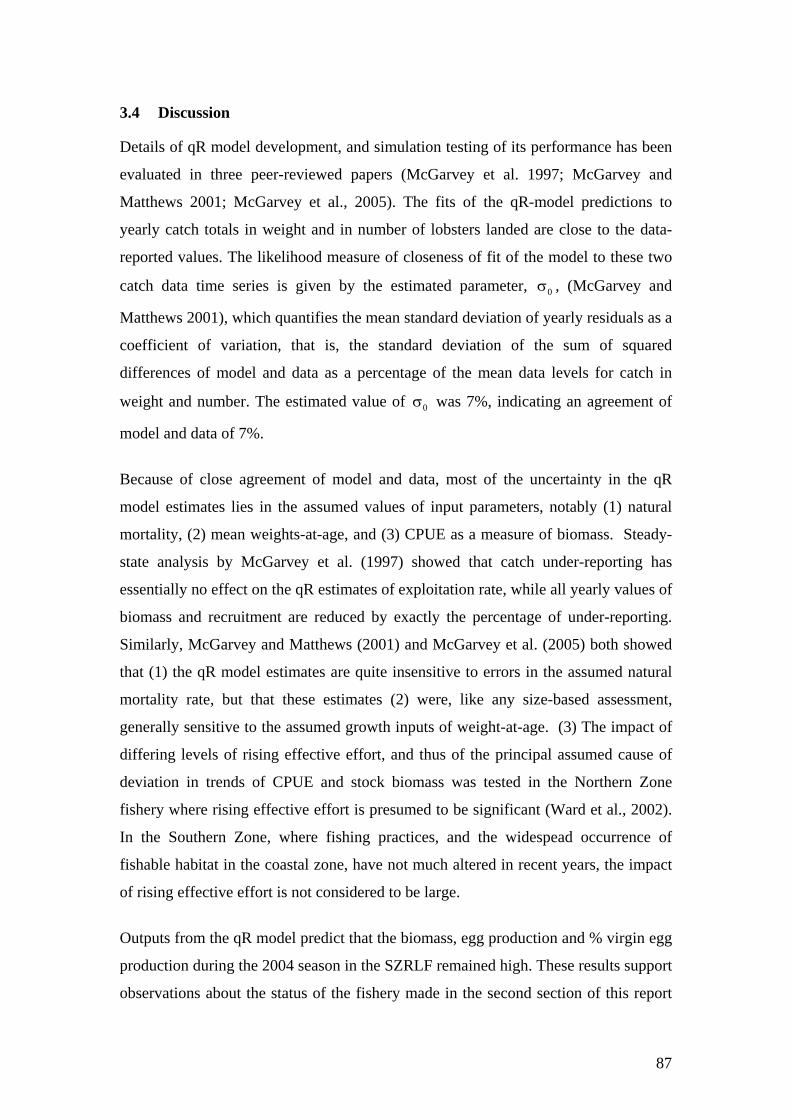
3.4 Discussion
Details of qR model development, and simulation testing of its performance has been
evaluated in three peer-reviewed papers (McGarvey et al. 1997; McGarvey and
Matthews 2001; McGarvey et al., 2005). The fits of the qR-model predictions to
yearly catch totals in weight and in number of lobsters landed are close to the data-
reported values. The likelihood measure of closeness of fit of the model to these two
catch data time series is given by the estimated parameter, 0σ , (McGarvey and
Matthews 2001), which quantifies the mean standard deviation of yearly residuals as a
coefficient of variation, that is, the standard deviation of the sum of squared
differences of model and data as a percentage of the mean data levels for catch in
weight and number. The estimated value of 0σ was 7%, indicating an agreement of
model and data of 7%.
Because of close agreement of model and data, most of the uncertainty in the qR
model estimates lies in the assumed values of input parameters, notably (1) natural
mortality, (2) mean weights-at-age, and (3) CPUE as a measure of biomass. Steady-
state analysis by McGarvey et al. (1997) showed that catch under-reporting has
essentially no effect on the qR estimates of exploitation rate, while all yearly values of
biomass and recruitment are reduced by exactly the percentage of under-reporting.
Similarly, McGarvey and Matthews (2001) and McGarvey et al. (2005) both showed
that (1) the qR model estimates are quite insensitive to errors in the assumed natural
mortality rate, but that these estimates (2) were, like any size-based assessment,
generally sensitive to the assumed growth inputs of weight-at-age. (3) The impact of
differing levels of rising effective effort, and thus of the principal assumed cause of
deviation in trends of CPUE and stock biomass was tested in the Northern Zone
fishery where rising effective effort is presumed to be significant (Ward et al., 2002).
In the Southern Zone, where fishing practices, and the widespead occurrence of
fishable habitat in the coastal zone, have not much altered in recent years, the impact
of rising effective effort is not considered to be large.
Outputs from the qR model predict that the biomass, egg production and % virgin egg
production during the 2004 season in the SZRLF remained high. These results support
observations about the status of the fishery made in the second section of this report
87

on the basis of CPUE. There appears to be a strong correlation between estimates of
recruitment from the qR model with both the independent pre-recruit index (R2 =
0.90) and lagged puerulus settlement index (R2 = 0.57) which provides evidence that
the qR model is a useful stock assessment tool for the SZRLF.
Forecasts suggest that the biomass will increase in 2006 for both quotas examined
(1770 and 1900 t) in response to the high puerulus settlement in 2002. Biomass is
predicted to decrease in 2007 due to the low settlement in 2003, but will increase for
the next two seasons due to high puerulus counts in 2004 and 2005. The large
predicted increase in biomass in 2009 reflects one of the highest puerulus settlement
counts on record in 2005.
88

4 PERFORMANCE INDICATORS
Current biological performance indicators for the SZRLF are catch rate, mean weight,
pre-recruit abundance, exploitation rate and egg production. Upper and lower limits
for catch rate, mean weight and pre-recruit abundance are identified in the
Management Plan and are the highest and lowest values to occur in the reference
seasons 1992 through 1996 (Zacharin 1997) (Table 1-5). For those performance
indicators that are estimated by the qR model, i.e. exploitation rate and egg
production, the upper and lower estimates derived for the reference years are from the
most recent version of the qR model.
4.1 Catch Rate
The catch rate (CPUE) for the reference years ranged between 0.935 kg/pot lift in
1996 and 1.138 kg/pot lift in 1994 (Table 4-1). CPUE for the 2004 season was 1.81
kg/pot lift, which is 59% above the upper reference limit and one of the highest
CPUEs in the history of the fishery. This is the sixth season in succession in which the
CPUE has been higher than the upper reference limit. As indicated in the first section
of this report, the rise in CPUE reflects the increase in lobster biomass resulting from
the control of catch levels associated with introduction and enforcement of the TACC
and high levels of recruitment in recent years.
4.2 Mean Weight
The mean weight of lobsters for the reference years ranged between 0.794 kg in 1992
and 0.839 kg in 1993 (Table 4-1). The mean weight of lobsters for the 2004 season
(calculated from season totals rather than daily catch data as it was in section two)
was 0.846 kg, which is 0.83% higher than the upper reference limit. As mentioned in
section 2.3.1, fishing behaviour (particularily highgrading) undoubtedly affects
current annual estimates of lobster size in the zone.
4.3 Abundance of Pre-recruits
The index of pre-recruit abundance for the reference years ranged between 1.20
undersize/pot lift in 1996 to 1.53 undersize/pot lift in 1994 (Table 4-1). The pre-
recruit index for the 2004 season, calculated for months of November to March
(inclusive), was 1.31 undersize/pot lift, which is inside the reference range. The
89

independent estimates of recruitment provided by the qR model broadly confirms
trends in pre-recruit estimates.
4.4 Exploitation Rate
Reference points for the exploitation rate for the reference years generated by the qR
model ranged from 0.37 in 1992 to 0.44 in 1996 (Table 4-1). The exploitation rate for
2004 was 0.28, which is 24% below the lower reference limit. The 2004 exploitation
rate estimate remains one of the lowest figures in the history of the fishery and
indicates that the current level of the TACC is achieving the goal of rebuilding the
biomass.
4.5 Egg Production
Reference points for egg production derived from the qR model range from 895
billion eggs in 1996 to 1,019 billion eggs in 1992 (Table 4-1). Egg production in the
2004 season was 1,500 billion eggs, which is 47% above the upper reference limit and
one of the highest in the history of the fishery. The high level of egg production in the
2004 season as estimated by the qR model reflects the continuing increase in
abundance of adult lobsters in the SZRLF.
90

Biological Reference Points
2004/05
Lower Limit
Upper Limit
Exploitation rate
0.28
0.37
0.44
Egg production (billions)
1,500
895
1,019
Pre-recruit abundance (no. undersized/potlift)
1.31
1.20
1.53
Catch rate (kg/pot lift)
1.81
0.94
1.14
Mean Weight (kg)
0.85
0.79
0.84
Table 4-1 Estimates of biological performance indicators for the SZRLF in 2004/05 in relation to upper and lower limit ranges.
91

5 GENERAL DISCUSSION
5.1 Information Available for the Fishery
Stock assessment of the SZRLF is aided by documentation on the history of the
management of the fishery in the Management Plan and both recent stock assessment
and status reports (Prescott et al. 1997; Zacharin 1997; Linnane et al. 2005b and c).
The management plan also describes the management arrangements in place at the
time of this assessment and the biological reference points used for assessing the
fishery. Comprehensive catch and effort data have been collected since 1970. Data
collected since 1983, however, provide more reliable information on effort. Fishery
stock assessments are also aided by puerulus settlement data and stock assessment
model outputs. Voluntary catch sampling data have been collected since 1991 and
provide critical information on length frequency, pre-recruit indices and reproductive
condition of females. Data from 1994 onwards are more robust due to low levels of
participation in the early years of the program.
Assessment of the SZRLF currently depends mainly on commercial catch and effort
data. Future stock assessment would greatly benefit from the collection of additional
fishery-independent information. A fishery-independent monitoring survey (FIMS) is
currently being developed in the SZRLF. Outputs from this survey will be presented
in future stock assessments for the fishery and will help to reduce the level of
uncertainty in the assessment.
5.2 Current Status of Southern Zone Rock Lobster Fishery
The fishery-dependent data provided in this report clearly suggest that the status of
the resource upon which the SZRLF is based has improved substantially over the last
decade and consequently that the biomass of rock lobster in the Southern Zone has
increased, reflecting the success of the long-term rebuilding program. This conclusion
is consistent with that reached in the most recent reports (Ward et al., 2005; Linnane
et al., 2005b and c) and is based on numerous lines of evidence. For example, catch
rates have increased rapidly since 1996 and have been above the upper reference point
stated in the Management Plan since 1999. The catch rate for 2004 (1.81 kg/pot lift) is
one of the highest in the recent history of the fishery (i.e. since 1970). The pre-recruit
92
index for 2004 (1.31 undersize/pot lift) is also inside the range for the reference
period identified in the Management Plan.
Similarly, the performance indicators derived from the qR model suggest that the
SZRLF is currently in a strong position. Recruitment levels, as estimated by the qR
model, have been above the historic average in each of the previous seven seasons. In
addition, the 2004 level of biomass is one of the highest in the history of the fishery
(i.e. since 1970) and egg production is currently 47% above the upper limits for the
reference period identified in the Management Plan. The exploitation rate for the 2004
season (0.28) is 24% below the lower limit for the reference period identified in the
Management Plan. The close yearly correlation of all three independent recruitment
indices, namely from the qR model, the pre-recruit index (PRI), and lagged puerulus
settlement index (PSI) is encouraging and suggests that the PSI may be a suitable
indicator for predicting future recruitment within the zone.
Overall, fishery data and outputs from the qR model indicate that the biomass
rebuilding strategy for the SZRLF has succeeded.
Despite optimistic outputs at a zonal level, the observed downtrend trend in a number
of localised fishery dependent statistics should be highlighted. Currently, >85% of the
catch in the SZRLF is taken from depths of <60 m. Data presented in this report
suggests that continued exploitation of inshore stocks at this level may not be
sustainable. For example, catch rates in MFAs 56 and 58 have decreased notably over
the last two seasons in both the 0-30 m and 31-60 m depth ranges. In addition, the
catch rate of both spawning females and undersized lobsters in both these MFAs have
also decreased. For example, the pre-recruit index in MFA 56 has been decreasing
since 1999 and the 2004 estimate is the lowest on record since 1996. While current
estimates of catch rate and pre-recruit index for the entire zone are within the range of
the performance indicators in the Management Plan, these results indicate that close
monitoring of these indices on a finer spatial scale may be required if localised
reductions in lobster abundance is to be avoided. Overall, these results highlight the
need for fishery independent data that are currently lacking from both fishery statistics
and stock assessment model outputs.
93

5.3 Research in Response to DEH Recommendations
Both current and future research needs in the SZRLF have recently been refocused by
the South Australian Rock Lobster Research Committee to ensure the
recommendations outlined in the assessment of the fishery, by the Department of
Environment and Heritage (DEH), (Anon, 2003) are addressed appropriately. The
DEH report outlines 13 recommendations to the fishery that relate to both
management arrangements and environmentally sustainable fishing practices. A
number of these recommendations are currently being addressed through either
ongoing research or through proposed research projects. A full list of the DEH
recommendations are provided in an appendix to this assessment report.
Recommendation 4 requests:
PIRSA to continue to improve assessment of all components of non-commercial catch in the fishery to be factored into the annual stock assessment process and management of the fishery. This will include further periodic surveys or other data collection and analysis measures to enhance the assessments of recreational and indigenous catch in the fishery.
Details of management arrangements associated with recreational fishing in the
SZRLF are provided in Section 1.2.4 of this report. Periodic recreational catch and
effort surveys are undertaken (e.g. Venema et al. 2003), the most recent of which was
conducted during the 2004/05 fishing season (Currie et al. 2006). Outcomes from this
survey are presented in section 1.2.4 of this report.
Recommendation 5 requests:
PIRSA within 18 months, to review the monitoring requirements for both zones of the fishery, including options for independent monitoring appropriate to the scale of fishing and status of stocks in the main fishing areas, to identify monitoring measures necessary to confirm the status of stocks and support stock recovery strategies.
In order to overcome the inherent limitations of the fishery dependent catch and effort
logbook program, a Fishery Independent Monitoring Survey (FIMS) was developed
for trial in the southern zone rock lobster fishery (SZRLF) for the 2005/06 season.
Sampling is being undertaken at the beginning (September), mid season (January) and
end (May) of this fishing season along five predetermined transects across a range of
depth profiles. Data will be used as input for fishery independent models with outputs
used in the determination of a fishery independent estimate of lobster abundance.
94

Initially, the FIMS will be conducted in the SZRLF only. However, once the sampling
protocol and data analyses procedures have been developed and refined, it is proposed
that they will be applied to the NZRLF.
Recommendation 7 requests:
Performance measures and targets for the main byproduct species to be included in the revised management plans for both zones, and the catches of the main byproduct species should be reviewed as part of the annual stock assessment process
A report detailing the species composition and spatio-temporal trends in by-catch
from the South Australian commercial rock lobster fishery as estimated using two
monitoring options was finalised in 2004 (Brock et al., 2004). The report identifies the
main by-catch species within the fishery and estimates catch rates of by-catch as
determined during the 2001/02 and 2002/03 fishing seasons. It also compares the
effectiveness of logbook and observer sampling strategies and comments on the
appropriateness of each for application within the South Australian rock lobster
fishery. A workshop on the outcomes of the report is proposed for 2006 as part of the
revision of the management plans for the fishery. The species composition of by-catch
from the SZRLF is also monitored annually through the onboard observer
programme. Results are presented in a previous section of this report.
Recommendations 10, 11 and 12 request:
PIRSA within 18 months to introduce mandatory structured reporting of all interactions between the rock lobster fishery and endangered, threatened or protected species
PIRSA and industry to continue to monitor the extent of interactions between rock lobster fishery and fur seals and sea lions, and develop appropriate mitigation measures including establishment within 2 years of preliminary trigger and reference points, to minimise these interactions
PIRSA within 12 months to conduct a qualitative risk assessment of the interactions between the rock lobster fishery and protected species off SA and use the outcomes of this assessment to implement further protected species mitigation measures as required
In response to these recommendations, a project titled “Interactions of the South
Australian fishery for southern rock lobster (Jasus edwardsii) with pinnipeds” has
been submitted to the Fisheries Research and Development Corporation for funding
consideration. The main objectives of the project are as follows:
95

1) To measure the interaction of the South Australian rock lobster fishery with pinnipeds
2) To assess the risks to pinniped populations arising from their interactions with the South Australian rock lobster fishery
3) To develop and assess methods for mitigating the interaction of pinnipeds with lobster pots.
4) To determine the importance of rock lobster in the diets of Australian sealions.
Initial funding has been provided by FRDC for a desktop review study. This report is
due for completion in 2006.
5.4 Future Research Priorities
A number of additional strategic research priorities facing the fishery have been
identified through the Fishery Research Sub-Committee. The relationship between
rock lobster recruitment characteristics and oceanographic conditions is currently
listed as a high research priority for the zone. A project titled “Relationships between
sea surface temperature, ocean colour and recruitment to fisheries in South Australia”
was submitted to FRDC in 2005 for funding consideration. The objectives of the
project are:
1) To calculate quantitative indices from remote sensing of sea surface temperatures (SST) and ocean colour from 20-year and 16 year datasets respectively.
2) To compile the model-based and measured recruitment indices for S.A. fisheries including rock lobster.
3) To statistically compare the time series of remote sensing indices to the time series of recruitment indices for each species with the goal of determining whether a relationship exists.
Rock lobster population spatial dynamics has also been identified as having a
medium-high priority for the zone. In response to this, a project titled “Improving
spatial management of southern rock lobster fisheries to improve yield, value and
sustainability” has been submitted to FRDC for funding consideration. The objectives
of the project are:
1) To enable assessment reporting of trends in biomass and egg production by depth.
96
2) To evaluate separate deep-water quota for increase in yield and egg production.
3) To evaluate regional size limits to increase in yield and egg production.
4) To conduct field experiments and sampling to provide additional data required for alternative harvest strategy evaluation (fisher catch sampling, translocation release survival, release movement, translocation growth transition, effects of translocation on maturity and egg production parameters, density dependent growth).
5) To conduct field experiments on translocation to provide additional data required for economic evaluation (change in colour, tail width, condition, and ability to survive transport).
6) To evaluate translocation options that increase yield and egg production.
7) To evaluate and compare spatial management options by economic analysis.
8) To determine the extent of ecological community change in deep water reef habitats in response to increased harvest rates of lobsters.
9) To develop functional management and monitoring recommendations to apply outcomes.
Finally, the inherent problems associated with the use of fishery dependent data for
estimating lobster abundance are widely acknowledged. Changes in fishing patterns
mean that commercial catch rates are no longer a true reflection of lobster biomass. In
South Australia, this is highlighted under the quota management system where
highgrading (the selection of smaller or non-damaged individuals due to higher unit
value) is a feature of the fishery. As a result, a Fishery Independent Monitoring
Survey (FIMS) has been developed for trial in the SZRLF for the 2005/06 season.
Sampling is being undertaken throughout the season along five predetermined
transects that cover a range of depth profiles. Data will be used as input for fishery
independent models with outputs used in the determination of a fishery independent
estimate of lobster abundance.
The strategic research plan for the SZRLF will be reviewed as part of the process in
developing a new Management Plan for the fishery.
97

6 BIBLIOGRAPHY
Anon. (1995) A review of the management of the South Australian southern zone rock lobster fishery. South Australian Research and Development Institute, Adelaide. Anon. (2003). Assessment of the ecological sustainability of management arrangements for the South Australian Rock Lobster Fishery. Department of the Environment and Heritage publication, Canberra, 1-34. Bentley, N. and P. J. Starr (2001) An Examination of Stock Definitions for the New
Zealand Rock Lobster Fishery 2001/48 Ministry of Fisheries, Wellington, 1-22.
Booth, J. D. (1994). Jasus edwardsii larval recruitment off the east coast of New
Zealand. Crustaceana 66: 295-317. Booth, J. D., A. D. Carruthers, C. D. Bolt and R. A. Stewart (1991). Measuring the
depth of settlement in the red rock lobster, Jasus edwardsii. New Zealand Journal of Marine and Freshwater Research 25: 123-132.
Booth, J. D., J. S. Forman and D. R. Stotter (2002). Settlement indices for 2000 for
the red rock lobster, Jasus edwardsii 2002/12 National Institute of Water Research and Atmosphere, Wellington, 1-34.
Booth, J. D., J. S. Forman, D. R. Stotter, E. Bradford, J. Renwick and S. M. Chiswell
(1999). Recruitment of the red rock lobster with management implications 99/10 NIWA, Wellington, 1-103.
Booth, J. D. and R. A. Stewart (1992). Distribution of phyllosoma larvae of the red
rock lobster Jasus edwardsii off the east coast of New Zealand in relation to the ocdeanography. Australian Society for Fish Biology workshop on larval biology, Australian Government Publishing Service.
Booth, J. D. and R. A. Stewart (1993). Puerulus settlement in the red rock lobster,
Jasus edwardsii. 93/5 MFA, Wellington, Booth, J. D., R. J. Street and P. J. Smith (1990). Systematic status of the rock lobsters
Jasus edwardsii from New Zealand and J. novehollandae from Australia. New Zealand Journal of Marine and Freshwater Research 24: 239-249.
Brasher, D. J., J. R. Ovenden and R. W. G. White (1992). Mitochondrial DNA
variation and phylogenetic relationships of Jasus spp. (Decapoda: Palinuridae). Journal of Zoology 227: 1-16.
Breen, P. A. and J. D. Booth (1989). Puerulus and juvenile abundance in the rock
lobster Jasus edwardsii at Stewart Island, New Zealand. New Zealand Journal of Marine and Freshwater Research 23: 519-523.
98

Breen, P. A. and J. L. McKoy (2002) Review of current and past stock assessments for the South Australian Northern Zone Rock Lobster: Report by NIWA to the NZRL FMC Fishery NIWA, Wellington,
Brock, D. J. and T. M. Ward (2004). Maori octopus (Octopus maorum) bycatch and southern rock lobster (Jasus edwardsii) mortality in the South Australian rock lobster fishery. Fishery Bulletin 102, 430-440. Brock, D. J., Saunders, T. M., Ward, T. M. and A. J. Linnane (2006a). Effectiveness of a two-chambered trap in reducing within-trap predation by octopus on southern spiny rock lobster. Fisheries Research 77,.348-355.
Brock, D. J., Saunders, T. M., Ward, T. M. and A. J. Linnane (2006b). A two- chambered trap reduces within-trap predation by octopus on rock lobsters in aquarium trials. Fisheries Research in press.
Brown, R. S. and B. F. Phillips (1994). The Current Status of Australia's Rock Lobster Fisheries. Spiny Lobster Management. B. F. Phillips, J. S. Cobb and J. Kittaka. Melbourne, Blackwell Scientific Publications Ltd.: 33-63.
Bruce, B., R. Bradford, D. Griffin, C. Gardner and J. Young (1999). A synthesis of
existing data on larval rock lobster distribution in southern Australia. Final report to the Fisheries Research and Development Corporation 96/107 FRDC, Canberra, 1-57.
Caddy, J. and R. Mahon (1995). Reference points for fisheries management FAO
Fisheries Technical Paper 347, 1-83. Copes, P. (1978). Resource management for the Rock Lobster Fisheries of South
Australia: A report commissioned by the Steering Committee for the Review of Fisheries of the South Australian Government.
Currie, D.R., Sorokin S.J. and Ward T.M. (2006). Survey of Recreational Rock
Lobster Fishing in South Australia during 2004/05. Report to PIRSA Fisheries. SARDI Aquatic Sciences Publication No. RD04/0228-2.
Gardner, C.; Frusher, S. D.; Buxton, C.; Haddon, M. 2003: Movements of southern rock lobster, Jasus edwardsii, in Tasmania, Australia. Bulletin of Marine Science 73: 653-671. Henry, G. W. and J. M. Lyle (2003). The National Recreational and Indigenous
Fishing Survey 99/158 NSW Fisheries, Cronulla, NSW, 200. Kanciruk, P. (1980). Ecology of juvenile and adult Palinuridae. The Biology and
Management of Lobsters. J. S. Cobb and B. F. Phillips. New York, Academic Press. 2: 59-96.
Kermack, W.O., McKendrick, A.G., 1932. Contributions to the mathematical theory of epidemics. III. Further studies of the problem of endemicity. Proc. R. Soc., Series A 138, 94-122.
99
Lewis, R. K. (1981). Southern Rock Lobster Jasus novaehollandae: Zone N Review
South Australian Department of Fisheries. Linnane, A, T. M. Ward, R. McGarvey and J. Feenstra (2004). Southern Zone Rock
Lobster (Jasus edwardsii) Fishery Status Report 2003/04. Status Report to PIRSA Fisheries. SARDI Aquatic Sciences Publication No. RD04/0164.
Linnane, A., W. F. Dimmlich, and T. M. Ward (2005a). Movement patterns of the southern rock lobster, Jasus edwardsii, off South Australia. New Zealand Journal of Marine and Freshwater Research, 39: 335-346. Linnane, A, T. M. Ward, R. McGarvey and J. Feenstra (2005b). Southern Zone Rock
Lobster (Jasus edwardsii) Fishery Status Report 2004/05. Status Report to PIRSA Fisheries. SARDI Aquatic Sciences Publication No. RD04/0164-2. SARDI Report Series No. 108.
Linnane, A, T. M. Ward, R. McGarvey, Y. Xiao and J. Feenstra (2005c). Southern
Zone Rock Lobster (Jasus edwardsii) Fishery 2003/04. Final Stock Assessment Report to PIRSA Fisheries. SARDI Aquatic Sciences Publication No. RD03/0153-02.
Lotka, A.J. (1922). The stability of the normal age distribution. Proceedings of the National Academy of Science. 8, 339-345.
MacDiarmid, A. B. (1988). Experimental confirmation of external fertilisation in the
southern temperate rock lobster Jasus edwardsii (Hutton) (Decapoda: Palinuridae). Journal of Experimental Marine Biology and Ecology 120(3): 277-285.
MacDiarmid, A. B. (1989). Moulting and reproduction of the spiny lobster Jasus
edwardsii (Decapoda:Palinurudae) in northern New Zealand. Marine Biology 103: 303-310.
McClatchie, S and T. M. Ward in press. Water mass and alongshore variation in
upwelling intensity in the eastern Great Australian Bight. Journal of Geophysical Research.
McGarvey, R., G. J. Ferguson and J. H. Prescott (1999a). Spatial variation in mean
growth rates of rock lobster, Jasus edwardsii, in South Australian waters. Marine and Freshwater Research 50: 333-342.
McGarvey, R., M. Pennington, J. Matthews, D. Fournier, J. Feenstra, M. Lorkin and
G. Ferguson (1999b). Survey sampling design and length-frequency data analysis for ongoing monitoring and model parameter evaluation in the South Australian rock lobster fishery: Final report to Fisheries Research and Development Corporation 95/138 South Australian Research and Development Institute, Adelaide, 1-119.
100

McGarvey, R. and J. M. Matthews (2001). Incorporating numbers harvested in dynamic estimation of yearly recruitment: onshore wind in interannual variation of South Australian rock lobster (Jasus edwardsii). Journal of the International Council for the Exploration of the Sea 58(5): 1092-1099.
McGarvey, R. and M. Pennington (2001). Designing and evaluating length-frequency
surveys for trap fisheries with application to the southern rock lobster. Canadian Journal of Fisheries and Aquatic Sciences 58(2): 254-261.
McGarvey, R., J. M. Matthews and J. H. Prescott (1997). Estimating lobster
recruitment and exploitation rate from landings by weight and numbers, and age-specific weights. Marine and Freshwater Research 48: 1001-1008.
McGarvey, R., A.E. Punt and J.M. Matthews (2005). Assessing the information
content of catch-in-numbers: a simulation comparison of stock assessment methods based on catch and effort totals. pp. 635-653, In: G.H. Kruse, V.F. Gallucci, D.E. Hay, R.I. Perry, R.M. Peterman, T.C. Shirley, P.D. Spencer, B. Wilson, and D. Woodby [eds.], Fisheries Assessment and Management in Data-Limited Situations. Alaska Sea Grant College Program, University of Alaska, Fairbanks.
McKendrick, A.G. (1926). Applications of mathematics to medical problems. Proceedings of the Edinburgh Mathematical Society. 44, 98-130.
Musgrove, R. J. B. (2000). Moult staging in the southern rock lobster Jasus
edwardsii. Journal of Crustacean Biology 20(1): 44-53. Ovenden, J. R., D. J. Brasher and R. W. G. White (1992). Mitochondrial DNA
analyses of red rock lobster, Jasus edwardsii, supports an apparent absence of population subdivision throughout Australasia. Marine Biology. 112(2): 319-326.
Prescott, J., R. McGarvey, G. Ferguson and M. Lorkin (1996). Population dynamics
of the southern rock lobster in South Australian waters. Final report to the Fisheries Research and Development Corporation 93/086 and 93/087, 1-64.
Prescott, J., G. Ferguson, D. Maynard, S. Slegers, M. Lorkin and R. McGarvey
(1997a). South Australian southern and northern zone rock lobster. South Australian Fisheries Assessment Series 97/1 South Australian Research and Development Institute, Adelaide, 1-58.
Prescott, J., R. McGarvey, G. Ferguson and M. Lorkin (1997b) Population Dynamics
of the Southern Rock Lobster in South Australian Waters 93/386 and 93/087 South Australian Research and Development Institute, Adelaide, 1-65.
Prescott, J., R. McGarvey, A. Jones, A. Peso, G. Ferguson, D. Casement, Y. Xiao and
P. McShane (1998) Southern Zone Rock Lobster 97/14 South Australian Research and Development Institute, Adelaide, 1-22.
101

Prescott, J., R. McGarvey, Y. Xiao and D. Casement (1999). Fisheries Assessment Report to PIRSA for the Northern Zone and Southern Zone Rock Lobster Fishery Management Committees 99/04 South Australian Research and Development Institute, Adelaide, 1-28.
Prescott, J. and Y. Xiao (2001) Rock Lobster 2001/04, Report to PIRSA Fisheries 1-
68. Rochford, D. J. (1977) A review of a possible upwelling situation off Port
MacDonnell S.A. 81 CSIRO Aust. Div. Fish. Oceanography. Schahinger, R. B. (1987). Structure of coastal upwelling events observed off the
south-east coast of South Australia during February 1983 - April 1984. Australian Journal of Marine and Freshwater Research 38: 439-459.
Smith, P. J., J. L. McKoy and P. J. Machin (1980). Genetic variation in the rock
lobsters Jasus edwardsii and Jasus novaehollandiae. New Zealand Journal of Marine and Freshwater Research 14: 55-63.
Spiegelhalter, D.J., Thomas, A., and Best, N.G., (2000). WinBUGS Version 1.3 User Manual. Medical Research Council Biostatistics Unit, Institute of Public Health, Cambridge, UK. Venema, S., V. Boxall and T. M. Ward (2003). Survey of Recreational Rock Lobster
Fishing in South Australia during 2001/02 South Australian Research and Development Institute, Adelaide, 1-42.
Ward, T. M., R. McGarvey and D. Brock (2002) Southern Zone Rock Lobster (Jasus
edwardsii) Fishery 2002/03a South Australian Research and Development Institute, Adelaide, 1-70.
Ward, T M. R. McGarvey, Y. Xiao, G. Ferguson and A. Linnane (2004). Southern Zone Rock Lobster (Jasus edwardsii) Fishery 2002/03. Final Stock Assessment Report to PIRSA Fisheries. SARDI Aquatic Sciences Publication No. RD03/0153. Zacharin, W., Ed. (1997). Management Plan for the South Australian Southern Zone
Rock Lobster Fishery. Primary Industries and Resources South Australia,1-29.
102

7 APPENDIX
The following is a list of recommendations by the Department of Environment and
Heritage (DEH) aimed at strengthening the effectiveness of the management
arrangements for the SARLF and containing the environmental risks in the medium to
long term (Anon. 2003).
Recommendation 1: PIRSA to inform the Department of the Environment and Heritage of any significant changes to the management regime of the South Australian Rock Lobster Fishery. Recommendation 2: The current review of SA's Fisheries Act 1982 should provide for the inclusion of general community members on the two fisheries management committees. Greater efforts should also be made to increase conservation and general community involvement in stock assessments and research priority setting processes. Recommendation 3: PIRSA to pursue complementary management arrangements with other Australian jurisdictions responsible for managing southern rock lobster fisheries to ensure that all removals and other relevant impacts on the stock are properly accounted for in stock assessments. Recommendation 4: PIRSA to continue to improve assessment of all components of non commercial catch in the fishery to be factored into the annual stock assessment process and management of the fishery. This will include further periodic surveys or other data collection and analysis measures to enhance the assessments of recreational and indigenous catch in the fishery. . Recommendation 5: PIRSA, within 18 months, to review the monitoring requirements for both zones of the fishery, including options for independent monitoring appropriate to the scale of fishing and status of stocks in the main fishing areas, to identify monitoring measures necessary to confirm the status of stocks and support stock recovery strategies. PIRSA to progressively implement priority actions identified in the review. Recommendation 6: PIRSA and the SA industry to work with their Victorian counterparts to investigate and adopt appropriate measures to address quota avoidance, misreporting of catches and other illegal activities in waters near the SA-Victoria border. These measures should be built into SA's compliance strategies. Recommendation 7: Performance measures and targets for the main byproduct species to be included in the revised management plans for both zones, and the catches of the main byproduct species should be reviewed as part of the annual stock assessment process. Recommendation 8: PIRSA to develop within 18 months a conservative harvest strategy for the Northern Zone fishery, including a TAC to commence on 1 November 2003, that includes recovery targets and reference points, and monitoring arrangements, representative of the scale of fishing in the Zone, and stock recovery timeframes. Recommendation 9: Priority should be given to early implementation of escape gaps in the Northern Zone, and should be mandatory in both zones by October 2004. Decisions on the dimensions of escape gaps in both zones to be based on the requirement to minimise fishery impacts on all bycatch species.
103

Recommendation 10: PIRSA within 18 months to introduce mandatory structured reporting of all interactions between the rock lobster fishery and endangered, threatened or protected species. Recommendation 11: PIRSA and industry to continue to monitor the extent of interactions between rock lobster fishery and fur seals and sea lions, and develop appropriate mitigation measures, including establishment within 2 years of preliminary trigger and reference points, to minimise these interactions. Recommendation 12: PIRSA within 12 months to conduct a qualitative risk assessment of the interactions between the rock lobster fishery and protected species off SA and use the outcomes of this assessment to implement further protected species mitigation measures as required. Recommendation 13: PIRSA to develop measures to assess ecosystem impacts of the fishery. Consideration should be given to the appropriateness of reference areas that would allow comparison between fished and unfished areas.
104