Embed Size (px)
Citation preview


Office of Institutional Research Page 2 of 55
Southern Oregon University Fact Book 2016
Table of Contents
SOU Mission Statement ....................................................................................................................................................... 3 SOU Profile Overview & Facts-at-a-glance ......................................................................................................................... 6 Enrollment Trends ............................................................................................................................................................... 13 Applications & Admissions ............................................................................................................................................ 14 Retention & Graduation ...................................................................................................................................................... 31 Degrees Conferred ........................................................................................................................................................ 35 Tuition & Financial Aid ........................................................................................................................................................ 38 Faculty & Staff ..................................................................................................................................................................... 45 Employee Counts/Categories ....................................................................................................................................... 49 Financial Summary ............................................................................................................................................................. 51
Written by
Jake Scott, Research Analyst, for the
Office of Institutional Research www.sou.edu/ir
Churchill Hall

Office of Institutional Research Page 3 of 55
Mission Statement Southern Oregon University is an inclusive campus community dedicated to
student success, intellectual growth, and responsible global citizenship.
SOU Commitments: Southern Oregon University is committed to a challenging and practical liberal arts
education centered on student learning, accessibility, and civic engagement; academic programs, partnerships, public service, outreach, sustainable practices, and economic development activities that address regional needs such as health and human services, business, and education; and outstanding programs that draw on and enrich our unique arts community and bioregion.

Office of Institutional Research Page 4 of 55
Fall 2016 Contact Information
Admissions Toll Free: 1 (855) 470-3377 In Oregon: (541) 552-6411 Email: [email protected] http://www.sou.edu/admissions/
Enrollment Services Phone: (541) 552-6600 Fax: (541) 552-6614 Email: [email protected] http://www.sou.edu/enrollment/
Graduate Studies Phone: (541) 552-6113 Email: [email protected] http://www.sou.edu/graduatestudies/
University Housing Phone: (541) 552-6371 Fax: 541-552-6380 Email: [email protected] http://www.sou.edu/housing/
Campus Administration President's Office Phone: (541) 552-6111 Fax: (541) 552-6337 Email: [email protected] http://www.sou.edu/president/ Academic and Student Affairs Phone: (541) 552-6114 Fax: (541) 552-6115 Email: [email protected] http://www.sou.edu/provost/ http://www.sou.edu/studentaffairs/ Development & SOU Foundation Phone: (541) 552-6127 Fax: (541) 552-6126 Email: [email protected] http://soufoundation.org Finance & Administration Phone: (541) 552-6319 Fax: (541) 552-6337 Email: [email protected] http://www.sou.edu/finadmin/ Southern Oregon University Marketing & Communications Phone: (541) 552-7246 Media Inquiries: (541) 552-6186 http://www.sou.edu/marketing/

Office of Institutional Research Page 5 of 55
Fall 2016 General Profile
Headcount: 6,088 (FTE: 4,295) 92% undergrad and 8% graduate 60% resident and 40% non-resident 28% minority population 4076 total applications and 73% of those admitted 675 new freshmen and 522 new transfers 21 to 1 student to faculty ratio 148 tenure track faculty, 302 administrative personnel, and 210 classified staff Housing and residential services capacity: 1100 and another 206 family housing units Over 1,000 degrees conferred in the past year 33 major programs and over 160 areas of study 4 bachelor online degree completion programs, 3 online master programs, and 5 online endorsement or licensures; 10 accelerated baccalaureate programs 175 acre campus 340,015 Library book volumes 295,618 Government documents 810,224 Microfilm/fiche Items 27,108 Periodical Subscriptions 12,067 Audiovisual Holdings 135,298 Electronic Books
Hannon Library

Office of Institutional Research Page 6 of 55

Office of Institutional Research Page 7 of 55
History at a Glance
1855 – City of Ashland, originally called Ashland Mills town, officially founded. 1872 – Ashland Academy founded by Rev. Joseph H. Skidmore and Annie Hill Skidmore. 1878 – The Academy was incorporated as the Ashland Academy and Commercial College. 1879 – School sold and renamed Ashland College and Normal School (ACNS). 1881 – First graduating class of ACNS. 1882 – Gov. of Oregon signs bill recognizing ACNS as an official state school. 1886 – Closed due to financial trouble, no evidence of the state supporting the institution. 1887 – Reopened as Ashland State Normal School after fundraising. 1890 – Closed due to lack of enrollment. 1895 – Reopened as Southern Oregon State Normal School after a series of deals. 1899 – The institution begins receiving state appropriations. 1932 – The unofficial name of Southern Oregon Normal School (SONS) becomes official. 1934 – Drama Professor Angus Bowmer founds the Oregon Shakespeare Festival. 1938 – Receives full accreditation from the American Association of Teachers Colleges. 1939 – Renamed to Southern Oregon College of Education. 1941 – Authorized to offer the first advanced degree, a B.S. in elementary education. 1956 – Renamed to Southern Oregon College, no longer just a school of education. 1966 – The entire Faculty Council resigns leading to work on a new faculty constitution. 1975 – Renamed to Southern Oregon State College. 1997 – Renamed to Southern Oregon University. 2007 – Created the College of Arts and Sciences. 2013 – Implemented House Model with Green and Social Justice Houses. 2015 – Became an Independent public body, Board of Trustees founded.

Office of Institutional Research Page 8 of 55

Office of Institutional Research Page 9 of 55
Fall 2016 Winter 2017 Spring 2017Priority Registration May 18 Nov 7 Feb 27Registration Sept 12 Dec 26 Mar 20New Student Orientation Sep 23-26 Jan 6-9 Apr 1-3Quarter begins Sept 26 Jan 9 Apr 3Last day to add courses, change sections, or register Sept 30 Jan 13 Apr 7
Last day to pay fees without penalty Oct 7 Jan 13 Apr 7Late add fee ($100) for any classes added after this date Oct 7 Jan 20 Apr 14Last day for tuition refund for dropped courses Oct 10 Jan 23 Apr 17
Last day to drop a course w/o being resposible for a grade Oct 21 Feb 3 Apr 28Last day to add a course or change sections Oct 21 Feb 3 Apr 28Last day to change "Audit" option Oct 21 Feb 3 Apr 28Last day to change P/NP option Nov 11 Feb 24 May 19Last day to submit course withdrawal Nov 28 Mar 13 Jun 5
Final examinations Dec 5-9 Mar 20-24 Jun 12-16Quarter ends Dec 9 Mar 24 Jun 16
Thanksgiving Holiday Nov 24-25Martin Luther King, Jr. holiday observed Jan 16Memorial Day holiday observed May 29
Academic Calendar2016-2017

Office of Institutional Research Page 10 of 55
Oregon Center for the Arts Science, Technology, Engineering, and MathArt BiologyCreative Writing ChemistryEmerging Media & Digital Art Computer ScienceMusic MathematicsTheatre Arts
DanceShakespeare Studies Business, Communication, & the Environment
BusinessEducation, Health, and Leadership Communication
Education JournalismEarly Childhood Development Video ProductionElementary Education Environmental Studies
Health and Physical EducationOutdoor Adventure Leadership Humanities and CultureMilitary Science Anthropology
Army Gold English and WritingGender, Sexuality, and Women's Studies
Social Sciences International StudiesCriminology and Criminal Justice Native American StudiesEconomics PhilosophyGeography World Languages & LiteraturesHistoryPolitical Science Graduate StudiesPsychology Master of Arts in TeachingSociology Master in Education
Master in ManagementUndergraduate Studies Master in Business Administration (MBA)
House Experience MS in Environmental EducationHonors College MS in Applied Computer ScienceLearning Commons Master in Interdisciplinary StudiesStudy Abroad Master in Mental Health CounselingSuccess at Southern Master of Theatre Studies, Production & DesignUniversity Seminar Master of Music, Performance
Master of Arts in French/Spanish Language Teaching
* Source SOU Website
Academic Offerings2016-2017
Office of Institutional Research Page 11 of 55
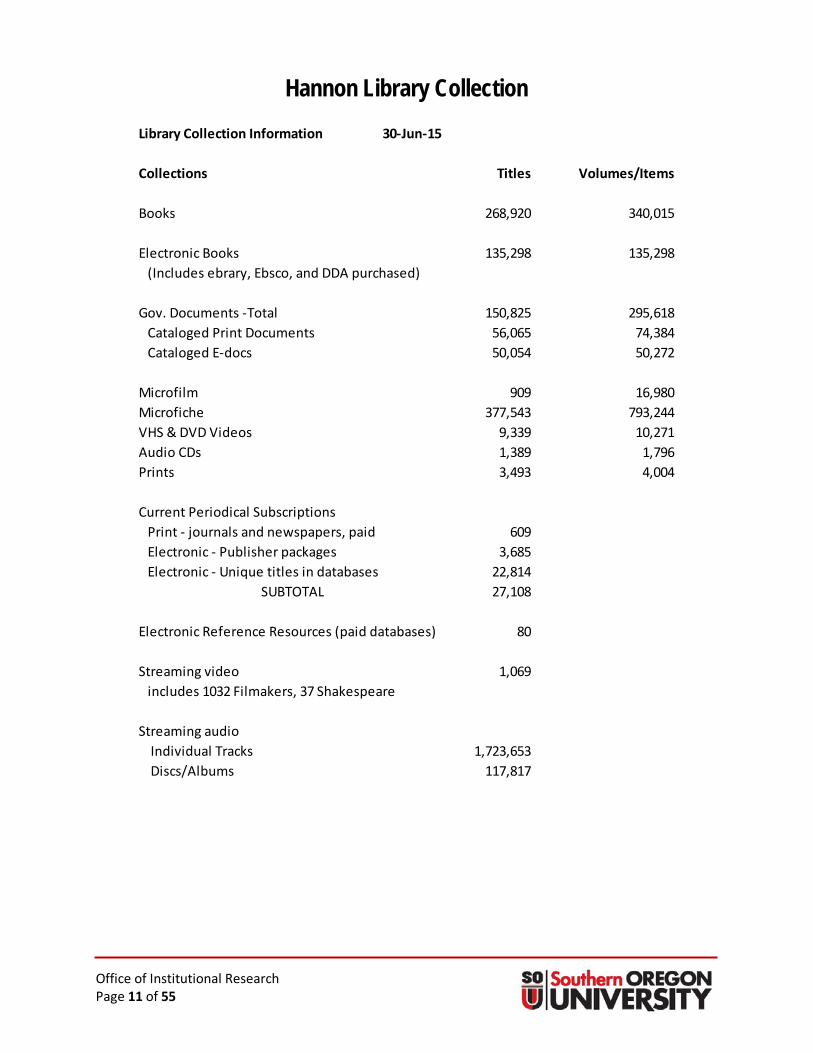
Library Collection Information 30-Jun-15
Collections Titles Volumes/Items
Books 268,920 340,015
Electronic Books 135,298 135,298 (Includes ebrary, Ebsco, and DDA purchased)
Gov. Documents -Total 150,825 295,618Cataloged Print Documents 56,065 74,384Cataloged E-docs 50,054 50,272
Microfilm 909 16,980Microfiche 377,543 793,244VHS & DVD Videos 9,339 10,271Audio CDs 1,389 1,796Prints 3,493 4,004
Current Periodical Subscriptions Print - journals and newspapers, paid 609 Electronic - Publisher packages 3,685 Electronic - Unique titles in databases 22,814
SUBTOTAL 27,108
Electronic Reference Resources (paid databases) 80
Streaming video 1,069includes 1032 Filmakers, 37 Shakespeare
Streaming audio Individual Tracks 1,723,653 Discs/Albums 117,817
Hannon Library Collection

Office of Institutional Research Page 12 of 55

Office of Institutional Research Page 13 of 55
Enrollment Trends

ENROLLMENT TRENDS
Office of Institutional Research Page 14 of 55
Applied Admitted % Applied Admitted %Resident Freshmen 1,262 977 77.4% 1,119 879 78.6%Non-Resident Freshmen 1,707 1,343 78.7% 1,634 1,269 77.7%
Total Freshman 2,969 2,320 78.1% 2,753 2,148 78.0%
Resident Transfer 477 396 83.0% 486 405 83.3%Non-Resident Transfer 486 414 85.2% 426 346 81.2%
Total Transfer 963 810 84.1% 912 751 82.3%
Grad/PostBacc 240 141 58.8% 223 131 58.7%
Grand Total 4,172 3,271 78.4% 3,888 3,030 77.9%
* Source SOU Institutional Research
Applications and Admissions for Fall Term2015 2016
3,775 3,775
4,1723,888
2,845 2,845
3,2713,030
75.4% 75.4%
78.4% 77.9%
70.0%
72.0%
74.0%
76.0%
78.0%
80.0%
82.0%
84.0%
86.0%
88.0%
90.0%
0
500
1,000
1,500
2,000
2,500
3,000
3,500
4,000
4,500
2013 2014 2015 2016
Applications and Admissions for End of Fourth Week in Fall Terms 2013-2016
Applied Admitted Percentage Admitted

ENROLLMENT TRENDS
Office of Institutional Research Page 15 of 55
2006 2007 2008 2009 2010 2011 2012 2013 2014 2015 2016% Change from
2015 to 2016Total Fall Headcount 5,002 4,836 5,085 5,103 6,444 6,745 6,477 6,097 6,186 6,200 6,088 -1.8%Fall FTE Enrollment 3,761 3,766 3,854 3,929 4,527 4,679 4,572 4,334 4,343 4,402 4,293 -2.5%
* Source SOU Institutional Research** FTE does not include Nursing Enrollment*** Starting in 2010, Advanced Southern Credit students were admitted in Fall instead of Winter
Fall 2016 Headcount and FTE Enrollment
5,002 4,836 5,085 5,103
6,4446,745
6,4776,097 6,186 6,200
6,088
3,761 3,766 3,854 3,9294,527 4,679 4,572 4,334 4,343 4,402 4,293
0
1,000
2,000
3,000
4,000
5,000
6,000
7,000
8,000
2006 2007 2008 2009 2010 2011 2012 2013 2014 2015 2016
Fall Headcount and Annual FTE Enrollment per Year
Total Fall Headcount Fall FTE Enrollment

ENROLLMENT TRENDS
Office of Institutional Research Page 16 of 55
2013 2014 2015 2016% Change from
2015 to 2016Freshman 912 1,030 1,124 942 -16.2%Sophomore 795 796 835 877 5.0%Junior 1,143 1,067 1,095 1,068 -2.5%Senior 1,464 1,365 1,268 1,313 3.5%Postbaccalaureate Nongraduate 121 141 115 92 -20.0%Nonadmit Undergraduate 1,049 1,045 1,081 1,166 7.9%
Subtotal Undergraduate 5,484 5,444 5,518 5,458 -1.1%
Master's 353 370 350 322 -8.0%Postbaccalaureate Graduate 83 90 54 45 -16.7%Nonadmit Graduate 177 282 278 263 -5.4%
Subtotal Graduate 613 742 682 630 -7.6%
Grand Total 6,097 6,186 6,200 6,088 -1.8%
* Source SOU Institutional Research
Fall Enrollment by Student Level
6,097 6,186 6,200 6,088
0
1,000
2,000
3,000
4,000
5,000
6,000
7,000
2013 2014 2015 2016
Fall Enrollment per Year by Student Level
Nonadmit Graduate
Postbaccalaureate Graduate
Master's
Nonadmit Undergraduate
Postbaccalaureate Nongraduate
Senior
Junior
Sophomore
Freshman

ENROLLMENT TRENDS
Office of Institutional Research Page 17 of 55
2013 2014 2015 2016% Change from
2015 to 2016American Indian/Alaskan Native 71 59 57 56 -1.8%Asian/Pacific Islander 120 124 136 130 -4.4%Black 107 116 125 112 -10.4%Hispanic 454 481 529 539 1.9%
Subtotal All Minorities 752 780 847 837 -1.2%
White 3,341 3,552 3,103 2,946 -5.1%Declined to Respond or Unknown 2,004 2,181 2,250 2,305 2.4%
Grand Total 6,097 6,513 6,200 6,088 -1.8%
* Source SOU Institutional Research
Fall Enrollment by Racial/Ethnic Group
752780
847837
0
100
200
300
400
500
600
700
800
900
2013 2014 2015 2016
Fall Enrollment per Year byMinority Racial/Ethnic Group
Hispanic
Black
Asian/Pacific Islander
America Indian/Alaska Native

ENROLLMENT TRENDS
Office of Institutional Research Page 18 of 55
2013 2014 2015 2016% Change from
2015 to 2016Male
Undergraduate 1,934 1,876 1,823 1,748 -4.1%Graduate 160 142 146 117 -19.9%Non Admit Undergrad 372 372 398 439 10.3%Non Admit Graduate 60 89 66 55 -16.7%
Total 2,526 2,479 2,433 2,359 -3.0%
FemaleUndergraduate 2,473 2,495 2,592 2,525 -2.6%Graduate 275 316 256 250 -2.3%Non Admit Undergrad 628 621 635 656 3.3%Non Admit Graduate 99 138 139 123 -11.5%
Total 3,475 3,570 3,622 3,554 -1.9%
* Source SOU Institutional Research** SOU Permits individuals to report gender as Other or Unknown
Gender by Student Level
3,475 3,570 3,622 3,554
2,526 2,479 2,433 2,359
0
500
1,000
1,500
2,000
2,500
3,000
3,500
4,000
2013 2014 2015 2016
Fall Enrollment per Year by Gender
Female
Male

ENROLLMENT TRENDS
Office of Institutional Research Page 19 of 55
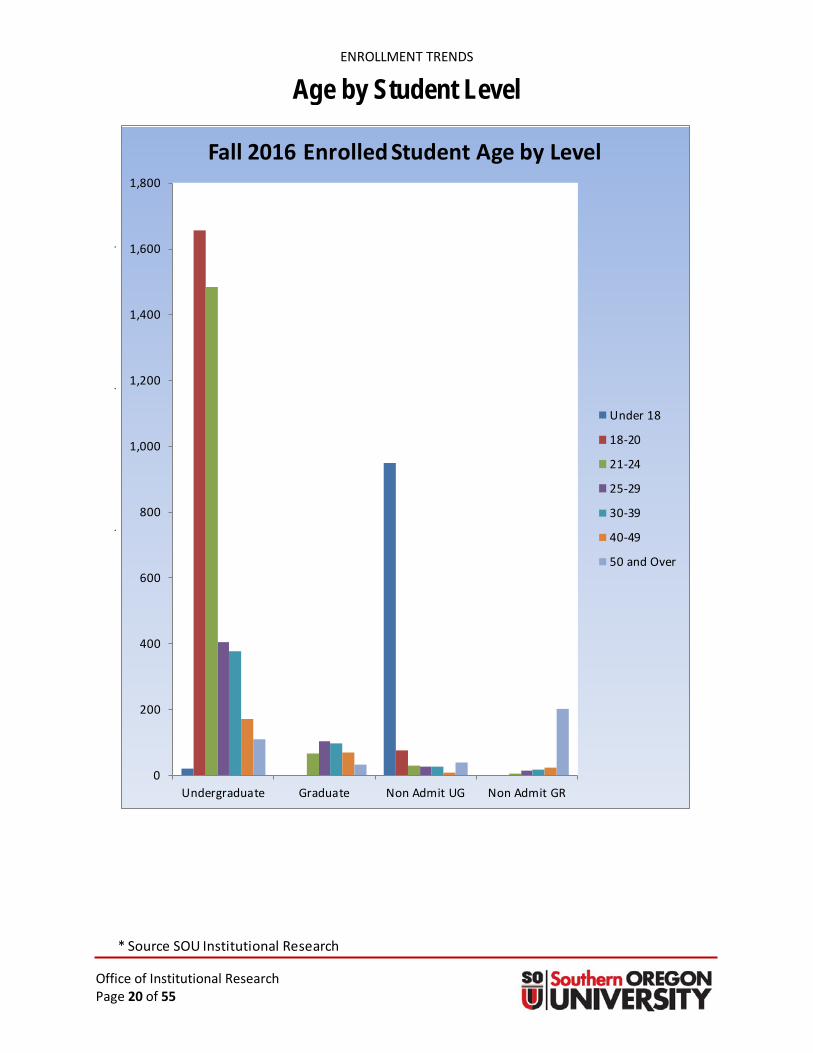
2013 2014 2015 2016 2013 2014 2015 2016Under 18 18-20
Undergraduate 22 24 30 21 Undergraduate 1,566 1,649 1,801 1,656Graduate - - - - Graduate - - - -Non Admit UG 812 798 868 950 Non Admit UG 83 88 66 76Non Admit GR - - - - Non Admit GR - - - -
Total 834 822 898 971 Total 1,649 1,737 1,867 1,732
21-24 25-29Undergraduate 1,519 1,448 1,444 1483 Undergraduate 486 483 463 405Graduate 69 99 64 65 Graduate 99 96 105 102Non Admit UG 32 32 31 31 Non Admit UG 30 31 26 27Non Admit GR 7 5 8 5 Non Admit GR 14 24 14 13
Total 1,627 1,584 1,547 1,584 Total 629 634 608 547
30-39 40-49Undergraduate 469 469 391 377 Undergraduate 234 219 183 170Graduate 129 127 111 98 Graduate 83 92 74 70Non Admit UG 38 34 26 25 Non Admit UG 14 10 10 8Non Admit GR 15 25 16 17 Non Admit GR 12 20 15 24
Total 651 655 544 517 Total 343 341 282 272
50 and OverUndergraduate 128 107 109 109Graduate 54 46 50 32Non Admit UG 34 47 45 38Non Admit GR 129 208 225 203
Total 345 408 429 382
* Source SOU Institutional Research
Age by Student Level
ENROLLMENT TRENDS
Office of Institutional Research Page 20 of 55
* Source SOU Institutional Research
Age by Student Level
0
200
400
600
800
1,000
1,200
1,400
1,600
1,800
Undergraduate Graduate Non Admit UG Non Admit GR
Fall 2016 Enrolled Student Age by Level
Under 18
18-20
21-24
25-29
30-39
40-49
50 and Over

ENROLLMENT TRENDS
Office of Institutional Research Page 21 of 55
2013 2014 2015 2016Freshman 19.4 19.6 19.4 19.4Sophomore 22.7 22.4 21.4 21.7Junior 25.7 25.9 25.1 25.1Senior 29.0 28.7 27.7 27.8Postbacc Nongraduate 35.0 35.8 35.1 37.1Non-Admit Undergraduate 19.8 20.7 20.2 19.6
Average Undergraduate 24.1 24.1 24.2 24.2
Graduate Masters 34.5 33.4 33.9 33.1Postbacc Graduate 41.0 40.8 44.8 44.0Non-Admit Graduate 62.5 62.3 64.1 57.4
Average Graduate 48.4 46.2 43.4 45.3
* Source SOU Institutional Research** Age at of Start of Term
Average Age by Student Level
1922
2528
37
20
33
44
57
0
10
20
30
40
50
60
70
2016
Average Age of Students by LevelStart of Fall 2016
Freshman
Sophomore
Junior
Senior
Postbacc Nongraduate
Non-Admit Undergraduate
Graduate Masters
Postbacc Graduate
Non-Admit Graduate

ENROLLMENT TRENDS
Office of Institutional Research Page 22 of 55
2013 2014 2015 2016% Change from
2015 to 2016Part Time
Undergraduate 885 938 904 866 -4.2%Graduate 235 241 168 132 -21.4%Non Admit UG 932 869 960 1,058 10.2%Non Admit GR 168 274 260 256 -1.5%
Total 2,220 2,322 2,292 2,312 0.9%
Full TimeUndergraduate 3,550 3,461 3,533 3,426 -3.0%Graduate 201 219 236 235 -0.4%Non Admit UG 117 176 121 108 -10.7%Non Admit GR 9 8 18 7 -61.1%
Total 3,877 3,864 3,908 3,776 -3.4%
Percent Part Time 36.4% 37.5% 37.0% 38.0%
* Source SOU Institutional Research
Fall Enrollment by FT/PT Status
2,220 2,322 2,292 2,312
3,877 3,864 3,9083,776
0
500
1,000
1,500
2,000
2,500
3,000
3,500
4,000
4,500
2013 2014 2015 2016
Fall Enrollment per Year by FT/PT Status
Part Time Full Time

ENROLLMENT TRENDS
Office of Institutional Research Page 23 of 55
N % N % N %Biological Sciences 276.7 6.9% 5.0 1.7% 281.7 6.6%Business 391.1 9.8% 42.3 14.5% 433.4 10.1%Comm/Journalism 196.0 4.9% 1.3 0.4% 197.3 4.6%Computer Science 92.3 2.3% 1.7 0.6% 94.0 2.2%Education 165.5 4.1% 164.8 56.7% 330.3 7.7%Environmental Studies 149.5 3.7% 16.7 5.7% 166.2 3.9%Health Education1 83.1 2.1% 0.0 0.0% 83.1 1.9%Humanities/Fine Arts 725.5 18.1% 8.5 2.9% 734.0 17.1%Math 306.7 7.7% 1.7 0.6% 308.4 7.2%Physical Sciences 199.6 5.0% 0.0 0.0% 199.6 4.6%Social Sciences 571.3 14.3% 0.7 0.2% 572.0 13.3%Other2 845.5 21.1% 48.1 16.5% 893.6 20.8%
Total 4,002.8 100.0% 290.8 100.0% 4,293.6 100.0%
1 Excludes Nursing FTE
* Source SOU Institutional Research** Total FTE is slightly different from FTE reported elsewhere due to timing
Total
2 "Other" includes area, ethnic, cultural, gender, and group studies; family and consumer sciences/human sciences; library science; military science, leadership, and operational art; multi/interdisciplinary studies; park, recreation, leisure, and fitness studies; science technologies/technicians; homeland security, law enforement, firefighting, and related protective services; engineering and engineering tech; and public administration and social service professions.
Fall 2016 FTE Enrollment by DisciplineUndergraduate Graduate
282
433
197
94
330
16683
734
308
200
572
894
0
100
200
300
400
500
600
700
800
900
1,000
Fall 2016 FTE Enrollment by Discipline
Graduate
Undergraduate

ENROLLMENT TRENDS
Office of Institutional Research Page 24 of 55
2013 2014 2015 2016Biological Sciences 238.2 238.2 256.8 281.7Business 459.7 459.7 462.1 433.4Comm/Journalism 176.4 176.4 190.0 197.3Computer Science 93.4 93.4 87.7 94.0Education 313.2 313.2 324.9 330.3Environmental Studies 144.6 144.6 117.5 166.1Health Education1 85.6 85.6 82.9 83.1Humanities/Fine Arts 903.7 903.7 793.1 733.5Math 300.4 300.4 315.8 307.9Physical Sciences 196.8 196.8 231.5 199.6Social Sciences 718.4 718.4 595.7 572.0Other2 727.6 727.6 945.8 893.6
Total 4,358.0 4,358.0 4,403.8 4,292.5
1 Excludes Nursing FTE
* Source SOU Institutional Research** Total FTE is slightly different from FTE reported elsewhere due to timing
Fall FTE Enrollment by Discipline
2 "Other" includes area, ethnic, cultural, gender, and group studies; family and consumer sciences/human sciences; library science; military science, leadership, and operational art; multi/interdisciplinary studies; park, recreation, leisure, and fitness studies; science technologies/technicians; homeland security, law enforement, firefighting, and related protective services; engineering and engineering tech; and public administration and social service professions.
0
100
200
300
400
500
600
700
800
900
1,000
Fall FTE Enrollment by Discipline Per Year
2013
2014
2015
2016
ENROLLMENT TRENDS
Office of Institutional Research Page 25 of 55
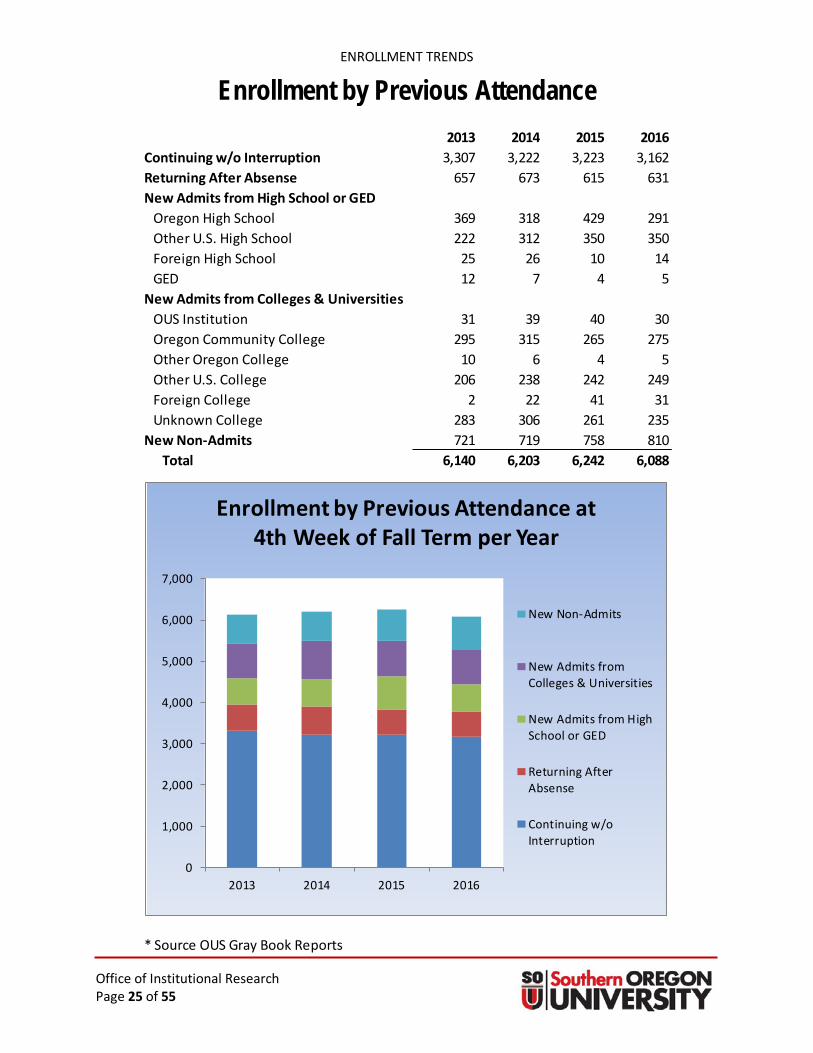
2013 2014 2015 2016Continuing w/o Interruption 3,307 3,222 3,223 3,162Returning After Absense 657 673 615 631New Admits from High School or GED 628 663 793 660
Oregon High School 369 318 429 291Other U.S. High School 222 312 350 350Foreign High School 25 26 10 14GED 12 7 4 5
New Admits from Colleges & Universities 827 926 853 825OUS Institution 31 39 40 30Oregon Community College 295 315 265 275Other Oregon College 10 6 4 5Other U.S. College 206 238 242 249Foreign College 2 22 41 31Unknown College 283 306 261 235
New Non-Admits 721 719 758 810Total 6,140 6,203 6,242 6,088
* Source OUS Gray Book Reports
Enrollment by Previous Attendance
0
1,000
2,000
3,000
4,000
5,000
6,000
7,000
2013 2014 2015 2016
Enrollment by Previous Attendance at 4th Week of Fall Term per Year
New Non-Admits
New Admits fromColleges & Universities
New Admits from HighSchool or GED
Returning AfterAbsense
Continuing w/oInterruption

ENROLLMENT TRENDS
Office of Institutional Research Page 26 of 55
2013 2014 2015 2016Baker 4 5 3 2Benton 28 24 20 24Clackamas 126 124 140 133Clatsop 11 11 13 9Columbia 11 12 15 11Coos 65 81 67 53Crook 5 8 7 4Curry 30 26 17 15Deschutes 110 123 128 166Douglas 116 114 106 149GilliamGrant 2 3 2 2Harney 4 3 4 1Hood River 3 3 5 6Jackson 2,609 2,687 2,556 2,409Jefferson 7 3 4 3Josephine 375 371 383 393Klammath 125 128 136 139Lake 5 6 6 6Lane 154 126 115 112Lincoln 5 3 11 8Linn 27 26 19 22Malheur 6 6 9 7Marion 78 62 65 61Morrow 3 2 2 2Multnomah 164 180 195 185Polk 16 12 9 11Sherman 1Tillamook 5 2 1 3Umatilla 11 11 8 4Union 5 6 4 3Wallowa 2 3 3Wasco 6 8 4 3Washington 156 169 160 141Wheeler 1Yamhill 31 26 20 20Unknown County 1
Total Oregon 4,307 4,374 4,238 4,238
* Source SOU Institutional Research
Enrollment by Geographic Origin

ENROLLMENT TRENDS
Office of Institutional Research Page 27 of 55
continued…2013 2014 2015 2016
State of Washington 152 162 152 149State of California 913 1,016 1,135 1,223State of Idaho 24 26 32 34State of Alaska 94 75 80 67State of Hawaii 87 104 117 118Other U.S. States 240 261 261 226Foreign 160 154 156 158Unknown Geog. Source 120 14 29 6
Total Other 1,790 1,812 1,962 1,981
Grand Total 6,097 6,186 6,200 6,219
* Source SOU Institutional Research
Enrollment by Geographic Origin
Oregon, 4,238
Washington,148
California, 1,223
Idaho, 34
Alaska, 67
Hawaii, 118
Other U.S. States, 226 Foreign, 158
Enrollment by Geographic Origin Fall 2016
ENROLLMENT TRENDS
Office of Institutional Research Page 28 of 55
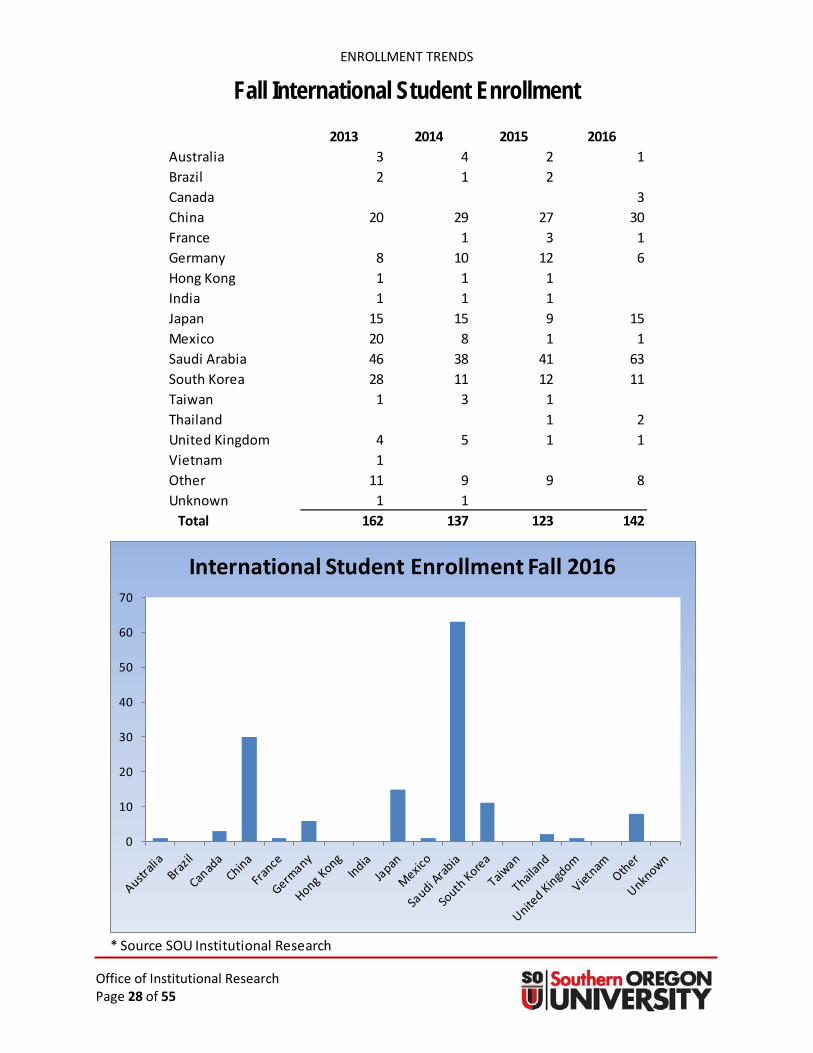
2013 2014 2015 2016Australia 3 4 2 1Brazil 2 1 2Canada 3China 20 29 27 30France 1 3 1Germany 8 10 12 6Hong Kong 1 1 1India 1 1 1Japan 15 15 9 15Mexico 20 8 1 1Saudi Arabia 46 38 41 63South Korea 28 11 12 11Taiwan 1 3 1Thailand 1 2United Kingdom 4 5 1 1Vietnam 1Other 11 9 9 8Unknown 1 1
Total 162 137 123 142
* Source SOU Institutional Research
Fall International Student Enrollment
0
10
20
30
40
50
60
70
International Student Enrollment Fall 2016

ENROLLMENT TRENDS
Office of Institutional Research Page 29 of 55
2010 2011 2012 2013 2014 2015 2016Blue Mountain 1 1 1 2Central 13 10 10 14 13 8 7Chemeketa 12 13 10 12 14 8 10Clackamas 8 9 6 4 9 11 7Clatsop 2 5 1 1 4Klamath 8 9 12 7 7 13 25Lane 23 28 19 24 10 11 16Linn-Benton 4 9 8 4 4 7 3Mt. Hood 5 3 6 13 7 3 7PCC 31 26 17 30 17 14 7Southwestern 17 18 16 10 15 14 16Treasure Valley 1 3 2 1 2Umpqua 16 39 16 23 20 17 17RCC 146 211 186 153 194 155 160
Total Oregon CC 287 384 310 295 315 265 275
* Source OUS Gray Book Reports
Fall Transfers From Community Colleges
0
5
10
15
20
25
30
35
Transfers from Community Colleges excluding RCC during Fall 2013-2016
2013
2014
2015
2016

ENROLLMENT TRENDS
Office of Institutional Research Page 30 of 55
2010 2011 2012 2013 2014 2015 2016EUO 3 1 1 1 3 5 2OIT 10 5 5 3 5 6 2OSU 16 15 16 7 5 9 7PSU 13 7 8 6 9 9 6UO 15 10 17 7 9 8 8WOU 5 6 4 6 7 3 4
Subtotal 62 44 51 30 38 40 29
Other InstitutionsOregon CC 287 384 310 295 315 265 275Other Institutions 390 401 484 502 573 524 547
Grand Total 739 829 845 827 926 829 851
* Source OUS Gray Book Reports
Fall Transfers From OUS & Other Institutions
0
1
2
3
4
5
6
7
8
9
10
EUO OIT OSU PSU UO WOU
Fall Transfers from OUS Institutions during 2013-2016
2013
2014
2015
2016

Office of Institutional Research Page 31 of 55
Retention & Graduation

RETENTION & GRADUATION
Office of Institutional Research Page 32 of 55
Cohort 2006 2007 2008 2009 2010 2011 2012 2013 2014 2015N 704 703 675 653 738 709 641 594 630 784Incoming GPA 3.21 3.20 3.24 3.23 3.27 3.25 3.25 3.31 3.31 3.32% Retained at SOU the following Fall 65.6% 66.0% 67.4% 70.4% 69.2% 68.3% 67.4% 73.6% 71.7% 67.7%
* Source SOU Institutional Research
Average GPA and RetentionFirst Time, Full Time, Degree Seeking Freshmen Fall Cohort
3.21 3.20 3.24 3.23 3.27 3.25 3.25 3.31 3.31 3.32
65.6% 66.0% 67.4%70.4% 69.2% 68.3% 67.4%
73.6% 71.7%67.7%
0%
10%
20%
30%
40%
50%
60%
70%
80%
90%
100%
0
0.5
1
1.5
2
2.5
3
3.5
4
2006 2007 2008 2009 2010 2011 2012 2013 2014 2015
Rete
ntio
n Ra
te
Inco
min
g GP
A
Cohort
Incoming GPA and Retention Rate of Freshmen Fall Cohorts
Incoming GPA Retention Rate
RETENTION & GRADUATION
Office of Institutional Research Page 33 of 55
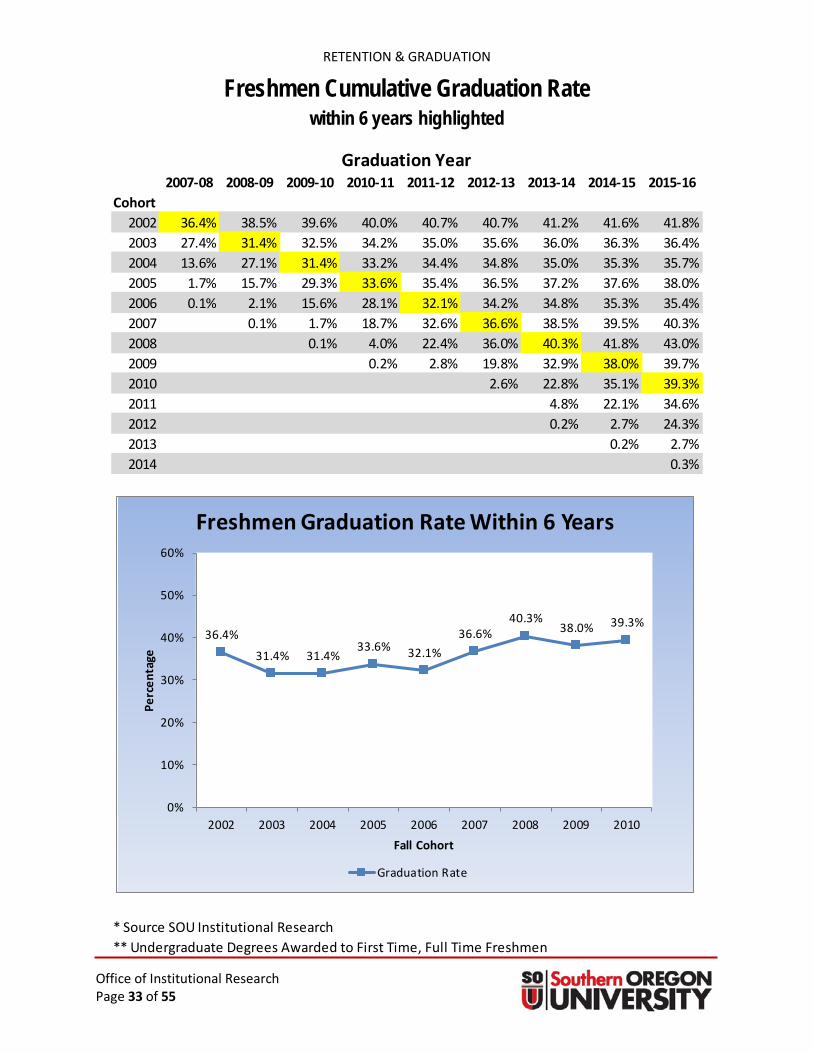
2007-08 2008-09 2009-10 2010-11 2011-12 2012-13 2013-14 2014-15 2015-16Cohort
2002 36.4% 38.5% 39.6% 40.0% 40.7% 40.7% 41.2% 41.6% 41.8%2003 27.4% 31.4% 32.5% 34.2% 35.0% 35.6% 36.0% 36.3% 36.4%2004 13.6% 27.1% 31.4% 33.2% 34.4% 34.8% 35.0% 35.3% 35.7%2005 1.7% 15.7% 29.3% 33.6% 35.4% 36.5% 37.2% 37.6% 38.0%2006 0.1% 2.1% 15.6% 28.1% 32.1% 34.2% 34.8% 35.3% 35.4%2007 0.1% 1.7% 18.7% 32.6% 36.6% 38.5% 39.5% 40.3%2008 0.1% 4.0% 22.4% 36.0% 40.3% 41.8% 43.0%2009 0.2% 2.8% 19.8% 32.9% 38.0% 39.7%2010 2.6% 22.8% 35.1% 39.3%2011 4.8% 22.1% 34.6%2012 0.2% 2.7% 24.3%2013 0.2% 2.7%2014 0.3%
* Source SOU Institutional Research** Undergraduate Degrees Awarded to First Time, Full Time Freshmen
Freshmen Cumulative Graduation Ratewithin 6 years highlighted
Graduation Year
36.4%
31.4% 31.4%33.6% 32.1%
36.6%40.3%
38.0% 39.3%
0%
10%
20%
30%
40%
50%
60%
2002 2003 2004 2005 2006 2007 2008 2009 2010
Perc
enta
ge
Fall Cohort
Freshmen Graduation Rate Within 6 Years
Graduation Rate

RETENTION & GRADUATION
Office of Institutional Research Page 34 of 55
2007-08 2008-09 2009-10 2010-11 2011-12 2012-13 2013-14 2014-15 2015-16Cohort
2002 45.4% 46.2% 46.7% 47.7% 48.1% 48.2% 48.4% 48.7% 49.4%2003 38.3% 40.6% 42.2% 43.2% 43.4% 43.8% 44.3% 44.5% 44.6%2004 37.9% 42.5% 44.6% 45.7% 46.8% 47.0% 47.0% 47.2% 47.5%2005 36.3% 44.2% 49.4% 50.4% 50.8% 51.2% 51.4% 51.7% 51.9%2006 13.3% 30.7% 43.9% 47.1% 49.0% 49.9% 50.8% 51.6% 51.8%2007 0.3% 11.9% 32.3% 44.4% 50.9% 52.4% 53.5% 54.0% 54.2%2008 0.2% 12.1% 32.6% 45.6% 48.2% 50.3% 51.6% 52.3%2009 0.3% 11.8% 33.6% 43.3% 47.3% 49.0% 50.2%2010 1.0% 11.8% 30.4% 42.0% 46.8% 48.6%2011 0.60% 13.8% 32.1% 43.2% 46.6%2012 13.2% 31.0% 42.3%2013 0.3% 13.8% 34.6%2014 0.7% 15.2%
* Source SOU Institutional Research** Undergraduate Degrees Awarded to Transfer Students
Transfer Graduation Ratewithin 6 years highlighted
Graduation Year
45.4%40.6%
44.6%50.4% 49.0%
52.4%
50.3%
49.0% 48.6%
0%
10%
20%
30%
40%
50%
60%
2002 2003 2004 2005 2006 2007 2008 2009 2010
Perc
enta
ge
Cohort
Transfer Graduation Rate Within 6 Years
Graduation Rate

RETENTION & GRADUATION
Office of Institutional Research Page 35 of 55
2012-13 2013-14 2014-15 2015-16Biological/life sciences 22 36 20 31Business/marketing 145 145 139 149Communication/journalism 44 59 57 45Computer and information sciences 34 17 24 11Education 77 76 55 82English 45 31 36 32Foreign languages and literature 17 3 7 10History 21 18 16 13Homeland Security, law enforcement, firefighting, and protective services 69 65 62 48Interdisciplinary studies 18 18 13 17Mathematics and statistics 14 17 13 12Natural resources / environmental science 17 33 32 17Parks and recreation 47 57 67 59Physical sciences 13 21 16 20Psychology 96 84 80 76Social sciences 67 74 57 63Visual and performing arts 59 98 106 119
Total 805 852 800 804
* Source SOU Institutional Research** Note: Primary and Secondary Majors Included Awarded a Degree anytime within the academic year
Undergraduate Degrees Awarded by Major
020406080
100120140160
UG Degrees Awarded During 2015-16

RETENTION & GRADUATION
Office of Institutional Research Page 36 of 55
2012-13 2013-14 2014-15 2015-16Art and Art History 10 16 15 12Biology 10 11 6 5Business Administration 19 28 24 17Chem Physics Materials Engr 11 15 6 9Communication 16 17 17 17Computer Science 4 3 2 1Criminology & Criminal Justice 16 12 11 10Education 9 14 10 23Emerging Media & Digital Arts 19 15 18 14Environmental Studies 3 5 6 6Health, P.E., & Leadership 11 5 10 7History & Political Science 4 6 9 12Lang., Literature & Philosophy 41 54 38 33Mathematics 14 18 11 25Music 2 4 2 3Psychology 67 60 64 52Social Sci., Policy, & Culture 58 39 40 37Theatre Arts 3 12 7
Total 314 325 301 290
* Source SOU Institutional Research** Note: Primary and Secondary Minors Included Awarded a Minor any time within the academic year
Minor Degrees Awarded
0
10
20
30
40
50
60
Minors Awarded During 2015-2016

RETENTION & GRADUATION
Office of Institutional Research Page 37 of 55
2012-13 2013-14 2014-15 2015-16
Male 316 349 333 327American Indian/Alaskan Native 4 5 3 3Asian/Pacific Islander 10 10 7 13Black 4 6 9 5Hispanic 22 29 24 24White 245 242 231 210Other1 31 57 59 72
Female 485 499 458 473American Indian/Alaskan Native 9 10 15 4Asian/Pacific Islander 18 10 11 8Black 5 1 9 5Hispanic 43 44 35 48White 362 363 327 323Other1 48 71 61 85
* Source SOU Institutional Research1Includes Multiple Ethnicities, Declined to Respond, Unknown, or None of the Above** Note: Primary and Secondary Majors Included Awarded a Degree within the Academic Year
Undergraduate Degrees Awarded by Ethnicity and Gender
316349 333 327
485 499458 473
0
100
200
300
400
500
600
2012-13 2013-14 2014-15 2015-16
Total Undergraduate Degrees Awarded by Gender per Year
Male Female
Office of Institutional Research Page 38 of 55
Tuition & Financial Aid

TUITION & FINANCIAL AID
Office of Institutional Research Page 39 of 55
2006-07 2007-08 2008-09 2009-10 2010-11 2011-12 2012-13 2013-14 2014-15 2015-16 2016-17% Change
from 2015-16Undergraduate
Resident 5,233 5,502 5,718 6,252 6,795 7,215 7,521 7,794 7,720 8,145 8,523 4.6%Non-Resident 16,918 17,580 18,264 19,914 20,430 20,490 20,238 21,278 21,296 22,365 23,170 3.6%
GraduateResident 10,186 10,632 1,169 11,919 12,195 14,190 14,298 15,029 15,047 15,822 16,002 1.1%Non-Resident 16,882 17,553 18,324 18,810 19,005 17,790 17,538 18,437 18,455 19,422 19,602 0.9%
*based upon 15 credit hours for undergraduates and 12 credit hours for graduates
2006-07 2007-08 2008-09 2009-10 2010-11 2011-12 2012-13 2013-14 2014-15 2015-16 2016-17% Change
from 2015-16
UndergraduateResident 5,233 5,305 5,339 5,830 6,258 6,460 6,582 6,655 6,436 6,708 6,872 2.4%Non-Resident 16,918 16,952 17,052 18,571 18,817 18,347 17,712 18,168 17,754 18,418 18,681 1.4%
GraduateResident 10,186 10,252 1,091 11,115 11,232 12,706 12,513 12,832 12,545 13,030 12,902 -1.0%Non-Resident 16,882 16,925 17,108 17,541 17,504 15,929 15,349 15,742 15,386 15,995 15,804 -1.2%
*Source OUS Fact Book & SOU Enrollment Services**Inflation adjustment indexed against the Portland-Salem Consumer Price Index
Annual Tuition and Fee Rates
Inflation Adjusted Against 2006-07 Dollars

TUITION & FINANCIAL AID
Office of Institutional Research Page 40 of 55
*Source OUS Fact Book & SOU Financial Aid**Inflation adjustment indexed against the Portland-Salem Consumer Price Index
Annual Tuition and Fee Rates
$5,233
$8,523
$6,872
0
1,000
2,000
3,000
4,000
5,000
6,000
7,000
8,000
9,000
Resident Undergraduate Tuition and Fee RatesActual and Adjusted for Inflation
Actual
Inflation Adjusted

TUITION & FINANCIAL AID
Office of Institutional Research Page 41 of 55
2006-07 2007-08 2008-09 2009-10 2010-11 2011-12 2012-13 2013-14 2014-15 2015-16 2016-17% Change
from 2015-16Resident Tuition and Fees 5,233 5,409 5,718 6,252 6,795 7,215 7,521 7,794 7,720 8,010 8,523 6.4%Room and Board 7,404 7,941 8,418 8,454 8,508 9,240 9,651 11,340 11,682 12,033 12,540 4.2%Books and Supplies 1,200 1,350 1,350 1,350 1,350 1,260 900 1,029 960 999 999 0.0%Personal Expenses (incl Transportation) 3,300 3,600 3,750 3,750 3,750 2,484 2,685 2,685 2,685 3,252 3,252 0.0%
Total 17,137 18,300 19,236 19,806 20,403 20,199 20,757 22,848 23,047 24,294 25,314 4.2%
2006-07 2007-08 2008-09 2009-10 2010-11 2011-12 2012-13 2013-14 2014-15 2015-16 2016-17% Change
from 2015-16Resident Tuition and Fees 5,233 5,216 5,339 5,830 6,258 6,460 6,582 6,655 6,436 6,597 6,872 4.2%Room and Board 7,404 7,657 7,860 7,884 7,836 8,274 8,446 9,682 9,739 9,910 10,110 2.0%Books and Supplies 1,200 1,302 1,260 1,259 1,243 1,128 788 879 800 823 805 -2.1%Personal Expenses (incl Transportation) 3,300 3,471 3,501 3,497 3,454 2,224 2,350 2,293 2,238 2,678 2,622 -2.1%
Total 17,137 17,646 17,960 18,470 18,792 18,086 18,166 19,508 19,214 20,007 20,409 2.0%
*Source OUS Fact Book and SOU Enrollment Services**Inflation adjustment indexed against the Portland-Salem Consumer Price Index
Student Budget Breakdown for Resident Undergraduates
Inflation Adjusted Against 2006-07 Dollars

TUITION & FINANCIAL AID
Office of Institutional Research Page 42 of 55
*Source OUS Fact Book & SOU Financial Aid Office**Inflation adjustment indexed against the Portland-Salem Consumer Price Index
Student Budget Breakdown for Resident Undergraduates
$17,137
$25,314
$20,409
0
5,000
10,000
15,000
20,000
25,000
30,000
Student Budget per YearActual and Adjusted for Inflation
Actual
Inflation Adjusted

TUITION & FINANCIAL AID
Office of Institutional Research Page 43 of 55
2013-14 2014-15 2015-16 2016-17Scholarships/GrantsFederal 10,245,665$ 9,608,866$ 9,589,555$ 8,193,303$ State 1,629,193 1,626,167 1,894,101 2,041,125 Institutional 950,514 872,739 3,950,439 3,255,479 External Sources 1,758,177 1,530,748 626,030 497,247
Total Scholarships/Grants 14,583,549 13,638,520 16,060,125 13,987,154
Self-HelpStudent Loans 27,954,370 25,792,375 16,543,483 16,718,331 Federal Work-Study 568,738 455,131 205,646 263,219 State and other - - - -
Total Self-Help 28,523,108 26,247,506 16,749,129 16,981,550
OtherParent Loans 13,009,350 14,472,414 8,887,777 5,710,042 Tuition Waivers 3,239,752 2,956,469 3,587,221 3,031,877 Athletic Awards 498,895 511,987 467,841 382,350
Total Other 16,747,997 17,940,870 12,942,839 9,124,269
Grand Total 59,854,654$ 57,826,896$ 45,752,093$ 40,092,973$
* Source SOU Financial Aid
Financial Aid Awards
0
$10M
$20M
$30M
$40M
$50M
$60M
$70M
2013-14 2014-15 2015-16 2016-17
Total Financial Aid Awards per Year
Other
Self-Help
Scholarships/Grants

TUITION & FINANCIAL AID
Office of Institutional Research Page 44 of 55
2007-08 2008-09 2009-10 2010-11 2011-12 2012-13 2013-14 2014-15 2015-16Average Debt $17,747 $18,223 $21,180 $21,764 $26,371 $26,820 $26,418 $27,354 $26,590% of Graduates who borrowed 66% 65% 67% 67% 68% 69% 67% 69% 63%
* Source SOU Office of Institutional Research** Students who started at SOU as first time freshmen*** Excludes PLUS loans and private/alternative loans
Average Federal Loan Debt of Graduates by Year
$17,747 $18,223
$21,180 $21,764
$26,371 $26,820 $26,418$27,354 $26,590
66% 65%67% 67% 68% 69%
67%
69%
63%
50%
55%
60%
65%
70%
75%
80%
85%
90%
95%
100%
$0
$5,000
$10,000
$15,000
$20,000
$25,000
$30,000
2007-08 2008-09 2009-10 2010-11 2011-12 2012-13 2013-14 2014-15 2015-16
Average Debt of Graduates and the Percentage of Graduates with Debt by Year
Average Debt % of Graduates who borrowed
Note: Due to large variations in calculating historical student debt, a new methodology was introduced in 2015-16 that only includes students'federal loans once they've been applied to their account receivable
Office of Institutional Research Page 45 of 55
FACULTY & STAFF

FACULTY & STAFF
Office of Institutional Research Page 46 of 55
2013-14 2014-15 2015-16 2016-17Male
Professor 57 50 50 50Associate Professor 27 26 20 17Assistant Professor 12 12 11 13Instructor/Lecturer 33 26 20 21
Total 129 114 101 101
FemaleProfessor 25 27 28 29Associate Professor 29 24 21 20Assistant Professor 12 10 5 11Instructor/Lecturer 25 29 28 21
Total 91 90 82 81
* Source SOU Institutional Research
Instructional Faculty by Gender and Rank
50
17
13
21
29
20
11
21
0
10
20
30
40
50
60
Professor Associate Professor Assistant Professor Instructor/Lecturer
Instructional Faculty by Status and Gender 2016-17
Male Female

FACULTY & STAFF
Office of Institutional Research Page 47 of 55
2013-14 2014-15 2015-16 2016-17Tenured & Tenure Track 72.1% 71.5% 69.5% 78.0%
Professor 84 78 78 77Associate Professor 50 47 40 37Assistant Professor 20 13 10 19Instructor/Lecturer 4 5 2 9
Total 158 143 130 142
Non-Tenured 27.9% 28.5% 30.5% 22.0%Professor - - 2 2Associate Professor 1 1 1 -Assistant Professor 3 5 6 5Instructor/Lecturer 57 51 48 33
Total 61 57 57 40
* Source SOU Institutional Research
Instructional Faculty Rank by Tenure Status
72% 72% 70%
78%
28% 29% 30%
22%
0%
20%
40%
60%
80%
100%
2013-14 2014-15 2015-16 2016-17
Perc
ent o
f Fac
ulty
Instructional Faculty Tenure Status
Tenured & Tenure Track Non-Tenured

FACULTY & STAFF
Office of Institutional Research Page 48 of 55
FT PT FT PT FT PT FT PT74 10 70 8 68 10 70 943 8 41 7 39 2 36 121 1 17 1 16 - 24 -
Instructor/Lecturer 41 21 39 17 37 11 33 97 128 3 126 2 127 - 105
N 197 136 186 168 162 150 163 124% 59.2% 40.8% 52.5% 47.5% 51.9% 48.1% 56.8% 43.2%
* Source SOU Institutional Research
Total
ProfessorAssociate ProfessorAssistant Professor
Other Ranks
Faculty by Full Time/Part Time2016-172015-162013-14 2014-15
197186
162 163
136
168
150
124
0
50
100
150
200
250
2013-14 2014-15 2015-16 2016-17
Instructional Faculty and Other Faculty by Full Time/Part Time
Full Time Part Time

FACULTY & STAFF
Office of Institutional Research Page 49 of 55
FacultyExec/Admin/
MgmtProfessional Non-faculty
Tech/ Paraprof'l
Secty/ Clerical
Skilled Craft
Service/Maint Total
% of Total
American Indian/Alaska NativeMale 1 0 3 0 0 0 1 5 0.68%Female 2 0 4 0 0 0 0 6 0.82%
Subtotal 3 0 7 0 0 0 1 11 1.50%
Asian/Pacific IslanderMale 8 0 5 0 0 1 0 14 1.91%Female 6 0 2 0 0 0 0 8 1.09%
Subtotal 14 0 7 0 0 1 0 22 3.00%
Black/African AmericanMale 0 0 4 0 0 0 0 4 0.54%Female 1 0 1 0 1 0 0 3 0.41%
Subtotal 1 0 5 0 1 0 0 7 0.95%
Hispanic/LatinoMale 5 0 3 1 0 1 2 12 1.63%Female 8 0 4 0 5 0 0 17 2.32%
Subtotal 13 0 7 1 5 1 2 29 3.95%
Multiple EthnicitiesMale 0 0 2 1 0 1 0 4 0.54%Female 1 0 2 0 3 0 0 6 0.82%
Subtotal 1 0 4 1 3 1 0 10 1.36%
* Source SOU Institutional Research
Faculty and Staff by Racial/Ethnic Group and Gender for Fall 2016

FACULTY & STAFF
Office of Institutional Research Page 50 of 55
...continued
FacultyExec/Admin/
MgmtProfessional Non-faculty
Tech/ Paraprof'l
Secty/ Clerical
Skilled Craft
Service/Maint Total
% of Total
Total MinorityMale 14 0 17 2 0 3 3 39 5.31%Female 18 0 13 0 9 0 0 40 5.45%
Subtotal 32 0 30 2 9 3 3 79 10.76%
WhiteMale 126 4 80 21 13 13 30 287 39.10%Female 135 5 112 24 68 1 10 355 48.37%
Subtotal 261 9 192 45 81 14 40 642 87.47%
Other / UnknownMale 2 0 6 1 0 0 0 9 1.23%Female 2 0 2 0 0 0 0 4 0.54%
Subtotal 4 0 8 1 0 0 0 13 1.77%
TotalMale 142 4 103 24 13 16 33 335 45.64%Female 155 5 127 24 77 1 10 399 54.36%
Grand Total 297 9 230 48 90 17 43 734 100.00%
* Source SOU Institutional Research** All Teaching, Administrative, Classified and Unclassified Faculty & Staff Included
Faculty and Staff by Racial/Ethnic Group and Gender for Fall 2016

Office of Institutional Research Page 51 of 55
Financial Summary

FINANCIAL SUMMARY
Office of Institutional Research Page 52 of 55
FY 2013 FY 2014 FY 2015 FY 2016Revenue
Tuition & Fees 43,267,105$ 42,368,667$ 42,362,772$ 45,346,072$ State Appropriation 13,518,004 14,211,725 17,513,658 21,153,931Sales & Service 14,063,091 14,918,333 13,063,860 16,650,224Gifts, Grants, & Contracts 19,646,630 18,304,690 18,657,947 19,671,454Internal Sales 1,553,317 1,951,696 1,395,979 1,483,934Investments 940,332 849,842 988,909 746,943Misc Income 369,975 1,564,798 338,295 843,046
Total 93,358,453 94,169,752 94,321,419 105,895,605
* Source SOU Institutional Research
Source of Funds - Actuals
Tuition & Fees43%
State Appropriation
20%
Sales & Service16%
Gifts, Grants, & Contracts
18%
Internal Sales1%
Investments1% Misc
Income1%
Source of Funds, FY 2016

FINANCIAL SUMMARY
Office of Institutional Research Page 53 of 55
FY 2013 FY 2014 FY 2015 FY 2016Expenses
Faculty/Staff Pay 34,076,109$ 34,289,052$ 33,371,359$ 36,968,975$ Student/Assistant Pay 2,140,257 2,450,194 2,446,646 2,926,814 Other Payroll Expenses 18,081,022 18,436,055 18,166,416 27,353,278 Service & Supplies 25,278,055 22,206,399 24,489,428 29,427,278 Capital Expenses 296,095 389,997 291,144 323,701 Student Aid 14,271,932 14,000,107 13,791,575 14,314,853 Other Expense 600,568 (271,833) (652,508) (957,680)
Total 94,744,038 91,499,971 91,904,058 110,357,219
* Source SOU Institutional ResearchOther Expense Includes Merchandise-resale/Redistribution,Depreciation/Amortization, Indirect Costs, Internal Sales, and Interfund Transfers
Use of Funds - Actuals
Faculty/Staff Pay33%
Student/Assistant Pay3%
Other Payroll Expenses
24%
Service & Supplies
26%
Capital Expenses5%
Student Aid13%
Other Expense-1%
Use of Funds, FY 2016

FINANCIAL SUMMARY
Office of Institutional Research Page 54 of 55
FY 2013 FY 2014 FY 2015 FY 2016Federal Grants & Contracts 12,179,272$ 10,988,145$ 10,444,207$ 10,316,769 State and Local Grants & Contracts 3,006,179 3,043,211 3,029,482 3,350,967 Nongovernmental Grants & Contracts 5,322,140 5,095,204 6,015,171 2,218,764 Overhead Cost Recovery 261,028 334,451 260,750 220,213 Refunds to Grantors (3,865,151) (4,412,242) (4,566,098) (78,793)
Total 16,903,468$ 15,048,770$ 15,183,513$ 16,027,920$
* Source SOU Institutional Research
Grants and Contracts
$12,179,272
$10,988,145 $10,444,207 10,316,769
$-
$2,000,000
$4,000,000
$6,000,000
$8,000,000
$10,000,000
$12,000,000
$14,000,000
FY 2013 FY 2014 FY 2015 FY 2016
Grants and Contracts by Source
Federal State and Local Nongovernmental
FINANCIAL SUMMARY
Office of Institutional Research Page 55 of 55
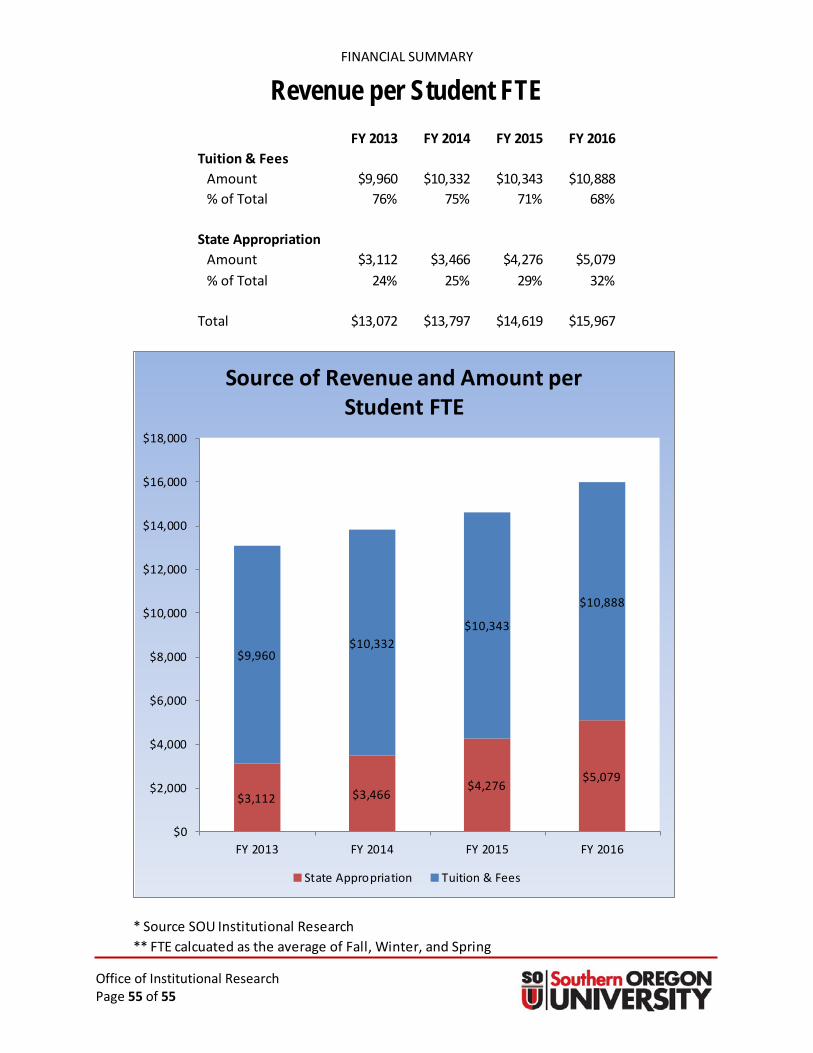
FY 2013 FY 2014 FY 2015 FY 2016Tuition & Fees
Amount $9,960 $10,332 $10,343 $10,888% of Total 76% 75% 71% 68%
State AppropriationAmount $3,112 $3,466 $4,276 $5,079% of Total 24% 25% 29% 32%
Total $13,072 $13,797 $14,619 $15,967
* Source SOU Institutional Research** FTE calcuated as the average of Fall, Winter, and Spring
Revenue per Student FTE
$3,112 $3,466$4,276
$5,079
$9,960$10,332
$10,343
$10,888
$0
$2,000
$4,000
$6,000
$8,000
$10,000
$12,000
$14,000
$16,000
$18,000
FY 2013 FY 2014 FY 2015 FY 2016
Source of Revenue and Amount per Student FTE
State Appropriation Tuition & Fees