Embed Size (px)
Citation preview
Southern Company’s Investigation of BioPower
Southern CompanySouthern Company’’s s Investigation of Investigation of BioPowerBioPower
BioPro Conference
March, 2011
BioPro Conference
March, 2011
CC
OPCO Plant Type
GPC
APC
GULF
MPC
SPC
H Weiss Dam
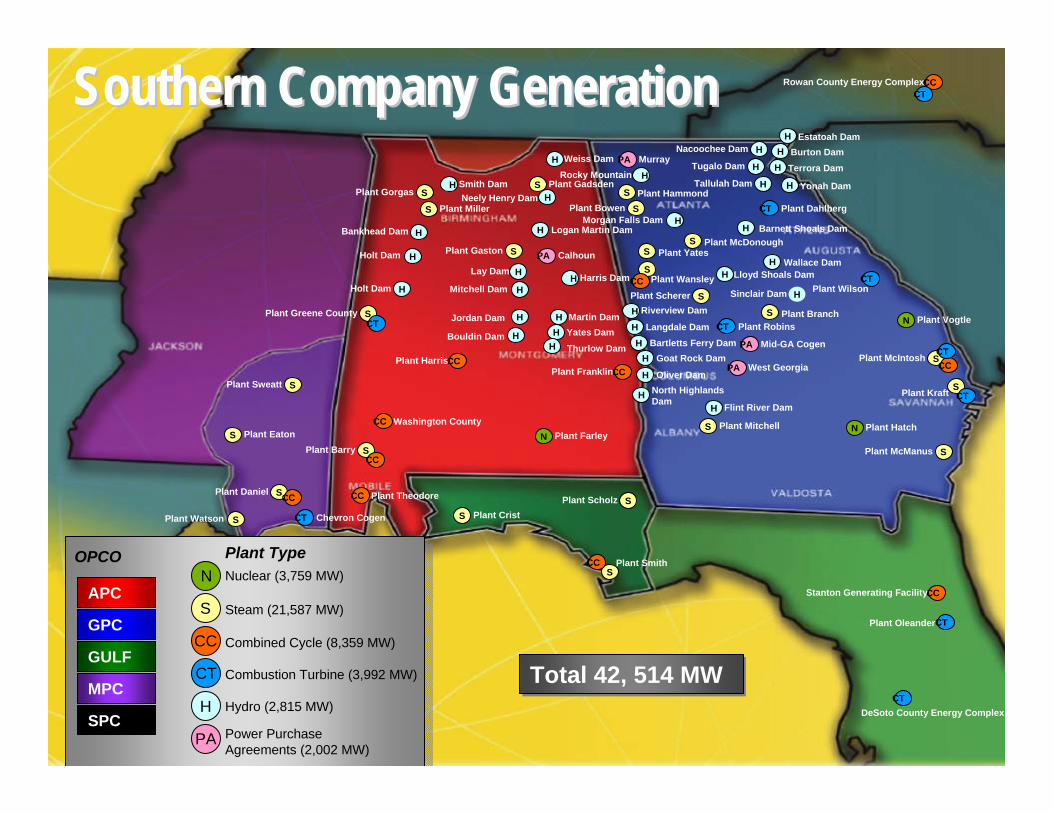
Total 42, 514 MW Total 42, 514 MW
Southern Company GenerationSouthern Company Generation
N
S
Combined Cycle (8,359 MW)
H
CT
PA
Nuclear (3,759 MW)
Steam (21,587 MW)
Combustion Turbine (3,992 MW)
Hydro (2,815 MW)
Power Purchase Agreements (2,002 MW)
HLay Dam
HMitchell Dam
H Martin DamH Yates Dam
H Thurlow Dam
HSinclair Dam
H Logan Martin Dam
HHolt Dam
HNeely Henry Dam
HHolt Dam
HJordan Dam
HBankhead Dam
HBouldin Dam
H Riverview Dam
H Smith Dam
H Harris Dam
HRocky Mountain
HMorgan Falls Dam
H Langdale DamH Bartletts Ferry Dam
H Goat Rock Dam
H Oliver Dam
H North Highlands Dam
H Flint River Dam
H Lloyd Shoals Dam
SPlant McManus
H Wallace Dam
H Barnett Shoals Dam
H Estatoah DamH Burton Dam
H Terrora Dam
H Yonah Dam
HNacoochee Dam
HTugalo Dam
HTallulah DamSPlant Gorgas
N Plant Vogtle
S Plant Miller
SPlant Greene County
S Plant Gadsden
SPlant Bowen
SPlant Gaston
SPlant Barry
SPlant Scholz
S Plant Mitchell
SPlant Wansley
S Plant YatesS Plant McDonough
SPlant Scherer
S Plant Hammond
SPlant McIntosh
SPlant Kraft
SPlant Smith
SPlant Watson
SPlant Daniel
SPlant Sweatt
S Plant Eaton
S Plant Crist
N Plant FarleyN Plant Hatch
S Plant Branch
CCStanton Generating Facility
CC Washington County
CC
CC CC Plant Theodore
CC
CCPlant HarrisCCPlant Franklin
CC
CC
CTDeSoto County Energy Complex
CT Chevron Cogen
CT
CT
CTPlant Wilson
CT Plant Dahlberg
CT Plant RobinsCT
CTPlant Oleander
PA Murray
PA Calhoun
PA Mid-GA Cogen
PA West Georgia
CCRowan County Energy ComplexCT
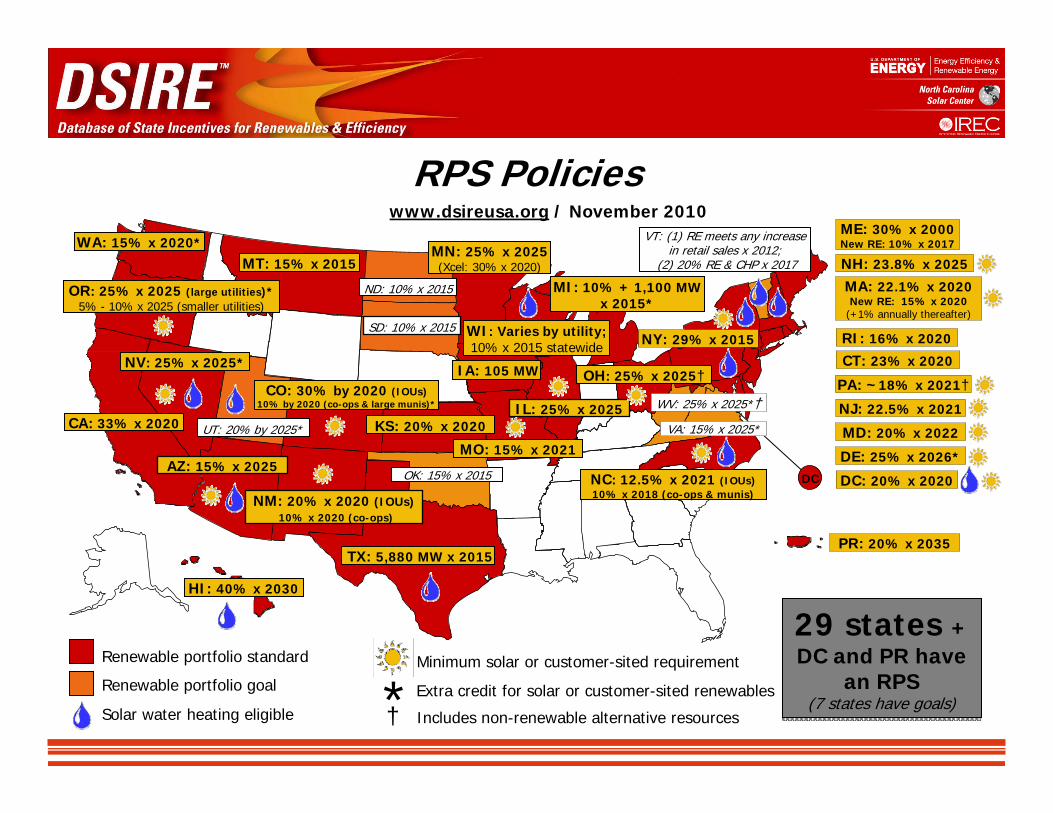
RPS Policies
Renewable portfolio standard
Renewable portfolio goal
www.dsireusa.org / November 2010
Solar water heating eligible *† Extra credit for solar or customer-sited renewables
Includes non-renewable alternative resources
WA: 15% x 2020*
CA: 33% x 2020
NV: 25% x 2025*
AZ: 15% x 2025
NM: 20% x 2020 (IOUs)10% x 2020 (co-ops)
HI: 40% x 2030
Minimum solar or customer-sited requirement
TX: 5,880 MW x 2015
UT: 20% by 2025*
CO: 30% by 2020 (IOUs)10% by 2020 (co-ops & large munis)*
MT: 15% x 2015
ND: 10% x 2015
SD: 10% x 2015
IA: 105 MW
MN: 25% x 2025(Xcel: 30% x 2020)
MO: 15% x 2021
WI: Varies by utility; 10% x 2015 statewide
MI: 10% + 1,100 MW x 2015*
OH: 25% x 2025†
ME: 30% x 2000New RE: 10% x 2017
NH: 23.8% x 2025
MA: 22.1% x 2020 New RE: 15% x 2020
(+1% annually thereafter)
RI: 16% x 2020
CT: 23% x 2020
NY: 29% x 2015
NJ: 22.5% x 2021
PA: ~18% x 2021†
MD: 20% x 2022
DE: 25% x 2026*
DC: 20% x 2020
VA: 15% x 2025*
NC: 12.5% x 2021 (IOUs)10% x 2018 (co-ops & munis)
VT: (1) RE meets any increase in retail sales x 2012;
(2) 20% RE & CHP x 2017
KS: 20% x 2020
OR: 25% x 2025 (large utilities)*5% - 10% x 2025 (smaller utilities)
IL: 25% x 2025 WV: 25% x 2025*†
29 states + DC and PR have
an RPS(7 states have goals)
29 states + DC and PR have
an RPS(7 states have goals)
DCOK: 15% x 2015
PR: 20% x 2035
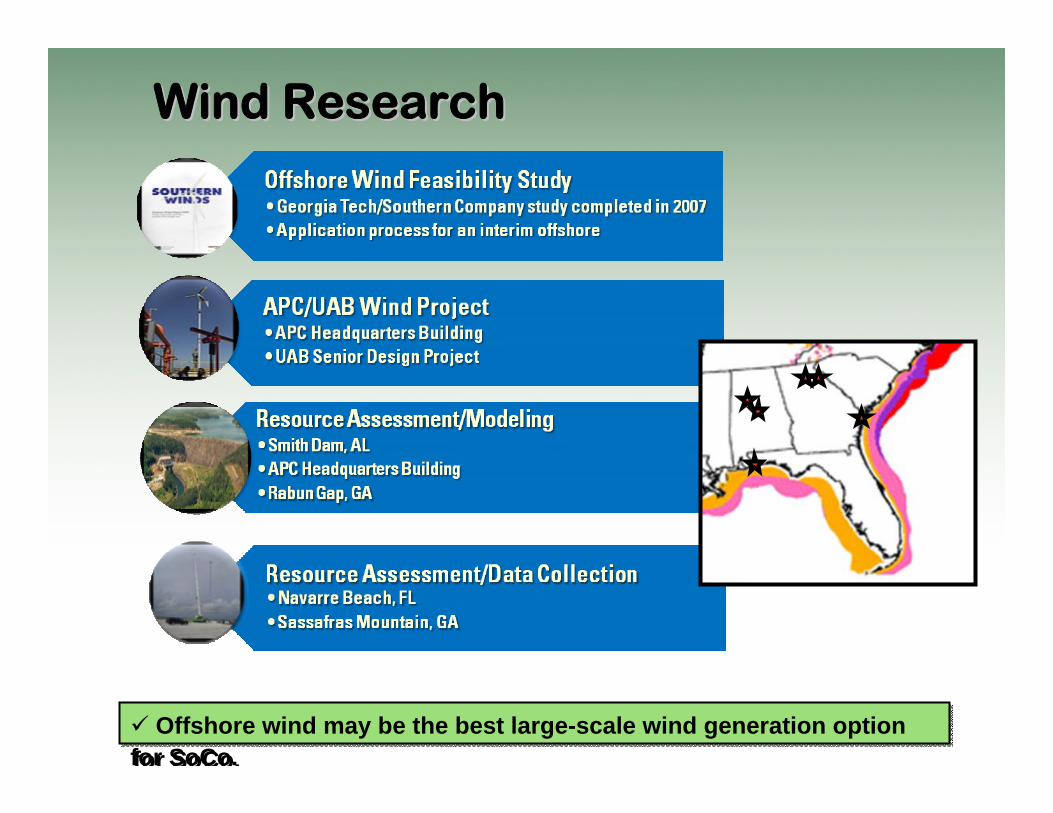
Wind ResearchWind Research
Offshore wind may be the best large-scale wind generation option for SoCo.
Offshore wind may be the best large-scale wind generation option for SoCo.
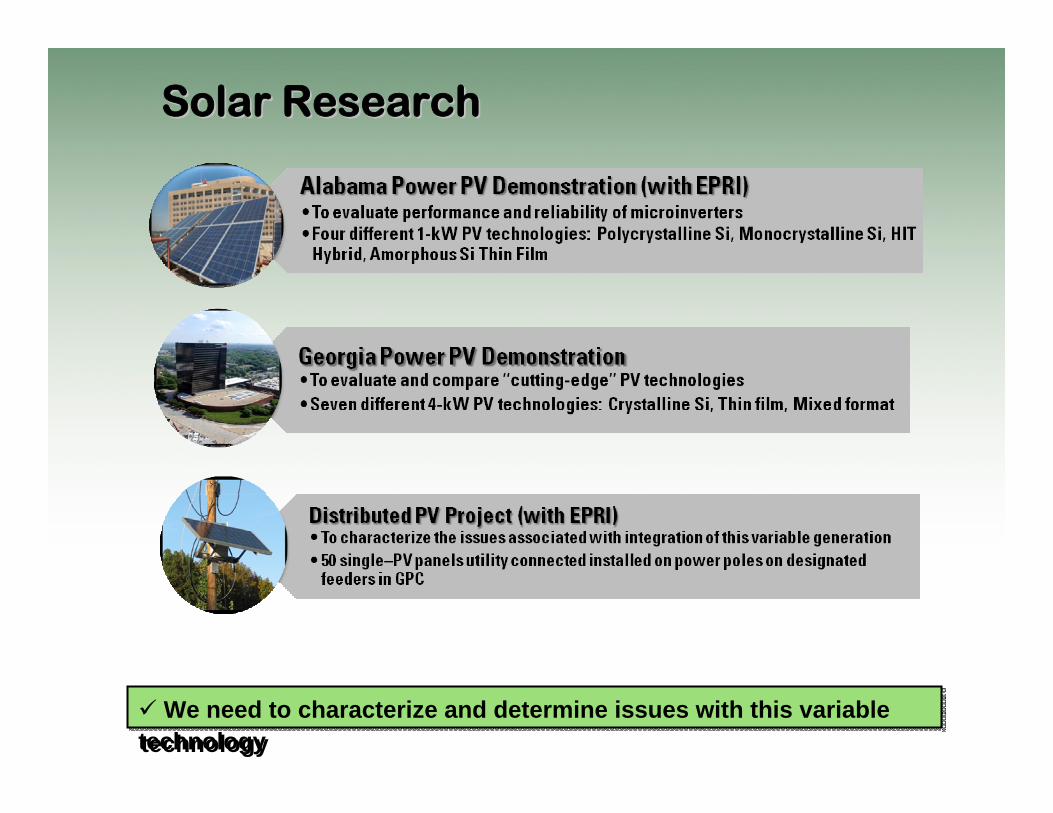
Solar ResearchSolar Research
We need to characterize and determine issues with this variabletechnology
We need to characterize and determine issues with this variabletechnology

Mississippi PowerMississippi Power
Georgia PowerGeorgia Power
BarryBarry
Gadsden Gadsden
MitchellMitchell
Auburn Auburn
Gulf PowerGulf Power
Alabama PowerAlabama Power
Biomass-to-Power Demonstrations
Hammond Hammond
Gaston Gaston
Gorgas Gorgas
Greene County Greene County
Watson Watson Plant MitchellBiomass Conversion
Auburn UniversityBiomass Gasification Project
Plant GadsdenSwitchgrass Co-Firing
Biomass Co-milling tests
SweattSweatt
ScholzScholz
Plants Barry, Scholz, & Sweatt Biomass Conversion Studies

Biomass Co-milling• Biomass co-milling involves
creation of a fuel mix of biomass with coal and sending this mix to the existing fuel handling system
• Advantages• Little or no capital investment• Quick implementation• Low cost fuel
• Disadvantages• Low co-firing %• Fuel handling• Extra pulverizer O&M?• Ash sales
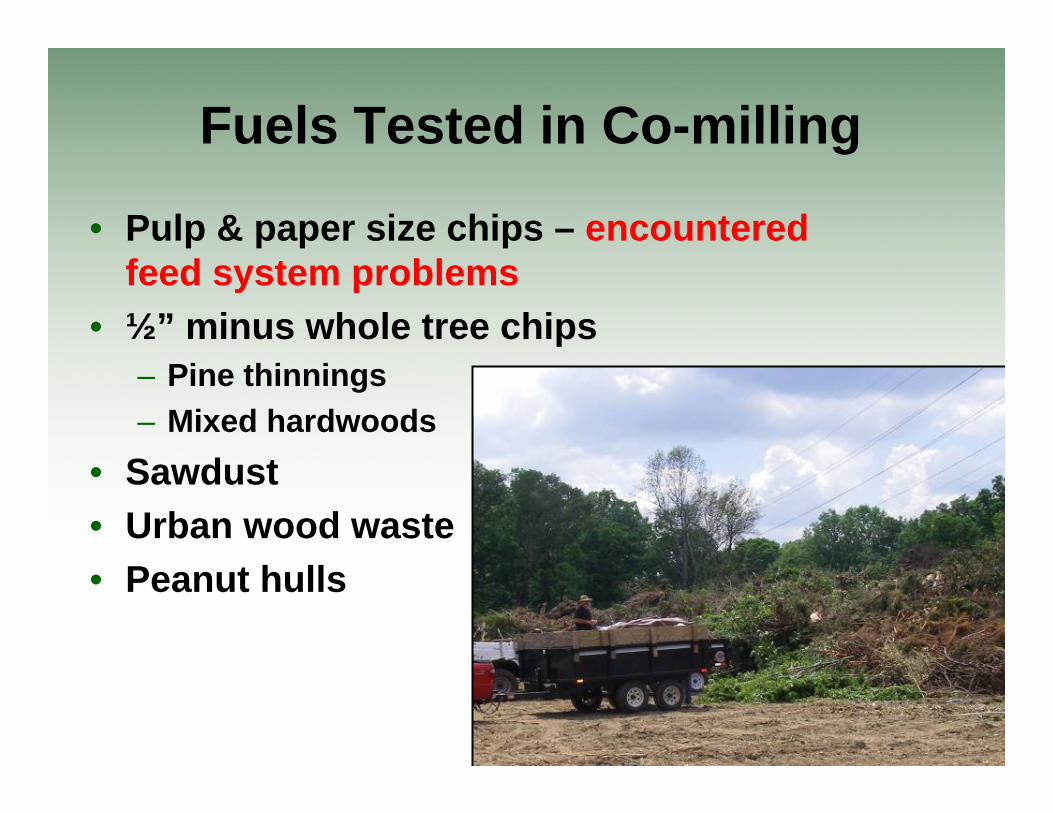
Fuels Tested in Co-milling
• Pulp & paper size chips – encountered feed system problems
• ½” minus whole tree chips– Pine thinnings– Mixed hardwoods
• Sawdust• Urban wood waste• Peanut hulls
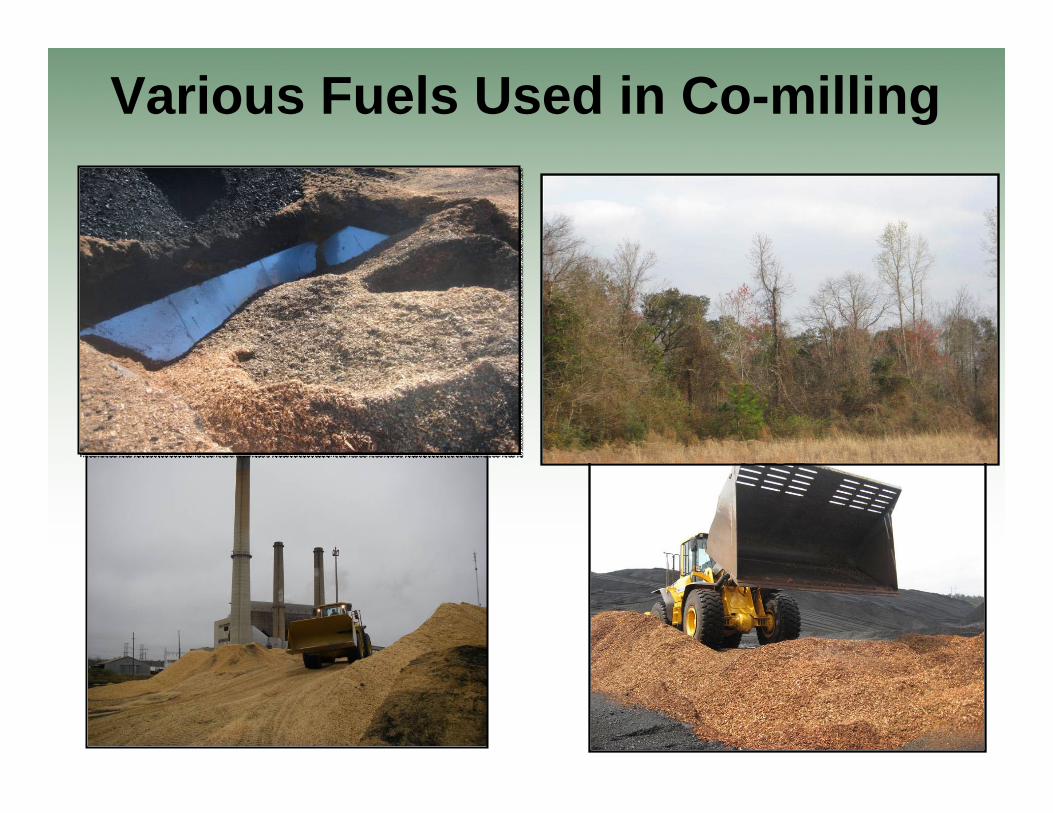
Various Fuels Used in Co-milling
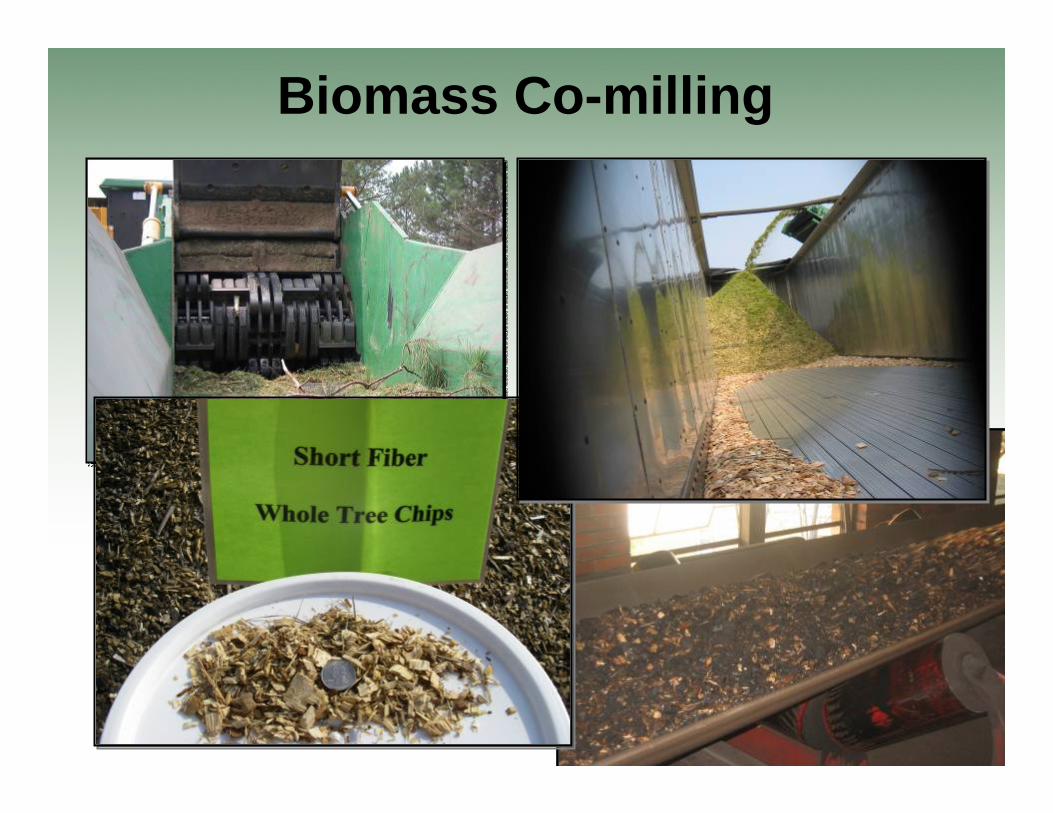
Biomass Co-milling
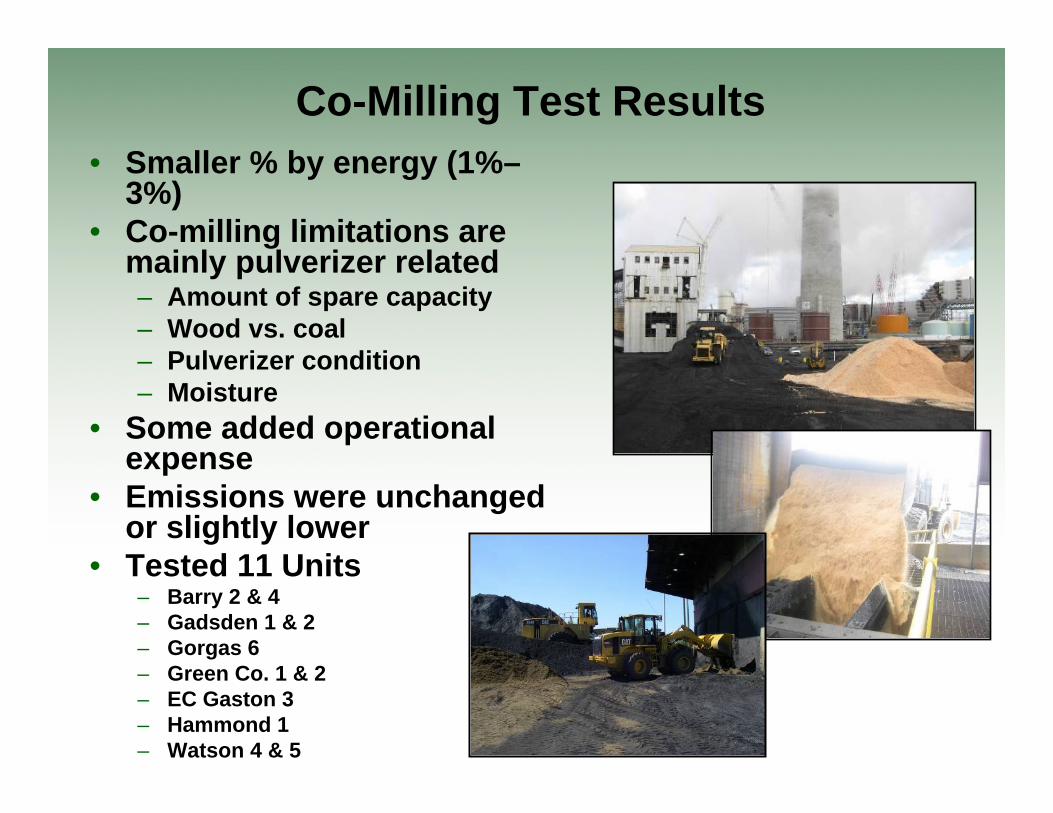
Co-Milling Test Results• Smaller % by energy (1%–
3%)• Co-milling limitations are
mainly pulverizer related– Amount of spare capacity– Wood vs. coal– Pulverizer condition– Moisture
• Some added operational expense
• Emissions were unchanged or slightly lower
• Tested 11 Units– Barry 2 & 4– Gadsden 1 & 2– Gorgas 6– Green Co. 1 & 2– EC Gaston 3– Hammond 1– Watson 4 & 5

Barry 4 Wood Pellet Co-MillingResults• Achieved 7.2% by energy
co-milling at near full load (350 MW)
• New record for Southern Company renewable energy generation at 25 MW
Pellet Disadvantages• Price $10 – 12/MMBtu• Must keep dry• Added capital would be
required for material handling and storage
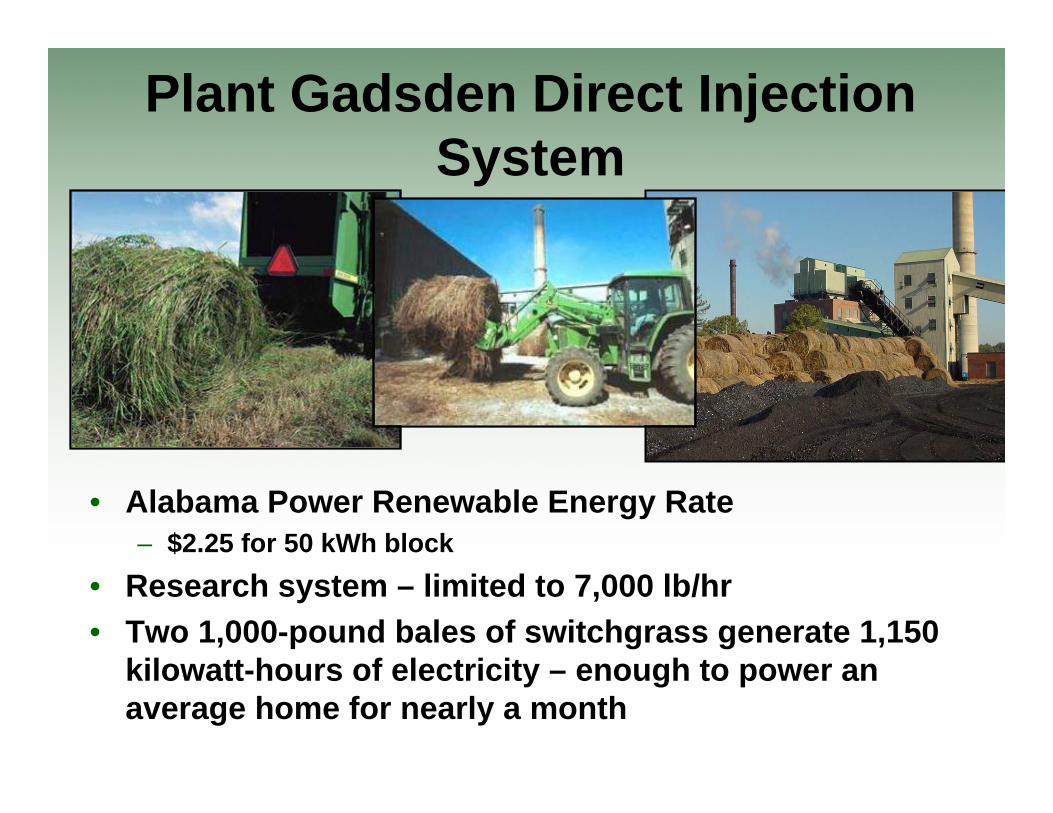
Plant Gadsden Direct Injection System
• Alabama Power Renewable Energy Rate– $2.25 for 50 kWh block
• Research system – limited to 7,000 lb/hr• Two 1,000-pound bales of switchgrass generate 1,150
kilowatt-hours of electricity – enough to power an average home for nearly a month
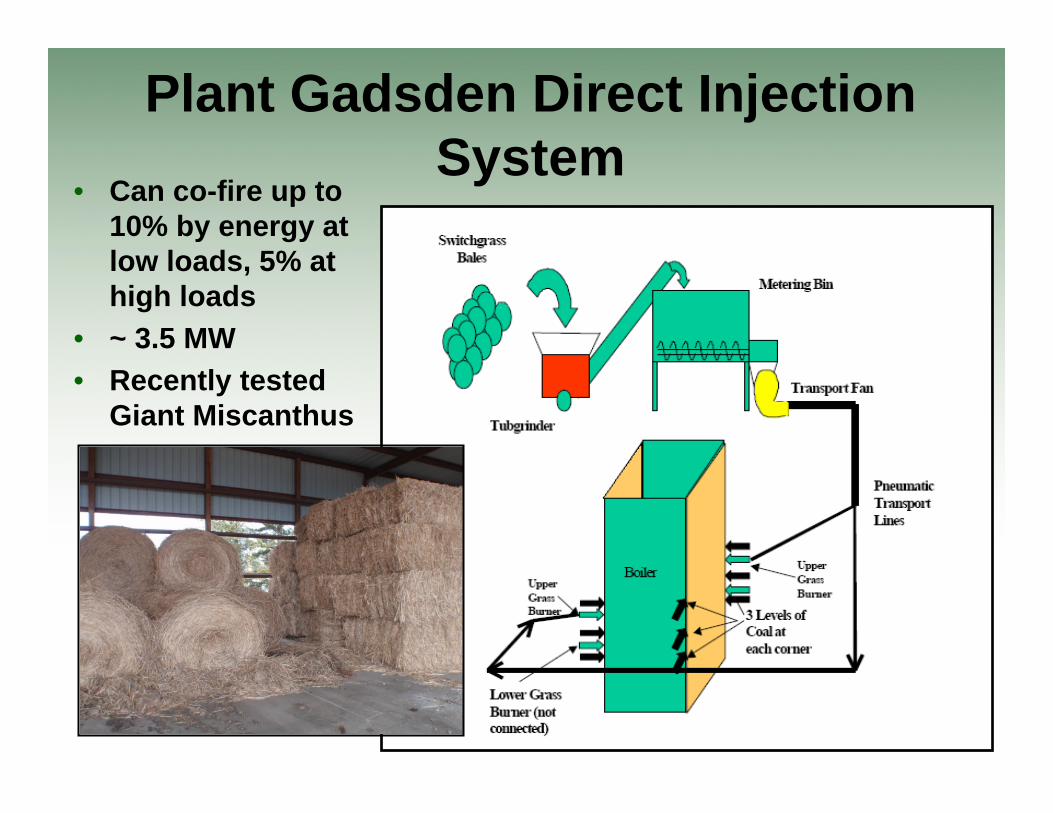
Plant Gadsden Direct Injection System
• Can co-fire up to 10% by energy at low loads, 5% at high loads
• ~ 3.5 MW• Recently tested
Giant Miscanthus

Direct Injection• Proposed direct injection system
– Multiple system designs at different cost points– Will pursue DOE funding in 2011 and beyond
• Only systems in the U.S. located in the Northeast– 2010 trip to visit direct injection sites in New York
• Extensive European experience– Several sites in Europe co-fire Biomass– European sites utilize a wide range of feedstocks
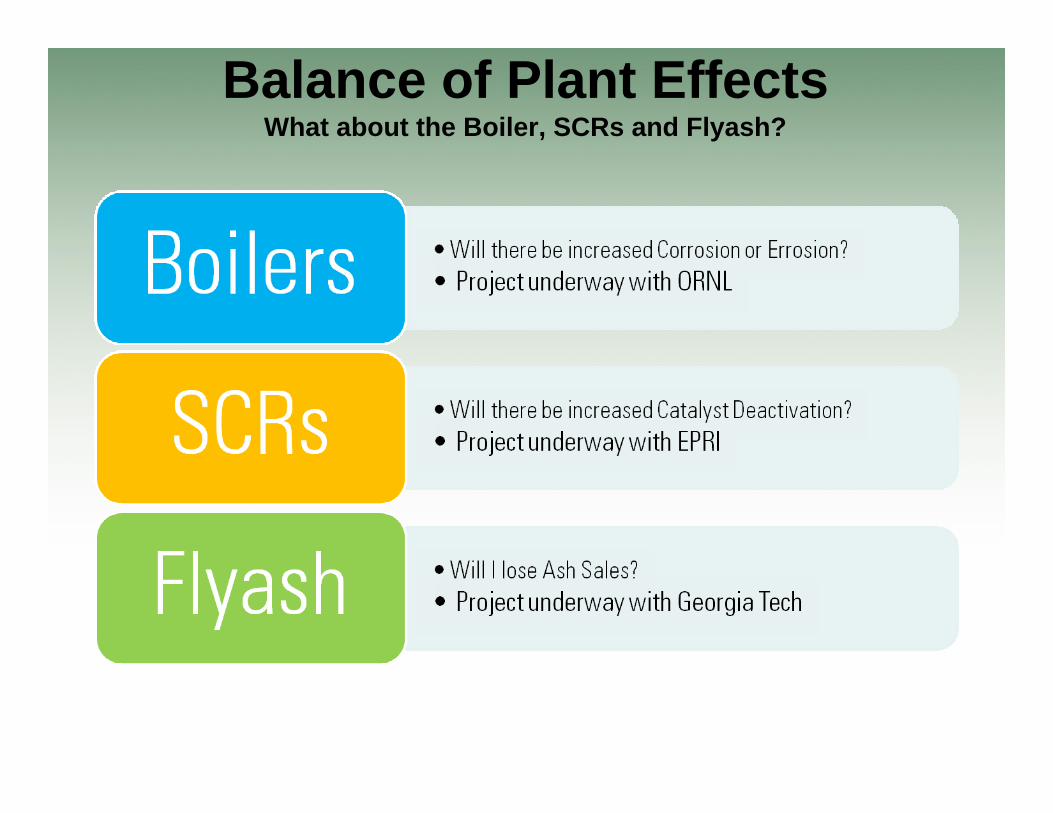
Balance of Plant EffectsWhat about the Boiler, SCRs and Flyash?
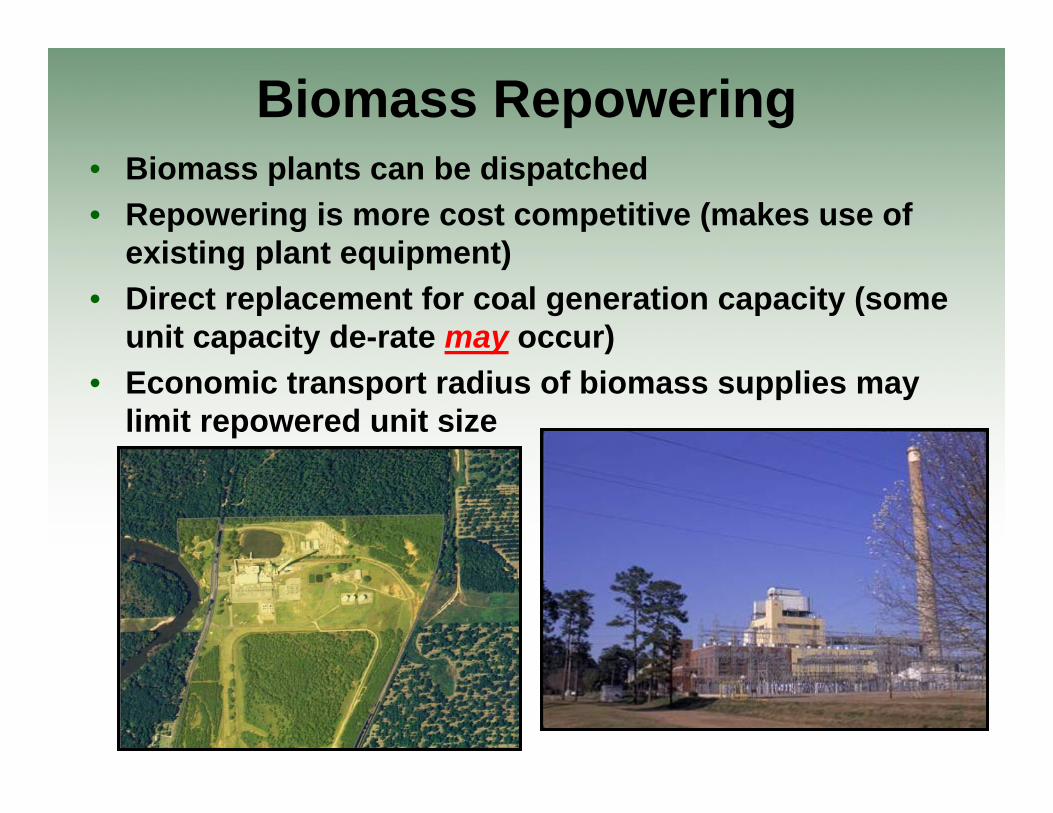
Biomass Repowering• Biomass plants can be dispatched• Repowering is more cost competitive (makes use of
existing plant equipment)• Direct replacement for coal generation capacity (some
unit capacity de-rate may occur)• Economic transport radius of biomass supplies may
limit repowered unit size
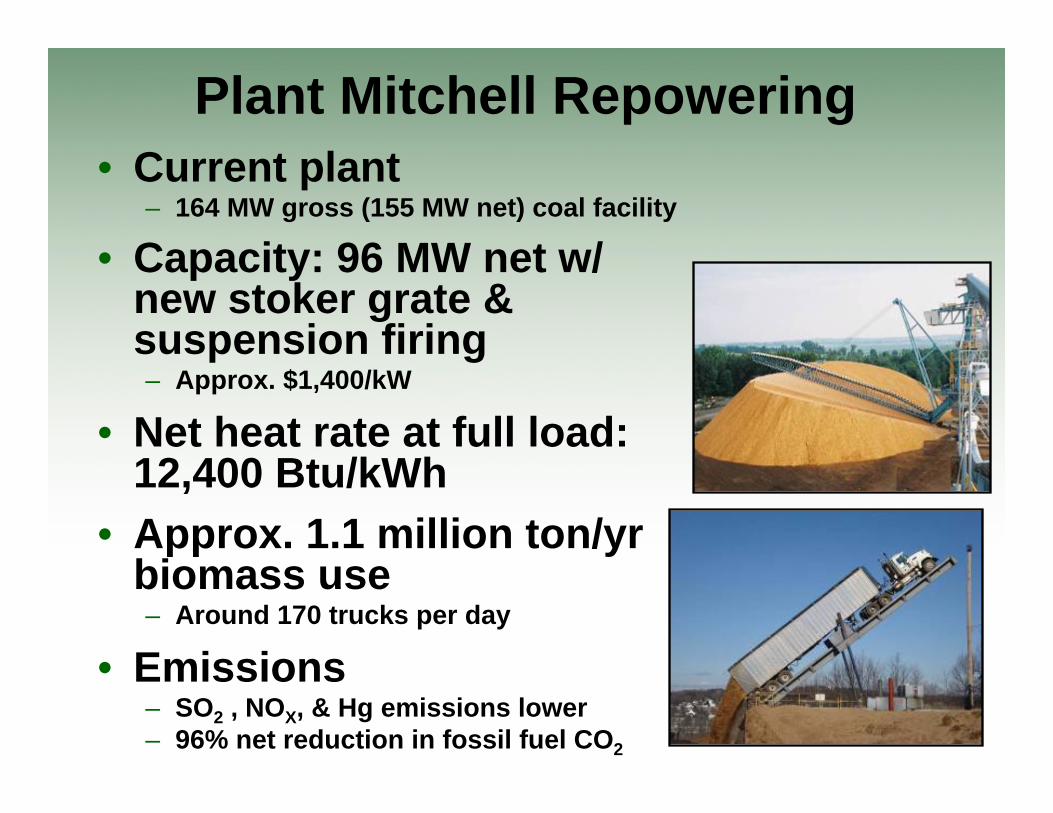
Plant Mitchell Repowering• Current plant
– 164 MW gross (155 MW net) coal facility
• Capacity: 96 MW net w/ new stoker grate & suspension firing– Approx. $1,400/kW
• Net heat rate at full load: 12,400 Btu/kWh
• Approx. 1.1 million ton/yr biomass use– Around 170 trucks per day
• Emissions– SO2 , NOX, & Hg emissions lower– 96% net reduction in fossil fuel CO2
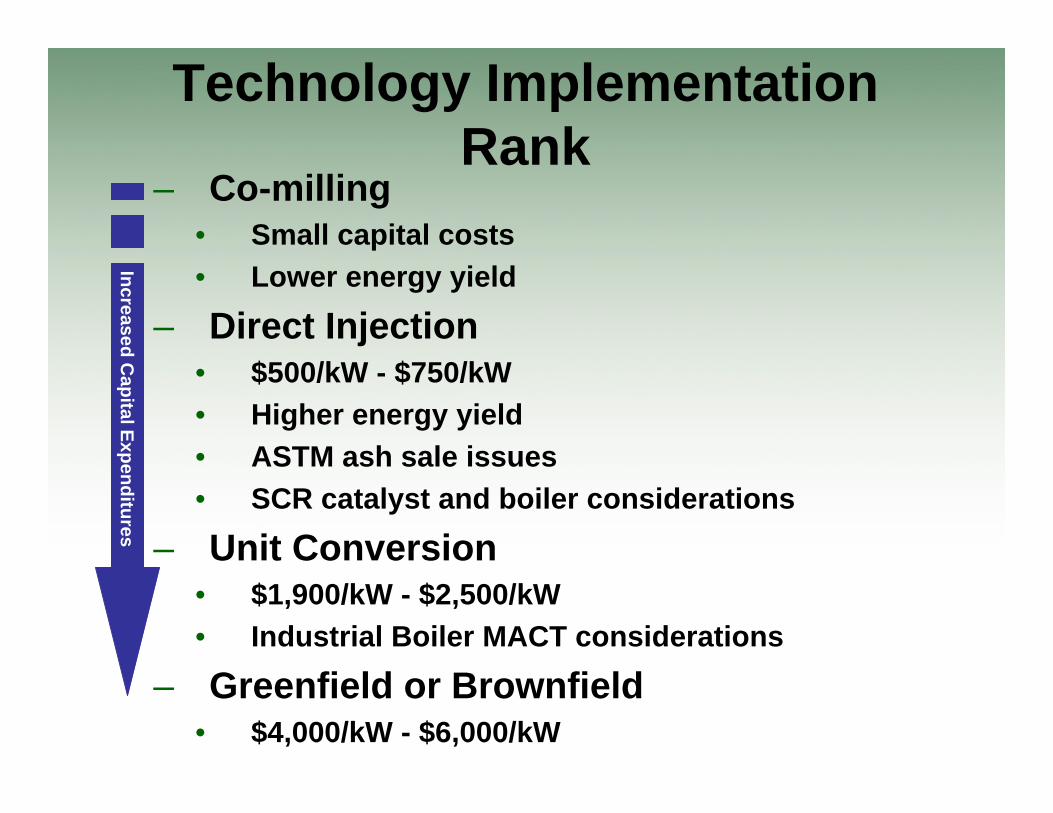
Technology Implementation Rank
– Co-milling• Small capital costs• Lower energy yield
– Direct Injection• $500/kW - $750/kW• Higher energy yield• ASTM ash sale issues• SCR catalyst and boiler considerations
– Unit Conversion• $1,900/kW - $2,500/kW• Industrial Boiler MACT considerations
– Greenfield or Brownfield• $4,000/kW - $6,000/kW
Increased Capital Expenditures

Mitchell Feedstock Plot
• 150 Acres near Plant Mitchell
• Both Herbaceous and Woody Species
• Study of Growth Rates, Maintenance Requirements, and Yields
• Start Date in 2012

Torrefied Wood Research
• Project underway with CEATI to investigate the Torrefactionmarket
• Work is underway to purchase 500 tons of torrefied wood for a test burn at Plant Gadsden.
• Lab and combustor scale testing of material will help understand handling needs and risks
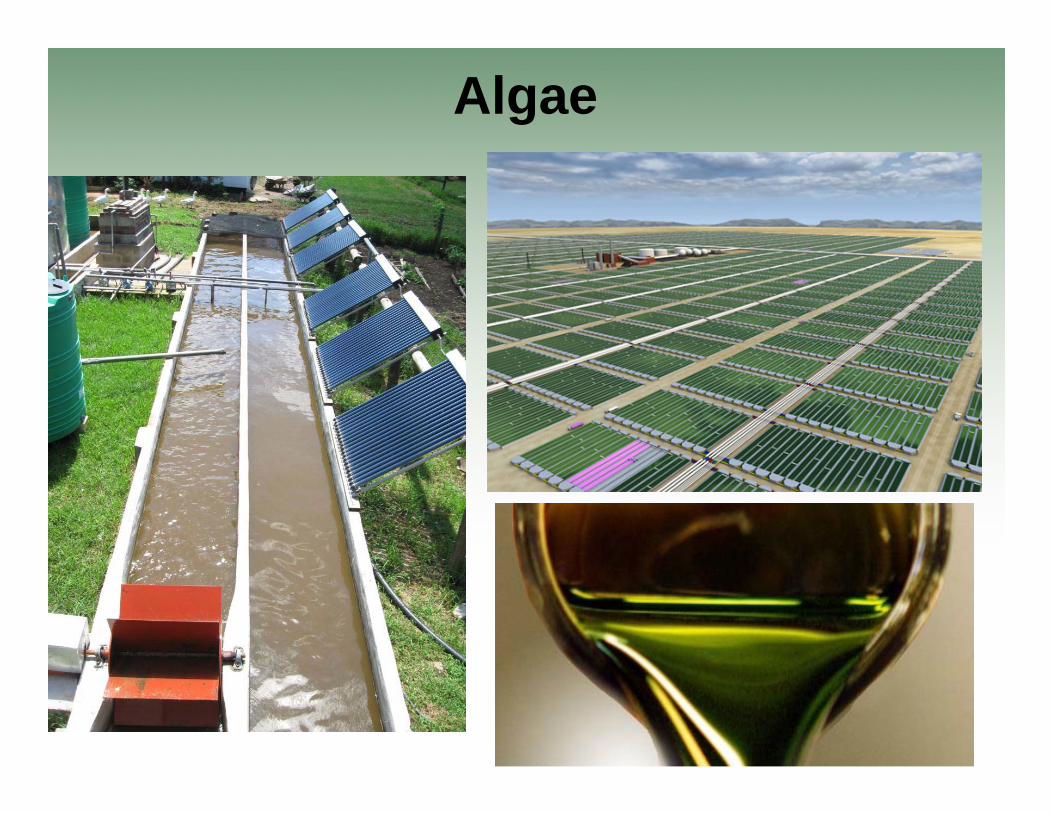
Algae
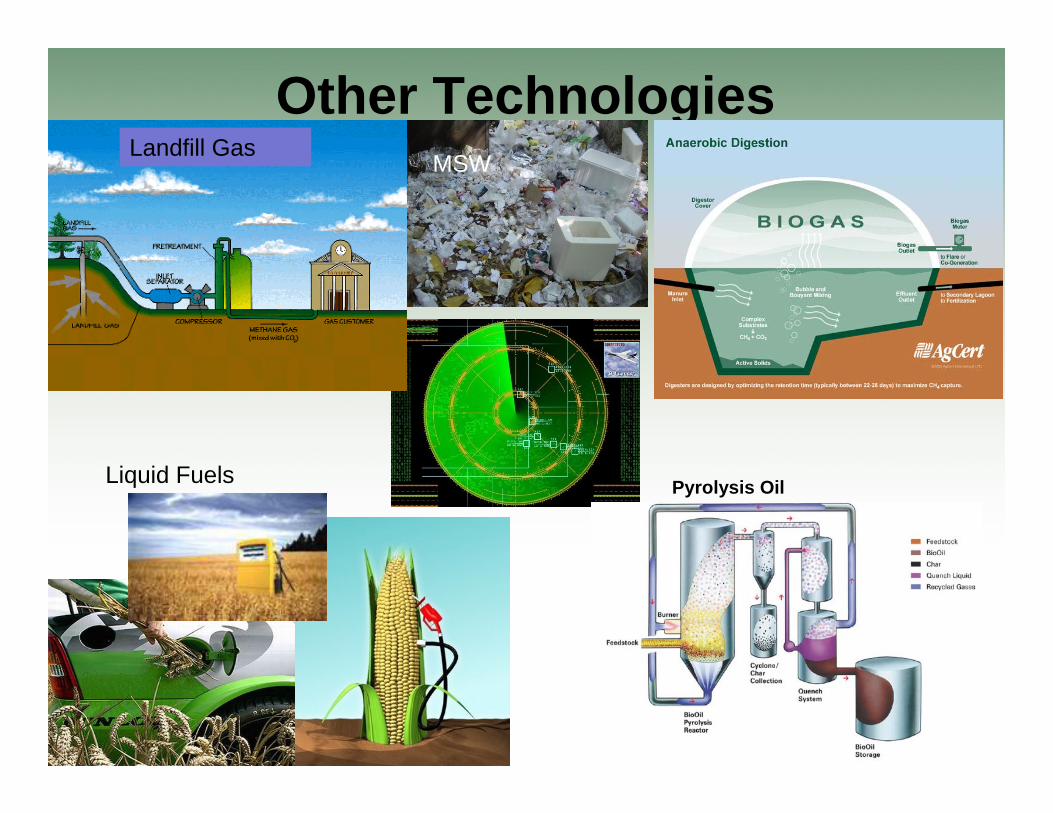
Other Technologies
Pyrolysis Oil
Landfill GasMSW
Liquid Fuels

• Auburn small scale gasifiers– 25 kW distributed gasification trailer– Pressurized (150 psi) gasification bench
scale unit (based on GTI technology)
• UND EERC gasification– Collaboration with EPRI– Transport Reactor Development Unit
(pressurized)
• PSDF pilot plant Transport Reactor research in pressurized biomass gasification– Tested wood pellet feeding 1Q 2009– Gasification test of 20% by energy in 4Q
2009
Biomass Gasification
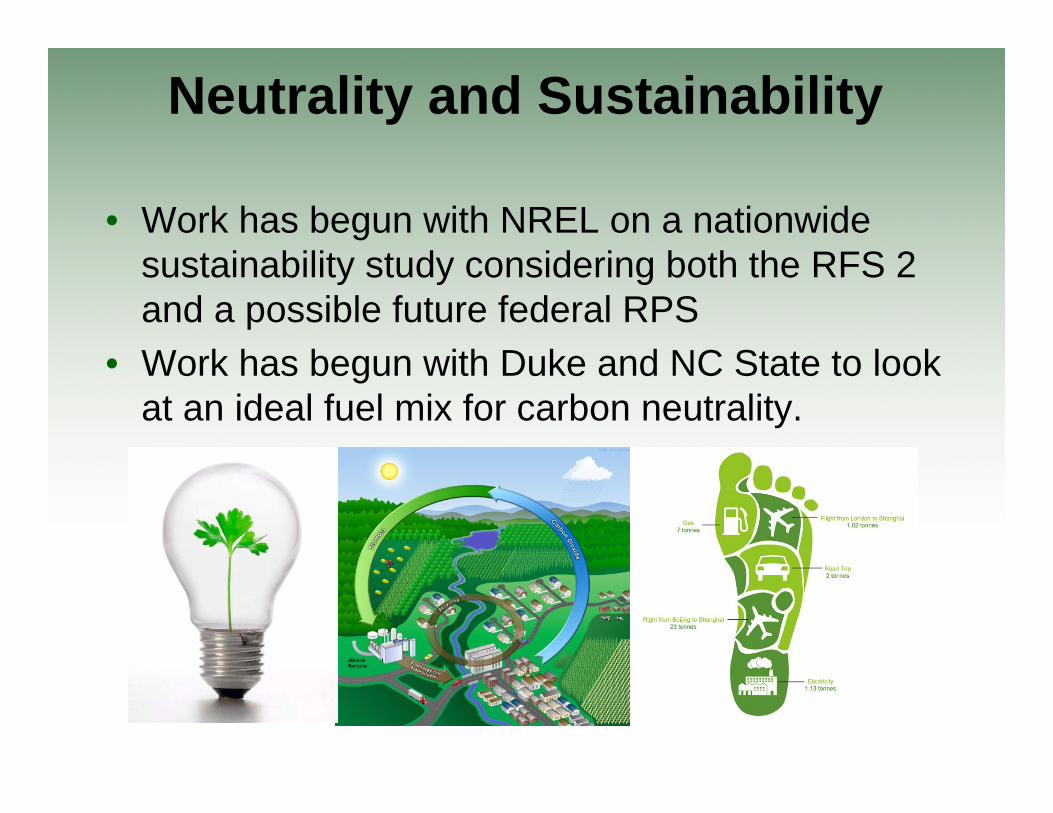
Neutrality and Sustainability
• Work has begun with NREL on a nationwide sustainability study considering both the RFS 2 and a possible future federal RPS
• Work has begun with Duke and NC State to look at an ideal fuel mix for carbon neutrality.

END