Embed Size (px)
Citation preview

REPORT OF INDEPENDENT AUDITORS AND COMBINED FINANCIAL STATEMENTS
SOUTHERN CALIFORNIA PUBLIC POWER AUTHORITY
June 30, 2019 and 2018
Table of Contents
PAGE
Report of Independent Auditors 1–3
Management’s Discussion and Analysis 4–8
Financial Statements
Combined and individual financial statements 9–44
Notes to combined financial statements 45–123
Required Supplemental Information
Schedule of proportionate share of the net pension liability as of June 30, 2019 124
Schedule of contributions as of June 30, 2019 125
Schedule of changes in net OPEB liability 126
Supplementary Information
Power Purchase Agreements combining statement of net position as of June 30, 2019 127–128
Power Purchase Agreements combining statement of net position as of June 30, 2018 129–130
Power Purchase Agreements combining statement of revenues, expenses, and changes
in net position for the year ended June 30, 2019 131–132
Power Purchase Agreements combining statement of revenues, expenses, and changes
in net position for the year ended June 30, 2018 133–134
Power Purchase Agreements combining statement of cash flows
for the year ended June 30, 2019 135–136
Power Purchase Agreements combining statement of cash flows
for the year ended June 30, 2018 137–138
Power Purchase Agreements investments for the year ended June 30, 2019 139–140
Power Purchase Agreements investments for the year ended June 30, 2018 141–142
Other Information
Supplemental schedule of receipts and disbursements in funds required by the
bond indenture for the year ended June 30, 2019
Palo Verde Project 143
San Juan Project 144
Magnolia Power Project 145
Canyon Power Project 146
Apex Power Project 147
Tieton Hydropower Project 148
Milford I Wind Project 149
Milford II Wind Project 150
Windy Point Project 151
Linden Wind Energy Project 152
Southern Transmission System Project 153
Mead-Phoenix Project 154
Mead-Adelanto Project 155
Pinedale Project 156
Barnett Project 157
Prepaid Natural Gas Project 158

1
Report of Independent Auditors
The Board of Directors and Participants of
Southern California Public Power Authority
Report on Financial Statements
We have audited the accompanying combined and individual projects’ financial statements of
Southern California Public Power Authority (the Authority), which comprise the combined and
individual projects’ statements of net position as of June 30, 2019 and 2018, and the related
combined and individual projects’ statements of revenues, expenses and changes in net position, and
cash flows for the years then ended, and the related notes to the financial statements.
Management’s Responsibility for the Financial Statements
Management is responsible for the preparation and fair presentation of these combined and individual
projects’ financial statements in accordance with accounting principles generally accepted in the
United States of America; this includes the design, implementation, and maintenance of internal
control relevant to the preparation and fair presentation of combined and individual project financial
statements that are free from material misstatement, whether due to fraud or error.
Auditor’s Responsibility
Our responsibility is to express an opinion on these combined and individual projects’ financial
statements based on our audits. We conducted our audits in accordance with auditing standards
generally accepted in the United States of America and the California Code of Regulations, Title 2,
Section 1131.2, State Controller’s Minimum Audit Requirements for California Special Districts. Those
standards require that we plan and perform the audits to obtain reasonable assurance about whether
the combined and individual projects’ financial statements are free from material misstatement.
An audit involves performing procedures to obtain audit evidence about the amounts and disclosures
in the combined and individual projects’ financial statements. The procedures selected depend on the
auditor’s judgment, including the assessment of the risks of material misstatement of the combined
and individual projects’ financial statements, whether due to fraud or error. In making those risk
assessments, the auditor considers internal control relevant to the entity’s preparation and fair
presentation of the combined and individual projects’ financial statements in order to design audit
procedures that are appropriate in the circumstances, but not for the purpose of expressing an
opinion on the effectiveness of the entity’s internal control. Accordingly, we express no such opinion.
An audit also includes evaluating the appropriateness of accounting policies used and the
reasonableness of significant accounting estimates made by management, as well as evaluating the
overall presentation of the combined and individual projects’ financial statements.
We believe that the audit evidence we have obtained is sufficient and appropriate to provide a basis
for our audit opinions.
2
Opinions
In our opinion, the combined and individual projects’ financial statements referred to above present
fairly, in all material respects, the financial position of Southern California Public Power Authority and
each of the Authority’s projects: Palo Verde Project, San Juan Project, Magnolia Power Project,
Canyon Power Project, Apex Power Project, Tieton Hydropower Project, Milford I Wind Project,
Milford II Wind Project, Windy Point Project, Linden Wind Energy Project, Southern Transmission
System Project, Mead-Phoenix Project, Mead-Adelanto Project, Pinedale Project, Barnett Project,
Prepaid Natural Gas Project, Power Purchase Agreements, Project Development Fund, Projects’
Stabilization Fund and SCPPA Fund as of June 30, 2019 and 2018 and Hoover Uprating Project as
of June 30, 2018, and the combined and individual results of the projects’ operations and cash flows
for the years then ended in accordance with accounting principles generally accepted in the United
States of America.
Emphasis of Matter
As discussed in Note 1 to the financial statements, the Authority adopted the provisions of
Governmental Accounting Standards Board (GASB) No. 83, Certain Asset Retirement Obligations,
effective July 1, 2018. The beginning of year net position has been adjusted for this change. Our
opinion is not modified with respect to this matter.
Other Matters
Required Supplementary Information
Accounting principles generally accepted in the United States of America require that the
management’s discussion and analysis, Schedule of Proportionate Share of the Net Pension Liability
as of June 30, 2019 and the Schedule of Contributions as of June 30, 2019 be presented to
supplement the financial statements. Such information, although not a part of the financial
statements, is required by the Governmental Accounting Standards Board who considers it to be an
essential part of financial reporting for placing the financial statements in an appropriate operational,
economic, or historical context. We have applied certain limited procedures in the required
supplementary information in accordance with auditing standards generally accepted in the United
States of America, which consisted of inquiries of management about the methods of preparing the
information and comparing the information for consistency with management’s responses to our
inquiries, the financial statements, and other knowledge we obtained during our audit of the financial
statements. We do not express an opinion or provide any assurance on the information because the
limited procedures do not provide us with sufficient evidence to express an opinion or provide any
assurance.
Supplementary Information
Our audit was conducted for the purpose of forming opinions on the financial statements that
collectively comprise the Authority's basic financial statements. The Power Purchase Agreements
combining statements of net position as of June 30, 2019 and 2018, and the related Power Purchase
Agreements combining statements of revenues, expenses, and changes in net position, and cash
flows for the years then ended, and the Purchase Power Agreements investments as of June 30,
2019 and 2018 (collectively, supplementary information) are presented for purposes of additional
analysis and are not a required part of the basic financial statements.
3
The supplementary information is the responsibility of management and was derived from and relates
directly to the underlying accounting and other records used to prepare the basic financial
statements. Such information has been subjected to the auditing procedures applied in the audit of
the basic financial statements and certain additional procedures, including comparing and reconciling
such information directly to the underlying accounting and other records used to prepare the basic
financial statements or to the basic financial statements themselves, and other additional procedures
in accordance with auditing standards generally accepted in the United States of America. In our
opinion, the supplementary information is fairly stated, in all material respects, in relation to the basic
financial statements as a whole.
Other Information
Our audit was conducted for the purpose of forming an opinion on the financial statements as a
whole. The supplemental schedules of receipts and disbursements in funds for the year ended
June 30, 2019, are presented for purposes of additional analysis and are not a required part of the
basic financial statements. Such information has not been subjected to the auditing procedures
applied in the audit of the basic financial statements, and accordingly, we do not express an opinion
or provide any assurance on it.
Portland, Oregon
October 31, 2019
Southern California Public Power Authority Management’s Discussion and Analysis
See accompanying notes. 4
The following discussion and analysis of the financial performance of Southern California Public Power
Authority (the Authority or SCPPA), provides an overview of the Authority’s financial activities for the fiscal
years ended June 30, 2019 and 2018. Please read this discussion and analysis in conjunction with the
Authority’s Combined Financial Statements, which begin on page 9. Description and other details
pertaining to the Authority are included in the Notes to Combined Financial Statements.
The Authority is a joint powers authority whose primary purpose has been to provide joint financing and
oversight for large joint projects for its member agencies that consist of eleven municipal electric utilities
and one irrigation district in California. On a combined basis, these entities provide electricity to more than
two million retail electric customers. A Board of Directors (the Board) governs the Authority, which
consists of one representative from each member agency.
Using This Financial Report
This annual financial report consists of a series of financial statements and reflects the self-supporting
activities of the Authority that are funded primarily through the sale of energy, natural gas, and
transmission services to member agencies under project specific take-or-pay contracts that require each
member agency to pay its proportionate share of operating and maintenance expenses and debt service
with respect to such projects. The contracts cannot be terminated or amended in any manner that will
impair or adversely affect the rights of the bondholders as long as any bonds issued by the specific
project remain outstanding. The Authority also established take-and-pay contracts for the participants of
the prepaid natural gas project where the payments received from the sale of gas will be sufficient to pay
debt service. In addition, the Authority has entered into various power purchase agreements. These
agreements are substantially take-and-pay contracts but there may be other costs not associated with the
delivery of energy that the participants may be obligated to pay.

Southern California Public Power Authority Management’s Discussion and Analysis
5 See accompanying notes.
Combined Summary of Financial Condition and Changes in Net Position
(in thousands)
2019 2018 (Restated) 2017 (Restated)
Assets
Net utility plant 1,441,741$ 1,507,609$ 1,567,960$
Investments 693,454 648,816 740,656
Cash and cash equivalents 247,855 277,645 224,652
Prepaid and other 784,532 842,175 916,328
Total assets 3,167,582 3,276,245 3,449,596
Deferred outflows of resources 154,827 167,606 190,934
Total assets and deferred outflows of resources 3,322,409$ 3,443,851$ 3,640,530$
Liabilities
Noncurrent liabilities 2,769,102$ 2,934,274$ 3,135,884$
Current liabilities 426,088 427,036 432,349
Total liabilities 3,195,190 3,361,310 3,568,233
Deferred inflows of resources 61 50 87
Net position
Net investment in capital assets (138,447) (189,747) (142,599)
Restricted 385,434 404,782 393,361
Unrestricted (119,829) (132,544) (178,552)
Total net position 127,158 82,491 72,210
Total liabilities, deferred inflows of resources,
and net position 3,322,409$ 3,443,851$ 3,640,530$
Revenues, expenses and changes in net position
for the year ended June 30
Operating revenues 1,012,325$ 970,156$ 995,236$
Operating expenses (903,743) (836,888) (832,403)
Operating income 108,582 133,268 162,833
Investment and other income 41,672 10,237 13,973
Derivative gain (loss) (3,485) 8,632 7,569
Inflation of ARO Liability (3,004) (5,086) (3,469)
Debt expense (111,313) (116,543) (126,895)
Change in net position before special items 32,452 30,508 54,011
Special items - (3,261) (61,839)
Change in net position 32,452 27,247 (7,828)
Net position, beginning of year 82,491 72,210 (48,951)
Cumulative effect of restatement of GASB 83 - - 142,633
Net position - beginning of year, as adjusted 82,491 72,210 93,682
Net contributions/(withdrawals) by participants 12,215 (16,966) (13,644)
Net position, end of year 127,158$ 82,491$ 72,210$
June 30,
Southern California Public Power Authority Management’s Discussion and Analysis
See accompanying notes. 6
Net Position – The Authority's net position increased by $45 million mainly due to the decrease in assets
and deferred outflows of resources of $121 million offset by the decrease in liabilities and deferred inflows
of resources of $166 million.
Assets – The decrease of $121 million in the Authority's assets and deferred outflows of resources is due
to the following:
Net Utility Plant – decreased by $66 million
The decrease is primarily due to the $91 million scheduled depreciation in Generation and
Transmission Project and $6 million depletion in the Natural Gas Reserves Projects; offset by the $31
million ongoing capital improvements in the Apex Power Project (APP), Palo Verde Project (PV) and
Canyon Power Project (CPP).
Investments – increased by $45 million
The increase is largely due to $16 million transfer of funds to Projects’ Stabilization Fund (PSF) for
the Participants’ share of the prior years’ over-collection in the San Juan Project (SJ); Invested $12
million accumulated overbillings in various Projects; $15 million transfer of short-term investments to
long-term investments; $3 million reinvestment of interest earnings and $3 million increase in market
value of investment securities in the PV Decommissioning Trust Fund. The increases were offset by
the $4 million withdrawal from the Project Funds for capital improvement in CPP.
Cash and cash equivalents – decreased by $30 million
The decrease is mainly due to the $16 million transfer of funds to the PSF for the Participants’ share
of the prior years’ over collection in SJ Project, and $15 million transfer of cash and cash equivalent
to long-term investments; offset by the $1 million accumulated overbillings in various Projects’
invested in short term investments.
Prepaid and other assets – decreased by $57 million
The decrease is mainly due to the $60 million scheduled amortization of the prepaid assets in the
Natural Gas Prepaid Project (NGPP), Milford I, Milford II, and Windy Point/Windy Flats Projects
(Windy Point); offset by $1 million change in the fair value of the derivative instruments in the Mead-
Adelanto Project (MA) and $2 million increase in inventories in various generation projects.
Deferred outflows of resources – decreased by $13 million
The decrease is mainly due to the $21 million amortization of loss on refunding in various debt–
funded projects and $2 million amortization of Asset Retirement Obligation (ARO) in the PV, Linden,
Tieton Hydropower Project (THP) and Pinedale and Barnett Natural Gas Projects. The decreases
were offset by the $10 million increase in the reported fair value of the derivative instruments in the
Magnolia Power Project (MPP) and NGPP.

Southern California Public Power Authority Management’s Discussion and Analysis
7 See accompanying notes.
Liabilities – The decrease in the Authority’s liabilities of $166 million is primarily due to the following:
$186 million of principal maturities and related amortizations for all debt-funded projects, the
return of $16 million prior years’ over-collection in SJ and the $4 million release of Reserve and
Contingency Fund for the initial deposit in SJ Decommissioning Trust Fund. The decreases were
offset by the $19 million accumulated overbillings and accruals in various Projects; $17 million net
increase in the reported fair market values of derivative instruments in MPP and NGPP; and $4
million increase in the recognition of ARO in the PV, APP, THP, Linden, and Pinedale and Barnett
Natural Gas Projects in accordance with GASB 83, Certain Asset Retirement Obligations.
During fiscal year 2018, the Authority’s assets and deferred outflow of resources, as restated, decreased
by $197 million largely due to the scheduled depreciation in the generation and transmission Projects,
and depletion in the Natural Gas Reserves Project; offset by $207 million decrease in liabilities mainly
due to the scheduled principal maturities and related amortizations for all debt-funded projects, resulted
an increase in the Authority’s net position of $10 million. In addition, the PV decommissioning obligation
was adjusted to recognize the current value and effects of general inflation or deflation to conform to the
requirements of GASB 83.
Operating Income – Operating income decreased by $25 million mainly attributable to the $32 million
unbudgeted expenditures in the Adelanto Converter Station in Southern Transmission System Project
(STS), $8 million additional major maintenance expenses for the GE upgrades in MPP, and $1 million
increase in the depletion rate due to the new reserve study conducted for Barnett Natural Gas Project.
The expenses were offset by the $16 million return of prior years’ over-collection in SJ Project.
During fiscal year 2018, the net operating income, as restated, decreased by $29 million primarily due to
the $14 million reduction in billings in the PV Project resulted from the final debt service requirement that
ended in July 2017; $10 million prior years’ overbillings contributed to the issuance STS 2017A for the
refunding of STS 2009A Bonds, and the issuance of 2018A&B Bonds for the refunding of the 2017A
Bonds in CPP; $4 million release of Reserve and Contingency Fund for the scheduled major maintenance
in MPP; and $1 million recognition of other post-employment benefits (OPEB) expense.
Investment and Other Income – Investment and other income increased $31 million due to the $15
million reimbursement of fire insurance settlements in STS Project and $16 million increase in market
values and higher interest earnings of the investment securities held in various Projects primarily in PV
Decommissioning Trust Fund.
Derivative Gain (Loss) – In June 2008, GASB issued Statement No 53, Accounting and Financial
Reporting for Derivative Instruments, effective for financial statements for periods beginning after June
15, 2009. GASB 53 requires that the fair value of derivative instruments be reported in the financial
statements as investment income or loss if the derivative fails to effectively hedge the risk of rising or
falling cash flows or fair values. $3.5 million derivative loss and $8.6 million derivative gain were reported
related to the Authority’s derivative instruments that were deemed investment instruments as of June 30,
2019 and 2018, respectively. The $12.1 million increase in derivative loss is mainly due to the effect of
changes in fair values of Magnolia Power Project Swaps. (See Note 5)
Southern California Public Power Authority Management’s Discussion and Analysis
See accompanying notes. 8
SCPPA has three basis swaps that make variable payments based on SIFMA and receive variable
payments based on a percentage of LIBOR. Their purpose is to reduce the interest expense on the
Mead-Adelanto Project, and the Magnolia Power Project Bonds. Pursuant to GASB 53, there is no
identified risk being hedged by a basis swap, and therefore they are all deemed investment instruments.
These investment instruments were strategically placed by management to reduce interest expense and
they continue to serve this purpose.
Inflation of ARO Liability – A decrease in inflation loss of $2 million was recognized due to the
implementation of GASB 83, Certain Asset Retirement Obligations, which requires the current value of an
entity’s ARO to be adjusted for the effects of general inflation or deflation at least annually and it requires
entities to evaluate all relevant factors to determine whether the effects of one or more of the factors are
expected to significantly change the estimated asset retirement outlays.
Debt Expense – Debt expense decreased by $5 million primarily due to lower interest expense from the
refunding of the 2008A and 2009A Bonds in the STS Project, and the cost of issuance recognized in
fiscal year 2018 associated with the issuance of Magnolia Power Project 2017-1 and Canyon Power
Project 2018A&B Refunding Bonds.
Special Items – Special items for fiscal year 2018 pertain to the $3 million net write-off of inventories,
prepaid accounts, and liabilities due to the divesting of ownership interests of the SJ Unit 3 plant on
December 31, 2017.

9 See accompanying notes.
Southern California Public Power Authority Combined Statements of Net Position (Amounts in Thousands)
2019 2018 (Restated)
Noncurrent assets
Net utility plant 1,441,741$ 1,507,609$
Investments – restricted 619,889 608,142
Investments – unrestricted 73,565 40,674
Advance to IPA - restricted 10,930 10,930
Fair value of derivative instruments 1,094 -
Prepaid and other assets 669,903 729,736
Total noncurrent assets 2,817,122 2,897,091
Current assets
Cash and cash equivalents – restricted 152,245 181,059
Cash and cash equivalents – unrestricted 95,610 96,586
Interest receivable 2,295 2,257
Accounts receivable 13,310 13,517
Materials and supplies 23,973 23,787
Prepaid and other assets 63,027 61,948
Total current assets 350,460 379,154
Deferred items related to pensions 559 660
Unamortized loss on refunding 81,898 102,712
Asset retirement obligation 42,842 44,561
Accumulated decrease in fair value of hedging derivatives 29,528 19,673
Total deferred outflows of resources 154,827 167,606
Total assets and deferred outflows of resources 3,322,409$ 3,443,851$
Noncurrent liabilities
Long-term debt 2,491,059$ 2,674,562$
Fair value of derivative instruments 39,620 25,185
Notes payable, net pension and other liabilities 4,546 2,301
Advances from participants 19,027 20,956
Reclamation and decommission obligation 214,850 211,270
Total noncurrent liabilities 2,769,102 2,934,274
Current liabilities
Debt due within one year 160,265 163,185
Notes payable and other liabilities due within one year 21,127 20,142
Advances from participants due within one year 54,594 67,364
Accrued interest 50,241 53,005
Accounts payable and accruals 136,649 119,872
Accrued property tax 3,212 3,468
Total current liabilities 426,088 427,036
Total liabilities 3,195,190 3,361,310
Deferred items related to pensions 61 50
Total deferred inflows of resources 61 50
NET POSITION
Net investment in capital assets (138,447) (189,747)
Restricted 385,434 404,782
Unrestricted (119,829) (132,544)
Total net position 127,158 82,491
Total liabilities, deferred inflows of resources and net position 3,322,409$ 3,443,851$
ASSETS
LIABILITIES
June 30,
DEFERRED OUTFLOWS OF RESOURCES
DEFERRED INFLOWS OF RESOURCES
See accompanying notes. 10
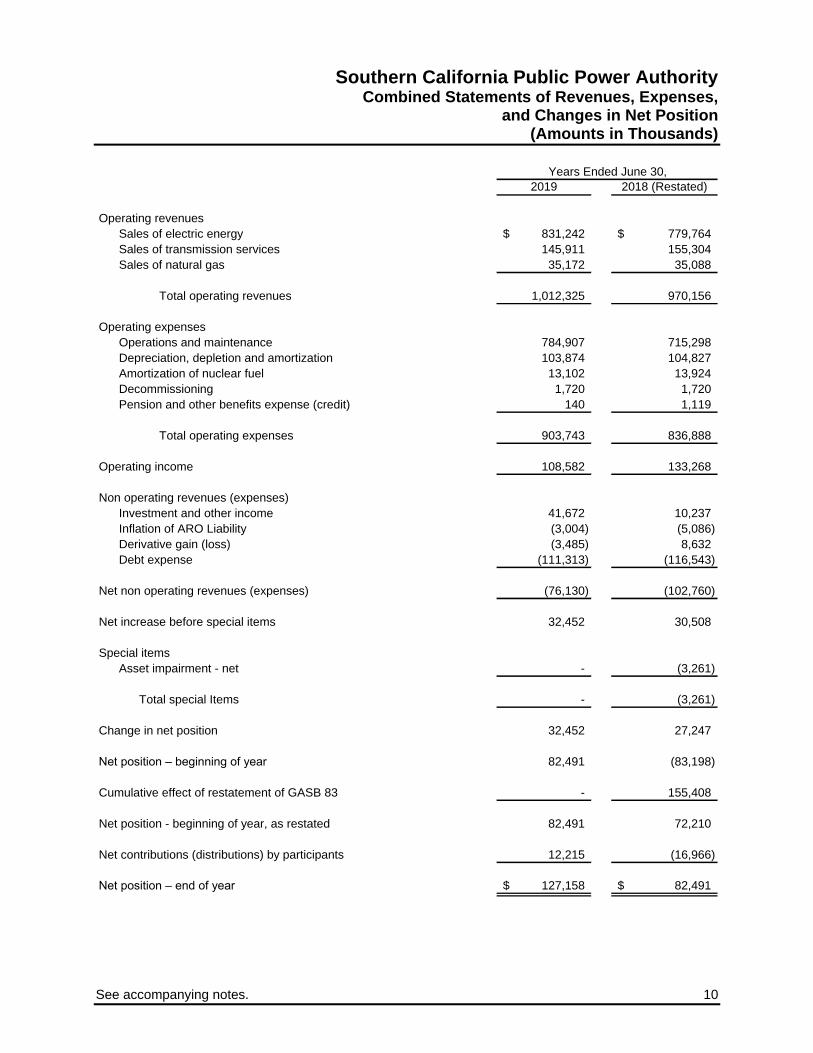
Southern California Public Power Authority Combined Statements of Revenues, Expenses,
and Changes in Net Position (Amounts in Thousands)
2019 2018 (Restated)
Operating revenues
Sales of electric energy 831,242$ 779,764$
Sales of transmission services 145,911 155,304
Sales of natural gas 35,172 35,088
Total operating revenues 1,012,325 970,156
Operating expenses
Operations and maintenance 784,907 715,298
Depreciation, depletion and amortization 103,874 104,827
Amortization of nuclear fuel 13,102 13,924
Decommissioning 1,720 1,720
Pension and other benefits expense (credit) 140 1,119
Total operating expenses 903,743 836,888
Operating income 108,582 133,268
Non operating revenues (expenses)
Investment and other income 41,672 10,237
Inflation of ARO Liability (3,004) (5,086)
Derivative gain (loss) (3,485) 8,632
Debt expense (111,313) (116,543)
Net non operating revenues (expenses) (76,130) (102,760)
Net increase before special items 32,452 30,508
Special items
Asset impairment - net - (3,261)
Total special Items - (3,261)
Change in net position 32,452 27,247
Net position – beginning of year 82,491 (83,198)
Cumulative effect of restatement of GASB 83 - 155,408
Net position - beginning of year, as restated 82,491 72,210
Net contributions (distributions) by participants 12,215 (16,966)
Net position – end of year 127,158$ 82,491$
Years Ended June 30,

11 See accompanying notes.
Southern California Public Power Authority Combined Statements of Cash Flows (Amounts in Thousands)
2019 2018 (Restated)
Cash flows from operating activities
Receipts from participants 833,169$ 834,482$
Receipts from sale of oil and gas 8,165 15,130
Payments to operating managers (547,641) (527,988)
Other disbursements and receipts 18,006 12,210
Net cash flows provided by (used for) operating activities 311,699 333,834
Cash flows from noncapital financing activities
Advances by participants, net 9,916 (15,170)
Cash flows from capital financing activities
Additions to plant and prepaid projects, net (53,953) (57,234)
Debt interest payments (111,539) (121,328)
Proceeds from sale of bonds 53,211 338,870
Payment for defeasance of revenue bonds (53,574) (108,966)
Payments for swap termination fee - (7,334)
Transfer of funds from (to) escrow - (232,407)
Transfer of funds from (to) Mine Reclamation Trust Fund (500) (17,790)
Principal payments on debt (163,185) (172,210)
Payment for bond issue costs (529) (1,696)
Net cash used for capital and related financing activities (330,069) (380,095)
Cash flows from investing activities
Interest received on investments 9,863 7,019
Purchases of investments (475,064) (391,063)
Proceeds from sale/maturity of investments 443,865 498,468
Net cash provided by (used for) investing activities (21,336) 114,424
Net change in cash and cash equivalents (29,790) 52,993
Cash and cash equivalents, beginning of year 277,645 224,652
Cash and cash equivalents, end of year 247,855$ 277,645$
Reconciliation of operating income to net cash
provided by operating activities
Operating income 108,582$ 133,268$
Adjustments to reconcile operating income to net cash provided
by operating activities
Depreciation, depletion and amortization 151,228 152,181
Decommissioning 1,720 1,720
Advances for capacity and energy - 682
Amortization of nuclear fuel 13,102 13,924
Pension and other benefits expense 140 1,119
Changes in assets and liabilities
Accounts receivable (150) 8,908
Accounts payable and accruals 10,472 12,376
Other 26,605 9,656
Net cash provided by operating activities 311,699$ 333,834$
Cash and cash equivalents as stated in the Combined Statements
of Net Position
Cash and cash equivalents – restricted 152,245$ 181,059$
Cash and cash equivalents – unrestricted 95,610 96,586
247,855$ 277,645$
Years Ended June 30,
12 See accompanying notes.
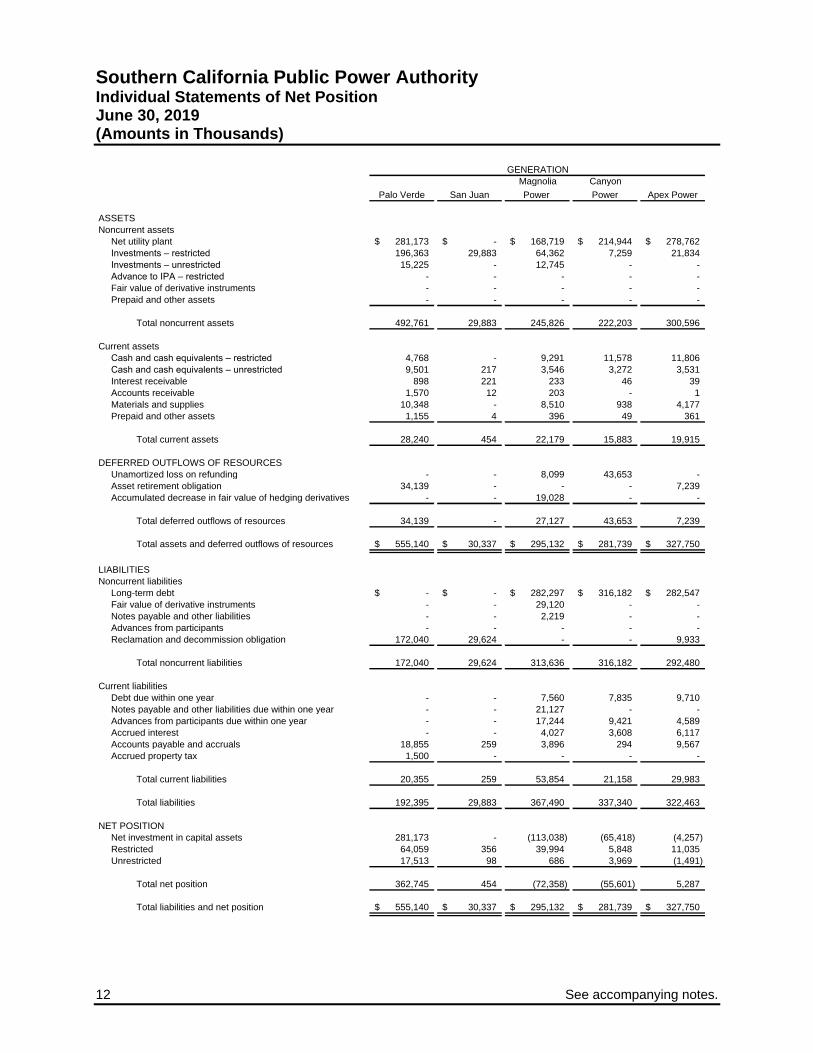
Southern California Public Power Authority Individual Statements of Net Position June 30, 2019 (Amounts in Thousands)
Magnolia Canyon
Palo Verde San Juan Power Power Apex Power
Noncurrent assets
Net utility plant 281,173$ -$ 168,719$ 214,944$ 278,762$
Investments – restricted 196,363 29,883 64,362 7,259 21,834
Investments – unrestricted 15,225 - 12,745 - -
Advance to IPA – restricted - - - - -
Fair value of derivative instruments - - - - -
Prepaid and other assets - - - - -
Total noncurrent assets 492,761 29,883 245,826 222,203 300,596
Current assets
Cash and cash equivalents – restricted 4,768 - 9,291 11,578 11,806
Cash and cash equivalents – unrestricted 9,501 217 3,546 3,272 3,531
Interest receivable 898 221 233 46 39
Accounts receivable 1,570 12 203 - 1
Materials and supplies 10,348 - 8,510 938 4,177
Prepaid and other assets 1,155 4 396 49 361
Total current assets 28,240 454 22,179 15,883 19,915
Unamortized loss on refunding - - 8,099 43,653 -
Asset retirement obligation 34,139 - - - 7,239
Accumulated decrease in fair value of hedging derivatives - - 19,028 - -
Total deferred outflows of resources 34,139 - 27,127 43,653 7,239
Total assets and deferred outflows of resources 555,140$ 30,337$ 295,132$ 281,739$ 327,750$
Noncurrent liabilities
Long-term debt -$ -$ 282,297$ 316,182$ 282,547$
Fair value of derivative instruments - - 29,120 - -
Notes payable and other liabilities - - 2,219 - -
Advances from participants - - - - -
Reclamation and decommission obligation 172,040 29,624 - - 9,933
Total noncurrent liabilities 172,040 29,624 313,636 316,182 292,480
Current liabilities
Debt due within one year - - 7,560 7,835 9,710
Notes payable and other liabilities due within one year - - 21,127 - -
Advances from participants due within one year - - 17,244 9,421 4,589
Accrued interest - - 4,027 3,608 6,117
Accounts payable and accruals 18,855 259 3,896 294 9,567
Accrued property tax 1,500 - - - -
Total current liabilities 20,355 259 53,854 21,158 29,983
Total liabilities 192,395 29,883 367,490 337,340 322,463
NET POSITION
Net investment in capital assets 281,173 - (113,038) (65,418) (4,257)
Restricted 64,059 356 39,994 5,848 11,035
Unrestricted 17,513 98 686 3,969 (1,491)
Total net position 362,745 454 (72,358) (55,601) 5,287
Total liabilities and net position 555,140$ 30,337$ 295,132$ 281,739$ 327,750$
ASSETS
LIABILITIES
DEFERRED OUTFLOWS OF RESOURCES
GENERATION

See accompanying notes. 13
Southern California Public Power Authority Individual Statements of Net Position
June 30, 2018 (Restated) (Amounts in Thousands)
Magnolia Canyon
Palo Verde San Juan Power Power Apex Power
Noncurrent assets
Net utility plant 288,516$ -$ 179,285$ 220,614$ 276,341$
Investments – restricted 192,198 29,237 57,474 13,630 17,642
Investments – unrestricted 16,383 - 2,976 - -
Advance to IPA – restricted - - - - -
Fair value of derivative instruments - - - - -
Prepaid and other assets - - - - -
Total noncurrent assets 497,097 29,237 239,735 234,244 293,983
Current assets
Cash and cash equivalents – restricted 4,761 9,840 20,373 8,477 13,734
Cash and cash equivalents – unrestricted 7,857 6,709 8,276 1,510 1,117
Interest receivable 764 180 515 35 36
Accounts receivable 1,867 - 1,148 - -
Materials and supplies 10,253 - 8,590 1,186 3,758
Prepaid and other assets 826 - 200 45 15
Total current assets 26,328 16,729 39,102 11,253 18,660
Unamortized loss on refunding - - 12,571 47,598 -
Asset retirement obligation 35,399 - - - 7,606
Accumulated decrease in fair value of hedging derivatives - - 12,248 - -
Total deferred outflows of resources 35,399 - 24,819 47,598 7,606
Total assets and deferred outflows of resources 558,824$ 45,966$ 303,656$ 293,095$ 320,249$
Noncurrent liabilities
Long-term debt -$ -$ 291,139$ 326,042$ 293,004$
Fair value of derivative instruments - - 16,542 - -
Notes payable and other liabilities - - - - -
Advances from participants - - - - -
Reclamation and decommission obligation 169,250 29,050 - - 9,772
Total noncurrent liabilities 169,250 29,050 307,681 326,042 302,776
Current liabilities
Debt due within one year - - 7,210 7,540 9,545
Notes payable and other liabilities due within one year - - 20,142 - -
Advances from participants due within one year - 19,954 17,204 - 3,451
Accrued interest - - 4,103 2,865 6,199
Accounts payable and accruals 19,940 8,254 5,400 1,613 4,396
Accrued property tax 1,602 - - - -
Total current liabilities 21,542 28,208 54,059 12,018 23,591
Total liabilities 190,792 57,258 361,740 338,060 326,367
NET POSITION
Net investment in capital assets 288,516 - (106,494) (61,844) (16,016)
Restricted 63,804 - 45,497 15,748 9,388
Unrestricted 15,712 (11,292) 2,913 1,131 510
Total net position 368,032 (11,292) (58,084) (44,965) (6,118)
Total liabilities and net position 558,824$ 45,966$ 303,656$ 293,095$ 320,249$
ASSETS
LIABILITIES
DEFERRED OUTFLOWS OF RESOURCES
GENERATION

14 See accompanying notes.
Southern California Public Power Authority Individual Statements of Net Position June 30, 2019 (Amounts in Thousands)
Tieton
Hydropower
Milford I
Wind Milford II Wind Windy Point
Linden Wind
Energy
Noncurrent assets
Net utility plant 35,034$ -$ -$ -$ 95,402$
Investments – restricted 5,686 27,023 8,907 32,176 4,387
Investments – unrestricted - - - - 1,700
Advance to IPA – restricted - - - - -
Fair value of derivative instruments - - - - -
Prepaid and other assets - 106,930 97,103 279,692 -
Total noncurrent assets 40,720 133,953 106,010 311,868 101,489
Current assets
Cash and cash equivalents – restricted 1,934 9,697 4,131 10,403 5,217
Cash and cash equivalents – unrestricted 605 13 3,988 5,857 698
Interest receivable 23 88 12 39 2
Accounts receivable 146 3,263 - - -
Materials and supplies - - - - -
Prepaid and other assets 179 11,408 8,701 27,854 27
Total current assets 2,887 24,469 16,832 44,153 5,944
Unamortized loss on refunding - - - - -
Asset retirement obligation 479 - - - 372
Accumulated decrease in fair value of hedging derivatives - - - - -
Total deferred outflows of resources 479 - - - 372
Total assets and deferred outflows of resources 44,086$ 158,422$ 122,842$ 356,021$ 107,805$
Noncurrent liabilities
Long-term debt 45,943$ 161,336$ 118,470$ 358,591$ 108,479$
Fair value of derivative instruments - - - - -
Notes payable and other liabilities - - - - -
Advances from participants - - - - -
Reclamation and decommission obligation 853 - - - 699
Total noncurrent liabilities 46,796 161,336 118,470 358,591 109,178
Current liabilities
Debt due within one year 1,000 10,570 6,665 23,040 4,335
Notes payable and other liabilities due within
one year - - - - -
Advances from participants due within one year 202 250 250 1,000 2,004
Accrued interest 1,181 4,150 3,098 9,002 2,910
Accounts payable and accruals 583 546 2,516 4,734 924
Accrued property tax - - - 529 204
Total current liabilities 2,966 15,516 12,529 38,305 10,377
Total liabilities 49,762 176,852 130,999 396,896 119,555
NET POSITION
Net investment in capital assets (11,909) - - - (17,412)
Restricted 6,089 - - - 6,370
Unrestricted 144 (18,430) (8,157) (40,875) (708)
Total net position (5,676) (18,430) (8,157) (40,875) (11,750)
Total liabilities and net position 44,086$ 158,422$ 122,842$ 356,021$ 107,805$
ASSETS
LIABILITIES
GREEN POWER
DEFERRED OUTFLOWS OF RESOURCES
See accompanying notes. 15
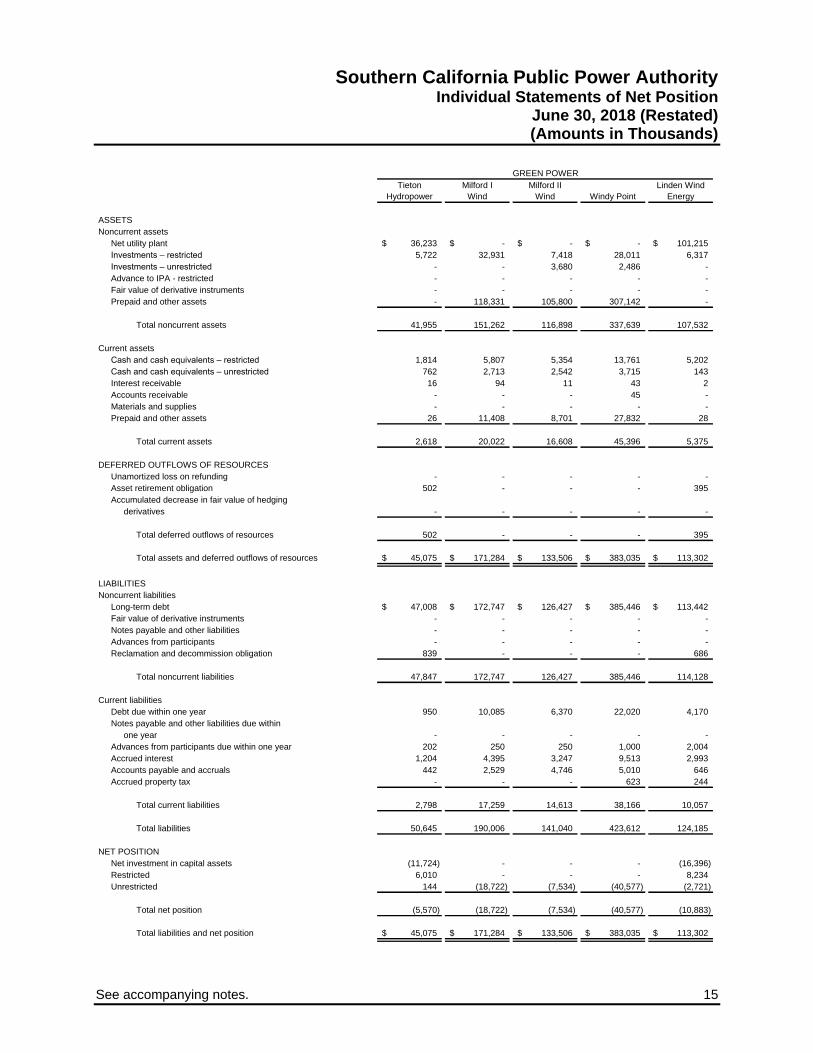
Southern California Public Power Authority Individual Statements of Net Position
June 30, 2018 (Restated) (Amounts in Thousands)
Tieton
Hydropower
Milford I
Wind
Milford II
Wind Windy Point
Linden Wind
Energy
Noncurrent assets
Net utility plant 36,233$ -$ -$ -$ 101,215$
Investments – restricted 5,722 32,931 7,418 28,011 6,317
Investments – unrestricted - - 3,680 2,486 -
Advance to IPA - restricted - - - - -
Fair value of derivative instruments - - - - -
Prepaid and other assets - 118,331 105,800 307,142 -
Total noncurrent assets 41,955 151,262 116,898 337,639 107,532
Current assets
Cash and cash equivalents – restricted 1,814 5,807 5,354 13,761 5,202
Cash and cash equivalents – unrestricted 762 2,713 2,542 3,715 143
Interest receivable 16 94 11 43 2
Accounts receivable - - - 45 -
Materials and supplies - - - - -
Prepaid and other assets 26 11,408 8,701 27,832 28
Total current assets 2,618 20,022 16,608 45,396 5,375
Unamortized loss on refunding - - - - -
Asset retirement obligation 502 - - - 395
Accumulated decrease in fair value of hedging
derivatives - - - - -
Total deferred outflows of resources 502 - - - 395
Total assets and deferred outflows of resources 45,075$ 171,284$ 133,506$ 383,035$ 113,302$
Noncurrent liabilities
Long-term debt 47,008$ 172,747$ 126,427$ 385,446$ 113,442$
Fair value of derivative instruments - - - - -
Notes payable and other liabilities - - - - -
Advances from participants - - - - -
Reclamation and decommission obligation 839 - - - 686
Total noncurrent liabilities 47,847 172,747 126,427 385,446 114,128
Current liabilities
Debt due within one year 950 10,085 6,370 22,020 4,170
Notes payable and other liabilities due within
one year - - - - -
Advances from participants due within one year 202 250 250 1,000 2,004
Accrued interest 1,204 4,395 3,247 9,513 2,993
Accounts payable and accruals 442 2,529 4,746 5,010 646
Accrued property tax - - - 623 244
Total current liabilities 2,798 17,259 14,613 38,166 10,057
Total liabilities 50,645 190,006 141,040 423,612 124,185
NET POSITION
Net investment in capital assets (11,724) - - - (16,396)
Restricted 6,010 - - - 8,234
Unrestricted 144 (18,722) (7,534) (40,577) (2,721)
Total net position (5,570) (18,722) (7,534) (40,577) (10,883)
Total liabilities and net position 45,075$ 171,284$ 133,506$ 383,035$ 113,302$
GREEN POWER
ASSETS
LIABILITIES
DEFERRED OUTFLOWS OF RESOURCES

16 See accompanying notes.
Southern California Public Power Authority Individual Statements of Net Position June 30, 2019 (Amounts in Thousands)
Southern
Transmission
System Mead-Phoenix Mead-Adelanto
Noncurrent assets
Net utility plant 147,997$ 46,808$ 96,686$
Investments – restricted 45,051 3,700 17,400
Investments – unrestricted 9,486 - -
Advance to IPA – restricted 10,930 - -
Fair value of derivative instruments - - 1,094
Prepaid and other assets - - -
Total noncurrent assets 213,464 50,508 115,180
Current assets
Cash and cash equivalents – restricted 25,225 4,747 11,625
Cash and cash equivalents – unrestricted 1,272 906 805
Interest receivable 75 1 1
Accounts receivable 2,939 186 825
Materials and supplies - - -
Prepaid and other assets 35 2 580
Total current assets 29,546 5,842 13,836
Unamortized loss on refunding 28,921 317 908
Asset retirement obligation - - -
Accumulated decrease in fair value of hedging derivatives - - -
Total deferred outflows of resources 28,921 317 908
Total assets and deferred outflows of resources 271,931$ 56,667$ 129,924$
Noncurrent liabilities
Long-term debt 411,623$ 26,461$ 42,593$
Fair value of derivative instruments - - -
Notes payable and other liabilities - - -
Advances from participants - - -
Reclamation and decommission obligation - - -
Total noncurrent liabilities 411,623 26,461 42,593
Current liabilities
Debt due within one year 48,730 7,365 21,565
Notes payable and other liabilities due within one year - - -
Advances from participants due within one year - - -
Accrued interest 9,912 677 1,488
Accounts payable and accruals 11,231 725 1,496
Accrued property tax - - -
Total current liabilities 69,873 8,767 24,549
Total liabilities 481,496 35,228 67,142
NET POSITION
Net investment in capital assets (283,436) 12,982 33,436
Restricted 71,368 8,088 27,327
Unrestricted 2,503 369 2,019
Total net position (209,565) 21,439 62,782
Total liabilities and net position 271,931$ 56,667$ 129,924$
TRANSMISSION
ASSETS
LIABILITIES
DEFERRED OUTFLOWS OF RESOURCES

See accompanying notes. 17
Southern California Public Power Authority Individual Statements of Net Position
June 30, 2018 (Amounts in Thousands)
Southern
Transmission
System Mead-Phoenix Mead-Adelanto
Noncurrent assets
Net utility plant 170,751$ 49,538$ 102,806$
Investments – restricted 61,635 4,940 21,021
Investments – unrestricted - - -
Advance to IPA – restricted 10,930 - -
Fair value of derivative instruments - - -
Prepaid and other assets - - -
Total noncurrent assets 243,316 54,478 123,827
Current assets
Cash and cash equivalents – restricted 28,689 3,444 8,213
Cash and cash equivalents – unrestricted 1,132 913 951
Interest receivable 63 6 33
Accounts receivable 1,377 - 87
Materials and supplies - - -
Prepaid and other assets 31 166 571
Total current assets 31,292 4,529 9,855
Unamortized loss on refunding 40,093 634 1,816
Asset retirement obligation - - -
Accumulated decrease in fair value of hedging derivatives - - -
Total deferred outflows of resources 40,093 634 1,816
Total assets and deferred outflows of resources 314,701$ 59,641$ 135,498$
Noncurrent liabilities
Long-term debt 470,191$ 34,583$ 65,877$
Fair value of derivative instruments - - 1,218
Notes payable and other liabilities - - -
Advances from participants - - -
Reclamation and decommission obligation - - -
Total noncurrent liabilities 470,191 34,583 67,095
Current liabilities
Debt due within one year 56,100 7,185 20,705
Notes payable and other liabilities due within one year - - -
Advances from participants due within one year - - 1,100
Accrued interest 11,468 793 1,942
Accounts payable and accruals 3,913 733 505
Accrued property tax - - -
Total current liabilities 71,481 8,711 24,252
Total liabilities 541,672 43,294 91,347
NET POSITION
Net investment in capital assets (315,447) 7,769 18,040
Restricted 89,849 8,222 26,211
Unrestricted (1,373) 356 (100)
Total net position (226,971) 16,347 44,151
Total liabilities and net position 314,701$ 59,641$ 135,498$
TRANSMISSION
ASSETS
LIABILITIES
DEFERRED OUTFLOWS OF RESOURCES

18 See accompanying notes.
Southern California Public Power Authority Individual Statements of Net Position June 30, 2019 (Amounts in Thousands)
Pinedale Barnett
Prepaid
Natural Gas
Noncurrent assets
Net utility plant 30,997$ 38,821$ -$
Investments – restricted - 32,118 12,679
Investments –unrestricted - - -
Advance to IPA – restricted - - -
Fair value of derivative instruments - - -
Prepaid and other assets 126 - 186,052
Total noncurrent assets 31,123 70,939 198,731
Current assets
Cash and cash equivalents – restricted 3,740 8,878 4,995
Cash and cash equivalents – unrestricted 5,095 2,641 78
Interest receivable 7 129 56
Accounts receivable 453 538 1,575
Materials and supplies - - -
Prepaid and other assets 511 2 11,635
Total current assets 9,806 12,188 18,339
Unamortized loss on refunding - - -
Asset retirement obligation 497 116 -
Accumulated decrease in fair value of hedging derivatives - - 10,500
Total deferred outflows of resources 497 116 10,500
Total assets and deferred outflows of resources 41,426$ 83,243$ 227,570$
Noncurrent liabilities
Long-term debt 14,864$ 34,961$ 286,712$
Fair value of derivative instruments - - 10,500
Notes payable and other liabilities - - -
Advances from participants 12,458 6,569 -
Reclamation and decommission obligation 1,404 297 -
Total noncurrent liabilities 28,726 41,827 297,212
Current liabilities
Debt due within one year 1,627 3,818 6,445
Notes payable and other liabilities due within one year - - -
Advances from participants due within one year 3,549 1,951 -
Accrued interest 477 1,120 2,474
Accounts payable and accruals 2,034 2,410 570
Accrued property tax 979 - -
Total current liabilities 8,666 9,299 9,489
Total liabilities 37,392 51,126 306,701
NET POSITION
Net investment in capital assets 696 22,343 -
Restricted 800 8,998 -
Unrestricted 2,538 776 (79,131)
Total net position 4,034 32,117 (79,131)
Total liabilities and net position 41,426$ 83,243$ 227,570$
NATURAL GAS
ASSETS
LIABILITIES
DEFERRED OUTFLOWS OF RESOURCES

See accompanying notes. 19
Southern California Public Power Authority Individual Statements of Net Position
June 30, 2018 (Restated) (Amounts in Thousands)
Pinedale Barnett
Prepaid
Natural Gas
Noncurrent assets
Net utility plant 34,113$ 41,663$ -$
Investments – restricted - 28,947 12,183
Investments – unrestricted - - -
Advance to IPA – restricted - - -
Fair value of derivative instruments - - -
Prepaid and other assets 126 - 198,337
Total noncurrent assets 34,239 70,610 210,520
Current assets
Cash and cash equivalents – restricted 4,332 11,534 4,789
Cash and cash equivalents – unrestricted 7,341 2,022 110
Interest receivable 7 89 56
Accounts receivable 519 618 1,514
Materials and supplies - - - Prepaid and other assets 511 2 11,477
Total current assets 12,710 14,265 17,946
Unamortized loss on refunding - - -
Asset retirement obligation 535 124 - Accumulated decrease in fair value of hedging derivatives - - 7,425
Total deferred outflows of resources 535 124 7,425
Total assets and deferred outflows of resources 47,484$ 84,999$ 235,891$
Noncurrent liabilities
Long-term debt 16,490$ 38,780$ 293,386$
Fair value of derivative instruments - - 7,425
Notes payable and other liabilities - - -
Advances from participants 13,682 7,274 -
Reclamation and decommission obligation 1,381 292 -
Total noncurrent liabilities 31,553 46,346 300,811
Current liabilities
Debt due within one year 1,770 4,150 5,385
Notes payable and other liabilities due within one year - - -
Advances from participants due within one year 6,136 1,743 -
Accrued interest 526 1,238 2,519
Accounts payable and accruals 2,275 2,150 573
Accrued property tax 999 - -
Total current liabilities 11,706 9,281 8,477
Total liabilities 43,259 55,627 309,288
NET POSITION
Net investment in capital assets 704 16,611 -
Restricted - 12,266 -
Unrestricted 3,521 495 (73,397)
Total net position 4,225 29,372 (73,397)
Total liabilities and net position 47,484$ 84,999$ 235,891$
NATURAL GAS
ASSETS
LIABILITIES
DEFERRED OUTFLOWS OF RESOURCES

20 See accompanying notes.
Southern California Public Power Authority Individual Statements of Net Position June 30, 2019 and 2018 (Amounts in Thousands)
2019 2018
Noncurrent assets
Investments – unrestricted 34,409$ 15,149$
Total noncurrent assets 34,409 15,149
Current assets
Cash and cash equivalents – restricted 34 -
Cash and cash equivalents – unrestricted 48,384 48,773
Interest receivable 87 18
Accounts receivable 1,086 6,342
Prepaid and other assets 125 109
Total current assets 49,716 55,242
Total assets 84,125$ 70,391$
Current liabilities
Advances from participants due within one year 12,163$ 13,563$
Accounts payable and accruals 71,787 56,747
Total current liabilities 83,950 70,310
Total liabilities 83,950 70,310
NET POSITION
Unrestricted 175 81
Total net position 175 81
Total liabilities and net position 84,125$ 70,391$
ASSETS
LIABILITIES
POWER PURCHASE AGREEMENTS
21 See accompanying notes.
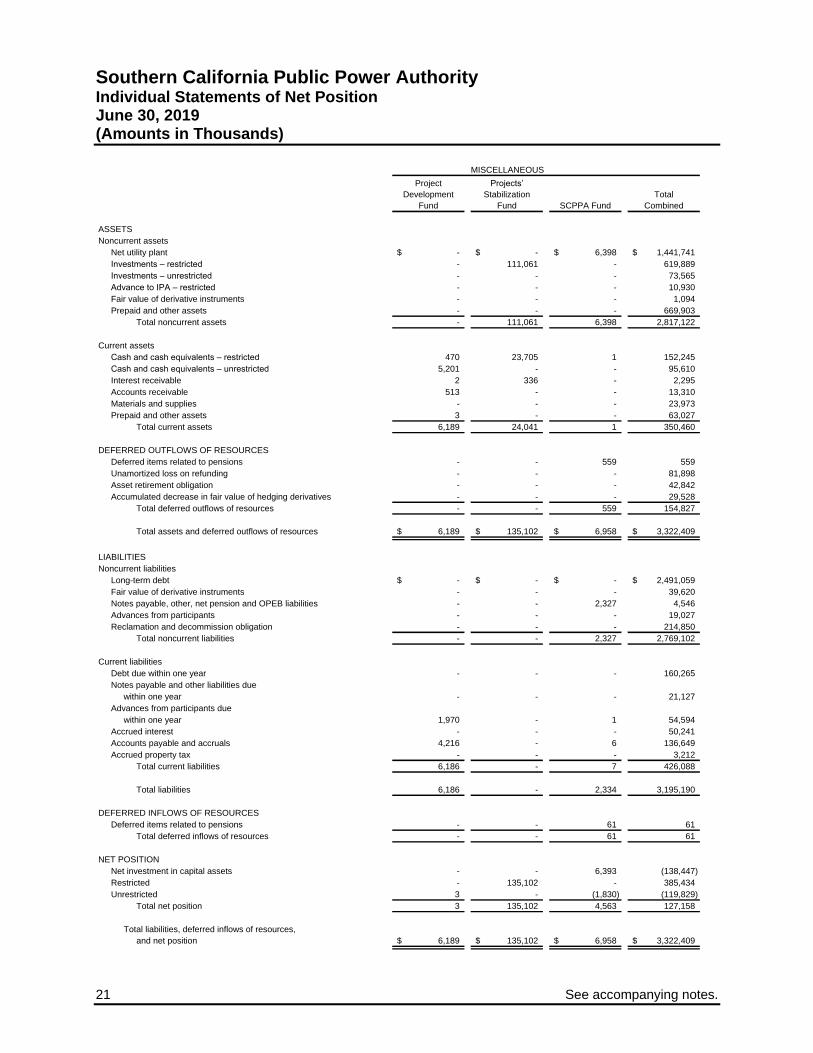
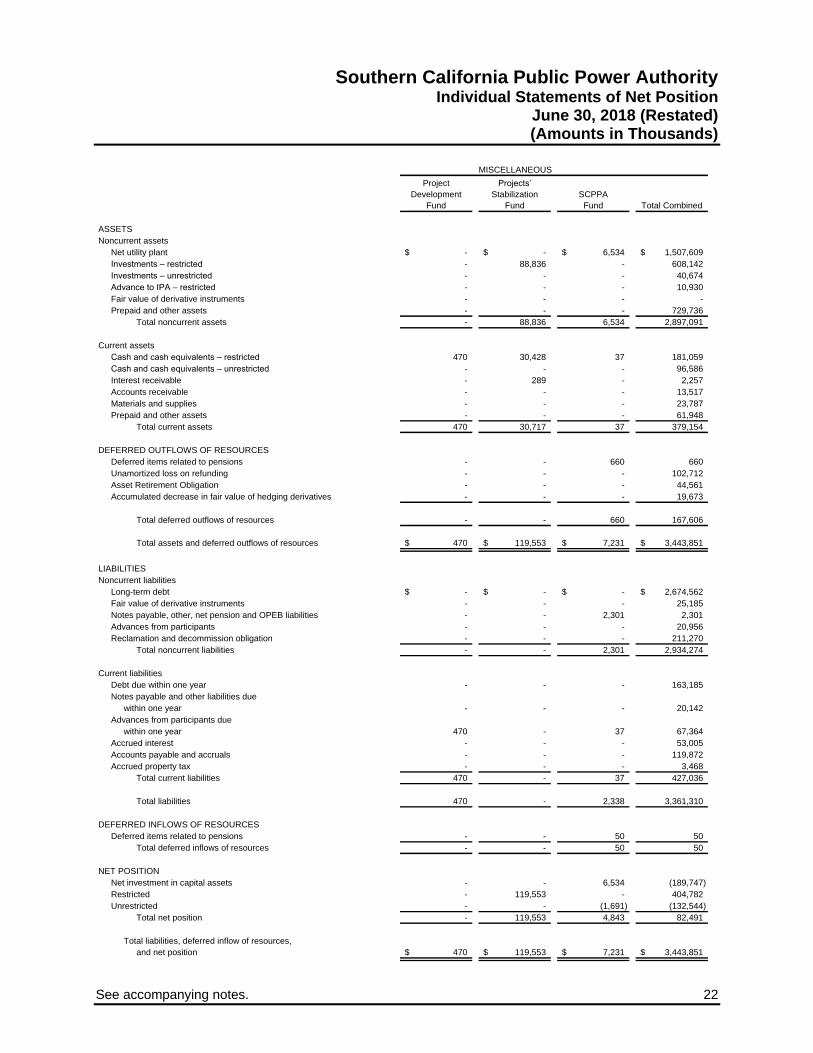
Southern California Public Power Authority Individual Statements of Net Position June 30, 2019 (Amounts in Thousands)
Project
Development
Fund
Projects’
Stabilization
Fund SCPPA Fund
Total
Combined
Noncurrent assets
Net utility plant -$ -$ 6,398$ 1,441,741$
Investments – restricted - 111,061 - 619,889
Investments – unrestricted - - - 73,565
Advance to IPA – restricted - - - 10,930
Fair value of derivative instruments - - - 1,094
Prepaid and other assets - - - 669,903
Total noncurrent assets - 111,061 6,398 2,817,122
Current assets
Cash and cash equivalents – restricted 470 23,705 1 152,245
Cash and cash equivalents – unrestricted 5,201 - - 95,610
Interest receivable 2 336 - 2,295
Accounts receivable 513 - - 13,310
Materials and supplies - - - 23,973
Prepaid and other assets 3 - - 63,027
Total current assets 6,189 24,041 1 350,460
Deferred items related to pensions - - 559 559
Unamortized loss on refunding - - - 81,898
Asset retirement obligation - - - 42,842
Accumulated decrease in fair value of hedging derivatives - - - 29,528
Total deferred outflows of resources - - 559 154,827
Total assets and deferred outflows of resources 6,189$ 135,102$ 6,958$ 3,322,409$
Noncurrent liabilities
Long-term debt -$ -$ -$ 2,491,059$
Fair value of derivative instruments - - - 39,620
Notes payable, other, net pension and OPEB liabilities - - 2,327 4,546
Advances from participants - - - 19,027
Reclamation and decommission obligation - - - 214,850
Total noncurrent liabilities - - 2,327 2,769,102
Current liabilities
Debt due within one year - - - 160,265
Notes payable and other liabilities due
within one year - - - 21,127
Advances from participants due
within one year 1,970 - 1 54,594
Accrued interest - - - 50,241
Accounts payable and accruals 4,216 - 6 136,649
Accrued property tax - - - 3,212
Total current liabilities 6,186 - 7 426,088
Total liabilities 6,186 - 2,334 3,195,190
Deferred items related to pensions - - 61 61
Total deferred inflows of resources - - 61 61
NET POSITION
Net investment in capital assets - - 6,393 (138,447)
Restricted - 135,102 - 385,434
Unrestricted 3 - (1,830) (119,829)
Total net position 3 135,102 4,563 127,158
Total liabilities, deferred inflows of resources,
and net position 6,189$ 135,102$ 6,958$ 3,322,409$
ASSETS
LIABILITIES
DEFERRED OUTFLOWS OF RESOURCES
DEFERRED INFLOWS OF RESOURCES
MISCELLANEOUS
See accompanying notes. 22
Southern California Public Power Authority Individual Statements of Net Position
June 30, 2018 (Restated) (Amounts in Thousands)
Project
Development
Fund
Projects’
Stabilization
Fund
SCPPA
Fund Total Combined
Noncurrent assets
Net utility plant -$ -$ 6,534$ 1,507,609$
Investments – restricted - 88,836 - 608,142
Investments – unrestricted - - - 40,674
Advance to IPA – restricted - - - 10,930
Fair value of derivative instruments - - - -
Prepaid and other assets - - - 729,736
Total noncurrent assets - 88,836 6,534 2,897,091
Current assets
Cash and cash equivalents – restricted 470 30,428 37 181,059
Cash and cash equivalents – unrestricted - - - 96,586
Interest receivable - 289 - 2,257
Accounts receivable - - - 13,517
Materials and supplies - - - 23,787
Prepaid and other assets - - - 61,948
Total current assets 470 30,717 37 379,154
Deferred items related to pensions - - 660 660
Unamortized loss on refunding - - - 102,712
Asset Retirement Obligation - - - 44,561
Accumulated decrease in fair value of hedging derivatives - - - 19,673
Total deferred outflows of resources - - 660 167,606
Total assets and deferred outflows of resources 470$ 119,553$ 7,231$ 3,443,851$
Noncurrent liabilities
Long-term debt -$ -$ -$ 2,674,562$
Fair value of derivative instruments - - - 25,185
Notes payable, other, net pension and OPEB liabilities - - 2,301 2,301
Advances from participants - - - 20,956
Reclamation and decommission obligation - - - 211,270
Total noncurrent liabilities - - 2,301 2,934,274
Current liabilities
Debt due within one year - - - 163,185
Notes payable and other liabilities due
within one year - - - 20,142
Advances from participants due
within one year 470 - 37 67,364
Accrued interest - - - 53,005
Accounts payable and accruals - - - 119,872
Accrued property tax - - - 3,468
Total current liabilities 470 - 37 427,036
Total liabilities 470 - 2,338 3,361,310
DEFERRED INFLOWS OF RESOURCES
Deferred items related to pensions - - 50 50
Total deferred inflows of resources - - 50 50
NET POSITION
Net investment in capital assets - - 6,534 (189,747)
Restricted - 119,553 - 404,782
Unrestricted - - (1,691) (132,544)
Total net position - 119,553 4,843 82,491
Total liabilities, deferred inflow of resources,
and net position 470$ 119,553$ 7,231$ 3,443,851$
ASSETS
LIABILITIES
DEFERRED OUTFLOWS OF RESOURCES
MISCELLANEOUS

23 See accompanying notes.
Southern California Public Power Authority Individual Statements of Revenues, Expenses, and Changes in Net Position for the Year Ended June 30, 2019 (Amounts in Thousands)
Palo Verde San Juan
Magnolia
Power
Canyon
Power Apex Power
Operating revenues
Sales of electric energy 66,182$ 11,558$ 107,267$ 31,057$ 137,004$
Sales of transmission services - - - - -
Sales of natural gas - - - - -
Total operating revenues 66,182 11,558 107,267 31,057 137,004
Operating expenses
Operations and maintenance 40,210 86 95,147 21,639 99,166
Depreciation, depletion and
amortization 22,634 - 10,988 9,685 15,156
Amortization of nuclear fuel 13,102 - - - -
Decommissioning 1,260 - - - 367
Total operating expenses 77,206 86 106,135 31,324 114,689
Operating income (loss) (11,024) 11,472 1,132 (267) 22,315
Non operating revenues (expenses)
Investment and other income 8,527 274 2,203 458 737
Inflation of ARO Liability (2,790) - - - (161)
Derivative gain (loss) - - (5,797) - -
Debt expense - - (11,812) (10,827) (11,486)
Net non operating revenues (expenses) 5,737 274 (15,406) (10,369) (10,910)
Net increase before special items (5,287) 11,746 (14,274) (10,636) 11,405
Special items
Asset impairment - - - - -
Total special Items - - - - -
Change in net position (5,287) 11,746 (14,274) (10,636) 11,405
Net position – beginning of year 368,032 (11,292) (58,084) (44,965) (6,118)
Cumulative effect of restatement of GASB 83 - - - - -
Net position - beginning of year, as restated 368,032 (11,292) (58,084) (44,965) (6,118)
Net contributions (distributions) by participants - - - - -
Net position – end of year 362,745$ 454$ (72,358)$ (55,601)$ 5,287$
GENERATION

See accompanying notes. 24
Southern California Public Power Authority Individual Statements of Revenues, Expenses, and Changes in Net Position
for the Year Ended June 30, 2018 (Restated) (Amounts in Thousands)
Palo Verde San Juan
Magnolia
Power
Canyon
Power Apex Power
Operating revenues
Sales of electric energy 67,561$ 26,757$ 81,368$ 27,636$ 123,288$
Sales of transmission services - - - - -
Sales of natural gas - - - - -
Total operating revenues 67,561 26,757 81,368 27,636 123,288
Operating expenses
Operations and maintenance 41,819 27,488 63,069 11,999 94,060
Depreciation, depletion and
amortization 21,982 3,917 10,978 9,602 13,516
Amortization of nuclear fuel 13,924 - - - -
Decommissioning 1,260 - - - 367
Total operating expenses 78,985 31,405 74,047 21,601 107,943
Operating income (loss) (11,424) (4,648) 7,321 6,035 15,345
Non operating revenues (expenses)
Investment and other income 1,327 797 841 256 368
Inflation of ARO Liability (4,724) - - - (273)
Derivative gain (loss) - - 11,021 - -
Debt expense (5) - (12,922) (12,085) (11,651)
Net non operating revenues (expenses) (3,402) 797 (1,060) (11,829) (11,556)
Net increase before special items (14,826) (3,851) 6,261 (5,794) 3,789
Special items
Asset impairment - (3,261) - - -
Total special items - (3,261) - - -
Change in net position (14,826) (7,112) 6,261 (5,794) 3,789
Net position – beginning of year 224,463 (4,180) (64,345) (39,171) (8,381)
Cumulative effect of restatement of GASB 83 158,395 - - - (1,526)
Net position - beginning of year, as restated 382,858 (4,180) (64,345) (39,171) (9,907)
Net contributions (distributions)
by participants - - - - -
Net position – end of year 368,032$ (11,292)$ (58,084)$ (44,965)$ (6,118)$
GENERATION

25 See accompanying notes.
Southern California Public Power Authority Individual Statements of Revenues, Expenses, and Changes in Net Position for the Year Ended June 30, 2019 (Amounts in Thousands)
Tieton
Hydropower
Milford I
Wind
Milford II
Wind Windy Point
Linden Wind
Energy
Operating revenues
Sales of electric energy 6,060$ 33,698$ 19,750$ 81,117$ 15,990$
Sales of transmission services - - - - -
Sales of natural gas - - - - -
Total operating revenues 6,060 33,698 19,750 81,117 15,990
Operating expenses
Operations and maintenance 2,477 26,675 15,771 68,016 6,805
Depreciation, depletion and
amortization 1,553 - - - 5,814
Amortization of nuclear fuel - - - - -
Decommissioning 23 - - - 23
Total operating expenses 4,053 26,675 15,771 68,016 12,642
Operating income (loss) 2,007 7,023 3,979 13,101 3,348
Non operating revenues (expenses)
Investment and other income 198 791 356 868 987
Inflation of ARO Liability (14) - - - (11)
Derivative gain (loss) - - - - -
Debt expense (2,297) (7,522) (4,958) (14,267) (5,191)
Net non operating revenues (expenses) (2,113) (6,731) (4,602) (13,399) (4,215)
Net increase before special items (106) 292 (623) (298) (867)
Special items
Asset impairment - - - - -
Total special Items - - - - -
Change in net position (106) 292 (623) (298) (867)
Net position – beginning of year (5,570) (18,722) (7,534) (40,577) (10,883)
Cumulative effect of restatement of GASB 83 - - - - -
Net position - beginning of year, as restated (5,570) (18,722) (7,534) (40,577) (10,883)
Net contributions (distributions) by participants - - - - -
Net position – end of year (5,676)$ (18,430)$ (8,157)$ (40,875)$ (11,750)$
GREEN POWER
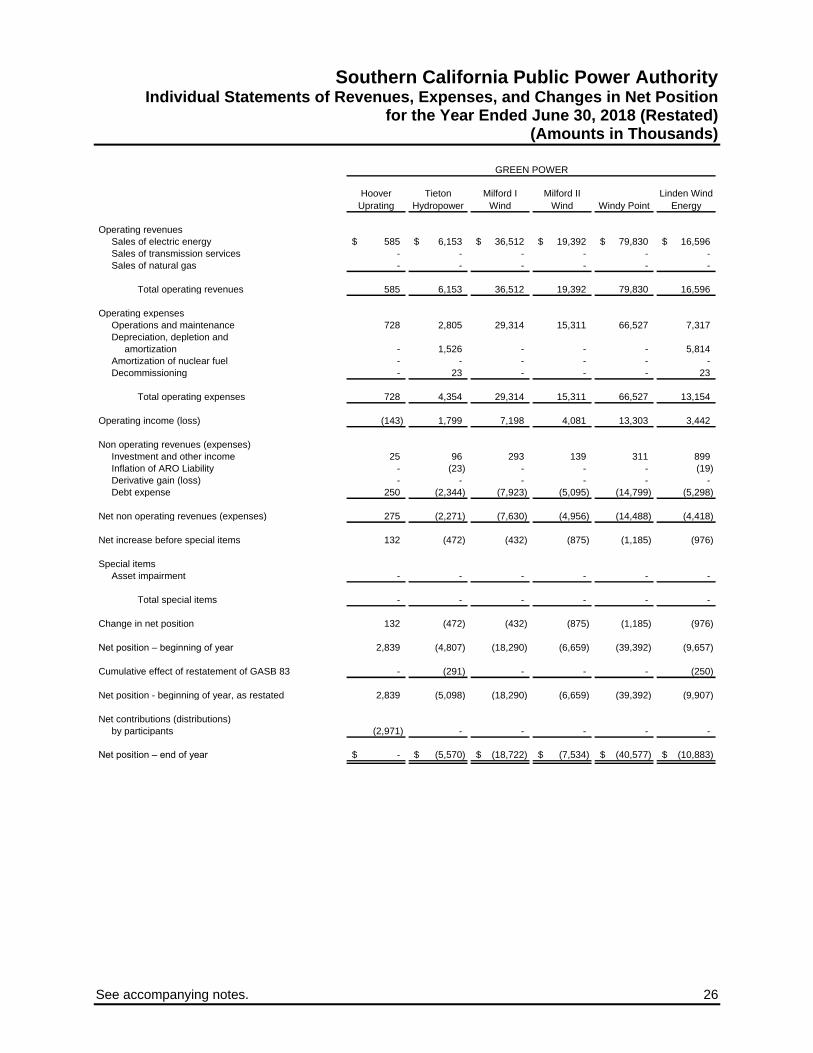
See accompanying notes. 26
Southern California Public Power Authority Individual Statements of Revenues, Expenses, and Changes in Net Position
for the Year Ended June 30, 2018 (Restated) (Amounts in Thousands)
Hoover
Uprating
Tieton
Hydropower
Milford I
Wind
Milford II
Wind Windy Point
Linden Wind
Energy
Operating revenues
Sales of electric energy 585$ 6,153$ 36,512$ 19,392$ 79,830$ 16,596$
Sales of transmission services - - - - - -
Sales of natural gas - - - - - -
Total operating revenues 585 6,153 36,512 19,392 79,830 16,596
Operating expenses
Operations and maintenance 728 2,805 29,314 15,311 66,527 7,317
Depreciation, depletion and
amortization - 1,526 - - - 5,814
Amortization of nuclear fuel - - - - - -
Decommissioning - 23 - - - 23
Total operating expenses 728 4,354 29,314 15,311 66,527 13,154
Operating income (loss) (143) 1,799 7,198 4,081 13,303 3,442
Non operating revenues (expenses)
Investment and other income 25 96 293 139 311 899
Inflation of ARO Liability - (23) - - - (19)
Derivative gain (loss) - - - - - -
Debt expense 250 (2,344) (7,923) (5,095) (14,799) (5,298)
Net non operating revenues (expenses) 275 (2,271) (7,630) (4,956) (14,488) (4,418)
Net increase before special items 132 (472) (432) (875) (1,185) (976)
Special items
Asset impairment - - - - - -
Total special items - - - - - -
Change in net position 132 (472) (432) (875) (1,185) (976)
Net position – beginning of year 2,839 (4,807) (18,290) (6,659) (39,392) (9,657)
Cumulative effect of restatement of GASB 83 - (291) - - - (250)
Net position - beginning of year, as restated 2,839 (5,098) (18,290) (6,659) (39,392) (9,907)
Net contributions (distributions)
by participants (2,971) - - - - -
Net position – end of year -$ (5,570)$ (18,722)$ (7,534)$ (40,577)$ (10,883)$
GREEN POWER
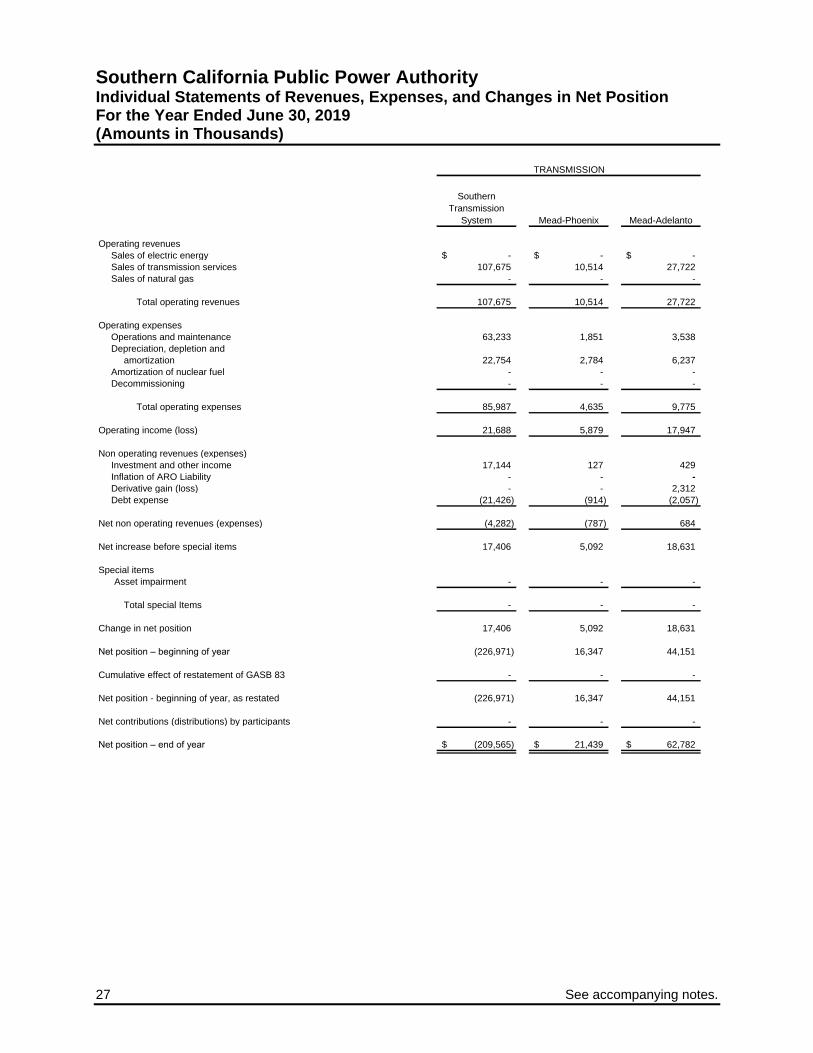
27 See accompanying notes.
Southern California Public Power Authority Individual Statements of Revenues, Expenses, and Changes in Net Position For the Year Ended June 30, 2019 (Amounts in Thousands)
Southern
Transmission
System Mead-Phoenix Mead-Adelanto
Operating revenues
Sales of electric energy -$ -$ -$
Sales of transmission services 107,675 10,514 27,722
Sales of natural gas - - -
Total operating revenues 107,675 10,514 27,722
Operating expenses
Operations and maintenance 63,233 1,851 3,538
Depreciation, depletion and
amortization 22,754 2,784 6,237
Amortization of nuclear fuel - - -
Decommissioning - - -
Total operating expenses 85,987 4,635 9,775
Operating income (loss) 21,688 5,879 17,947
Non operating revenues (expenses)
Investment and other income 17,144 127 429
Inflation of ARO Liability - - -
Derivative gain (loss) - - 2,312
Debt expense (21,426) (914) (2,057)
Net non operating revenues (expenses) (4,282) (787) 684
Net increase before special items 17,406 5,092 18,631
Special items
Asset impairment - - -
Total special Items - - -
Change in net position 17,406 5,092 18,631
Net position – beginning of year (226,971) 16,347 44,151
Cumulative effect of restatement of GASB 83 - - -
Net position - beginning of year, as restated (226,971) 16,347 44,151
Net contributions (distributions) by participants - - -
Net position – end of year (209,565)$ 21,439$ 62,782$
TRANSMISSION

See accompanying notes. 28
Southern California Public Power Authority Individual Statements of Revenues, Expenses, and Changes in Net Position
For the Year Ended June 30, 2018 (Amounts in Thousands)
Southern
Transmission
System Mead-Phoenix Mead-Adelanto
Operating revenues
Sales of electric energy -$ -$ -$
Sales of transmission services 116,080 10,955 28,269
Sales of natural gas - - -
Total operating revenues 116,080 10,955 28,269
Operating expenses
Operations and maintenance 38,058 2,167 3,898
Depreciation, depletion, and
amortization 22,754 2,972 6,262
Amortization of nuclear fuel - - -
Decommissioning - - -
Total operating expenses 60,812 5,139 10,160
Operating income (loss) 55,268 5,816 18,109
Non operating revenues (expenses)
Investment and other income 1,199 62 311
Inflation of ARO Liability - - -
Derivative gain (loss) - - (2,389)
Debt expense (22,805) (1,000) (1,731)
Net non operating revenues (expenses) (21,606) (938) (3,809)
Net increase before special items 33,662 4,878 14,300
Special items
Asset impairment - - -
Total special items - - -
Change in net position 33,662 4,878 14,300
Net position – beginning of year (260,633) 11,469 29,851
Cumulative effect of restatement of GASB 83 - - -
Net position - beginning of year, as restated (260,633) 11,469 29,851
Net contributions (distributions) by participants - - -
Net position – end of year (226,971)$ 16,347$ 44,151$
TRANSMISSION
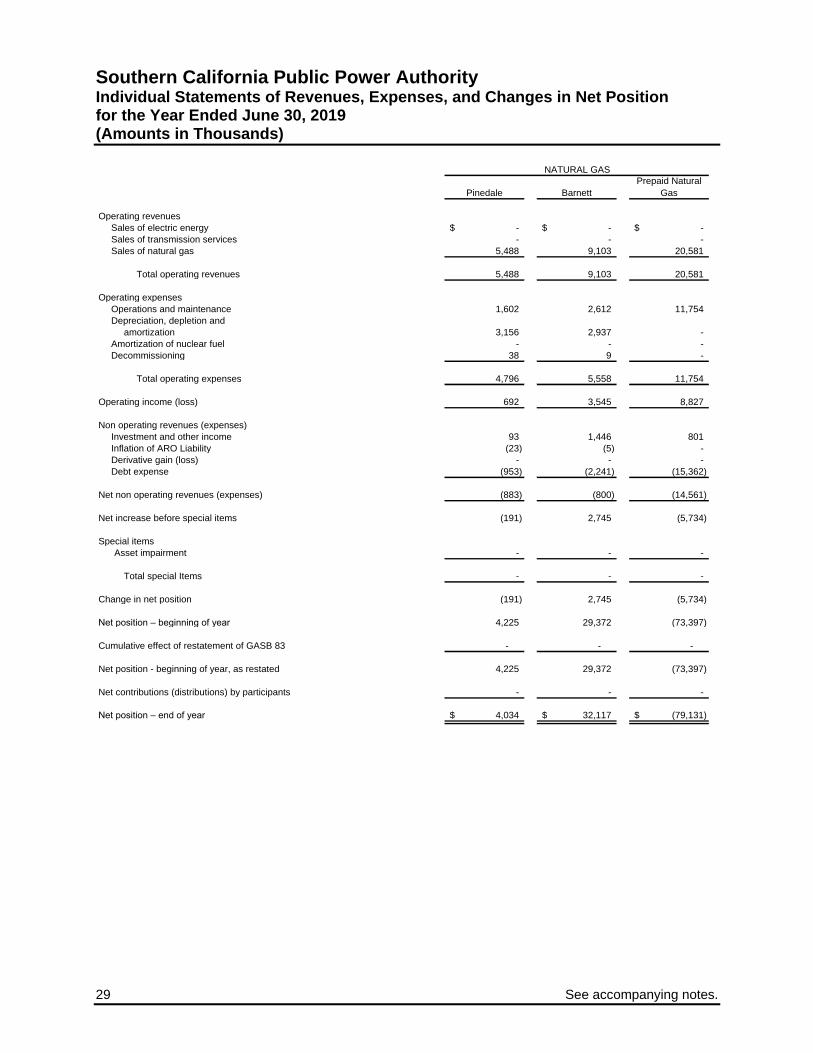
29 See accompanying notes.
Southern California Public Power Authority Individual Statements of Revenues, Expenses, and Changes in Net Position for the Year Ended June 30, 2019 (Amounts in Thousands)
Pinedale Barnett
Prepaid Natural
Gas
Operating revenues
Sales of electric energy -$ -$ -$
Sales of transmission services - - -
Sales of natural gas 5,488 9,103 20,581
Total operating revenues 5,488 9,103 20,581
Operating expenses
Operations and maintenance 1,602 2,612 11,754
Depreciation, depletion and
amortization 3,156 2,937 -
Amortization of nuclear fuel - - -
Decommissioning 38 9 -
Total operating expenses 4,796 5,558 11,754
Operating income (loss) 692 3,545 8,827
Non operating revenues (expenses)
Investment and other income 93 1,446 801
Inflation of ARO Liability (23) (5) -
Derivative gain (loss) - - -
Debt expense (953) (2,241) (15,362)
Net non operating revenues (expenses) (883) (800) (14,561)
Net increase before special items (191) 2,745 (5,734)
Special items
Asset impairment - - -
Total special Items - - -
Change in net position (191) 2,745 (5,734)
Net position – beginning of year 4,225 29,372 (73,397)
Cumulative effect of restatement of GASB 83 - - -
Net position - beginning of year, as restated 4,225 29,372 (73,397)
Net contributions (distributions) by participants - - -
Net position – end of year 4,034$ 32,117$ (79,131)$
NATURAL GAS

See accompanying notes. 30
Southern California Public Power Authority Individual Statements of Revenues, Expenses, and Changes in Net Position
for the Year Ended June 30, 2018 (Restated) (Amounts in Thousands)
Pinedale Barnett
Prepaid
Natural Gas
Operating revenues
Sales of electric energy -$ -$ -$
Sales of transmission services - - -
Sales of natural gas 5,617 9,576 19,895
Total operating revenues 5,617 9,576 19,895
Operating expenses
Operations and maintenance 1,355 2,720 11,645
Depreciation, depletion and
amortization 3,422 1,963 -
Amortization of nuclear fuel - - -
Decommissioning 38 9 -
Total operating expenses 4,815 4,692 11,645
Operating income (loss) 802 4,884 8,250
Non operating revenues (expenses)
Investment and other income 56 318 755
Inflation of ARO Liability (39) (8) -
Derivative gain (loss) - - -
Debt expense (1,052) (2,473) (15,610)
Net non operating revenues (expenses) (1,035) (2,163) (14,855)
Net increase before special items (233) 2,721 (6,605)
Special items
Asset impairment - - -
Total special items - - -
Change in net position (233) 2,721 (6,605)
Net position – beginning of year 5,227 26,802 (66,792)
Cumulative effect of restatement of GASB 83 (769) (151) -
Net position - beginning of year, as restated 4,458 26,651 (66,792)
Net contributions (distributions) by participants - - -
Net position – end of year 4,225$ 29,372$ (73,397)$
NATURAL GAS
31 See accompanying notes.
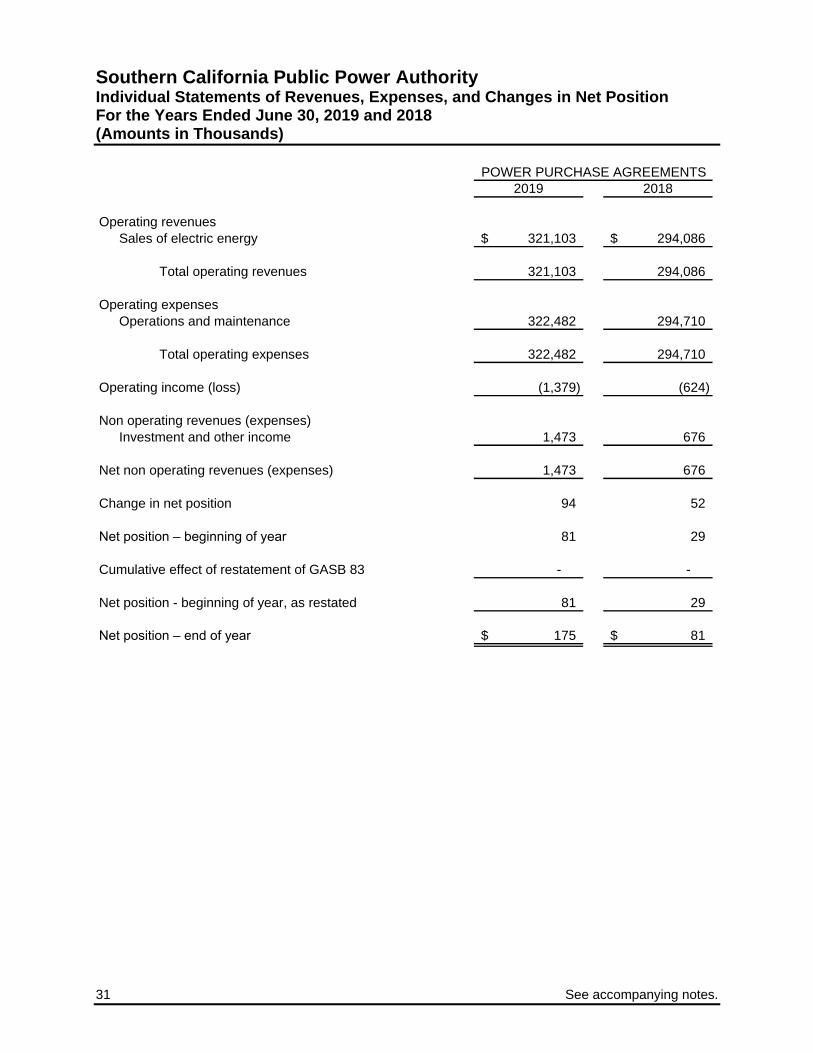
Southern California Public Power Authority Individual Statements of Revenues, Expenses, and Changes in Net Position For the Years Ended June 30, 2019 and 2018 (Amounts in Thousands)
2019 2018
Operating revenues
Sales of electric energy 321,103$ 294,086$
Total operating revenues 321,103 294,086
Operating expenses
Operations and maintenance 322,482 294,710
Total operating expenses 322,482 294,710
Operating income (loss) (1,379) (624)
Non operating revenues (expenses)
Investment and other income 1,473 676
Net non operating revenues (expenses) 1,473 676
Change in net position 94 52
Net position – beginning of year 81 29
Cumulative effect of restatement of GASB 83 - -
Net position - beginning of year, as restated 81 29
Net position – end of year 175$ 81$
POWER PURCHASE AGREEMENTS
32 See accompanying notes.
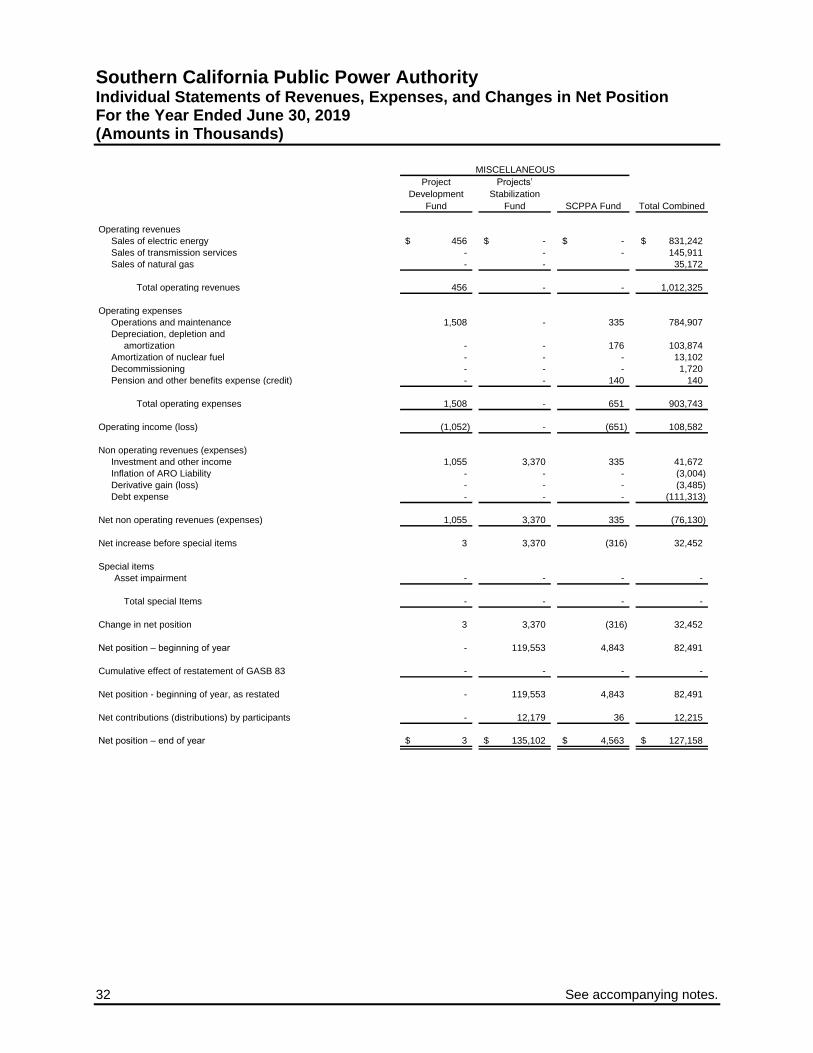
Southern California Public Power Authority Individual Statements of Revenues, Expenses, and Changes in Net Position For the Year Ended June 30, 2019 (Amounts in Thousands)
Project
Development
Fund
Projects’
Stabilization
Fund SCPPA Fund Total Combined
Operating revenues
Sales of electric energy 456$ -$ -$ 831,242$
Sales of transmission services - - - 145,911
Sales of natural gas - - 35,172
Total operating revenues 456 - - 1,012,325
Operating expenses
Operations and maintenance 1,508 - 335 784,907
Depreciation, depletion and
amortization - - 176 103,874
Amortization of nuclear fuel - - - 13,102
Decommissioning - - - 1,720
Pension and other benefits expense (credit) - - 140 140
Total operating expenses 1,508 - 651 903,743
Operating income (loss) (1,052) - (651) 108,582
Non operating revenues (expenses)
Investment and other income 1,055 3,370 335 41,672
Inflation of ARO Liability - - - (3,004)
Derivative gain (loss) - - - (3,485)
Debt expense - - - (111,313)
Net non operating revenues (expenses) 1,055 3,370 335 (76,130)
Net increase before special items 3 3,370 (316) 32,452
Special items
Asset impairment - - - -
Total special Items - - - -
Change in net position 3 3,370 (316) 32,452
Net position – beginning of year - 119,553 4,843 82,491
Cumulative effect of restatement of GASB 83 - - - -
Net position - beginning of year, as restated - 119,553 4,843 82,491
Net contributions (distributions) by participants - 12,179 36 12,215
Net position – end of year 3$ 135,102$ 4,563$ 127,158$
MISCELLANEOUS

See accompanying notes. 33
Southern California Public Power Authority Individual Statements of Revenues, Expenses, and Changes in Net Position
For the Year Ended June 30, 2018 (Restated) (Amounts in Thousands)
Project
Development
Fund
Projects’
Stabilization
Fund
SCPPA
Fund Total Combined
Operating revenues
Sales of electric energy -$ -$ -$ 779,764$
Sales of transmission services - - - 155,304
Sales of natural gas - - - 35,088
Total operating revenues - - - 970,156
Operating expenses
Operations and maintenance - - 308 715,298
Depreciation, depletion, and
amortization - - 119 104,827
Amortization of nuclear fuel - - - 13,924
Decommissioning - - - 1,720
Pension and other benefits expense (credit) - - 1,119 1,119
Total operating expenses - - 1,546 836,888
Operating income (loss) - - (1,546) 133,268
Non operating revenues (expenses)
Investment and other income - 1,200 308 10,237
Inflation of ARO Liability - - - (5,086)
Derivative gain (loss) - - - 8,632
Debt expense - - - (116,543)
Net nonoperating revenues (expenses) - 1,200 308 (102,760)
Net increase before special items - 1,200 (1,238) 30,508
Special items
Asset impairment - - - (3,261)
Total special items - - - (3,261)
Change in net position - 1,200 (1,238) 27,247
Net position – beginning of year - 133,941 4,488 (83,198)
Cumulative effect of restatement of GASB 83 - - - 155,408
Net position - beginning of year, as restated - 133,941 4,488 72,210
Net contributions (distributions) by participants - (15,588) 1,593 (16,966)
Net position – end of year -$ 119,553$ 4,843$ 82,491$
MISCELLANEOUS
34 See accompanying notes.
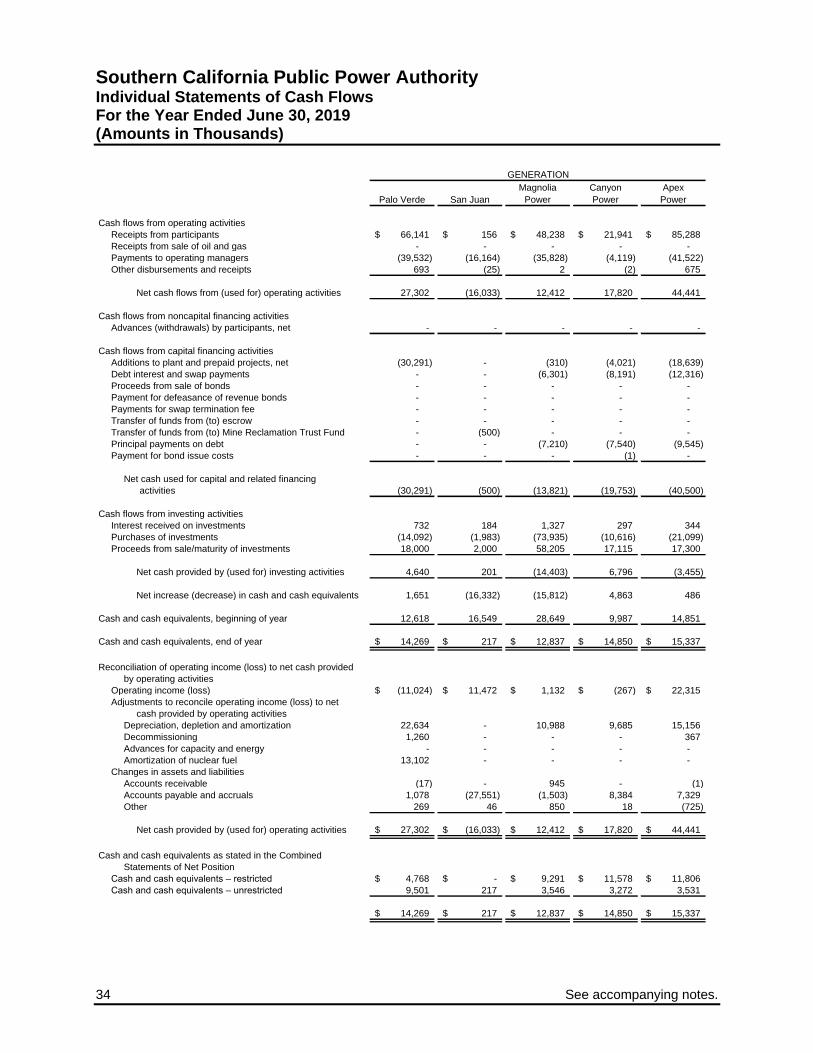
Southern California Public Power Authority Individual Statements of Cash Flows For the Year Ended June 30, 2019 (Amounts in Thousands)
Palo Verde San Juan
Magnolia
Power
Canyon
Power
Apex
Power
Cash flows from operating activities
Receipts from participants 66,141$ 156$ 48,238$ 21,941$ 85,288$
Receipts from sale of oil and gas - - - - -
Payments to operating managers (39,532) (16,164) (35,828) (4,119) (41,522)
Other disbursements and receipts 693 (25) 2 (2) 675
Net cash flows from (used for) operating activities 27,302 (16,033) 12,412 17,820 44,441
Cash flows from noncapital financing activities
Advances (withdrawals) by participants, net - - - - -
Cash flows from capital financing activities
Additions to plant and prepaid projects, net (30,291) - (310) (4,021) (18,639)
Debt interest and swap payments - - (6,301) (8,191) (12,316)
Proceeds from sale of bonds - - - - -
Payment for defeasance of revenue bonds - - - - -
Payments for swap termination fee - - - - -
Transfer of funds from (to) escrow - - - - -
Transfer of funds from (to) Mine Reclamation Trust Fund - (500) - - -
Principal payments on debt - - (7,210) (7,540) (9,545)
Payment for bond issue costs - - - (1) -
Net cash used for capital and related financing
activities (30,291) (500) (13,821) (19,753) (40,500)
Cash flows from investing activities
Interest received on investments 732 184 1,327 297 344
Purchases of investments (14,092) (1,983) (73,935) (10,616) (21,099)
Proceeds from sale/maturity of investments 18,000 2,000 58,205 17,115 17,300
Net cash provided by (used for) investing activities 4,640 201 (14,403) 6,796 (3,455)
Net increase (decrease) in cash and cash equivalents 1,651 (16,332) (15,812) 4,863 486
Cash and cash equivalents, beginning of year 12,618 16,549 28,649 9,987 14,851
Cash and cash equivalents, end of year 14,269$ 217$ 12,837$ 14,850$ 15,337$
Reconciliation of operating income (loss) to net cash provided
by operating activities
Operating income (loss) (11,024)$ 11,472$ 1,132$ (267)$ 22,315$
Adjustments to reconcile operating income (loss) to net
cash provided by operating activities
Depreciation, depletion and amortization 22,634 - 10,988 9,685 15,156
Decommissioning 1,260 - - - 367
Advances for capacity and energy - - - - -
Amortization of nuclear fuel 13,102 - - - -
Changes in assets and liabilities
Accounts receivable (17) - 945 - (1)
Accounts payable and accruals 1,078 (27,551) (1,503) 8,384 7,329
Other 269 46 850 18 (725)
Net cash provided by (used for) operating activities 27,302$ (16,033)$ 12,412$ 17,820$ 44,441$
Cash and cash equivalents as stated in the Combined
Statements of Net Position
Cash and cash equivalents – restricted 4,768$ -$ 9,291$ 11,578$ 11,806$
Cash and cash equivalents – unrestricted 9,501 217 3,546 3,272 3,531
14,269$ 217$ 12,837$ 14,850$ 15,337$
GENERATION
See accompanying notes. 35
Southern California Public Power Authority Individual Statements of Cash Flows
For the Year Ended June 30, 2018 (Restated) (Amounts in Thousands)
Palo Verde San Juan
Magnolia
Power
Canyon
Power Apex Power
Cash flows from operating activities
Receipts from participants 67,374$ 25,476$ 45,476$ 22,840$ 66,294$
Receipts from sale of oil and gas - - - - -
Payments to operating managers (43,367) (26,745) (27,342) (3,857) (34,346)
Other disbursements and receipts 536 - (1) 2 7
Net cash flows from (used for) operating activities 24,543 (1,269) 18,133 18,985 31,955
Cash flows from noncapital financing activities
Advances (withdrawals) by participants, net - - - - 2,000
Cash flows from capital financing activities
Additions to plant and prepaid projects, net (25,636) - (161) (615) (29,002)
Debt interest and swap payments (17) - (9,007) (8,339) (12,453)
Proceeds from sale of bonds - - 109,657 229,213 -
Payment for defeasance of revenue bonds - - (108,966) - -
Payment for swap termination fee - - (7,334) - -
Transfer of funds from (to) Mine Reclamation Trust Fund - (17,790) - (232,407) -
Principal payments on debt (12,410) - (7,230) (7,185) (9,435)
Payment for bond issue costs - - (712) (983) -
Net cash used for capital and related financing
activities (38,063) (17,790) (23,753) (20,316) (50,890)
Cash flows from investing activities
Interest received on investments 231 333 861 189 392
Purchases of investments (41,638) (4,990) (39,830) (13,630) (18,334)
Proceeds from sale/maturity of investments 48,305 36,165 45,474 18,149 42,016
Net cash provided by (used for) investing activities 6,898 31,508 6,505 4,708 24,074
Net increase (decrease) in cash and cash equivalents (6,622) 12,449 885 3,377 7,139
Cash and cash equivalents, beginning of year 19,240 4,100 27,764 6,610 7,712
Cash and cash equivalents, end of year 12,618$ 16,549$ 28,649$ 9,987$ 14,851$
Reconciliation of operating income (loss) to net cash
provided by operating activities
Operating income (loss) (11,424)$ (4,648)$ 7,321$ 6,035$ 15,345$
Adjustments to reconcile operating income (loss) to net
cash provided by operating activities
Depreciation, depletion, and amortization 21,982 3,917 10,978 9,602 13,516
Decommissioning 1,260 - - - 367
Advances for capacity and energy - - - - -
Amortization of nuclear fuel 13,924 - - - -
Changes in assets and liabilities
Accounts receivable 282 70 (53) 591 2,378
Accounts payable and accruals (2,261) (2,106) 2,152 2,793 307
Other 780 1,498 (2,265) (36) 42
Net cash provided by (used for) operating activities 24,543$ (1,269)$ 18,133$ 18,985$ 31,955$
Cash and cash equivalents as stated in the Combined
Statements of Net Position
Cash and cash equivalents – restricted 4,761$ 9,840$ 20,373$ 8,477$ 13,734$
Cash and cash equivalents – unrestricted 7,857 6,709 8,276 1,510 1,117
12,618$ 16,549$ 28,649$ 9,987$ 14,851$
GENERATION

36 See accompanying notes.
Southern California Public Power Authority Individual Statements of Cash Flows For the Year Ended June 30, 2019 (Amounts in Thousands)
Tieton
Hydropower
Milford I
Wind
Milford II
Wind Windy Point
Linden Wind
Energy
Cash flows from operating activities
Receipts from participants 6,017$ 28,992$ 17,409$ 79,760$ 16,293$
Receipts from sale of oil and gas - - - - -
Payments to operating managers (2,587) (15,877) (7,017) (39,634) (6,867)
Other disbursements and receipts - (1) (1) - -
Net cash flows from operating activities 3,430 13,114 10,391 40,126 9,426
Cash flows from noncapital financing activities
Advances (withdrawals) by participants, net - - - - -
Cash flows from capital financing activities
Additions to plant and prepaid projects, net (354) - - - -
Debt interest and swap payments (2,385) (8,545) (6,346) (18,515) (5,095)
Proceeds from sale of bonds - - - - -
Payment for defeasance of revenue bonds - - - - -
Transfer of funds from (to) escrow - - - - -
Transfer of funds from (to) Mine Reclamation Trust Fund - - - - -
Principal payments on debt (950) (10,085) (6,370) (22,020) (4,170)
Payment for bond issue costs - - - - -
Net cash used for capital and related financing
activities (3,689) (18,630) (12,716) (40,535) (9,265)
Cash flows from investing activities
Interest received on investments 117 399 168 341 111
Purchases of investments (3,905) (25,751) (8,820) (36,873) (8,522)
Proceeds from sale/maturity of investments 4,010 32,058 11,200 35,725 8,820
Net cash provided by (used for) investing activities 222 6,706 2,548 (807) 409
Net increase (decrease) in cash and cash
equivalents (37) 1,190 223 (1,216) 570
Cash and cash equivalents, beginning of year 2,576 8,520 7,896 17,476 5,345
Cash and cash equivalents, end of year 2,539$ 9,710$ 8,119$ 16,260$ 5,915$
Reconciliation of operating income (loss) to net cash
provided by operating activities
Operating income (loss) 2,007$ 7,023$ 3,979$ 13,101$ 3,348$
Adjustments to reconcile operating income (loss) to net
cash provided by operating activities
Depreciation, depletion and amortization 1,553 11,338 8,643 27,373 5,814
Decommissioning 23 - - - 23
Advances for capacity and energy - - - - -
Amortization of nuclear fuel - - - - -
Changes in assets and liabilities
Accounts receivable (146) (3,264) - 45 -
Accounts payable and accruals 142 (1,983) (2,231) (371) 241
Other (149) - - (22) -
Net cash provided by operating activities 3,430$ 13,114$ 10,391$ 40,126$ 9,426$
Cash and cash equivalents as stated in the Combined
Statements of Net Position
Cash and cash equivalents – restricted 1,934$ 9,697$ 4,131$ 10,403$ 5,217$
Cash and cash equivalents – unrestricted 605 13 3,988 5,857 698
2,539$ 9,710$ 8,119$ 16,260$ 5,915$
GREEN POWER
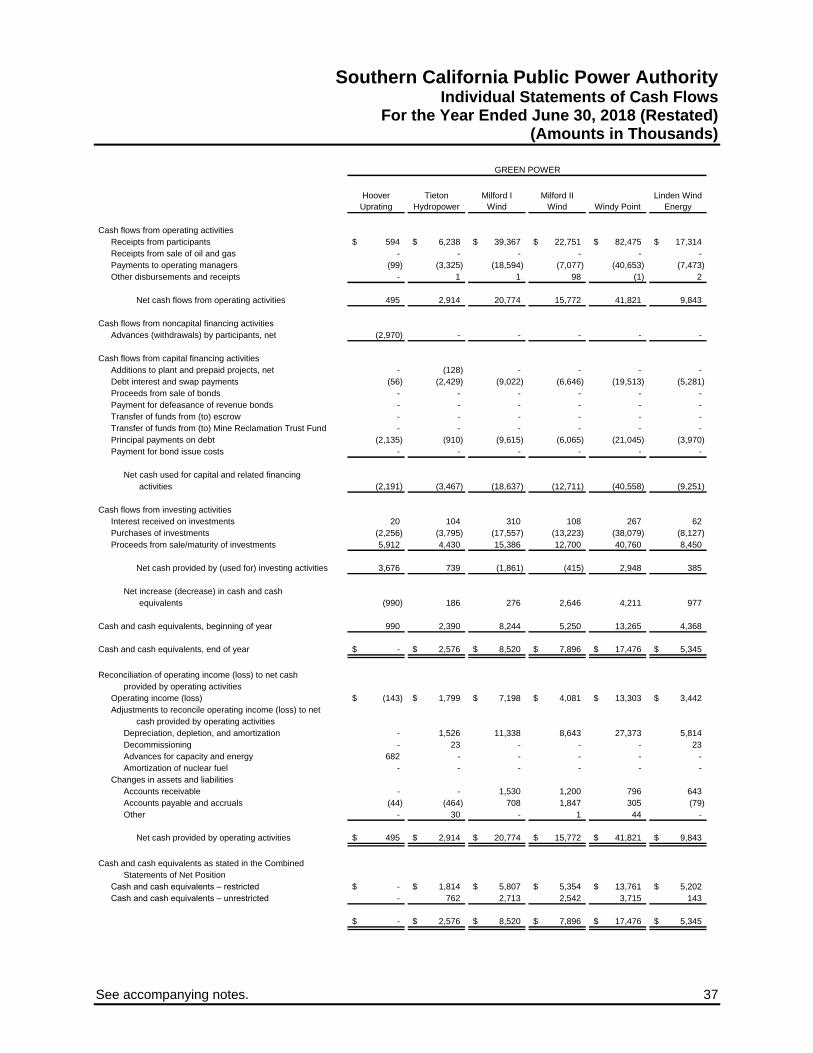
See accompanying notes. 37
Southern California Public Power Authority Individual Statements of Cash Flows
For the Year Ended June 30, 2018 (Restated) (Amounts in Thousands)
Hoover
Uprating
Tieton
Hydropower
Milford I
Wind
Milford II
Wind Windy Point
Linden Wind
Energy
Cash flows from operating activities
Receipts from participants 594$ 6,238$ 39,367$ 22,751$ 82,475$ 17,314$
Receipts from sale of oil and gas - - - - - -
Payments to operating managers (99) (3,325) (18,594) (7,077) (40,653) (7,473)
Other disbursements and receipts - 1 1 98 (1) 2
Net cash flows from operating activities 495 2,914 20,774 15,772 41,821 9,843
Cash flows from noncapital financing activities
Advances (withdrawals) by participants, net (2,970) - - - - -
Cash flows from capital financing activities
Additions to plant and prepaid projects, net - (128) - - - -
Debt interest and swap payments (56) (2,429) (9,022) (6,646) (19,513) (5,281)
Proceeds from sale of bonds - - - - - -
Payment for defeasance of revenue bonds - - - - - -
Transfer of funds from (to) escrow - - - - - -
Transfer of funds from (to) Mine Reclamation Trust Fund - - - - - -
Principal payments on debt (2,135) (910) (9,615) (6,065) (21,045) (3,970)
Payment for bond issue costs - - - - - -
Net cash used for capital and related financing
activities (2,191) (3,467) (18,637) (12,711) (40,558) (9,251)
Cash flows from investing activities
Interest received on investments 20 104 310 108 267 62
Purchases of investments (2,256) (3,795) (17,557) (13,223) (38,079) (8,127)
Proceeds from sale/maturity of investments 5,912 4,430 15,386 12,700 40,760 8,450
Net cash provided by (used for) investing activities 3,676 739 (1,861) (415) 2,948 385
Net increase (decrease) in cash and cash
equivalents (990) 186 276 2,646 4,211 977
Cash and cash equivalents, beginning of year 990 2,390 8,244 5,250 13,265 4,368
Cash and cash equivalents, end of year -$ 2,576$ 8,520$ 7,896$ 17,476$ 5,345$
Reconciliation of operating income (loss) to net cash
provided by operating activities
Operating income (loss) (143)$ 1,799$ 7,198$ 4,081$ 13,303$ 3,442$
Adjustments to reconcile operating income (loss) to net
cash provided by operating activities
Depreciation, depletion, and amortization - 1,526 11,338 8,643 27,373 5,814
Decommissioning - 23 - - - 23
Advances for capacity and energy 682 - - - - -
Amortization of nuclear fuel - - - - - -
Changes in assets and liabilities
Accounts receivable - - 1,530 1,200 796 643
Accounts payable and accruals (44) (464) 708 1,847 305 (79)
Other - 30 - 1 44 -
Net cash provided by operating activities 495$ 2,914$ 20,774$ 15,772$ 41,821$ 9,843$
Cash and cash equivalents as stated in the Combined
Statements of Net Position
Cash and cash equivalents – restricted -$ 1,814$ 5,807$ 5,354$ 13,761$ 5,202$
Cash and cash equivalents – unrestricted - 762 2,713 2,542 3,715 143
-$ 2,576$ 8,520$ 7,896$ 17,476$ 5,345$
GREEN POWER
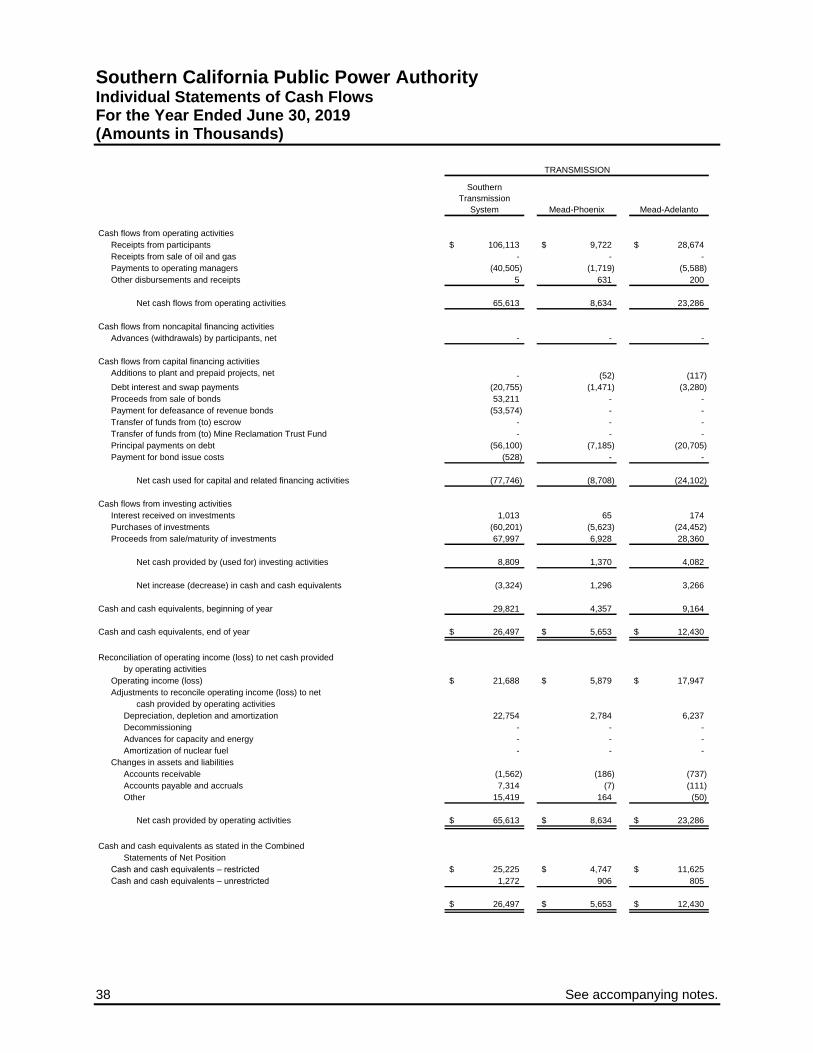
38 See accompanying notes.
Southern California Public Power Authority Individual Statements of Cash Flows For the Year Ended June 30, 2019 (Amounts in Thousands)
Southern
Transmission
System Mead-Phoenix Mead-Adelanto
Cash flows from operating activities
Receipts from participants 106,113$ 9,722$ 28,674$
Receipts from sale of oil and gas - - -
Payments to operating managers (40,505) (1,719) (5,588)
Other disbursements and receipts 5 631 200
Net cash flows from operating activities 65,613 8,634 23,286
Cash flows from noncapital financing activities
Advances (withdrawals) by participants, net - - -
Cash flows from capital financing activities
Additions to plant and prepaid projects, net - (52) (117)
Debt interest and swap payments (20,755) (1,471) (3,280)
Proceeds from sale of bonds 53,211 - -
Payment for defeasance of revenue bonds (53,574) - -
Transfer of funds from (to) escrow - - -
Transfer of funds from (to) Mine Reclamation Trust Fund - - -
Principal payments on debt (56,100) (7,185) (20,705)
Payment for bond issue costs (528) - -
Net cash used for capital and related financing activities (77,746) (8,708) (24,102)
Cash flows from investing activities
Interest received on investments 1,013 65 174
Purchases of investments (60,201) (5,623) (24,452)
Proceeds from sale/maturity of investments 67,997 6,928 28,360
Net cash provided by (used for) investing activities 8,809 1,370 4,082
Net increase (decrease) in cash and cash equivalents (3,324) 1,296 3,266
Cash and cash equivalents, beginning of year 29,821 4,357 9,164
Cash and cash equivalents, end of year 26,497$ 5,653$ 12,430$
Reconciliation of operating income (loss) to net cash provided
by operating activities
Operating income (loss) 21,688$ 5,879$ 17,947$
Adjustments to reconcile operating income (loss) to net
cash provided by operating activities
Depreciation, depletion and amortization 22,754 2,784 6,237
Decommissioning - - -
Advances for capacity and energy - - -
Amortization of nuclear fuel - - -
Changes in assets and liabilities
Accounts receivable (1,562) (186) (737)
Accounts payable and accruals 7,314 (7) (111)
Other 15,419 164 (50)
Net cash provided by operating activities 65,613$ 8,634$ 23,286$
Cash and cash equivalents as stated in the Combined
Statements of Net Position
Cash and cash equivalents – restricted 25,225$ 4,747$ 11,625$
Cash and cash equivalents – unrestricted 1,272 906 805
26,497$ 5,653$ 12,430$
TRANSMISSION
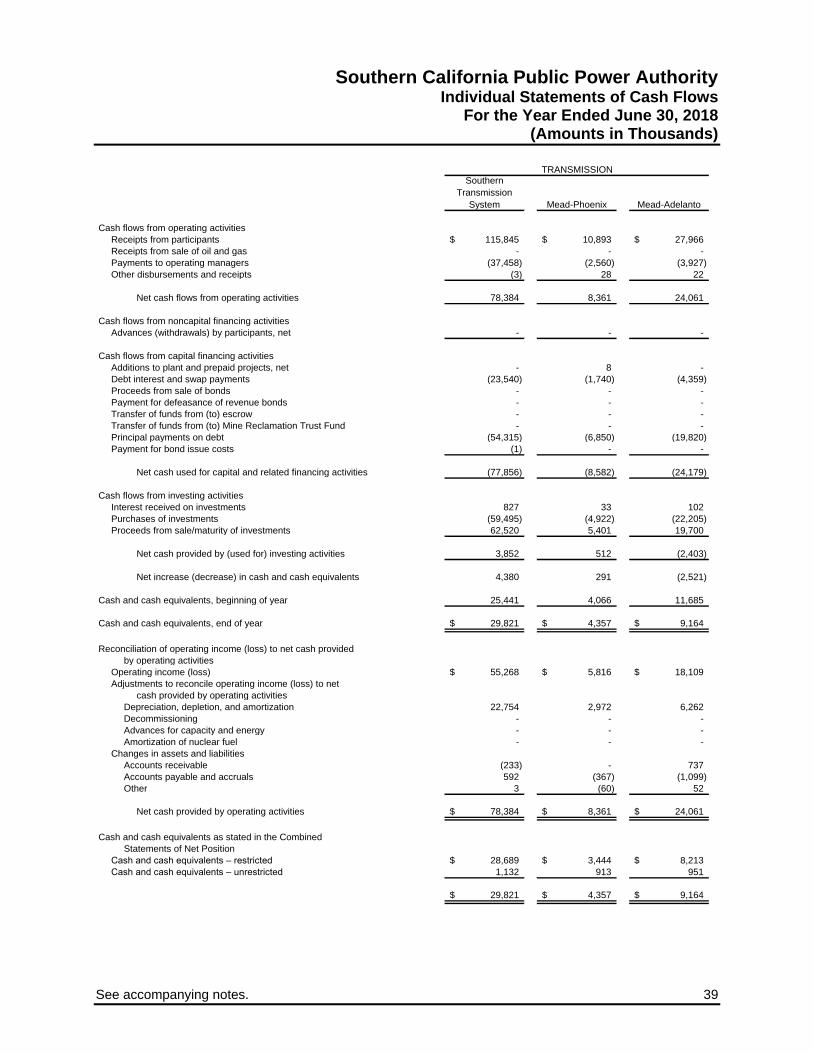
See accompanying notes. 39
Southern California Public Power Authority Individual Statements of Cash Flows
For the Year Ended June 30, 2018 (Amounts in Thousands)
Southern
Transmission
System Mead-Phoenix Mead-Adelanto
Cash flows from operating activities
Receipts from participants 115,845$ 10,893$ 27,966$
Receipts from sale of oil and gas - - -
Payments to operating managers (37,458) (2,560) (3,927)
Other disbursements and receipts (3) 28 22
Net cash flows from operating activities 78,384 8,361 24,061
Cash flows from noncapital financing activities
Advances (withdrawals) by participants, net - - -
Cash flows from capital financing activities
Additions to plant and prepaid projects, net - 8 -
Debt interest and swap payments (23,540) (1,740) (4,359)
Proceeds from sale of bonds - - -
Payment for defeasance of revenue bonds - - -
Transfer of funds from (to) escrow - - -
Transfer of funds from (to) Mine Reclamation Trust Fund - - -
Principal payments on debt (54,315) (6,850) (19,820)
Payment for bond issue costs (1) - -
Net cash used for capital and related financing activities (77,856) (8,582) (24,179)
Cash flows from investing activities
Interest received on investments 827 33 102
Purchases of investments (59,495) (4,922) (22,205)
Proceeds from sale/maturity of investments 62,520 5,401 19,700
Net cash provided by (used for) investing activities 3,852 512 (2,403)
Net increase (decrease) in cash and cash equivalents 4,380 291 (2,521)
Cash and cash equivalents, beginning of year 25,441 4,066 11,685
Cash and cash equivalents, end of year 29,821$ 4,357$ 9,164$
Reconciliation of operating income (loss) to net cash provided
by operating activities
Operating income (loss) 55,268$ 5,816$ 18,109$
Adjustments to reconcile operating income (loss) to net
cash provided by operating activities
Depreciation, depletion, and amortization 22,754 2,972 6,262
Decommissioning - - -
Advances for capacity and energy - - -
Amortization of nuclear fuel - - -
Changes in assets and liabilities
Accounts receivable (233) - 737
Accounts payable and accruals 592 (367) (1,099)
Other 3 (60) 52
Net cash provided by operating activities 78,384$ 8,361$ 24,061$
Cash and cash equivalents as stated in the Combined
Statements of Net Position
Cash and cash equivalents – restricted 28,689$ 3,444$ 8,213$
Cash and cash equivalents – unrestricted 1,132 913 951
29,821$ 4,357$ 9,164$
TRANSMISSION

40 See accompanying notes.
Southern California Public Power Authority Individual Statements of Cash Flows For the Year Ended June 30, 2019 (Amounts in Thousands)
Pinedale Barnett
Prepaid
Natural Gas
Cash flows from operating activities
Receipts from participants 2,950$ 6,627$ 15,874$
Receipts from sale of oil and gas 886 2,613 4,666
Payments to operating managers (1,393) (2,635) (308)
Other disbursements and receipts - - -
Net cash flows from operating activities 2,443 6,605 20,232
Cash flows from noncapital financing activities
Advances (withdrawals) by participants, net (2,568) (30) -
Cash flows from capital financing activities
Additions to plant and prepaid projects, net (36) (97) -
Debt interest and swap payments (1,003) (2,357) (14,979)
Proceeds from sale of bonds - - -
Payment for defeasance of revenue bonds - - -
Transfer of funds from (to) escrow - - -
Transfer of funds from (to) Mine Reclamation Trust Fund - - -
Principal payments on debt (1,770) (4,150) (5,385)
Payment for bond issue costs - - -
Net cash used for capital and related financing activities (2,809) (6,604) (20,364)
Cash flows from investing activities
Interest received on investments 96 645 802
Purchases of investments - (24,533) (16,963)
Proceeds from sale/maturity of investments - 21,880 16,467
Net cash provided by (used for) investing activities 96 (2,008) 306
Net increase (decrease) in cash and cash equivalents (2,838) (2,037) 174
Cash and cash equivalents, beginning of year 11,673 13,556 4,899
Cash and cash equivalents, end of year 8,835$ 11,519$ 5,073$
Reconciliation of operating income (loss) to net cash provided
by operating activities
Operating income (loss) 692$ 3,545$ 8,827$
Adjustments to reconcile operating income (loss) to net
cash provided by operating activities
Depreciation, depletion, and amortization 3,156 2,937 -
Decommissioning 38 9 -
Advances for capacity and energy - - -
Amortization of nuclear fuel - - -
Changes in assets and liabilities
Accounts receivable 11 82 (61)
Accounts payable and accruals (280) 566 (4)
Other (1,174) (534) 11,470
Net cash provided by operating activities 2,443$ 6,605$ 20,232$
Cash and cash equivalents as stated in the Combined
Statements of Net Position
Cash and cash equivalents – restricted 3,740$ 8,878$ 4,995$
Cash and cash equivalents – unrestricted 5,095 2,641 78
8,835$ 11,519$ 5,073$
NATURAL GAS

See accompanying notes. 41
Southern California Public Power Authority Individual Statements of Cash Flows
For the Year Ended June 30, 2018 (Restated) (Amounts in Thousands)
Pinedale Barnett
Prepaid
Natural Gas
Cash flows from operating activities
Receipts from participants 3,046$ 7,236$ 8,054$
Receipts from sale of oil and gas 861 2,489 11,780
Payments to operating managers (1,301) (2,928) (240)
Other disbursements and receipts - - -
Net cash flows from operating activities 2,606 6,797 19,594
Cash flows from noncapital financing activities
Advances (withdrawals) by participants, net 1,118 (3) -
Cash flows from capital financing activities
Additions to plant and prepaid projects, net (9) (98) -
Debt interest and swap payments (1,104) (2,596) (15,226)
Proceeds from sale of bonds - - -
Payment for defeasance of revenue bonds - - -
Transfer of funds from (to) escrow - - -
Transfer of funds from (to) Mine Reclamation Trust Fund - - -
Principal payments on debt (1,980) (4,640) (4,605)
Payment for bond issue costs - - -
Net cash used for capital and related financing activities (3,093) (7,334) (19,831)
Cash flows from investing activities
Interest received on investments 50 448 733
Purchases of investments - (24,683) (17,709)
Proceeds from sale/maturity of investments 998 27,486 17,371
Net cash provided by (used for) investing activities 1,048 3,251 395
Net increase (decrease) in cash and cash equivalents 1,679 2,711 158
Cash and cash equivalents, beginning of year 9,994 10,845 4,741
Cash and cash equivalents, end of year 11,673$ 13,556$ 4,899$
Reconciliation of operating income (loss) to net cash provided
by operating activities
Operating income (loss) 802$ 4,884$ 8,250$
Adjustments to reconcile operating income (loss) to net
cash provided by operating activities
Depreciation, depletion, and amortization 3,422 1,963 -
Decommissioning 38 9 -
Advances for capacity and energy - - -
Amortization of nuclear fuel - - -
Changes in assets and liabilities
Accounts receivable 12 5 (46)
Accounts payable and accruals (206) 267 13
Other (1,462) (331) 11,377
Net cash provided by operating activities 2,606$ 6,797$ 19,594$
Cash and cash equivalents as stated in the Combined
Statements of Net Position
Cash and cash equivalents – restricted 4,332$ 11,534$ 4,789$
Cash and cash equivalents – unrestricted 7,341 2,022 110
11,673$ 13,556$ 4,899$
NATURAL GAS

42 See accompanying notes.
Southern California Public Power Authority Individual Statements of Cash Flows For the Year Ended June 30, 2019 and 2018 (Amounts in Thousands)
2019 2018
Cash flows from operating activities
Receipts from participants 288,312$ 265,243$
Receipts from sale of oil and gas - -
Payments to operating managers (286,877) (266,696)
Other disbursements and receipts 16,164 11,826
Net cash flows from operating activities 17,599 10,373
Cash flows from noncapital financing activities
Advances (withdrawals) by participants, net - -
Cash flows from investing activities
Interest received on investments 1,098 480
Purchases of investments (44,052) (20,096)
Proceeds from sale/maturity of investments 25,000 19,400
Net cash provided by (used for) investing activities (17,954) (216)
Net increase (decrease) in cash and cash equivalents (355) 10,157
Cash and cash equivalents, beginning of year 48,773 38,616
Cash and cash equivalents, end of year 48,418$ 48,773$
Reconciliation of operating income (loss) to net cash
provided by operating activities
Operating income (loss) (1,379)$ (624)$
Changes in assets and liabilities
Accounts receivable 5,254 996
Accounts payable and accruals 13,743 10,020
Other (19) (19)
Net cash provided by operating activities 17,599$ 10,373$
Cash and cash equivalents as stated in the Combined
Statements of Net Position
Cash and cash equivalents – restricted 34$ -$
Cash and cash equivalents – unrestricted 48,384 48,773
48,418$ 48,773$
POWER PURCHASE AGREEMENTS
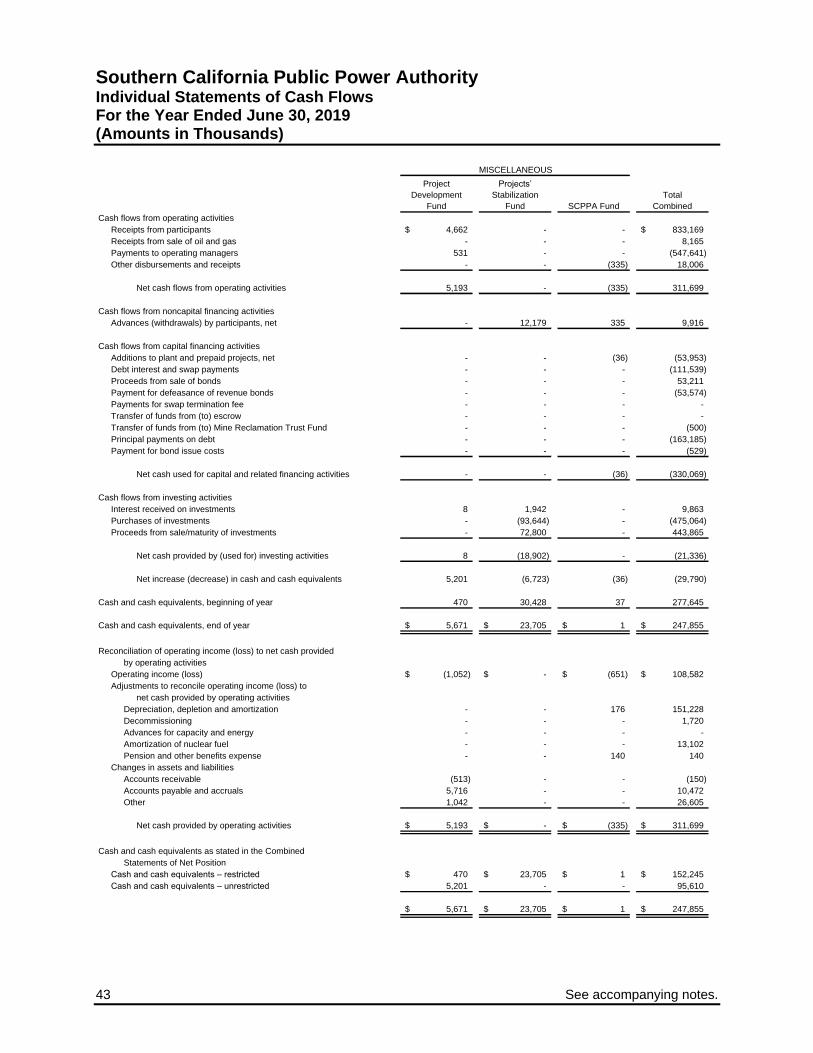
43 See accompanying notes.
Southern California Public Power Authority Individual Statements of Cash Flows For the Year Ended June 30, 2019 (Amounts in Thousands)
Project
Development
Fund
Projects’
Stabilization
Fund SCPPA Fund
Total
Combined
Cash flows from operating activities
Receipts from participants 4,662$ - - 833,169$
Receipts from sale of oil and gas - - - 8,165
Payments to operating managers 531 - - (547,641)
Other disbursements and receipts - - (335) 18,006
Net cash flows from operating activities 5,193 - (335) 311,699
Cash flows from noncapital financing activities
Advances (withdrawals) by participants, net - 12,179 335 9,916
Cash flows from capital financing activities
Additions to plant and prepaid projects, net - - (36) (53,953)
Debt interest and swap payments - - - (111,539)
Proceeds from sale of bonds - - - 53,211
Payment for defeasance of revenue bonds - - - (53,574)
Payments for swap termination fee - - - -
Transfer of funds from (to) escrow - - - -
Transfer of funds from (to) Mine Reclamation Trust Fund - - - (500)
Principal payments on debt - - - (163,185)
Payment for bond issue costs - - - (529)
Net cash used for capital and related financing activities - - (36) (330,069)
Cash flows from investing activities
Interest received on investments 8 1,942 - 9,863
Purchases of investments - (93,644) - (475,064)
Proceeds from sale/maturity of investments - 72,800 - 443,865
Net cash provided by (used for) investing activities 8 (18,902) - (21,336)
Net increase (decrease) in cash and cash equivalents 5,201 (6,723) (36) (29,790)
Cash and cash equivalents, beginning of year 470 30,428 37 277,645
Cash and cash equivalents, end of year 5,671$ 23,705$ 1$ 247,855$
Reconciliation of operating income (loss) to net cash provided
by operating activities
Operating income (loss) (1,052)$ -$ (651)$ 108,582$
Adjustments to reconcile operating income (loss) to
net cash provided by operating activities
Depreciation, depletion and amortization - - 176 151,228
Decommissioning - - - 1,720
Advances for capacity and energy - - - -
Amortization of nuclear fuel - - - 13,102
Pension and other benefits expense - - 140 140
Changes in assets and liabilities
Accounts receivable (513) - - (150)
Accounts payable and accruals 5,716 - - 10,472
Other 1,042 - - 26,605
Net cash provided by operating activities 5,193$ -$ (335)$ 311,699$
Cash and cash equivalents as stated in the Combined
Statements of Net Position
Cash and cash equivalents – restricted 470$ 23,705$ 1$ 152,245$
Cash and cash equivalents – unrestricted 5,201 - - 95,610
5,671$ 23,705$ 1$ 247,855$
MISCELLANEOUS
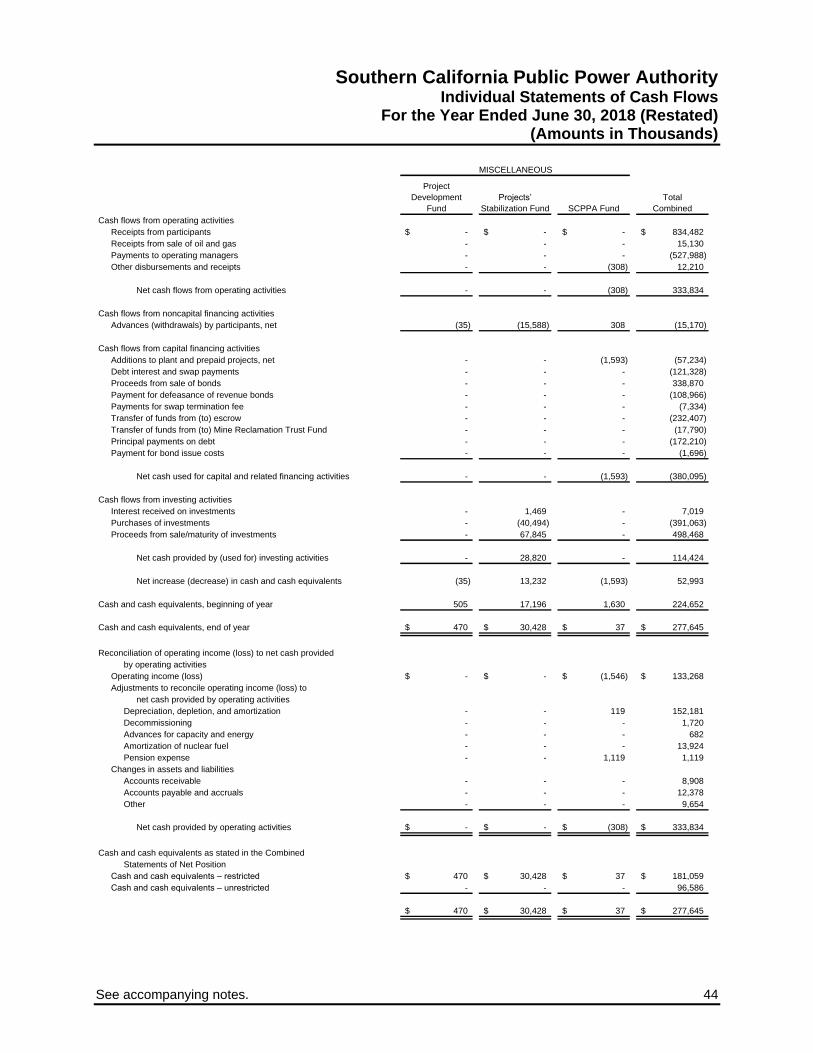
See accompanying notes. 44
Southern California Public Power Authority Individual Statements of Cash Flows
For the Year Ended June 30, 2018 (Restated) (Amounts in Thousands)
Project
Development
Fund
Projects’
Stabilization Fund SCPPA Fund
Total
Combined
Cash flows from operating activities
Receipts from participants -$ -$ -$ 834,482$
Receipts from sale of oil and gas - - - 15,130
Payments to operating managers - - - (527,988)
Other disbursements and receipts - - (308) 12,210
Net cash flows from operating activities - - (308) 333,834
Cash flows from noncapital financing activities
Advances (withdrawals) by participants, net (35) (15,588) 308 (15,170)
Cash flows from capital financing activities
Additions to plant and prepaid projects, net - - (1,593) (57,234)
Debt interest and swap payments - - - (121,328)
Proceeds from sale of bonds - - - 338,870
Payment for defeasance of revenue bonds - - - (108,966)
Payments for swap termination fee - - - (7,334)
Transfer of funds from (to) escrow - - - (232,407)
Transfer of funds from (to) Mine Reclamation Trust Fund - - - (17,790)
Principal payments on debt - - - (172,210)
Payment for bond issue costs - - - (1,696)
Net cash used for capital and related financing activities - - (1,593) (380,095)
Cash flows from investing activities
Interest received on investments - 1,469 - 7,019
Purchases of investments - (40,494) - (391,063)
Proceeds from sale/maturity of investments - 67,845 - 498,468
Net cash provided by (used for) investing activities - 28,820 - 114,424
Net increase (decrease) in cash and cash equivalents (35) 13,232 (1,593) 52,993
Cash and cash equivalents, beginning of year 505 17,196 1,630 224,652
Cash and cash equivalents, end of year 470$ 30,428$ 37$ 277,645$
Reconciliation of operating income (loss) to net cash provided
by operating activities
Operating income (loss) -$ -$ (1,546)$ 133,268$
Adjustments to reconcile operating income (loss) to
net cash provided by operating activities
Depreciation, depletion, and amortization - - 119 152,181
Decommissioning - - - 1,720
Advances for capacity and energy - - - 682
Amortization of nuclear fuel - - - 13,924
Pension expense - - 1,119 1,119
Changes in assets and liabilities
Accounts receivable - - - 8,908
Accounts payable and accruals - - - 12,378
Other - - - 9,654
Net cash provided by operating activities -$ -$ (308)$ 333,834$
Cash and cash equivalents as stated in the Combined
Statements of Net Position
Cash and cash equivalents – restricted 470$ 30,428$ 37$ 181,059$
Cash and cash equivalents – unrestricted - - - 96,586
470$ 30,428$ 37$ 277,645$
MISCELLANEOUS
Southern California Public Power Authority Notes to Combined Financial Statements
45
Note 1 – Organization and Purpose
The Southern California Public Power Authority (the Authority or SCPPA), a public entity organized under
the laws of the State of California, was formed by a Joint Powers Agreement dated as of November 1,
1980 pursuant to the Joint Exercise of Powers Act of the State of California. The Authority’s participants
consist of eleven municipal electric utilities and one irrigation district in the State of California. The
Authority was formed for the purpose of planning, financing, developing, acquiring, constructing,
operating and maintaining projects for the generation, transmission, and procurement of electric energy
and natural gas for sale to its participants. The Joint Powers Agreement has a term expiring in 2030 or
such later date as all bonds and notes of the Authority and the interest thereon have been paid in full or
adequate provision for payments have been made.
The Authority has interests in the following projects:
GENERATION PROJECTS
Palo Verde Project – On August 14, 1981, the Authority purchased a 5.91% interest in the Palo Verde
Nuclear Generating Station (PVNGS), a 3,810 MW nuclear-fueled generating station near Phoenix,
Arizona, a 5.44% ownership interest in the Arizona Nuclear Power Project High Voltage Switchyard
(ANPP HVS), and a 6.55% share of the right to use certain portions of the Arizona Nuclear Power Project
Valley Transmission System (collectively, the Palo Verde Project). Units 1, 2 and 3 of the Palo Verde
Project began commercial operations in January 1986, September 1986, and January 1988, respectively.
Since inception of the ANPP HVS capital additions, new terminations, and other events have
successively changed the respective ownership interests in the ANPP HVS. In fiscal year 2011, the
PVNGS fourth transformer became the 14th termination in the ANPP HVS, and caused the Authority’s
proportional ownership percentage to change from 5.56% to 5.44%. This change became effective on
April 1, 2011.
Units 1, 2, and 3 each operated under a 40-year Full-Power Operating License from the Nuclear
Regulatory Commission (NRC), expiring in 2025, 2026, and 2027, respectively. In April 2011, after a
detailed, two-year process, the NRC approved the application to extend the operating licenses for all
three units for an additional 20 years, allowing Unit 1 to operate through 2045, Unit 2 through 2046, and
Unit 3 through 2047.
San Juan Project – On July 1, 1993, the Authority purchased a 41.80% interest in Unit 3 and related
common facilities of the San Juan Generating Station (SJGS) from Century Power Corporation. Unit 3, a
497-MW unit, is one unit of a four-unit coal-fired power generating station in New Mexico.
Southern California Public Power Authority Notes to Combined Financial Statements
46
Note 1 – Organization and Purpose (continued)
On July 31, 2015, the SCPPA Board of Directors approved Resolution No. 2015-076 authorizing the San
Juan Generating Station Restructuring Agreement (the Restructuring Agreement). The Restructuring
Agreement required the SJGS owners to shut down SJGS Units 2 and 3 on December 31, 2017, per an
agreement with the Environmental Protection Agency (EPA) and allowed those SJGS owners wishing to
divest coal ownership in Units 3 and 4, to transfer their ownership interests to the plant operator and
largest SJGS owner, Public Service Company of New Mexico (PNM).
To consummate the necessary transactions to enable the Authority and other SJGS owners to divest or
terminate their ownership in the Project and allow other SJGS owners to retain or increase their
ownership in the Project, the SJGS owners have negotiated and developed a comprehensive set of
binding agreements collectively called SJGS Restructuring Agreements, including:
Restructuring Agreement, whereby, among other things, the Authority and the SJGS owners divest
their ownership interests in the Project and the other SJGS owners retain or increase their ownership
in the Project;
Amended and Restated Mine Reclamation and Trust Funds Agreement (the Mine Reclamation
Agreement), whereby the Authority and the other SJGS owners agree to amend the current Mine
Reclamation and Trust Funds Agreement to provide for additional trust funds by means of a trust
arrangement wherein such funds shall be held in trust for the purpose of funding the mine reclamation
costs;
San Juan Decommissioning and Trust Funds Agreement (the Decommissioning Agreement),
whereby the Authority and other SJGS owners agreed to establish a methodology for planning and
approving Decommissioning Work and funding and allocating the cost of Decommissioning Work;
Restructuring Amendment Amending and Restating the Amended and Restated San Juan Project
Participation Agreement (the SJPPA Restructuring Amendment) regarding rights and obligations in
respect of the ownership and operation of the San Juan Project for the period prior to the divestiture
on or after December 31, 2017; and
Exit Date Amendment Amending and Restating the Amended and Restated San Juan Project
Participation Agreement (the SJPPA Exit Date Amendment), whereby the Authority and the other
SJGS owners will amend certain provisions of the SJPPA regarding rights and obligations in respect
of the ownership and operation of the San Juan Project for the period after the divestiture on or after
December 31, 2017.
On July 20, 2017, the SCPPA Board of Directors approved Resolution No. 2017-073 authorizing the final
closing of San Juan Unit 3 on December 31, 2017. To complete the divestiture of SCPPA’s SJGS
ownership under the Restructuring Agreement, SCPPA executed nine agreements collectively called
SJGS Divestiture Agreements, including:
Assignment Assumption Termination and Release Agreement (AATRA), whereby, SCPPA and the
other SJGS owners are approving the transfer of PNMR Development and Management Corporation
(PNMR-D) shares to PNM;

Southern California Public Power Authority Notes to Combined Financial Statements
47
Note 1 – Organization and Purpose (continued)
New Exit Date Amendment to the SJPPA, amendment to the document governing all operations of
SJGS to reflect the change in ownership from PNMR-D to PNM approved in the AATRA;
Amended and Restated Designated Representative Agreement (ARDA), to restate the designation to
PNM as the representative to report the emissions from the SJGS under the Clean Air Act programs
after the Exit Date. The Authority and the other Exiters signed the ARDA for the sole purpose of
acknowledging that, while they are parties to the Prior Designated Representative Agreement, they
are not parties to the ARDA for operations past the exit date, December 31, 2017;
Amended and Restated North American Electric Reliability Corporation (NERC) Delegation
Agreement, to amend the Original Delegation Agreement to reflect the Exiters leaving ownership
positions in the SJGS, and the Remainers affirming their delegation to PNM to comply with the
generator operator reliability standards;
SCPPA-Tucson Electric Power Company (TEP)-Tri-State Generation and Transmission Associations,
Inc. (Tri-State) Interconnection Agreement Termination (ITA), whereby among other things, the
agreement terminates SCPPA’s rights in interconnection to the TEP System at the SJGS that had
been transferred to SCPPA for the life of Unit 3;
SCPPA-TEP-TRI-State Assumption Agreement Termination (AAT), whereby, among other things, the
AAT terminates SCPPA’s use rights in the Unit 3 step-up transformer;
SCPPA Termination Easement and License (TEL), whereby, among other things, the TEL terminates
SCPPA’s rights on the exit date, December 31, 2017, as an owner to the entirety of the SJGS plant
site; and
Template Decommissioning Trust Funds Agreement, whereby all SJGS owners agree that they will
use this template to establish decommissioning trust funds to prepay their decommissioning liabilities
per the Restructuring Agreement.
The SJGS Divestiture Agreements facilitated the Authority’s divestiture of its ownership interest in the
SJGS and did not commit the Authority to a project with potentially significant impact on the environment.
SJGS Unit 3 has permanently ceased operations in December 2017. However, the Authority retains
certain liabilities for a share of the environmental (mine reclamation) and plant decommissioning costs of
SJGS Unit 3.
Magnolia Power Project – MPP consists of a combined cycle natural gas-fired generating plant with a
nominally rated net base capacity of 242 MW and was built on a site in Burbank, California. The plant is
the first that is wholly owned by the Authority and entitlements to 100% of the capacity and energy of the
Project have been sold to six of its members.
Southern California Public Power Authority Notes to Combined Financial Statements
48
Note 1 – Organization and Purpose (continued)
The City of Burbank, a Project participant, managed its construction and also serves as the operating
agent for the Project. Commercial operations began on September 22, 2005.
Gas Supply and Services Agreement – SCPPA entered into an agreement with Occidental Energy
Marketing, Inc. (OEMI) beginning January 2005. This agreement is renewed each year unless
notification is given by either party prior to December 31, of each year. OEMI provides 100% of the
natural gas plant requirements on a daily basis, and also includes an option for the participants to
bring in their own gas supply. In addition, OEMI provides gas balancing services.
Natural Gas Transportation – SCPPA has an agreement with Southern California Gas Company
(SoCalGas) for intrastate transmission services. The agreement took effect in January 2005 and will
renew every year unless a cancellation notice is provided by the Authority. SoCalGas provides
transportation, storage, and balancing services of natural gas from the Southern California Border to
the Magnolia Plant.
Parts and Special Services Agreement – SCPPA entered into an 18-year agreement with General
Electric International (GEI) in September 2005. Initially, the agreement covered only the gas turbine,
but the agreement was amended in August 2007, to include coverage for the gas generator, the
steam turbine, and the steam generator. In 2015, a second amendment was executed and adjusted
the overall term from 96,000 fired factored hours (FFH) to 112,000 FFH due to the installation of
longer interval rated components. Due to this, the major maintenance intervals were extended from
every three years to every four years which made the existing agreement estimated to conclude in
early 2021. On May 17, 2019, a third amendment was executed adding 96,000 FFH of operation
beyond the prior agreement. It is now estimated to conclude in 2033 at a total of 208,000 FFH. GEI
provides planned and unplanned maintenance, including replacement parts, based on factored fired
hours.
Canyon Power Project – The Canyon Power Project (the Project) consists of a simple cycle natural gas-
fired power generating plant, comprised of four combustion turbines with a combined nominally rated net
base capacity of 200 MW, and auxiliary facilities, located in an industrial area of the City of Anaheim,
California (Anaheim). The Project is owned by the Authority and constructed, operated, and maintained
by Anaheim. The Project achieved full commercial operation in September 2011.
Apex Power Project – On March 26, 2014, the Authority acquired the Apex Power Project (the Project)
pursuant to an Asset Purchase Agreement, dated as of October 17, 2013. The Project consists of a
natural gas-fired, combined cycle generating facility (the Facility), nominally-rated at 531 MW, located in
Clark County, Nevada, generator interconnection facilities, related assets and property, and
interconnection and transmission contractual rights. The Facility is interconnected through a 3.13 mile
500 kV radial generation tie line owned by Nevada Power Company that connects the Facility to the
Nevada Power Company’s transmission system at its Harry Allen 500 kV Substation. The Los Angeles
Department of Water & Power (LADWP) serves as project manager and operating agent of the Project.

Southern California Public Power Authority Notes to Combined Financial Statements
49
Note 1 – Organization and Purpose (continued)
Operation and Maintenance (O&M) Agreement – The Facility is operated by EthosEnergy Power
Operations (West), LLC (EthosEnergy), formerly Wood Group Power Operations (West), Inc.,
pursuant to an Operations and Maintenance Agreement dated February 12, 2007. Under the O&M
Agreement, EthosEnergy provides all operations, routine maintenance, budget control, purchasing,
billing, and reporting for the operation of the Facility, other than the maintenance provided by General
Electric International (GEI), under a long-term service agreement. EthosEnergy currently employs 22
people at the Facility for operation and maintenance purposes. The O&M Agreement initially between
the Seller and EthosEnergy was assumed and amended by the Authority. The O&M Agreement
expires on February 2023.
Large Generator Interconnection Agreement (LGIA) – The LGIA between Nevada Power
Company and the Seller, dated July 1, 2001, provides for the interconnection of the Facility, and firm
transmission service for the Facility output through a Firm Point-to-Point Transmission Service
Agreement by and between Nevada Power Company and LADWP as Agent for the Authority, dated
in November 2015 with a point of delivery at the McCullough 500 kV Substation. The term of the
Transmission Service Agreement extends to July 30, 2023. The Authority expects to renegotiate
these agreements prior to their expiration date (with a term extension if it is economic) or to provide
for alternative transmission service from the facility to the McCullough 500 kV Substation.
Long-Term Service Agreement – Major maintenance, including parts supply, parts repair and labor
for the Facility’s combustion turbine generators and the steam turbine are provided pursuant to a
Long-Term Service Agreement between the Seller and GEI, dated June 16, 2004. The Authority
anticipates the contract to expire on 2022.
Operational Balancing Authority Agreement and Letter Agreement – The natural gas to fuel the
Facility will be provided by LADWP and delivered by facilities owned by the Kern River Gas
Transmission Company through an Operational Balancing Authority Agreement and Letter
Agreement.
Water Agreement – Water for the facility will be provided by Las Vegas Valley Water District
pursuant to an agreement, dated June 5, 2001 and assigned to the Authority upon acquisition of the
Facility. The Facility’s acquisition date was on March 26, 2014. Unless extended, the Water
Agreement expires on June 5, 2038.
Transmission Service Agreements (TSAs) – Under the TSAs, Nevada Power Company currently
provides transmission services to deliver the output of the Facility to the McCullough 500 kV
Substation. The rates, terms and conditions for such services are regulated by the Federal Energy
Regulatory Commission pursuant to Nevada Power Company’s open access transmission tariff.
Changes to the rates are not accurately predictable and subject to numerous factors unrelated to the
Apex Project.
Southern California Public Power Authority Notes to Combined Financial Statements
50
Note 1 – Organization and Purpose (continued)
LADWP, as the operating agent, will administer, supervise, monitor and enforce all the preceding
agreements in accordance with the Agency Agreement.
GREEN POWER
Hoover Uprating Project – As of March 1, 1986, the Authority and six participants entered into an
agreement pursuant to which each participant assigned its entitlement to Hoover Uprating capacity and
associated firm energy to the Authority in return for the Authority’s agreement to provide for the
advancement of funds for the uprating to the United States Bureau of Reclamation (USBR) on behalf of
such participants. The agreement expired on September 30, 2017.
On December 20, 2011, the Hoover Power Allocation Act, which extends the availability of Hoover Power
to the existing contractors for an additional fifty years and creates a pool for new entrants, was signed into
law. The participants entered into new agreements with the federal government for the capacity and
energy, effective from October 1, 2017 through September 30, 2067. SCPPA did not enter into a new
agreement with the federal government regarding the Project.
Certain SCPPA members have requested the Authority to continue attending project meetings and
monitoring activities at Hoover on their behalf. Participating members agreed to reimburse the Authority
for all costs and expenses associated with the services. In 2018, the remaining funds of $2.97 million
from the Project were distributed to the participants.
Tieton Hydropower Project – On November 30, 2009, the Authority acquired the Tieton Hydropower
Plant pursuant to an Asset Purchase Agreement, dated as of October 19, 2009. The Tieton Hydropower
Project (the Project) consists of a 13.6 MW nameplate capacity “run-of-the-reservoir” hydroelectric
generation facility, comprised of a powerhouse located in Yakima County, Washington, a 21-mile 115 kV
transmission line and other related assets, property, and contractual rights.
Contractor Service Agreement – SCPPA entered into an agreement with Energy Northwest on
July 1, 2014 to direct the operations of the Tieton Hydropower facility and to provide certain technical
services with respect to the operation and maintenance of the facility. On July 2018, the contract was
amended for one additional year from July 1, 2018 to June 30, 2019 with an option to renew on an
annual basis for up to four additional years.
Facilities Maintenance Agreement – SCPPA entered into an agreement with PacifiCorp to provide
supervision, labor, materials, and equipment necessary to perform routine non-emergency
maintenance of the facilities and routine vegetation management. The agreement started on April 28,
2010 and will continue for as long as the Interconnection Agreement is in effect, unless terminated by
mutual agreement.

Southern California Public Power Authority Notes to Combined Financial Statements
51
Note 1 – Organization and Purpose (continued)
Small Generator Interconnection Agreement – SCPPA entered into an agreement with PacifiCorp
to perform certain interconnection requests submitted under the Small Generator Interconnection
Procedures. This agreement governs the terms and conditions under which SCPPA’s Small
Generating Facility will interconnect with PacifiCorp’s Transmission System. The agreement became
effective on November 30, 2009 and will remain in effect for a period of 10 years after which it will
automatically renew for successive one-year periods, unless terminated by a 20-day written notice in
accordance with this agreement.
Milford I Wind Project – On February 9, 2010, the Authority financed the prepayment of a specified
supply of electricity from a wind farm located in Milford, Utah (the Facility). The Facility is a 203.5 MW
nameplate capacity wind farm comprised of 97 wind turbines located near Milford, Utah, together with a
90-mile transmission line, and other related facilities. Under the related power purchase agreements by
and between SCPPA and Milford Wind Corridor Phase I, LLC (the Seller), SCPPA will receive 6.7 million
MW hours over a 20-year delivery term. SCPPA has also agreed to make monthly payments to the Seller
for any energy delivered in each year that exceeds the guaranteed annual quantity of 338,215 MW hours.
Commercial operation began on November 16, 2009.
Milford II Wind Energy Project – On August 25, 2011, the Authority financed the prepayment of a
specified supply of energy from the Milford Wind Corridor Phase II Project (the Milford II Project), for a
delivery term of 20 years (unless terminated earlier) pursuant to a Power Purchase Agreement dated
March 1, 2010. The Authority also entered into power sales agreements with LADWP and the City of
Glendale (Glendale) to sell 100% of its entitlement to capacity and energy in the Facility on a “take-or-pay
basis.” Through a separate layoff agreement, the City of Glendale has sold 100% of its entitlement to
capacity and energy to LADWP, but remains responsible for all payments associated with its participation
in the power sales agreement if LADWP fails to buy the energy pursuant to the layoff agreement. The
Facility is a 102 MW nameplate capacity wind powered electric generating facility comprised of 68 1.5
MW wind turbines and related facilities located near Milford, Utah. The Milford II Project achieved
commercial operation on May 2, 2011.

Southern California Public Power Authority Notes to Combined Financial Statements
52
Note 1 – Organization and Purpose (continued)
Linden Wind Energy Project – On September 15, 2010, the Authority acquired the Linden Wind Energy
Project (the Project) pursuant to the terms of the Asset Purchase Agreement, dated as of June 23, 2009.
The Project is a 50 MW nameplate capacity wind farm comprised of 25 wind turbines and related
facilities, located in Klickitat County, Washington, developed and constructed by Northwest Wind
Partners, LLC. The Authority has also entered into power sales agreements with LADWP and Glendale to
sell 100% of its entitlement to capacity and energy in the Project on a “take-or-pay” basis. Through a
separate layoff agreement, the City of Glendale has sold 100% of its entitlement to capacity and energy
to LADWP, but remains responsible for all payments associated with its participation in the power sales
agreement if LADWP fails to buy the energy pursuant to the layoff agreement.
Operation and Maintenance Service Agreement – SCPPA entered into a three-year agreement
with Senvion Wind Energy Solutions (Senvion) (formerly, REpower Systems AG) in February 2012.
This agreement automatically renews for an additional two years unless either party provides written
notice to the other party to cancel the contract. Senvion performs fixed fee services such as
scheduled maintenance, periodic operational checks and tests, and regular preventive maintenance
required on the wind turbine generators (WEC) in accordance with the maintenance manual.
Senvion also performs remote monitoring services, repair services, and services related to the
availability of the WEC. The agreement with Senvion remains in effect until February 26, 2022.
Energy Exchange Agreement – SCPPA entered into a two-year agreement with Shell Energy North
America, L.P. (Shell) on January 1, 2018 for delivery of energy to Shell for shaping and moving
services. The delivery term may be renewed for up to five additional one-year terms commencing on
January 1 of each successive calendar year, if the parties have confirmed in writing their agreement
to extend this contract not less than ninety days prior to the commencement of each renewal term.
The agreement with Shell remains in effect until December 31, 2020.
Balance of Plant Agreement – Cannon Power Services Company, LLC assumed responsibility for
operations of the Linden Wind Energy Project from EDF Renewable Energy (formerly EnXco Service
Corporation) through an agreement with SCPPA that was executed on July 9, 2013 and was effective
September 3, 2013. This agreement to operate, maintain, and repair the Wind Plant will continue for a
period of three years and will automatically be extended for successive one-year periods unless
either party provides written notice to terminate the contract. The agreement with Cannon Power
Services Company, LLC remains in effect until December 31, 2020.
Windy Point/Windy Flats Project – On September 9, 2010, the Authority financed the purchase of a
supply of energy from the Windy Point/Windy Flats Project (the Project) for an initial delivery term of 20
years, pursuant to the terms of a power purchase agreement, dated June 24, 2009. The Authority also
entered into power sales agreements with LADWP and the City of Glendale to sell 100% of its entitlement
to capacity and energy in the Project on a “take-or-pay” basis.

Southern California Public Power Authority Notes to Combined Financial Statements
53
Note 1 – Organization and Purpose (continued)
Through a separate layoff agreement, the City of Glendale sold 100% of its entitlement to capacity and
energy to LADWP, but remains responsible for all payments associated with its participation in the power
sales agreement if LADWP fails to buy the energy pursuant to the layoff agreement.
The Project is a facility with a 262.2 MW nameplate capacity wind farm comprised of 114 wind turbines
located in the Columbia Hills area of Klickitat County, Washington near the city of Goldendale. The
Project is owned by Windy Flats Partners, LLC, a limited liability company organized and existing under
the laws of the State of Delaware. The initial delivery term began on the commercial operation date of the
first of two phases of the facility. The first phase commenced operations on January 25, 2010 and the
second phase on March 1, 2010.
TRANSMISSION PROJECTS
Southern Transmission System Project – On May 1, 1983, the Authority entered into an agreement
with the Intermountain Power Agency (IPA), to defray all the costs of acquisition and construction of the
Southern Transmission System Project (STS). IPA provides for the transmission of energy between the
Southern California and the Rocky Mountain regional markets, including long-term renewable resources
such as Milford I Wind and Milford II Wind, from the Intermountain Generating Station located in Utah to
Southern California. STS commenced commercial operations in July 1986. Construction to upgrade two
AC/DC converter stations and increase their combined rating from 1,920 MW to 2,400 MW was
completed in May 2011. The LADWP, a member of the Authority, serves as project manager and
operating agent of the Intermountain Power Project (IPP).
Mead-Phoenix and Mead-Adelanto Projects – Authority Interest (Members) – As of August 4, 1992,
the Authority entered into an agreement to acquire an interest in the Mead-Phoenix Project (Mead-
Phoenix), a transmission line extending between the Westwing substation in Arizona and the Marketplace
substation in Nevada. The agreement provides the Authority with an 18.31% interest in the Westwing-
Mead project component, a 17.76% interest in the Mead Substation project component, and a 22.41%
interest in the Mead-Marketplace project component.
As of August 4, 1992, the Authority also entered into an agreement to acquire a 67.92% interest in the
Mead-Adelanto Project (Mead-Adelanto), a transmission line extending between the Adelanto substation
in Southern California and the Marketplace substation in Nevada. Funding for these projects was
provided by a transfer of funds from the Multiple Project Fund and commercial operations commenced in
April 1996. LADWP serves as project manager and operating agent of Mead-Adelanto.
Mead-Phoenix and Mead-Adelanto Projects – Authority Interest (LADWP) – On May 25, 2016 the
Authority acquired all of M-S-R Public Power Agency’s (MSR PPA) ownership interests and associated
participation share and related rights and interests in the Mead-Adelanto (MA) and the Mead-Phoenix
(MP) Projects on behalf of LADWP.

Southern California Public Power Authority Notes to Combined Financial Statements
54
Note 1 – Organization and Purpose (continued)
The Authority Interest (LADWP) in Mead-Adelanto and in Mead-Phoenix, collectively the “Authority
Interests” (LADWP), is separate and distinct from the Authority Interest (Members) and the Authority
Interest (Western) in the existing MA and MP Projects. The acquisition represents an additional 17.5%
ownership share in the MA Project and an additional 11.54% ownership share in the Westwing-Mead
Component and an additional 8.10% ownership share in the Mead-Marketplace Component of the MP
Project, pursuant to a Purchase and Sale Agreement dated August 31, 2015 between MSR PPA and the
Authority. Pursuant to separate Transmission Service Contracts (LADWP), each dated as of March 17,
2016, LADWP is entitled to transmission services using 100% of the available capability of the Authority
Interests (LADWP) in the MA and MP Projects.
NATURAL GAS PROJECTS
Pinedale Project – On July 1, 2005, the Authority, together with LADWP and Turlock Irrigation District
(TID), acquired 42.5% of an undivided working interest in three natural gas leases located in the Pinedale
Anticline region of the State of Wyoming. The Authority’s individual share in these interests equals 14.9%.
The purchase includes 38 operating oil and gas wells and associated lateral pipelines, equipment,
permits, rights of way, and easements used in production. The natural gas field production is expected to
increase for several more years as additional capital is invested on drilling new wells and then decline
over a life expectancy greater than 30 years.
Joint Operating Agreement (JOA) – In July 2005, SCPPA’s purchase of the natural gas reserve
interests at Pinedale, Wyoming (Pinedale) included an underlying long-term JOA with the operator,
Ultra Resources, Inc. (Ultra). SCPPA pays the operator for SCPPA’s share of both operating and
drilling/capital expenses on a monthly basis.
Ultra filed for Chapter 11 on April 29, 2016 after failing to reach a debt-restructuring agreement with
its lenders and bondholders. Ultra continues as the Project Operator and has made no significant
changes to the operation of the project. Currently, there is no effect on the participants of the
Pinedale Project.
Gathering and processing agreements – SCPPA’s purchase of Pinedale included underlying
agreements with Jonah Gas Gathering Company, Tesoro Logistics, formerly Questar Gas
Management Company, and Western Gas Resources, Inc. for gathering and processing of the
natural gas.
Southern California Public Power Authority Notes to Combined Financial Statements
55
Note 1 – Organization and Purpose (continued)
Barnett Project – Natural gas resources in the Barnett shale geological formation in Texas were
acquired from Collins and Young Holding, LLP (C&Y) for a total of $84 million. The acquisition settled on
October 26, 2006 and was completed on December 7, 2006 when the participants, together with TID,
exercised their option to purchase additional resources from C&Y.
Joint Operating Agreement (JOA) – In October 2006, SCPPA’s purchase of the natural gas reserve
interests in Barnett, TX (Barnett) included an underlying long-term JOA with the operator, Devon
Energy Production Company, LP. SCPPA pays the operator for SCPPA’s share of both operating and
drilling/capital expenses on a monthly basis.
Prepaid Natural Gas Project – On October 11, 2007, the Authority made a one-time prepayment of
$481 million to acquire the right to receive approximately 135 billion cubic feet of natural gas from J. Aron
& Company (J. Aron) to be delivered over a 30-year term, beginning July 1, 2008. On October 3, 2007,
prior to the acquisition of the prepaid gas supply, the Authority entered into five separate Prepaid Natural
Gas Sales Agreements (the Gas Sales Agreements) with J. Aron and simultaneously, five Prepaid
Natural Gas Supply Agreements (the Gas Supply Contracts) in which the Authority sold its interest in the
natural gas, on a “take-and-pay” basis, to the cities of Anaheim, Burbank, Colton, Glendale, and
Pasadena (the Project Participants). Through the Gas Supply Contracts, SCPPA has provided for the
sale to the Project Participants, on a “pay-as-you-go” basis, of all of the natural gas to be delivered to
SCPPA pursuant to the Gas Sales Agreements.
On October 22, 2009, the Prepaid Natural Gas Sales Agreements and certain other agreements were
restructured to reduce risk, provide an acceleration of a portion of the long-term savings, reduce the
remaining volumes of gas to be delivered from 135 billion to 90 billion cubic feet, and shorten the term
of the agreements from 30 years to 27 years. As a result of the restructuring, the Natural Gas
contracts will now expire in 2035 and $165.5 million principal of the 2007 Natural Gas Project Bonds
were terminated (see Note 7).
Southern California Public Power Authority Notes to Combined Financial Statements
56
Note 1 – Organization and Purpose (continued)
Under the Gas Supply Contracts, the approximate average Daily Quantity of gas to be purchased by each
Project Participant is as follows:
Revised Original Participant
Volumes Volumes Percentage (%)
City of Anaheim 1,467 2,000 16.5%
City of Burbank 2,924 4,000 33.0%
City of Colton 1,007 1,375 11.0%
City of Glendale 2,015 2,750 23.0%
City of Pasadena 1,464 2,000 16.5%
Total 8,877 12,125 100.0%
(1) The Average Daily Quantity is in one million British Thermal Units (MMBtu) and is calculated
over the term of the applicable Gas Supply Contracts. The contracts were restructured and volumes
revised in October 2009.
Average Daily Quantity (1)
Project Participant
Participant ownership interests – The Authority’s participants may elect to participate in the projects.
As of June 30, 2019, the members have the following participation percentages in the Authority’s
operating projects:
Palo
Verde San Juan
Magnolia
Power
Canyon
Power
Apex
Power
Southern
Transmission
System
Mead-
Phoenix
(1992)
Mead-
Adelanto
(1992)
Mead-
Phoenix
(2016)
Mead-
Adelanto
(2016)
City of Los Angeles 67.0% - - - 100.0% 59.5% 24.8% 35.7% 100.0% 100.0%
City of Anaheim - - 38.0% 100% - 17.6% 24.2% 13.5% - -
City of Riverside 5.4% - - - - 10.2% 4.0% 13.5% - -
Imperial Irrigation District 6.5% 51.0% - - - - - - - -
City of Vernon 4.9% - - - - - - - - -
City of Azusa 1.0% 14.7% - - - - 1.0% 2.2% - -
City of Banning 1.0% 9.8% - - - - 1.0% 1.3% - -
City of Colton 1.0% 14.7% 4.2% - - - 1.0% 2.6% - -
City of Burbank 4.4% - 31.0% - - 4.5% 15.4% 11.5% - -
City of Glendale 4.4% 9.8% 16.5% - - 2.3% 14.8% 11.1% - -
City of Cerritos - - 4.2% - - - - - - -
City of Pasadena 4.4% - 6.1% - - 5.9% 13.8% 8.6% - -
100.0% 100.0% 100.0% 100.0% 100.0% 100.0% 100.0% 100.0% 100.0% 100.0%
Participants
GENERATION TRANSMISSION
Southern California Public Power Authority Notes to Combined Financial Statements
57
Note 1 – Organization and Purpose (continued)
Tieton
Hydro-
power
Milford I
Wind
Milford II
Wind
Linden
Wind
Energy
Windy
Point Pinedale Barnett
Prepaid
Natural
Gas
City of Los Angeles - 92.5% 95.1% 90.0% 92.4% - - -
City of Anaheim - - - - - 35.7% 45.4% 16.5%
City of Riverside - - - - - - - -
Imperial Irrigation District - - - - - - - -
City of Vernon - - - - - - - -
City of Azusa - - - - - - - -
City of Banning - - - - - - - -
City of Colton - - - - - 7.1% 9.1% 11.0%
City of Burbank 50.0% 5.0% - - - 14.3% 27.3% 33.0%
City of Glendale 50.0% - 4.9% 10.0% 7.6% 28.6% - 23.0%
City of Cerritos - - - - - - - -
City of Pasadena - 2.5% - - - 14.3% 18.2% 16.5%
100.0% 100.0% 100.0% 100.0% 100.0% 100.0% 100.0% 100.0%
Participants
GREEN POWER NATURAL GAS
The Authority has entered into power sales, natural gas sales, and transmission service agreements with
the above project participants. Under the terms of the contracts, the participants are entitled to power
output, natural gas, or transmission service, as applicable. The participants are obligated to make
payments on a “take-or-pay” basis for their proportionate share of operating and maintenance expenses
and debt service. The contracts cannot be terminated or amended in any manner that will impair or
adversely affect the rights of the bondholders as long as any bonds issued by the specific project remain
outstanding.
The contracts expire as follows:
Palo Verde Project various*
San Juan Project 2018**
Magnolia Power Project 2036
Canyon Power Project 2040
Apex Power Project 2038
Tieton Hydropower Project 2040
Milford I Wind Project 2030
Milford II Wind Project 2031
Linden Wind Energy Project 2035
Windy Point Project 2030
Southern Transmission System Project 2027
Mead-Phoenix Project 2030
Mead-Adelanto Project 2030
Natural Gas Pinedale Project 2032
Natural Gas Barnett Project 2032
Prepaid Natural Gas Project 2038
*2045, 2046 and 2047 for Units 1, 2 and 3, respectively.
**Decommissioning and Reclamation commenced on January 2018.
Southern California Public Power Authority Notes to Combined Financial Statements
58
Note 1 – Organization and Purpose (continued)
The Authority’s interests or entitlements in natural gas, generation, and transmission projects are jointly
owned with other utilities, except for the Magnolia Power Project, Canyon Power Project, Apex Power
Project, Tieton Hydropower Project, and the Linden Wind Energy Project, which are wholly owned by the
Authority. Under these arrangements, a participating member has an undivided interest in a utility plant
and is responsible for its proportionate share of the costs of construction and operation and is entitled to
its proportionate share of the energy, available transmission capacity, or natural gas produced. Each joint
plant participant, including the Authority, is responsible for financing its share of construction and
operating costs. The financial statements reflect the Authority’s interest in each jointly owned project as
well as the projects that it owns. Additionally, the Authority’s share of expenses for each project is
included in the statements of revenues, expenses, and changes in net position as part of operations and
maintenance expenses.
POWER PURCHASE AGREEMENTS
Ormat Geothermal Energy Project – The Authority entered into long-term power purchase agreements
in December 2005 with divisions of Ormat Technologies, Inc. for up to 20 MW of electric generation. The
Project started delivery of approximately 5 MW in January 2006 from geothermal energy facilities located
in Heber, California, and the agreements were amended to allow for excess capacity in May 2008. The
City of Anaheim acts as the scheduling coordinator on behalf of the project participants. The term of the
contract is 25 years.
MWD Small Hydro Project – Consists of a power purchase agreement for the output from four small
hydroelectric plants on the Metropolitan Water District system in Southern California, having a total
nameplate capacity of 17.04 MW, and a historical output of 40,130 MWH per year. Transmission is
accomplished through the California Independent System Operator, with the City of Anaheim acting as
scheduler. The term of the contract is 15 years and 2 months, expiring December 31, 2023. Operations
began on November 1, 2008.
Pebble Springs Wind Project – In December 2007, the Authority entered into a power purchase
agreement for the facility output of a wind project with 98.7 MW, located in Gilliam County, Oregon.
SCPPA along with LADWP, Burbank, and Glendale are now scheduling the energy through transmission
agreements which bring this renewable energy from the project substation to the project participants. The
term of the Project is 18 years with a right of first offer to potentially purchase the entire project after the
10th contract year. Operations formally began on January 31, 2009.
Ameresco Chiquita Energy Project – In March 2004, SCPPA entered into a power purchase agreement
with Ameresco Chiquita Energy LLC, subsequently amended in September 2006, for 100% of the electric
generation from a landfill gas to energy facility located at the landfill site in Valencia, California (Ameresco
Landfill Gas to Energy Project). The SCPPA participants in the project include the cities of Burbank and
Pasadena. This project will initially be for 10 MW with the right of first refusal on any increase in output.
Operations began in November 2010. The term of the contract is 20 years from the commercial operation
date.

Southern California Public Power Authority Notes to Combined Financial Statements
59
Note 1 – Organization and Purpose (continued)
Don A. Campbell/Wild Rose Geothermal Energy Project – On December 31, 2012, the Authority
entered into a power purchase agreement with Ormat Nevada, Inc. to purchase renewable geothermal
energy from the Don A. Campbell/Wild Rose Facility (the Facility) beginning December 31, 2013, for a 20-
year term. The Facility is a geothermal power generating facility with a 16.2 MW nameplate capacity and
a 95 percent capacity factor located in Mineral County, Nevada. The commercial operating date was
December 31, 2013 but early delivery of energy began in November 2013. The two participants are
LADWP and the City of Burbank. LADWP acts as project manager and has balancing authority at the
point of delivery of energy at the Mead 230kV Substation in Southern Nevada. Electricity from the Project
will be transmitted through Nevada Energy’s transmission system that includes the new 500 kV One
Nevada Transmission Line.
Copper Mountain Solar 3 Project – On August 31, 2012, SCPPA entered into a power purchase
agreement with Sempra U.S. Gas and Power (Sempra) to purchase certain renewable energy and
associated environmental attributes from the Copper Mountain Solar 3 Facility. The Facility is a fixed tilt
photovoltaic system with a capacity of 250 MW located near Boulder City, Nevada. Full commercial
operation was achieved on December 31, 2015. On December 13, 2018, Consolidated Edison purchased
the facility from Sempra. The term of the contract is 20 years. LADWP is the scheduling coordinator on
behalf of the participants.
Columbia 2 Solar Project – On September 19, 2013, SCPPA entered into a power purchase agreement
with RE Columbia Two, LLC to purchase all of the output of the Columbia 2 Solar Project, and to acquire
other rights and resources, including but not limited to the purchase option and the rights under other
ancillary agreements associated with the project. The project is a photovoltaic solar power generating
facility located in Kern County, California with an expected nameplate capacity of 15 MW. Commercial
operation began on December 20, 2014. The term of the contract is 20 years. The City of Riverside is the
scheduling coordinator on behalf of the participants.
Don A. Campbell 2 Geothermal Energy Project – On December 18, 2014, the Authority entered into a
power purchase agreement with ORNI 37 LLC to purchase renewable geothermal energy from the Don
A. Campbell 2 Facility (DAC2) beginning December 31, 2016, for a 20-year term. The Facility is a
geothermal power generating facility with a 16.2 MW nameplate capacity and a 95% capacity factor
located in Mineral County, Nevada. The commercial operating date was September 17, 2015, but early
delivery of energy began in August 2015. The LADWP acts as project manager and has balancing
authority at the point of delivery of energy at the Mead 230 kV Substation in Southern Nevada. Electricity
from the Project will be transmitted through Nevada Energy’s Transmission System that includes the new
500 kV One Nevada Transmission Line. Consequently, the Don A. Campbell/Wild Rose Facility is now
called Don A. Campbell 1 to distinguish from the expansion, DAC2.

Southern California Public Power Authority Notes to Combined Financial Statements
60
Note 1 – Organization and Purpose (continued)
Heber-1 Geothermal Energy Project – On May 31, 2013, the Authority entered into a power purchase
agreement with Heber Geothermal Company for 45 MW of generating capacity. The facility is a
geothermal power generating facility with a 62.5 MW gross nameplate capacity located in Imperial
County, California. The project began deliveries of energy under the power purchase agreement on
February 2, 2016. The term of the contract is 10 years. Global is the third party scheduling coordinator on
behalf of the participants.
Kingbird Solar B Project – On September 19, 2013, the Authority entered into a power purchase
agreement with Kingbird Solar B, LLC for 20 MW of generating capacity. The project is a solar
photovoltaic power generating facility located near Rosamond, California. The commercial operation date
for the project was declared on April 30, 2016. The term of the contract is 20 years. The City of Riverside
is the scheduling coordinator on behalf of the participants.
Springbok 1 Solar Farm Project – On August 21, 2014, SCPPA on behalf of LADWP, entered into a
power purchase agreement with 62 SK 8me, LLC for 100 MW of solar energy with all associated
environmental attributes, and photovoltaic generating capacity from the Springbok 1 Solar Farm located
in western Kern County, California. The commercial operation began on July 2016, starting a term of 25
years. SCPPA has an Early Buy Out option at the end of the 15th, 20th, and 25th Contract Years. The
project is expected to have a measured initial generation capacity factor up to 34% with a 0.7% annual
degradation. LADWP serves as the project manager on behalf of SCPPA.
Astoria 2 Solar Project – On July 23, 2014, SCPPA on behalf of Azusa, Banning, Colton and Vernon,
entered into a power purchase agreement with Recurrent Energy for solar energy from the Astoria 2 Solar
Project. SCPPA is entitled to 35 MW of photovoltaic generating capacity from commercial operation to
December 31, 2021 and 45 MW of generating capacity from January 1, 2022 until the expected expiration
date of December 31, 2036. The commercial operation date was December 2016. Power and Water
Resources Pooling Authority, Lodi, Corona, Moreno Valley, and Rancho Cucamonga, are each buying
the output of a separate portion of the facility, which is located in Kern County, California. SCPPA has
purchase options in the 10th, 15th, and 20th Contract Years.
The project is forecasted to start at a capacity factor of 31% with a 0.5% annual degradation. ACES
Power Marketing is the scheduling coordinator for the project.
Summer Solar Project – On November 15, 2012, SCPPA on behalf of Azusa, Pasadena and Riverside,
entered into a power purchase agreement with Sustainable Power Group (“sPower”) for 20 MW of solar
photovoltaic generating capacity from the Summer Solar Facility for a term of 25 years from January 1,
2017. The facility is located in Lancaster, California, and was commercial in July 2016. The project is
forecasted to start at a capacity factor of 28% with a 0.5% annual degradation. SCPPA does not have
purchase options on this project. Riverside serves as the scheduling coordinator for the project.
Southern California Public Power Authority Notes to Combined Financial Statements
61
Note 1 – Organization and Purpose (continued)
Springbok 2 Solar Farm Project – On August 28, 2015, SCPPA on behalf of LADWP, entered into a
power purchase agreement with 63SU 8me, LLC for 150 MW of solar photovoltaic generating capacity
from the Springbok 2 Solar Farm located 70 miles north of Los Angeles in Kern County, California. The
commercial operation began on September 2016, starting a term of 27 years, with an option for a three-
year extension. SCPPA has an Early Buy Out option at the end of the 15th, 20th, 27th, and 30th Contract
Years. The project is expected to start at a capacity factor of 33% with a 0.7% annual degradation.
LADWP serves as the project manager on behalf of SCPPA.
Antelope Big Sky Ranch Solar Project – On November 15, 2012, SCPPA on behalf of Azusa,
Pasadena and Riverside, entered into a power purchase agreement with sPower for 20 MW of solar
photovoltaic generating capacity from the Antelope Big Sky Ranch Facility. The facility is located near
Lancaster, California, and commercial operation occurred in late August 2016 for a term of 25 years from
January 1, 2017. The project is expected to start at a capacity factor of 28% with a 0.5% annual
degradation. SCPPA has purchase options in the 10th, 15th, and 20th Contract Years. Pasadena is the
scheduling coordinator for the project.
Antelope DSR 1 Solar Project – On July 16, 2015, the Authority, on behalf of Riverside and Vernon,
entered into a power purchase agreement with Antelope DSR 1, LLC for 50 MW solar photovoltaic
generating capacity from the Antelope DSR 1 Solar Facility. The facility is located near Lancaster,
California, and commercial operation occurred on December 16, 2016 for a term of 20 years. The City of
Riverside is the scheduling coordinator on behalf of the participants.
Antelope DSR 2 Solar Project – On July 16, 2015, the Authority, on behalf of Azusa and Colton, entered
into a power purchase agreement with Antelope DSR 2, LLC for 5 MW solar photovoltaic generating
capacity from the Antelope DSR 2 Solar Facility. The facility is located near Lancaster, California, and
commercial operation occurred on December 6, 2016 for a term of 20 years. The City of Riverside is the
scheduling coordinator on behalf of the participants.
Puente Hills Landfill Gas-to-Energy Project – On June 25, 2014, the Authority entered into a power
purchase agreement with County Sanitation District No. 2 of Los Angeles County for 46 MW of the
electric generation from a landfill gas to energy facility, located at Whittier, California. The project began
deliveries to the Authority on January 1, 2017 for a term of 10 years.
Ormat Northern Nevada Geothermal Project – On October 20, 2016, the Authority entered into a power
purchase agreement with ONGP, LLC, a subsidiary company of Ormat Technologies, Inc., based in
Reno, Nevada. The Ormat Northern Nevada Geothermal Portfolio Project is a renewable geothermal
power generating with nine separate facilities, and with a total of 150 MW nameplate capacity located in
the different counties of Nevada.
Southern California Public Power Authority Notes to Combined Financial Statements
62
Note 1 – Organization and Purpose (continued)
Each facility has its own schedule of commercial operation date and expiration date. The first facility
provided 24 MW on December 31, 2017, and subsequent development will bring the remainder in
commercial operation by December 31, 2022. LADWP maintains 100% entitlement of the entire 150 MW,
and will provide project management services on behalf of SCPPA. The term of the contract is 25 years.
Ormesa Geothermal Complex Energy Project – On March 1, 2016, the Authority entered into a power
purchase agreement with Ormesa, LLC, to purchase renewable geothermal energy. The project has a
generating facility of 30 MW nameplate capacity located in Imperial Valley, California. The official delivery
commencement date was on November 30, 2017 for a term of 25 years.
ARP-Loyalton Biomass Project – On April 2, 2018, the Authority entered into a power purchase
agreement with ARP-Loyalton Cogen LLC, seller and developer of the existing biomass power generation
facility in California. The project has a total energy output of 18 MW located in Loyalton, California. The
commercial operation date occurred on April 20, 2018 for a term of 5 years. The City of Riverside is the
scheduling coordinator on behalf of the participants.
The Authority has entered into power purchase agreements with project participants as follows. These
agreements are substantially “take-and-pay” contracts where there may be other obligations not
associated with the delivery of energy.

Southern California Public Power Authority Notes to Combined Financial Statements
63
Note 1 – Organization and Purpose (continued)
Participants’ ownership interests are as follows:
City of Los
Angeles
City of
Anaheim
City of
Imperial
City of
Vernon
City of
Riverside
City of
Azusa
City of
Banning
City of
Colton
City of
Burbank
City of
Glendale
City of
Pasadena Total
Ormat Geothermal Energy - 60.0% - - - - 10.0% - - 15.0% 15.0% 100.0%
Pebble Springs Wind 69.6% - - - - - - - 10.1% 20.3% - 100.0%
MWD Small Hydro - 56.4% - - - 21.8% - 21.8% - - - 100.0%
Ameresco Chiquita Landfill Gas - - - - - - - - 16.7% - 83.3% 100.0%
Don A Campbell/Wild Rose Geothermal 84.6% - - - - - - - 15.4% - - 100.0%
Copper Mountain Solar 3 84.0% - - - - - - - 16.0% - - 100.0%
Columbia 2 Solar - - - - 74.3% 8.6% - - - - 17.1% 100.0%
Don A. Campbell 2 Geothermal 100.0% - - - - - - - - - - 100.0%
Heber-1 Geothermal 66.7% - 33.3% - - - - - - - - 100.0%
Kingbird Solar - - - - 70.0% 15.0% - 15.0% - - - 100.0%
Summer Solar - - - - 50.0% 17.5% - - - - 32.5% 100.0%
Springbok 1 100.0% - - - - - - - - - - 100.0%
Springbok 2 100.0% - - - - - - - - - - 100.0%
Astoria 2 Solar - - - 57.1% - - 22.9% 20.0% - - - 100.0%
Antelope Big Sky Ranch Solar - - - - 50.0% 17.5% - - - - 32.5% 100.0%
Antelope DSR 1 Solar - - - 50.0% 50.0% - - - - - - 100.0%
Antelope DSR 2 Solar - - - - - 100.0% - - - - - 100.0%
Puente Hills Landfill Gas - - - 23.3% - - 23.2% 23.3% - - 30.2% 100.0%
Ormat Northern Nevada Geothermal 100.0% - - - - - - - - - - 100.0%
Ormesa Geothermal Complex 85.7% - 14.3% - - - - - - - - 100.0%
ARP-Loyalton Biomass Project 74.1% 6.7% 12.5% - 6.7% - - - - - - 100.0%
(1) In accordance to the project's respective "Contract for Sale and Purchase" agreement between the City of Glendale,
LADWP, and SCPPA, LADWP agrees to pay from and after the Commencement Date, the Contract Monthly Costs
and other obligations of Glendale associated with the Contract Output Entitlement Shares of the project until Glendale
exercises its option to repurchase its Entitlement Share by providing LADWP with a 60 day prior written notice of its intent.
(2) In accordance with Board Resolution No. 2017-097, the City of Azusa assigned its interest of energy
and capacity to the City of Banning and terminated the Power Sales Agreement with the Authority in the Puente Hills
Landfill Gas Project effective January 1, 2018.
(3) In accordance with Board Resolution No. 2017-105, the City of Azusa and the City of Colton have mutually
negotiated and agreed to transfer their respective rights and obligations among themselves in the Antelope DSR 2 Solar
and Astoria 2 Solar projects. The resolution authorized the transfer of rights and obligation in the Antelope DSR 2 Solar
Project from the City of Colton to the City of Azusa and the transfer of rights and obligation in the Astoria 2 Solar
Project from the City of Azusa to the City of Colton.
Power Purchase Agreements
Participants

Southern California Public Power Authority Notes to Combined Financial Statements
64
Note 1 – Organization and Purpose (continued)
As of June 30, 2019, the Authority’s power purchase agreements are summarized as follows:
Agreement Commercial Project Contract
Location Capacity Date Operations Date Manager Expiration
Ormat Geothermal Energy Project Heber, California 17.0 MW December 2005 January 2006 SCPPA 2031
Pebble Springs Wind Project Gilliam County, Oregon 98.7 MW December 2007 January 2009 LADWP 2025
MWD Small Hydro Project Southern California 17.04 MW November 2008 November 2008 SCPPA 2023
Ameresco Chiquita Landfill Gas Project Valencia, California 10.0 MW March 2006 November 2010 SCPPA 2030
Don A. Campbell 1 Project Mineral County, Nevada 16.2 MW December 2012 December 2013 LADWP 2033
Copper Mountain Solar 3 Project Clark County, Nevada 250.0 MW August 2012 December 2012 LADWP 2040
Columbia 2 Solar Project Kern County, California 15.0 MW September 2013 December 2014 SCPPA 2033
Don A. Campbell 2 Project Mineral County, Nevada 16.2 MW December 2014 September 2015 LADWP 2035
Heber-1 Geothermal Project Imperial Valley, California 46.0 MW May 2013 February 2016 LADWP 2025
Kingbird Solar Project Kern County near Rosamund, California 20.0 MW July 2013 February 2016 SCPPA 2036
Summer Solar Project Los Angeles County 20.0 MW November 2012 July 2016 SCPPA 2042
Springbok 1 Solar Project Kern County, California 100.0 MW April 2015 July 2016 LADWP 2040
Springbok 2 Solar Project Kern County, California 150.0 MW April 2015 October 2016 LADWP 2045
Astoria 2 Solar Project Kern County, California 45.0 MW July 2014 December 2016 SCPPA 2036
Antelope Big Sky Ranch Solar Project Los Angeles County 20.0 MW November 2012 August 2016 SCPPA 2036
Antelope DSR 1 Solar Project Los Angeles County 50.0 MW September 2015 December 2016 SCPPA 2036
Antelope DSR 2 Solar Project Los Angeles County 5.0 MW September 2015 August 2016 SCPPA 2036
Puente Hills Landfill Gas-to-Energy Project Whittier, California 46.0 MW June 2014 January 2017 SCPPA 2030
Ormat Northern Nevada Geothermal Nevada Counties 150.0 MW October 2016 October 2017 LADWP 2042
Ormesa Geothermal Complex Imperial County, California 125.6 MW March 2016 November 2017 LADWP 2042
ARP-Loyalton Biomass Project Loyalton, California 18.0 MW October 2017 April 2018 SCPPA 2023
Project Name

Southern California Public Power Authority Notes to Combined Financial Statements
65
Note 1 – Organization and Purpose (continued)
MISCELLANEOUS FUNDS
Project Development Fund – Holds funds related to projects in the development phase.
Projects’ Stabilization Fund – In fiscal year 1997, the Authority authorized the creation of a Projects’
Stabilization Fund. Deposits may be made into the fund from budget under-runs, after authorization of
individual participants, and by direct contributions from the participants. Participants have discretion over
the use of their deposits within SCPPA project purposes. This fund is not a project-related fund; therefore,
it is not governed by any project Indenture of Trust. The members participate in the Projects’ Stabilization
Fund by making deposits to the fund at their discretion.
SCPPA Fund – In January 2016, the SCPPA Board of Directors approved Resolution No. 2016-003
authorizing the purchase and renovation of the building adjacent to the office building that SCPPA
currently owns.
The building was negotiated and put into escrow on January 16, 2016 at a price of $1.54 million. The
acquisition will be allocated to each member based on the methodology that was used to fund the
purchase of the original SCPPA Office Building which was acquired in June 2011. On January 2, 2018,
the Authority had commenced the close of the escrow for the new building (see Note 3).
Reclassification – Certain accounts in the 2018 financial statements have been reclassified to conform
to the presentation in the 2019 combined financial statements. Such reclassifications have no effect on
net position or the changes in net position.
Note 2 – Summary of Significant Accounting Policies
Basis of accounting and presentation – The combined and individual financial statements of the
Authority are prepared under the accrual basis of accounting in accordance with accounting principles
generally accepted in the United States of America issued by the GASB applicable to governmental
entities that use proprietary fund accounting. Revenues are recognized when earned and expenses are
recognized when incurred. The format of the Statement of Net Position follows the inverted approach
which is consistent with the Federal Energy Regulatory Commission (FERC).

Southern California Public Power Authority Notes to Combined Financial Statements
66
Note 2 – Summary of Significant Accounting Policies (continued)
In November 2016, the GASB issued Statement No. 83, Certain Asset Retirement Obligations, effective
for financial statements for periods beginning after June 15, 2018. This statement addresses accounting
and financial reporting for certain asset retirement obligations (AROs). An ARO is a legally enforceable
liability associated with the retirement of a tangible capital asset. A government that has legal obligations
to perform future asset retirement activities related to its tangible capital assets should recognize a liability
and deferred outflows based on the guidance of this statement. Changes adopted to conform to the
provisions of GASB 83 were applied retroactively by restating the financial statements for all prior periods
presented (see Note 13).
In March 2016, the GASB issued Statement No. 75, Accounting and Financial Reporting for
Postemployment Benefits Other Than Pensions, effective for financial statements for periods beginning
after June 15, 2017. Statement 75 replaces the requirements of GASB Statement No. 45, Accounting and
Financial Reporting by Employers for Postemployment Benefits Other Than Pensions. Among other
things, Statement 75 requires governments to report a liability on the face of the financial statements for
the OPEB that they provide and requires governments in all types of OPEB plans to present more
extensive note disclosures and required supplementary information about their OPEB liabilities (see
Note 11).
Net position – The Authority’s net position is classified as follows:
Net investment in capital assets – This component of net position consists of capital assets, net of
accumulated depreciation, reduced by the outstanding balances of any bonds, other borrowings, and
advances from participants that are attributable to the acquisition, construction, or improvement of
those assets. If there are significant unspent related debt proceeds at year-end, the portion of the
debt attributable to the unspent proceeds is not included in the calculation of net investment in capital
assets. Rather, that portion of the debt is included in the same net position component as the unspent
proceeds.
Restricted – This component consists of net position on which constraints are placed as to their use.
Constraints include those imposed by creditors (such as through debt covenants), contributors, or
laws or regulation of other governments or constraints imposed by law through constitutional
provisions or through enabling legislation.
Unrestricted – This component of net position consists of net position that does not meet the
definition of “restricted” or “net investment in capital assets.”
Southern California Public Power Authority Notes to Combined Financial Statements
67
Note 2 – Summary of Significant Accounting Policies (continued)
Use of estimates – The preparation of financial statements in conformity with accounting principles
generally accepted in the United States of America requires management to make estimates and
assumptions that affect the reported amounts of assets and liabilities and disclosure of contingent assets
and liabilities at the date of the combined financial statements and the reported amounts of revenues and
expenses during the reporting period. Actual results could differ from those estimates.
Utility plant – The Authority’s share of construction and betterment costs, natural gas reserves,
intangibles, and nuclear fuel associated with PVNGS, STS, Mead-Phoenix, Mead-Adelanto, SJGS,
Magnolia Power Project, the Natural Gas Pinedale Project and the Natural Gas Barnett Project (together
the Natural Gas Projects), Canyon Power, Tieton Hydropower, Linden Wind Energy, and the Apex Power
Projects are included as utility plant and recorded at cost. Utility plant also includes the SCPPA Building.
Costs include labor, materials, capitalized interest costs on funds used in construction, and allocated
indirect charges such as engineering, supervision, transportation and construction equipment, retirement
plan contributions, health care costs, and certain administrative and general expenses. The costs of
routine maintenance, repairs, and minor replacements incurred to maintain the plant in operating
condition are charged to the appropriate operations and maintenance expense accounts in the period
incurred. The original cost of property retired, net of removal and salvage costs, is charged to
accumulated depreciation.
Depreciation expense is computed using the straight-line method based on the estimated service lives,
principally 35 years for PVNGS, STS, Mead-Phoenix and Mead-Adelanto; 30 years for Magnolia and
Canyon Power Project; 50 years for the Tieton Hydropower Project; 25 years for Linden Wind Energy
Project; 24 Years for the Apex Power Project; and 35 years for the SCPPA Building Fund. In June 2018
due to the Authority’s divestiture from the SJ Project, the Authority decided to write down the utility plant
(see Notes 1 and 2).
Natural gas reserve depletion – Depletion expense for the Natural Gas Projects is computed using the
unit of production method based on the future production of the proven producing wells, estimated at 50
years for the Natural Gas Pinedale Project and 50 years for the Natural Gas Barnett Project. The estimate
is based on site specific studies prepared by independent consultants as of December 2016 for both
projects. The depletion rate for the Natural Gas Pinedale Project was $5.27/MMBtu and $5.17/MMBtu for
fiscal years 2019 and 2018, respectively; and the estimated total net revenue volume was 6,354,798
MMBtu and 6,977,121 MMBtu for fiscal years 2019 and 2018, respectively. The depletion rate for the
Natural Gas Barnett Project was $6.08/MMBtu and $2.78/MMBtu for fiscal years 2019 and 2018,
respectively; and the estimated total net revenue volume was 14,887,980 MMBtu and 15,660,008 MMBtu
for fiscal years ended June 30, 2019 and 2018, respectively.
Nuclear fuel – Nuclear fuel is amortized and charged to expense on the basis of actual thermal energy
produced relative to total thermal energy expected to be produced over the life of the fuel. Under the
provisions of the Nuclear Waste Policy Act of 1982, the federal government assesses each entity with
nuclear operations, including the participants in PVNGS, $1 per MW hour of nuclear generation. The
Authority records this charge as a current year expense. See Note 12 for information about spent nuclear
fuel disposal.

Southern California Public Power Authority Notes to Combined Financial Statements
68
Note 2 – Summary of Significant Accounting Policies (continued)
Asset Retirement Obligations – SCPPA records asset retirement obligations where there is a legally
enforceable liability associated with the retirement of the tangible capital assets. An ARO is measured
based on the best estimate of the current value of outlays expected to be incurred. The current value is
adjusted annually for the effects of general inflation or deflation. All relevant factors are evaluated at least
annually to determine whether there is a significant change in the estimate outlays and whether to
remeasure ARO. The deferred outflows of resources should be reduced and recognized as outflows or
resources in a systematic and rational manner over the estimated useful life of the tangible capital assets.
Implementation of GASB 83, Certain Asset Retirement Obligation – The Authority adopted the
requirements of GASB 83 as of June 30, 2019. This statement requires that recognition of a liability
occur when external laws, regulations, contracts, or court judgments, together with the occurrence of an
internal event that obligates an entity to perform asset retirement activities.
The impact for the Authority is as follows:
Asset Retirement Obligation Liability – An asset retirement obligation is measured based on the best
estimate of the current value of outlays expected to be incurred, including probability weighting of
potential outcomes. This statement requires the current value of an entity’s AROs to be adjusted for the
effects of general inflation or deflation at least annually and it requires entities to evaluate all relevant
factors at least annually to determine whether the effects of one or more of the factors are expected to
significantly change the estimated asset retirement outlays. An entity should remeasure an ARO only
when the result of the evaluation indicates there is a significant change in the estimate outlays. Under
GASB 83, the current value of the obligation was recorded and the effect of inflation was recognized in
the opening balance of the statements of net position.
Deferred outflows of resources – asset retirement obligation – GASB 83 requires recognition of
deferred outflows of resources associated with an ARO based on the useful life of the asset and
estimated liability at the time of recognition. The deferred outflows of resources reported after a tangible
capital asset’s estimated life should be reduced and recognized as outflows or resources in a systematic
and rational manner over the remaining estimated useful life of the tangible capital asset.
GASB 83 requires the effects of accounting change to be applied retroactively by restating the financial
statements for all prior periods presented.
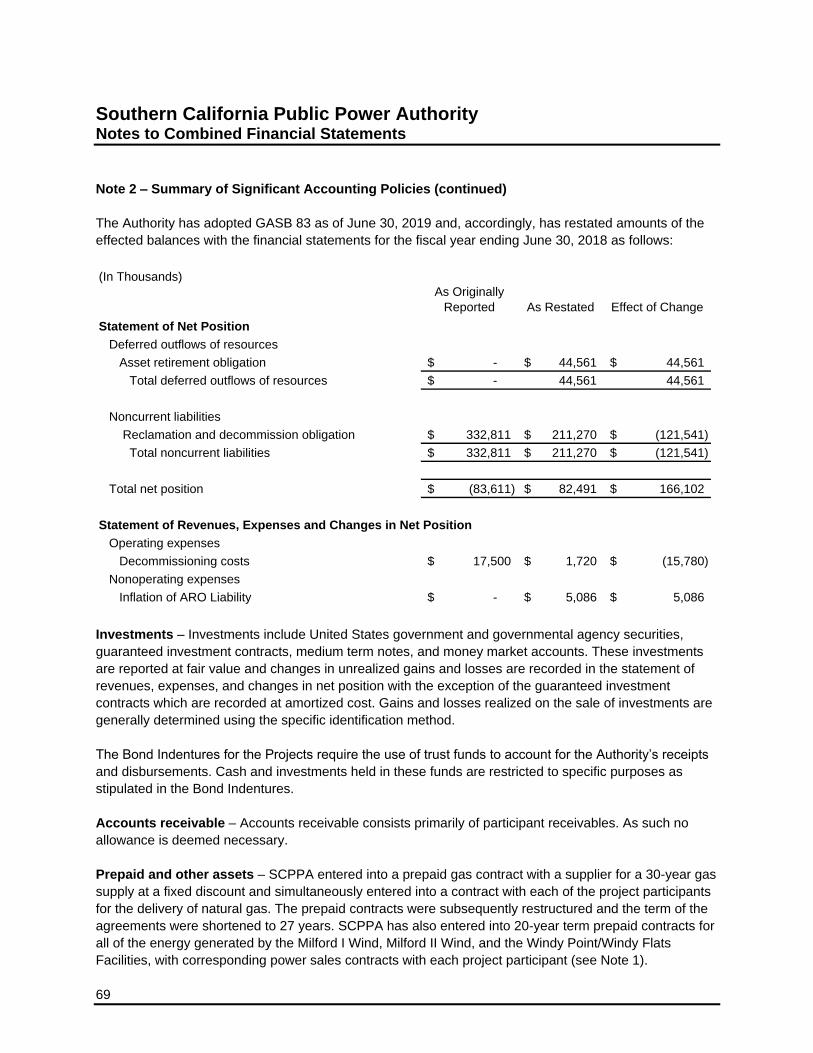
Southern California Public Power Authority Notes to Combined Financial Statements
69
Note 2 – Summary of Significant Accounting Policies (continued)
The Authority has adopted GASB 83 as of June 30, 2019 and, accordingly, has restated amounts of the
effected balances with the financial statements for the fiscal year ending June 30, 2018 as follows:
(In Thousands)
As Originally
Reported As Restated Effect of Change
Statement of Net Position
Deferred outflows of resources
Asset retirement obligation -$ 44,561$ 44,561$
Total deferred outflows of resources -$ 44,561 44,561
Noncurrent liabilities
Reclamation and decommission obligation 332,811$ 211,270$ (121,541)$
Total noncurrent liabilities 332,811$ 211,270$ (121,541)$
Total net position (83,611)$ 82,491$ 166,102$
Statement of Revenues, Expenses and Changes in Net Position
Operating expenses
Decommissioning costs 17,500$ 1,720$ (15,780)$
Nonoperating expenses
Inflation of ARO Liability -$ 5,086$ 5,086$
Investments – Investments include United States government and governmental agency securities,
guaranteed investment contracts, medium term notes, and money market accounts. These investments
are reported at fair value and changes in unrealized gains and losses are recorded in the statement of
revenues, expenses, and changes in net position with the exception of the guaranteed investment
contracts which are recorded at amortized cost. Gains and losses realized on the sale of investments are
generally determined using the specific identification method.
The Bond Indentures for the Projects require the use of trust funds to account for the Authority’s receipts
and disbursements. Cash and investments held in these funds are restricted to specific purposes as
stipulated in the Bond Indentures.
Accounts receivable – Accounts receivable consists primarily of participant receivables. As such no
allowance is deemed necessary.
Prepaid and other assets – SCPPA entered into a prepaid gas contract with a supplier for a 30-year gas
supply at a fixed discount and simultaneously entered into a contract with each of the project participants
for the delivery of natural gas. The prepaid contracts were subsequently restructured and the term of the
agreements were shortened to 27 years. SCPPA has also entered into 20-year term prepaid contracts for
all of the energy generated by the Milford I Wind, Milford II Wind, and the Windy Point/Windy Flats
Facilities, with corresponding power sales contracts with each project participant (see Note 1).

Southern California Public Power Authority Notes to Combined Financial Statements
70
Note 2 – Summary of Significant Accounting Policies (continued)
Advance to IPA – Advance to IPA consists of cash transferred to IPA for reserve, contingency, and self-
insurance funding and relates to the STS Project.
Unamortized premiums and discounts – Unamortized premiums and discounts are recorded as part of
long-term debt and amortized over the life of the related debt issue.
Cash and cash equivalents – Cash and cash equivalents include cash and investments with original
maturities of 90 days or less.
Restricted cash and investments – Restricted cash and investments are set aside to meet externally
imposed legal and contractual obligations. Restricted cash and investments are used in accordance with
their requirements and include certain proceeds of the Authority’s revenue bonds, as well as resources
set aside for their repayment, and participant advances restricted for costs of certain capital projects.
Deferred outflow and inflow of resources – Losses on refunding related to bonds redeemed by
refunding bonds are reported as deferred outflows of resources and are amortized over the shorter life of
the refunding bonds, or the remaining term of bonds in accordance with GASB Statement No. 23,
Accounting and Financial Reporting for Refunding’s of Debt Reported by Proprietary Activities.
In addition, the accumulated decrease in the fair value of effective hedging derivative instruments are
reported as deferred outflow of resources. Under hedge accounting, the changes in the fair value of an
effective hedging derivative instrument, in asset or liability positions, are reported as a deferred inflow of
resources or deferred outflow of resources, respectively, on the statements of net position.
See Note 11 for a description of the deferred outflows of resources and the deferred inflows of resources
related to the pension and OPEB.
Deferred outflows of resources related to asset retirement obligation are recognized and amortized in a
systematic and rational manner over the remaining estimated useful life of the tangible capital asset.
Materials and supplies – Materials and supplies consist primarily of items for construction and
maintenance of plant assets and are stated at the lower of cost or market.
Arbitrage rebate and yield restrictions – The unused proceeds from the issuance of tax-exempt debt
have been invested in taxable financial instruments. The excess of earnings on investments, if any, over
the amount that would have been earned if the investments had a yield equal to the bond yield or yield
restricted rate, is payable to the IRS within five years of the date of the bond offering and each
consecutive five years thereafter until final maturity of the related bonds.

Southern California Public Power Authority Notes to Combined Financial Statements
71
Note 2 – Summary of Significant Accounting Policies (continued)
Pensions – For purposes of measuring the net pension liability and deferred outflows/inflows of
resources related to pensions, and pension expense, information about the fiduciary net position of
SCPPA’s California Public Employees’ Retirement System (CalPERS), Miscellaneous plans (Plans), and
additions to/deductions from the Plans’ fiduciary net position have been determined on the same basis as
they are reported to CalPERS. For this purpose, benefit payments (including refunds of employee
contributions) are recognized when due and payable in accordance with the benefit terms. Investments
are reported at fair value.
Postemployment benefits other than pensions – For purposes of measuring the net OPEB liability and
deferred outflows/inflows of resources related to OPEB, and OPEB expense, information about the
fiduciary net position of the OPEB’s plan and additions to/deductions from the OPEB plans’ fiduciary net
position have been determined on the same basis as they are reported by the plan. For this purpose, the
OPEB plan recognizes benefit payments when due and payable in accordance with the benefit terms.
Revenues – Revenues consist of billings to participants for the sales of electric energy, natural gas, and
transmission service in accordance with the participation agreements. Generally, revenues are fixed at a
level to recover all operating and any debt service costs over the commercial life of the property.
Transportation costs – As a result of the sales and purchases agreements for natural gas entered into
by SCPPA, the participants receive less volume than processed incurring embedded transportation costs.
These costs are recorded as participants’ revenue and expense to the Natural Gas Pinedale Project. At
June 30, 2019 and 2018, transportation costs were approximately $231,600 and $119,100, respectively,
for the Natural Gas Pinedale Project.
Non-exchange contribution – Each participant of the Magnolia Power Plant is responsible for its own
share of natural gas. They may elect to bring fuel to the plant or purchase fuel from Occidental Energy
Marketing, Inc. (OEMI). OEMI computes the daily imbalances of fuel volume per participant using the
daily consumption data that the operating manager provides. Monthly, actual fuel burnt is reported
together with the daily imbalances, participants’ in kind contribution, and fuel purchases from OEMI.
Non-exchange contributions are valued at fair market value and recorded as participant revenue and fuel
expense to the Magnolia Power Project. SCPPA values the participants’ fuel contribution using monthly
average pricing from the Project’s OEMI fuel purchases. During the fiscal years ended June 30, 2019 and
2018, the participants’ contribution in kind was approximately 10.7 MMBtu and 9.9 MMBtu and was
valued at approximately $62.4 million and $34.7 million, respectively.
Build America Bonds (BABs) – These are taxable municipal bonds that were created under the
American Recovery and Reinvestment Act of 2009, and carry special tax credits and federal subsidies for
either the bond issuer or the bondholder. BABs provide for a subsidy payment from the Department of the
Treasury to be paid directly to the issuer (Direct Payment) or the bondholder (Tax Credit BABs) in an
amount equal to 35% of the bond’s interest. On September 28, 2010, SCPPA issued $41.5 million of the
Linden Wind 2010 Series B, Direct Payment BABs.

Southern California Public Power Authority Notes to Combined Financial Statements
72
Note 2 – Summary of Significant Accounting Policies (continued)
The budget sequestration or automatic spending cuts of the United States Government that went into
effect in 2013 resulted in a 7.2% decrease of the BABs subsidies received by the Authority for the related
bonds. During the fiscal year ended June 30, 2019, BABs subsidy received for the debt service payments
made on July 1, 2018 was reduced by 6.9% and by 6.2% for the payments made on January 1, 2019.
Note 3 – Utility Plant
At June 30, 2019, Net utility plant consisted of the following (amounts in thousands):
Palo Verde San Juan
Magnolia
Power
Canyon
Power Apex Power
Tieton
Hydro-power
Linden Wind
Energy
Utility plant
Production 755,779$ -$ 289,348$ 256,964$ 345,826$ 35,601$ 123,083$
Transmission 18,575 - 15,247 31,853 - 13,371 23,431
General 4,508 - 16,752 595 493 11 -
Natural gas reserves - - - - - - -
778,862 - 321,347 289,412 346,319 48,983 146,514
Less accumulated depreciation 584,960 - 153,185 74,468 68,937 13,949 51,112
193,902 - 168,162 214,944 277,382 35,034 95,402
Construction work in progress 40,889 - 557 - 1,380 - -
Nuclear fuel, at amortized cost 46,382 - - - - - -
Net utility plant 281,173$ -$ 168,719$ 214,944$ 278,762$ 35,034$ 95,402$
OTHERS
Southern
Transmission
System
Mead-
Phoenix
Mead-
Adelanto Pinedale Barnett
SCPPA
Fund Total
Utility plant
Production -$ -$ -$ -$ -$ -$ 1,806,601$
Transmission 770,498 82,071 206,521 - - - 1,161,567
General 44,399 3,159 509 4,092 - 7,266 81,784
Natural gas reserves - - - 73,202 85,182 - 158,384
814,897 85,230 207,030 77,294 85,182 7,266 3,208,336
Less accumulated depreciation 666,900 38,504 110,344 46,336 46,456 868 1,856,019
147,997 46,726 96,686 30,958 38,726 6,398 1,352,317
Construction work in progress - 82 - 39 95 - 43,042
Nuclear fuel, at amortized cost - - - - - - 46,382
Net utility plant 147,997$ 46,808$ 96,686$ 30,997$ 38,821$ 6,398$ 1,441,741$
June 30, 2019
GENERATION
TRANSMISSION
GREEN POWER
NATURAL GAS
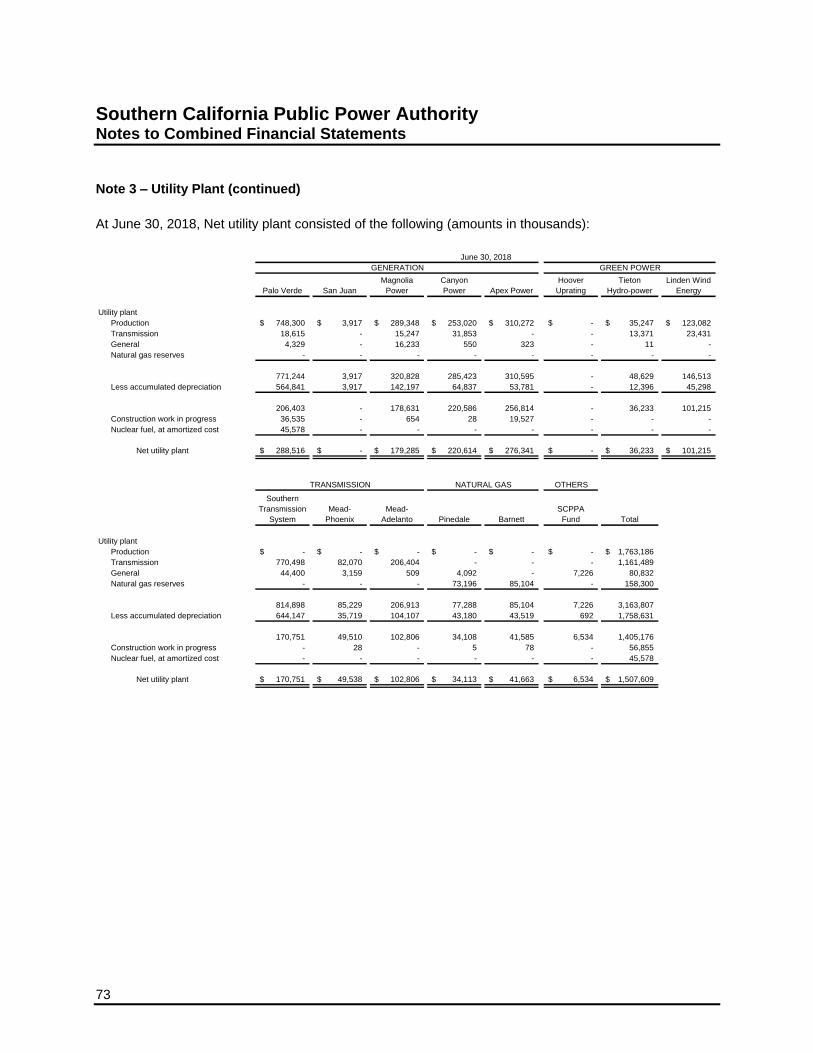
Southern California Public Power Authority Notes to Combined Financial Statements
73
Note 3 – Utility Plant (continued)
At June 30, 2018, Net utility plant consisted of the following (amounts in thousands):
Palo Verde San Juan
Magnolia
Power
Canyon
Power Apex Power
Hoover
Uprating
Tieton
Hydro-power
Linden Wind
Energy
Utility plant
Production 748,300$ 3,917$ 289,348$ 253,020$ 310,272$ -$ 35,247$ 123,082$
Transmission 18,615 - 15,247 31,853 - - 13,371 23,431
General 4,329 - 16,233 550 323 - 11 -
Natural gas reserves - - - - - - - -
771,244 3,917 320,828 285,423 310,595 - 48,629 146,513
Less accumulated depreciation 564,841 3,917 142,197 64,837 53,781 - 12,396 45,298
206,403 - 178,631 220,586 256,814 - 36,233 101,215
Construction work in progress 36,535 - 654 28 19,527 - - -
Nuclear fuel, at amortized cost 45,578 - - - - - - -
Net utility plant 288,516$ -$ 179,285$ 220,614$ 276,341$ -$ 36,233$ 101,215$
OTHERS
Southern
Transmission
System
Mead-
Phoenix
Mead-
Adelanto Pinedale Barnett
SCPPA
Fund Total
Utility plant
Production -$ -$ -$ -$ -$ -$ 1,763,186$
Transmission 770,498 82,070 206,404 - - - 1,161,489
General 44,400 3,159 509 4,092 - 7,226 80,832
Natural gas reserves - - - 73,196 85,104 - 158,300
814,898 85,229 206,913 77,288 85,104 7,226 3,163,807
Less accumulated depreciation 644,147 35,719 104,107 43,180 43,519 692 1,758,631
170,751 49,510 102,806 34,108 41,585 6,534 1,405,176
Construction work in progress - 28 - 5 78 - 56,855
Nuclear fuel, at amortized cost - - - - - - 45,578
Net utility plant 170,751$ 49,538$ 102,806$ 34,113$ 41,663$ 6,534$ 1,507,609$
June 30, 2018
GENERATION GREEN POWER
TRANSMISSION NATURAL GAS
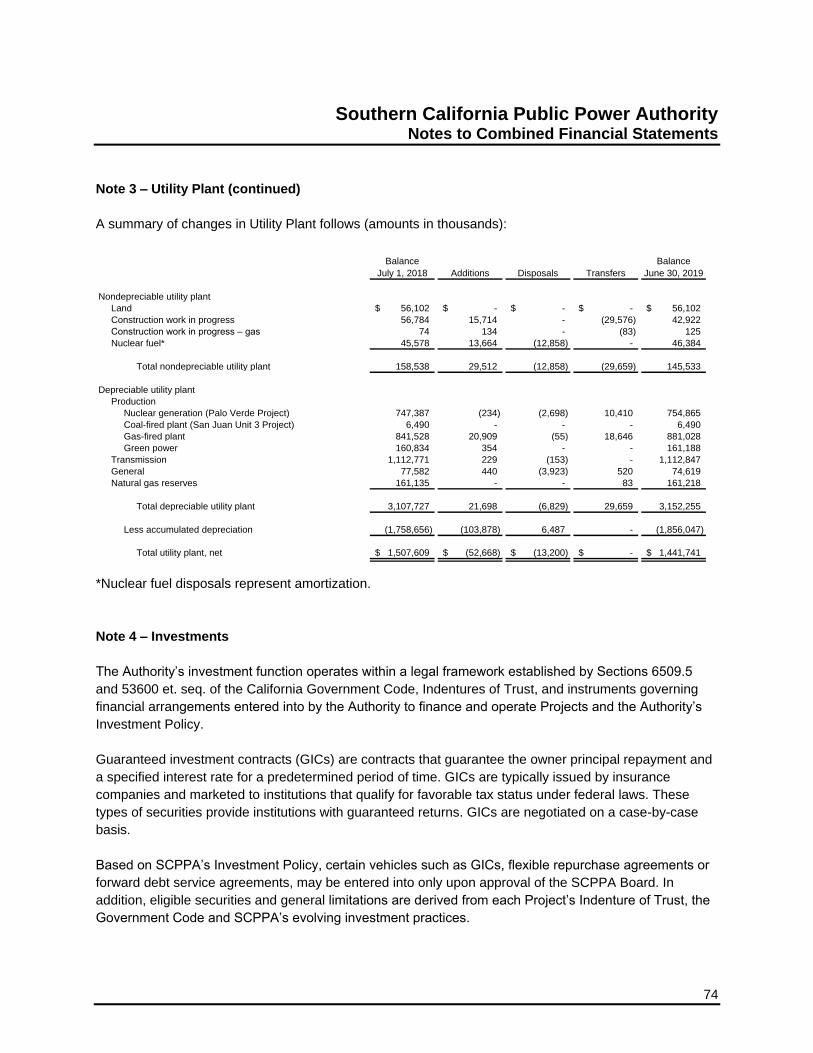
Southern California Public Power Authority Notes to Combined Financial Statements
74
Note 3 – Utility Plant (continued)
A summary of changes in Utility Plant follows (amounts in thousands):
Balance
July 1, 2018 Additions Disposals Transfers
Balance
June 30, 2019
Nondepreciable utility plant
Land 56,102$ -$ -$ -$ 56,102$
Construction work in progress 56,784 15,714 - (29,576) 42,922
Construction work in progress – gas 74 134 - (83) 125
Nuclear fuel* 45,578 13,664 (12,858) - 46,384
Total nondepreciable utility plant 158,538 29,512 (12,858) (29,659) 145,533
Depreciable utility plant
Production
Nuclear generation (Palo Verde Project) 747,387 (234) (2,698) 10,410 754,865
Coal-fired plant (San Juan Unit 3 Project) 6,490 - - - 6,490
Gas-fired plant 841,528 20,909 (55) 18,646 881,028
Green power 160,834 354 - - 161,188
Transmission 1,112,771 229 (153) - 1,112,847
General 77,582 440 (3,923) 520 74,619
Natural gas reserves 161,135 - - 83 161,218
Total depreciable utility plant 3,107,727 21,698 (6,829) 29,659 3,152,255
Less accumulated depreciation (1,758,656) (103,878) 6,487 - (1,856,047)
Total utility plant, net 1,507,609$ (52,668)$ (13,200)$ -$ 1,441,741$
*Nuclear fuel disposals represent amortization.
Note 4 – Investments
The Authority’s investment function operates within a legal framework established by Sections 6509.5
and 53600 et. seq. of the California Government Code, Indentures of Trust, and instruments governing
financial arrangements entered into by the Authority to finance and operate Projects and the Authority’s
Investment Policy.
Guaranteed investment contracts (GICs) are contracts that guarantee the owner principal repayment and
a specified interest rate for a predetermined period of time. GICs are typically issued by insurance
companies and marketed to institutions that qualify for favorable tax status under federal laws. These
types of securities provide institutions with guaranteed returns. GICs are negotiated on a case-by-case
basis.
Based on SCPPA’s Investment Policy, certain vehicles such as GICs, flexible repurchase agreements or
forward debt service agreements, may be entered into only upon approval of the SCPPA Board. In
addition, eligible securities and general limitations are derived from each Project’s Indenture of Trust, the
Government Code and SCPPA’s evolving investment practices.

Southern California Public Power Authority Notes to Combined Financial Statements
75
Note 4 – Investments (continued)
The operative Indentures of Trust in which securities are authorized for investment purposes relate to the
Southern Transmission System Project Bonds, the Mead-Phoenix Project Bonds, the Mead-Adelanto
Project Bonds, the Magnolia Power Project Bonds, the Pinedale Project Bonds, the Barnett Project
Bonds, Prepaid Natural Gas Project Bonds, the Canyon Power Project Bonds, the Milford Wind Phase I
Project Bonds, the Milford Wind Phase II Project Bonds, the Linden Wind Project Bonds, the Tieton
Hydropower Project Bonds, the Windy Point/Windy Flats Bonds, and the Apex Power Project Bonds.
Authorized investments for the Projects’ Stabilization Fund are set forth in a resolution approved by the
Board in 1996 and amended and approved in 2016.
Eligible securities include:
United States Treasury Securities, which are bonds or other obligations secured by the full faith and
credit of the United States of America;
Federal Agency Obligations, which have the full financial backing of the U.S. Government;
Government Sponsored Enterprise Obligations, which are created by acts of Congress to provide
liquidity for selected lending programs targeted by Congress;
Repurchase Agreements, which are collateralized loan contracts where the seller includes a written
agreement to repurchase the securities at a later date for a specified amount;
Negotiable Certificates of Deposit, which are deposit liabilities issued by a nationally or state-
chartered bank, a savings or a federal association or by a state-licensed branch of a foreign bank,
which has short-term ratings of at least “A-1” by S&P and at least “P-1” by Moody’s;
Bankers' Acceptances, a short-term draft or bill of exchange guaranteed for payment at face value to
the holder of the instrument on its maturity date, which has a short-term rating of at least “A-1” by
S&P and at least “P-1” by Moody’s;
Commercial Paper, a short-term unsecured promissory note issued by non-financial or financial firms
with a rating of at least “A-1” by S&P and at least “P-1” by Moody’s;
Medium Term Notes rated “A” or better and only those issued by corporations organized and
operating within the United States, or by depository institutions licensed by the United States or any
state and operating within the United States;
Mortgage-Backed and Asset-Backed Obligations, which are secured by a mortgage or collection of
mortgages, credit card receivables, student and auto loans, which are rated “AA” or its equivalent or
better by NRSRO and whose issuer have a rating of “A” or higher for the issuer’s debt as provided by
NRSRO;
State of California Obligations such as warrants, treasury notes, or bonds, including bonds payable
solely out of the revenues from a revenue producing property owned, controlled, or operated by the
State of California or by a department, board, agency, or authority of the State of California with a
rating of “A” or better;
California Local Agency Obligations such as notes, warrants, or bonds including bonds payable solely
out of the revenues from a revenue producing property owned, controlled, or operated by the local
agency or by a department, board, agency, or authority of the local agency with a rating of “A” or
better;

Southern California Public Power Authority Notes to Combined Financial Statements
76
Note 4 – Investments (continued)
State (Other than California) Obligations such as notes or bonds of any of the other 49 states in
addition to California was a rating of “A” or better;
Supranationals, which are United States dollar denominated senior unsecured unsubordinated
obligations issued or unconditionally guaranteed by the International Bank of Reconstruction and
Development, International Finance Corporation, or Inter-American Development Bank with the rating
of “AA” or better;
Placement Service Deposits placed through a deposit placement service that meet the requirements
of Code Section 53601.8, with a maximum term of one year or less; and
Equity-Linked Notes, which are categorized as medium-term corporate notes and are subject to the
constraints set forth in the Government Code and the Authority’s Investment Policy.
As of June 30, 2019, the Authority held the following as cash and cash equivalents and investments:
Fair Value Weighted Average
(in thousands) Maturity (Years) Percent of Portfolio
U.S. Agency Securities 367,792$ 0.32 39.1%
Guaranteed Investment Contracts 20,467 12.30 2.2%
Money Market Funds 86,250 0.08 9.1%
Supranational Securities 29,546 0.30 3.1%
Commercial Paper 13,269 0.10 1.4%
U.S. Treasury Securities 41,143 0.44 4.4%
Medium Term Corporate Notes 15,631 0.97 1.7%
Negotiable CDs 6,800 2.00 0.7%
Municipal Bonds 4,125 1.37 0.4%
U.S. Agency Discount Notes 356,286 0.07 37.9%
Total 941,309$ 0.49 100.0%
Investment Type
The “weighted average maturity in years” calculation assumes that all investments are held until maturity.
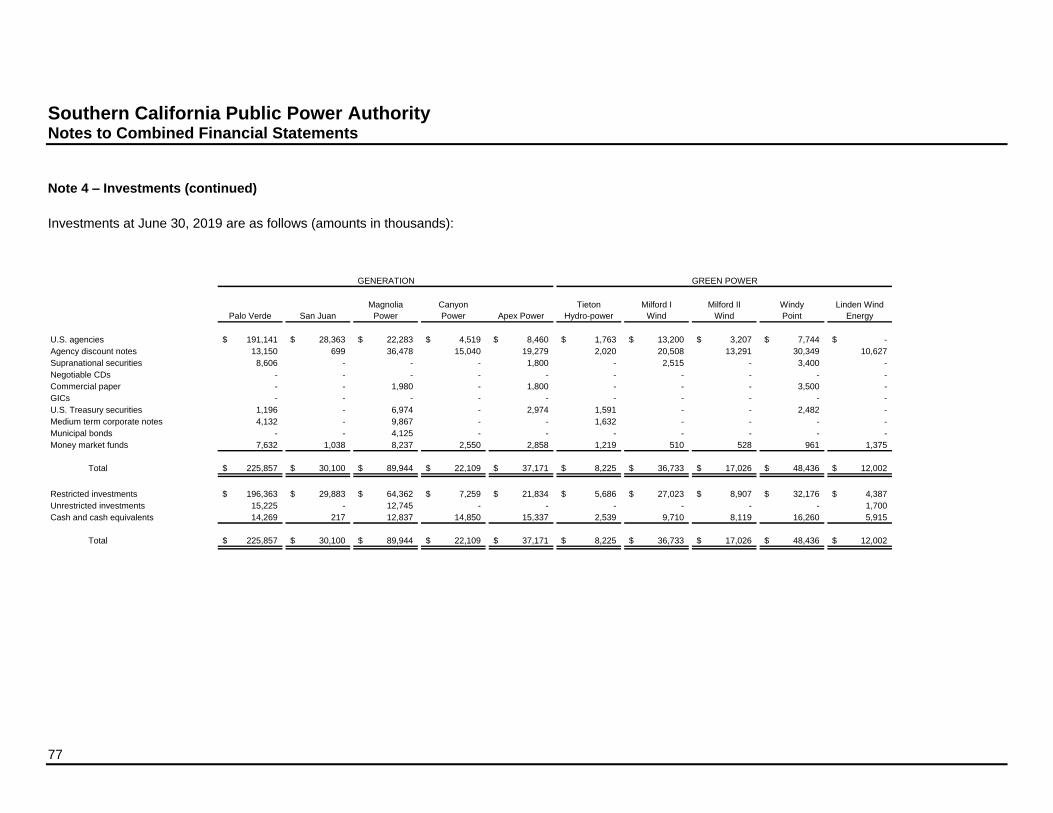
Southern California Public Power Authority Notes to Combined Financial Statements
77
Note 4 – Investments (continued)
Investments at June 30, 2019 are as follows (amounts in thousands):
Palo Verde San Juan
Magnolia
Power
Canyon
Power Apex Power
Tieton
Hydro-power
Milford I
Wind
Milford II
Wind
Windy
Point
Linden Wind
Energy
U.S. agencies 191,141$ 28,363$ 22,283$ 4,519$ 8,460$ 1,763$ 13,200$ 3,207$ 7,744$ -$
Agency discount notes 13,150 699 36,478 15,040 19,279 2,020 20,508 13,291 30,349 10,627
Supranational securities 8,606 - - - 1,800 - 2,515 - 3,400 -
Negotiable CDs - - - - - - - - - -
Commercial paper - - 1,980 - 1,800 - - - 3,500 -
GICs - - - - - - - - - -
U.S. Treasury securities 1,196 - 6,974 - 2,974 1,591 - - 2,482 -
Medium term corporate notes 4,132 - 9,867 - - 1,632 - - - -
Municipal bonds - - 4,125 - - - - - - -
Money market funds 7,632 1,038 8,237 2,550 2,858 1,219 510 528 961 1,375
Total 225,857$ 30,100$ 89,944$ 22,109$ 37,171$ 8,225$ 36,733$ 17,026$ 48,436$ 12,002$
Restricted investments 196,363$ 29,883$ 64,362$ 7,259$ 21,834$ 5,686$ 27,023$ 8,907$ 32,176$ 4,387$
Unrestricted investments 15,225 - 12,745 - - - - - - 1,700
Cash and cash equivalents 14,269 217 12,837 14,850 15,337 2,539 9,710 8,119 16,260 5,915
Total 225,857$ 30,100$ 89,944$ 22,109$ 37,171$ 8,225$ 36,733$ 17,026$ 48,436$ 12,002$
GENERATION GREEN POWER

Southern California Public Power Authority Notes to Combined Financial Statements
78
Note 4 – Investments (continued)
Investments at June 30, 2019 are as follows (amounts in thousands):
U.S. agencies
Agency discount notes
Supranational securities
Negotiable CDs
Commercial paper
GICs
U.S. Treasury securities
Medium term corporate notes
Municipal bonds
Money market funds
Total
Restricted investments
Unrestricted investments
Cash and cash equivalents
Total
POWER
PURCHASE
AGREEMENTS
Southern
Transmission
System
Mead-
Phoenix Mead- Adelanto Pinedale Barnett
Prepaid
Natural Gas Combined
Project
Development
Fund
Projects’
Stabilization
Fund
SCPPA
Fund Total
5,259$ -$ -$ -$ 22,858$ -$ -$ -$ 58,995$ -$ 367,792$
46,250 8,450 28,692 3,350 12,137 2,196 45,202 2,098 46,470 - 356,286
6,100 - - - - - - - 7,125 - 29,546
6,800 - - - - - - - - - 6,800
5,989 - - - - - - - - - 13,269
7,789 - - - - 12,678 - - - - 20,467
- - - - 2,991 - 11,987 - 10,948 - 41,143
- - - - - - - - - - 15,631
- - - - - - - - - - 4,125
2,847 903 1,138 5,485 5,651 2,878 25,638 3,573 11,228 1 86,250
81,034$ 9,353$ 29,830$ 8,835$ 43,637$ 17,752$ 82,827$ 5,671$ 134,766$ 1$ 941,309$
45,051$ 3,700$ 17,400$ -$ 32,118$ 12,679$ -$ -$ 111,061$ -$ 619,889$
9,486 - - - - - 34,409 - - - 73,565
26,497 5,653 12,430 8,835 11,519 5,073 48,418 5,671 23,705 1 247,855
81,034$ 9,353$ 29,830$ 8,835$ 43,637$ 17,752$ 82,827$ 5,671$ 134,766$ 1$ 941,309$
NATURAL GAS MISCELLANEOUSTRANSMISSION

Southern California Public Power Authority Notes to Combined Financial Statements
79
Note 4 – Investments (continued)
Investments at June 30, 2018 are as follows (amounts in thousands):
Palo Verde San Juan
Magnolia
Power
Canyon
Power Apex Power
Hoover
Uprating
Tieton
Hydro-power
Milford I
Wind
Milford II
Wind Windy Point
Linden Wind
Energy
U.S. agencies 187,807$ 24,577$ 32,478$ 6,430$ 11,041$ -$ 4,922$ 21,187$ 3,118$ 10,090$ 2,317$
Agency discount notes 17,723 10,595 38,156 12,800 15,800 - 1,550 11,350 12,078 31,004 7,200
Supranational securities 6,756 3,394 - - 3,000 - - 3,100 2,100 6,100 1,300
Negotiable CDs - 3,999 3,999 - - - - - - - -
Commercial paper - 1,599 - - - - - - - - -
GICs - - - - - - - - - - -
U.S. Treasury securities - - 1,984 - - - - 1,994 - - -
Medium term corporate notes 3,075 - - - - - - - - - -
Municipal bonds - - 2,119 - - - - - - - -
Money market funds 5,838 1,622 10,363 4,387 2,652 - 1,826 3,820 1,698 779 845
Total 221,199$ 45,786$ 89,099$ 23,617$ 32,493$ -$ 8,298$ 41,451$ 18,994$ 47,973$ 11,662$
Restricted investments 192,198$ 29,237$ 57,474$ 13,630$ 17,642$ -$ 5,722$ 32,931$ 7,418$ 28,011$ 6,317$
Unrestricted investments 16,383 - 2,976 - - - - - 3,680 2,486 -
Cash and cash equivalents 12,618 16,549 28,649 9,987 14,851 - 2,576 8,520 7,896 17,476 5,345
Total 221,199$ 45,786$ 89,099$ 23,617$ 32,493$ -$ 8,298$ 41,451$ 18,994$ 47,973$ 11,662$
GENERATION GREEN POWER

Southern California Public Power Authority Notes to Combined Financial Statements
80
Note 4 – Investments (continued)
Investments at June 30, 2018 are as follows (amounts in thousands):
U.S. agencies
Agency discount notes
Supranational securities
Negotiable CDs
Commercial paper
GICs
U.S. Treasury securities
Medium term corporate notes
Municipal bonds
Money market funds
Total
Restricted investments
Unrestricted investments
Cash and cash equivalents
Total
POWER
PURCHASE
AGREEMENTS
Southern
Transmission
System
Mead-
Phoenix Mead- Adelanto Pinedale Barnett
Prepaid
Natural Gas Combined
Project
Development
Fund
Projects’
Stabilization
Fund
SCPPA
Fund Total
8,645$ -$ 1,987$ -$ 17,320$ -$ -$ -$ 79,888$ -$ 411,807$
62,599 4,000 20,374 3,995 8,527 1,995 45,012 - 19,380 - 324,138
1,100 1,100 1,600 - - - - - 2,499 - 32,049
7,000 - 1,000 - 1,450 - - - 2,600 - 20,048
- - - - - - - - 1,599 - 3,198
7,789 - - - - 12,183 - - - - 19,972
- 2,040 1,860 - 7,747 - - - 6,448 - 22,073
- - - - - - - - - - 3,075
- - - - - - - - - - 2,119
4,323 2,157 3,364 7,678 7,459 2,904 18,910 470 6,850 37 87,982
91,456$ 9,297$ 30,185$ 11,673$ 42,503$ 17,082$ 63,922$ 470$ 119,264$ 37$ 926,461$
61,635$ 4,940$ 21,021$ -$ 28,947$ 12,183$ -$ -$ 88,836$ -$ 608,142$
- - - - - - 15,149 - - - 40,674
29,821 4,357 9,164 11,673 13,556 4,899 48,773 470 30,428 37 277,645
91,456$ 9,297$ 30,185$ 11,673$ 42,503$ 17,082$ 63,922$ 470$ 119,264$ 37$ 926,461$
NATURAL GAS MISCELLANEOUSTRANSMISSION

Southern California Public Power Authority Notes to Combined Financial Statements
81
Note 4 – Investments (continued)
Interest rate risk – The Authority’s investment policy limits the maturity of its investments to a maximum
of five years for investments in the United States Treasury, Federal Agency, and Government Sponsored
Enterprise securities, excluding: investments held in Project Debt Service Reserve; long-term
commitments or agreements approved by the Authority’s Board; five years for medium term corporate
notes; 270 days for commercial paper; 180 days for bankers' acceptances; and one year for negotiable
certificates of deposits.
Credit risk – Under its investment policy and the State of California Government Code, the Authority is
subject to the prudent investor standard of care in managing all aspects of its portfolios. As an investment
standard, each investment shall be made with “judgment and care under circumstances then prevailing,
which a person of prudence, discretion and intelligence would exercise in the management of his/her
affairs, not in regard for speculation, but in regard to the permanent disposition of funds, considering the
probable income as well as the probable safety of the capital to be invested.” The Authority’s investment
policy does not preclude active management of the portfolio to address market opportunities. All
transactions shall be undertaken in the best interest of the Authority and its participants.
The Authority’s investment policy specifies that all project funds may be invested in shares of beneficial
interest for temporary periods, pending disbursement or reinvestment as allowed under the state of
California Government Code (Code). The Code requires that the fund must have either 1) attained the
highest ranking or highest letter and numerical rating provided by not less than two nationally recognized
statistical rating organizations (NRSRO) or 2) retained an investment advisor registered or exempt from
registration with the Securities and Exchange Commission with not less than five years’ experience
managing money market mutual funds with assets under management in excess of $500 million. As of
June 30, 2019, money market funds in the portfolios with Bank of New York Mellon have attained the
following ratings: AAAm by Standard and Poor’s, and AAA-mf by Moody’s Investors Service; while money
market funds in the portfolios with US Bank have attained ratings of AAAm by Standard and Poor’s,
AAAmf by Moody’s Investors Service, and AAAmmf by Fitch Ratings.
The U.S. government agency securities in the portfolio consist of securities issued by government-
sponsored enterprises, which are not explicitly guaranteed by the U.S. government. As of June 30, 2019
and 2018, the U.S. government agency securities in the portfolio carried the highest possible credit
ratings by the NRSRO that rated them.
The Guaranteed Investment Contracts in the portfolio with American International Group (AIG) consist of
securities issued by corporations and carry a rating of Baa1 by Moody’s Investors Service, BBB+ by
Standard and Poor’s, and BBB+ by Fitch Rating.
The Investment Agreement Contract with American General Life consists of securities issued by
corporations and carries a rating of A+ by Standard and Poor’s, A2 by Moody’s and A+ by Fitch Ratings.

Southern California Public Power Authority Notes to Combined Financial Statements
82
Note 4 – Investments (continued)
The Investment Agreement Contract in the portfolio with Assured Guaranty (formerly Financial Security
Assurance) consists of securities issued by corporations and carries a rating of A by Standard and Poor’s,
and Baa2 by Moody’s Investors Service.
Concentration of credit risk – The Authority’s investment policy specifies a 100% percentage limitation
on the amount that can be invested in U.S. government agency securities, except in certain issues of
other Authority projects, such as the STS project, specifically relating to the 1992 Subordinate Refunding
Bond.
Of the Authority’s total investments as of June 30, 2019, $384.6 million (40.9%) was invested in securities
issued by the Federal Home Loan Bank; $39.5 million (4.2%) was invested with Farm Credit Bank; $62.5
million (6.6%) was invested in securities issued by the Federal National Mortgage Association; $237.4
million (25.2%) was invested with Federal Home Loan Mortgage; $41.1 million (4.4%) was invested in US
Treasuries; $6.8 million (0.7%) was invested in Certificates of Deposit; $13.3 million (1.4%) was invested
in Commercial Paper; $20.5 million (2.2%) was invested in GICs; $29.5 million (3.1%) was invested in
Supranational Securities; $15.6 million (1.7%) was invested in Medium Term Corporate Notes; and $4.1
million (0.4%) was invested in Municipal Bonds.
Of the Authority’s total investments as of June 30, 2018, $340.6 million (36.8%) was invested in securities
issued by the Federal Home Loan Bank; $44.5 million (4.8%) was invested with Farm Credit Bank; $97.2
million (10.5%) was invested in securities issued by the Federal National Mortgage Association; $253.7
million (27.4%) was invested with Federal Home Loan Mortgage; $22.1 million (2.4%) was invested in US
Treasuries; $20.0 million (2.2%) was invested in Certificates of Deposit; $3.2 million (0.3%) was invested
in Commercial Paper; $20.0 million (2.2%) was invested in GICs; $32.0 million (3.5%) was invested in
Supranational Securities; $3.1 million (0.3%) was invested in Medium Term Corporate Notes; and $2.1
million (0.2%) was invested in Municipal Bonds.
Note 5 – Derivative Instruments
Objective of the swaps – SCPPA uses derivative instruments to hedge its exposure to changing interest
rates through the use of interest rate swaps and also to manage its exposure to fluctuating natural gas
prices through the use of natural gas hedge contracts. An interest rate swap is the exchange of payments
between SCPPA and a counterparty in order to potentially obtain a lower cost of funding than traditional
fixed rate bonds, or to hedge interest rate exposure on SCPPA’s assets or liabilities. The Authority has
entered into separate pay-fixed, receive-variable interest rate swaps and three basis swaps to produce
savings or to result in lower costs over the life of each transaction than what the Authority would have
paid using fixed-rate debt.

Southern California Public Power Authority Notes to Combined Financial Statements
83
Note 5 – Derivative Instruments (continued)
The Authority has adopted GASB Statement No. 53, Accounting and Financial Reporting for Derivative
Instruments. This Statement addresses the recognition, measurement, and disclosure of information
regarding derivative instruments. In accordance with GASB 53, SCPPA recognizes the changes in fair
values of effective hedging derivative instruments as either deferred inflows or outflows of resources on
the Authority’s Statements of Net Position and includes changes in the fair value of an ineffective
derivative instrument in earnings.
For fiscal year ended June 30, 2019, the balance for the swaps deemed to qualify for effective hedge
accounting under GASB 53 was a net liability and corresponding deferred outflows of resources of $28.7
million. It is an increase of $11.5 million from the liability balance of $17.2 million at June 30, 2018.
For the swaps that were deemed ineffective derivative instruments under GASB 53, the changes were
reported in the statements of revenues, expenses and changes in net position. The net liability balance
for the ineffective derivative instruments at June 30, 2019 was $9.0 million, an increase of $3.5 million
from the liability balance of $5.5 million at June 30, 2018.
For fiscal year ended June 30, 2018, the balance for the swaps deemed to qualify for effective hedge
accounting under GASB 53 was a net liability and corresponding deferred outflows of resources of $17.2
million. It is a decrease of $7.5 million from the liability balance of $24.7 million at June 30, 2017.
For the swaps that were deemed ineffective derivative instruments under GASB 53, the changes were
reported in the statements of revenues, expenses and changes in net position. The net liability balance
for the ineffective derivative instruments at June 30, 2018 was $5.5 million, a decrease of $8.6 million
from the liability balance of $14.1 million at June 30, 2017.
Terms, fair values, and credit risk – The terms, including the fair values and credit ratings of the
counterparties under the outstanding swaps as of June 30, 2019, are included in following table. In most
cases, and with the exclusion of basis swaps, the notional amount of any swap matches the principal
amount of the associated debt. Except as discussed under the rollover risk, and when associated with
basis swaps, the Authority’s swap agreements contain scheduled reductions to outstanding notional
amounts that are expected to approximately follow scheduled or anticipated reductions in the associated
“bonds payable” category.
Notional
Amount
(in thousands)
Effective
Date Fixed Rate Paid Variable Rate Received
Fair Values
(in thousands)
Swap
Termination
Date
Counterparty
Credit Rating*
MAG 2010-1 Swap (Barclays) 100,000$ 7/1/2023 SIFMA 80.4% of 3-month LIBOR 395$ 7/1/2036 A/A2/A+
MAG 2010-2 Swap (RBC) 100,000 7/1/2023 SIFMA 81% of 3-month LIBOR 482 7/1/2036 AA-/Aa2/AA
MAG 2009-1 Swap (BNYMellon) 108,686 5/1/2012 3.125% SIFMA (18,152) 7/1/2036 AA-/Aa2/AA
MAG 2009-2 Swap (JPMorgan) - 9/22/2017 3.139% SIFMA (10,968) 7/1/2036 A+/Aa2/AA
MA 2007 Swap (JPMorgan) 100,000 6/1/2018 1-month LIBOR 100% of 10-yr LIBOR CMS rate less .414% 1,094 9/15/2030 A+/Aa2/AA
PNG 2007 Swap (J. Aron) 36,000 5/1/2009 5.0475% 67% of 3-Month LIBOR plus 1.47% (10,500) 11/1/2035 BBB+/A3/A
444,686$ (37,649)$
* S&P/Moody's/Fitch ratings
Southern California Public Power Authority Notes to Combined Financial Statements
84
Note 5 – Derivative Instruments (continued)
MAG 2017-1 Swap (amended/restated) – This swap transaction amends and restates the MAG
2009-2 Swap which amended the MAG 2007-1 Swap. The original transaction was novated from
Bear Stearns to JP Morgan on November 6, 2008 and was amended and restated on April 21, 2009.
Under the MAG 2009-2 Swap, the Authority was paying its counterparty a fixed rate of 3.139% in
exchange for receiving 100% of the SIFMA Index on a notional amount of $109.9 million. In order to
provide more favorable terms to the participants, SCPPA made a payment of $15.7 million to the
counterparty which has been deferred and is being amortized as an interest yield adjustment over the
life of the swap. The amendment allowed the parties to re-coupon the swaps, change the collateral
posting requirements, and to move to uninsured swaps. In August 2012, the swap documents were
amended to raise the collateral threshold.
On September 22, 2017 the MAG 2017-1 Swap restructured the MAG 2009-2 Swap. Under the MAG
2017-1 Swap, SCPPA makes scheduled monthly payments to the counterparty commencing on
October 1, 2017 through July 1, 2020. Commencing July 1, 2020, SCPPA will recommence making
fixed rate payments at 3.139% and receive floating rate payments at 100% of the SIFMA Index on an
initial notional amount of $63,840,000. Additionally, a portion of the MAG 2009-2 swap was
terminated and SCPPA paid the counterparty a restructure payment of $7.3 million.
MAG 2010-1 Swap (amended/restated) – In May 2010, SCPPA executed $100 million Securities
Industry and Financial Markets Association Swap Index (SIFMA)/LIBOR floating-to-floating basis
swap related to Magnolia Power Project A Refunding Bonds 2009-1. SCPPA pays the 6-month
average of the weekly reset SIFMA Municipal Swap Index semi-annually on an Actual/Actual basis in
exchange for receiving 80.4% of average 3-Month LIBOR, reset quarterly and paid semi-annually on
an Actual/360-day basis. The swap expires on July 1, 2036.
On November 16, 2018, the SCPPA suspended the swap for a period of five years. SCPPA received
$1.2 million from Barclays Bank PLC, the swap counterparty, as full consideration of the suspension.
No cash flows shall occur from January 1, 2019 to July 1, 2023. Payment on the MAG 2010-1 Swap
will recommence on January 1, 2024.
MAG 2010-2 Swap (amended/restated) – In May 2010, SCPPA executed $100 million
SIFMA/LIBOR floating-to-floating basis swap related to Magnolia Power Project A Refunding Bonds
2009-2. SCPPA pays the 6-month average of the weekly reset SIFMA Municipal Swap Index semi-
annually on an Actual/Actual basis in exchange for receiving 81.0% of average 3-Month LIBOR, reset
quarterly and paid semi-annually on an Actual/360-day basis. The swap expires on July 1, 2036.
On November 13, 2018, the SCPPA suspended the swap for a period of five years. SCPPA received
$1.4 million from the Royal Bank of Canada, the swap counterparty, as full consideration of the
suspension. No cash flows shall occur from January 1, 2019 to July 1, 2023. Payment on the MAG
2010-2 Swap will recommence on January 1, 2024.
Southern California Public Power Authority Notes to Combined Financial Statements
85
Note 5 – Derivative Instruments (continued)
MAG 2009-1 Swap (restated/novated) – This swap transaction amends the MAG 2007-1 Swap,
which had an original trade date of April 30, 2007. The transaction was amended and restated as of
April 21, 2009. The Authority pays its counterparty a fixed rate of 3.125% in exchange for receiving
100% of the SIFMA on a notional amount of $109.0 million. In order to provide more favorable terms
to the participants, SCPPA made a payment of $15.7 million to the counterparty which has been
deferred and is being amortized as an interest yield adjustment over the life of the swap. The
amendment allowed the parties to re-coupon the swaps, change the collateral posting requirements,
and to move to uninsured swaps. In May 2012, the swap was novated to a new counterparty and the
swap documents were amended to raise the collateral threshold.
MA 2007 Swap (amended) – In January 2007, the Authority entered into a Constant Maturity Swap
(CMS) in connection with its outstanding Mead-Adelanto Project bonds. The transaction consisted of
a $100 million basis swap and does not relate to any single series of the Mead-Adelanto bonds. The
amended swap terms became effective on February 1, 2008 and the Authority pays the swap
counterparty 100% of the one month LIBOR in exchange for receiving 100% of the 10-year LIBOR
minus 41.4 basis points. The swap expires on September 15, 2030.
On November 5, 2008, the MA 2007 Swap was novated from Bear Stearns to JP Morgan. In addition,
the swap was suspended until November 1, 2011. As part of the novation, the credit terms of the
existing swap agreements were maintained and SCPPA received $4.1 million from JP Morgan as
compensation for the suspension of the cash flows of the MA 2007 CMS. The $4.1 million was
deferred to be amortized over the suspension term.
In June 2010, the MA 2007 CMS Agreement was amended to extend the suspension period from
November 1, 2011 to June 1, 2018. SCPPA received $5 million as compensation for the suspension
of the cash flows of the swap, which was deferred and is being amortized over the suspension term.
The credit terms of the existing swap agreements remain unchanged. Payment on the MA 2007 CMS
Agreement recommenced on July 1, 2018.
PNG 2007 Swap – In October 2007, SCPPA entered into an interest rate swap agreement in
connection with the issuance of the Prepaid Natural Gas Project No. 1 Series 2007B Bonds. The
swap hedges the interest-rate risk on the LIBOR Floating-rate bonds, where SCPPA pays a fixed rate
of 5.0475% in exchange for receiving 67% of three-month LIBOR plus 1.47%. The floating index on
the swap exactly matches the coupon on the Bonds and therefore provides a hedge with no tax or
basis risk. The swap expires on November 1, 2035.
PNG 2007 Commodity Swap – At the same time, SCPPA also entered into five commodity price
swap agreements, on behalf of each of the Prepaid Natural Gas Project No. 1 Participants, in order to
hedge against reductions to its gas sale revenues resulting from changes in monthly market index
prices. SCPPA pays a floating natural gas price over a 30-year period and receives specified fixed
natural gas prices at an agreed pricing point as determined in the Prepaid Natural Gas No. 1
Agreements. The swaps became effective on July 1, 2008 and will all expire on September 30, 2035.
Southern California Public Power Authority Notes to Combined Financial Statements
86
Note 5 – Derivative Instruments (continued)
Fair value – The Authority reports its derivative instruments in accordance with GASB 53 and records its
fair values in accordance with GASB 72 (see Note 6).
While some of SCPPA’s current mark to market values are negative, this valuation would be realized only
if the swaps were terminated at the valuation date, and only SCPPA retains the right to optionally
terminate most of the transactions.
Interest rate risk – Interest rate risk is the risk that changes in interest rates will adversely affect the fair
values of SCPPA’s financial instruments or cash flows. SCPPA is exposed to interest-rate risk on its pay-
fixed, receive variable interest rate swaps. As the LIBOR or the SIFMA swap index decreases, SCPPA’s
net payment on swaps increases. In addition, SCPPA is exposed to interest rate risk if the counterparty to
the swap defaults or if the swap is terminated.
Market access risk – Market access risk is the risk that SCPPA will not be able to enter credit markets or
that credit will become more costly. SCPPA’s financial rating is tied to the credit strength of the major
participants of the specific project for which each financial instrument is issued. SCPPA is also exposed
to market access risks caused by disruptions in the municipal bond market.
Credit risk – As of June 30, 2019, the net fair values of the Authority’s applicable swaps for which
payments were made were negative for each counterparty except for the MAG 2010-1, MAG 2010-2 and
Mead-Adelanto 2007 swap. However, should interest rates change and the fair values of the swaps
become positive, the Authority may be exposed to credit risk in the amount of the derivatives’ fair value.
The swap agreements contain varying collateral agreements with the counterparties. The swaps require
full collateralization of the fair value of the swap should the counterparty’s (or if applicable, the guarantors
of the counterparty’s) credit rating fall below AA- as issued by Standard & Poor’s or Aa3 as issued by
Moody’s Investors Service for the MA 2007 Swaps; A/A2 for the PNG 2007 Commodity Swap; and A-/A3
for the MAG 2010-1, MAG 2010-2, and MAG 2009-1. Collateral on all swaps is to be in the form of U.S.
government securities held by a third-party custodian.
The swap agreements provide that when the Authority has more than one derivative transaction with a
given counterparty involving the same Authority project (and having the same swap/bond insurer), should
one party become insolvent or otherwise default on its obligations, close-out netting provisions permit the
non-defaulting party to accelerate and terminate all such related transactions and net the transactions’ fair
values so that a single sum will be owed by, or owed to, the non-defaulting party.
Basis risk – Basis risk is the risk that the interest rate paid by the Authority on underlying variable rate
bonds to bondholders exceeds the variable swap rate received from the counterparty, and the risk that
both legs of a basis swap are not exactly equal. With the exception of the PNG 2007 Swap, the Authority
bears basis risk on each of its swaps. The PNG 2007 Swap is perfectly hedged since the counterparty
pays the Authority its actual variable bond rate on the related bonds.

Southern California Public Power Authority Notes to Combined Financial Statements
87
Note 5 – Derivative Instruments (continued)
All the other swaps have a basis risk since under each of those swaps the Authority received a
percentage of LIBOR or a percentage of, or spread to, SIFMA to offset the actual variable bond rate or
variable swap rate the Authority pays on any related bonds or on any basis swap. The Authority is
exposed to basis risk should the floating rate that it receives on a swap be less than the actual variable
rate the Authority pays on any related bonds; or in the case of the floating-to-floating fixed-spread basis
swap, less than the variable rate paid to the swap counterparty.
Depending on the magnitude and duration of any basis risk shortfall, the expected cost savings from a
swap may not be fully realized.
The following is a summary of interest rates paid to and received from the counterparties as of June 30,
2019:
MAG 2009-1
Swap
MAG 2010-1
Swap
MAG 2010-2
Swap
PNG 2007
Swap
Payments to counterparty 3.125% 1.489% 1.488% 5.048%
Less, variable payments from counterparty 1.659% 1.926% 1.940% 2.579%
Net interest-rate swap payments 1.466% -0.437% -0.452% 2.469%
Add, variable-rate bond coupon payments 1.500% N/A N/A 2.579%
Synthetic interest rate on bonds 2.966% -0.437% -0.452% 5.048%
Termination risk – The Authority or the counterparty may terminate any of the swaps if the other party
fails to perform under the terms of the contract. If any of the swaps were terminated, any associated
variable rate bonds would no longer be hedged to a fixed rate. If at the time of termination the swap has a
negative fair value, the Authority would be liable to the counterparty for a payment equal to the swap’s fair
value.
Rollover risk – Rollover risk is the risk that the swap contract is not co-terminus with the related bonds.
In the event that this type of swap terminates, the Authority would be exposed to variable interest rates on
the underlying bonds.

Southern California Public Power Authority Notes to Combined Financial Statements
88
Note 5 – Derivative Instruments (continued)
Swap payments and associated debt – Using rates as of June 30, 2019, debt service requirements of
the Authority’s outstanding variable rate debt and net swap payments are as follows. As rates vary,
variable rate bond interest payments and net swap payments will vary.
Interest-Rate
Principal Interest Swaps, Net Total
2020 485$ 2,132$ 2,513$ 4,645$
2021 900 3,902 2,882 6,784
2022 940 3,887 2,758 6,645
2023 5,665 3,794 2,674 6,468
2024 11,550 3,612 2,504 6,116
2025–2029 114,920 15,076 10,395 25,471
2030–2034 178,825 9,333 7,020 16,353
2035–2039 172,860 2,083 1,772 3,855
486,145$ 43,819$ 32,518$ 76,337$
Fiscal Year Ending June 30,
(amounts in thousands)
Variable-Rate Bonds
The following table shows the changes in fair value of derivative instruments (amounts in thousands):
June 30, 2018
Change in
Fair Value June 30, 2019
Assets
Mead Adelanto – Derivative instruments -$ 1,094$ 1,094$
-$ 1,094$ 1,094$
Deferred outflows of resources
Magnolia – Deferred outflows 12,248$ 6,780$ 19,028$
Prepaid Natural Gas – Deferred outflows 7,425 3,075 10,500
19,673$ 9,855$ 29,528$
Liabilities
Magnolia – Derivative instruments 16,542$ 14,797$ 29,120$
Mead Adelanto – Derivative instruments 1,218 (1,218) -
Prepaid Natural Gas – Derivative instruments 7,425 3,075 10,500
25,185$ 16,654$ 39,620$
Description

Southern California Public Power Authority Notes to Combined Financial Statements
89
Note 6 – Fair Value Measurement
In February 2015, the GASB issued Statement No. 72, Fair Value Measurement and Application, effective
for financial statements for years beginning after June 15, 2015. This statement clarifies the definition of
fair value, establishes general principles for measuring fair value, provides additional fair value application
guidance, and enhances disclosures about fair value measurements. This statement establishes a three-
level hierarchy to the valuation techniques used to measure fair value. Disclosure is required to be made
about fair value measurements, the level of fair value hierarchy, and valuation techniques.
In accordance with GASB 72, fair value is the price that would be received to sell an asset or paid to
transfer a liability in an orderly transaction between market participants at the measurement date (an exit
price). Fair Value is a market-based measurement for a particular asset or liability based on assumptions
that market participants would use in pricing the asset or liability. Such assumptions include observable
and unobservable inputs of market data, as well as assumptions about risk and the risk inherent in the
inputs to the valuation technique.
Valuation inputs are assumptions that market participants use in pricing an asset or liability. The hierarchy
of inputs used to generate the valuation is classified into three different Levels:
Level 1 inputs are quoted prices (unadjusted) in active markets for identical assets or liabilities that
the government can access at the measurement date.
Level 2 inputs include quoted prices for similar assets or liabilities in markets that are active; quoted
prices for identical or similar assets or liabilities in markets that are not active; and inputs other than
quoted prices that are observable for an asset, either directly or indirectly.
Level 3 inputs are unobservable inputs from the asset or liability where there is very little market
activity and they should be used only when relevant Level 1 and Level 2 inputs are unavailable.
The Authority’s fair value measurements are performed on a recurring basis. Because investing is not a
core part of the Authority’s mission, the Authority determines that the disclosures related to these
investments only need to be disaggregated by major type. The Authority categorizes its fair value
measurements within the fair value hierarchy established by generally accepted accounting principles.
The fair value of SCPPA’s swaps reflect the nonperformance risk of their client counterparty relating to
that liability, and the nonperformance risk of the bank counterparty relating to that asset. The tables on
pages 90 and 91 present fair value balances and their levels within the fair value hierarchy as of June 30,
2019 and 2018. The investment balances presented exclude amounts related to Government Money
Market Funds and Guaranteed Investment Contracts.
Fair value of SCPPA’s investments under GASB 72 – Debt and other securities classified in Level 1 of
the fair value hierarchy are valued through the evaluation of information obtained from live data sources,
including active market makers and inter-dealer brokers and the use of prices quoted in active markets for
those securities. Level 2 Securities are valued using a multi-dimensional relationship model or matrix
pricing model utilizing market data including, but not limited to, benchmark yields, reported trades, and
broker/dealer quotes.
Southern California Public Power Authority Notes to Combined Financial Statements
90
Note 6 – Fair Value Measurement (continued)
Fair value of SCPPA’s swaps under GASB 72 – Fair values take into consideration the prevailing
interest rate environment and the specific terms and conditions of a given transaction. The expected
swap cash flows are calculated using the zero-coupon discounting method which takes into consideration
the prevailing interest rate environment, the specific terms and conditions of a given transaction, and
assumes that the current forward rates implied by the yield curve are the market’s best estimate of future
spot interest rates. The income approach is then used to obtain the fair value of the swaps, where future
amounts (the expected swap cash flows) are converted to a single current (discounted) amount, using a
rate of return that takes into account the relative risk of nonperformance associated with the cash flows,
and time value of money. Where applicable under the income approach, the option pricing model
technique, such as the Black-Derman-Toy model, or other appropriate option pricing model is used. The
observability of inputs used to perform the measurement results in the swap fair values being categorized
as Level 2.
The Authority has the following fair value measurements at June 30, 2019:
Quoted Prices Significant
in Active Other Significant
Markets for Observable Unobservable
June 30, Identical Assets Inputs Inputs
2019 (Level 1) (Level 2) (Level 3)
Investments by fair value level
Debt securities
U.S. government securities 41,143$ 41,143$ -$ -$
U.S. agencies 724,078 - 724,078 -
Supranational securities 29,546 - 29,546 -
Municipal bonds 4,125 - 4,125 -
Total debt securities 798,892 41,143 757,749 -
Other
Commercial paper 13,269 - 13,269 -
Certificate of deposit 6,800 - 6,800 -
Medium term corporate notes 15,631 - 15,631 -
Total other 35,700 - 35,700 -
Total investments by fair
value level 834,592$ 41,143$ 793,449$ -$
Derivative instruments by fair value level
Investment derivative (8,997)$ -$ (8,998)$ -$
Effective hedge (28,652) - (28,652) -
Total derivative instruments by
fair value level (37,649)$ -$ (37,650)$ -$
Fair Value Using

Southern California Public Power Authority Notes to Combined Financial Statements
91
Note 6 – Fair Value Measurement (continued)
The Authority has the following fair value measurements at June 30, 2018:
Quoted Prices Significant
in Active Other Significant
Markets for Observable Unobservable
June 30, Identical Assets Inputs Inputs
2018 (Level 1) (Level 2) (Level 3)
Investments by fair value level
Debt securities
U.S. government securities 22,073$ 22,073$ -$ -$
U.S. agencies 735,945 - 735,945 -
Supranational securities 32,049 - 32,049 -
Municipal bonds 2,119 - 2,119 -
Total debt securities 792,186 22,073 770,113 -
Other
Commercial paper 3,198 - 3,198 -
Certificate of deposit 20,048 - 20,048 -
Medium term corporate notes 3,075 - 3,075 -
Total other 26,321 - 26,321 -
Total investments by fair
value level 818,507$ 22,073$ 796,434$ -$
Derivative instruments by fair value level
Investment derivative (5,512)$ -$ (5,512)$ -$
Effective hedge (17,194) - (17,194) -
Total derivative Instruments by
fair value level (22,706)$ -$ (22,706)$ -$
Fair Value Using

Southern California Public Power Authority Notes to Combined Financial Statements
92
Note 7 – Long-Term Debt
Long-term debt outstanding at June 30, 2019, consisted of “new money” bonds, refunding bonds, and
subordinate refunding bonds due in varying annual amounts through July 1, 2040. The new money bonds
were issued to finance the purchase and construction or acquisition of the Authority’s interest in each of
the Projects. The refunding and subordinate refunding bonds were issued to refund specified new money
bonds.
In accordance with the bond indentures, the new money bonds and refunding bonds are special, limited
obligations of the Authority. With the exception of the Magnolia Power Project B, Lease Revenue Bonds
(City of Cerritos, California) 2003-1 (Project B Bonds), the bonds issued by each project are payable
solely from and secured solely by interests in that project as follows:
Proceeds from the sale of bonds;
All revenues, incomes, rents, and receipts attributable to that project and interest earned on securities
held under the bond indenture or indentures; and
All funds established by the indenture or indentures.
The Authority has agreed to certain covenants with respect to bonded indebtedness, including the
requirement to enforce the natural gas, power, and transmission sales agreements with the participants.
At the option of the Authority, all outstanding new money bonds and refunding bonds are subject to
redemption prior to maturity, except as follows:
Southern Transmission System – 2011 Series A, 2013 Series A, 2015 Series A and B, portions of the
2015 Series C Subordinate Refunding bonds, 2017 Series A Subordinate Refunding bonds, and 2018
Series A Subordinate Refunding bonds;
Mead-Phoenix and Mead-Adelanto – 2012 Series A and portions of 2016 Series A Revenue bonds;
Prepaid Natural Gas – 2007 Series A and B Revenue bonds;
Canyon Power – portions of 2016 Series A Refunding Revenue bonds;
Milford II Wind – portions of the 2011-1 Revenue bonds;
Linden Wind – portions of the 2010 Series A Revenue bonds; and
Windy Point/Windy Flats – portions of the 2010-1 Revenue bonds.
Variable rate debt includes debt with rates based on daily, weekly, and long-term rates as determined by
a remarketing or calculation agent.

Southern California Public Power Authority Notes to Combined Financial Statements
93
Note 7 – Long-Term Debt (continued)
A summary of changes in long-term debt follows (amounts in thousands):
Magnolia Power
Canyon
Power Apex Power
Tieton
Hydro-power
Milford I
Wind
Milford II
Wind Windy Point Linden Wind
Total long-term debt at June 30, 2018 291,139$ 326,042$ 293,004$ 47,008$ 172,747$ 126,427$ 385,446$ 113,442$
Total debt due within one year at June 30, 2018 7,210 7,540 9,545 950 10,085 6,370 22,020 4,170
Total debt at June 30, 2018 298,349 333,582 302,549 47,958 182,832 132,797 407,466 117,612
Principal payments (7,210) (7,540) (9,545) (950) (10,085) (6,370) (22,020) (4,170)
Revenue bonds issued - - - - - - - -
Bonds refunded/defeased - - - - - - - -
Refunding bonds issued - - - - - - - -
Change in unamortized premiums and discounts (1,282) (2,025) (747) (65) (841) (1,292) (3,815) (628)
Total debt at June 30, 2019 289,857 324,017 292,257 46,943 171,906 125,135 381,631 112,814
Total debt due within one year at June 30, 2019 (7,560) (7,835) (9,710) (1,000) (10,570) (6,665) (23,040) (4,335)
Total long-term debt at June 30, 2019 282,297$ 316,182$ 282,547$ 45,943$ 161,336$ 118,470$ 358,591$ 108,479$
Southern
Transmission
System
Mead-
Phoenix
Mead-
Adelanto Pinedale Barnett
Prepaid
Natural Gas Total
Total long-term debt at June 30, 2018 470,191$ 34,583$ 65,877$ 16,490$ 38,780$ 293,386$ 2,674,562$
Total debt due within one year at June 30, 2018 56,100 7,185 20,705 1,770 4,150 5,385 163,185
Total debt at June 30, 2018 526,291 41,768 86,582 18,260 42,930 298,771 2,837,747
Principal payments (56,100) (7,185) (20,705) (1,770) (4,150) (5,385) (163,185)
Revenue bonds issued - - - - - - -
Bonds refunded/defeased (52,795) - - - - - (52,795)
Refunding bonds issued 48,535 - - - - - 48,535
Change in unamortized premiums and discounts (5,578) (757) (1,719) 1 (1) (229) (18,978)
Total debt at June 30, 2019 460,353 33,826 64,158 16,491 38,779 293,157 2,651,324
Total debt due within one year at June 30, 2019 (48,730) (7,365) (21,565) (1,627) (3,818) (6,445) (160,265)
Total long-term debt at June 30, 2019 411,623$ 26,461$ 42,593$ 14,864$ 34,961$ 286,712$ 2,491,059$
TRANSMISSION NATURAL GAS
GENERATION GREEN POWER
Southern California Public Power Authority Notes to Combined Financial Statements
94
Note 7 – Long-Term Debt (continued)
Magnolia Power Project – Debt consists of revenue and refunding series bonds with variable and fixed
interest rates between 2.00% and 5.00% with final maturities occurring in 2036.
Of the outstanding Magnolia Power Project Revenue Bonds, $10.685 million of “Project B Bonds” are
secured by lease rental payments to be made by the City of Cerritos (the City) in connection with the
lease of certain facilities and premises owned by the City to the Authority and the leaseback of such
facilities and premises to the City. The Base Rental Payments will be equal to the principal and interest
on the Project B Bonds. In accordance with the Assignment Agreement between the Authority and the
Trustee, the Authority will assign certain of its rights under the lease, including its right to receive the
Base Rental Payments, to the Trustee for the benefit of the owners of the Project B Bonds.
The City has covenanted to budget and appropriate sufficient funds to make all payments required to be
made under the lease. The lease has a term of 55 years.
Canyon Power Project – Debt consists of revenue bonds with variable and fixed interest rates ranging
from 0.94% to 5.00% and final maturity occurring in 2040.
Canyon Power Project Refunding Revenue Bonds – On May 15, 2018, SCPPA issued $114.31 million of
Canyon Power Project 2018 Series A Refunding Revenue Bonds (the “2018A Bonds”) with a premium of
$298,349 and $114,605,000 of Canyon Power Project 2018 Series B Refunding Revenue Bonds (the
“2018B Bonds”). The 2018A and 2018B Bonds are being issued to refund all of the outstanding Canyon
Power Project, Refunding Revenue Bonds 2017 Series A, and pay the costs of issuance relating to the
2018A & 2018B Bonds. The Series 2018A Bonds were issued as Fixed Rate Tender Bonds, bearing a
fixed yield of 2.14% through the initial mandatory tender date of May 1, 2021, at which point the bonds
will be remarketed for another fixed rate period or converted into another permissible mode. The Series
2018B Bonds were issued as Index Tender Bonds, bearing a variable rate at a fixed spread of 0.25% to
the SIFMA Index through the initial mandatory tender date of May 1, 2021, at which point the bonds will
be remarketed for another index rate period or converted into another permissible mode. Based on the
assumed rate, the Refunding has a present value savings of $1.68 million.
Apex Power Project – Debt consists of revenue bonds with fixed interest rates between 1.728% and
5.00% and final maturity occurring in 2038.
Tieton Hydropower Project – Debt consists of revenue bonds with fixed interest rates between 5.00%
and 5.79% and final maturity occurring in 2040.
Milford I Wind Project – Debt consists of revenue bonds with fixed interest rates ranging from 4.00% to
5.00% and final maturity occurring in 2030.
Milford II Wind Project – Debt consists of revenue bonds with fixed interest rates ranging from 4.00% to
5.25% and final maturity occurring in 2031.

Southern California Public Power Authority Notes to Combined Financial Statements
95
Note 7 – Long-Term Debt (continued)
Linden Wind Energy Project – Debt consists of revenue bonds with fixed interest rates between 4.00%
and 5.92% and final maturity occurring in 2035.
Southern Transmission System Project – Debt consists of refunding and subordinate refunding series
bonds with fixed interest rates ranging from 1.829% to 5.00% and final maturities occurring in 2027.
STS Project Refunding Bonds – On October 10, 2018, SCPPA issued $48,535,000 of Southern
Transmission System Project 2018 Series A Refunding Revenue Bonds (the “2018A Bonds”) with a
premium of $4,675,655.90. The 2018A Bonds are being issued to refund all of the outstanding
$43,860,000 of STS Project, Refunding Revenue Bonds 2008 Series A, and $37,000,000 of STS Project,
Refunding Revenue Bonds 2009 Series A, and to pay the costs of issuance relating to the 2018A Bonds.
The Refunding has a net present value savings of $4.65 million.
Windy Point/Windy Flats Project – Debt consists of revenue bonds with fixed interest rates between
3.00% and 5.00% and final maturity occurring in 2030.
Mead Phoenix/Mead Adelanto Projects – Debt consists of revenue and refunding series bonds with
fixed interest rates between 2.81% and 5.00% with final maturities occurring in 2030.
Natural Gas Projects – Debt consists of revenue bonds with fixed interest rates ranging from 5.51% to
6.03% and final maturities occurring in 2032.
Prepaid Natural Gas Project – Debt consists of revenue bonds with variable and fixed interest rates
ranging from 5.00% to 5.25% and final maturity occurring in 2035.

Southern California Public Power Authority Notes to Combined Financial Statements
96
Note 7 – Long-Term Debt (continued)
Premiums/Discounts – Unamortized premiums and discounts, net, which are included in the statements
of net position as a component of long-term debt, are as follows (amounts in thousands):
June 30, 2019
(Premium) Discount
(1,627)$
Canyon Power Project (8,186)
Apex Power Project (11,087)
Tieton Hydropower Project (843)
Milford I Wind Project (4,406)
Milford II Wind Project (6,000)
Windy Point Project (17,456)
Linden Wind Energy Project (2,944)
(34,307)
(3,071)
(4,159)
Prepaid Natural Gas Project No. 1 (1,882)
(95,968)$
June 30, 2018
(Premium) Discount
(2,909)$
Canyon Power Project (10,211)
Apex Power Project (11,834)
Tieton Hydropower Project (908)
Milford I Wind Project (5,247)
Milford II Wind Project (7,292)
Windy Point Project (21,271)
Linden Wind Energy Project (3,572)
(39,885)
(3,828)
(5,878)
Prepaid Natural Gas Project No. 1 (2,111)
(114,946)$
Magnolia Power Project
Southern Transmission System Project
Mead-Phoenix Project
Mead-Adelanto Project
Unamortized (Premium) Discount, Net
Unamortized (Premium) Discount, Net
Magnolia Power Project
Southern Transmission System Project
Mead-Phoenix Project
Mead-Adelanto Project
Southern California Public Power Authority Notes to Combined Financial Statements
97
Note 7 – Long-Term Debt (continued)
Advance refundings – The Authority has established irrevocable escrow trusts with the proceeds from
issuance of subordinate refunding bonds. These investments will be used to pay specified revenue bonds
called at scheduled redemption dates.
Defeasance of debt – The Authority has defeased specified revenue bonds by placing the proceeds from
the issuance of subordinate refunding bonds in irrevocable trusts to provide for all future debt service
payments on the refunded bonds. The trust investments and related liability for bonds that are considered
legally defeased are not included in the Authority’s financial statements. At June 30, 2019 and 2018,
$81.7 million and $206.7 million, respectively, of revenue bonds outstanding are considered legally
defeased.
The refunded bonds constitute a contingent liability of the Authority only to the extent that cash and
investments presently in the control of the refunding trustees are not sufficient to meet debt service
requirements and are therefore excluded from the combined financial statements because the likelihood
of additional funding requirements is considered remote.
Debt service – The scheduled debt service payments for future years ending June 30 are included in the
table on the following page. The variable rate used for the MAG 2009-1 was 1.50%. The variable rate
used for the CPP 2018B Bonds was 1.90%. All of the preceding variable rates were the rates at June 30,
2019. The variable rates are set by the bond-remarketing agent on a weekly basis based on economic
conditions and bond ratings.

Southern California Public Power Authority Notes to Combined Financial Statements
98
Note 7 – Long-Term Debt (continued)
Future principal and interest payments are as follows (amounts in thousands):
Palo Verde San Juan
Magnolia
Power
Canyon
Power Apex Power
Tieton
Hydropower
Milford I
Wind
Milford II
Wind Windy Point
Linden Wind
Energy
2020 Principal -$ -$ 7,560$ 7,835$ 9,710$ 1,000 10,570 6,665 23,040 4,335
2020 Interest - - 8,298 8,833 12,128 2,336 8,040 6,030 17,462 5,711
2021 Principal - - 115,450 8,185 9,920 1,050 11,090 7,000 24,125 4,555
2021 Interest - - 6,847 8,453 11,892 2,284 7,508 5,691 16,362 5,511
2022 Principal - - 8,320 8,595 10,185 1,105 11,635 7,345 25,240 4,735
2022 Interest - - 5,377 8,033 11,609 2,226 6,955 5,335 15,186 5,308
2023 Principal - - 7,085 9,025 10,490 1,165 12,200 7,710 26,475 4,960
2023 Interest - - 5,014 7,593 11,286 2,164 6,369 4,949 13,907 5,071
2024 - 2028 Principal - - 36,000 52,375 58,210 8,665 70,610 45,070 153,520 28,780
2024 - 2028 Interest - - 21,454 30,546 50,413 9,490 21,995 18,061 47,871 21,277
2029 - 2033 Principal - - 44,060 78,825 71,245 9,280 51,395 45,345 111,775 36,640
2029 - 2033 Interest - - 14,990 19,840 36,825 7,164 3,937 4,913 8,564 12,986
2034 - 2038 Principal - - 69,755 91,775 90,505 11,845 - - - 25,865
2034 - 2038 Interest - - 5,920 10,865 16,981 4,536 - - - 2,336
2039 - 2043 Principal - - - 59,216 20,905 11,990 - - - -
2039 - 2043 Interest - - - 1,840 523 1,082 - - - -
Principal -$ -$ 288,230$ 315,831$ 281,170$ 46,100$ 167,500$ 119,135$ 364,175$ 109,870$
Interest -$ -$ 67,900$ 96,003$ 151,657$ 31,282$ 54,804$ 44,979$ 119,352$ 58,200$
GREEN POWERGENERATION
FISCAL YEAR
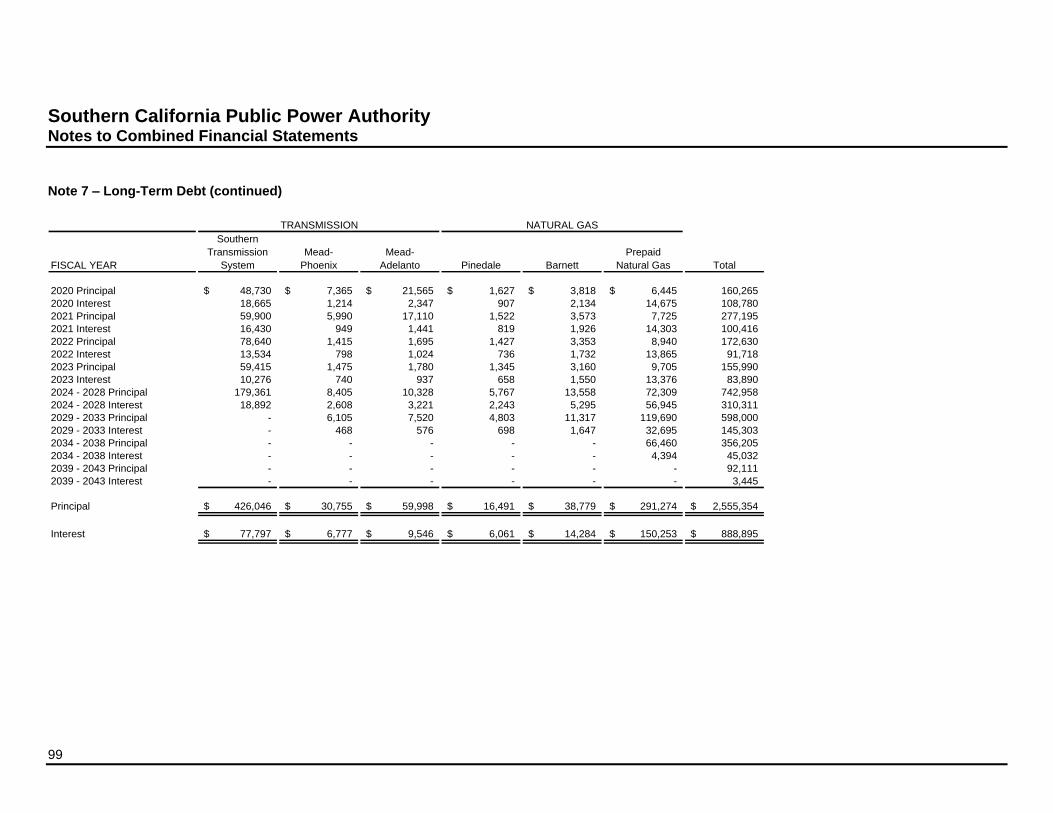
Southern California Public Power Authority Notes to Combined Financial Statements
99
Note 7 – Long-Term Debt (continued)
Southern
Transmission
System
Mead-
Phoenix
Mead-
Adelanto Pinedale Barnett
Prepaid
Natural Gas Total
2020 Principal 48,730$ 7,365$ 21,565$ 1,627$ 3,818$ 6,445$ 160,265
2020 Interest 18,665 1,214 2,347 907 2,134 14,675 108,780
2021 Principal 59,900 5,990 17,110 1,522 3,573 7,725 277,195
2021 Interest 16,430 949 1,441 819 1,926 14,303 100,416
2022 Principal 78,640 1,415 1,695 1,427 3,353 8,940 172,630
2022 Interest 13,534 798 1,024 736 1,732 13,865 91,718
2023 Principal 59,415 1,475 1,780 1,345 3,160 9,705 155,990
2023 Interest 10,276 740 937 658 1,550 13,376 83,890
2024 - 2028 Principal 179,361 8,405 10,328 5,767 13,558 72,309 742,958
2024 - 2028 Interest 18,892 2,608 3,221 2,243 5,295 56,945 310,311
2029 - 2033 Principal - 6,105 7,520 4,803 11,317 119,690 598,000
2029 - 2033 Interest - 468 576 698 1,647 32,695 145,303
2034 - 2038 Principal - - - - - 66,460 356,205
2034 - 2038 Interest - - - - - 4,394 45,032
2039 - 2043 Principal - - - - - - 92,111
2039 - 2043 Interest - - - - - - 3,445
Principal 426,046$ 30,755$ 59,998$ 16,491$ 38,779$ 291,274$ 2,555,354$
Interest 77,797$ 6,777$ 9,546$ 6,061$ 14,284$ 150,253$ 888,895$
FISCAL YEAR
TRANSMISSION NATURAL GAS
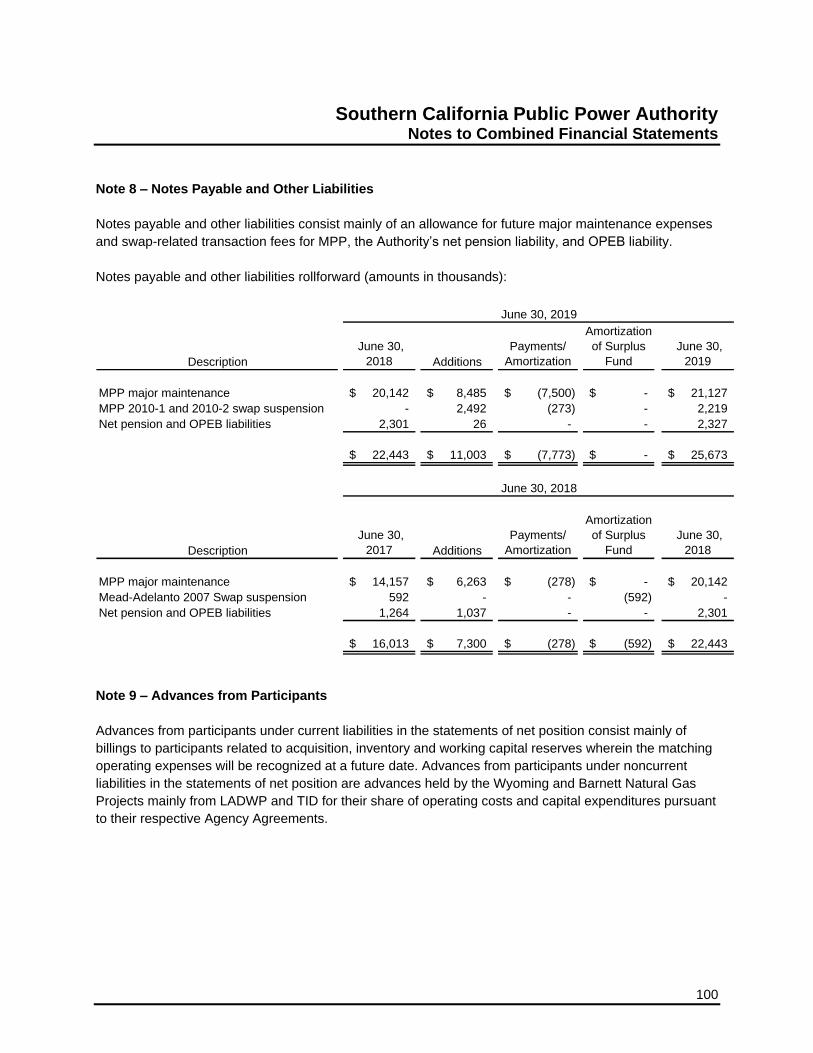
Southern California Public Power Authority Notes to Combined Financial Statements
100
Note 8 – Notes Payable and Other Liabilities
Notes payable and other liabilities consist mainly of an allowance for future major maintenance expenses
and swap-related transaction fees for MPP, the Authority’s net pension liability, and OPEB liability.
Notes payable and other liabilities rollforward (amounts in thousands):
Description
June 30,
2018 Additions
Payments/
Amortization
Amortization
of Surplus
Fund
June 30,
2019
MPP major maintenance 20,142$ 8,485$ (7,500)$ -$ 21,127$
MPP 2010-1 and 2010-2 swap suspension - 2,492 (273) - 2,219
Net pension and OPEB liabilities 2,301 26 - - 2,327
22,443$ 11,003$ (7,773)$ -$ 25,673$
Description
June 30,
2017 Additions
Payments/
Amortization
Amortization
of Surplus
Fund
June 30,
2018
MPP major maintenance 14,157$ 6,263$ (278)$ -$ 20,142$
Mead-Adelanto 2007 Swap suspension 592 - - (592) -
Net pension and OPEB liabilities 1,264 1,037 - - 2,301
16,013$ 7,300$ (278)$ (592)$ 22,443$
June 30, 2018
June 30, 2019
Note 9 – Advances from Participants
Advances from participants under current liabilities in the statements of net position consist mainly of
billings to participants related to acquisition, inventory and working capital reserves wherein the matching
operating expenses will be recognized at a future date. Advances from participants under noncurrent
liabilities in the statements of net position are advances held by the Wyoming and Barnett Natural Gas
Projects mainly from LADWP and TID for their share of operating costs and capital expenditures pursuant
to their respective Agency Agreements.
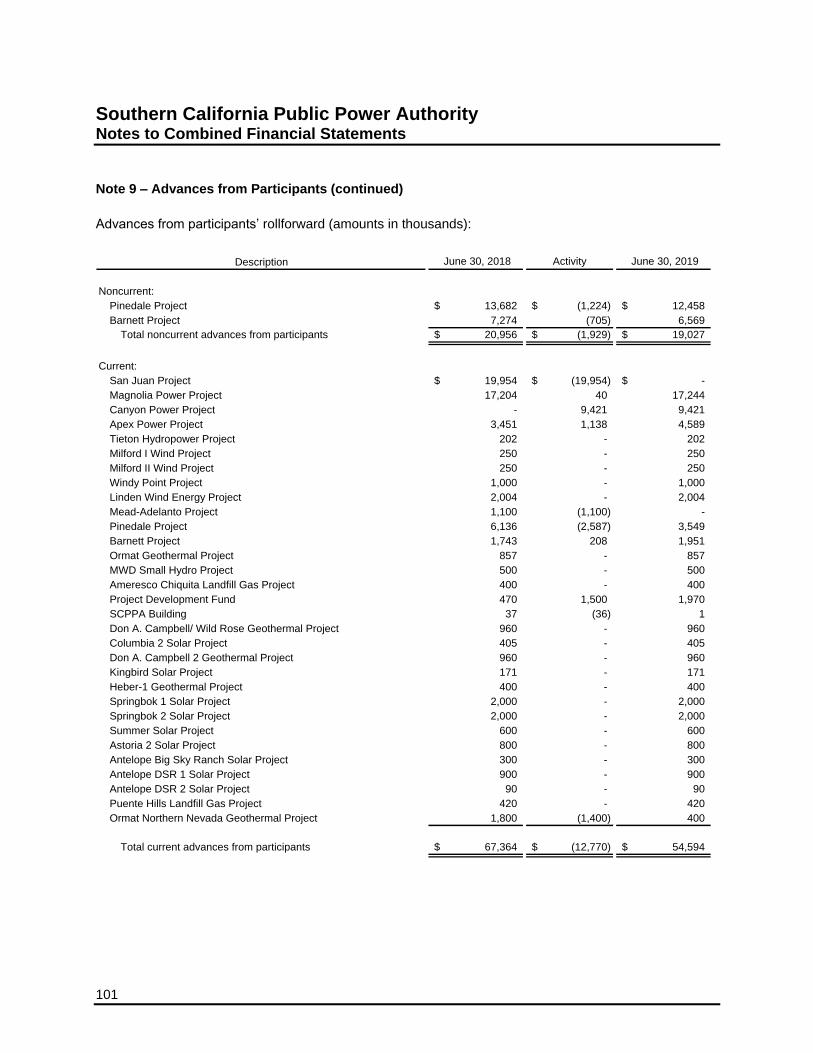
Southern California Public Power Authority Notes to Combined Financial Statements
101
Note 9 – Advances from Participants (continued)
Advances from participants’ rollforward (amounts in thousands):
Description June 30, 2018 Activity June 30, 2019
Noncurrent:
Pinedale Project 13,682$ (1,224)$ 12,458$
Barnett Project 7,274 (705) 6,569
Total noncurrent advances from participants 20,956$ (1,929)$ 19,027$
Current:
San Juan Project 19,954$ (19,954)$ -$
Magnolia Power Project 17,204 40 17,244
Canyon Power Project - 9,421 9,421
Apex Power Project 3,451 1,138 4,589
Tieton Hydropower Project 202 - 202
Milford I Wind Project 250 - 250
Milford II Wind Project 250 - 250
Windy Point Project 1,000 - 1,000
Linden Wind Energy Project 2,004 - 2,004
Mead-Adelanto Project 1,100 (1,100) -
Pinedale Project 6,136 (2,587) 3,549
Barnett Project 1,743 208 1,951
Ormat Geothermal Project 857 - 857
MWD Small Hydro Project 500 - 500
Ameresco Chiquita Landfill Gas Project 400 - 400
Project Development Fund 470 1,500 1,970
SCPPA Building 37 (36) 1
Don A. Campbell/ Wild Rose Geothermal Project 960 - 960
Columbia 2 Solar Project 405 - 405
Don A. Campbell 2 Geothermal Project 960 - 960
Kingbird Solar Project 171 - 171
Heber-1 Geothermal Project 400 - 400
Springbok 1 Solar Project 2,000 - 2,000
Springbok 2 Solar Project 2,000 - 2,000
Summer Solar Project 600 - 600
Astoria 2 Solar Project 800 - 800
Antelope Big Sky Ranch Solar Project 300 - 300
Antelope DSR 1 Solar Project 900 - 900
Antelope DSR 2 Solar Project 90 - 90
Puente Hills Landfill Gas Project 420 - 420
Ormat Northern Nevada Geothermal Project 1,800 (1,400) 400
Total current advances from participants 67,364$ (12,770)$ 54,594$

Southern California Public Power Authority Notes to Combined Financial Statements
102
Note 10 – Net Position
The Authority’s billing amounts to the participants are determined by its Board of Directors and are
subject to review and approval by the participants. Billings to participants are designed to recover “costs”
as defined by the power sales, natural gas sales, and transmission service agreements. The billings are
structured to systematically provide for debt service requirements, operating funds, and reserves in
accordance with these agreements. The accumulated difference between billings and the Authority’s
expenses calculated in accordance with accounting principles generally accepted in the United States of
America are presented as Net Position. It is intended that this difference will be recovered in the future
through billings for repayment of principal on the related bonds.
Net position is comprised of the following (in thousands):
June 30, 2017
Fiscal Year
2018 Activity June 30, 2018
Fiscal Year
2019
Activity June 30, 2019
GAAP items not included in billings to participants
Depreciation of plant (1,942,154)$ (104,827)$ (2,046,981)$ (103,874)$ (2,150,855)$
Nuclear fuel amortization (5,860) - (5,860) - (5,860)
Decommissioning expense (125,085) (1,720) (126,805) (1,720) (128,525)
Inflation gain (loss) (3,469) (5,086) (8,555) (3,004) (11,559)
Amortization of bond discount, debt issue costs,
and loss on refundings (801,735) 3,554 (798,181) 1,427 (796,754)
Interest expense (54,900) - (54,900) - (54,900)
Loss on defeasance of bonds (87,509) - (87,509) - (87,509)
Derivatives and related charges (13,817) 8,632 (5,185) (3,486) (8,671)
Pension expense (1,058) (1,119) (2,177) (140) (2,317)
Bond requirements included in billings to participants
Operations and maintenance, net of investment
income (62,114) (32,960) (95,074) (31,133) (126,207)
Costs of acquisition of capacity 264 (431) (167) - (167)
Billings to amortize costs recoverable 382,050 - 382,050 - 382,050
Reduction in debt service billings due to transfer
of excess funds (94,543) - (94,543) - (94,543)
Principal repayments 2,504,456 163,459 2,667,915 160,186 2,828,101
Withdrawal of funds (24,821) (2,971) (27,792) - (27,792)
Other 268,564 (1,862) 266,702 10,862 277,564
(61,731) 24,669 (37,062) 29,118 (7,944)
Projects’ Stabilization Fund net position 133,941 (14,388) 119,553 15,549 135,102
72,210$ 10,281$ 82,491$ 44,667$ 127,158$
Note 11 – Pension and Other Postemployment Retirement Plans
Pension Plan
Plan descriptions – All qualified permanent and probationary employees are eligible to participate in
SCPPA’s Miscellaneous Employee Pension Plans, cost-sharing multiple employer defined benefit
pension plans administered by the California Public Employees’ Retirement System (CalPERS). Benefit
provisions under the Plans are established by State statute and SCPPA resolution. CalPERS issues
publicly available reports that include a full description of the pension plans regarding benefit provisions,
assumptions and membership information that can be found on the CalPERS website.

Southern California Public Power Authority Notes to Combined Financial Statements
103
Note 11 – Pension and Other Postemployment Retirement Plans (continued)
Benefits provided – CalPERS provides service retirement and disability benefits, annual cost of living
adjustments and death benefits to plan members, who must be public employees and beneficiaries.
Benefits are based on years of credited service, equal to one year of full time employment. Members with
five years of total service are eligible to retire at age 50 with statutorily reduced benefits. All members are
eligible for non-duty disability benefits after 10 years of service.
The death benefit is one of the following: The Basic Death Benefit, the 1957 Survivor Benefit, or the
Optional Settlement 2W Death Benefit. The cost of living adjustments for each plan are applied as
specified by the Public Employees’ Retirement Law.
The Plans’ provisions and benefits in effect at June 30, 2019 and 2018, are summarized as follows:
Prior to
January 1,
2013
On or after
January 1,
2013
Hire date
Benefit formula 2.7% @ 55 2% @ 62
Benefit vesting schedule 5 years service 5 years service
Benefit payments monthly for life monthly for life
Retirement age 50 – 55 52 – 67
Monthly benefits, as a % of eligible compensation 2.0% to 2.7% 1.0% to 2.5%
Required employee contribution rates 8% 6.5%
Required employer contribution rates 19.6% 6.7%
Contributions – Section 20814(c) of the California Public Employees’ Retirement Law requires that the
employer contribution rates for all public employers be determined on an annual basis by the actuary and
shall be effective on the July 1 following notice of a change in the rate. Funding contributions for both
Plans are determined annually on an actuarial basis as of June 30 by CalPERS. The actuarially
determined rate is the estimated amount necessary to finance the costs of benefits earned by employees
during the year, with an additional amount to finance any unfunded accrued liability. SCPPA is required to
contribute the difference between the actuarially determined rate and the contribution rate of employees.
For the year ended June 30, 2019 and 2018, the contributions recognized as part of pension expense for
the Plans were $263,137 and $269,866, respectively.
Pension liabilities, pension expenses and deferred outflows / inflows of resources related to pensions –
As of June 30, 2019 and 2018, SCPPA reported a net pension liability of $1.4 million and $1.5 million,
respectively, for its proportionate share of the net pension liability. SCPPA’s net pension liability for each
Plan is measured as the proportionate share of the net pension liability. The net pension liability of each
of the Plans is measured as of June 30, 2018, and the total pension liability for each Plan used to
calculate the net pension liability was determined by an actuarial valuation as of June 30, 2017 rolled
forward to June 30, 2018 using standard update procedures. SCPPA’s proportion of the net pension
liability was based on a projection of SCPPA’s long-term share of contributions to the pension plans
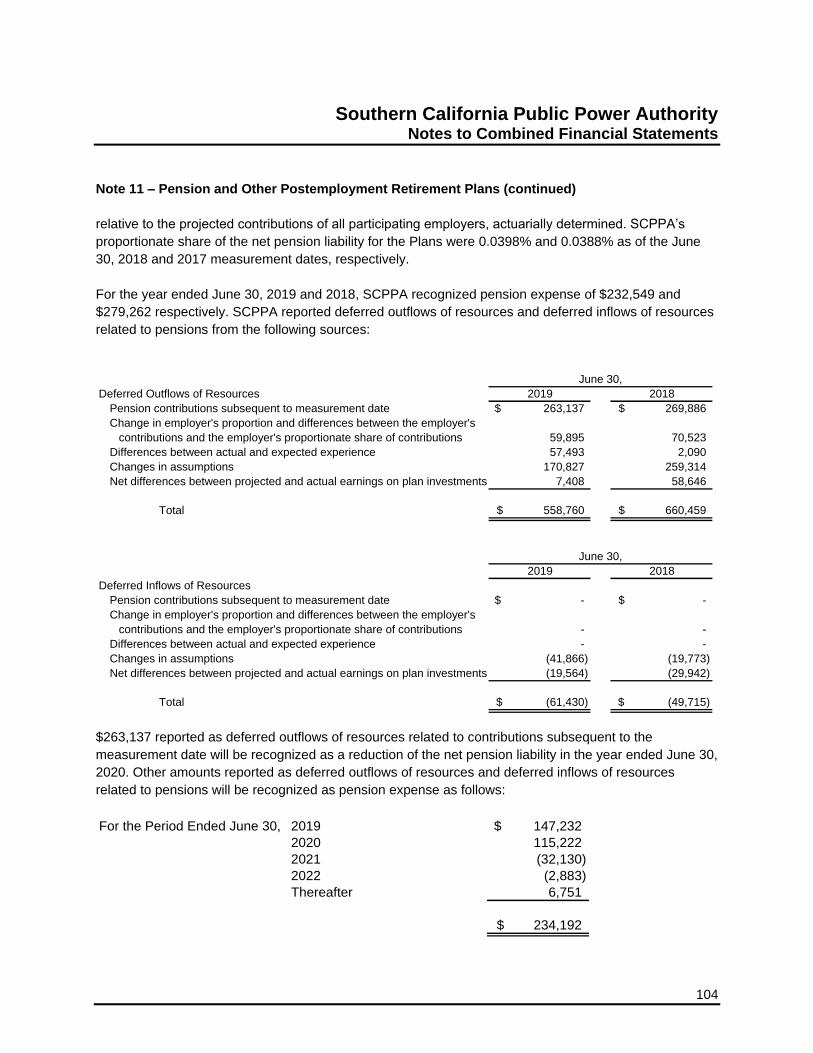
Southern California Public Power Authority Notes to Combined Financial Statements
104
Note 11 – Pension and Other Postemployment Retirement Plans (continued)
relative to the projected contributions of all participating employers, actuarially determined. SCPPA’s
proportionate share of the net pension liability for the Plans were 0.0398% and 0.0388% as of the June
30, 2018 and 2017 measurement dates, respectively.
For the year ended June 30, 2019 and 2018, SCPPA recognized pension expense of $232,549 and
$279,262 respectively. SCPPA reported deferred outflows of resources and deferred inflows of resources
related to pensions from the following sources:
2019 2018
Pension contributions subsequent to measurement date 263,137$ 269,886$
Change in employer's proportion and differences between the employer's
contributions and the employer's proportionate share of contributions 59,895 70,523
Differences between actual and expected experience 57,493 2,090
Changes in assumptions 170,827 259,314
Net differences between projected and actual earnings on plan investments 7,408 58,646
Total 558,760$ 660,459$
2019 2018
Pension contributions subsequent to measurement date -$ -$
Change in employer's proportion and differences between the employer's
contributions and the employer's proportionate share of contributions - -
Differences between actual and expected experience - -
Changes in assumptions (41,866) (19,773)
Net differences between projected and actual earnings on plan investments (19,564) (29,942)
Total (61,430)$ (49,715)$
Deferred Outflows of Resources
June 30,
June 30,
Deferred Inflows of Resources
$263,137 reported as deferred outflows of resources related to contributions subsequent to the
measurement date will be recognized as a reduction of the net pension liability in the year ended June 30,
2020. Other amounts reported as deferred outflows of resources and deferred inflows of resources
related to pensions will be recognized as pension expense as follows:
For the Period Ended June 30, 2019 147,232$
2020 115,222
2021 (32,130)
2022 (2,883)
Thereafter 6,751
234,192$
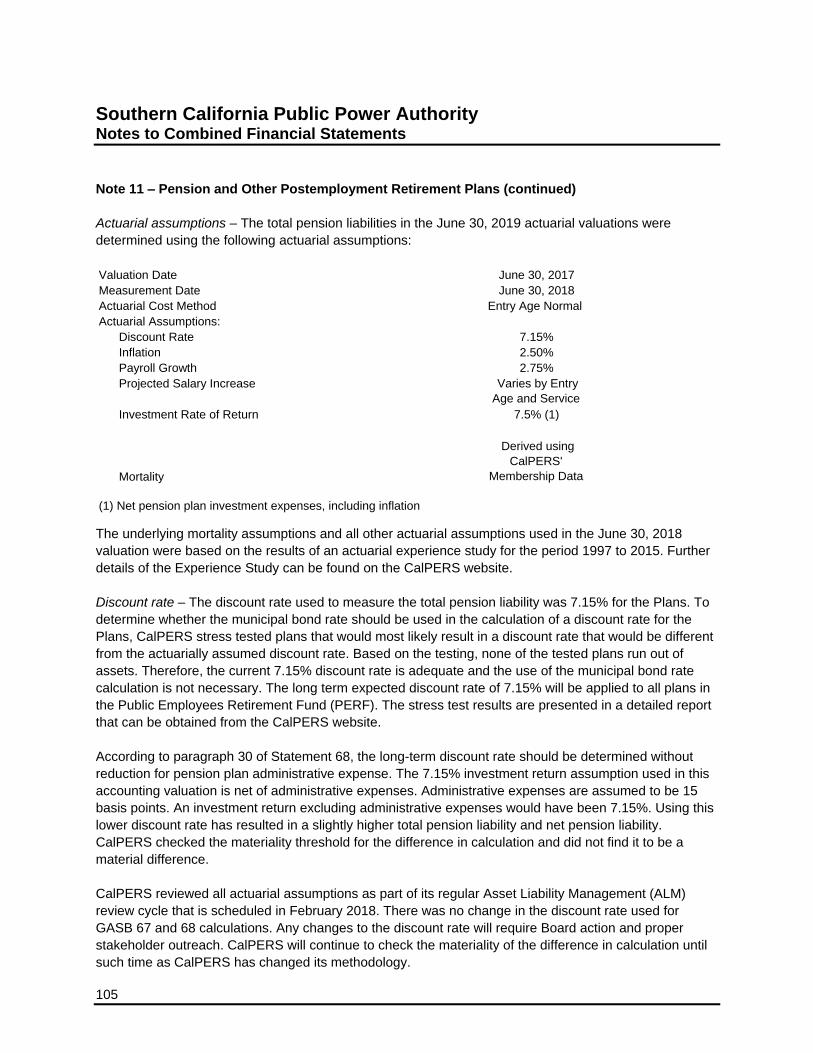
Southern California Public Power Authority Notes to Combined Financial Statements
105
Note 11 – Pension and Other Postemployment Retirement Plans (continued)
Actuarial assumptions – The total pension liabilities in the June 30, 2019 actuarial valuations were
determined using the following actuarial assumptions:
Valuation Date June 30, 2017
Measurement Date June 30, 2018
Actuarial Cost Method Entry Age Normal
Actuarial Assumptions:
Discount Rate 7.15%
Inflation 2.50%
Payroll Growth 2.75%
Projected Salary Increase Varies by Entry
Age and Service
Investment Rate of Return 7.5% (1)
Mortality
Derived using
CalPERS'
Membership Data
(1) Net pension plan investment expenses, including inflation
The underlying mortality assumptions and all other actuarial assumptions used in the June 30, 2018
valuation were based on the results of an actuarial experience study for the period 1997 to 2015. Further
details of the Experience Study can be found on the CalPERS website.
Discount rate – The discount rate used to measure the total pension liability was 7.15% for the Plans. To
determine whether the municipal bond rate should be used in the calculation of a discount rate for the
Plans, CalPERS stress tested plans that would most likely result in a discount rate that would be different
from the actuarially assumed discount rate. Based on the testing, none of the tested plans run out of
assets. Therefore, the current 7.15% discount rate is adequate and the use of the municipal bond rate
calculation is not necessary. The long term expected discount rate of 7.15% will be applied to all plans in
the Public Employees Retirement Fund (PERF). The stress test results are presented in a detailed report
that can be obtained from the CalPERS website.
According to paragraph 30 of Statement 68, the long-term discount rate should be determined without
reduction for pension plan administrative expense. The 7.15% investment return assumption used in this
accounting valuation is net of administrative expenses. Administrative expenses are assumed to be 15
basis points. An investment return excluding administrative expenses would have been 7.15%. Using this
lower discount rate has resulted in a slightly higher total pension liability and net pension liability.
CalPERS checked the materiality threshold for the difference in calculation and did not find it to be a
material difference.
CalPERS reviewed all actuarial assumptions as part of its regular Asset Liability Management (ALM)
review cycle that is scheduled in February 2018. There was no change in the discount rate used for
GASB 67 and 68 calculations. Any changes to the discount rate will require Board action and proper
stakeholder outreach. CalPERS will continue to check the materiality of the difference in calculation until
such time as CalPERS has changed its methodology.

Southern California Public Power Authority Notes to Combined Financial Statements
106
Note 11 – Pension and Other Postemployment Retirement Plans (continued)
The long-term expected rate of return on pension plan investments was determined using a building-block
method in which best-estimate ranges of expected future real rates of return (expected returns, net of
pension plan investment expense and inflation) are developed for each major asset class.
In determining the long-term expected rate of return, CalPERS took into account both short-term and
long-term market return expectations as well as the expected pension fund cash flows. Using historical
returns of all the funds’ asset classes, expected compound returns were calculated over the short-term
(first 10 years) and the long-term (11-60 years) using a building-block approach. Using the expected
nominal returns for both short-term and long-term, the present value of benefits was calculated for each
fund.
The expected rate of return was set by calculating the single equivalent expected return that arrived at the
same present value of benefits for cash flows as the one calculated using both short-term and long-term
returns. The expected rate of return was then set equivalent to the single equivalent rate calculated above
and rounded down to the nearest one quarter of one percent.
The table below reflects the long-term expected real rate of return by asset class. The rate of return was
calculated using the capital market assumptions applied to determine the discount rate and asset
allocation. These rates of return are net of administrative expenses.
New Strategic
Allocation
Real Return
Years 1 - 10(a)
Real Return
Years 11+ (b)
Global Equity 50.0% 4.80% 5.98%
Global Debt Securities 28.0% 1.00% 2.62%
Inflation Assets - 0.77% 1.81%
Private Equity 8.0% 6.30% 7.23%
Real Estate 13.0% 3.75% 4.93%
Infrastructure and Forestland 0.0% 0.00% 0.00%
Liquidity 1.0% - -0.92%
Total 100.0%
(a) An expected inflation of 2.00% used for this period
(b) An expected inflation of 2.92% used for this period
Asset Class
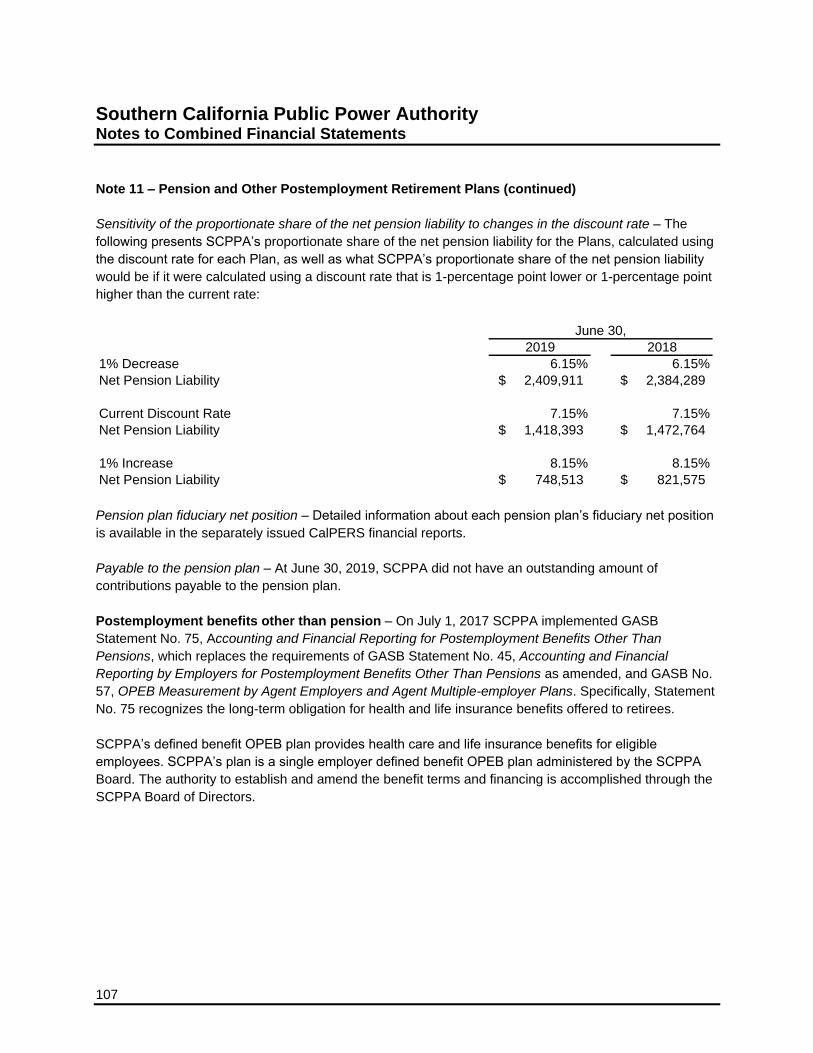
Southern California Public Power Authority Notes to Combined Financial Statements
107
Note 11 – Pension and Other Postemployment Retirement Plans (continued)
Sensitivity of the proportionate share of the net pension liability to changes in the discount rate – The
following presents SCPPA’s proportionate share of the net pension liability for the Plans, calculated using
the discount rate for each Plan, as well as what SCPPA’s proportionate share of the net pension liability
would be if it were calculated using a discount rate that is 1-percentage point lower or 1-percentage point
higher than the current rate:
2019 2018
1% Decrease 6.15% 6.15%
Net Pension Liability 2,409,911$ 2,384,289$
Current Discount Rate 7.15% 7.15%
Net Pension Liability 1,418,393$ 1,472,764$
1% Increase 8.15% 8.15%
Net Pension Liability 748,513$ 821,575$
June 30,
Pension plan fiduciary net position – Detailed information about each pension plan’s fiduciary net position
is available in the separately issued CalPERS financial reports.
Payable to the pension plan – At June 30, 2019, SCPPA did not have an outstanding amount of
contributions payable to the pension plan.
Postemployment benefits other than pension – On July 1, 2017 SCPPA implemented GASB
Statement No. 75, Accounting and Financial Reporting for Postemployment Benefits Other Than
Pensions, which replaces the requirements of GASB Statement No. 45, Accounting and Financial
Reporting by Employers for Postemployment Benefits Other Than Pensions as amended, and GASB No.
57, OPEB Measurement by Agent Employers and Agent Multiple-employer Plans. Specifically, Statement
No. 75 recognizes the long-term obligation for health and life insurance benefits offered to retirees.
SCPPA’s defined benefit OPEB plan provides health care and life insurance benefits for eligible
employees. SCPPA’s plan is a single employer defined benefit OPEB plan administered by the SCPPA
Board. The authority to establish and amend the benefit terms and financing is accomplished through the
SCPPA Board of Directors.

Southern California Public Power Authority Notes to Combined Financial Statements
108
Note 11 – Pension and Other Postemployment Retirement Plans (continued)
SCPPA’s plan provides healthcare and life insurance benefits for retirees. The benefit terms vary
depending on the employee’s date of hire. Below is a brief summary of employee eligibility and benefits
provided.
1) Employee must retire with 120 days from date of separation
2) The retiree must be receiving benefits from CalPERS
(California Public Employees' Retirement System)
3) Employee was either hired before December 18, 2014 or
has at least 10 years of service is eligible for a
supplemental contribution upon retirement
Eligibility for OPEB
Net OPEB Liability – At June 30, 2018 and 2017, the following employees were covered by the benefit
terms:
Active employees electing coverage 10
Active employees waiving coverage 4
Retirees electing coverage 4
Total 18
SCPPA’s net OPEB liability of $908,596 and $827,411 was measured on June 30, 2018 and 2017,
respectively and was determined by an actuarial valuation as of that date.
The total OPEB liability in the June 30, 2018 actuarial valuation was determined using the following
actuarial assumptions and other inputs, applied to all periods included in the measurement, unless
otherwise specified:
Inflation 2.75%
Salary Increases Varied on years of experience
Discount Rate 3.62%
Healthcare cost trend rates:
Not Medicare Eligible Medicare Eligible
6.3% in 2019, trending 5.4% in 2019, trending
down to 4.4% in 2074 down to 4.4% in 2074
thereafter thereafter
Retirees are required to pay the applicable retiree premiums, less any direct subsidies provided by
SCPPA. Retiree premiums can vary from $357 to $878 for the retiree and $713 to $1,756 for the retiree
plus spouse depending on the care the provider selected.

Southern California Public Power Authority Notes to Combined Financial Statements
109
Note 11 – Pension and Other Postemployment Retirement Plans (continued)
The discount rate was based on the index rate for 20-year, tax exempt municipal bonds.
Mortality rates were based on assumptions for the Public Agency Miscellaneous members used in the
June 30, 2017 and 2016 CalPERS actuarial valuation.
2018 2017
Beginning balance 827,411$ 818,744$
Changes for the year
Service cost 80,882 86,517
Interest 31,913 26,114
Changes of assumptions (7,876) (82,085)
Benefit payments (23,734) (21,879)
Net changes 81,185 8,667
Ending balance 908,596$ 827,411$
June 30,
Changes in the Net OPEB Liability – There were no changes to benefit terms during the year. Changes of
assumptions and other inputs reflect a change in the discount rate from 3.56% percent as of June 30,
2017 to 3.62% as of June 30, 2018. In addition, changes of assumptions were made to update healthcare
costs and trends, and a change was made to the spousal coverage assumptions.
Benefit payments in the measurement period included $14,574 in direct subsidy payments to retirees and
$9,160 estimated implicit subsidy costs incurred during measurement period ended June 30, 2018.
The following presents the net OPEB liability of SCPPA, as well as what SCPPA’s net OPEB liability
would be if it were calculated using a discount rate that is 1-percentage-point lower or 1-percentage point
higher than the current discount rate:
2018 2017
Discount rate
1% Decrease 2.62% 2.56%
Net OPEB Liability 1,054,739$ 961,145$
Current Discount Rate 3.62% 3.56%
Net OPEB Liability 908,596$ 827,411$
1% Increase 4.62% 4.56%
Net OPEB Liability 791,389$ 720,071$
June 30,
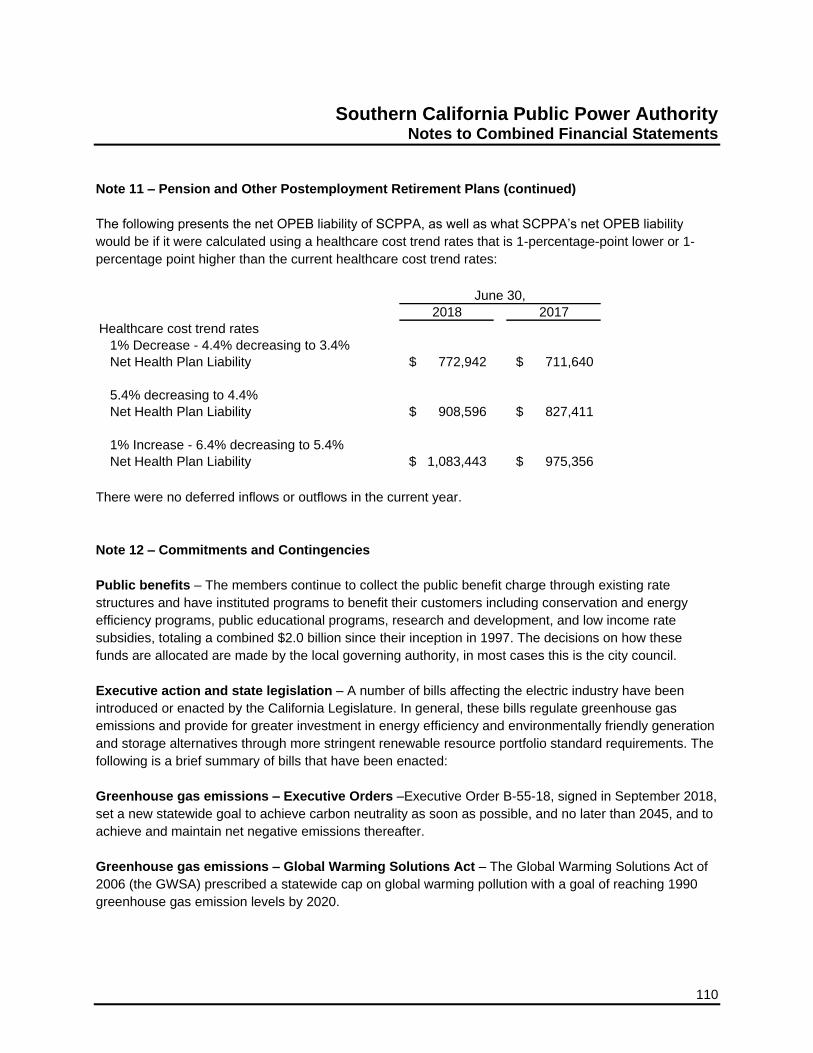
Southern California Public Power Authority Notes to Combined Financial Statements
110
Note 11 – Pension and Other Postemployment Retirement Plans (continued)
The following presents the net OPEB liability of SCPPA, as well as what SCPPA’s net OPEB liability
would be if it were calculated using a healthcare cost trend rates that is 1-percentage-point lower or 1-
percentage point higher than the current healthcare cost trend rates:
2018 2017
Healthcare cost trend rates
1% Decrease - 4.4% decreasing to 3.4%
Net Health Plan Liability 772,942$ 711,640$
5.4% decreasing to 4.4%
Net Health Plan Liability 908,596$ 827,411$
1% Increase - 6.4% decreasing to 5.4%
Net Health Plan Liability 1,083,443$ 975,356$
June 30,
There were no deferred inflows or outflows in the current year.
Note 12 – Commitments and Contingencies
Public benefits – The members continue to collect the public benefit charge through existing rate
structures and have instituted programs to benefit their customers including conservation and energy
efficiency programs, public educational programs, research and development, and low income rate
subsidies, totaling a combined $2.0 billion since their inception in 1997. The decisions on how these
funds are allocated are made by the local governing authority, in most cases this is the city council.
Executive action and state legislation – A number of bills affecting the electric industry have been
introduced or enacted by the California Legislature. In general, these bills regulate greenhouse gas
emissions and provide for greater investment in energy efficiency and environmentally friendly generation
and storage alternatives through more stringent renewable resource portfolio standard requirements. The
following is a brief summary of bills that have been enacted:
Greenhouse gas emissions – Executive Orders –Executive Order B-55-18, signed in September 2018,
set a new statewide goal to achieve carbon neutrality as soon as possible, and no later than 2045, and to
achieve and maintain net negative emissions thereafter.
Greenhouse gas emissions – Global Warming Solutions Act – The Global Warming Solutions Act of
2006 (the GWSA) prescribed a statewide cap on global warming pollution with a goal of reaching 1990
greenhouse gas emission levels by 2020.

Southern California Public Power Authority Notes to Combined Financial Statements
111
Note 12 – Commitments and Contingencies (continued)
Greenhouse gas emissions – cap-and-trade program – The cap-and-trade program introduced a hard
emissions cap that covered emissions transportation fuels, natural gas, propane, and other fossil fuels. In
July 2017, the California Legislature passed AB 398, extending the cap-and-trade program until 2030 and
the distribution of free carbon allowances is continued for certain industrial sectors.
Greenhouse gas emissions – emissions performance standard – Senate Bill 1368 (SB 1368) signed
on January 1, 2007, provides for an emission performance standard, restricting new investments in
baseload fossil fuel electric generating resources that exceed the rate of greenhouse gas emissions for
existing combined-cycle natural gas baseload generation.
Energy procurement and efficiency reporting – Senate Bill 1037 requires that each publicly owned
utilities (POUs), including the Project Participants, prior to procuring new energy generation resources,
first acquire all available energy efficiency, demand reduction, and renewable resources that are cost
effective, reliable and feasible, then report annually to its customers and to the CEC its investment in
energy efficiency and demand reduction programs. Each Project Participant has complied with such
reporting requirements.
Renewable Portfolio Standard (RPS) – Senate Bill X1 2 (SBX1-2), the “California Renewable Energy
Resources Act,” was signed into law on April 12, 2011. SBX1-2 codifies the RPS target for retail electricity
sellers to serve 33% of their loads with eligible renewable energy resources by 2020 as provided in
Executive Order S-14-08.
Clean Energy and Pollution Reduction Act of 2015 – Senate Bill 100 (SB 100), the 100 Percent Clean
Energy Act of 2018, was signed into law in September 2018. SB 100 accelerates the State’s RPS target
as established by SB 350 from 50% by 2030 to 60% by 2030 and sets a goal of 100% “clean energy” by
the year 2045. SB 100 requires retail electric sellers and local publicly-owned electric utilities to procure a
minimum quantity of electric products from eligible renewable energy resources so that the total kWhs of
those products sold to retail end-use customers achieve 44% of retail sales by December 31, 2024, 52%
of retail sales by December 31, 2027 and 60% of retail sales by December 31, 2030. SB 100 further
establishes a State policy that eligible renewable energy resources and zero-carbon resources supply
100% of retail sales of electricity to California end-use customers by December 31, 2045.
Biomass Legislation – Senate Bill 859, signed in September 2016, requires investor-owned utilities
(IOUs) and POUs that serve more than 100,000 customers, including certain of the Project Participants,
to procure, through financial commitments of five years, their proportionate shares (based on the ratio of
the utility’s peak demand to the total statewide peak demand), of 125 MW of cumulative rated capacity
from existing bioenergy projects that generate energy from wood harvested from high-fire-hazard zones.
Legislation Relating to Wildfires – SB 901, signed into in September 2018, amends certain provisions
of SB 1028 requiring POUs and electric cooperatives to prepare wildfire mitigation measures if the
utilities’ overhead electrical lines and equipment are located in an area that has a significant risk of
wildfire resulting from those electrical lines and equipment. Under SB 901, each POU or electric
cooperative is required to prepare before January 1, 2020 and annually thereafter, a wildfire mitigation

Southern California Public Power Authority Notes to Combined Financial Statements
112
Note 12 – Commitments and Contingencies (continued)
plan. SB 901 requires specified information and elements to be considered as necessary, at minimum, in
the wildfire mitigation plan. The POU or electric cooperative is required to present each wildfire mitigation
plan in an appropriately noticed public meeting, and to accept comments on its wildfire mitigation plan
from the public, other local and state agencies, and interested parties. In addition, SB 901 requires the
POU or electric cooperative to contract with a qualified independent evaluator with experience in
assessing the safe operation of electrical infrastructure to review and assess the comprehensiveness of
its wildfire mitigation plan. The report of the independent evaluator is to be made available to the public
and to be presented at a public meeting of the POU’s governing board.
Assembly Bill 1054 (AB 1054) was signed into law on July 12, 2019. AB 1054 was enacted as an urgency
statute to take effect immediately. SB 1054 establishes a Wildfire Fund of approximately $21 billion to
provide liquidity for IOUs (only) to facilitate payment of eligible, uninsured third-party damage claims
resulting from future catastrophic wildfires. AB 1054 revises the cost recovery review of wildfire costs and
expenses for IOUs before the California Public Utilities Commission (CPUC), and establishes safety
certification protocols that IOUs must meet in order to participate in the Wildfire Fund. AB 1054 provides
for a cap on an IOU’s obligations to reimburse the Wildfire Fund and a presumption of reasonableness if a
utility develops and maintains a valid safety certification from the Wildfire Safety Division, which is
established in the CPUC pursuant to companion legislation, Assembly Bill 111, also signed into law on
July 12, 2019. To receive the safety certification from the CPUC, the IOU must develop and implement an
approved wildfire mitigation plan, implement the findings of its safety culture assessments, establish a
safety committee of its board of directors, establish board level reporting to the CPUC on safety issues,
and adopt a compensation structure tied to safety performance, among other requirements.
AB 1054 expands on the existing requirements established under SB 901 for POUs to make and
implement wildfire mitigation plans. AB 1054 also establishes the California Wildfire Safety Advisory
Board (the Wildfire Advisory Board), a seven member board to be appointed by the Governor (five
members), the Speaker of the State Assembly (one member) and the State Senate Committee on Rules
(one member). The Wildfire Advisory Board will provide advice and recommendations related to wildfire
safety, including on the content and sufficiency of wildfire mitigation plans. AB 1054 requires that after
January 1, 2020, each POU or electrical cooperative submit, by July 1 of each year, its plan to the Wildfire
Advisory Board for review and comment. Under AB 1054, the Wildfire Advisory Board is required to
provide comments and an advisory opinion to each POU regarding the content and sufficiency of its plan
and to make recommendations on how to mitigate wildfire risks. AB 1054 requires each POU to
comprehensively revise its plan at least once every three years. The Authority and the Project
Participants expect to prepare and submit wildfire mitigation plans in accordance with the requirements of
SB 901 and AB 1054 as required.
A number of wildfires occurred in California in 2017 and 2018. Under the doctrine of inverse
condemnation (a legal concept that entitles property owners to just compensation if their property is
damaged by a public use), California courts have imposed liability on utilities in legal actions brought by
property holders for damages caused by the utility’s infrastructure. Thus, if the facilities of a utility, such as
its electric distribution and transmission lines, are determined to be the substantial cause of a fire, and the
doctrine of inverse condemnation applies, the utility could be liable for damages without having been

Southern California Public Power Authority Notes to Combined Financial Statements
113
Note 12 – Commitments and Contingencies (continued)
found negligent. SB 1028, SB 901 or AB 1054 do not address the existing legal doctrine relating to
utilities’ liability for wildfires. How any future legislation addresses California’s inverse condemnation and
“strict liability” issues for utilities in the context of wildfires in particular could be significant for the electric
utility industry.
Solar power – Senate Bill 1 (also known as the California Solar Initiative), which was signed into law on
August 21, 2006, requires POUs, including the Project Participants, to establish a program supporting the
stated goal of the legislation to install 3,000 MW of photovoltaic energy in California. POUs are also
required to establish eligibility criteria in collaboration with the CEC for the funding of solar energy
systems receiving ratepayer-funded incentives. Certain reporting requirements also have to be met by the
POUs. Each of the Project Participants has established programs in accordance with the requirements of
the California Solar Initiative.
Future regulation – The electric industry is subject to continuing legislative and administrative reforms.
States routinely consider changes to the way they regulate the electric industry. Historically, both further
deregulation and forms of additional regulation have been proposed for the industry, which has been
highly regulated throughout its history. While there is no current proposal to further the industry, there still
are additional regulations or legislative mandates being proposed or considered for the industry such as
higher reliance on renewable energy and tighter regulations for greenhouse gas emission reductions. The
Authority and the Project Participants are unable to predict at this time the impact any such proposals will
have on the operations and finances of the Project Participant’s electric utility or the electric utility industry
generally.
Impact of developments on the Project Participants – The effect of these developments in the
California energy markets on the Project Participants cannot be fully ascertained at this time. Also,
volatility in energy price in California may return due to a variety of factors which affect both the supply
and demand for electric energy in the western United States.
This price volatility may contribute to greater volatility in the revenues of their respective electric systems
from the sale (and purchase) of electric energy and, therefore, could materially affect each Project
Participant’s financial condition. Each Project Participant undertakes resource planning, risk management
activities, and manages its resource portfolio to mitigate such price volatility and spot market rate
exposure.
Federal policy on cybersecurity –In September 2018, “National Cyber Strategy” was signed which
sought to update the nation’s cyber strategy for the first time in 15 years – and identified “energy and
power” as one of the seven key areas for protection. The FERC has also sought to expand reporting
rules for incidents involving attempts to compromise operation of the electric grid (not just when an
incident to compromise or disrupt one or more reliability tasks actually occurs).

Southern California Public Power Authority Notes to Combined Financial Statements
114
Note 12 – Commitments and Contingencies (continued)
Federal energy legislation
Energy Policy Act of 2005 – Under the Federal Energy Policy Act of 2005 (EPAct 2005), FERC was
given refund authority over municipal utilities if they sell into short-term markets, like the International
Organization for Standardization or ISO markets, and sell eight million MWhs or more of electric energy
on an annual basis.
NERC reliability standards – On February 3, 2006, FERC issued Order 672, which certified the NERC
as the Electric Reliability Organization or ERO. Many reliability standards have since been approved by
FERC. Such standards pertain not only to the planning, operations, and maintenance of Bulk-Power
System facilities, but also to the cyber and physical security of certain critical facilities.
Federal regulation of transmission access – EPAct 2005 authorizes FERC to compel “open access” to
the transmission systems of certain utilities that are not generally regulated by FERC, including municipal
utilities if the utility sells more than four million MWhs of electricity per year. Under open access, a
transmission provider must allow all customers to use the system under standardized rates, terms and
conditions of service.
Other legislation – Congress has considered and is considering numerous bills addressing domestic
energy policies and various environmental matters, including bills relating to energy supplies and
development (such as a federal energy efficiency standard and expedited permitting for natural gas
drilling projects), global warming, and water quality. Many of these bills, if enacted into law, could have a
material impact on the Authority, the Project Participants, and the electric utility industry as a whole. The
Authority and the Project Participants are unable to predict the outcome or potential impacts of any
possible legislation at this time.
Environmental issues – Electric utilities are subject to continuing environmental regulation. Federal,
state and local standards and procedures which regulate the environmental impact of electric utilities are
subject to change. There is no assurance that any Authority or Project Participant facility or project will
remain subject to the laws and regulations currently in effect, will always be in compliance with future laws
and regulations, or will always be able to obtain all required operating permits. In addition, the election of
new administrations, including the President of the United States, could impact substantially the current
environmental standards and regulations and other matters described herein. An inability to comply with
environmental standards could result in, for example, additional capital expenditures, reduced operating
levels or the shutdown of individual units not in compliance. In addition, increased environmental laws and
regulations may create certain barriers to new facility development, may require modification of existing
facilities and may result in additional costs for affected resources.
Greenhouse gas regulations under the Clean Air Act – On July 8, 2019, the EPA issued the final rule.
The final Affordable Clean Energy rule: (i) replaces the Clean Power Plan with revised emissions
guidelines that inform the development, submittal, and implementation of state plans to reduce
greenhouse gas emissions from fossil fuel steam electric generating units, primarily coal-fired plants; and
(ii) implements new regulations that provide direction to both the EPA and the states on the

Southern California Public Power Authority Notes to Combined Financial Statements
115
Note 12 – Commitments and Contingencies (continued)
implementation of emission guidelines. The final rule identifies heat rate improvements as the best
system of emission reduction from coal-fired power plants, to be made at the individual facilities. The final
rule becomes effective on September 6, 2019
National Ambient Air Quality Standards – The Clean Air Act requires that the EPA establish National
Ambient Air Quality Standards (NAAQS) for certain air pollutants. Once NAAQS have been established,
each state must identify areas that do not meet the EPA standard (“non-attainment areas”) and develop
regulatory measures in its state implementation plan to reduce or control the emissions of that air
pollutant in order to meet the applicable standard and become an “attainment area”. EPA noticed a final
rule on December 6, 2018 implementing ozone NAAQS for non-attainment areas and addressing state
implementation plan requirements.
That rule became effective on February 4, 2019. In August 2019, the D.C. appellate court upheld
thresholds for ground-level ozone (70 ppb), directing EPA to revisit secondary public welfare standards.
Mercury and Air Toxic Standards (MATS) – On December 16, 2011, the EPA signed a rule establishing
new standards to reduce air pollution from coal- and oil-fired power plants under sections 111 (new
source performance standards) and 112 (toxics program) of the Clean Air Act. While many plants meet
some or all of these new standards, some plants will be required to install new equipment to meet the
standards. In April 2019, California joined a multi-state comment letter opposing EPA’s proposal that they
believe would undermine emissions standards for power plants as it “would unlawfully remove justification
for Clean Air Act regulation of mercury and air toxics emissions from coal- and oil-fired power plants.”
Other proposals – On August 14, 2019, EPA formally noticed a proposed rule to make “targeted”
revisions to Coal Combustion Residuals (CCR) rules from electric utilities – intended to enhance public
access to information, reconsider beneficial use criteria, make revisions to the annual groundwater
monitoring and corrective action report requirements, amongst others; stakeholder comments are due
October 15, 2019.
Other factors – The electric utility industry in general has been, or in the future may be, affected by a
number of other factors which could impact the financial condition and competitiveness of many electric
utilities and the level of utilization of generating and transmission facilities. Such factors, including those
discussed above, could have an adverse effect on the financial condition of any given electric utility and
likely will affect individual utilities in different ways.
The Authority is unable to predict what impact such factors will have on the business operations and
financial condition of its members but the impact could be significant. Extensive information on the electric
utility industry is available from the legislative and regulatory bodies and other sources in the public
domain.
Southern California Public Power Authority Notes to Combined Financial Statements
116
Note 12 – Commitments and Contingencies (continued)
Nuclear spent fuel and waste disposal – Under the Nuclear Waste Policy Act, the Department of
Energy (DOE) was to develop the facilities necessary for the storage and disposal of spent fuel and to
have the first such facility in operation by 1998. DOE collected a fee of 0.1 cents/kwh of electric
generation from the nuclear plant operators to fund the development and operation of the disposal facility.
In 2009, the federal government, under the new administration, decided to cut off all the appropriated
funds for the development of the repository at the Yucca Mountain, at the urging of the Congress, except
a small budget allocation for the closing of the project.
The Palo Verde operating agent, on behalf of the co-owners, has litigated the DOE to recover the costs of
storing spent fuel at Palo Verde because the DOE failed to honor the contract to remove and dispose of
spent fuel as scheduled. Palo Verde has submitted four claims pursuant to the terms of the 2014
Settlement Agreement, for four separate time periods during July 1, 2011 through June 30, 2018. The
DOE has approved and paid $74.2 million for these claims (Authority’s share is $4.4 million).
Palo Verde submitted its most recent claim on October 2018 in the amount of $10.2 million of which the
Authority’s share was $0.6 million. On June 2019, the Authority received this payment.
The spent fuel storage in the wet pool at Palo Verde exhausted its capacity in 2003. A Dry Cask Storage
Facility (the Facility) was built and completed in 2003. The Facility has the capacity to store all the spent
fuel generated by the Palo Verde plant until 2027. To date, over 152 casks, each containing 24 spent fuel
assemblies were placed in the Facility. Beginning in 2019, PVNGS is expected to use the newly designed
“Magnastor” casks that contain 36 spent fuel assemblies allowing the dry cask storage facility to accept
more spent fuel. The new cask design is currently in fabrication. Storing spent fuel at Palo Verde is now
considered indefinite with undetermined costs until spent fuel is removed from the plant site.
The Department of Energy indicated to nuclear operators that it intends to restart collection of the spent
fuel disposal fee in the year 2020. The plant still intends to continue petitioning for reimbursement for the
indefinite future.
Nuclear insurance – The Price-Anderson Act (the Act) requires that all utilities with nuclear generating
facilities share in the payment for liability claims resulting from a nuclear incident. The Act limits liability
from third-party claims to approximately $13.9 billion per incident. Participants in the Palo Verde Nuclear
Generating Station (PVNGS) currently insure potential claims and liability through commercial insurance
with a $450 million limit; the remainder of the potential liability is covered by the industry-wide
retrospective assessment program provided under the Act. This program limits assessments to $137.6
million per operating reactor for each licensee (there are about 98 operating reactors in the U.S.) for each
nuclear incident occurring at any nuclear reactor in the United States; payments under the program are
limited to $28.4 million per reactor, per incident, per year to be indexed for inflation every five years.
Based on the Authority’s 5.91% interest in Palo Verde, the Authority would be responsible for a maximum
assessment of $24.4 million per incident for all three units, limited to payments of $4.9 million per
incident, per year.
Southern California Public Power Authority Notes to Combined Financial Statements
117
Note 12 – Commitments and Contingencies (continued)
In addition to the above, the Authority may be subject to retroactive insurance assessments for its
participation in the Neil Property Insurance Program in the amount of $2.75 million.
Other legal matters – The Authority is also involved in various other legal actions. In the opinion of
management, the outcome of such litigation or claims will not have a material effect on the financial
position or the results of operations of the Authority or the respective separate Projects.
Note 13 – Certain Asset Retirement Obligations
The Authority has asset retirement obligations in the following projects:
GENERATION PROJECTS
Palo Verde Project – PVNGS is located approximately 50 miles west of Phoenix, Arizona. PVNGS
consists of three nuclear electric generating units (numbered 1, 2 and 3). PVNGS’s combined design
capacity is 4,003 MWs and its combined dependable capacity is 3,937 MWs. Each PVNGS generating
unit has been operating under 40-year Full-Power Operating Licenses granted by the Nuclear Regulatory
Commission (NRC) expiring in 2025, 2026, and 2027, respectively. In 2011, NRC extended the operation
for an additional 20 years until 2045, 2046 and 2047, respectively.
Nuclear Regulatory Commission – The NRC has broad authority under federal law to impose
licensing and safety-related requirements for the operation of nuclear generation facilities. In
1988, NRC issued the General Requirements for Decommissioning Nuclear Facilities. The
regulation addressed decommissioning planning needs, timing, funding methods, and
environmental review requirements. The intent of the rule was to ensure that decommissioning
would be accomplished in a safe and timely manner and that adequate funds would be available
for this purpose.
Decommissioning Study – In April 2017, APS, the operating agent for PVNGS has availed of
the services of an independent consultant to prepare the 2016 Decommissioning Cost Study.
This study is conducted every three years and the next study is scheduled in April 2020. The
objective of this study is to prepare an estimate of the cost, schedule and waste volume
generated to decommission Palo Verde, including all common and supporting facilities. The study
considered the integration of the three-unit dismantling, and the dismantling of the Water
Facilities and Reservoirs, Evaporation Ponds, Independent Spent Fuel Storage Installation,
Steam Generators, Reactor and Storage Facilities. However, the site’s Transmission and
Distribution System will remain in place and is not considered part of the decommissioning
estimate.
The methodology used to develop the estimates are based on numerous fundamental
assumptions such as the estimating basis, labor costs, design conditions, including regulatory
requirements, project contingencies, low level radioactive waste disposal practices, high-level

Southern California Public Power Authority Notes to Combined Financial Statements
118
Note 13 – Certain Asset Retirement Obligations (continued)
radioactive waste management options, and site restoration requirements. The decommissioning
scenarios assume continued operation of the plant’s spent fuel pool for a minimum of six years
following the cessation of operations for continued cooling of the assemblies. The primary cost
contributors are either labor-related or associated with the management and disposition of the
radioactive waste. Program management is the largest single contributor to the overall cost.
Removal costs reflect the labor-intensive nature of the decommissioning process, as well as the
management controls required to ensure a safe and successful program. Decontamination and
packaging costs also have a large labor component that is based upon prevailing union wages.
License termination survey costs are associated with the labor intensive and complex activity of
verifying that contamination has been removed from the site to the levels specified by the
regulating agency.
The cost projected to promptly decommission Palo Verde is estimated to be $2.74 billion (2016 dollars),
of which the Authority’s interest which is at 5.91% is estimated to be $161.9 million (2016 dollars). The
Authority is providing for its share of the estimated future decommissioning costs over the remaining life
of the nuclear power plant through annual charges to expense, which amounted to $1.3 million at June
30, 2019 and 2018. The estimated remaining useful life for Unit 1, Unit 2 and Unit are 26 years, 27 years
and 28 years, respectively. The effects of general inflation amounted to $0.003 million and $0.005 million
as of June 30, 2019 and 2018, respectively. The decommissioning liability reported under noncurrent
liabilities in the statements of net position was $172.0 million and $169.3 million at June 30, 2019 and
2018, respectively.
The owners of PVNGS have created external trusts in accordance with the PVNGS participation
agreement and NRC requirements to fund the costs of decommissioning PVNGS. As of June 30, 2019,
the Authority’s decommissioning funds totaled approximately $181.4 million, including approximately $0.9
million of interest receivable.
San Juan Project – On July 1, 1993, the Authority purchased a 41.80% interest in Unit 3 and related
common facilities of the SJGS from Century Power Corporation. Unit 3, a 497-MW unit, is one unit of a
four-unit coal-fired power generating station in New Mexico.
Environmental Protection Agency – SJGS was subject to the statutory obligations of the
Federal Clean Air Act to reduce visibility impacts. On October 9, 2014, the United States
Environmental Protection Agency (EPA) issued a final rule approving a plan to provide a Best
Available Retrofit Technology path to comply with federal visibility rules at SJGS, which among
other things resulted in the shutdown of Units 2 and 3 on December 2017. The EPA rule became
effective on November 10, 2014.
To meet the 2017 closure deadline, the Authority and other owners who participated in Unit 3
entered into various negotiations and agreements that ultimately entitled the Authority and the
other owners to exit the Project at the end of 2017. Unit 3 closed on December 18, 2017 and the
Authority exited the SGJS Project on December 31, 2017.

Southern California Public Power Authority Notes to Combined Financial Statements
119
Note 13 – Certain Asset Retirement Obligations (continued)
Decommissioning Study – In 2013, the operating agent of SJGS availed the services of an
independent engineering firm to conduct a decommissioning study for the Project. The study
included three retirement, decommissioning and demolition scenarios and the impact of the different
assumptions on these scenarios. The cost estimates were based on direct and indirect cost
assumptions and material estimations using a contracting approach by the operating agent and
other SJGS owners. Direct cost assumptions include, among others, wage rates based on the
prevalent rates in the labor sector, costs associated with equipment rental, demolition and all
contractor services, and contingency costs are included as an allowance for site unknowns. Indirect
costs assumptions include utilities used during demolition, liability insurance and performance bond.
Material quantity estimation was based on major demolition activities including complete
dismantling of all four units and restoring the site to the original condition.
The reclamation and decommissioning of SJGS Unit 3 has commenced on January 2018 and July 2018,
respectively. The decommissioning liability reported under noncurrent liabilities in the statements of net
position was $3.6 million and $3.7 million at June 30, 2019 and 2018, respectively. For the fiscal year
ended June 30, 2019, actual decommissioning expenses totaled $0.19 million.
As of June 30, 2019 and 2018, the Authority recognized $26.0 million and $25.4 million reclamation
liability and reported it under noncurrent liabilities in the statements of net position, respectively. For the
fiscal year ended June 30, 2019 and 2018, actual decommissioning and reclamation expenses totaled
$0.69 million and $0.52 million, respectively.
The Decommissioning and Reclamation Trust Funds were fully funded based on the requirements set
forth by the Trust Fund Agreements in December 2017. As of June 30, 2019, decommissioning and
reclamation trust funds totaled $3.6 million and $25.2 million, respectively.
Apex Power Project – On March 26, 2014, the Authority acquired the Apex Power Project pursuant to an
Asset Purchase Agreement, dated as of October 17, 2013. The Apex Generating Station, located in
North Las Vegas, Nevada, is owned by SCPPA with all power generated sold to LADWP. The station is
natural gas combined cycle consisting of combustion turbine generators and a steam turbine generator.
The facility is interconnected through a 3.13 mile 500kv radial generation tie line owned by Nevada Power
Company that connects the Facility to the Nevada Power Company’s transmission system at its Harry
Allen 500 kV Substation. LADWP serves as project manager and operating agent of the Project.
Contractual Obligation – In accordance with the Asset Purchase Agreement, Schedule 2.07,
the Authority assumed liabilities arising after the Closing of the facility. The liabilities include
among others, those related to environmental conditions on the real property and remediation
obligations.
Decommissioning Study – In 2019, the Authority and LADWP contracted an independent
consultant to perform a study of decommissioning costs and so to begin allocating the funds
necessary for station decommissioning. The study presented demolition of all equipment and
structures as well as removal of all paved roads and foundations to a depth of two feet below

Southern California Public Power Authority Notes to Combined Financial Statements
120
Note 13 – Certain Asset Retirement Obligations (continued)
grade. It may ultimately be required by local or state authorities in the future or for the property’s
future use and was used by the Authority to recognize the asset retirement obligation. The study
developed a labor-hour estimate for disassembling the station using standard techniques for
wholesale demolition and associated unit cost factors applicable for installed equipment and
structures. Costs were calculated for removal and demolition of existing station structures,
equipment and associated site restoration costs, scrap value of valuable metals, indirect,
contingency, escalation and owner’s costs.
Total decommissioning cost recognized amounted to $9.9 million (2019 dollars). The estimated remaining
useful life for the tangible capital assets from the date of purchase is approximately 24 years. The
deferred outflows recognized at the beginning of the Project amounted to $9.2 million and is amortized
over the remaining useful life of the plant for $0.37 million as of June 30, 2019 and 2018. The effects of
general inflation amounted to $0.16 million and $0.27 million as of June 30, 2019 and 2018, respectively.
The decommissioning liability reported under noncurrent liabilities in the statements of net position was
$9.9 million and $9.8 million at June 30, 2019 and 2018, respectively.
GREEN POWER
Tieton Hydropower Project – The Tieton Hydropower Project is a “run of the reservoir” hydroelectric
facility, comprised of a powerhouse constructed at the base of the USBR Tieton Dam on the Tieton River,
and a 21-mile 115 kV transmission line from the power plant substation to the point of interconnection
with the electrical grid. The powerhouse comprised of two Francis turbines and accompanying
generators, has a nameplate capacity of 13.6 MW, with a maximum capacity of approximately 20 MW.
Federal Energy Regulatory Commission –In accordance with Article 30 of the FERC, if the
Authority shall abandon or discontinue the operation of the Project, it may require the Authority to
remove any or all structures, equipment and power lines within the boundary and to take any
such other action necessary to restore the waters, lands and facilities remaining within the
boundary to a condition satisfactory to the United States agency having jurisdiction over its lands
or the FERC’s authorized representative as appropriate or to provide for the continued operation
and maintenance of non-power facilities and fulfill such other obligations under the license as the
FERC may prescribe.
Asset Retirement Obligation – The operating manager for the Project availed the services of an
independent consultant to perform the estimate for the decommissioning and restoration
estimate. The preliminary estimate presented a list of the work that will be performed on the site
such as concrete and foundation work, mechanical and electrical work with corresponding cost
estimates. The estimate assumed that the powerhouse will be removed up to the top of the
caisson. It also assumed that the concrete trust block and the two inlet pipes will remain along
with the existing valve house. Cost estimates include both labor and materials.
Total cost recognized amounted to $0.85 million (2019 dollars). The estimated remaining useful life for
the tangible capital assets from the date of purchase is 31 years. The deferred outflows recognized at the
beginning of the Project amounted to $0.72 million and is amortized over the remaining useful life of the

Southern California Public Power Authority Notes to Combined Financial Statements
121
Note 13 – Certain Asset Retirement Obligations (continued)
plant for $0.02 million as of June 30, 2019 and 2018. The effects of general inflation amounted to $0.01
million and $0.02 million as of June 30, 2019 and 2018, respectively. The decommissioning liability
reported under noncurrent liabilities in the statements of net position was $0.85 million and $0.83 million
at June 30, 2019 and 2018, respectively.
Linden Wind Energy Project – Linden Wind is a wind farm facility that is located near the town of
Goldendale in Klickitat County, Washington. It has an approximately 50 MW nameplate capacity
comprised of: (i) 25 Repower MM 92, 60 HZ, three-bladed, 92.5 meter rotor diameter wind energy
converters (WECs); (ii) one 50 meter tall meteorological tower; (iii) a 34.5-kV power underground
collection system linking the WECs to the collector substation; (iv) 25 pad-mount 2.25 MVA transformers;
(v) a substation and transmission line intertie; (vi) fiber optic underground communication cables from the
WEC’s to the substation control building; (vii) a supervisory control and data acquisition system; (viii)
operation, maintenance and storage buildings, structures and facilities; and (ix) all equipment and other
personal property related to the operation and support of the facility. The facility achieved commercial
operation on June 30, 2010, and on September 15, 2010, the Authority completed its acquisition pursuant
to the terms of the Asset Purchase Agreement. LADWP is the operating manager of this Project.
Environmental Matters –The lead agency for environmental review and land use permitting is
Klickitat County. The facility is located within the Klickitat Country Energy Overlay Zone (EOZ) for
wind energy development and EOZ requires compliance with numerous other laws and
regulations, including the Clean Air Act, the Clean Water Act, the Endangered Species Act,
hazardous materials and waste management requirements, fire and building codes, health and
safety regulations, Federal Aviation Administration limitations, and historical, cultural and
archeological requirements. The EOZ Permit authority will continue so long as the facility remains
in compliance with all permit requirements, including habitat mitigation and financial assurance
requirements for final decommissioning of facility structures. The decommissioning of turbines on
federal lands is regulated by the Bureau of Land Management.
Wind Turbine Decommissioning Costs – The Authority has used a market survey from an
independent consultant considering key cost components on decommissioning, restoration of
project site and salvage value. The survey used a case-by-case approach to analyze and
estimate costs given numerous variables relating to equipment, geography, commodity market,
etc. An internal assessment was made to identify the wind farm that is closest to the Linden Wind
Energy Project and used the cost to recognize for ARO purposes.
Total cost recognized amounted to $0.70 million (2019 dollars). The useful life for the tangible capital
assets from the date of purchase is 26 years. The deferred outflows recognized at the beginning of the
Project amounted to $0.60 million and is amortized over the remaining useful life of the plant for $0.02
million as of June 30, 2019 and 2018. The effects of general inflation amounted to $0.01 million and
$0.19 million as of June 30, 2019 and 2018, respectively. The decommissioning liability reported under
noncurrent liabilities in the statements of net position was $0.70 million and $0.69 million at June 30, 2019
and 2018, respectively.

Southern California Public Power Authority Notes to Combined Financial Statements
122
Note 13 – Certain Asset Retirement Obligations (continued)
NATURAL GAS
Natural Gas Project – The Natural Gas Project includes the Authority’s leasehold interests in (i) certain
natural gas resources, reserves, fields, wells and related facilities located near Pinedale, Wyoming and
(ii) certain natural gas resources, reserves, fields, wells and related facilities in (or near) the Barnett Shale
geological formation in Texas. There are currently 130 proved, developed, and producing wells on the
Pinedale Leases. In addition to the producing wells, the Pinedale Leases include 19 proved Undeveloped
well locations with well spacing down to the 10-acre level. The Barnett Leases has currently 151 proved,
developed and producing wells, including condensing equipment to remove water and oil from the gas. In
addition to the producing wells, there are 3 proved undeveloped well locations and 3 Probable
undeveloped well locations, with well spacing down to 1,000 feet between 2,500-foot lateral wells.
Wyoming Oil and Gas Conservation Commission (Supervisor) – Pinedale Field is controlled
by the Supervisor which administers the Wyoming Conservation Act. The Supervisor sets the
manner for supervising the field in conjunction with the federal government which also issued
leases for federal land within the outline of the field.
Abandonment Work – The Authority has availed of the services of an independent engineering
firm to estimate the costs of abandonment on idle wells. Abandonment costs include detailed
statement of proposed work such as kind, location, length of plugs, plans for mudding, cementing,
shooting, testing and removing casing, as well as any other pertinent information. The final
abandonment consists of restoring the land to its natural state. The operator will contour the land
to fit its natural environment and the area will be seeded to restore the native vegetation.
Abandonment costs used in the study are the operator’s estimates of the costs to abandon the
wells and production facilities, net of any salvage value. The costs are held constant, and then
escalated 1 percent on January 1 of each year to the date of expenditure.
For Wyoming, Pinedale, total cost recognized amounted to $1.38 million (2018 dollars). The useful life for
the tangible capital assets from the date of acquisition is 28 years. The deferred outflows recognized at
the beginning of the Project amounted to $1.07 million and is amortized over the remaining useful life of
the plant for $0.04 million as of June 30, 2019 and 2018. The effects of general inflation amounted to
$0.02 million and $0.04 million as of June 30, 2019 and 2018, respectively. The decommissioning liability
reported under noncurrent liabilities in the statements of net position was $1.40 million and $1.38 million
at June 30, 2019 and 2018, respectively.
For Barnett, Texas, total cost recognized amounted to $0.29 million (2018 dollars). The useful life for the
tangible capital assets from the date of acquisition is 28 years. The deferred outflows recognized at the
beginning of the Project amounted to $0.23 million and is amortized over the remaining useful life of the
plant for $0.008 million as of June 30, 2019 and 2018. The effects of general inflation amounted to $0.004
million and $0.008 million as of June 30, 2019 and 2018, respectively. The decommissioning liability
reported under noncurrent liabilities in the statements of net position was $0.30 million at June 30, 2019
and 2018.

Southern California Public Power Authority Notes to Combined Financial Statements
123
Note 13 – Certain Asset Retirement Obligations (continued)
TRANSMISSION PROJECTS
Southern Transmission System, Mead-Phoenix, and Mead-Adelanto Projects – These projects are
generally located upon land that is leased from Federal and certain state governments. Upon termination
of the leases, the structures, improvements and equipment are to be removed and the land is to be
restored. Because these leases are expected to be renewed indefinitely and because the inherent value
of the transmission corridors, the leases have no foreseeable termination date, and therefore, ARO
related to the transmission facilities cannot be reasonably estimated.
A summary of ARO information are as follows (amounts in thousands):
Remaining Deferred Outflow Decommissioning and
Asset Types Useful Life (yrs) of Resources Reclamation Obligation
Palo Verde Nuclear power plant 26/27/28 34,139$ 172,040$
San Juan* Coal power plant - - 29,624
Apex Power Natural Gas turbine generators 24 7,239 9,933
Tieton Hydropower Hydro Powerhouse 21 479 853
Linden Wind Energy Wind turbines 16 372 699
Natural Gas - Wyoming Oil Wells 13 497 1,404
Natural Gas - Barnett Oil Wells 13 116 297
42,842$ 214,850$
*Decommissioning and reclamation commenced on January 2018.
Project Name
Note 14 – Subsequent Events
Springbok 3 Solar Farm Project – On December 17, 2015, SCPPA on behalf of LADWP, entered into a
power purchase agreement with 64KT 8ME, LLC for 90 MW of solar photovoltaic generating capacity
from the Springbok 3 Solar Farm Project located approximately 4.5 miles north-northwest of California
City and to the south-southwest of the unincorporated town of Cantil, California. Springbok 3 is adjacent
to both Springbok 1 and 2. The commercial operation began on July 19, 2019, starting for a term of 27
years, unless a one-time three-year extension is exercised. LADWP serves as the project manager on
behalf of SCPPA.
Milford I Wind Project Bonds – On September 19, 2019, the Board approved the bond resolutions and
related bond documents necessary for the sale and issuance of refunding bonds. The Milford Wind
Corridor Phase 1 Project, Revenue Bonds, 2010-1 bonds are fixed rate bonds issued on February 9,
2010 in the amount of $237,235,000. Presently, $156,930,000 of the 2010-1 bonds remain outstanding
and are subject to optional redemption on January 1, 2020. The refunding is expected to generate a
significant amount of debt savings through 2030. The net present value savings net of issuance costs is
estimated at $32.33 million, 20.6% savings of refunded bonds, based on market conditions at the time of
bond pricing on October 3, 2019.
Required Supplementary Information
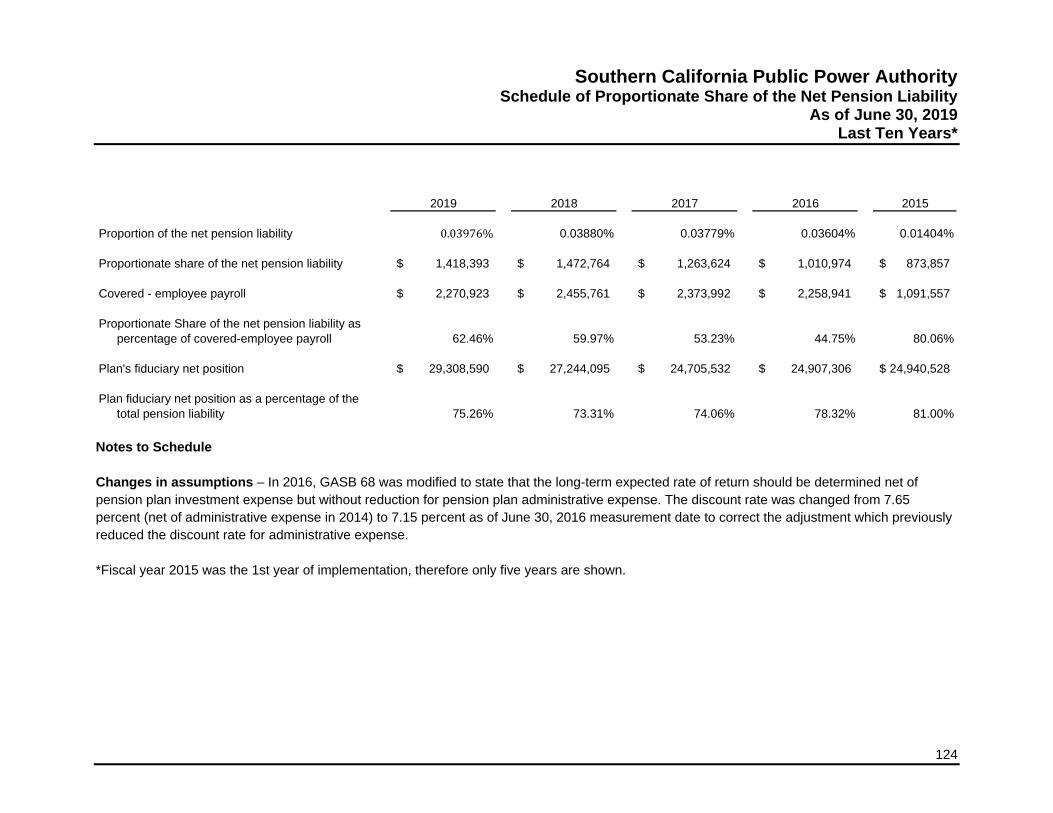
124
Southern California Public Power Authority Schedule of Proportionate Share of the Net Pension Liability
As of June 30, 2019 Last Ten Years*
2019 2018 2017 2016 2015
Proportion of the net pension liability 0.03976% 0.03880% 0.03779% 0.03604% 0.01404%
Proportionate share of the net pension liability 1,418,393$ 1,472,764$ 1,263,624$ 1,010,974$ 873,857$
Covered - employee payroll 2,270,923$ 2,455,761$ 2,373,992$ 2,258,941$ 1,091,557$
Proportionate Share of the net pension liability as
percentage of covered-employee payroll 62.46% 59.97% 53.23% 44.75% 80.06%
Plan's fiduciary net position 29,308,590$ 27,244,095$ 24,705,532$ 24,907,306$ 24,940,528$
Plan fiduciary net position as a percentage of the
total pension liability 75.26% 73.31% 74.06% 78.32% 81.00%
Notes to Schedule
Changes in assumptions – In 2016, GASB 68 was modified to state that the long-term expected rate of return should be determined net of
pension plan investment expense but without reduction for pension plan administrative expense. The discount rate was changed from 7.65
percent (net of administrative expense in 2014) to 7.15 percent as of June 30, 2016 measurement date to correct the adjustment which previously
reduced the discount rate for administrative expense.
*Fiscal year 2015 was the 1st year of implementation, therefore only five years are shown.
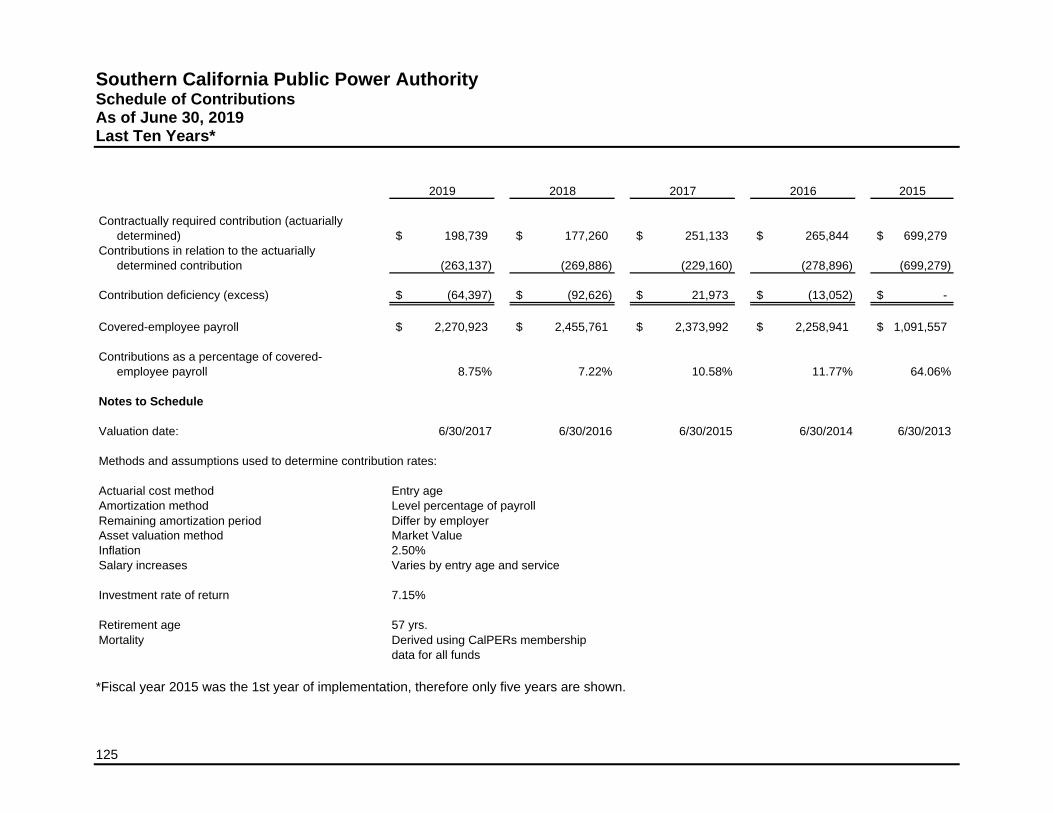
125
Southern California Public Power Authority Schedule of Contributions As of June 30, 2019 Last Ten Years*
2019 2018 2017 2016 2015
Contractually required contribution (actuarially
determined) 198,739$ 177,260$ 251,133$ 265,844$ 699,279$
Contributions in relation to the actuarially
determined contribution (263,137) (269,886) (229,160) (278,896) (699,279)
Contribution deficiency (excess) (64,397)$ (92,626)$ 21,973$ (13,052)$ -$
Covered-employee payroll 2,270,923$ 2,455,761$ 2,373,992$ 2,258,941$ 1,091,557$
Contributions as a percentage of covered-
employee payroll 8.75% 7.22% 10.58% 11.77% 64.06%
Notes to Schedule
Valuation date: 6/30/2017 6/30/2016 6/30/2015 6/30/2014 6/30/2013
Methods and assumptions used to determine contribution rates:
Actuarial cost method Entry age
Amortization method Level percentage of payroll
Remaining amortization period
Asset valuation method Market Value
Inflation 2.50%
Salary increases Varies by entry age and service
Investment rate of return 7.15%
Retirement age 57 yrs.
Mortality
Differ by employer
Derived using CalPERs membership
data for all funds
*Fiscal year 2015 was the 1st year of implementation, therefore only five years are shown.
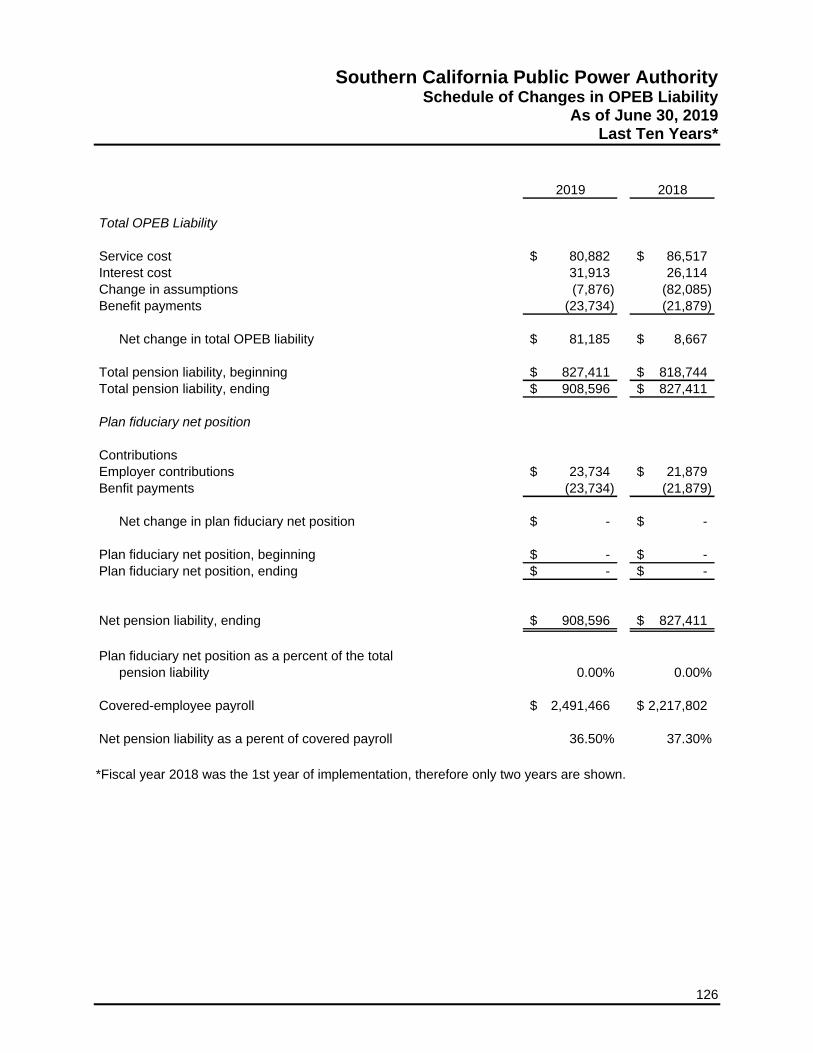
126
Southern California Public Power Authority Schedule of Changes in OPEB Liability
As of June 30, 2019 Last Ten Years*
2019 2018
Total OPEB Liability
Service cost 80,882$ 86,517$
Interest cost 31,913 26,114
Change in assumptions (7,876) (82,085)
Benefit payments (23,734) (21,879)
Net change in total OPEB liability 81,185$ 8,667$
Total pension liability, beginning 827,411$ 818,744$
Total pension liability, ending 908,596$ 827,411$
Plan fiduciary net position
Contributions
Employer contributions 23,734$ 21,879$
Benfit payments (23,734) (21,879)
Net change in plan fiduciary net position -$ -$
Plan fiduciary net position, beginning -$ -$
Plan fiduciary net position, ending -$ -$
Net pension liability, ending 908,596$ 827,411$
Plan fiduciary net position as a percent of the total
pension liability 0.00% 0.00%
Covered-employee payroll 2,491,466$ 2,217,802$
Net pension liability as a perent of covered payroll 36.50% 37.30%
*Fiscal year 2018 was the 1st year of implementation, therefore only two years are shown.
Supplementary Information
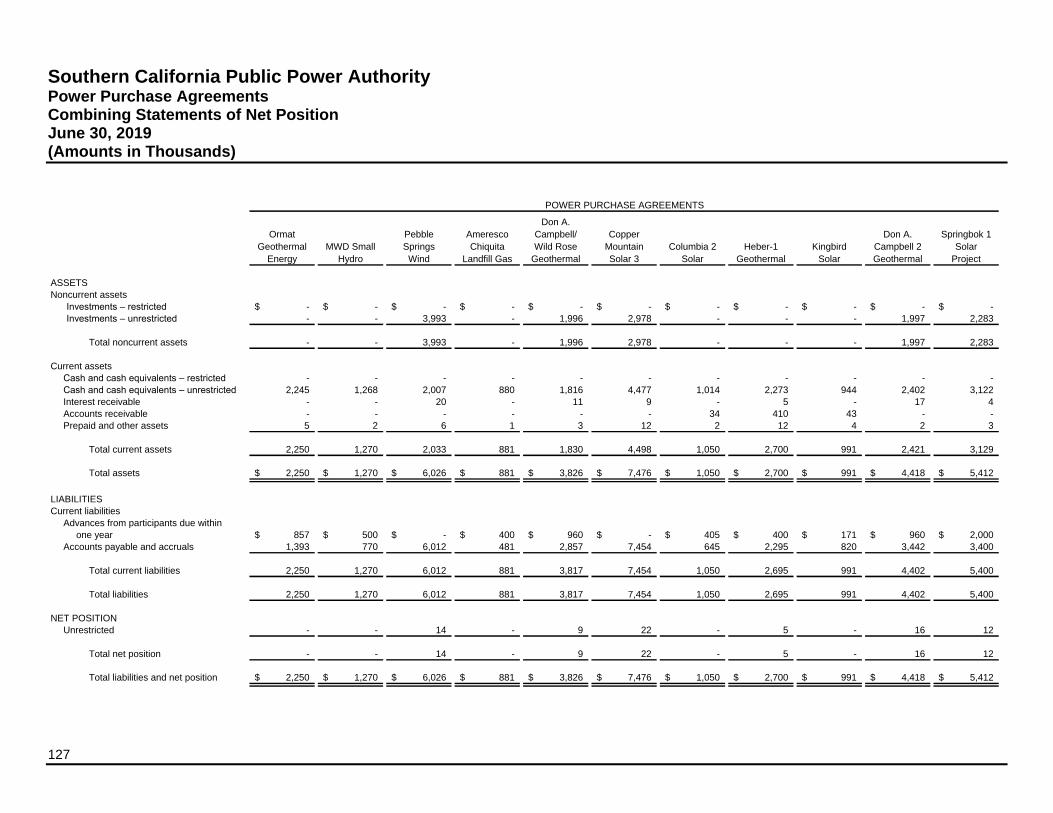
127
Southern California Public Power Authority Power Purchase Agreements Combining Statements of Net Position June 30, 2019 (Amounts in Thousands)
Ormat
Geothermal
Energy
MWD Small
Hydro
Pebble
Springs
Wind
Ameresco
Chiquita
Landfill Gas
Don A.
Campbell/
Wild Rose
Geothermal
Copper
Mountain
Solar 3
Columbia 2
Solar
Heber-1
Geothermal
Kingbird
Solar
Don A.
Campbell 2
Geothermal
Springbok 1
Solar
Project
Noncurrent assets
Investments – restricted -$ -$ -$ -$ -$ -$ -$ -$ -$ -$ -$
Investments – unrestricted - - 3,993 - 1,996 2,978 - - - 1,997 2,283
Total noncurrent assets - - 3,993 - 1,996 2,978 - - - 1,997 2,283
Current assets
Cash and cash equivalents – restricted - - - - - - - - - - -
Cash and cash equivalents – unrestricted 2,245 1,268 2,007 880 1,816 4,477 1,014 2,273 944 2,402 3,122
Interest receivable - - 20 - 11 9 - 5 - 17 4
Accounts receivable - - - - - - 34 410 43 - -
Prepaid and other assets 5 2 6 1 3 12 2 12 4 2 3
Total current assets 2,250 1,270 2,033 881 1,830 4,498 1,050 2,700 991 2,421 3,129
Total assets 2,250$ 1,270$ 6,026$ 881$ 3,826$ 7,476$ 1,050$ 2,700$ 991$ 4,418$ 5,412$
Current liabilities
Advances from participants due within
one year 857$ 500$ -$ 400$ 960$ -$ 405$ 400$ 171$ 960$ 2,000$
Accounts payable and accruals 1,393 770 6,012 481 2,857 7,454 645 2,295 820 3,442 3,400
Total current liabilities 2,250 1,270 6,012 881 3,817 7,454 1,050 2,695 991 4,402 5,400
Total liabilities 2,250 1,270 6,012 881 3,817 7,454 1,050 2,695 991 4,402 5,400
NET POSITION
Unrestricted - - 14 - 9 22 - 5 - 16 12
Total net position - - 14 - 9 22 - 5 - 16 12
Total liabilities and net position 2,250$ 1,270$ 6,026$ 881$ 3,826$ 7,476$ 1,050$ 2,700$ 991$ 4,418$ 5,412$
ASSETS
LIABILITIES
POWER PURCHASE AGREEMENTS
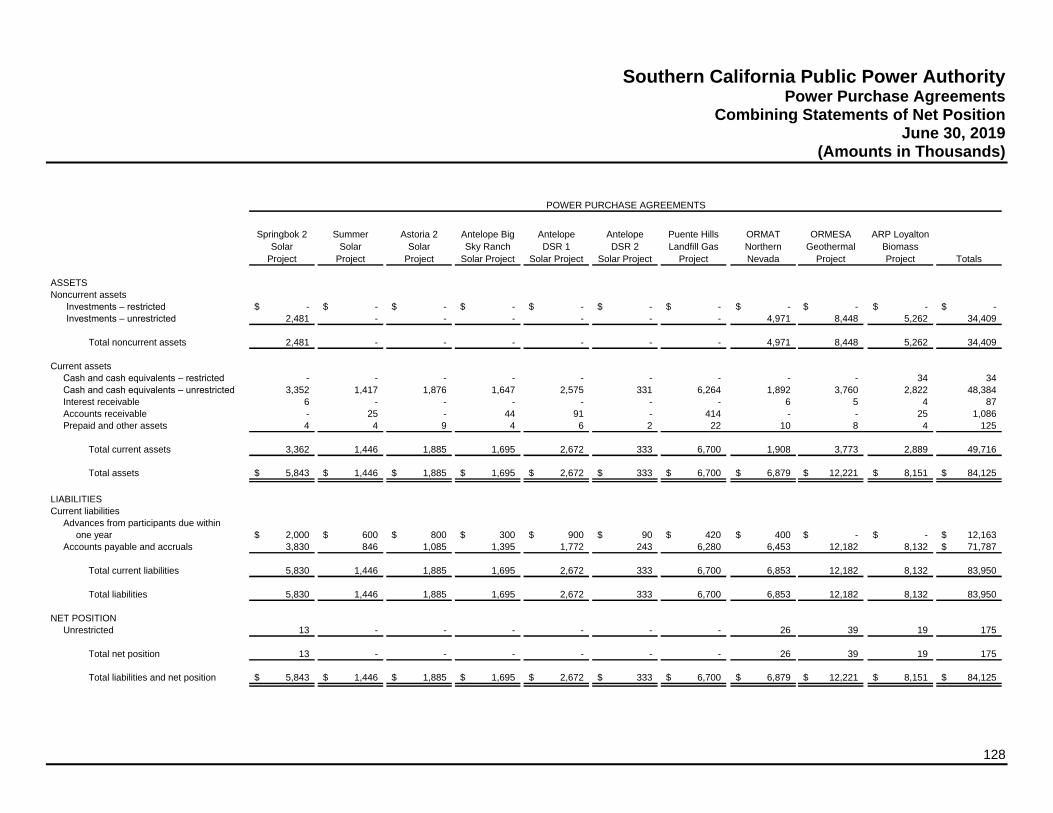
128
Southern California Public Power Authority Power Purchase Agreements
Combining Statements of Net Position June 30, 2019
(Amounts in Thousands)
Noncurrent assets
Investments – restricted
Investments – unrestricted
Total noncurrent assets
Current assets
Cash and cash equivalents – restricted
Cash and cash equivalents – unrestricted
Interest receivable
Accounts receivable
Prepaid and other assets
Total current assets
Total assets
Current liabilities
Advances from participants due within
one year
Accounts payable and accruals
Total current liabilities
Total liabilities
NET POSITION
Unrestricted
Total net position
Total liabilities and net position
ASSETS
LIABILITIES
Springbok 2
Solar
Project
Summer
Solar
Project
Astoria 2
Solar
Project
Antelope Big
Sky Ranch
Solar Project
Antelope
DSR 1
Solar Project
Antelope
DSR 2
Solar Project
Puente Hills
Landfill Gas
Project
ORMAT
Northern
Nevada
ORMESA
Geothermal
Project
ARP Loyalton
Biomass
Project Totals
-$ -$ -$ -$ -$ -$ -$ -$ -$ -$ -$
2,481 - - - - - - 4,971 8,448 5,262 34,409
2,481 - - - - - - 4,971 8,448 5,262 34,409
- - - - - - - - - 34 34
3,352 1,417 1,876 1,647 2,575 331 6,264 1,892 3,760 2,822 48,384
6 - - - - - - 6 5 4 87
- 25 - 44 91 - 414 - - 25 1,086
4 4 9 4 6 2 22 10 8 4 125
3,362 1,446 1,885 1,695 2,672 333 6,700 1,908 3,773 2,889 49,716
5,843$ 1,446$ 1,885$ 1,695$ 2,672$ 333$ 6,700$ 6,879$ 12,221$ 8,151$ 84,125$
2,000$ 600$ 800$ 300$ 900$ 90$ 420$ 400$ -$ -$ 12,163$
3,830 846 1,085 1,395 1,772 243 6,280 6,453 12,182 8,132 71,787$
5,830 1,446 1,885 1,695 2,672 333 6,700 6,853 12,182 8,132 83,950
5,830 1,446 1,885 1,695 2,672 333 6,700 6,853 12,182 8,132 83,950
13 - - - - - - 26 39 19 175
13 - - - - - - 26 39 19 175
5,843$ 1,446$ 1,885$ 1,695$ 2,672$ 333$ 6,700$ 6,879$ 12,221$ 8,151$ 84,125$
POWER PURCHASE AGREEMENTS

129
Southern California Public Power Authority Power Purchase Agreements Combining Statements of Net Position June 30, 2018 (Amounts in Thousands)
ORMAT
Geothermal
Energy
MWD Small
Hydro
Pebble
Springs
Wind
Ameresco
Chiquita
Landfill Gas
Don A.
Campbell/
Wild Rose
Geothermal
Copper
Mountain
Solar 3
Columbia 2
Solar
Heber-1
Geothermal
Kingbird
Solar
Don A.
Campbell 2
Geothermal
Springbok 1
Solar
Project
Noncurrent assets
Investments – restricted -$ -$ -$ -$ -$ -$ -$ -$ -$ -$ -$
Investments – unrestricted - - - - - - - 5,486 - - -
Total noncurrent assets - - - - - - - 5,486 - - -
Current assets
Cash and cash equivalents – restricted - - - - - - - - - - -
Cash and cash equivalents – unrestricted 1,205 1,033 4,672 819 2,190 4,873 1,108 5,156 699 2,404 3,525
Interest receivable - - 3 - 2 2 - 2 - 2 -
Accounts receivable 403 - - - - 1,398 20 - 114 - 904
Prepaid and other assets 5 2 6 2 4 13 3 11 5 3 4
Total current assets 1,613 1,035 4,681 821 2,196 6,286 1,131 5,169 818 2,409 4,433
Total assets 1,613$ 1,035$ 4,681$ 821$ 2,196$ 6,286$ 1,131$ 10,655$ 818$ 2,409$ 4,433$
Current liabilities
Advances from participants due within
one year 857$ 500$ -$ 400$ 960$ -$ 405$ 400$ 171$ 960$ 2,000$
Accounts payable and accruals 756 535 4,678 421 1,232 6,282 726 10,229 647 1,446 2,430
Total current liabilities 1,613 1,035 4,678 821 2,192 6,282 1,131 10,629 818 2,406 4,430
Total liabilities 1,613 1,035 4,678 821 2,192 6,282 1,131 10,629 818 2,406 4,430
NET POSITION
Unrestricted - - 3 - 4 4 - 26 - 3 3
Total net position - - 3 - 4 4 - 26 - 3 3
Total liabilities and net position 1,613$ 1,035$ 4,681$ 821$ 2,196$ 6,286$ 1,131$ 10,655$ 818$ 2,409$ 4,433$
ASSETS
LIABILITIES
POWER PURCHASE AGREEMENTS

130
Southern California Public Power Authority Power Purchase Agreements
Combining Statements of Net Position June 30, 2018
(Amounts in Thousands)
Noncurrent assets
Investments – restricted
Investments – unrestricted
Total noncurrent assets
Current assets
Cash and cash equivalents – restricted
Cash and cash equivalents – unrestricted
Interest receivable
Accounts receivable
Prepaid and other assets
Total current assets
Total assets
Current liabilities
Advances from participants due within
one year
Accounts payable and accruals
Total current liabilities
Total liabilities
NET POSITION
Unrestricted
Total net position
Total liabilities and net position
ASSETS
LIABILITIES
Springbok 2
Solar
Project
Summer
Solar
Project
Astoria 2
Solar
Project
Antelope Big
Sky Ranch
Solar Project
Antelope
DSR 1
Solar Project
Antelope
DSR 2
Solar Project
Puente Hills
Landfill Gas
Project
ORMAT
Northern
Nevada
ORMAT
Geothermal
Project
ARP Loyalton
Biomass
Project Totals
-$ -$ -$ -$ -$ -$ -$ -$ -$ -$ -$
- - - - - - - 4,681 4,982 - 15,149
- - - - - - - 4,681 4,982 - 15,149
- - - - - - - - - - -
6,044 517 901 496 2,210 182 4,159 1,281 2,353 2,946 48,773
- - - - - - - 2 2 3 18
- 741 1,126 416 333 17 800 - - 70 6,342
5 4 8 5 6 2 21 - - - 109
6,049 1,262 2,035 917 2,549 201 4,980 1,283 2,355 3,019 55,242
6,049$ 1,262$ 2,035$ 917$ 2,549$ 201$ 4,980$ 5,964$ 7,337$ 3,019$ 70,391$
2,000$ 600$ 800$ 300$ 900$ 90$ 420$ 1,800$ -$ -$ 13,563$
4,043 662 1,235 617 1,649 111 4,560 4,152 7,321 3,015 56,747
6,043 1,262 2,035 917 2,549 201 4,980 5,952 7,321 3,015 70,310
6,043 1,262 2,035 917 2,549 201 4,980 5,952 7,321 3,015 70,310
6 - - - - - - 12 16 4 81
6 - - - - - - 12 16 4 81
6,049$ 1,262$ 2,035$ 917$ 2,549$ 201$ 4,980$ 5,964$ 7,337$ 3,019$ 70,391$
POWER PURCHASE AGREEMENTS

131
Southern California Public Power Authority Power Purchase Agreements Statements of Revenues, Expenses, and Changes in Net Position June 30, 2019 (Amounts in Thousands)
Ormat
Geothermal
MWD Small
Hydro
Pebble
Springs
Wind
Ameresco
Chiquita
Landfill Gas
Don A.
Campbell/
Wild Rose
Geothermal
Copper
Mountain
Solar 3
Columbia
Solar 2
Heber-1
Geothermal
Kingbird
Solar
Don A.
Campbell 2
Geothermal
Springbok 1
Solar
Project
Operating revenues
Sales of electric energy 9,772$ 1,106$ 19,455$ 3,068$ 15,175$ 56,249$ 4,273$ 27,062$ 5,944$ 11,264$ 19,959$
Total operating revenues 9,772 1,106 19,455 3,068 15,175 56,249 4,273 27,062 5,944 11,264 19,959
Operating expenses
Operations and maintenance 9,772 1,106 19,549 3,068 15,248 56,362 4,273 27,246 5,944 11,337 20,040
Total operating expenses 9,772 1,106 19,549 3,068 15,248 56,362 4,273 27,246 5,944 11,337 20,040
Operating income (loss) - - (94) - (73) (113) - (184) - (73) (81)
Non operating revenues (expenses)
Investment and other income - - 105 - 78 131 - 163 - 86 90
Net non operating revenues (expenses) - - 105 - 78 131 - 163 - 86 90
Change in net position - - 11 - 5 18 - (21) - 13 9
Net position – beginning of year - - 3 - 4 4 - 26 - 3 3
Net position – end of year -$ -$ 14$ -$ 9$ 22$ -$ 5$ -$ 16$ 12$
POWER PURCHASE AGREEMENTS

132
Southern California Public Power Authority Power Purchase Agreements
Statements of Revenues, Expenses, and Changes in Net Position June 30, 2019
(Amounts in Thousands)
Operating revenues
Sales of electric energy
Total operating revenues
Operating expenses
Operations and maintenance
Total operating expenses
Operating income (loss)
Non operating revenues (expenses)
Investment and other income
Net non operating revenues (expenses)
Change in net position
Net position – beginning of year
Net position – end of year
Springbok 2
Solar
Project
Summer
Solar
Project
Astoria 2
Solar Project
Antelope Big
Sky Ranch
Solar Project
Antelope
DSR 1
Solar Project
Antelope
DSR 2
Solar Project
Puente Hills
Landfill Gas
Project
ORMAT
Northern
Nevada
ORMESA
Geothermal
Project
ARP Loyalton
Biomass
Project Totals
23,803$ 5,846$ 9,687$ 5,998$ 10,977$ 646$ 26,471$ 41,947$ 18,409$ 3,992$ 321,103$
23,803 5,846 9,687 5,998 10,977 646 26,471 41,947 18,409 3,992 321,103
23,915 5,846 9,687 5,998 11,068 655 26,471 42,188 18,615 4,094 322,482
23,915 5,846 9,687 5,998 11,068 655 26,471 42,188 18,615 4,094 322,482
(112) - - - (91) (9) - (241) (206) (102) (1,379)
119 - - - 91 9 - 255 229 117 1,473
119 - - - 91 9 - 255 229 117 1,473
7 - - - - - - 14 23 15 94
6 - - - - - - 12 16 4 81
13$ -$ -$ -$ -$ -$ -$ 26$ 39$ 19$ 175$
POWER PURCHASE AGREEMENTS

133
Southern California Public Power Authority Power Purchase Agreements Statement of Revenues, Expenses, and Changes in Net Position June 30, 2018 (Amounts in Thousands)
ORMAT
Geothermal
MWD Small
Hydro
Pebble
Springs
Wind
Ameresco
Chiquita
Landfill Gas
Don A.
Campbell/
Wild Rose
Geothermal
Copper
Mountain
Solar 3
Columbia
Solar 2
Heber-1
Geothermal Kingbird Solar
Don A.
Campbell 2
Geothermal
Springbok 1
Solar Project
Operating revenues
Sales of electric energy 10,728$ 1,314$ 20,829$ 3,155$ 16,927$ 59,207$ 3,852$ 26,050$ 5,727$ 13,340$ 20,539$
Total operating revenues 10,728 1,314 20,829 3,155 16,927 59,207 3,852 26,050 5,727 13,340 20,539
Operating expenses
Operations and maintenance 10,728 1,314 20,901 3,155 16,954 59,319 3,852 26,177 5,727 13,360 20,572
Total operating expenses 10,728 1,314 20,901 3,155 16,954 59,319 3,852 26,177 5,727 13,360 20,572
Operating income (loss) - - (72) - (27) (112) - (127) - (20) (33)
Non operating revenues (expenses)
Investment and other income - - 70 - 30 105 - 141 - 23 36
Net non operating revenues (expenses) - - 70 - 30 105 - 141 - 23 36
Change in net position - - (2) - 3 (7) - 14 - 3 3
Net position – beginning of year - - 5 - 1 11 - 12 - - -
Net position – end of year -$ -$ 3$ -$ 4$ 4$ -$ 26$ -$ 3$ 3$
POWER PURCHASE AGREEMENTS
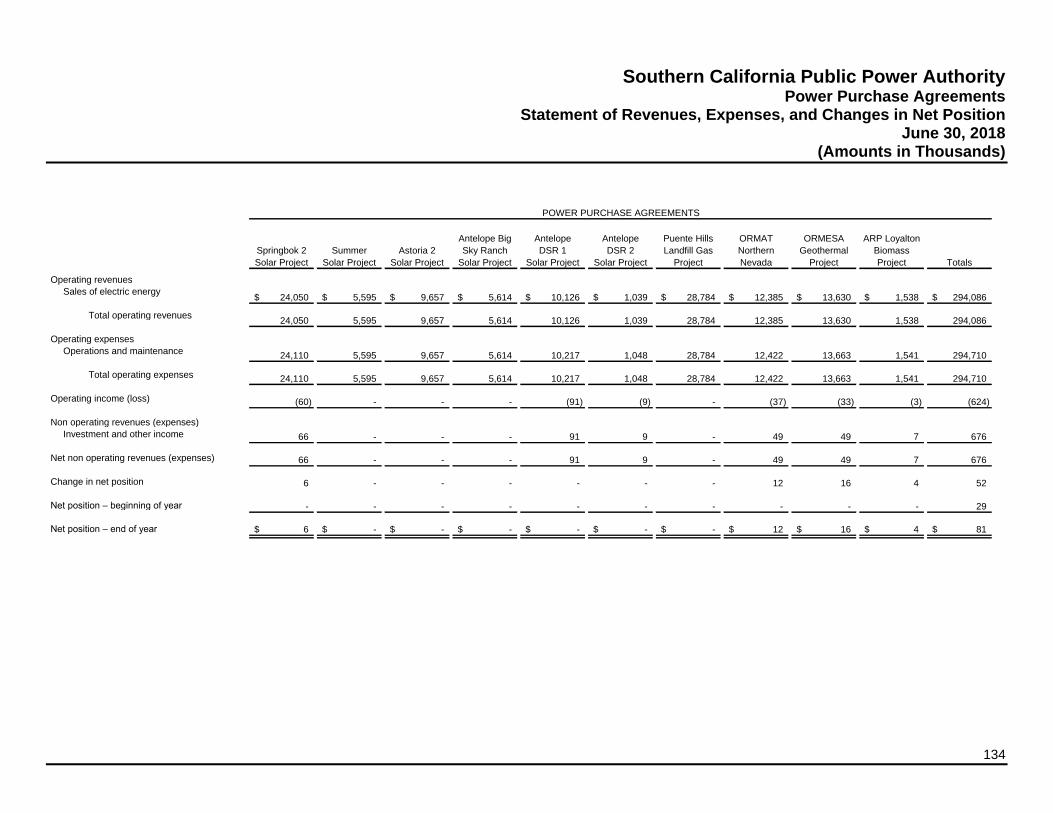
134
Southern California Public Power Authority Power Purchase Agreements
Statement of Revenues, Expenses, and Changes in Net Position June 30, 2018
(Amounts in Thousands)
Operating revenues
Sales of electric energy
Total operating revenues
Operating expenses
Operations and maintenance
Total operating expenses
Operating income (loss)
Non operating revenues (expenses)
Investment and other income
Net non operating revenues (expenses)
Change in net position
Net position – beginning of year
Net position – end of year
Springbok 2
Solar Project
Summer
Solar Project
Astoria 2
Solar Project
Antelope Big
Sky Ranch
Solar Project
Antelope
DSR 1
Solar Project
Antelope
DSR 2
Solar Project
Puente Hills
Landfill Gas
Project
ORMAT
Northern
Nevada
ORMESA
Geothermal
Project
ARP Loyalton
Biomass
Project Totals
24,050$ 5,595$ 9,657$ 5,614$ 10,126$ 1,039$ 28,784$ 12,385$ 13,630$ 1,538$ 294,086$
24,050 5,595 9,657 5,614 10,126 1,039 28,784 12,385 13,630 1,538 294,086
24,110 5,595 9,657 5,614 10,217 1,048 28,784 12,422 13,663 1,541 294,710
24,110 5,595 9,657 5,614 10,217 1,048 28,784 12,422 13,663 1,541 294,710
(60) - - - (91) (9) - (37) (33) (3) (624)
66 - - - 91 9 - 49 49 7 676
66 - - - 91 9 - 49 49 7 676
6 - - - - - - 12 16 4 52
- - - - - - - - - - 29
6$ -$ -$ -$ -$ -$ -$ 12$ 16$ 4$ 81$
POWER PURCHASE AGREEMENTS

135
Southern California Public Power Authority Power Purchase Agreements Statement of Cash Flows June 30, 2019 (Amounts in Thousands)
ORMAT
Geothermal
Energy
MWD Small
Hydro
Pebble Springs
Wind
Ameresco
Chiquita
Landfill Gas
Don A.
Campbell/ Wild
Rose
Geothermal
Copper
Mountain
Solar 3
Columbia 2
Solar
Heber-1
Geothermal Kingbird Solar
Don A.
Campbell 2
Geothermal
Springbok 1
Solar Project
Cash flows from operating activities
Receipts from participants 10,795$ 1,380$ 20,312$ 3,146$ 16,867$ 59,142$ 1,652$ 18,752$ 2,365$ 13,311$ 21,928$
Payments to operating managers (9,755) (1,145) (19,071) (3,085) (15,314) (56,684) (3,014) (27,280) (3,940) (11,386) (20,134)
Other disbursements and receipts - - 1 - - - 1,268 (1) 1,820 (1) -
Net cash flows from operating activities 1,040 235 1,242 61 1,553 2,458 (94) (8,529) 245 1,924 1,794
Cash flows from investing activities
Interest received on investments - - 81 - 72 115 - 146 - 68 67
Purchases of investments - - (3,988) - (1,999) (2,969) - - (1,994) (4,264)
Proceeds from sale/maturity of investments - - - - - - - 5,500 - - 2,000
Net cash provided by (used for)
investing activities - - (3,907) - (1,927) (2,854) - 5,646 - (1,926) (2,197)
Net increase (decrease) in cash and
cash equivalents 1,040 235 (2,665) 61 (374) (396) (94) (2,883) 245 (2) (403)
Cash and cash equivalents, beginning of year 1,205 1,033 4,672 819 2,190 4,873 1,108 5,156 699 2,404 3,525
Cash and cash equivalents, end of year 2,245$ 1,268$ 2,007$ 880$ 1,816$ 4,477$ 1,014$ 2,273$ 944$ 2,402$ 3,122$
Reconciliation of operating income (loss) to net
cash provided by operating activities
Operating income (loss) -$ -$ (94)$ -$ (73)$ (113)$ -$ (184)$ -$ (73)$ (81)$
Changes in assets and liabilities
Accounts receivable 403 - - - - 1,398 (14) (410) 71 - 904
Accounts payable and accruals 637 235 1,334 61 1,626 1,172 (80) (7,934) 174 1,997 970
Other - - 2 - - 1 - (1) - - 1
Net cash provided by operating activities 1,040$ 235$ 1,242$ 61$ 1,553$ 2,458$ (94)$ (8,529)$ 245$ 1,924$ 1,794$
Cash and cash equivalents as stated in the
Combined Statements of Net Position
Cash and cash equivalents – restricted - - - - - - - - - - -
Cash and cash equivalents – unrestricted 2,245 1,268 2,007 880 1,816 4,477 1,014 2,273 944 2,402 3,122
2,245$ 1,268$ 2,007$ 880$ 1,816$ 4,477$ 1,014$ 2,273$ 944$ 2,402$ 3,122$
POWER PURCHASE AGREEMENTS
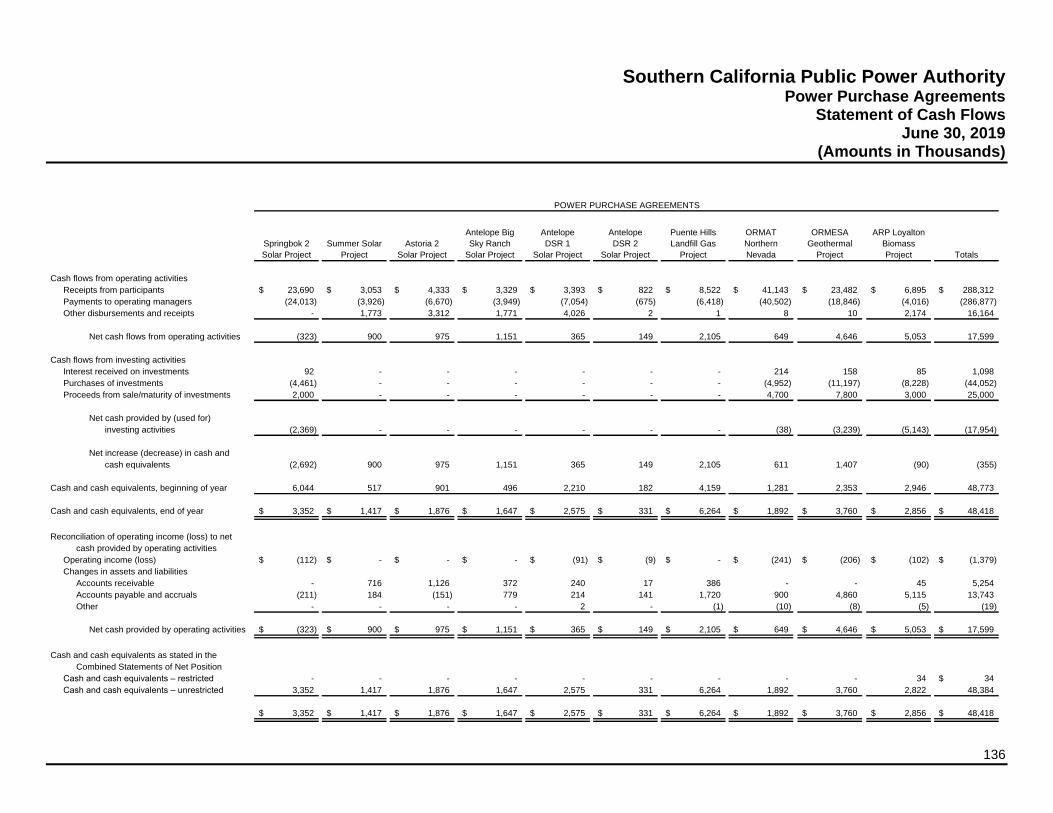
136
Southern California Public Power Authority Power Purchase Agreements
Statement of Cash Flows June 30, 2019
(Amounts in Thousands)
Cash flows from operating activities
Receipts from participants
Payments to operating managers
Other disbursements and receipts
Net cash flows from operating activities
Cash flows from investing activities
Interest received on investments
Purchases of investments
Proceeds from sale/maturity of investments
Net cash provided by (used for)
investing activities
Net increase (decrease) in cash and
cash equivalents
Cash and cash equivalents, beginning of year
Cash and cash equivalents, end of year
Reconciliation of operating income (loss) to net
cash provided by operating activities
Operating income (loss)
Changes in assets and liabilities
Accounts receivable
Accounts payable and accruals
Other
Net cash provided by operating activities
Cash and cash equivalents as stated in the
Combined Statements of Net Position
Cash and cash equivalents – restricted
Cash and cash equivalents – unrestricted
Springbok 2
Solar Project
Summer Solar
Project
Astoria 2
Solar Project
Antelope Big
Sky Ranch
Solar Project
Antelope
DSR 1
Solar Project
Antelope
DSR 2
Solar Project
Puente Hills
Landfill Gas
Project
ORMAT
Northern
Nevada
ORMESA
Geothermal
Project
ARP Loyalton
Biomass
Project Totals
23,690$ 3,053$ 4,333$ 3,329$ 3,393$ 822$ 8,522$ 41,143$ 23,482$ 6,895$ 288,312$
(24,013) (3,926) (6,670) (3,949) (7,054) (675) (6,418) (40,502) (18,846) (4,016) (286,877)
- 1,773 3,312 1,771 4,026 2 1 8 10 2,174 16,164
(323) 900 975 1,151 365 149 2,105 649 4,646 5,053 17,599
92 - - - - - - 214 158 85 1,098
(4,461) - - - - - - (4,952) (11,197) (8,228) (44,052)
2,000 - - - - - - 4,700 7,800 3,000 25,000
(2,369) - - - - - - (38) (3,239) (5,143) (17,954)
(2,692) 900 975 1,151 365 149 2,105 611 1,407 (90) (355)
6,044 517 901 496 2,210 182 4,159 1,281 2,353 2,946 48,773
3,352$ 1,417$ 1,876$ 1,647$ 2,575$ 331$ 6,264$ 1,892$ 3,760$ 2,856$ 48,418$
(112)$ -$ -$ -$ (91)$ (9)$ -$ (241)$ (206)$ (102)$ (1,379)$
- 716 1,126 372 240 17 386 - - 45 5,254
(211) 184 (151) 779 214 141 1,720 900 4,860 5,115 13,743
- - - - 2 - (1) (10) (8) (5) (19)
(323)$ 900$ 975$ 1,151$ 365$ 149$ 2,105$ 649$ 4,646$ 5,053$ 17,599$
- - - - - - - - - 34 34$
3,352 1,417 1,876 1,647 2,575 331 6,264 1,892 3,760 2,822 48,384
3,352$ 1,417$ 1,876$ 1,647$ 2,575$ 331$ 6,264$ 1,892$ 3,760$ 2,856$ 48,418$
POWER PURCHASE AGREEMENTS

137
Southern California Public Power Authority Power Purchase Agreements Statement of Cash Flows June 30, 2018 (Amounts in Thousands)
ORMAT
Geothermal
Energy
MWD Small
Hydro
Pebble Springs
Wind
Ameresco
Chiquita
Landfill Gas
Don A.
Campbell/
Wild Rose
Geothermal
Copper
Mountain
Solar 3
Columbia 2
Solar
Heber-1
Geothermal Kingbird Solar
Don A.
Campbell 2
Geothermal
Springbok 1
Solar Project
Cash flows from operating activities
Receipts from participants 11,822$ 1,771$ 19,245$ 3,318$ 18,085$ 58,187$ 2,137$ 26,195$ 2,459$ 14,836$ 21,930$
Payments to operating managers (10,648) (1,456) (20,844) (3,194) (16,760) (65,416) (2,973) (26,007) (4,215) (13,277) (20,612)
Other disbursements and receipts - 1 1 2 - (1) 953 4 1,431 - 4
Net cash flows from operating activities 1,174 316 (1,598) 126 1,325 (7,230) 117 192 (325) 1,559 1,322
Cash flows from investing activities
Interest received on investments - - 54 - 28 93 - 104 - 22 35
Purchases of investments - - - - - - - (10,452) - - -
Proceeds from sale/maturity of investments - - 3,200 - - 7,000 - 9,200 - - -
Net cash provided by (used for)
investing activities - - 3,254 - 28 7,093 - (1,148) - 22 35
Net increase (decrease) in cash and
cash equivalents 1,174 316 1,656 126 1,353 (137) 117 (956) (325) 1,581 1,357
Cash and cash equivalents, beginning of year 31 717 3,016 693 837 5,010 991 6,112 1,024 823 2,168
Cash and cash equivalents, end of year 1,205$ 1,033$ 4,672$ 819$ 2,190$ 4,873$ 1,108$ 5,156$ 699$ 2,404$ 3,525$
Reconciliation of operating income (loss) to net
cash provided by operating activities
Operating income (loss) -$ -$ (72)$ -$ (27)$ (112)$ -$ (127)$ -$ (20)$ (33)$
Changes in assets and liabilities
Accounts receivable 1,619 - - 9 997 (1,019) 69 - 14 875 1,391
Accounts payable and accruals (444) 316 (1,527) 117 355 (6,099) 48 318 (338) 677 (36)
Other (1) - 1 - - - - 1 (1) 27 -
Net cash provided by operating activities 1,174$ 316$ (1,598)$ 126$ 1,325$ (7,230)$ 117$ 192$ (325)$ 1,559$ 1,322$
Cash and cash equivalents as stated in the
Combined Statements of Net Position
Cash and cash equivalents – unrestricted 1,205 1,033 4,672 819 2,190 4,873 1,108 5,156 699 2,404 3,525
1,205$ 1,033$ 4,672$ 819$ 2,190$ 4,873$ 1,108$ 5,156$ 699$ 2,404$ 3,525$
POWER PURCHASE AGREEMENTS

138
Southern California Public Power Authority Power Purchase Agreements
Statement of Cash Flows June 30, 2018
(Amounts in Thousands)
Cash flows from operating activities
Receipts from participants
Payments to operating managers
Other disbursements and receipts
Net cash flows from operating activities
Cash flows from investing activities
Interest received on investments
Purchases of investments
Proceeds from sale/maturity of investments
Net cash provided by (used for)
investing activities
Net increase (decrease) in cash and
cash equivalents
Cash and cash equivalents, beginning of year
Cash and cash equivalents, end of year
Reconciliation of operating income (loss) to net
cash provided by operating activities
Operating income (loss)
Changes in assets and liabilities
Accounts receivable
Accounts payable and accruals
Other
Net cash provided by operating activities
Cash and cash equivalents as stated in the
Combined Statements of Net Position
Cash and cash equivalents – unrestricted
Springbok 2
Solar Project
Summer
Solar Project
Astoria 2
Solar Project
Antelope
Big Sky Ranch
Solar Project
Antelope
DSR 1
Solar Project
Antelope
DSR 2
Solar Project
Puente Hills
Landfill Gas
Project
ORMAT
Northern
Nevada
ORMESA
Geothermal
Project
ARP Loyalton
Biomass
Project Totals
24,745$ 1,892$ 2,236$ 2,306$ 3,566$ 508$ 11,595$ 15,766$ 19,320$ 3,324$ 265,243$
(24,141) (4,059) (5,828) (4,182) (7,325) (832) (10,818) (11,251) (12,031) (827) (266,696)
5 1,312 1,552 1,379 3,070 247 20 1,400 - 446 11,826
609 (855) (2,040) (497) (689) (77) 797 5,915 7,289 2,943 10,373
67 - - - - - - 39 35 3 480
- - - - - - - (4,673) (4,971) - (20,096)
- - - - - - - - - - 19,400
67 - - - - - - (4,634) (4,936) 3 (216)
676 (855) (2,040) (497) (689) (77) 797 1,281 2,353 2,946 10,157
5,368 1,372 2,941 993 2,899 259 3,362 - - - 38,616
6,044$ 517$ 901$ 496$ 2,210$ 182$ 4,159$ 1,281$ 2,353$ 2,946$ 48,773$
(60)$ -$ -$ -$ (91)$ (9)$ -$ (37)$ (33)$ (3)$ (624)$
- (620) (1,126) (307) (59) 12 (789) - - (70) 996
669 (230) (906) (185) (533) (80) 1,608 5,952 7,322 3,016 10,020
- (5) (8) (5) (6) - (22) - - - (19)
609$ (855)$ (2,040)$ (497)$ (689)$ (77)$ 797$ 5,915$ 7,289$ 2,943$ 10,373$
6,044 517 901 496 2,210 182 4,159 1,281 2,353 2,946 48,773
6,044$ 517$ 901$ 496$ 2,210$ 182$ 4,159$ 1,281$ 2,353$ 2,946$ 48,773$
POWER PURCHASE AGREEMENTS

139
Southern California Public Power Authority Power Purchase Agreements Investments June 30, 2019 (Amounts in Thousands)
ORMAT
Geothermal
MWD Small
Hydro
Pebble
Springs
Wind
Ameresco
Chiquita
Landfill Gas
Don A.
Campbell/
Wild Rose
Geothermal
Copper
Mountain
Solar 3
Columbia 2
Solar
Heber-1
Geothermal Kingbird Solar
Don A.
Campbell 2
Geothermal Springbok 1
Agency discount notes -$ -$ 1,498$ -$ 1,399$ 4,474$ -$ 1,598$ -$ 1,998$ 3,383$
U.S. treasury securities - - 3,993$ - 1,997 2,600 - - - 1,997 1,400
Money market funds 2,245 1,268 509 880 416 381 1,014 675 944 404 622
Total 2,245$ 1,268$ 6,000$ 880$ 3,812$ 7,455$ 1,014$ 2,273$ 944$ 4,399$ 5,405$
Unrestricted investments -$ -$ 3,993$ -$ 1,996$ 2,978$ -$ -$ -$ 1,997$ 2,283$
Cash and cash equivalents 2,245 1,268 2,007 880 1,816 4,477 1,014 2,273 944 2,402 3,122
Total 2,245$ 1,268$ 6,000$ 880$ 3,812$ 7,455$ 1,014$ 2,273$ 944$ 4,399$ 5,405$
POWER PURCHASE AGREEMENTS

140
Southern California Public Power Authority Power Purchase Agreements
Investments June 30, 2019
(Amounts in Thousands)
Springbok 2
Summer
Solar
Astoria 2
Solar
Antelope
Big Sky
Ranch
Antelope
DSR 1
Solar
Antelope
DSR 2
Solar
Puente Hills
Landfill Gas
ORMAT
Northern
Nevada
ORMESA
Geothermal
Project
ARP Loyalton
Biomass
Project Total
Agency discount notes 5,478$ -$ -$ -$ -$ -$ -$ 6,469$ 11,645$ 7,260$ 45,202$
U.S. treasury securities - - - - - - - - - - 11,987
Money market funds 355 1,417 1,876 1,647 2,575 331 6,264 394 563 858 25,638
Total 5,833$ 1,417$ 1,876$ 1,647$ 2,575$ 331$ 6,264$ 6,863$ 12,208$ 8,118$ 82,827$
Unrestricted investments 2,481$ -$ -$ -$ -$ -$ -$ 4,971$ 8,448$ 5,262$ 34,409$
Cash and cash equivalents 3,352 1,417 1,876 1,647 2,575 331 6,264 1,892 3,760 2,856 48,418
Total 5,833$ 1,417$ 1,876$ 1,647$ 2,575$ 331$ 6,264$ 6,863$ 12,208$ 8,118$ 82,827$
POWER PURCHASE AGREEMENTS

141
Southern California Public Power Authority Power Purchase Agreements Investments June 30, 2018 (Amounts in Thousands)
ORMAT
Geothermal
MWD Small
Hydro
Pebble Springs
Wind
Ameresco
Chiquita
Landfill Gas
Don A.
Campbell/
Wild Rose
Geothermal
Copper
Mountain
Solar 3
Columbia 2
Solar
Heber-1
Geothermal Kingbird Solar
Don A.
Campbell 2
Geothermal Springbok 1
Agency discount notes -$ -$ 3,997$ -$ 1,799$ 4,395$ -$ 9,878$ -$ 1,999$ 3,195$
Money market funds 1,205 1,033 675 819 391 478 1,108 764 699 405 330
Total 1,205$ 1,033$ 4,672$ 819$ 2,190$ 4,873$ 1,108$ 10,642$ 699$ 2,404$ 3,525$
Unrestricted investments -$ -$ -$ -$ -$ -$ -$ 5,486$ -$ -$ -$
Cash and cash equivalents 1,205 1,033 4,672 819 2,190 4,873 1,108 5,156 699 2,404 3,525
Total 1,205$ 1,033$ 4,672$ 819$ 2,190$ 4,873$ 1,108$ 10,642$ 699$ 2,404$ 3,525$
POWER PURCHASE AGREEMENTS
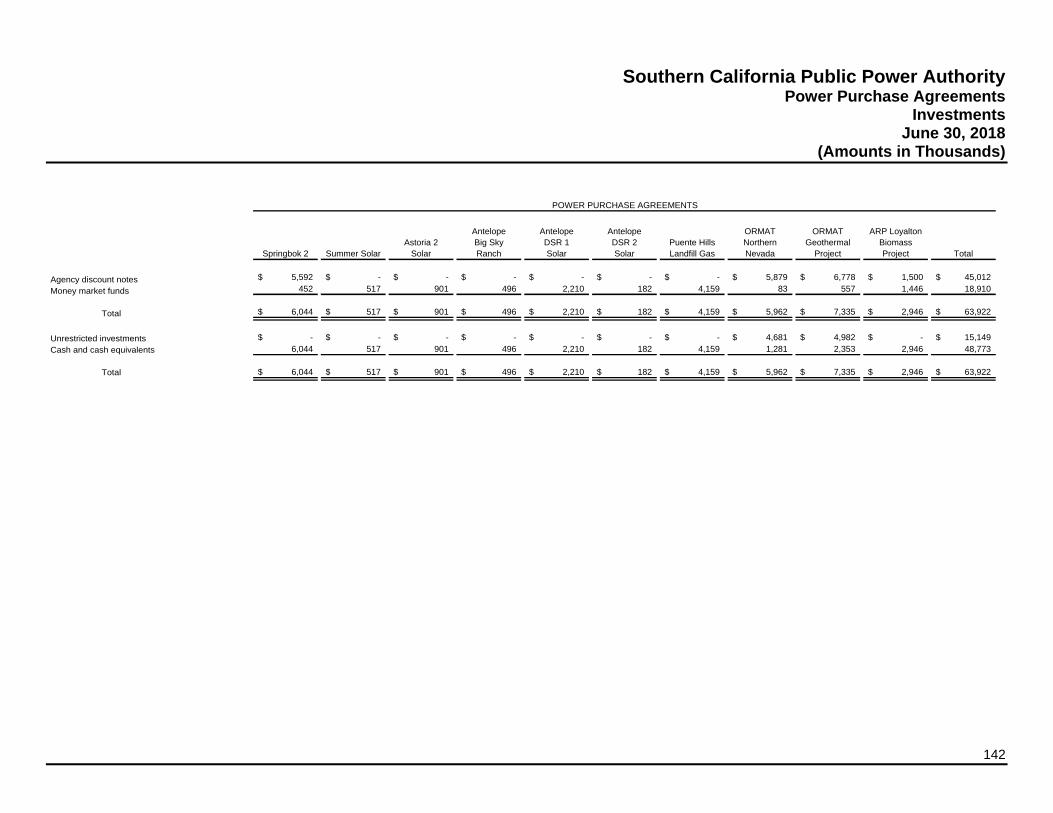
142
Southern California Public Power Authority Power Purchase Agreements
Investments June 30, 2018
(Amounts in Thousands)
Agency discount notes
Money market funds
Total
Unrestricted investments
Cash and cash equivalents
Total
Springbok 2 Summer Solar
Astoria 2
Solar
Antelope
Big Sky
Ranch
Antelope
DSR 1
Solar
Antelope
DSR 2
Solar
Puente Hills
Landfill Gas
ORMAT
Northern
Nevada
ORMAT
Geothermal
Project
ARP Loyalton
Biomass
Project Total
5,592$ -$ -$ -$ -$ -$ -$ 5,879$ 6,778$ 1,500$ 45,012$
452 517 901 496 2,210 182 4,159 83 557 1,446 18,910
6,044$ 517$ 901$ 496$ 2,210$ 182$ 4,159$ 5,962$ 7,335$ 2,946$ 63,922$
-$ -$ -$ -$ -$ -$ -$ 4,681$ 4,982$ -$ 15,149$
6,044 517 901 496 2,210 182 4,159 1,281 2,353 2,946 48,773
6,044$ 517$ 901$ 496$ 2,210$ 182$ 4,159$ 5,962$ 7,335$ 2,946$ 63,922$
POWER PURCHASE AGREEMENTS

Other Information
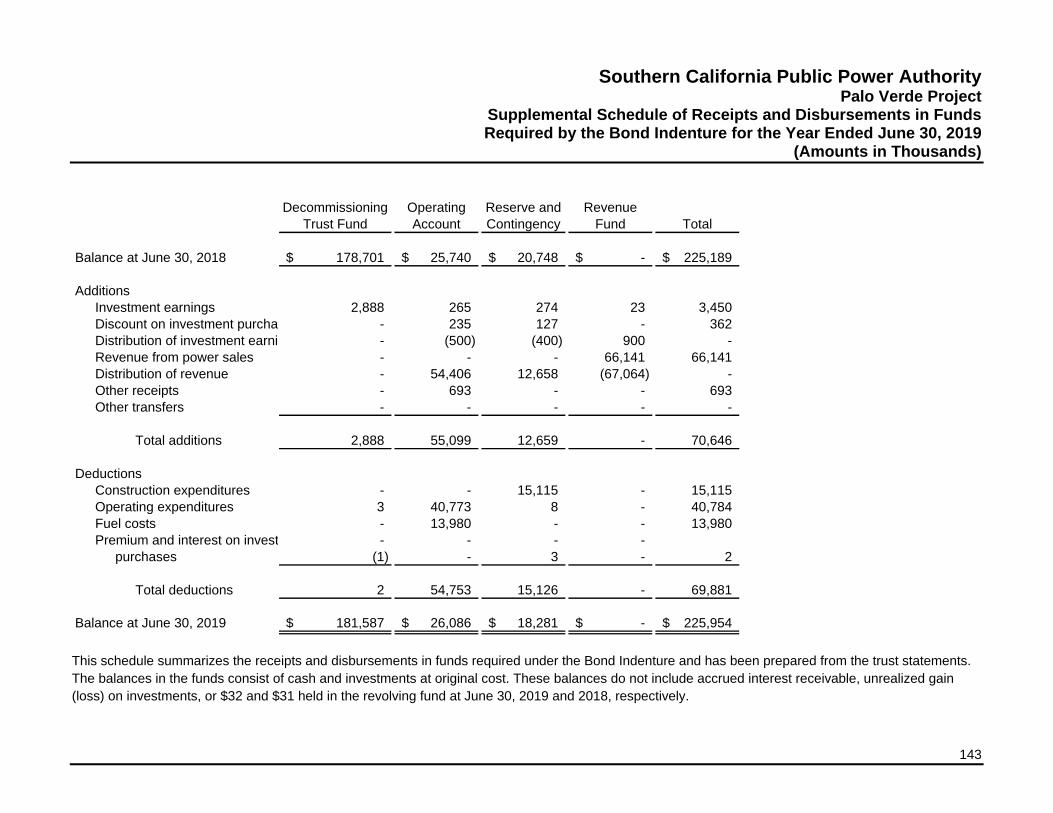
143
Southern California Public Power Authority Palo Verde Project
Supplemental Schedule of Receipts and Disbursements in Funds Required by the Bond Indenture for the Year Ended June 30, 2019
(Amounts in Thousands)
Decommissioning
Trust Fund
Operating
Account
Reserve and
Contingency
Revenue
Fund Total
Balance at June 30, 2018 178,701$ 25,740$ 20,748$ -$ 225,189$
Additions
Investment earnings 2,888 265 274 23 3,450
Discount on investment purchases - 235 127 - 362
Distribution of investment earnings - (500) (400) 900 -
Revenue from power sales - - - 66,141 66,141
Distribution of revenue - 54,406 12,658 (67,064) -
Other receipts - 693 - - 693
Other transfers - - - - -
Total additions 2,888 55,099 12,659 - 70,646
Deductions
Construction expenditures - - 15,115 - 15,115
Operating expenditures 3 40,773 8 - 40,784
Fuel costs - 13,980 - - 13,980
Premium and interest on investment - - - -
purchases (1) - 3 - 2
Total deductions 2 54,753 15,126 - 69,881
Balance at June 30, 2019 181,587$ 26,086$ 18,281$ -$ 225,954$
This schedule summarizes the receipts and disbursements in funds required under the Bond Indenture and has been prepared from the trust statements.
The balances in the funds consist of cash and investments at original cost. These balances do not include accrued interest receivable, unrealized gain
(loss) on investments, or $32 and $31 held in the revolving fund at June 30, 2019 and 2018, respectively.
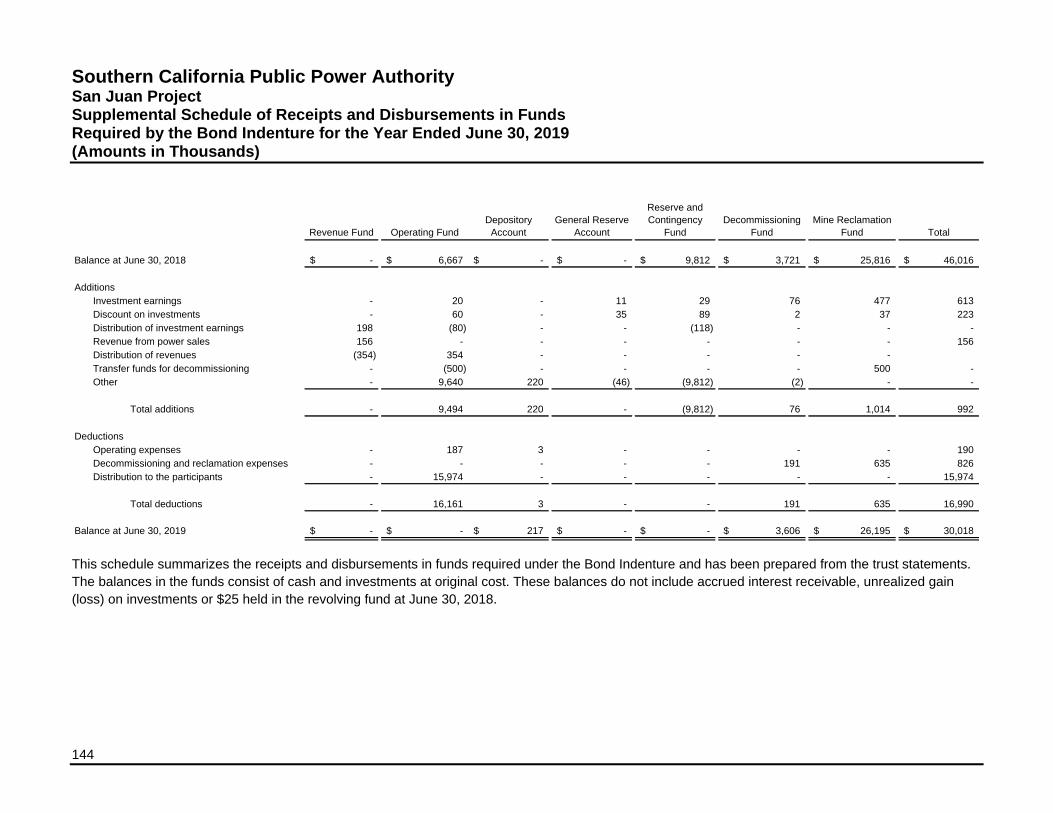
144
Southern California Public Power Authority San Juan Project Supplemental Schedule of Receipts and Disbursements in Funds Required by the Bond Indenture for the Year Ended June 30, 2019 (Amounts in Thousands)
Revenue Fund Operating Fund
Depository
Account
General Reserve
Account
Reserve and
Contingency
Fund
Decommissioning
Fund
Mine Reclamation
Fund Total
Balance at June 30, 2018 -$ 6,667$ -$ -$ 9,812$ 3,721$ 25,816$ 46,016$
Additions
Investment earnings - 20 - 11 29 76 477 613
Discount on investments - 60 - 35 89 2 37 223
Distribution of investment earnings 198 (80) - - (118) - - -
Revenue from power sales 156 - - - - - - 156
Distribution of revenues (354) 354 - - - - -
Transfer funds for decommissioning - (500) - - - - 500 -
Other - 9,640 220 (46) (9,812) (2) - -
Total additions - 9,494 220 - (9,812) 76 1,014 992
Deductions
Operating expenses - 187 3 - - - - 190
Decommissioning and reclamation expenses - - - - - 191 635 826
Distribution to the participants - 15,974 - - - - - 15,974
Total deductions - 16,161 3 - - 191 635 16,990
Balance at June 30, 2019 -$ -$ 217$ -$ -$ 3,606$ 26,195$ 30,018$
This schedule summarizes the receipts and disbursements in funds required under the Bond Indenture and has been prepared from the trust statements.
The balances in the funds consist of cash and investments at original cost. These balances do not include accrued interest receivable, unrealized gain
(loss) on investments or $25 held in the revolving fund at June 30, 2018.
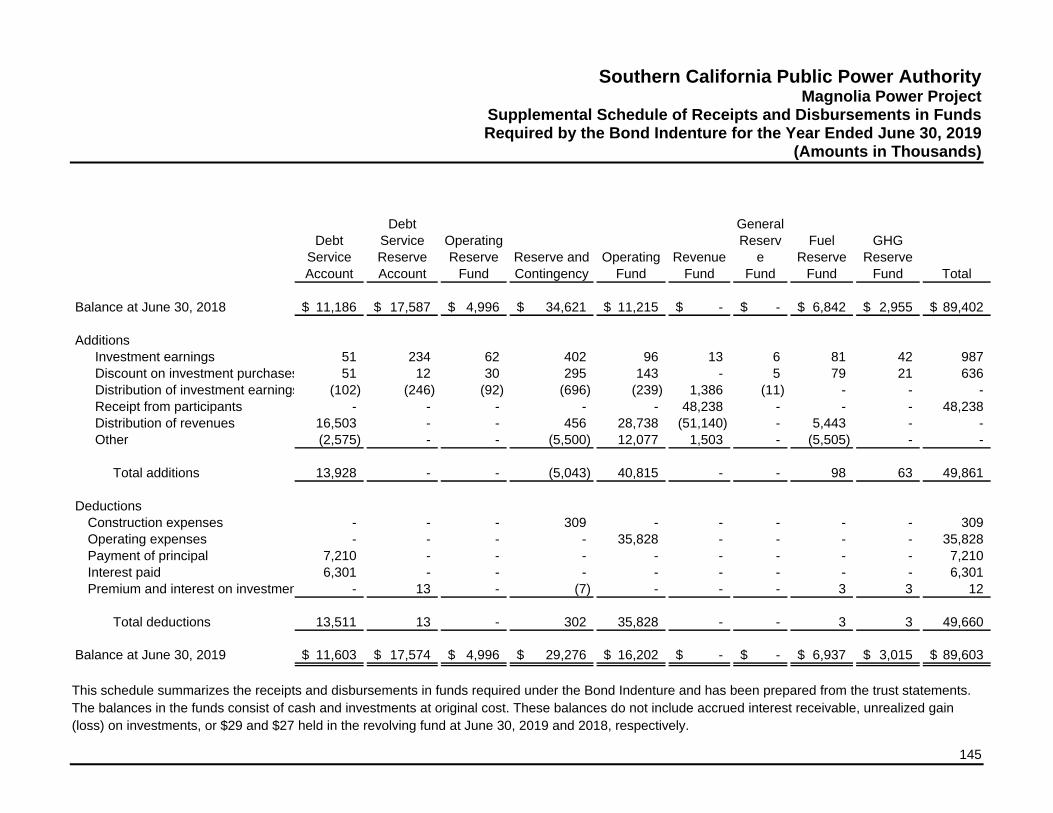
145
Southern California Public Power Authority Magnolia Power Project
Supplemental Schedule of Receipts and Disbursements in Funds Required by the Bond Indenture for the Year Ended June 30, 2019
(Amounts in Thousands)
Debt
Service
Account
Debt
Service
Reserve
Account
Operating
Reserve
Fund
Reserve and
Contingency
Operating
Fund
Revenue
Fund
General
Reserv
e
Fund
Fuel
Reserve
Fund
GHG
Reserve
Fund Total
Balance at June 30, 2018 11,186$ 17,587$ 4,996$ 34,621$ 11,215$ -$ -$ 6,842$ 2,955$ 89,402$
Additions
Investment earnings 51 234 62 402 96 13 6 81 42 987
Discount on investment purchases 51 12 30 295 143 - 5 79 21 636
Distribution of investment earnings (102) (246) (92) (696) (239) 1,386 (11) - - -
Receipt from participants - - - - - 48,238 - - - 48,238
Distribution of revenues 16,503 - - 456 28,738 (51,140) - 5,443 - -
Other (2,575) - - (5,500) 12,077 1,503 - (5,505) - -
Total additions 13,928 - - (5,043) 40,815 - - 98 63 49,861
Deductions
Construction expenses - - - 309 - - - - - 309
Operating expenses - - - - 35,828 - - - - 35,828
Payment of principal 7,210 - - - - - - - - 7,210
Interest paid 6,301 - - - - - - - - 6,301
Premium and interest on investment purchases- 13 - (7) - - - 3 3 12
Total deductions 13,511 13 - 302 35,828 - - 3 3 49,660
Balance at June 30, 2019 11,603$ 17,574$ 4,996$ 29,276$ 16,202$ -$ -$ 6,937$ 3,015$ 89,603$
This schedule summarizes the receipts and disbursements in funds required under the Bond Indenture and has been prepared from the trust statements.
The balances in the funds consist of cash and investments at original cost. These balances do not include accrued interest receivable, unrealized gain
(loss) on investments, or $29 and $27 held in the revolving fund at June 30, 2019 and 2018, respectively.

146
Southern California Public Power Authority Canyon Power Project Supplemental Schedule of Receipts and Disbursements in Funds Required by the Bond Indenture for the Year Ended June 30, 2019 (Amounts in Thousands)
Revenue
Fund
Operating
Fund
Debt
Service
Fund
Debt
Service
Reserve
Fund
Project
Fund
General
Reserve
Cost of
Issuance
Fund Total
Balance at June 30, 2018 -$ 1,500$ 10,501$ 8,072$ 3,506$ 3$ 27$ 23,609$
Additions
Investment earnings 3 26 25 99 16 20 - 189
Discount on investment purchases - 18 76 13 36 26 - 169
Distribution of investment earnings 293 (44) (91) (112) - (46) - -
Receipt from participants 21,940 - - - - - - 21,940
Distribution of revenues (22,236) 6,347 9,222 - - 6,667 - -
Other - (4) 26 2 4 (2) (26) -
Total additions - 6,343 9,258 2 56 6,665 (26) 22,298
Deductions
Construction expenses - 461 - - 3,560 - - 4,021
Operating expenses - 4,119 - - - - - 4,119
Principal payment - - 7,540 - - - - 7,540
Interest paid - - 8,191 - - - - 8,191
Accrued interest purchased on investments - - - (18) - 18 - -
Debt issue costs - - - - - - 1 1
Total deductions - 4,580 15,731 (18) 3,560 18 1 23,872
Balance at June 30, 2019 -$ 3,263$ 4,028$ 8,092$ 2$ 6,650$ -$ 22,035$
This schedule summarizes the receipts and disbursements in funds required under the Bond Indenture and has been prepared from the trust statements.
The balances in the funds consist of cash and investments at original cost. These balances do not include accrued interest receivable or unrealized gain
(loss) on investments, or $8 and $10 held in the revolving fund at June 30, 2019 and 2018, respectively.

147
Southern California Public Power Authority Apex Power Project
Supplemental Schedule of Receipts and Disbursements in Funds Required by the Bond Indenture for the Year Ended June 30, 2019
(Amounts in Thousands)
Revenue
Fund
Depository
Fund
Operating
Fund
Debt
Service
Fund
Debt
Service
Reserve
Fund
Reserve and
Contingency
Fund
General
Reserve
Project
Fund Total
Balance at June 30, 2018 -$ -$ 1,118$ 15,798$ 5,488$ 3,664$ 58$ 6,523$ 32,649$
Additions
Investment earnings 11 - 96 6 45 28 - 65 251
Discount on investment purchases - - 31 114 11 48 - 4 208
Distribution of investment earnings 380 - (128) (120) (56) (76) - - -
Receipt from participants 85,288 - - - - - - - 85,288
Distribution of revenues (85,679) - 44,520 21,832 - 19,327 - - -
Other transfers - 60,194 (42,782) 58 - (13,831) (58) (3,581) -
Other receipts - - 675 - - 33 - - 708
Total additions - 60,194 2,412 21,890 - 5,529 (58) (3,512) 86,455
Deductions
Construction expenses - 18,639 - - - - - - 18,639
Operating expenses - 41,555 - - - - - - 41,555
Payment of principal - - - 9,545 - - - - 9,545
Interest paid - - - 12,316 - - - - 12,316
Total deductions - 60,194 - 21,861 - - - - 82,055
Balance at June 30, 2019 -$ -$ 3,530$ 15,827$ 5,488$ 9,193$ -$ 3,011$ 37,049$
This schedule summarizes the receipts and disbursements in funds required under the Bond Indenture and has been prepared from the trust statements.
The balances in the funds consist of cash and investments at original cost. These balances do not include accrued interest receivable and unrealized gain
(loss) on investments, or $15 and $13 held in the revolving fund at June 30, 2019 and 2018, respectively.
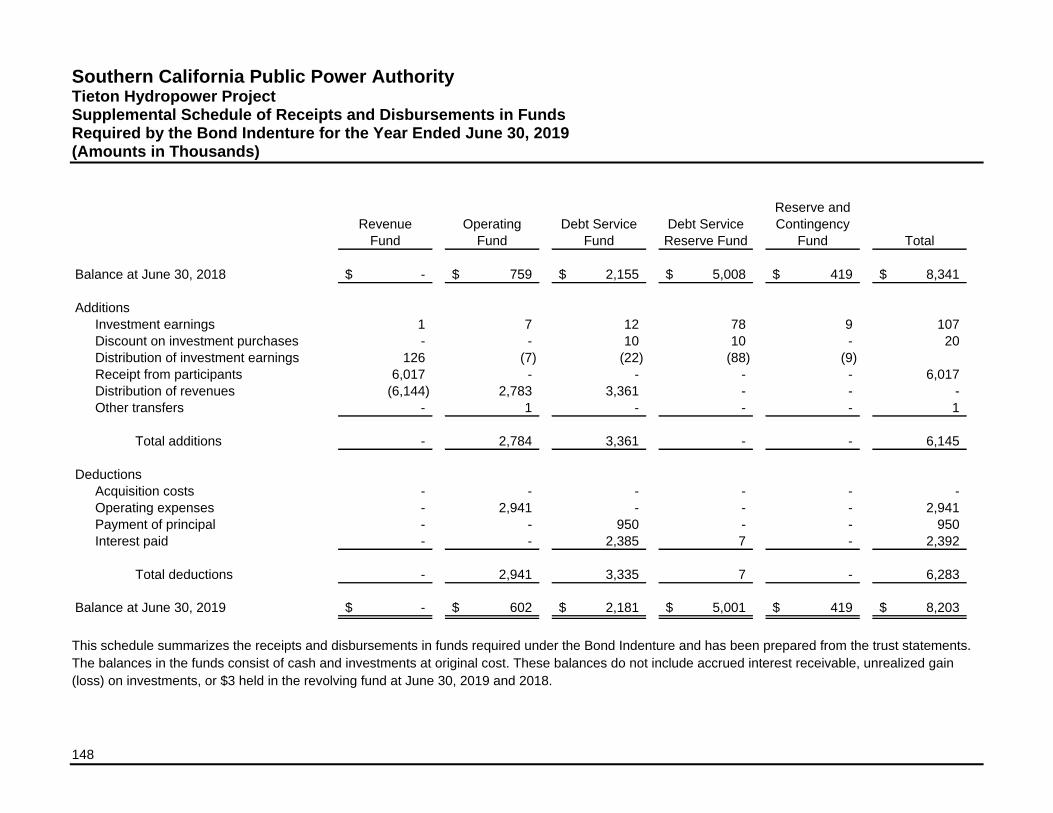
148
Southern California Public Power Authority Tieton Hydropower Project Supplemental Schedule of Receipts and Disbursements in Funds Required by the Bond Indenture for the Year Ended June 30, 2019 (Amounts in Thousands)
Revenue
Fund
Operating
Fund
Debt Service
Fund
Debt Service
Reserve Fund
Reserve and
Contingency
Fund Total
Balance at June 30, 2018 -$ 759$ 2,155$ 5,008$ 419$ 8,341$
Additions
Investment earnings 1 7 12 78 9 107
Discount on investment purchases - - 10 10 - 20
Distribution of investment earnings 126 (7) (22) (88) (9)
Receipt from participants 6,017 - - - - 6,017
Distribution of revenues (6,144) 2,783 3,361 - - -
Other transfers - 1 - - - 1
Total additions - 2,784 3,361 - - 6,145
Deductions
Acquisition costs - - - - - -
Operating expenses - 2,941 - - - 2,941
Payment of principal - - 950 - - 950
Interest paid - - 2,385 7 - 2,392
Total deductions - 2,941 3,335 7 - 6,283
Balance at June 30, 2019 -$ 602$ 2,181$ 5,001$ 419$ 8,203$
This schedule summarizes the receipts and disbursements in funds required under the Bond Indenture and has been prepared from the trust statements.
The balances in the funds consist of cash and investments at original cost. These balances do not include accrued interest receivable, unrealized gain
(loss) on investments, or $3 held in the revolving fund at June 30, 2019 and 2018.

149
Southern California Public Power Authority Milford I Wind Project
Supplemental Schedule of Receipts and Disbursements in Funds Required by the Bond Indenture for the Year Ended June 30, 2019
(Amounts in Thousands)
Revenue
Fund
Operating
Fund
Debt Service
Fund
Debt Service
Reserve
Fund
General
Reserve
Fund
Operating
Reserve
Fund Total
Balance at June 30, 2018 -$ 2,706$ 14,479$ 18,874$ 2,520$ 3,000$ 41,579$
Additions
Investment earnings 6 18 4 232 35 26 321
Discount on investments - 10 104 47 10 17 188
Distribution of investment earnings 502 (28) (107) (279) (45) (43) -
Receipt from participants 28,992 - - - - - 28,992
Distribution of revenues (29,500) 10,630 18,870 - - - -
Other transfers - 2,548 - - - (2,548) -
Total additions - 13,178 18,871 - - (2,548) 29,501
Deductions
Operating expenses - 15,877 - - - - 15,877
Payment of principal - - 10,085 - - - 10,085
Interest paid - - 8,545 - - - 8,545
Total deductions - 15,877 18,630 - - - 34,507
Balance at June 30, 2019 -$ 7$ 14,720$ 18,874$ 2,520$ 452$ 36,573$
This schedule summarizes the receipts and disbursements in funds required under the Bond Indenture and has been prepared from the trust statements.
The balances in the funds consist of cash and investments at original cost. These balances do not include accrued interest receivable, unrealized gain
(loss) on investments, or $6 and $7 held in the revolving fund at June 30, 2019 and 2018, respectively.
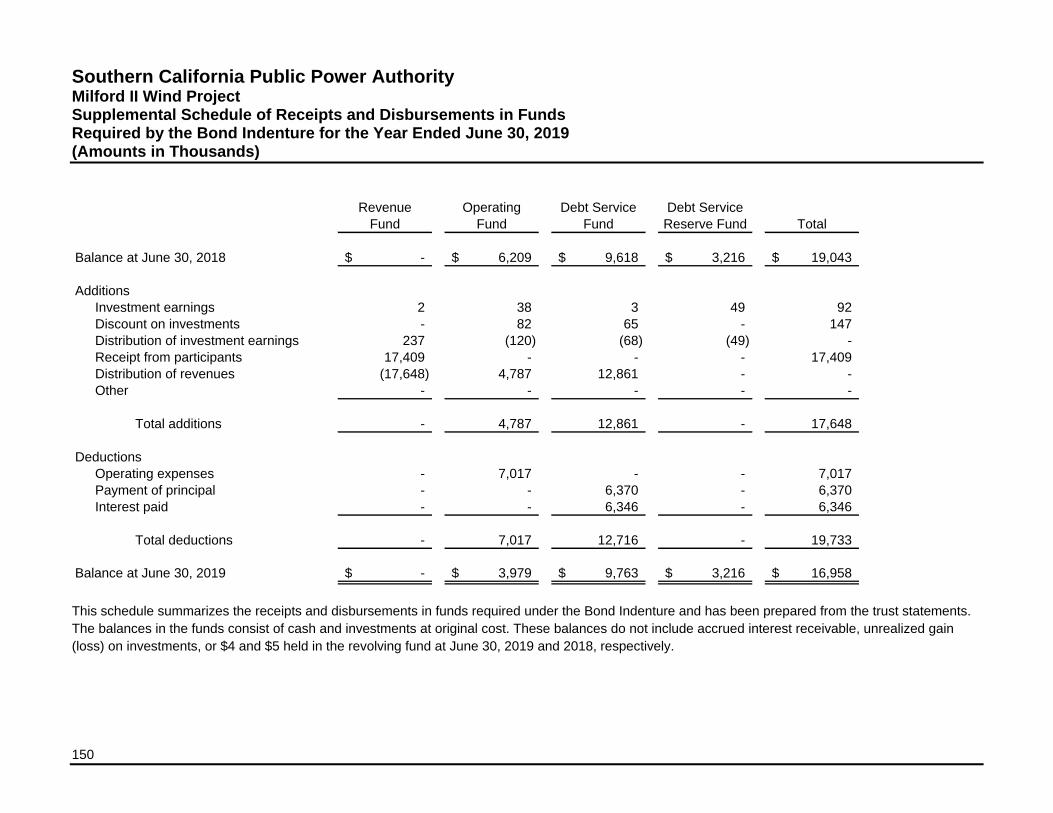
150
Southern California Public Power Authority Milford II Wind Project Supplemental Schedule of Receipts and Disbursements in Funds Required by the Bond Indenture for the Year Ended June 30, 2019 (Amounts in Thousands)
Revenue
Fund
Operating
Fund
Debt Service
Fund
Debt Service
Reserve Fund Total
Balance at June 30, 2018 -$ 6,209$ 9,618$ 3,216$ 19,043$
Additions
Investment earnings 2 38 3 49 92
Discount on investments - 82 65 - 147
Distribution of investment earnings 237 (120) (68) (49) -
Receipt from participants 17,409 - - - 17,409
Distribution of revenues (17,648) 4,787 12,861 - -
Other - - - - -
Total additions - 4,787 12,861 - 17,648
Deductions
Operating expenses - 7,017 - - 7,017
Payment of principal - - 6,370 - 6,370
Interest paid - - 6,346 - 6,346
Total deductions - 7,017 12,716 - 19,733
Balance at June 30, 2019 -$ 3,979$ 9,763$ 3,216$ 16,958$
This schedule summarizes the receipts and disbursements in funds required under the Bond Indenture and has been prepared from the trust statements.
The balances in the funds consist of cash and investments at original cost. These balances do not include accrued interest receivable, unrealized gain
(loss) on investments, or $4 and $5 held in the revolving fund at June 30, 2019 and 2018, respectively.

151
Southern California Public Power Authority Windy Point Project
Supplemental Schedule of Receipts and Disbursements in Funds Required by the Bond Indenture for the Year Ended June 30, 2019
(Amounts in Thousands)
Revenue
Fund
Operating
Fund
Debt Service
Fund
Debt Service
Reserve Fund Total
Balance at June 30, 2018 -$ 6,182$ 31,533$ 10,262$ 47,977$
Additions
Investment earnings 6 48 9 1 64
Discount on investments - 70 241 195 506
Distribution of investment earnings 564 (118) (250) (196) -
Receipt from participants 79,760 39,286 41,044 - 160,090
Distribution of revenue (80,330) - - - (80,330)
Total additions - 39,286 41,044 - 80,330
Deductions
Operating expenses - 39,634 - - 39,634
Payment of principal - - 22,020 - 22,020
Interest paid - - 18,515 - 18,515
Total deductions - 39,634 40,535 - 80,169
Balance at June 30, 2019 -$ 5,834$ 32,042$ 10,262$ 48,138$
This schedule summarizes the receipts and disbursements in funds required under the Bond Indenture and has been prepared from the trust statements.
The balances in the funds consist of cash and investments at original cost. These balances do not include accrued interest receivable, unrealized gain
(loss) on investments, or $15 and $16 held in the revolving fund at June 30, 2019 and 2018, respectively.
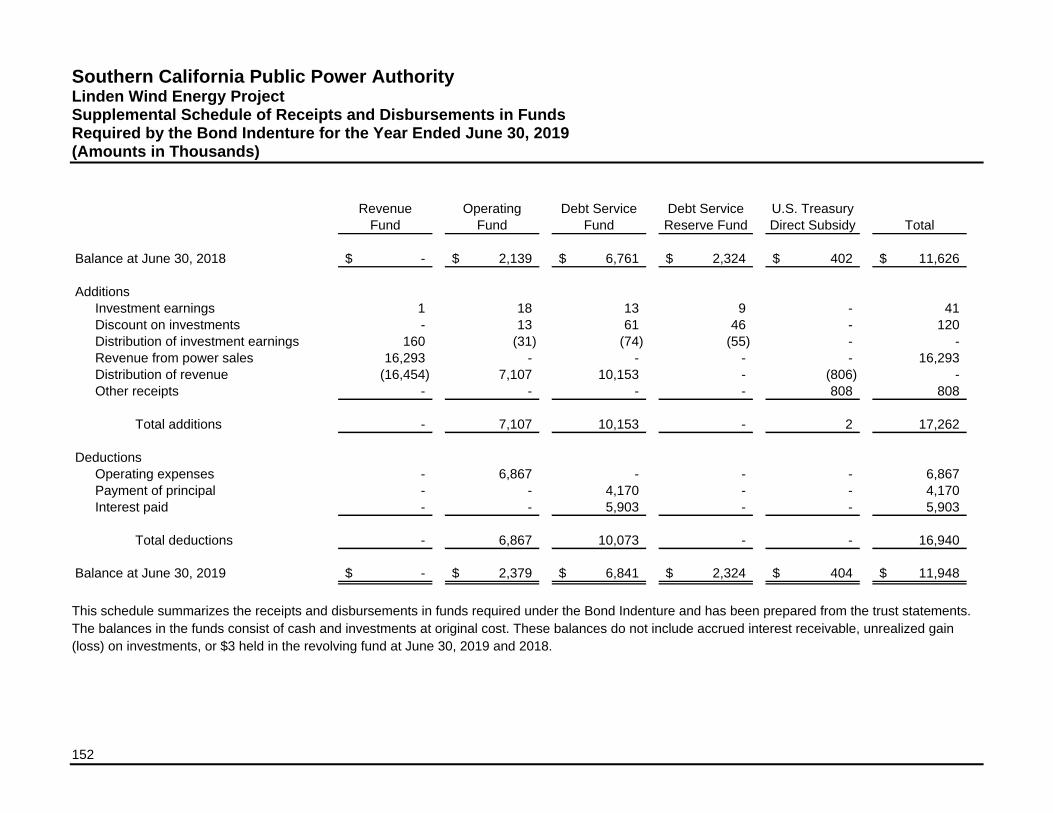
152
Southern California Public Power Authority Linden Wind Energy Project Supplemental Schedule of Receipts and Disbursements in Funds Required by the Bond Indenture for the Year Ended June 30, 2019 (Amounts in Thousands)
Revenue
Fund
Operating
Fund
Debt Service
Fund
Debt Service
Reserve Fund
U.S. Treasury
Direct Subsidy Total
Balance at June 30, 2018 -$ 2,139$ 6,761$ 2,324$ 402$ 11,626$
Additions
Investment earnings 1 18 13 9 - 41
Discount on investments - 13 61 46 - 120
Distribution of investment earnings 160 (31) (74) (55) - -
Revenue from power sales 16,293 - - - - 16,293
Distribution of revenue (16,454) 7,107 10,153 - (806) -
Other receipts - - - - 808 808
Total additions - 7,107 10,153 - 2 17,262
Deductions
Operating expenses - 6,867 - - - 6,867
Payment of principal - - 4,170 - - 4,170
Interest paid - - 5,903 - - 5,903
Total deductions - 6,867 10,073 - - 16,940
Balance at June 30, 2019 -$ 2,379$ 6,841$ 2,324$ 404$ 11,948$
This schedule summarizes the receipts and disbursements in funds required under the Bond Indenture and has been prepared from the trust statements.
The balances in the funds consist of cash and investments at original cost. These balances do not include accrued interest receivable, unrealized gain
(loss) on investments, or $3 held in the revolving fund at June 30, 2019 and 2018.

153
Southern California Public Power Authority Southern Transmission System Project
Supplemental Schedule of Receipts and Disbursements in Funds Required by the Bond Indenture for the Year Ended June 30, 2019
(Amounts in Thousands)
General
Reserve Fund Issue Fund
Operating
Fund
Revenue
Fund Escrow Fund Total
Balance at June 30, 2018 3,243$ 82,175$ 4,487$ -$ -$ 89,905$
Additions
Investment earnings 56 737 66 24 - 883
Discount on investment purchases 4 535 71 - - 610
Distribution of investment earnings (60) (1,272) (137) 1,469 - -
Revenue from transmission sales - - - 106,113 - 106,113
Distribution of revenue - 60,956 46,650 (107,606) - -
Bond proceeds 2018A - 541 - - 52,670 53,211
Other - (931) 27 - 904 -
Total additions - 60,566 46,677 - 53,574 160,817
Deductions
Operating expenses - - 40,505 - - 40,505
Payment of principal - 56,100 - - - 56,100
Interest paid - 20,755 - - - 20,755
Debt issuance costs - 528 - - - 528
Premium and interest on investment purchases (2) - - - - (2)
2008A Bond redemption - escrow - - - - 44,461 44,461
2009A Bond redemption - escrow - - - - 9,113 9,113
Total deductions (2) 77,383 40,505 - 53,574 171,460
Balance at June 30, 2019 3,245$ 65,358$ 10,659$ -$ -$ 79,262$
This schedule summarizes the receipts and disbursements in funds required under the Bond Indenture and has been prepared from the trust statements.
The balances in the funds consist of cash and investments at original cost. These balances do not include accrued interest receivable, unrealized gain
(loss) on investments, or $31 and $36 held in the revolving fund at June 30, 2019 and 2018, respectively.
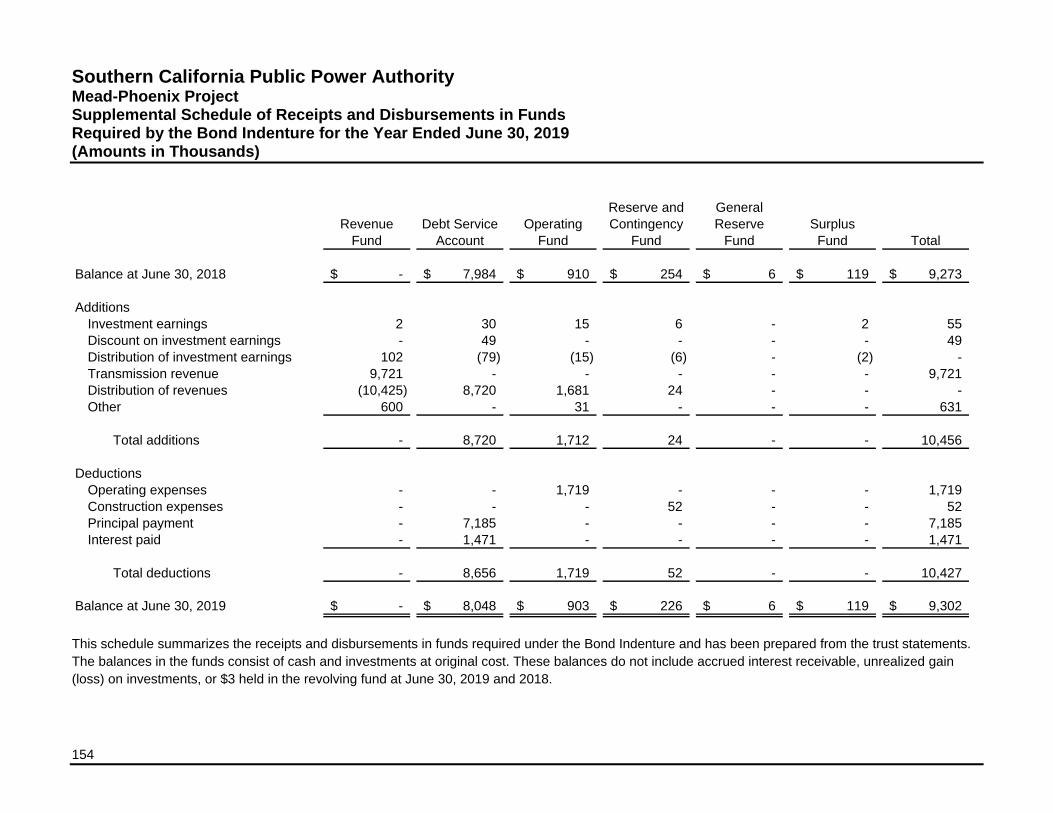
154
Southern California Public Power Authority Mead-Phoenix Project Supplemental Schedule of Receipts and Disbursements in Funds Required by the Bond Indenture for the Year Ended June 30, 2019 (Amounts in Thousands)
Revenue
Fund
Debt Service
Account
Operating
Fund
Reserve and
Contingency
Fund
General
Reserve
Fund
Surplus
Fund Total
Balance at June 30, 2018 -$ 7,984$ 910$ 254$ 6$ 119$ 9,273$
Additions
Investment earnings 2 30 15 6 - 2 55
Discount on investment earnings - 49 - - - - 49
Distribution of investment earnings 102 (79) (15) (6) - (2) -
Transmission revenue 9,721 - - - - - 9,721
Distribution of revenues (10,425) 8,720 1,681 24 - - -
Other 600 - 31 - - - 631
Total additions - 8,720 1,712 24 - - 10,456
Deductions
Operating expenses - - 1,719 - - - 1,719
Construction expenses - - - 52 - - 52
Principal payment - 7,185 - - - - 7,185
Interest paid - 1,471 - - - - 1,471
Total deductions - 8,656 1,719 52 - - 10,427
Balance at June 30, 2019 -$ 8,048$ 903$ 226$ 6$ 119$ 9,302$
This schedule summarizes the receipts and disbursements in funds required under the Bond Indenture and has been prepared from the trust statements.
The balances in the funds consist of cash and investments at original cost. These balances do not include accrued interest receivable, unrealized gain
(loss) on investments, or $3 held in the revolving fund at June 30, 2019 and 2018.

155
Southern California Public Power Authority Mead-Adelanto Project
Supplemental Schedule of Receipts and Disbursements in Funds Required by the Bond Indenture for the Year Ended June 30, 2019
(Amounts in Thousands)
Revenue
Fund
Debt Service
Account
Operating
Fund
Reserve and
Contingency
General
Reserve
Surplus
Fund Total
Balance at June 30, 2018 -$ 22,647$ 952$ 509$ 13$ 5,936$ 30,057$
Additions
Investment earnings 7 29 12 9 - 70 127
Discount on investment earnings - 178 - - - 60 238
Distribution of investment earnings 358 (207) (12) (9) - (130) -
Transmission revenue 28,674 - - - - - 28,674
Distribution of revenues (29,214) 24,416 5,442 (365) - (279) -
Other receipts 200 - - - - 7 207
Other transfers (25) 25 - - - - -
Total additions - 24,441 5,442 (365) - (272) 29,246
Deductions
Construction expenses - - - 117 - - 117
Operating expenses - - 5,588 - - - 5,588
Principal payment - 20,705 - - - - 20,705
Interest paid - 3,280 - - - - 3,280
Accrued interest on investment purchase - - - - - - -
Total deductions - 23,985 5,588 117 - - 29,690
Balance at June 30, 2019 -$ 23,103$ 806$ 27$ 13$ 5,664$ 29,613$
This schedule summarizes the receipts and disbursements in funds required under the Bond Indenture and has been prepared from the trust statements.
The balances in the funds consist of cash and investments at original cost. These balances do not include accrued interest receivable, unrealized gain
(loss) on investments, or $11 and $10 held in the revolving fund at June 30, 2019 and 2018, respectively.

156
Southern California Public Power Authority Pinedale Project Supplemental Schedule of Receipts and Disbursements in Funds Required by the Bond Indenture for the Year Ended June 30, 2019 (Amounts in Thousands)
Revenue
Fund
Operating
Fund
Debt Service
Fund
General
Reserve
Fund
Project
Fund
Capital
Fund Total
Balance at June 30, 2018 -$ 6,972$ 2,297$ 39$ 1,685$ 676$ 11,669$
Additions
Investment earnings 1 88 19 1 36 10 155
Discount on investment purchases - 28 - - - - 28
Distribution of investment earnings 19 - (19) - - - -
Receipt from participants 2,877 2,054 - - - - 4,931
Sales of natural gas 381 4,019 - - - - 4,400
Distribution of revenues (3,280) 917 2,580 - - (217) -
Other receipts 2 16 - - - - 18
Other transfer - - - - (21) 21 -
Total additions - 7,122 2,580 1 15 (186) 9,532
Deductions
Construction expenses - - - - - 218 218
Operating expenses - 9,380 - - - - 9,380
Payment of principal - - 1,770 - - - 1,770
Interest paid - - 1,003 - - - 1,003
Total deductions - 9,380 2,773 - - 218 12,371
Balance at June 30, 2019 -$ 4,714$ 2,104$ 40$ 1,700$ 272$ 8,830$
This schedule summarizes the receipts and disbursements in funds required under the Bond Indenture and has been prepared from the trust statements.
The balances in the funds consist of cash and investments at original cost. These balances do not include accrued interest receivable, unrealized gain
(loss) on investments, or $2 held in the revolving fund at June 30, 2019 and 2018.

157
Southern California Public Power Authority Barnett Project
Supplemental Schedule of Receipts and Disbursements in Funds Required by the Bond Indenture for the Year Ended June 30, 2019
(Amounts in Thousands)
Revenue
Fund
Operating
Fund
Debt Service
Fund
General
Reserve
Fund
Project
Fund
Capital
Fund Total
Balance at June 30, 2018 -$ 2,475$ 5,387$ 23$ 34,276$ 680$ 42,841$
Additions
Investment earnings 2 54 30 - 111 14 211
Discount on investment purchases - 4 21 - 590 - 615
Distribution of investment earnings 51 - (51) - - - -
Receipt from participants 6,627 98 - - - - 6,725
Sales of natural gas 2,034 579 - - - - 2,613
Distribution of revenues (8,714) 2,655 6,059 - (80) 80 -
Total additions - 3,390 6,059 - 621 94 10,164
Deductions
Construction expenses - - - - - 97 97
Operating expenses - 2,773 - - 39 - 2,812
Payment of principal - - 4,150 - - - 4,150
Interest paid - - 2,357 - - - 2,357
Total deductions - 2,773 6,507 - 39 97 9,416
Balance at June 30, 2019 -$ 3,092$ 4,939$ 23$ 34,858$ 677$ 43,589$
This schedule summarizes the receipts and disbursements in funds required under the Bond Indenture and has been prepared from the trust statements.
The balances in the funds consist of cash and investments at original cost. These balances do not include accrued interest receivable, unrealized gain
(loss) on investments, or $3 held in the revolving fund at June 30, 2019 and 2018.

158
Southern California Public Power Authority Prepaid Natural Gas Project No. 1 Supplemental Schedule of Receipts and Disbursements in Funds Required by the Bond Indenture for the Year Ended June 30, 2019 (Amounts in Thousands)
Revenue
Fund
Operating
Fund
Debt Service
Fund Total
Balance at June 30, 2018 -$ 13,155$ 3,923$ 17,078$
Additions
Investment earnings 6 565 231 802
Distribution of investment earnings 489 (489) - -
Receipt from gas sales 15,874 - - 15,874
Distribution of revenues (23,310) 2,626 20,684 -
Commodity swap settlement 6,941 - 1,130 8,071
Other receipts - - - -
Total additions - 2,702 22,045 24,747
Deductions
A & G expenses - 2,583 - 2,583
Payment of principal - - 5,385 5,385
Payment of interest - - 16,109 16,109
Total deductions - 2,583 21,494 24,077
Balance at June 30, 2019 -$ 13,274$ 4,474$ 17,748$
This schedule summarizes the receipts and disbursements in funds required under the Bond Indenture and has been prepared from the trust statements.
The balances in the funds consist of cash and investments at original cost. These balances do not include accrued interest receivable, unrealized gain
(loss) on investments, or $4 and $3 held in the revolving fund at June 30, 2019 and 2018, respectively.


![Untitled-2 [] · FS 78 FS 68 , FOCUS ÉkJ ËFOCUS FS 78 FS 68 FS 68 , , , FS 68 Foundation FS 68 , FS 68 68 fi , FOCUS F-s 688 , , 68 , 688 FOCUS FS , FS 68 , , , 688 ,](https://img.pdfslide.us/doc/110x75/5b75f9b67f8b9a3b7e8b5e04/untitled-2-fs-78-fs-68-focus-ekj-efocus-fs-78-fs-68-fs-68-fs-68.jpg)