Embed Size (px)
Citation preview

Southeast Florida Regional Climate Compact Regional Greenhouse Gas Emissions Inventory Baseline Period: 2005 - 2009
Produced by the Regional Compact GHG Inventory Working Group
November 2011
Credits and Acknowledgements The Regional Compact GHG Team Alicia Betancourt, Monroe County Derek Bradchulis, Miami-Dade County Donald Burgess, Broward County Maribel Feliciano, Broward County Mark Finn, Palm Beach County Bonnie Finneran, Palm Beach County Nancy Gassman,PhD, Broward County Patricia Gomez-Acevedo, Miami-Dade County Nichole Hefty, Miami-Dade County Rowan Hughes, Palm Beach County with assistance from: Steve Adams, Institute for Sustainable Communities
Other Credits and Acknowledgements Assistance from ICLEI – Local Governments for Sustainability in use of the CCAP 2009 tool, the final inventory report template, and advice and encouragement along the way – special thanks to Missy Stults and Cyrus Bhedwar Cover Photo “Miami River Entrance at Night” by Emilio Labrador – used under Creative Commons Attribution Generic 2.0
© 2011 ICLEI-Local Governments for Sustainability USA. All Rights Reserved.
Table of Contents Table of Contents ................................................................................................ 3
Executive Summary ............................................................................................ 4
Introduction ......................................................................................................... 6
Inventory Methodology ....................................................................................... 8
Quantifying Greenhouse Gas Emissions ............................................................................. 8
Establishing a Base Year ...................................................................................................................................... 8
Establishing Boundaries ....................................................................................................................................... 8
Emission Types .................................................................................................................................................... 9
Quantification Methods ......................................................................................................................................... 9
Clean Air and Climate Protection 2009 (CACP 2009) Software .......................................................................... 10
Evaluating Greenhouse Gas Emissions ............................................................................ 10
Greenhouse Gas Emissions by Scope ............................................................................................................... 10
Greenhouse Gas Emissions by Sector ............................................................................................................... 11
Inventory Results .............................................................................................. 12
Greenhouse Gas Emissions by Sector and County.......................................................... 12
Residential, Commercial and Industrial Sectors.................................................................................................. 15
Transportation Sector ......................................................................................................................................... 16
Regional Emissions ............................................................................................................................................ 17
Toward a Regional Emissions Baseline ............................................................................. 17
Appendices ........................................................................................................ 18
Appendix A - Regional Greenhouse Gas Emissions 2005 - 2009 .................................... 19
Southeast Florida Regional Climate Compact – Regional GHG Emissions Inventory Page 4
Executive Summary
In October 2009, Broward, Miami-Dade, Monroe and Palm Beach Counties announced the creation of the Southeast
Florida Regional Climate Change Compact with mutual commitments to coordinate their respective energy and climate
public policy positions, work together to create a Regional Climate Action Plan and to meet annually in Regional
Climate Summits to mark progress. One specific commitment of the Compact Counties - the development of a
Regional Greenhouse Gas Emissions (GHG) Inventory - is completed with the publication of this document. This
report highlights the findings of the GHG emissions inventory and provides an emissions baseline against which future
progress in reducing emissions across Southeast Florida can be measured.
The formation of the Regional Climate Compact occurred in the immediate aftermath of the Great Recession of 2008-
2009, presenting a challenge in establishing a baseline year for regional emissions for Southeast Florida. This analysis
presents emissions data from the period 2005 – 2009, a period that includes two years of robust economic activity and
three years of recessionary and modest recovery activity from which an average annual emissions profile can be
obtained. Data collection focused on four main areas of regional emissions: Residential, Commercial, Industrial and
Transportation.
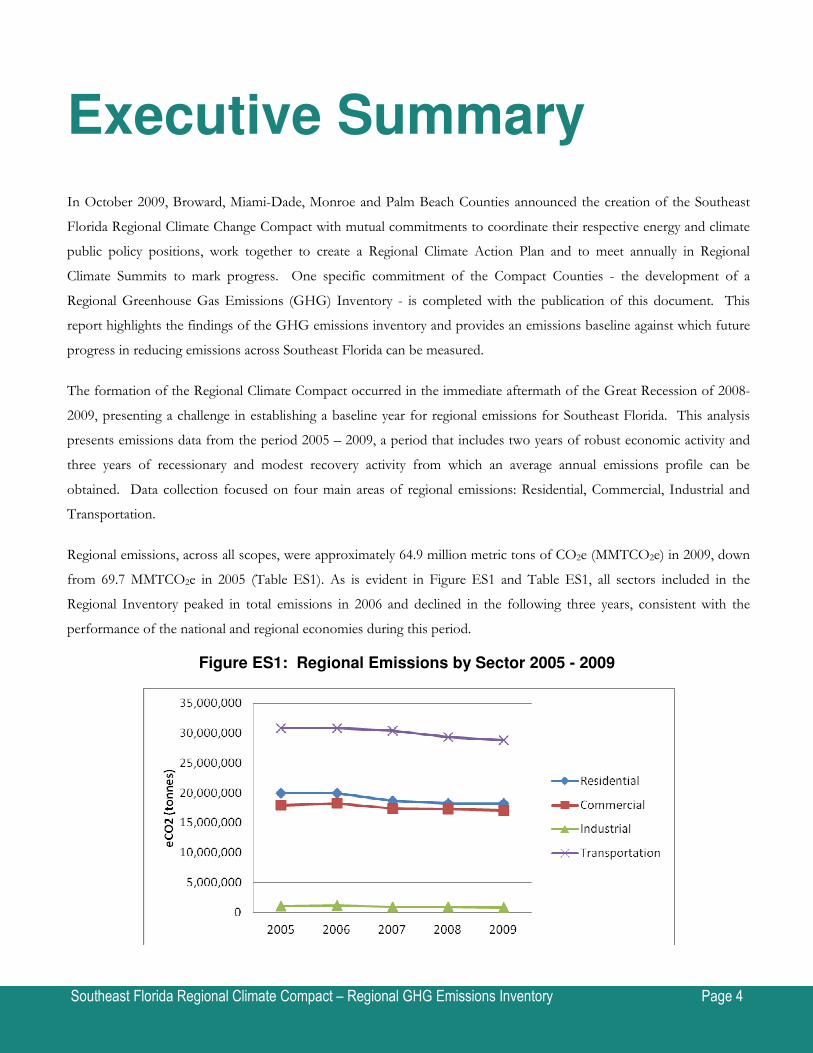
Regional emissions, across all scopes, were approximately 64.9 million metric tons of CO2e (MMTCO2e) in 2009, down
from 69.7 MMTCO2e in 2005 (Table ES1). As is evident in Figure ES1 and Table ES1, all sectors included in the
Regional Inventory peaked in total emissions in 2006 and declined in the following three years, consistent with the
performance of the national and regional economies during this period.
Figure ES1: Regional Emissions by Sector 2005 - 2009
Southeast Florida Regional Climate Compact – Regional GHG Emissions Inventory Page 5
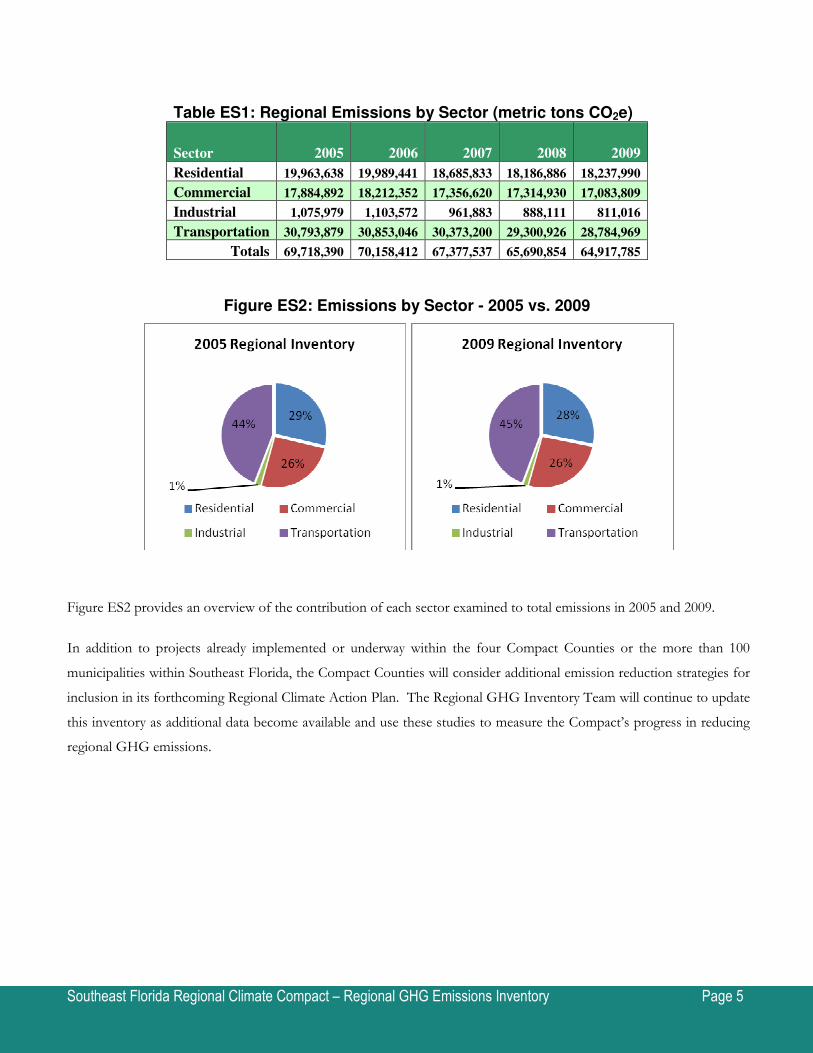
Table ES1: Regional Emissions by Sector (metric tons CO2e)
Sector 2005 2006 2007 2008 2009
Residential 19,963,638 19,989,441 18,685,833 18,186,886 18,237,990
Commercial 17,884,892 18,212,352 17,356,620 17,314,930 17,083,809
Industrial 1,075,979 1,103,572 961,883 888,111 811,016
Transportation 30,793,879 30,853,046 30,373,200 29,300,926 28,784,969
Totals 69,718,390 70,158,412 67,377,537 65,690,854 64,917,785
Figure ES2: Emissions by Sector - 2005 vs. 2009
Figure ES2 provides an overview of the contribution of each sector examined to total emissions in 2005 and 2009.
In addition to projects already implemented or underway within the four Compact Counties or the more than 100
municipalities within Southeast Florida, the Compact Counties will consider additional emission reduction strategies for
inclusion in its forthcoming Regional Climate Action Plan. The Regional GHG Inventory Team will continue to update
this inventory as additional data become available and use these studies to measure the Compact’s progress in reducing
regional GHG emissions.
Southeast Florida Regional Climate Compact – Regional GHG Emissions Inventory Page 6
Introduction
The parties to the Southeast Florida Regional Climate Change Compact [Broward, Miami-Dade, Monroe and Palm
Beach Counties] recognize that greenhouse gas (GHG) emissions from human activity are catalyzing profound changes
in climate and weather, the consequences of which pose substantial risks to the future health, wellbeing, and prosperity
of the planet. In response, the Compact Counties have taken action to understand the sources of these emissions across
the Southeast Florida region through the completion of a GHG emissions inventory. The results of that study are
included in this report. By acting quickly to reduce GHG emissions, Southeast Florida stands to benefit by reducing the
impacts of climate change. The detailed findings of this report provide a profile of emissions sources across the region,
information that is key to guiding local reduction efforts. This inventory is also useful in establishing a benchmark or
emissions baseline Compact Counties can later use to evaluate efforts by comparing GHG emission levels over time.
The Southeast Florida Regional Climate Change Compact was announced at the First Regional Climate Leadership
Summit in October 2009 in Fort Lauderdale. Commissioners representing Broward, Miami-Dade, Monroe and Palm
Beach Counties announced their intention of sponsoring the draft Regional Compact before their respective County
Commissions. By January 2010, each of the four Boards of County Commissioners had adopted the Compact, bringing
the core commitments of the Compact into force. The Compact commitments include:
• Development of joint federal and state policy positions on climate related issues, which includes:
o recognizing the unique vulnerabilities of Southeast Florida to the impacts of climate change,
o allocating funding based on vulnerability,
o supporting enhanced levels of participation in regional adaptation projects,
o supporting energy and climate security and a renewable energy portfolio standard for the State.
• Development of a Southeast Florida Regional Climate Change Action Plan, which includes:
o conducting a regional greenhouse gas emissions inventory (with a particular focus on emissions from
inter‐county travel and commerce);
o developing regional climate impacts planning scenarios incorporating sea‐level rise and other potential
impacts;
o developing climate mitigation and adaptation measures for each of the three sectors included in the
compact: land use, regional transport, and the built environment.
• Annual participation in regional summits to mark progress.
Southeast Florida Regional Climate Compact – Regional GHG Emissions Inventory Page 7
The primary purpose of the Regional Compact is to enable the four Counties of Southeast Florida to work collectively,
efficiently and effectively with each other as well as with state and federal agencies to reduce GHG emissions and to
regionally address key vulnerabilities to the impacts of climatic change over the coming decades. In developing the
Regional Compact, the Counties recognized the scope of effort was appropriately regional in nature – Compact activities
are meant to augment rather than supersede the sustainability and climate initiatives of the four Compact Counties or
the many municipal initiatives underway among the 108 municipalities within the Compact region. It should be noted
that three of the four Compact Counties have completed county-level emissions inventories to date and that all four are
actively implementing previously developed Climate Action Plans or related programs funded in whole or in part by the
Energy Efficiency & Conservation Block Grant via the American Recovery & Reinvestment Act of 2009.
Presented here are estimates of greenhouse gas emissions resulting from select activities within Southeast Florida during
the five-year baseline period 2005 - 2009. While established GHG inventory protocols were used in compiling this
regional inventory, it is by design focused only on the sectors of greatest interest to the Regional Compact and the
Regional Climate Action Plan. Omitted here are emissions data from government operations including water
infrastructure, waste management among other sectors. While this resulting inventory is incomplete by accepted
inventory standards, it serves its primary utility by providing emissions data for the sectors of greatest concern and
highest potential for coordinated regional action.

Southeast Florida Regional Climate Compact – Regional GHG Emissions Inventory Page 8
Inventory Methodology
Quantifying Greenhouse Gas Emissions
The first step toward achieving tangible greenhouse gas emission reductions requires identifying baseline levels and
sources of emissions in the community. As local governments have continued efforts to reduce emissions, the need for
a standardized approach to quantify GHG emissions has proven essential. Standard processes of accounting for
emissions have been developed to which this inventory adheres. The Regional Compact’s GHG Inventory Team used
the International Local Government GHG Emissions Analysis Protocol (IEAP) to inventory emissions across the four
counties of Southeast Florida.
Establishing a Base Year
A primary aspect of the GHG emissions inventory process is the need to select a base year with which to compare
future emissions over time. The formation of the Regional Compact occurred at a moment of economic dislocation
unprecedented in the nation’s post-World War II experience. Given that the existing County-level inventories used
differing baseline years (2005, 2007 and 2008) and further, that significant state and federal energy policy changes and
grants to local governments will alter future emissions trajectories, the Compact Staff Steering Committee directed the
Regional GHG Team to obtain five years of emissions data from the period 2005 – 2009 from which to derive an
emissions baseline for the Regional Compact. The five-year period includes two years of robust economic activity and
three years of recessionary and modest recovery activity (the region was among the first to experience the effects of the
2007-2008 recession) from which an average annual emissions profile can be obtained. After considering the amount
and types of data available for each of several recent years, this greenhouse gas emissions inventory utilizes a five-year
average of emissions from 2005 - 2009 as the base year.
Establishing Boundaries
Setting an organizational boundary for greenhouse gas emissions accounting and reporting is an important step in the
inventory process. The Southeast Florida Regional Climate Compact community inventory assesses emissions resulting
from activities taking place within the geopolitical boundaries of Broward, Miami-Dade, Monroe and Palm Beach
Counties and includes the municipalities therein. The IEAP defines geopolitical boundary as that “consisting of the
physical area or region over which the local government has jurisdictional authority.” Activities that occur within this
boundary can be, for the most part, controlled or influenced by each county’s policies and educational programs.
Although the Compact Counties may have limited influence over the level of emissions from some activities, it is
important that every effort be made to compile a complete analysis of all activities that result in greenhouse gas
emissions.
Southeast Florida Regional Climate Compact – Regional GHG Emissions Inventory Page 9
Emission Types
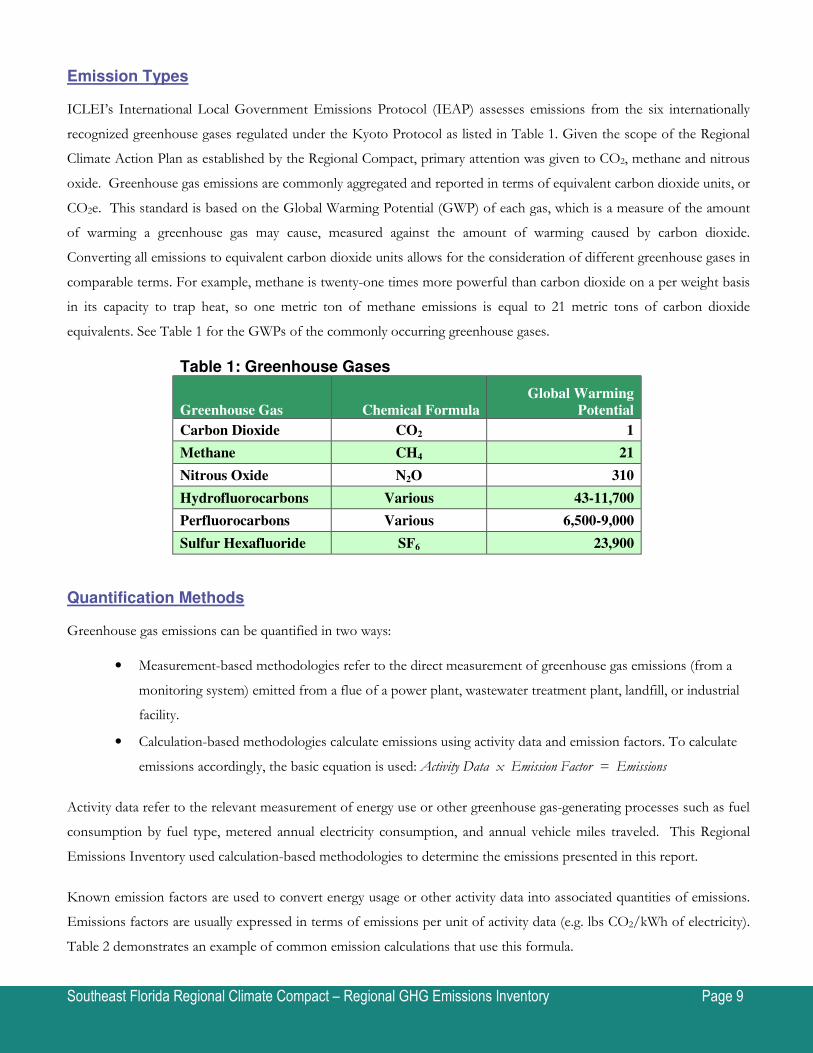
ICLEI’s International Local Government Emissions Protocol (IEAP) assesses emissions from the six internationally
recognized greenhouse gases regulated under the Kyoto Protocol as listed in Table 1. Given the scope of the Regional
Climate Action Plan as established by the Regional Compact, primary attention was given to CO2, methane and nitrous
oxide. Greenhouse gas emissions are commonly aggregated and reported in terms of equivalent carbon dioxide units, or
CO2e. This standard is based on the Global Warming Potential (GWP) of each gas, which is a measure of the amount
of warming a greenhouse gas may cause, measured against the amount of warming caused by carbon dioxide.
Converting all emissions to equivalent carbon dioxide units allows for the consideration of different greenhouse gases in
comparable terms. For example, methane is twenty-one times more powerful than carbon dioxide on a per weight basis
in its capacity to trap heat, so one metric ton of methane emissions is equal to 21 metric tons of carbon dioxide
equivalents. See Table 1 for the GWPs of the commonly occurring greenhouse gases.
Table 1: Greenhouse Gases
Greenhouse Gas Chemical Formula
Global Warming
Potential
Carbon Dioxide CO2 1
Methane CH4 21
Nitrous Oxide N2O 310
Hydrofluorocarbons Various 43-11,700
Perfluorocarbons Various 6,500-9,000
Sulfur Hexafluoride SF6 23,900
Quantification Methods
Greenhouse gas emissions can be quantified in two ways:
• Measurement-based methodologies refer to the direct measurement of greenhouse gas emissions (from a
monitoring system) emitted from a flue of a power plant, wastewater treatment plant, landfill, or industrial
facility.
• Calculation-based methodologies calculate emissions using activity data and emission factors. To calculate
emissions accordingly, the basic equation is used: Activity Data x Emission Factor = Emissions
Activity data refer to the relevant measurement of energy use or other greenhouse gas-generating processes such as fuel
consumption by fuel type, metered annual electricity consumption, and annual vehicle miles traveled. This Regional
Emissions Inventory used calculation-based methodologies to determine the emissions presented in this report.
Known emission factors are used to convert energy usage or other activity data into associated quantities of emissions.
Emissions factors are usually expressed in terms of emissions per unit of activity data (e.g. lbs CO2/kWh of electricity).
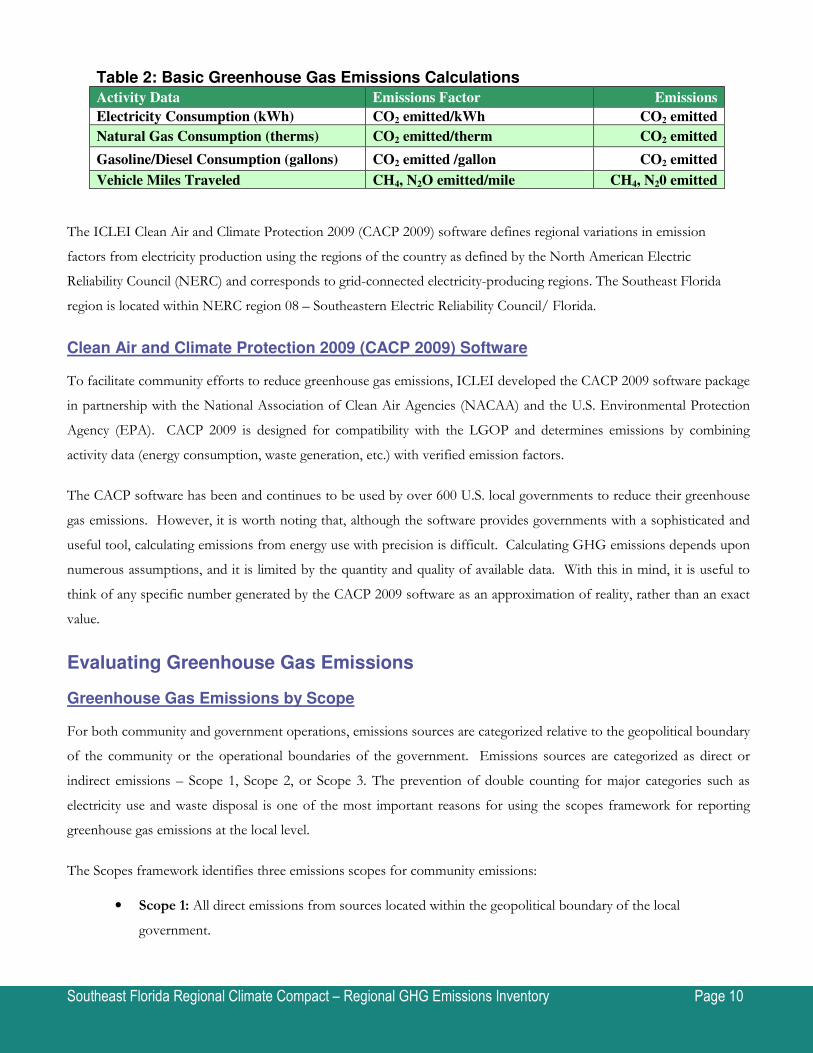
Table 2 demonstrates an example of common emission calculations that use this formula.
Southeast Florida Regional Climate Compact – Regional GHG Emissions Inventory Page 10
Table 2: Basic Greenhouse Gas Emissions Calculations
Activity Data Emissions Factor Emissions
Electricity Consumption (kWh) CO2 emitted/kWh CO2 emitted
Natural Gas Consumption (therms) CO2 emitted/therm CO2 emitted
Gasoline/Diesel Consumption (gallons) CO2 emitted /gallon CO2 emitted
Vehicle Miles Traveled CH4, N2O emitted/mile CH4, N20 emitted
The ICLEI Clean Air and Climate Protection 2009 (CACP 2009) software defines regional variations in emission
factors from electricity production using the regions of the country as defined by the North American Electric
Reliability Council (NERC) and corresponds to grid-connected electricity-producing regions. The Southeast Florida
region is located within NERC region 08 – Southeastern Electric Reliability Council/ Florida.
Clean Air and Climate Protection 2009 (CACP 2009) Software
To facilitate community efforts to reduce greenhouse gas emissions, ICLEI developed the CACP 2009 software package
in partnership with the National Association of Clean Air Agencies (NACAA) and the U.S. Environmental Protection
Agency (EPA). CACP 2009 is designed for compatibility with the LGOP and determines emissions by combining
activity data (energy consumption, waste generation, etc.) with verified emission factors.
The CACP software has been and continues to be used by over 600 U.S. local governments to reduce their greenhouse
gas emissions. However, it is worth noting that, although the software provides governments with a sophisticated and
useful tool, calculating emissions from energy use with precision is difficult. Calculating GHG emissions depends upon
numerous assumptions, and it is limited by the quantity and quality of available data. With this in mind, it is useful to
think of any specific number generated by the CACP 2009 software as an approximation of reality, rather than an exact
value.
Evaluating Greenhouse Gas Emissions
Greenhouse Gas Emissions by Scope
For both community and government operations, emissions sources are categorized relative to the geopolitical boundary
of the community or the operational boundaries of the government. Emissions sources are categorized as direct or
indirect emissions – Scope 1, Scope 2, or Scope 3. The prevention of double counting for major categories such as
electricity use and waste disposal is one of the most important reasons for using the scopes framework for reporting
greenhouse gas emissions at the local level.
The Scopes framework identifies three emissions scopes for community emissions:
• Scope 1: All direct emissions from sources located within the geopolitical boundary of the local
government.
Southeast Florida Regional Climate Compact – Regional GHG Emissions Inventory Page 11
• Scope 2: Indirect emissions associated with the consumption of purchased or acquired electricity, steam,
heating, and cooling. Scope 2 emissions occur as a result of activities that take place within the geopolitical
boundary of the local government, but that rely upon emissions-producing processes located outside of the
government’s jurisdiction.
• Scope 3: All other indirect or embodied emissions not covered in Scope 2 that occur as a result of activity
within the geopolitical boundary.
Scope 1 and Scope 2 sources are the most essential components of a community greenhouse gas analysis as these
sources are typically the most significant in scale, and are most easily affected by local policy making. This Regional
Inventory utilizes only Scope 1 and Scope 2 data.
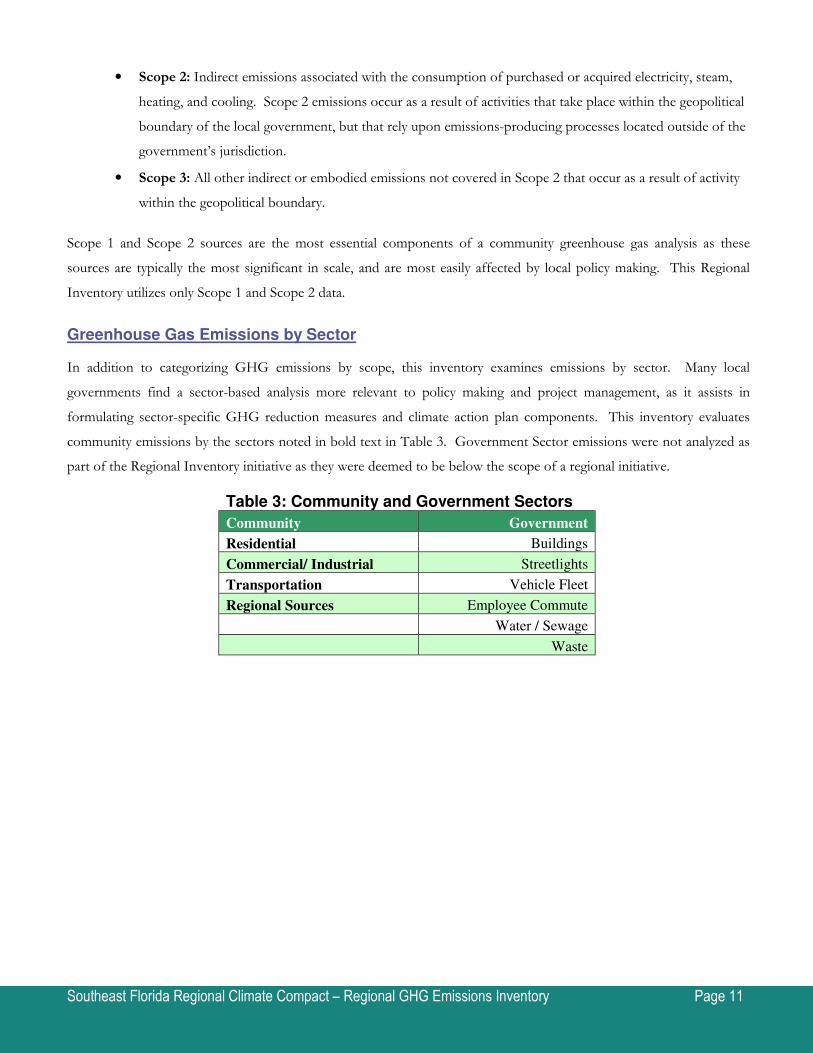
Greenhouse Gas Emissions by Sector
In addition to categorizing GHG emissions by scope, this inventory examines emissions by sector. Many local
governments find a sector-based analysis more relevant to policy making and project management, as it assists in
formulating sector-specific GHG reduction measures and climate action plan components. This inventory evaluates
community emissions by the sectors noted in bold text in Table 3. Government Sector emissions were not analyzed as
part of the Regional Inventory initiative as they were deemed to be below the scope of a regional initiative.
Table 3: Community and Government Sectors
Community Government
Residential Buildings
Commercial/ Industrial Streetlights
Transportation Vehicle Fleet
Regional Sources Employee Commute
Water / Sewage
Waste
Southeast Florida Regional Climate Compact – Regional GHG Emissions Inventory Page 12
Inventory Results
Greenhouse Gas Emissions by Sector and County
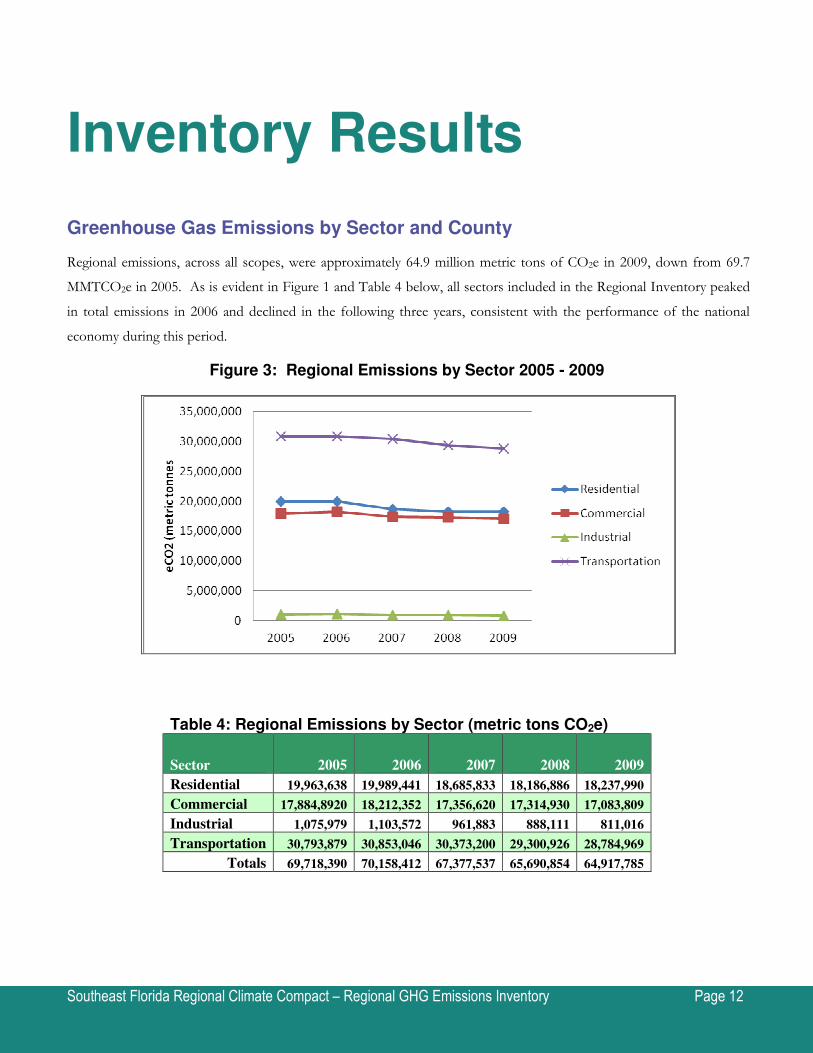
Regional emissions, across all scopes, were approximately 64.9 million metric tons of CO2e in 2009, down from 69.7
MMTCO2e in 2005. As is evident in Figure 1 and Table 4 below, all sectors included in the Regional Inventory peaked
in total emissions in 2006 and declined in the following three years, consistent with the performance of the national
economy during this period.
Figure 3: Regional Emissions by Sector 2005 - 2009
Table 4: Regional Emissions by Sector (metric tons CO2e)
Sector 2005 2006 2007 2008 2009
Residential 19,963,638 19,989,441 18,685,833 18,186,886 18,237,990
Commercial 17,884,8920 18,212,352 17,356,620 17,314,930 17,083,809
Industrial 1,075,979 1,103,572 961,883 888,111 811,016
Transportation 30,793,879 30,853,046 30,373,200 29,300,926 28,784,969
Totals 69,718,390 70,158,412 67,377,537 65,690,854 64,917,785
Southeast Florida Regional Climate Compact – Regional GHG Emissions Inventory Page 13
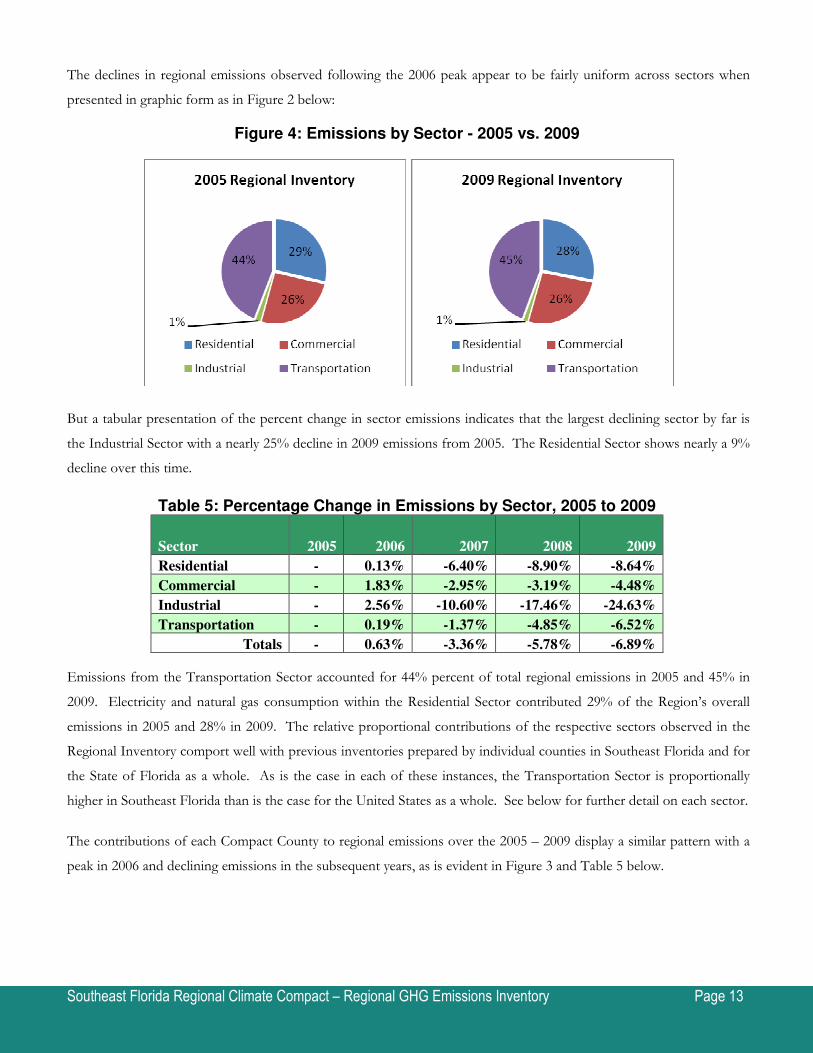
The declines in regional emissions observed following the 2006 peak appear to be fairly uniform across sectors when
presented in graphic form as in Figure 2 below:
Figure 4: Emissions by Sector - 2005 vs. 2009
But a tabular presentation of the percent change in sector emissions indicates that the largest declining sector by far is
the Industrial Sector with a nearly 25% decline in 2009 emissions from 2005. The Residential Sector shows nearly a 9%
decline over this time.
Table 5: Percentage Change in Emissions by Sector, 2005 to 2009
Sector 2005 2006 2007 2008 2009
Residential - 0.13% -6.40% -8.90% -8.64%
Commercial - 1.83% -2.95% -3.19% -4.48%
Industrial - 2.56% -10.60% -17.46% -24.63%
Transportation - 0.19% -1.37% -4.85% -6.52%
Totals - 0.63% -3.36% -5.78% -6.89%
Emissions from the Transportation Sector accounted for 44% percent of total regional emissions in 2005 and 45% in
2009. Electricity and natural gas consumption within the Residential Sector contributed 29% of the Region’s overall
emissions in 2005 and 28% in 2009. The relative proportional contributions of the respective sectors observed in the
Regional Inventory comport well with previous inventories prepared by individual counties in Southeast Florida and for
the State of Florida as a whole. As is the case in each of these instances, the Transportation Sector is proportionally
higher in Southeast Florida than is the case for the United States as a whole. See below for further detail on each sector.
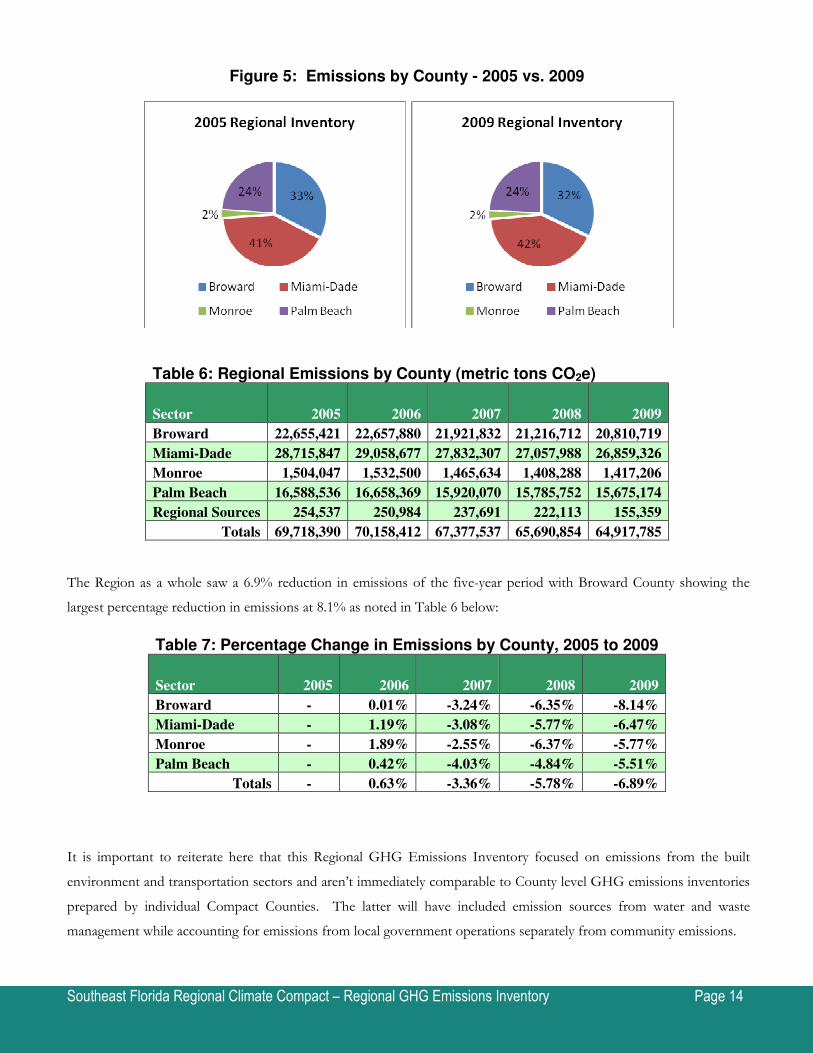
The contributions of each Compact County to regional emissions over the 2005 – 2009 display a similar pattern with a
peak in 2006 and declining emissions in the subsequent years, as is evident in Figure 3 and Table 5 below.
Southeast Florida Regional Climate Compact – Regional GHG Emissions Inventory Page 14
Figure 5: Emissions by County - 2005 vs. 2009
Table 6: Regional Emissions by County (metric tons CO2e)
Sector 2005 2006 2007 2008 2009
Broward 22,655,421 22,657,880 21,921,832 21,216,712 20,810,719
Miami-Dade 28,715,847 29,058,677 27,832,307 27,057,988 26,859,326
Monroe 1,504,047 1,532,500 1,465,634 1,408,288 1,417,206
Palm Beach 16,588,536 16,658,369 15,920,070 15,785,752 15,675,174
Regional Sources 254,537 250,984 237,691 222,113 155,359
Totals 69,718,390 70,158,412 67,377,537 65,690,854 64,917,785
The Region as a whole saw a 6.9% reduction in emissions of the five-year period with Broward County showing the
largest percentage reduction in emissions at 8.1% as noted in Table 6 below:
Table 7: Percentage Change in Emissions by County, 2005 to 2009
Sector 2005 2006 2007 2008 2009
Broward - 0.01% -3.24% -6.35% -8.14%
Miami-Dade - 1.19% -3.08% -5.77% -6.47%
Monroe - 1.89% -2.55% -6.37% -5.77%
Palm Beach - 0.42% -4.03% -4.84% -5.51%
Totals - 0.63% -3.36% -5.78% -6.89%
It is important to reiterate here that this Regional GHG Emissions Inventory focused on emissions from the built
environment and transportation sectors and aren’t immediately comparable to County level GHG emissions inventories
prepared by individual Compact Counties. The latter will have included emission sources from water and waste
management while accounting for emissions from local government operations separately from community emissions.
Southeast Florida Regional Climate Compact – Regional GHG Emissions Inventory Page 15
Residential, Commercial and Industrial Sectors
The primary source of energy – and emissions – for the residential, commercial and industrial sectors within Southeast
Florida is electricity. Natural gas emissions are three orders of magnitude below that of electricity. Combined, these
sectors accounted for 55% of regional emissions in 2009. Data for electricity consumption within the Compact
Counties were obtained from Florida Power & Light, the Lake Worth Municipal Utility, the Homestead Municipal
Utility, the Florida Keys Electric Cooperative and Keys Energy Services. Data for natural gas consumption were
obtained from TECO Peoples Gas and Florida City Gas. Data on residential equipment usage, such as lawnmowers or
on-site electricity generation, is not included in this inventory.
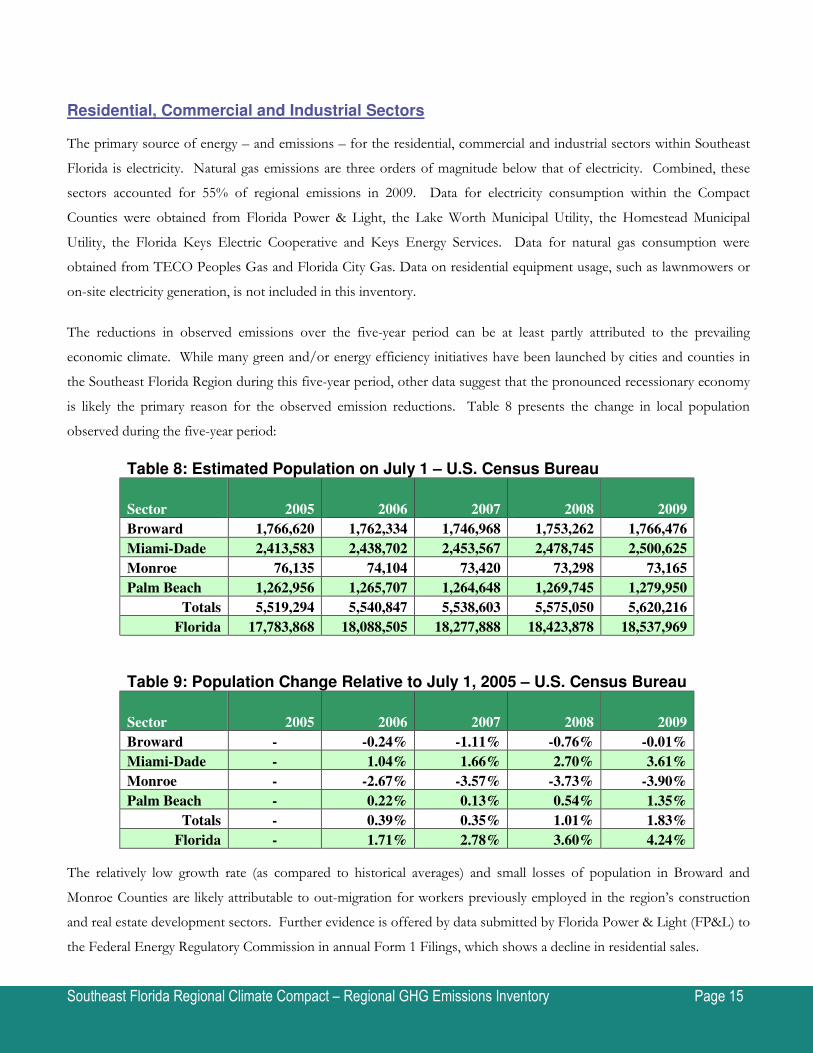
The reductions in observed emissions over the five-year period can be at least partly attributed to the prevailing
economic climate. While many green and/or energy efficiency initiatives have been launched by cities and counties in
the Southeast Florida Region during this five-year period, other data suggest that the pronounced recessionary economy
is likely the primary reason for the observed emission reductions. Table 8 presents the change in local population
observed during the five-year period:
Table 8: Estimated Population on July 1 – U.S. Census Bureau
Sector 2005 2006 2007 2008 2009
Broward 1,766,620 1,762,334 1,746,968 1,753,262 1,766,476
Miami-Dade 2,413,583 2,438,702 2,453,567 2,478,745 2,500,625
Monroe 76,135 74,104 73,420 73,298 73,165
Palm Beach 1,262,956 1,265,707 1,264,648 1,269,745 1,279,950
Totals 5,519,294 5,540,847 5,538,603 5,575,050 5,620,216
Florida 17,783,868 18,088,505 18,277,888 18,423,878 18,537,969
Table 9: Population Change Relative to July 1, 2005 – U.S. Census Bureau
Sector 2005 2006 2007 2008 2009
Broward - -0.24% -1.11% -0.76% -0.01%
Miami-Dade - 1.04% 1.66% 2.70% 3.61%
Monroe - -2.67% -3.57% -3.73% -3.90%
Palm Beach - 0.22% 0.13% 0.54% 1.35%
Totals - 0.39% 0.35% 1.01% 1.83%
Florida - 1.71% 2.78% 3.60% 4.24%
The relatively low growth rate (as compared to historical averages) and small losses of population in Broward and
Monroe Counties are likely attributable to out-migration for workers previously employed in the region’s construction
and real estate development sectors. Further evidence is offered by data submitted by Florida Power & Light (FP&L) to
the Federal Energy Regulatory Commission in annual Form 1 Filings, which shows a decline in residential sales.
Southeast Florida Regional Climate Compact – Regional GHG Emissions Inventory Page 16
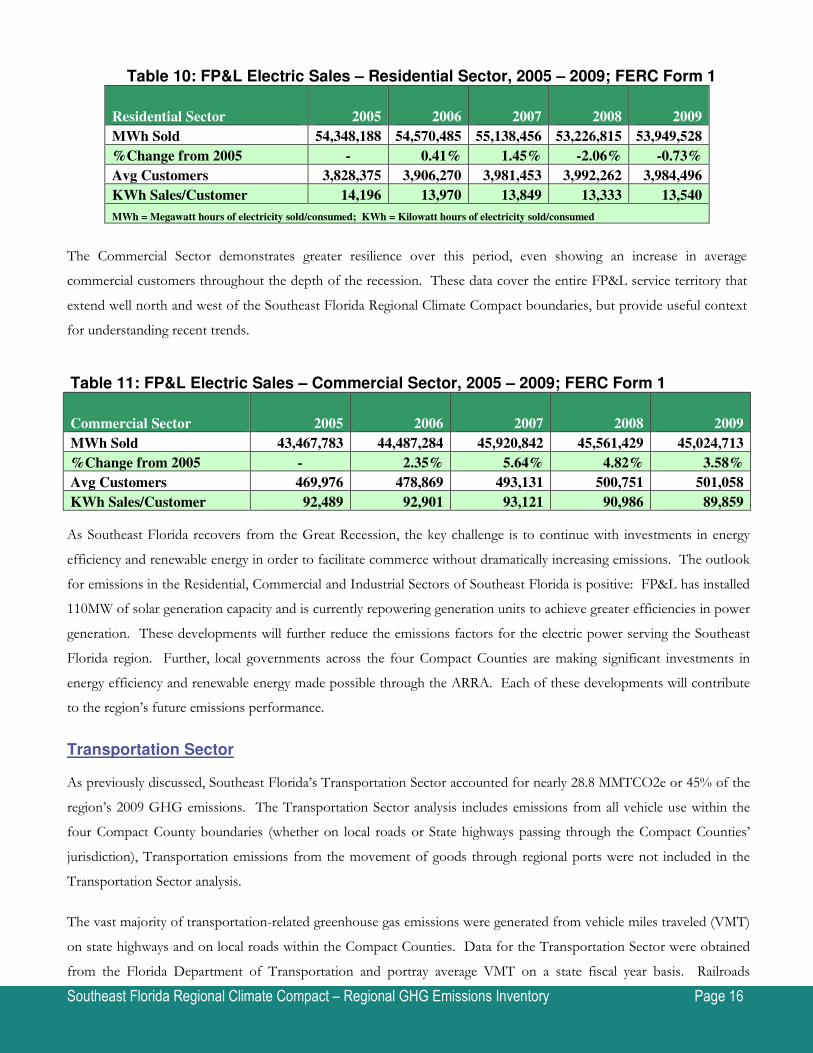
Table 10: FP&L Electric Sales – Residential Sector, 2005 – 2009; FERC Form 1
Residential Sector 2005 2006 2007 2008 2009
MWh Sold 54,348,188 54,570,485 55,138,456 53,226,815 53,949,528
%Change from 2005 - 0.41% 1.45% -2.06% -0.73%
Avg Customers 3,828,375 3,906,270 3,981,453 3,992,262 3,984,496
KWh Sales/Customer 14,196 13,970 13,849 13,333 13,540
MWh = Megawatt hours of electricity sold/consumed; KWh = Kilowatt hours of electricity sold/consumed
The Commercial Sector demonstrates greater resilience over this period, even showing an increase in average
commercial customers throughout the depth of the recession. These data cover the entire FP&L service territory that
extend well north and west of the Southeast Florida Regional Climate Compact boundaries, but provide useful context
for understanding recent trends.
Table 11: FP&L Electric Sales – Commercial Sector, 2005 – 2009; FERC Form 1
Commercial Sector 2005 2006 2007 2008 2009
MWh Sold 43,467,783 44,487,284 45,920,842 45,561,429 45,024,713
%Change from 2005 - 2.35% 5.64% 4.82% 3.58%
Avg Customers 469,976 478,869 493,131 500,751 501,058
KWh Sales/Customer 92,489 92,901 93,121 90,986 89,859
As Southeast Florida recovers from the Great Recession, the key challenge is to continue with investments in energy
efficiency and renewable energy in order to facilitate commerce without dramatically increasing emissions. The outlook
for emissions in the Residential, Commercial and Industrial Sectors of Southeast Florida is positive: FP&L has installed
110MW of solar generation capacity and is currently repowering generation units to achieve greater efficiencies in power
generation. These developments will further reduce the emissions factors for the electric power serving the Southeast
Florida region. Further, local governments across the four Compact Counties are making significant investments in
energy efficiency and renewable energy made possible through the ARRA. Each of these developments will contribute
to the region’s future emissions performance.
Transportation Sector
As previously discussed, Southeast Florida’s Transportation Sector accounted for nearly 28.8 MMTCO2e or 45% of the
region’s 2009 GHG emissions. The Transportation Sector analysis includes emissions from all vehicle use within the
four Compact County boundaries (whether on local roads or State highways passing through the Compact Counties’
jurisdiction), Transportation emissions from the movement of goods through regional ports were not included in the
Transportation Sector analysis.
The vast majority of transportation-related greenhouse gas emissions were generated from vehicle miles traveled (VMT)
on state highways and on local roads within the Compact Counties. Data for the Transportation Sector were obtained
from the Florida Department of Transportation and portray average VMT on a state fiscal year basis. Railroads

Southeast Florida Regional Climate Compact – Regional GHG Emissions Inventory Page 17
generated a small percentage of transportation-related greenhouse gas emissions, but are treated in the “Regional
Sources” section that follows. Emissions from air travel were not included in the Transportation Sector analysis.
Regional Emissions
In developing the Regional Emissions Inventory for Southeast Florida, we chose to treat two classes of emissions as
“regional emissions” including street lighting and railroad emissions. For the former, separate data for street lighting
was not available from Monroe County (those data are included in Residential and Commercial data). Rather than
attempt to apportion these data into specific county-level energy usage within the other three counties, we chose to
assign emissions associated with street lighting to the Regional Emissions category. Total emissions associated with
street lighting make a relatively small component of regional emissions, amounting to 155,359 metric tonnes of CO2e in
2009, or about one quarter of one percent of total regional emissions that year.
Railroads, including Amtrak, CSXT, FEC and Tri-Rail, operate in Palm Beach, Broward and Miami-Dade Counties. We
were able to obtain sufficient data from the respective railroads to estimate emissions for the period 2005 – 2008. Data
for 2009 were not available. Total contributions to regional emissions from these four railroad operations average
75,000 metric tonnes CO2e on an annual basis, or about one eighth of one percent of total regional emissions. We
report total regional emissions for 2009 with these railroad data omitted as its impact is barely material to total regional
emissions for 2009.
Toward a Regional Emissions Baseline
For purposes for establishing an emissions baseline for the Southeast Florida Regional Climate Compact, the following
table provides an average by sector from the years 2005 through 2009. We propose to use this 5 year average as the
baseline against which to assess future performance in reducing emissions.
Table 12: Regional Emissions by Sector (metric tons CO2e)
Sector 2005 2006 2007 2008 2009
Five Year
Average
Residential 19,963,638.00 19,989,441.20 18,685,833.10 18,186,886.70 18,237,990.20 19,012,757.84
Commercial 17,884,892.70 18,212,352.50 17,356,620.50 17,314,930.10 17,083,809.80 17,570,521.12
Industrial 1,075,979.90 1,103,572.30 961,883.70 888,111.50 811,016.60 968,112.80
Transportation 30,793,879.80 30,853,046.30 30,373,200.10 29,300,926.30 28,784,969.10 30,021,204.32
Totals 69,718,390.20 70,158,412.30 67,377,537.40 65,690,854.60 64,917,785.60 67,572,596.02

Southeast Florida Regional Climate Compact – Regional GHG Emissions Inventory Page 18
Appendices

Southeast Florida Regional Climate Compact – Regional GHG Emissions Inventory Page 19
Appendix A - Regional Greenhouse Gas Emissions 2005 - 2009
Scope 1 + Scope 2
2005 2006 2007 2008 2009
Residential eCO2 (metric tonnes) 19,963,638.00 19,989,441.20 18,685,833.10 18,186,886.70 18,237,990.20
Energy (MMBtu) 114,373,669.10 114,409,906.90 115,589,454.20 112,593,056.60 113,067,849.20
Commercial eCO2 (metric tonnes) 17,884,892.70 18,212,352.50 17,356,620.50 17,314,930.10 17,083,809.80
Energy (MMBtu) 107,459,145.50 108,622,460.40 111,501,033.80 111,116,419.80 110,127,241.40
Industrial eCO2 (metric tonnes) 1,075,979.90 1,103,572.30 961,883.70 888,111.50 811,016.60
Energy (MMBtu) 6,209,619.90 6,369,767.40 5,999,684.60 5,541,354.90 5,065,185.10
Transportation eCO2 (metric tonnes) 30,793,879.80 30,853,046.30 30,373,200.10 29,300,926.30 28,784,969.10
Energy (MMBtu) 426,009,136.20 427,857,481.20 421,139,872.70 406,211,643.20 399,023,166.50
Total eCO2 (metric tonnes) 69,718,390.20 70,158,412.30 67,377,537.40 65,690,854.60 64,917,785.60
Energy (MMBtu) 654,051,570.70 657,259,615.80 654,230,045.30 635,462,474.50 627,283,442.20
Data generated using ICLEI's Clean Air and Climate Protection 2009 Software.