Embed Size (px)
Citation preview
Facts & Community Trends Report
SOUTHEAST ASIAN
DATA & TRENDS ANALYSIS
CSEA Center for Southeast Asians SPRING 2014
CENTER FOR SOUTHEAST ASIANS | SEA DATA INITIATIVE
Southeast Asian
Data & Trends Analysis
Channavy Chhay Executive Director
John Nguyen Project Consultant
Maxim Fetissenko Communication Strategist
Center for Southeast Asians
Providence, Rhode Island
Project Lead
Asian & Pacific Islander
American Health Forum
San Francisco, California
Collaborating Partner
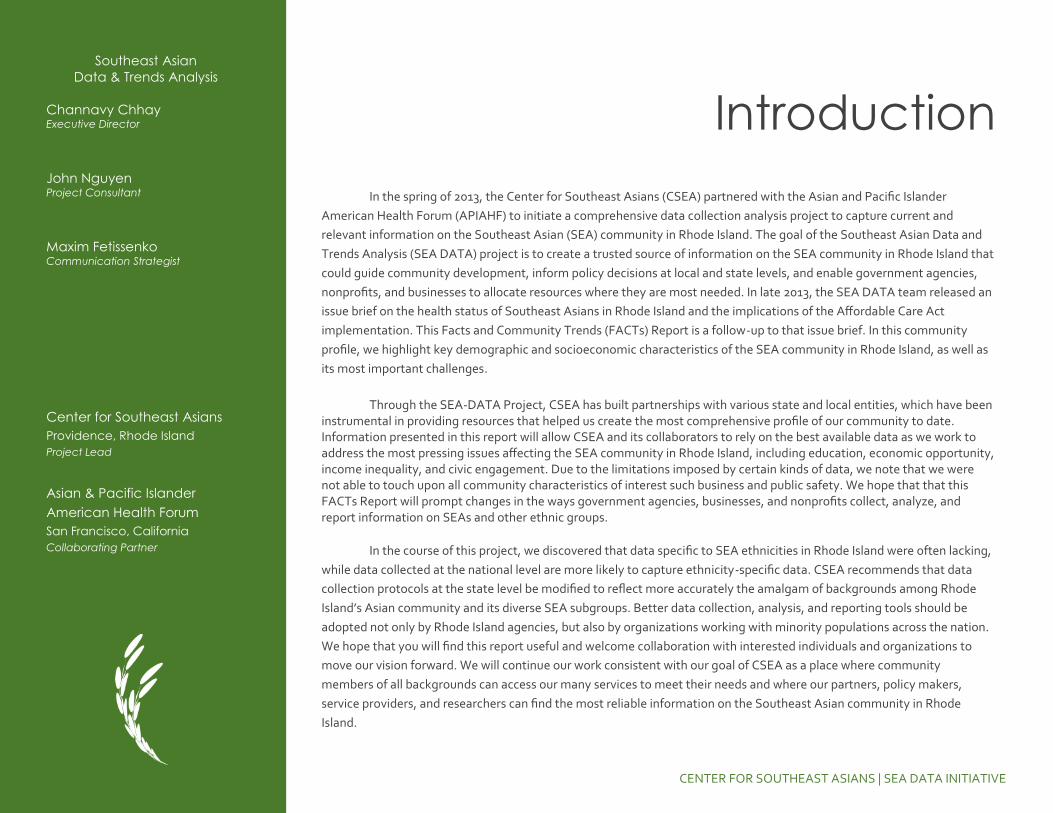
Introduction
In the spring of 2013, the Center for Southeast Asians (CSEA) partnered with the Asian and Pacific Islander
American Health Forum (APIAHF) to initiate a comprehensive data collection analysis project to capture current and
relevant information on the Southeast Asian (SEA) community in Rhode Island. The goal of the Southeast Asian Data and
Trends Analysis (SEA DATA) project is to create a trusted source of information on the SEA community in Rhode Island that
could guide community development, inform policy decisions at local and state levels, and enable government agencies,
nonprofits, and businesses to allocate resources where they are most needed. In late 2013, the SEA DATA team released an
issue brief on the health status of Southeast Asians in Rhode Island and the implications of the Affordable Care Act
implementation. This Facts and Community Trends (FACTs) Report is a follow-up to that issue brief. In this community
profile, we highlight key demographic and socioeconomic characteristics of the SEA community in Rhode Island, as well as
its most important challenges.
Through the SEA-DATA Project, CSEA has built partnerships with various state and local entities, which have been instrumental in providing resources that helped us create the most comprehensive profile of our community to date. Information presented in this report will allow CSEA and its collaborators to rely on the best available data as we work to address the most pressing issues affecting the SEA community in Rhode Island, including education, economic opportunity, income inequality, and civic engagement. Due to the limitations imposed by certain kinds of data, we note that we were not able to touch upon all community characteristics of interest such business and public safety. We hope that that this FACTs Report will prompt changes in the ways government agencies, businesses, and nonprofits collect, analyze, and report information on SEAs and other ethnic groups.
In the course of this project, we discovered that data specific to SEA ethnicities in Rhode Island were often lacking,
while data collected at the national level are more likely to capture ethnicity-specific data. CSEA recommends that data
collection protocols at the state level be modified to reflect more accurately the amalgam of backgrounds among Rhode
Island’s Asian community and its diverse SEA subgroups. Better data collection, analysis, and reporting tools should be
adopted not only by Rhode Island agencies, but also by organizations working with minority populations across the nation.
We hope that you will find this report useful and welcome collaboration with interested individuals and organizations to
move our vision forward. We will continue our work consistent with our goal of CSEA as a place where community
members of all backgrounds can access our many services to meet their needs and where our partners, policy makers,
service providers, and researchers can find the most reliable information on the Southeast Asian community in Rhode
Island.
CENTER FOR SOUTHEAST ASIANS | SEA DATA INITIATIVE
2
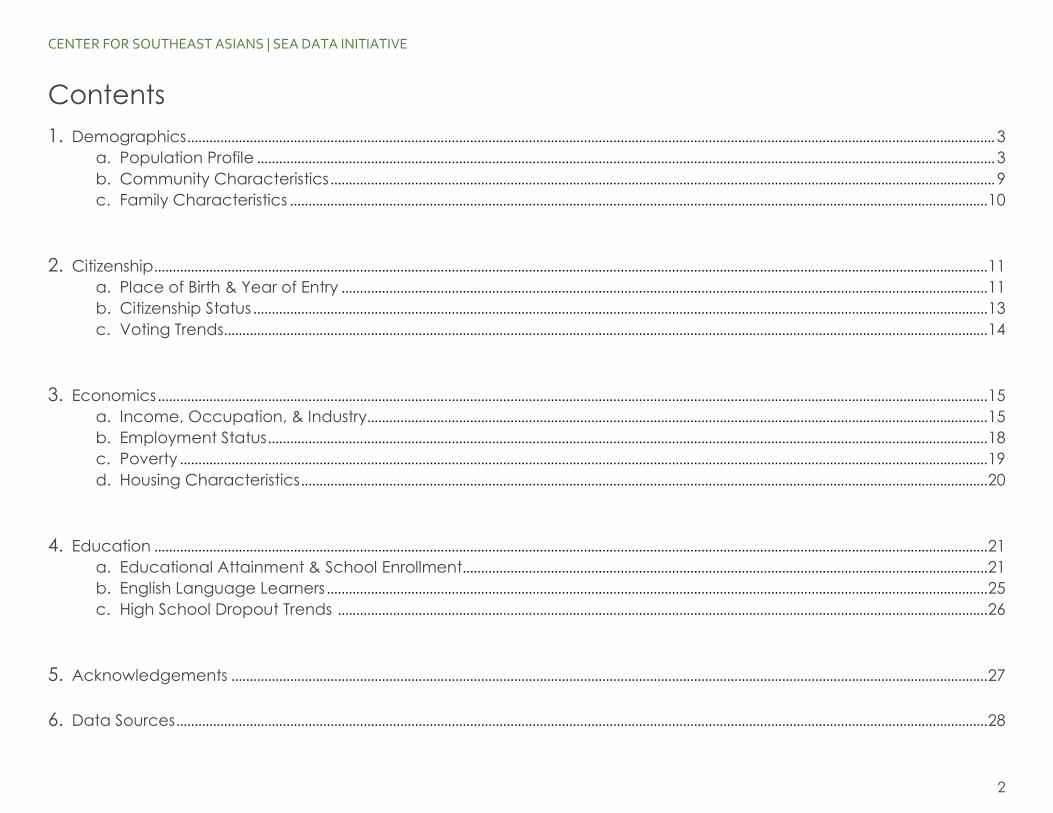
Contents
1. Demographics ............................................................................................................................................................................................................................ 3
a. Population Profile ......................................................................................................................................................................................................... 3
b. Community Characteristics ..................................................................................................................................................................................... 9
c. Family Characteristics .............................................................................................................................................................................................. 10
2. Citizenship ................................................................................................................................................................................................................................... 11
a. Place of Birth & Year of Entry ................................................................................................................................................................................ 11
b. Citizenship Status ........................................................................................................................................................................................................ 13
c. Voting Trends ................................................................................................................................................................................................................ 14
3. Economics .................................................................................................................................................................................................................................. 15
a. Income, Occupation, & Industry......................................................................................................................................................................... 15
b. Employment Status .................................................................................................................................................................................................... 18
c. Poverty ............................................................................................................................................................................................................................ 19
d. Housing Characteristics ........................................................................................................................................................................................... 20
4. Education ................................................................................................................................................................................................................................... 21
a. Educational Attainment & School Enrollment ............................................................................................................................................... 21
b. English Language Learners .................................................................................................................................................................................... 25
c. High School Dropout Trends ................................................................................................................................................................................. 26
5. Acknowledgements .............................................................................................................................................................................................................. 27
6. Data Sources ............................................................................................................................................................................................................................. 28
DEMOGRAPHICS
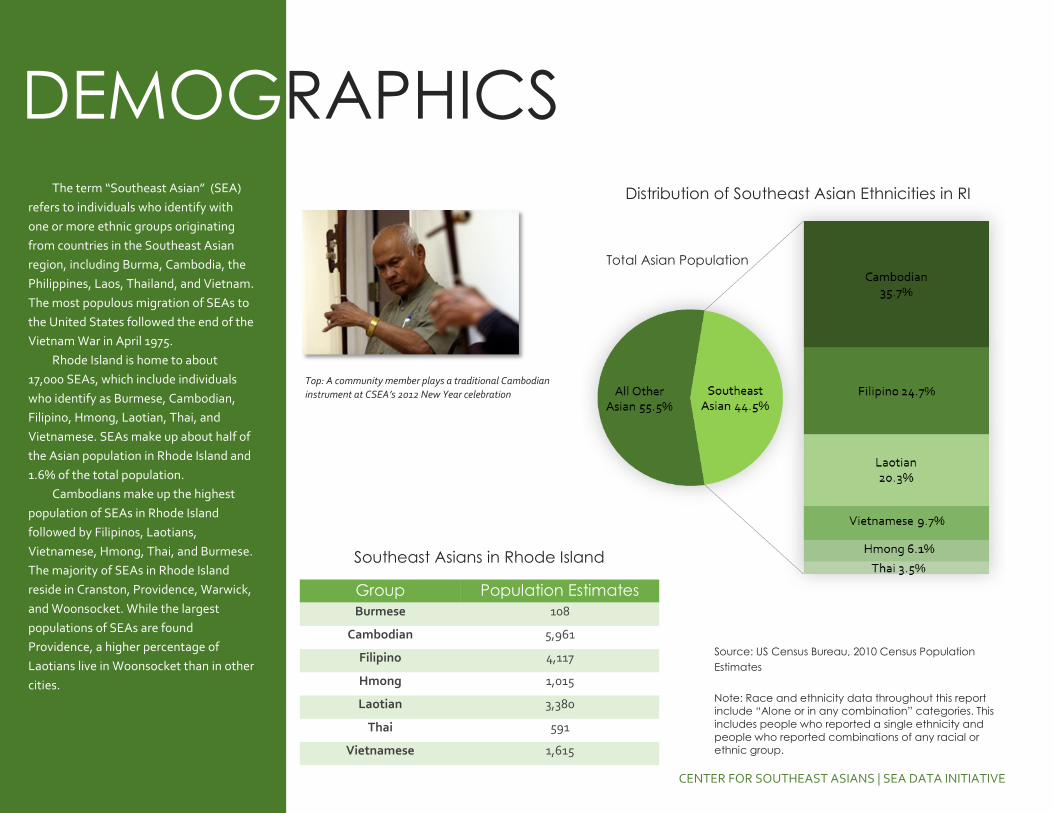
The term “Southeast Asian” (SEA)
refers to individuals who identify with
one or more ethnic groups originating
from countries in the Southeast Asian
region, including Burma, Cambodia, the
Philippines, Laos, Thailand, and Vietnam.
The most populous migration of SEAs to
the United States followed the end of the
Vietnam War in April 1975.
Rhode Island is home to about
17,000 SEAs, which include individuals
who identify as Burmese, Cambodian,
Filipino, Hmong, Laotian, Thai, and
Vietnamese. SEAs make up about half of
the Asian population in Rhode Island and
1.6% of the total population.
Cambodians make up the highest
population of SEAs in Rhode Island
followed by Filipinos, Laotians,
Vietnamese, Hmong, Thai, and Burmese.
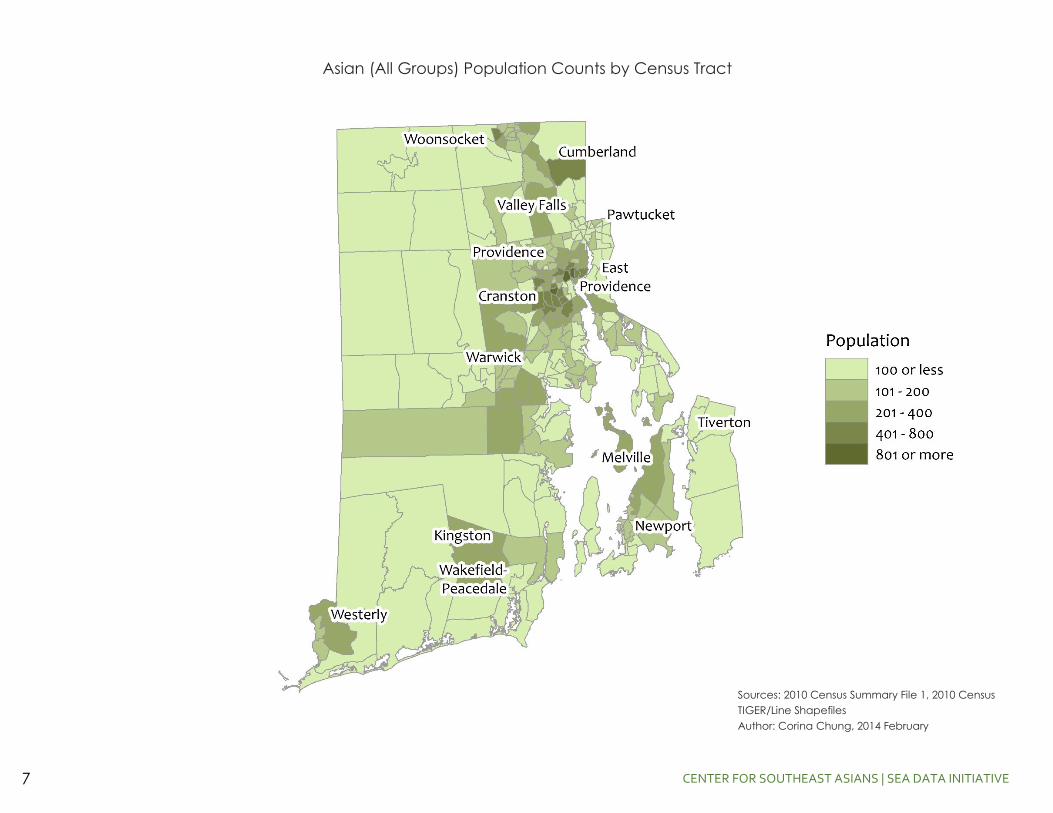
The majority of SEAs in Rhode Island
reside in Cranston, Providence, Warwick,
and Woonsocket. While the largest
populations of SEAs are found
Providence, a higher percentage of
Laotians live in Woonsocket than in other
cities.
Top: A community member plays a traditional Cambodian
instrument at CSEA’s 2012 New Year celebration
Southeast Asians in Rhode Island
Source: US Census Bureau, 2010 Census Population
Estimates
Note: Race and ethnicity data throughout this report
include “Alone or in any combination” categories. This
includes people who reported a single ethnicity and
people who reported combinations of any racial or
ethnic group.
Group Population Estimates
Burmese 108
Cambodian 5,961
Filipino 4,117
Hmong 1,015
Laotian 3,380
Thai 591
Vietnamese 1,615
Total Asian Population
Distribution of Southeast Asian Ethnicities in RI
CENTER FOR SOUTHEAST ASIANS | SEA DATA INITIATIVE
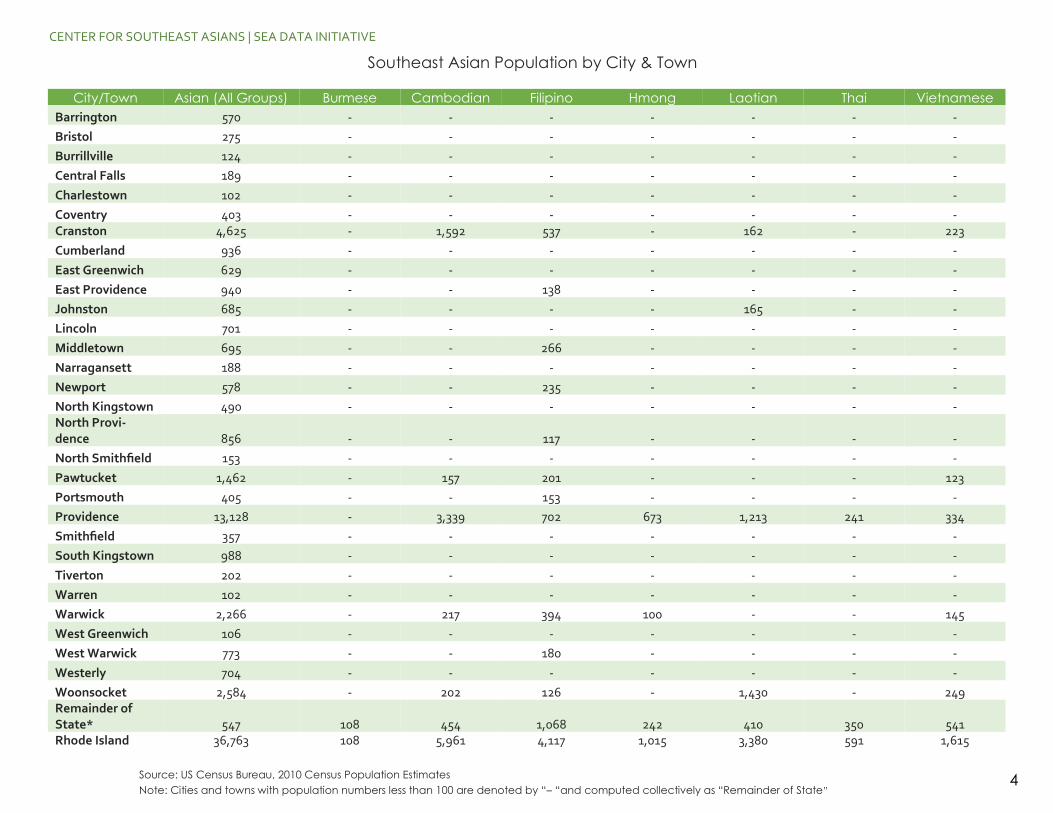
City/Town Asian (All Groups) Burmese Cambodian Filipino Hmong Laotian Thai Vietnamese
Barrington 570 - - - - - - -
Bristol 275 - - - - - - -
Burrillville 124 - - - - - - -
Central Falls 189 - - - - - - -
Charlestown 102 - - - - - - -
Coventry 403 - - - - - - - Cranston 4,625 - 1,592 537 - 162 - 223
Cumberland 936 - - - - - - -
East Greenwich 629 - - - - - - -
East Providence 940 - - 138 - - - -
Johnston 685 - - - - 165 - -
Lincoln 701 - - - - - - -
Middletown 695 - - 266 - - - -
Narragansett 188 - - - - - - -
Newport 578 - - 235 - - - -
North Kingstown 490 - - - - - - - North Provi-dence 856 - - 117 - - - -
North Smithfield 153 - - - - - - -
Pawtucket 1,462 - 157 201 - - - 123
Portsmouth 405 - - 153 - - - -
Providence 13,128 - 3,339 702 673 1,213 241 334
Smithfield 357 - - - - - - -
South Kingstown 988 - - - - - - -
Tiverton 202 - - - - - - -
Warren 102 - - - - - - -
Warwick 2,266 - 217 394 100 - - 145
West Greenwich 106 - - - - - - -
West Warwick 773 - - 180 - - - -
Westerly 704 - - - - - - -
Woonsocket 2,584 - 202 126 - 1,430 - 249 Remainder of State* 547 108 454 1,068 242 410 350 541 Rhode Island 36,763 108 5,961 4,117 1,015 3,380 591 1,615
CENTER FOR SOUTHEAST ASIANS | SEA DATA INITIATIVE
Source: US Census Bureau, 2010 Census Population Estimates
Note: Cities and towns with population numbers less than 100 are denoted by “– “and computed collectively as “Remainder of State”
Southeast Asian Population by City & Town
4
CENTER FOR SOUTHEAST ASIANS | SEA DATA INITIATIVE
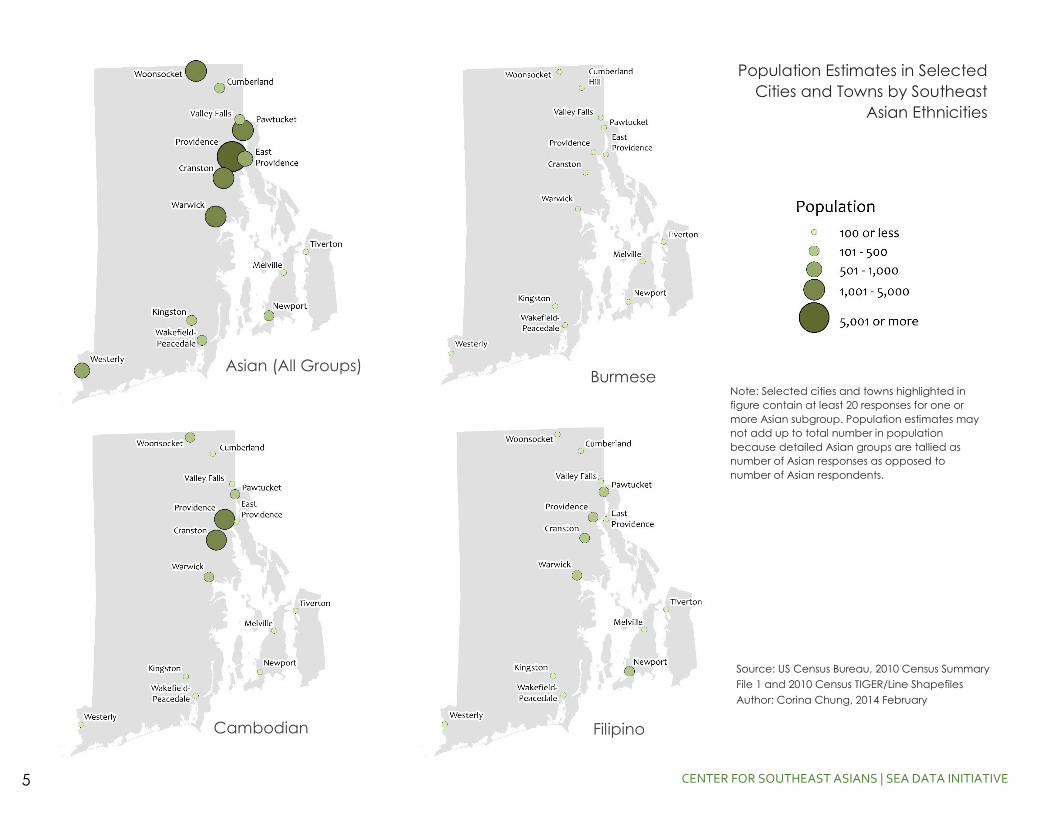
Burmese Asian (All Groups)
Filipino Cambodian
Population Estimates in Selected
Cities and Towns by Southeast
Asian Ethnicities
Note: Selected cities and towns highlighted in
figure contain at least 20 responses for one or
more Asian subgroup. Population estimates may
not add up to total number in population
because detailed Asian groups are tallied as
number of Asian responses as opposed to
number of Asian respondents.
Source: US Census Bureau, 2010 Census Summary
File 1 and 2010 Census TIGER/Line Shapefiles
Author: Corina Chung, 2014 February
5
CENTER FOR SOUTHEAST ASIANS | SEA DATA INITIATIVE
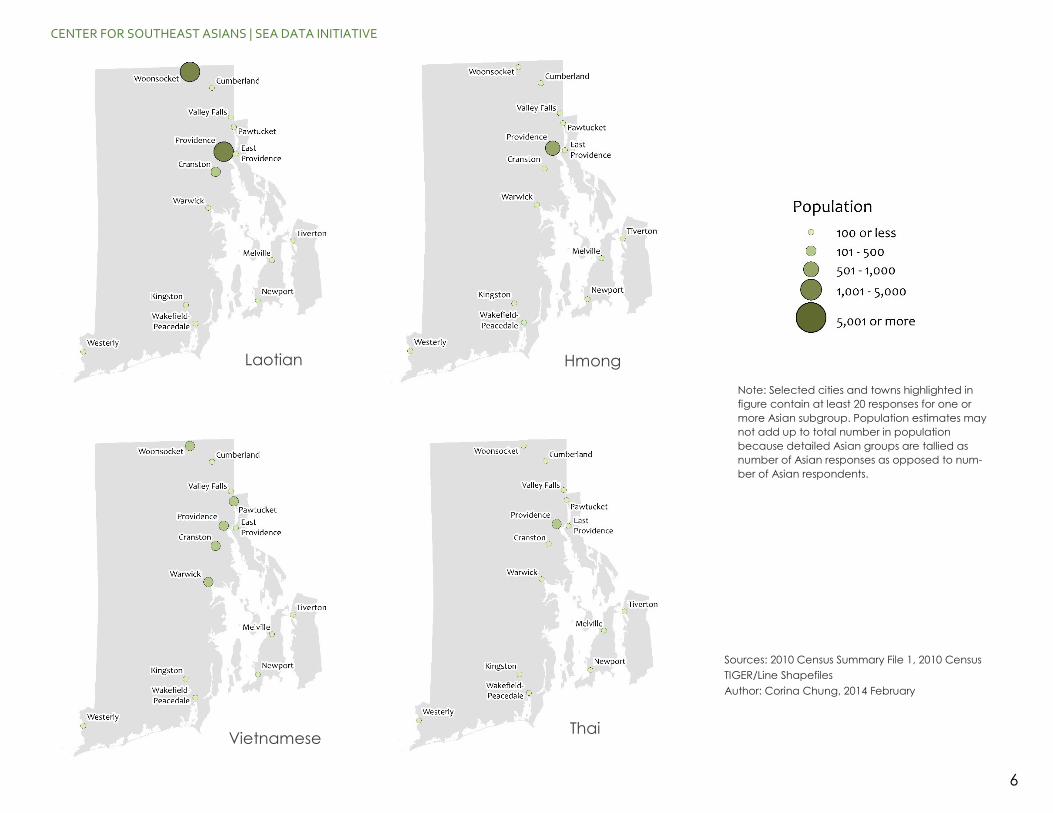
Hmong Laotian
Thai Vietnamese
Note: Selected cities and towns highlighted in
figure contain at least 20 responses for one or
more Asian subgroup. Population estimates may
not add up to total number in population
because detailed Asian groups are tallied as
number of Asian responses as opposed to num-
ber of Asian respondents.
Sources: 2010 Census Summary File 1, 2010 Census
TIGER/Line Shapefiles
Author: Corina Chung, 2014 February
6
CENTER FOR SOUTHEAST ASIANS | SEA DATA INITIATIVE
Sources: 2010 Census Summary File 1, 2010 Census
TIGER/Line Shapefiles
Author: Corina Chung, 2014 February
Asian (All Groups) Population Counts by Census Tract
7
CENTER FOR SOUTHEAST ASIANS | SEA DATA INITIATIVE
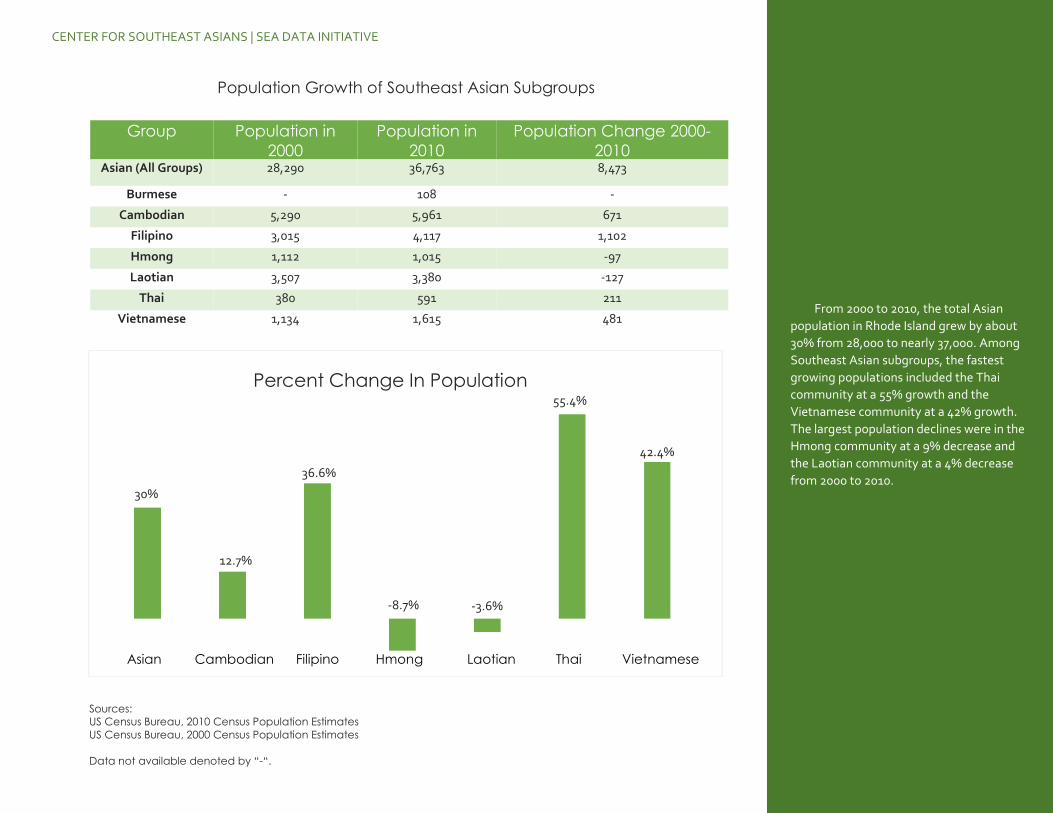
From 2000 to 2010, the total Asian
population in Rhode Island grew by about
30% from 28,000 to nearly 37,000. Among
Southeast Asian subgroups, the fastest
growing populations included the Thai
community at a 55% growth and the
Vietnamese community at a 42% growth.
The largest population declines were in the
Hmong community at a 9% decrease and
the Laotian community at a 4% decrease
from 2000 to 2010.
Group Population in
2000
Population in
2010
Population Change 2000-
2010 Asian (All Groups) 28,290 36,763 8,473
Burmese - 108 -
Cambodian 5,290 5,961 671
Filipino 3,015 4,117 1,102
Hmong 1,112 1,015 -97
Laotian 3,507 3,380 -127
Thai 380 591 211
Vietnamese 1,134 1,615 481
Population Growth of Southeast Asian Subgroups
Sources:
US Census Bureau, 2010 Census Population Estimates
US Census Bureau, 2000 Census Population Estimates
Data not available denoted by “-“.
Percent Change In Population
Asian Cambodian Filipino Hmong Laotian Thai Vietnamese
42.4%
55.4%
-3.6% -8.7%
36.6%
12.7%
30%
CENTER FOR SOUTHEAST ASIANS | SEA DATA INITIATIVE
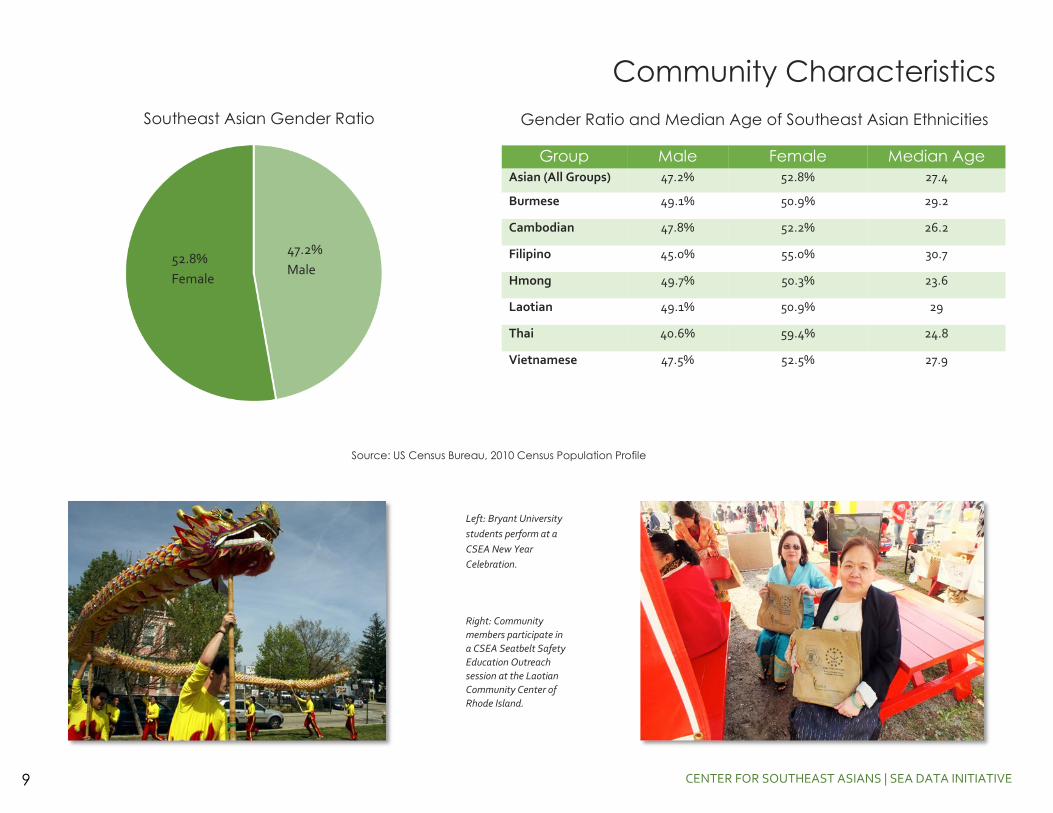
Community Characteristics
Gender Ratio and Median Age of Southeast Asian Ethnicities
Group Male Female Median Age
Asian (All Groups) 47.2% 52.8% 27.4
Burmese 49.1% 50.9% 29.2
Cambodian 47.8% 52.2% 26.2
Filipino 45.0% 55.0% 30.7
Hmong 49.7% 50.3% 23.6
Laotian 49.1% 50.9% 29
Thai 40.6% 59.4% 24.8
Vietnamese 47.5% 52.5% 27.9
Southeast Asian Gender Ratio
52.8%
Female
47.2%
Male
Source: US Census Bureau, 2010 Census Population Profile
Left: Bryant University
students perform at a
CSEA New Year
Celebration.
Right: Community
members participate in
a CSEA Seatbelt Safety
Education Outreach
session at the Laotian
Community Center of
Rhode Island.
9
CENTER FOR SOUTHEAST ASIANS | SEA DATA INITIATIVE
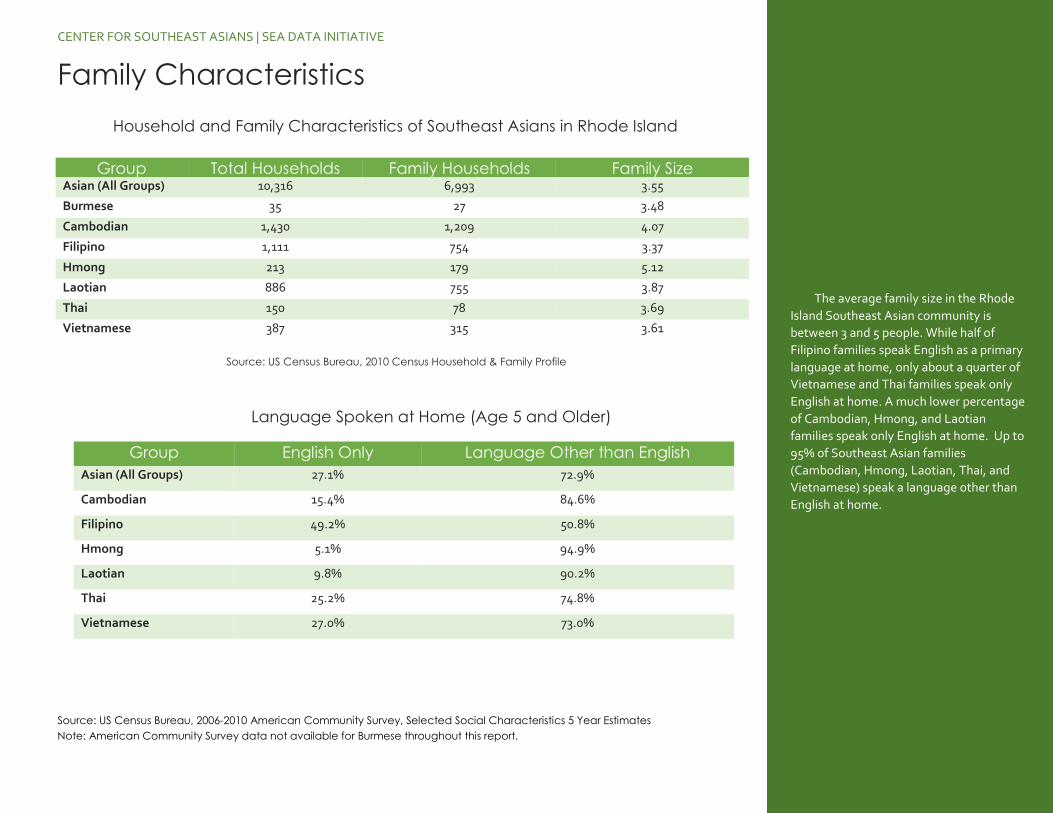
The average family size in the Rhode
Island Southeast Asian community is
between 3 and 5 people. While half of
Filipino families speak English as a primary
language at home, only about a quarter of
Vietnamese and Thai families speak only
English at home. A much lower percentage
of Cambodian, Hmong, and Laotian
families speak only English at home. Up to
95% of Southeast Asian families
(Cambodian, Hmong, Laotian, Thai, and
Vietnamese) speak a language other than
English at home.
Family Characteristics
Group Total Households Family Households Family Size Asian (All Groups) 10,316 6,993 3.55
Burmese 35 27 3.48
Cambodian 1,430 1,209 4.07
Filipino 1,111 754 3.37
Hmong 213 179 5.12
Laotian 886 755 3.87
Thai 150 78 3.69
Vietnamese 387 315 3.61
Household and Family Characteristics of Southeast Asians in Rhode Island
Source: US Census Bureau, 2010 Census Household & Family Profile
Language Spoken at Home (Age 5 and Older)
Group English Only Language Other than English
Asian (All Groups) 27.1% 72.9%
Cambodian 15.4% 84.6%
Filipino 49.2% 50.8%
Hmong 5.1% 94.9%
Laotian 9.8% 90.2%
Thai 25.2% 74.8%
Vietnamese 27.0% 73.0%
Source: US Census Bureau, 2006-2010 American Community Survey, Selected Social Characteristics 5 Year Estimates
Note: American Community Survey data not available for Burmese throughout this report.
CITIZENSHIP
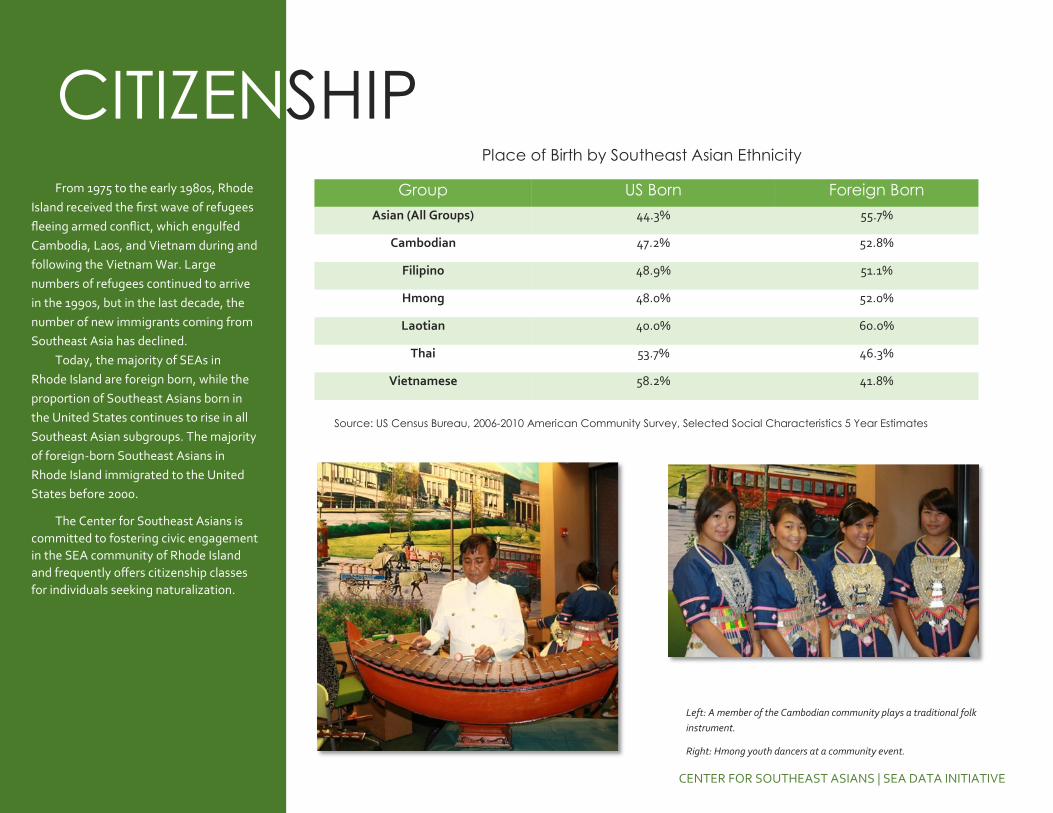
From 1975 to the early 1980s, Rhode
Island received the first wave of refugees
fleeing armed conflict, which engulfed
Cambodia, Laos, and Vietnam during and
following the Vietnam War. Large
numbers of refugees continued to arrive
in the 1990s, but in the last decade, the
number of new immigrants coming from
Southeast Asia has declined.
Today, the majority of SEAs in
Rhode Island are foreign born, while the
proportion of Southeast Asians born in
the United States continues to rise in all
Southeast Asian subgroups. The majority
of foreign-born Southeast Asians in
Rhode Island immigrated to the United
States before 2000.
The Center for Southeast Asians is
committed to fostering civic engagement
in the SEA community of Rhode Island
and frequently offers citizenship classes
for individuals seeking naturalization.
CENTER FOR SOUTHEAST ASIANS | SEA DATA INITIATIVE
Group US Born Foreign Born
Asian (All Groups) 44.3% 55.7%
Cambodian 47.2% 52.8%
Filipino 48.9% 51.1%
Hmong 48.0% 52.0%
Laotian 40.0% 60.0%
Thai 53.7% 46.3%
Vietnamese 58.2% 41.8%
Place of Birth by Southeast Asian Ethnicity
Source: US Census Bureau, 2006-2010 American Community Survey, Selected Social Characteristics 5 Year Estimates
Left: A member of the Cambodian community plays a traditional folk
instrument.
Right: Hmong youth dancers at a community event.
CENTER FOR SOUTHEAST ASIANS | SEA DATA INITIATIVE
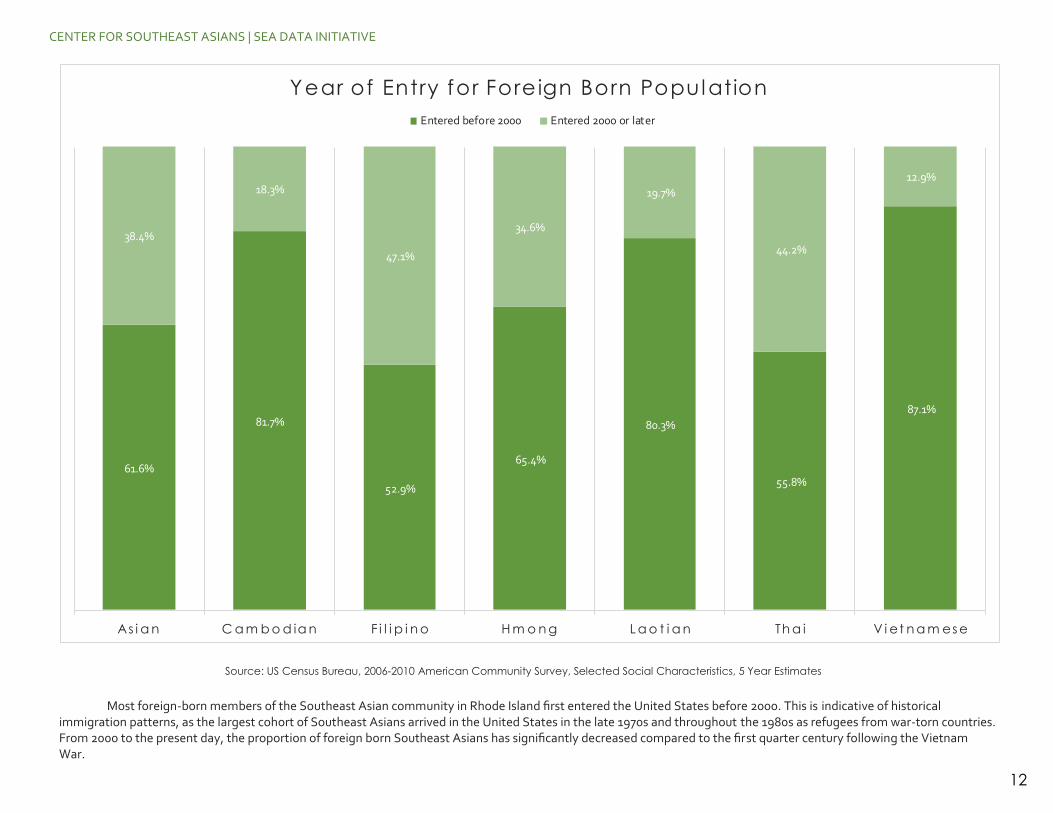
61.6%
81.7%
52.9%
65.4%
80.3%
55.8%
87.1%
38.4%
18.3%
47.1%
34.6%
19.7%
44.2%
12.9%
As i a n C a m b o d ia n F i l i p i n o H m o n g L a o t i a n Th a i V i et n a m es e
Year of Entry for Foreign Born Population
Entered before 2000 Entered 2000 or later
Source: US Census Bureau, 2006-2010 American Community Survey, Selected Social Characteristics, 5 Year Estimates
Most foreign-born members of the Southeast Asian community in Rhode Island first entered the United States before 2000. This is indicative of historical immigration patterns, as the largest cohort of Southeast Asians arrived in the United States in the late 1970s and throughout the 1980s as refugees from war-torn countries. From 2000 to the present day, the proportion of foreign born Southeast Asians has significantly decreased compared to the first quarter century following the Vietnam War.
12
CENTER FOR SOUTHEAST ASIANS | SEA DATA INITIATIVE
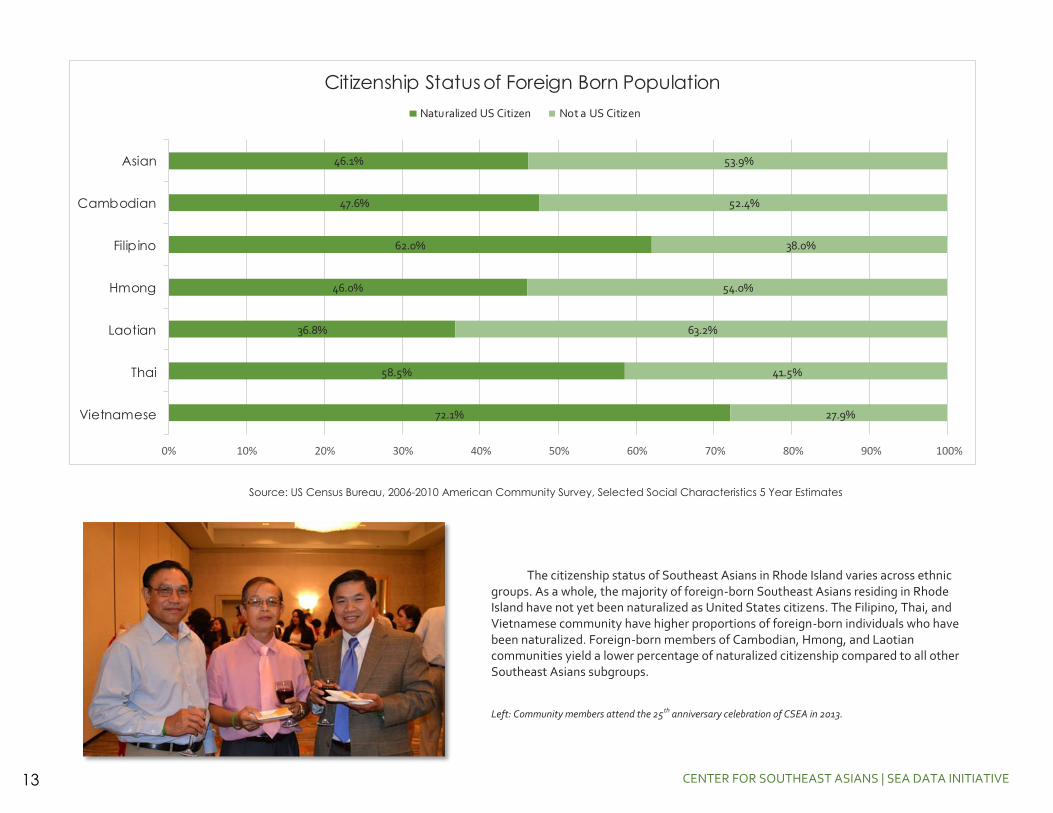
72.1%
58.5%
36.8%
46.0%
62.0%
47.6%
46.1%
27.9%
41.5%
63.2%
54.0%
38.0%
52.4%
53.9%
0% 10% 20% 30% 40% 50% 60% 70% 80% 90% 100%
Vietnamese
Thai
Laotian
Hmong
Filipino
Cambodian
Asian
Citizenship Status of Foreign Born Population
Naturalized US Citizen Not a US Citizen
The citizenship status of Southeast Asians in Rhode Island varies across ethnic groups. As a whole, the majority of foreign-born Southeast Asians residing in Rhode Island have not yet been naturalized as United States citizens. The Filipino, Thai, and Vietnamese community have higher proportions of foreign-born individuals who have been naturalized. Foreign-born members of Cambodian, Hmong, and Laotian communities yield a lower percentage of naturalized citizenship compared to all other Southeast Asians subgroups.
Left: Community members attend the 25th anniversary celebration of CSEA in 2013.
Source: US Census Bureau, 2006-2010 American Community Survey, Selected Social Characteristics 5 Year Estimates
13
CENTER FOR SOUTHEAST ASIANS | SEA DATA INITIATIVE
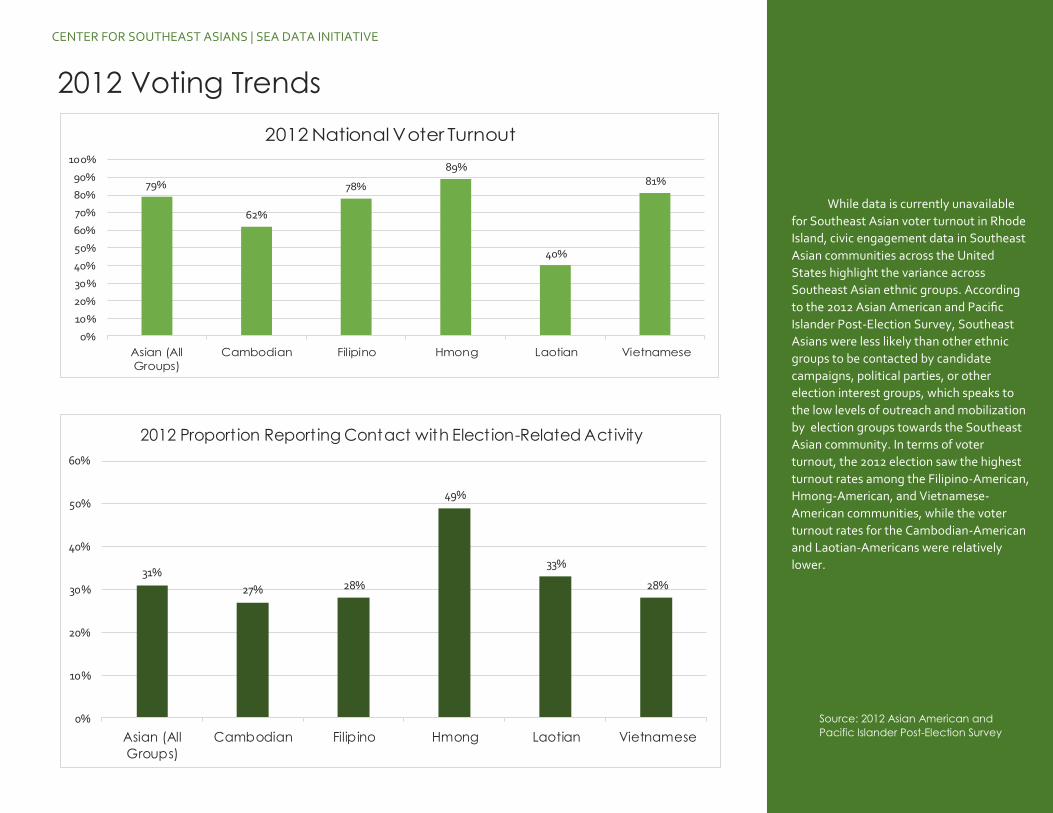
While data is currently unavailable
for Southeast Asian voter turnout in Rhode
Island, civic engagement data in Southeast
Asian communities across the United
States highlight the variance across
Southeast Asian ethnic groups. According
to the 2012 Asian American and Pacific
Islander Post-Election Survey, Southeast
Asians were less likely than other ethnic
groups to be contacted by candidate
campaigns, political parties, or other
election interest groups, which speaks to
the low levels of outreach and mobilization
by election groups towards the Southeast
Asian community. In terms of voter
turnout, the 2012 election saw the highest
turnout rates among the Filipino-American,
Hmong-American, and Vietnamese-
American communities, while the voter
turnout rates for the Cambodian-American
and Laotian-Americans were relatively
lower.
2012 Voting Trends
79%
62%
78%
89%
40%
81%
0%
10%
20%
30%
40%
50%
60%
70%
80%
90%
100%
Asian (All
Groups)
Cambodian Filipino Hmong Laotian Vietnamese
2012 National Voter Turnout
31%
27% 28%
49%
33%
28%
0%
10%
20%
30%
40%
50%
60%
Asian (All
Groups)
Cambodian Filipino Hmong Laotian Vietnamese
2012 Proport ion Report ing Contact with Election-Related Activity
Source: 2012 Asian American and
Pacific Islander Post-Election Survey
ECONOMICS
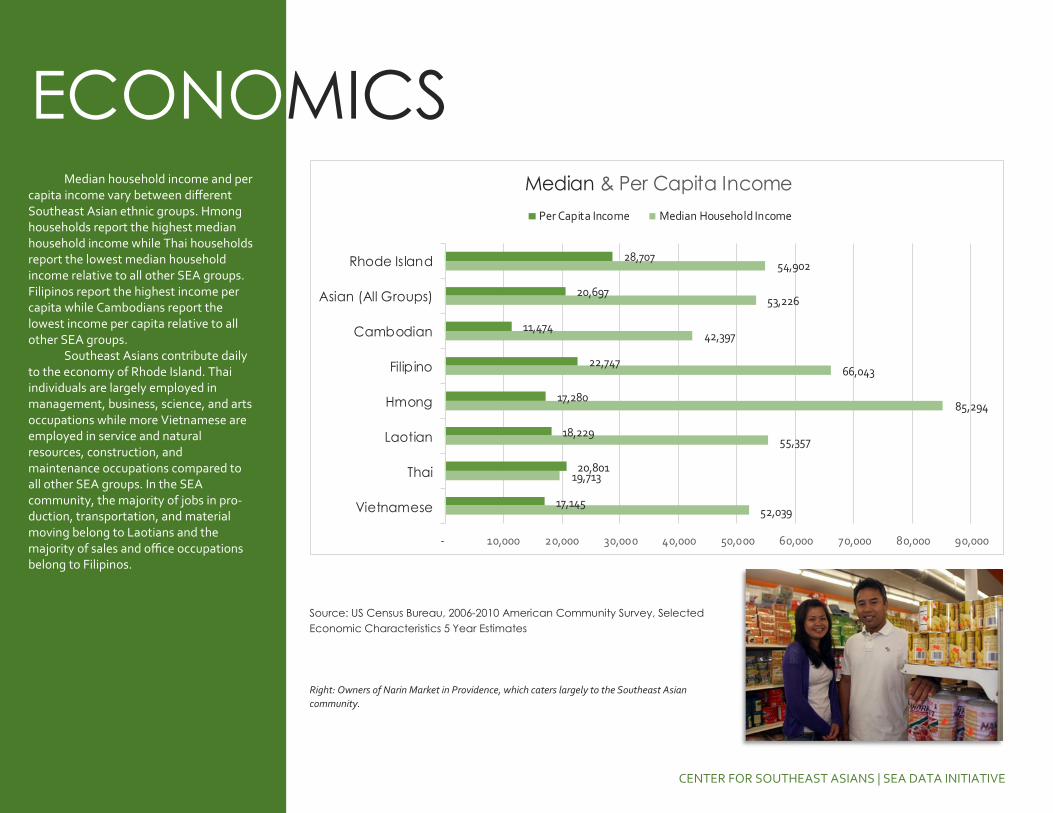
Median household income and per capita income vary between different Southeast Asian ethnic groups. Hmong households report the highest median household income while Thai households report the lowest median household income relative to all other SEA groups. Filipinos report the highest income per capita while Cambodians report the lowest income per capita relative to all other SEA groups.
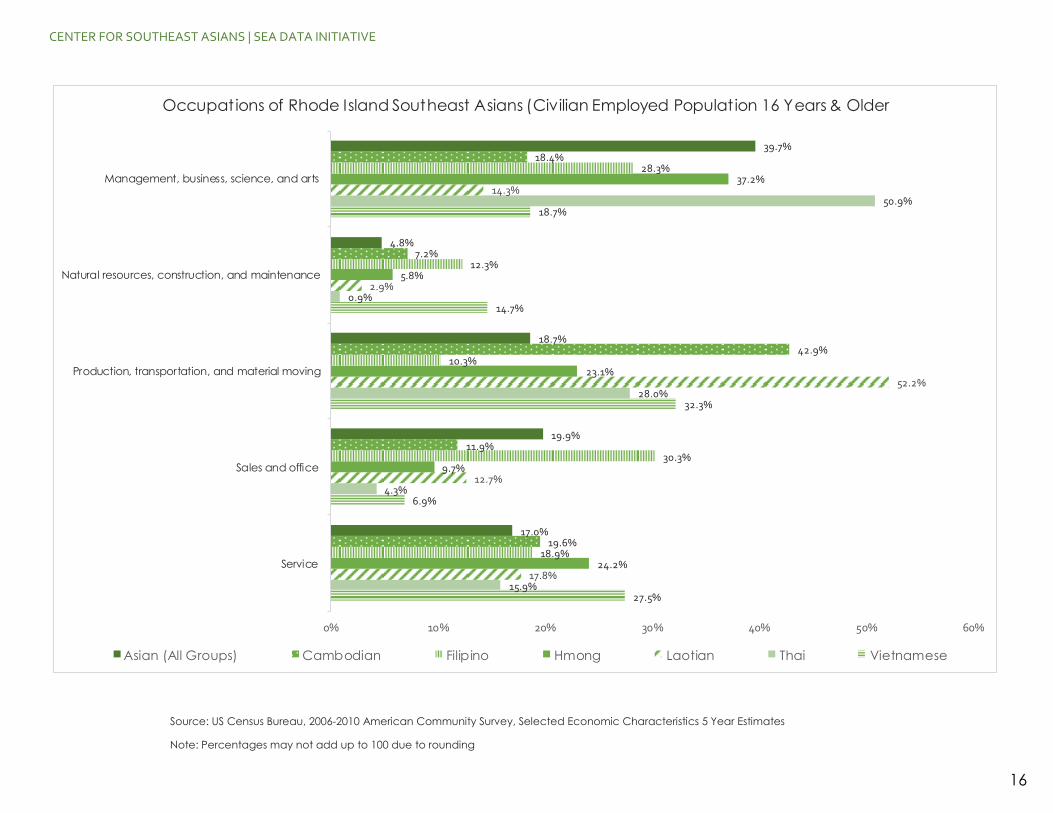
Southeast Asians contribute daily to the economy of Rhode Island. Thai individuals are largely employed in management, business, science, and arts occupations while more Vietnamese are employed in service and natural resources, construction, and maintenance occupations compared to all other SEA groups. In the SEA community, the majority of jobs in pro-duction, transportation, and material moving belong to Laotians and the majority of sales and office occupations belong to Filipinos.
52,039
19,713
55,357
85,294
66,043
42,397
53,226
54,902
17,145
20,801
18,229
17,280
22,747
11,474
20,697
28,707
- 10,000 20,000 30,000 40,000 50,000 60,000 70,000 80,000 90,000
Vietnamese
Thai
Laotian
Hmong
Filipino
Cambodian
Asian (All Groups)
Rhode Island
Median & Per Capita Income
Per Capita Income Median Household Income
Source: US Census Bureau, 2006-2010 American Community Survey, Selected
Economic Characteristics 5 Year Estimates
Right: Owners of Narin Market in Providence, which caters largely to the Southeast Asian
community.
CENTER FOR SOUTHEAST ASIANS | SEA DATA INITIATIVE
CENTER FOR SOUTHEAST ASIANS | SEA DATA INITIATIVE
Source: US Census Bureau, 2006-2010 American Community Survey, Selected Economic Characteristics 5 Year Estimates
Note: Percentages may not add up to 100 due to rounding
27.5%
6.9%
32.3%
14.7%
18.7%
15.9%
4.3%
28.0%
0.9%
50.9%
17.8%
12.7%
52.2%
2.9%
14.3%
24.2%
9.7%
23.1%
5.8%
37.2%
18.9%
30.3%
10.3%
12.3%
28.3%
19.6%
11.9%
42.9%
7.2%
18.4%
17.0%
19.9%
18.7%
4.8%
39.7%
0% 10% 20% 30% 40% 50% 60%
Service
Sales and office
Production, transportation, and material moving
Natural resources, construction, and maintenance
Management, business, science, and arts
Occupations of Rhode Island Southeast Asians (Civilian Employed Populat ion 16 Years & Older
Asian (All Groups) Cambodian Filipino Hmong Laotian Thai Vietnamese
16
CENTER FOR SOUTHEAST ASIANS | SEA DATA INITIATIVE
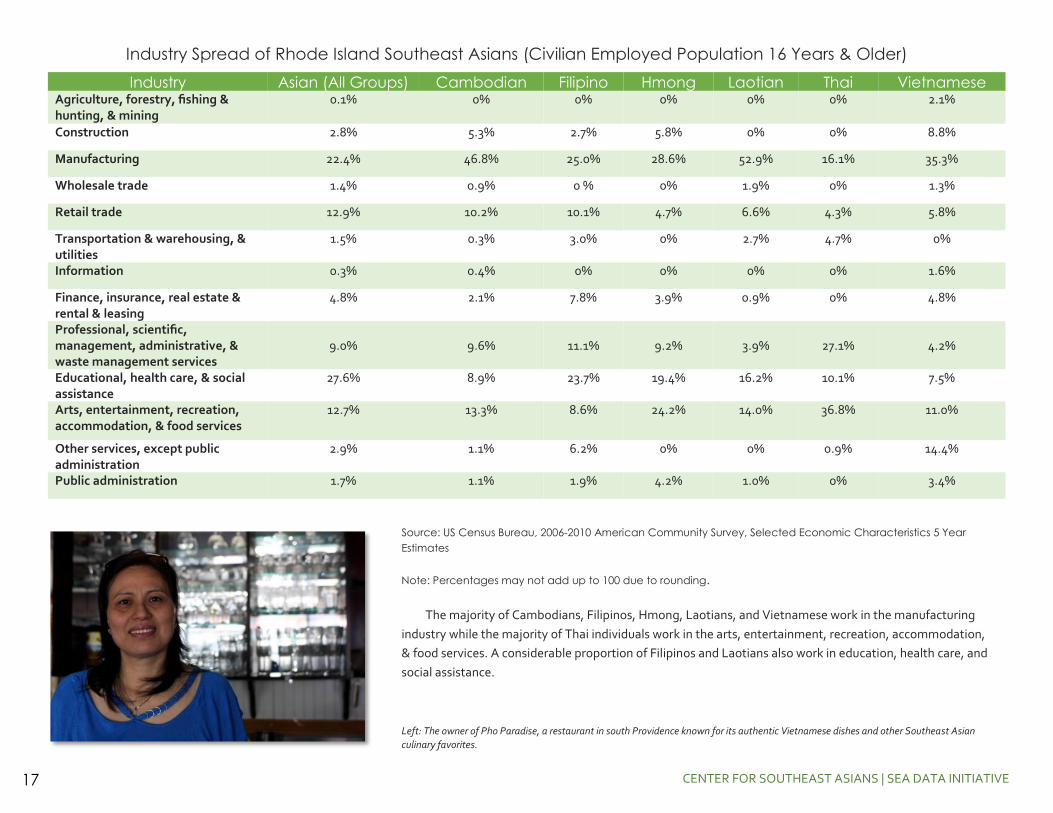
Industry Spread of Rhode Island Southeast Asians (Civilian Employed Population 16 Years & Older)
Industry Asian (All Groups) Cambodian Filipino Hmong Laotian Thai Vietnamese Agriculture, forestry, fishing & hunting, & mining
0.1% 0% 0% 0% 0% 0% 2.1%
Construction 2.8% 5.3% 2.7% 5.8% 0% 0% 8.8%
Manufacturing 22.4% 46.8% 25.0% 28.6% 52.9% 16.1% 35.3%
Wholesale trade 1.4% 0.9% 0 % 0% 1.9% 0% 1.3%
Retail trade 12.9% 10.2% 10.1% 4.7% 6.6% 4.3% 5.8%
Transportation & warehousing, & utilities
1.5% 0.3% 3.0% 0% 2.7% 4.7% 0%
Information 0.3% 0.4% 0% 0% 0% 0% 1.6%
Finance, insurance, real estate & rental & leasing
4.8% 2.1% 7.8% 3.9% 0.9% 0% 4.8%
Professional, scientific, management, administrative, & waste management services
9.0%
9.6%
11.1%
9.2%
3.9%
27.1%
4.2%
Educational, health care, & social assistance
27.6% 8.9% 23.7% 19.4% 16.2% 10.1% 7.5%
Arts, entertainment, recreation, accommodation, & food services
12.7% 13.3% 8.6% 24.2% 14.0% 36.8% 11.0%
Other services, except public administration
2.9% 1.1% 6.2% 0% 0% 0.9% 14.4%
Public administration 1.7% 1.1% 1.9% 4.2% 1.0% 0% 3.4%
Source: US Census Bureau, 2006-2010 American Community Survey, Selected Economic Characteristics 5 Year
Estimates
Note: Percentages may not add up to 100 due to rounding.
The majority of Cambodians, Filipinos, Hmong, Laotians, and Vietnamese work in the manufacturing
industry while the majority of Thai individuals work in the arts, entertainment, recreation, accommodation,
& food services. A considerable proportion of Filipinos and Laotians also work in education, health care, and
social assistance.
Left: The owner of Pho Paradise, a restaurant in south Providence known for its authentic Vietnamese dishes and other Southeast Asian
culinary favorites.
17
CENTER FOR SOUTHEAST ASIANS | SEA DATA INITIATIVE
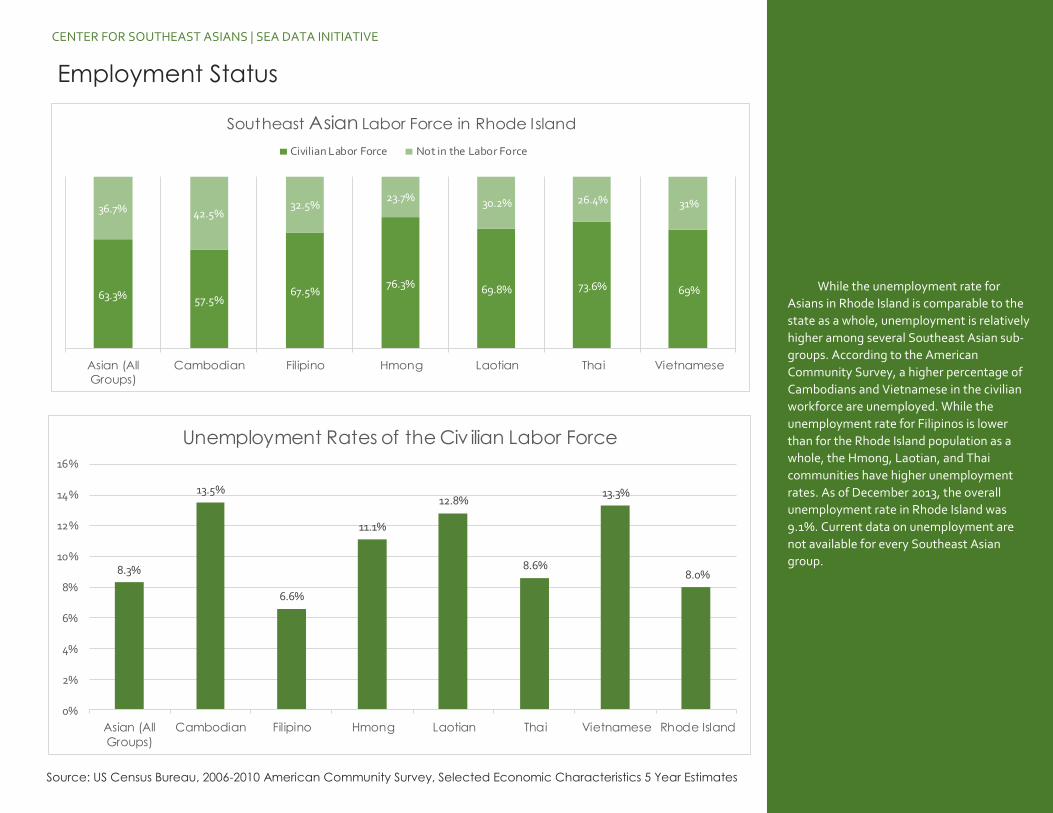
While the unemployment rate for
Asians in Rhode Island is comparable to the
state as a whole, unemployment is relatively
higher among several Southeast Asian sub-
groups. According to the American
Community Survey, a higher percentage of
Cambodians and Vietnamese in the civilian
workforce are unemployed. While the
unemployment rate for Filipinos is lower
than for the Rhode Island population as a
whole, the Hmong, Laotian, and Thai
communities have higher unemployment
rates. As of December 2013, the overall
unemployment rate in Rhode Island was
9.1%. Current data on unemployment are
not available for every Southeast Asian
group.
Employment Status
63.3% 57.5%67.5%
76.3% 69.8% 73.6% 69%
36.7% 42.5%32.5%
23.7% 30.2% 26.4% 31%
Asian (All
Groups)
Cambodian Filipino Hmong Laotian Thai Vietnamese
Southeast Asian Labor Force in Rhode Island
Civilian Labor Force Not in the Labor Force
8.3%
13.5%
6.6%
11.1%
12.8%
8.6%
13.3%
8.0%
0%
2%
4%
6%
8%
10%
12%
14%
16%
Asian (All
Groups)
Cambodian Filipino Hmong Laotian Thai Vietnamese Rhode Island
Unemployment Rates of the Civ ilian Labor Force
Source: US Census Bureau, 2006-2010 American Community Survey, Selected Economic Characteristics 5 Year Estimates
CENTER FOR SOUTHEAST ASIANS | SEA DATA INITIATIVE
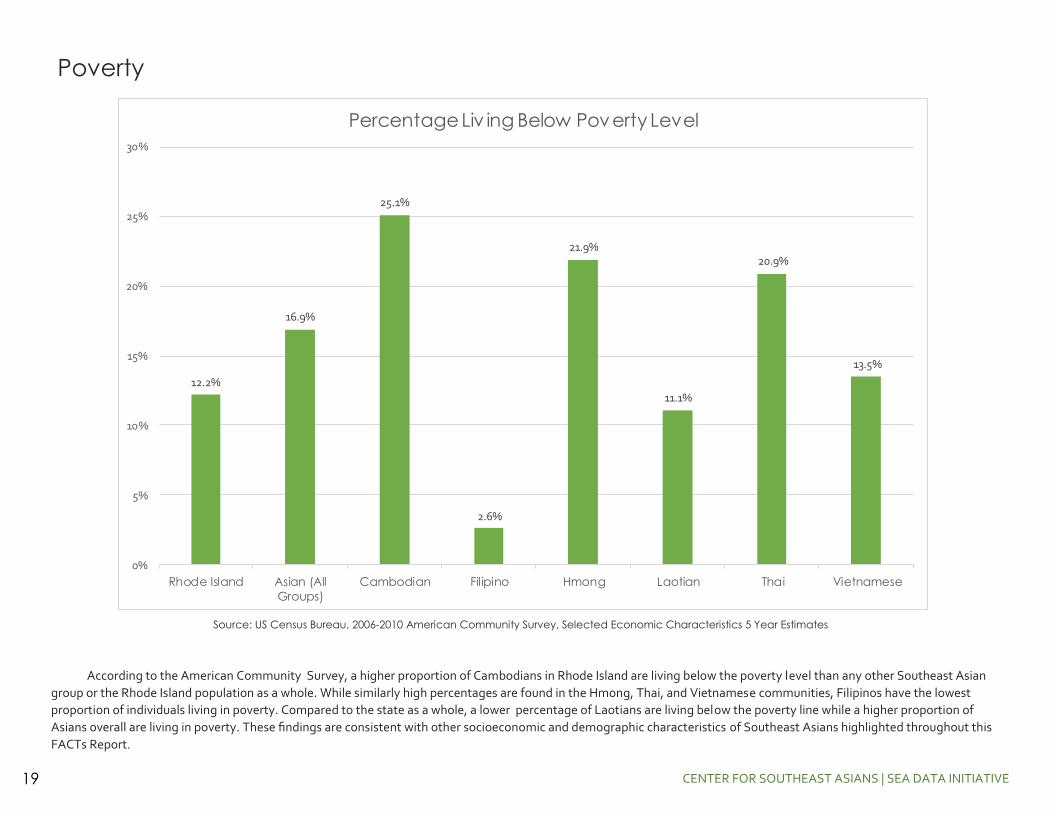
Poverty
Source: US Census Bureau, 2006-2010 American Community Survey, Selected Economic Characteristics 5 Year Estimates
12.2%
16.9%
25.1%
2.6%
21.9%
11.1%
20.9%
13.5%
0%
5%
10%
15%
20%
25%
30%
Rhode Island Asian (All
Groups)
Cambodian Filipino Hmong Laotian Thai Vietnamese
Percentage Liv ing Below Poverty Level
According to the American Community Survey, a higher proportion of Cambodians in Rhode Island are living below the poverty level than any other Southeast Asian
group or the Rhode Island population as a whole. While similarly high percentages are found in the Hmong, Thai, and Vietnamese communities, Filipinos have the lowest
proportion of individuals living in poverty. Compared to the state as a whole, a lower percentage of Laotians are living below the poverty line while a higher proportion of
Asians overall are living in poverty. These findings are consistent with other socioeconomic and demographic characteristics of Southeast Asians highlighted throughout this
FACTs Report.
19
CENTER FOR SOUTHEAST ASIANS | SEA DATA INITIATIVE
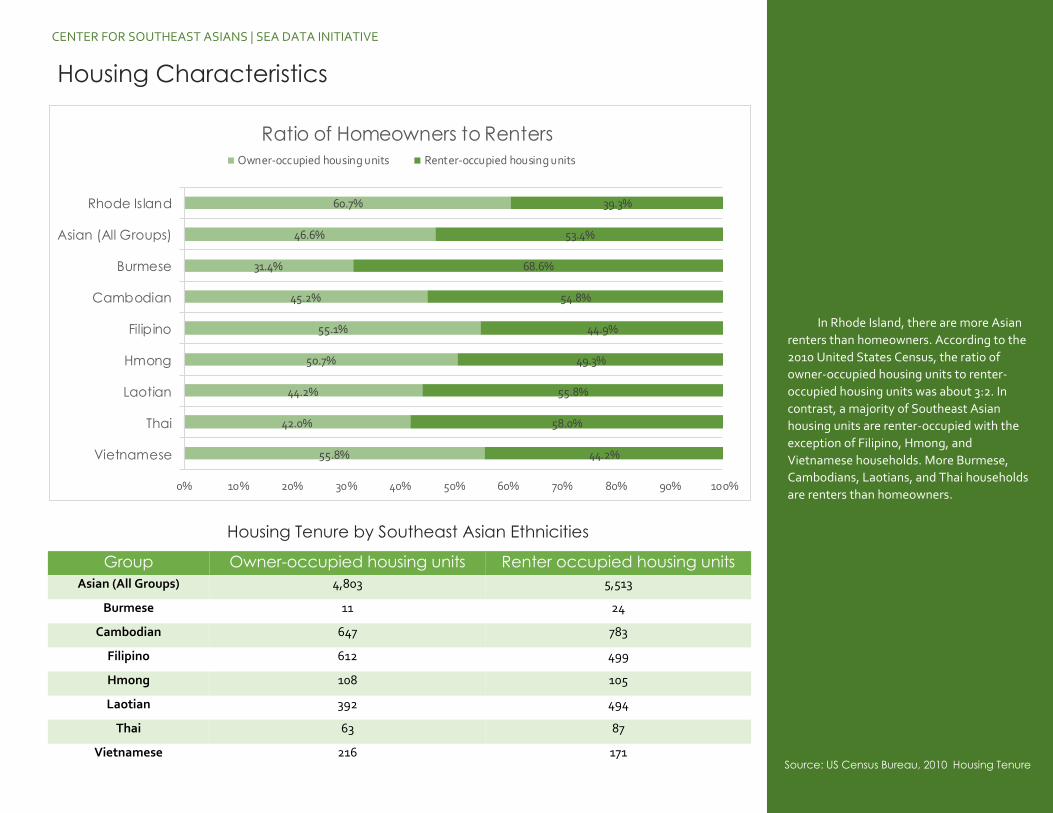
In Rhode Island, there are more Asian
renters than homeowners. According to the
2010 United States Census, the ratio of
owner-occupied housing units to renter-
occupied housing units was about 3:2. In
contrast, a majority of Southeast Asian
housing units are renter-occupied with the
exception of Filipino, Hmong, and
Vietnamese households. More Burmese,
Cambodians, Laotians, and Thai households
are renters than homeowners.
Housing Characteristics
55.8%
42.0%
44.2%
50.7%
55.1%
45.2%
31.4%
46.6%
60.7%
44.2%
58.0%
55.8%
49.3%
44.9%
54.8%
68.6%
53.4%
39.3%
0% 10% 20% 30% 40% 50% 60% 70% 80% 90% 100%
Vietnamese
Thai
Laotian
Hmong
Filipino
Cambodian
Burmese
Asian (All Groups)
Rhode Island
Ratio of Homeowners to Renters
Owner-occupied housing units Renter-occupied housing units
Group Owner-occupied housing units Renter occupied housing units
Asian (All Groups) 4,803 5,513
Burmese 11 24
Cambodian 647 783
Filipino 612 499
Hmong 108 105
Laotian 392 494
Thai 63 87
Vietnamese 216 171 Source: US Census Bureau, 2010 Housing Tenure
Housing Tenure by Southeast Asian Ethnicities
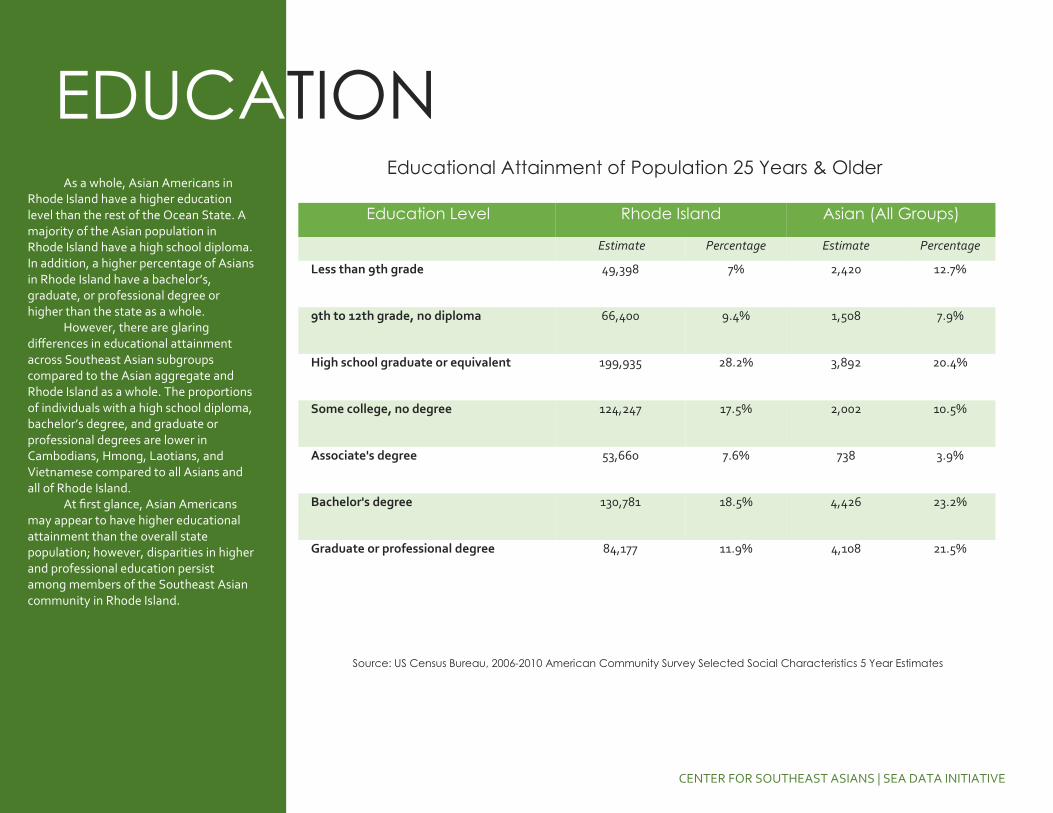
EDUCATION
As a whole, Asian Americans in Rhode Island have a higher education level than the rest of the Ocean State. A majority of the Asian population in Rhode Island have a high school diploma. In addition, a higher percentage of Asians in Rhode Island have a bachelor’s, graduate, or professional degree or higher than the state as a whole.
However, there are glaring differences in educational attainment across Southeast Asian subgroups compared to the Asian aggregate and Rhode Island as a whole. The proportions of individuals with a high school diploma, bachelor’s degree, and graduate or professional degrees are lower in Cambodians, Hmong, Laotians, and Vietnamese compared to all Asians and all of Rhode Island.
At first glance, Asian Americans may appear to have higher educational attainment than the overall state population; however, disparities in higher and professional education persist among members of the Southeast Asian community in Rhode Island.
CENTER FOR SOUTHEAST ASIANS | SEA DATA INITIATIVE
Education Level Rhode Island Asian (All Groups)
Estimate Percentage Estimate Percentage
Less than 9th grade 49,398 7% 2,420 12.7%
9th to 12th grade, no diploma 66,400 9.4% 1,508 7.9%
High school graduate or equivalent 199,935 28.2% 3,892 20.4%
Some college, no degree 124,247 17.5% 2,002 10.5%
Associate's degree 53,660 7.6% 738 3.9%
Bachelor's degree 130,781 18.5% 4,426 23.2%
Graduate or professional degree 84,177 11.9% 4,108 21.5%
Educational Attainment of Population 25 Years & Older
Source: US Census Bureau, 2006-2010 American Community Survey Selected Social Characteristics 5 Year Estimates
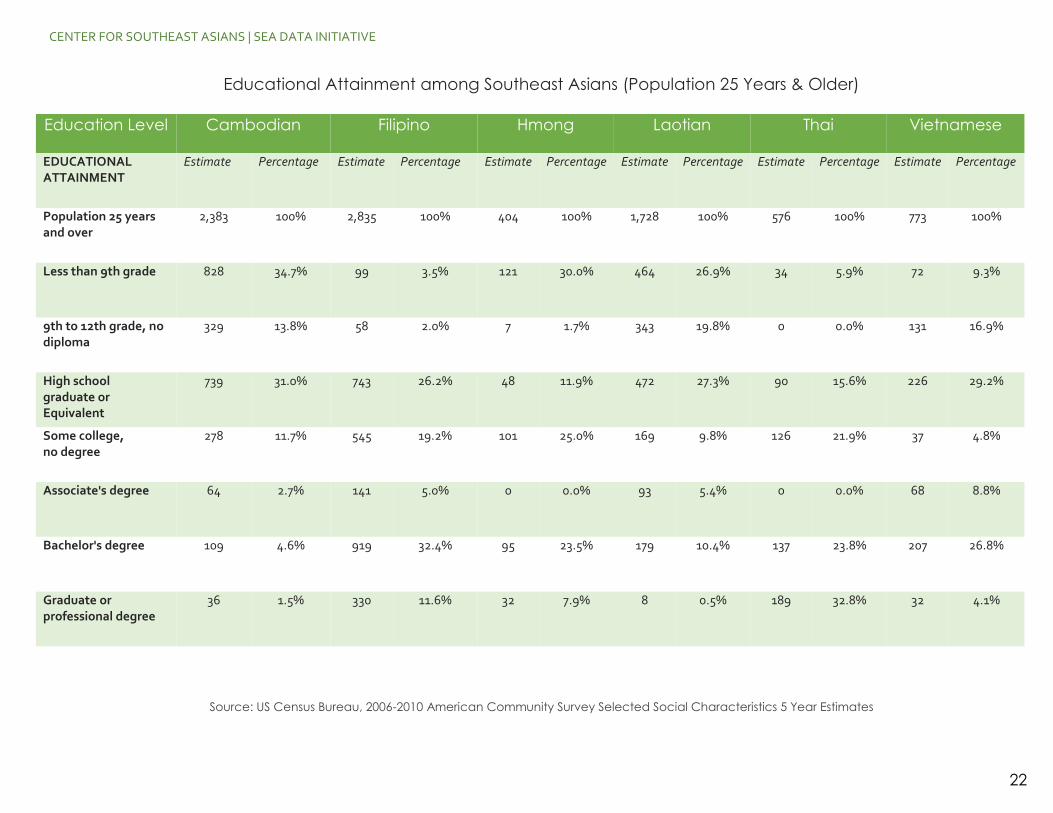
CENTER FOR SOUTHEAST ASIANS | SEA DATA INITIATIVE
Educational Attainment among Southeast Asians (Population 25 Years & Older)
Education Level Cambodian Filipino Hmong Laotian Thai Vietnamese
EDUCATIONAL ATTAINMENT
Estimate Percentage Estimate Percentage Estimate Percentage Estimate Percentage Estimate Percentage Estimate Percentage
Population 25 years and over
2,383 100% 2,835 100% 404 100% 1,728 100% 576 100% 773 100%
Less than 9th grade 828 34.7% 99 3.5% 121 30.0% 464 26.9% 34 5.9% 72 9.3%
9th to 12th grade, no diploma
329 13.8% 58 2.0% 7 1.7% 343 19.8% 0 0.0% 131 16.9%
High school graduate or Equivalent
739 31.0% 743 26.2% 48 11.9% 472 27.3% 90 15.6% 226 29.2%
Some college, no degree
278 11.7% 545 19.2% 101 25.0% 169 9.8% 126 21.9% 37 4.8%
Associate's degree 64 2.7% 141 5.0% 0 0.0% 93 5.4% 0 0.0% 68 8.8%
Bachelor's degree 109 4.6% 919 32.4% 95 23.5% 179 10.4% 137 23.8% 207 26.8%
Graduate or professional degree
36 1.5% 330 11.6% 32 7.9% 8 0.5% 189 32.8% 32 4.1%
Source: US Census Bureau, 2006-2010 American Community Survey Selected Social Characteristics 5 Year Estimates
22
CENTER FOR SOUTHEAST ASIANS | SEA DATA INITIATIVE
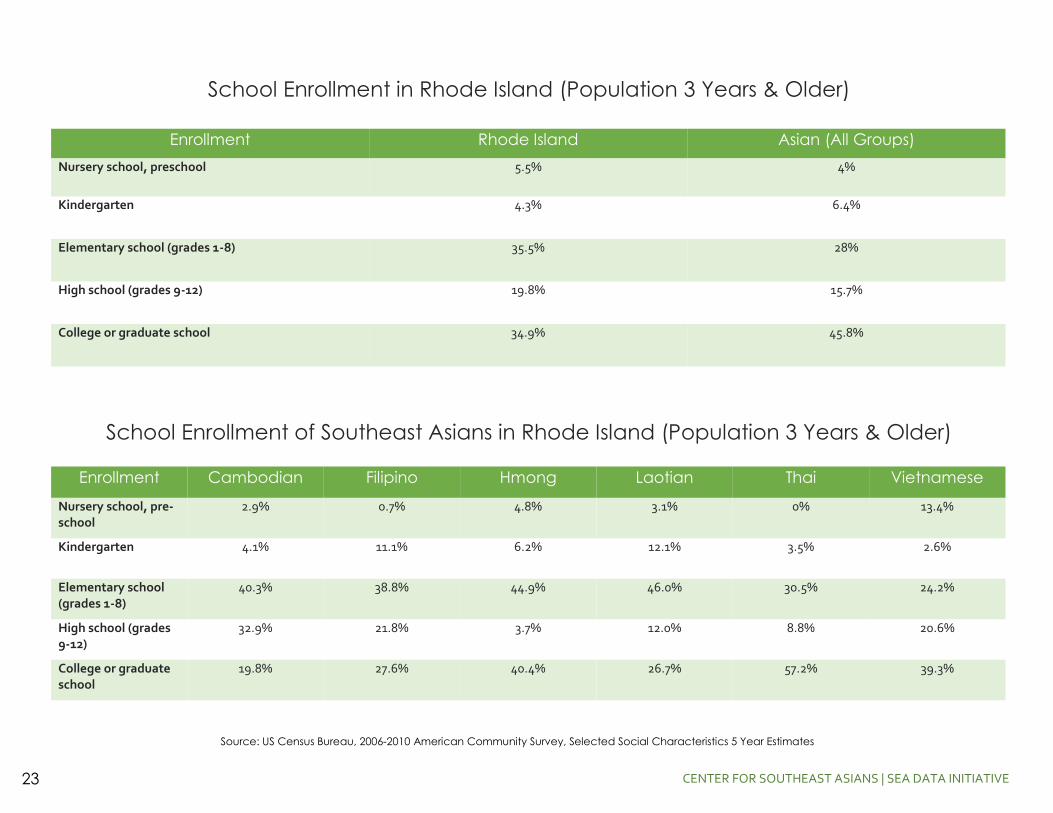
School Enrollment in Rhode Island (Population 3 Years & Older)
Source: US Census Bureau, 2006-2010 American Community Survey, Selected Social Characteristics 5 Year Estimates
Enrollment Rhode Island Asian (All Groups)
Nursery school, preschool 5.5% 4%
Kindergarten 4.3% 6.4%
Elementary school (grades 1-8) 35.5% 28%
High school (grades 9-12) 19.8% 15.7%
College or graduate school 34.9% 45.8%
Enrollment Cambodian Filipino Hmong Laotian Thai Vietnamese
Nursery school, pre-school
2.9% 0.7% 4.8% 3.1% 0% 13.4%
Kindergarten 4.1% 11.1% 6.2% 12.1% 3.5% 2.6%
Elementary school (grades 1-8)
40.3% 38.8% 44.9% 46.0% 30.5% 24.2%
High school (grades 9-12)
32.9% 21.8% 3.7% 12.0% 8.8% 20.6%
College or graduate school
19.8% 27.6% 40.4% 26.7% 57.2% 39.3%
School Enrollment of Southeast Asians in Rhode Island (Population 3 Years & Older)
23
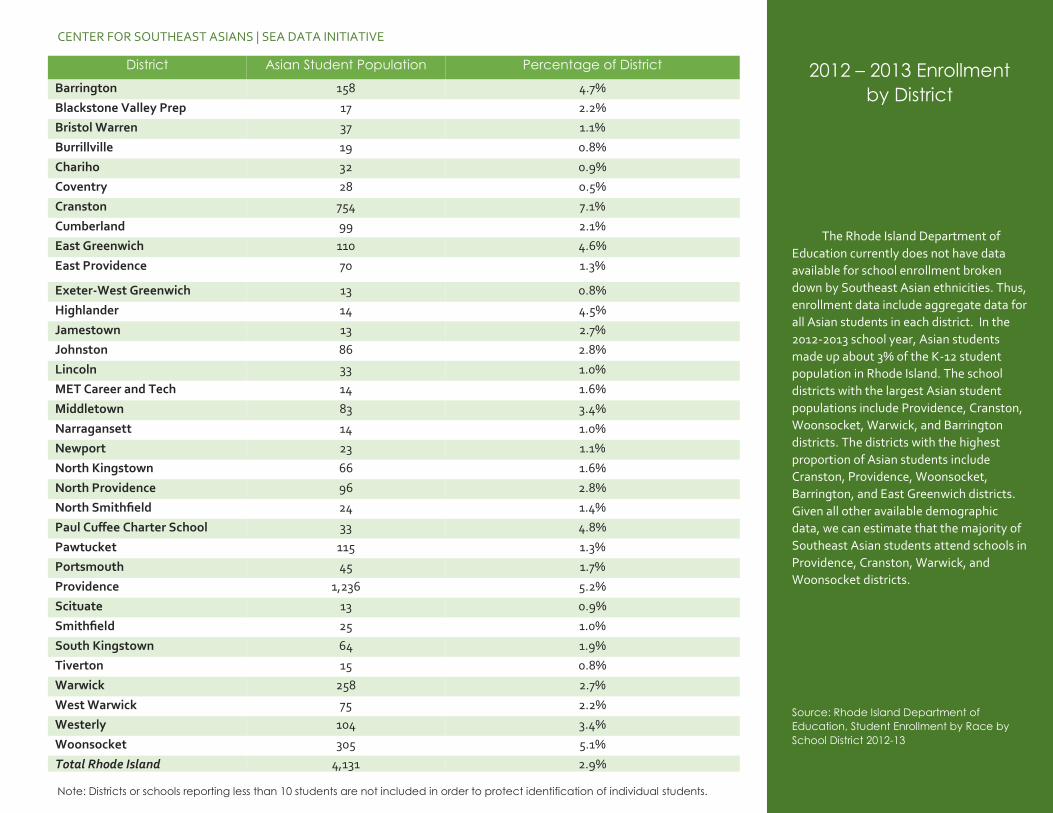
District Asian Student Population Percentage of District
Barrington 158 4.7%
Blackstone Valley Prep 17 2.2%
Bristol Warren 37 1.1%
Burrillville 19 0.8%
Chariho 32 0.9%
Coventry 28 0.5%
Cranston 754 7.1%
Cumberland 99 2.1%
East Greenwich 110 4.6%
East Providence 70 1.3%
Exeter-West Greenwich 13 0.8%
Highlander 14 4.5%
Jamestown 13 2.7%
Johnston 86 2.8%
Lincoln 33 1.0%
MET Career and Tech 14 1.6%
Middletown 83 3.4%
Narragansett 14 1.0%
Newport 23 1.1%
North Kingstown 66 1.6%
North Providence 96 2.8%
North Smithfield 24 1.4%
Paul Cuffee Charter School 33 4.8%
Pawtucket 115 1.3%
Portsmouth 45 1.7%
Providence 1,236 5.2%
Scituate 13 0.9%
Smithfield 25 1.0%
South Kingstown 64 1.9%
Tiverton 15 0.8%
Warwick 258 2.7%
West Warwick 75 2.2%
Westerly 104 3.4%
Woonsocket 305 5.1%
Total Rhode Island 4,131 2.9%
CENTER FOR SOUTHEAST ASIANS | SEA DATA INITIATIVE
Note: Districts or schools reporting less than 10 students are not included in order to protect identification of individual students.
2012 – 2013 Enrollment
by District
The Rhode Island Department of
Education currently does not have data
available for school enrollment broken
down by Southeast Asian ethnicities. Thus,
enrollment data include aggregate data for
all Asian students in each district. In the
2012-2013 school year, Asian students
made up about 3% of the K-12 student
population in Rhode Island. The school
districts with the largest Asian student
populations include Providence, Cranston,
Woonsocket, Warwick, and Barrington
districts. The districts with the highest
proportion of Asian students include
Cranston, Providence, Woonsocket,
Barrington, and East Greenwich districts.
Given all other available demographic
data, we can estimate that the majority of
Southeast Asian students attend schools in
Providence, Cranston, Warwick, and
Woonsocket districts.
Source: Rhode Island Department of
Education, Student Enrollment by Race by
School District 2012-13
CENTER FOR SOUTHEAST ASIANS | SEA DATA INITIATIVE
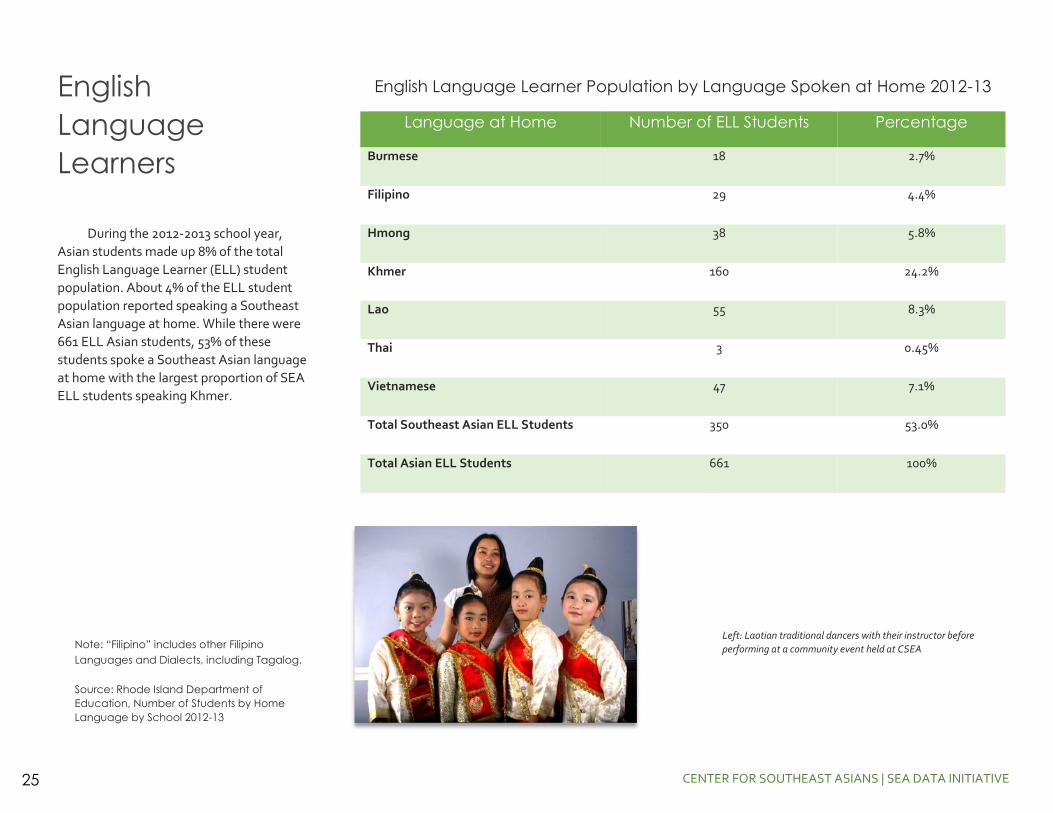
English Language Learner Population by Language Spoken at Home 2012-13
Language at Home Number of ELL Students Percentage
Burmese 18 2.7%
Filipino 29 4.4%
Hmong 38 5.8%
Khmer 160 24.2%
Lao 55 8.3%
Thai 3 0.45%
Vietnamese 47 7.1%
Total Southeast Asian ELL Students 350 53.0%
Total Asian ELL Students 661 100%
English
Language
Learners
During the 2012-2013 school year,
Asian students made up 8% of the total
English Language Learner (ELL) student
population. About 4% of the ELL student
population reported speaking a Southeast
Asian language at home. While there were
661 ELL Asian students, 53% of these
students spoke a Southeast Asian language
at home with the largest proportion of SEA
ELL students speaking Khmer.
Note: “Filipino” includes other Filipino
Languages and Dialects, including Tagalog.
Source: Rhode Island Department of
Education, Number of Students by Home
Language by School 2012-13
Left: Laotian traditional dancers with their instructor before
performing at a community event held at CSEA
25
CENTER FOR SOUTHEAST ASIANS | SEA DATA INITIATIVE
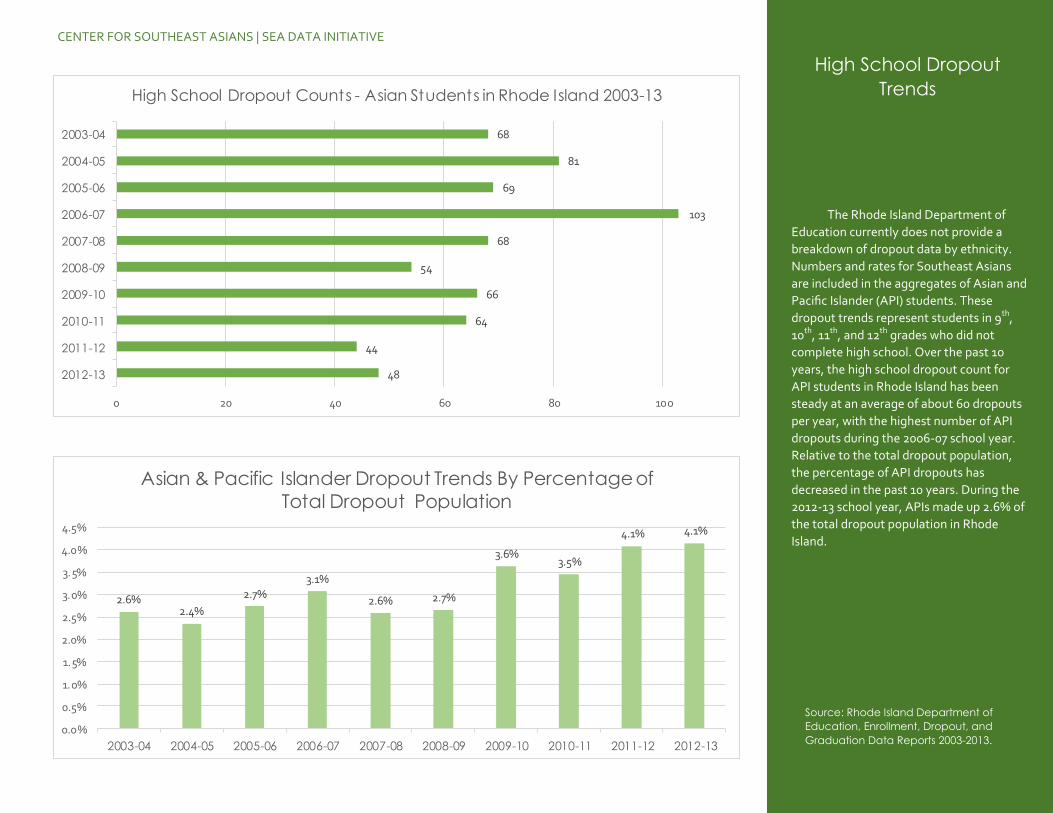
High School Dropout
Trends
The Rhode Island Department of
Education currently does not provide a
breakdown of dropout data by ethnicity.
Numbers and rates for Southeast Asians
are included in the aggregates of Asian and
Pacific Islander (API) students. These
dropout trends represent students in 9th,
10th, 11th, and 12th grades who did not
complete high school. Over the past 10
years, the high school dropout count for
API students in Rhode Island has been
steady at an average of about 60 dropouts
per year, with the highest number of API
dropouts during the 2006-07 school year.
Relative to the total dropout population,
the percentage of API dropouts has
decreased in the past 10 years. During the
2012-13 school year, APIs made up 2.6% of
the total dropout population in Rhode
Island.
Source: Rhode Island Department of
Education, Enrollment, Dropout, and
Graduation Data Reports 2003-2013.
48
44
64
66
54
68
103
69
81
68
0 20 40 60 80 100
2012-13
2011-12
2010-11
2009-10
2008-09
2007-08
2006-07
2005-06
2004-05
2003-04
High School Dropout Counts - Asian Students in Rhode Island 2003-13
2.6%2.4%
2.7%
3.1%
2.6% 2.7%
3.6%3.5%
4.1% 4.1%
0.0%
0.5%
1.0%
1.5%
2.0%
2.5%
3.0%
3.5%
4.0%
4.5%
2003-04 2004-05 2005-06 2006-07 2007-08 2008-09 2009-10 2010-11 2011-12 2012-13
Asian & Pacific Islander Dropout Trends By Percentage of
Total Dropout Population
ACKNOWLEDGEMENTS
This Facts and Community Trends
Report would not be possible without the
generous support of many individuals
and organizations. We would especially
like to thank our principal funders and
partners in this project—the W.K. Kellogg
Foundation and the Asian & Pacific Is-
lander American Health Forum.
We also acknowledge our working
group members and individuals from the
various community organizations and
government agencies for their feedback
and guidance throughout the entire SEA
DATA project.
The contributions of all involved in
this project will be instrumental in build-
ing a stronger Southeast Asian communi-
ty and a stronger Rhode Island. To all
involved in this SEA DATA initiative—we
thank you.
CENTER FOR SOUTHEAST ASIANS | SEA DATA INITIATIVE
Brown University Institute for Community Health Promotion Rhode Island Department of Education
City of Providence Department of Planning & Development Rhode Island Department of Health
City of Providence Office of Public Safety Rhode Island Department of Labor and Training
Rhode Island Department of Children, Youth and Families Rhode Island Department of Transportation
Rhode Island Department of Corrections Rhode Island Office of the Attorney General
Photography by Adam Stoltman and Center for Southeast Asians
CENTER FOR SOUTHEAST ASIANS | SEA DATA INITIATIVE
Data Sources
1. Asian American Justice Center, Asian and Pacific Islander American Vote, National Asian American Survey. Behind the Numbers: Post-
Election Survey of Asian American and Pacific Islander Voters in 2012.
2. Enrollment Counts by School and District 2012-2013 provided by Rhode Island Department of Education
3. Enrollment Counts by School by Home Language for English Language Learners 2012-2013 provided by Rhode Island Department of
Education
4. Number of Dropouts by Grade and Race provided by Rhode Island Department of Education Enrollment, Dropout and Graduation Data
Reports 2003 - 2013
5. Rhode Island Unemployment Statistics provided by Rhode Island Department of Labor and Training Labor Market Information Data Center
6. United States Census Bureau, 2006-2010 American Community Survey, Selected Economic Characteristics 5 Year Estimates
7. United States Census Bureau, 2006-2010 American Community Survey, Selected Housing Characteristics 5 Year Estimates
8. United States Census Bureau, 2006-2010 American Community Survey, Selected Social Characteristics 5 Year Estimates
9. United Status Census Bureau, 2010 Census Profile of General Population and Housing Characteristics
28
Main Office
270 Elmwood Avenue
Providence, RI 02907
Phone: 401-274-8811 | Fax: 401-274-8877
Satellite Office
727 Front Street, Suite 110
Woonsocket, RI 02895
Phone: 401-762-0343 | Fax: 401-762-1459
The mission of the Center for Southeast Asians is to promote the
prosperity, heritage, and leadership of Southeast Asians in Rhode Island.
CSEA Center for Southeast Asians