Embed Size (px)
Citation preview
Southeast Asia Tech Investment H1 2018
dmpABOUT CENTO VENTURES
2
Cento Ventures is a venture capital firm focused on technology startups building products and services emerging from the digital transformation of promising growth markets, particularly Southeast Asia.
We are based in Singapore and backed by a team well experienced in internet business. We operate three funds that invest across industries through a disciplined, well-researched approach to locate technology investment opportunities originating from the Southeast Asian region.
Our investments are guided by these three principles:
Sectors ready for digital transformation
We believe that there is a great opportunity for technology to solve some of the inefficiencies present in growth markets. However, technology alone does not digitise industries. Most of our investments apply innovative business models to industries that are set in their ways, using technology as an enabler.
Early stage, but with proof points
Cento Ventures aims to be the first institutional investor in most of our deals. We believe this helps us establish a solid relationship with the founder, and influence the strategic direction of the company. Our investments are most frequently at Series A and we usually lead the round. We maintain a realistic approach to investment and exit valuations, one that is driven by data we gather on venture capital deals in Southeast Asia.
Expansion to multiple growth markets
Cento Ventures seeks to help our founders build large digital companies that are leaders in their industry or category. In a fragmented region like Southeast Asia, operating across multiple markets is almost inevitable. We look for founding teams that share this ambition and focus our support on making their expansion easier. We have a suspicion that great companies born in one growth market have an opportunity to replicate their success across many others.
Cento Ventures is convinced that the opportunity exists for Southeast Asian entrepreneurs to build transformational digital companies. Learn more about us at cento.vc or our Facebook or Linkedin pages.

dmp
Introduction
dmpINTRODUCTION
4
Cento Ventures has been tracking data on digital investment activity in Southeast Asia for a number of years. It is our pleasure to continue sharing the data and insights we accumulated in our second Southeast Asia tech investment report, covering up to the first half of 2018.
The headline story of Southeast Asia is the continued growth in technology investment. A record amount of $7.3B was invested during the first half of 2018, compared to $4.4B in H2 2017 and $1.2B in H1 2017. This suggests a healthy, and growing interest in the potential for Southeast Asia’s tech startups. We estimate that this amount may exceed $12B for the full year, based on deals that we are tracking in the second half of the year.
A closer look at the data partly emphasizes the progression of existing trends, but also reveals interesting findings emerging in 2018:
- A few familiar companies capture most investment
2018 sees a continuation of ‘mega-deals’ as later stage companies capture ever larger investments. 83% of funding in H1 2018 was captured by only 4 investments (Grab, Go-Jek, Sea Group, Lazada).
- A new wave of companies are approaching later stages
Although the majority of capital will likely continue to be associated with a few familiar names, we also observe a growing cohort of other late stage companies who are raising larger rounds. The amount of investment and number of companies who have successfully raised between $10M – $50M show a consistent growth while $50M - $100M cohort grew over 50% from the same period in 2017 with deals such as Ninja Van’s $87M, Carousell $85M and Carro $64M round.
- Concentration of capital by country
Indonesia accounts for almost three-quarters of the capital invested in Southeast Asia. However, the number of deals done can better illustrate the distribution of activities across the region. By deal count, allocations to Indonesia, Vietnam, Thailand, and Malaysia appear to be consistent with the past few years. Singapore has experienced a growth in interest, in contrast with the Philippines which has been cooling off in both investment amount and number of deals since 2016.
- Diversification of capital by sector
We also continue to observe increasing investment into a wider range of sectors. Logistics and real estate startup investments demonstrate solid growth. Enterprise software maintained the level of investment received during 2017. However, some sectors such as employment have not picked up investor interest despite having produced large exits in the past.
- Series B is gradually growing
The cohort of companies that received seed investment in 2013 does illustrate a significant increase in successful series B funding rate. However, the rates for other cohorts are still relatively low. More time is needed to see how much follow-on funding pipeline in Southeast Asia resembles those from more mature funding environments like the United States and Europe.
- Growth in funds raised for Southeast Asia
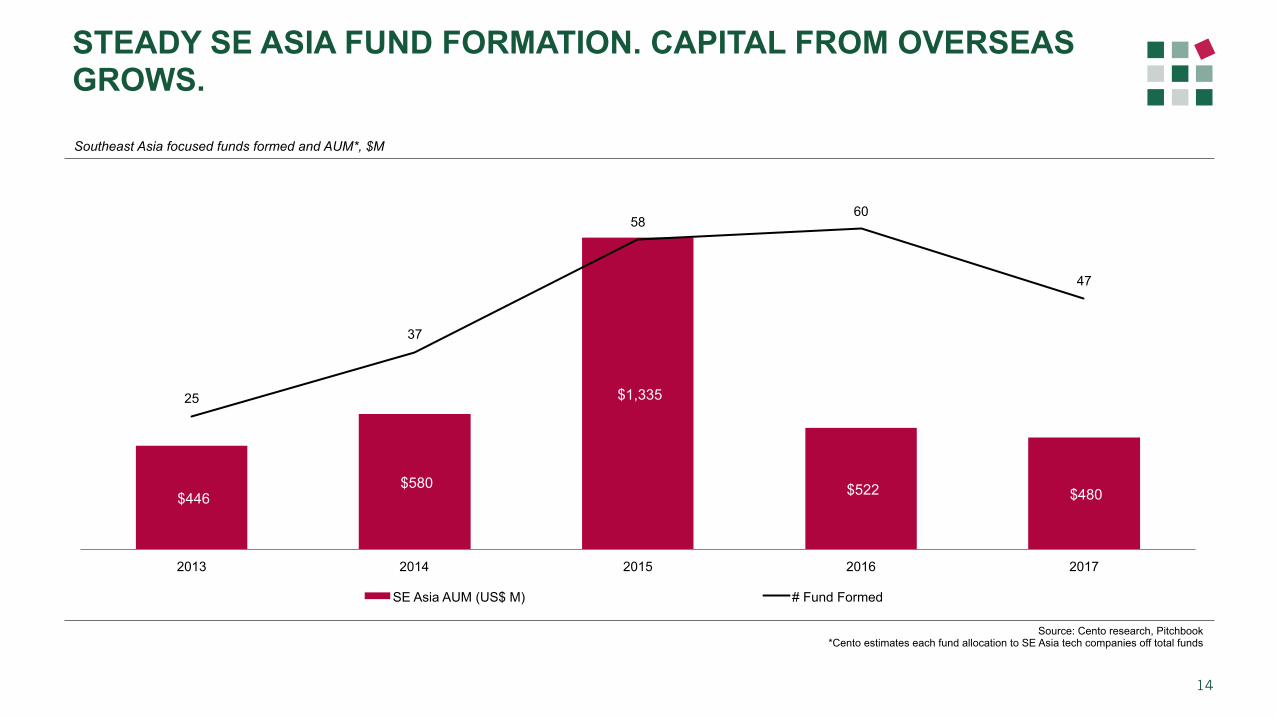
2018 shows a significant jump in the volume of funds allocated to Southeast Asia. This includes local funds that have progressed into later stage investment, multi-regional funds that have increased their allocations to Southeast Asia, and sector or country specific funds.
dmpINTRODUCTION
5
- Secondary sales and M&A continue to provide liquidity
Although 2017 saw Sea Group’s NYSE IPO, as well as several local IPOs in Indonesia, 2018 data indicates that trade exits and secondary sales of shares are still the main sources of liquidity in the region. Exits in the $20M - $50M range are increasing in frequency, with higher end valuations being in excess of $300M.
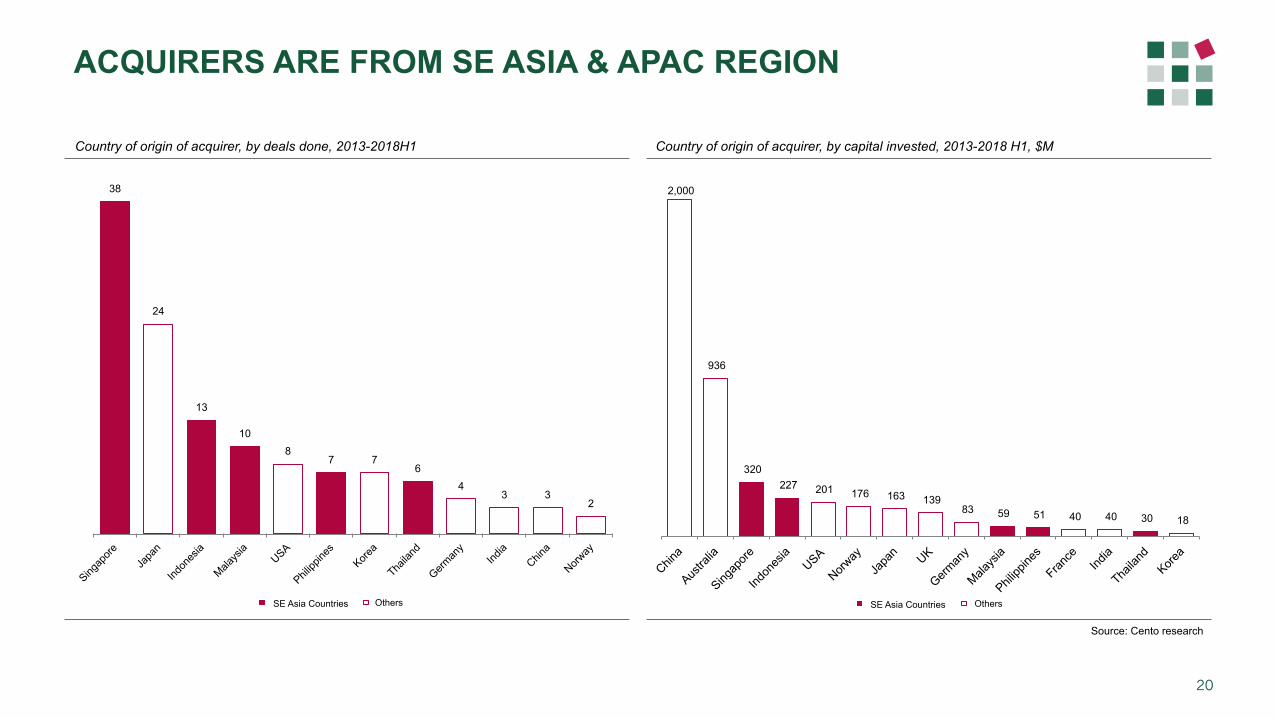
The majority of acquirers in 2018 have been technology companies within Southeast Asia region. These companies tend to be those who are cash-rich and embark on acquisitions as part of a regional and platform expansion strategy. Some are active acquirers such as Grab, while many are first time acquirers that are early in their regional expansion phrases such as Carro, 99.co, Dahmakan, and Shopback. Singapore-based acquirers still contribute the largest number of deals while Chinese acquirers are the largest spenders.
- Declining early stage activities
Deals below $500K continue to decline since their peak in 2015. This could partly be influenced by existing seed investors migration toward later stage investment, and the media’s attention toward later stage mega-deals overwhelming signals from smaller ones.
Thank you
Mark Suckling
Laphat Tantiphipop
Marco Hadisurya
Southeast Asia in 2018 remains a very attractive region for tech investors. We note that while some of the factors we highlighted in last year’s report remain, others are changing. We think high-quality startups exist beyond a few heavily-invested parts of the region and there has been some improvement in bridging the funding gaps that remain. Every year that brings more successful exit stories will help inspire more founders to start companies and attract more investors to the ASEAN region.
Southeast Asia’s tech continues to mature, and we hope this report helps anyone, whether they are startup founders, investors, or policymakers, achieve a better understanding of the landscape that we all operate within.

dmp
Investment landscape
dmpRECORD INVESTMENT IN H1 2018. $12B FORECAST FOR FY 2018
7
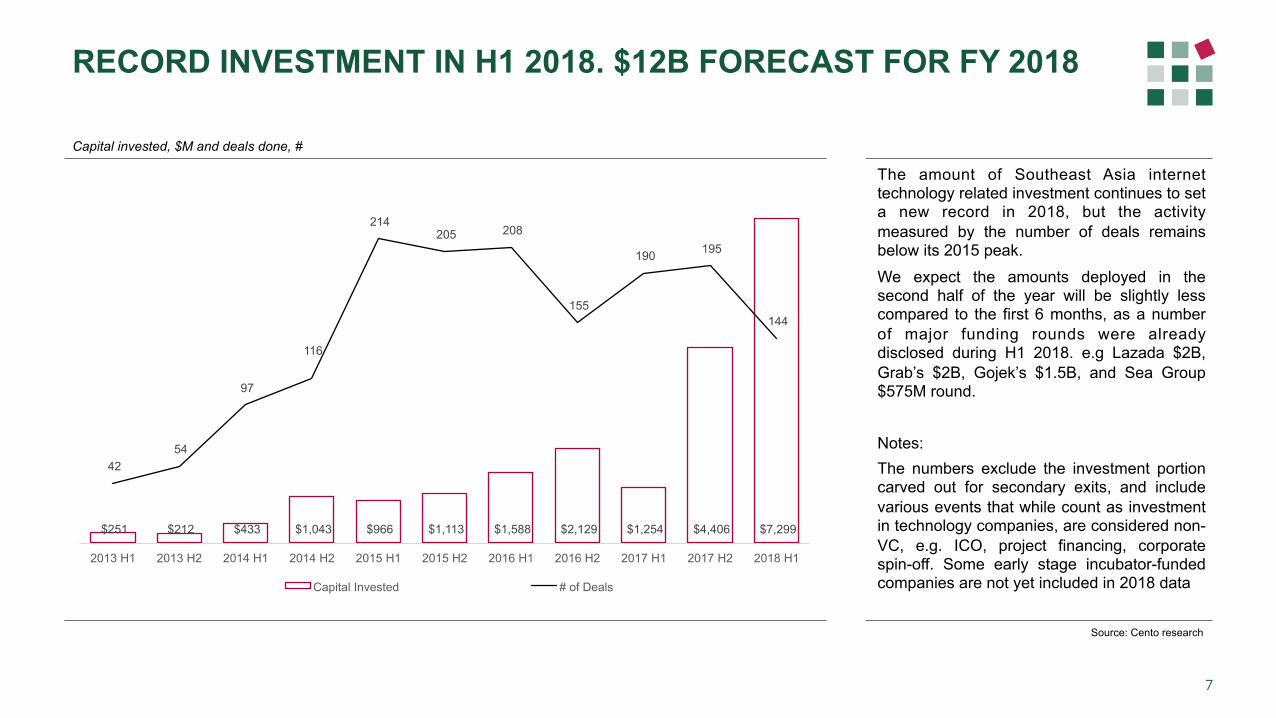
Capital invested, $M and deals done, #
The amount of Southeast Asia internet technology related investment continues to set a new record in 2018, but the activity measured by the number of deals remains below its 2015 peak.
We expect the amounts deployed in the second half of the year will be slightly less compared to the first 6 months, as a number of major funding rounds were already disclosed during H1 2018. e.g Lazada $2B, Grab’s $2B, Gojek’s $1.5B, and Sea Group $575M round.
Notes: The numbers exclude the investment portion carved out for secondary exits, and include various events that while count as investment in technology companies, are considered non-VC, e.g. ICO, project financing, corporate spin-off. Some early stage incubator-funded companies are not yet included in 2018 data
Source: Cento research
$251 $212 $433 $1,043 $966 $1,113 $1,588 $2,129 $1,254 $4,406 $7,299
42 54
97
116
214 205 208
155
190 195
144
-
50
100
150
200
250
$-
$1,000
$2,000
$3,000
$4,000
$5,000
$6,000
$7,000
$8,000
2013 H1 2013 H2 2014 H1 2014 H2 2015 H1 2015 H2 2016 H1 2016 H2 2017 H1 2017 H2 2018 H1
Capital Invested # of Deals
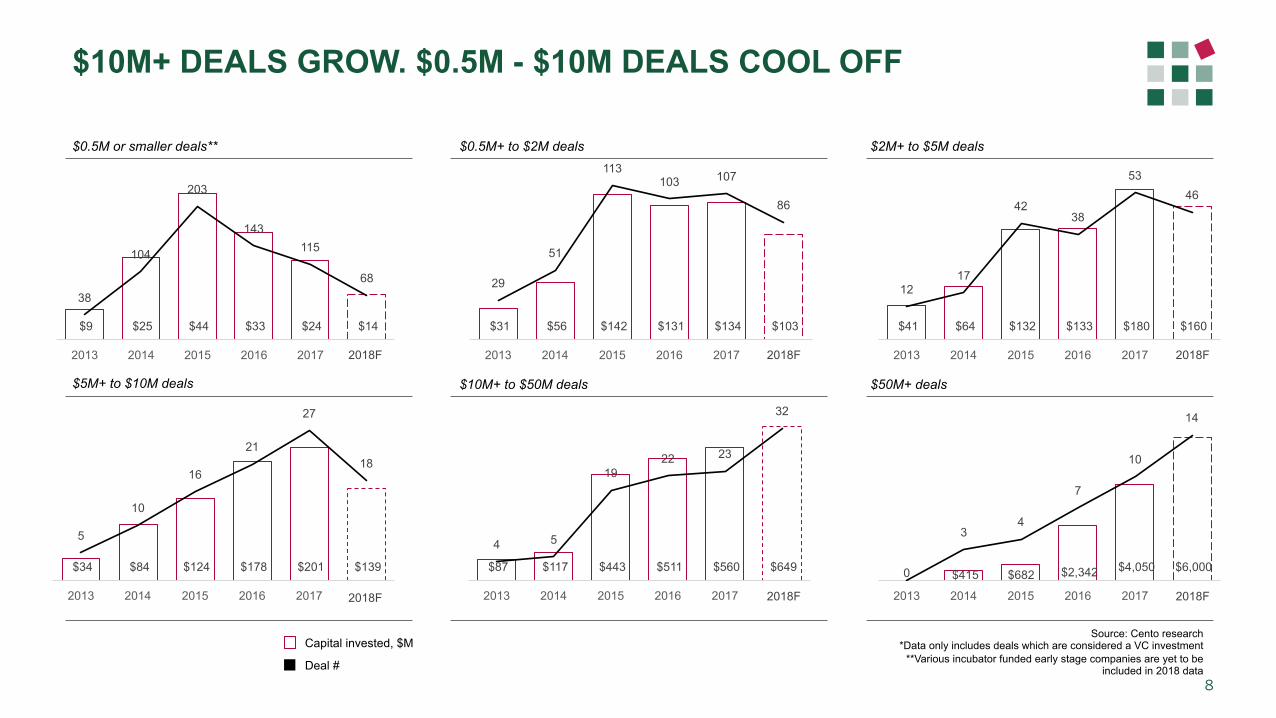
dmp$10M+ DEALS GROW. $0.5M - $10M DEALS COOL OFF
8
$0.5M or smaller deals** $0.5M+ to $2M deals $2M+ to $5M deals
$5M+ to $10M deals $10M+ to $50M deals $50M+ deals
Source: Cento research *Data only includes deals which are considered a VC investment
**Various incubator funded early stage companies are yet to be included in 2018 data
Capital invested, $M
Deal #
$9 $25 $44 $33 $24 $14
38
104
203
143 115
68
2013 2014 2015 2016 2017 2018 H1
$31 $56 $142 $131 $134 $103
29
51
113 103 107
86
2013 2014 2015 2016 2017 2018 H1
$41 $64 $132 $133 $180 $160
12 17
42 38
53 46
2013 2014 2015 2016 2017 2018 H1
$34 $84 $124 $178 $201 $139
5
10
16
21
27
18
2013 2014 2015 2016 2017 2018 H1
$87 $117 $443 $511 $560 $649
4 5
19 22 23
32
2013 2014 2015 2016 2017 2018 H1
$415 $682 $2,342 $4,050 $6,000 0
3 4
7
10
14
2013 2014 2015 2016 2017 2018 H1 2018F 2018F 2018F
2018F 2018F 2018F
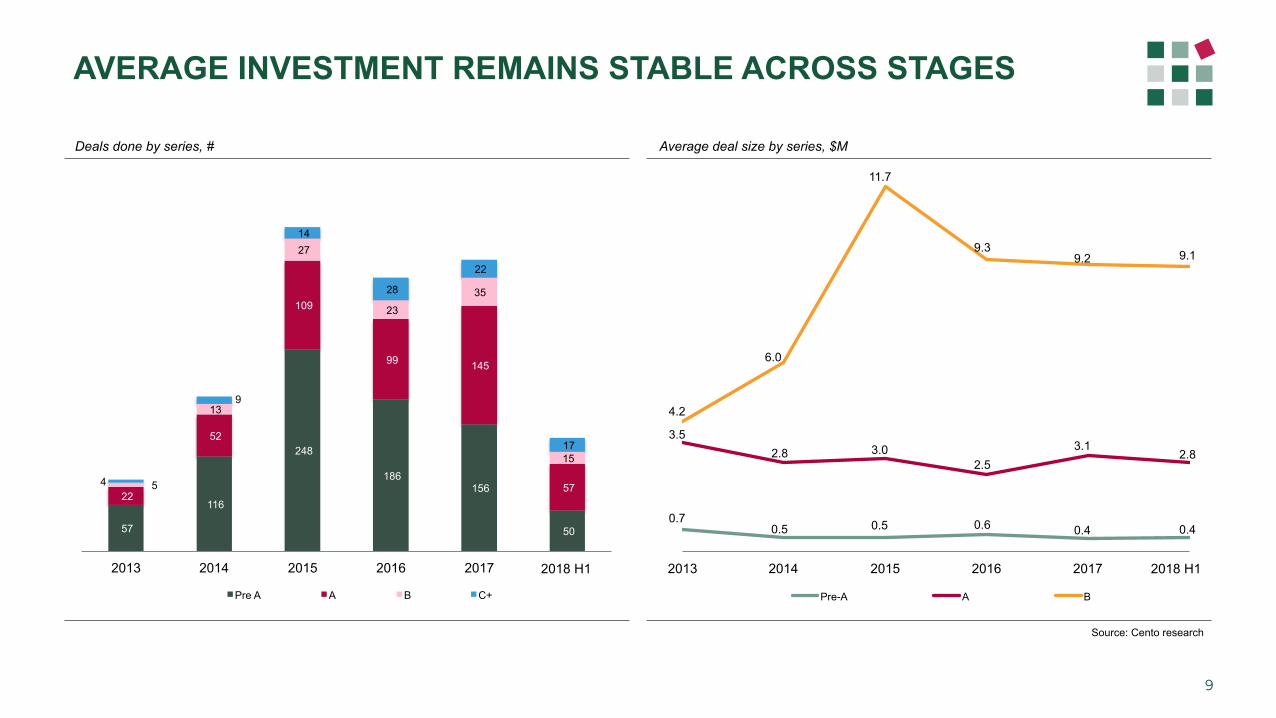
dmpAVERAGE INVESTMENT REMAINS STABLE ACROSS STAGES
9
Deals done by series, # Average deal size by series, $M
Source: Cento research
57
116
248
186 156
50
22
52
109
99 145
57 5
13
27
23
35
15
4
9
14
28
22
17
2013 2014 2015 2016 2017 2018
Pre A A B C+
2018 H1
0.7 0.5 0.5 0.6 0.4 0.4
3.5 2.8 3.0
2.5 3.1
2.8
4.2
6.0
11.7
9.3 9.2 9.1
2013 2014 2015 2016 2017 2018
Pre-A A B
2018 H1
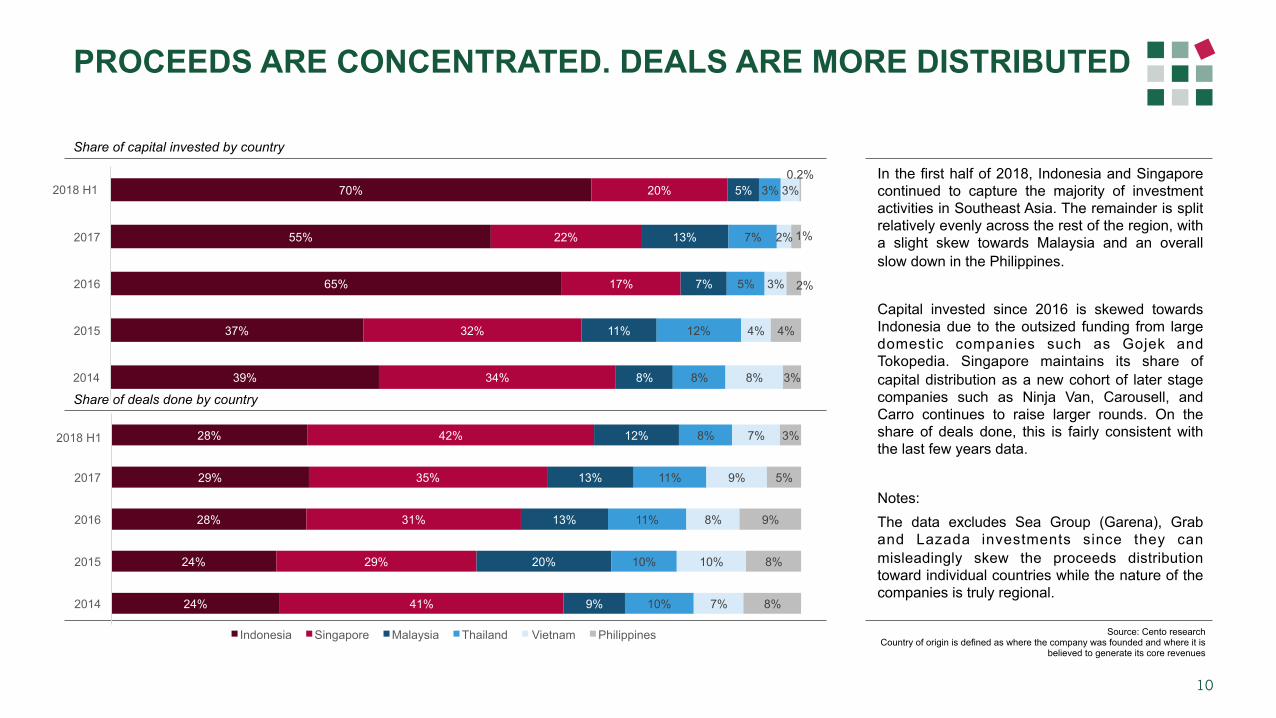
dmpPROCEEDS ARE CONCENTRATED. DEALS ARE MORE DISTRIBUTED
10
Source: Cento research Country of origin is defined as where the company was founded and where it is
believed to generate its core revenues
In the first half of 2018, Indonesia and Singapore continued to capture the majority of investment activities in Southeast Asia. The remainder is split relatively evenly across the rest of the region, with a slight skew towards Malaysia and an overall slow down in the Philippines. Capital invested since 2016 is skewed towards Indonesia due to the outsized funding from large domestic companies such as Gojek and Tokopedia. Singapore maintains its share of capital distribution as a new cohort of later stage companies such as Ninja Van, Carousell, and Carro continues to raise larger rounds. On the share of deals done, this is fairly consistent with the last few years data.
Notes: The data excludes Sea Group (Garena), Grab and Lazada investments since they can misleadingly skew the proceeds distribution toward individual countries while the nature of the companies is truly regional.
Share of capital invested by country
Share of deals done by country
39%
37%
65%
55%
70%
34%
32%
17%
22%
20%
8%
11%
7%
13%
5%
8%
12%
5%
7%
3%
8%
4%
3%
2%
3%
3%
4%
2%
1%
0.2%
2014
2015
2016
2017
2018 2018 H1
24%
24%
28%
29%
28%
41%
29%
31%
35%
42%
9%
20%
13%
13%
12%
10%
10%
11%
11%
8%
7%
10%
8%
9%
7%
8%
8%
9%
5%
3%
2014
2015
2016
2017
2018
Indonesia Singapore Malaysia Thailand Vietnam Philippines
2018 H1
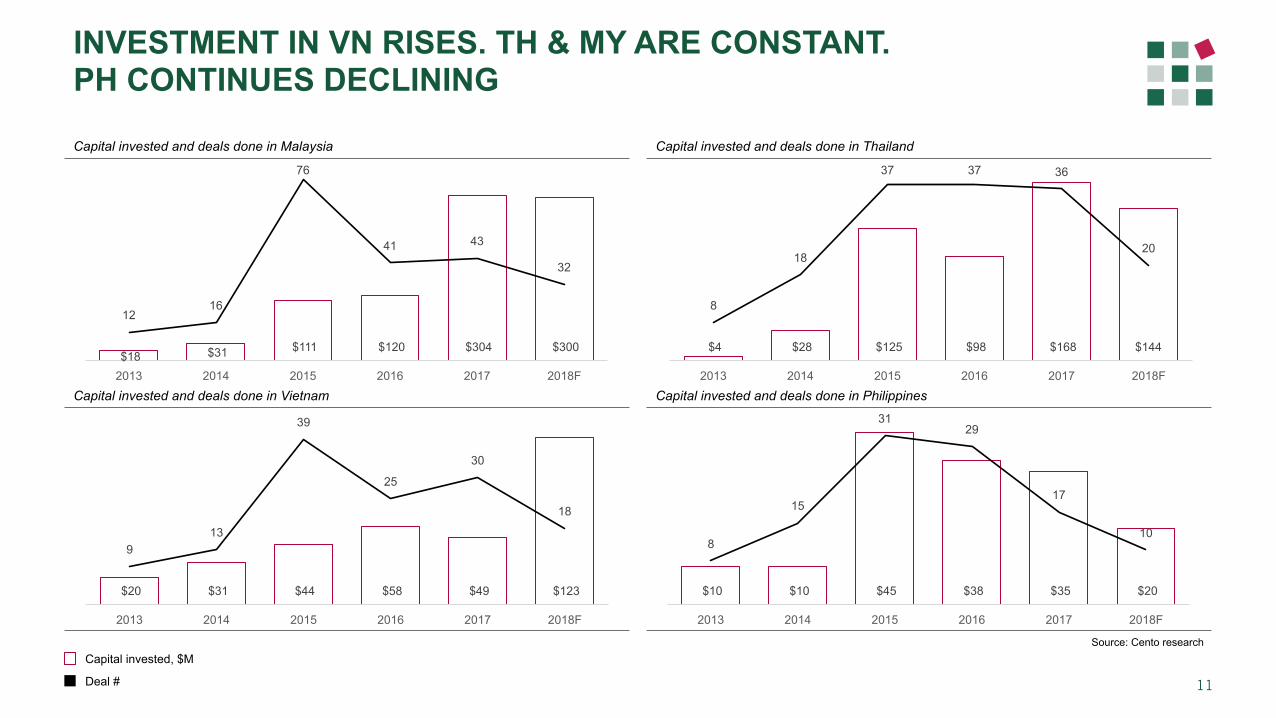
dmpINVESTMENT IN VN RISES. TH & MY ARE CONSTANT. PH CONTINUES DECLINING
11
Capital invested and deals done in Malaysia
Capital invested and deals done in Vietnam
Capital invested and deals done in Thailand
Capital invested and deals done in Philippines
Source: Cento research
$18 $31 $111 $120 $304 $300
12 16
76
41 43
32
2013 2014 2015 2016 2017 2018F
$4 $28 $125 $98 $168 $144
8
18
37 37 36
20
2013 2014 2015 2016 2017 2018F
$20 $31 $44 $58 $49 $123
9 13
39
25
30
18
2013 2014 2015 2016 2017 2018F
$10 $10 $45 $38 $35 $20
8
15
31 29
17
10
2013 2014 2015 2016 2017 2018F
Capital invested, $M
Deal #
dmpGRADUAL DIVERSIFICATION ACROSS INDUSTRY SECTORS
12
Deals done by sector, $M
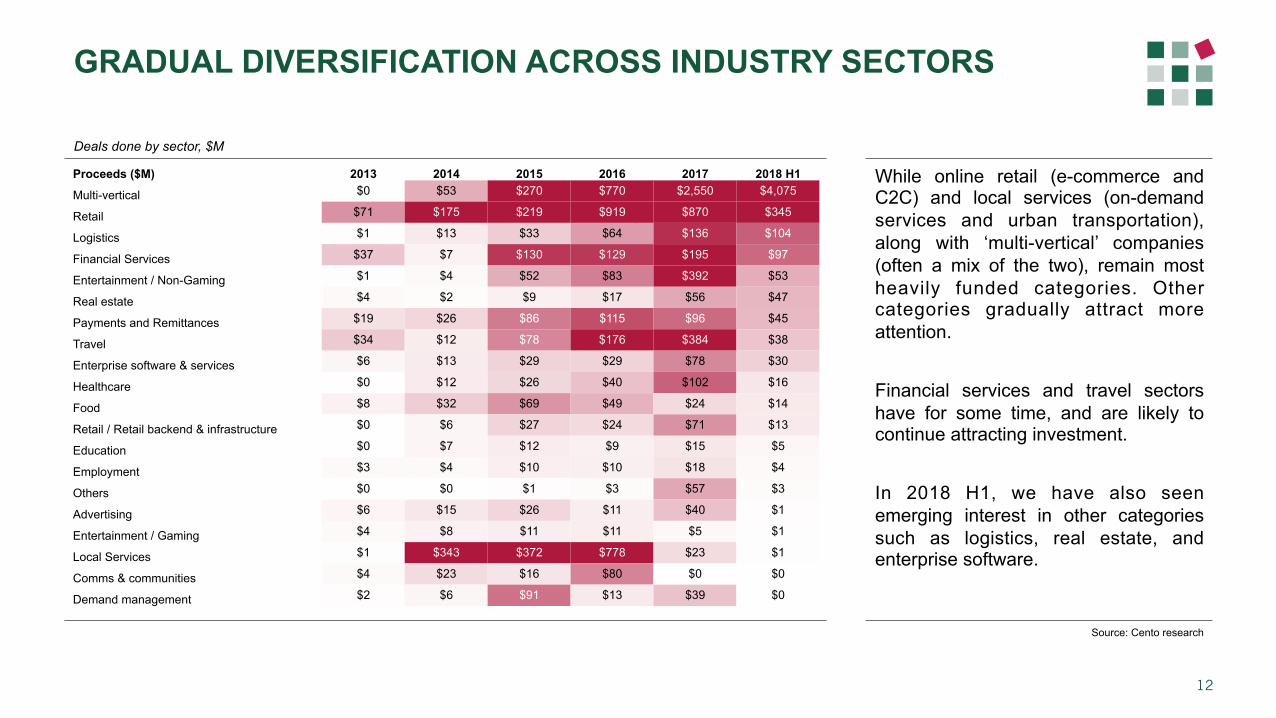
While online retail (e-commerce and C2C) and local services (on-demand services and urban transportation), along with ‘multi-vertical’ companies (often a mix of the two), remain most heavily funded categories. Other categories gradually attract more attention. Financial services and travel sectors have for some time, and are likely to continue attracting investment. In 2018 H1, we have also seen emerging interest in other categories such as logistics, real estate, and enterprise software.
Source: Cento research
Proceeds ($M) 2013 2014 2015 2016 2017 2018 H1
Multi-vertical $0 $53 $270 $770 $2,550 $4,075
Retail $71 $175 $219 $919 $870 $345
Logistics $1 $13 $33 $64 $136 $104
Financial Services $37 $7 $130 $129 $195 $97
Entertainment / Non-Gaming $1 $4 $52 $83 $392 $53
Real estate $4 $2 $9 $17 $56 $47
Payments and Remittances $19 $26 $86 $115 $96 $45
Travel $34 $12 $78 $176 $384 $38
Enterprise software & services $6 $13 $29 $29 $78 $30
Healthcare $0 $12 $26 $40 $102 $16
Food $8 $32 $69 $49 $24 $14
Retail / Retail backend & infrastructure $0 $6 $27 $24 $71 $13
Education $0 $7 $12 $9 $15 $5
Employment $3 $4 $10 $10 $18 $4
Others $0 $0 $1 $3 $57 $3
Advertising $6 $15 $26 $11 $40 $1
Entertainment / Gaming $4 $8 $11 $11 $5 $1
Local Services $1 $343 $372 $778 $23 $1
Comms & communities $4 $23 $16 $80 $0 $0
Demand management $2 $6 $91 $13 $39 $0
dmp% of companies raising seed round that raised follow-on rounds
13
Source: Cento research https://www.cbinsights.com/research/venture-capital-funnel-2/
http://www.atomico.com/news/the-state-of-european-tech-2016
A SERIES B REMAINS A CHALLENGE
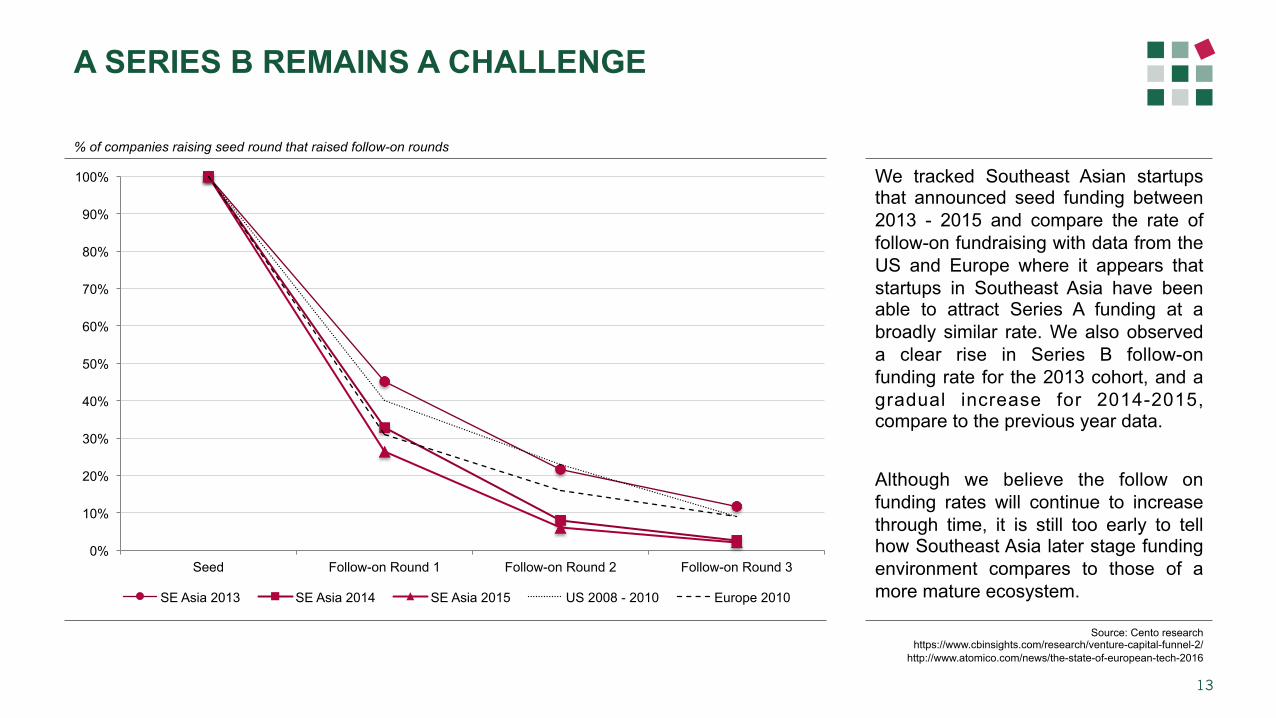
We tracked Southeast Asian startups that announced seed funding between 2013 - 2015 and compare the rate of follow-on fundraising with data from the US and Europe where it appears that startups in Southeast Asia have been able to attract Series A funding at a broadly similar rate. We also observed a clear rise in Series B follow-on funding rate for the 2013 cohort, and a gradual increase for 2014-2015, compare to the previous year data. Although we believe the follow on funding rates will continue to increase through time, it is still too early to tell how Southeast Asia later stage funding environment compares to those of a more mature ecosystem.
0%
10%
20%
30%
40%
50%
60%
70%
80%
90%
100%
Seed Follow-on Round 1 Follow-on Round 2 Follow-on Round 3
SE Asia 2013 SE Asia 2014 SE Asia 2015 US 2008 - 2010 Europe 2010
dmpSTEADY SE ASIA FUND FORMATION. CAPITAL FROM OVERSEAS GROWS.
14
Southeast Asia focused funds formed and AUM*, $M
Source: Cento research, Pitchbook *Cento estimates each fund allocation to SE Asia tech companies off total funds
$446 $580
$1,335
$522 $480
25
37
58 60
47
2013 2014 2015 2016 2017
SE Asia AUM (US$ M) # Fund Formed
dmp $209 *
$200
$150
$135
$120
$100 $100 $100 $100 $100* $90*
Sequoia Capital Latitude Venture Partners
EV Growth Openspace Ventures
Insignia Venture Partners
Golden Gate Ventures
Qualgro Tin Men VinaCapital Ventures
Eight Roads B Capital Group
15
OVER $1.5B SE ASIA ALLOCATION FROM 36 FUNDS
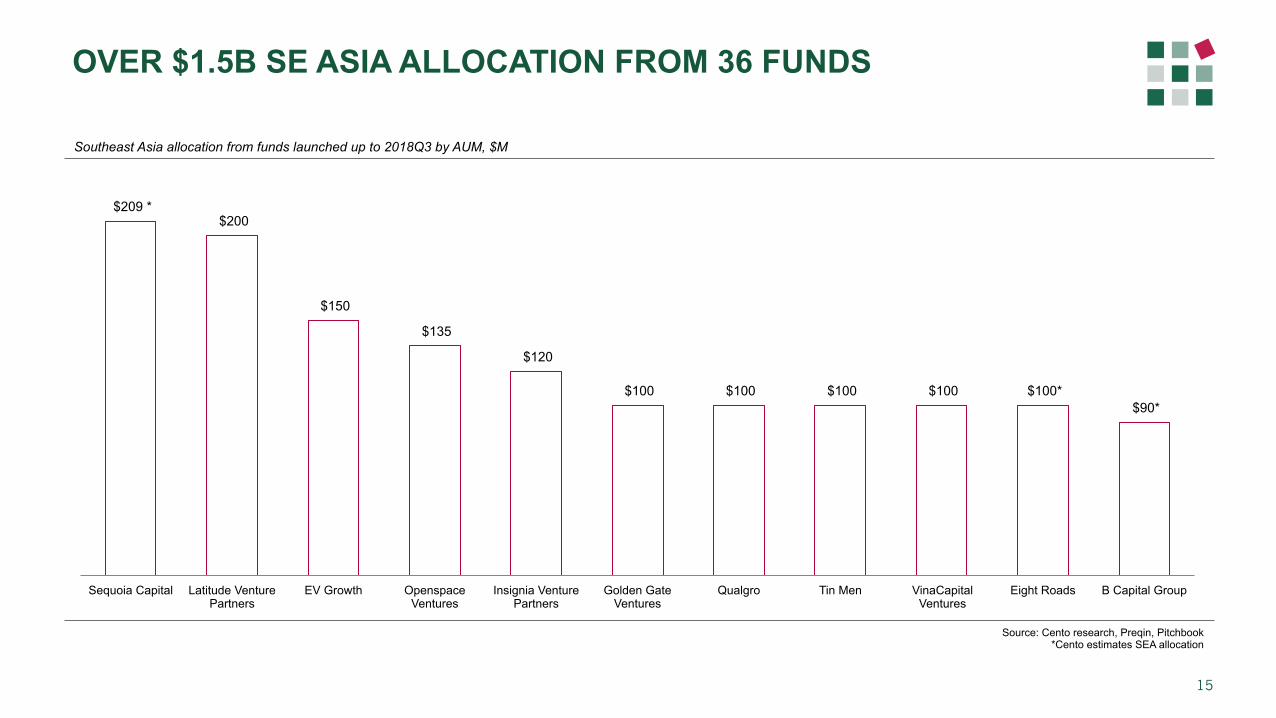
Southeast Asia allocation from funds launched up to 2018Q3 by AUM, $M
Source: Cento research, Preqin, Pitchbook *Cento estimates SEA allocation
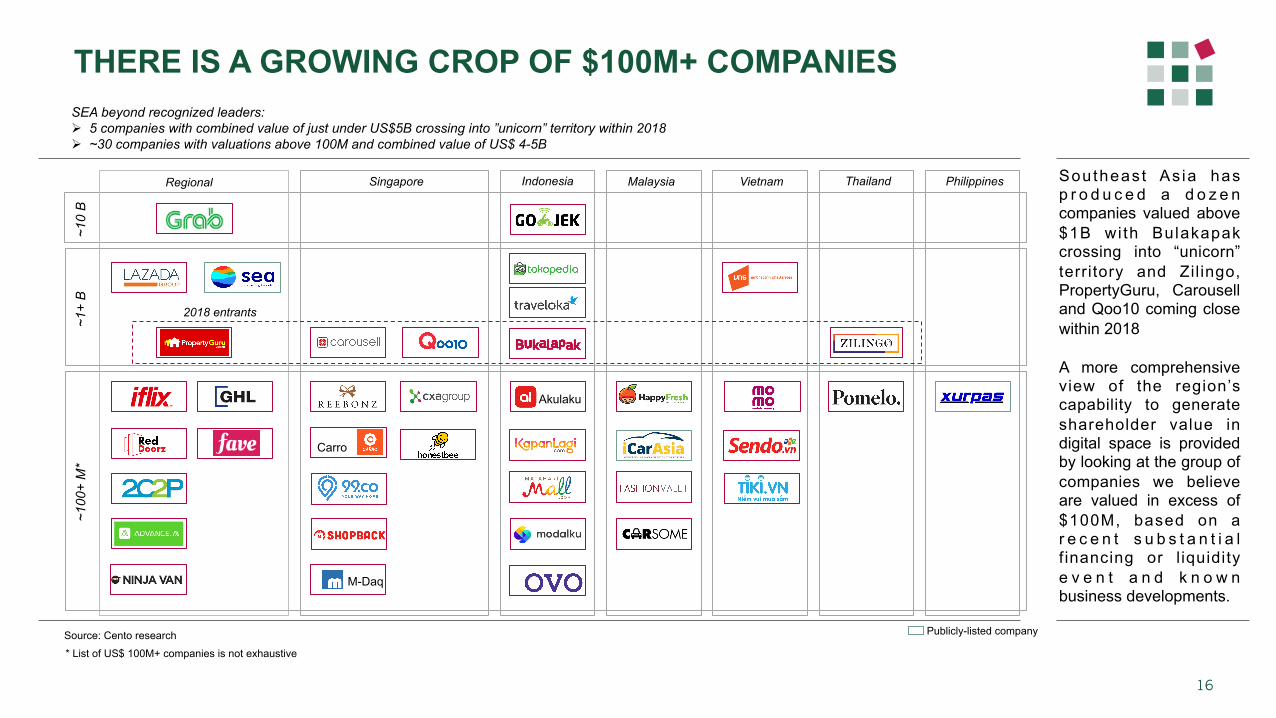
dmpTHERE IS A GROWING CROP OF $100M+ COMPANIES
16
SEA beyond recognized leaders: Ø 5 companies with combined value of just under US$5B crossing into ”unicorn” territory within 2018 Ø ~30 companies with valuations above 100M and combined value of US$ 4-5B
Source: Cento research
~10
B
Indonesia Malaysia Singapore Thailand Vietnam Regional
~1+
B
Akulaku
Philippines
Carro
M-Daq
Publicly-listed company
~100
+ M
*
* List of US$ 100M+ companies is not exhaustive
Southeas t As ia has p r o d u c e d a d o z e n companies valued above $1B wi th Bulakapak crossing into “unicorn” territory and Zil ingo, PropertyGuru, Carousell and Qoo10 coming close within 2018 A more comprehensive view of the region’s capability to generate shareholder value in digital space is provided by looking at the group of companies we believe are valued in excess of $100M, based on a r e c e n t s u b s t a n t i a l f inancing or l iquidity e v e n t a n d k n o w n business developments.
2018 entrants
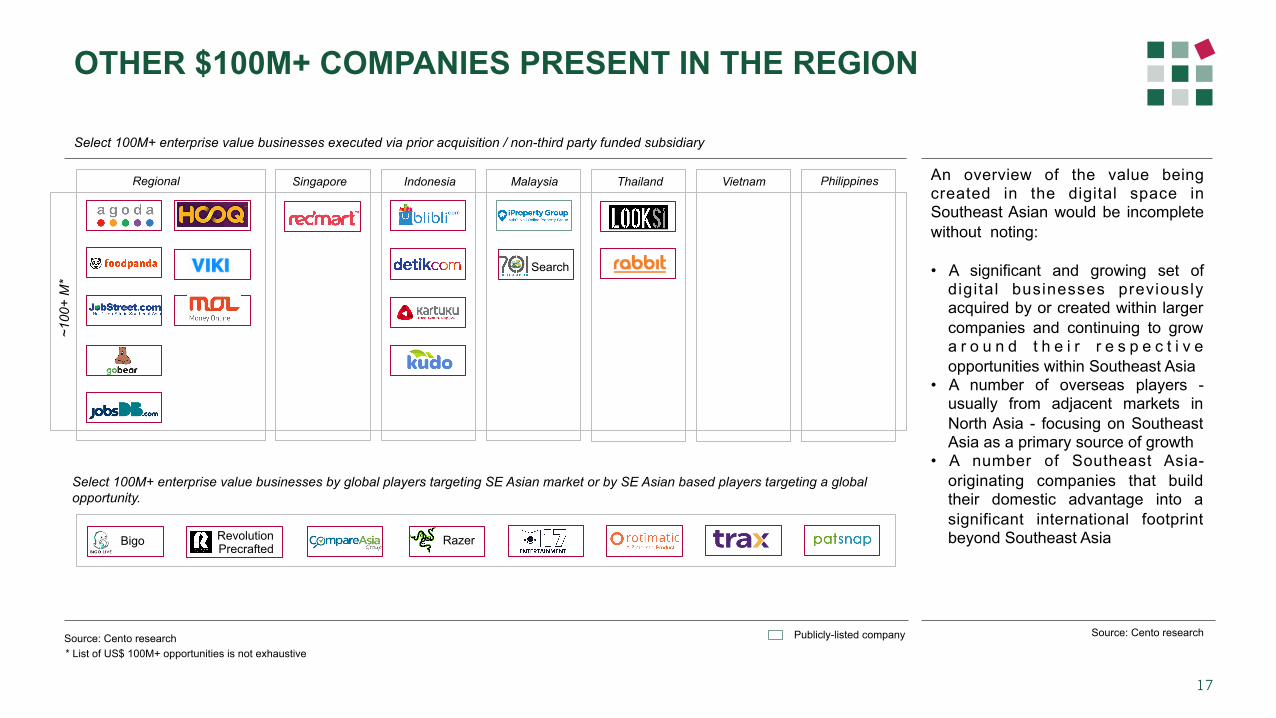
dmpOTHER $100M+ COMPANIES PRESENT IN THE REGION
17
Select 100M+ enterprise value businesses executed via prior acquisition / non-third party funded subsidiary
Source: Cento research
An overview of the value being created in the digital space in Southeast Asian would be incomplete without noting: • A significant and growing set of
digital businesses previously acquired by or created within larger companies and continuing to grow a r o u n d t h e i r r e s p e c t i v e opportunities within Southeast Asia
• A number of overseas players - usually from adjacent markets in North Asia - focusing on Southeast Asia as a primary source of growth
• A number of Southeast Asia-originating companies that build their domestic advantage into a significant international footprint beyond Southeast Asia
Indonesia Malaysia Singapore Thailand Regional
Search
Bigo Revolution Precrafted
Razer
Select 100M+ enterprise value businesses by global players targeting SE Asian market or by SE Asian based players targeting a global opportunity.
Vietnam Philippines
Source: Cento research * List of US$ 100M+ opportunities is not exhaustive
~100
+ M
*
Publicly-listed company
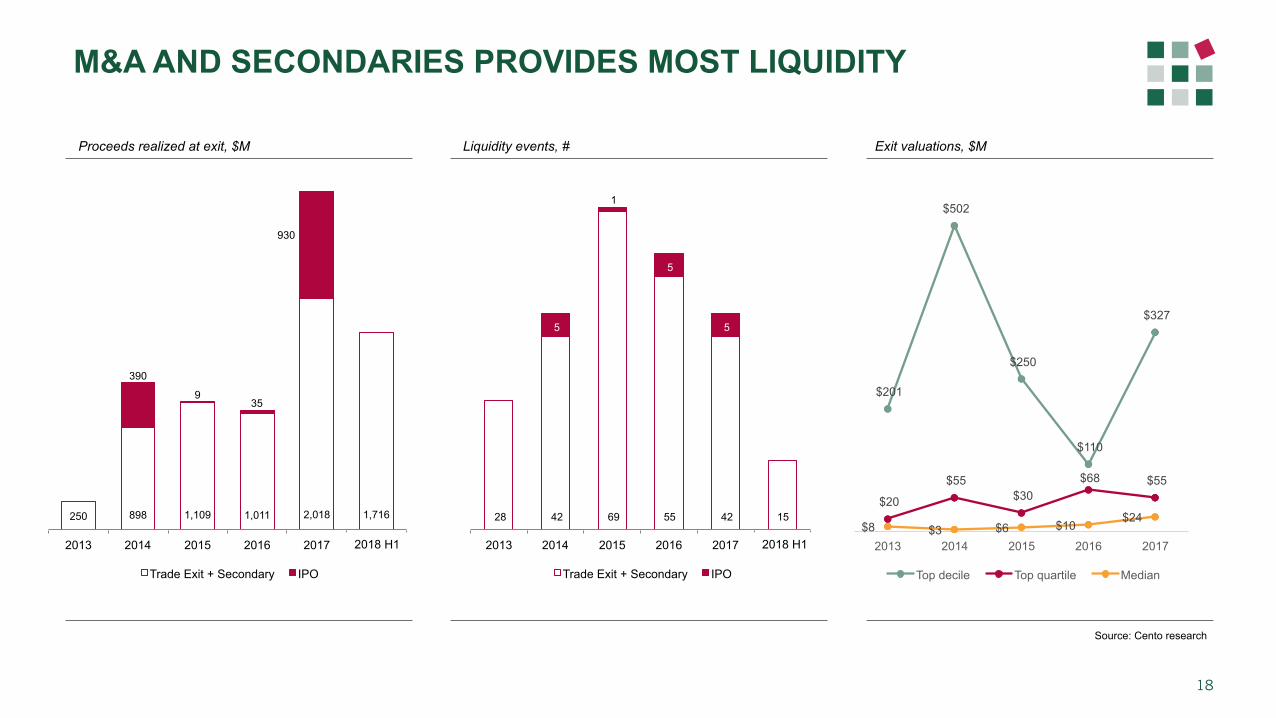
dmpM&A AND SECONDARIES PROVIDES MOST LIQUIDITY
18
Source: Cento research
Liquidity events, # Proceeds realized at exit, $M Exit valuations, $M
250 898 1,109 1,011 2,018 1,716
390
9 35
930
2013 2014 2015 2016 2017 2018
Trade Exit + Secondary IPO
28 42 69 55 42 15
5
1
5
5
2013 2014 2015 2016 2017 2018
Trade Exit + Secondary IPO
2018 H1 2018 H1
$201
$502
$250
$110
$327
$20
$55 $30
$68 $55
$8 $3 $6 $10 $24
2013 2014 2015 2016 2017
Top decile Top quartile Median
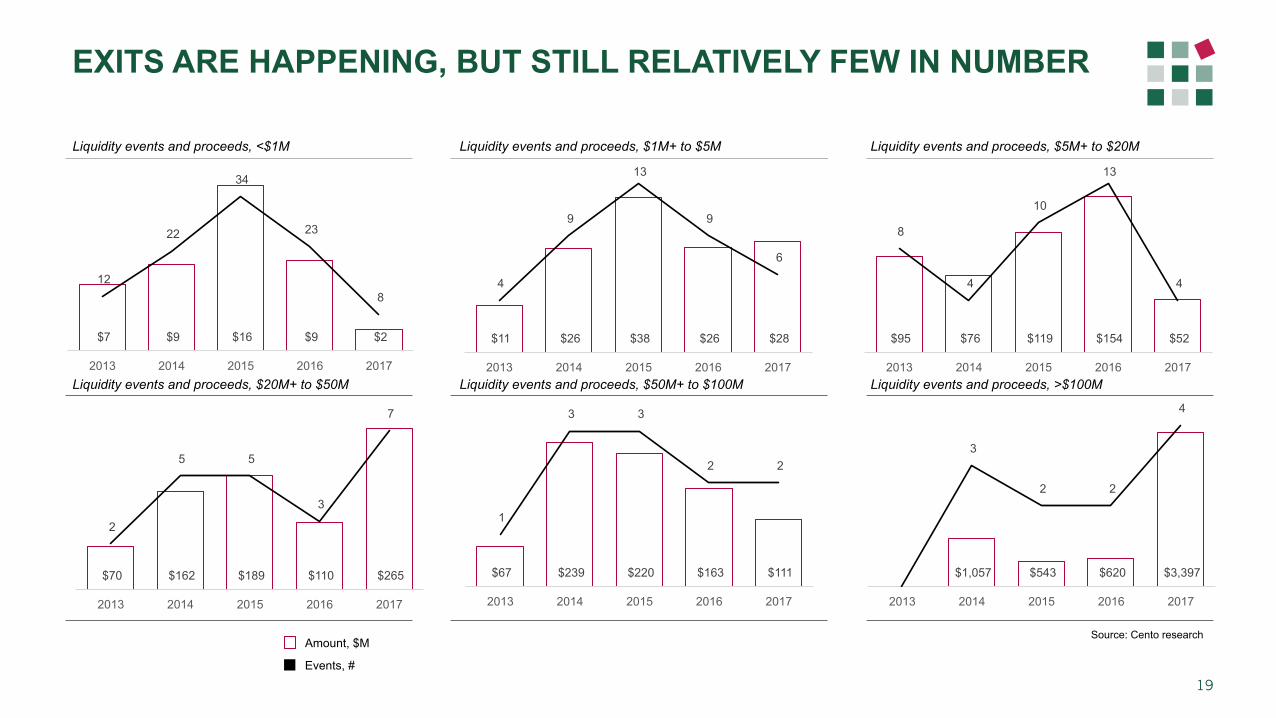
dmpEXITS ARE HAPPENING, BUT STILL RELATIVELY FEW IN NUMBER
19
Source: Cento research Amount, $M
Events, #
Liquidity events and proceeds, <$1M Liquidity events and proceeds, $1M+ to $5M Liquidity events and proceeds, $5M+ to $20M
Liquidity events and proceeds, $20M+ to $50M Liquidity events and proceeds, $50M+ to $100M Liquidity events and proceeds, >$100M
$7 $9 $16 $9 $2
12
22
34
23
8
2013 2014 2015 2016 2017
$11 $26 $38 $26 $28
4
9
13
9
6
2013 2014 2015 2016 2017
$95 $76 $119 $154 $52
8
4
10
13
4
2013 2014 2015 2016 2017
$70 $162 $189 $110 $265
2
5 5
3
7
2013 2014 2015 2016 2017
$67 $239 $220 $163 $111
1
3 3
2 2
2013 2014 2015 2016 2017
$1,057 $543 $620 $3,397
3
2 2
4
2013 2014 2015 2016 2017
dmp
20
Source: Cento research
ACQUIRERS ARE FROM SE ASIA & APAC REGION
Country of origin of acquirer, by deals done, 2013-2018H1 Country of origin of acquirer, by capital invested, 2013-2018 H1, $M
38
24
13
10 8
7 7 6
4 3 3
2
SE Asia Countries Others SE Asia Countries Others
2,000
936
320 227 201 176 163 139
83 59 51 40 40 30 18

dmp
Methodology
dmpMETHODOLOGY
22
In this report, we analysed and verfied close to 2,200 data points of financing and liquidity events. Inevitably, a few large deals would avoid detection on occasion of exceptionally secretive nature of the transaction or due to methodology we apply. It is also our impression that we are likely seeing only half or less of the pre-Series A activity in the region due to a sheer volume of deals in $ 10 - 250K range happening in the market – while total dollar value of inflow and outflows is unlikely to be impacted heavily, do take our “number of deal” assessments for pre-Series A with a large handful of salt. Finally, as new facts come to light and as erstwhile announcements are verified, we adjust our databases retroactively, leading to mild inconsistencies between various versions at the same period.
Category definitions and company profiles included:
This report aims to describe the state of financing of and liquidity generated by companies focused on digital technology-driven opportunities in Southeast Asia. The exact definition of what a digital technology-driven opportunity constitutes is a subject of much debate. While leaving biotech, new materials and space tech out is relatively straightforward (but including software and digital services enabling these industries), telling an offline company with digital elements apart from a business where value creation is primarily tied to either its technology core or its digital distribution is anything but simple.
We have generally taken a view that if something is valued as a technology company, we can trust its investors that it probably is. At the same time, we also endeavour to exclude categories that, while adjacent to digital economy, tend to attract non-VC capital to a degree where their financing / liquidation events interfere with signal from the rest of the ecosystem (notably, excluding the companies with valuations determined by token economics). Furthermore, we currently do not include traditional TV stations, content producers, telcos, IT infrastructures and system integration companies into our reporting. Hence, this excludes a number of otherwise very important names absolutely worth a closer look under different circumstances such as Circles.Life, MyRepublic, Airtrunk, NetTV, One Championship, and others that would occasionally be included into other digital ecosystem reports.
Key premises:
Many numbers and conclusions in this study rely upon a company’s reported last round valuation. At best this is a partial reflection of a company’s true value. To all in our audience who appreciate the importance of financing terms over headline valuations, and who recognise that a more complete understanding of any underlying business is helpful, we apologise. To atone for this oversimplification, we’d like to take this opportunity to give a commendation to the great work being done by a few in academia who probe deeply into the contradictory nature of how tech valuations are reported, and produce splendid research that will one day help us as an industry upgrade our reporting systems and, perhaps, change how tech company narratives are formed. In this report, our recognition goes to Will Gornall and Ilya A. Strebulaev (professors at the Sauder School of Business at the University of British Columbia and the Stanford Graduate School of Business, respectively) for their comprehensive work on “Squaring Venture Capital Valuations with Reality”, available here: https://papers.ssrn.com/sol3/papers.cfm?abstract_id=2955455 and with media coverage http://nymag.com/intelligencer/2018/11/fake-unicorns-are-running-over-the-venture-capital-industry.html Geographies covered:
This iteration of our report does not make an attempt at covering some of the newer digital ecosystems within ASEAN beyond the customary six countries, or the developments in counties starting to ”gravitate” towards SEA venture scene such as Pakistan, Bangladesh, Sri Lanka, Hong Kong, and Taiwan. Data sources and completeness :
Our data is compiled from a number of sources, although we primarily rely on public press announcements and community disclosures from the companies and their investors. Our team researches the validity of claims to an extent possible and supplements incomplete information with insights from our own industry sources and, on occasion, somewhat educated guesswork.
dmpMETHODOLOGY
23
Company classification
Country of origin:
Determined by the country in which the company was founded, and has its primary base of operation (defined in terms of revenue, if known). At the (subjective) point where the company has both operations in multiple countries in Southeast Asia and substantial revenues generated in multiple countries, then it may be classified as Southeast Asia / regional in the country of origin.
Sector classification:
Cento’s definition of the industry segment in which the company’s primary business focus sits. A full taxonomy of sector allocation is available. In cases where a company focus on multiple sectors with different units generating thought to generate substantial revenue, then multi-vertical category is used.
Fund definitions
Mapping fund allocations is an inexact science. We count the number of funds that have been observed doing early stage tech investment in Southeast Asia. We also try to assess the allocation of those funds to the region. In some cases (e.g. Cento Ventures) that is equivalent to 100% of their AUM. In many others with a broader, or no particular geographic focus, Southeast Asia allocation is an estimate based on information received from the fund manager, or the relative number of deals that they have done within the region compared to elsewhere. Besides that, the collected fund information is also compared with third-party data sources such as Pitchbook and Preqin.
Currency: $ refers to United States Dollar (US$) unless otherwise stated.
Deal definitions
Deal stage:
Each series definition is determined as follows:
- Pre-Series A: amounts of $10K - $1M. Purpose of investment tends to be building the idea/team; in some cases, the company generates revenue.
- Series A: amounts of $1M - $3M. Product has been built and proven via initial but repeatable revenue. Investment purpose tends to be establishing domestic position, and sometimes scaling regionally.
- Series B: amounts of $3M-$10M. Investment purpose tends to be building scale, either domestically or regionally.
- Series C+: any amount invested later than Series B. Series C, Series D, later series investments, pre-IPO, mezzanine.
Deal type:
We focus mainly on venture capital deals – investments made by fund entities into early stage startups, whether they are from independent funds of corporate venture capital entities. This is a subset of the total number of early stage tech deals in the region.
We separate the following from most of our data, apart from the ‘total capital invested and total deals done’ chart:
- Corporate transfers: events where a corporate entity funds an entity in the region in which it owns a majority or significant minority stake (e.g. Rocket Internet, Lippo Group)
- Project financing: A deal which was a partnership for an identified purpose – e.g. Grab-Honda.
- Non-Southeast Asia deals: e.g. India and China focused companies that happen to use Singapore for their corporate domicile.

dmp
www.cento.vc [email protected] +65 6816 2810 Office address: 56B Pagoda Street, Singapore 059215 Mailing address: Cento Ventures, 3 Church Street, Level 8, Singapore 049483
Con
tact
24


![#5 Tokopedia - Missing CSRF Token that could Result ...firstsight.me/fia07a53c4ec63d2b0d47fe27ea2645d82f8c98648/[ID] Tokopedia...dituju akan membuat pengguna ... di dalam suatu aplikasi](https://img.pdfslide.us/doc/110x75/5d35c96588c993ee5c8c373e/5-tokopedia-missing-csrf-token-that-could-result-id-tokopediadituju-akan.jpg)