Embed Size (px)
Citation preview
Southeast Asia IPO market with additional coverage on Singapore and Malaysia2017 Report
02
Brochure / report title goes here | Section title goes here
Southeast Asia IPO market 03
Singapore IPO market 10
Malaysia IPO market 16
Contact us 20
Report as of December 31, 2017
Southeast Asia IPO market
03
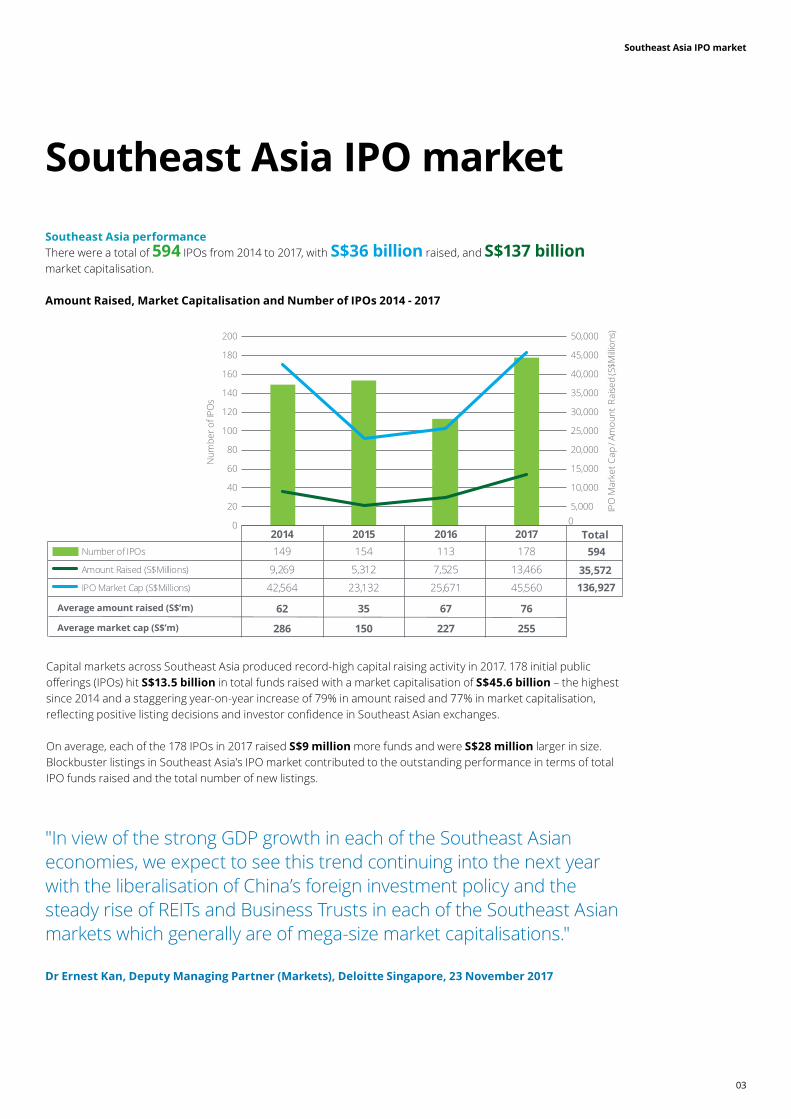
Capital markets across Southeast Asia produced record-high capital raising activity in 2017. 178 initial public offerings (IPOs) hit S$13.5 billion in total funds raised with a market capitalisation of S$45.6 billion – the highest since 2014 and a staggering year-on-year increase of 79% in amount raised and 77% in market capitalisation, reflecting positive listing decisions and investor confidence in Southeast Asian exchanges.
On average, each of the 178 IPOs in 2017 raised S$9 million more funds and were S$28 million larger in size. Blockbuster listings in Southeast Asia’s IPO market contributed to the outstanding performance in terms of total IPO funds raised and the total number of new listings.
Southeast Asia performanceThere were a total of 594 IPOs from 2014 to 2017, with S$36 billion raised, and S$137 billion market capitalisation.
Amount Raised, Market Capitalisation and Number of IPOs 2014 - 2017
Southeast Asia IPO market
2014 2015 2016 2017Number of IPOs 149 154 113 178
Amount Raised (S$Millions) 9,269 5,312 7,525 13,466
IPO Market Cap (S$Millions) 42,564 23,132 25,671 45,560
5,0000
10,000
15,000
20,000
25,000
30,000
35,000
40,000
45,000
50,000
0
20
40
60
80
100
120
140
160
180
200
IPO
Mar
ket C
ap /
Amou
nt R
aise
d (S
$Milli
ons)
Num
ber o
f IPO
s
Average amount raised (S$’m) 62 35 67 76
Average market cap (S$’m) 286 150 227 255
Total594
35,572136,927
"In view of the strong GDP growth in each of the Southeast Asian economies, we expect to see this trend continuing into the next year with the liberalisation of China’s foreign investment policy and the steady rise of REITs and Business Trusts in each of the Southeast Asian markets which generally are of mega-size market capitalisations."
Dr Ernest Kan, Deputy Managing Partner (Markets), Deloitte Singapore, 23 November 2017
Southeast Asia IPO market
04
1 In Vietnam, it is common for State-owned Entities (“SOEs”) to list on an exchange while the state still holds most of the shares. Therefore, we have included it as an IPO when the SOE sell shares to the public for the first time.
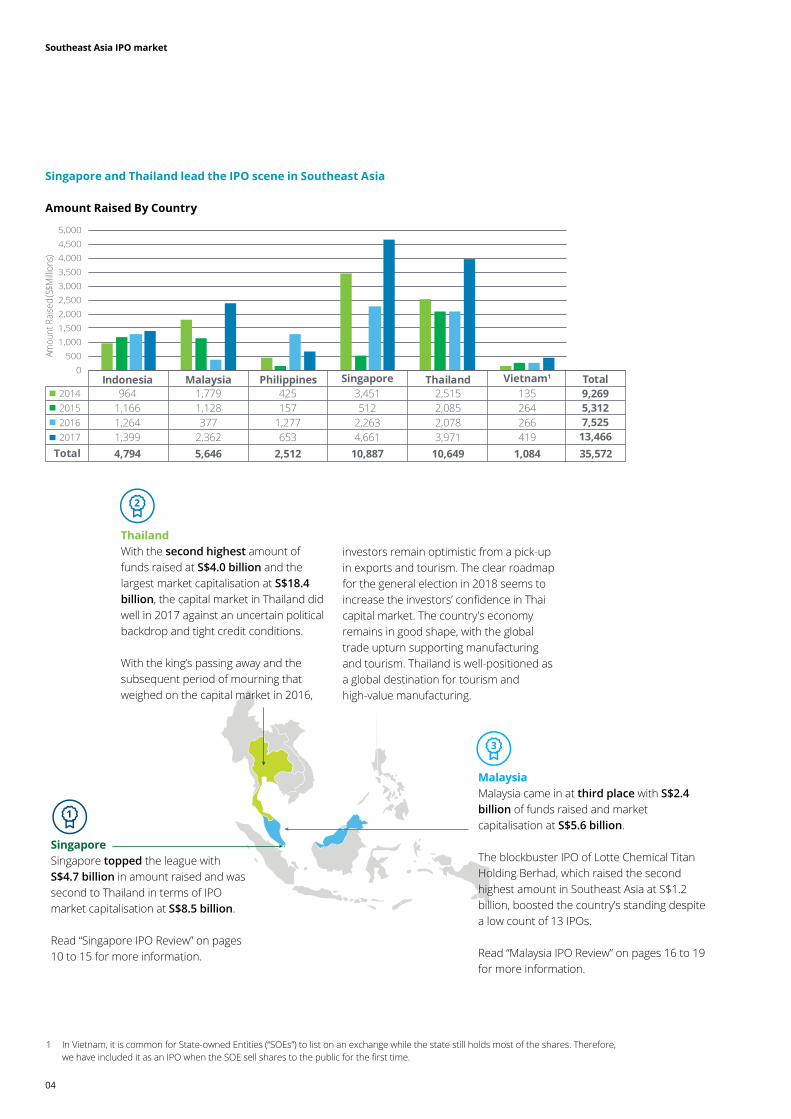
Total 4,794 5,646 2,512 10,887 10,649 1,084 35,572
Indonesia Thailand2014 964 1,779 425 3,451 2,515 1352015 1,166 1,128 157 512 2,085 2642016 1,264 377 1,277 2,263 2,078 2662017 1,399 2,362 653 4,661 3,971 419
0 500
1,000 1,500 2,000 2,500 3,000 3,500 4,000 4,500 5,000
Amou
nt R
aise
d (S
$Milli
ons)
Total9,2695,3127,525
13,466
Vietnam1SingaporeMalaysia Philippines
Singapore and Thailand lead the IPO scene in Southeast Asia
Amount Raised By Country
SingaporeSingapore topped the league with S$4.7 billion in amount raised and was second to Thailand in terms of IPO market capitalisation at S$8.5 billion.
Read “Singapore IPO Review” on pages 10 to 15 for more information.
MalaysiaMalaysia came in at third place with S$2.4 billion of funds raised and market capitalisation at S$5.6 billion.
The blockbuster IPO of Lotte Chemical Titan Holding Berhad, which raised the second highest amount in Southeast Asia at S$1.2 billion, boosted the country’s standing despite a low count of 13 IPOs.
Read “Malaysia IPO Review” on pages 16 to 19 for more information.
ThailandWith the second highest amount of funds raised at S$4.0 billion and the largest market capitalisation at S$18.4 billion, the capital market in Thailand did well in 2017 against an uncertain political backdrop and tight credit conditions.
With the king’s passing away and the subsequent period of mourning that weighed on the capital market in 2016,
investors remain optimistic from a pick-up in exports and tourism. The clear roadmap for the general election in 2018 seems to increase the investors’ confidence in Thai capital market. The country's economy remains in good shape, with the global trade upturn supporting manufacturing and tourism. Thailand is well-positioned as a global destination for tourism and high-value manufacturing.
Southeast Asia IPO market
05
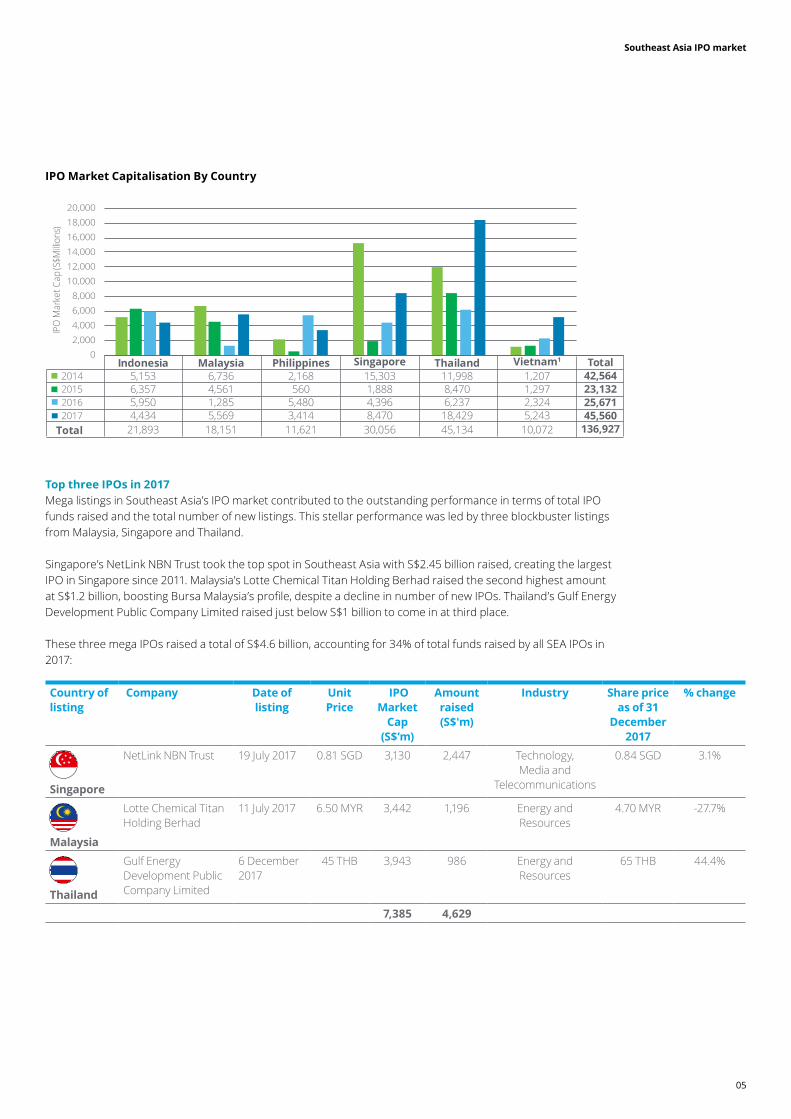
5,153 6,736 2,168 15,303 11,998 1,2076,357 4,561 560 1,888 8,470 1,2975,950 1,285 5,480 4,396 6,237 2,3244,434 5,569 3,414 8,470 18,429 5,243
21,893 18,151 11,621 30,056 45,134 10,072
0 2,000 4,000 6,000 8,000
10,000 12,000 14,000 16,000 18,000 20,000
IPO
Mar
ket C
ap (S
$Milli
ons)
Total
2014201520162017
Indonesia Thailand Total42,56423,13225,67145,560
136,927
Vietnam1SingaporeMalaysia Philippines
IPO Market Capitalisation By Country
Top three IPOs in 2017Mega listings in Southeast Asia’s IPO market contributed to the outstanding performance in terms of total IPO funds raised and the total number of new listings. This stellar performance was led by three blockbuster listings from Malaysia, Singapore and Thailand.
Singapore’s NetLink NBN Trust took the top spot in Southeast Asia with S$2.45 billion raised, creating the largest IPO in Singapore since 2011. Malaysia’s Lotte Chemical Titan Holding Berhad raised the second highest amount at S$1.2 billion, boosting Bursa Malaysia’s profile, despite a decline in number of new IPOs. Thailand’s Gulf Energy Development Public Company Limited raised just below S$1 billion to come in at third place.
These three mega IPOs raised a total of S$4.6 billion, accounting for 34% of total funds raised by all SEA IPOs in 2017:
Country of listing
Company Date of listing
Unit Price
IPO Market
Cap (S$’m)
Amount raised (S$'m)
Industry Share price as of 31
December 2017
% change
Singapore
NetLink NBN Trust 19 July 2017 0.81 SGD 3,130 2,447 Technology, Media and
Telecommunications
0.84 SGD 3.1%
Malaysia
Lotte Chemical Titan Holding Berhad
11 July 2017 6.50 MYR 3,442 1,196 Energy and Resources
4.70 MYR -27.7%
Thailand
Gulf Energy Development Public Company Limited
6 December 2017
45 THB 3,943 986 Energy and Resources
65 THB 44.4%
7,385 4,629
Southeast Asia IPO market
06
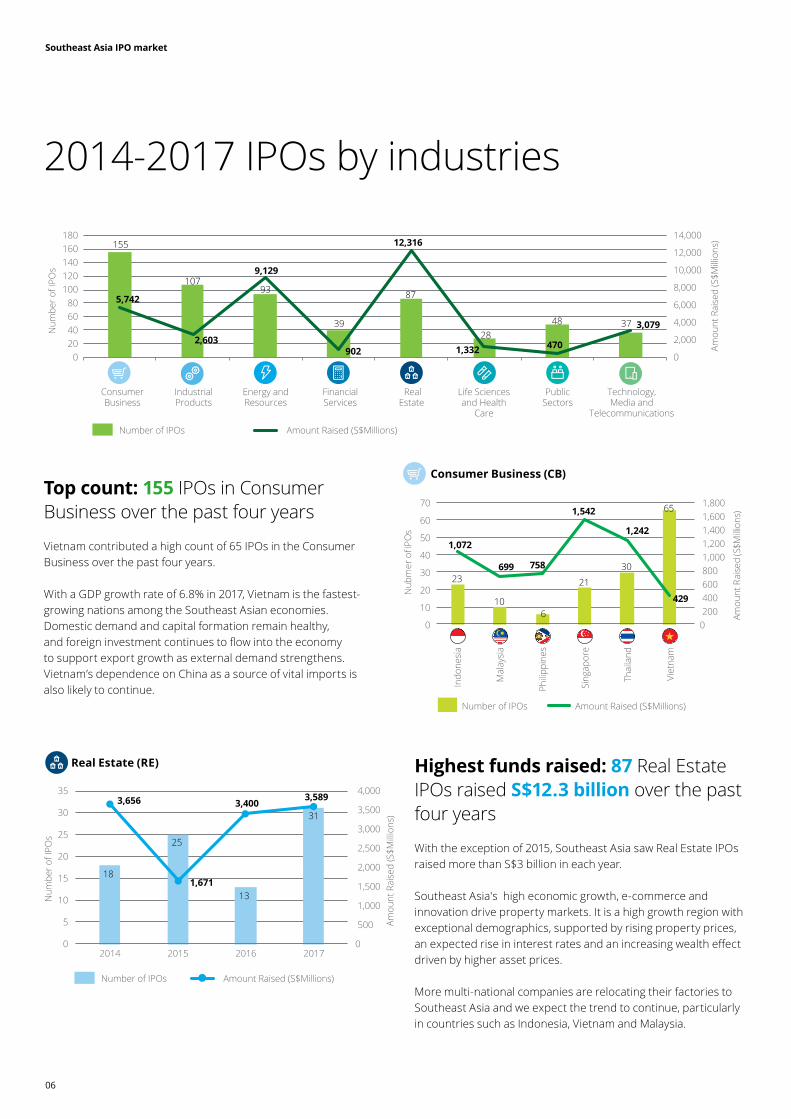
2014-2017 IPOs by industries
Top count: 155 IPOs in Consumer Business over the past four years
Vietnam contributed a high count of 65 IPOs in the ConsumerBusiness over the past four years.
With a GDP growth rate of 6.8% in 2017, Vietnam is the fastest-growing nations among the Southeast Asian economies. Domestic demand and capital formation remain healthy, and foreign investment continues to flow into the economy to support export growth as external demand strengthens. Vietnam’s dependence on China as a source of vital imports is also likely to continue.
Highest funds raised: 87 Real Estate IPOs raised S$12.3 billion over the past four years
With the exception of 2015, Southeast Asia saw Real Estate IPOs raised more than S$3 billion in each year.
Southeast Asia's high economic growth, e-commerce and innovation drive property markets. It is a high growth region with exceptional demographics, supported by rising property prices, an expected rise in interest rates and an increasing wealth effect driven by higher asset prices.
More multi-national companies are relocating their factories to Southeast Asia and we expect the trend to continue, particularly in countries such as Indonesia, Vietnam and Malaysia.
155
10793
39
87
2848 37
5,742
2,603
9,129
902
12,316
1,332 470
3,079
0
2,000
4,000
6,000
8,000
10,000
12,000
14,000
020406080
100120140160180
Amou
nt R
aise
d (S
$Milli
ons)
Num
ber o
f IPO
s
Number of IPOs Amount Raised (S$Millions)
ConsumerBusiness
IndustrialProducts
Energy andResources
FinancialServices
RealEstate
Life Sciencesand Health
Care
PublicSectors
Technology,Media and
Telecommunications
18
25
13
313,656
1,671
3,400 3,589
0
500
1,000
1,500
2,000
2,500
3,000
3,500
4,000
0
5
10
15
20
25
30
35
2014 2015 2016 2017
Amou
nt R
aise
d (S
$Milli
ons)
Num
ber o
f IPO
s
Number of IPOs Amount Raised (S$Millions)
Real Estate (RE)
Consumer Business (CB)
Number of IPOs Amount Raised (S$Millions)
23
106
21
30
65
1,072
699 758
1,542
1,242
429
0 200 400 600 800 1,000 1,200 1,400 1,600 1,800
0
10
20
30
40
50
60
70
Amou
nt R
aise
d (S
$Milli
ons)
Nub
mer
of I
POs
Indo
nesi
a
Mal
aysi
a
Philip
pine
s
Sing
apor
e
Thai
land
Viet
nam
Southeast Asia IPO market
07
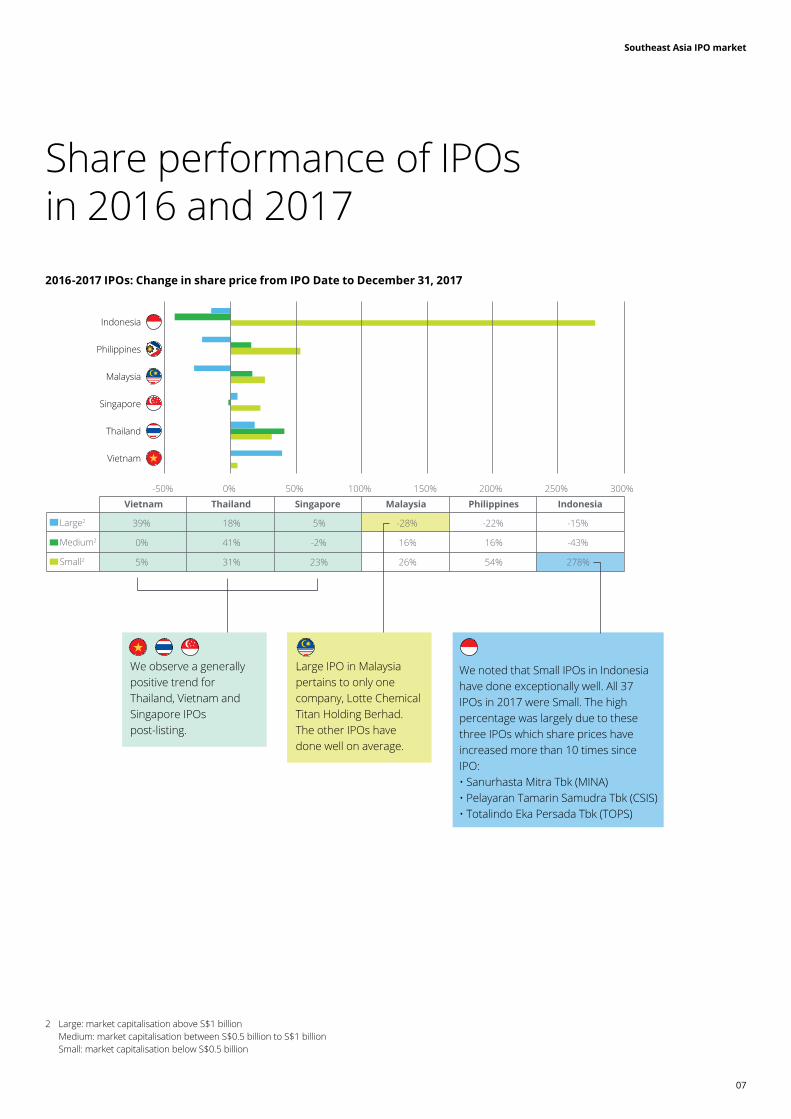
Share performance of IPOs in 2016 and 20172016-2017 IPOs: Change in share price from IPO Date to December 31, 2017
2 Large: market capitalisation above S$1 billion Medium: market capitalisation between S$0.5 billion to S$1 billion Small: market capitalisation below S$0.5 billion
-50% 0% 50% 100% 150% 200% 250% 300%
Vietnam Thailand Singapore Malaysia Philippines Indonesia
Large2 39% 18% 5% -28% -22% -15%
Medium2 0% 41% -2% 16% 16% -43%
Small2 5% 31% 23% 26% 54% 278%
Indonesia
Philippines
Malaysia
Singapore
Thailand
Vietnam
We noted that Small IPOs in Indonesia have done exceptionally well. All 37 IPOs in 2017 were Small. The high percentage was largely due to these three IPOs which share prices have increased more than 10 times since IPO:• Sanurhasta Mitra Tbk (MINA)• Pelayaran Tamarin Samudra Tbk (CSIS)• Totalindo Eka Persada Tbk (TOPS)
Large IPO in Malaysia pertains to only one company, Lotte Chemical Titan Holding Berhad. The other IPOs have done well on average.
We observe a generally positive trend for Thailand, Vietnam and Singapore IPOs post-listing.
Southeast Asia IPO market
08
Outlook
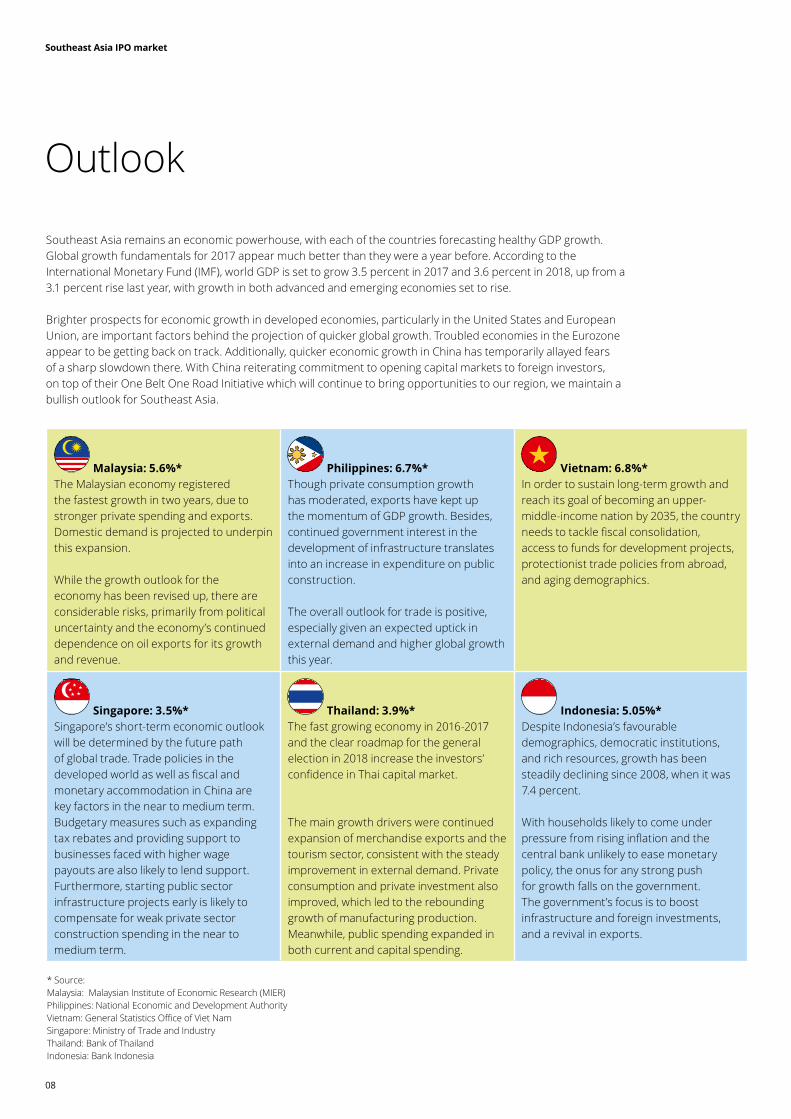
Southeast Asia remains an economic powerhouse, with each of the countries forecasting healthy GDP growth. Global growth fundamentals for 2017 appear much better than they were a year before. According to the International Monetary Fund (IMF), world GDP is set to grow 3.5 percent in 2017 and 3.6 percent in 2018, up from a 3.1 percent rise last year, with growth in both advanced and emerging economies set to rise.
Brighter prospects for economic growth in developed economies, particularly in the United States and European Union, are important factors behind the projection of quicker global growth. Troubled economies in the Eurozone appear to be getting back on track. Additionally, quicker economic growth in China has temporarily allayed fears of a sharp slowdown there. With China reiterating commitment to opening capital markets to foreign investors, on top of their One Belt One Road Initiative which will continue to bring opportunities to our region, we maintain a bullish outlook for Southeast Asia.
* Source: Malaysia: Malaysian Institute of Economic Research (MIER)Philippines: National Economic and Development AuthorityVietnam: General Statistics Office of Viet NamSingapore: Ministry of Trade and Industry Thailand: Bank of ThailandIndonesia: Bank Indonesia
Malaysia: 5.6%*The Malaysian economy registered the fastest growth in two years, due to stronger private spending and exports. Domestic demand is projected to underpin this expansion.
While the growth outlook for the economy has been revised up, there are considerable risks, primarily from political uncertainty and the economy’s continued dependence on oil exports for its growth and revenue.
Philippines: 6.7%*Though private consumption growth has moderated, exports have kept up the momentum of GDP growth. Besides, continued government interest in the development of infrastructure translates into an increase in expenditure on public construction.
The overall outlook for trade is positive, especially given an expected uptick in external demand and higher global growth this year.
Vietnam: 6.8%*In order to sustain long-term growth and reach its goal of becoming an upper-middle-income nation by 2035, the country needs to tackle fiscal consolidation, access to funds for development projects, protectionist trade policies from abroad, and aging demographics.
Singapore: 3.5%*Singapore’s short-term economic outlook will be determined by the future path of global trade. Trade policies in the developed world as well as fiscal and monetary accommodation in China are key factors in the near to medium term. Budgetary measures such as expanding tax rebates and providing support to businesses faced with higher wage payouts are also likely to lend support. Furthermore, starting public sector infrastructure projects early is likely to compensate for weak private sector construction spending in the near to medium term.
Thailand: 3.9%*The fast growing economy in 2016-2017 and the clear roadmap for the general election in 2018 increase the investors’ confidence in Thai capital market.
The main growth drivers were continued expansion of merchandise exports and the tourism sector, consistent with the steady improvement in external demand. Private consumption and private investment also improved, which led to the rebounding growth of manufacturing production. Meanwhile, public spending expanded in both current and capital spending.
Indonesia: 5.05%*Despite Indonesia’s favourable demographics, democratic institutions, and rich resources, growth has been steadily declining since 2008, when it was 7.4 percent.
With households likely to come under pressure from rising inflation and the central bank unlikely to ease monetary policy, the onus for any strong push for growth falls on the government. The government’s focus is to boost infrastructure and foreign investments, and a revival in exports.
Southeast Asia IPO market
09
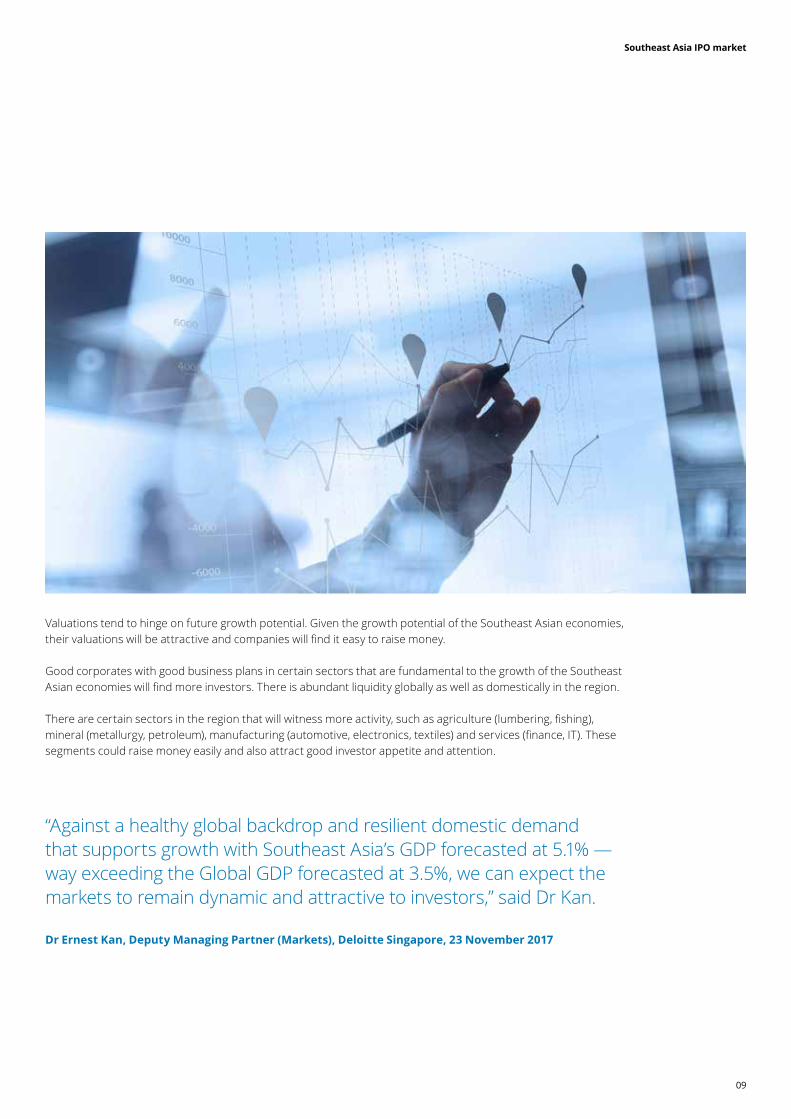
Valuations tend to hinge on future growth potential. Given the growth potential of the Southeast Asian economies, their valuations will be attractive and companies will find it easy to raise money. Good corporates with good business plans in certain sectors that are fundamental to the growth of the Southeast Asian economies will find more investors. There is abundant liquidity globally as well as domestically in the region.
There are certain sectors in the region that will witness more activity, such as agriculture (lumbering, fishing), mineral (metallurgy, petroleum), manufacturing (automotive, electronics, textiles) and services (finance, IT). These segments could raise money easily and also attract good investor appetite and attention.
“Against a healthy global backdrop and resilient domestic demand that supports growth with Southeast Asia’s GDP forecasted at 5.1% — way exceeding the Global GDP forecasted at 3.5%, we can expect the markets to remain dynamic and attractive to investors,” said Dr Kan.
Dr Ernest Kan, Deputy Managing Partner (Markets), Deloitte Singapore, 23 November 2017
Southeast Asia IPO market
10
Singapore IPO Review2014 – 2017
Singapore IPO market
11
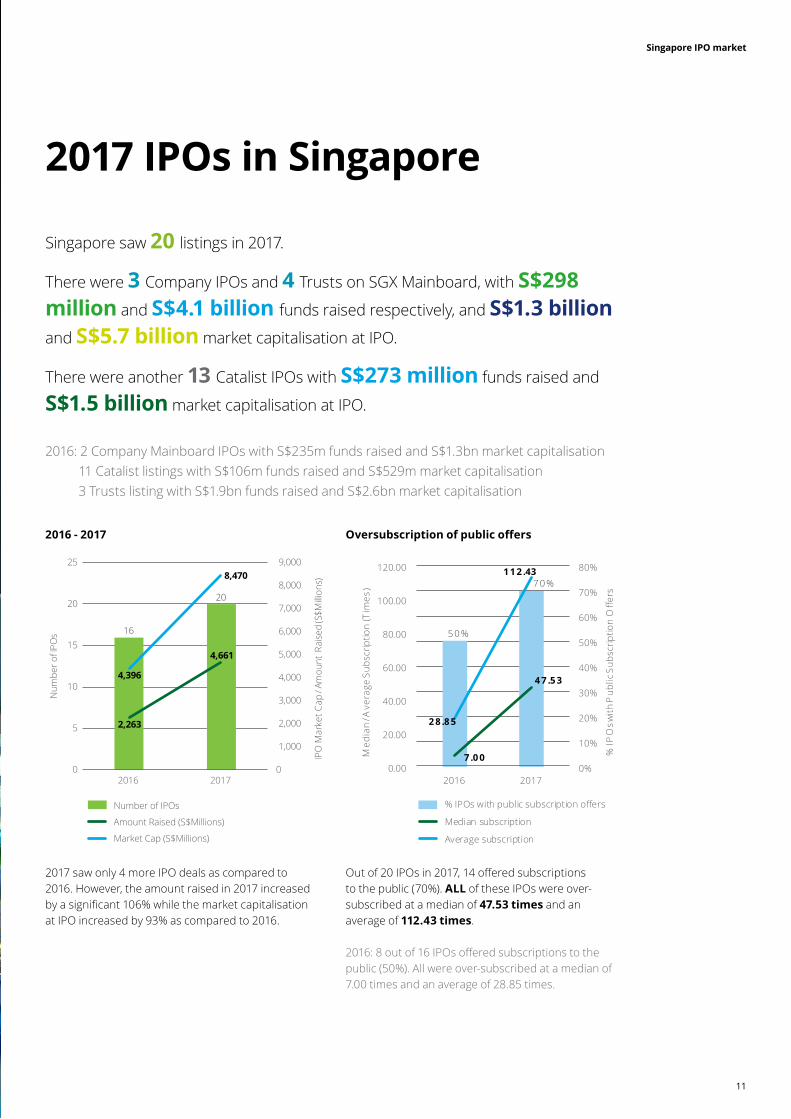
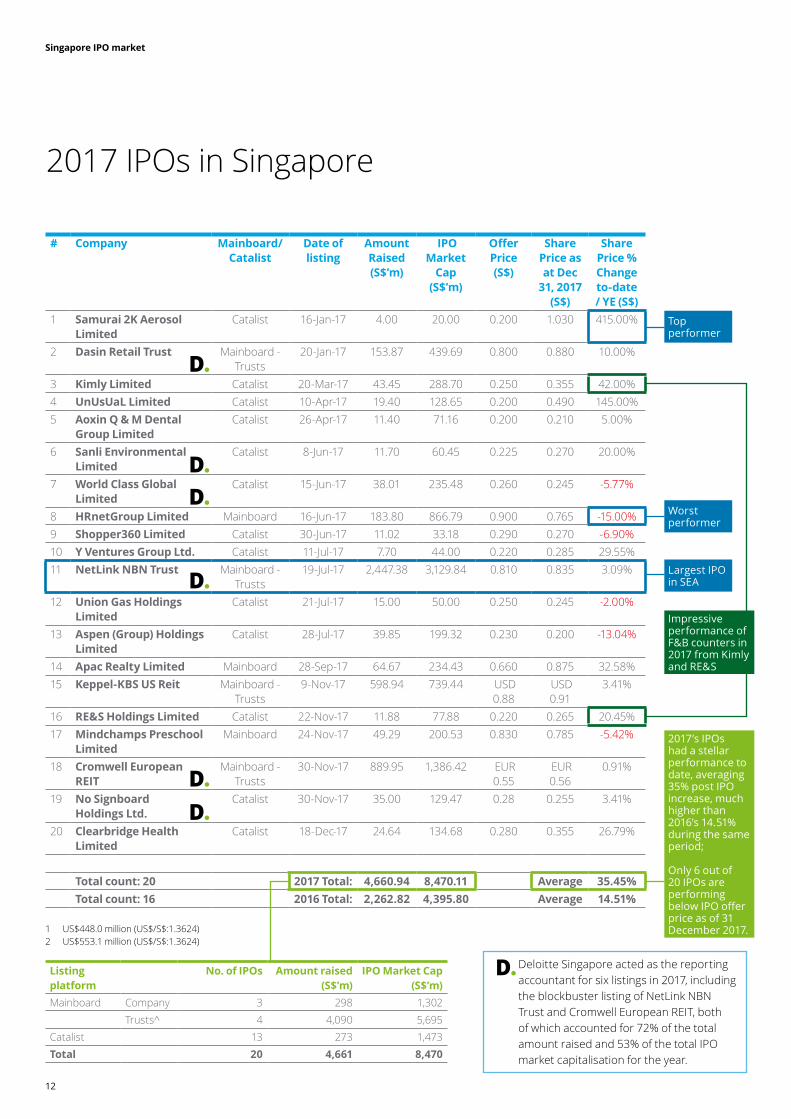
Singapore saw 20 listings in 2017.
There were 3 Company IPOs and 4 Trusts on SGX Mainboard, with S$298 million and S$4.1 billion funds raised respectively, and S$1.3 billion
and S$5.7 billion market capitalisation at IPO.
There were another 13 Catalist IPOs with S$273 million funds raised and
S$1.5 billion market capitalisation at IPO.
2016: 2 Company Mainboard IPOs with S$235m funds raised and S$1.3bn market capitalisation 11 Catalist listings with S$106m funds raised and S$529m market capitalisation 3 Trusts listing with S$1.9bn funds raised and S$2.6bn market capitalisation
2017 IPOs in Singapore
2017 saw only 4 more IPO deals as compared to 2016. However, the amount raised in 2017 increased by a significant 106% while the market capitalisation at IPO increased by 93% as compared to 2016.
Out of 20 IPOs in 2017, 14 offered subscriptions to the public (70%). ALL of these IPOs were over-subscribed at a median of 47.53 times and an average of 112.43 times.
2016: 8 out of 16 IPOs offered subscriptions to the public (50%). All were over-subscribed at a median of 7.00 times and an average of 28.85 times.
16
20
2,263
4,661
4,396
8,470
0
1,000
2,000
3,000
4,000
5,000
6,000
7,000
8,000
9,000
0
5
10
15
20
25
2016 2017
IPO
Mar
ket C
ap /
Amou
nt R
aise
d (S
$Milli
ons)
Num
ber o
f IPO
s
Number of IPOs
Amount Raised (S$Millions)
Market Cap (S$Millions)
5 0 %
7 0 %
7 .0 0
4 7 .5 3
2 8 .8 5
1 1 2 .43
0.00
20.00
40.00
60.00
80.00
100.00
120.00
2016 20170%
10%
20%
30%
40%
50%
60%
70%
80%
Med
ian
/ Ave
rage
Sub
scrip
tion
(Tim
es)
% IP
Os w
ith P
ublic
Sub
scrip
tion
Offe
rs
% IPOs with public subscription offers
Median subscription
Average subscription
2016 - 2017 Oversubscription of public offers
Singapore IPO market
12
# Company Mainboard/ Catalist
Date of listing
Amount Raised (S$’m)
IPO Market
Cap (S$’m)
Offer Price(S$)
Share Price as at Dec
31, 2017 (S$)
Share Price % Change to-date / YE (S$)
1 Samurai 2K Aerosol Limited
Catalist 16-Jan-17 4.00 20.00 0.200 1.030 415.00%
2 Dasin Retail Trust Mainboard - Trusts
20-Jan-17 153.87 439.69 0.800 0.880 10.00%
3 Kimly Limited Catalist 20-Mar-17 43.45 288.70 0.250 0.355 42.00%4 UnUsUaL Limited Catalist 10-Apr-17 19.40 128.65 0.200 0.490 145.00%5 Aoxin Q & M Dental
Group LimitedCatalist 26-Apr-17 11.40 71.16 0.200 0.210 5.00%
6 Sanli Environmental Limited
Catalist 8-Jun-17 11.70 60.45 0.225 0.270 20.00%
7 World Class Global Limited
Catalist 15-Jun-17 38.01 235.48 0.260 0.245 -5.77%
8 HRnetGroup Limited Mainboard 16-Jun-17 183.80 866.79 0.900 0.765 -15.00%9 Shopper360 Limited Catalist 30-Jun-17 11.02 33.18 0.290 0.270 -6.90%10 Y Ventures Group Ltd. Catalist 11-Jul-17 7.70 44.00 0.220 0.285 29.55%11 NetLink NBN Trust Mainboard -
Trusts19-Jul-17 2,447.38 3,129.84 0.810 0.835 3.09%
12 Union Gas Holdings Limited
Catalist 21-Jul-17 15.00 50.00 0.250 0.245 -2.00%
13 Aspen (Group) Holdings Limited
Catalist 28-Jul-17 39.85 199.32 0.230 0.200 -13.04%
14 Apac Realty Limited Mainboard 28-Sep-17 64.67 234.43 0.660 0.875 32.58%15 Keppel-KBS US Reit Mainboard -
Trusts9-Nov-17 598.94 739.44 USD
0.88 USD 0.91
3.41%
16 RE&S Holdings Limited Catalist 22-Nov-17 11.88 77.88 0.220 0.265 20.45%17 Mindchamps Preschool
LimitedMainboard 24-Nov-17 49.29 200.53 0.830 0.785 -5.42%
18 Cromwell European REIT
Mainboard - Trusts
30-Nov-17 889.95 1,386.42 EUR 0.55
EUR 0.56
0.91%
19 No Signboard Holdings Ltd.
Catalist 30-Nov-17 35.00 129.47 0.28 0.255 3.41%
20 Clearbridge Health Limited
Catalist 18-Dec-17 24.64 134.68 0.280 0.355 26.79%
Total count: 20 2017 Total: 4,660.94 8,470.11 Average 35.45%Total count: 16 2016 Total: 2,262.82 4,395.80 Average 14.51%
2017 IPOs in Singapore
1 US$448.0 million (US$/S$:1.3624) 2 US$553.1 million (US$/S$:1.3624)
Top performer
Worst performer
Largest IPO in SEA
Impressive performance of F&B counters in 2017 from Kimly and RE&S
2017’s IPOs had a stellar performance to date, averaging 35% post IPO increase, much higher than 2016’s 14.51% during the same period;
Only 6 out of 20 IPOs are performing below IPO offer price as of 31 December 2017.
Deloitte Singapore acted as the reporting accountant for six listings in 2017, including the blockbuster listing of NetLink NBN Trust and Cromwell European REIT, both of which accounted for 72% of the total amount raised and 53% of the total IPO market capitalisation for the year.
Listing platform
No. of IPOs Amount raised (S$’m)
IPO Market Cap(S$’m)
Mainboard Company 3 298 1,302Trusts^ 4 4,090 5,695
Catalist 13 273 1,473Total 20 4,661 8,470
Singapore IPO market
13
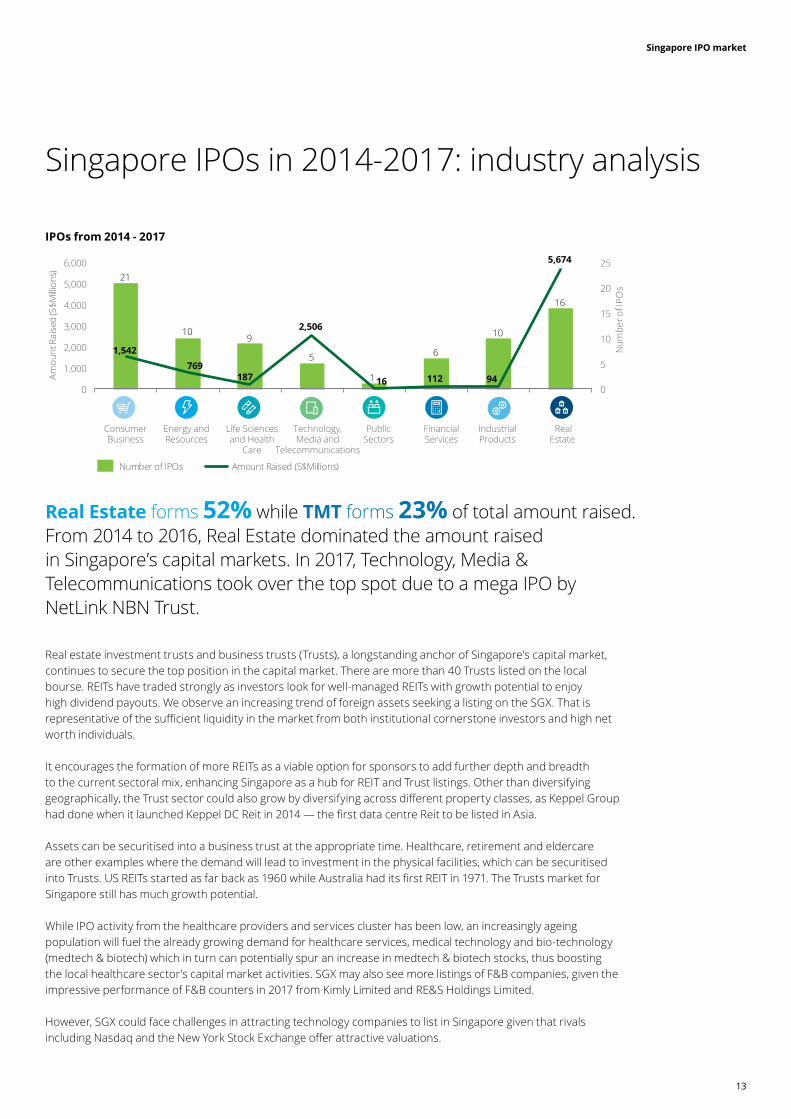
Singapore IPOs in 2014-2017: industry analysis
Real estate investment trusts and business trusts (Trusts), a longstanding anchor of Singapore’s capital market, continues to secure the top position in the capital market. There are more than 40 Trusts listed on the local bourse. REITs have traded strongly as investors look for well-managed REITs with growth potential to enjoy high dividend payouts. We observe an increasing trend of foreign assets seeking a listing on the SGX. That is representative of the sufficient liquidity in the market from both institutional cornerstone investors and high net worth individuals.
It encourages the formation of more REITs as a viable option for sponsors to add further depth and breadth to the current sectoral mix, enhancing Singapore as a hub for REIT and Trust listings. Other than diversifying geographically, the Trust sector could also grow by diversifying across different property classes, as Keppel Group had done when it launched Keppel DC Reit in 2014 — the first data centre Reit to be listed in Asia.
Assets can be securitised into a business trust at the appropriate time. Healthcare, retirement and eldercare are other examples where the demand will lead to investment in the physical facilities, which can be securitised into Trusts. US REITs started as far back as 1960 while Australia had its first REIT in 1971. The Trusts market for Singapore still has much growth potential.
While IPO activity from the healthcare providers and services cluster has been low, an increasingly ageing population will fuel the already growing demand for healthcare services, medical technology and bio-technology (medtech & biotech) which in turn can potentially spur an increase in medtech & biotech stocks, thus boosting the local healthcare sector’s capital market activities. SGX may also see more listings of F&B companies, given the impressive performance of F&B counters in 2017 from Kimly Limited and RE&S Holdings Limited.
However, SGX could face challenges in attracting technology companies to list in Singapore given that rivals including Nasdaq and the New York Stock Exchange offer attractive valuations.
Real Estate forms 52% while TMT forms 23% of total amount raised. From 2014 to 2016, Real Estate dominated the amount raised in Singapore’s capital markets. In 2017, Technology, Media & Telecommunications took over the top spot due to a mega IPO by NetLink NBN Trust.
IPOs from 2014 - 2017
21
109
5
1
6
10
16
1,542769
187
2,506
16 112 94
5,674
0
5
10
15
20
25
0
1,000
2,000
3,000
4,000
5,000
6,000
Num
ber o
f IPO
s
Amou
nt R
aise
d (S
$Milli
ons)
Number of IPOs Amount Raised (S$Millions)
ConsumerBusiness
IndustrialProducts
Energy andResources
FinancialServices
RealEstate
Life Sciencesand Health
Care
PublicSectors
Technology,Media and
Telecommunications
Singapore IPO market
14
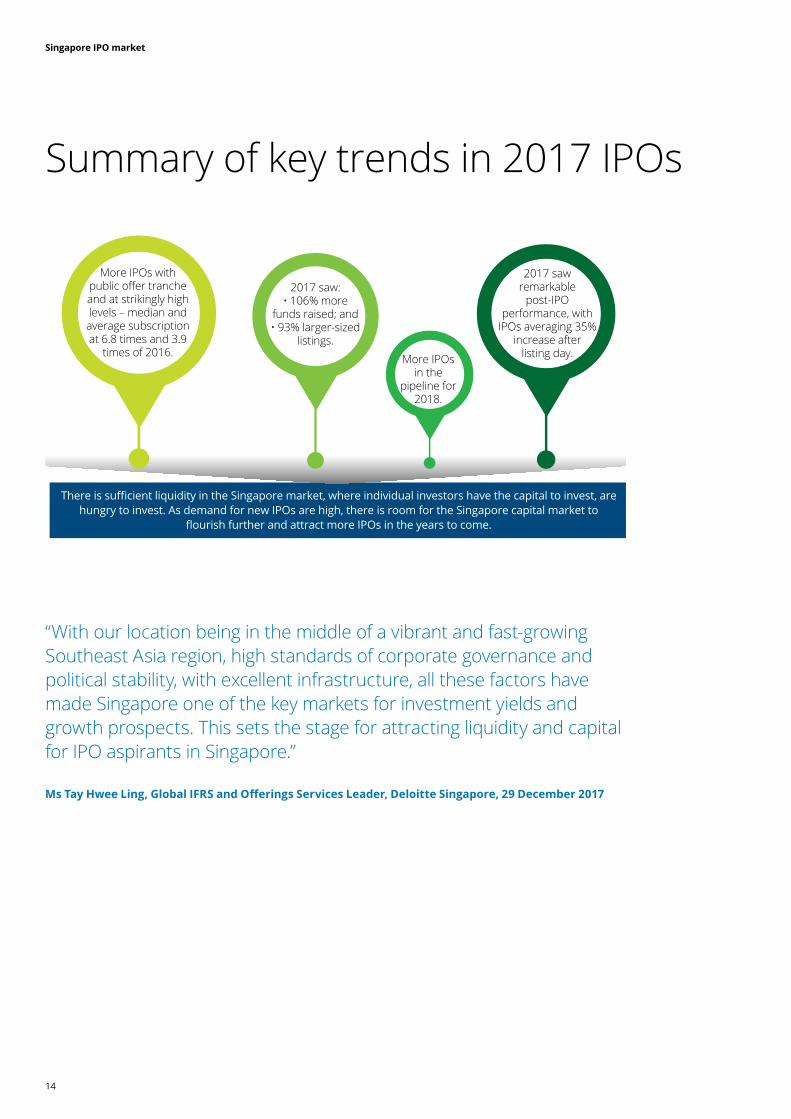
Summary of key trends in 2017 IPOs
“With our location being in the middle of a vibrant and fast-growing Southeast Asia region, high standards of corporate governance and political stability, with excellent infrastructure, all these factors have made Singapore one of the key markets for investment yields and growth prospects. This sets the stage for attracting liquidity and capital for IPO aspirants in Singapore.”
Ms Tay Hwee Ling, Global IFRS and Offerings Services Leader, Deloitte Singapore, 29 December 2017
There is sufficient liquidity in the Singapore market, where individual investors have the capital to invest, are hungry to invest. As demand for new IPOs are high, there is room for the Singapore capital market to
flourish further and attract more IPOs in the years to come.
More IPOs with public offer tranche and at strikingly high levels – median and average subscription at 6.8 times and 3.9
times of 2016.
2017 saw:• 106% more
funds raised; and• 93% larger-sized
listings.
More IPOs in the
pipeline for 2018.
2017 saw remarkable
post-IPO performance, with
IPOs averaging 35% increase after
listing day.
Singapore IPO market
15
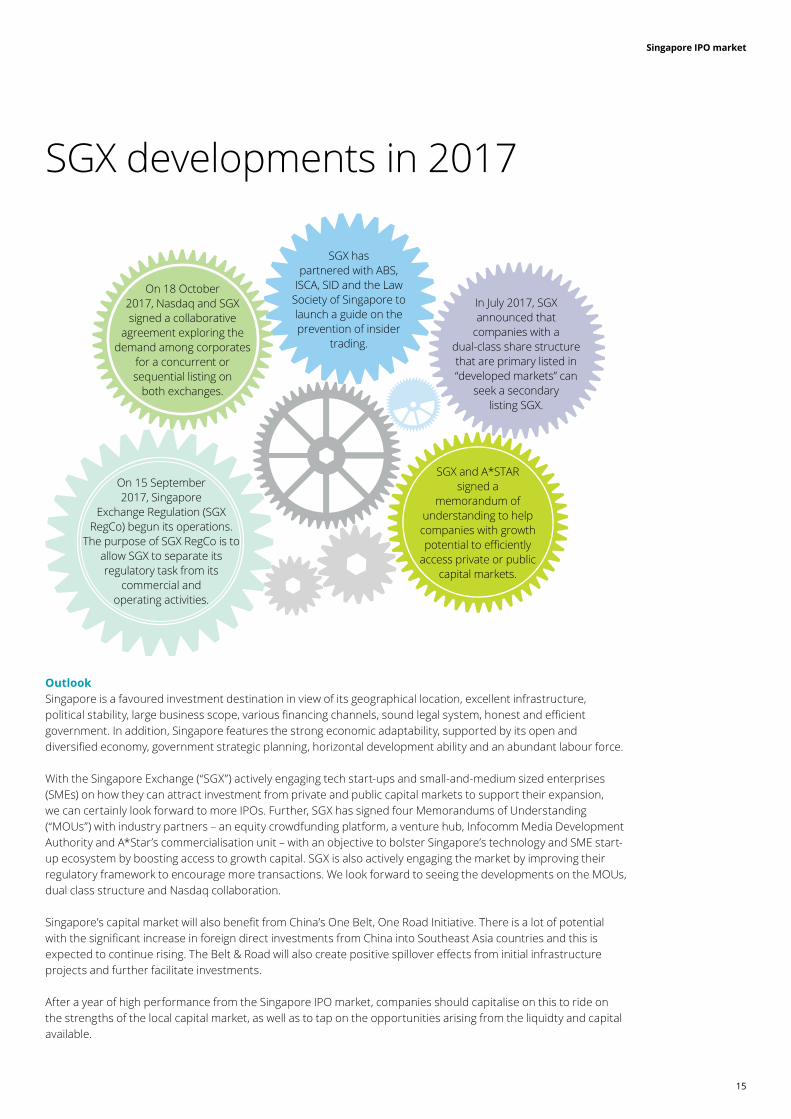
SGX developments in 2017
SGX has partnered with ABS,
ISCA, SID and the Law Society of Singapore to launch a guide on the prevention of insider
trading.
In July 2017, SGX announced that
companies with a dual-class share structure that are primary listed in “developed markets” can
seek a secondary listing SGX.
SGX and A*STAR signed a
memorandum of understanding to help companies with growth potential to efficiently
access private or public capital markets.
On 18 October 2017, Nasdaq and SGX signed a collaborative
agreement exploring the demand among corporates
for a concurrent or sequential listing on
both exchanges.
On 15 September 2017, Singapore
Exchange Regulation (SGX RegCo) begun its operations.
The purpose of SGX RegCo is to allow SGX to separate its regulatory task from its
commercial and operating activities.
Outlook Singapore is a favoured investment destination in view of its geographical location, excellent infrastructure, political stability, large business scope, various financing channels, sound legal system, honest and efficient government. In addition, Singapore features the strong economic adaptability, supported by its open and diversified economy, government strategic planning, horizontal development ability and an abundant labour force.
With the Singapore Exchange (“SGX”) actively engaging tech start-ups and small-and-medium sized enterprises (SMEs) on how they can attract investment from private and public capital markets to support their expansion, we can certainly look forward to more IPOs. Further, SGX has signed four Memorandums of Understanding (“MOUs”) with industry partners – an equity crowdfunding platform, a venture hub, Infocomm Media Development Authority and A*Star’s commercialisation unit – with an objective to bolster Singapore’s technology and SME start-up ecosystem by boosting access to growth capital. SGX is also actively engaging the market by improving their regulatory framework to encourage more transactions. We look forward to seeing the developments on the MOUs, dual class structure and Nasdaq collaboration. Singapore’s capital market will also benefit from China’s One Belt, One Road Initiative. There is a lot of potential with the significant increase in foreign direct investments from China into Southeast Asia countries and this is expected to continue rising. The Belt & Road will also create positive spillover effects from initial infrastructure projects and further facilitate investments.
After a year of high performance from the Singapore IPO market, companies should capitalise on this to ride on the strengths of the local capital market, as well as to tap on the opportunities arising from the liquidty and capital available.

Malaysia IPO market
16
Malaysia IPO Review2014 – 2017
Malaysia IPO market
17
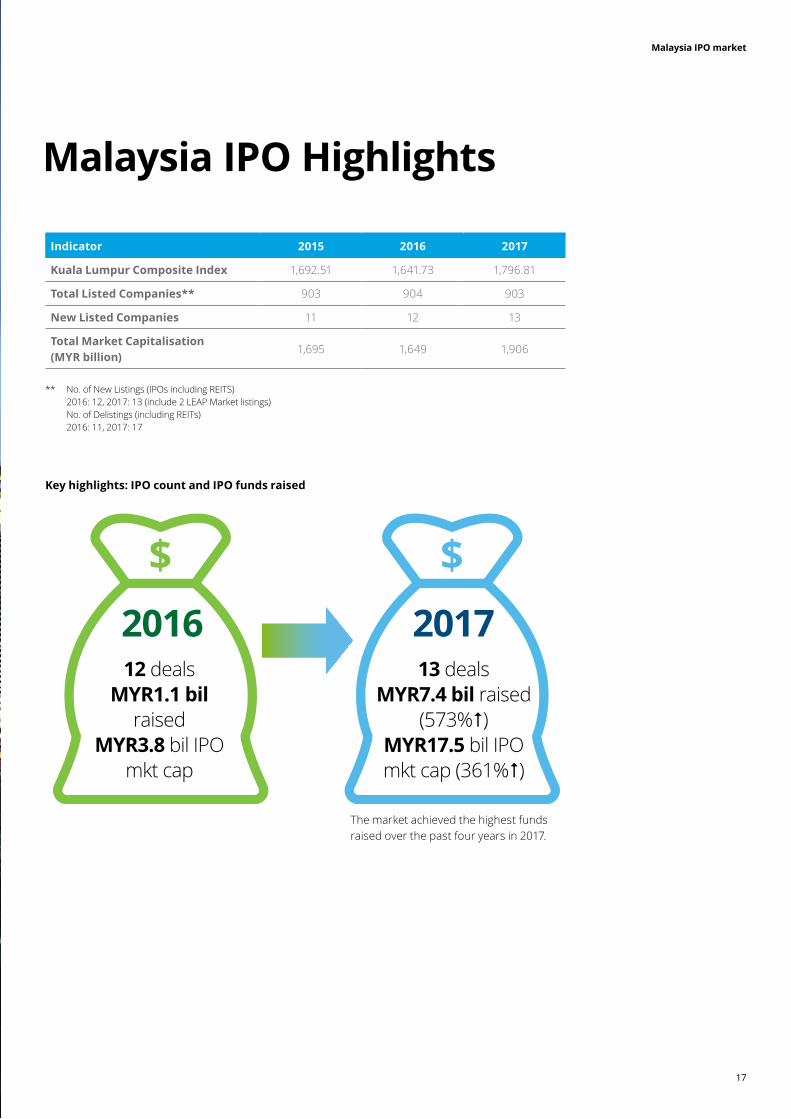
Malaysia IPO Highlights
Indicator 2015 2016 2017
Kuala Lumpur Composite Index 1,692.51 1,641.73 1,796.81
Total Listed Companies** 903 904 903
New Listed Companies 11 12 13
Total Market Capitalisation (MYR billion)
1,695 1,649 1,906
** No. of New Listings (IPOs including REITS) 2016: 12, 2017: 13 (include 2 LEAP Market listings) No. of Delistings (including REITs) 2016: 11, 2017: 17
Key highlights: IPO count and IPO funds raised
2016 201712 deals
MYR1.1 bil raised
MYR3.8 bil IPO mkt cap
13 dealsMYR7.4 bil raised
(573%)MYR17.5 bil IPO mkt cap (361%)
The market achieved the highest funds raised over the past four years in 2017.
Malaysia IPO market
18
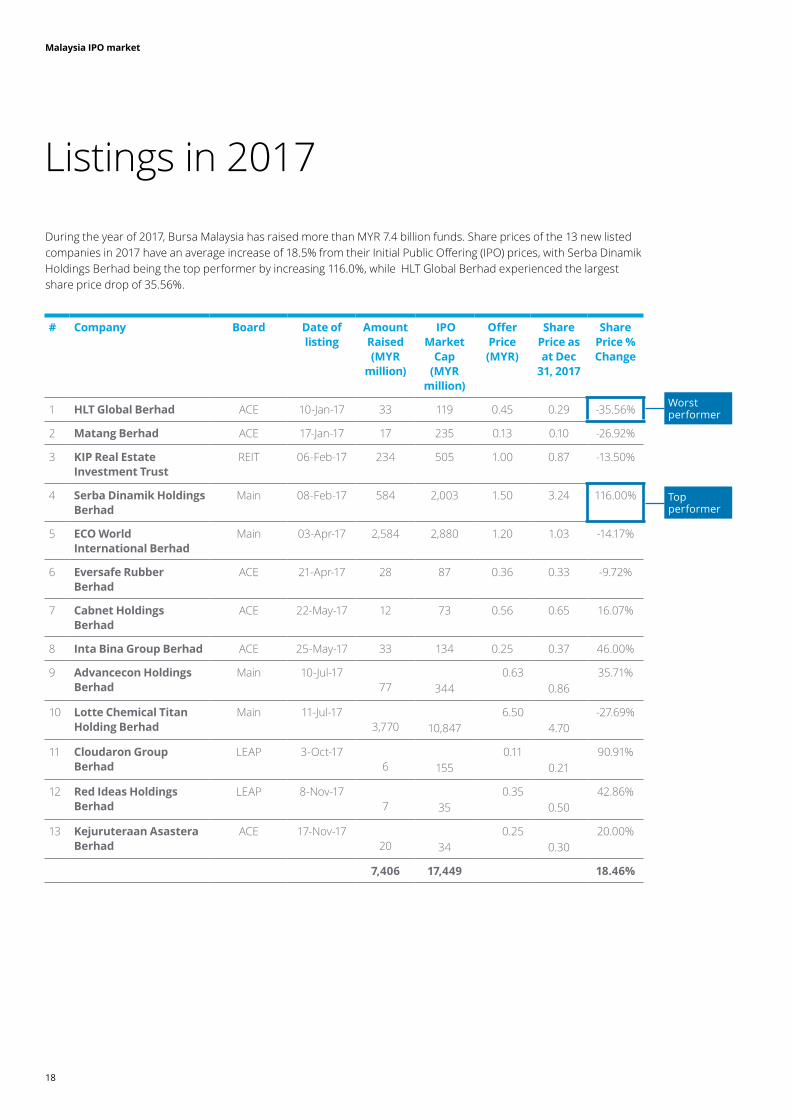
# Company Board Date of listing
Amount Raised (MYR
million)
IPO Market
Cap (MYR
million)
Offer Price(MYR)
Share Price as at Dec
31, 2017
Share Price % Change
1 HLT Global Berhad ACE 10-Jan-17 33 119 0.45 0.29 -35.56%
2 Matang Berhad ACE 17-Jan-17 17 235 0.13 0.10 -26.92%
3 KIP Real Estate Investment Trust
REIT 06-Feb-17 234 505 1.00 0.87 -13.50%
4 Serba Dinamik Holdings Berhad
Main 08-Feb-17 584 2,003 1.50 3.24 116.00%
5 ECO World International Berhad
Main 03-Apr-17 2,584 2,880 1.20 1.03 -14.17%
6 Eversafe Rubber Berhad
ACE 21-Apr-17 28 87 0.36 0.33 -9.72%
7 Cabnet Holdings Berhad
ACE 22-May-17 12 73 0.56 0.65 16.07%
8 Inta Bina Group Berhad ACE 25-May-17 33 134 0.25 0.37 46.00%
9 Advancecon Holdings Berhad
Main 10-Jul-17 77
344
0.63 0.86
35.71%
10 Lotte Chemical Titan Holding Berhad
Main 11-Jul-17 3,770
10,847
6.50 4.70
-27.69%
11 Cloudaron Group Berhad
LEAP 3-Oct-17 6
155
0.11 0.21
90.91%
12 Red Ideas Holdings Berhad
LEAP 8-Nov-17 7
35
0.35 0.50
42.86%
13 Kejuruteraan Asastera Berhad
ACE 17-Nov-17 20
34
0.25 0.30
20.00%
7,406 17,449 18.46%
Listings in 2017
Worst performer
Top performer
During the year of 2017, Bursa Malaysia has raised more than MYR 7.4 billion funds. Share prices of the 13 new listed companies in 2017 have an average increase of 18.5% from their Initial Public Offering (IPO) prices, with Serba Dinamik Holdings Berhad being the top performer by increasing 116.0%, while HLT Global Berhad experienced the largest share price drop of 35.56%.
Malaysia IPO market
19
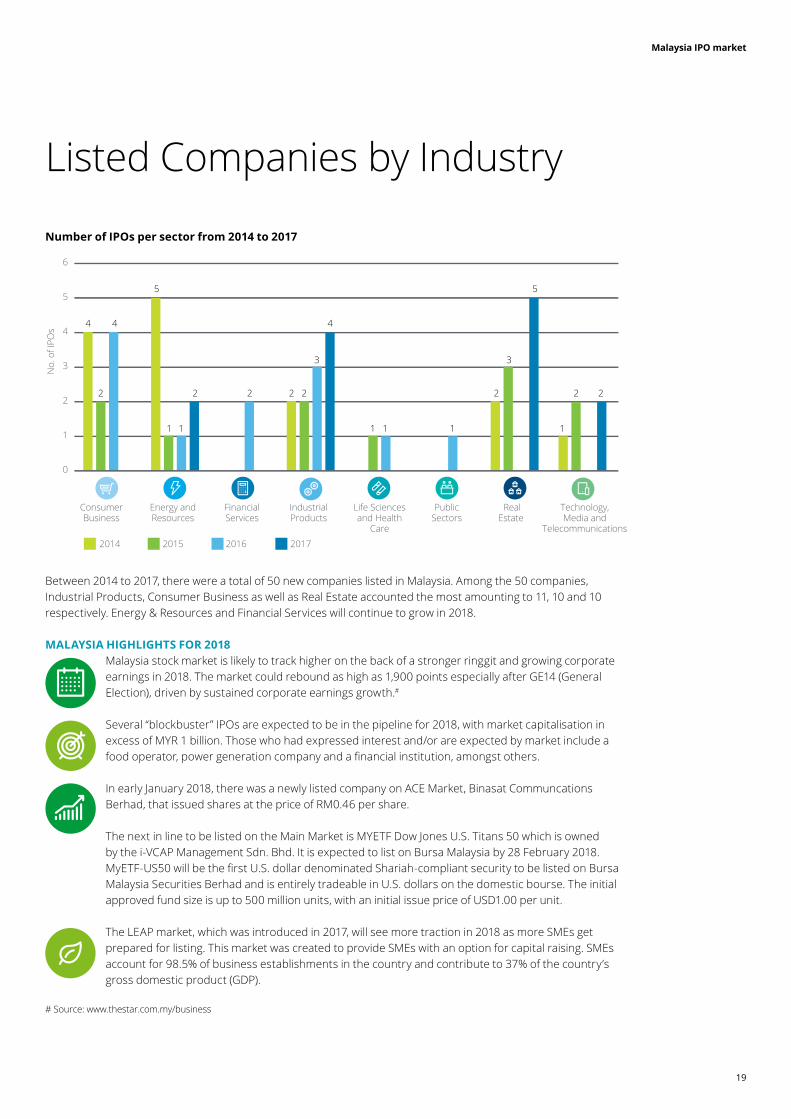
Listed Companies by Industry
Between 2014 to 2017, there were a total of 50 new companies listed in Malaysia. Among the 50 companies, Industrial Products, Consumer Business as well as Real Estate accounted the most amounting to 11, 10 and 10 respectively. Energy & Resources and Financial Services will continue to grow in 2018.
MALAYSIA HIGHLIGHTS FOR 2018Malaysia stock market is likely to track higher on the back of a stronger ringgit and growing corporate earnings in 2018. The market could rebound as high as 1,900 points especially after GE14 (General Election), driven by sustained corporate earnings growth.#
Several “blockbuster” IPOs are expected to be in the pipeline for 2018, with market capitalisation in excess of MYR 1 billion. Those who had expressed interest and/or are expected by market include a food operator, power generation company and a financial institution, amongst others.
In early January 2018, there was a newly listed company on ACE Market, Binasat Communcations Berhad, that issued shares at the price of RM0.46 per share.
The next in line to be listed on the Main Market is MYETF Dow Jones U.S. Titans 50 which is owned by the i-VCAP Management Sdn. Bhd. It is expected to list on Bursa Malaysia by 28 February 2018. MyETF-US50 will be the first U.S. dollar denominated Shariah-compliant security to be listed on Bursa Malaysia Securities Berhad and is entirely tradeable in U.S. dollars on the domestic bourse. The initial approved fund size is up to 500 million units, with an initial issue price of USD1.00 per unit.
The LEAP market, which was introduced in 2017, will see more traction in 2018 as more SMEs get prepared for listing. This market was created to provide SMEs with an option for capital raising. SMEs account for 98.5% of business establishments in the country and contribute to 37% of the country’s gross domestic product (GDP).
# Source: www.thestar.com.my/business
Number of IPOs per sector from 2014 to 2017
6
5
4
3
2
1
0
No.
of I
POs
ConsumerBusiness
2014 2015 2016 2017
IndustrialProducts
Energy andResources
FinancialServices
RealEstate
Life Sciencesand Health
Care
PublicSectors
Technology,Media and
Telecommunications
4 4 4
5 5
2
1 1 1 1 1 1
2 2 2 2
3 3
2 22

Southeast Asia IPO market
20
Contact us
Southeast Asia IPO market
21
About GIOSOur Global IFRS and Offerings Services (GIOS) professionals provide a diverse range of services ranging from IFRS implementation services, reporting advisory services and cross-border offerings services.
The global GIOS network consists of more than 200 member firm professionals located in the key markets of Asia, Europe, and North and South America.
The formation of GIOS Southeast Asia strengthens our capabilities in marketing as well as in the execution of public offerings as reporting accountants, IFRS and reporting advisory transactions.
Global service teams are knowledgeable about the regulatory requirements of the key markets around the globe and adept at assisting clients in addressing the complexities of cross-border listings, as well as assessing and fulfilling their post-offering reporting requirements.
Global service teams that develop responses, services, methodologies and technologies to respond to your issues. Practice development through educations, conference and online trainings.
Southeast Asia IPO market
22
Talk to us
To find out more, please contact the respective GIOS Country Leaders:
Southeast AsiaKan, [email protected]+65 6530 5517
Guam Vensel, Lee H. [email protected]+1 671 646 3884
PhilippinesBaltazar, Wilfredo [email protected]+63 2 581 9000 ext 011
VietnamLe Dinh, Tu [email protected]+84 8391 00751 ext 6226
LaosSurachutikarn, Choopong [email protected]+66 2034 0114 ext 40114
MyanmarCho, [email protected]+65 6800 2255
CambodiaKhoy, [email protected]+855 23 963 788
IndonesiaBing [email protected]+62 21 5081 8200
SingaporeTay, Hwee [email protected]+65 6216 3258
MalaysiaHuang, Gary [email protected]+60 3 7610 8812
ThailandMeakhaamnouychai, Suwatchai [email protected]+66 2034 0139 ext 40139

Southeast Asia IPO market
23
LaosSurachutikarn, Choopong [email protected]+66 2034 0114 ext 40114
SingaporeTay, Hwee [email protected]+65 6216 3258
Deloitte refers to one or more of Deloitte Touche Tohmatsu Limited, a UK private company limited by guarantee (“DTTL”), its network of member firms, and their related entities. DTTL and each of its member firms are legally separate and independent entities. DTTL (also referred to as “Deloitte Global”) does not provide services to clients. Please see www.deloitte.com/about to learn more about our global network of member firms.
Deloitte provides audit, consulting, financial advisory, risk advisory, tax and related services to public and private clients spanning multiple industries. Deloitte serves four out of five Fortune Global 500® companies through a globally connected network of member firms in more than 150 countries and territories bringing world-class capabilities, insights, and high-quality service to address clients’ most complex business challenges. To learn more about how Deloitte’s approximately 264,000 professionals make an impact that matters, please connect with us on Facebook, LinkedIn, or Twitter. About Deloitte Southeast AsiaDeloitte Southeast Asia Ltd – a member firm of Deloitte Touche Tohmatsu Limited comprising Deloitte practices operating in Brunei, Cambodia, Guam, Indonesia, Lao PDR, Malaysia, Myanmar, Philippines, Singapore, Thailand and Vietnam – was established to deliver measurable value to the particular demands of increasingly intra-regional and fast growing companies and enterprises.
Comprising 300 partners and over 8,000 professionals in 25 office locations, the subsidiaries and affiliates of Deloitte Southeast Asia Ltd combine their technical expertise and deep industry knowledge to deliver consistent high quality services to companies in the region.
All services are provided through the individual country practices, their subsidiaries and affiliates which are separate and independent legal entities.
© 2018 Deloitte Southeast Asia Ltd