Embed Size (px)
Citation preview

South Walker Creek Mine
Texel Solutions
August 2013
1308/2
KemmisII–Impactsonwaterqualityandhydrology

South Walker Creek Mine – Kemmis II Impacts on Water Quality and Hydrology
P a g e | i
CONTENTS
EXECUTIVE SUMMARY ....................................................................................................................................III
1. BACKGROUND AND SCOPE ...................................................................................................................... 1
1.1 KEMMIS II PROJECT AND HYDROLOGICAL SETTING ............................................................................................. 1
1.2 SCOPE ...................................................................................................................................................... 2
2. IMPACTS ON HYDROLOGY OF FARM DAM TRIBUTARY ............................................................................ 5
2.1 IDENTIFICATION OF ASPECTS ......................................................................................................................... 5
2.2 CHANGES TO FARM DAM WATER LEVELS AND AVAILABILITY ............................................................................... 5
2.3 CHANGES TO THE FREQUENCY AND DURATION OF OVERFLOWS FROM FARM DAM .................................................. 5
2.4 CHANGES TO HYDROLOGY OF FARM DAM TRIBUTARY ....................................................................................... 6
3. IMPACTS ON THE HYDROLOGY AND WATER QUALITY OF KEMMIS 1 TRIBUTARY .................................... 7
3.1 IDENTIFICATION OF ASPECTS ......................................................................................................................... 7
3.2 CHANGES TO HYDROLOGY OF KEMMIS 1 TRIBUTARY ....................................................................................... 10
3.3 CHANGES TO WATER QUALITY IN KEMMIS 1 TRIBUTARY .................................................................................. 12
3.3.1 Data Review and Water Quality Objectives .................................................................................... 12
3.3.2 Desktop Assessment of HEV Receiving Water Values ..................................................................... 13
3.3.3 Assessment of Impacts .................................................................................................................... 14
4. IMPACTS ON WATER RESOURCES .......................................................................................................... 16
South Walker Creek Mine – Kemmis II Impacts on Water Quality and Hydrology
P a g e | ii
FIGURES
FIGURE 1.1 SOUTH WALKER CREEK MINE LOCATION WITHIN FITZROY BASIN.................................................................. 3
FIGURE 1.2 SOUTH WALKER CREEK MINE WITHIN THE BEE CREEK CATCHMENT .............................................................. 3
FIGURE 1.3 SOUTH WALKER CREEK MINE WITHIN THE BEE CREEK CATCHMENT .............................................................. 4
FIGURE 2.1 FARM DAM TRIBUTARY AND PROPOSED KEMMIS II EXTENSION .................................................................... 8
FIGURE 3.1. KEMMIS 1 TRIBUTARY AND PROPOSED KEMMIS II EXTENSION ..................................................................... 9
FIGURE 3.2 PREDICTED CHANGE IN PEAK FLOW AT KEMMIS 1 OUTFLOW FOR DESIGN STORM EVENTS ................................ 10
FIGURE 3.3 PREDICTED CHANGE IN PEAK FLOW AT KEMMIS TRIBUTARY OUTFLOW FOR DESIGN STORM EVENTS .................... 11
FIGURE 3.4 COMPARISON OF DISSOLVED ALUMINIUM CONCENTRATIONS BETWEEN EXISTING KEMMIS DAMS AND BACKGROUND
MONITORING LOCATION. .................................................................................................................................... 14
FIGURE 3.5 PREDICTED CHANGES IN FLOW FREQUENCY AND SALINITY IN KEMMIS 1 TRIBUTARY ........................................ 15
FIGURE 4.1 PREDICTED CHANGES IN MEAN ANNUAL FLOW ........................................................................................ 18

South Walker Creek Mine – Kemmis II Impacts on Water Quality and Hydrology
P a g e | iii
EXECUTIVE SUMMARY
BHP Mitsui Coal (BMC) is proposing to further develop the Kemmis mining area at South Walker
Creek Mine (SWC) by extending the strike of the existing Kemmis 1 workings approximately 3km in a
north westerly direction. The proposed extension is referred to as Kemmis II. Texel Solutions has
been engaged by BMC to evaluate the nature and magnitude of impacts from Kemmis II on
hydrology and water quality.
The Kemmis II project involves the direct disturbance of four 1st order streams with a combined
catchment area of approximately 250 ha at the downstream most extent of the Kemmis II
disturbance. These streams are associated with two 2nd order un-named tributaries of Kemmis
Creek that will not undergo any direct disturbance. These tributaries are identified as Farm Dam
tributary and Kemmis 1 tributary for the purposes of the assessment. A large constructed dam is
located on the Farm Dam tributary downstream from the Kemmis II mining area. This dam has
already altered the flow regime of this tributary.
Kemmis Creek in the vicinity of the Farm Dam and Kemmis 1 tributaries is a 4th order stream with an
upstream catchment of approximately 10,700 ha and is located in the upper Isaac River sub-basin.
The Isaac River, a regional waterway, is located approximately 160 km downstream from where the
tributaries impacted by Kemmis II flow to Kemmis Creek. All of the above mentioned creeks and
rivers, including the Isaac River, are ephemeral watercourses, flowing only intermittently, after
significant rainfall, which typically occurs during the wetter months between November and
February.
The evaluation of hydrological and water quality impacts involved the undertaking of both event
based hydrological modelling and a long term daily AWBM runoff and water balance. Predictions
from this evaluation were compared with predictions for the existing condition, EPP Water - Water
Quality Objectives (WQO) and other relevant guidelines and are summarised on the next page.

South Walker Creek Mine – Kemmis II Impacts on Water Quality and Hydrology
P a g e | iv
Summary of predicted impacts from Kemmis II on water quality and hydrology.
Kemmis II Potential Impacts
Minor tributaries - 1st
order streams Kemmis 1 tributary – 2nd
order tributary, stream length 6.0 km
Farm Dam tributary – 2nd
order tributary, stream length 3.3 km
Kemmis Creek – 4th
order tributary
Direct disturbance Direct disturbance of tributaries with a combined catchment of 250 ha at the downstream limit of Kemmis II disturbance
None. None. None.
Hydrological impacts Full diversion of catchment and flow path.
Changes in peak flow rates of between -45% and +30% at the mining area outlet.
15-45% reduction in critical peak flow rates (maximum predicted flow rate for a given ARI) at the mining area outlet.
Changes in peak flow rates of between -5-0% at the tributary outlet.
Occurrence of tributary flows immediately downstream from Farm Dam already reduced by >80% from natural condition as a result of the dam.
Kemmis II results in a further 5% reduction in these occurrences.
25-35% reduction in peak outflow rates from Farm Dam.
Changes in peak flow rates of between -0.7% and +1.5%
Water quality impacts
NA No change in the achievement of the locally derived Environmental Authority low flow release limit for EC.
7% increase in the occurrence of salinity WQO being exceeded.
Salinity conforms to the stock and irrigation WQOs 100% of the time and the drinking water (aesthetic) limit for good quality water 99.7% of the time.
No changes anticipated. No change in achievement of WQO.
Water resources NA 12% increase in mean annual flow at the tributary outlet.
27% reduction in mean annual flow at the tributary outlet.
0.3% reduction in Kemmis Creek mean annual flow immediately downstream of Kemmis II tributaries.

South Walker Creek Mine – Kemmis II Impacts on Water Quality and Hydrology
P a g e | 1
1. BACKGROUND AND SCOPE
1.1 Kemmis II project and hydrological setting BHP Mitsui Coal (BMC) is proposing to further develop the Kemmis mining area at South Walker
Creek Mine (SWC) by extending the strike of the existing Kemmis 1 workings approximately 3km in a
north westerly direction. The proposed extension is referred to as Kemmis II. Texel Solutions has
been engaged by BMC to evaluate the nature and magnitude of impacts from Kemmis II on
hydrology and water quality.
SWC is in located in the upper catchment of the Isaac River sub-basin of the Fitzroy Basin. Significant
(4th order) streams traversing and adjoining SWC are Kemmis Creek and Walker Creek, both of which
flow to Bee Creek, a tributary of Connors River system. The Connors River flows into the Isaac River
approximately 75 km downstream from its confluence with Bee Creek.
SWC is located approximately mid-catchment within the Bee Creek catchment. The Bee Creek outlet
to Connors River is located approximately 70 km downstream from the confluence with Kemmis
Creek and Walker Creek tributaries while the headwaters of Bee Creek are approximately 70 km
upstream from these tributaries. The location of SWC in relation to these hydrological features is
shown in Figure 1.1 and Figure 1.2. All of the above mentioned creeks and rivers, including the Isaac
River, are ephemeral watercourses, flowing only intermittently after significant rainfall, which
typically occurs during the wetter months between November and February.
The Kemmis II mining area, shown in Figure 1.3, is located in the northern portion of SWC mining
leases. The Kemmis II mining area is located on the catchment divide between Walker Creek and
Kemmis Creek. While the 10 year planned mining extents are generally located within the Kemmis
Creek catchment, approximately 100 ha in the south western portion of Kemmis II is located within
the Walker Creek catchment and drains to the west. Runoff from this area will be contained by the
pit and managed within the site mine water management network, or directed to Kemmis II dams,
effectively removing this area from the Walker Creek catchment. Given that the resultant reduction
in catchment area represents less than 0.3% of Walker Creek’s 38,300 ha total catchment area (at
the confluence with Bee Creek), a detailed assessment of impacts on Walker Creek hydrology and
water resources has not been undertaken.
Drainage from the majority of the Kemmis II mining area is towards Kemmis Creek. Direct
disturbance of streams by Kemmis II activities is limited to four minor, 1st order streams three of
which have catchments < 40 ha in area. The northern portion of Kemmis II is within the catchment
of a substantial dam (Farm Dam). Farm Dam is a man-made dam and was constructed within a
neighbouring property on a tributary of Kemmis Creek (Farm Dam tributary) in order to supply
construction water for the adjacent railway. The Kemmis II development directly disturbs the Farm
Dam tributary up to a point at which it presently has a 150 ha catchment. Impacts of the Kemmis II
development on Farm Dam itself have previously been assessed and are referenced in Section 2.2.
Mine infrastructure and overburden emplacements are planned for within the Farm Dam
catchment, which until now has been undisturbed by mining activity. It is proposed by BMC that in
order to avoid any risk of mining activity impacting on water quality in Farm Dam, runoff from

South Walker Creek Mine – Kemmis II Impacts on Water Quality and Hydrology
P a g e | 2
Kemmis II overburden emplacements is directed south and away from the dam via drainage
channels on the overburden emplacements and a dam and transfer network. Two new sediment
dams are planned to be constructed for this purpose with a combined capacity of approximately 75
ML. The southernmost of the new dams, Kemmis II South Sediment Dam, will overflow via an
excavated channel to a tributary of Kemmis Creek at the eastern boundary of the existing Kemmis 1
mining area. This tributary of Kemmis Creek is referred to as the Kemmis 1 tributary. In order to
enhance sediment capture for subsequent rainfall events and to facilitate maintenance of the dams,
the water level in these sediment dams will be drawn down following rain through use of captured
water in road watering.
The southern portion of the Kemmis II extension interfaces with the existing Kemmis 1 mining area,
which includes an existing sediment dam (Kemmis 1 Sediment Dam). While the catchment area of
the Kemmis 1 Sediment Dam will remain largely unchanged through the development of Kemmis II,
there will be an increase in the disturbed portion of the catchment as Kemmis II overburden
emplacements are situated within its catchment. Overflows from this dam currently report to the
Kemmis 1 tributary, with no changes to this arrangement proposed as part of the mining extension.
1.2 Scope The Kemmis II proposal described in Section 1.1 has the potential to alter the local hydrology and
water quality in Kemmis Creek and its associated tributaries. The Kemmis II development plan was
reviewed in the context of the current topography, drainage and surface water infrastructure, with a
view to identifying significant hydrological and water quality aspects. The following aspects and
potential impacts were identified:
In establishing the pit and controlling or treating runoff from the northern portion of Kemmis II,
runoff from proposed disturbance areas that currently drain to the Farm Dam will be intercepted
and re-directed to the south, thereby altering the magnitude and occurrence of outflows from
the dam.
Directing mine area runoff away from Farm Dam and to the south will increase the catchment of
the Kemmis 1 tributary, thereby altering the downstream hydrology.
The runoff from disturbed ground and overburden emplacement areas has the potential to
contain higher than background levels of contaminants such as sediment and dissolved salts.
While sediments will be captured in purpose built sediment basins, dissolved contaminants have
the potential to adversely impact nearby receptors such as the local watercourses. Given that
mine affected runoff will be directed away from the Farm Dam tributary, the potential for
adverse water quality impacts is limited to the Kemmis 1 tributary
The new sediment dams may detain flows in the Kemmis 1 tributary, thereby reducing
downstream peak flow rates.
Drawing down the water level in the sediment dams through road water, evaporation and
infiltration may reduce the availability of water downstream from the dams.
Mine affected water generated at the Kemmis II area will be managed through the mine’s water
management system and discharged into Walker creek via the current EA conditions

South Walker Creek Mine – Kemmis II Impacts on Water Quality and Hydrology
P a g e | 3
Figure 1.1 South Walker Creek Mine location within Fitzroy Basin
Figure 1.2 South Walker Creek Mine within the Bee Creek Catchment
Kemmis Creek
Walker Creek
Kemmis II mining area

South Walker Creek Mine – Kemmis II Impacts on Water Quality and Hydrology
P a g e | 4
Figure 1.3 South Walker Creek Mine within the Bee Creek Catchment
The following tasks have been undertaken in order to evaluate the nature and magnitude of the potential impacts
identified above:
Undertake a water and solute balance using long term historical rainfall data to compare the occurrence of flows
and associated water quality between the existing case and the developed case at significant locations.
Undertake hydrological modelling of design rainfall events with various durations and recurrence intervals,
including the critical duration, and identify hydrological changes between the existing case and the developed
case at significant locations.
The assessments described above are based on the 10 year Kemmis II extents. The justification for this is twofold:
There is insufficient detail beyond the 10 years planning horizon to undertake an assessment of this nature
After 10 years, the net area of disturbance and its composition is expected to remain relatively static as
progressive rehabilitation will have commenced and will be approximately equivalent to new disturbance.
Drainage from established rehabilitation will be directed away from the dams so that they do not become
hydraulically overloaded.
Details of the water and solute balance and hydrological modelling methods are included in Appendix A. Findings
are presented in this report.
10,693 hectares
742.82 hectares
662.91 hectares
771.90 hectares
Kemmis II
Existing operation
Kemmis 1

South Walker Creek Mine – Kemmis II Impacts on Water Quality and Hydrology
P a g e | 5
2. Impacts on Hydrology of Farm Dam Tributary
2.1 Identification of Aspects The catchment area of the Farm Dam tributary to the confluence with Kemmis Creek is
approximately 770 ha. As is shown in Figure 3.1, approximately three quarters of this catchment
area (590 ha) currently reports to Farm Dam, which has an estimated capacity of 450 ML. As a
result, the catchment area of the reach between Farm Dam and the Kemmis Creek confluence is
effectively reduced from 770 ha to 180 ha unless the dam is overflowing. This remains unchanged
with the development of Kemmis II as the proposed extension does not impact the 180 ha of
catchment area that contributes directly to flow downstream of Farm Dam and therefore the
proposed Kemmis II extension is not expected impact hydrology at an event level in the Farm Dam
tributary downstream from Farm Dam unless the dam is overflowing.
The Kemmis II extension will reduce the catchment area to Farm Dam from 590 ha to approximately
405 ha as runoff from the mining area is to be directed away from the dam. Direct impacts on the
volume of water in Farm Dam, has been previously assessed and results from this assessment are
res-stated in Section 2.2. The reduction in catchment also has the potential to reduce the frequency
of overflows from Farm Dam as well and reduce the runoff volume and peak flows of events when
Farm Dam is overflowing. These aspects have been assessed, with results presented under the
following headings.
As runoff from the proposed mining area is to be directed away from the Farm Dam tributary,
impacts on water quality are not anticipated.
2.2 Changes to Farm Dam Water Levels and Availability The potential for Kemmis II to impact water levels in Farm Dam is described in the report “Kemmis II
– Options for the Management of Drainage from Overburden” (Texel Solutions, June 2013). The
modelling undertaken in the above assessment predicted that while diverting all mine generated
water away from Farm Dam resulted in the least impact on water quality in the dam, this approach
had the greatest impact on the water level in Farm Dam. The modelling predicted that under the
proposed Kemmis II drainage arrangements, the volume of water in Farm Dam would on a daily
basis typically be between 22 and 51% lower than it would be under the existing catchment
arrangements. The occurrence rate of the dam supply failings is predicted to approximately double,
as is the average annual rate of supply shortfall in the event the dam is utilised for supply.
2.3 Changes to the Frequency and Duration of Overflows from Farm Dam The frequency and volume of overflows from Farm Dam in the existing case and for the Kemmis II
case were assessed using the AWBM/GoldSim water balance model. Given the influence Farm Dam
already has catchment hydrology, a pre-Farm Dam case was also developed in order to provide
context to any changes identified. For the cases including the Farm Dam, the model was used to
simulate daily Farm Dam levels over a long term synthetic rainfall series that was sourced from the
Bureau of Meteorology (BOM). Further details of the modelling are provided in Appendix A. Model
predictions are tabulated below.
South Walker Creek Mine – Kemmis II Impacts on Water Quality and Hydrology
P a g e | 6
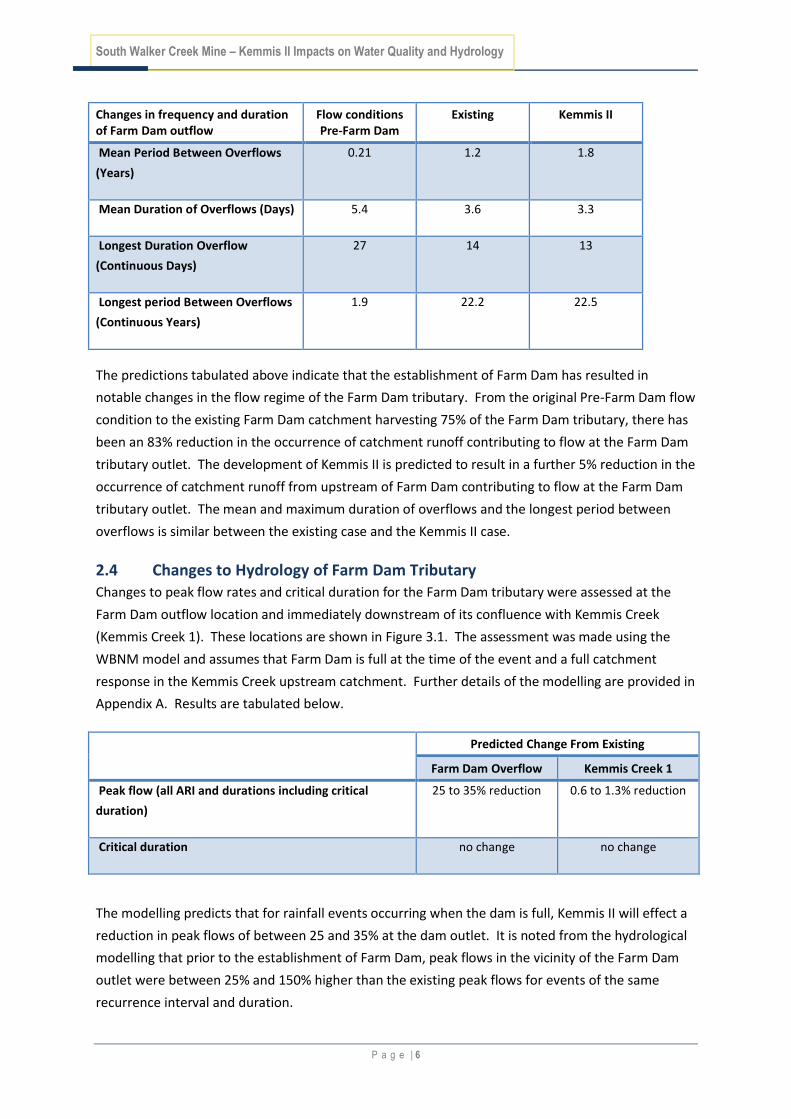
Changes in frequency and duration of Farm Dam outflow
Flow conditions Pre-Farm Dam
Existing Kemmis II
Mean Period Between Overflows
(Years)
0.21 1.2 1.8
Mean Duration of Overflows (Days) 5.4 3.6 3.3
Longest Duration Overflow
(Continuous Days)
27 14 13
Longest period Between Overflows
(Continuous Years)
1.9 22.2 22.5
The predictions tabulated above indicate that the establishment of Farm Dam has resulted in
notable changes in the flow regime of the Farm Dam tributary. From the original Pre-Farm Dam flow
condition to the existing Farm Dam catchment harvesting 75% of the Farm Dam tributary, there has
been an 83% reduction in the occurrence of catchment runoff contributing to flow at the Farm Dam
tributary outlet. The development of Kemmis II is predicted to result in a further 5% reduction in the
occurrence of catchment runoff from upstream of Farm Dam contributing to flow at the Farm Dam
tributary outlet. The mean and maximum duration of overflows and the longest period between
overflows is similar between the existing case and the Kemmis II case.
2.4 Changes to Hydrology of Farm Dam Tributary Changes to peak flow rates and critical duration for the Farm Dam tributary were assessed at the
Farm Dam outflow location and immediately downstream of its confluence with Kemmis Creek
(Kemmis Creek 1). These locations are shown in Figure 3.1. The assessment was made using the
WBNM model and assumes that Farm Dam is full at the time of the event and a full catchment
response in the Kemmis Creek upstream catchment. Further details of the modelling are provided in
Appendix A. Results are tabulated below.
Predicted Change From Existing
Farm Dam Overflow Kemmis Creek 1
Peak flow (all ARI and durations including critical
duration)
25 to 35% reduction 0.6 to 1.3% reduction
Critical duration no change no change
The modelling predicts that for rainfall events occurring when the dam is full, Kemmis II will effect a
reduction in peak flows of between 25 and 35% at the dam outlet. It is noted from the hydrological
modelling that prior to the establishment of Farm Dam, peak flows in the vicinity of the Farm Dam
outlet were between 25% and 150% higher than the existing peak flows for events of the same
recurrence interval and duration.

South Walker Creek Mine – Kemmis II Impacts on Water Quality and Hydrology
P a g e | 7
Under the condition of full catchment response, the change in peak flows between the existing case
and the Kemmis II case is predicted to reduce to -1.3 to -0.6% immediately downstream from the
confluence with Kemmis Creek, indicating that hydrological impacts are limited to the Farm Dam
tributary.
3. Impacts on the Hydrology and Water Quality of Kemmis 1 Tributary
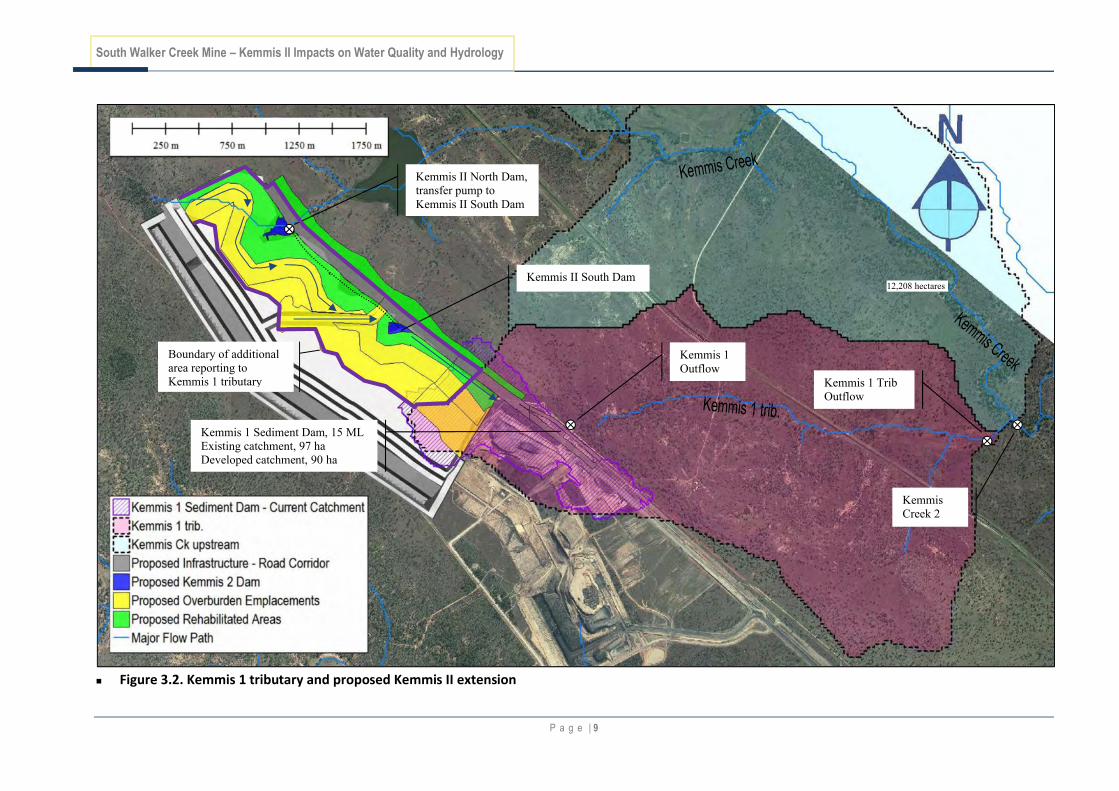
3.1 Identification of Aspects The catchment area of the Kemmis 1 tributary to the confluence with Kemmis Creek is
approximately 665 ha. As is shown in Figure 3.2, approximately 15% of this catchment area (97 ha)
reports to Kemmis 1 Sediment Dam, which has an estimated capacity of 15 ML. Under the existing
condition, approximately 25% of the Kemmis 1 Sediment Dam catchment comprises overburden
emplacements with infrastructure and undisturbed areas making up the remainder.
The Kemmis II extension will not materially alter the catchment area to Kemmis 1 Sediment Dam,
however, the portion of the catchment comprising overburden emplacements will increase from
25% to 45%. Further, runoff from an additional 130 ha of mining disturbed land, of which
approximately 60% is overburden emplacements, will be directed to the Kemmis 1 tributary
immediately downstream from the Kemmis 1 Sediment Dam via a series of drains, a pump and pipe
transfer network and the new sediment dams (Kemmis II North Dam and Kemmis II South Dam). The
drainage layout is shown in Figure 3.2.
Run off from overburden emplacements can have a higher than background salinity, however, this
reduces over time as a leached surface profile is established, or rehabilitation works provide cover.
During the period for which runoff from overburden has a higher than background salinity, there is
potential for the achievement of downstream water quality objectives (WQO) to be impacted.
Catchment areas formerly within the Farm Dam catchment are to be directed to the Kemmis 1
tributary via the Kemmis II dams, potentially altering the downstream hydrology. Further impacts on
hydrology may arise as a result of the overburden emplacements generally having a lower rainfall
excess than natural catchment areas and peak flows being attenuated through the new sediment
dams.
These aspects have been assessed, with results presented under the following headings. While this
section evaluates the potential hydrologic and water quality impacts associated with these aspects,
the associated water resources impacts are evaluated in Section 4.

South Walker Creek Mine – Kemmis II Impacts on Water Quality and Hydrology
P a g e | 8
Figure 3.1 Farm Dam tributary and proposed Kemmis II extension
Farm Dam, 447 ML Existing catchment, 590 ha Developed catchment, 404 ha
180 ha downstream
from Farm Dam
10,693 hectares
Farm Dam Outflow
Kemmis Creek 1
South Walker Creek Mine – Kemmis II Impacts on Water Quality and Hydrology
P a g e | 9
Figure 3.2. Kemmis 1 tributary and proposed Kemmis II extension
Kemmis 1 Sediment Dam, 15 ML Existing catchment, 97 ha Developed catchment, 90 ha
12,208 hectares
Kemmis 1 Outflow
Kemmis Creek 2
Kemmis 1 Trib Outflow
Kemmis II North Dam, transfer pump to Kemmis II South Dam
Kemmis II South Dam
`
Boundary of additional area reporting to Kemmis 1 tributary

South Walker Creek Mine – Kemmis II Impacts on Water Quality and Hydrology
P a g e | 10
3.2 Changes to Hydrology of Kemmis 1 Tributary Changes to peak flow rates and critical duration for the Kemmis 1 tributary were assessed at the
Kemmis 1 Outflow location, the Kemmis 1 tributary outflow and immediately downstream of the
Kemmis 1 tributary confluence with Kemmis Creek (Kemmis Creek 2). These locations are shown in
Figure 3.2. The assessment was made using the WBNM model and assumes that all dams are full at
the time of the event and a full catchment response in the Kemmis Creek upstream catchment.
Further details of the modelling are provided in Appendix A. Results are tabulated below. .
Predicted Change From Existing
Kemmis Outflow Kemmis 1 trib. Outflow
Kemmis Creek 2
Peak flow (all ARI and durations including critical duration)
-45% to +30%
Variation with ARI and duration shown in
Figure 3.3.
-5% to 0% Variation with ARI and
duration shown in
Figure 3.4.
- 0.7 to +1.5%
Critical duration No change. No change. No change.
Figure 3.3 Predicted change in peak flow at Kemmis 1 Outflow for design storm events

South Walker Creek Mine – Kemmis II Impacts on Water Quality and Hydrology
P a g e | 11
Figure 3.4 Predicted change in peak flow at Kemmis tributary outflow for design storm events
The above table and figures indicate that despite there being an increase in catchment to the
Kemmis 1 Outflow from the Kemmis II development case, peak flows are generally predicted to be
lower than the existing case in most circumstances, with the exception of the Kemmis 1 outflow
location for events with high runoff volumes1. The general reduction in peak flows is attributed to
the detention provided by the Kemmis II South Dam, which is necessary to ensure effective removal
of sediment from the flows.
Changes in peak flows at Kemmis Creek 2, downstream from the confluence of Kemmis 1 tributary
and Kemmis Creek are predicted to be between -0.7 and +1.5% for all modelled ARI and durations,
indicating that hydrological impacts are limited to the Kemmis 1 tributary.
1 The model predicts increased peak flows for only 100 year ARI events with duration > 24h duration, and 72
hour events with recurrence interval > 10 year ARI.

South Walker Creek Mine – Kemmis II Impacts on Water Quality and Hydrology
P a g e | 12
3.3 Changes to Water Quality in Kemmis 1 Tributary
3.3.1 Data Review and Water Quality Objectives
SWC water quality monitoring data from water courses and the existing Kemmis 1 Dams was
reviewed in order to identify potential contaminants and characterise runoff for the modelling. The
existing Kemmis 1 dams have overburden emplacements within their catchments, with materials
sourced from the pit immediately adjacent to the Kemmis II. The water quality in these dams is
considered to be reflective of the quality expected from the Kemmis II area. Potential contaminants
were identified as those present in levels exceeding the water quality objectives (WQO) set out in
the Environmental Protection (Water) Policy 2009 – Isaac River Sub-basin Environmental Values and
Water Quality Objectives (EPP Water). Salinity and aluminium were identified as potential
contaminants and relevant WQO for these contaminants are presented below.
Contaminant Guideline Criteria
Electric Conductivity
(EC)
EPP Water Aquatic Ecosystems – moderately disturbed
low flow – 430 uS/cm
high flow – 250 uS/cm
Stock Water
3,000 uS/cm based on 2,000 mg/L for poultry, most sensitive
South Walker Creek Mine
Environmental Authority
Locally derived limit for low flow releases up to 28 days
after flows in the receiving water
700 uS/cm
Australian Drinking Water
Quality Guidelines
No health guideline value provided
Palatability
900 uS/cm – based on 600 mg/L threshold for good quality
Aluminium EPP Water Aquatic Ecosystems - Australian and New Zealand
Guidelines for Fresh and Marine Water Quality
(NWQMS 2000) 95% level of protection trigger value for
freshwater
55 ug/L
Stock (low risk) and Irrigation (Long Term Value – LTV)
5,000 ug/L
Australian Drinking Water
Quality Guidelines
No health guideline value provided for aluminium.
Salinity monitoring of water in the Kemmis 1 dams indicates a higher than background EC with a
median EC of 340 uS/cm compared with an ambient median EC of 230 uS/cm recorded in Walker
Creek at locations upstream of South Walker Creek Mine activity. While the median EC value for the
Kemmis 1 dams is higher than the EPP Water high flow WQO for salinity of 250 uS/cm it is below the

South Walker Creek Mine – Kemmis II Impacts on Water Quality and Hydrology
P a g e | 13
low flow WQO for salinity of 430 uS/cm. Although the observed higher than background EC in dams
may in part be a result of concentration in the dams through evaporation, it was assumed for the
purposes of characterising runoff from overburden that this variance is attributable solely to the
proportion of overburden area within the catchment. The resultant EC in runoff from overburden
was calculated to be 660 uS/cm and this value was applied to runoff from overburden in the model.
Apart from EC, aluminium was the only contaminant identified from the monitoring to be present in
concentrations exceeding the EPP Water WQO2. Samples from the existing Kemmis North and
Kemmis South Dam returned dissolved aluminium concentrations of 200 ug/L and 310 ug/L
respectively compared with the EPP Water WQO for aquatic ecosystems of 55 ug/L . The aluminium
concentration in both samples was well below the EPP Water WQO for stock and irrigation of 5,000
uS/cm. The relevant guidelines do not provide a health based threshold for aluminium in drinking
water.
A review of the existing receiving water environment monitoring data was undertaken to assess
background aluminium concentrations in the vicinity of the Kemmis mining area. While no
monitoring data is available for Kemmis Creek, thirteen samples taken upstream of the SWC mining
operations from Bee Creek, the receiving water for Kemmis Creek, have undergone laboratory
analysis for dissolved aluminium. The data is presented in Figure 3.5 and indicates that the
aluminium concentration in samples from the Kemmis Dams is consistent with background levels.
Operational phase monitoring is recommended to evaluate and review the potential for
contaminants originating from the mining area to exceed the water quality objectives and
background concentrations.
3.3.2 Desktop Assessment of HEV Receiving Water Values
A desktop assessment was undertaken with the objective of identifying any high environmental
value features associated with the streams and receiving waters potentially impacted by Kemmis II.
A review of Queensland Government mapping for High Environmental Value (HEV) waters and
Environmentally Sensitive Areas (ESA) was undertaken with relevant maps attached in Appendix B.
The review identified the nearest downstream HEV as Dipperu National Park, located adjacent to
Bee Creek. This HEV is located approximately 50 km downstream from the Kemmis II impacted
Kemmis Creek tributaries. The nearest ESA is an area mapped as Endangered Regional Ecosystem
(ERE) approximately 1.1 km from the Kemmis 1 tributary. This ERE is located adjacent to the Kemmis
Creek riparian zone and is entirely outside the Kemmis 1 tributary catchment.
Receiving water impacts resulting from the Kemmis II development are predicted to be limited to
the Kemmis Creek tributaries and indiscernible within Kemmis Creek. Therefore no specific
consideration has been given to these high environmental value features in this assessment.
2 The EPP water references the NWQMS guidelines for the 95th
percentile level of protection trigger value for freshwater

South Walker Creek Mine – Kemmis II Impacts on Water Quality and Hydrology
P a g e | 14
Figure 3.5 Comparison of dissolved aluminium concentrations between existing Kemmis dams and background monitoring location.
3.3.3 Assessment of Impacts
The frequency and quality of outflows from the Kemmis 1 mining area in the existing case and in the
Kemmis II development case were assessed using the AWBM/GoldSim water balance model. The
modelling involved a long term simulation of the mining area water network and contributing
catchments both on the mine site and downstream from the mine site. The model used a daily
synthetic rainfall series that was sourced from the BOM. Further details of the modelling are
provided in Appendix A.
Flow frequency and salinity were predicted using the water balance model at Kemmis 1 Outflow
location, the Kemmis 1 Tributary Outflow and immediately downstream of the Kemmis 1 tributary
confluence with Kemmis Creek (Kemmis Creek 2). These locations are shown in Figure 3.2. The
predictions were compared against the WQO and results are summarised in Figure 3.6.
Mean: 476310200
0
500
1,000
1,500
2,000
2,500
3,000
3,500
4,000
4,500
5,000
0
500
1,000
1,500
2,000
2,500
3,000
3,500
4,000
4,500
5,000
Background - BeeCreek Upstream (n=13)
Existing Kemmis Dams
Dis
solv
ed
Alu
min
ium
(u
g/L)
Monitoring Location
Comparison of Dissolved Alumimium Concentration in Existing Kemmis Dams With
Background (Bee Creek Upstream)
Kemmis S Dam
Kemmis N Dam
EPP Water Stock (low risk) &Irrigation LTV - 5,000 ug/L
EPP Water - Aquatic Ecosystems(NWQMS) - 55 ug/L
LOD - 10
Chart legend
Candle chart key
Maximum 80
th percentile
Mean
20th
percentile Minimum

South Walker Creek Mine – Kemmis II Impacts on Water Quality and Hydrology
P a g e | 15
While the modelling predicts no discernible changes with regard to the achievement of the
Environmental Authority low flow release limits within the Kemmis 1 tributary, the occurrence of
WQO exceedances is predicted to increase by 7% within the tributary. Predicted occurrences of
drinking water quality guideline being exceeded are less than 0.3% in both the existing and Kemmis
II case and there are no predicted occurrences of the stock water guideline being exceeded. These
changes in salinity are limited to the Kemmis 1 tributary and no discernible increases in EC relative to
the WQO are predicted within Kemmis Creek at the Kemmis Creek 2 location.
Figure 3.6 Predicted changes in flow frequency and salinity in Kemmis 1 tributary
The modelling outputs were further interrogated to investigate whether the concentration of any
contaminants potentially present in runoff from overburden would be likely to be magnified
following extended containment without flushing and evaporation. The event averaged
concentration of a contaminant with a relative concentration of 1 in the runoff from overburden was
predicted for each flow event (flow on consecutive days is a single event) at Kemmis 1 Outflow
location, the Kemmis 1 Tributary Outflow and immediately downstream of the Kemmis 1 tributary
confluence with Kemmis Creek (Kemmis Creek 2). These locations are shown in Figure 3.2. Model
predictions are tabulated below and indicate that the predicted occurrence of contaminant
magnification is rare (occur on average every 40 – 100 years) and moderate in scale (maximum 23%
increase in concentration compared with concentration in runoff from overburden).

South Walker Creek Mine – Kemmis II Impacts on Water Quality and Hydrology
P a g e | 16
Kemmis 1 outflow
Kemmis 1 trib. Outflow
Kemmis Creek 2
Range of event concentrations 0.25 – 1.23 0 – 1.23 0 – 1.23
Median event concentration 0.56 0.11 <0.01
No of occurrences of event concentration >
1 (magnification)
3 1 1
Average interval between magnification
occurrences
40 years > 100 years > 100 years
4. Impacts on Water Resources
Changes to catchment boundaries, catchment type and potential losses through evaporation,
seepage and the drawing down of sediment dam water levels have the potential to alter the
quantity of water conveyed through each of the tributaries and ultimately flowing in Kemmis Creek
downstream from mine affected catchments.
To assess the potential changes, the water balance model was used to predict the annual (July to
June) volume of flow through each of the locations below, over the long term historical rainfall
simulation. The mean annual flow was calculated from this simulation and results are shown in
Figure 4.1.
Farm Dam Outflow
Farm Dam Tributary Outflow
Kemmis Creek 1
Kemmis 1 Outflow
Kemmis 1 Tributary Outflow
Kemmis Creek 2
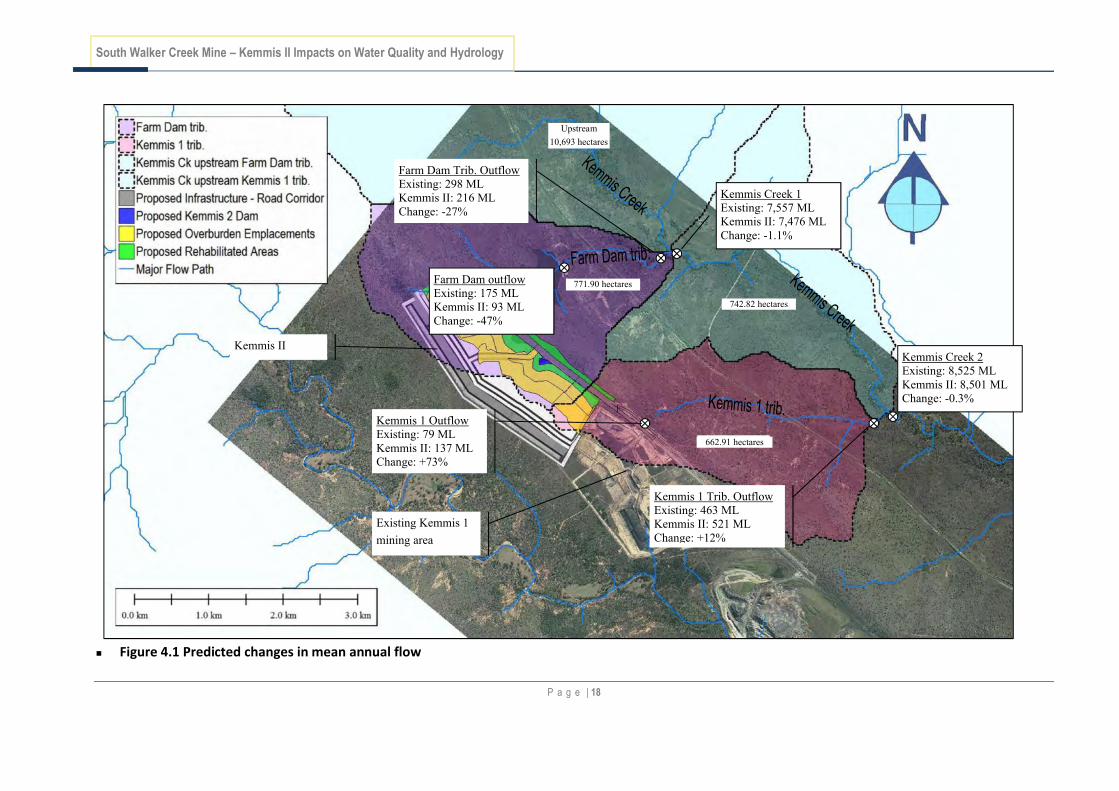
The modelling predicts a reduction in mean annual flow of only 0.3% immediately downstream of
the Kemmis Creek confluence with the Kemmis 1 tributary, indicating that changes to water
availability resulting from the Kemmis II development are predicted to be limited to only two
Kemmis Creek tributaries, namely Farm Dam tributary and Kemmis 1 tributary.
While the Kemmis II development is predicted to result in an 82ML reduction in the mean annual
overflow volume from within the Farm Dam catchment, compared to the Pre-Farm Dam conditions,
the construction of the Farm Dam itself has already reduced the availability of water in the
downstream reach, and given the relatively infrequent occurrence of overflows at present, the
downstream reach is unlikely at present to provide a reliable or significant source of water.

South Walker Creek Mine – Kemmis II Impacts on Water Quality and Hydrology
P a g e | 17
Increases in the mean annual volume are predicted within the Kemmis 1 tributary, however,
hydrological modelling has shown that with the exception of events with a large rainfall excess (ie.
100 year ARI events > 24h duration, or 72 hour events > 10 year ARI), peak flows, including the
critical peak are not predicted to increase. This is a result of the routing of flows through the
Kemmis II sediment Dams.
South Walker Creek Mine – Kemmis II Impacts on Water Quality and Hydrology
P a g e | 18
Figure 4.1 Predicted changes in mean annual flow
Upstream
10,693 hectares
742.82 hectares
662.91 hectares
771.90 hectares
Kemmis II
Existing Kemmis 1
mining area
Kemmis 1 Outflow Existing: 79 ML Kemmis II: 137 ML Change: +73%
Kemmis 1 Trib. Outflow Existing: 463 ML Kemmis II: 521 ML Change: +12%
Kemmis Creek 2 Existing: 8,525 ML Kemmis II: 8,501 ML Change: -0.3%
Farm Dam Trib. Outflow Existing: 298 ML Kemmis II: 216 ML Change: -27%
Kemmis Creek 1 Existing: 7,557 ML Kemmis II: 7,476 ML Change: -1.1%
Farm Dam outflow Existing: 175 ML Kemmis II: 93 ML Change: -47%

South Walker Creek Mine – Kemmis II Impacts on Water Quality and Hydrology
AppendixA
Hydrological Model Methodology
The objective of this component of the study was to investigate the potential impact that the proposed
Kemmis mine expansion would have on the hydrology immediately downstream of the site and within
Kemmis Creek. As part of this investigation there were four locations within the catchment that were
assessed to gain a better understanding on any changes to:
1. Peak discharge; 2. Timing of the peak; 3. Discharge volume; and 4. Duration of discharge exiting the mine site.
Modelling has been carried out for the 1, 2, 5, 10, 20, 50 and 100 year Annual Exceedance Probability
(AEP) flood events. The following scenarios have been investigated:
1. Existing Scenario – Pre Kemmis expansion as currently exists on site
2. Developed Scenario – Post Kemmis expansion for the anticipated 10 year horizon
Hydrologic modelling of the catchment has been carried out using WBNM software developed jointly
by the University of Wollongong, Rienco Consulting and Balance R&D. The January 2007 version
has been used for this investigation. A peak flow rational method calibration has also been carried
out.
Catchment
Sub-catchments delineated for the WBNM model has been based on LiDAR survey of the site and
25m DEM obtained from the State Government. A breakdown of the sub-catchments for the existing
and developed scenarios is presented below in TABLE A1 and TABLE A2. Catchments SUB1 to
SUB9, and SUB12, represent the Kemmis Creek catchments which are external to the South Walker
Creek mining area. These catchments remained unchanged in the existing and developed scenario.
Under the existing scenario SUB11 contains part of the existing mine which drains to a sediment
basin. From here overflows discharge along a drainage line before entering Kemmis Creek.
In the developed scenario, the mine extends into SUB10. Areas that are disturbed from the mine
expansion are directed into a new sediment basin and the overflow is re-diverted into SUB11. This
results in a reduction in catchment to SUB10 and increase in catchment to SUB11. It is to be noted
that there is an area of 42.8ha which drains to a newly created dam on the northern extent of the
expansion. This catchment has not been represented as it does not have the ability to overflow. Any
waters collected here are pumped south to a suitable storage. The total areas of SUB10 and SUB11
have decreased by approximately 50ha when comparing the existing and developed. This is a result
of the active pit being expanded into SUB10 and SUB11 and not contributing to overland flow.

South Walker Creek Mine – Kemmis II Impacts on Water Quality and Hydrology
TABLE A1: Existing Scenario WBNM Sub-Catchment Breakdown
ID Area (ha)
Natural
(ha)
Spoil
(ha)
Road
(ha)
SUB1 1174.9 1174.9 - -
SUB2 1291.2 1291.2 - -
SUB3 1120.3 1120.3 - -
SUB4 1199.1 1199.1 - -
SUB5 1419.4 1419.4 - -
SUB6 1250.3 1250.3 - -
SUB7 1474.0 1474.0 - -
SUB8 932.4 932.4 - -
SUB9 841.4 841.4 - -
SUB10a (US Farm Dam) 590.0 590.0 - -
SUB10b (DS Farm Dam) 181.9 181.9 - -
SUB11a-Existing Sed Basin 97.2 55.6 25.4 16.2
SUB11b 553.7 553.7 - -
SUB12 742.8 742.8 - -
Total 12868.6 12827.1 25.4 16.2
TABLE A2: Developed Scenario WBNM Sub-Catchment Breakdown
ID
Area
(ha)
Natural
(ha)
Spoil
(ha)
Road
(ha)
SUB1 1174.9 1174.9 - -
SUB2 1291.2 1291.2 - -
SUB3 1120.3 1120.3 - -
SUB4 1199.1 1199.1 - -
SUB5 1419.4 1419.4 - -
SUB6 1250.3 1250.3 - -
SUB7 1474.0 1474.0 - -
SUB8 932.4 932.4 - -
SUB9 841.4 841.4 - -
SUB10a (US Farm Dam) 409.0 409.0 - -
SUB10b (DS Farm Dam) 181.9 181.9 - -
SUB11a-Existing Sed
Basin 90.0 41.2 43.9 4.9
SUB11c-New Sed Basin 89.5 6.9 76.6 6.0
SUB11b – DS Sed Basins 553.7 553.7 - -
SUB12 742.8 742.8 - -
Total 12769.9 12638.5 120.5 10.9

South Walker Creek Mine – Kemmis II Impacts on Water Quality and Hydrology
Model Parameters
Intensity Frequency Duration
The intensity frequency duration (IFD) data has been obtained from the Bureau of Meteorology
website using the ARR87 methodology for the co-ordinates: Latitude: 21.70S, Longitude: 147.375
(issued 19/08/2013).
Rainfall Losses
Suitable rainfall loss parameters were selected to represent the respective catchment breakdowns as
either natural, spoil or road. TABLE A3 highlights the respective loss parameters and
imperviousness applied to each catchment type.
TABLE A3: WBNM Model Loss Parameters
WBNM Sub-Catchment Natural Spoil Road
Initial Loss 15 40 1
Continuing Loss 2.5 5 0
% Impervious 0 10 80
Online Storages
There was one storage represented in the existing scenario and two in the developed scenario that
were used the investigation. The farm dam, located in SUB10 is a large water storage constructed by
the Rail Authority and has a water surface area of 27ha and a spillway 30m wide. This dam is present
in both the existing and developed scenarios. In the developed scenario the new sediment basin has
been represented in the model to which disturbed areas from the Kemmis expansion contributes too.
This basin is approximately 2.3ha and has a spillway 3m wide. Outlined below in TABLE A4 are the
storage curves used in the model setup. It is to be noted that each storage is assumed to be full at the
start of the model run and only the effects of routing runoff through the spillway has been accounted
for.
TABLE A4: WBNM Storage Curve
Farm Dam (SUB10) New Sediment Basin (SUB11)
Elevation (m RL) Volume (ML) Elevation (m RL) Volume (ML)
0.00 0.0 0.0 0.0
0.25 69.2 0.25 5.8
0.50 138.3 0.5 11.5
0.75 207.5 0.75 17.3
1.00 276.6 1.0 23.0
Rational Method Comparison

South Walker Creek Mine – Kemmis II Impacts on Water Quality and Hydrology
The WBNM model has been calibrated to Rational Method derived peak flows for three sub-
catchments; SUB6, SUB7 and SUB9. A summary of the Rational Method calculation is provided
below in TABLE A5. A WBNM catchment lag parameter of 1.8 was applied to each catchment as
part of the calibration method (recommended 1.3 to 1.8).
TABLE A5: 100 year AEP Rational Method Comparison Summary
WBNM Sub-
Catchment
Catchment Area (ha)
Rational Method tc
(min) C10
Rational Method Q100
(m3/s)
WBNM Q100 (m3/s)
SUB6 1250.3 198 0.53 80.9 72.3
SUB7 1474.0 223 0.53 89.8 81.0
SUB9 841.4 178 0.53 59.5 54.6
A flood study was prepared for South Walker Creek by Alluvium (2008), which investigated regional
flooding of the numerous creek systems in the area. The reported flows from the Kemmis Creek
catchment were 430m3/s (9 hour storm). The model used in this investigation was broadly extended
down to Bee Creek in order to represent the total Kemmis Creek catchment of over 21km2. Peak
flows in the 100 year AEP were estimated to be 508m3/s (12 hour storm). Whilst there is limited
calibration data specific to Kemmis Creek, we believe a reasonable fit is achieved using the available
rational method and flow comparison with other studies.

South Walker Creek Mine – Kemmis II Impacts on Water Quality and Hydrology
AppendixB
Environmentally Sensitive Areas – Queensland Government
High Environmental Value Waters – EPP Water