Embed Size (px)
Citation preview
1
South Plains Transmission Project
October 10, 2016
Prepared by:
Sharyland Utilities, L.P.
2
Contents
1. Executive Summary .............................................................................................................................. 3
2. Introduction/Background ..................................................................................................................... 5
3. Model Benchmarking ............................................................................................................................ 7
a. Generation Expansion Assumptions ................................................................................................. 8
b. Load Modeling Assumptions ............................................................................................................. 8
c. DC Tie Modeling Assumptions .......................................................................................................... 9
d. Natural Gas Prices ........................................................................................................................... 10
e. Transmission Additions ................................................................................................................... 10
f. Economic Model Benchmarking Results ......................................................................................... 10
4. System Strength Assessment and Identification of Synchronous Condenser Locations .................... 12
5. Transmission Option Development .................................................................................................... 15
6. Transmission Option Assessment ....................................................................................................... 17
a. System Strength Evaluation ............................................................................................................ 17
b. Dynamic Assessment ...................................................................................................................... 18
c. Economic Assessment ..................................................................................................................... 23
7. Lubbock Power & Light (LP&L) Integration Sensitivity ....................................................................... 25
8. Future Panhandle WGR Build-out Sensitivity ..................................................................................... 27
9. Recommendations .............................................................................................................................. 28
Appendix A – Transmission Option Schematics .......................................................................................... 30
3
1. Executive Summary
Sharyland has actively monitored the development and financial commitment of generation resources in
the Panhandle region over the past year and, given the significant increase in wind generation resources
since the last ERCOT independent assessment in the region, has prepared a comprehensive Panhandle
region transmission assessment. Based on that assessment, on September 20, 2016, Sharyland
presented nine transmission expansion options with the objective of increasing the Panhandle export
limit. Those options are summarized in this report, and Sharyland recommends Option #3 (South Plains
Transmission Project or “Project”) as the preferred option to address the future needs of the Panhandle
region.
The Project builds on other recent decisions concerning Panhandle transmission capacity. Based on the
2015 recommendation of the ERCOT independent assessment of the Panhandle region, at its September
24, 2015, Open Meeting the Public Utility Commission of Texas (PUCT) recommended the construction
of the second 345 kV circuit on the Alibates – AJ Swope – Windmill – Ogallala – Tule Canyon (AAWOT)
line under the CREZ Order (PURA §39.904(g)) and in the summer of 2016 approved a Certificate of
Convenience and Necessity (CCN) for that project. Additionally, on December 8, 2015, the ERCOT Board
of Directors approved the addition of two synchronous condensers, one each at Sharyland’s 345 kV
Alibates and Tule Canyon stations. The tender for the synchronous condenser has been awarded and the
condensers, along with the construction of the AAWOT line, are on schedule to be completed by June of
2018. The estimated Panhandle export transfer capability with these project additions is 4,013 MW.1
ERCOT’s recommendations for the addition of the second circuit and the synchronous condensers were
economically justified per the ERCOT economic planning criteria.2 These recommendations were based
on ERCOT’s independent assessment of the Panhandle region needs performed in September 2015,
when the Panhandle Wind Generation Resources (WGR) capacity meeting Section 6.9 requirements of
the ERCOT Planning Guide was approximately 4,305 MW. During the course of the last year, there has
been a significant increase in the Panhandle capacity meeting Section 6.9 requirements, with a new total
of WGR capacity of approximately 5,269 MW.
This Sharyland assessment of the Panhandle region spans system strength, power flow, dynamic stability,
and production cost based economic assessments. Numerous transmission expansion options were
investigated in the Sharyland studies with the objective of expanding the Panhandle export limit to
accommodate the increases in generation capacity. At the August and September, 2016 ERCOT RPG
meetings, Sharyland presented updates of the wind generation interconnection activity in the region,
along with a study scope to review the addition of additional shunt reactive devices and new
transmission paths to increase the Panhandle export transfer capability. Comments on the scope of
work and transmission options were incorporated in the study plan.
1 See ERCOT’s Panhandle Export Update at the September 20, 2016 RPG Meeting:
http://www.ercot.com/content/wcm/key_documents_lists/77742/Panhandle_Interface_Limit-Update_RPG_09202016.pptx 2 See ERCOT Protocols Section 3.11.2
4
Sharyland recommends the South Plains Transmission Project as the preferred option to address the
future needs of the Panhandle region. The Project includes the following three transmission additions:
New 67.5 mile 345 kV (double circuit capable) Abernathy – Grassland single circuit line
New 53.2 mile 345 kV (double circuit capable) Ogallala – Abernathy single circuit line
One (1) 175 MVA synchronous condenser at Windmill (minimum short circuit contribution of
1606 A at the condenser terminals)
The South Plains Transmission Project provides the highest Panhandle export capability amongst all the
options evaluated by Sharyland when taking both system strength and dynamic performance into
account. Of note, this option meets the ERCOT economic planning criteria with or without the Lubbock
Power & Light (LP&L) system integrated into ERCOT.3 This project provides a new export path out of the
Panhandle while striking an optimal balance between the system strength and dynamic performance of
the region.
All the transmission additions comprising the South Plains Transmission Project align closely with the
Stage 2 upgrades recommended for the Panhandle region by ERCOT in their April 2014 Panhandle
Renewable Energy Zone (PREZ) study report4 as well as ERCOT’s recommended Option #4ow to
integrate LP&L.
The capital cost estimate for the South Plains Transmission Project is estimated to be $251 Million.
Assuming ERCOT endorsement by Q2, 2017, Sharyland estimates the project to be in service by the end
of 2020. With the addition of the Project, the estimated Panhandle export transfer capability increases
from 4,013 MW to 4,833 MW, and the South Plains Transmission Project satisfies the ERCOT economic
planning criteria with annual production cost savings exceeding 15% of the capital cost of the Project.
3 Details on the PUCT docket 45633 “Project to identify issues pertaining to LP&L proposal to become part of
ERCOT” are posted at: [http://interchange.puc.texas.gov/WebApp/Interchange/application/dbapps/filings/pgControl.asp?TXT_UTILITY_TYPE=A&TXT_CNTRL_NO=45633&TXT_ITEM_MATCH=1&TXT_ITEM_NO=&TXT_N_UTILITY=&TXT_N_FILE_PARTY=&TXT_DOC_TYPE=ALL&TXT_D_FROM=&TXT_D_TO=&TXT_NEW=trueAdd a link to the PUCT docket on the LP&L integration] 4 See the Panhandle Renewable Energy Zone Study Report
http://www.ercot.com/content/news/presentations/2014/Panhandle%20Renewable%20Energy%20Zone%20Study%20Report.pdf
5
2. Introduction/Background
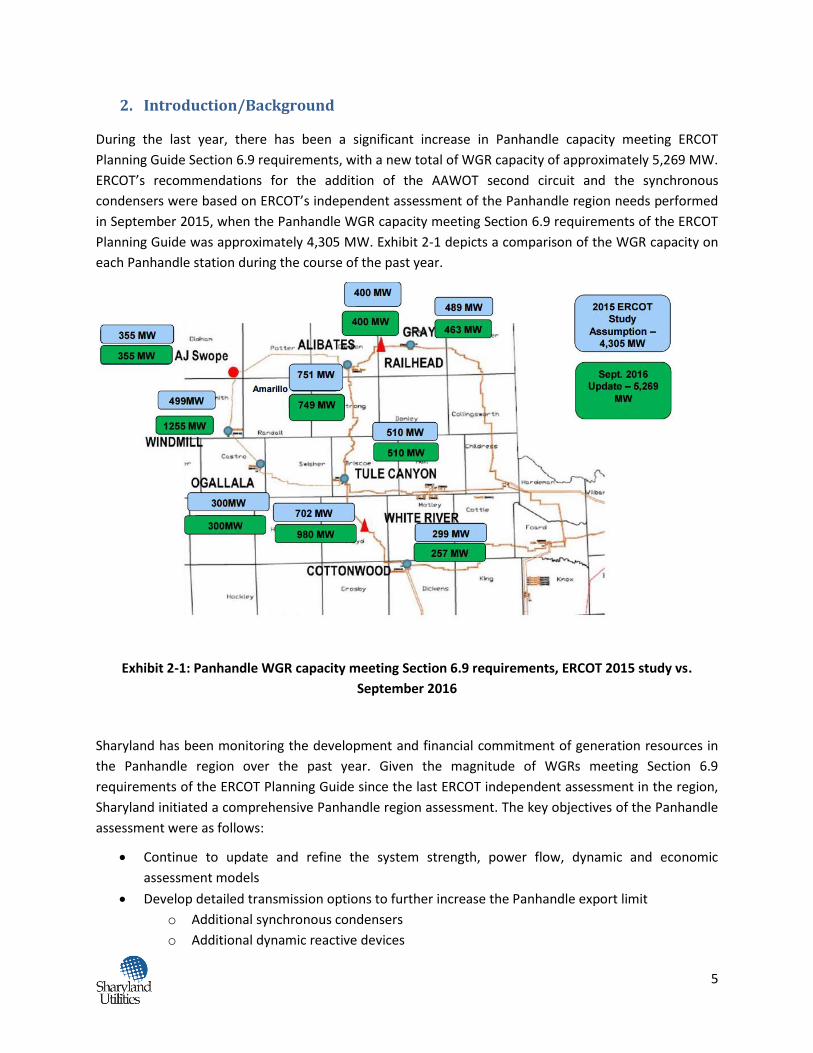
During the last year, there has been a significant increase in Panhandle capacity meeting ERCOT
Planning Guide Section 6.9 requirements, with a new total of WGR capacity of approximately 5,269 MW.
ERCOT’s recommendations for the addition of the AAWOT second circuit and the synchronous
condensers were based on ERCOT’s independent assessment of the Panhandle region needs performed
in September 2015, when the Panhandle WGR capacity meeting Section 6.9 requirements of the ERCOT
Planning Guide was approximately 4,305 MW. Exhibit 2-1 depicts a comparison of the WGR capacity on
each Panhandle station during the course of the past year.
Exhibit 2-1: Panhandle WGR capacity meeting Section 6.9 requirements, ERCOT 2015 study vs.
September 2016
Sharyland has been monitoring the development and financial commitment of generation resources in
the Panhandle region over the past year. Given the magnitude of WGRs meeting Section 6.9
requirements of the ERCOT Planning Guide since the last ERCOT independent assessment in the region,
Sharyland initiated a comprehensive Panhandle region assessment. The key objectives of the Panhandle
assessment were as follows:
Continue to update and refine the system strength, power flow, dynamic and economic
assessment models
Develop detailed transmission options to further increase the Panhandle export limit
o Additional synchronous condensers
o Additional dynamic reactive devices
6
o Other shunt reactive devices
o New transmission paths out of the panhandle
Perform system strength and voltage stability assessment to identify Panhandle export limits
associated with each option
Perform economic evaluations to evaluate economically justifiable options
o Evaluate sensitivity around LP&L integration for preferred options
o Evaluate performance of preferred options with additional WGR capacity in the
Panhandle (above those meeting Section 6.9 requirements)
This report provides a detailed discussion around the study/modeling assumptions, model
benchmarking, system strength/dynamic/economic assessments and key observations.
7
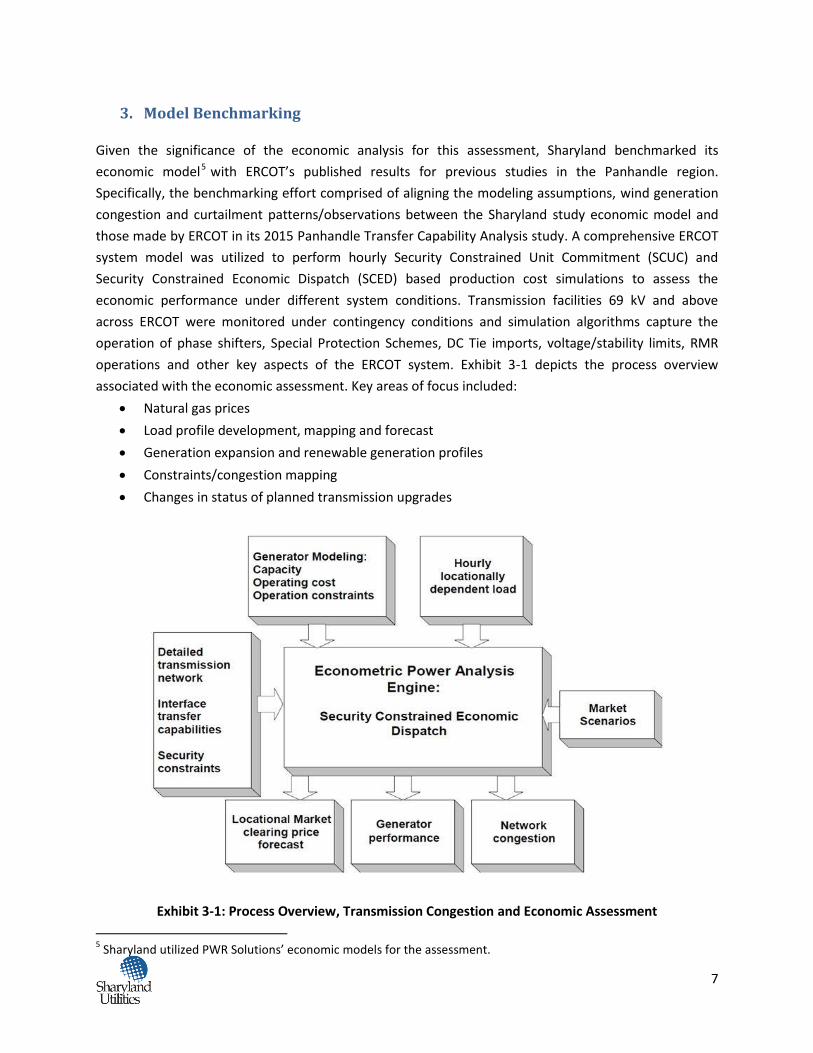
3. Model Benchmarking
Given the significance of the economic analysis for this assessment, Sharyland benchmarked its
economic model5 with ERCOT’s published results for previous studies in the Panhandle region.
Specifically, the benchmarking effort comprised of aligning the modeling assumptions, wind generation
congestion and curtailment patterns/observations between the Sharyland study economic model and
those made by ERCOT in its 2015 Panhandle Transfer Capability Analysis study. A comprehensive ERCOT
system model was utilized to perform hourly Security Constrained Unit Commitment (SCUC) and
Security Constrained Economic Dispatch (SCED) based production cost simulations to assess the
economic performance under different system conditions. Transmission facilities 69 kV and above
across ERCOT were monitored under contingency conditions and simulation algorithms capture the
operation of phase shifters, Special Protection Schemes, DC Tie imports, voltage/stability limits, RMR
operations and other key aspects of the ERCOT system. Exhibit 3-1 depicts the process overview
associated with the economic assessment. Key areas of focus included:
Natural gas prices
Load profile development, mapping and forecast
Generation expansion and renewable generation profiles
Constraints/congestion mapping
Changes in status of planned transmission upgrades
Exhibit 3-1: Process Overview, Transmission Congestion and Economic Assessment
5 Sharyland utilized PWR Solutions’ economic models for the assessment.
8
a. Generation Expansion Assumptions
All generation resources meeting Section 6.9 requirements of the ERCOT Planning Guide at the time of
the ERCOT 2015 independent assessment were included and appropriately modeled for the benchmark.
Specific focus was placed upon the wind generation levels in the Panhandle region and to align the same
with those documented in the ERCOT 2015 study. Exhibit 3-2 depicts the total Wind Generation
Resource (WGR) capacity (MW) in the Panhandle in the Sharyland benchmark model, which aligns
closely with the ERCOT assumptions for the 2015 study. A combination of Net Capacity Factors (NCF) for
the Panhandle region WGRs and the ERCOT utilized AWS True Wind profiles were utilized to derive the
hourly profiles for individual WGRs in the Panhandle.
Station Modeled MW
AJ Swope 355
Alibates 751
Cottonwood 299
Gray 289
Ogallala 0
Railhead 400
Tule Canyon 510
White River 500
Windmill 500
Grand Total 3,604
Exhibit 3-2 Panhandle Wind installed capacity (MW) by station – 2015 study
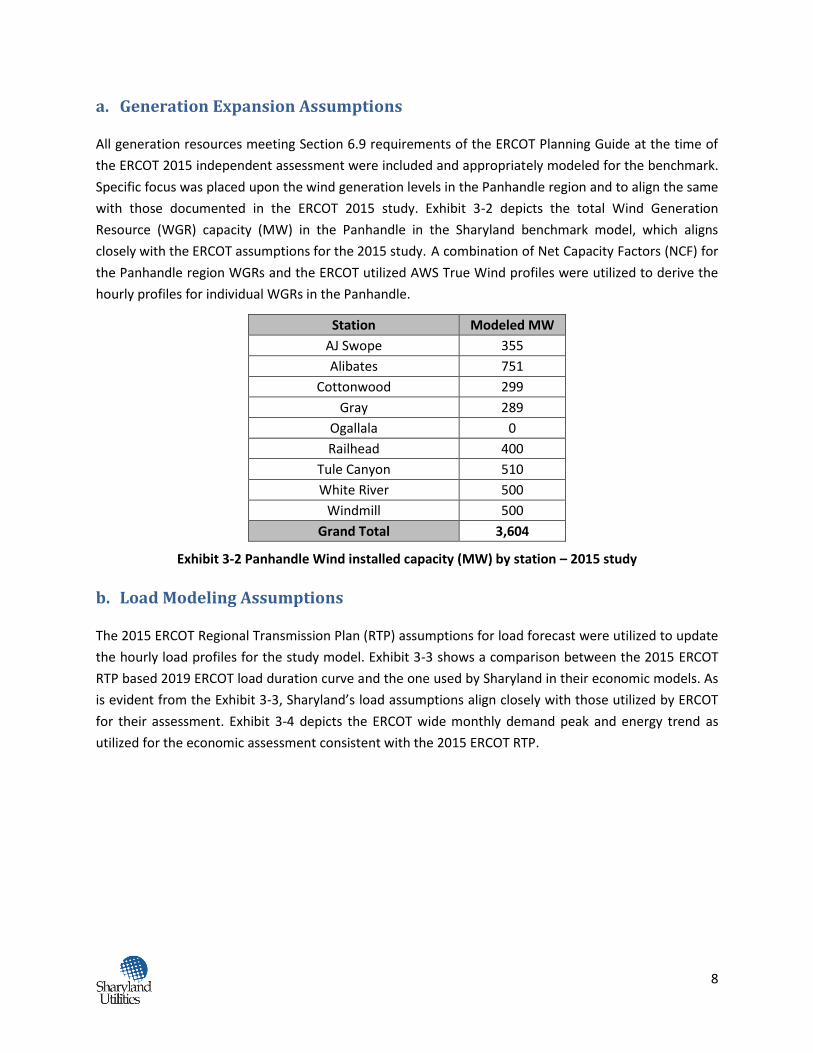
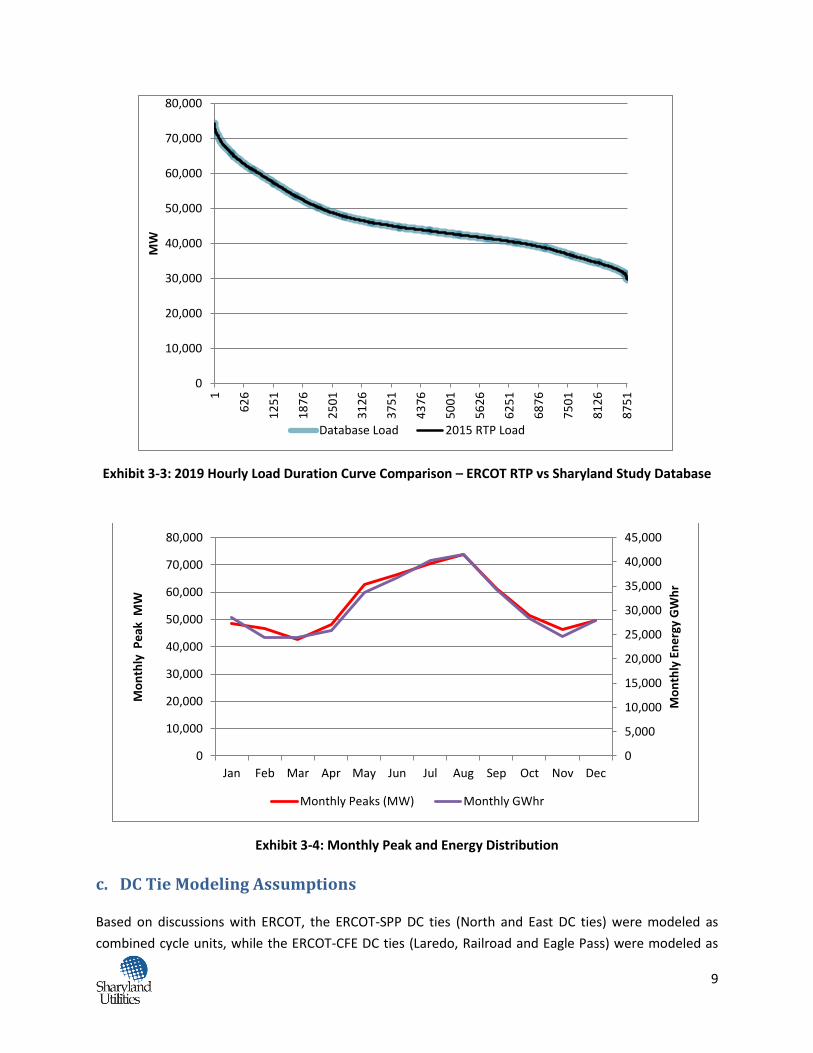
b. Load Modeling Assumptions
The 2015 ERCOT Regional Transmission Plan (RTP) assumptions for load forecast were utilized to update
the hourly load profiles for the study model. Exhibit 3-3 shows a comparison between the 2015 ERCOT
RTP based 2019 ERCOT load duration curve and the one used by Sharyland in their economic models. As
is evident from the Exhibit 3-3, Sharyland’s load assumptions align closely with those utilized by ERCOT
for their assessment. Exhibit 3-4 depicts the ERCOT wide monthly demand peak and energy trend as
utilized for the economic assessment consistent with the 2015 ERCOT RTP.
9
Exhibit 3-3: 2019 Hourly Load Duration Curve Comparison – ERCOT RTP vs Sharyland Study Database
Exhibit 3-4: Monthly Peak and Energy Distribution
c. DC Tie Modeling Assumptions
Based on discussions with ERCOT, the ERCOT-SPP DC ties (North and East DC ties) were modeled as
combined cycle units, while the ERCOT-CFE DC ties (Laredo, Railroad and Eagle Pass) were modeled as
0
10,000
20,000
30,000
40,000
50,000
60,000
70,000
80,000
1
62
6
12
51
18
76
25
01
31
26
37
51
43
76
50
01
56
26
62
51
68
76
75
01
81
26
87
51
MW
Database Load 2015 RTP Load
0
5,000
10,000
15,000
20,000
25,000
30,000
35,000
40,000
45,000
0
10,000
20,000
30,000
40,000
50,000
60,000
70,000
80,000
Jan Feb Mar Apr May Jun Jul Aug Sep Oct Nov Dec
Mo
nth
ly E
ne
rgy
GW
hr
Mo
nth
ly P
eak
MW
Monthly Peaks (MW) Monthly GWhr
10
loads given that the CFE DC ties are mostly exporting power from ERCOT. ERCOT load data was utilized
to obtain the duration curves associated with the loads representing the CFE DC ties.
d. Natural Gas Prices
In line with ERCOT assumptions, Sharyland utilized the latest available natural gas prices’ forecast from
the EIA Annual Energy Outlook (AEO). The annual natural gas price forecast for 2019 was obtained and
the NYMEX forward monthly prices were utilized to derive a shape for the monthly gas prices.
e. Transmission Additions
Transmission additions and planned transmission improvements were applied to the model based on
the ERCOT Transmission Project and Information Tracking (TPIT) report from February 2016. Approved
transmission additions and/or upgrades with expected in service dates prior to the study year were
included in the economic model. Exhibit 3-5 provides a list of major transmission projects added to the
economic model.
Key Transmission Projects In-Service Year
New Lobo – North Edinburg 345 kV line (Valley Import) 2016
New North Edinburg – Palmito 345 kV line (Cross Valley) 2016
New Jones Creek 345 kV station with two 345/138 kV transformers 2017
Hill Country to Skyline - 345 kV 2nd Circuit 2016
Upgrade McDonald Road – Garden City 138/69 kV line 2018
345kV Houston Import Project 2018
Add second 345 kV circuit in the Panhandle loop 2018
Add synchronous condenser in the Panhandle loop 2018
Add Zorn – Marion 345 kV transmission line 2019
Exhibit 3-5: Key Transmission additions
f. Economic Model Benchmarking Results
In order to accurately benchmark its economic model, Sharyland evaluated the same scenarios studied
by ERCOT in its 2015 independent assessment namely:
Scenario 0 – No Panhandle transmission upgrades
Scenario 1 – Only two (2) 150 MVA, 1050 Amp SCs at Alibates and Tule Canyon
11
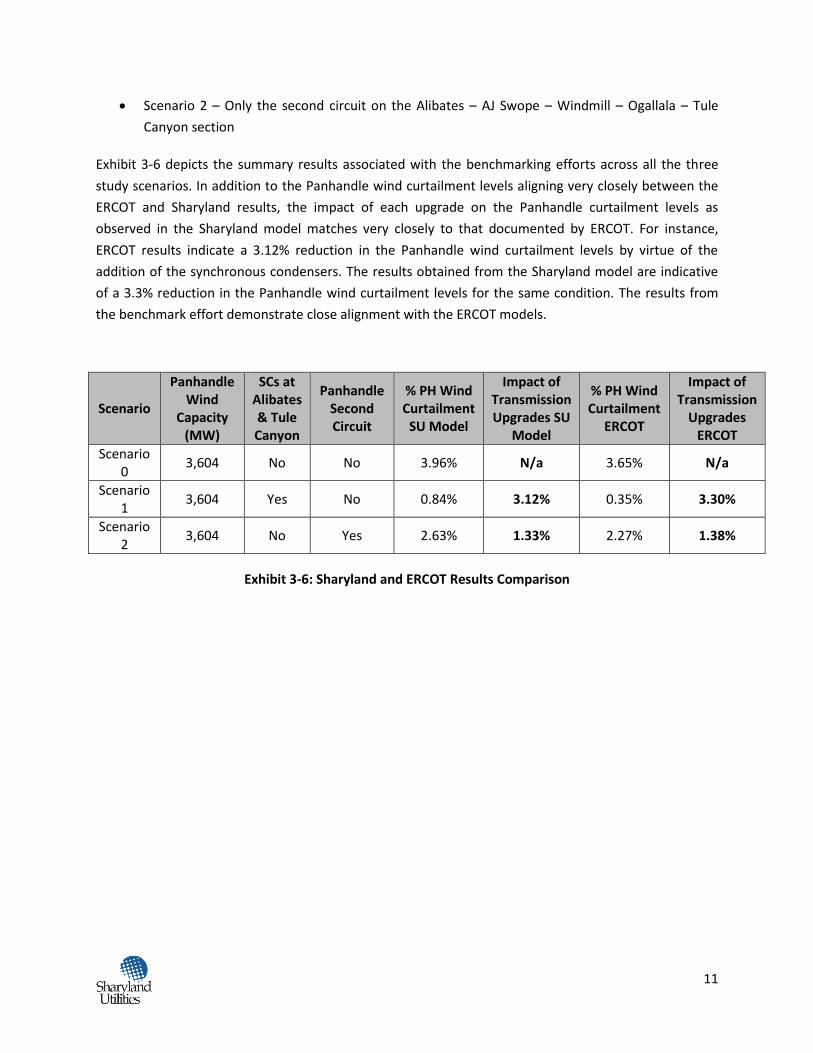
Scenario 2 – Only the second circuit on the Alibates – AJ Swope – Windmill – Ogallala – Tule
Canyon section
Exhibit 3-6 depicts the summary results associated with the benchmarking efforts across all the three
study scenarios. In addition to the Panhandle wind curtailment levels aligning very closely between the
ERCOT and Sharyland results, the impact of each upgrade on the Panhandle curtailment levels as
observed in the Sharyland model matches very closely to that documented by ERCOT. For instance,
ERCOT results indicate a 3.12% reduction in the Panhandle wind curtailment levels by virtue of the
addition of the synchronous condensers. The results obtained from the Sharyland model are indicative
of a 3.3% reduction in the Panhandle wind curtailment levels for the same condition. The results from
the benchmark effort demonstrate close alignment with the ERCOT models.
Scenario
Panhandle Wind
Capacity (MW)
SCs at Alibates & Tule Canyon
Panhandle Second Circuit
% PH Wind Curtailment
SU Model
Impact of Transmission Upgrades SU
Model
% PH Wind Curtailment
ERCOT
Impact of Transmission
Upgrades ERCOT
Scenario 0
3,604 No No 3.96% N/a 3.65% N/a
Scenario 1
3,604 Yes No 0.84% 3.12% 0.35% 3.30%
Scenario 2
3,604 No Yes 2.63% 1.33% 2.27% 1.38%
Exhibit 3-6: Sharyland and ERCOT Results Comparison
12
4. System Strength Assessment and Identification of Synchronous Condenser
Locations
Panhandle system strength is estimated using a Weighted Short-Circuit Ratio (WSCR) metric6. ERCOT
currently limits the Panhandle WGR dispatch such that the WSCR metric is above its target value of 1.5.
Based on prior studies conducted by ERCOT and Sharyland, synchronous condensers are effective in
increasing the value of WSCR and consequently the Panhandle export limit. ERCOT has endorsed the
installation of two (2) synchronous condensers at Sharyland’s Alibates and Tule Canyon stations. Further
increase in system strength and Panhandle export limit may be achieved by installation of additional
synchronous condensers. To that effect, Sharyland conducted a system strength assessment to identify
the number and the optimal locations for any future synchronous condensers that may be installed on
the Panhandle system.
Key aspects involved in development of short-circuit model for the WSCR based system strength
assessment are summarized below:
ERCOT system is modeled on the basis of the System Protection Working Group (SPWG) Future
Year (FY) 2020 case
o 2nd 345 kV circuit along the Alibates – AJ Swope – Windmill – Ogallala – Tule Canyon
section is modeled in the SPWG case
o One (1) 175MVA synchronous condenser each is added at the Alibates and Tule Canyon
stations
o Each synchronous condenser is modeled to provide a fault current of 1606A at the
condenser terminals for a bolted 3-phase fault at its terminals
Gas generation units in West Texas are kept offline (including the Antelope/Elk generation units
at the 345kV Abernathy station)
Further, the latest Generation Interconnection Status (GIS) report (July 2016) available at the time of
performing this study is utilized to identify all WGRs in the Panhandle that are currently meeting Section
6.9 requirements of the ERCOT Planning Guide. A total of 5,269MW of Panhandle WGR capacity is
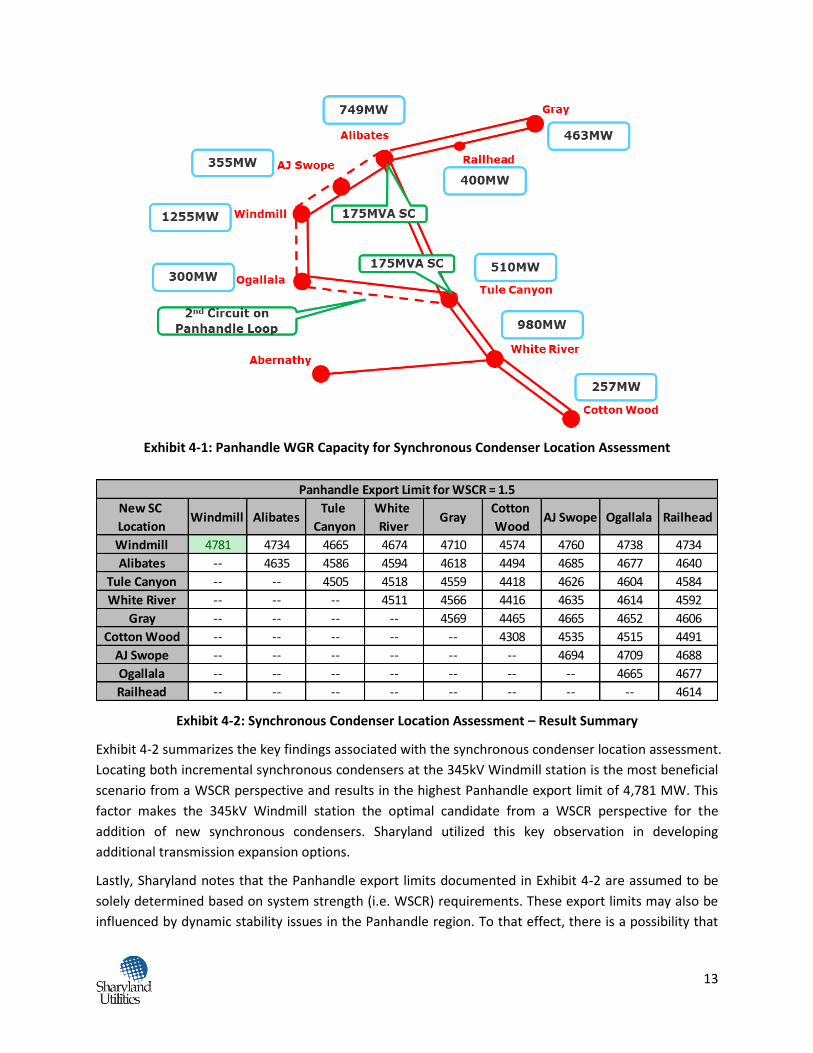
utilized for WSCR computation. Exhibit 4-1 depicts the WGR capacity that is utilized for WSCR
computation at each identified 345kV station.
In order to determine optimal locations for synchronous condensers, two (2) additional 175MVAR units
are incrementally added to the short-circuit case. Multiple scenarios are evaluated around all possible
combinations of 345kV stations in the Panhandle transmission system that can be selected for locating
the additional synchronous condensers. For each scenario, the Panhandle export limit that is required to
achieve the minimum WSCR value of 1.5 is computed.
6 ERCOT Panhandle Transfer Capability Analysis, September 8, 2015
(http://interchange.puc.state.tx.us/WebApp/Interchange/Documents/42647_58_865838.PDF)
13
Exhibit 4-1: Panhandle WGR Capacity for Synchronous Condenser Location Assessment
Exhibit 4-2: Synchronous Condenser Location Assessment – Result Summary
Exhibit 4-2 summarizes the key findings associated with the synchronous condenser location assessment.
Locating both incremental synchronous condensers at the 345kV Windmill station is the most beneficial
scenario from a WSCR perspective and results in the highest Panhandle export limit of 4,781 MW. This
factor makes the 345kV Windmill station the optimal candidate from a WSCR perspective for the
addition of new synchronous condensers. Sharyland utilized this key observation in developing
additional transmission expansion options.
Lastly, Sharyland notes that the Panhandle export limits documented in Exhibit 4-2 are assumed to be
solely determined based on system strength (i.e. WSCR) requirements. These export limits may also be
influenced by dynamic stability issues in the Panhandle region. To that effect, there is a possibility that
New SC
LocationWindmill Alibates
Tule
Canyon
White
RiverGray
Cotton
WoodAJ Swope Ogallala Railhead
Windmill 4781 4734 4665 4674 4710 4574 4760 4738 4734
Alibates -- 4635 4586 4594 4618 4494 4685 4677 4640
Tule Canyon -- -- 4505 4518 4559 4418 4626 4604 4584
White River -- -- -- 4511 4566 4416 4635 4614 4592
Gray -- -- -- -- 4569 4465 4665 4652 4606
Cotton Wood -- -- -- -- -- 4308 4535 4515 4491
AJ Swope -- -- -- -- -- -- 4694 4709 4688
Ogallala -- -- -- -- -- -- -- 4665 4677
Railhead -- -- -- -- -- -- -- -- 4614
Panhandle Export Limit for WSCR = 1.5

14
the actual Panhandle export limits are lower than the system strength based limits depicted in Exhibit 4-
2.
15
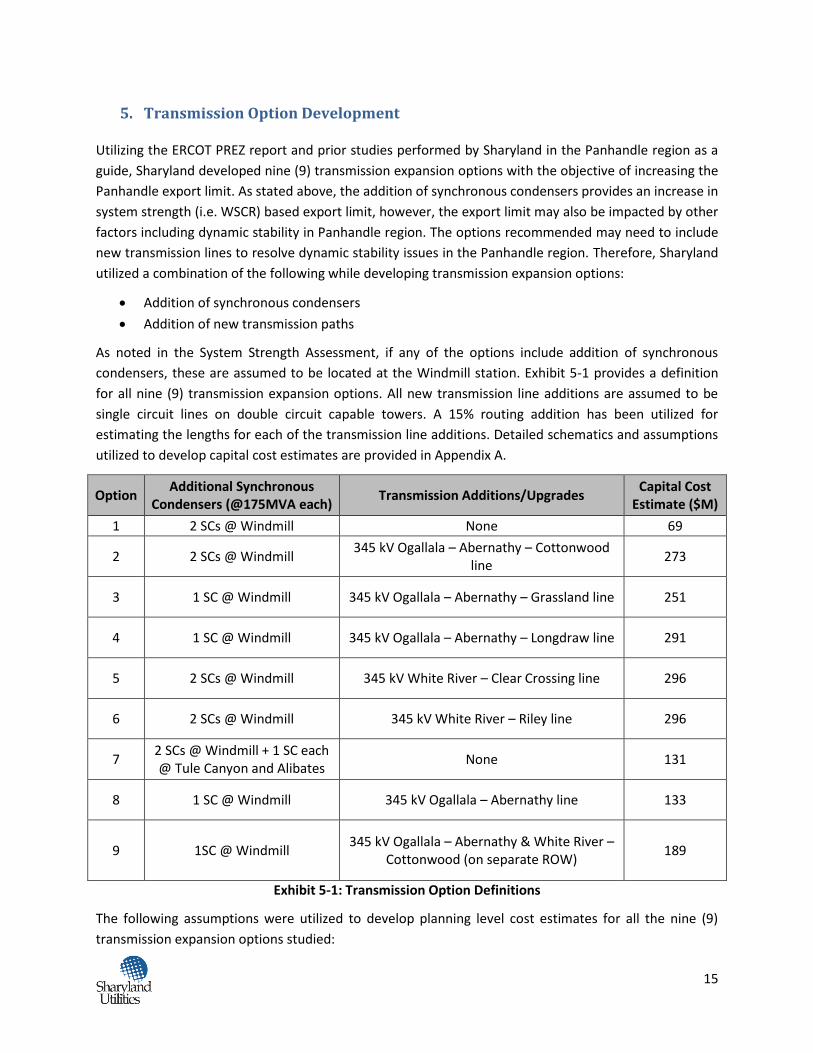
5. Transmission Option Development
Utilizing the ERCOT PREZ report and prior studies performed by Sharyland in the Panhandle region as a
guide, Sharyland developed nine (9) transmission expansion options with the objective of increasing the
Panhandle export limit. As stated above, the addition of synchronous condensers provides an increase in
system strength (i.e. WSCR) based export limit, however, the export limit may also be impacted by other
factors including dynamic stability in Panhandle region. The options recommended may need to include
new transmission lines to resolve dynamic stability issues in the Panhandle region. Therefore, Sharyland
utilized a combination of the following while developing transmission expansion options:
Addition of synchronous condensers
Addition of new transmission paths
As noted in the System Strength Assessment, if any of the options include addition of synchronous
condensers, these are assumed to be located at the Windmill station. Exhibit 5-1 provides a definition
for all nine (9) transmission expansion options. All new transmission line additions are assumed to be
single circuit lines on double circuit capable towers. A 15% routing addition has been utilized for
estimating the lengths for each of the transmission line additions. Detailed schematics and assumptions
utilized to develop capital cost estimates are provided in Appendix A.
Option Additional Synchronous
Condensers (@175MVA each) Transmission Additions/Upgrades
Capital Cost Estimate ($M)
1 2 SCs @ Windmill None 69
2 2 SCs @ Windmill 345 kV Ogallala – Abernathy – Cottonwood
line 273
3 1 SC @ Windmill 345 kV Ogallala – Abernathy – Grassland line 251
4 1 SC @ Windmill 345 kV Ogallala – Abernathy – Longdraw line 291
5 2 SCs @ Windmill 345 kV White River – Clear Crossing line 296
6 2 SCs @ Windmill 345 kV White River – Riley line 296
7 2 SCs @ Windmill + 1 SC each @ Tule Canyon and Alibates
None 131
8 1 SC @ Windmill 345 kV Ogallala – Abernathy line 133
9 1SC @ Windmill 345 kV Ogallala – Abernathy & White River –
Cottonwood (on separate ROW) 189
Exhibit 5-1: Transmission Option Definitions
The following assumptions were utilized to develop planning level cost estimates for all the nine (9)
transmission expansion options studied:
16
The 345 kV single circuit (double circuit capable) line cost estimates are based on Sharyland’s
estimates from recent 345 kV constructions in the Panhandle region.
A transmission line routing factor of 15% has been included to estimate the lengths associated
with the AC transmission line options.
Sharyland utilized the cost estimates derived from the recent tender process for the future
synchronous condensers.
The cost of station expansions has been accounted for based on estimates submitted for the
LP&L integration study.
17
6. Transmission Option Assessment
Sharyland comprehensively evaluated all nine (9) transmission expansion options identified above.
These evaluations encompassed system strength, power flow, dynamics and economic assessments.
System strength (i.e. WSCR) based Panhandle export limits are computed for each option. These are
compared with limits observed in dynamic evaluations. Finally, an economic assessment is conducted
using the most restrictive Panhandle export limit for each option. Details associated with each
evaluation are provided below.
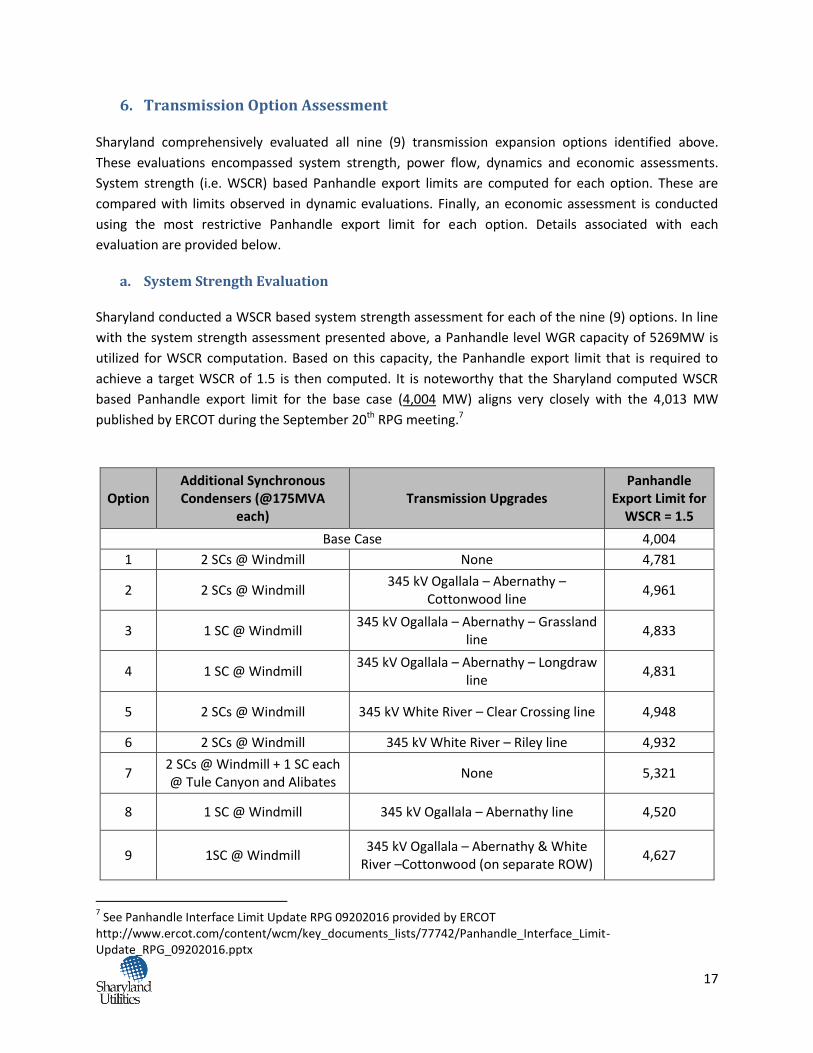
a. System Strength Evaluation
Sharyland conducted a WSCR based system strength assessment for each of the nine (9) options. In line
with the system strength assessment presented above, a Panhandle level WGR capacity of 5269MW is
utilized for WSCR computation. Based on this capacity, the Panhandle export limit that is required to
achieve a target WSCR of 1.5 is then computed. It is noteworthy that the Sharyland computed WSCR
based Panhandle export limit for the base case (4,004 MW) aligns very closely with the 4,013 MW
published by ERCOT during the September 20th RPG meeting.7
Option Additional Synchronous Condensers (@175MVA
each) Transmission Upgrades
Panhandle Export Limit for
WSCR = 1.5
Base Case 4,004
1 2 SCs @ Windmill None 4,781
2 2 SCs @ Windmill 345 kV Ogallala – Abernathy –
Cottonwood line 4,961
3 1 SC @ Windmill 345 kV Ogallala – Abernathy – Grassland
line 4,833
4 1 SC @ Windmill 345 kV Ogallala – Abernathy – Longdraw
line 4,831
5 2 SCs @ Windmill 345 kV White River – Clear Crossing line 4,948
6 2 SCs @ Windmill 345 kV White River – Riley line 4,932
7 2 SCs @ Windmill + 1 SC each @ Tule Canyon and Alibates
None 5,321
8 1 SC @ Windmill 345 kV Ogallala – Abernathy line 4,520
9 1SC @ Windmill 345 kV Ogallala – Abernathy & White
River –Cottonwood (on separate ROW) 4,627
7 See Panhandle Interface Limit Update RPG 09202016 provided by ERCOT
http://www.ercot.com/content/wcm/key_documents_lists/77742/Panhandle_Interface_Limit-Update_RPG_09202016.pptx
18
Exhibit 6-1: Transmission Option Evaluation – System Strength (WSCR) Based Panhandle Export Limits
Key findings of the system strength evaluation are depicted in Exhibit 6-1, which are indicative of the
following:
Option#7 provides the highest Panhandle export limit of 5,321 MW from a system strength
perspective. This option involves addition of four (4) synchronous condensers on the Panhandle
transmission system. This option does not include addition of any new transmission lines. The
synchronous condensers by themselves are observed to be effective in increasing the fault-
current levels in the Panhandle region with corresponding improvement in WSCR and export
limit. That being said, the Panhandle export limit for this option is expected to be limited by the
results of the dynamic assessment due to the absence of a new export path out of the
Panhandle.
All options that include a new transmission path out of the Panhandle also perform well from a
WSCR and export limit standpoint (Option#2 - #6). As expected, options that have a single
175MVA synchronous condenser have relatively lower export limits (e.g. Options #3 and #4).
However, they offer significant improvement in the export limit compared to the base case.
Lastly, Options #8 and #9 offer relatively low increase in the Panhandle export limit. Option #8
does not include a new transmission path out of the Panhandle export limit interface and
therefore increase in export limit can be predominantly attributed to the addition of one (1)
synchronous condenser at Windmill.
b. Dynamic Assessment
Sharyland also performed transient stability assessment to evaluate the performance of above
mentioned nine (9) options from transient voltage and angle stability standpoint.
The ERCOT Dynamics Working Group (DWG) Future Year (FY) 2018 High Wind Light Load (HWLL)
dynamic dataset was utilized as the starting dataset for the transient stability assessment. The following
incremental changes and/or additions were made to arrive at the base study dataset:
All WGRs meeting Section 6.9 requirements of the ERCOT planning guide in the Panhandle
region (according to July 2016 ERCOT ROS report) not already included in the ERCOT posted
dataset were incrementally modeled hence increasing the total panhandle wind capacity
modeled in the study dataset to 5,269 MW.
ERCOT gas units were scaled down to maintain the load and generation balance.
The latest information associated with the turbines comprising the abovementioned WGRs
available at the time of the study was utilized.
For every transmission option, a corresponding study scenario was developed by incrementally
integrating the transmission option into the base case.
19
Sharyland evaluated the performance of the Panhandle transmission system for all the ten (10) study
datasets (base and study option datasets) for the following dynamic events:
Three phase fault based normal clearing events for all Panhandle and nearby transmission
facilities (P1 and P7 events)
Single Line to Ground (S-L-G) fault based breaker failure events for all Panhandle and nearby
transmission facilities (P4 events)
Prior outage of transmission circuit followed by outage of another unrelated transmission circuit
(P6 events)
Close to 100 dynamic events were utilized to evaluate the performance of study datasets from stability
standpoint.
The following criteria were utilized to define stable transmission system performance for the dynamic
events simulated for the transient stability assessment:
• All the generation units within and in the vicinity of the Panhandle region should be transiently
stable except for units tripped for fault clearing, if any
• Voltage at BES elements within and in the vicinity of the Panhandle region should exhibit
transient stability and acceptable transient voltage recovery
o For P1 category events, voltage shall recover to 0.90 p.u. within five seconds after clearing the fault.
o For P2 to P7 category events, voltage shall recover to 0.90 p.u. within ten seconds after clearing the fault.
• Loss of source should not exceed the ERCOT Responsive Reserve Service (RRS) i.e. 2,300 MW for
any of the events simulated
The following system responses would be considered unacceptable:
• Transiently unstable, with widespread system collapse
• Transiently stable, with un-damped or sustained power system oscillations
• Loss of source exceeding ERCOT RRS levels i.e. 2,300 MW
In addition to the above, specific focus was placed on observing any sustained or poorly damped voltage
oscillations that could be potential manifestations of control/instability issues due to the weak system
conditions in the Panhandle region.
Sharyland performed transient stability analysis by simulating the above discussed dynamic event
categories on the study datasets. The study results were compared to the performance criteria to
identify any unacceptable system response. In case of any unacceptable performance, the Panhandle
wind export was reduced proportionally for all Panhandle generation resources to identify the
Panhandle export limit in which no voltage and/or angle instability is observed. Any local wind
generation limits within the Panhandle arising due to loss of transmission facilities within the Panhandle
were also identified (if applicable for any transmission option).
20
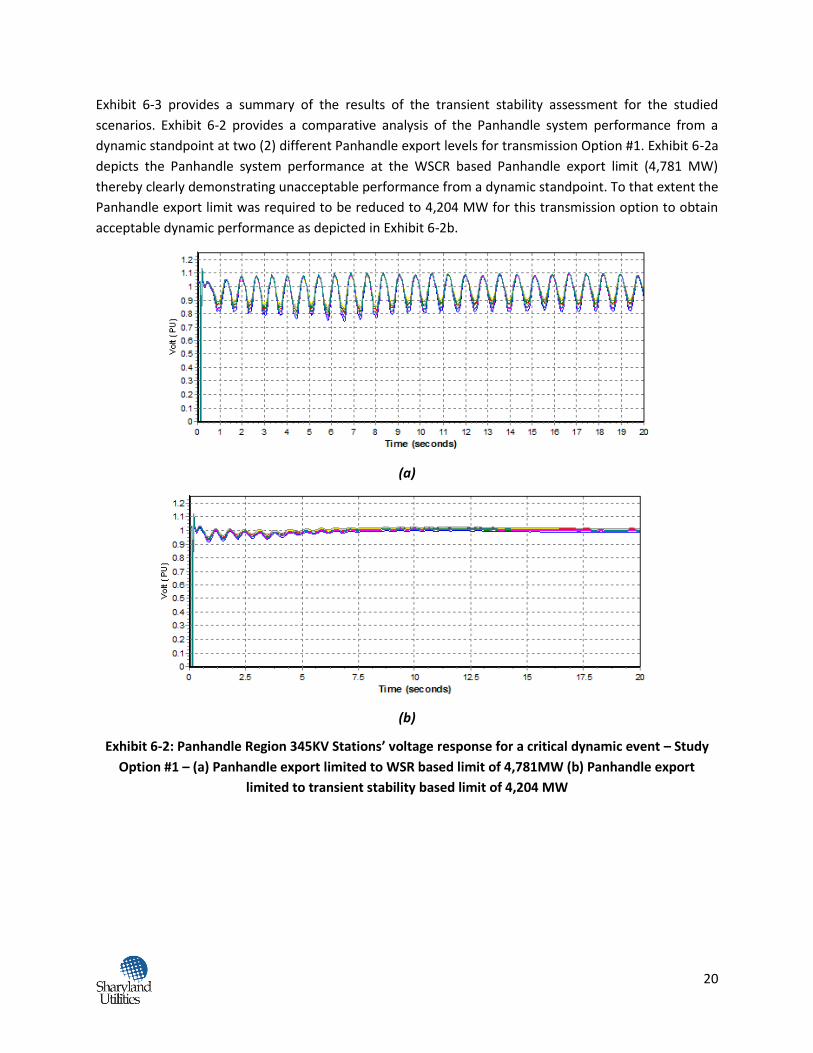
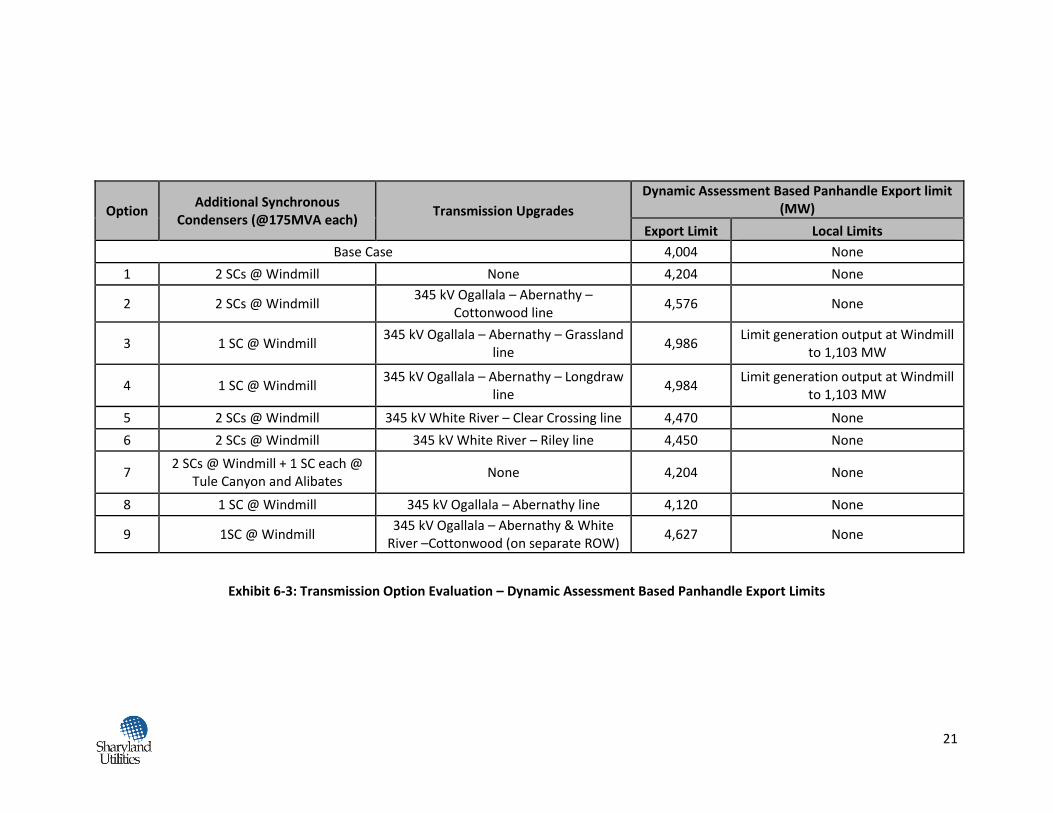
Exhibit 6-3 provides a summary of the results of the transient stability assessment for the studied
scenarios. Exhibit 6-2 provides a comparative analysis of the Panhandle system performance from a
dynamic standpoint at two (2) different Panhandle export levels for transmission Option #1. Exhibit 6-2a
depicts the Panhandle system performance at the WSCR based Panhandle export limit (4,781 MW)
thereby clearly demonstrating unacceptable performance from a dynamic standpoint. To that extent the
Panhandle export limit was required to be reduced to 4,204 MW for this transmission option to obtain
acceptable dynamic performance as depicted in Exhibit 6-2b.
(a)
(b)
Exhibit 6-2: Panhandle Region 345KV Stations’ voltage response for a critical dynamic event – Study
Option #1 – (a) Panhandle export limited to WSR based limit of 4,781MW (b) Panhandle export
limited to transient stability based limit of 4,204 MW
21
Option Additional Synchronous
Condensers (@175MVA each) Transmission Upgrades
Dynamic Assessment Based Panhandle Export limit (MW)
Export Limit Local Limits
Base Case 4,004 None
1 2 SCs @ Windmill None 4,204 None
2 2 SCs @ Windmill 345 kV Ogallala – Abernathy –
Cottonwood line 4,576 None
3 1 SC @ Windmill 345 kV Ogallala – Abernathy – Grassland
line 4,986
Limit generation output at Windmill to 1,103 MW
4 1 SC @ Windmill 345 kV Ogallala – Abernathy – Longdraw
line 4,984
Limit generation output at Windmill to 1,103 MW
5 2 SCs @ Windmill 345 kV White River – Clear Crossing line 4,470 None
6 2 SCs @ Windmill 345 kV White River – Riley line 4,450 None
7 2 SCs @ Windmill + 1 SC each @
Tule Canyon and Alibates None 4,204 None
8 1 SC @ Windmill 345 kV Ogallala – Abernathy line 4,120 None
9 1SC @ Windmill 345 kV Ogallala – Abernathy & White
River –Cottonwood (on separate ROW) 4,627 None
Exhibit 6-3: Transmission Option Evaluation – Dynamic Assessment Based Panhandle Export Limits
22
The results associated with the transient stability assessment when compared with the systems strength
evaluation results are indicative of the following:
The panhandle export limit as obtained by dynamic assessment seem more restrictive than the
WSCR-screening based panhandle export limits especially for transmission options that do not
offer a new export path out of the Panhandle
Angular stability issues are observed in the absence of an additional export path out of
Panhandle at export levels greater than 4,400 MW
Transmission options that include a new export path out of the Panhandle exhibit a better
balance between the WSCR based and the dynamic assessment based Panhandle export limit.
This is clearly evident from the performance of Options #3, #4 and #9
The SC only options (Options #1 and #7) are severely limited in terms of the Panhandle export
capability from a dynamic standpoint
Option #8 does not provide a significant benefit in terms of the Panhandle export capability
since the Ogallala to Abernathy line segment comprising the option does not extend beyond the
Panhandle export interface boundary
While the results of the system strength and dynamic assessment do provide clear indications towards
better performing options (Options #3, #4 and #9) in terms of Panhandle export capability, Sharyland
has evaluated all nine (9) transmission options from an economic perspective.
23
c. Economic Assessment
The future year 2019 economic model benchmarked with the modeling assumptions discussed above
was utilized to evaluate the performance of the nine (9) transmission expansion options. The economic
model was updated to reflect all Panhandle WGRs meeting Section 6.9 requirements of the ERCOT
Planning Guide (5,269 MW). Transmission additions and/or upgrades associated with each transmission
options were implemented in the economic model as appropriate.8 The Panhandle export limit was
implemented by defining the Panhandle interface consistent with ERCOT definitions and as defined
below:
345 kV Tesla – Jim Treece/Riley double circuit
345 kV Tesla – Edith Clarke double circuit
345 kV Cottonwood – Dermott double circuit
345 kV Cottonwood – Edith Clarke double circuit
It is important to note that the Panhandle interface definition and limits were appropriately altered to
reflect the addition of transmission facilities associated with each transmission option. The results of the
system strength and dynamic assessment were utilized to identify the most limiting Panhandle export
condition associated with each transmission option. Additionally, in line with ERCOT’s operations
practice, a 10% operational margin was utilized when implementing the Panhandle export limits for the
purposes of the economic assessment (refer to Exhibit 6-4). Detailed 8,760 hour production cost based
economic simulations were performed to evaluate the performance of each of the nine (9) transmission
options and compare the same to the ERCOT economic performance criteria.
Per ERCOT’s economic planning criteria, if the production cost savings of a transmission project is
greater than the first year annual revenue requirement for a transmission project, calculated at 15% of
the estimated capital cost of the project, then the project is deemed economically justified.
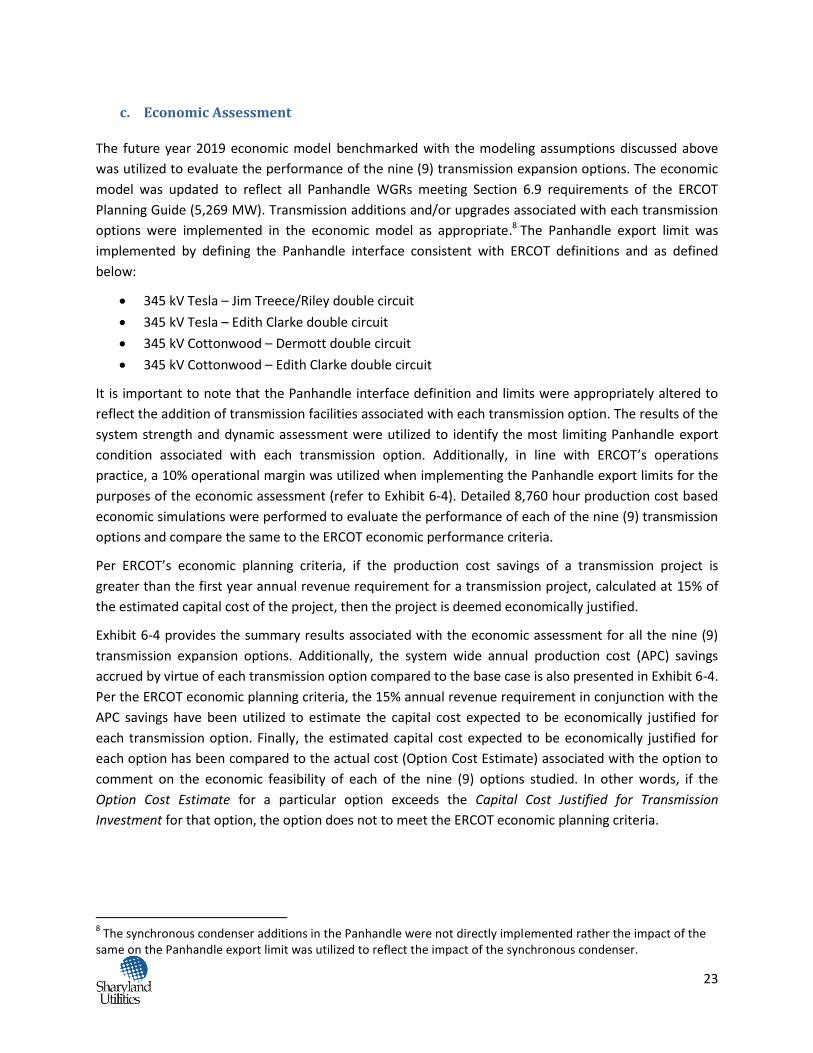
Exhibit 6-4 provides the summary results associated with the economic assessment for all the nine (9)
transmission expansion options. Additionally, the system wide annual production cost (APC) savings
accrued by virtue of each transmission option compared to the base case is also presented in Exhibit 6-4.
Per the ERCOT economic planning criteria, the 15% annual revenue requirement in conjunction with the
APC savings have been utilized to estimate the capital cost expected to be economically justified for
each transmission option. Finally, the estimated capital cost expected to be economically justified for
each option has been compared to the actual cost (Option Cost Estimate) associated with the option to
comment on the economic feasibility of each of the nine (9) options studied. In other words, if the
Option Cost Estimate for a particular option exceeds the Capital Cost Justified for Transmission
Investment for that option, the option does not to meet the ERCOT economic planning criteria.
8 The synchronous condenser additions in the Panhandle were not directly implemented rather the impact of the
same on the Panhandle export limit was utilized to reflect the impact of the synchronous condenser.
24
Scenario ID
Panhandle Interface Limit
# Hours PH
Binding
APC Savings
($M)
Capital Cost justified for
Transmission Investment
($M)
Option Cost
Estimate ($M)
System Strength
Limit
Stability Limit
Operational Limit (90% of
Min of System
Strength and Stability
Limit)
Base Case 4,004 4,004 3,604 2,318 NA NA NA
Option 1 4,781 4,204 3,784 2,038 12.3 82 69
Option 2 4,961 4,576 4,118 1,542 31 206.8 273
Option 3 4,833 4,986 4,350 1,162 40.5 269.9 251
Option 4 4,831 4,984 4,348 1,167 40.5 269.9 291
Option 5 4,948 4,470 4,023 1,681 25.7 171.6 296
Option 6 4,932 4,450 4,005 1,703 25.1 167.1 296
Option 7 5,321 4,204 3,784 2,038 12.3 82 131
Option 8 4,520 4,120 3,708 2,151 7.1 47.4 133
Option 9 4,627 4,627 4,164 1,467 33.2 221.1 189
Exhibit 6-4: Economic Analysis Results
The following key observations can be made from the results of the economic study depicted in Exhibit
6-4:
Options #1, #3 and #9 meet the ERCOT economic planning criteria.
While Options #3 and #4 are very similar in terms of composition and performance, Option #3
meets the ERCOT economic planning criteria while Option #4 doesn’t. This is due to the
additional cost associated with building approximately 30 miles of additional 345 kV line to
Longdraw (Option #4) as opposed to terminating at Grassland (Option #3).
Options #7 and #8 suffer in terms of economic performance due to limited Panhandle export
capability stemming from the lack of an export path out of the Panhandle.
Option #1 is economically justifiable despite limited improvements in Panhandle export
capability due to the relatively lower cost of the SC only option. That said, the overall results of
the study are indicative of one synchronous condenser coupled with an additional export path
out of the Panhandle as an optimal and cost effective solution to the Panhandle export
limitations.

25
7. Lubbock Power & Light (LP&L) Integration Sensitivity
The economic analysis showed that Options #1, #3 and #9 meet the ERCOT economic planning criteria
based on their APC savings compared to the capital cost associated with the options. Sharyland
conducted a sensitivity analysis to evaluate the performance of these options with the Lubbock Power &
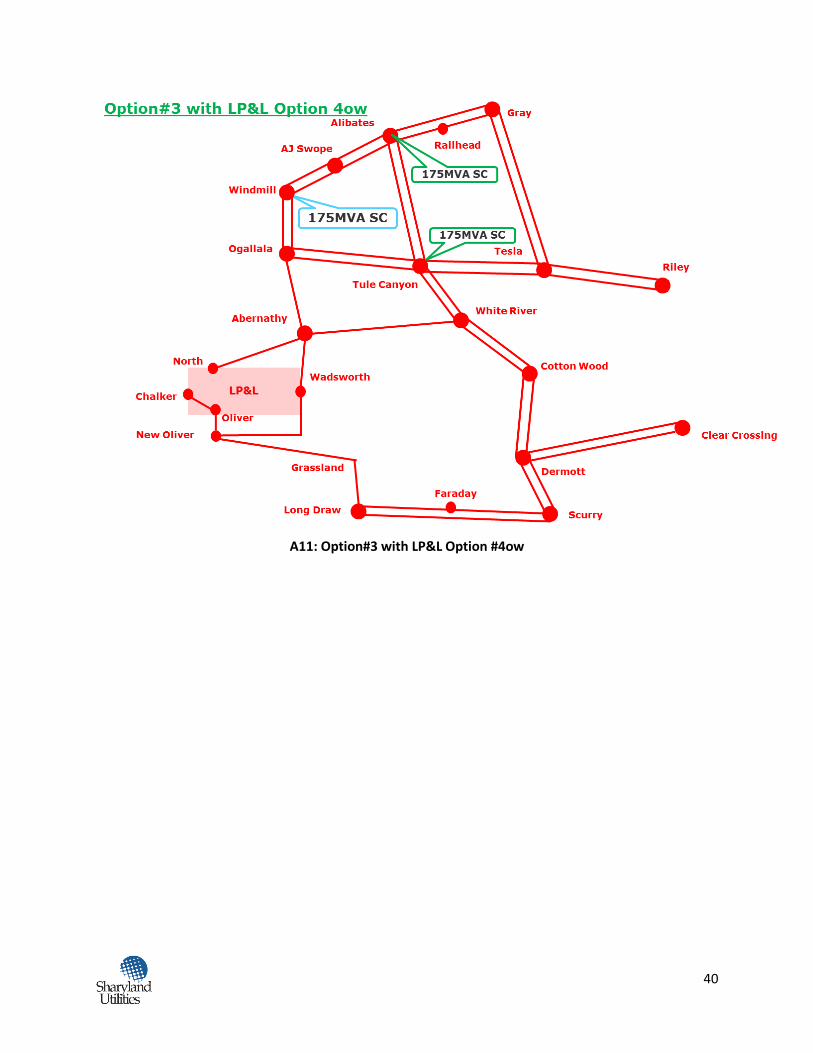
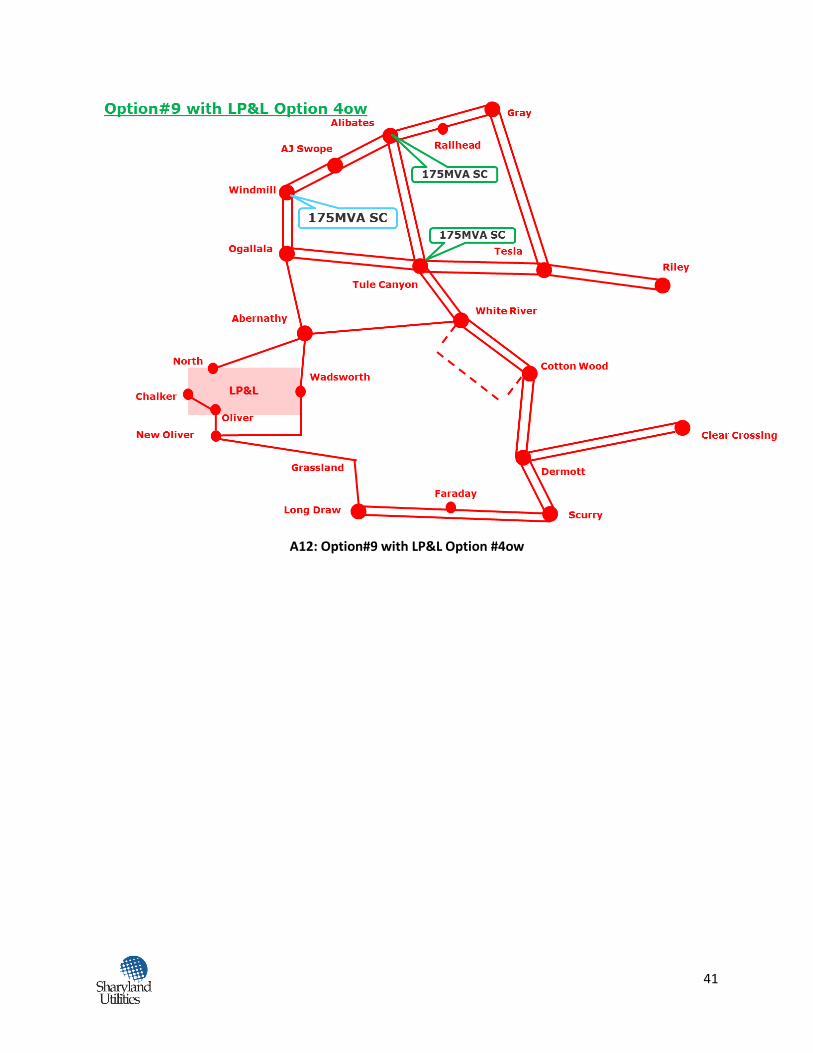
Light (LP&L) system integrated into ERCOT. Sharyland utilized the ERCOT recommended Option #4ow to
integrate the LP&L system into the ERCOT grid9. This option is depicted in Exhibit 7-1.
Exhibit 7-1: LP&L Integration via Option#4ow
It is important to note that Option #4ow,utilized for LP&L integration, already includes similar 345kV
transmission lines that are a part of Option #3 except for the 345 kV Abernathy – North section. To that
effect, implementation of Option #3 after LP&L has been integrated into ERCOT essentially amounts to
addition of a single 175MVA synchronous condenser at the Windmill station. Options #1 and #3 will be
similar post LP&L integration. The only difference between these two options is that Option#1 will
9 Study of the Integration of the Lubbock Power & Light System into the ERCOT System, June 09, 2016
(http://www.ercot.com/content/wcm/key_documents_lists/76336/13_ERCOT_Lubbock_Load_Integrati
on_Study.pdf)
26
include two (2) 175MVA synchronous condensers at Windmill. Detailed schematics for Options #1, #3
and #9 in presence of LP&L integration via Option #4ow are provided in Appendix B.
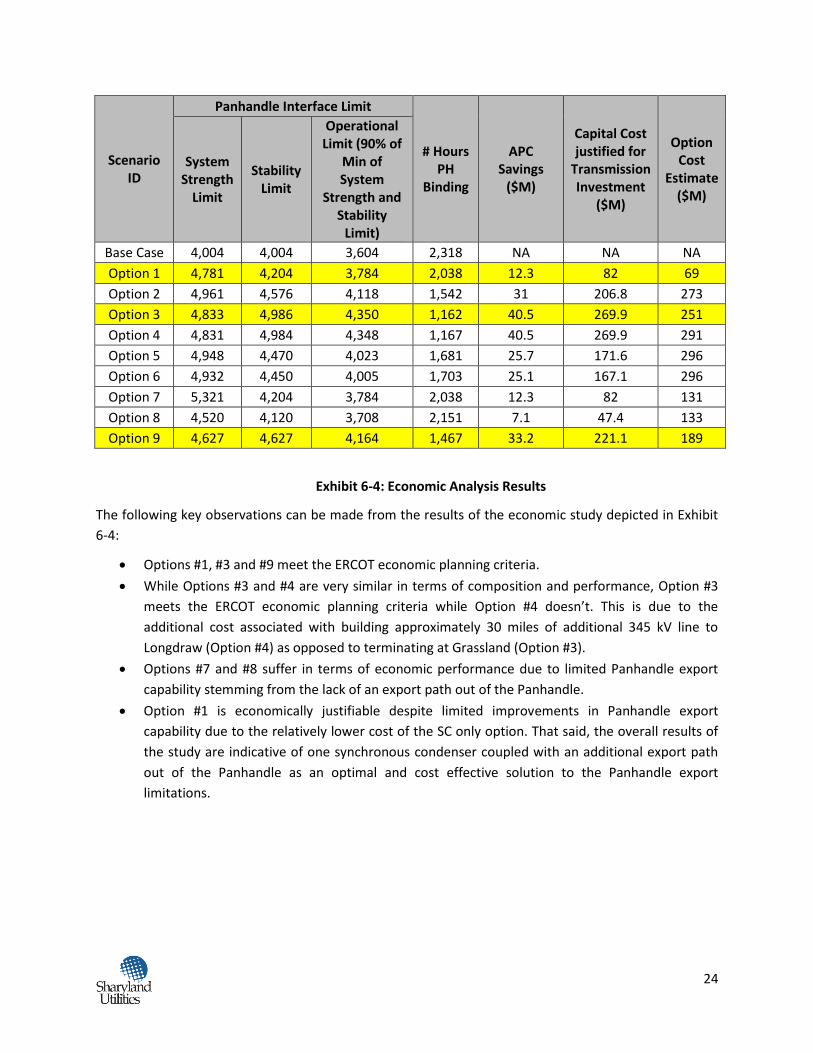
Sharyland reevaluated the Panhandle export limits from a system strength and dynamic stability
perspective for Options #1, #3 and #9 in presence of LP&L integration solution. While conducting the
system strength assessment, all gas generation units within the LP&L system are kept offline. The
updated Panhandle export limits are utilized to perform economic simulations for evaluation of APC
savings associated with the three (3) options. While conducting economic simulations, the Panhandle
interface definition is appropriately modified to account for LP&L integration (Refer Exhibit 7-2). It is
important to note that the Panhandle interface definition utilized by Sharyland post-Lubbock integration
is consistent with that utilized by ERCOT in their LP&L integration study.
Exhibit 7-2: Panhandle Interface Definition with LP&L Integration (Option #4ow)
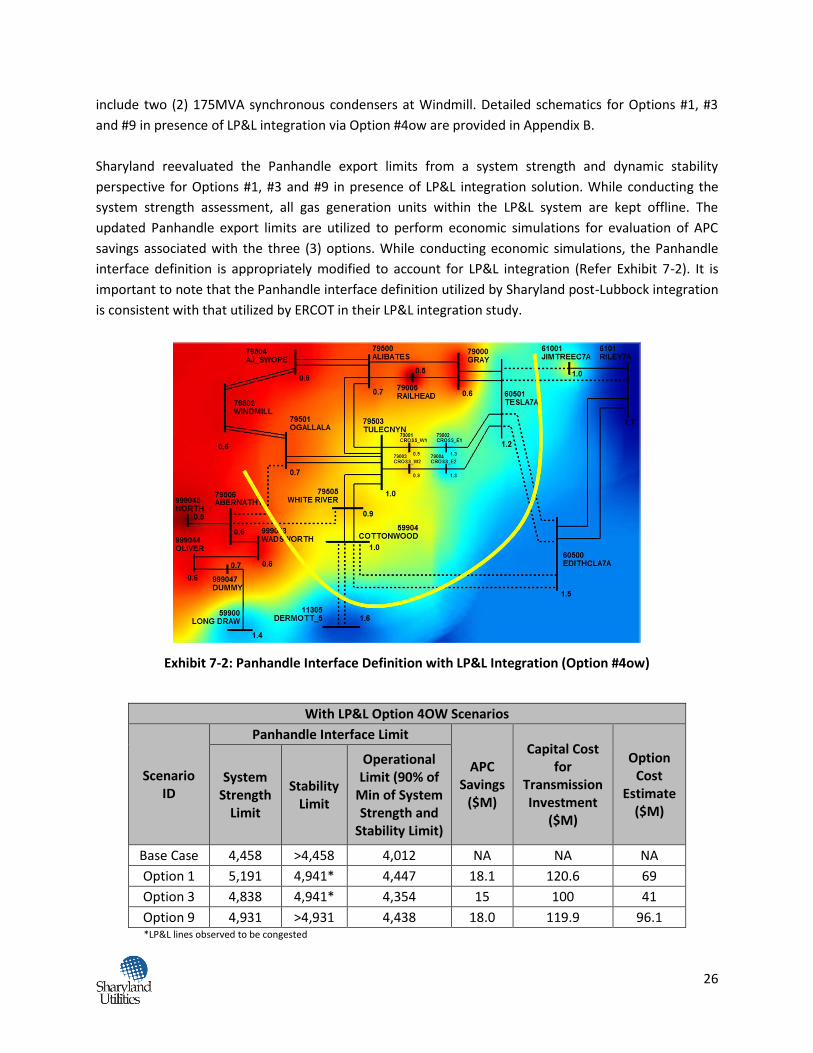
With LP&L Option 4OW Scenarios
Scenario ID
Panhandle Interface Limit
APC Savings
($M)
Capital Cost for
Transmission Investment
($M)
Option Cost
Estimate ($M)
System Strength
Limit
Stability Limit
Operational Limit (90% of
Min of System Strength and
Stability Limit)
Base Case 4,458 >4,458 4,012 NA NA NA
Option 1 5,191 4,941* 4,447 18.1 120.6 69
Option 3 4,838 4,941* 4,354 15 100 41
Option 9 4,931 >4,931 4,438 18.0 119.9 96.1 *LP&L lines observed to be congested
27
Exhibit 7-3: Economic Assessment with LP&L Integration (Option#4ow)
Exhibit 7-3 depicts the economic study results in presence of LP&L integration. It is important to note
that the cost estimates associated with each option as depicted in Exhibit 7-3 represent costs
incremental to the LP&L integration. Key observations associated with same are summarized below:
All three (3) options are deemed to be economic based on APC savings listed in Exhibit 7-3 and
their incremental capital costs post LP&L integration via Option #4ow.
Options #1 and #3 offer similar performance in terms of transfer capability and APC savings.
Option #3 has the lowest capital cost as it includes only one synchronous condenser.
8. Future Panhandle WGR Build-out Sensitivity
In addition to evaluating the impact of integrating LP&L into the ERCOT grid, Sharyland also performed a
sensitivity around the increase in WGR Panhandle capacity beyond resources that currently meet
Section 6.9 requirements of the ERCOT Planning Guide. The Panhandle WGR capacity was increased
proportionately by ~13.9% (from the original 5,269 MW) resulting in a total Panhandle WGR capacity of
6,000 MW. No other changes were made to the economic model and/or assumptions as compared to
the previous economic analysis. Note that the LP&L system integration into ERCOT was not modeled for
this sensitivity.
The following study options were evaluated from an economic standpoint for this sensitivity:
Base Case
Option 3
Option 9
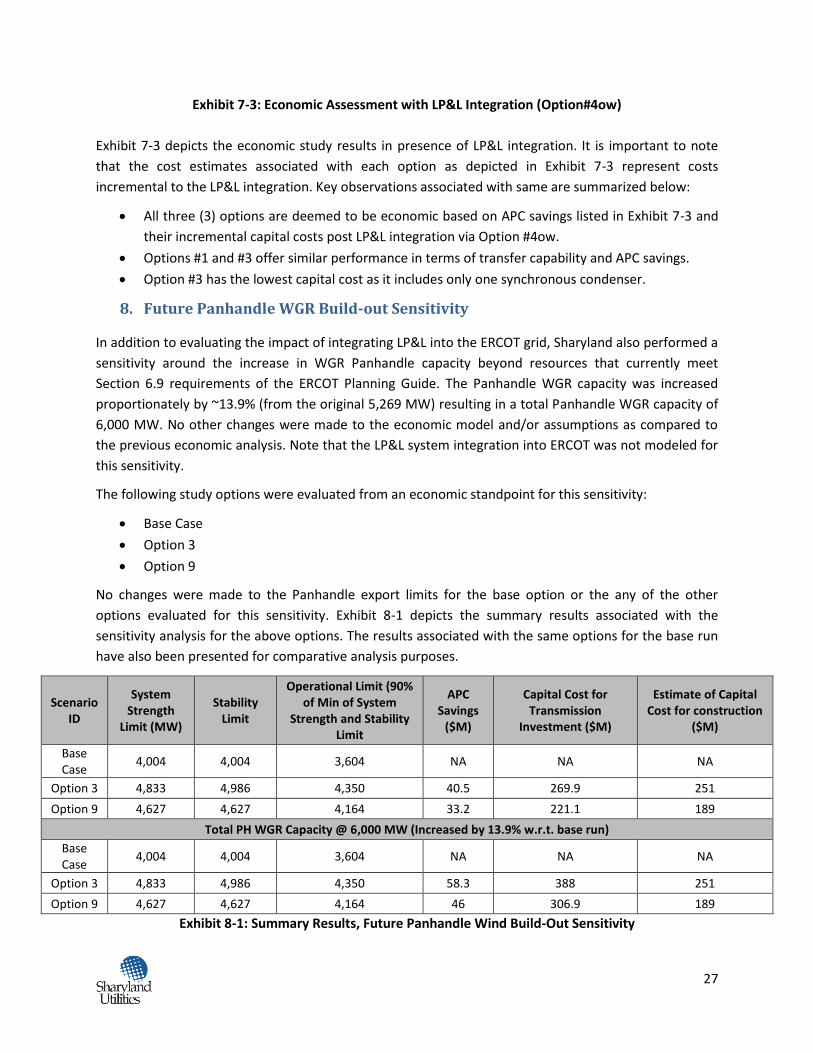
No changes were made to the Panhandle export limits for the base option or the any of the other
options evaluated for this sensitivity. Exhibit 8-1 depicts the summary results associated with the
sensitivity analysis for the above options. The results associated with the same options for the base run
have also been presented for comparative analysis purposes.
Scenario ID
System Strength
Limit (MW)
Stability Limit
Operational Limit (90% of Min of System
Strength and Stability Limit
APC Savings
($M)
Capital Cost for Transmission
Investment ($M)
Estimate of Capital Cost for construction
($M)
Base Case
4,004 4,004 3,604 NA NA NA
Option 3 4,833 4,986 4,350 40.5 269.9 251
Option 9 4,627 4,627 4,164 33.2 221.1 189
Total PH WGR Capacity @ 6,000 MW (Increased by 13.9% w.r.t. base run)
Base Case
4,004 4,004 3,604 NA NA NA
Option 3 4,833 4,986 4,350 58.3 388 251
Option 9 4,627 4,627 4,164 46 306.9 189
Exhibit 8-1: Summary Results, Future Panhandle Wind Build-Out Sensitivity
28
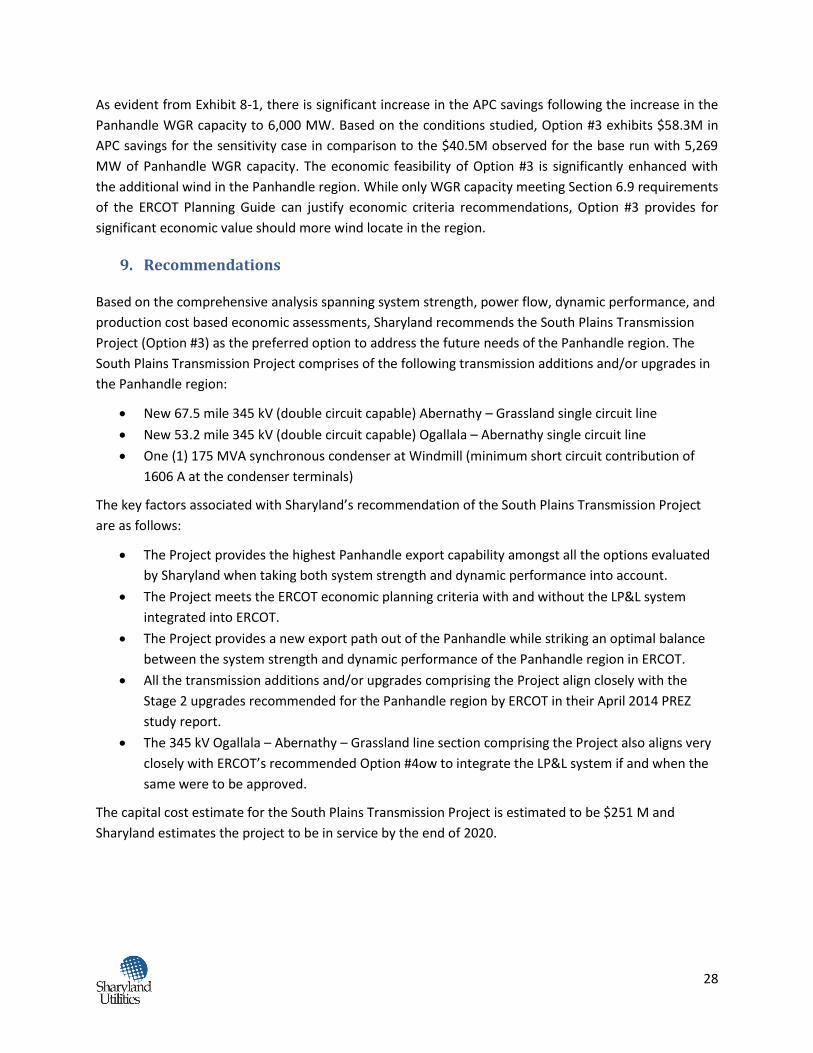
As evident from Exhibit 8-1, there is significant increase in the APC savings following the increase in the
Panhandle WGR capacity to 6,000 MW. Based on the conditions studied, Option #3 exhibits $58.3M in
APC savings for the sensitivity case in comparison to the $40.5M observed for the base run with 5,269
MW of Panhandle WGR capacity. The economic feasibility of Option #3 is significantly enhanced with
the additional wind in the Panhandle region. While only WGR capacity meeting Section 6.9 requirements
of the ERCOT Planning Guide can justify economic criteria recommendations, Option #3 provides for
significant economic value should more wind locate in the region.
9. Recommendations
Based on the comprehensive analysis spanning system strength, power flow, dynamic performance, and
production cost based economic assessments, Sharyland recommends the South Plains Transmission
Project (Option #3) as the preferred option to address the future needs of the Panhandle region. The
South Plains Transmission Project comprises of the following transmission additions and/or upgrades in
the Panhandle region:
New 67.5 mile 345 kV (double circuit capable) Abernathy – Grassland single circuit line
New 53.2 mile 345 kV (double circuit capable) Ogallala – Abernathy single circuit line
One (1) 175 MVA synchronous condenser at Windmill (minimum short circuit contribution of
1606 A at the condenser terminals)
The key factors associated with Sharyland’s recommendation of the South Plains Transmission Project
are as follows:
The Project provides the highest Panhandle export capability amongst all the options evaluated
by Sharyland when taking both system strength and dynamic performance into account.
The Project meets the ERCOT economic planning criteria with and without the LP&L system
integrated into ERCOT.
The Project provides a new export path out of the Panhandle while striking an optimal balance
between the system strength and dynamic performance of the Panhandle region in ERCOT.
All the transmission additions and/or upgrades comprising the Project align closely with the
Stage 2 upgrades recommended for the Panhandle region by ERCOT in their April 2014 PREZ
study report.
The 345 kV Ogallala – Abernathy – Grassland line section comprising the Project also aligns very
closely with ERCOT’s recommended Option #4ow to integrate the LP&L system if and when the
same were to be approved.
The capital cost estimate for the South Plains Transmission Project is estimated to be $251 M and
Sharyland estimates the project to be in service by the end of 2020.

29
30
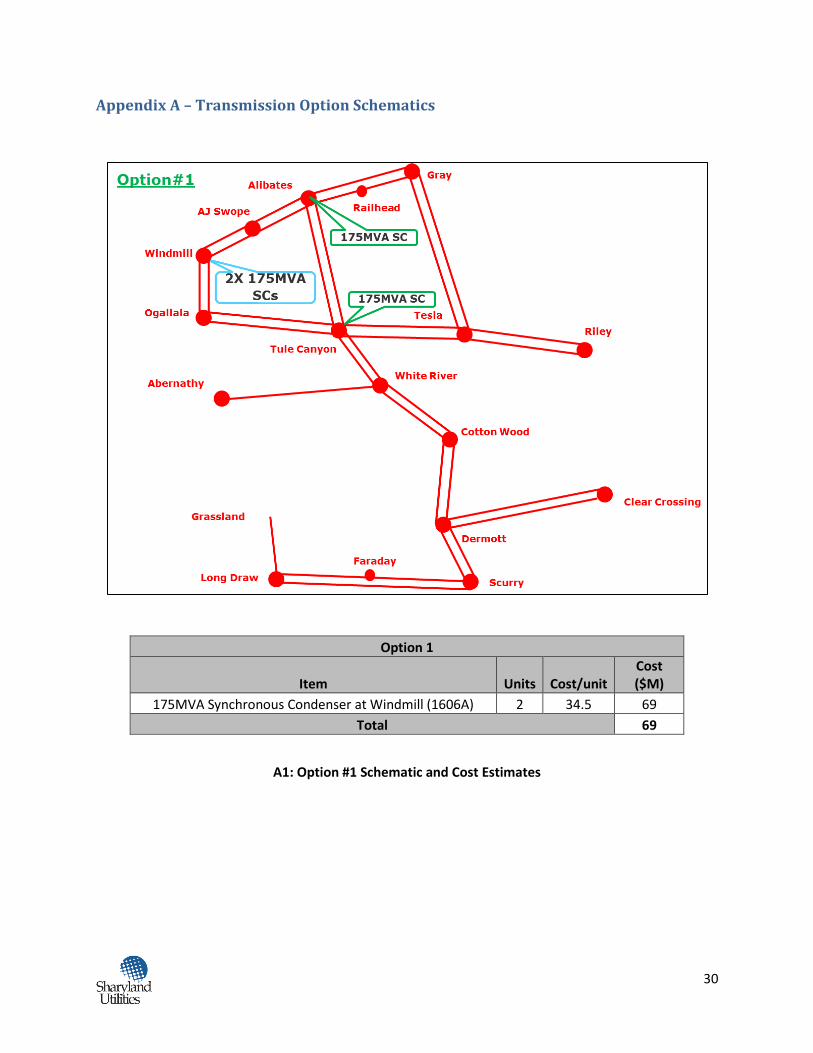
Appendix A – Transmission Option Schematics
Option 1
Item Units Cost/unit Cost ($M)
175MVA Synchronous Condenser at Windmill (1606A) 2 34.5 69
Total 69
A1: Option #1 Schematic and Cost Estimates
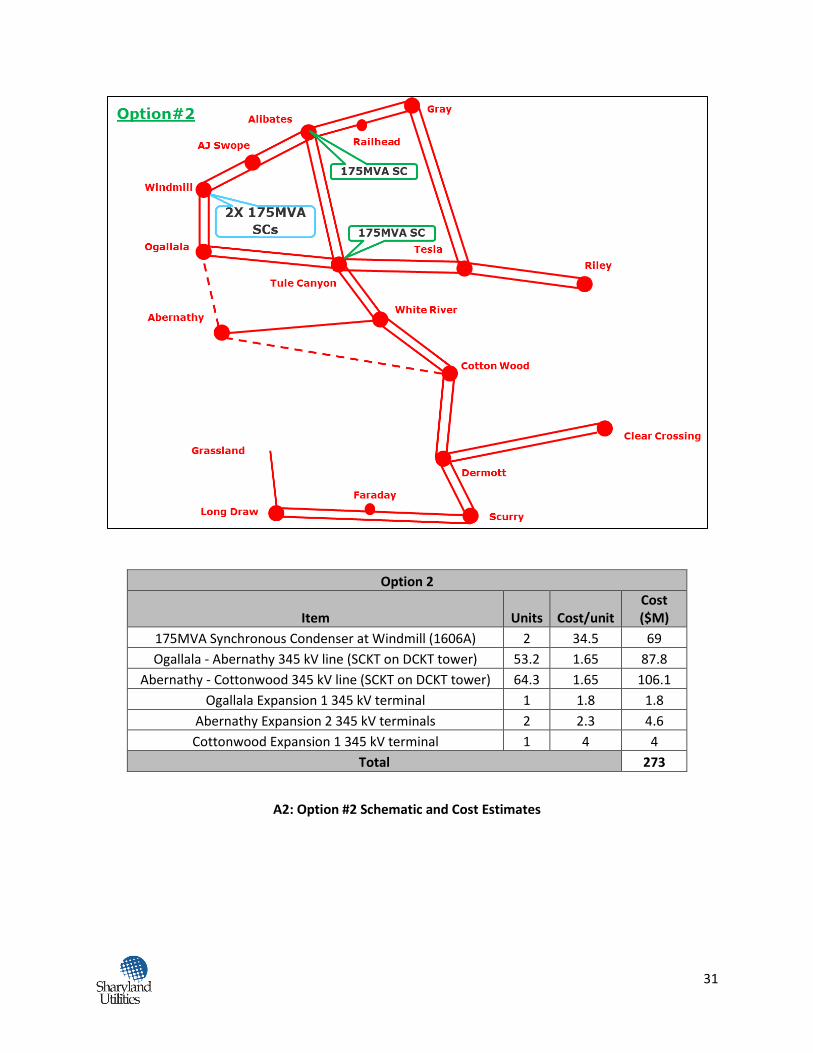
31
Option 2
Item Units Cost/unit Cost ($M)
175MVA Synchronous Condenser at Windmill (1606A) 2 34.5 69
Ogallala - Abernathy 345 kV line (SCKT on DCKT tower) 53.2 1.65 87.8
Abernathy - Cottonwood 345 kV line (SCKT on DCKT tower) 64.3 1.65 106.1
Ogallala Expansion 1 345 kV terminal 1 1.8 1.8
Abernathy Expansion 2 345 kV terminals 2 2.3 4.6
Cottonwood Expansion 1 345 kV terminal 1 4 4
Total 273
A2: Option #2 Schematic and Cost Estimates
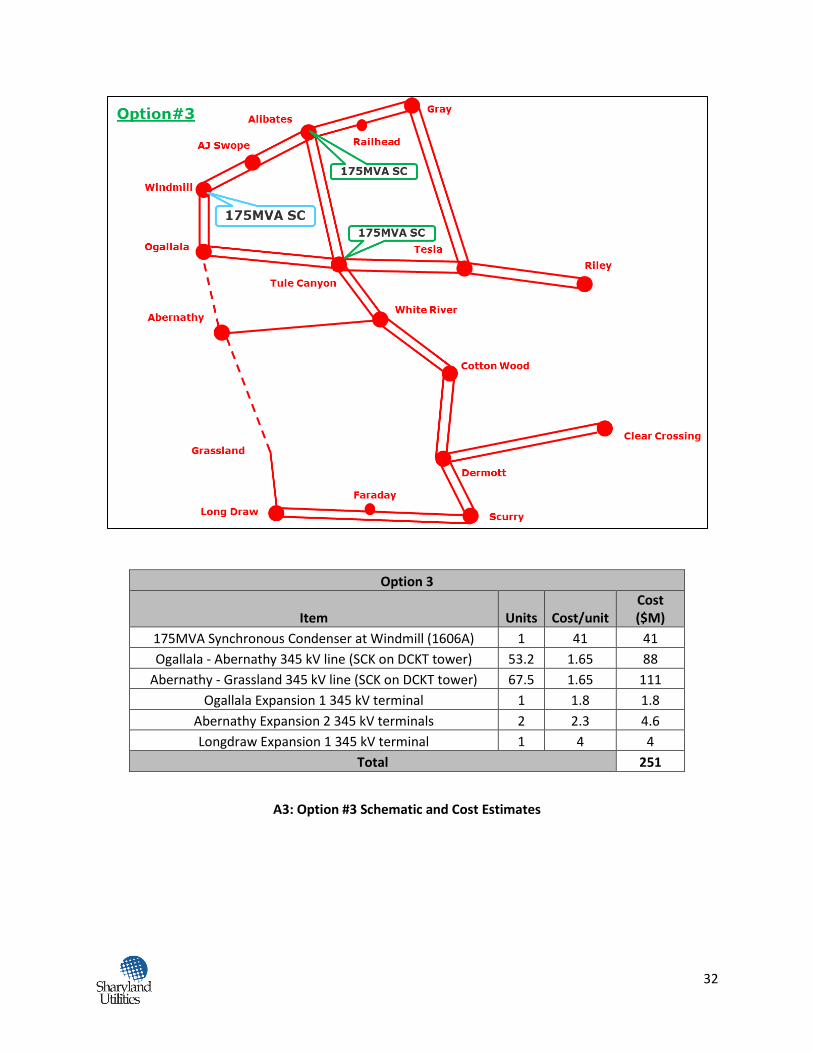
32
Option 3
Item Units Cost/unit Cost ($M)
175MVA Synchronous Condenser at Windmill (1606A) 1 41 41
Ogallala - Abernathy 345 kV line (SCK on DCKT tower) 53.2 1.65 88
Abernathy - Grassland 345 kV line (SCK on DCKT tower) 67.5 1.65 111
Ogallala Expansion 1 345 kV terminal 1 1.8 1.8
Abernathy Expansion 2 345 kV terminals 2 2.3 4.6
Longdraw Expansion 1 345 kV terminal 1 4 4
Total 251
A3: Option #3 Schematic and Cost Estimates
33
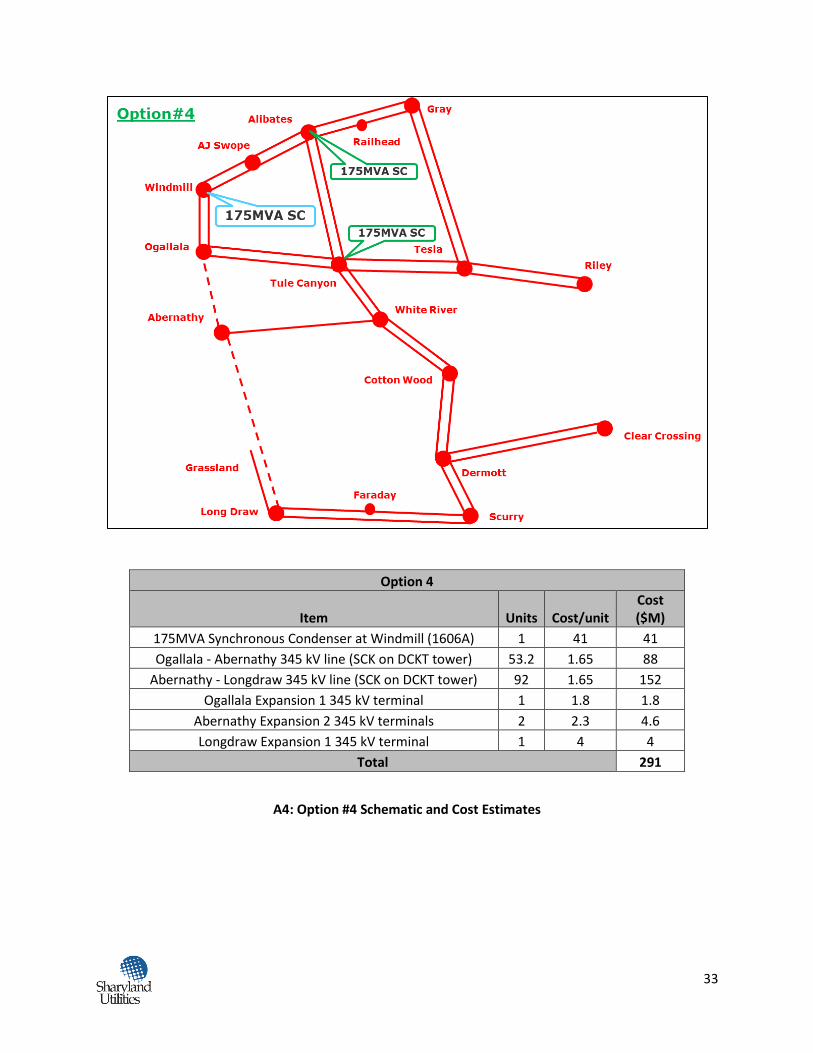
Option 4
Item Units Cost/unit Cost ($M)
175MVA Synchronous Condenser at Windmill (1606A) 1 41 41
Ogallala - Abernathy 345 kV line (SCK on DCKT tower) 53.2 1.65 88
Abernathy - Longdraw 345 kV line (SCK on DCKT tower) 92 1.65 152
Ogallala Expansion 1 345 kV terminal 1 1.8 1.8
Abernathy Expansion 2 345 kV terminals 2 2.3 4.6
Longdraw Expansion 1 345 kV terminal 1 4 4
Total 291
A4: Option #4 Schematic and Cost Estimates

34
Option 5
Item Units Cost/unit Cost ($M)
175MVA Synchronous Condenser at Windmill (1606A) 2 34.5 69
White River - Clear Crossing 345 kV line (SCKT on DCKT tower) 134 1.65 221.1
White River Expansion 1 345 kV terminal 1 1.8 1.8
Clear Crossing Expansion 1 345 kV terminal 1 4 4
Total 296
A5: Option #5 Schematic and Cost Estimates
35
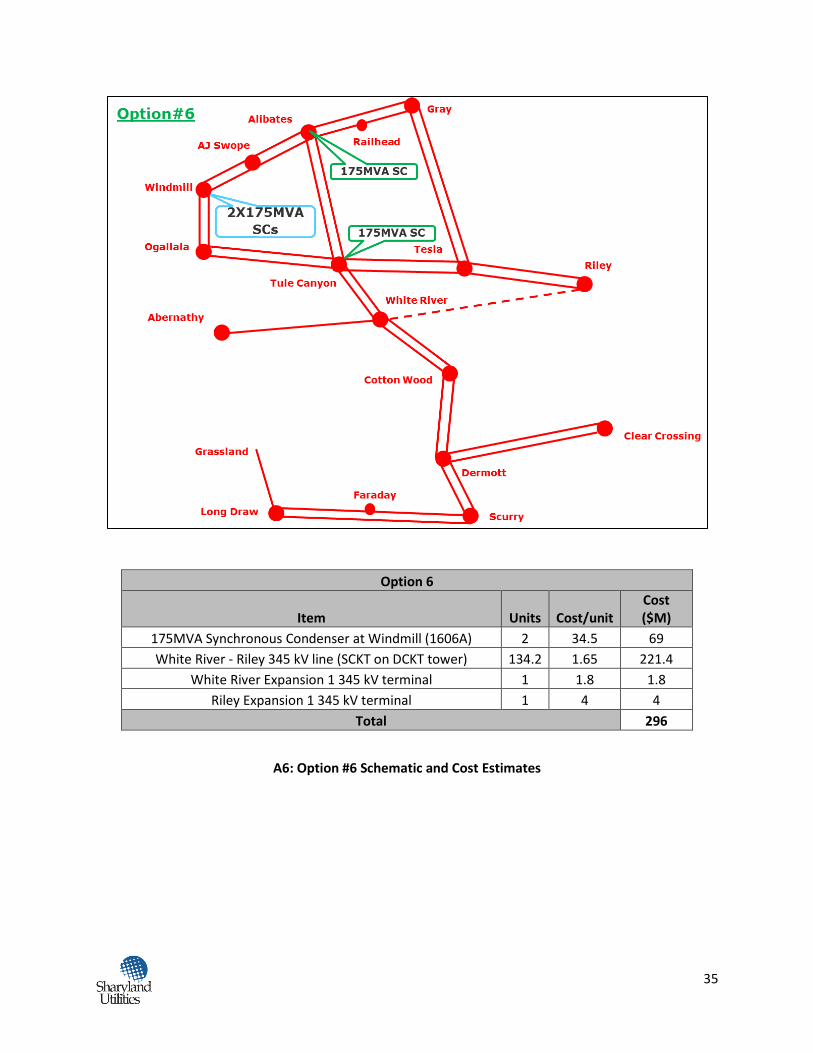
Option 6
Item Units Cost/unit Cost ($M)
175MVA Synchronous Condenser at Windmill (1606A) 2 34.5 69
White River - Riley 345 kV line (SCKT on DCKT tower) 134.2 1.65 221.4
White River Expansion 1 345 kV terminal 1 1.8 1.8
Riley Expansion 1 345 kV terminal 1 4 4
Total 296
A6: Option #6 Schematic and Cost Estimates
36
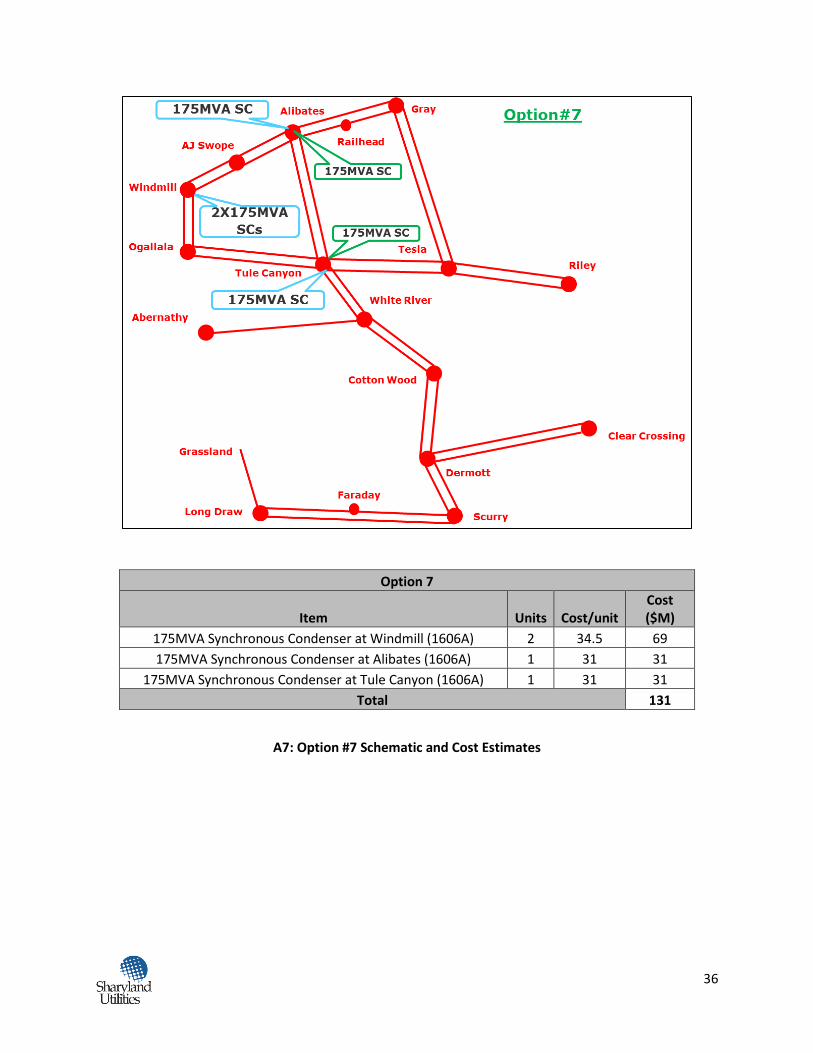
Option 7
Item Units Cost/unit Cost ($M)
175MVA Synchronous Condenser at Windmill (1606A) 2 34.5 69
175MVA Synchronous Condenser at Alibates (1606A) 1 31 31
175MVA Synchronous Condenser at Tule Canyon (1606A) 1 31 31
Total 131
A7: Option #7 Schematic and Cost Estimates
37
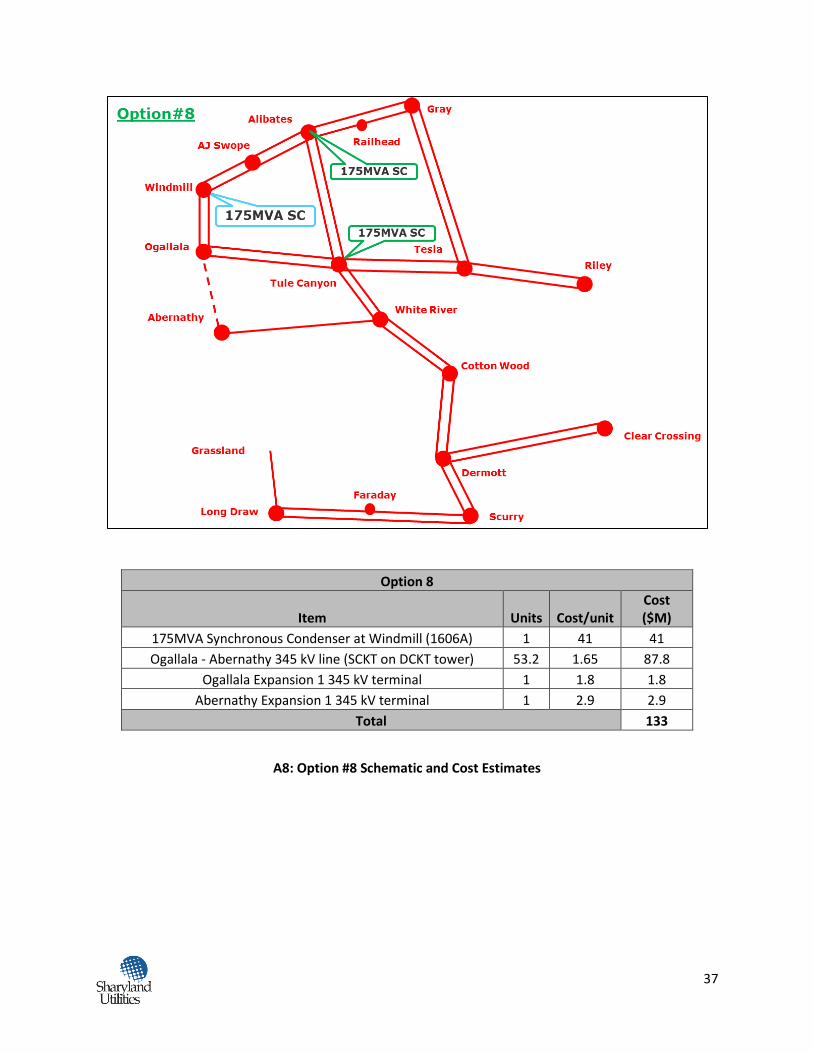
Option 8
Item Units Cost/unit Cost ($M)
175MVA Synchronous Condenser at Windmill (1606A) 1 41 41
Ogallala - Abernathy 345 kV line (SCKT on DCKT tower) 53.2 1.65 87.8
Ogallala Expansion 1 345 kV terminal 1 1.8 1.8
Abernathy Expansion 1 345 kV terminal 1 2.9 2.9
Total 133
A8: Option #8 Schematic and Cost Estimates
38
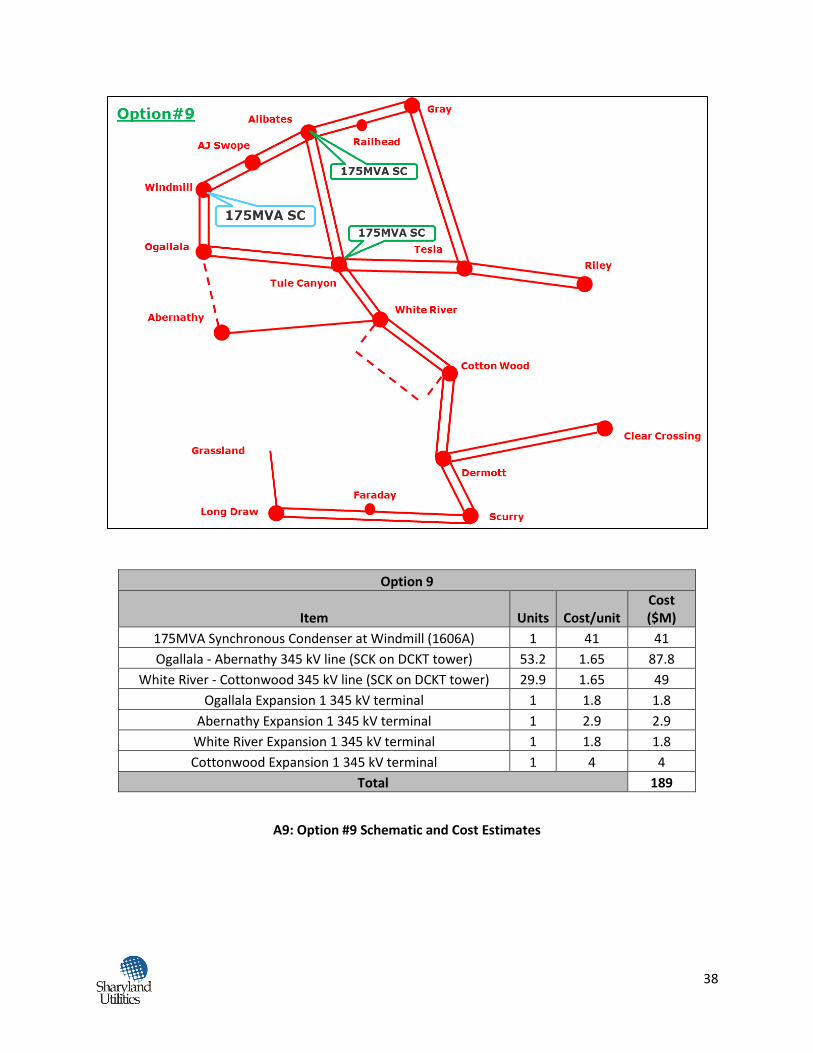
Option 9
Item Units Cost/unit Cost ($M)
175MVA Synchronous Condenser at Windmill (1606A) 1 41 41
Ogallala - Abernathy 345 kV line (SCK on DCKT tower) 53.2 1.65 87.8
White River - Cottonwood 345 kV line (SCK on DCKT tower) 29.9 1.65 49
Ogallala Expansion 1 345 kV terminal 1 1.8 1.8
Abernathy Expansion 1 345 kV terminal 1 2.9 2.9
White River Expansion 1 345 kV terminal 1 1.8 1.8
Cottonwood Expansion 1 345 kV terminal 1 4 4
Total 189
A9: Option #9 Schematic and Cost Estimates

39
A10: Option#1 with LP&L Option #4ow
40
A11: Option#3 with LP&L Option #4ow
41
A12: Option#9 with LP&L Option #4ow