Embed Size (px)
Citation preview

153
South Korea’s Development Assistance and Economic Outreach
Toward Southeast AsiaKwak Sungil
154 | Joint U.S.-Korea Academic Studies
Recently South Korea has robustly increased its Official Development Assistance (ODA) budget despite the global financial crisis of 2009. It has risen approximately nine times from $0.21 billion in 2000 to $1.76 billion in 2013. Korea receives a great deal of attention from practitioners and scholars as a model; it was a very poor recipient country in the 1950s and 1960s and managed to become a rare case of successful economic development among newly independent countries receiving ODA.
Explaining whether the purpose of aid centers on the donor’s interests or the recipient’s needs may reflect the quality of aid. A few studies have explored the determinants of Korea’s ODA, concluding that Korea is motivated by its own economic needs (thus Korea’s giving behavior is in the donor’s best interest1 not the recipients’ needs). There has been a misunderstanding of Korean ODA, which focuses on constructing infrastructure with tied aid. To dispel this misunderstanding, I explore the direct relationship between Korean foreign direct investment (FDI) and ODA as well as between bilateral trade volumes and ODA to Southeast Asia. Since Southeast Asia is where many Korean firms and economic activities are located and where a great share of ODA is sent, it provides a good test of the motivations behind ODA. Moreover, considering that the Korean government increases the share of aid for trade, it may be hard to say that Korean ODA only pursues economic interests because international trade can stimulate the economic growth of developing countries.
I first present a brief history of Korea’s ODA and ODA policy and then provide an overview of current Korean ODA. This is followed by a summary of the features of Korean ODA for Southeast Asia. In the next section, I analyze the relationship between Korean ODA for Southeast Asia and economic activities of Korea. Finally, I offer some concluding remarks and discuss policy implications.
History of Korea’s ODA and ODA PolicyThe Korean War devastated Korea, leaving it one of the poorest countries in the world. For a time, the only source of capital was ODA. In the 1950s the main targets of assistance were humanitarian relief and military support. In the 1960s a large influx of foreign investment led to economic growth even as ODA continued. As a result, the economic structure of Korea was dramatically transformed. The type of ODA to Korea was expanded from grants for reconstruction to concessional loans, thus promoting industrial development. In the 1970s and 1980s, readjustment program loans or sector-wide loans contributed to reforming the overall industrial structure. As the Korean economy was becoming more robust, ODA sources became more diversified.
Korea became a donor in the 1960s. One step in that direction occurred in 1963, when Korea hosted a U.S.-funded training program for public officials from developing countries. In 1977, Korea provided $2 million in equipment from its own budget for the first time. In 1987, it launched the Economic Development Cooperation Fund (EDCF), offering concessional loans for developing countries. In 1991, Korea began to provide grants through the establishment of the Korea International Cooperation Agency (KOICA). In 2000, it was dropped from the DAC (Development Assistance Committee) list of ODA recipients. Indeed, it was able to join the Organisation for Economic Co-operation and Development’s (OECD) DAC as an international donor member in November 2009.

Kwak: South Korea’s Development Assistance | 155
Table 1. Korea’s List of Priority Partner Countries
Asia and Commonwealth of Independent States Africa Latin America
• Azerbaijan• Bangladesh• Cambodia• Indonesia• Laos• Mongolia• Nepal• Pakistan• Philippines• Solomon Islands• Sri Lanka• Timor Leste• Uzbekistan• Vietnam
• Cameroon• Democratic Republic
of Congo• Ethiopia• Ghana• Mozambique• Nigeria• Rwanda• Uganda
• Bolivia• Colombia• Paraguay• Peru
Source: Park et al. (2013), p. 28.4
Joining the DAC was a turning point in Korea’s ODA system. It enacted the Framework Act on International Development Cooperation and devised the Strategic Plan for International Development Cooperation2 and the mid-term ODA policy for 2011-2015. Through these actions, Korea reviewed its entire ODA system and recognized the need for an integrated strategy, and a coordinated, results-based management system. Recognizing the problem of fragmentation in the ODA system, it sought to conduct ODA in a harmonized manner among multiple agents and in recognition of various types of ODA. To do so, the government established the Committee for International Development Cooperation (CIDC) under the prime minister’s office. The government also prepared Country Partnership Strategies (CPS) for selected priority partner countries. CPS provides unitary guidance for all ODA executing ministries and agencies and serves as a basic guideline for delivering aid to priority countries, for which two or three core sectors are identified to “select and focus” principles to enhance aid effectiveness.3 Korea had two unpublished lists of priority countries selected by KOICA and EDCF. Before joining the DAC, the lists were integrated into a single list of 26 countries, as shown in Table 1. Five countries in Southeast Asia are on this priority list. Grants and concessional loans are concentrated in these countries.
The efforts above have surely improved the ODA system of Korea. However, there still exist many limitations on the implementation of ODA by the agencies. This chapter identifies specific characteristics and challenges in ODA for Southeast Asia and proposes steps that could produce better results.

156 | Joint U.S.-Korea Academic Studies
Korea’s ODA SystemKorea’s ODA institutional framework consists of a coordinating body, supervising ministries, and executing ministries and agencies, as shown in Figure 1. There are still unsolved questions within its internal structure, e.g., the widely-recognized problem of fragmentation. To cope with this weakness, the MOSF (Ministry of Strategy and Finance) and MOFA (Ministry of Foreign Affairs) co-chair the Inter-Agency EDCF Committee and the Inter-Agency Grants Committee. In order to build a regional network and strengthen the linkage between concessional loans and grants, the KOICA-EDCF Senior Officers’ Meeting is held regularly.
The CIDC, as a coordinating body, deliberates and decides overall ODA policies for greater policy coherence and systematic delivery of aid programs. MOSF and MOFA, which supervise concessional loans and grants, respectively, draft the mid-term ODA policy and the annual implementation plan, which are ultimately approved by the CIDC. KOICA and the Korea Eximbank implement grant aid and concessional loans respectively, and other ministries also play a role in the delivery of Korea’s ODA, especially for grant aid and technical cooperation.

Kwak: South Korea’s Development Assistance | 157
Table 2. Overview of Korea’s Current ODA Provision (Unit: $ million, %)
2007 2008 2009 2010 2011 2012 2013Growth
rateShare
ODA696
(53%)802
(15%)816(2%)
1174(44%)
1325(13%)
1597(21%)
1755(10%)
14.3% 100.0%
ODA/GNI (%) 0.07 0.09 0.1 0.12 0.12 0.14 0.13 - -
Bilateral Cooperation
491(31%)
539(10%)
581(8%)
901(55%)
990(10%)
1183(19%)
1310(11%)
13.3% 74.6%
Grants358
(38%)369(3%)
367(-1%)
574 (56%)
575(0%)
715(24%)
809(13%)
12.1% (61.8%)
Concessional Loans
132(13%)
171(30%)
214(25%)
327(53%)
415(27%)
468(13%)
501(7%)
15.3% (38.2%)
Multilateral Cooperation
206(161%)
263(28%)
235(-11%)
273(16%)
335(23%)
414(24%)
446(8%)
17.8% 25.4%
Note: 1. Current amounts of disbursement. 2. Increasing rate year-on-year is presented in ( ). 3. Growth rate represents compound average growth rate from 2010 to 2013 after joining DAC. 4. The last column represents the share to total ODA.Source: OECD QWIDS, http://stats.oecd.org/qwids/popularqueries.html
Overview of Korean ODAKorea, as an emerging donor, has continuously increased the total amount of ODA in order to contribute to the growth of developing countries. The amount has grown from $0.11 billion in 1991 to $1.75 billion in 2013 (Table 2). In particular, ODA soared in 2005 to $0.75 billion, 0.1 percent of the GNI. This sudden increase is attributed to support for the recovery of postwar Afghanistan and Iraq. In 2006, ODA (disbursement) decreased by 39.5 percent to $0.45 billion. In 2007, however, the amount grew by 52.8 percent to $0.69 billion, which is 0.07 percent of the gross national income (GNI). This increase is attributed to an increase in multilateral ODA through investment in the regional development bank. ODA grew by 15.2 percent in 2008. In 2009 it grew slightly by 1.7 percent to reach approximately $0.816 billion. The increase was due to the exchange rate applied,5 while the decrease had mainly resulted from the reduction of investment in the Inter-American Development Bank (IDB). Korea’s ODA in 2010 was $1.17 billion, which is attributed to an increase in disbursement of bilateral concessional loans since 2006. In 2011, both bilateral concessional loans and multilateral ODA support of the regional development bank and multilateral organizations were the main contributors to the increase. In 2012 Korea’s ODA exceeded $1.5 billion for the first time. The ODA to GNI ratio now stood at 0.14 percent.
In 2013, the figure had climbed to $1.75 billion, a 9.9 percent increase over 2012. Bilateral and multilateral aid both rose. After these continuous increases, Korea ranked as the 16th largest donor among the 27 members of the OECD DAC, followed by Belgium. The ODA to GNI ratio (0.13 percent) had slightly declined, however, as the GNI increased by 15.9 percent year-on-year due to a reform of the national account. Korea still has to increase its assistance, given the fact that the average aid ratio for DAC members is 0.30 percent of GNI. The

158 | Joint U.S.-Korea Academic Studies
Table 3. Bilateral ODA Budget (Unit: $ million)
2012 2013
MOSF 594.9 643.4
MOFA 488.6 517.3
MEST 36.7 47.5
RDA 11.0 12.6
MFAFF 11.5 13.6
MHW 9.7 11.5
MOE 6.6 9.2
Etc. 42.1 40.9
Total 1,201.2 1,295.9
Source: Collaboration of listed Ministries.Note: Ministry of Education, Science and Technology (MEST); Rural Development Administration (RDA); Ministry for Food, Agriculture, Forestry and Fisheries (MFAFF), Ministry of Health and Welfare (MHW), Ministry of Environment (MOE)

Kwak: South Korea’s Development Assistance | 159
government has a plan to narrow the gap and meet this responsibility to international society,6 as seen in the mid-term ODA policy for 2011-2015.7 In addition, the Korean government has kept the ratio between bilateral and multilateral ODA (7:3) and between grants and concessional loans (6:4) as “Strategies for Advancement of International Development Cooperation” proposed in 2010. It is time to think about whether maintaining this ratio is good for improving the effectiveness of ODA because the donor shopping phenomenon is pervasive across recipient countries. As the amount of disbursement increases, the size of the budget for ODA also increases. After joining the OECD DAC in 2010, the size of the budget increased from $0.89 billion to $1.29 billion (grants $0.68 billion/concession loans $0.61 billion) in 2013. Most of the budget has been concentrated in MOSF/EDCF (40 percent) and MOFA/KOICA (48 percent). Only five ministries had over $9 million of ODA in 2013.
Figure 3 and Table 4 show the geographic distribution of Korea’s bilateral ODA and top five recipients. The largest share of aid goes to Asia, and increases over time. Korea’s economic relationships are closest with recipients in Asia, where there are 14 priority partner countries, especially in ASEAN with its growing demand for infrastructure. In addition, the Korean government believes that its development experience is relevant for Asian recipient countries.

160 | Joint U.S.-Korea Academic Studies
Table 4. Top 5 Recipients of Korean Bilateral Aid (Unit: $ million)
Rank2011 2013
Loans Grants Total Loans Grants Total
1Vietnam(109.4)
Mongolia(32.6)
Vietnam(139.5)
Vietnam(206.5)
Afghanistan(122.4)
Vietnam(242.5)
2Bangladesh
(70.8)Vietnam
(30.1)Bangladesh
(80.0)Mozambique
(53.5)Vietnam
(35.9)Afghanistan
(122.4)
3Cambodia
(39.1)Afghanistan
(28.0)Cambodia
(62.2)Tanzania
(46.2)Philippines
(33.2)Cambodia
(63.8)
4Sri Lanka
(31.9)Philippines
(25.8)Sri Lanka
(43.4)Sri Lanka
(36.5)Cambodia
(32.6)Mozambique
(57.1)
5Jordan(26.9)
Cambodia(23.1)
Philippines(35.7)
Pakistan(32.1)
Mongolia(30.4)
Tanzania(56.9)
Source: OECD QWIDS (http://stats.oecd.org/qwids/popularqueries.html).
The second largest group of recipient countries is located in Africa. Aid is still concentrated in the Asia-Pacific region, but support for Africa reached more than 6 percent of total aid in 2005 and 21 percent of total aid in 2013. Korea continues to diversify the regional allocation of aid. This change can be observed in Table 4. In 2011, the top five recipient countries were in Asia, but Mozambique and Tanzania made this list in 2013. Considering grant provision alone, Asian countries are still the only ones on this list.
Kwak: South Korea’s Development Assistance | 161
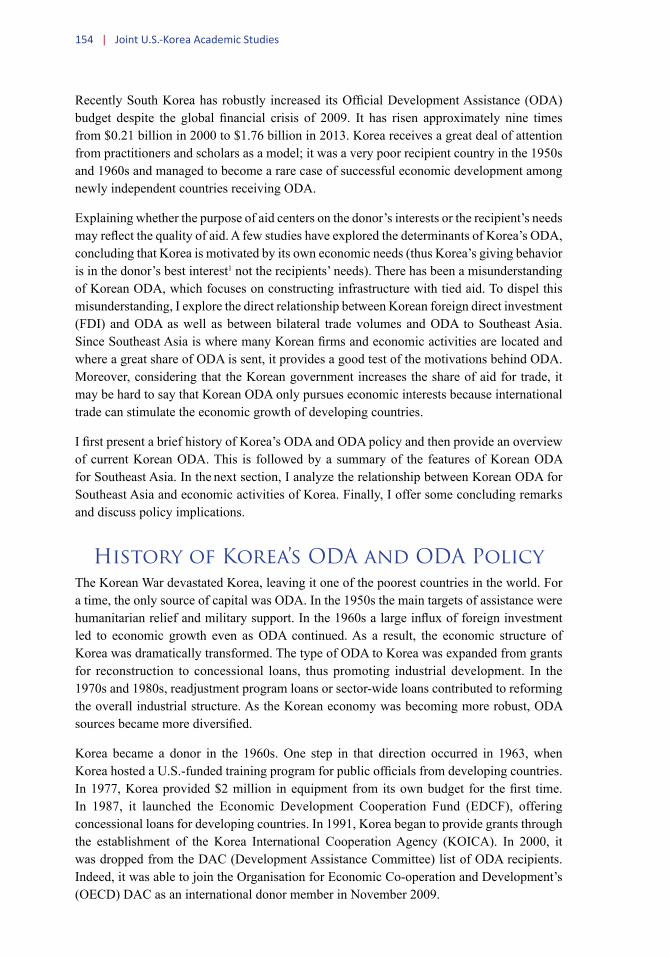
Table 5. Korea’s Loan to Grant Ratio (Unit: %)
(Loan/grant)
2005 2006 2007 2008 2009 2010 2011 2012 2013
Total 45.6 45.2 36.9 46.3 58.3 57.0 72.2 65.5 61.9
Asia 97.0 47.6 55.4 55.9 78.0 76.1 107.1 87.4 77.9
Africa 0.0 0.0 0.0 0.0 0.0 37.6 47.1 90.5 102.2
Central South America
-25.0 1450.0 750.0 225.0 370.0 16.4 32.7 26.2 42.6
Middle East Asia
116.7 84.6 34.6 41.9 37.7 21.4 192.9 100.0 48.1
Europe 33.3 56.3 48.6 94.3 75.0 550.0 185.7 220.0 100.0
Oceania 14.9 10.8 1.4 36.4 0.0 0.0 -20.0 -25.0 -25.0
Source: OECD QWIDS (http://stats.oecd.org/qwids/popularqueries.html).
Concessional loans, as noted in Table 5, have continually garnered an increasing share of total aid, from 45 percent in 2005 to 61.9 percent in 2013. For Asia, the percentages at first glance do not seem to demonstrate an inverse-U shape. Until 2011, the figure increased, but it has declined recently due to a growth in aid shopping by recipient countries in Southeast Asia since they prefer grants to concessional loans. For Africa, the share of concessional loans is much greater than that of grants because large infrastructure projects are being delivered to that continent.
The Korean government allocates more than 70 percent of its aid to social and economic infrastructure and services (Figure 4). The share of economic infrastructure and the services sector noticeably increased after it joined OECD DAC in 2009, while the share of social infrastructure and the services sector decreased until 2011. In 2012 the trends were reversed.
Aid for transportation and storage had the largest share of allocations (17.8 percent) in 2012. Education was second. Table 6 shows that aid for social infrastructure was $0.56 billion, while $0.31 billion was provided for economic infrastructure. Multisector and production sector aid reached 9.8 percent and 8.1 percent, respectively, of total aid. Over 3 percent of total aid went to support the rebuilding of Iraq before falling back to around 1 percent.
Aid allocation to less developed countries (LDCs) has dramatically increased from $89.83 million in 2006 to $494.96 million in 2013, a 5.5-fold increase. As of 2013, 30.8 percent of Korea’s bilateral ODA was delivered to LDCs. The overall ODA volume for LDCs and other low-income countries (OLICs) has been trending higher from 27.1 percent to 31.4 percent in 2013. In terms of absolute numbers, ODA volume for LDCs was the fastest-growing among all income groups.

162 | Joint U.S.-Korea Academic Studies
Table 6. Aid Provision of Korea by Sector
Sector2009 2012
Amount Share Amount Share
Social SOC
Education 69.5 12.0% 205.0 17.3%
Health 91.0 15.7% 120.2 10.2%
Population 3.3 0.6% 7.3 0.6%
Water and Sanitation 41.3 7.1% 118.4 10.0%
Government and Civil Society 61.2 10.5% 90.7 7.7%
Other Social Infrastructure and Services
7.1 1.2% 16.6 1.4%
Subtotal 273.5 47.1% 558.2 47.2%
Economic SOC
Transport and Storage 77.4 13.3% 210.3 17.8%
Communication 59.5 10.2% 47.4 4.0%
Energy Generation and Supply 14.1 2.4% 48.0 4.1%
Banking and Financial Services 0.9 0.2% 1.5 0.1%
Business and Other Services 0.5 0.1% 1.6 0.1%
Subtotal 152.5 26.2% 308.8 26.1%
Etc.
Production 59.9 10.3% 95.7 8.1%
Multisector/Cross-Cutting 37.6 6.5% 115.6 9.8%
Commodity Aid and General Program Assistance
0.1 0.0% 2.0 0.2%
Action Relating to Debt .. ..
Humanitarian Aid 16.8 2.9% 16.4 1.4%
Administrative Cost of Donors 27.8 4.8% 59.4 5.0%
NGO Support 7.8 1.3% 1.2 0.1%
Unallocated 5.3 0.9% 26.0 2.2%
Subtotal 155.2 26.7% 316.2 26.7%
Total 581.1 100% 1183.2 100%
Source: KoreaExim Bank ODA Stat (net disbursement).

Kwak: South Korea’s Development Assistance | 163
Challenges of Korean ODA ProvisionAlthough the total size of ODA has recently increased, it is small compared to other OECD countries (Table 7); however, the average amount of each project-type assistance is greater than that for other major donors except Belgium and the EU. This means that Korea still prefers to show off by carrying forward big projects. It should concentrate on qualitative indicators, not showy quantitative ones.
The Korean government should also clarify the objectives and raise public awareness of ODA. According to a survey conducted by the Korea Institute for International Economic Policy (KIEP) in 2014, 75.4 percent of the sample reported never having heard about Millennium Development Goals, and 22.4 percent indicated that they had heard about them but did not know exactly the content of these goals. Moreover, 78.6 percent reported that they are not familiar with the fact that Korea is a member of the DAC.

164 | Joint U.S.-Korea Academic Studies
Table 7. Size of Project-Type Intervention by Korea (Unit: $ million, ea)
2010 2012
Grant total
AverageCase
numberGrant total Average
Case number
Austria 51.85 0.36 144 40.16 0.28 143
Belgium 202.71 5.63 36 50.9 2.83 18
Denmark 842.24 1.56 540 644.4 1.33 484
France 330.7 1.35 245 330.06 1.39 238
Germany 1,770.53 1.46 1,216 2,080.96 1.41 1,475
Italy 122.24 0.12 998 179.63 0.16 1,113
Netherlands 564.28 0.64 876 1,009.21 2.65 381
Norway 892.56 0.82 1,089 860.7 0.75 1,146
Portugal 7.83 0.07 113
Sweden 609.27 1.42 430 576.72 1.12 515
Switzerland 336.74 0.56 604 352.31 0.46 759
United Kingdom
1,142.27 0.57 1,994 1,304.97 0.48 2,738
Finland 215.56 0.35 611 129.39 0.3 431
Greece 0 0 1
Spain 1,537.88 0.24 6,418 537.44 0.17 3,104
Canada 378.71 0.36 1,051 369.7 0.51 729
United States
19,334.09 1.3 14,901 12,924.25 1.11 11,635
Japan 3,652.30 0.5 7,265 3,508.94 0.28 12,408
Korea 435.44 4.44 98 154.74 2.54 61
Australia 293.09 1.05 278
New Zealand
74.36 0.46 163 43.62 0.78 56
EU Institutions
5,230.65 7.74 676 5,726.44 11.08 517
Total 38,017.45 0.96 39,633 30,832.4 0.81 38,065
Source: OECD QWIDS (http://stats.oecd.org/qwids/popularqueries.html).

Kwak: South Korea’s Development Assistance | 165
Table 8. Aid from Major Donors to Southeast Asia (2013) (Unit: $ million)
2013 US Japan Australia
Cambodia 76.92 141.49 71.95
Indonesia 152.16 -820.93 549.33
Laos 9.41 75.96 49.22
Myanmar 81.2 2,528.32 70.01
Philippines 154.2 -401.5 143.3
Thailand 56.84 -193.05 6.16
Timor-Leste 21.12 22.17 108.57
Vietnam 107.65 1,306.89 147.17
Total 659.5 2659.35 1145.71
Standard Deviation (54.02) (1077) (170.8)
Note: Each number represents the amount of net disbursement in terms of 2013 current price.Source: OECD QWIDS (http://stats.oecd.org/qwids/popularqueries.html).
Table 9. Official Development Assistance from Donors for Southeast Asia (Unit: $ million)
2007 2008 2009 2010 2011 2012 2013
Cambodia 752.45 787.32 778.44 770.57 774.62 807.41 830.61
Indonesia 1,009.9 1,296.4 1,185.4 1,484.8 411.73 67.81 -107.4
Laos 451.59 524.62 457.94 437.55 382.26 408.92 435.53
Malaysia 287.06 180.45 155.74 0.17 31.23 15.37 -157
Myanmar 220.38 561.11 383.14 376.13 367.04 504.05 4,479.8
Philippines 745.61 15.06 366.99 552.88 -178.9 5.12 97.21
Thailand -480.2 -784.3 -89.49 -14.28 -150.7 -134.8 -70.5
Timor-Leste 324.17 306.67 248.48 316.94 274.07 283.07 266.67
Vietnam 2,865.3 2,712 3,998.2 3,080.9 3,509.8 4,115.8 4,355.3
Total 6,176.3 5,599.3 7,484.9 7,005.7 5,421.2 6,072.7 10,130
Source: OECD QWIDS (http://stats.oecd.org/qwids/popularqueries.html).Note: Each number represents the amount of net disbursement in terms of 2012 constant price.
166 | Joint U.S.-Korea Academic Studies
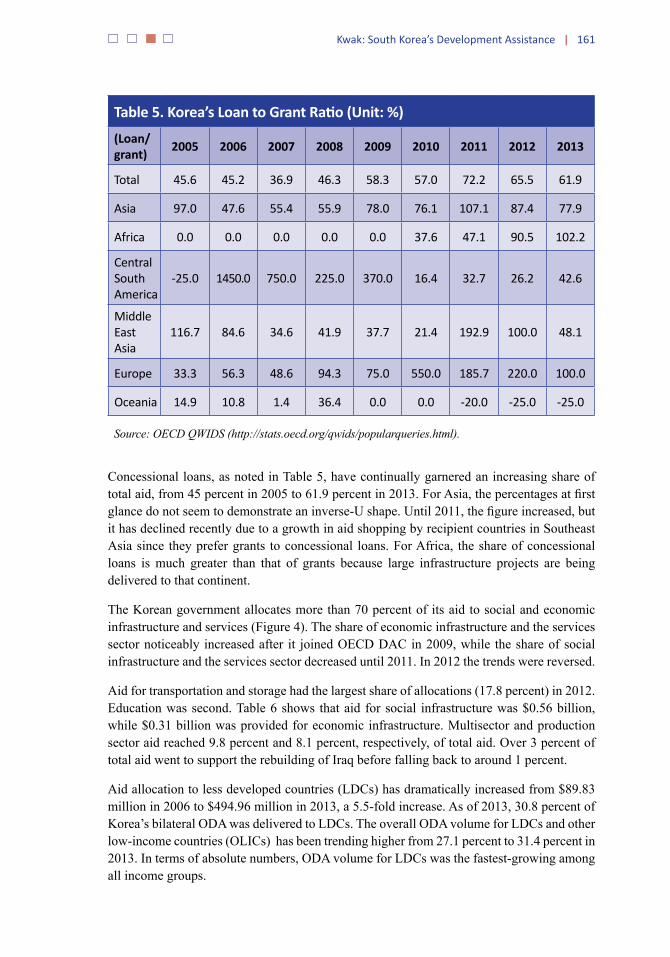
Table 10. Korea’s Aid Allocation by Country in Southeast Asia (Unit: $ million, %)
Southeast Asia
Year
2005 2006 2007 2008 2009 2010 2011 2012 2013
All Recipients (A)
788.57 444.18 649.67 868.88 980.62 1234.61 1315.14 1597.5 1685.12
Recipient in Asia (B) 393 222.06 279.98 304.73 376.69 617.77 620.69 679.92 740.83
Cambodia 18.63 13.49 32.92 37.54 20.5 39.3 61.79 56.15 58.12
Indonesia 19.2 18.44 26.86 20.51 33.4 25.7 24.12 37.23 30.24
Laos 10.24 13.22 16.7 12.53 30.2 29.2 33.24 23.52 25.99
Malaysia 0.68 1.08 0.61 1.32 1.29 1.82 1.84 0.43 0.13
Myanmar 8.5 8.32 0.47 4.73 2.34 3.42 4.78 6.04 11.25
Philippines 7.88 6.89 26.28 22.92 26.5 31.1 35.44 31.33 41.03
Thailand 3.95 2.17 2.01 2 2.79 2.62 4.44 2.89 3.21
Timor-Leste 0.31 0.56 1.27 2.36 2.13 1.91 6.97 7.55 3.46
Vietnam 16.03 9.83 23.02 57.64 69.1 101 138.5 200.3 225.2
Recipient in Southeast Asia (C)
85.42 74 130.14 161.6 188 236 311.1 365.5 398.6
B/A 49.8% 50.0% 43.1% 35.1% 38.4% 50.0% 47.2% 42.6% 44.0%
C/A 10.8% 16.7% 20.0% 18.6% 19.2% 19.1% 23.7% 22.9% 23.7%
C/B 21.7% 33.3% 46.5% 53.0% 49.9% 38.2% 50.1% 53.8% 53.8%
Source: OECD QWIDS (http://stats.oecd.org/qwids/popularqueries.html).Note: 1. Each number represents the amount of net disbursement in terms of 2012 constant price. 2. Recipient in Asia includes all countries located in the Middle East Asia, South and Central Asia, and Far East Asia.

Kwak: South Korea’s Development Assistance | 167
In addition, to reduce the inefficiency of the dual-aid delivering agency system such as KOICA and EDCF giving similar projects to the same recipient countries,8 the government could establish a control tower with practical power to make separate agencies exchange related information and link their projects.
ODA to Southeast AsiaAustralia provides the largest amount of grants to Southeast Asian countries. Indonesia has been the most favored recipient because it is important for their national security. Excluding Indonesia, the standard deviation of Australian ODA to Southeast Asia countries is 51.2, which is the smallest among the donor states of the United States, Japan, and Australia. This indicates that Australia treats most recipients in Southeast Asia alike. As seen in Table 8, Japan selects a few targeted countries and provides the most resources to them. In 2013 Japan gave $2.5 billion to Myanmar and $1.3 billion to Vietnam. Japan was paid back by Indonesia, Thailand, and the Philippines. Among the three donors, only Japan provided concessional loans to the recipients, with Myanmar receiving $20.4 billion in 2013.
Because countries in Southeast Asia are at various stages of development, recipient countries were given different amounts of ODA by donors (Table 9). We can observe that Indonesia, Malaysia, and Thailand, as their income grew, paid back the concessional loans. Myanmar, the largest emerging recipient in this region, was provided $4.48 billion in 2013—an additional $3.96 billion more than the previous year, as the United States and the EU lifted economic sanctions. The second largest recipient was Vietnam, which received $4.36 billion. As it moved to successfully reform its economic and social systems, ODA to that nation continually increased.
Table 10 represents Korea’s aid allocation by country in Southeast Asia. Korea has historically had a close relationship with Asian countries given its cultural familiarity and geographic proximity. Thus, approximately 50 percent of bilateral ODA was given to Asia after joining DAC, though the figure was reduced to 44 percent in 2013. In that year approximately 23.75 percent of bilateral ODA (A) was provided only to Southeast Asian countries (C). Given that bilateral ODA for the nine recipients in Southeast Asia soared from $85 million in 2005 to $398 million in 2013, one can see that they were the major beneficiaries of Korea, garnering more than half of Korea’s ODA in 2013.
Korea mostly provided experts and technical assistance type of ODA to Southeast Asia in 2013 due to the region’s increase in knowledge sharing programs.9 As seen in Table 11, Cambodia and Vietnam received most funding for knowledge sharing programs. South Korea preferred project-type interventions, which it has traditionally provided, but it rarely provided budget support and pooled funds. In terms of amounts provided to recipients, however, project-type intervention was dominant, as shown in Table 11. While the average value per instance of experts and technical assistance was approximately $17,000, the average for projects was around $1 million. The Korean government, because it has little experience in the provision of various types of ODA, should investigate from the experience of other advanced donors which type of provision is more effective in enhancing the wellbeing of people in recipient countries.

168 | Joint U.S.-Korea Academic Studies
Table 11. Korea’s Type of Aid to Southeast Asia (2013) (Unit: $ million, ea)
Budget Support
Core contributions and pooled programs and funds
Project-type interventions
Experts and other technical
assistance
Scholarships and student
costs in donor
countries Total
Amt. Ea Amt. Ea Amt. Ea Amt. Ea Amt. Ea Amt. Ea
Cambodia 0 1.551 5 51.49 62 9.51 736 1.28 20 63.85 823
Indonesia 0 0 0 31.29 53 7.26 378 0.60 16 39.17 447
Laos 0 0.385 3 19.66 29 5.79 307 1.28 12 27.12 351
Malaysia 0 0 0 0 0.09 11 0.04 4 0.139 15
Myanmar 0 0.046 1 10.05 36 4.28 202 0.41 11 14.8 250
Philippines 0 4.1 11 33.12 48 6.84 462 0.51 12 44.59 533
Thailand 0 0.046 1 0 3.19 122 0.10 7 3.34 130
Timor-Leste 0 0 0 2.96 11 0.61 51 0.02 2 3.602 64
Vietnam 19.62 2 0.38 3 209.47 93 12.22 669 0.75 16 242.5 783
Total 19.62 2 6.51 24 358.06 332 49.83 2938 5.04 100 439.1 3396
Note: Each number of “Amt” represents the amount of disbursement in terms of current price. “EA” represents the number of cases provided.Source: OECD QWIDS (http://stats.oecd.org/qwids/popularqueries.html).
Korea provided 3,297 grants to recipient countries in Southeast Asia, as shown in Table 12. The average amount per grant was $49,000. Loans are distinct from grants. The loan provisions, particularly investment-related loans to developing countries, have been related to ODA “selection and focus principles.” As seen in column (3) of Table 12, South Korea provided large investments to both Indonesia and Vietnam in 2013. Comparing the size of concessional loans in column (2) with investments in (3), however, one can see that only Vietnam received both in large amounts, even though both countries have strong economic relationships with South Korea.
Table 13 shows the share of untied aid provided to Southeast Asian countries from donors. Most advanced donors reported a relatively high share of untied aid to total over 75 percent. Japan gave Myanmar a commitment of $4,862 million, 99 percent of it untied. In general, Japan was notorious for providing large amounts of tied aid to promote its firms. Based on Table 13, the share of its untied aid is much greater than other donors. South Korea still provides a large amount of tied aid: only 52.6 percent of Korean aid to Southeast Asia was untied in 2013. This is much lower than the figure for aid from Australia, which provided a similar dollar amount of aid for this region.

Kwak: South Korea’s Development Assistance | 169
Table 12. Finance Type of Korea’s Aid and Investment to Southeast Asia (2013) (Unit: $ million, ea)
Recipient
(1) Aid grant excluding debt reorganization
(2) Aid loan excluding debt reorganization
(3) Investment-related loan
to developing countries
(4) Loan to national private
investor
Total Amount Cases Total
Amount Cases Total Amount Cases Total
Amount Cases
Cambodia 32.63 810 31.21 13 27.65 1
Indonesia 24.28 430 14.89 17 770.74 4 77.2 3
Laos 13.33 344 13.79 7
Malaysia 0.14 15 5 1
Myanmar 14.8 242 0 8
Philippines 33.36 522 11.22 11 23.2 2
Thailand 3.34 130 49.2 3
Timor-Leste 3.6 64
Vietnam 35.95 740 206.51 43 1,035.10 6 10.5 3
Total 161.44 3,297 277.62 99 1,910.89 17 87.7 6
Thailand 3.34 130 49.2 3
Timor-Leste 3.6 64
Vietnam 35.95 740 206.51 43 1,035.10 6 10.5 3
Total 161.44 3,297 277.62 99 1,910.89 17 87.7 6
Note: Each number represents the amount of gross disbursement in terms of current price.Source: OECD QWIDS (http://stats.oecd.org/qwids/popularqueries.html).
In Southeast Asia, five types of financial assistance can be broadly distinguished: grants, interest subsidies, loans, equity, and debt relief (Table 14). The largest share of financial assistance is in the form of loans, which from all DAC donors total $8.04 billion. Japan and Korea account for approximately 93 percent of the total loans in this region. Japan is the largest provider of loans in Southeast Asia, and Korea is a far second in terms of size. In addition, Japan and France provided approximately $3.7 billion in debt relief. Australia’s grant-making was the largest, providing $1.18 billion for developing countries in Southeast Asia. Following Australia, Japan and the United States provided $0.83 and $0.77 billion dollars, respectively. Even though Korea’s total financial assistance to Southeast Asia was the second largest, it provided a very negligible $0.16 billion in grants in contrast to $2.27 billion in loans.

170 | Joint U.S.-Korea Academic Studies
The purposes of assistance differ greatly, as seen in the comparison of Korea and Australia in Table 15. Korea focused on industrial development and economic infrastructure, while Australia concentrated on social infrastructure and multi-sector development. Korea’s provision of ODA is much more likely to be directly related to economic activities than Australia’s. Most loans from Korea are related to investment used for production sector development.
In 2013, about 24.6 percent of total bilateral ODA was targeted to economic infrastructure and services development, with a sectoral focus on energy generation and supply (49.4 percent), road transport (31 percent), and communications (16.4 percent) in Vietnam and Indonesia (Table 16). In fact, the largest share of the total bilateral ODA provided to Southeast Asia was intended for industrial development. About 93.4 percent of the total bilateral ODA was targeted for this purpose in 2013. Only 4.5 percent of it was used for agricultural development in 2013. The main recipient countries were Vietnam and Indonesia; both have strong economic relationships with Korea.
Korea’s ODA and Economic Activities in Southeast Asia
Comparing Korea’s ODA and FDI trends can provide insight regarding whether Korea’s aid matches its economic interests. Figure 6 shows overall trends of Korea’s ODA and its FDI. ODA is relatively steadily increasing, while FDI has variability. However, it appears that both have strong, rising trends.
Table 13. Share of Untied Aid to Southeast Asia from Korea (2013) (Unit: $ million, %)
Korea Japan Australia United States
Commit-ment
Untied Share
Commit-ment
Untied Share
Commit-ment
Untied Share
Commit-ment
Untied Share
Cambodia 85.4 63.9% 245.2 79.7% 72.0 97.9% 73.2 71.4%
Indonesia 114.2 46.9% 606.9 81.7% 549.3 99.2% 689.2 89.9%
Laos 24.6 60.6% 160.2 75.8% 49.2 99.7% 8.4 70.8%
Malaysia 0.1 13.3% 11.1 6.3% 2.4 100.0% 4.0 72.6%
Myanmar 179.2 18.2% 4862.2 99.0% 70.0 98.3% 90.6 63.9%
Philippines 140.8 69.6% 865.0 17.4% 143.3 95.4% 190.3 55.8%
Thailand 3.3 18.5% 51.8 5.1% 6.2 100.0% 77.3 68.0%
Timor-Leste 12.5 92.8% 44.0 72.9% 108.6 98.4% 38.6 36.3%
Vietnam 264.6 64.3% 2432.8 75.9% 147.2 99.9% 107.7 61.1%
Total 824.7 52.8% 9279.2 82.5% 1148.1 98.6% 1279.3 76.3%
Source: OECD QWIDS (http://stats.oecd.org/qwids/popularqueries.html).

Kwak: South Korea’s Development Assistance | 171
Table 14. DAC Member’s Type of Financial Assistance in Southeast Asia (Unit: $ million, %)
Donor Grant Interest Subsidy Loan Equity Debt Relief
Australia 1186.0 24.33% 20.1 0.25% 0.0 0.00% 8.5 0.22%
Austria 4.9 0.10% 6.3 30.61% 0.0 0.00% 0.0 0.00% 34.9 0.91%
Belgium 35.2 0.72% 2.8 13.67% 17.7 0.22% 10.6 16.90% 2.5 0.07%
Canada 140.2 2.88% 0.0 0.00% 0.0 0.00% 0.0 0.00%
Denmark 80.6 1.65% 0.8 3.66% 0.0 0.00% 2.1 3.43% 52.6 1.37%
EU Institutions 292.2 6.00% 20.0 0.25% 0.0 0.00% 0.0 0.00%
Finland 43.4 0.89% 7.8 37.68% 0.0 0.00% 0.0 0.00% 0.0 0.00%
France 148.0 3.04% 252.5 3.14% 0.0 0.00% 588.6 15.3%
Germany 352.1 7.22% 140.1 1.74% 5.8 9.22% 0.0 0.00%
Greece 0.1 0.00% 0.0 0.00% 0.0 0.00% 0.0 0.00%
Ireland 24.8 0.51% 0.0 0.00% 0.0 0.00% 0.0 0.00%
Italy 12.5 0.26% 9.3 0.12% 0.0 0.00% 4.1 0.11%
Japan 828.0 16.99% 5295.5 65.87% 0.0 0.00% 3110.7 80.7%
Korea 161.4 3.31% 2276.2 28.31% 0.0 0.00% 0.0 0.00%
Luxembourg 33.4 0.68% 0.0 0.00% 0.0 0.00% 0.0 0.00%
Netherlands 51.3 1.05% 0.0 0.00% 0.0 0.00% 2.7 0.07%
New Zealand 44.9 0.92% 0.0 0.00% 0.0 0.00% 0.0 0.00%
Norway 123.8 2.54% 0.0 0.00% 21.3 33.99% 0.0 0.00%
Portugal 17.7 0.36% 0.0 0.00% 0.0 0.00% 0.0 0.00%
Spain 18.2 0.37% 3.4 0.04% 0.0 0.00% 0.0 0.00%
Sweden 120.9 2.48% 0.0 0.00% 0.0 0.00% 0.0 0.00%
Switzerland 114.6 2.35% 0.0 0.00% 11.5 18.40% 0.0 0.00%
United Kingdom 262.3 5.38% 3.0 14.37% 0.0 0.00% 11.3 18.06% 42.2 1.09%
United States 777.1 15.94% 5.0 0.06% 0.0 0.00% 4.4 0.11%
Total 4873.7 20.6 8039.8 62.6 3851.1
Note: 1. Each number represents the amount of gross disbursement in terms of current price. 2. 0.0 indicates a small number. 3. Loans include concessional loans, investment-related loan, and so on.Source: OECD QWIDS (http://stats.oecd.org/qwids/popularqueries.html).

172 | Joint U.S.-Korea Academic Studies
Among the priority partner countries of Korea,10 the level of correlation differs. First, for Cambodia and Indonesia, Korea’s FDI and ODA are very weakly related, with correlations respectively of 0.2208 and 0.2632. FDI to Laos and the Philippines recently recorded peaks around $1 billion before falling, though Korea’s aid for Laos is a negligible $20-30 million. With correlation coefficients of 0.6332 and 0.6160, respectively, they have a relatively strong linear relationship. However, since the size of the ODA is small compared to the FDI, it is hard to say that the ODA could have a strong relationship with the FDI. A unique case is Vietnam; both series show increasing trends, and the size of aid and FDI are also large. The correlation coefficient is 0.5202, which is not large. From these data, it is hard to observe that all of Korea’s aid is given to satisfy economic interests, which could be represented by FDI. Figure 7 shows the different aspects present in each trend.
Trade is another important economic indicator that is useful to explain the depth of bilateral economic relationships (Table 17). In Cambodia and Vietnam, strong correlations between Korea’s ODA and trade volume were found. Though Cambodia has a weak relationship with Korea in terms of FDI, it has a relatively strong correlation of 0.819 between trade and given
Table 15. Major Donors’ Allocation by Purpose in Southeast Asia (2013) (Unit: $ million)
Japan Korea Australia France United States DAC total
Action relating to debt
3110.70 8.48 589.17 4.40 3851.68
Administrative cost of donors
0.00 12.17 27.87
Commodity Aid and General Program Assistance
2581.07 7.77 0.77 1.28 2614.06
Economic Infrastructure
2221.81 599.21 95.80 106.44 85.63 3348.97
Humanitarian Aid 153.19 7.19 90.21 2.60 102.13 688.06
Multi-sector/Cross-cutting
95.89 9.57 231.57 22.26 25.11 494.39
Social Infrastructure
621.60 178.98 620.40 148.25 443.12 2917.27
Unallocated 0.00 33.54 15.18 6.60 3.93 150.57
Environment 232.04 23.97 38.44 62.60 97.25 579.35
Production 217.89 1585.19 71.56 38.28 23.64 2140.45
Total 9234.20 2437.65 1179.39 989.15 786.49 16812.67
Note: Each number represents the amount of gross disbursement in terms of current price.Source: OECD QWIDS (http://stats.oecd.org/qwids/popularqueries.html.

Kwak: South Korea’s Development Assistance | 173
Table 16. Korea’s Allocation by Purpose (2013) (Unit: $ million)
Country
Economic Infrastruc-
ture & Services
Humani-tarian
Aid
Multi-Sector
Social Infrastruc-
ture & Services
Unallo-cated
Environ-ment
Produc-tion
SectorTotal
Cambodia 23.85 0.1 1.80 33.68 0.33 0.05 32.0 91.83
Indonesia 148.73 0.2 0.11 22.55 27.66 2.52 685.0 886.8
Laos 8.75 1.66 14.86 1.9 27.17
Malaysia 0.015 0.077 5 0 5.09
Myanmar 2.17 0.038 1.08 5.47 0.53 0.011 5.5 14.82
Philippines 21.92 6.79 1.19 11.66 0.106 26.0 67.69
Thailand 11.73 2.31 0 0.16 38.0 52.21
Timor-Leste 0.52 1.06 1.86 0.064 0.1 3.61
Vietnam 381.51 0.054 2.65 86.48 21.04 796.0 1,288.0
Total 599.21 7.18 9.57 178.98 33.53 23.97 1,584.5 2,437
Note: Each number represents the amount of disbursement in terms of current price.Source: OECD QWIDS (http://stats.oecd.org/qwids/popularqueries.html).

174 | Joint U.S.-Korea Academic Studies

Kwak: South Korea’s Development Assistance | 175
Table 17. Bilateral Trade Volume with Korea and ODA (Unit: $ million)
Cambodia Indonesia Laos Philippines Vietnam
Trade ODA Trade ODA Trade ODA Trade ODA Trade ODA
2008 236.6 37.5 106.1 12.5 9048.7 57.6
2009 218.7 20.5 73.3 30.2 9054.1 69.1
2010 272.6 39.3 22.2 25.7 132.2 29.2 6283.5 31.1 12849.9 101.0
2011 347.4 61.8 30383.7 24.1 158.8 33.2 6911.8 35.4 18042.7 138.5
2012 482.6 56.2 27019.9 37.2 176.4 23.5 7604.5 31.3 21116.2 200.3
2013 469.6 58.1 23014.8 30.2 199.5 26.0 7600.8 41.0
Correlation 0.819 0.316 0.115 0.484 0.980
Source: KITA Korea trade data (http://stat.kita.net/stat/istat/asean) and OECD QWIDS (http://stats.oecd.org/qwids/popularqueries.html).
ODA. Vietnam also has a strong correlation of 0.98. Korea’s ODA decisions may be more determined by the information about bilateral trade volume than about FDI. As the size of FDI provided by South Korea is relatively small, the Korean government relies on the more accessible information about bilateral trade volume.
This is the pattern we find for Southeast Asia. The ratio of total aid for trade to total bilateral ODA remains around 0.35 to 0.40. Given that the Korean government increases the total bilateral ODA by 15.6 percent per year on average, aid for trade has a similar annual growth rate. The government focuses on support for transportation and storage, which are directly related to international trade. Given that South Korea provided $1.32 billion for bilateral ODA in 2013, about 40 percent of the total resources concentrated on aid for trade. Since South Korea has experienced economic development through international trade, it is an appropriate approach for it to provide aid for trade to developing countries.
Table 19 shows that the Korean government gives more aid for trade to LDCs and lower middle income country groups than to other income groups. The amount for LDCs increased about 2.5 times from 2009 to 2013. The average annual growth rate of total aid for trade was 16.5 percent, as the average annual growth rates for LDCs and LMICs were 26 percent and 20.8 percent respectively. The size of aid for trade to recipients in Southeast Asia increased about 2.7 times from 2009 to 2013. Its share of overall aid for trade changed from 30.3 percent in 2009 to 45.1 percent in 2013. The share of aid for trade for Southeast Asia is much greater than that for other regions. This may be related to the expansion of economic relations, particularly in trade volume rather than investment.
As seen in Table 19, most ODA is classified as aid for trade. Table 20 shows key sectors of Korean aid for trade to Southeast Asia. During the last five years the economic infrastructure sector comprised 83.5 percent of Korean aid for trade, and building capacity for production, especially in agriculture and fishing, had 11.7 percent. Most resources were used for

176 | Joint U.S.-Korea Academic Studies
construction of road transport and Information and Communication Technology (ICT). In order to contribute to economic development in developing countries in Southeast Asia, Korean ODA has to focus on building their trade capacity as well as their hardware. Korea has accumulated great experience in this sector, which is being shared with others. The role of the private sector and external factors such as low oil prices in the 1980s were very important in accomplishing economic growth in Korea, and it overcame many later difficulties such as the economic crises in 1997 and 2008. Korean small and medium enterprises (SMEs) have successfully been involved in global value chains (GVCs) relying on government support in the 1980s and 1990s, an experience that can be transmitted to developing countries.
ConclusionAlthough South Korea has a relatively short history as a donor, many foreign scholars and practitioners are interested in its ODA since it has experience as a recipient country. However, the literature of Korean ODA has been very limited because authors cannot access information on Korean ODA. This chapter has explored Korea’s ODA system, in particular its ODA to Southeast Asia. From the tables and figures describing its current ODA to this region, we find the following three main characteristics: first, Korean aid focuses on building
Table 18. Korea’s Aid for Trade (Unit: $ million)
2009 2010 2011 2012 2013 CAGR
Transport & Storage 107.4 134.4 240.1 222.4 246.1 23.0%
Communications 76.8 70.9 44.8 52.3 43.7 -13.2%
Energy 22.7 73.3 40.5 54.2 104.0 46.3%
Banking & Financial Services 0.9 2.1 1.5 1.5 1.4 10.2%
Business & Other Services 0.7 2.5 1.9 1.6 3.1 47.3%
Agriculture, Forestry, Fishing 48.9 53.3 56.7 72.0 96.2 18.4%
Industry 14.4 10.2 10.5 14.1 16.2 3.0%
Mineral Resources & Mining 0.4 1.2 1.3 0.7 1.1 27.1%
Construction 0.2 2.0 1.8 1.5 1.5 67.6%
Trade Policies & Regulations 10.2 2.1 7.3 8.0 7.8 -6.5%
Tourism 0.4 0.3 0.4 1.2 1.0 24.3%
Total Aid for Trade (a) 283.0 352.4 406.7 429.5 522.0 16.5%
Total Bilateral ODA (b) 739.4 981.7 1026.9 1232.2 1320.0 15.6%
(a)/(b) 0.38 0.36 0.40 0.35 0.40
Note: Net disbursement in terms of 2012 constant price.Source: OECD QWID(http://stats.oecd.org/qwids/popularqueries.html).

Kwak: South Korea’s Development Assistance | 177
Table 19. Aid for Trade Activities of South Korea (Unit: $ million, %)
Aid for Trade by Income Groups 2009 2010 2011 2012 2013
LDCs 82.2 140.1 200.2 183 207.5
OLICs 1.5 4.7 1.9 2.7 2.6
LMICs 130.1 174.1 194 214.6 276.8
UMICst 59.4 31.1 19.6 18 23.4
MADCT 0 0 0 0 0
Part I Unallocated by income 9.8 2.3 4.6 11.1 11.7
Total Aid for Trade to all bilateral recipients (a)
283 352.4 420.3 429.5 522
Recipients Only in Southeast Asia
Cambodia 8.7 21.7 35 21.7 26.8
Indonesia 17.7 13.9 9 14.4 12.8
Laos 5.4 5.6 10.5 7.9 10.2
Malaysia 0.2 0.3 0.3 0.2 0.1
Myanmar (Burma) 2.2 1.6 2.6 4.2 7.4
Philippines 24.1 25.9 25.2 19 23.8
Thailand 0.7 0.7 2.1 1.3 0.8
Timor-Leste 0.2 1.2 1.7 0.7 0.6
Vietnam 26.6 59.3 93.6 114.1 152.8
Total Aid for Trade to Southeast Asian recipients (b)
85.9 130.2 180.1 183.4 235.2
(b)/(a) 30.30% 37.00% 42.80% 42.70% 45.10%
Note: 1. Following DAC list of recipients, LDCs, OLICs, LMICs, UMICs, and MADCT represent Least Developed, Other Low Income, Low Middle Income, Upper Middle Income, More Advanced Developing Countries and Territories respectively. 2. Net disbursement in terms of 2012 constant price. 3. Bold typed countries are Korea’s priority partners.Source: OECD QWIDS (http://stats.oecd.org/qwids/popularqueries.html).

178 | Joint U.S.-Korea Academic Studies
economic infrastructure and production capacity including industrial development, which can be interpreted as aid for trade; second, relatively large project-type interventions were preferred; third, the share of tied aid is greater than that for other donors.
Furthermore, Korean ODA is dramatically increasing. To fulfill its promise to the international community to provide 0.25 percent of GNI to ODA, the Korean government has steadily expanded the scale of ODA. It has learned from advanced donors how to provide more effective international aid, but it is accused by the international community of only pursuing its own economic interests. ODA for Southeast Asia, excluding Vietnam, has little correlation with Korean investment decisions. Rather than investments, the amount of bilateral trade is a key determinant of Korean ODA provisions. However, given the fact that international trade can stimulate the economic growth of developing countries, it is not fair to say that Korean ODA narrowly pursues economic interests because the government steadily increases the share of aid for trade to Southeast Asia, as shown in Table 19. Moreover, Korean aid for trade focuses on building economic infrastructure and production capacity.
Although Korean ODA provided to Southeast Asia still has weaknesses compared with advanced donors’ ODA, Korea has made an effort to overcome them. First, the Korean
Table 20. Key Sectors of Korean Aid for Trade to Southeast Asia (Unit: $ million, %)
2009 2010 2011 2012 2013 Total
Transport & Storage 48.4 82.7 136.3 129.4 184.4581.3
(71.3%)
Communications 22.4 17.1 11.6 16.5 8.9 76.6 (9.4%)
Energy 0.0 7.5 3.0 3.5 2.2 16.3 (2%)
Banking & Financial Services 0.6 1.3 0.7 0.7 0.4 3.6 (0.45%)
Business & Other Services 0.1 0.9 0.7 0.4 0.5 2.6 (0.32%)
Agriculture, Forestry, Fishing
8.4 14.7 20.6 23.0 28.8 95.4 (11.7%)
Industry 5.7 4.6 5.5 7.5 8.3 31.6 (3.9%)
Mineral Resources & Mining 0.0 0.9 0.9 0.4 0.2 2.4 (0.29%)
Construction 0.0 0.2 0.2 0.2 0.3 0.8 (0.1%)
Trade Policies & Regulations 0.2 0.3 0.4 1.8 0.8 3.4 (0.42%)
Tourism 0.1 0.1 0.2 0.1 0.2 0.7 (0.08%)
Total 85.9 130.2 180.1 183.4 235.2814.8
(100%)
Note: 1. Gross disbursement in terms of current prices. 2. The number in ( ) represents its share.Source: OECD QWIDS (http://stats.oecd.org/qwids/popularqueries.html).

Kwak: South Korea’s Development Assistance | 179
government recognizes that support for humanitarian aid and cross-cutting purposes related to the basic subsistence sectors have to expand more than before. Recognition of weaknesses is a starting point to cure the problem. As developing countries in Southeast Asia achieve economic growth, their needs change from satisfying subsistence needs to enjoying increased well-being. Korean ODA should respond to these changes by supporting regional studies: Even though Southeast Asia has geographic proximity and cultural ties with Korea, there are few regional specialists on ASEAN.
Second, the Korean government also recognized that its ODA still has a large share of tied aid, as seen in Table 13. This is seen as a tool for the economic interests of donors, not for the reduction of poverty in recipient countries, because this form of aid limits accessibility for local firms to participate in the production process. Therefore, Korea and recipient countries have to think about a reasonable approach to make local SMEs involved in the production process. Furthermore, this evolution can create jobs and contribute to the development of recipient countries in Southeast Asia. In the near future, local firms may finally be involved in global value chains (GVCs).
Third, public awareness of the objectives of ODA is very limited in Korea. Though this problem does not directly affect Southeast Asia, it will determine the characteristics of Korean ODA in the long run. The Korean government has to clarify all the procedures of ODA and explain to its citizens the necessity of ODA for developing countries.
Endnotes1. Park Bok-young, “Gukje bigyo reul tonghan Hanguk ui wonjo mohyeong mosaek,” (paper
presented at ODA Watch Forum, 2007); Park Bok-young, “Wonjo mohyeong ui guke bigyo-wa sisajeom,” (Seoul: KIEP, Research report 7-7, 2007); You Wong-Jo. “Hanguk Gonjeokgaebalwonjo (ODA) Keongchaek-ui Seonggyeok-e-daehan Siljeung Bunseok,” Segye Chiyok Yongu Nonchong, 29, No. 1 (2011), pp. 33-58; Koo and Kim, “Sehye Sahoe-wa Gongjeokgaebalwonjo: Hanguk ODA Gyeoljeong Yoin Bunseok, 1989-2007,” Han’guk Sahoehak, Vol. 45, No. 1 (2011), pp. 153-90.
2. This was devised at the 7th meeting of the Committee for International Development Cooperation (CIDC) in October 2010 and clarified the basic framework: to take responsibility as a member of the DAC; to fulfill its commitment of scaling up the ODA volume; and to strengthen the integrated ODA system in accordance with the Framework Act.
3. The CPS will be revised every three to five years for better alignment with the national development plans of the partner country.
4. Park Bok-young, Hong-shik Lee, and Koo Jeong-woo, “JoongJeom Heopryupkuk seonjeong kijoon mit bangbeop e gwanhan yeongoo,” (Seoul: KIEP, ODA Jeongchaek report 13-03, 2013).
5. In 2008, one U.S. dollar was equivalent to 1,110.1 won. In 2009, it was equivalent to 1,273.9 won.6. Currently, due to the long-lasting recession after 2008, the Korean government seems to be
fatigued from the continuous increases in ODA to fulfill its promise that it will provide 0.25 percent of GNI for ODA by 2015.
7. An action plan specifies how to carry out the strategic plan for five years. It includes annual ODA scaling-up targets and ODA allocation guidelines by region and by income group.
8. Kang Young-Moon, “Hankuk ui ASEAN ODA wa tongsang jeongchaek e gwanhan yeongu,” Gwanse HakheoJi, Vol. 14, No. 2 (2013), pp. 251-267.
9. See Wonhyuk Lim’s chapter 9 on the Knowledge Sharing Program (KSP) in this publication.10. Korea’s priority partner countries in Southeast Asia are Cambodia, Indonesia, Laos, the
Philippines, and Vietnam.