Embed Size (px)
Citation preview
SOUTH KOREAPerspectives, trends and insightsAn independent report for National Australia Bank (NAB) prepared through the East Asian Bureau of Economic Research (EABER) in the Crawford School of Public Policy at The Australian National University.
Authors: Peter Drysdale and Adam Triggs
November 2017
CONTENT
Acknowledgements 2
Foreword 2
Executive Summary 3
1. Introduction 4
2. The South Korean Economy 6
2.1 Outlook 6
2.2 The structure of the South Korean economy 8
2.3 Financial markets 10
2.4 Economic challenges 12
2.5 Geopolitical risks 12
3. South Korea’s Trade and Investment Climate 14
4. The Deepening Integration of Australia and 16 South Korea
4.1 A deepening relationship in merchandise trade 16
4.2 Services trade growing faster than 17 merchandise trade
4.3 Investment growth between Australia and 18 South Korea
4.4 Political and people-to-people links 18
5. The Australia-Korea Free Trade Agreement 19
5.1 Agriculture and horticulture: the biggest winners from KAFTA 20
5.2 Mining and resources: the bright spots 22
5.3 Manufactured goods 23
5.4 Services: Exports of financial services up 24 500 per cent and growing
6. Conclusion 25
ACKNOWLEDGEMENTS
This paper was prepared through the East Asian Bureau of Economic Research (EABER) in the Crawford School of Public Policy at The Australian National University with the assistance of a research grant from the National Australia Bank (NAB). We would like to thank Melissa Gribble and her colleagues at NAB in Sydney and in Hong Kong and colleagues in EABER for very helpful comments and input into the development of its argument.
FOREWORD
Next year marks two important anniversaries: the 20th straight-year of economic growth in South Korea and the 55th anniversary of diplomatic relations between Australia and South Korea. By any standard, South Korea has achieved a remarkable track record of economic performance. The paper examines the positive outlook for the South Korean economy, its growing importance in the Asia Pacific region, its strong environment for trade and investment, the growing appeal of its financial markets and some of the key structural challenges and geopolitical risks it faces. It then explores the deepening integration between the Australian and South Korean economies, the benefits of the Korea-Australia Free Trade Agreement and the sectors and markets which are profiting most from this deepening relationship.
SOUTH KOREA: Perspectives, trends and insights 2
EXECUTIVE SUMMARY
•South Korea is forecast by the IMF to achieve its 20th straight year of economic growth in 2018. South Korea has consistently out-performed all other advanced economies and is now the fourth largest economy in Asia. In 1960, per capita income in South Korea was 5 per cent of that of the United States. By the time of the global financial crisis, it had increased to 55 per cent (IMF, 2016). Within two-decades, South Korea joined the OECD and is now Australia’s fourth largest trading partner, with two-way trade at A$29 billion.
• In 2016, S&P raised South Korea’s long-term credit rating to AA, with a stable outlook. South Korea has the highest credit rating in the region – including higher than both Japan and China. In its recent in-country consultations, the IMF has endorsed the resilience of the South Korean financial system. The South Korean government’s fiscal position is the envy of advanced economies. Its financial markets are increasingly popular among investors. Its currency – the won – is deep and actively traded. It runs a wide current account surplus and is now one of the world’s safe haven economies. South Korea’s economy and financial markets have proved resilient to the region’s geo-political risks.
•South Korea is Australia’s third largest export market, and our fourth largest two-way trading partner. The Korea-Australia free trade agreement (KAFTA) has set a course for a rapid deepening in this already large trading relationship. It carries exceptional growth opportunities for many sectors that were formally heavily protected, or in which there was discrimination against Australian imports, including agriculture, horticulture and key markets in manufacturing, mining and services. Australia’s agricultural exports to South Korea alone are projected to increase by 73 per cent by 2030.
•South Korea’s exports to Australia are diversified. Its primary exports to Australia, representing 35 per cent of the total, are passenger vehicles, refined petroleum, telecommunications equipment and heating and cooling equipment and parts. But the remaining 65 per cent of South Korea’s exports to Australia are spread across over 60 different industries.
• Like other advanced economies, South Korea faces a number of structural challenges, including a rapidly ageing population. But South Korea is much better placed than most — in terms of its fiscal position, its environment for investment, its relative ease of doing business and overall economic policy posture — to deal with them. Its negotiation of over 50 free trade agreements has advanced a vigorous strategy of liberalisation and economic reform.
•South Korea’s economic relationship with Australia has grown and diversified remarkably. Two-way trade has increased 7-fold since 1990. While iron ore and coal still account for around 60 per cent of Australian exports, resources which are at the core of South Korea’s economic security, rapidly growing agricultural exports and exports of services like tourism and education have broadened the export basket. KAFTA played a major role in securing equal access to key South Korean markets, such as beef and wine, and this trade is set to grow further as tariffs come down over the next decade and beyond.
•South Korea’s direct investment in Australia has jumped to A$23 billion and is growing 60 per cent faster than that from Australia’s other investment partners. Major Korean institutions have developed a significant Australian investment portfolio, and some Korean institutions, including Export Import Bank of Korea, The Korean Development Bank and Hyundai Capital Services, have issued A$5.3b of ‘kangaroo” bond issues since 2013, thus allowing investment from Australian and other global investors.
•South Korea faces well-known geo-political risks, mainly from North Korea. Historically the impact of these risks on South Korea have been muted. But recently there has been some increase in volatility in financial markets. Assessment of South Korea’s prospects in the longer term must also consider a range of scenarios under which re-unification with the North might occur.
•The geo-political risks associated with the North Korean threat to Northeast Asia underlines the importance of South Korea to Australia. This is not only because of the substantial ties that already exist between the two countries, but also because of South Korea’s role in East Asian economic integration through the participation of its major corporations in global value chains and the increasingly important role of its economy in services and financial markets.
Steve LambertExecutive General ManagerCorporate FinanceCorporate and Institutional BankingNational Australia Bank
3 SOUTH KOREA: Perspectives, trends and insights
1. INTRODUCTION
Although often overshadowed by the antics of its northern neighbour or the regional prominence of China and Japan, South Korea is forecast by the IMF to have its 20th straight-year of economic growth in 2018.
South Korea is Asia’s fourth-largest economy. By any standard, it has achieved a remarkable track record in its economic performance. One of the thirteen success stories identified by the Commission on Growth and Development (2008), South Korea embarked on, and adhered to, a government-guided export-promotion strategy that delivered average growth of over 7 per cent for nearly 15 years (IMF, 2016).
In 1960, per capita income in South Korea was around 5 per cent of that of the United States. By the time of the global financial crisis, it had increased to 55 per cent (IMF, 2016). Within two-decades, South Korea joined the OECD and saw its national corporate icons – such as Hyundai, Samsung, LG and Kia – become some of the world’s most recognisable brands. Politically, South Korea has undergone a huge transformation and has one of the most vibrant civic democracies in any country today, with a population of 50 million people.
Next year will also mark the 55th anniversary of diplomatic relations between South Korea and Australia. Over that time, the relationship between these two countries has deepened significantly. South Korea is Australia’s third largest export market, our fourth-largest two-way trading partner. In 1990, two-way trade between Australia and South Korea was around A$4 billion. Today it is over 7-times that at A$29 billion. While it is starting from a lower base, services trade between Australia and South Korea is growing 70 per cent faster than trade in merchandise.
Australia and South Korea share a similar background and positioning in the world. Both are competitive, market-based democracies with transparent and accountable governments. Both are middle powers which share a common strategic outlook, are multilaterally engaged and constructive citizens in international society. Both are strong allies of the United States, are committed to a stable and prosperous Asia-Pacific and actively promote the rules-based, international order.
The Australia-South Korea relationship is set to deepen significantly through KAFTA – the comprehensive free trade agreement between Australia and South Korea which entered into force in December 2014. KAFTA is forecast to increase Australia’s exports to South Korea by 25 per cent by 2030, over 73 per cent for Australia’s agricultural exports. Mining exports are forecast to increase by 17 per cent, manufacturing exports by 53 per cent.
This paper identifies some of the critical markets to watch. Beef is one of them. Beef exports to South Korea have doubled since 2011 and are forecast to double again by 2030. Australia’s dairy exports to South Korea are projected to triple by 2030. Pork, sheepmeat and goatmeat exports also stand as big winners from KAFTA.
Horticulture is another critical sector to watch – from potatoes, grapes and oranges to almonds, cherries and macadamia nuts – all will have their tariffs eliminated within 10 years under KAFTA. Exporters of natural gas stand to benefit on the resources front, as do exports of financial services and pharmaceuticals.
Cross-border investment is growing, too. The rate of South Korean investment in Australia is growing 60 per cent faster than the five-year average for other countries (DFAT, 2017). Politically, Australian and South Korean leaders of all political persuasions have voiced strong support for a deeper relationship. South Korea is the third largest source of working holiday visits to Australia with around 21,000 visits annually. With 150,000 South Koreans in Australia at any one time, these political and people-to-people links provide a critical foundation for increased economic ties into the future.
SOUTH KOREA: Perspectives, trends and insights 4
The paper details South Korea’s strong environment for business. South Korea ranks 5th in the world on the World Bank’s Ease of Doing Business indicators (World Bank, 2016). It performs better than the rest of the OECD in the majority of the services sectors covered by the OECD’s services trade restrictiveness index. The South Korean economy is diversified across multiple sectors and exports, its biggest being electronics, shipbuilding, automotive manufacturing and petrochemicals. South Korean markets for equities, bonds and foreign exchange have deepened greatly and are increasingly attractive to foreign investors.
In 2016, S&P raised South Korea’s long-term credit rating to AA, with a stable outlook, and the IMF has endorsed the resilience of the South Korean financial system (S&P, 2016; IMF, 2016). The South Korean government’s fiscal position is the envy of advanced economies. In the face of escalating tensions, the South Korean economy grew at a respectable 2.7 per cent year-on-year in the second quarter of 2017, largely on the back of strong investment.
South Korean Treasury bonds are currently trading in-line with US 10-year Treasury bond yields, after US Treasury yields recently rose as the market anticipates the US Federal reserve will shortly announce the start to its balance sheet unwind. Even though there has been an escalation in trading volatility, both the South Korean won and South Korean equity index (KOSPI) have managed to return to its calm state amidst the increasingly provocative actions from North Korea, and from a more aggressive US Administration. The KOSPI index is up 19 per cent year-to-date compared to a 17 per cent increase for the US S&P 500 index. Firms in KOSPI are expected to post earnings per share of 236.10 won in 2017, representing an 88 percent jump from last year and the highest profits since 2010, according to Bloomberg (2017).
With relatively robust South Korean exports, and the sound economic growth in the second quarter, the recent rise in the Korea 5-year CDS spreads can be largely attributable to rising political tensions with North Korea. The Korea 5-year CDS has risen to the highest levels in 12 months. However, the current levels are still well below highs that were observed in September 2015 and February 2016.
After almost two decades of growth, South Korea’s economy is facing structural challenges which need to be overcome. South Korea has ample resources to address these challenges, many of which are not unique to South Korea. These challenges include rising household debt, an ageing population, very high dependence on exports, labour-force participation challenges, weak productivity growth, slipping competitiveness and a patchy social safety net.
South Korea also faces unique geopolitical challenges. The South Korean economy and financial markets have shown remarkable resilience to geopolitical tensions with the North. South Korea also faces pressure from Beijing – including cuts to tourism and harassment of South Korean investors – for its decision to place the American THAAD anti-missile system in its territory. Like others, South Korea is dealing with a new United States Administration which appears determined to renegotiate the Korea-United States free trade agreement. And although it seems far away at the present juncture, South Korea could also face the cost of reunification with the North in the future, impacting both its fiscal position and its capacity to absorb increased migration (McKibbin et al, 2017).
The paper is structured as follows. Section 2 explores the outlook for the South Korean economy, its composition, growth sectors and the economic challenges and geopolitical risks that it faces. Section 3 looks more deeply at South Korea’s environment for business, investment and trade. Section 4 explores the deepening integration of Australia and South Korea in merchandise trade, services trade, investment, politics and people-to-people links. Section 5 explores the critical growth markets which are benefiting from the deepening relationship through KAFTA, regional developments and structural changes in both economies. Section 6 concludes with a summary.
5 SOUTH KOREA: Perspectives, trends and insights
2. THE SOUTH KOREAN ECONOMY
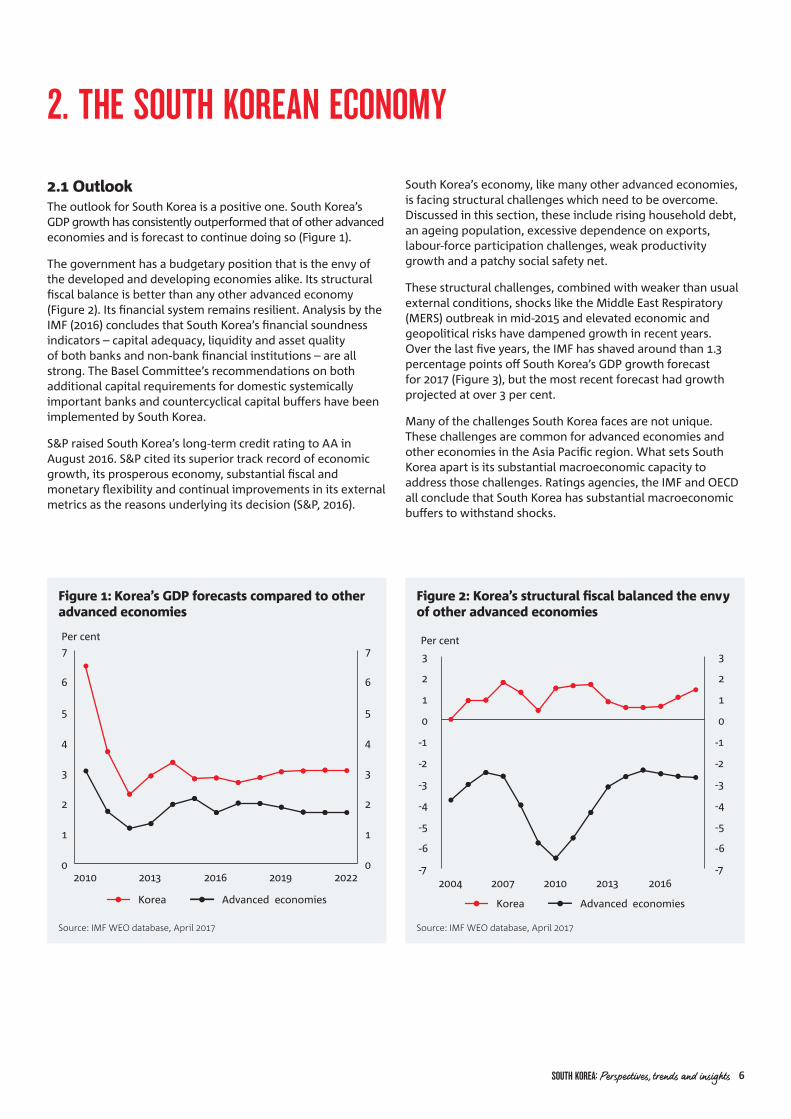
2.1 OutlookThe outlook for South Korea is a positive one. South Korea’s GDP growth has consistently outperformed that of other advanced economies and is forecast to continue doing so (Figure 1).
The government has a budgetary position that is the envy of the developed and developing economies alike. Its structural fiscal balance is better than any other advanced economy (Figure 2). Its financial system remains resilient. Analysis by the IMF (2016) concludes that South Korea’s financial soundness indicators – capital adequacy, liquidity and asset quality of both banks and non-bank financial institutions – are all strong. The Basel Committee’s recommendations on both additional capital requirements for domestic systemically important banks and countercyclical capital buffers have been implemented by South Korea.
S&P raised South Korea’s long-term credit rating to AA in August 2016. S&P cited its superior track record of economic growth, its prosperous economy, substantial fiscal and monetary flexibility and continual improvements in its external metrics as the reasons underlying its decision (S&P, 2016).
0
1
2
3
4
5
6
7
0
1
2
3
4
5
6
7
2010 2013 2016 2019 2022
Per cent
Korea Advanced economies
Figure 1: Korea’s GDP forecasts compared to other advanced economies
Source: IMF WEO database, April 2017
South Korea’s economy, like many other advanced economies, is facing structural challenges which need to be overcome. Discussed in this section, these include rising household debt, an ageing population, excessive dependence on exports, labour-force participation challenges, weak productivity growth and a patchy social safety net.
These structural challenges, combined with weaker than usual external conditions, shocks like the Middle East Respiratory (MERS) outbreak in mid-2015 and elevated economic and geopolitical risks have dampened growth in recent years. Over the last five years, the IMF has shaved around than 1.3 percentage points off South Korea’s GDP growth forecast for 2017 (Figure 3), but the most recent forecast had growth projected at over 3 per cent.
Many of the challenges South Korea faces are not unique. These challenges are common for advanced economies and other economies in the Asia Pacific region. What sets South Korea apart is its substantial macroeconomic capacity to address those challenges. Ratings agencies, the IMF and OECD all conclude that South Korea has substantial macroeconomic buffers to withstand shocks.
Source: IMF WEO database, April 2017
Korea Advanced economies
-7
-6
-5
-4
-3
-2
-1
0
1
2
3
-7
-6
-5
-4
-3
-2
-1
0
1
2
3
2004 2007 2010 2013 2016
Per cent
Figure 2: Korea’s structural �scal balanced the envy of other advanced economies
SOUTH KOREA: Perspectives, trends and insights 6
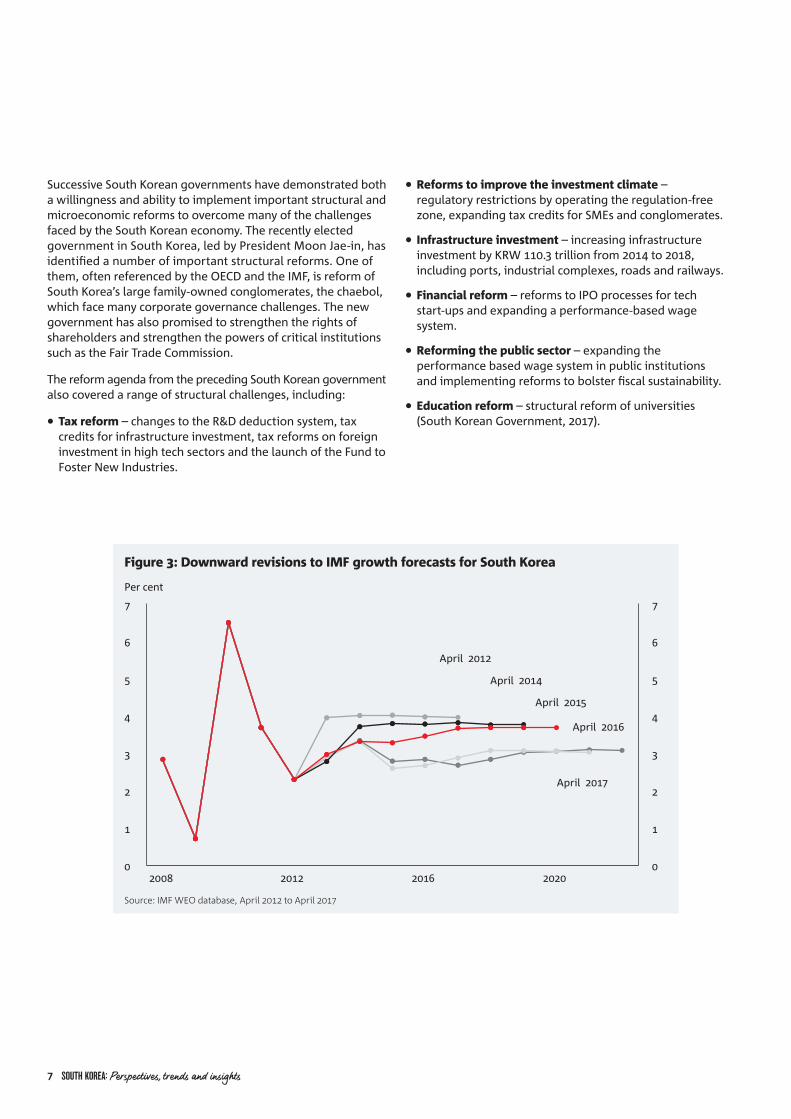
Figure 3: Downward revisions to IMF growth forecasts for South Korea
Source: IMF WEO database, April 2012 to April 2017
April 2017
April 2016
April 2014
April 2012
April 2015
0
1
2
3
4
5
6
7
2008 2012 2016 2020
Per cent
0
1
2
3
4
5
6
7
Successive South Korean governments have demonstrated both a willingness and ability to implement important structural and microeconomic reforms to overcome many of the challenges faced by the South Korean economy. The recently elected government in South Korea, led by President Moon Jae-in, has identified a number of important structural reforms. One of them, often referenced by the OECD and the IMF, is reform of South Korea’s large family-owned conglomerates, the chaebol, which face many corporate governance challenges. The new government has also promised to strengthen the rights of shareholders and strengthen the powers of critical institutions such as the Fair Trade Commission.
The reform agenda from the preceding South Korean government also covered a range of structural challenges, including:
•Tax reform – changes to the R&D deduction system, tax credits for infrastructure investment, tax reforms on foreign investment in high tech sectors and the launch of the Fund to Foster New Industries.
•Reforms to improve the investment climate – regulatory restrictions by operating the regulation-free zone, expanding tax credits for SMEs and conglomerates.
• Infrastructure investment – increasing infrastructure investment by KRW 110.3 trillion from 2014 to 2018, including ports, industrial complexes, roads and railways.
•Financial reform – reforms to IPO processes for tech start-ups and expanding a performance-based wage system.
•Reforming the public sector – expanding the performance based wage system in public institutions and implementing reforms to bolster fiscal sustainability.
•Education reform – structural reform of universities (South Korean Government, 2017).
7 SOUTH KOREA: Perspectives, trends and insights
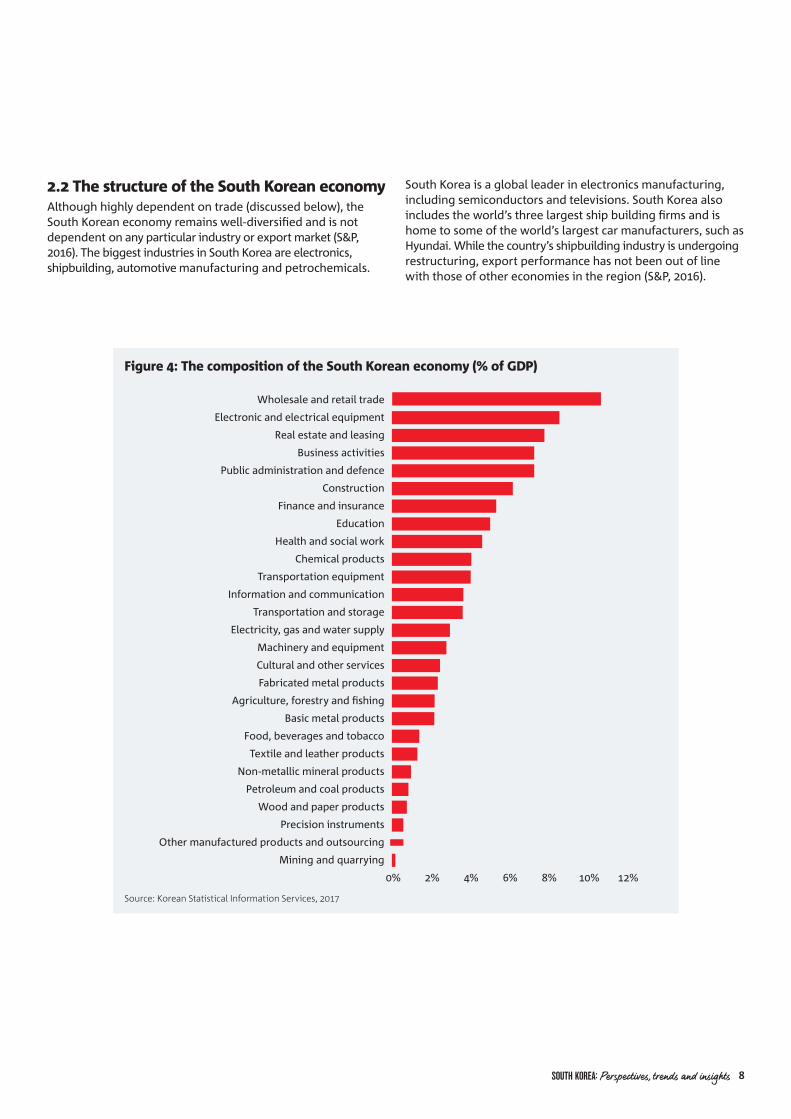
2.2 The structure of the South Korean economyAlthough highly dependent on trade (discussed below), the South Korean economy remains well-diversified and is not dependent on any particular industry or export market (S&P, 2016). The biggest industries in South Korea are electronics, shipbuilding, automotive manufacturing and petrochemicals.
Figure 4: The composition of the South Korean economy (% of GDP)
Source: Korean Statistical Information Services, 2017
0% 2% 4% 6% 8% 10% 12%
Mining and quarrying
Other manufactured products and outsourcing
Precision instruments
Wood and paper products
Petroleum and coal products
Non-metallic mineral products
Textile and leather products
Food, beverages and tobacco
Basic metal products
Agriculture, forestry and �shing
Fabricated metal products
Cultural and other services
Machinery and equipment
Electricity, gas and water supply
Transportation and storage
Information and communication
Transportation equipment
Chemical products
Health and social work
Education
Finance and insurance
Construction
Public administration and defence
Business activities
Real estate and leasing
Electronic and electrical equipment
Wholesale and retail trade
South Korea is a global leader in electronics manufacturing, including semiconductors and televisions. South Korea also includes the world’s three largest ship building firms and is home to some of the world’s largest car manufacturers, such as Hyundai. While the country’s shipbuilding industry is undergoing restructuring, export performance has not been out of line with those of other economies in the region (S&P, 2016).
SOUTH KOREA: Perspectives, trends and insights 8
Despite reform efforts, South Korea’s economy remains heavily reliant on trade. Exports represent 42 per cent of the South Korean economy. This is high compared to the OECD average of 28 per cent.
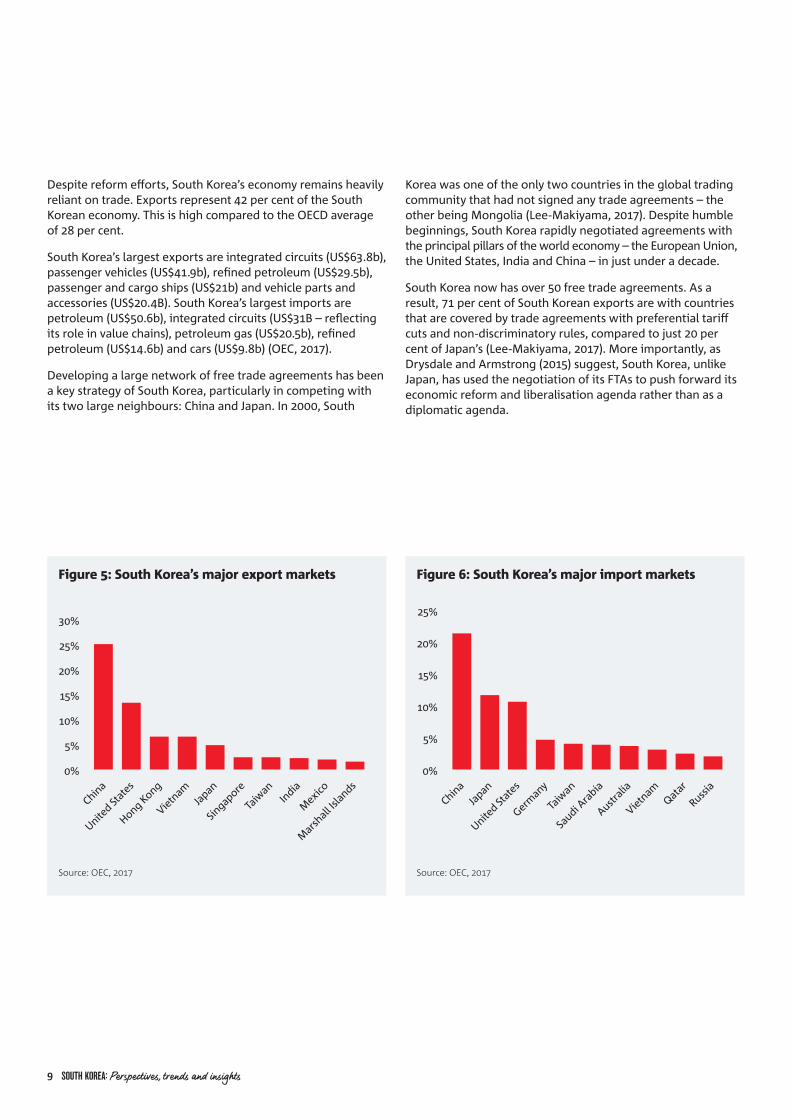
South Korea’s largest exports are integrated circuits (US$63.8b), passenger vehicles (US$41.9b), refined petroleum (US$29.5b), passenger and cargo ships (US$21b) and vehicle parts and accessories (US$20.4B). South Korea’s largest imports are petroleum (US$50.6b), integrated circuits (US$31B – reflecting its role in value chains), petroleum gas (US$20.5b), refined petroleum (US$14.6b) and cars (US$9.8b) (OEC, 2017).
Developing a large network of free trade agreements has been a key strategy of South Korea, particularly in competing with its two large neighbours: China and Japan. In 2000, South
Korea was one of the only two countries in the global trading community that had not signed any trade agreements – the other being Mongolia (Lee-Makiyama, 2017). Despite humble beginnings, South Korea rapidly negotiated agreements with the principal pillars of the world economy – the European Union, the United States, India and China – in just under a decade.
South Korea now has over 50 free trade agreements. As a result, 71 per cent of South Korean exports are with countries that are covered by trade agreements with preferential tariff cuts and non-discriminatory rules, compared to just 20 per cent of Japan’s (Lee-Makiyama, 2017). More importantly, as Drysdale and Armstrong (2015) suggest, South Korea, unlike Japan, has used the negotiation of its FTAs to push forward its economic reform and liberalisation agenda rather than as a diplomatic agenda.
Figure 5: South Korea’s major export markets
Source: OEC, 2017
0%
China
United S
tate
s
Hong Kong
Vietnam
Japan
Singap
ore
Taiw
anIn
dia
Mex
ico
Mar
shall
Islan
ds
5%
10%
15%
20%
25%
30%
Figure 6: South Korea’s major import markets
Source: OEC, 2017
China
Japan
United S
tate
s
Germ
any
Taiw
an
Saudi A
rabia
Australi
a
Vietnam
Qatar
Russia
0%
5%
10%
15%
20%
25%
9 SOUTH KOREA: Perspectives, trends and insights
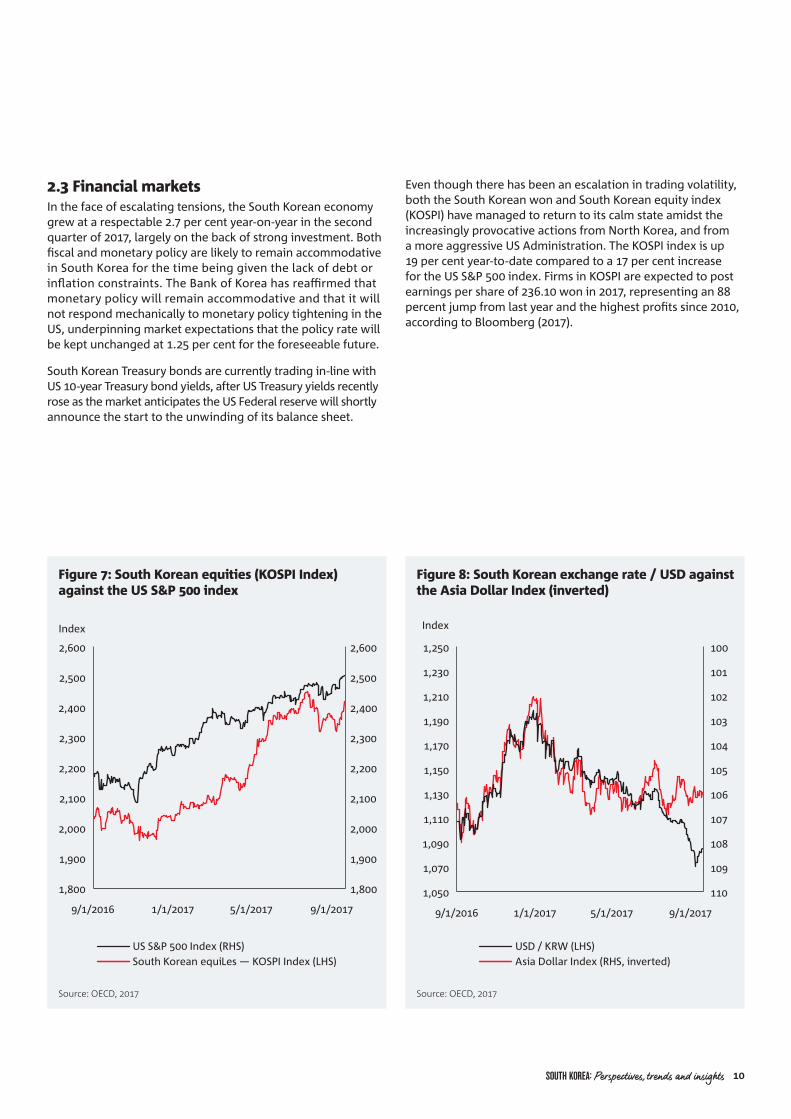
2.3 Financial marketsIn the face of escalating tensions, the South Korean economy grew at a respectable 2.7 per cent year-on-year in the second quarter of 2017, largely on the back of strong investment. Both fiscal and monetary policy are likely to remain accommodative in South Korea for the time being given the lack of debt or inflation constraints. The Bank of Korea has reaffirmed that monetary policy will remain accommodative and that it will not respond mechanically to monetary policy tightening in the US, underpinning market expectations that the policy rate will be kept unchanged at 1.25 per cent for the foreseeable future.
South Korean Treasury bonds are currently trading in-line with US 10-year Treasury bond yields, after US Treasury yields recently rose as the market anticipates the US Federal reserve will shortly announce the start to the unwinding of its balance sheet.
Figure 7: South Korean equities (KOSPI Index) against the US S&P 500 index
Source: OECD, 2017
1,800
1,900
2,000
2,100
2,200
2,300
2,400
2,500
2,600
1,800
1,900
2,000
2,100
2,200
2,300
2,400
2,500
2,600
9/1/2016 1/1/2017 5/1/2017 9/1/2017
Index
US S&P 500 Index (RHS)South Korean equiLes — KOSPI Index (LHS)
Figure 8: South Korean exchange rate / USD against the Asia Dollar Index (inverted)
Source: OECD, 2017
USD / KRW (LHS)Asia Dollar Index (RHS, inverted)
1,050
1,070
1,090
1,110
1,130
1,150
1,170
1,190
1,210
1,230
1,250
9/1/2016 1/1/2017 5/1/2017 9/1/2017
Index
110
109
108
107
106
105
104
103
102
101
100
Even though there has been an escalation in trading volatility, both the South Korean won and South Korean equity index (KOSPI) have managed to return to its calm state amidst the increasingly provocative actions from North Korea, and from a more aggressive US Administration. The KOSPI index is up 19 per cent year-to-date compared to a 17 per cent increase for the US S&P 500 index. Firms in KOSPI are expected to post earnings per share of 236.10 won in 2017, representing an 88 percent jump from last year and the highest profits since 2010, according to Bloomberg (2017).
SOUTH KOREA: Perspectives, trends and insights 10
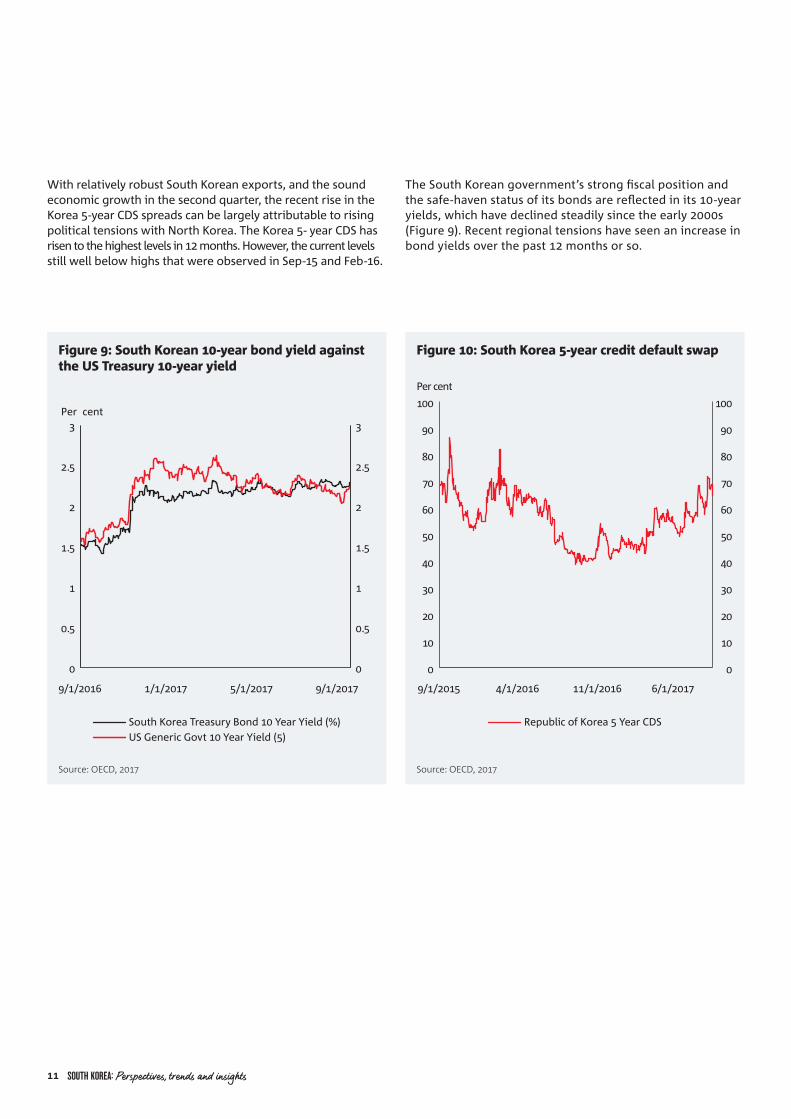
Figure 9: South Korean 10-year bond yield against the US Treasury 10-year yield
Source: OECD, 2017
South Korea Treasury Bond 10 Year Yield (%)US Generic Govt 10 Year Yield (5)
9/1/2016 1/1/2017 5/1/2017 9/1/2017
0
0.5
1
1.5
2
2.5
3
0
0.5
1
1.5
2
2.5
3Per cent
Figure 10: South Korea 5-year credit default swap
Source: OECD, 2017
Republic of Korea 5 Year CDS
9/1/2015 4/1/2016 11/1/2016 6/1/2017
0
10
20
30
40
50
60
70
80
90
100
0
10
20
30
40
50
60
70
80
90
100
Per cent
With relatively robust South Korean exports, and the sound economic growth in the second quarter, the recent rise in the Korea 5-year CDS spreads can be largely attributable to rising political tensions with North Korea. The Korea 5- year CDS has risen to the highest levels in 12 months. However, the current levels still well below highs that were observed in Sep-15 and Feb-16.
The South Korean government’s strong fiscal position and the safe-haven status of its bonds are reflected in its 10-year yields, which have declined steadily since the early 2000s (Figure 9). Recent regional tensions have seen an increase in bond yields over the past 12 months or so.
11 SOUTH KOREA: Perspectives, trends and insights
2.4 Economic challengesHousehold debt in South Korea is more than 170 per cent as a percentage of household disposable income (OECD, 2017). This is well-above average for OECD economies (131 per cent) although still lower than in Australia (190 per cent). It represents both a short-term vulnerability, with possible risks to financial stability, and a structural issue, insofar as high debt can depress households’ propensity to consume and dampen medium-term growth (IMF, 2016).
Prices in South Korea’s property market have risen significantly in recent years. Policies implemented since early 2016 to stabilise prices appear to be having an impact – including more stringent bank screening of applications and tighter loan-to-value limits on nonbanks’ non-residential mortgages – but both the IMF and OECD warn that more effort is likely required.
The South Korean economy faces several longer-term structural challenges. Mentioned earlier, its economy remains highly dependent on exports. Its exports represent 42 per cent of its GDP, one of the highest shares among advanced economies. This makes South Korea exposed to spillovers, particularly from China, a country which is experiencing slowing growth and a process of major financial reform (IMF, 2016). China is also retaliating against South Korea’s decision to put anti-missile defence systems on its territory (discussed in the next section).
The vulnerability of South Korea’s economy to Chinese shocks was highlighted by the strong capital outflows from its economy following the ‘RMB tantrum’ in anticipation of increased interest rates from the United States Federal Reserve (see IMF, 2016). This required South Korean authorities to sell-off foreign exchange reserves to stabilise markets. The Brexit decision similarly resulted in sharp initial losses in South Korean equities. This dependence makes South Korea more vulnerable than most to a hard-landing in China. A faster than expected move up the value chain by China would also generate significant competition for South Korea in many of its key industries and exports (IMF, 2016).
South Korea, like many advanced economies, also faces demographic challenges from an ageing population. South Korea is one of the world’s most rapidly ageing societies and fiscal outlays are expected to increase sharply over the medium-term (IMF, 2016). The fraction of the population that is of working age is projected to peak in 2017 and decline rapidly thereafter. This will have significant implications for South Korean consumption, savings, investment and its fiscal position.
South Korea, like others in the region, also faces a growing productivity challenge. Labour productivity is much lower in its services sectors than is the case for other OECD economies. This in part reflects high regulatory barriers in South Korea to services competition, discussed in detail in the next section, and presents significant opportunity for high pay-off from continuing policy reform.
Finally, South Korea faces structural challenges in its labour markets and in its social protection system. Labour force participation rates, particularly female participation, is much lower in South Korea compared to the OECD average (IMF, 2016). South Korea has also struggled to build a comprehensive social safety net. It spends just 10 per cent of GDP on social welfare spending, less than half the OECD average, which is distorting the economy through increased precautionary savings which depress consumption and growth, distort savings-investment decisions and promote external imbalances (IMF, 2016).
2.5 Geopolitical risksIncreased tensions with North KoreaSouth Korea’s primary geopolitical risk is well known. North Korea has become increasingly aggressive in recent years in both its rhetoric and its testing of inter-continental ballistic missiles and nuclear weapons. The new United States administration is perceived to have acted to stoke these tensions more than reduce them.
While the impact of all-out-conflict would be catastrophic for South Korea – resulting in the deaths of millions and the destruction of a substantial portion of its capital stock – the impact of the North’s threats on the South Korean economy has historically been comparatively muted. This appears to have changed in recent years. The recent elevation in tensions has had a greater impact on South Korea’s equity and foreign exchange markets, but also on investor confidence, than has been the case in the past.
President Trump’s recent remarks threatening ‘fire and fury’ for the North Koreans, for example, rattled South Korean markets. The KOSPI index dropped 1.1 per cent at the close in Seoul, though trading was about 20 per cent lower than the 30-day average. The won weakened 0.9 per cent against the dollar and the yield on the benchmark 10-year government bond rose to the highest since it was issued in March. The KOSPI 200 volatility index jumped as much as 30 per cent, while the cost of insuring five-year sovereign bonds from non-payment rose to 60.75 basis points, set for the highest close in about a month, according to pricing at Nomura Holdings Inc (Teso and Kim, 2017).
A significant risk is if these tensions result in a withdrawal of direct investment. Although only anecdotal at this stage, General Motors at an earlier time warned that it was making contingency plans for employee safety at its South Korean plants and that further increases in tensions would prompt it to consider moving production elsewhere (Sang-Hun, 2013).
Ratings agencies have largely discounted rising geopolitical risks on the South Korean peninsula, citing South Korea’s substantial macroeconomic buffers to withstand shocks. S&P noted in August 2016 when it raised South Korea’s long-term rating to AA that ‘the stable outlook on the long-term rating reflects our expectations that geopolitical risks on the Korean peninsula will not escalate beyond what we have observed since the last [North South Korean] leadership transition in 2011’ (S&P, August 2016).
SOUTH KOREA: Perspectives, trends and insights 12
The costs of reunificationWhile tensions and conflict can have substantial implications for the South Korean economy, so too could peace. Recent general equilibrium analysis by Warwick McKibbin, Jong Wha Lee, Weifeng Liu and Cheol Jong Song showed what the costs and benefits of reunification would be under 3 different scenarios.
The first scenario is where North Korea follows a similar path to China in gradually opening to the world economy through market-oriented economic reform, accompanied by gradual reunification between the two South Koreas. Although this seems unlikely under present conditions, this scenario sees substantial economic growth in North Korea. The North Korean economy grows at between 10 and 15 per cent each year to be 400 per cent bigger by 2040 (McKibbin et al, 2017).
The impacts of this scenario on the South Korean economy depend in large part on what role the South chooses to play in helping the North. If South Korea provides financial aid throughout this process equal to 1.5 per cent of GDP, the impact on South Korea is to have GDP 0.2 per cent lower by 2018, 0.5 per cent smaller by 2030 and 0.6 per cent smaller by 2040. This is the result of reduced investment and consumption as the financial aid is taken from the supply-side of the South Korean economy and given to the North.
The second scenario is where North Korea collapses and there is immediate reunification between North and South. This scenario assumes even larger fiscal transfers from the South to the North but also includes an inflow of migrants moving from North to South Korea equal to 0.5 per cent of the North Korean population every year, or 0.25 per cent of the two South Korea’s total population.
The medium-term impact of this scenario is positive. The inflow of migrants raises potential output in South Korea. Real GDP, consumption and investment gradually decline, reflecting the fiscal transfers from South to North, and the trade balance improves as financial flows from South to North depreciate the won. Overall, South Korean real GDP is 0.25 per cent smaller in 2018 but is positive from 2018 onwards reflecting higher potential output from migrant inflows.
Finally, the third scenario is one of chaos in the North which also triggers a crisis of confidence in South Korea. This involves a loss of confidence in the ability of the South Korea government to manage unification and the impact on its economy. This is modelled as a sharp jump in the country risk premium of South Korea of 1000 basis points (10 percentage points) in 2017 followed by a gradual decline by 100 basis points per year to zero by 2027. The initial jump is of a similar magnitude to the Asia Financial crisis in 1997/98. The fiscal transfers from South Korea to North Korea and the migrants moving from North to South Korea are assumed to be the same as in the managed chaos case.
The model shows that a loss of confidence in South Korea leads to capital outflow from South Korea, an increase in real interest rates and a collapse in private investment. South Korea enters recession and the won depreciates by 14 per cent in real effective terms. The falls in real GDP are significant. GDP is 5 per
cent lower in 2018 and remains below the baseline until 2025.
The work by McKibbin et al (2017) on South Korean reunification is pertinent when thinking about the longer-term prospects of the South Korean economy and the importance of it maintaining its substantial fiscal, monetary and structural buffers. Most experts at this stage consider that the status quo will likely prevail into the near future (see Costello, 2017, for example).
Other risks: Domestic politics, China opposition to missile defence, revisions to KORUSThe recent South Korean election has been described as a tectonic event in East Asian policy (Costello, 2017). This is only the second conservative-to- progressive power shift in South Korea’s modern history. The impeachment of Park Guen-hye and the snap election that followed has influenced the South Korean economy, although this effect appears to have now passed. The OECD has noted that the political uncertainty flowing from these events acted, along with other factors, to dampen consumer confidence, pushing it to its lowest level since 2008 (OECD, 2017).
It will take several months for the new government to staff its ministries and assume all controls over the levers of government. President Moon Jae-in’s government has the potential to bring significant change to South Korea and East Asia more broadly. Many experts predict this election result could mark a return to the social, institutional and democratic modernisation that begun with the previous conservative-to-progressive change 20 years ago when Kim Dae Jung was elected (Costello, 2017).
A critical geopolitical risk, given the significant role China plays in the South Korean economy, relates to South Korea’s decision to deploy a missile defence system on its territory. This defence system – called THAAD – has the potential to shoot-down missiles from the North. China has reacted strongly given the system’s potential to also to threaten Chinese defence systems.
China retaliated by hampering sales of South Korean consumer products and cultural goods. It also banned Chinese tour groups to South Korea (OECD, 2017). South Korea’s Lotte department stores based in China were targeted by China. Up to 80 per cent of the stores in China were closed for supposed ‘fire and safety reasons’ which many speculate was part of the broader retaliation for the missile defence system (Stangarone, 2017). The Bank of South Korea has warned that China’s overall retaliation could lower GDP growth in South Korea by up to 0.2 percentage points.
Finally, the new administration in the United States poses risks over and above what top US analysts have described as a ‘reckless strategy towards North Korea’. The Trump White House has been highly critical of the South Korea-US free trade agreement. President Trump has suggested a new deal will be negotiated. President Moon has rejected this. The United States has announced that a special joint committee will be formed to renegotiate the deal. South Korea has noted the creation of this committee and hopes it will be used to analyse the impact of the agreement on both countries.
13 SOUTH KOREA: Perspectives, trends and insights
3. SOUTH KOREA’S TRADE AND INVESTMENT CLIMATE
South Korea underwent a remarkable transition from dictatorship and authoritarianism to one of the most vibrant civic democracies of any country today.
S&P’s most recent assessment of South Korea was to raise its long-term credit rating from AA- to AA with a stable outlook while maintaining the short-term rating at A-1+. These ratings reflected South Korea’s favourable policy environment, sound fiscal position and net external creditor position. Even though South Korea’s GDP growth has been slower than what it was before the global financial crisis, S&P believes its prospects are superior to those of most developed economies.
South Korea has a strong policy environment. Its monetary policy regime provides strong support for resilient and sustainable economic growth. Its banking sector turned to a net external creditor position in 2015. The South Korean won is a deep and actively traded currency and South Korea runs consistent and wide current account surpluses. The government’s healthy fiscal position offers further support for the sovereign’s creditworthiness (S&P, 2016).
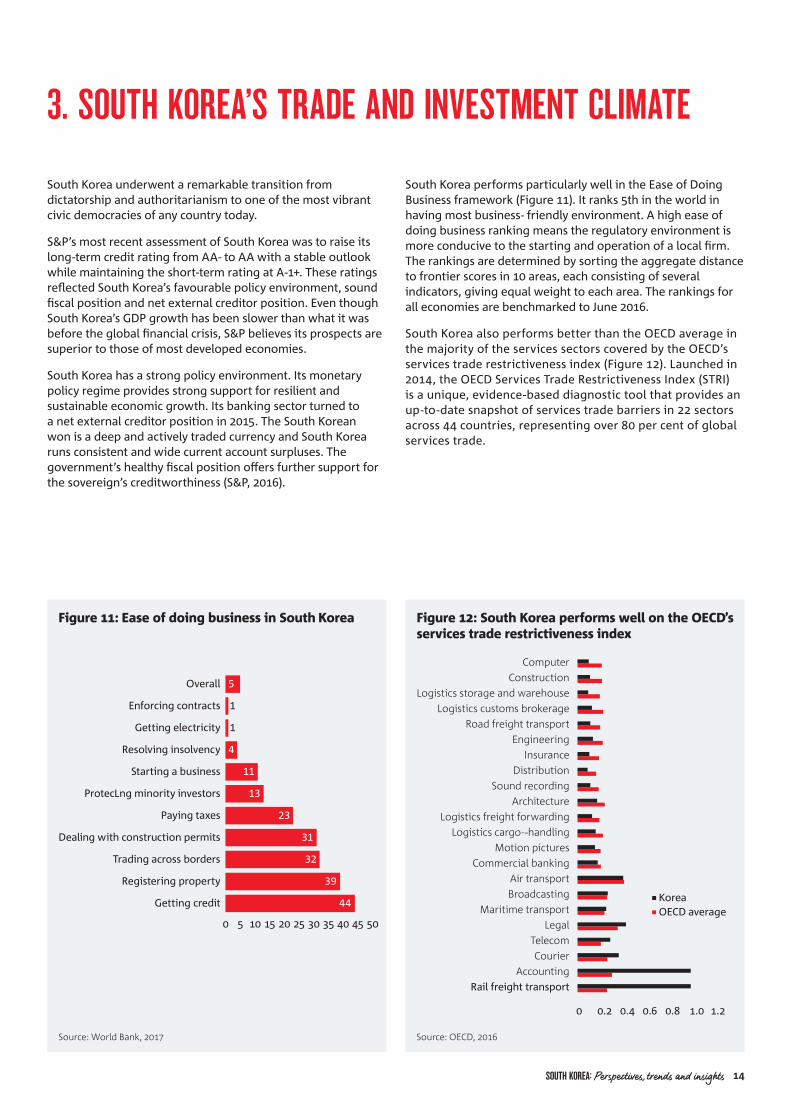
South Korea performs particularly well in the Ease of Doing Business framework (Figure 11). It ranks 5th in the world in having most business- friendly environment. A high ease of doing business ranking means the regulatory environment is more conducive to the starting and operation of a local firm. The rankings are determined by sorting the aggregate distance to frontier scores in 10 areas, each consisting of several indicators, giving equal weight to each area. The rankings for all economies are benchmarked to June 2016.
South Korea also performs better than the OECD average in the majority of the services sectors covered by the OECD’s services trade restrictiveness index (Figure 12). Launched in 2014, the OECD Services Trade Restrictiveness Index (STRI) is a unique, evidence-based diagnostic tool that provides an up-to-date snapshot of services trade barriers in 22 sectors across 44 countries, representing over 80 per cent of global services trade.
Figure 11: Ease of doing business in South Korea
Source: World Bank, 2017
Getting credit
Registering property
Trading across borders
Dealing with construction permits
Paying taxes
ProtecLng minority investors
Starting a business
Resolving insolvency
Getting electricity
Enforcing contracts
0 5 10 15 20 25 30 35 40 45 50
Overall 5
4
11
13
23
31
32
39
44
1
1
Figure 12: South Korea performs well on the OECD’s services trade restrictiveness index
Source: OECD, 2016
0 0.2 0.4 0.6 0.8 1.0 1.2
Rail freight transportAccounting
CourierTelecom
LegalMaritime transport
BroadcastingAir transport
Commercial bankingMotion pictures
Logistics cargo--handlingLogistics freight forwarding
ArchitectureSound recording
DistributionInsurance
EngineeringRoad freight transport
Logistics customs brokerageLogistics storage and warehouse
ConstructionComputer
KoreaOECD average
SOUTH KOREA: Perspectives, trends and insights 14
Compared to the OECD average, South Korea performs particularly well in computer and construction services, logistics and transportation, engineering, insurance and commercial banking. South Korea performs less well in some of the other professional services, namely accounting, legal and telecommunications, including some specific areas of transportation which remain the subject of relatively strong domestic protections.
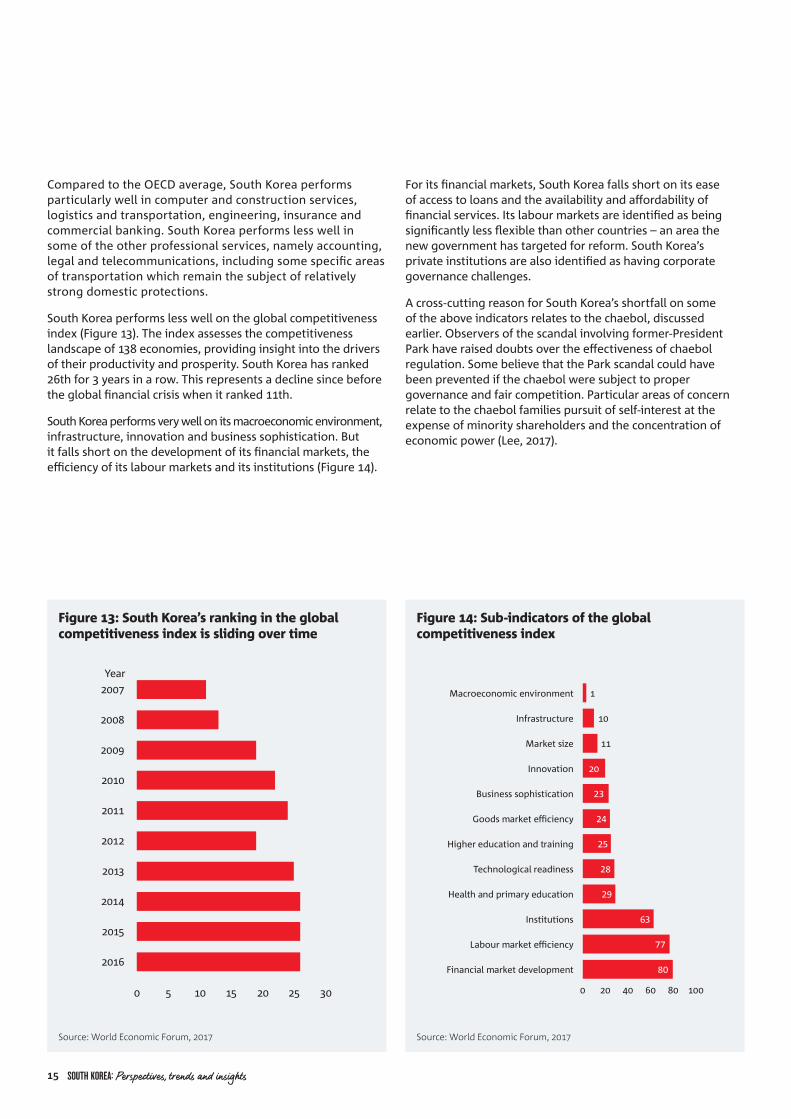
South Korea performs less well on the global competitiveness index (Figure 13). The index assesses the competitiveness landscape of 138 economies, providing insight into the drivers of their productivity and prosperity. South Korea has ranked 26th for 3 years in a row. This represents a decline since before the global financial crisis when it ranked 11th.
South Korea performs very well on its macroeconomic environment, infrastructure, innovation and business sophistication. But it falls short on the development of its financial markets, the efficiency of its labour markets and its institutions (Figure 14).
For its financial markets, South Korea falls short on its ease of access to loans and the availability and affordability of financial services. Its labour markets are identified as being significantly less flexible than other countries – an area the new government has targeted for reform. South Korea’s private institutions are also identified as having corporate governance challenges.
A cross-cutting reason for South Korea’s shortfall on some of the above indicators relates to the chaebol, discussed earlier. Observers of the scandal involving former-President Park have raised doubts over the effectiveness of chaebol regulation. Some believe that the Park scandal could have been prevented if the chaebol were subject to proper governance and fair competition. Particular areas of concern relate to the chaebol families pursuit of self-interest at the expense of minority shareholders and the concentration of economic power (Lee, 2017).
Figure 13: South Korea’s ranking in the global competitiveness index is sliding over time
Source: World Economic Forum, 2017
0 5 10 15 20 25 30
2016
2015
2014
2013
2012
2011
2010
2009
2008
2007
Year
Figure 14: Sub-indicators of the global competitiveness index
Source: World Economic Forum, 2017
20
23
24
25
28
29
63
77
80
11
10
1
0 20 40 60 80 100
Financial market development
Labour market e�ciency
Institutions
Health and primary education
Technological readiness
Higher education and training
Goods market e�ciency
Business sophistication
Innovation
Market size
Infrastructure
Macroeconomic environment
15 SOUTH KOREA: Perspectives, trends and insights
4. THE DEEPENING INTEGRATION OF AUSTRALIA AND SOUTH KOREA
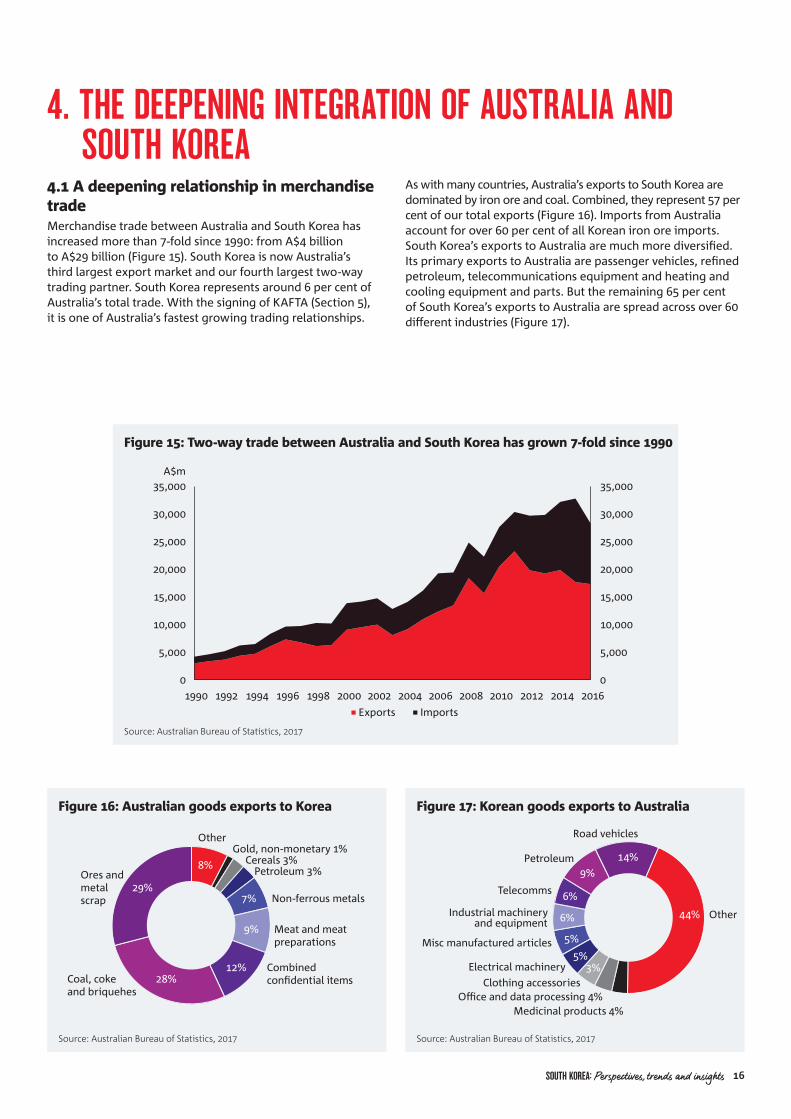
4.1 A deepening relationship in merchandise tradeMerchandise trade between Australia and South Korea has increased more than 7-fold since 1990: from A$4 billion to A$29 billion (Figure 15). South Korea is now Australia’s third largest export market and our fourth largest two-way trading partner. South Korea represents around 6 per cent of Australia’s total trade. With the signing of KAFTA (Section 5), it is one of Australia’s fastest growing trading relationships.
Figure 15: Two-way trade between Australia and South Korea has grown 7-fold since 1990
Source: Australian Bureau of Statistics, 2017
0
5,000
10,000
15,000
20,000
25,000
30,000
35,000
0
5,000
10,000
15,000
20,000
25,000
30,000
35,000
1990 1992 1994 1996 1998 2000 2002 2004 2006 2008 2010 2012 2014 2016
A$m
Exports Imports
Figure 16: Australian goods exports to Korea
Source: Australian Bureau of Statistics, 2017
Ores and metal scrap
OtherGold, non-monetary 1%
Cereals 3%Petroleum 3%
Non-ferrous metals
Meat and meat preparations
Combined con�dential itemsCoal, coke
and briquehes
29%
28%12%
9%
7%
8%
Figure 17: Korean goods exports to Australia
Source: Australian Bureau of Statistics, 2017
Road vehicles
Other
Misc manufactured articles
Electrical machineryClothing accessories
O�ce and data processing 4% Medicinal products 4%
14%Petroleum9%
Telecomms
Industrial machineryand equipment
6%
6%
5%
5%3%
44%
As with many countries, Australia’s exports to South Korea are dominated by iron ore and coal. Combined, they represent 57 per cent of our total exports (Figure 16). Imports from Australia account for over 60 per cent of all Korean iron ore imports. South Korea’s exports to Australia are much more diversified. Its primary exports to Australia are passenger vehicles, refined petroleum, telecommunications equipment and heating and cooling equipment and parts. But the remaining 65 per cent of South Korea’s exports to Australia are spread across over 60 different industries (Figure 17).
SOUTH KOREA: Perspectives, trends and insights 16
The merchandise trading relationship between Australia and South Korea is shifting in important ways, as discussed in detail in Section 5. The shares of Australian exports of coal and iron ore are declining, consistent with global trends and the broader drop-off in the Australian mining investment boom, while agriculture, horticulture and specific industries in mining, resources, manufacturing and services are growing rapidly.
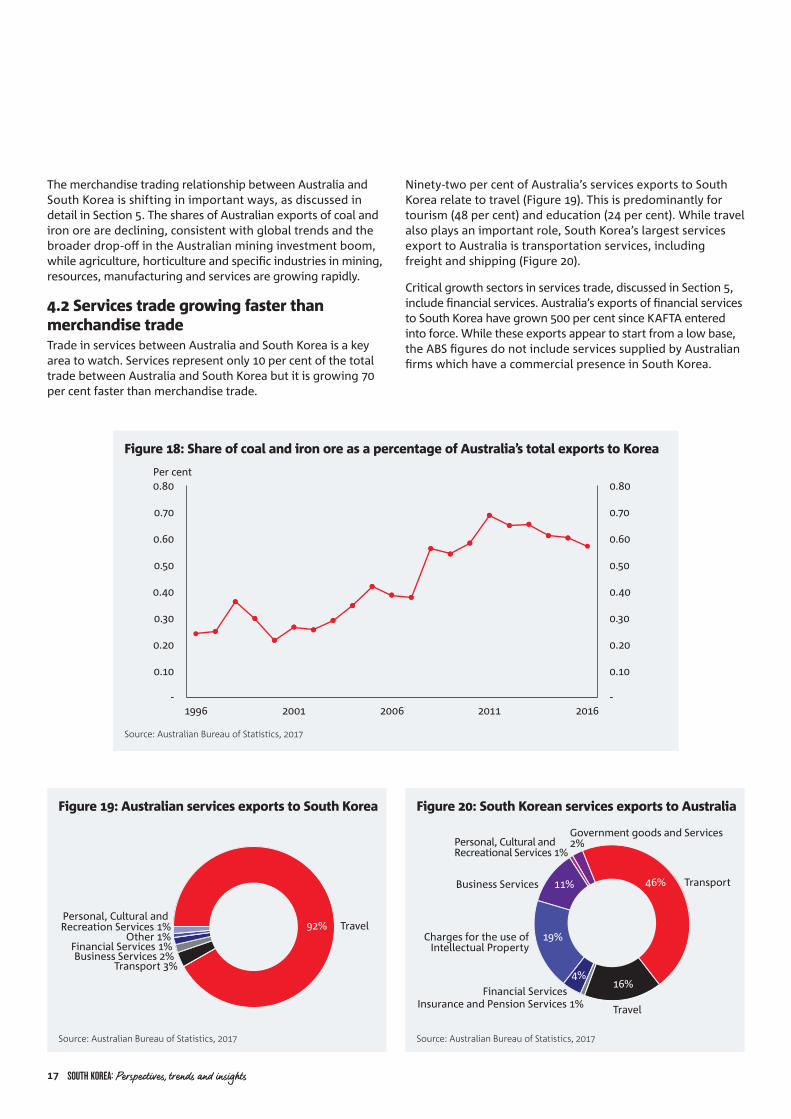
4.2 Services trade growing faster than merchandise tradeTrade in services between Australia and South Korea is a key area to watch. Services represent only 10 per cent of the total trade between Australia and South Korea but it is growing 70 per cent faster than merchandise trade.
Figure 18: Share of coal and iron ore as a percentage of Australia’s total exports to Korea
Source: Australian Bureau of Statistics, 2017
-
0.10
0.20
0.30
0.40
0.50
0.60
0.70
0.80
-
0.10
0.20
0.30
0.40
0.50
0.60
0.70
0.80
1996 2001 2006 2011 2016
Per cent
Figure 19: Australian services exports to South Korea
Source: Australian Bureau of Statistics, 2017
92% TravelPersonal, Cultural and Recreation Services 1%
Other 1%Financial Services 1%Business Services 2%
Transport 3%
Source: Australian Bureau of Statistics, 2017
Figure 20: South Korean services exports to Australia
Government goods and Services2%
Insurance and Pension Services 1%
Personal, Cultural and Recreational Services 1%
Business Services
Financial Services
Charges for the use ofIntellectual Property
Travel
16%4%
19%
11% 46% Transport
Ninety-two per cent of Australia’s services exports to South Korea relate to travel (Figure 19). This is predominantly for tourism (48 per cent) and education (24 per cent). While travel also plays an important role, South Korea’s largest services export to Australia is transportation services, including freight and shipping (Figure 20).
Critical growth sectors in services trade, discussed in Section 5, include financial services. Australia’s exports of financial services to South Korea have grown 500 per cent since KAFTA entered into force. While these exports appear to start from a low base, the ABS figures do not include services supplied by Australian firms which have a commercial presence in South Korea.
17 SOUTH KOREA: Perspectives, trends and insights
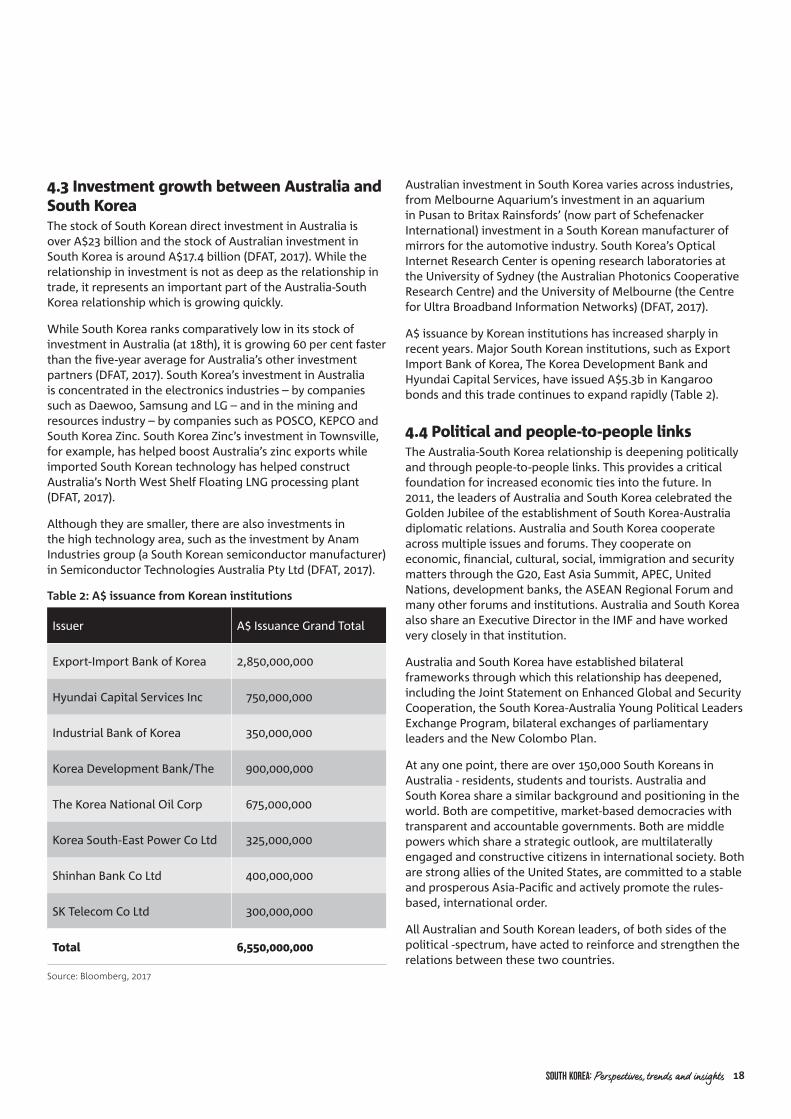
4.3 Investment growth between Australia and South KoreaThe stock of South Korean direct investment in Australia is over A$23 billion and the stock of Australian investment in South Korea is around A$17.4 billion (DFAT, 2017). While the relationship in investment is not as deep as the relationship in trade, it represents an important part of the Australia-South Korea relationship which is growing quickly.
While South Korea ranks comparatively low in its stock of investment in Australia (at 18th), it is growing 60 per cent faster than the five-year average for Australia’s other investment partners (DFAT, 2017). South Korea’s investment in Australia is concentrated in the electronics industries – by companies such as Daewoo, Samsung and LG – and in the mining and resources industry – by companies such as POSCO, KEPCO and South Korea Zinc. South Korea Zinc’s investment in Townsville, for example, has helped boost Australia’s zinc exports while imported South Korean technology has helped construct Australia’s North West Shelf Floating LNG processing plant (DFAT, 2017).
Although they are smaller, there are also investments in the high technology area, such as the investment by Anam Industries group (a South Korean semiconductor manufacturer) in Semiconductor Technologies Australia Pty Ltd (DFAT, 2017).
Table 2: A$ issuance from Korean institutions
Issuer A$ Issuance Grand Total
Export- Import Bank of Korea 2,850,000,000
Hyundai Capital Services Inc 750,000,000
Industrial Bank of Korea 350,000,000
Korea Development Bank/The 900,000,000
The Korea National Oil Corp 675,000,000
Korea South-East Power Co Ltd 325,000,000
Shinhan Bank Co Ltd 400,000,000
SK Telecom Co Ltd 300,000,000
Total 6,550,000,000
Source: Bloomberg, 2017
Australian investment in South Korea varies across industries, from Melbourne Aquarium’s investment in an aquarium in Pusan to Britax Rainsfords’ (now part of Schefenacker International) investment in a South Korean manufacturer of mirrors for the automotive industry. South Korea’s Optical Internet Research Center is opening research laboratories at the University of Sydney (the Australian Photonics Cooperative Research Centre) and the University of Melbourne (the Centre for Ultra Broadband Information Networks) (DFAT, 2017).
A$ issuance by Korean institutions has increased sharply in recent years. Major South Korean institutions, such as Export Import Bank of Korea, The Korea Development Bank and Hyundai Capital Services, have issued A$5.3b in Kangaroo bonds and this trade continues to expand rapidly (Table 2).
4.4 Political and people-to-people linksThe Australia-South Korea relationship is deepening politically and through people-to-people links. This provides a critical foundation for increased economic ties into the future. In 2011, the leaders of Australia and South Korea celebrated the Golden Jubilee of the establishment of South Korea-Australia diplomatic relations. Australia and South Korea cooperate across multiple issues and forums. They cooperate on economic, financial, cultural, social, immigration and security matters through the G20, East Asia Summit, APEC, United Nations, development banks, the ASEAN Regional Forum and many other forums and institutions. Australia and South Korea also share an Executive Director in the IMF and have worked very closely in that institution.
Australia and South Korea have established bilateral frameworks through which this relationship has deepened, including the Joint Statement on Enhanced Global and Security Cooperation, the South Korea-Australia Young Political Leaders Exchange Program, bilateral exchanges of parliamentary leaders and the New Colombo Plan.
At any one point, there are over 150,000 South Koreans in Australia - residents, students and tourists. Australia and South Korea share a similar background and positioning in the world. Both are competitive, market-based democracies with transparent and accountable governments. Both are middle powers which share a strategic outlook, are multilaterally engaged and constructive citizens in international society. Both are strong allies of the United States, are committed to a stable and prosperous Asia-Pacific and actively promote the rules-based, international order.
All Australian and South Korean leaders, of both sides of the political -spectrum, have acted to reinforce and strengthen the relations between these two countries.
SOUTH KOREA: Perspectives, trends and insights 18
5. THE AUSTRALIA-KOREA FREE TRADE AGREEMENT
KAFTA represents a significant deepening of trade and investment linkages between Australia and South Korea. The agreement has been operating now for over two years, having entered into force on 12 December 2014.
The importance of KAFTA is underscored by developments in the region. The United States, European Union and many ASEAN countries have already entered into free-trade agreements with South Korea. Without KAFTA, the effect of these agreements would be to divert trade that would otherwise flow between Australia and South Korea, damaging both economies, particularly Australia.
In the absence of KAFTA, Australian exports to South Korea are projected to have been 5 per cent lower by the time the United States and United States agreements were fully implemented in 2030 (CIE, 2015). South Korean imports of Australian agricultural goods, for example, would have declined by 29 per cent. Mining and manufacturing exports would have declined by 1 and 7 per cent, respectively (DFAT, 2017).
KAFTA avoids these negative outcomes. Entering into a free trade agreement with South Korea not only prevents the eroding existing Australia-South Korea trade flows but creates new and further opportunities to broaden and deepen these trade links.
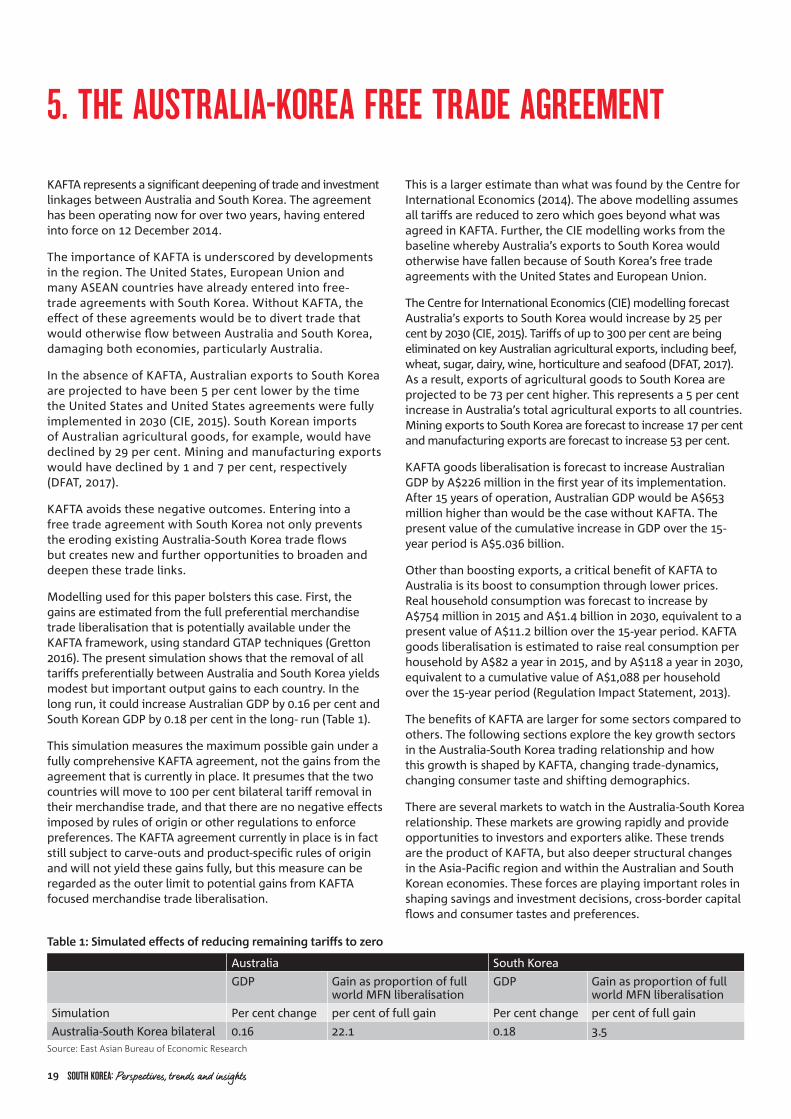
Modelling used for this paper bolsters this case. First, the gains are estimated from the full preferential merchandise trade liberalisation that is potentially available under the KAFTA framework, using standard GTAP techniques (Gretton 2016). The present simulation shows that the removal of all tariffs preferentially between Australia and South Korea yields modest but important output gains to each country. In the long run, it could increase Australian GDP by 0.16 per cent and South Korean GDP by 0.18 per cent in the long- run (Table 1).
This simulation measures the maximum possible gain under a fully comprehensive KAFTA agreement, not the gains from the agreement that is currently in place. It presumes that the two countries will move to 100 per cent bilateral tariff removal in their merchandise trade, and that there are no negative effects imposed by rules of origin or other regulations to enforce preferences. The KAFTA agreement currently in place is in fact still subject to carve-outs and product-specific rules of origin and will not yield these gains fully, but this measure can be regarded as the outer limit to potential gains from KAFTA focused merchandise trade liberalisation.
Table 1: Simulated effects of reducing remaining tariffs to zero
Australia South Korea
GDP Gain as proportion of full world MFN liberalisation
GDP Gain as proportion of full world MFN liberalisation
Simulation Per cent change per cent of full gain Per cent change per cent of full gain
Australia-South Korea bilateral 0.16 22.1 0.18 3.5Source: East Asian Bureau of Economic Research
This is a larger estimate than what was found by the Centre for International Economics (2014). The above modelling assumes all tariffs are reduced to zero which goes beyond what was agreed in KAFTA. Further, the CIE modelling works from the baseline whereby Australia’s exports to South Korea would otherwise have fallen because of South Korea’s free trade agreements with the United States and European Union.
The Centre for International Economics (CIE) modelling forecast Australia’s exports to South Korea would increase by 25 per cent by 2030 (CIE, 2015). Tariffs of up to 300 per cent are being eliminated on key Australian agricultural exports, including beef, wheat, sugar, dairy, wine, horticulture and seafood (DFAT, 2017). As a result, exports of agricultural goods to South Korea are projected to be 73 per cent higher. This represents a 5 per cent increase in Australia’s total agricultural exports to all countries. Mining exports to South Korea are forecast to increase 17 per cent and manufacturing exports are forecast to increase 53 per cent.
KAFTA goods liberalisation is forecast to increase Australian GDP by A$226 million in the first year of its implementation. After 15 years of operation, Australian GDP would be A$653 million higher than would be the case without KAFTA. The present value of the cumulative increase in GDP over the 15-year period is A$5.036 billion.
Other than boosting exports, a critical benefit of KAFTA to Australia is its boost to consumption through lower prices. Real household consumption was forecast to increase by A$754 million in 2015 and A$1.4 billion in 2030, equivalent to a present value of A$11.2 billion over the 15-year period. KAFTA goods liberalisation is estimated to raise real consumption per household by A$82 a year in 2015, and by A$118 a year in 2030, equivalent to a cumulative value of A$1,088 per household over the 15-year period (Regulation Impact Statement, 2013).
The benefits of KAFTA are larger for some sectors compared to others. The following sections explore the key growth sectors in the Australia-South Korea trading relationship and how this growth is shaped by KAFTA, changing trade-dynamics, changing consumer taste and shifting demographics.
There are several markets to watch in the Australia-South Korea relationship. These markets are growing rapidly and provide opportunities to investors and exporters alike. These trends are the product of KAFTA, but also deeper structural changes in the Asia-Pacific region and within the Australian and South Korean economies. These forces are playing important roles in shaping savings and investment decisions, cross-border capital flows and consumer tastes and preferences.
19 SOUTH KOREA: Perspectives, trends and insights
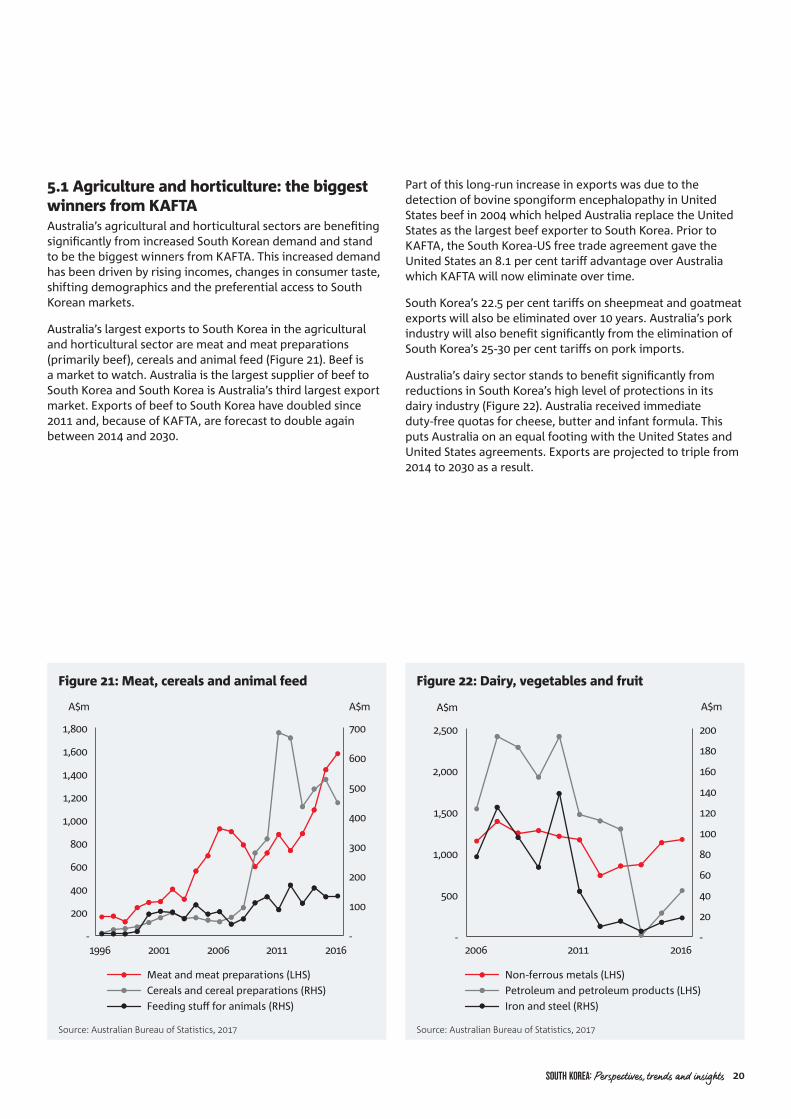
5.1 Agriculture and horticulture: the biggest winners from KAFTA Australia’s agricultural and horticultural sectors are benefiting significantly from increased South Korean demand and stand to be the biggest winners from KAFTA. This increased demand has been driven by rising incomes, changes in consumer taste, shifting demographics and the preferential access to South Korean markets.
Australia’s largest exports to South Korea in the agricultural and horticultural sector are meat and meat preparations (primarily beef), cereals and animal feed (Figure 21). Beef is a market to watch. Australia is the largest supplier of beef to South Korea and South Korea is Australia’s third largest export market. Exports of beef to South Korea have doubled since 2011 and, because of KAFTA, are forecast to double again between 2014 and 2030.
Figure 21: Meat, cereals and animal feed
Source: Australian Bureau of Statistics, 2017
-
200
400
600
800
1,000
1,200
1,400
1,600
1,800
1996 2001 2006 2011 2016
A$m
-
100
200
300
400
500
600
700
A$m
Meat and meat preparations (LHS)Cereals and cereal preparations (RHS)Feeding stu� for animals (RHS)
Figure 22: Dairy, vegetables and fruit
Source: Australian Bureau of Statistics, 2017
Non-ferrous metals (LHS)Petroleum and petroleum products (LHS)Iron and steel (RHS)
-
20
40
60
80
100
120
140
160
180
200
2006 2011 2016
A$m
-
500
1,000
1,500
2,000
2,500
A$m
Part of this long-run increase in exports was due to the detection of bovine spongiform encephalopathy in United States beef in 2004 which helped Australia replace the United States as the largest beef exporter to South Korea. Prior to KAFTA, the South Korea-US free trade agreement gave the United States an 8.1 per cent tariff advantage over Australia which KAFTA will now eliminate over time.
South Korea’s 22.5 per cent tariffs on sheepmeat and goatmeat exports will also be eliminated over 10 years. Australia’s pork industry will also benefit significantly from the elimination of South Korea’s 25-30 per cent tariffs on pork imports.
Australia’s dairy sector stands to benefit significantly from reductions in South Korea’s high level of protections in its dairy industry (Figure 22). Australia received immediate duty-free quotas for cheese, butter and infant formula. This puts Australia on an equal footing with the United States and United States agreements. Exports are projected to triple from 2014 to 2030 as a result.
SOUTH KOREA: Perspectives, trends and insights 20
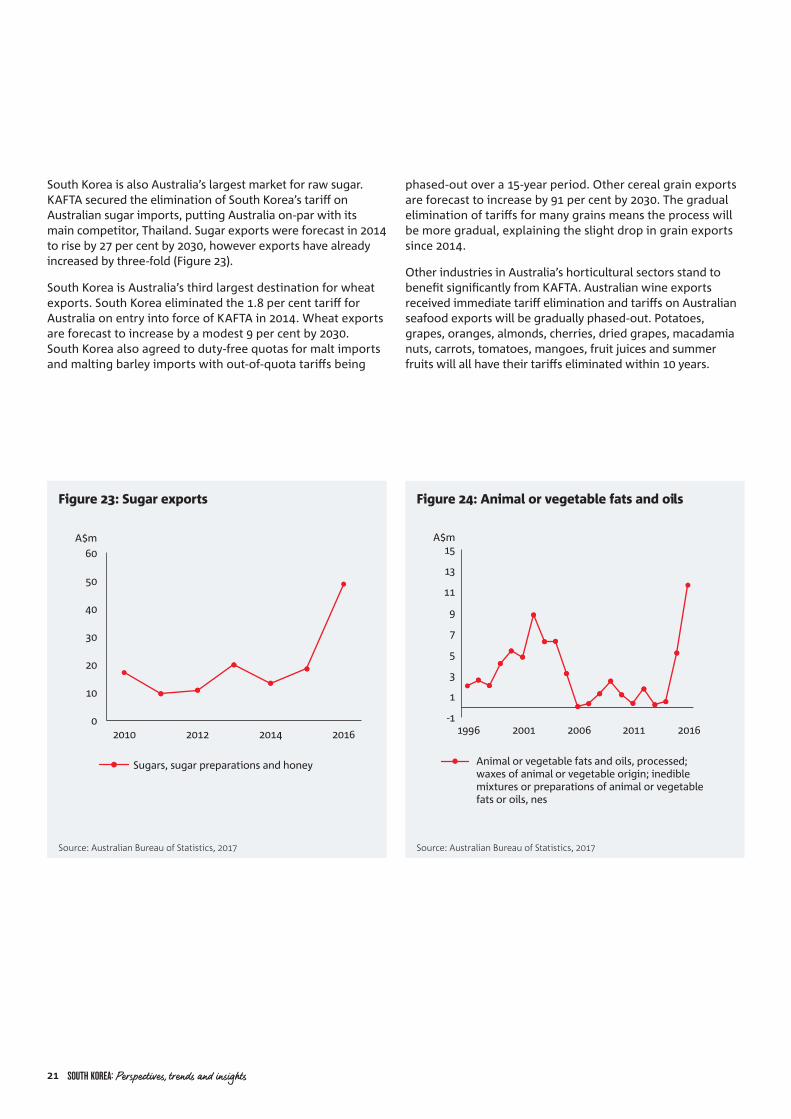
South Korea is also Australia’s largest market for raw sugar. KAFTA secured the elimination of South Korea’s tariff on Australian sugar imports, putting Australia on-par with its main competitor, Thailand. Sugar exports were forecast in 2014 to rise by 27 per cent by 2030, however exports have already increased by three-fold (Figure 23).
South Korea is Australia’s third largest destination for wheat exports. South Korea eliminated the 1.8 per cent tariff for Australia on entry into force of KAFTA in 2014. Wheat exports are forecast to increase by a modest 9 per cent by 2030. South Korea also agreed to duty-free quotas for malt imports and malting barley imports with out-of-quota tariffs being
Figure 23: Sugar exports
Source: Australian Bureau of Statistics, 2017
0
10
20
30
40
50
60
2010 2012 2014 2016
A$m
Sugars, sugar preparations and honey
Figure 24: Animal or vegetable fats and oils
Source: Australian Bureau of Statistics, 2017
-1
1
3
5
7
9
11
13
15
1996 2001 2006 2011 2016
A$m
Animal or vegetable fats and oils, processed; waxes of animal or vegetable origin; inedible mixtures or preparations of animal or vegetable fats or oils, nes
phased-out over a 15-year period. Other cereal grain exports are forecast to increase by 91 per cent by 2030. The gradual elimination of tariffs for many grains means the process will be more gradual, explaining the slight drop in grain exports since 2014.
Other industries in Australia’s horticultural sectors stand to benefit significantly from KAFTA. Australian wine exports received immediate tariff elimination and tariffs on Australian seafood exports will be gradually phased-out. Potatoes, grapes, oranges, almonds, cherries, dried grapes, macadamia nuts, carrots, tomatoes, mangoes, fruit juices and summer fruits will all have their tariffs eliminated within 10 years.
21 SOUTH KOREA: Perspectives, trends and insights
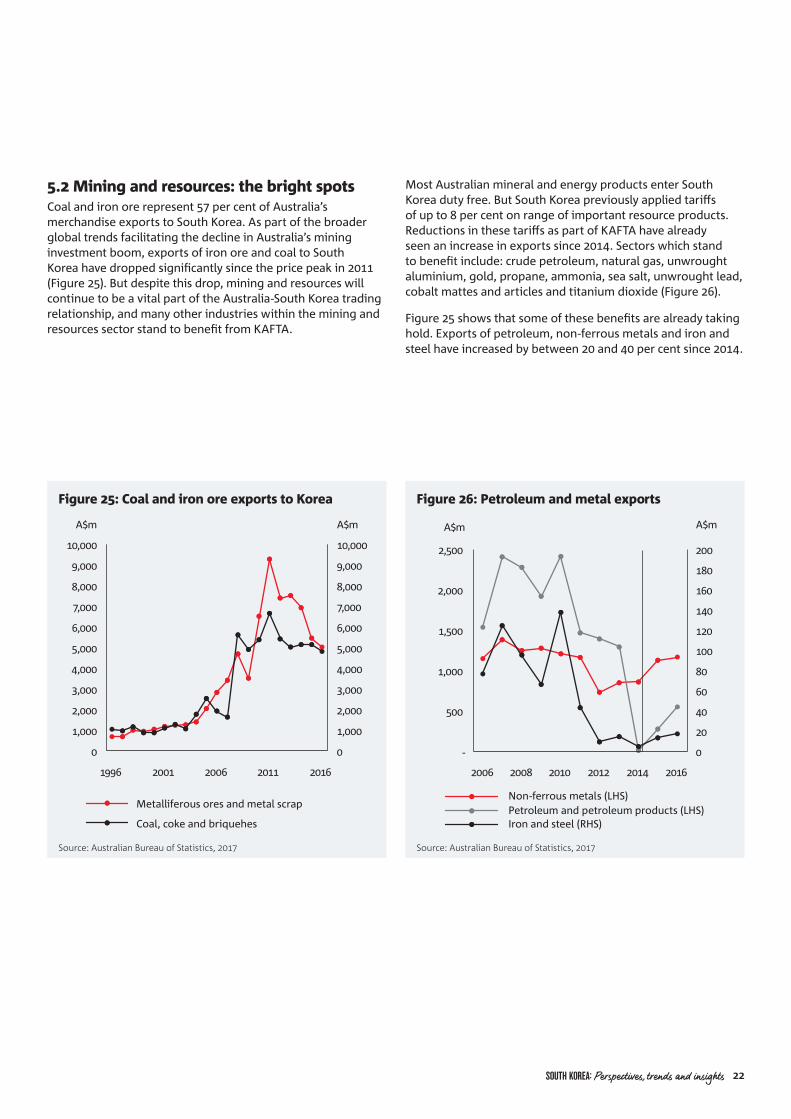
5.2 Mining and resources: the bright spotsCoal and iron ore represent 57 per cent of Australia’s merchandise exports to South Korea. As part of the broader global trends facilitating the decline in Australia’s mining investment boom, exports of iron ore and coal to South Korea have dropped significantly since the price peak in 2011 (Figure 25). But despite this drop, mining and resources will continue to be a vital part of the Australia-South Korea trading relationship, and many other industries within the mining and resources sector stand to benefit from KAFTA.
Figure 25: Coal and iron ore exports to Korea
Source: Australian Bureau of Statistics, 2017
0
1,000
2,000
3,000
4,000
5,000
6,000
7,000
8,000
9,000
10,000
1996 2001 2006 2011 2016
A$m
0
1,000
2,000
3,000
4,000
5,000
6,000
7,000
8,000
9,000
10,000
A$m
Metalliferous ores and metal scrap
Coal, coke and briquehes
Figure 26: Petroleum and metal exports
Source: Australian Bureau of Statistics, 2017
0
20
40
60
80
100
120
140
160
180
200
-
500
1,000
1,500
2,000
2,500
2006 2008 2010 2012 2014 2016
A$mA$m
Non-ferrous metals (LHS)Petroleum and petroleum products (LHS)Iron and steel (RHS)
Most Australian mineral and energy products enter South Korea duty free. But South Korea previously applied tariffs of up to 8 per cent on range of important resource products. Reductions in these tariffs as part of KAFTA have already seen an increase in exports since 2014. Sectors which stand to benefit include: crude petroleum, natural gas, unwrought aluminium, gold, propane, ammonia, sea salt, unwrought lead, cobalt mattes and articles and titanium dioxide (Figure 26).
Figure 25 shows that some of these benefits are already taking hold. Exports of petroleum, non-ferrous metals and iron and steel have increased by between 20 and 40 per cent since 2014.
SOUTH KOREA: Perspectives, trends and insights 22
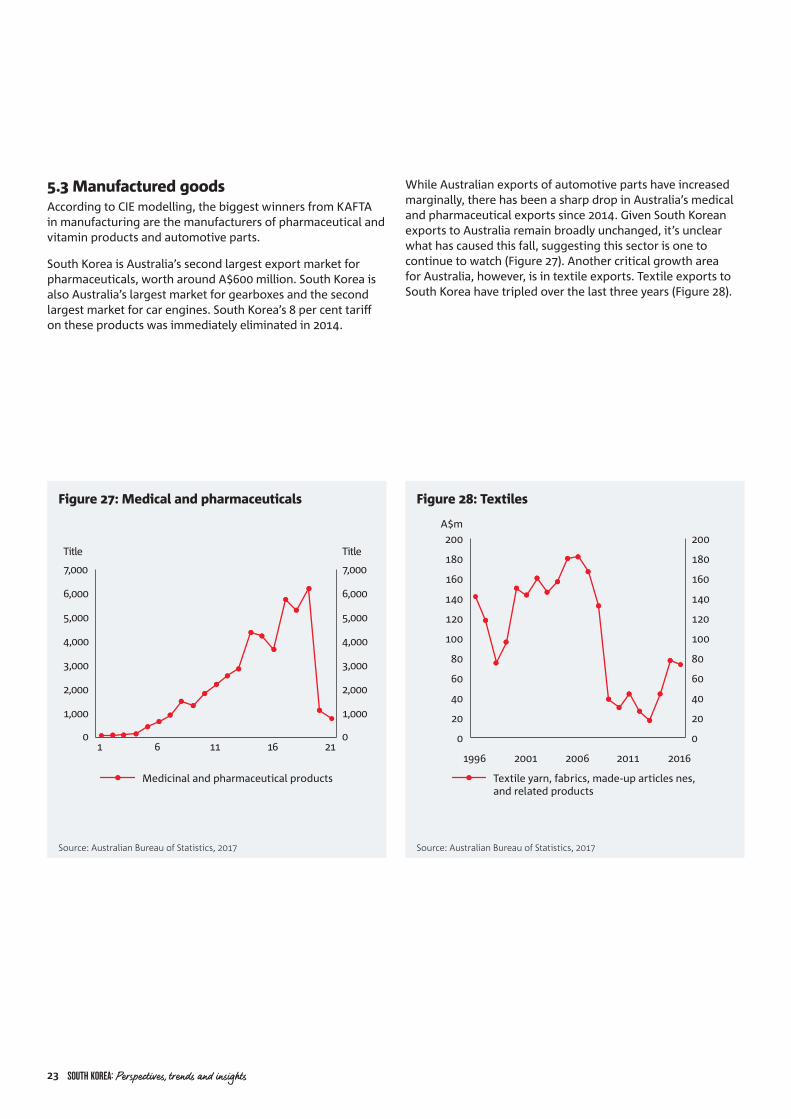
5.3 Manufactured goodsAccording to CIE modelling, the biggest winners from KAFTA in manufacturing are the manufacturers of pharmaceutical and vitamin products and automotive parts.
South Korea is Australia’s second largest export market for pharmaceuticals, worth around A$600 million. South Korea is also Australia’s largest market for gearboxes and the second largest market for car engines. South Korea’s 8 per cent tariff on these products was immediately eliminated in 2014.
Figure 27: Medical and pharmaceuticals
Source: Australian Bureau of Statistics, 2017
Medicinal and pharmaceutical products
0
1,000
2,000
3,000
4,000
5,000
6,000
7,000
1 6 11 16 21
Title
1,000
0
2,000
3,000
4,000
5,000
6,000
7,000
Title
Figure 28: Textiles
Source: Australian Bureau of Statistics, 2017
Textile yarn, fabrics, made-up articles nes, and related products
0
20
40
60
80
100
120
140
160
180
200
0
20
40
60
80
100
120
140
160
180
200
1996 2001 2006 2011 2016
A$m
While Australian exports of automotive parts have increased marginally, there has been a sharp drop in Australia’s medical and pharmaceutical exports since 2014. Given South Korean exports to Australia remain broadly unchanged, it’s unclear what has caused this fall, suggesting this sector is one to continue to watch (Figure 27). Another critical growth area for Australia, however, is in textile exports. Textile exports to South Korea have tripled over the last three years (Figure 28).
23 SOUTH KOREA: Perspectives, trends and insights
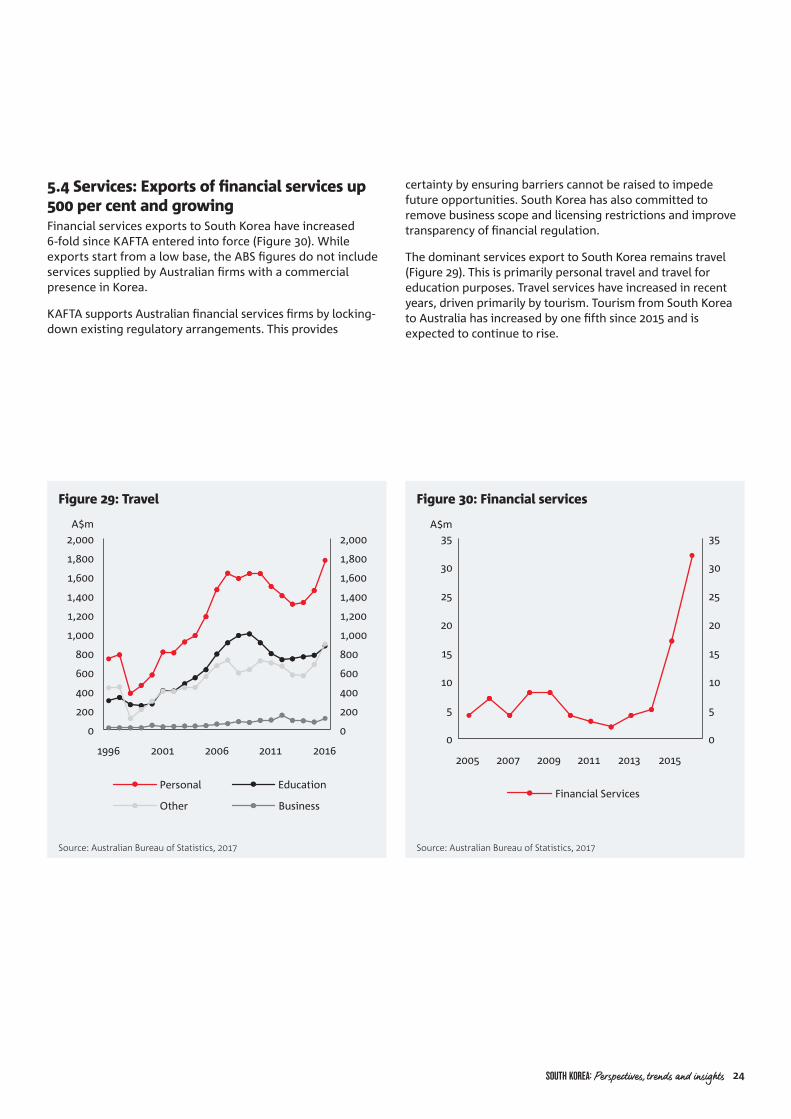
5.4 Services: Exports of financial services up 500 per cent and growingFinancial services exports to South Korea have increased 6-fold since KAFTA entered into force (Figure 30). While exports start from a low base, the ABS figures do not include services supplied by Australian firms with a commercial presence in Korea.
KAFTA supports Australian financial services firms by locking-down existing regulatory arrangements. This provides
Figure 29: Travel
Source: Australian Bureau of Statistics, 2017
0
200
400
600
800
1,000
1,200
1,400
1,600
1,800
2,000
0
200
400
600
800
1,000
1,200
1,400
1,600
1,800
2,000
1996 2001 2006 2011 2016
A$m
Personal
Other Business
Education
Figure 30: Financial services
Source: Australian Bureau of Statistics, 2017
Financial Services
2005 2007 2009 2011 2013 2015
0
5
10
15
20
25
30
35
0
5
10
15
20
25
30
35A$m
certainty by ensuring barriers cannot be raised to impede future opportunities. South Korea has also committed to remove business scope and licensing restrictions and improve transparency of financial regulation.
The dominant services export to South Korea remains travel (Figure 29). This is primarily personal travel and travel for education purposes. Travel services have increased in recent years, driven primarily by tourism. Tourism from South Korea to Australia has increased by one fifth since 2015 and is expected to continue to rise.
SOUTH KOREA: Perspectives, trends and insights 24
6. CONCLUSION
Dubbed one of the four Asian Tigers, the South Korean economy has achieved remarkable success. South Korea embarked on, and adhered to, a government-guided export-promotion strategy that delivered average growth in excess of 7 per cent for nearly 15 years (IMF, 2016).
While the South Korean economy has a tremendous track record, it now faces several headwinds. Structural challenges like rising household debt, an ageing population, excessive dependence on exports, labour-force participation challenges, weak productivity growth, slipping competitiveness and a patchy social safety net require comprehensive action from the South Korean authorities.
South Korea also faces unique geopolitical challenges. Tensions on the Korean peninsula have escalated, South Korea faces a backlash from Beijing for its decision to place an anti-missile system in its territory and a new United States Administration which appears determined to renegotiate the South Korea-United States free trade agreement.
But despite these challenges, the outlook for South Korea is very strong. South Korea’s GDP growth forecasts exceed those of all other advanced countries and South Korea’s macroeconomic capacity to withstand shocks and address the challenges it faces are strong. Its fiscal position is the envy of other advanced economies. It has substantial monetary policy space and resilient macroeconomic frameworks. Successive governments have demonstrated an ability and willingness to undertake difficult structural reforms.
Australia stands to benefit from a strong South Korea more than many. The Australia-South Korea relationship has deepened significantly over the almost 55 years of diplomatic relations. Two-way merchandise trade has increased 7-fold since 1990. Services trade and direct investment are growing rapidly. People-to-people links are increasing and the relationship enjoys strong and increasing political support.
KAFTA represents a major step in this deepening relationship, and many Australian sectors and markets stand to benefit significantly. Australia’s exports to South Korea are forecast to grow by 25 per cent by 2030, over 73 per cent for Australia’s agricultural exports. Mining exports are forecast to increase by 17 per cent, manufacturing exports by 53 per cent, dairy exports by 200 per cent. Financial services exports have already increased by 6-fold as tariffs across a range of markets have been eliminated.
In many respects, the Australia-South Korea relationship is only just beginning. Many opportunities continue to arise as this relationship deepens. South Korea remains a critical country to watch, bilaterally, regionally and globally.
25 SOUTH KOREA: Perspectives, trends and insights
REFERENCES
Bloomberg (2017). Korea Stock Exchange KOSPI Index (KOSPI:IND). Bloomberg Markets. Accessed 10 September 2017.
Centre for International Economics (2015). Economic benefits of Australia’s North Asian FTAs. The Centre for International Economics. 12 June 2015.
Commission on Growth and Development (2008). The Growth Report: Strategies for Sustained Growth and Inclusive Development. Washington, DC. World Bank.
Costello (2017). South Korea steps up as the US steps back. East Asia Forum. 13 June 2017.
DFAT (2017). Republic of Korea. Country fact sheet. Department of Foreign Affairs and Trade. Canberra. June 2017.
Drysdale Peter and Shiro Armstrong (2015) 'Foreign economic policy strategies and economic performance', in Yoichi Funabashi and Barak Kushner (ed.), Examining Japan's Lost Decades, Routledge, Oxon, New York, pp. 176-205.
Fensom (2017). North Korea Crisis Hits Asia’s Biggest Economies. Pacific Money. The Diplomat. 17 April 2017.
IMF (2016). Republic of Korea: Article IV consultation staff report. International Monetary Fund. IMF Country Report No. 16/278. August 2016.
IMF (2017). World Economic Outlook Database, April 2017. International Monetary Fund. Washington DC. April 2017.
Lee (2017). Chaebol reform set to take off again in South Korea. Hwa Ryung Lee. East Asia Forum. 6 June 2017.
Lee-Makiyama (2017). Radical Reforms May Risk South Korea's Economic Rebound. Inside Asia. Forbes. 25 July 2017.
McKibbin et al (2017). Modelling the Economic Impacts of Korean Unification. Warwick J. McKibbin, Jong Wha Lee, Weifeng Liu and Cheol Jong Song, April 2017.
OEC (2017). South Korean exports. The Observatory of Economic Complexity. Massachusetts Institute of Technology. Boston. 2017.
OECD (2017). Household debt: Total, % of net disposable income, 2015. OECD Data, Paris 2017.
OECD (2017). OECD Services Trade Restrictiveness Index. Trade Policy Note. Paris, June 2017.
Regulation Impact Statement (2013). Korea-Australia Free Trade Agreement: Regulation Impact Statement. Australian Parliament House. 4 February 2013.
S&P (2016). S&P Raises Korea Long-Term Rtg To 'AA'; Outlook Stable. S&P Global Ratings. New York, August 2016.
Sang-Hun (2013). Tensions Over North Korea Rattle the South’s Economy and Its Foreign Investors. Choe Sang-Hun. New York Times, 6 April 2013.
South Korean Government (2017). 2016 G20 growth strategy: Korea. November 2016.
Stangarone (2017). What should South Korea’s new trade policy be? Troy Stangarone. East Asia Forum. 9 June 2017.
Teso and Kim (2017). Markets on Edge in Seoul as Trump Escalates North Korea Warnings. Yumi Teso and Heejin Kim. Bloomberg Markets. 9 August 2017.
World Bank (2016). Doing Business 2017: Equal opportunity for all. The World Bank Group. Washington DC. October 2016.
SOUTH KOREA: Perspectives, trends and insights 26
ABOUT THE EAST ASIAN BUREAU OF ECONOMIC RESEARCH
NATIONAL AUSTRALIA BANK
The research was undertaken at the East Asian Bureau of Economic Research (EABER) in the Crawford School of Public Policy at The Australian National University (ANU).
Professor Peter Drysdale
Professor of Economics and the Head of the East Asian Bureau of Economic Research and East Asia Forum at the Crawford School of Public Policy
Professor Adam TriggsVisiting Researcher at the Brookings Institution and doctoral scholar at the Crawford School of Public Policy
Contact
Steve LambertExecutive General Manager Corporate Financing
T +61 2 9237 1150E [email protected]
For more information, please visit:
www.nab.com.au/corporateinsights
Cathryn CarverExecutive General ManagerClient Coverage
T +61 2 8220 5595E [email protected]
Contact
EABER has links with 46 leading economic policy research institutes in Asia, including KIEP in South Korea. The Crawford School of Public Policy is the Asia and Pacific’s leading graduate public policy school and the Australian National University is Australia’s top research university and ranked among the top universities in the world.
27 SOUTH KOREA: Perspectives, trends and insights

NOTES

NOTES


Important information
This document is independent research prepared through the East Asian Bureau of Economic Research in the Crawford School of Public Policy at The Australian National University (“ANU“) and is distributed by National Australia Bank Limited ABN 12 004 044 937 (AFSL 230686) (“NAB“) for information purposes and does not constitute financial product advice.
This is not an offer to buy, sell or provide any product or service described herein. So far as the law allows, neither ANU, NAB nor its related bodies corporate or any of their officers, employees, agents, advisers or contractors (“NAB Group”) warrants or represents that the information in this document is accurate, reliable, complete or contemporary. To the extent permitted by law, NAB Group shall not be liable for any loss or damage which may be suffered by any person relying upon this document or any information (including by way of negligence or misrepresentation) arising from or in connection with information contained in this document.
The information reflects the personal views of the author(s) about the subject matters discussed, and is based upon sources reasonably believed to be reliable and accurate. The views of the author(s) are independent of the views of the NAB Group. No part of the compensation of the author(s) was, is, or will be, directly or indirectly, related to any specific recommendations or views expressed.
NAB is not licensed to undertake any banking or securities business within South Korea.
©2017 National Australia Bank Limited ABN 12 004 044 937 AFSL and Australian Credit Licence 230686 A135316-0417