Embed Size (px)
Citation preview
Benchmark Report – South Korea May 2015 Sponsored by 1
South KoreaAnapji Pond in Gyeongju
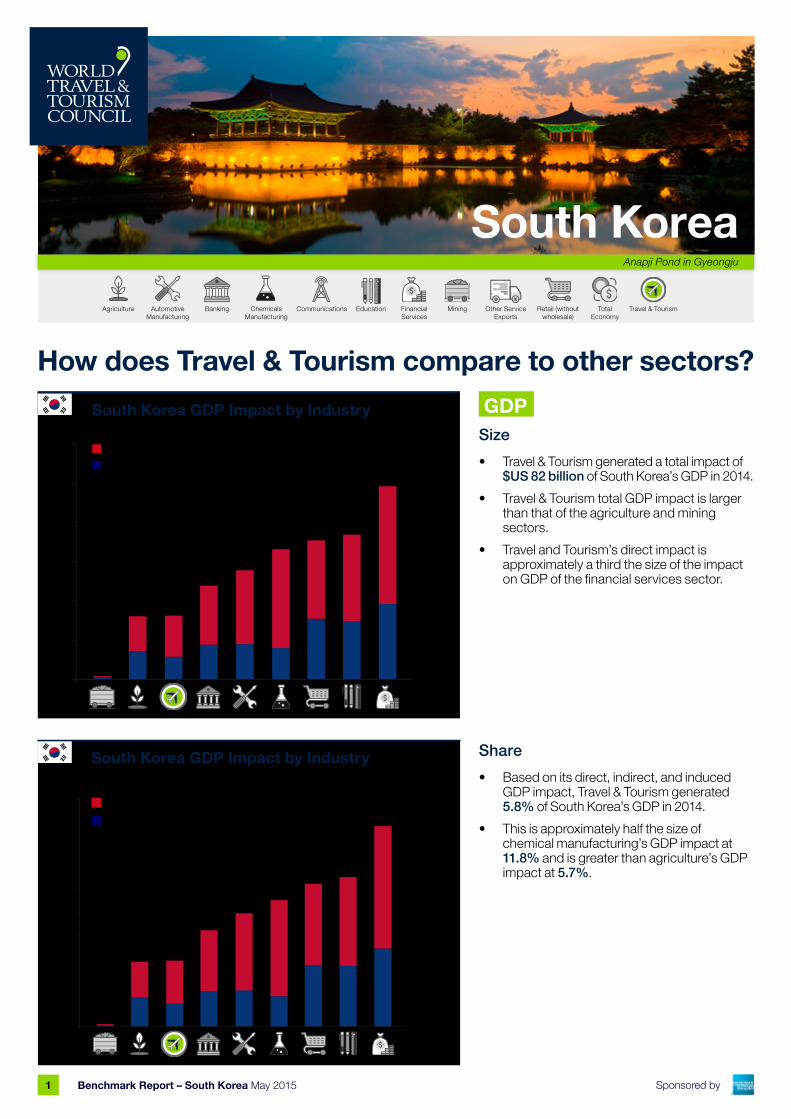
Size• Travel & Tourism generated a total impact of
$US 82 billion of South Korea’s GDP in 2014. • Travel & Tourism total GDP impact is larger
than that of the agriculture and mining sectors.
• Travel and Tourism’s direct impact is approximately a third the size of the impact on GDP of the financial services sector.
Share• Based on its direct, indirect, and induced
GDP impact, Travel & Tourism generated 5.8% of South Korea’s GDP in 2014.
• This is approximately half the size of chemical manufacturing’s GDP impact at 11.8% and is greater than agriculture’s GDP impact at 5.7%.
How does Travel & Tourism compare to other sectors?GDP
Agriculture Communications Education Financial Services
Banking Mining Other Service Exports
Retail (without wholesale)
Total Economy
Travel & TourismAutomotive Manufacturing
Chemicals Manufacturing
South Korea GDP Impact by Industry
South Korea GDP Impact by Industry
$US billion (2014 prices)Indirect & InducedDirect
Indirect & InducedDirect
0
250
300
200
150
50
100
Share of total economy GDP
0%
20%
18%
14%
10%
6%
2%
12%
4%
16%
8%
Benchmark Report – South Korea May 2015 Sponsored by 2
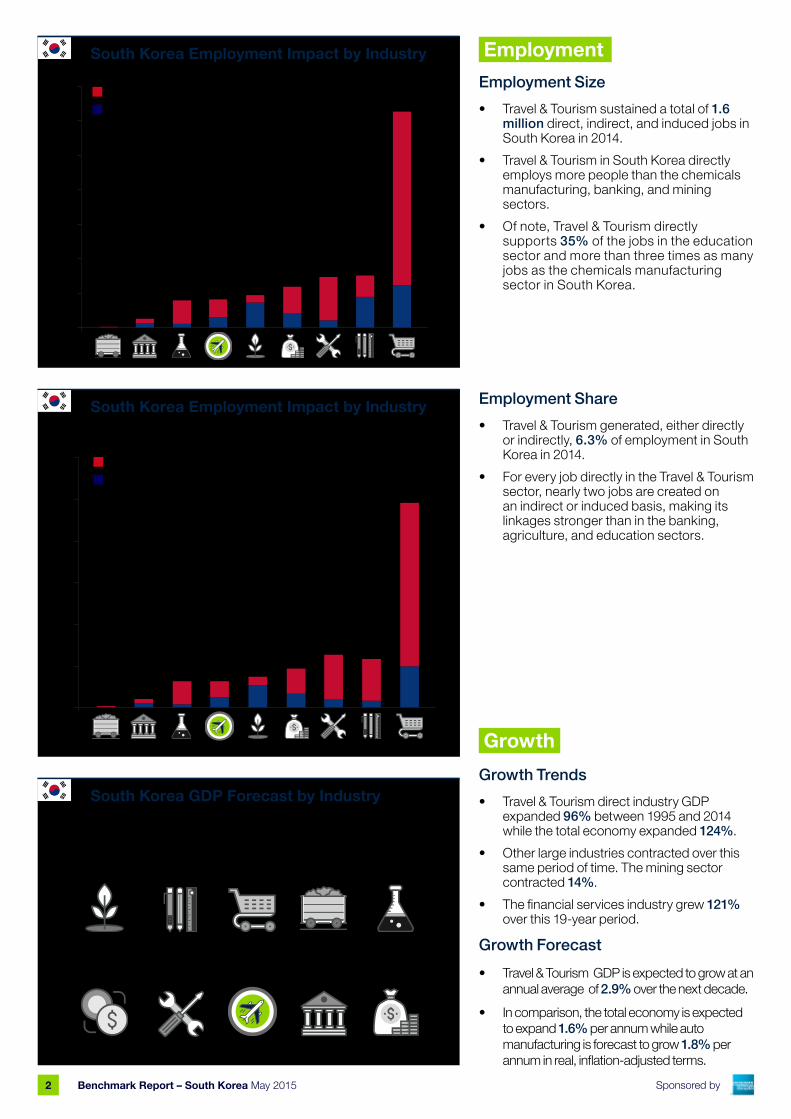
Employment Size• Travel & Tourism sustained a total of 1.6
million direct, indirect, and induced jobs in South Korea in 2014.
• Travel & Tourism in South Korea directly employs more people than the chemicals manufacturing, banking, and mining sectors.
• Of note, Travel & Tourism directly supports 35% of the jobs in the education sector and more than three times as many jobs as the chemicals manufacturing sector in South Korea.
Employment Share• Travel & Tourism generated, either directly
or indirectly, 6.3% of employment in South Korea in 2014.
• For every job directly in the Travel & Tourism sector, nearly two jobs are created on an indirect or induced basis, making its linkages stronger than in the banking, agriculture, and education sectors.
Growth Trends• Travel & Tourism direct industry GDP
expanded 96% between 1995 and 2014 while the total economy expanded 124%.
• Other large industries contracted over this same period of time. The mining sector contracted 14%.
• The financial services industry grew 121% over this 19-year period.
Growth Forecast• Travel & Tourism GDP is expected to grow at an
annual average of 2.9% over the next decade.• In comparison, the total economy is expected
to expand 1.6% per annum while auto manufacturing is forecast to grow 1.8% per annum in real, inflation-adjusted terms.
South Korea Employment Impact by Industry
South Korea Employment Impact by Industry
2014, millions
Share of total economy employment
Indirect & InducedDirect
Indirect & InducedDirect
0.0
0%
50%
-3.3% -0.7% 0.1% 1.3% 1.3%
40%
4.0
2.0
8.0
6.0
14.0
10.0
60%
Employment
Growth
South Korea GDP Forecast by IndustryCAGR% 2015-2025
1.6% 1.8% 2.9% 4.3% 4.6%
20%
10%
30%
12.0
Benchmark Report – South Korea May 2015 Sponsored by 3
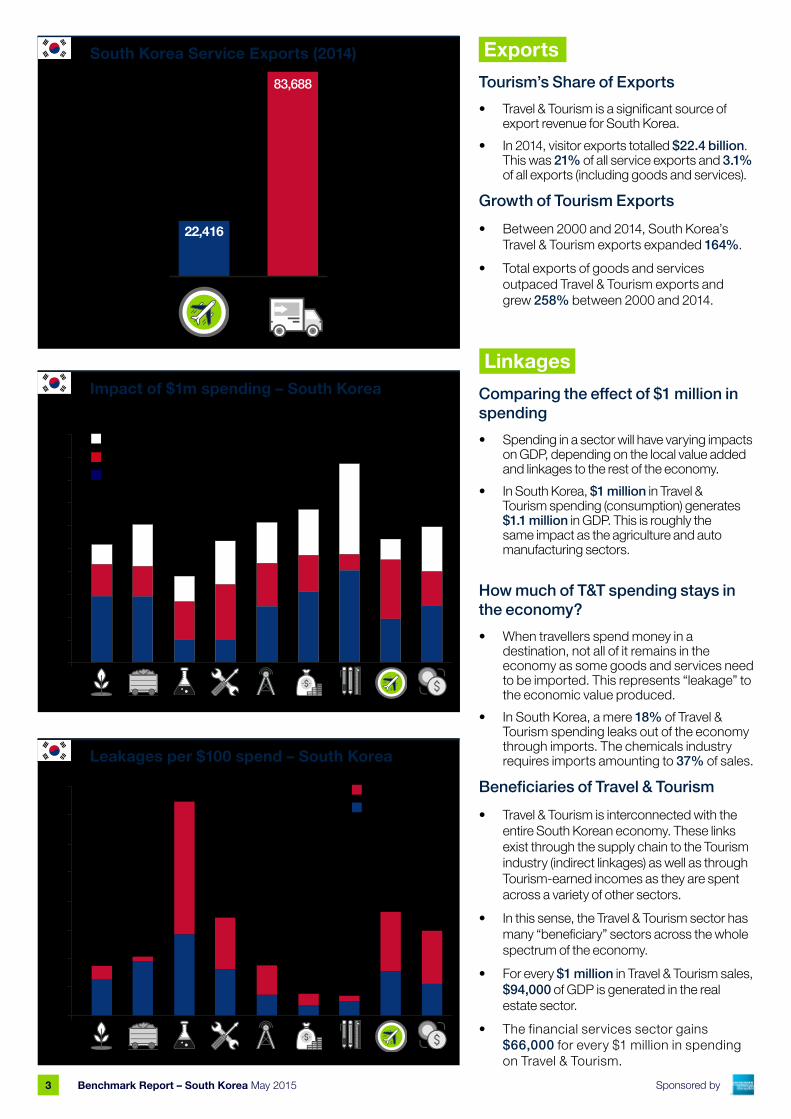
Tourism’s Share of Exports• Travel & Tourism is a significant source of
export revenue for South Korea.• In 2014, visitor exports totalled $22.4 billion.
This was 21% of all service exports and 3.1% of all exports (including goods and services).
Growth of Tourism Exports• Between 2000 and 2014, South Korea’s
Travel & Tourism exports expanded 164%.• Total exports of goods and services
outpaced Travel & Tourism exports and grew 258% between 2000 and 2014.
Comparing the effect of $1 million in spending• Spending in a sector will have varying impacts
on GDP, depending on the local value added and linkages to the rest of the economy.
• In South Korea, $1 million in Travel & Tourism spending (consumption) generates $1.1 million in GDP. This is roughly the same impact as the agriculture and auto manufacturing sectors.
How much of T&T spending stays in the economy?• When travellers spend money in a
destination, not all of it remains in the economy as some goods and services need to be imported. This represents “leakage” to the economic value produced.
• In South Korea, a mere 18% of Travel & Tourism spending leaks out of the economy through imports. The chemicals industry requires imports amounting to 37% of sales.
Beneficiaries of Travel & Tourism• Travel & Tourism is interconnected with the
entire South Korean economy. These links exist through the supply chain to the Tourism industry (indirect linkages) as well as through Tourism-earned incomes as they are spent across a variety of other sectors.
• In this sense, the Travel & Tourism sector has many “beneficiary” sectors across the whole spectrum of the economy.
• For every $1 million in Travel & Tourism sales, $94,000 of GDP is generated in the real estate sector.
• The financial services sector gains $66,000 for every $1 million in spending on Travel & Tourism.
South Korea Service Exports (2014)
Impact of $1m spending – South Korea
$US million
GDP ($m)
Indirect
Induced
Direct
Direct ImportsSupplier Imports
0
1.6
1.4
0.8
1.0
1.2
0.6
0.4
0.2
1.8
2.0
Exports
Linkages
Leakages per $100 spend – South Korea
22,416
83,688
0%
35%
30%
25%
20%
40%
5%
15%
10%
Benchmark Report – South Korea May 2015 Sponsored by 4
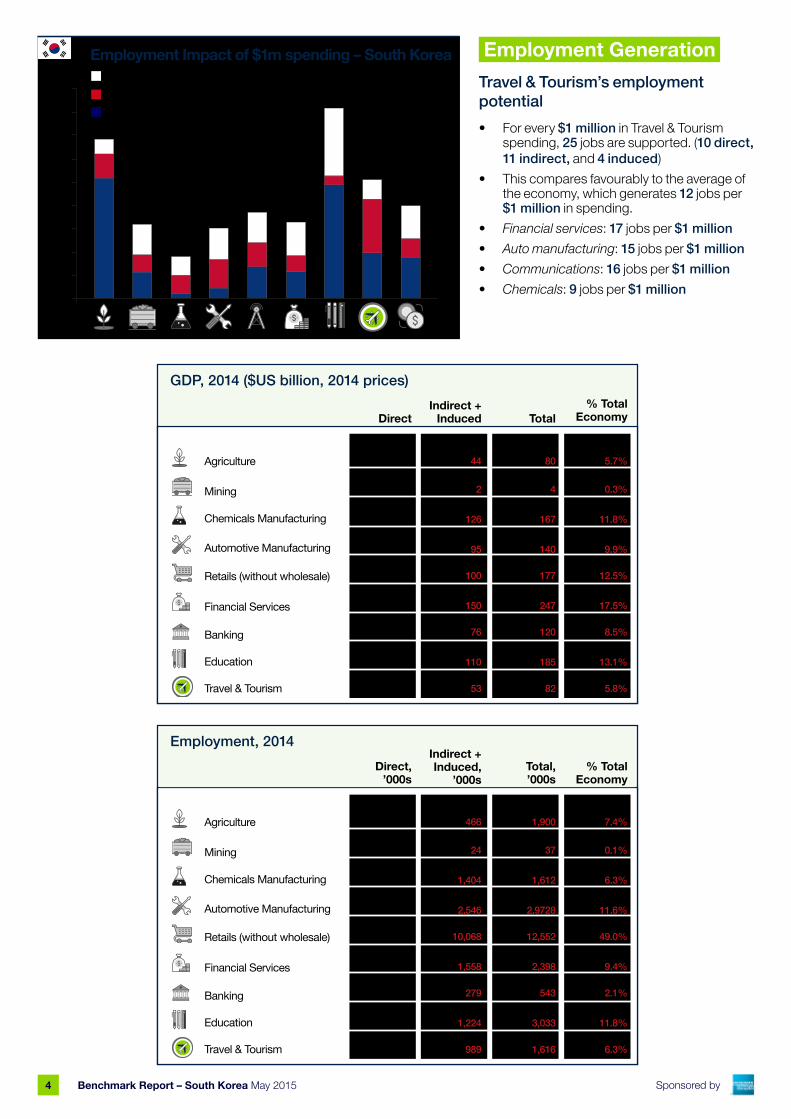
Travel & Tourism’s employment potential• For every $1 million in Travel & Tourism
spending, 25 jobs are supported. (10 direct, 11 indirect, and 4 induced)
• This compares favourably to the average of the economy, which generates 12 jobs per $1 million in spending.
• Financial services: 17 jobs per $1 million • Auto manufacturing: 15 jobs per $1 million• Communications: 16 jobs per $1 million• Chemicals: 9 jobs per $1 million
Employment Impact of $1m spending – South Korea Employment Generation
GDP, 2014 ($US billion, 2014 prices)
Agriculture
DirectIndirect +
Induced Total% Total
Economy
Mining
Banking
Education
Travel & Tourism
Chemicals Manufacturing
Automotive Manufacturing
Retails (without wholesale)
Financial Services
36
2
41
45
77
97
44
75
29
44
2
126
95
100
150
76
110
53
80
4
167
140
177
247
120
185
82
5.7%
0.3%
11.8%
9.9%
12.5%
17.5%
8.5%
13.1%
5.8%
Employment, 2014
Agriculture
Direct, ’000s
Indirect + Induced,
’000sTotal, ’000s
% Total Economy
Mining
Banking
Education
Travel & Tourism
Chemicals Manufacturing
Automotive Manufacturing
Retails (without wholesale)
Financial Services
1,434
13
208
426
2,485
840
264
1,809
627
466
24
1,404
2,546
10,068
1,558
279
1,224
989
1,900
37
1,612
2,9728
12,552
2,398
543
3,033
1,616
7.4%
0.1%
6.3%
11.6%
49.0%
9.4%
2.1%
11.8%
6.3%
Indirect
Induced
Direct
Jobs
30
25
20
15
10
5
0
35
45
40
T&T Direct
T&T Indirect
T&T Induced
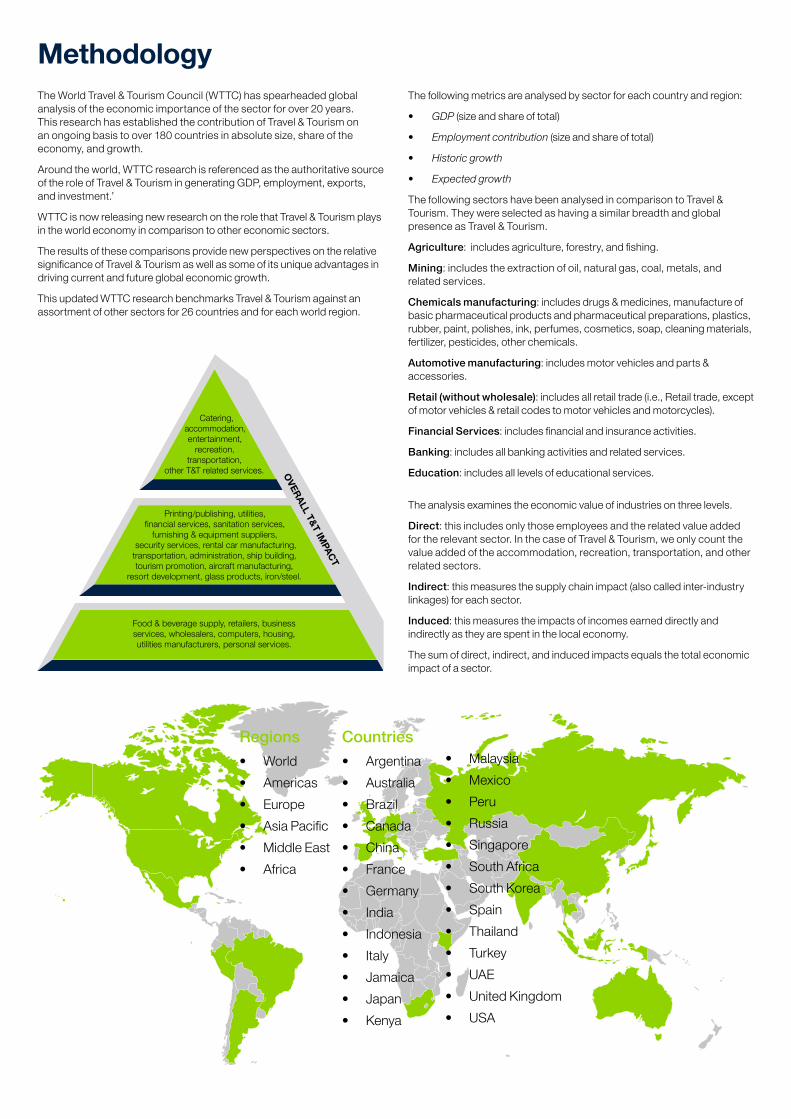
Catering, accommodation, entertainment,
recreation, transportation,
other T&T related services.
Printing/publishing, utilities,financial services, sanitation services,
furnishing & equipment suppliers, security services, rental car manufacturing, transportation, administration, ship building, tourism promotion, aircraft manufacturing,
resort development, glass products, iron/steel.
Food & beverage supply, retailers, business services, wholesalers, computers, housing, utilities manufacturers, personal services.
OVERALL T&T IMPACT
Regions• World• Americas• Europe• Asia Pacific• Middle East• Africa
Countries• Argentina• Australia• Brazil• Canada• China• France• Germany• India• Indonesia• Italy• Jamaica• Japan• Kenya
• Malaysia• Mexico• Peru• Russia• Singapore• South Africa• South Korea• Spain• Thailand• Turkey• UAE• United Kingdom• USA
MethodologyThe World Travel & Tourism Council (WTTC) has spearheaded global analysis of the economic importance of the sector for over 20 years. This research has established the contribution of Travel & Tourism on an ongoing basis to over 180 countries in absolute size, share of the economy, and growth.
Around the world, WTTC research is referenced as the authoritative source of the role of Travel & Tourism in generating GDP, employment, exports, and investment.’
WTTC is now releasing new research on the role that Travel & Tourism plays in the world economy in comparison to other economic sectors.
The results of these comparisons provide new perspectives on the relative significance of Travel & Tourism as well as some of its unique advantages in driving current and future global economic growth.
This updated WTTC research benchmarks Travel & Tourism against an assortment of other sectors for 26 countries and for each world region.
The following metrics are analysed by sector for each country and region:
• GDP (size and share of total)
• Employment contribution (size and share of total)
• Historic growth
• Expected growth
The following sectors have been analysed in comparison to Travel & Tourism. They were selected as having a similar breadth and global presence as Travel & Tourism.
Agriculture: includes agriculture, forestry, and fishing.
Mining: includes the extraction of oil, natural gas, coal, metals, and related services.
Chemicals manufacturing: includes drugs & medicines, manufacture of basic pharmaceutical products and pharmaceutical preparations, plastics, rubber, paint, polishes, ink, perfumes, cosmetics, soap, cleaning materials, fertilizer, pesticides, other chemicals.
Automotive manufacturing: includes motor vehicles and parts & accessories.
Retail (without wholesale): includes all retail trade (i.e., Retail trade, except of motor vehicles & retail codes to motor vehicles and motorcycles).
Financial Services: includes financial and insurance activities.
Banking: includes all banking activities and related services.
Education: includes all levels of educational services.
The analysis examines the economic value of industries on three levels.
Direct: this includes only those employees and the related value added for the relevant sector. In the case of Travel & Tourism, we only count the value added of the accommodation, recreation, transportation, and other related sectors.
Indirect: this measures the supply chain impact (also called inter-industry linkages) for each sector.
Induced: this measures the impacts of incomes earned directly and indirectly as they are spent in the local economy.
The sum of direct, indirect, and induced impacts equals the total economic impact of a sector.
Data Sources & Methodology
About WTTC & Oxford Economics
GDP & Employment:• Main data sources for comparative sectors:
• United Nations International Labour Organization;
• OECD;
• CEIC Data Manager;
• Eurostat (European Commission);
• UK Office for National Statistics (ONS);
• Oxford Economics Cities and Regions Forecasting Service;
• UNESCO;
• Groningen Growth and Development Centre;
• UN World Input-Output Database (WIOD);
• Oxford Economics Global Industry Model;
• Oxford Economics Global Economic Model;
• Oxford Economics UK Regional Model; and
• Various country-specific National Statistics Office websites
• Travel & Tourism GDP and employment figures are drawn from Oxford Economics analysis for WTTC using the Tourism Satellite Account framework.
Exports• Main data sources:
• World Trade Organization (WTO)
• IMFBOPA
• Oxford Economics.
• Total exports, total service exports and total goods/merchandise exports are sourced originally to national accounts and central bank balance of payments data.
• Service exports taken from IMFBOPA database for all countries where possible.
• 2000 figures taken from above, 2014 estimated using 2013 shares of total and applied to totals for 2014.
• All currency figures are stated in 2014 US dollars.
Linkages• Main data sources: OECD, National Statistical Offices, Oxford
Economics
• Input-output tables for all countries were sourced from either the OECD or, when not available, National Statistical Offices. From the input-output tables, multiplier matrices were developed for each economy, detailing the flow of spending in an economy that occurs as a consequence of spending in a given industry.
• For each of the comparator sectors, a spending shock of $1 million was simulated, with the resulting spending impacts in every industry in the economy recorded.
• These spending outcomes were translated into gross value added (GVA) using the GVA/output ratios available in the input-output tables, and employment, using productivity level data developed from the GDP and employment figures derived elsewhere in the study.
• Travel & Tourism multipliers are drawn from Oxford Economics / WTTC ongoing Tourism Satellite Account analysis.
• Global and regional multipliers were calculated as the weighted average of all relevant nations, with weightings assigned according to sector GDP.
• Oxford Economics is one of the world’s leading providers of economic analysis, forecasts and consulting advice. Founded in 1981 as a joint venture with Oxford University’s business college, Oxford Economics enjoys a reputation for high quality, quantitative analysis and evidence-based advice.
• For this, its draws on its own staff of over 70 highly-experienced professional economists; a dedicated data analysis team; global modelling tools, and a range of partner institutions in Europe, the US and in the United Nations Project Link. Oxford Economics has offices in New York, Philadelphia, San Francisco, Chicago, London, Oxford, Belfast, Dubai, and Singapore.
• The World Travel & Tourism Council (WTTC) is the forum for business leaders in the Travel & Tourism industry. With Chief Executives of some one hundred of the world’s leading Travel & Tourism companies as its Members, WTTC has a unique mandate and overview on all matters related to Travel & Tourism.
• WTTC works to raise awareness of Travel & Tourism as one of the world’s largest industries, supporting 260 million jobs and generating 9 per cent of world GDP in 2012.
• WTTC advocates partnership between the public and private sectors, delivering results that match the needs of economies, local and regional authorities and local communities with those of business.
The Harlequin Building65 Southwark Street
London, SE1 0HRUnited Kingdom
T. +44 (0)20 7481 8007F. +44 (0)20 7488 1008E. [email protected]
www.wttc.orgSponsored by