Embed Size (px)
Citation preview
Retail Equity Research (South India Focus)
SOUTH INDIAN BANK Ltd Banking
BSE CODE : 532218 NSE CODE: SOUTHBANK
BLOOMBERG CODE: SIB:IN SENSEX : 36,546
BUY
www.geojit.com
12M Investment Period Rating as per Mid cap
CMP Rs13.5 TARGET Rs17.4 RETURN 29%
INITIATING COVERAGE
11th February 2019
(Closing:08-02-19)
Strategic realignment to impact positively… South Indian Bank (SIB) is a mid-sized private commercial bank having a network of 857 branches across India with a loan book size of ~Rs60,000cr
• SIB has realigned the loan book in favor of the retail and SME seg-ments with dedicated verticals, strategically shifting away from large corporate loans.
• Revival in loan growth (CAGR of 16%) in next two years led by re-newed focus in retail and SME segments, which is expected to grow at a CAGR of 29% and 17% respectively over FY18-20E.
• Strategy and roadmap in place to improve CASA over a long term, which eventually helps to reduce the cost of funds.
• We factor GNPA and NNPA at 4.2% and 2.9% by FY20E and provi-sion burden to stabilise in the coming years, leading to 11% CAGR in earnings over FY18-20E.
• We have a positive outlook in loan growth and earnings for a long-er term. Though we expect overhang of asset quality issues in the near to medium term, with the stock trading at much lower valua-tion, we value SIB at 0.55x FY20E BVPS of Rs 31.7 with a target price of Rs17.4 and recommend to BUY.
Growth outlook realigned with retail oriented loan book...
SIB has realigned the loan book in favor of the retail and SME segments, strategi-cally shifting away from large corporate loans over the last few years. Robust retail network, improving economic activities and demand outlook for retail adds impetus to the loan growth while de-risking the balance sheet. Loan growth had been tepid for three years till FY16 while showing signs of improvement from FY17 and significant improvement in FY18. SME and retail books have grown at 18% and 21% respectively helping the overall loan book to grow at 18% in FY18. We factor 16% CAGR in loan book over FY18-20E.
Asset quality risk slowly coming down… Asset quality outlook has significantly improved with legacy risk assets already recognized in NPA. GNPA and NNPA spiked to 4.88% and 3.54% by Q3FY19 on account of Rs400 slippages in IL&FS exposure. Going forward, the loan book growing through less risky lower ticket size retail and SME augurs well for asset quality outlook and is expected to improve by FY20E.
Valuation… We have a positive outlook in loan growth at 16% CAGR over FY18-20E, which aid a PAT growth of over 11% during the same period. But we do expect the overhang of asset quality issues in near to medium term, and to get moderate by FY20E. The stock is currently trading at much lower valuation of 0.45x/0.42x respectively for FY19E/FY20E P/B. Hence we value South Indian Bank at 0.55x FY20E BVPS of Rs31.7 and recommend Buy rating with a target price of Rs17.4.
Retail network growing slowly and constantly... SIB currently has 857 branches spread across different states, while 83% in South India. The large retail network amid expanding national and increasing penetra-tion in Southern markets will support the retail loan momentum. SIB had 794 branches in FY14. The bank constantly and slowly added new branches annually and reached 857 branches as on Q3 FY19.
Company Data
Market Cap (cr) Rs. 2,434
Outstanding Shares (cr) 181.0
Free Float 100%
Dividend Yield 3.0%
52 week high Rs. 28
52 week low Rs. 12
6m average volume (cr) 1.86
Beta 1.13
Face value Rs. 1
Shareholding (%) Q1FY19 Q2FY19 Q3FY19
Promoters 0.00 0.00 0.00
FPI’s/FII’s 32.34 30.18 25.74
MFs/Insti 14.94 12.44 13.05
Public 52.72 57.38 61.21
Total 100.0 100.0 100
Price Performance 3 month 6 Month 1 Year
Absolute Return -13.2% -25.3% -51.4%
Absolute Sensex 3.9% -3.5% 6.2%
Relative Return* -17.2% -21.8% -57.6%
over or under performance to benchmark index
Standalone (cr) FY18A FY19E FY20E
Interest Income 6,193 6,845 7,619
Interest Expense 4,227 4,699 5,196
NII 1,966 2,146 2,423
Growth (%) 17.3 9.2 12.9
NIM(%) 2.83 2.75 2.73
Provisions 981 977 979
Adj. PAT 335 264 414
Growth (%) (14.8) (21.2) 56.8
Adj. EPS 1.9 1.5 2.3
Growth (%) (15.0) (21.2) 56.8
P/E 7.28 9.24 5.90
P/B 0.47 0.45 0.42
Adj. P/B 0.64 0.73 0.68
ROE (%) 6.64 4.95 7.42
Abijith T Cherian
Research Analyst
10
15
20
25
30
35
Feb 18 May 18 Aug 18 Nov 18 Feb 19
SIB Sensex Rebased
www.geojit.com
Valuations…
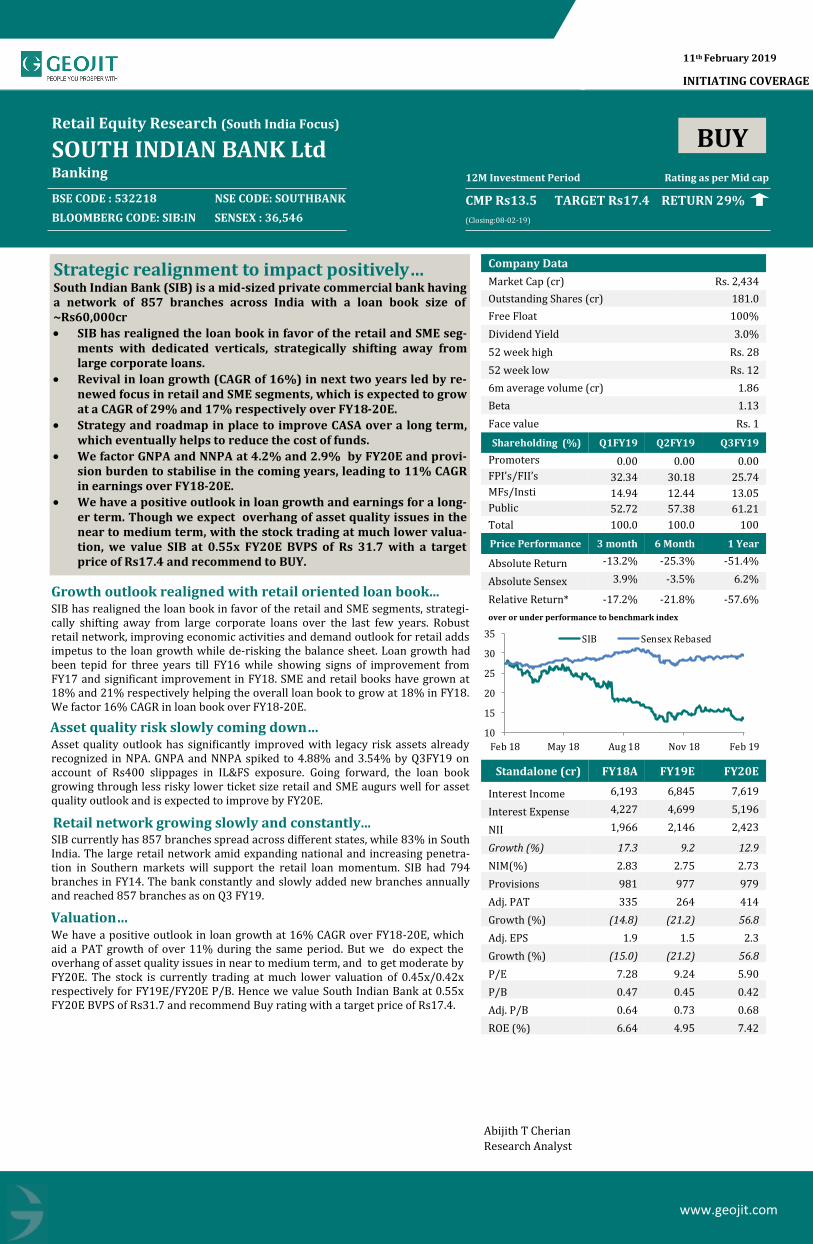
We have a positive outlook in loan growth at 16% CAGR over FY18-20E, which aid a PAT growth of over 11% during the same period. But we do expect the overhang of asset quality issues in near to medium term, and to get moderate by FY20E with the banks focus on retail and SME loans. The stock is currently trading at much lower valuation of 0.45x/0.42x respectively for FY19E/FY20E P/B. Hence we value South Indian Bank at 0.55x FY20E BVPS of Rs31.7 and recommend Buy rating with a target price of Rs17.4.
P/BV one year forward
Revival in earnings growth expected
In FY18, the PAT de-grew 15% YoY mainly on account of higher provisioning. Loan book grew 18%YoY while Net interest margin remained stable which supported the earnings momentum. Higher NPA provisions and muted loan growth had been impacting the earnings growth since FY13 till FY16. However, loan growth has picked up from FY17 onwards. Loan book grew at CAGR of 11% during 2014-18. GNPA almost tripled to more than 3.6% from 1.2% during the same period. NIMs had remained largely stable over the years helped by improving yields from changing loan mix.
NPAs have spiked up by Q3FY19 with all legacy risky assets recognized with GNPA at 4.88% and NNPA at 3.50%. The business momentum is picking up with focus on small ticket retail loans and moderate NPA provisioning, earnings are expected to significantly improve by FY20E.
On improving asset quality, provisioning hit would be minimal over the long term and profita-bility could see further improvement. Management is confident of economic revival and recog-nition of legacy books to influence the asset quality from FY20. We factor GNPA and NNPA at 4.2% and 2.9% by FY20E. ROE and ROA would see notable improvement over the next two years reaching 7.42% and 0.42% respectively by FY20E. We factor 11% CAGR in earnings over FY18-20E.
Source: Company, Geojit Research.
Market
Cap
Loan book
(Rs Cr)
Loan Book CAGR
Gross NPA (%)
Net NPA (%)
PAT growth P/BV
(Rs cr) FY18 4 years FY18 FY18 FY18 FY19E FY20E FY18 FY19E FY20E
Federal Bank 16,698 93,201 21% 3.11 1.78 6% 36% 34% 1.36 1.27 1.15
City Union Bank
13,657 28,230 15% 3.03 1.7 18% 16% 17% 3.27 2.79 2.41
Karur Vysya Bank
6,857 45,891 8% 6.56 4.16 -43% 13% 129% 0.91 1.05 0.95
Lakshmi Vilas Bank
1,547 26,937 20% 9.98 5.66 P-L* L-L# L-L# 0.66 1.02 1.18
Karnataka Bank
4,379 48,198 14% 4.7 3.0 -28% 53% 41% 0.61 0.6 0.55
DCB Bank 5,517 20,558 26% 1.79 0.72 23% 27% 32% 1.95 1.87 1.63
South Indian Bank
2,434 55,104 11% 3.6 2.6 -15% -24% 59% 0.47 0.45 0.42
0.3
0.4
0.5
0.6
0.7
0.8
0.9
1.0
1.1
1.2
Feb-14 Feb-15 Feb-16 Feb-17 Feb-18 Feb-19
P/BV 1 yr Fwd Avg 1yr Fwd P/BV Avg + 1 SD Avg - 1 SD
South Indian Bank has been trading at a discount over its private peers in the last two years on the back of subdued business momentum and asset quality overhang. Earnings are expected to grow at a relatively healthy and stable momentum supported by loan growth, over the next few years. With a 11% CAGR growth in earnings, ROE will improve to 7.4%. With better earnings outlook and profitability, we expect South Indian Bank’s discount over peers to nar-row over the next two years.
Peer Comparison
Source: Company, Bloomberg, Geojit Research.
Note: P-L* Profit to Loss; L-L# Loss to Loss
Valued at 0.55x FY20E BVPS of
Rs31.7 with a target price of
Rs17.4
Rating “Buy”
Revival in earnings growth
expected by FY20E.
After a de-growth in FY19E, PAT
to grow at ~57% in FY20E.
RoE to reach 7.4% by FY20E.
RoA to reach 0.42% by FY20E.
Currently trading at a discount
over peers at 0.42x P/BV FY20E.
The discount in valuation to get
narrowed in coming years.
www.geojit.com
Investment Rationale… The Bank had been successful in widening its network across India with 857 Branches, 53 Extension Counters, 1407 ATMs and 51 CRMs/CDMs. The Bank has opened 10 new outlets (4 Branches and 6 Extension Counters), 60 ATMs and 4 CRMs across the country during the fi-nancial year 2017-18. The branch network now covers 27 States and 3 Union Territories. The Bank plans to open a maximum of 10 new outlets (Branches and Extension Counters) and 50 ATMs/CRMs during the financial year 2018-19.
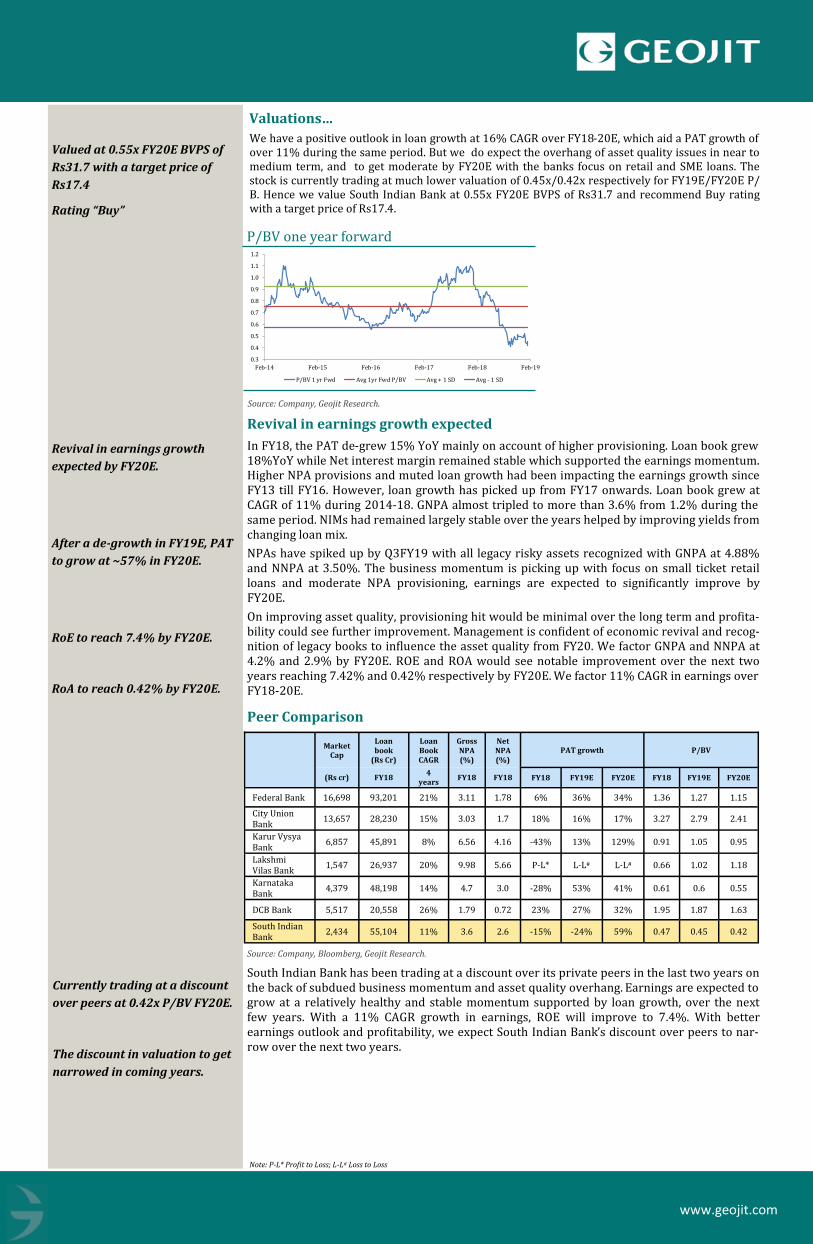
Loan Book mix as of FY18
The business of SIB is growing at a good pace attaining a loan book size of Rs60,000cr as on Q3FY19. The loan growth outlook continues to be robust on the back of improving economic outlook and strong retail network. SME and retail books have grown at 18% and 19% respec-tively helping the overall loan book to grow 17% in FY18. We factor 16% CAGR in loan book over FY18E-20E.
Retail, SME & Housing loans gains focus
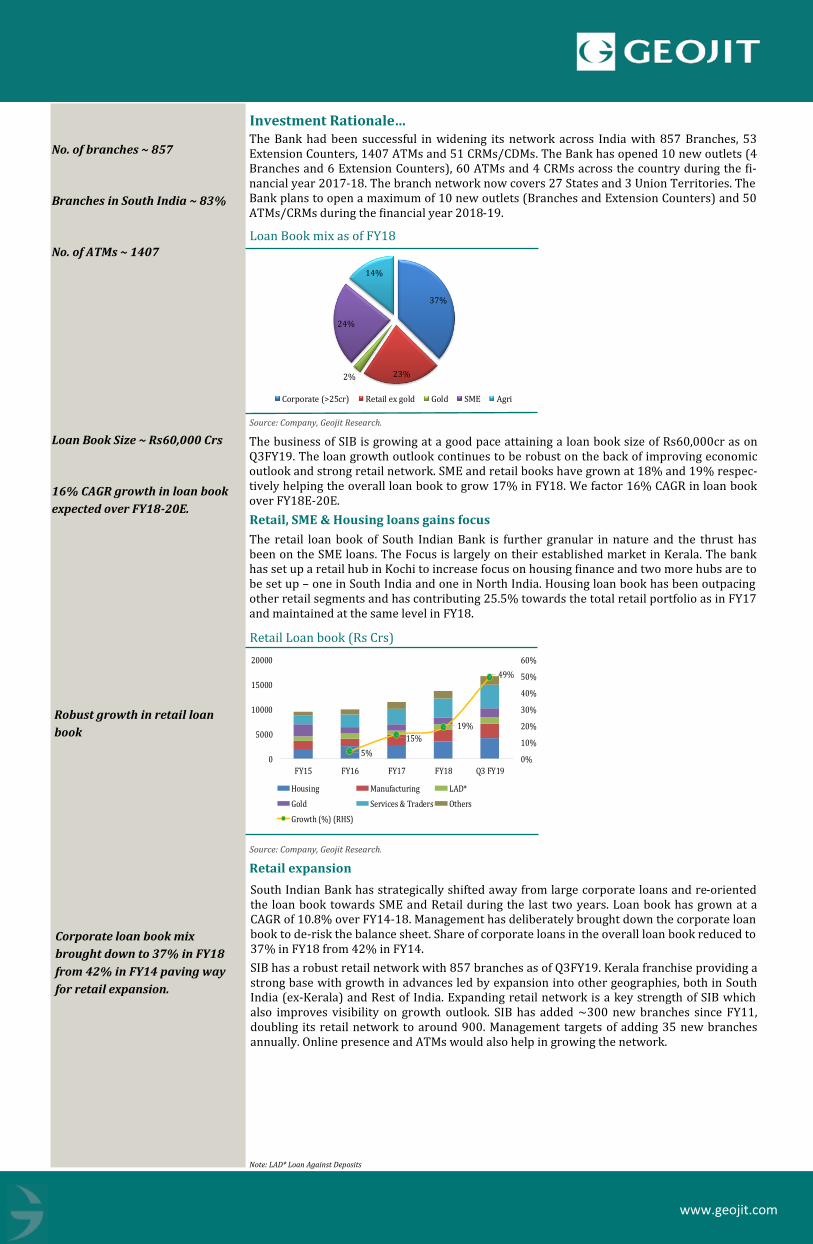
The retail loan book of South Indian Bank is further granular in nature and the thrust has been on the SME loans. The Focus is largely on their established market in Kerala. The bank has set up a retail hub in Kochi to increase focus on housing finance and two more hubs are to be set up – one in South India and one in North India. Housing loan book has been outpacing other retail segments and has contributing 25.5% towards the total retail portfolio as in FY17 and maintained at the same level in FY18.
Retail Loan book (Rs Crs)
South Indian Bank has strategically shifted away from large corporate loans and re-oriented the loan book towards SME and Retail during the last two years. Loan book has grown at a CAGR of 10.8% over FY14-18. Management has deliberately brought down the corporate loan book to de-risk the balance sheet. Share of corporate loans in the overall loan book reduced to 37% in FY18 from 42% in FY14.
SIB has a robust retail network with 857 branches as of Q3FY19. Kerala franchise providing a strong base with growth in advances led by expansion into other geographies, both in South India (ex-Kerala) and Rest of India. Expanding retail network is a key strength of SIB which also improves visibility on growth outlook. SIB has added ~300 new branches since FY11, doubling its retail network to around 900. Management targets of adding 35 new branches annually. Online presence and ATMs would also help in growing the network.
Source: Company, Geojit Research.
Source: Company, Geojit Research.
Retail expansion
37%
23%2%
24%
14%
Corporate (>25cr) Retail ex gold Gold SME Agri
5%
15%
19%
49%
0%
10%
20%
30%
40%
50%
60%
0
5000
10000
15000
20000
FY15 FY16 FY17 FY18 Q3 FY19
Housing Manufacturing LAD*
Gold Services & Traders Others
Growth (%) (RHS)
Note: LAD* Loan Against Deposits
No. of branches ~ 857
Branches in South India ~ 83%
No. of ATMs ~ 1407
Loan Book Size ~ Rs60,000 Crs
16% CAGR growth in loan book
expected over FY18-20E.
Robust growth in retail loan
book
Corporate loan book mix
brought down to 37% in FY18
from 42% in FY14 paving way
for retail expansion.
www.geojit.com
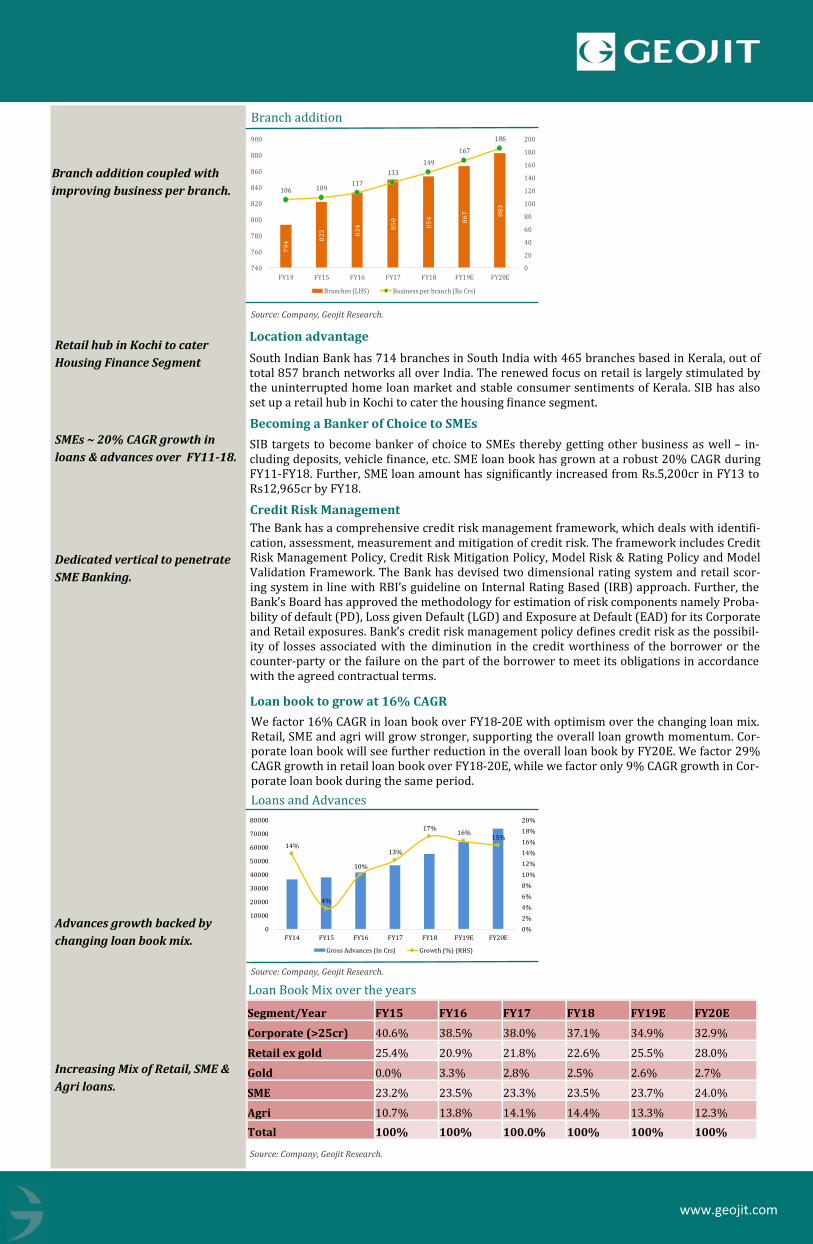
Branch addition
Source: Company, Geojit Research.
Location advantage
South Indian Bank has 714 branches in South India with 465 branches based in Kerala, out of total 857 branch networks all over India. The renewed focus on retail is largely stimulated by the uninterrupted home loan market and stable consumer sentiments of Kerala. SIB has also set up a retail hub in Kochi to cater the housing finance segment.
Becoming a Banker of Choice to SMEs
SIB targets to become banker of choice to SMEs thereby getting other business as well – in-cluding deposits, vehicle finance, etc. SME loan book has grown at a robust 20% CAGR during FY11-FY18. Further, SME loan amount has significantly increased from Rs.5,200cr in FY13 to Rs12,965cr by FY18.
Credit Risk Management
The Bank has a comprehensive credit risk management framework, which deals with identifi-cation, assessment, measurement and mitigation of credit risk. The framework includes Credit Risk Management Policy, Credit Risk Mitigation Policy, Model Risk & Rating Policy and Model Validation Framework. The Bank has devised two dimensional rating system and retail scor-ing system in line with RBI’s guideline on Internal Rating Based (IRB) approach. Further, the Bank’s Board has approved the methodology for estimation of risk components namely Proba-bility of default (PD), Loss given Default (LGD) and Exposure at Default (EAD) for its Corporate and Retail exposures. Bank’s credit risk management policy defines credit risk as the possibil-ity of losses associated with the diminution in the credit worthiness of the borrower or the counter-party or the failure on the part of the borrower to meet its obligations in accordance with the agreed contractual terms.
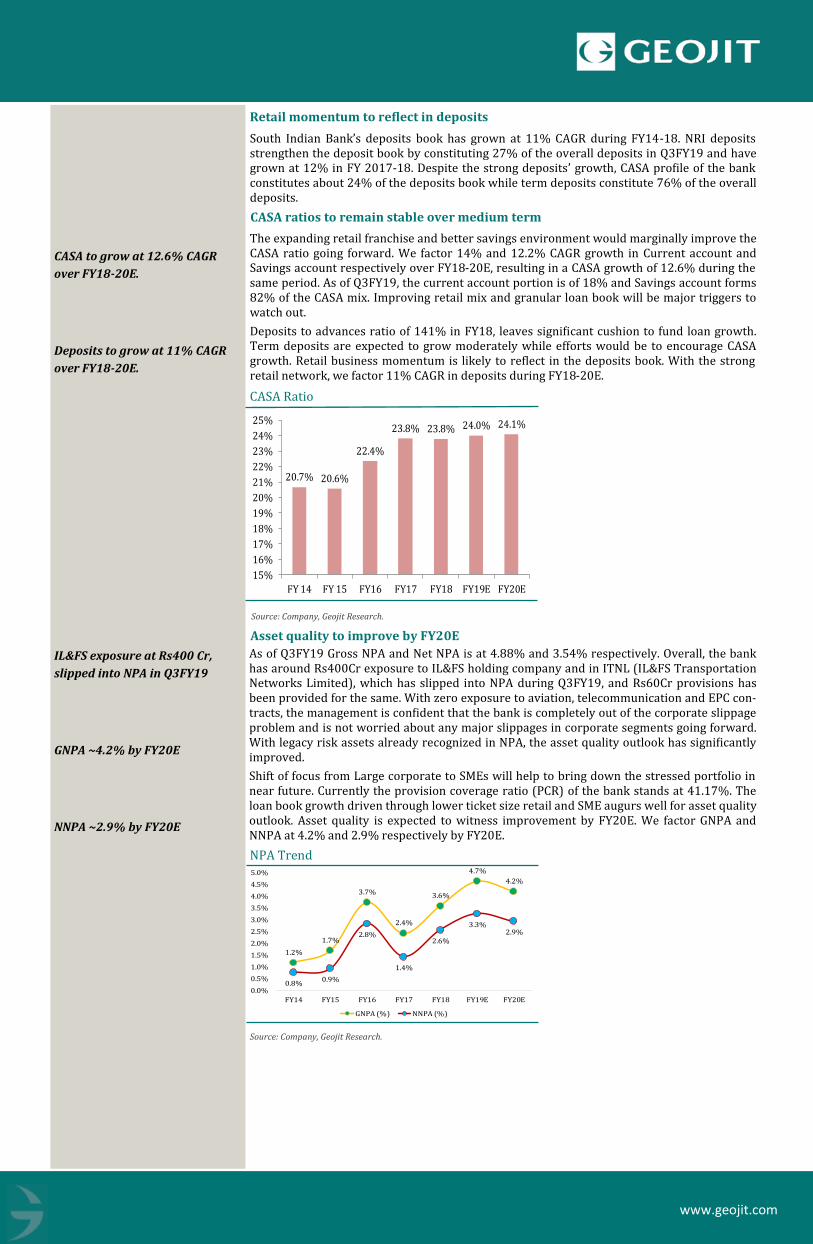
Loan book to grow at 16% CAGR
We factor 16% CAGR in loan book over FY18-20E with optimism over the changing loan mix. Retail, SME and agri will grow stronger, supporting the overall loan growth momentum. Cor-porate loan book will see further reduction in the overall loan book by FY20E. We factor 29% CAGR growth in retail loan book over FY18-20E, while we factor only 9% CAGR growth in Cor-porate loan book during the same period.
Loans and Advances
Source: Company, Geojit Research.
Loan Book Mix over the years
Source: Company, Geojit Research.
79
4 82
2 83
4 85
0
85
4 86
7 88
3
106 109117
133
149
167
186
0
20
40
60
80
100
120
140
160
180
200
740
760
780
800
820
840
860
880
900
FY14 FY15 FY16 FY17 FY18 FY19E FY20E
Branches (LHS) Business per branch (Rs Crs)
14%
4%
10%
13%
17%16%
15%
0%
2%
4%
6%
8%
10%
12%
14%
16%
18%
20%
0
10000
20000
30000
40000
50000
60000
70000
80000
FY14 FY15 FY16 FY17 FY18 FY19E FY20E
Gross Advances (In Crs) Growth (%) (RHS)
Branch addition coupled with
improving business per branch.
Retail hub in Kochi to cater
Housing Finance Segment
SMEs ~ 20% CAGR growth in
loans & advances over FY11-18.
Dedicated vertical to penetrate
SME Banking.
Advances growth backed by
changing loan book mix.
Increasing Mix of Retail, SME &
Agri loans.
Segment/Year FY15 FY16 FY17 FY18 FY19E FY20E
Corporate (>25cr) 40.6% 38.5% 38.0% 37.1% 34.9% 32.9%
Retail ex gold 25.4% 20.9% 21.8% 22.6% 25.5% 28.0%
Gold 0.0% 3.3% 2.8% 2.5% 2.6% 2.7%
SME 23.2% 23.5% 23.3% 23.5% 23.7% 24.0%
Agri 10.7% 13.8% 14.1% 14.4% 13.3% 12.3%
Total 100% 100% 100.0% 100% 100% 100%
www.geojit.com
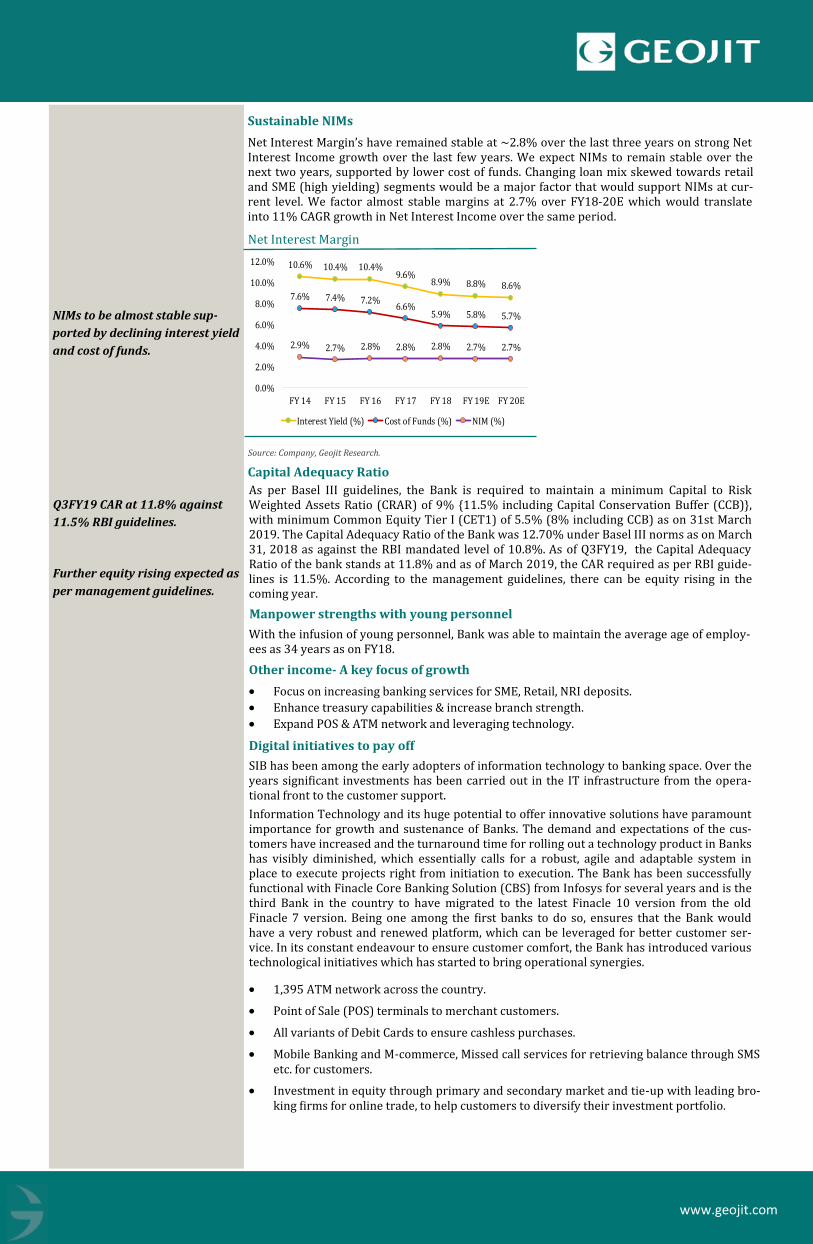
Retail momentum to reflect in deposits
South Indian Bank’s deposits book has grown at 11% CAGR during FY14-18. NRI deposits strengthen the deposit book by constituting 27% of the overall deposits in Q3FY19 and have grown at 12% in FY 2017-18. Despite the strong deposits’ growth, CASA profile of the bank constitutes about 24% of the deposits book while term deposits constitute 76% of the overall deposits.
CASA ratios to remain stable over medium term
The expanding retail franchise and better savings environment would marginally improve the CASA ratio going forward. We factor 14% and 12.2% CAGR growth in Current account and Savings account respectively over FY18-20E, resulting in a CASA growth of 12.6% during the same period. As of Q3FY19, the current account portion is of 18% and Savings account forms 82% of the CASA mix. Improving retail mix and granular loan book will be major triggers to watch out.
Deposits to advances ratio of 141% in FY18, leaves significant cushion to fund loan growth. Term deposits are expected to grow moderately while efforts would be to encourage CASA growth. Retail business momentum is likely to reflect in the deposits book. With the strong retail network, we factor 11% CAGR in deposits during FY18-20E.
As of Q3FY19 Gross NPA and Net NPA is at 4.88% and 3.54% respectively. Overall, the bank has around Rs400Cr exposure to IL&FS holding company and in ITNL (IL&FS Transportation Networks Limited), which has slipped into NPA during Q3FY19, and Rs60Cr provisions has been provided for the same. With zero exposure to aviation, telecommunication and EPC con-tracts, the management is confident that the bank is completely out of the corporate slippage problem and is not worried about any major slippages in corporate segments going forward. With legacy risk assets already recognized in NPA, the asset quality outlook has significantly improved.
Shift of focus from Large corporate to SMEs will help to bring down the stressed portfolio in near future. Currently the provision coverage ratio (PCR) of the bank stands at 41.17%. The loan book growth driven through lower ticket size retail and SME augurs well for asset quality outlook. Asset quality is expected to witness improvement by FY20E. We factor GNPA and NNPA at 4.2% and 2.9% respectively by FY20E.
Source: Company, Geojit Research.
CASA Ratio
Asset quality to improve by FY20E
NPA Trend
Source: Company, Geojit Research.
20.7% 20.6%
22.4%
23.8% 23.8% 24.0% 24.1%
15%
16%
17%
18%
19%
20%
21%
22%
23%
24%
25%
FY 14 FY 15 FY16 FY17 FY18 FY19E FY20E
1.2%
1.7%
3.7%
2.4%
3.6%
4.7%
4.2%
0.8%0.9%
2.8%
1.4%
2.6%
3.3%2.9%
0.0%
0.5%
1.0%
1.5%
2.0%
2.5%
3.0%
3.5%
4.0%
4.5%
5.0%
FY14 FY15 FY16 FY17 FY18 FY19E FY20E
GNPA (%) NNPA (%)
CASA to grow at 12.6% CAGR
over FY18-20E.
Deposits to grow at 11% CAGR
over FY18-20E.
IL&FS exposure at Rs400 Cr,
slipped into NPA in Q3FY19
GNPA ~4.2% by FY20E
NNPA ~2.9% by FY20E
www.geojit.com
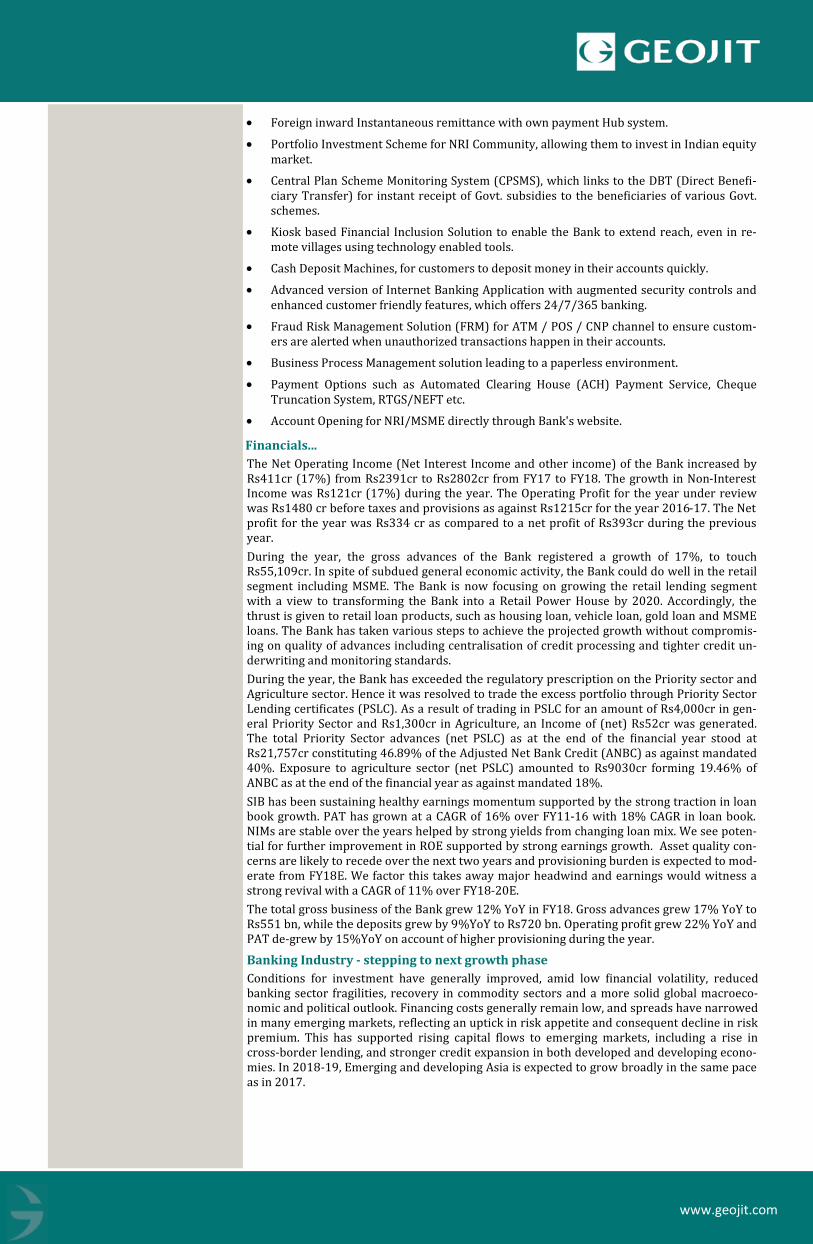
Sustainable NIMs
Net Interest Margin’s have remained stable at ~2.8% over the last three years on strong Net Interest Income growth over the last few years. We expect NIMs to remain stable over the next two years, supported by lower cost of funds. Changing loan mix skewed towards retail and SME (high yielding) segments would be a major factor that would support NIMs at cur-rent level. We factor almost stable margins at 2.7% over FY18-20E which would translate into 11% CAGR growth in Net Interest Income over the same period.
Net Interest Margin
As per Basel III guidelines, the Bank is required to maintain a minimum Capital to Risk Weighted Assets Ratio (CRAR) of 9% {11.5% including Capital Conservation Buffer (CCB)}, with minimum Common Equity Tier I (CET1) of 5.5% (8% including CCB) as on 31st March 2019. The Capital Adequacy Ratio of the Bank was 12.70% under Basel III norms as on March 31, 2018 as against the RBI mandated level of 10.8%. As of Q3FY19, the Capital Adequacy Ratio of the bank stands at 11.8% and as of March 2019, the CAR required as per RBI guide-lines is 11.5%. According to the management guidelines, there can be equity rising in the coming year.
Source: Company, Geojit Research.
Capital Adequacy Ratio
Manpower strengths with young personnel
With the infusion of young personnel, Bank was able to maintain the average age of employ-ees as 34 years as on FY18.
Other income- A key focus of growth
• Focus on increasing banking services for SME, Retail, NRI deposits.
• Enhance treasury capabilities & increase branch strength.
• Expand POS & ATM network and leveraging technology.
Digital initiatives to pay off
SIB has been among the early adopters of information technology to banking space. Over the years significant investments has been carried out in the IT infrastructure from the opera-tional front to the customer support.
Information Technology and its huge potential to offer innovative solutions have paramount importance for growth and sustenance of Banks. The demand and expectations of the cus-tomers have increased and the turnaround time for rolling out a technology product in Banks has visibly diminished, which essentially calls for a robust, agile and adaptable system in place to execute projects right from initiation to execution. The Bank has been successfully functional with Finacle Core Banking Solution (CBS) from Infosys for several years and is the third Bank in the country to have migrated to the latest Finacle 10 version from the old Finacle 7 version. Being one among the first banks to do so, ensures that the Bank would have a very robust and renewed platform, which can be leveraged for better customer ser-vice. In its constant endeavour to ensure customer comfort, the Bank has introduced various technological initiatives which has started to bring operational synergies.
10.6% 10.4% 10.4%9.6%
8.9% 8.8% 8.6%7.6% 7.4% 7.2%
6.6%5.9% 5.8% 5.7%
2.9% 2.7% 2.8% 2.8% 2.8% 2.7% 2.7%
0.0%
2.0%
4.0%
6.0%
8.0%
10.0%
12.0%
FY 14 FY 15 FY 16 FY 17 FY 18 FY 19E FY 20E
Interest Yield (%) Cost of Funds (%) NIM (%)
• 1,395 ATM network across the country.
• Point of Sale (POS) terminals to merchant customers.
• All variants of Debit Cards to ensure cashless purchases.
• Mobile Banking and M-commerce, Missed call services for retrieving balance through SMS etc. for customers.
• Investment in equity through primary and secondary market and tie-up with leading bro-king firms for online trade, to help customers to diversify their investment portfolio.
NIMs to be almost stable sup-
ported by declining interest yield
and cost of funds.
Q3FY19 CAR at 11.8% against
11.5% RBI guidelines.
Further equity rising expected as
per management guidelines.
www.geojit.com
27th December 2018
Financials...
The Net Operating Income (Net Interest Income and other income) of the Bank increased by Rs411cr (17%) from Rs2391cr to Rs2802cr from FY17 to FY18. The growth in Non-Interest Income was Rs121cr (17%) during the year. The Operating Profit for the year under review was Rs1480 cr before taxes and provisions as against Rs1215cr for the year 2016-17. The Net profit for the year was Rs334 cr as compared to a net profit of Rs393cr during the previous year.
During the year, the gross advances of the Bank registered a growth of 17%, to touch Rs55,109cr. In spite of subdued general economic activity, the Bank could do well in the retail segment including MSME. The Bank is now focusing on growing the retail lending segment with a view to transforming the Bank into a Retail Power House by 2020. Accordingly, the thrust is given to retail loan products, such as housing loan, vehicle loan, gold loan and MSME loans. The Bank has taken various steps to achieve the projected growth without compromis-ing on quality of advances including centralisation of credit processing and tighter credit un-derwriting and monitoring standards.
During the year, the Bank has exceeded the regulatory prescription on the Priority sector and Agriculture sector. Hence it was resolved to trade the excess portfolio through Priority Sector Lending certificates (PSLC). As a result of trading in PSLC for an amount of Rs4,000cr in gen-eral Priority Sector and Rs1,300cr in Agriculture, an Income of (net) Rs52cr was generated. The total Priority Sector advances (net PSLC) as at the end of the financial year stood at Rs21,757cr constituting 46.89% of the Adjusted Net Bank Credit (ANBC) as against mandated 40%. Exposure to agriculture sector (net PSLC) amounted to Rs9030cr forming 19.46% of ANBC as at the end of the financial year as against mandated 18%.
SIB has been sustaining healthy earnings momentum supported by the strong traction in loan book growth. PAT has grown at a CAGR of 16% over FY11-16 with 18% CAGR in loan book. NIMs are stable over the years helped by strong yields from changing loan mix. We see poten-tial for further improvement in ROE supported by strong earnings growth. Asset quality con-cerns are likely to recede over the next two years and provisioning burden is expected to mod-erate from FY18E. We factor this takes away major headwind and earnings would witness a strong revival with a CAGR of 11% over FY18-20E.
The total gross business of the Bank grew 12% YoY in FY18. Gross advances grew 17% YoY to Rs551 bn, while the deposits grew by 9%YoY to Rs720 bn. Operating profit grew 22% YoY and PAT de-grew by 15%YoY on account of higher provisioning during the year.
• Foreign inward Instantaneous remittance with own payment Hub system.
• Portfolio Investment Scheme for NRI Community, allowing them to invest in Indian equity market.
• Central Plan Scheme Monitoring System (CPSMS), which links to the DBT (Direct Benefi-ciary Transfer) for instant receipt of Govt. subsidies to the beneficiaries of various Govt. schemes.
• Kiosk based Financial Inclusion Solution to enable the Bank to extend reach, even in re-mote villages using technology enabled tools.
• Cash Deposit Machines, for customers to deposit money in their accounts quickly.
• Advanced version of Internet Banking Application with augmented security controls and enhanced customer friendly features, which offers 24/7/365 banking.
• Fraud Risk Management Solution (FRM) for ATM / POS / CNP channel to ensure custom-ers are alerted when unauthorized transactions happen in their accounts.
• Business Process Management solution leading to a paperless environment.
• Payment Options such as Automated Clearing House (ACH) Payment Service, Cheque Truncation System, RTGS/NEFT etc.
• Account Opening for NRI/MSME directly through Bank's website.
Banking Industry - stepping to next growth phase
Conditions for investment have generally improved, amid low financial volatility, reduced banking sector fragilities, recovery in commodity sectors and a more solid global macroeco-nomic and political outlook. Financing costs generally remain low, and spreads have narrowed in many emerging markets, reflecting an uptick in risk appetite and consequent decline in risk premium. This has supported rising capital flows to emerging markets, including a rise in cross-border lending, and stronger credit expansion in both developed and developing econo-mies. In 2018-19, Emerging and developing Asia is expected to grow broadly in the same pace as in 2017.
www.geojit.com
India’s macroeconomic fundamentals continued to improve from last year on the back of sig-nificant policy initiatives by the Government, supported by a stable monetary policy. The re-cent 25bps reduction in the repo rate will also act as a boost to banks and financial compa-nies. After lagging for five consecutive quarters, economic growth in India is turning around. India has emerged as the fastest growing major economy in the world. India’s GDP is estimat-ed to have increased to 6.7% in 2017-18 and is expected to grow by 7.2% in 2018-19, as per (Central Statistics Office) CSO estimates. Looking forward, the economic growth is expected to gather momentum.
Focusing on the banking sector, the coming year will test the effectiveness of the much await-ed Insolvency and Bankruptcy Code (IBC). Successful resolution of cases admitted in National Company Law Tribunal (NCLT) is crucial to the banking sector, considering the large amount of stressed assets. Considering the sticky Non Performing Assets (NPA) menace, the Reserve Bank of India (RBI) laid out conservative asset classification norms. Though the RBI norms will cause short-term pain to the banking industry in terms of sector profitability and capital adequacy, the same would force banks to clean up their balance sheets. In addition to the NPA trouble, the recently discovered large value frauds in banks dented the image of Indian banks as flag bearers of financial prudence, conservatism and judicious lending. During the year un-der review, the Reserve Bank of India has initiated various measures to ensure that the sys-tem, operational processes, cyber security and risk management for the banking sector are sound, safe and healthy.
Positive economic prospects
The growth of the banking industry is closely linked with the overall economic growth. India is one of the emerging world economies and will continue to be so for the few years to come. This will be coupled with the growth in infrastructure, industry, services and agriculture sec-tor. Together, these are expected to boost the economy’s corporate credit growth, providing better lending opportunities to banks.
Rising income: The rising income is expected to drive retail credit growth. India demon-strate a conservative outlook towards credit. But with higher disposable income and better exposure to products, consumers are gradually showing a positive willingness towards taking credit. This particularly holds true for young customers.
Remonetisation: With the accelerated pace of remonetisation and discretionary consumer spending held back by demonetisation is expected to have picked up from Q416-17 and will gather momentum over several quarters ahead. The recovery is also likely to be aided by the reduction in banks’ lending rates due to large inflows of current and savings accounts (CASA) deposits. Although the fuller transmission impact might be impeded by stressed balance sheets of banks and the tepid demand for bank credit
About the company…
South Indian Bank is one of the oldest bank in India which came into the existence during the swadeshi movement and was the first among the private sector banks in Kerala to become a scheduled bank in 1946 under the RBI Act. With a branch network of 857, 53 extensive coun-ters and 1,407 ATMs, SIB has enhanced its presence across India. SIB is the third largest branch network among Private Sector banks, in India, with all its branches under Core bank-ing System.
Opened a Currency Chest on behalf of the RBI in April 1992 and a NRI branch in November 1992. SIB is the first bank in the private sector to start an Industrial Finance Branch in March 1993. The first bank in Kerala to develop in-house, fully integrated branch automation soft-ware in addition to the in-house partial automation solution operational since 1992. The FIRST Kerala based bank to implement Core Banking System.
Key Risks...
• Any unforeseen economic and industrial slowdown may impact the asset quality assump-tions.
• Due to large exposure to SME, any further slowdown in economic activities may impact deposit and loan growth.
www.geojit.com
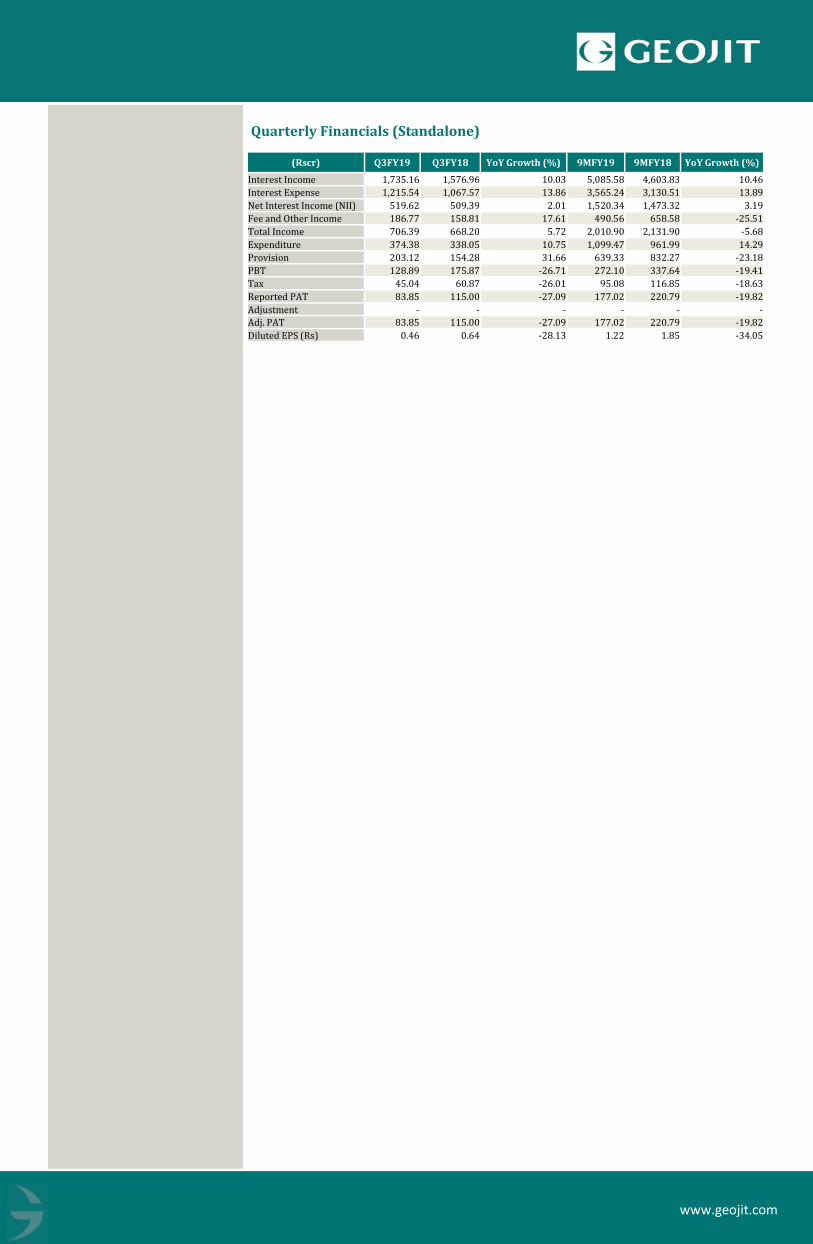
(Rscr) Q3FY19 Q3FY18 YoY Growth (%) 9MFY19 9MFY18 YoY Growth (%)
Interest Income 1,735.16 1,576.96 10.03 5,085.58 4,603.83 10.46
Interest Expense 1,215.54 1,067.57 13.86 3,565.24 3,130.51 13.89
Net Interest Income (NII) 519.62 509.39 2.01 1,520.34 1,473.32 3.19
Fee and Other Income 186.77 158.81 17.61 490.56 658.58 -25.51
Total Income 706.39 668.20 5.72 2,010.90 2,131.90 -5.68
Expenditure 374.38 338.05 10.75 1,099.47 961.99 14.29
Provision 203.12 154.28 31.66 639.33 832.27 -23.18
PBT 128.89 175.87 -26.71 272.10 337.64 -19.41
Tax 45.04 60.87 -26.01 95.08 116.85 -18.63
Reported PAT 83.85 115.00 -27.09 177.02 220.79 -19.82
Adjustment - - - - - -
Adj. PAT 83.85 115.00 -27.09 177.02 220.79 -19.82
Diluted EPS (Rs) 0.46 0.64 -28.13 1.22 1.85 -34.05
Quarterly Financials (Standalone)
www.geojit.com
27th December 2018
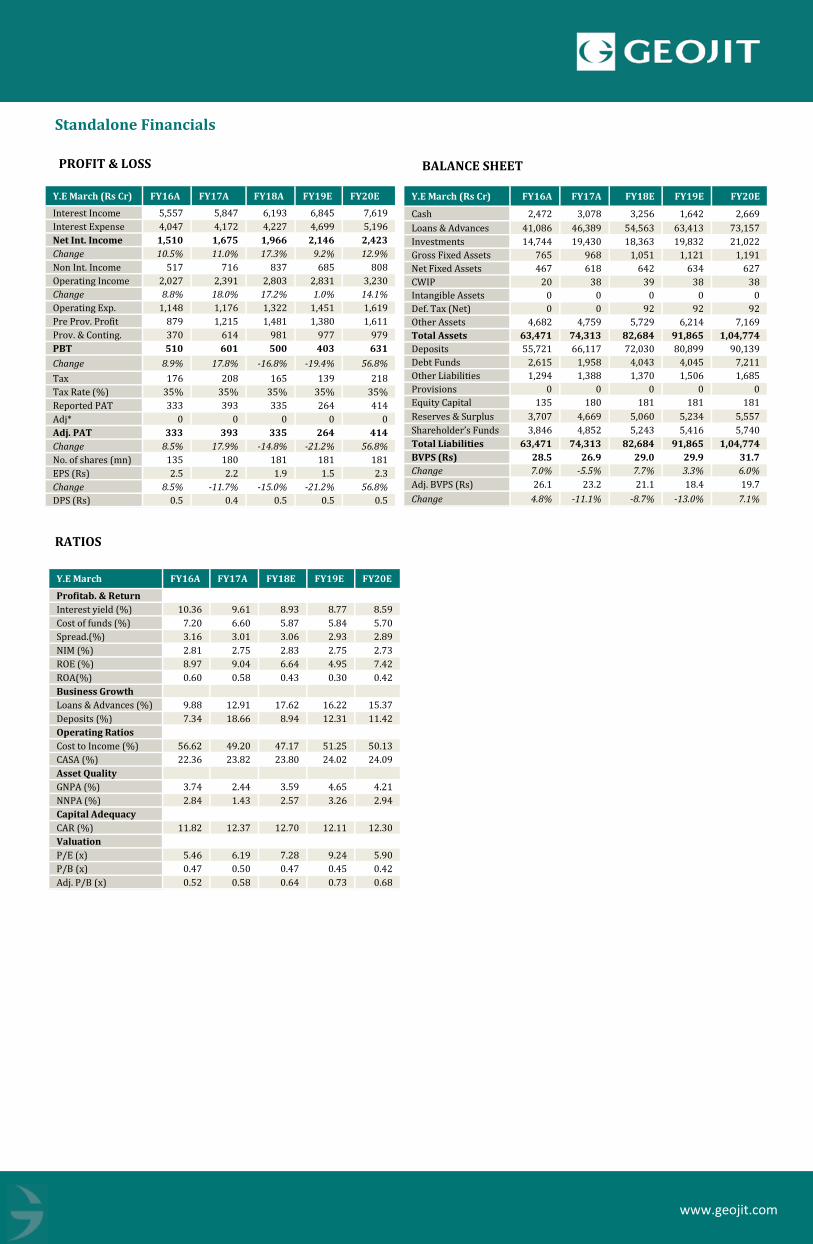
Standalone Financials
Y.E March (Rs Cr) FY16A FY17A FY18A FY19E FY20E
Interest Income 5,557 5,847 6,193 6,845 7,619
Interest Expense 4,047 4,172 4,227 4,699 5,196
Net Int. Income 1,510 1,675 1,966 2,146 2,423
Change 10.5% 11.0% 17.3% 9.2% 12.9%
Non Int. Income 517 716 837 685 808
Operating Income 2,027 2,391 2,803 2,831 3,230
Change 8.8% 18.0% 17.2% 1.0% 14.1%
Operating Exp. 1,148 1,176 1,322 1,451 1,619
Pre Prov. Profit 879 1,215 1,481 1,380 1,611
Prov. & Conting. 370 614 981 977 979
PBT 510 601 500 403 631
Change 8.9% 17.8% -16.8% -19.4% 56.8%
Tax 176 208 165 139 218
Tax Rate (%) 35% 35% 35% 35% 35%
Reported PAT 333 393 335 264 414
Adj* 0 0 0 0 0
Adj. PAT 333 393 335 264 414
Change 8.5% 17.9% -14.8% -21.2% 56.8%
No. of shares (mn) 135 180 181 181 181
EPS (Rs) 2.5 2.2 1.9 1.5 2.3
Change 8.5% -11.7% -15.0% -21.2% 56.8%
DPS (Rs) 0.5 0.4 0.5 0.5 0.5
Y.E March (Rs Cr) FY16A FY17A FY18E FY19E FY20E
Cash 2,472 3,078 3,256 1,642 2,669
Loans & Advances 41,086 46,389 54,563 63,413 73,157
Investments 14,744 19,430 18,363 19,832 21,022
Gross Fixed Assets 765 968 1,051 1,121 1,191
Net Fixed Assets 467 618 642 634 627
CWIP 20 38 39 38 38
Intangible Assets 0 0 0 0 0
Def. Tax (Net) 0 0 92 92 92
Other Assets 4,682 4,759 5,729 6,214 7,169
Total Assets 63,471 74,313 82,684 91,865 1,04,774
Deposits 55,721 66,117 72,030 80,899 90,139
Debt Funds 2,615 1,958 4,043 4,045 7,211
Other Liabilities 1,294 1,388 1,370 1,506 1,685
Provisions 0 0 0 0 0
Equity Capital 135 180 181 181 181
Reserves & Surplus 3,707 4,669 5,060 5,234 5,557
Shareholder’s Funds 3,846 4,852 5,243 5,416 5,740
Total Liabilities 63,471 74,313 82,684 91,865 1,04,774
BVPS (Rs) 28.5 26.9 29.0 29.9 31.7
Change 7.0% -5.5% 7.7% 3.3% 6.0%
Adj. BVPS (Rs) 26.1 23.2 21.1 18.4 19.7
Change 4.8% -11.1% -8.7% -13.0% 7.1%
Y.E March FY16A FY17A FY18E FY19E FY20E
Profitab. & Return
Interest yield (%) 10.36 9.61 8.93 8.77 8.59
Cost of funds (%) 7.20 6.60 5.87 5.84 5.70
Spread.(%) 3.16 3.01 3.06 2.93 2.89
NIM (%) 2.81 2.75 2.83 2.75 2.73
ROE (%) 8.97 9.04 6.64 4.95 7.42
ROA(%) 0.60 0.58 0.43 0.30 0.42
Business Growth
Loans & Advances (%) 9.88 12.91 17.62 16.22 15.37
Deposits (%) 7.34 18.66 8.94 12.31 11.42
Operating Ratios
Cost to Income (%) 56.62 49.20 47.17 51.25 50.13
CASA (%) 22.36 23.82 23.80 24.02 24.09
Asset Quality
GNPA (%) 3.74 2.44 3.59 4.65 4.21
NNPA (%) 2.84 1.43 2.57 3.26 2.94
Capital Adequacy
CAR (%) 11.82 12.37 12.70 12.11 12.30
Valuation
P/E (x) 5.46 6.19 7.28 9.24 5.90
P/B (x) 0.47 0.50 0.47 0.45 0.42
Adj. P/B (x) 0.52 0.58 0.64 0.73 0.68
PROFIT & LOSS BALANCE SHEET
RATIOS
www.geojit.com
Source: Bloomberg, Geojit Research.
27th December 2018
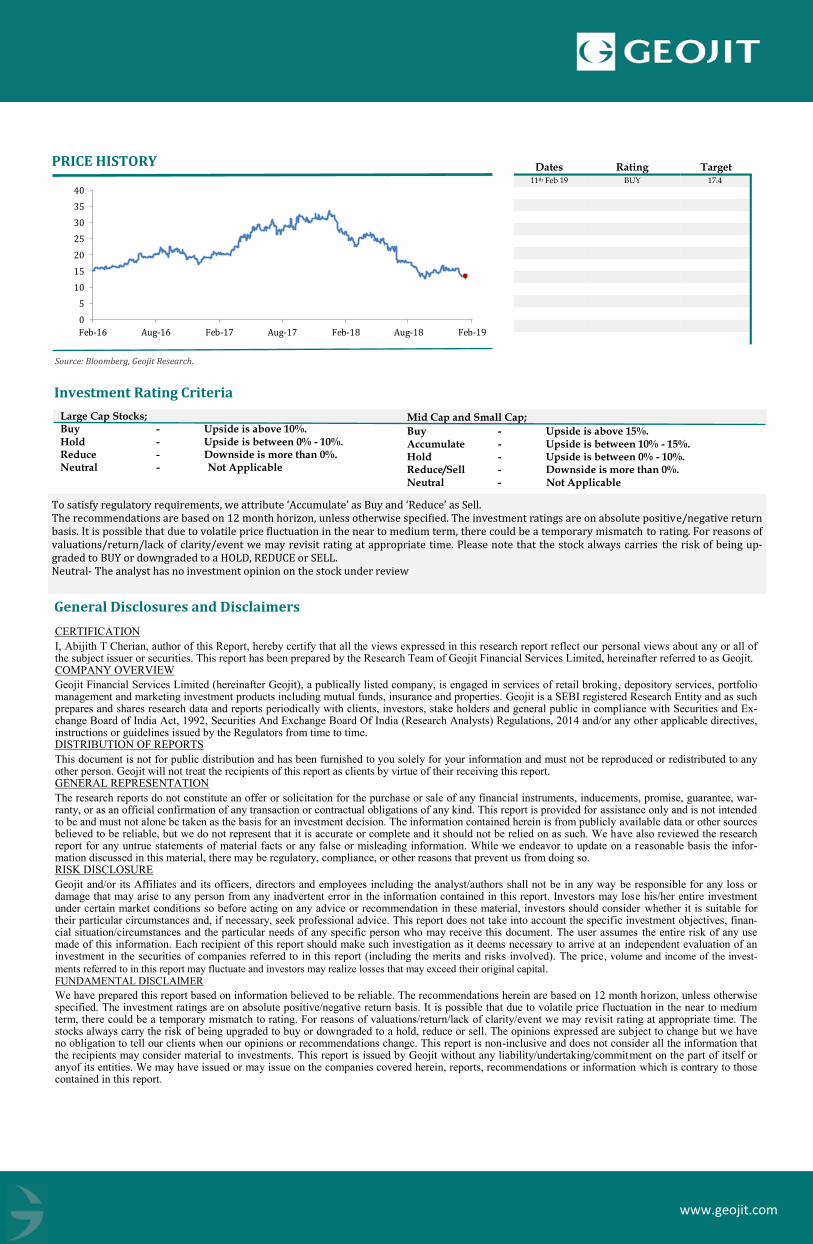
PRICE HISTORY Dates Rating Target 11th Feb 19 BUY 17.4
Investment Rating Criteria
Large Cap Stocks; Buy - Upside is above 10%. Hold - Upside is between 0% - 10%. Reduce - Downside is more than 0%. Neutral - Not Applicable
Mid Cap and Small Cap; Buy - Upside is above 15%. Accumulate - Upside is between 10% - 15%. Hold - Upside is between 0% - 10%. Reduce/Sell - Downside is more than 0%. Neutral - Not Applicable
To satisfy regulatory requirements, we attribute ‘Accumulate’ as Buy and ‘Reduce’ as Sell. The recommendations are based on 12 month horizon, unless otherwise specified. The investment ratings are on absolute positive/negative return basis. It is possible that due to volatile price fluctuation in the near to medium term, there could be a temporary mismatch to rating. For reasons of valuations/return/lack of clarity/event we may revisit rating at appropriate time. Please note that the stock always carries the risk of being up-graded to BUY or downgraded to a HOLD, REDUCE or SELL. Neutral- The analyst has no investment opinion on the stock under review
General Disclosures and Disclaimers
CERTIFICATION
I, Abijith T Cherian, author of this Report, hereby certify that all the views expressed in this research report reflect our personal views about any or all of the subject issuer or securities. This report has been prepared by the Research Team of Geojit Financial Services Limited, hereinafter referred to as Geojit. COMPANY OVERVIEW
Geojit Financial Services Limited (hereinafter Geojit), a publically listed company, is engaged in services of retail broking, depository services, portfolio management and marketing investment products including mutual funds, insurance and properties. Geojit is a SEBI registered Research Entity and as such prepares and shares research data and reports periodically with clients, investors, stake holders and general public in compliance with Securities and Ex-change Board of India Act, 1992, Securities And Exchange Board Of India (Research Analysts) Regulations, 2014 and/or any other applicable directives, instructions or guidelines issued by the Regulators from time to time. DISTRIBUTION OF REPORTS
This document is not for public distribution and has been furnished to you solely for your information and must not be reproduced or redistributed to any other person. Geojit will not treat the recipients of this report as clients by virtue of their receiving this report. GENERAL REPRESENTATION
The research reports do not constitute an offer or solicitation for the purchase or sale of any financial instruments, inducements, promise, guarantee, war-ranty, or as an official confirmation of any transaction or contractual obligations of any kind. This report is provided for assistance only and is not intended to be and must not alone be taken as the basis for an investment decision. The information contained herein is from publicly available data or other sources believed to be reliable, but we do not represent that it is accurate or complete and it should not be relied on as such. We have also reviewed the research report for any untrue statements of material facts or any false or misleading information. While we endeavor to update on a reasonable basis the infor-mation discussed in this material, there may be regulatory, compliance, or other reasons that prevent us from doing so. RISK DISCLOSURE
Geojit and/or its Affiliates and its officers, directors and employees including the analyst/authors shall not be in any way be responsible for any loss or damage that may arise to any person from any inadvertent error in the information contained in this report. Investors may lose his/her entire investment under certain market conditions so before acting on any advice or recommendation in these material, investors should consider whether it is suitable for their particular circumstances and, if necessary, seek professional advice. This report does not take into account the specific investment objectives, finan-cial situation/circumstances and the particular needs of any specific person who may receive this document. The user assumes the entire risk of any use made of this information. Each recipient of this report should make such investigation as it deems necessary to arrive at an independent evaluation of an investment in the securities of companies referred to in this report (including the merits and risks involved). The price, volume and income of the invest-
ments referred to in this report may fluctuate and investors may realize losses that may exceed their original capital. FUNDAMENTAL DISCLAIMER
We have prepared this report based on information believed to be reliable. The recommendations herein are based on 12 month horizon, unless otherwise specified. The investment ratings are on absolute positive/negative return basis. It is possible that due to volatile price fluctuation in the near to medium term, there could be a temporary mismatch to rating. For reasons of valuations/return/lack of clarity/event we may revisit rating at appropriate time. The stocks always carry the risk of being upgraded to buy or downgraded to a hold, reduce or sell. The opinions expressed are subject to change but we have no obligation to tell our clients when our opinions or recommendations change. This report is non-inclusive and does not consider all the information that the recipients may consider material to investments. This report is issued by Geojit without any liability/undertaking/commitment on the part of itself or anyof its entities. We may have issued or may issue on the companies covered herein, reports, recommendations or information which is contrary to those contained in this report.
0
5
10
15
20
25
30
35
40
Feb-16 Aug-16 Feb-17 Aug-17 Feb-18 Aug-18 Feb-19
www.geojit.com
27th December 2018
The projections and forecasts described in this report should be evaluated keeping in mind the fact that these are based on estimates and assumptions and will vary from actual results over a period of time. The actual performance of the companies represented in the report may vary from those projected. These are not scientifically proven to guarantee certain intended results and hence, are not published as a warranty and do not carry any evidentiary value whatso-ever. These are not to be relied on in or as contractual, legal or tax advice. Prospective investors and others are cautioned that any forward-looking state-ments are not predictions and may be subject to change without notice. JURISDICTION
The securities described herein may not be eligible for sale in all jurisdictions or to all categories of investors. The countries in which the companies men-tioned in this report are organized may have restrictions on investments, voting rights or dealings in securities by nationals of other countries. Distributing/taking/sending/dispatching/transmitting this document in certain foreign jurisdictions may be restricted by law, and persons into whose possession this document comes should inform themselves about, and observe any such restrictions. Failure to comply with this restriction may constitute a violation of any foreign jurisdiction laws. Foreign currencies denominated securities are subject to fluctuations in exchange rates that could have an adverse effect on the value or price of or income derived from the investment. Investors in securities such as ADRs, the value of which are influenced by foreign currencies effectively assume currency risk. REGULATORY DISCLOSURES:
Geojit’s Associates consists of privately held companies such as Geojit Technologies Private Limited (GTPL- Software Solutions provider), Geojit Credits Private Limited (GCPL- NBFC Services provider), Geojit Investment Services Limited (GISL- Corporate Agent for Insurance products), Geojit Financial Management Services Private Limited (GFMSL) &Geojit Financial Distribution Private Limited (GFDPL), (Distributors of Insurance and MF Units).In the context of the SEBI Regulations on Research Analysts (2014), Geojit affirms that we are a SEBI registered Research Entity and in the course of our busi-ness as a stock market intermediary, we issue research reports /research analysis etc that are prepared by our Research Analysts. We also affirm and under-take that no disciplinary action has been taken against us or our Analysts in connection with our business activities. In compliance with the above mentioned SEBI Regulations, the following additional disclosures are also provided which may be considered by the reader before making an investment decision: 1. Disclosures regarding Ownership*:
Geojit confirms that: It/its associates have no financial interest or any other material conflict in relation to the subject company (ies) covered herein. It/its associates have no actual beneficial ownership greater than 1% in relation to the subject company (ies) covered herein. Further, the Analyst confirms that:
he, his associates and his relatives have no financial interest in the subject company (ies) covered herein, and they have no other material conflict in the subject company.
he, his associates and his relatives have no actual/beneficial ownership greater than 1% in the subject company covered
2. Disclosures regarding Compensation:
During the past 12 months, Geojit or its Associates:
(a) Have not received any compensation from the subject company; (b) Have not managed or co-managed public offering of securities for the subject com-pany (c) Have not received any compensation for investment banking or merchant banking or brokerage services from the subject company. (d) Have not received any compensation for products or services other than investment banking or merchant banking or brokerage services from the subject company (e) Have not received any compensation or other benefits from the subject company or third party in connection with the research report (f) The subject com-pany is / was not a client during twelve months preceding the date of distribution of the research report. But Geojit have B2B relationship with the subject company. 3. Disclosure by Geojit regarding the compensation paid to its Research Analyst:
Geojit hereby confirms that no part of the compensation paid to the persons employed by it as Research Analysts is based on any specific brokerage ser-vices or transactions pertaining to trading in securities of companies contained in the Research Reports. 4. Disclosure regarding the Research Analyst’s connection with the subject company:
It is affirmed that the I, Abijith T Cherian, Research Analyst(s) of Geojit have not served as an officer, director or employee of the subject company 5. Disclosure regarding Market Making activity:
Neither Geojit/its Analysts have engaged in market making activities for the subject company. Please ensure that you have read the “Risk Disclosure Docu-ments for Capital Market and Derivatives Segments” as prescribed by the Securities and Exchange Board of India before investing.
Geojit Financial Services Ltd. (formerly known as Geojit BNP Paribas Financial Services Ltd.), Registered Office: 34/659-P, Civil Line Road, Padivattom, Kochi-682024, Kerala, India. Phone: +91 484-2901000, Website: www.geojit.com. For investor queries: [email protected], For grievances: [email protected], For compliance officer: [email protected]. Corporate Identity Number: L67120KL1994PLC008403, SEBI Stock Broker Registration No INZ000104737, Research Entity SEBI Reg No: IN-H200000345, Investment Adviser SEBI Reg No: INA200002817, Portfolio Manager: INP000003203, Depository Participant: IN-DP-325-2017, ARN Regn.Nos:0098, IRDA Corporate Agent (Composite) No.: CA0226