Embed Size (px)
Citation preview
8/6/2019 South-India Asian Elephant-Current Sceince
http://slidepdf.com/reader/full/south-india-asian-elephant-current-sceince 1/12
RESEARCH COMMUNICATIONS
CURRENT SCIENCE, VOL. 82, NO. 8, 25 APRIL 20021022
*For correspondence. (e-mail: [email protected])
activity of bats only on the night of the eclipse and
compared them with those of bats observed on the next
full moon night that occurred on 12 April 1979. In con-
trast, moonlight did not modify the activity pattern of
the microchiropteran bat Myotis lucifugus23
. In this
study the authors23 observed bat activity only for one
hour at the beginning and one hour at the end of the
night. However, moonlight did influence the foraging
activity of the same species in an another study24
.
Reith25
suggested that the bats shift their activity by
flying more under canopy or in shadow on moonlit
nights. Such microhabitat shift during bright moonlight
was also observed on ten species of vespertilionid
bats26
.
The reduced feeding activity of bats during bright
moonlight is generally viewed as an adaptation to avoid
nocturnal predators3,27. We have noted a barn owl Tyto
alba and an Indian great horned owl Bubo buboperch-ing on trees in the vicinity of our orchard. However, we
have not observed predation on fruit bats while they
were foraging. Interestingly, red fig-eating bats Steno-
derma rufum did not modify their activity in response to
moonlight possibly because of absence of bat predators
in the study area28
. We have previously observed that a
C. sphinx chased away a conspecific that was feeding
on a fruit in situ in a Psidium guajava tree during a full
moon night. Our study clearly shows that bright
moonlight suppresses the foraging activity of fruit bats
in the orchard.
1. Crespo, R. F., Linhart, S. B., Burns, R. J. and Mitchell, G. C.,
J. Mammal., 1972, 53, 366–368.
2. Erkert, H. G., Oecologia, 1974, 14, 269–287.
3. Fenton, M. B., Boyle, N. G. H., Harrison, T. M. and Oxley,
D. J., Biotropica, 1977, 9, 73–85.
4. Morrison, D. W., Anim. Behav ., 1978, 26, 852–855.
5. Nair, N. G., Elangovan, V. and Subbaraj, R., Curr. Sci., 1998,
74, 688–689.
6. Haeussler, U. and Erkert, H. G., Behav. Processes, 1978, 3,
223–239.
7. Lockard, R. B. and Owings, D. M., Anim. Behav., 1974, 22,
262–273.
8. Bowers, M. A., Ecology, 1990, 71, 2334–2344.
9. Longhand, W. S. and Price, M. V., ibid , 1991, 72, 2261–2273.
10. Jahoda, J. C., J. Mammal., 1973, 54, 544–549.11. Wolfe, J. L. and Summerlin, C. T., Anim. Behav., 1989, 37,
410–414.
12. Butynski , T. M., Afr. J. Ecol., 1984, 22 , 7–22.
13. Gilbert, B. S. and Boutin, S., Arct. Alp. Res., 1991, 23, 61–65.
14. Julian-Laferriere, D., J. Mammal., 1997, 78, 251–255.
15. Erkert, H. G., Folia Primatol., 1976, 25 , 186–192.
16. Trent, B. K., Tucker, M. E. and Lockard, J. S., Appl. Anim.
Ethol., 1977, 3, 281–286.
17. Elangovan, V. and Marimuthu, G., J. Zool., London, 2001, 253 ,
347–350.
18. Marimuthu, G., Rajan, K. E., John Koilraj, A., Suthakar Isaac,
S. and Balasingh, J., Biotropica, 1998, 30, 321–324.
19. Bhat, H. R. and Kunz, T. H., J. Zool., London, 1995, 235 , 597–
604.
20. Elangovan, V., Ph D thesis, Madurai Kamaraj University, Mad-urai, 2000.
21. Chandrashekaran, M. K. and Marimuthu, G., Bat Res. News,
1994, 35, 82.
22. Usman, K., Habersetzer, J., Subbaraj, R., Gopalakrishnaswamy,
G. and Paramanandam, K., Behav. Ecol. Sociobiol., 1980, 7, 79–
81.
23. Negraeff, E. and Brigham, R. M., Z. Saeugetierkd ., 1995, 60,
330–336.
24. Anthony, E. L. P., Stack, M. H. and Kunz, T. H., Oecologia,
1981, 51, 151–156.
25. Reith, C. C., J. Mammal., 1982, 63, 685–688.
26. Hecker, K. R. and Brigham, R. M., ibid , 1999, 80, 1196–
1201.
27. Fleming, T. H. and Heithaus, E. R., ibid , 1986, 67, 660–671.
28. Gannon, M. R. and Willig, M. R., Biotropica, 1997, 29, 525–
529.
ACKNOWLEDGEMENTS. We thank an unknown referee for
providing valuable comments on the earlier version of the paper. We
are grateful to the Ministry of Environment and Forests, Government
of India for providing grants.
Received 12 November 2001; revised accepted 29 January 2002
Conservation of a flagship species:Prioritizing Asian Elephant ( Elephas
maximus) conservation units in
southern India
Arun B. Venkataraman*, N. Venkatesa Kumar,Surendra Varma and R. Sukumar
Asian Elephant Research and Conservation Centre, Centre forEcological Sciences, Indian Institute of Science,Bangalore 560 012, India
The Asian elephant ( Elephas maximus) is believed to
number about 45,000 in the wild and is distributed
across several populations over South and SoutheastAsia. It is an important flagship species for the con-
servation of biodiversity as well as being a cultural
symbol of the people of this region. We analyse aGeographical Information System database of ad-
ministrative forest divisions constituting four Project
Elephant Reserves designated for southern India, inan attempt to prioritize them for specific conserva-
tion action and funding allocation. We compute a
conservation value for each of these divisions byusing five variables characterizing habitat, popula-
tion and biodiversity attributes. We also compute
threat values for each, using two variables whichrepresent the most significant threats. Based on a
cluster analysis we demonstrate that divisions with
high conservation values have large elephant distri-bution areas, preferred habitat areas and elephant
8/6/2019 South-India Asian Elephant-Current Sceince
http://slidepdf.com/reader/full/south-india-asian-elephant-current-sceince 2/12
RESEARCH COMMUNICATIONS
CURRENT SCIENCE, VOL. 82, NO. 8, 25 APRIL 2002 1023
numbers as dominant attributes. Divisions with the
lowest conservation values are characterized by high
levels of habitat fragmentation.Based on results obtained from the conservation
valuation which allow for the zonation of elephant
habitats, we recommend conservation action specificto resultant zones. On resolving divisions into clus-
ters, each having specific dominant attributes, we
further suggest divisions that could be targeted ei-ther for elephant or biodiversity/habitat conserva-
tion.
WHILE conservationists express dismay over the fate of
African elephants ( Loxondonta africana), there may be
as many as 600,000 free-ranging African elephants
distributed over several large populations1. In contrast,
there are possibly no more than 45,000 Asian elephants
left in the wild, with only 20 populations having more
than several hundred individuals each2,3
. The southernIndian elephant populations, among the largest in Asia
4,
are spread over a large area along the Western Ghats,
one of the global ‘hot spots’ of biodiversity, and a part
of the Eastern Ghats. Conservation action here requires
a strategic framework based on an objective assessment
of the variation in elephant habitat and population
attributes and threats. Project Elephant, instituted and
funded by the Government of India since 1992, aims to
conserve elephant populations, their habitats and overall
biodiversity in eleven designated elephant reserves
across the country5,6
.
These reserves represent the most
important elephant populations by virtue of their popu-
lation size and habitat area.
The delineation of elephant reserves has benefited
greatly from past studies where the location of popu-
lations and the extent of available habitat for each
population has been determined with some accuracy.
Furthermore, conservation of elephants within these
habitats is greatly facilitated by the existence of admini-
strative forest divisions. We therefore focus on
prioritizing elephant-bearing forest divisions. Structured
administration of elephant habitats in large parts of
southeast Asia is still in its infancy. A landscape
approach similar to the prioritization and delineation of
tiger conservation units (TCUs)7 may be more appro-priate for stimulating conservation action here.
The largest and most viable populations of the Asian
elephant ( Elephas maximus) in the wild today are in
India (22,000–28,000)2. Here, the elephant’s range in-
cludes the northeastern states of Arunachal Pradesh,
Assam, Meghalaya (a few elephants are also found in
Tripura, Mizoram and Nagaland) and West Bengal, the
northern states of Uttaranchal and Uttar Pradesh, the
east-central states of Orissa and Jharkhand (carved out
of Bihar) and four southern states of Tamil Nadu, Kar-
nataka, Kerala and Andhra Pradesh8. In southern India,
elephants are spread over the hill forests of the Western
and Eastern Ghats9. The Asian elephant is globally
categorized as endangered (A1cd) (IUCN 1996) (Ap-
pendix I) (CITES) and nationally listed under Schedule
1 of the Indian Wildlife (Protection) Act, 1972.
Elephant habitats in southern India encompass a wide
range of climatic and geographical zones and conse-
quently diverse vegetation types. These harbour high
levels of species endemism and biological diversity,
particularly among the herpetofauna and vascular
plants10,11
. The Western Ghats, for example, has 14
endemic mammals and 19 endemic birds (Daniels, R. J.
R., unpublished data), and approximately 352 endemic
tree species11,12. Forest types range from mid-elevation
evergreen forests, occupying areas in which average
annual rainfall is as high as 9000 mm, to thorn scrub
with rainfall as low as 600 mm.
Loss of elephant habitat through spread of agricul-
ture, including commercial plantations of tea and cof-fee, and developmental activities such as hydroelectric
and irrigation projects, roads, railway lines and mining,
have been the most significant threats to elephant habi-
tats. In most range areas, habitat fragmentation and loss
have caused an escalation of elephant–human conflict,
as elephants foray into agricultural lands to feed on
cultivated crops. Manslaughter by elephants and injur-
ing and killing of elephants by irate farmers accompany
this conflict. An average of 50 people are killed by
elephants every year, a significant proportion of these
occurring within settlements and cultivation. In Karna-
taka alone, at least ten animals are killed every year as a
result of human–elephant conflict. The conflict creates
adverse sentiments among local communities against
the setting-up of protected areas and other conservation
strategies targeting wildlife habitats. Poaching for ivory
selectively removes male elephants, resulting in skewed
sex ratios and causing deleterious demographic conse-
quences13.
The purpose of the paper is to offer a strategic frame-
work, which attempts to capture the variation in habitat,
population attributes and threat factors. We use a
combination of these to generate conservation values
for administrative forest divisions comprising Project
Elephant Reserves in southern India. Keeping the flag-ship concept in mind, biodiversity-related variables
such as level of endemicity of various plant and animal
taxa have also been incorporated into the conservation
valuation. We then demonstrate that this process allows
for the zonation of elephant habitats which could then
be targets of varying levels of conservation action.
Using cluster analysis we also demonstrate how these
conservation values could be interpreted in terms of
varying potential for elephant, biodiversity and habitat
conservation strategies and funding.
Elephant distribution data within the four elephant
reserves in southern India were collected by field visits
8/6/2019 South-India Asian Elephant-Current Sceince
http://slidepdf.com/reader/full/south-india-asian-elephant-current-sceince 3/12
RESEARCH COMMUNICATIONS
CURRENT SCIENCE, VOL. 82, NO. 8, 25 APRIL 20021024
to all elephant range areas described in the past litera-
ture4,8,9,14–19. These data on elephant distribution were
modified to incorporate temporal changes mainly
caused by factors such as habitat loss through en-
croachments, developmental activities such as construc-
tion of reservoirs and large-scale landscape
transformation (e.g. recent conversion to commercial
plantations such as tea and coffee). Presence of ele-
phants was verified by direct sighting, indirect evidence
such as dung, and interviews with local villagers, forest
department staff and researchers working in the con-
cerned areas. In certain cases distribution was inferred
based on forest contiguity and quality, even if an inter-
vening stretch of forest was not surveyed, but had ele-
phants in the adjacent tracts. All spatial data on
elephant distribution were transferred to tracings of
toposheets which were then digitized to produce distri-
bution layers for areas surveyed in the four reserves.Elephant density estimates were obtained from the
records of the forest department. Estimates used here
are based on census figures obtained during the simula-
taneous (in the southern states) census conducted in
May 1993. In Tamil Nadu and Karnataka, random block
counts that sampled about 30% of the forest division
area were carried out. No statistical confidence limits
have been presented for these results. Estimates for
Kerala were obtained from dung counts with 95% con-
fidence limits19. The dung counts were necessary as the
forests here mostly comprised moist deciduous and wet
evergreen vegetation with low visibility.
Vegetation types of forest areas constituting elephant
habitats were obtained from secondary sources or de-
rived from our interpretation of satellite imagery. Vege-
tation maps produced by the French Institute,
Pondicherry (list provided in Appendix 1) were digi-
tized for elephant reserves 7 and 8. Each vegetation
type was represented by single or multiple polygons
with a unique identifier. Vegetation maps of 1 : 250,000
scale are not available for forest areas within elephant
reserves 9 and 10. Satellite images were acquired (Ap-
pendix 1) for first carrying out unsupervised classifica-
tion. Areas having a unique and unknown vegetation
type (obtained from the unsupervised classification)were identified and visited in the field for recording
dominant tree species at sample sites. Eventually, a
supervised classification was carried out with a total of
220 training sites representing coordinates within 22
vegetation types, plantations and mosaics of natural
vegetation types with plantations.
Most forest areas within elephant habitats of southern
India are gazetted reserved forests and have boundaries
clearly marked on Survey of India toposheets (scales
1 : 250,000 and 1 : 50,000) (Appendix 1). Forest maps of
the study area were reconstructed using a combination
of 1
:
25,000 scale toposheets, 1
:
50,000 scale to-
posheets (when forest boundaries and other features in
1 : 250,000 scale maps were unclear or the 1 : 250,000
scale map was outdated) and satellite imagery. Subse-
quently, a number of new enclaves within forests, not
represented in the toposheets, were incorporated into
the forest map which was then used as the primary layer
in the Geographical Information System (GIS) database.
Boundaries of administrative units were obtained from
the cartography section of the forest departments.
The number of poaching incidents was obtained from
the forest division offices. To obtain the annual rate, the
number of incidents where only tuskers were killed was
divided by the number of years for which records were
available. In some cases animals were killed, presuma-
bly for tusks, but tusks were not removed because of
immediate detection by the authorities. The rates were
computed for poaching incidents during the years 1990–
97.Data on the number of reported elephant raids on
crop fields within each administrative division were
obtained from the forest division offices. Farmers file
compensation claims at the local division office provid-
ing details on the location of the raided agricultural
lands, type and quantity of crops damaged and eco-
nomic loss incurred. Each claim therefore could be
thought of as representing one raid. This was converted
to a rate by dividing the number of raids by years for
which records were available. Some states such as
Tamil Nadu began the practice of paying compensations
only recently. The records therefore may not reflect
actual raiding intensities. However, states like Karna-
taka have been providing relief for several years and
records may provide more reliable indications of rela-
tive raiding intensities. Looking at a combination of
reliable records existing for divisions, field investiga-
tors’ subjective assessment of raiding intensities and
earlier survey work 9,20, all divisions were ranked in
terms of the prevailing levels of crop-raiding. Based on
this ranking system, values for divisions having unreli-
able records were extrapolated by placing them among
divisions ranked according to reliable records.
The division-wide distribution of endemic mammals,
birds and trees was obtained from establishedsources
12,21–26. By considering the existing knowledge
of species distributions, the location of collection of
type specimens and other information contained in the
above references, the presence or absence of the above
taxa was inferred for each division. The index of
endemicity was simply the total number of endemic
species belonging to the above taxa. We did not con-
sider other taxa within the Western Ghats. This is
because taxonomic uncertainties do exist, in terms of
the relatively greater difficulties faced by systematists
in correctly ascertaining the taxomomic status of an
organism. Furthermore, it is difficult to access adequate
8/6/2019 South-India Asian Elephant-Current Sceince
http://slidepdf.com/reader/full/south-india-asian-elephant-current-sceince 4/12
RESEARCH COMMUNICATIONS
CURRENT SCIENCE, VOL. 82, NO. 8, 25 APRIL 2002 1025
information against which confirmation is possible27.
This may not however be true for certain invertebrate
taxa such as Lepidopterans28
.
Analysis was carried out at the level of a forest divi-
sion. Digitized input such as forest boundaries, vegeta-
tion maps, elephant distributions and administrative unit
boundaries comprised separate layers in the GIS data-
base. Each of these layers was clipped with the forest
division boundary and the following four spatial ele-
phant-related variables calculated. In addition to these,
the number of endemic species was used for calculating
conservation values.
For Karnataka and Tamil Nadu, the elephant numbers
obtained from a 30% random block sampling of the
division were extrapolated to the total forest area within
the division. For Kerala the elephant densities, as ob-
tained from the dung counts, were used to obtain actual
numbers of the entire elephant distribution area withinthe division.
Fragmentation indices for forest divisions were calcu-
lated by dividing the total forest perimeter within a
division by the total forest area. High values indicate a
higher perimeter to area ratio, implying that the forest
perimeter is either very convoluted or long and narrow.
An increase in the number of enclosures within tracts of
forest adds to the perimeter, decreases the forest area
and increases the value of the index.
The elephant distribution area within a division was
the actual area over which it ranged. While determining
the preferred habitat area, the total area of each vegeta-
tion type within a division was first computed. The
preferred habitat area was then the total of each type
excluding wet evergreen forest, crop-lands and planta-
tions (with the exception of teak Tectona grandis) as
well as those falling on steep hill slopes and hills above
1400 m asl, as these are known to support low or negli-
gible density of elephants9.
The primary issue in multi-criterion evaluation is the
treatment of several criteria to form a single index of
evaluation. In the subsequent analysis, the criteria were
the variables characterizing elephant populations,
habitats and biodiversity. Multi-criterion evaluation and
the calculation of conservation value (S) are discussedelsewhere
29, but are briefly described below.
A continuous grading system was developed for as-
sessing the importance of criteria to a dependent vari-
able, the conservation value (Table 1). In the pair-wise
comparison matrix in Table 2, the rationale behind the
relative importance of row variables over column vari-
ables towards the conservation value is the following.
Quite unequivocally, high levels of fragmentation of
habitat or its absence, is the most important criterion
influencing a division’s conservation value positively or
negatively. In southern India, fragmentation is rather
irreversible, except in unique cases. This criterion was
therefore considered more important than others. Within
a division a large elephant distribution area is a desir-
able criterion but unless accompanied by significant
preferred habitat area, may have elephants living under
sub-optimal conditions. Preferred habitat area is there-
fore considered more important than elephant distribu-
tion area. Elephant numbers could be increased byconservation action if distribution area and preferred
habitat area are adequate and levels of fragmentation
low. We assign lower importance to elephant numbers
than the fragmentation index, elephant distribution and
preferred habitat areas. Finally, the level of endemism
has been arbitirarily taken to be moderately less impor-
tant than the other four criteria. For the pair-wise com-
parison matrix, a consistency ratio indicates the
Table 1. Whole numbers and reciprocals indicate that a criterion is
more or less important to the conservation value, respectively. Such
comparisons are made in a pair-wise manner as elaborated in Tables
2 and 3
Relative importance Description
1/9
1/7 Less1/5 important
1/3
1
3
5 More
7 important
9
Table 2. Relative importance of criteria (compare row variable over the column variable)
Fragmentation Elephant Elephant Preferred Number of
index number distribution area habitat area endemic species
Fragmentation index 1
Elephant number 1/3 1
Elephant distribution area 1/3 3 1
Preferred habitat area 1/3 3 3 1
Number of endemic species 1/5 1/3 1/5 1/5 1
8/6/2019 South-India Asian Elephant-Current Sceince
http://slidepdf.com/reader/full/south-india-asian-elephant-current-sceince 5/12
RESEARCH COMMUNICATIONS
CURRENT SCIENCE, VOL. 82, NO. 8, 25 APRIL 20021026
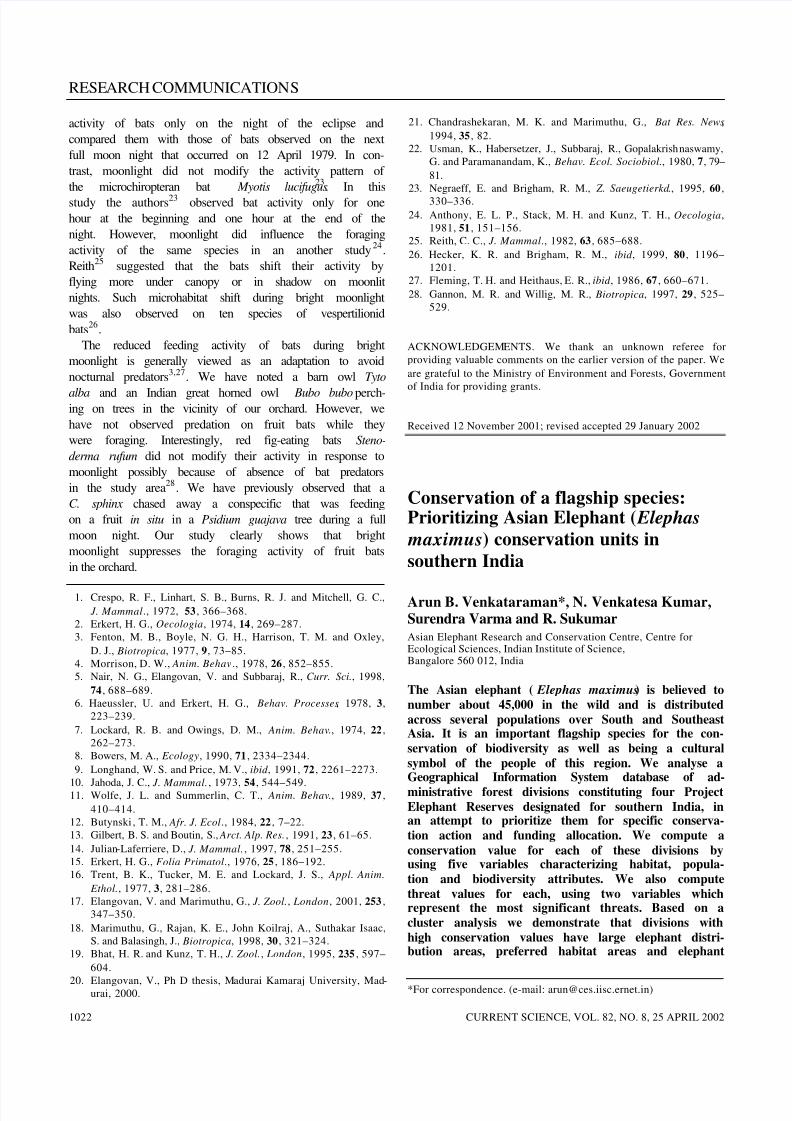
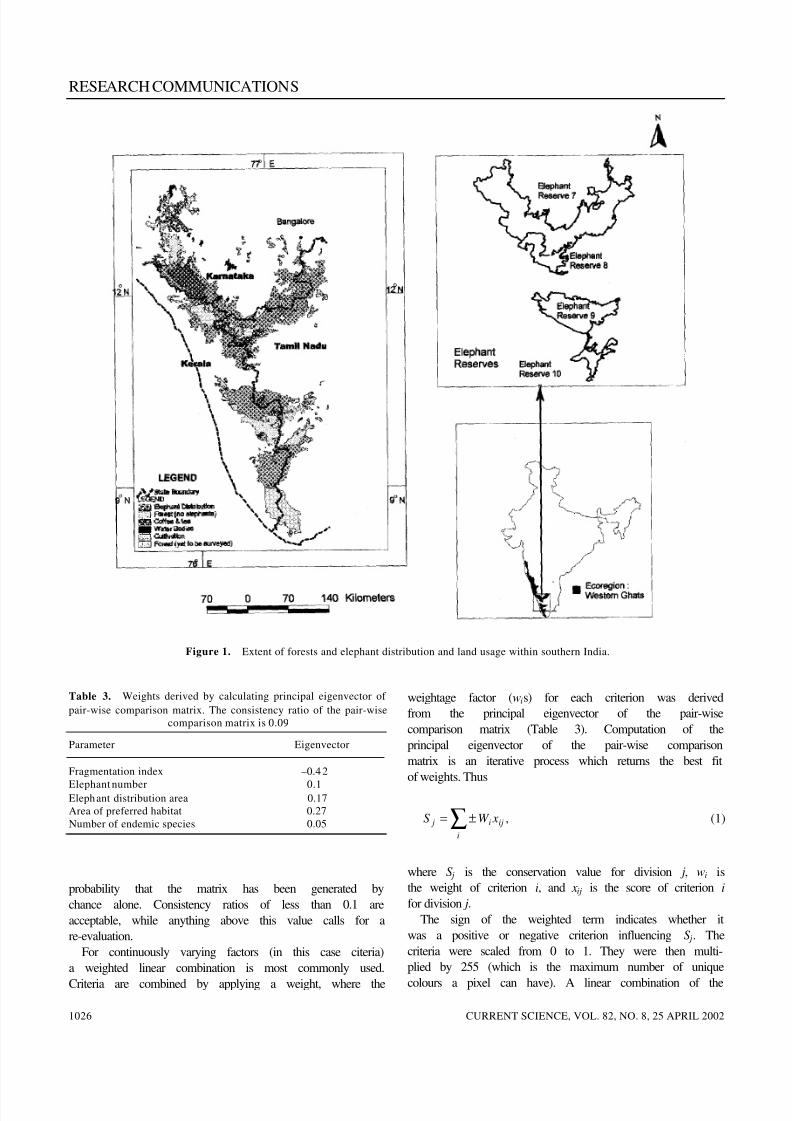
Figure 1. Extent of forests and elephant distribution and land usage within southern India.
Table 3. Weights derived by calculating principal eigenvector of
pair-wise comparison matrix. The consistency ratio of the pair-wise
comparison matrix is 0.09
Parameter Eigenvector
Fragmentation index –0.42
Elephant number 0.1Elephant distribution area 0.17
Area of preferred habitat 0.27
Number of endemic species 0.05
probability that the matrix has been generated by
chance alone. Consistency ratios of less than 0.1 are
acceptable, while anything above this value calls for a
re-evaluation.
For continuously varying factors (in this case citeria)
a weighted linear combination is most commonly used.
Criteria are combined by applying a weight, where the
weightage factor (wis) for each criterion was derived
from the principal eigenvector of the pair-wise
comparison matrix (Table 3). Computation of the
principal eigenvector of the pair-wise comparison
matrix is an iterative process which returns the best fit
of weights. Thus
,∑±=
i
iji j xW S (1)
where S j is the conservation value for division j, wi is
the weight of criterion i, and xij is the score of criterion i
for division j.
The sign of the weighted term indicates whether it
was a positive or negative criterion influencing S j. The
criteria were scaled from 0 to 1. They were then multi-
plied by 255 (which is the maximum number of unique
colours a pixel can have). A linear combination of the
8/6/2019 South-India Asian Elephant-Current Sceince
http://slidepdf.com/reader/full/south-india-asian-elephant-current-sceince 6/12
RESEARCH COMMUNICATIONS
CURRENT SCIENCE, VOL. 82, NO. 8, 25 APRIL 2002 1027
Table 4. Distance from the origin of cluster centres with respect of criteria
Fragmentation Elephant Elephant Area of No. of endemic
Cluster index number distribution area preferred habitat species
1 64.34 7.56 17.77 7.79 166.39
2 48.19 50.21 140.8 78.71 192.973 178.33 8.56 26.89 20.65 19 .53
4 28.97 50.99 82.73 48.07 19 .99
5 26.04 38.21 223.97 208.02 0
6 12.23 222.63 163.38 142.68 27.57
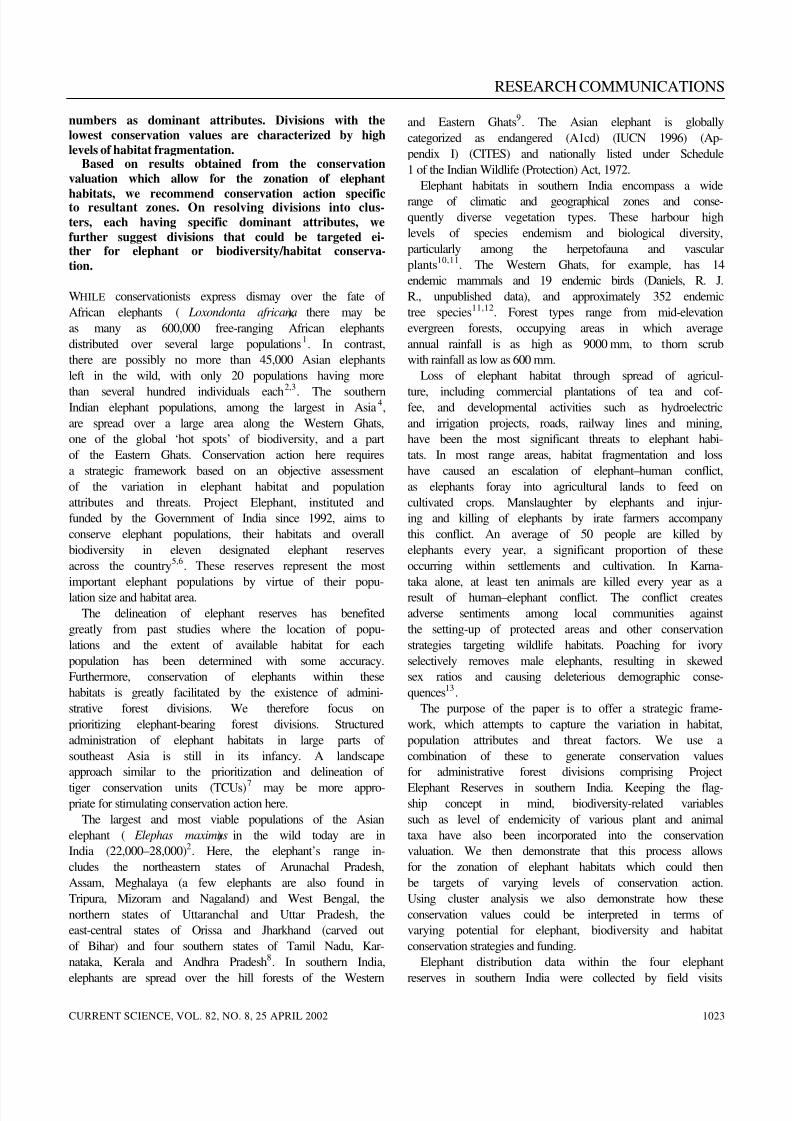
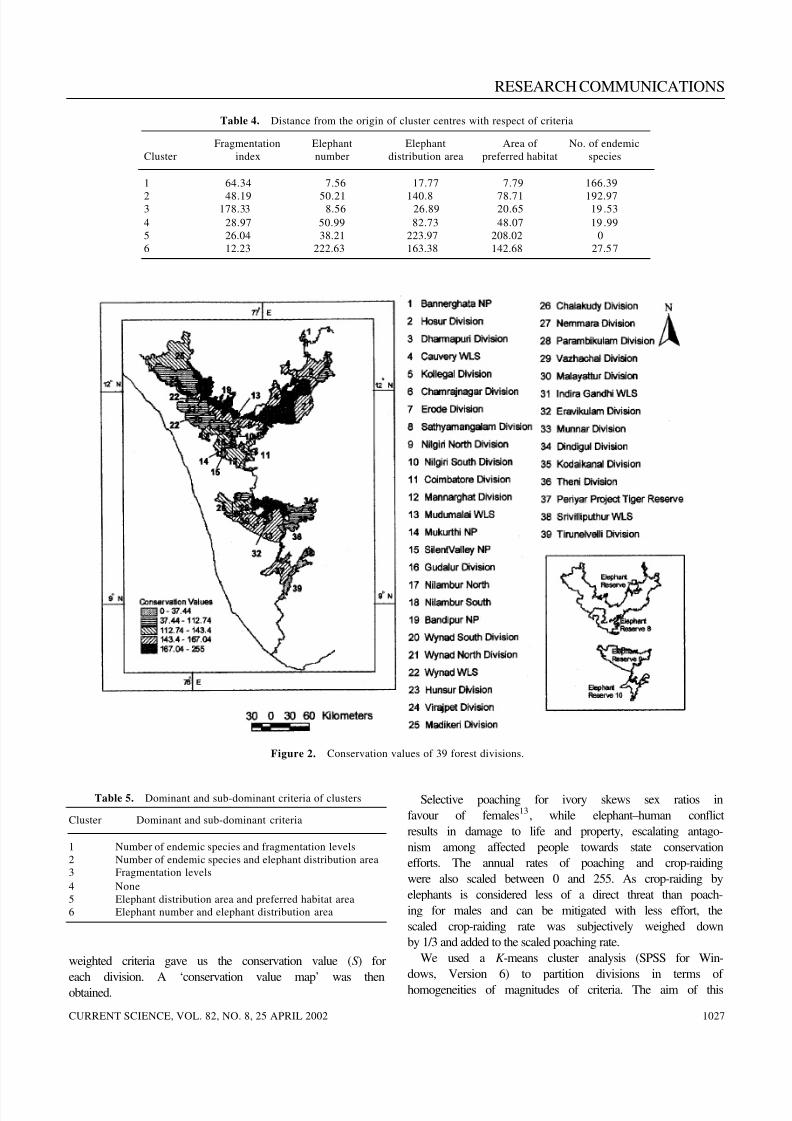
Figure 2. Conservation values of 39 forest divisions.
Table 5. Dominant and sub-dominant criteria of clusters
Cluster Dominant and sub-dominant criteria
1 Number of endemic species and fragmentation levels
2 Number of endemic species and elephant distribution area
3 Fragmentation levels
4 None
5 Elephant distribution area and preferred habitat area
6 Elephant number and elephant distribution area
weighted criteria gave us the conservation value (S) for
each division. A ‘conservation value map’ was thenobtained.
Selective poaching for ivory skews sex ratios in
favour of females13, while elephant–human conflict
results in damage to life and property, escalating antago-
nism among affected people towards state conservation
efforts. The annual rates of poaching and crop-raiding
were also scaled between 0 and 255. As crop-raiding by
elephants is considered less of a direct threat than poach-
ing for males and can be mitigated with less effort, the
scaled crop-raiding rate was subjectively weighed down
by 1/3 and added to the scaled poaching rate.
We used a K -means cluster analysis (SPSS for Win-
dows, Version 6) to partition divisions in terms of
homogeneities of magnitudes of criteria. The aim of this
8/6/2019 South-India Asian Elephant-Current Sceince
http://slidepdf.com/reader/full/south-india-asian-elephant-current-sceince 7/12
RESEARCH COMMUNICATIONS
CURRENT SCIENCE, VOL. 82, NO. 8, 25 APRIL 20021028
algorithm is to initially partition 39 divisions in five
dimensions (five criteria) into k clusters. We ultimately
present the results of partitioning into six clusters, given
that partitioning into fewer or more clusters causes a loss
of resolution or increases the complexity of interpretation
of the clusters, respectively. In the first iteration the
centroid of each cluster is calculated. Coordinates of the
centroid and each division in a five-dimensional space
are the distances from the origin with respect to each of
the five criteria. The square error for all divisions (which
is the square of a given division’s distance in five-
dimensional space from its cluster’s centroid) is calcu-
lated. In the next step of iterations, divisions are reas-
signed to clusters and the process is repeated till the
square errors summed over all divisions are minimized.
In all iterations the number of clusters remains constant
at k . The distance from the origin of the cluster centre
with respect to each of the criteria is given in Table 4
and cluster membership is given in Table 5.
For conservation of elephant habitats in southern
India, the four reserves (Figure 1) protecting
22,113 km2 out of a total elephant range of 24,622 km2
(distribution encompasses intact and degraded forests
only) are critical because several small, isolated popula-
tions (with the possible exception of Bhadra) to the
north of these reserves, along the Western Ghats, are
of questionable viability. Furthermore, one of these
reserves (elephant reserve 7) encompasses 12,583 km2
and is possibly the largest intact elephant landscape in
the country. Further south, another contiguous block of
forest (Agastyamalai) exists, but has a relatively low
elephant density and population size (Figure 1).
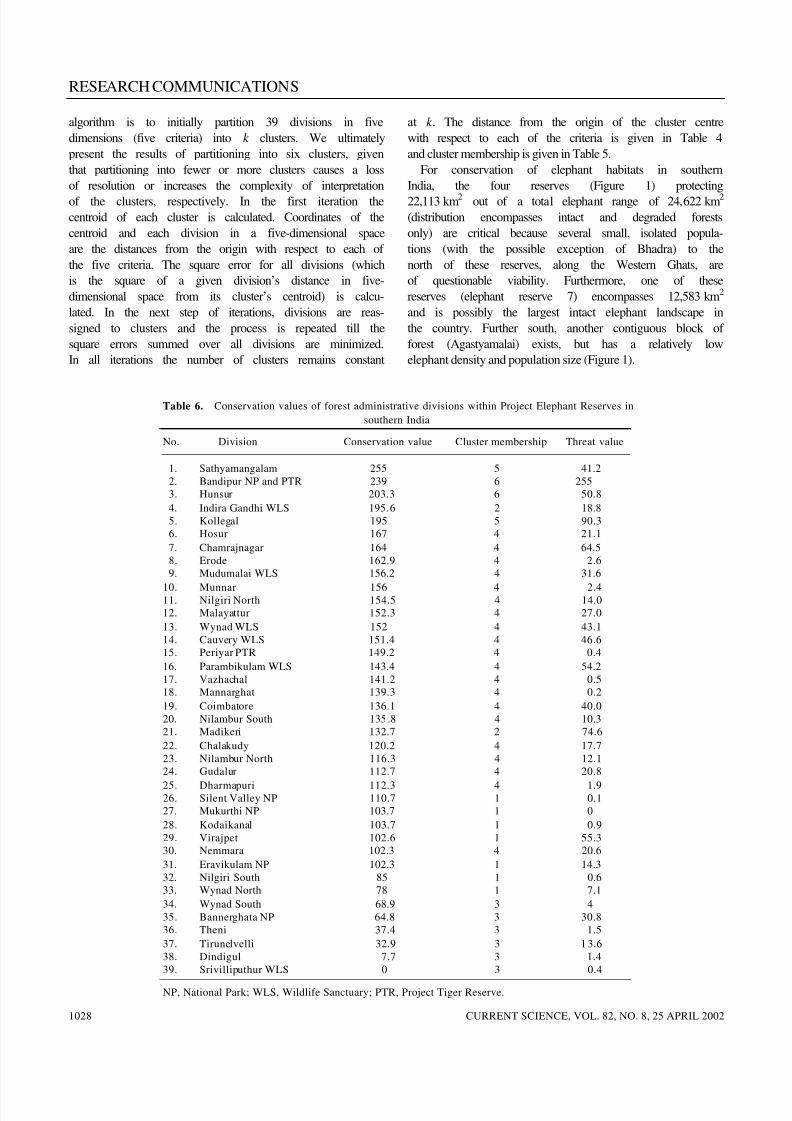
Table 6. Conservation values of forest administrative divisions within Project Elephant Reserves in
southern India
No. Division Conservation value Cluster membership Threat value
1. Sathyamangalam 255 5 41.2
2. Bandipur NP and PTR 239 6 255
3. Hunsur 203.3 6 50.8
4. Indira Gandhi WLS 195.6 2 18.8
5. Kollegal 195 5 90.3
6. Hosur 167 4 21.1
7. Chamrajnagar 164 4 64.5
8. Erode 162.9 4 2.6
9. Mudumalai WLS 156.2 4 31.6
10. Munnar 156 4 2.411. Nilgiri North 154.5 4 14.0
12. Malayattur 152.3 4 27.0
13. Wynad WLS 152 4 43.1
14. Cauvery WLS 151.4 4 46.6
15. Periyar PTR 149.2 4 0.4
16. Parambikulam WLS 143.4 4 54.2
17. Vazhachal 141.2 4 0.5
18. Mannarghat 139.3 4 0.2
19. Coimbatore 136.1 4 40.0
20. Nilambur South 135.8 4 10.3
21. Madikeri 132.7 2 74.6
22. Chalakudy 120.2 4 17.7
23. Nilambur North 116.3 4 12.1
24. Gudalur 112.7 4 20.8
25. Dharmapuri 112.3 4 1.926. Silent Valley NP 110.7 1 0.1
27. Mukurthi NP 103.7 1 0
28. Kodaikanal 103.7 1 0.9
29. Virajpet 102.6 1 55.3
30. Nemmara 102.3 4 20.6
31. Eravikulam NP 102.3 1 14.3
32. Nilgiri South 85 1 0.6
33. Wynad North 78 1 7.1
34. Wynad South 68.9 3 4
35. Bannerghata NP 64.8 3 30.8
36. Theni 37.4 3 1.5
37. Tirunelvelli 32.9 3 13.6
38. Dindigul 7.7 3 1.4
39. Srivilliputhur WLS 0 3 0.4
NP, National Park; WLS, Wildlife Sanctuary; PTR, Project Tiger Reserve.
8/6/2019 South-India Asian Elephant-Current Sceince
http://slidepdf.com/reader/full/south-india-asian-elephant-current-sceince 8/12
RESEARCH COMMUNICATIONS
CURRENT SCIENCE, VOL. 82, NO. 8, 25 APRIL 2002 1029
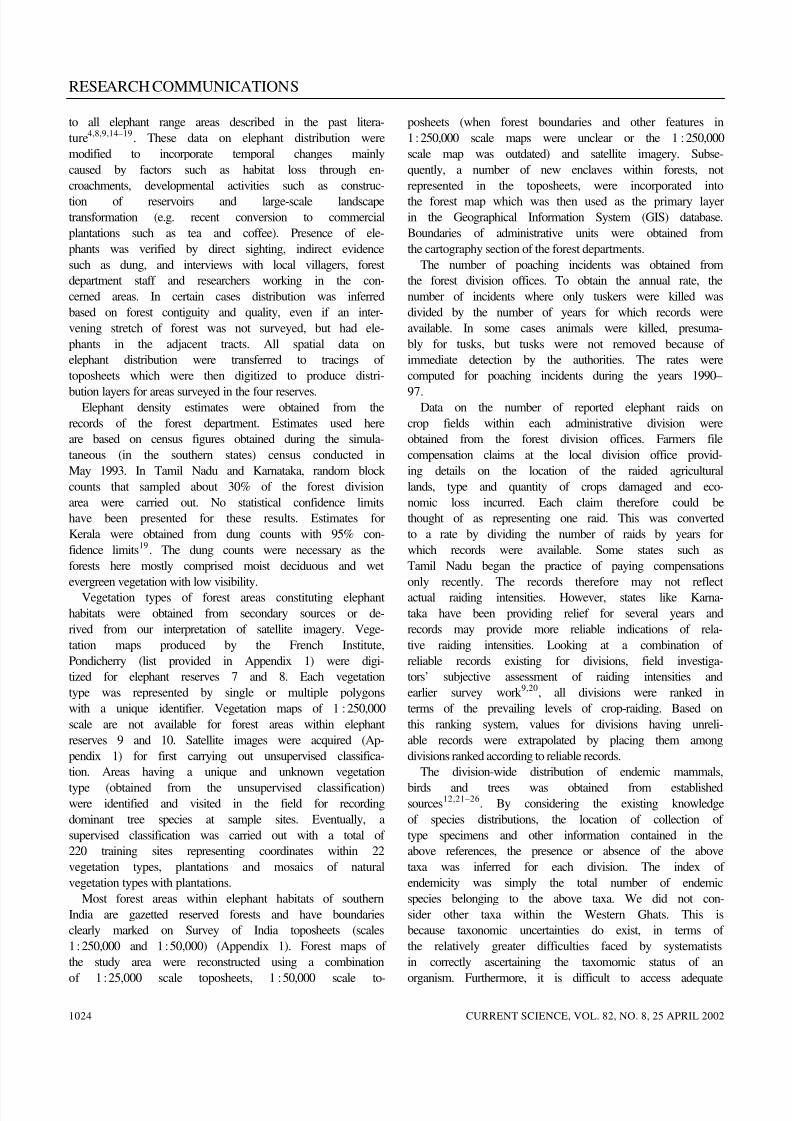
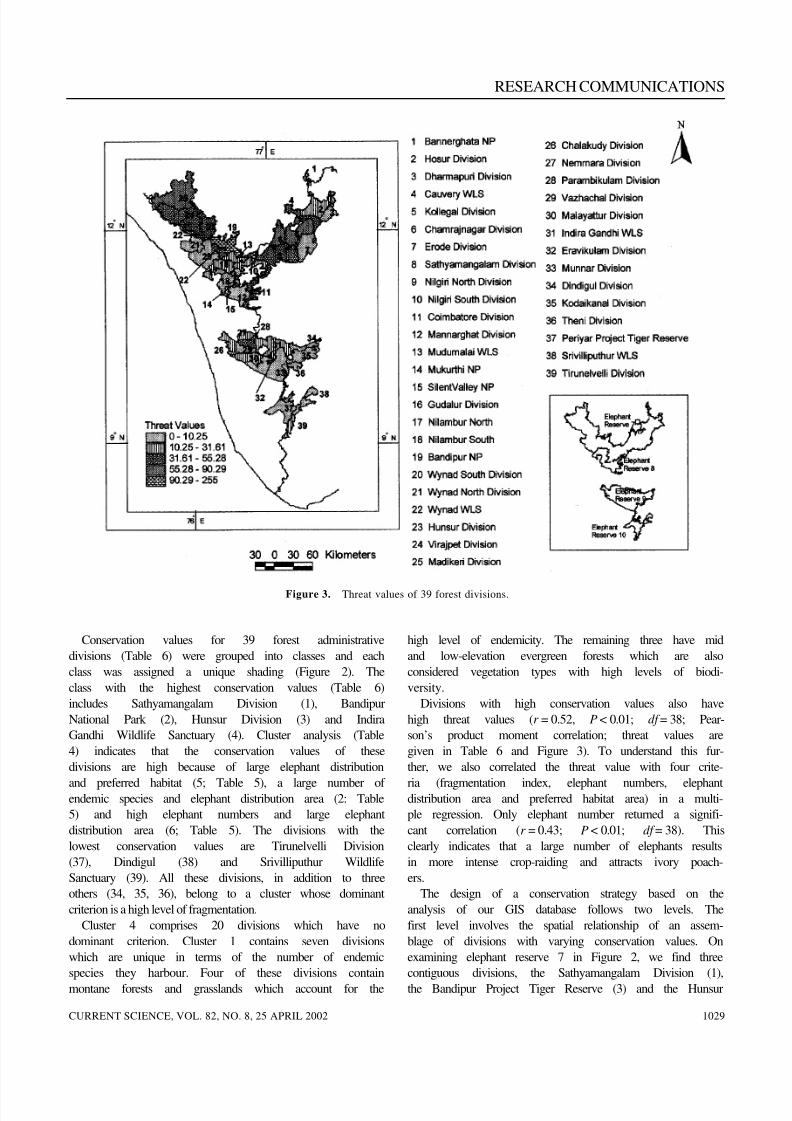
Figure 3. Threat values of 39 forest divisions.
Conservation values for 39 forest administrative
divisions (Table 6) were grouped into classes and each
class was assigned a unique shading (Figure 2). The
class with the highest conservation values (Table 6)
includes Sathyamangalam Division (1), Bandipur
National Park (2), Hunsur Division (3) and Indira
Gandhi Wildlife Sanctuary (4). Cluster analysis (Table
4) indicates that the conservation values of these
divisions are high because of large elephant distribution
and preferred habitat (5; Table 5), a large number of endemic species and elephant distribution area (2: Table
5) and high elephant numbers and large elephant
distribution area (6; Table 5). The divisions with the
lowest conservation values are Tirunelvelli Division
(37), Dindigul (38) and Srivilliputhur Wildlife
Sanctuary (39). All these divisions, in addition to three
others (34, 35, 36), belong to a cluster whose dominant
criterion is a high level of fragmentation.
Cluster 4 comprises 20 divisions which have no
dominant criterion. Cluster 1 contains seven divisions
which are unique in terms of the number of endemic
species they harbour. Four of these divisions contain
montane forests and grasslands which account for the
high level of endemicity. The remaining three have mid
and low-elevation evergreen forests which are also
considered vegetation types with high levels of biodi-
versity.
Divisions with high conservation values also have
high threat values (r = 0.52, P < 0.01; df = 38; Pear-
son’s product moment correlation; threat values are
given in Table 6 and Figure 3). To understand this fur-
ther, we also correlated the threat value with four crite-
ria (fragmentation index, elephant numbers, elephantdistribution area and preferred habitat area) in a multi-
ple regression. Only elephant number returned a signifi-
cant correlation (r = 0.43; P < 0.01; df = 38). This
clearly indicates that a large number of elephants results
in more intense crop-raiding and attracts ivory poach-
ers.
The design of a conservation strategy based on the
analysis of our GIS database follows two levels. The
first level involves the spatial relationship of an assem-
blage of divisions with varying conservation values. On
examining elephant reserve 7 in Figure 2, we find three
contiguous divisions, the Sathyamangalam Division (1),
the Bandipur Project Tiger Reserve (3) and the Hunsur
8/6/2019 South-India Asian Elephant-Current Sceince
http://slidepdf.com/reader/full/south-india-asian-elephant-current-sceince 9/12
RESEARCH COMMUNICATIONS
CURRENT SCIENCE, VOL. 82, NO. 8, 25 APRIL 20021030
Wildlife Division (4) with high conservation values.
Further east, we have divisions with relatively lower
conservation values. There almost appears to be a west-
to-east gradient of decreasing conservation values. This
may, on one hand, reflect a shift from the larger, more
intact forests along the foothills of the Western Ghats to
smaller, more fragmented tracts as one moves east-
wards. On the other hand, this could also reflect a sim-
ple gradient in the efficacies of management given that
most eastern divisions are not protected areas. We can
therefore declare a set of divisions as ‘core zones’ and
‘augmentation zones’ in order to maintain a single,
large viable population. In this case the divisions,
Sathyamangalam (1; Table 6), Bandipur National Park
(2) and Hunsur (3) could comprise the ‘core zone’ and
Hosur (6), Cauvery Wildlife Sanctuary (14), Kollegal
(5), Chamrajnagar (7), Erode (8), Mudumalai Wildlife
Sanctuary (9), Nilgiri North (11) and Wynad Sanctuary(13) could comprise the ‘augmentation zone’ of the
elephant reserve.
The value of other divisions resides on facilitating the
natural movement of elephants. Conservation values,
largely influenced by elephant-related criteria, could be
greatly enhanced within this ‘augmentation zone’, if
they are specifically targeted for funding and pragmatic
management strategies. Strategies could possibly in-
clude direct conservation measures for increasing ele-
phant numbers and improving the quality of habitat.
These include greater law enforcement to curb poach-
ing, identifying, securing and augmenting elephant
‘corridors’, and replacing monoculture plantations with
natural vegetation. Such strategies could be distinct
from those utilized in the core area, where elephant
numbers are high and good quality habitat exists. The
latter could primarily focus on capacity building of field
staff for increased efficiency in management and
enforcement. Elephant–human conflict is high around
such areas and it is essential that such conflicts be
addressed on a high priority to ensure sustained accep-
tance among local people of protected areas. Designing
an elephant reserve would therefore benefit from such
spatial analysis and an examination of the key problems
threatening elephants and habitats within specific divi-sions. However one must note that conservation values
in certain smaller divisions (e.g. Mudumalai Sanctuary)
with high elephant numbers may be somewhat lower,
because of lower elephant distribution areas and
preferred habitat areas. These divisions may be
re-assigned to the core zone after examining the indi-
vidual criteria.
Appendix 1.
Vegetation maps analysed:
1. Institut de la carte internationale du tapis vegetal, 1985, Nilgiri Hills, India. Maps of the main vegetation types from Landsat
imagery.2. Pascal, J-P., Forest map of south India, Mercara-Mysore, Karnataka and Kerala Forest Departments and the French Institute,
Pondicherry.
Statistics of imagery analysed
Path and row Date Percentage cloud cover Band combinations classified
P025 R 061 of IRS-1B, LISS II 5 August 1997 2–5 3, 2,1 out of 4 bands
P025 R 062 of IRS-1B, LISS II 5 August 1997 2–5 3, 2, 1 out of 4 bandsP026 R 061 of IRS-1B, LISS II 5 August 1997 2–5 3, 2, 1 out of 4 bandsP026 R 062 of IRS-1B, LISS II 5 August 1997 2–5 3, 2, 1 out of 4 bands
Survey of India topographical sheets used and year of survey
Map number Year(s) of survey
48 O 1975–76, 1977–79
48 P 1967–6957 D 1971–7357 H 1970–75
58 A 1966–68, 1967–73, 1975–7758 B 1966–67, 1968–69, 1975–7758 C 1965–67, 1968–69, 1976–77
58 E 1967–68, 1969–70, 1971–7458 F 1971–73, 1976–7758 G 1975–77
58 H 1914–15, 1917–20 (forest boundaries not subjected to verification)
8/6/2019 South-India Asian Elephant-Current Sceince
http://slidepdf.com/reader/full/south-india-asian-elephant-current-sceince 10/12
RESEARCH COMMUNICATIONS
CURRENT SCIENCE, VOL. 82, NO. 8, 25 APRIL 2002 1031
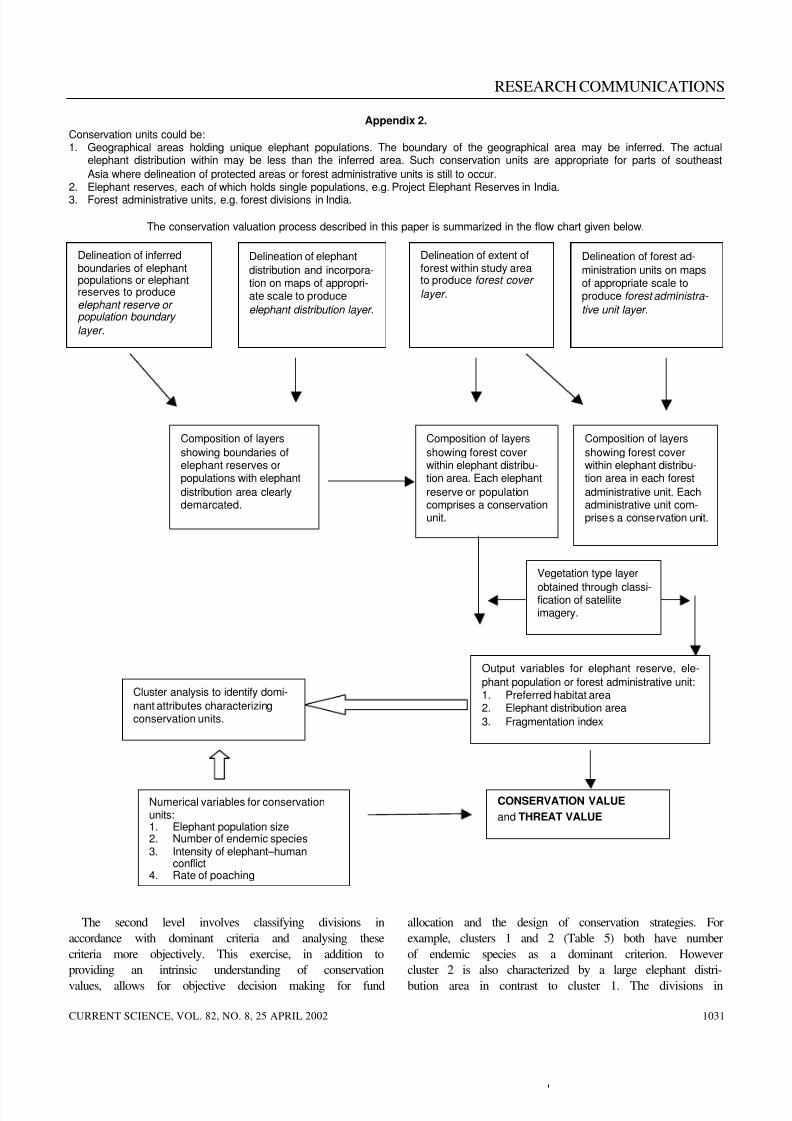
Appendix 2.
Conservation units could be:1. Geographical areas holding unique elephant populations. The boundary of the geographical area may be inferred. The actual
elephant distribution within may be less than the inferred area. Such conservation units are appropriate for parts of southeast
Asia where delineation of protected areas or forest administrative units is still to occur.2. Elephant reserves, each of which holds single populations, e.g. Project Elephant Reserves in India.
3. Forest administrative units, e.g. forest divisions in India.
The conservation valuation process described in this paper is summarized in the flow chart given below.
The second level involves classifying divisions in
accordance with dominant criteria and analysing these
criteria more objectively. This exercise, in addition to
providing an intrinsic understanding of conservation
values, allows for objective decision making for fund
allocation and the design of conservation strategies. For
example, clusters 1 and 2 (Table 5) both have number
of endemic species as a dominant criterion. However
cluster 2 is also characterized by a large elephant distri-
bution area in contrast to cluster 1. The divisions in
Delineation of elephant
distribution and incorpora-tion on maps of appropri-ate scale to produce
elephant distribution layer.
Delineation of forest ad-
ministration units on mapsof appropriate scale toproduce forest administra-
tive unit layer.
Delineation of inferredboundaries of elephantpopulations or elephantreserves to produceelephant reserve or population boundary
layer.
Delineation of extent offorest within study areato produce forest cover
layer.
Composition of layers
showing boundaries ofelephant reserves orpopulations with elephant
distribution area clearlydemarcated.
Composition of layers
showing forest coverwithin elephant distribu-tion area. Each elephant
reserve or populationcomprises a conservationunit.
Composition of layers
showing forest coverwithin elephant distribu-tion area in each forest
administrative unit. Eachadministrative unit com-prises a conservation unit.
Vegetation type layer
obtained through classi-fication of satelliteimagery.
Output variables for elephant reserve, ele-
phant population or forest administrative unit:1. Preferred habitat area2. Elephant distribution area
3. Fragmentation index
Numerical variables for conservationunits:1. Elephant population size2. Number of endemic species3. Intensity of elephant–human
conflict4. Rate of poaching
CONSERVATION VALUE
and THREAT VALUE
Cluster analysis to identify domi-
nant attributes characterizingconservation units.
8/6/2019 South-India Asian Elephant-Current Sceince
http://slidepdf.com/reader/full/south-india-asian-elephant-current-sceince 11/12

8/6/2019 South-India Asian Elephant-Current Sceince
http://slidepdf.com/reader/full/south-india-asian-elephant-current-sceince 12/12
RESEARCH COMMUNICATIONS
CURRENT SCIENCE, VOL. 82, NO. 8, 25 APRIL 2002 1033
*For correspondence.
28. Kunte, K., Butterflies of Peninsular India (ed. Gadgil, M.), Ori-
ent Longman, Hyderabad, 2000.
29. Voogd, H., Multi-criteria Evaluation for Urban and Regional
Planning, Pion Ltd, London, 1983.
30. Duckworth, J. W. and Hedges, S., Tracking Tigers. Report,
WWF, Indo-China Programme, Hanoi, 1998.
ACKNOWLEDGEMENTS. This work was supported by the John,
D. and Catherine T. MacArthur Foundation, USA. We would also
like to thank the Wildlife Preservation Trust International, USA (now
the Wildlife Trust) for actively supporting our research. We thank
the Forest Departments of Karnataka, Kerala and Tamil Nadu for
permission to carry out field surveys in the elephant reserves and
providing logistic support and information when needed. Joshua
David collected and collated a subset of the data that were eventually
incorporated in the database. Kumaran Raju provided additional GIS
support.
Received 6 November 2001; revised accepted 31 January 2002
Identification and usage of multiples
in crustal seismics – An application inthe Bengal Basin, India
A. S. S. S. R. S. Prasad, D. Sarkar andP. R. Reddy*
National Geophysical Research Institute, Hyderabad 500 007, India
Multiple seismic phases associated with deeper hori-
zons have been observed in long-range seismic re-fraction sections. These have been successfully
distinguished from the primary events and utilized
to build crustal velocity–depth section along Gopali–Port Canning profile, Bengal Basin.
PHASE identification is the basic component of seismic
data processing. The phase may correspond to primary
events like refraction, reflection, diffraction and con-
verted wave. In addition, multiples of various kinds are
observed in some cases depending on the geologicalsetting of the region. These phases in favourable cir-
cumstances can be identified and distinguished from the
primary using the difference in their arrival times.
These multiples (conventionally viewed as ‘noise’) have
been utilized as ‘seismic signals’ to build up velocity–
depth models1–3 .
Crustal velocity–depth section4
was built along a
profile in West Bengal Basin (Figure 1; first arrival
refraction and later arrival wide-angle reflections) using
only primary phases. Crustal section along this profile,
viz. Gopali–Port Canning provided velocity–depth
details of the sedimentary column, basement and sub-
basement crust. Subsequently, an additional layer has
been introduced5
at the lower crustal level utilizing only
primary phases. As the record sections of Gopali–Port
Canning contain significantly high amplitude multiples,
2D velocity–depth sections down to the basement have
been built2,3
by using free surface multiple diving waves
and multiple reflections. These velocity–depth sections,
generated by using multiples were better constrained to
claim higher accuracy. These sections have brought into
focus the finer variations in the velocity gradients in
different shallower layers, which otherwise could not
have been obtained from the processing of primary
phases alone.
The multiples associated with deeper layers have
neither been identified nor utilized earlier. Refraction
seismograms of Gopali–Port Canning profile are seen tohave several strong phases even at a distance of 80 to
130 km away from the source. These phases are seen
intermixing with the primary phases. Seismograms of
all the shot points contain the phases that are identified
as peg-leg multiples6–8 and reflected refractions1,9,10.
These are the multiple events reflected from deeper
boundaries (basement, sub-basement and the Moho). In
the subsequent exercise, modelling of primary events
along with the multiples has been carried out. These
newly identified phases have thus been utilized to test
and modify the crustal velocity model derived earlier5.
In the process nearly all the prominent phases, which
were present in the observed seismograms but remained
unexplained have been synthetically reproduced, for
increasing confidence in the constructed model.
Multiples are reflections that have undergone more
than one bounce. It means that the wave gets reflected
by the same or another reflector one or more times and
returns to the surface to be recorded by the geophones11.
Figure 1. Location map of Gopali–Port Canning profile in West
Bengal Basin on the geological map of the region.