Embed Size (px)
Citation preview

South Fork Clearwater River TMDL Implementation Plan
The South Fork Clearwater River Watershed Advisory Group
April 2006


South Fork Clearwater River TMDL Implementation Plan
April 2006
The South Fork Clearwater River Watershed Advisory Group


South Fork Clearwater River TMDL Implementation Plan April 2006
i
Table of Contents
South Fork Clearwater River Watershed Advisory Group..........................................iii
South Fork Clearwater River Watershed Advisory Group..........................................iii
Idaho TMDL Implementation Plans........................................................................... iv
Regulatory Basis ..............................................................................................iv Time Frame ......................................................................................................iv Roles and Responsibilities ...............................................................................iv
Chapter 1: Introduction ............................................................................................. 1
1.1 TMDL Summary and Other Pertinent Information ..................................... 1 1.2 Key Findings.............................................................................................. 3 1.3 Nonpoint Sources ...................................................................................... 3 1.4 Point Sources ............................................................................................ 3 1.5 Statement of Reasonable Assurance ........................................................ 4 1.6 Processes to Ensure Public Participation .................................................. 4 1.7 Timelines for Implementation..................................................................... 4 1.8 Processes to Measure and Evaluate Progress.......................................... 4 1.9 Process to Establish Priorities ................................................................... 5
Chapter 2: Implementation........................................................................................ 7
2.1 Agriculture and Grazing........................................................................... 16 2.2 County and State Roads ......................................................................... 16 2.3 Forestry ................................................................................................... 16 2.4 Point Source Wastewater Allocations...................................................... 17
Chapter 3: Past and Present Watershed Improvement Activities ........................... 19
Chapter 4: Proposed Priority Areas for Improvement ............................................. 21
Chapter 5: Evaluation ............................................................................................. 23
5.1 Department of Environmental Quality, Water Quality Monitoring............. 23 5.2 Sampling Methods................................................................................... 24 5.3 Quality Assurance and Quality Control..................................................... 26 5.4 Designated Management Agencies, Water Quality Monitoring ............... 27
Appendix A. South Fork Clearwater TMDL Implementation Plan for Agriculture .... 29
Appendix B. Sediment Monitoring Plan, US Forest Service.................................... 79

South Fork Clearwater River TMDL Implementation Plan April 2006
ii
List of Figures
Figure 1. General Location Map of the South Fork Clearwater River ........................2
List of Tables
Table 1. Streams and pollutants for which TMDLs were developed..........................3
Table 2. Pollutant Control Strategies.........................................................................8
Table 3. Sampling locations to be monitored on Three Mile Creek for various parameters. ..............................................................................................................24
Table 4. Water quality parameters. .........................................................................25
Table 5. Field Measurements..................................................................................25

South Fork Clearwater River TMDL Implementation Plan April 2006
iii
Current and Original Members of the South Fork Clearwater River Watershed Advisory Group Timber Dick Willhite Shearer Lumber Elk City, ID Ranching/Livestock Bob Rylaarsdam Grangeville, ID Wastewater Treatment Plants Bob Klecha Grangeville, ID Family Farms JoAnn Mider Kamiah, ID Tourism/Travel Ron Andrews Kooskia, ID Preservationist /Environmentalist Bonnie Schonefeld Kooskia, ID Nez Perce Tribe Rudy Carter Grangeville, ID Ben Holcomb Lapwai, ID At Large Alice Mattson Kooskia, ID Local Government Kelly Frazier City of Kooskia Kooskia, ID
Mining Pat Holmberg Grangeville ID Federal Land Managers Kevin Martin Elk City, ID Phil Jahn Grangeville, ID Darcy Pederson Grangeville, ID At Large Joy Lee Kooskia, ID Agriculture Ed Stuivenga Grangeville, ID Road District Troy Biesecker Kooskia, ID Outfitters and Guides Lynn Laughy Kooskia, ID Recreation Borg Henderson Kooskia, ID

South Fork Clearwater River TMDL Implementation Plan April 2006
iv
Idaho TMDL Implementation Plans Regulatory Basis
General guidance on the purpose of an implementation plan is given in the Idaho Non-point Source Management Plan (DEQ1999).
“An implementation plan identifies and describes the specific pollution controls or management measures to be undertaken, the mechanisms by which the selected pollution control and management measures will be put into action, and describes the authorities, regulations, permits, contracts, commitments, or other evidence sufficient to ensure that implementation will take place. The plan also describes when implementation will take place, identifies when various tasks or action items will begin and end, when mid-term and final objectives will be met, and establishes dates for meeting water quality targets.”
Idaho Non-point Source Management Plan, page 58
Time Frame The Idaho Department of Environmental Quality considers ten years to be a reasonable time frame to complete the work recommended in this implementation plan. Adaptive management through the Idaho BMP feedback loop may require additional time to implement if the desired results are not immediately achieved by the planned activities and projects.
Roles and Responsibilities Idaho Code 39-3612 states, implementation of an Idaho TMDL is primarily the responsibility of designated management agencies in cooperation with landowners and managers. Idaho code defines these designated agencies as the Department of Lands (IDL) for timber harvest, oil and gas exploration and development, and for mining; the Soil Conservation Commission (SCC) for grazing and agriculture; the Idaho Transportation Department (ITD) for public roads; the State Department of Agriculture (ISDA) for aquaculture; and the IDEQ for all other activities.”
Idaho through its Non-point Source Management Plan recognizes the responsibility of the US Environmental Protection Agency to manage point sources of pollutants in Idaho and non point source pollutants on federal lands under the authority of the US Forest Service and Bureau of Land Management. The Nez Perce Tribe is recognized to be responsible for activities occurring on tribal lands within the South Fork Clearwater River watershed subject to tribal authorities.

South Fork Clearwater River TMDL Implementation Plan April 2006
v
The Watershed Advisory Group is the point of contact for enlisting participation of community members for implementation of this plan rather than the Department of Environmental Quality or the Environmental Protection Agency.


South Fork Clearwater River TMDL Implementation Plan April 2006
1
Chapter 1: Introduction This implementation plan is intended to document actions planned by designated management agencies and recommended by watershed advisory groups to accomplish load reductions provided in the South Fork Clearwater River TMDL. The plan lists recommended best management practices and permit actions for the South Fork Clearwater River developed by the appropriate designated state management agency and federal management agency with the watershed advisory group. The Best Management Practices and projects recommended in this plan are thought to be the most feasible and efficient for reducing sediment, temperature, nutrients, and bacteria inputs to the river. This plan is dynamic, and as additional information becomes available during its implementation, revisions to the plan may be necessary. When new data or information becomes available and justifies changes to the plan, revisions will be made with the assistance of the South Fork Clearwater River Watershed Advisory Group. 1.1 TMDL Summary and Other Pertinent Information The South Fork Clearwater River watershed encompasses an area of approximately 1,175 square miles and is entirely within Idaho County. Figure 1 shows the general location of the South Fork Clearwater River within North Central Idaho. The watershed extends from the headwaters above Elk City at an elevation of 6,382 feet to the confluence with the Middle Fork of the Clearwater River at Kooskia at an elevation of 1,280 feet. Precipitation ranges from 25 inches at the lower elevations to over 50 inches at the higher elevations. Ten percent of the annual precipitation in Kooskia falls as snow, whereas in Elk City the fraction is closer to 40%. Mean annual stream flow at Stites is approximately 1,060 cubic feet per second (cfs). High spring flows average 3,370 cfs while late summer low flows average 258 cfs. During late April, early May, or early June annual peak flows at Stites average 5,000 to 7,000 cfs. The largest flow of record occurred in June of 1964 at an estimated 17,500 cfs. Table 1 lists the water bodies in the watershed which are addressed by the TMDL and this implementation plan. Sediment load allocations apply to the main stem, Butcher Creek, and Threemile Creek; nutrient and bacteria load allocations apply to Threemile Creek; and temperature load allocations apply to 74 waters in the watershed including the main river, Butcher Creek, and Threemile Creek.

South Fork Clearwater River Implementation Plan April 2006
2
Figure 1. General Location Map of the South Fork Clearwater River

South Fork Clearwater River Implementation Plan April 2006
3
Table 1. Streams and pollutants for which TMDLs were developed.
Stream Pollutant(s)
South Fork Clearwater River Sediment, Temperature Threemile Creek Bacteria, Nutrients, DO, Sediment, Temperature Butcher Creek Sediment, Temperature Dawson Creek Temperature Little Elk Creek Temperature Big Elk Creek Temperature Buffalo Gulch Temperature Newsome Creek Temperature Beaver Creek Temperature Nugget Creek Temperature Sing Lee Creek Temperature Cougar Creek Temperature 58 Other Water Bodies Temperature
1.2 Key Findings Based on the pollutants found and measured in 2002, human caused sediment in Threemile Creek should be reduced by approximately 70%, in Butcher Creek by approximately 45%, and in the main river at Stites by approximately 25%. In Threemile creek, human caused bacteria should be reduced by approximately 85%, and phosphorus by 32% above Grangeville and 100% below. High water temperatures caused by humans need to be reduced in the main river channel and most of its tributaries. 1.3 Nonpoint Sources Wildlife, agriculture, livestock grazing and timber harvest activities are considered the primary non-point sources of sediment bacteria and nutrients. Roads, skid trails, land development, construction activities, and storm water also are considered non-point sediment sources that need to be addressed by this plan. The most commonly acceptable approach to controlling non-point sources is to limit pollutants from reaching the water through a combination of best management practices and filtering of runoff using riparian vegetation and floodplains. 1.4 Point Sources Point sources in the watershed include waste water treatment facilities, suction dredge mining, and storm water runoff. The US Environmental Protection Agency will manage all point sources in the watershed through permitted operational requirements included in the National Pollution Discharge Elimination System permits issued to each point source. The five waste water treatment facilities in the watershed are currently operating under valid permits.

South Fork Clearwater River Implementation Plan April 2006
4
1.5 Statement of Reasonable Assurance Non-point sources will be managed by applying the combination of authorities the state has included in the Idaho Non-point Source Management Plan. Section 319 of the Federal Clean Water Act requires each state to submit to the EPA a management plan for controlling pollution from non-point sources within the state. Idaho’s authority for implementing the Idaho Non-point Source Management Plan has been certified by the Idaho Attorney General. The plan has been submitted to and approved by the Environmental Protection Agency as complying with Section 319 of the Clean Water Act. 1.6 Processes to Ensure Public Participation
Idaho Code 39-3613 and 39-3615 require the appointment of Basin Advisory Groups and Watershed Advisory Groups to employ all means of public involvement deemed necessary and provide the Department of Environmental Quality and designated management agencies advice on the development and implementation of total maximum daily load processes as described in Idaho Code 39-3611. The South Fork Clearwater River Watershed Advisory Group was established by the Director of the Department of Environmental Quality in February of 2002. This version (2006) of the implementation plan is subject to change based on recommendations of the Watershed Advisory Group. 1.7 Timelines for Implementation Non-point source management is already occurring in the South Fork watershed, and is expected to accelerate with the completion of this plan and the availability of funds. Mature riparian communities and a stable hydrologic regime and stream channel are needed to substantially improve stream temperatures and provide pollutant buffers. The Idaho Department of Environmental Quality believes ten years should be a reasonable amount time for achievement of water quality standards; however, it is likely to take decades for improvement throughout the watershed considering the time needed to for riparian vegetation to grow to maturity. The US EPA National Pollution Discharge Elimination System permits will be issued on a schedule set by the EPA. The City of Grangeville wastewater treatment plant permit has been issued and the wastewater treatment plant permits for Kooskia, Stites, Elk City, and Red River Ranger Station are current at this time. 1.8 Processes to Measure and Evaluate Progress Idaho Code 39-3611 requires a review of TMDL implementation plans periodically at intervals no greater than five years. Such reviews are to be conducted using the Beneficial Use Reconnaissance Program protocol and the Water Body Assessment Guidance methodology to determine beneficial use attainability and status and whether state water quality standards are achieved in the South Fork Clearwater River.

South Fork Clearwater River Implementation Plan April 2006
5
Idaho Code 39-3621 requires designated agencies, in cooperation with the appropriate land management agency to ensure best management practices are monitored for their effect on water quality. The monitoring results are to be presented to the Department of Environmental Quality on a schedule agreed to between the designated agency and the department. Periodically, DEQ will provide the agency monitoring results obtained from the designated management agencies and water quality standards compliance determinations to the Watershed Advisory Group and the general public. 1.9 Process to Establish Priorities Idaho Code 39-3616 authorizes and directs the South Fork Clearwater River Watershed Advisory Group to recommend specific actions needed to control point and non point sources of pollution with in the watershed so that, within a reasonable amount of time, designated beneficial uses are fully supported and state water quality plans are achieved. The South Fork Clearwater Watershed Advisory Group recommends voluntary, community led, cost effective, economically compatible, long term, common sense actions as highest priority. Projects addressing multiple pollutants and beneficial uses, directly or indirectly, will be given highest priority. Lowest priority actions are property or activity restrictions. Specific priority actions to control point sources are: • Evaluation of Threemile Creek’s Salmon Spawning Beneficial Use Designation and
Idaho’s natural background water quality temperature criteria for application in the City of Grangeville’s wastewater treatment facility National Pollution Discharge Elimination System permit.
• Revision the Salmonid Spawning designated beneficial use above the migration barriers of 3 Mile Creek to Cold Water Biota.
Specific priority actions to control non point sources are: • The existing state and federal designated management agencies’ projects and programs. • Nutrient and sediment load reducing projects on private property, and implemented with
the cooperation of land owners on a voluntary basis are highest priority.

South Fork Clearwater River Implementation Plan April 2006
6

South Fork Clearwater River Implementation Plan April 2006
7
Chapter 2: Implementation Idaho Code 39-3611 and 39-3612 provides guidance on the development and implementation of TMDLs in Idaho. The guidance contained in code relies on participation and assistance of watershed advisory groups and designated management agencies. The following designated management agencies will assist the South Fork Clearwater River Watershed Advisory Group and the Department of Environmental Quality in the analysis and identification pollution control strategies for point and non point sources in the watershed. • Idaho Department of Lands (IDL) should assist with the identification and documentation
of strategies and measures addressing forestry, minerals and mining. • The Soil Conservation Commission (SCC), should assist with the identification and
documentation of strategies and measures addressing grazing, and agriculture. • Idaho Transportation Department (ITD) should assist with the identification and
documentation of strategies and measures addressing public roads and right-of-ways. • US Forest Service and Bureau of Land Management should assist with the identification
and documentation of strategies and measures addressing management practices and activities occurring on lands within their jurisdiction.
• The US EPA should assist with the identification and documentation of strategies and measures addressing National Pollution Discharge Elimination System permits.
• The Nez Perce Tribe should be responsible for activities occurring on tribal lands within the South Fork Clearwater River watershed subject to tribal authorities.
Table 2 lists projects being completed or proposed by the designated management agencies and community participants for pollutant control strategies for known point and non point sources within the watershed. The Watershed Advisory Group will continue to solicit and encourage additional water quality restoration and protection projects if unknown or unexpected problems should be discovered or encountered in the future.

South Fork Clearwater River Implementation Plan April 2006
8
Table 2. Pollutant Control Strategies
Implementation Task Category Pollutants
Estimated BMP
Effectiveness Status Schedule Task Participants
(Lead Agency) Outputs (Units) Cost
Funding Source
Funding Status
South Fork Clearwater River
Road Decommission Forestry Sediment 2005-2007 BLM 0.2 mile $6,000 BLM Secure
Road Improvement Forestry Sediment 2005-2007 BLM 1.0 mile $10,000 BLM Secure
Streamside Plantings Forestry Sediment Temperature 2005-2007 BLM 0.5 mile $15,000 BLM Secure
Floodplain Rehabilitation Forestry
Sediment Temperature 2005-2007 BLM 2 acres $15,000 BLM Secure
SF Cottonwood Implementation Project Agriculture
Sediment, Bacteria, Nutrients, Temperature
Sediment reduced ~10 tons/acre/year 100% 12/31/2004
Landowners, SCC, IASCD, NRCS $314,775 319 Completed
SF Cottonwood Implementation Project Agriculture
Sediment, Bacteria, Nutrients, Temperature
Sediment reduced ~10 tons/acre/year 40% 12/31/2007
Landowners, SCC, IASCD, NRCS $229,464 WQPA Implementing
Cottonwood Phase 2 Implementation Agriculture
Sediment, Bacteria, Nutrients, Temperature
Sediment reduced ~10 tons/acre/year 10% 9/30/2006
Landowners, SCC, IASCD, NRCS $279,728 319 Implementing
Division 2 IASCD AFO project Agriculture Bacteria
Sediment reduced ~10 tons/acre/year 50% 12/31/2005
Landowners, SCC, IASCD, NRCS
~10% of total grant is implemented within SF Clearwater River watershed 319 Implementing
Riparian Buffer Urban Riparian
Temp, Nutrients, Sediment, Bacteria,
60-80% sediment; 40-60% nutrients2
PCEI, private landowners, volunteers and other agency partners
$158,400 grant funds; $63,360 match
Idaho 319 Nonpoint source grants; Private grants
Floodplain Development
Urban Riparian
Sediment, Nutrients, Bacteria
PCEI, private landowners, volunteers and other agency partners $285,120 grant funds
Idaho 319 Nonpoint source grants; Private grants
Bank Stabilization/In-stream improvements
Urban Riparian
Sediment, Nutrients,
PCEI, private landowners, volunteers and other agency partners
$211,200 grant funds; $84,480 match
Idaho 319 Nonpoint source grants; Private grants
Fencing Livestock Bacteria, Sediment
PCEI, private landowners, volunteers and other agency partners
$13,306 grant funds; $5,322 match
Idaho 319 Nonpoint source grants; Private grants

South Fork Clearwater River Implementation Plan April 2006
9
Bank Stabilization Rural Roads Sediment
PCEI, private landowners, volunteers and other agency partners $190,080 grant funds
Idaho 319 Nonpoint source grants; Private grants
Bank Revegetation Rural Roads Sediment
PCEI, private landowners, volunteers and other agency partners
$295,680 grant funds; $118,272 match
Idaho 319 Nonpoint source grants; Private grants
Riparian Buffer Rural Riparian
Nutrients, Sediment, Bacteria,
60-80% sediment; 40-60% nutrients2 Proposed
PCEI, private landowners, volunteers and other agency partners
$1,584,000 grant funds; $633,600 match
Idaho 319 Nonpoint source grants; Private grants Pending
Floodplain Development
Rural Riparian
Sediment, Nutrients, Bacteria Proposed
PCEI, private landowners, volunteers and other agency partners
$2,851,200 grant funds
Idaho 319 Nonpoint source grants; Private grants Pending
Bank Stabilization/In-stream improvements
Rural Riparian
Sediment, Nutrients Proposed
PCEI, private landowners, volunteers and other agency partners
$1,056,000 grant funds; $422,400 match
Idaho 319 Nonpoint source grants; Private grants Pending
Wetland Creation Rural Wetlands
Sediment, Nutrients 85% sediment1
PCEI, private landowners, volunteers and other agency partners $156,815 grant funds
Idaho 319 Nonpoint source grants; Private grants
Wetland Riparian Buffer
Rural Wetlands
Sediment, Nutrients
PCEI, private landowners, volunteers and other agency partners
$199,680 grant funds; $79,872 match
Idaho 319 Nonpoint source grants; Private grants
Restoration Community Outreach and Education Education
Sediment, Temperature
PCEI, community groups and schools $350,074 grant funds Private grants
SH 13 & SH 14 Roads Sediment Pending ITD, City of Kooskia
Mag Cl Tank/Applicator CMAQ Pending
SH 13 & SH 14 Roads Sediment Pending ITD, City of Kooskia Vacuum Truck CMAQ Pending
SH 13 & SH 14 Roads Sediment Proposed 2007-2009 ITD, NPNF Sponsor Hydro-mulch $239,000
FHWA TransportationEnhancement Funds Pending
Reg. Air S. Sweeper Urban Runoff Sediment 30-90% sed. Complete Apr-04 EPA/Kooskia $129,688 90%/10% Funded
Sediment Trap Sediment Reduction Sediment Complete 1997 NPT BPA Secured
Road Condition Inventory (EAWS)
Sediment Reduction Sediment Complete 2000 NPT $194, 102 BPA Secured
Threemile / Buthcer Implementation Project Agriculture
Sediment, Bacteria, Nutrients,
Sediment reduced ~7 tons/acre/year NA 12/31/2007
Landowners, SCC, IASCD, NRCS $248,736 319
5% Completed

South Fork Clearwater River Implementation Plan April 2006
10
Temperature
Sediment Traps Urban Runoff Sediment 30-90% sed. Planning 2006 City Kooskia $100, 000 Grants Proposed
Paving existing gravel streets and parking lots
Roadside Erosion Control Sediment
90% sediment reduction Planning 2010 City Kooskia $12, 500 Grants Proposed
Road Decommissioning Forestry Sediment
NEPA in progress USFS (Blacktail) ~22 miles ~$200,000 NFS Proposed
Road Improvements Forestry Sediment NEPA in progress USFS (Blacktail) ~4 miles ~$80,000 NFS Proposed
Soil Restoration Forestry Sediment NEPA in progress USFS (Blacktail) Pending Pending NFS Proposed
Meadow Creek
Road Decommissioning Forestry sediment
23.5 miles complete
USFS/NPT (Meadow Face) 91 miles $701,000 NFS/BPA
Partially Secure
Road to Trail Conversion
Forestry, Recreation sediment
Implementation pending
USFS (Meadow Face) 5 miles $50,000 NFS
Partially Secure
Stream Crossing Improvements Forestry sediment
2 sites complete
USFS/NPT (Meadow Face) 43 sites $778,000 NFS/BPA
Partially Secure
Instream Improvements
Grazing, Forestry
sediment, temperature
Implementation in progress
USFS/NPT (Meadow Face) 3 miles $106,000 NFS/BPA
Partially Secure
Streamside Planting Grazing sediment, temperature
Implementation in progress NPT (Meadow Face) 50 acres $59,000 BPA Secure
Ditch Stabilization Grazing, Agriculture sediment
Implementation completed NPT (Meadow Face) 3 sites $18,000 BPA Secure
Recreation Site Improvements Recreation sediment
Implementation pending
USFS (Meadow Face) 12 sites $38,000 NFS
Partially Secure
Soil Restoration Forestry sediment 72 acres completed
USFS/NPT (Meadow Face) 550 acres $218,000 NFS/BPA
Partially Secure
Landslide Stabilization Natural sediment
Implementation pending
USFS (Meadow Face) 1 site $15,000 NFS/RAC Secure
Santiam Creek
Road Decommissioning Forestry sediment
Implementation in progress USFS (Starbucky) 6 miles ~$60,000 NFS Secure

South Fork Clearwater River Implementation Plan April 2006
11
Road Improvement Forestry sediment
Implementation in progress USFS (Starbucky) 5 miles ~$22,000 NFS Secure
Road to Trail Conversion Forestry sediment
Implementation pending USFS(Starbucky) 2 miles ~$20,000 NFS Secure
Trail Improvement Recreation sediment
Implementation pending USFS (Starbucky) 2 miles ~$10,000 NFS Secure
Mine Site Improvement Mining sediment
50% complete USFS (Starbucky) 1 site $75,000 NFS Secure
American River
Road Decommissioning Forestry Sediment
Plan to award contract in 2006
NEPA complete 2007-2012
USFS (American/Crooked) 20.2 miles $147,000 NFS
Partially Secure
Road Improvements Forestry Sediment Plan to award contract in 2006
NEPA complete 2007-2012
USFS (American/Crooked) 6.6 miles $5,000 NFS
Partially Secure
Stream Crossing Improvements Forestry Sediment
Plan to award contract in 2006
NEPA complete 2007-2012
USFS (American/Crooked) 9 sites $220,000 NFS
Partially Secure
Recreation and Trail Improvement Recreation Sediment
Plan to award contract in 2006
NEPA complete 2007-2012
USFS (American/Crooked) 2.4 miles $12,000 NFS
Partially Secure
Soil Restoration Forestry Sediment Plan to award contract in 2006
NEPA complete 2007-2012
USFS (American/Crooked) 21 acres $52,000 NFS
Partially Secure
Road Decommission Forestry Sediment Planned 2005 - 2010 BLM 10.00 miles $120,000 BLM
Partially Secure
Road Closure Forestry Sediment Planned 2005-2008 BLM 5.0 miles $25,000 BLM Partially Secure
Road to Trail Conversion Forestry Sediment Planned 2005 - 2007 BLM 3.0 miles $30,000 BLM
Partially Secure
Riparian Restoration Mining Sediment Temperature Planned 2005-2008 BLM 15 miles $200,000 BLM
Road Relocation Forestry Sediment Planned 2006-2010 BLM 2.0 miles $35,000 BLM
Instream Improvements Mining Sediment Planned 2006-2010 BLM 6.0 miles $200,000 BLM
Riparian Grazing Management
Livestock Grazing Sediment Ongoing Ongoing BLM 30.0 miles $30,000 BLM Secure
Riparian Fencing Livestock Grazing
Sediment Temperature Ongoing Ongoing BLM 2.5 miles $35,000 BLM/BPA
Partially Secure
Road Improvements Forestry Sediment Planned 2005 - 2010 BLM 10.0 miles $100,000 BLM

South Fork Clearwater River Implementation Plan April 2006
12
Wetland Rehab. Mining Sediment Temperature Planned 2005 - 2010 BLM 25 acres $200,000 BLM
Crooked River
Road Decommissioning Forestry Sediment
Contract awarded in 2006
NEPA complete 2006-2011
USFS (American/Crooked) 17.5 miles $117,000 NFS Secure
Road Improvements Forestry Sediment Contract awarded in 2006
NEPA complete 2006-2011
USFS (American/Crooked) 17.2 miles $100,000 NFS Secure
Road Improvements Forestry Sediment Contract awarded in 2006
NEPA complete 2006-2011
USFS (American/Crooked) 3 sites $11,000 NFS Secure
Stream Crossing Improvements Forestry Sediment
Contract awarded in 2006
NEPA complete 2006-2011
USFS(American/Crooked) 25 sites $764,000 NFS Secure
Instream Improvements
Mining, Forestry
Sediment, Temperature
Contract awarded in 2006 (partial)
NEPA complete 2006-2011
USFS (American/Crooked) 23.8 miles $737,000 NFS
Partially Secure
Recreation and Trail Improvement Recreation Sediment
Contract awarded in 2006
NEPA complete 2006-2011
USFS (American/Crooked)
1.8 miles+8 sites $62,000 NFS Secure
Mine Site Reclamation Mining Sediment
Contract awarded in 2006
NEPA complete 2006-2011
USFS (American/Crooked) 9 acres $25,000 NFS Secure
Soil Restoration Forestry Sediment Contract awarded in 2006
NEPA complete 2006-2011
USFS (American/Crooked) 37 acres $97,000 NFS Secure
Road Improvement Forestry Sediment 2005-2007 BLM 1.0 mile $10,000 BLM Secure
Newsome Creek
Road Decommissioning Forestry
Sediment
NEPA in progress NPT/USFS 25 miles $225,000 BPA Secure
Road Improvements Forestry Sediment NEPA in progress NPT/USFS 20 miles $88,000 BPA Secure
Instream Improvements
Mining, Forestry
Sediment, Temperature
NEPA in progress NPT/USFS 4.0 miles $1,800,000 BPA
Partially Secure
Soil Restoration Forestry Sediment NEPA in progress NPT/USFS 10 acres $25,000 BPA Secure
Sediment Trap Sediment Reduction Sediment Complete 1997 USFS BPA Secured
Road Condition Inventory (EAWS)
Sediment Reduction Sediment Complete 2000 NPT/USFS $194, 102 BPA Secured
Road Condition Inventory (EAWS)
Sediment Reduction Sediment Complete 2001 NPT/USFS $418, 251.05 BPA Secured

South Fork Clearwater River Implementation Plan April 2006
13
Road Decommissioning & Improvments
Sediment Reduction Sediment
In progress NPT/USFS $297, 515 BPA Secured
Culvert Survey and Design
Sediment Reduction Sediment
In progress NPT/USFS BPA Secured
Channel Rehabilitation
Sediment, Temperature
Sediment, Temperature Pending
NPT, NOAA, USFWS, SHPO, USFS BPA Secured
Red River
Road Decommissioning Forestry Sediment
NEPA in progress USFS (Red Pines) 102 miles $763,000 NFS
Road Improvements Forestry Sediment NEPA in progress USFS (Red Pines) ~13 miles ~$57,000 NFS
Stream Crossing Improvements Forestry Sediment
NEPA in progress USFS (Red Pines) 21 sites ~$750,000 NFS
Instream Improvements
Mining, Forestry, Grazing
Sediment, Temperature
NEPA in progress USFS (Red Pines) 32 miles ~$350,000 NFS
Partially Secure
Recreation and Trail Improvement Recreation Sediment
NEPA in progress USFS (Red Pines) 15 acres $172,000 NFS
Mine Site Reclamation Mining Sediment
NEPA in progress USFS (Red Pines) 23 acres $48,000 NFS
Soil Restoration Forestry Sediment NEPA in progress USFS (Red Pines) 30 acres $75,000 NFS
Road Decommissioning Forestry Sediment
NEPA in progress NPT/USFS 13 miles $117,000 BPA Secure
Road Improvements Forestry Sediment NEPA in progress NPT/USFS 20 miles $88,000 BPA Secure
Stream Crossing Improvements Forestry Sediment
NEPA in progress NPT/USFS 1 site $70,000 BPA Secure
Soil Restoration Forestry Sediment NEPA in progress NPT/USFS 5 acres $13,000 BPA Secure
Road and Culvert Surveys
Sediment Reduction Sediment Complete 2002 NPT.USFS $95,811 BPA Secured
Aquatic Restoration Sediment Reduction Sediment Complete NPT/USFS $138, 784.15 BPA Secured
Two Culvert Replacements Little Campbell Cr. Forestry Sediment Complete 2004 BLM 2 $30,000 BLM Secure

South Fork Clearwater River Implementation Plan April 2006
14
Road Improvement Forestry Sediment Ongoing 2005 BLM 1.5 $30,000 BLM Secure
Road Closure Forestry Sediment Ongoing 2004-2005 BLM 2.7 $20,000 BLM Secure

South Fork Clearwater River Implementation Plan April 2006
15
Point Sources
Kooskia/Stites NPDES Bacteria Ongoing 2004 US EPA Permit
Grangeville
NPDES Nutrients,
Bacteria Ongoing
2004 US EPA Permit
Elk City
NPDES
Bacteria Ongoing
2004
US EPA Permit
Red River Ranger Station
NPDES Bacteria Ongoing 2004 US EPA Permit
Suction Dredge
NPDES Sediment Ongoing US EPA Permit
Storm Water
NPDES
Sediment Ongoing 2005 US EPA Permit

South Fork Clearwater River Implementation Plan April, 2006
16
2.1 Agriculture and Grazing Continuous direct seeding, contour tillage, strip-cropping reduces, grassed waterways, sediment basins, gully plugs, vegetated buffers, and sediment traps are considered the agricultural best management practices most applicable in the watershed. The Idaho Soil Conservation Commission has developed an implementation plan for agriculture which is included in Appendix A of this document. Commission records show grazing plans for best management practices extend through 2011 on 1,743.7 acres including the Cottonwood Creek watershed. The Natural Resource Conservation Service has treatment contracts for best management practices on approximately 320 acres. The Nez Perce Tribe Land Services Division has conservation plans for best management practices on 12 grazing allotments in the South Fork watershed. 2.2 County and State Roads The Idaho Transportation Department best management practices will address problem areas such as eroding road cuts and fill banks and water conveyance problems contributing to non-point source pollution. Unstable, eroding road cut and fill banks will be shaped and stabilized by planting woody and herbaceous vegetation. Additional methods to stabilize the slope and reduce erosion include installation of erosion control blankets, armoring, and slope reduction. The Forest Service will establish best management practices to reduce sediment from Forest Service roads to include installation of culverts, improvements of road ditches, erection of bank buttresses, armoring, vegetated buffers, and re-shaping cut slopes and fill banks. 2.3 Forestry The Nez Perce National Forest and Bureau of Land Management will use best management practices to control pollutant sources under their jurisdiction. The Nez Perce National Forest Plan requires that most projects in the South Fork watershed have watershed improvements associated with the project. Specific details about some of these projects are found in Table 2. Most of the best management practices contain both sediment source reduction and shade improvement The Forest has an ongoing water quality and fish habitat monitoring program in the South Fork Clearwater River subbasin. This includes operation of four stream gaging stations at which suspended and bed load sediment are sampled and stream flow is measured. There are also numerous thermograph sites in the main stem and tributaries. Fish habitat monitoring stations have been established on several tributaries. A sediment monitoring plan for the main stem South Fork Clearwater River is included as Appendix B. Project implementation and effectiveness monitoring occurs on a sample basis. It is anticipated that the Forest will periodically conduct best management practice implementation monitoring to track progress toward meeting the goals of the TMDL. The National Forest will compile information of best management practices that have been implemented and the estimated changes in sediment yield. The Forest will summarize changes in shade conditions and report the results of water quality and substrate monitoring to DEQ, the Advisory Group and general public.

South Fork Clearwater River Implementation Plan April, 2006
17
The Nez Perce Tribe’s 1999 Forest Management Plan outlines best management practices that will be implemented on Tribal lands during timber harvest activities. These include riparian buffer strips, road designs, re-vegetation, and harvest practices. The Idaho Department of Lands will ensure the implementation of best management practices required by the Idaho Forest Practices Act. The Department of Lands best management practices address timber harvest, forest road construction and maintenance, forest tree stocking and reforestation, and use of chemicals/management and prescribed fire. 2.4 Point Source Wastewater Allocations Wastewater allocations will be implemented through the US Environmental Protection Agency’s National Pollution Discharge Elimination System permit program regulating effluent loads from regulated facilities. Currently permitted facilities include the Kooskia/ Stites, Grangeville, Elk City, and Red River Ranger Station wastewater treatment plants. A general permit has been established for construction and industrial storm water discharges. Currently there are no municipal storm water sources in the watershed subject to permit requirements. The US EPA considers suction dredges to be point sources that require National Pollution Discharge Elimination System permits. Other permitting processes applicable to suction dredges include Idaho Department of Water Resources: Stream Channel Alteration Permit; US Forest Service: Plan of Operations approval, Decision Notice and Finding of No Significant Impact; Bureau of Land Management: Decision Notice and Finding of No Significant Impact; and Army Corps of Engineers: Clean Water Act Section 404 permit.

South Fork Clearwater River Implementation Plan April, 2006
18

South Fork Clearwater River Implementation Plan April, 2006
19
Chapter 3: Past and Present Watershed Improvement Activities The Federal land management strategy called PACFISH applies to all proposed projects including recreation, mining, timber, roads, and grazing management projects required to comply with the National Forest Management Act and the Federal Land Policy and Management Act. The Bonneville Power Administration and the Nez Perce National Forest entered into an agreement in 1984 to improve fish habitat in accordance with the Pacific Northwest Electric Power Planning and Conservation Act of 1980. Improvement projects funded by BPA continue cooperatively with the Nez Perce Tribe. Cooperative improvement projects are also being funded using the Pacific Coast Salmon Recovery Funds and Title II funds under the Secure Rural Schools and Community Self-Determination Act of 2000. Road decommissioning in the Nez Perce National Forest increased in 1995. Current forest improvement projects focus on road decommissioning, road improvements, soil restoration and instream and riparian improvements. The Nez Perce Tribe has fenced meadows and riparian areas, stabilized stream channels, and planted vegetation on stream banks and in meadows throughout the watershed. Monitoring of these projects has been on-going to assess effectiveness. Projects have been completed in the Red River, Newsome Creek, Johns Creek, Meadow Creek, and Mill Creek watersheds. The Nez Perce Tribe is currently planning road decommissioning in several watersheds in the watershed. Instream structures, riparian vegetation, fencing and restoration of dredge mining areas have been completed in the Red River watershed. From 1985 to 1989, six sediment traps were installed in the Red River drainage to reduce sediment. In 1990, a rock crib check dam to trap sediment from the Cal-Idaho mining site was installed to reduce sediment reaching the Red River. Approximately 0.75 mile of stream channel was realigned and stabilized, in stream structures were installed, and riparian vegetation was planted in the meadow area below the confluence of the South Fork Red River and the Red River. The 314 acre Red River Wildlife Management Area was deeded to IDFG to manage for high quality habitat for bull trout, steelhead trout, chinook salmon. Project planning began in 1994 and implementation began in 1996. Monitoring was initiated in 1997 to assess the effectiveness of the project. As of 2001, channel length in the project area had been increased by 5,045 feet. Stream slope had been decreased by 40 percent, and sinuosity had been increased by 60 percent. The project decreased water velocity and reduced bank erosion. Channel width and depth characteristics have been improved in the project area. Improvements were made in Red River near the Bridge Creek Campground and Red River Hot Springs to decrease sediment loads. A project completed on Crooked River increased riparian vegetation, stabilized banks, reconnected a floodplain, and provided in stream cover.

South Fork Clearwater River Implementation Plan April, 2006
20
In the 1990s, the BLM completed a aquatic habitat project in American River. The project included riparian and wetland restoration, installation of in stream fish habitat structures, relocation of stream channels, and construction of rearing ponds and channels. The BLM has closed problem roads under its jurisdiction to motorized vehicles to reduce erosion and sediment delivered to the River. The BLM has replaced culverts to improve roads and will continue to make improvements on existing roads. A total of 5 miles of in stream improvements have been made on the American River by BLM. Approximately 0.3 miles of the East Fork American River have received improvements. Grazing plans have been developed to reduce grazing impacts along stream banks and include restrictions on seasonal use, standards for utilization, and riparian grazing restrictions. Streams with overgrazing problems, including Elk Creek and Big Elk Creek, have had riparian areas fenced. The Haysfork mining site has been a sediment source in Newsome Creek. In the 1980s and 1990s, the upper slopes of the mine were reshaped and revegetated with grasses, shrubs and trees. The drainage system in the hole was improved and the area was lined with erosion control material. Existing sediment traps were emptied on the stream side of the hole, and a third trap was installed above the two existing traps. In 1997, a settling pond was created to reduce sediment input to Newsome Creek. The Nez Perce Tribe and the Forest Service plan to decommissioning approximately 7 miles of roads in the Newsome Creek drainage. Trees and shrubs were planted in the Leggett Placer glory hole in 1987, and a sediment trap was constructed adjacent to the road below Leggett Placer. The Forest Service has rehabilitated roads and trails and obliterated roads in the Johns Creek watershed. The Forest Service has stabilized a llide on Road 9429. The Nez Perce Tribe fenced approximately 1 mile of stream along Johns Creek to minimize the impacts from grazing. In 1988, trees were planted on the slopes of the mining hole near Meadow Creek. A partial fish barrier was removed from Meadow Creek in 1986. The Meadow Face project will complete soil restoration, road decommissioning, road improvements, landslide stabilization and in stream improvements. Fence installation, riparian and stream channel improvements, and road decommissioning has occurred in the Meadow Creek drainage since 1997. Approximately 600 acres are fenced in McComas Meadows to reduce grazing impacts. In 2001, the Forest Service completed channel restoration on Swede Creek, a tributary of Meadow Creek. A stabilization plan has been developed for a the slide area near the mouth of Meadow Creek. Seeding and mulching is recommended to rehabilitate deep gullies and unstable slopes at the Prospector Bunny Mine site. The Forest Service rehabilitated the Fisher Placer Road and Road #297L. Roads in Bully Creek and elsewhere in the general area, known locally as “the Cove”, were rehabilitated in 2001. Additionally, a portion of Road #2021 in that area was decommissioned in 2005, in response to the Blackerby Fire. Road improvements, road decommissioning, and mine stabilization are planned for the Santiam, Buckhorn and several other watersheds.

South Fork Clearwater River Implementation Plan April, 2006
21
Chapter 4: Proposed Priority Areas for Improvement The Watershed Advisory Group has prioritized projects and work that provide integrated solutions, local economic compatibility and community involvement. High priority projects address multiple pollutants and beneficial uses, and projects that reduce nutrient and sediment loads from private property implemented with the cooperation of land owners on a voluntary basis. Agriculture, stream channel bed and banks, and roads are contributing the highest levels of pollutant loads. The Idaho Soil and Water Conservation District and the Idaho Soil Conservation Commission has prioritized agricultural areas that need Best management practices in the Implementation Plan for Agriculture (Appendix A). Sources of Implementation Funding The Idaho Soil Conservation Commission, Idaho Fish and Game, Idaho Department of Transportation, Idaho Department of Environmental Quality, the US Department of Agriculture, US Forest Service, Department of Interior, Environmental Protection Agency, and the Bonneville Power Administration administer watershed protection and restoration funds. Other funding sources include non-profit organizations and local government agencies. Congress established the Watershed Protection and Flood Prevention Program to assist local organizations to complete watershed projects. The program is administered by the US Department of Agriculture Natural Resource Conservation Service. Clean Water Act Section 319 Non point Source Management Program grants fund non point source projects. The US Environmental Protection Agency allocates funds annually to States and Tribes with approved Non point Source Management Programs to control non point source pollution. Idaho’s Water Quality Plan for Agriculture is administered by the Idaho Soil Conservation Commission and provides funds for agricultural best management practices to protect and restore water quality and fish and wildlife habitat. Agricultural land may be eligible for funds if the local soil conservation district and the ISCC designate the property as a critical area or source of pollution. Project funding is prioritized based on criteria such as Idaho’s TMDL schedule, watershed management plans, the beneficial uses affected and Endangered Species Act status. The Conservation Reserve Program was established by the Food Security Act of 1985 to protect environmentally sensitive agricultural land. The program contracts with agricultural land owners to use conservation practices in critical areas. The program is administered by the US Department of Agriculture Farm Service Agency on behalf of the US Department of Agriculture’s Commodity Credit Corporation.

South Fork Clearwater River Implementation Plan April, 2006
22
The US Department of Agriculture Natural Resource Conservation Service’s Wildlife Habitat Incentive Program provides funds from the Commodity Credit Corporation for conservation of upland, wetland, riparian, and aquatic habitat areas on eligible properties. The Resource Conservation and Rangeland Development Program is administered by the Idaho Soil Conservation Commission to provide funds for conserving water and soil resources, promoting efficient and beneficial use of water resources, TMDL implementation, and improving riparian areas. The program offers both loans and grants with top priority given to applicants on a 303(d) listed stream with a completed TMDL. The Idaho Fish and Game Habitat Incentive Program provides funds for enhancing upland game bird and waterfowl habitat. Projects are tailored to the HIP, though the scope of any individual project must incorporate available land, water, and specific needs of the local wildlife. The US Department of Agriculture Natural Resource Conservation Service administers the Environmental Quality Incentives Program and provides funds to encourage farms to adopt best management practices such as nutrient management, manure management, and pasture management with incentive payments for eligible conservation practices. Pheasants Forever is a non-profit conservation organization founded in 1982 to protect, enhance, and restore wildlife habitat by funding habitat improvement projects and acquiring and preserving habitat through land acquisition. The Idaho Transportation Enhancement Program (TEP) is a statewide competitive program that distributes federal funds to projects that strengthen the cultural, aesthetic or environmental value of Idaho’s surface transportation system. Category 11a of the program specifically addresses mitigation to address water pollution due to highway runoff. Title II funds under the Secure Rural Schools and Community Self-Determination Act of 2000 are available for improvement projects associated with National Forest lands and resources. The funds can be used off-Forest if there is a benefit to National Forest resources.

South Fork Clearwater River Implementation Plan April, 2006
23
Chapter 5: Evaluation Idaho Code 39-3611 requires the Department of Environmental Quality to review and evaluate each Idaho TMDL, supporting subbasin assessment, implementation plan and all available data periodically at intervals no greater than five years. Such reviews are to be conducted using the Beneficial Use Reconnaissance Program protocol and the Water Body Assessment Guidance methodology to determine beneficial use attainability and status and whether state water quality standards are being achieved.
Idaho Code 39-3621 requires designated agencies, in cooperation with the appropriate land management agency to ensure best management practices are monitored for their effect on water quality. The monitoring results should presented to the Department of Environmental Quality on a schedule agreed to between the designated agency and the Department.
5.1 Department of Environmental Quality, Water Quality Monitoring The South Fork Clearwater River will be monitored by the Department of Environmental Quality to determine beneficial use support status and compliance with State water quality standards on a five year cycle in accordance with Idaho Code 39-3611. Sediment and temperature data will be gathered by the Department and analyzed with biological and habitat data using the Idaho waterbody assessment guidance to assist in the determination of beneficial use support status. Temperature of the main stem South Fork Clearwater River will be tracked by the Department at the stream gage stations located near Crooked River and Stites. The Department of Environmental Quality has placed temperature recorders at selected sites in the watershed to correlate and calibrate the temperature recorded at the sites with the temperature data collected at the gage stations for long term water temperature tracking in the watershed. Recorders have been placed in the South Fork Clearwater River just above its confluence with Butcher Creek, Johns Creek, Ten Mile Creek, and Crooked River. Additional recorders have been placed in Three Mile Creek, Big Elk Creek, Red River, Butcher Creek, Newsome Creek, Crooked River, Little Elk Creek, and American River. The Department will continue to monitor Three Mile Creek for nutrients, bacteria, sediment, dissolved oxygen, and flow at the locations listed in Table 3 every two weeks during the months of July, August, and September to assist in refining information used in establishing load and waste load allocations for Three Mile Creek.

South Fork Clearwater River Implementation Plan April, 2006
24
Table 3. Sampling locations to be monitored on Three Mile Creek for various parameters.
Sampling Location Parameters
Headwaters Bacteria, Nutrients, Dissolved Oxygen, Flow
Above the City of Grangeville Bacteria, Nutrients, Dissolved Oxygen, Flow
Up stream of Wastewater Plant Bacteria, Nutrients, Dissolved Oxygen, Flow
Down stream of Wastewater Plant Bacteria, Nutrients, Dissolved Oxygen, Flow
Above the Fish Barrier Bacteria, Nutrients, Dissolved Oxygen, Flow
Above and below the mass failure Bacteria, Nutrients, Dissolved Oxygen, Flow
Mouth Bacteria, Nutrients, Dissolved Oxygen, Discharge, Continuous Temperature, Flow
5.2 Sampling Methods Table 4 lists parameters to be analyzed along with sample size, preservation requirements, holding time, laboratory certified methods, and corresponding method detection limit (MDL). E. coli bacteria samples are reported in colony forming units (cfu) per 100 milliters. With the exception of bacteria samples, each grab sample will be placed in a 2.5-gallon polyethylene churn sample splitter. The resultant sample will then be thoroughly homogenized and poured off into properly prepared sample containers. Nutrients water samples that require preservation will be obtained in preserved (H2SO4 pH <2) 500 ml sample containers. The polyethylene churn splitter will be thoroughly rinsed with ambient water at each location prior to sample collection. Bacteria samples will be collected directly from mid-stream flow into properly prepared sterile sample bottles. Refer to Table 4 for a list of parameters, analytical methods, preservation, and holding times. All sample containers will be equipped with sample labels that will be filled out using water proof markers with the following information: station location, sample identification, date of collection, and time of collection. Clear packing tape will be wrapped around each sample bottle and its label to insure that moisture from the coolers does not cause the loss of sample labels. All resultant samples will be placed within a cooler, on ice, to await shipment to the appropriate laboratory. All samples, except bacteria, will be analyzed by the Analytical Services Lab in Moscow, Idaho. Bacteria samples will be analyzed by Anatek Lab in Moscow. Samples will be shipped either the same day or early the next morning to meet the 30-hour holding time.

South Fork Clearwater River Implementation Plan April, 2006
25
Table 4. Water quality parameters.
Parameters Sample Size Preservation Holding
Time Method MDL1
(mg/L)2
Non Filterable Residue (TSS) 1L Cool 4°C 7 Days EPA 160.2 1.0
Nitrate+Nitrite-N (NO3+NO2)
100 ml Cool 4°C, H2SO4pH < 2 28 Days EPA 353.2 0.05
Nitrogen Ammonia (NH3)
100 ml Cool 4°C, H2SO4pH < 2 28 Days EPA 350.1 0.05
Total Phosphorus (TP) 100 ml Cool 4°C, H2SO4
pH < 2 28 Days EPA 365.4 0.05
Escherichia coli (E. coli) 100 ml Cool 4°C 30 Hours MPN 1.0 cfu
MDL=Method Detection Limit 2mg/L= milligrams per liter
At each location, field parameters of dissolved oxygen, temperature, specific conductance, and pH will be measured. These measurements will be taken, when possible, from a well-mixed section, near mid-stream at approximately mid-depth. Calibration of all field equipment will be in accordance with the manufacturer’s specifications. Table 5 lists field measurements, equipment and calibration techniques to be used. All field measurements will be recorded in a bound log book or on the appropriate data sheet, along with any relevant observations about the monitoring site, including weather conditions, flow rates, personnel on site or any potential problems observed that may affect the quality of data.
Table 5. Field Measurements
Parameters Instrument Calibration
Dissolved Oxygen YSI Model 55 100% Saturation
Temperature
YSI Model 55 Water Temp Pro Data logger
Centigrade thermometer Centigrade thermometer
Conductance Orion Model 115 Specific Conductance (25oC)
PH Orion Model 210A Standard buffer (7,10) bracketing for linearity

South Fork Clearwater River Implementation Plan April 2006
26
Flow measurements, when wadeable, will be collected using a Marsh McBirney-Flow Mate Model 2000 flow meter. The six-tenth-depth method (0.6 of the total depth below water surface) will be used when the depth of water is less than or equal to three feet. For depths greater than three feet the two-point method (0.2 and 0.8 of the total depth below the water surface) will be employed. At each site, a transect line will be established across the width of the drain/creek at an angle perpendicular to the flow. The mid-section method for computing cross-sectional area along with the velocity-area method will be used for discharge determination. The discharge is computed by summation of the products of the partial areas (partial sections) of the flow cross-sections and the average velocities for each of those sections. This method will be used to calculate cubic feet per second at each of the monitoring stations. 5.3 Quality Assurance and Quality Control Anatek Labs utilizes methods approved and validated by USEPA for inorganic parameter testing. A method validation process, including precision and accuracy performance evaluations and method detection limit studies, are required of all of Anatek’s analytical methods. Method performance evaluations include quality control samples, analyzed with a batch to ensure sample data integrity. Internal laboratory spikes and duplicates are all part of Anatek’s quality assurance program. Laboratory QA/QC results generated from this project can be provided upon request. QA/QC procedures from the field-sampling portion of this project will consist of duplicates (at 10% of the sample load) along with blank samples (one set per sampling day). The field blanks will consist of laboratory-grade de-ionized water, transported to the field and poured off into a prepared sample container. The blank sample is used to determine the integrity of the field teams handling of samples, the condition of the sample containers supplied by the laboratory and the accuracy of the laboratory methods. Duplicates consist of two sets of sample containers filled with the same composite water from the same sampling site. The duplicates are used to determine both field and laboratory precision. The duplicate and blank samples will not be identified as such and will enter the laboratories blindly for analyses. Both the duplicates and blank samples will be stored and handled with the normal sample load for shipment to the laboratory. Bacteriological samples collected will be transported from the field to Anatek in Moscow where the samples will be run within the 30 hour holding time. Anatek’s procedures use MPN (most probable number) by Quanti-Tray test to determine E. coli and total coliform bacteria concentrations. If after repeated sample collection and analyses, error is found to be constant in collection protocol or analytical procedures, the degree of inaccuracy will be determined and applied to the corresponding data set. Each batch of data from a survey will be reviewed to insure that all necessary observations, measurements, and analytical results have been properly recorded. The analytical results will be reviewed for completeness and quality control results. Any suspected errors will be investigated and resolved, if possible.

South Fork Clearwater River Implementation Plan April 2006
27
5.4 Designated Management Agencies, Water Quality Monitoring Idaho Code 39-3612 states designated management agencies are to use TMDL processes for achieving water quality standards. Idaho Code 39-3621 states designated agencies, in cooperation with the appropriate land management agency are to ensure best management practices are monitored for their effect on water quality. The Department of Environmental Quality will rely on the designated management agencies to implement pollution control measures or best management practices for pollutant sources they identify as priority. The designated management agency should report the effectiveness of the measures or practices implemented to the Department in the form of load reductions applicable to the TMDL. Pollutant controls or best management practices determined to be ineffective in achieving the desired load reductions are subject to the Feedback Loop process or adaptive management to ensure load reductions are achieved. The feedback loop provides for water quality improvements and maintenance through best management practice installation, evaluation and modification. Implementing the feedback loop to modify best management practices until water quality standards are met results in compliance with the water quality standards. Appendix A contains the TMDL implementation plan for agriculture developed by the Idaho Soil Conservation Commission and includes the agricultural best management practices recommended to achieve the load reductions desired and provisions for monitoring and evaluating data to ensure application of the feedback loop if needed. Appendix B contains the sediment monitoring plan developed by the USDA Forest Service and other agencies to compare annual sediment loads at several points, track sediment yield trends over time, and determine substrate and channel morphology conditions. The data will be used to distinguish sediment yields from the forested, upper parts of the watershed from those contributing from the agriculturally-dominated lower parts of the watershed, assisting in application of the feedback loop for lands managed by the Forest Service.

South Fork Clearwater River Implementation Plan April 2006
28

South Fork Clearwater River Implementation Plan April 2006
29
Appendix A. South Fork Clearwater TMDL Implementation Plan for Agriculture

South Fork Clearwater River Implementation Plan April 2006
30

South Fork Clearwater River Implementation Plan April 2006
31
South Fork Clearwater River TMDL Implementation Plan for Agriculture
Idaho Soil Conservation Commission
March 2005

South Fork Clearwater River Implementation Plan April 2006
32

South Fork Clearwater River Implementation Plan April 2006
33
Table of Contents
Introduction............................................................................................................ 35 Goal................................................................................................................ 36 Objectives....................................................................................................... 36 Project Setting ................................................................................................ 37 Land Use ........................................................................................................ 37 Land Ownership ............................................................................................. 38 Accomplishments ........................................................................................... 39
Cottonwood Creek ................................................................................... 39 Red River................................................................................................. 41 Tribal........................................................................................................ 41 USFS Allotments ..................................................................................... 42 BLM Allotments........................................................................................ 42
Problem .................................................................................................................. 42 Beneficial Use Status ..................................................................................... 42 Pollutants – Load Allocation and Reduction ................................................... 42
Sediment.................................................................................................. 42 Bacteria.................................................................................................... 44 Nutrients .................................................................................................. 45 Temperature ............................................................................................ 45
Water Quality Monitoring Results ................................................................... 46 Biological and Other Data ........................................................................ 46 Watershed Flow Characteristics .............................................................. 49 Water Column Data ................................................................................. 49 Summary and Analysis of Existing Water Quality Data for Threemile Creek and Butcher Creek................................................................................... 49
Critical Acres .................................................................................................. 52 Definitions ................................................................................................ 52 Quantifications ......................................................................................... 52 Location ................................................................................................... 53
ESA Issues..................................................................................................... 53 AFOs .............................................................................................................. 54 Nitrate Priority Area ........................................................................................ 55
Implementation Priority......................................................................................... 56 Sub-Watersheds............................................................................................. 56 Critical Areas .................................................................................................. 56
Treatment ............................................................................................................... 57 Treatment Units .............................................................................................. 57
Threemile Creek ...................................................................................... 58 Butcher Creek.......................................................................................... 58 Sally Ann Creek ....................................................................................... 59 Rabbit Creek............................................................................................ 60

South Fork Clearwater River Implementation Plan April 2006
34
Lower SFCR.............................................................................................60 Mid-Lower SFCR......................................................................................61 Above Forest Service Boundary...............................................................62
Alternatives and Costs ....................................................................................62 Threemile Creek.......................................................................................62 Butcher Creek ..........................................................................................64 Sally Ann Creek .......................................................................................65 Rabbit Creek ............................................................................................66 Lower SFCR.............................................................................................67 Mid SFCR.................................................................................................69 Above FS Boundary .................................................................................71
Funding ...................................................................................................................71
Outreach .................................................................................................................73
Monitoring and Evaluation ....................................................................................74 Field Level ......................................................................................................74
Status Reviews ........................................................................................74 BMP Effectiveness ...................................................................................74
Watershed Level .............................................................................................74 Pollution Source and Transport................................................................74 Project / Program Reviews.......................................................................75 Progress Tracking and Reporting.............................................................75
References..............................................................................................................76

South Fork Clearwater River Implementation Plan April 2006
35
Introduction A subbasin assessment and several total daily maximum loads (TMDLs) were developed for the South Fork Clearwater River (SFCR) subbasin in pursuant to Clean Water Act. This implementation plan will address the significant non-point, agricultural sources of sediment, temperature, nutrients, and bacteria in areas of the South Fork Clearwater River watershed dominated by agricultural and grazing activities (Table 1).
Table 1: Streams and Pollutants for which TMDLs were developed
Stream Pollutant(s)
South Fork Clearwater River Sediment, Temperature Threemile Creek Bacteria, Nutrients, DO, Sediment, Temperature Butcher Creek Sediment, Temperature Other Water Bodies Temperature
The agricultural component of the SFCR Subbasin (HUC 17060305) TMDL implementation plan presents an adaptive management approach for the implementation of agricultural Best Management Practices (BMPs) and Resource Management Systems (RMS) as described in the Agricultural Pollution Abatement Plan (Ag Plan) fir Idaho (Idaho Soil Conservation Commission 2002b) on private lands. Implementation activities will be phased on a sub-watershed basis due to the size of the South Fork Clearwater River Subbasin, which encompasses approximately 752,000 acres. Within the South Fork Clearwater River Subbasin approximately 203,840 acres (27%) are grazing and agricultural lands (Figure 1).
Figure 1. Land Use Distribution in the SFCR Subbasin The Cottonwood Creek TMDL implementation plan was completed in 2001. This plan addressed the following streams which are within the SFCR watershed: Lower Cottonwood Creek, Upper Cottonwood Creek, Lower Red Rock Creek, Upper Red Rock Creek, Stockney Creek, Shebang Creek, South Fork (SF) Cottonwood Creek, and Long Haul Creek (Figure 2). Implementation activities are currently in progress in the Cottonwood

South Fork Clearwater River Implementation Plan April 2006
36
Creek watershed as outlined in the Cottonwood Creek implementation plan. (Idaho Soil Conservation Commission 2001)
Figure 2. The South Fork Clearwater River Subbasin in North-Central Idaho Goal The goal of this Implementation Plan is to develop a comprehensive and detailed plan for agriculture in order to successfully implement the SFCR TMDL and work toward meeting the TMDL loading targets for sediment, nutrients, bacteria and temperature while assisting and/or complimenting other watershed efforts in restoring and protecting beneficial uses for the 303(d) listed stream segments. Objectives The primary objectives of this plan are to (1) reduce the amount of sediment, nutrients, and bacteria and lower temperatures in Threemile Creek, (2) reduce sediment and lower temperatures in Butcher creek, and (3) lower temperatures and reduce sediments in SFCR. Agriculture pollutant reductions and temperature reductions (where feasible) will be achieved through the BMPs and RMS developed and implemented on a site-specific basis with individual agriculture operators. Another objective of this plan is the implementation of a water quality outreach program to encourage landowner participation in the application of water quality BMPs. Emphasis will also be placed on BMP effectiveness evaluation and monitoring in terms of pollutant reduction and impacts on designated beneficial uses of the listed stream segments. Educate local landowners, citizens and agency personnel about water quality issues, conditions, concerns, and best management practices will enhance the overall success of the project.

South Fork Clearwater River Implementation Plan April 2006
37
Project Setting The SFCR watershed is located in north-central Idaho and encompasses an area of approximately 1,175 square miles (752,000 acres) with a 207 – mile perimeter (Figure 2). The watershed extends from the headwaters above Elk City (elevation 6,382 feet) to the confluence with the Middle Fork of the Clearwater River at Kooskia, Idaho (elevation 1,280 feet). Included in the SFCR watershed are 17 major sub-watersheds and numerous face drainages that flow into the mains stem SFCR. The lower 12.8 miles of the SFCR main stem flow through the Nez Perce Tribe (NPT) Reservation. The NPT Reservation encompasses 84,035 acres of the subbasin. Land Use Primary land uses and economic interests within the subbasin include timber harvest, mining, grazing, outfitting and guiding, recreation, and agriculture (Figure 3). This documentation focuses on agricultural and grazing land uses. The other land uses are discussed in the SFCR Sub-basin assessment (Table 2).
Table 2. Land use in each SFCR Subbasin.
Water Body Name Agriculture (acres) Grazing (acres) Forestry
(acres) Urban (acres)
Threemile Creek 14,235 4,146 2,671 391 Butcher Creek 6,432 2,393 1,921 0 Lower SFCR 6,758 8,513 4,129 0
Mid-Lower SFCR 3,025 12,551 40,063 44 Sally Ann Creek 2,370 1,365 5,148 0
Rabbit Creek 2,464 828 1,945 0
Figure 3. Land Use Distribution in the SFCR Subbasin

South Fork Clearwater River Implementation Plan April 2006
38
The majority of cropland is devoted to dry land agriculture. About 10% of area farmers are now using direct seed and no tilling practices, with the trend on the increase (Rowan, 2002). The major crops are winter wheat, spring wheat, barley, peas, lentils, and canola. Most of the cropland is on gently sloping, well-drained soils. Range and grazing lands tend to be on the steeper slopes or areas with soils unsuitable for crop production. Land Ownership The SFCR Subbasin includes a mixture of private and public lands covering approximately 752,000 acres (Figure 4). Federally managed lands are primarily forested and privately owned lands are primarily used for agricultural and grazing activities. Table 3 lists the acreage of the major management groups. The Camas Prairie portion of the subbasin contains approximately 199,000 acres and is comprised of private, BLM, State of Idaho, and Nez Perce Tribe (NPT) ownership.
Figure 4. Major Land Managers of the SFCR Subbasin
Table 3. Acreages of the SFCR Subbasin land management groups. Land Ownership/Management Agency Acres Percent Nez Perce National Forest 516,262 68 Bureau of Land Management 14,906 2 Private 218,316 29 Nez Perce Tribe 564 <1 Idaho State Department of Lands 3,330 <1

South Fork Clearwater River Implementation Plan April 2006
39
Accomplishments Non-point source pollution control efforts in the SFCR Subbasin are numerous and widespread. For the most part, they come from the implementation of standardized BMPs for forestry and agriculture. Several specially funded projects have been implemented in the watershed since passage of the Clean Water Act. State, tribal, federal, and private lands in the watershed have been cultivated and grazed since the mid-1800s (USFS 1998). Records are kept only on current contracts with private landowners for land enrolled in the Conservation Reserve Program through the Farm Services Agency. Currently, the records show contracts as early as 1992 and extending through 2015 (includes 2005 contracts). Land enrolled in the program in the SFCR drainage as a whole totals 1,743.7 acres, which includes the Cottonwood Creek watershed. Most of the land is enrolled as permanent wildlife habitat. There are some lands under contract to maintain existing vegetative cover, others to maintain permanent grasses and lagoons, some to provide wildlife food plots, two to maintain shallow water areas, one to establish a shelter belt (windbreak adjacent to a stream), and one to establish a tree planting plot (Sickels 2002). The NRCS in Grangeville has treated, or is currently treating, approximately 320 acres of cropland pasture, and hay land under the NRCS Environmental Quality Incentives Program in the SFCR Subbasin. The program encourages using no-till agriculture, planting grass waterways, and seeding pastures and hay lands (Spencer 2002). Cottonwood Creek has had a significant amount of land treated through Cottonwood Creek TMDL implementation efforts. There have been several major areas of accomplishments in the SFCR Subbasin for Agriculture and Grazing. The Cottonwood Creek implementation phase 1 project; Red River projects; tribal accomplishments; and grazing allotment accomplishments.
Cottonwood Creek Critical Areas Treated There has been ~4842 acres in the Cottonwood Creek watershed which have active contracts through the 319 and WQPA programs. No-till or direct seed implementations account for 91% of the total acres being implemented. The majority of these acres are in six-year contracts. The installed BMP’s in the Cottonwood Creek watershed can be found in Table 4. Other funding sources have treated an additional ~4,880 acres within the Cottonwood Creek watershed. (ISSC 2002; with edits)
Figure 5 shows the locations of all treated acres within the Cottonwood watershed. Acres have been treated using a variety of funding sources, which include 319, Water Quality Program for Agriculture (WQPA), Environmental Quality Incentive Program (EQIP), and the Conservation Reserve Program (CRP). These are grouped into two general categories: 319/WQPA and other sources. The 319 and WQPA funds are being used together to extend contract times and cost share amounts as needed. The Division 2 Animal feeding operation 319 grant was used to fund two feeding operations within the Cottonwood watershed. (ISCC 2002)
Estimated Pollutant Reductions Sediment - Based on RUSLE results there has been an estimated decrease in rill and sheet erosion of ~10 tons/acre/year due to the implementation of no-till or direct seed. Resulting in an erosion decrease of 43,570 tons/year for the Cottonwood Creek watershed. Soil quality results show an increase in infiltration rates, aggregate stability and earthworm counts due to no-till and direct seed, which will reduce runoff and soil erosion rates, thus substantiating the RUSLE predictions. (ISSC 2002; with edits)
Nutrients - Reduction of sediment losses often results in a reduction of nutrient losses since many nutrients are transported with sediment particles to the water source. Nutrient Management systems use soil tests to identify

South Fork Clearwater River Implementation Plan April 2006
40
current soil nutrient levels before fertilizer is applied reducing excess fertilizer applications. Thus the potential for leaching or runoff of nutrients is reduced. (ISCC 2002)
i) Table 4. Summary of the Cottonwood Creek watershed BMP Installations
ii) as of December 2003. Best Management Practice: Amount Acres Acres Installedb: Treatedc: Contracteda:ANIMAL TRAILS & WALKWAYS 120 CY 80 0
ANIMAL TRAILS & WALKWAYS 54 FT 105 0
FENCE 5123 FT 150 150
FILTER STRIP 3 AC 3 3
HEAVY USE AREA PROTECTION 1 EA 45 45
NUTRIENT MANAGEMENT 3727.6 AC 3,728 0
PIPELINE 4856 FT 75 0
RESIDUE MANAGEMENT; DIRECT SEED 5842.2 AC 5,842 3,392
RESIDUE MANAGEMENT; NO TILL & STRIP TILL 2666.6 AC 2,667 965
ROOF RUNOFF STRUCTURE 480 FT 80 0
SEDIMENT BASIN 1 EA 240 240
SPRING DEVELOPMENT 2 EA 70 0
UNDERGROUND OUTLET 280 FT 80 0
WASTE MANAGEMENT SYSTEM 173 FT 0 0
WASTE TREATMENT LAGOON 2 EA 10 10
WASTE UTILIZATION 38 AC 38 38
WATERING FACILITY 3 EA 30 0
Project Total: 13,322 4,842aRefers to actual acres under contract. bRefers to the extent the practice has been implemented within the watershed. Some management practices such as direct seed have yearly installations on the same acres. cRefers to the number of acres that have benefited from the installed practice.

South Fork Clearwater River Implementation Plan April 2006
41
(ii) (iii) (iv) (v)
(vi) (vii)
(viii) (ix) (x)
(xi) (xii)
(xiii) (xiv) (xv)
(xvi) (xvii)
(xviii) (xix)
Figure 5. Cottonwood Creek Implementation Map
Red River Several projects have been initiated in the Red River area and are documented in the SFCR Subbasin Assessment and TMDL (2003). The Lower Red River area is in early stages of the recovery. (LRK communications 2003). Interrelationships within the ecosystem cannot be overemphasized. The response of one component (e.g., fish habitat) of the ecosystem to restoration activities is inextricably influenced by the response of one or more components (e.g., hydrology, woody riparian shrubs, and cross-sectional dimensions). In addition, short-term analysis of several parameters is complicated due to the influence of ecosystem components that can fluctuate sporadically on an annual basis. The breadth of performance indicators evaluated is substantial, including physical as well as biological measurements that describe structural, hydrologic, riparian plant community, aquatic habitat, fish population, and terrestrial habitat changes and initial trends within the lower Red River meadow ecosystem (LRK communications 2003). Tribal The NPT Land Services Division is responsible for writing conservation plans of operations for agriculture leases on Indian-owned land, based on wise land use practices and owner input. The conservation plans of operations requirements include residue management and specific tilling requirements. Residue is not to be burned and, except for harvested grass seed, must be returned to the soil. Residue cannot be grazed or baled without authorization. Residue requirements are additionally in place specifying percent coverage for various low and high-residue crops. Tilling and seeding operations are to be performed across slope or as close as possible to contour. These operations must be performed parallel to diversions or terraces, where present (NPT 2002). In 2003, the Tribe enrolled 1,877 acres in priority watersheds on the Reservation into the NPT Direct Seed Incentive Program. In 2005, all Tribal lessees will be eligible for this program. NPT Forestry, Land Services and Water Resources collaborated on 1.5 miles of fencing to exclude 33 acres from grazing, one stream crossing hardened, 421 native shrubs planted along 300 feet of stream, 101.8 acres enrolled in CRP. Riparian vegetation was planted in the corridor and ½ mile of an allotment road re-contoured and seeded using NPT 319 funds and matching tribal funds. The channel was reshaped and 18 foot wide buffer strip along 1300 feet of stream through agricultural leased land was installed. NPT Forestry will plant trees in these allotments in 2005.

South Fork Clearwater River Implementation Plan April 2006
42
USFS Allotments Grazing laws in the NPNF were enacted when the forest was established in 1908. There are 10 grazing allotments active in the watershed (Lake, 2003). There are five active allotments (41,440 acres) in the American River watershed (BLM, 2003b). Livestock grazing on FS pastures were designed to alleviate riparian resource concerns by controlling the amount of time livestock can spend in any one area. Two provisions are required on FS allotments as identified in the Annual Operating Instructions: utilizing PACFISH grazing standards and Nez Perce Grazing Implementation Guidelines for Riparian Areas. BLM Allotments Grazing is authorized on two grazing allotments (2,668 acres) in the Upper SF Clearwater Subbasin; seven allotments (641 acres) in the Lower SF Clearwater Subbasin; and nine allotments (6,296 acres) in the American River watershed. Three provisions are used for administration of BLM grazing leases: (1) PACFISH Grazing Standards and Guidelines; (2) BLM Cottonwood Resource Area Grazing Implementation Guidelines for Riparian Areas; and (3) Required Monitoring for Sensitive Riparian Areas. All these allotments are in compliance with PACFISH and current levels of grazing will not retard recovery of riparian areas or result in degradation. (BLM, 1999; BLM, 1999b, BLM, 2003b) Problem Beneficial Use Status The water quality criteria (narrative and numeric) that is relevant for the designated and existing beneficial uses for the SFCR Subbasin are discussed below. Designated beneficial uses listed for the main stem SFCR include Salmonid spawning, primary contact recreation, and special resource water (IDAPA 58.01.02). For undesignated 303(d) listed tributaries, the existing beneficial uses for aquatic life are Salmonid Spawning and Primary or Secondary contact recreation (IDAPA 58.01.02.101.01). Pollutants – Load Allocation and Reduction Sediment Surface erosion from agricultural, grazing, and forestlands outside the federal ownership perimeter was modeled using the RUSLE model (Renard et al. 1997) in a GIS environment (Engel 1999). Staff from the University of Idaho Biological and Engineering Department did the modeling following methods reported in Boll et al. (2001), with an updated land use map for the SFCR area. The largest portion of sediment in the SFCR Subbasin is shown in the SFCR TMDL to move in pulses associated with high rainfall, rapid snowmelt, or large rain-on-snow events. In the largest of these, rain-on-snow events such as occurred in 1996, a significant portion of the sediment is generated by mass failures. (DEQ 2004) In terms of grazing, the TMDL states “The primary effect of grazing on sediment is increased stream bank erosion as the cattle access the stream. An inventory of stream bank erosion to quantify sediment from this source was conducted. All of the known eroding streams in the subbasin were inventoried. Table 5 and 6 show the sediment allocations, reductions pertinent to agriculture and grazing in the SFCR subbasin.

South Fork Clearwater River Implementation Plan April 2006
43
Table 5. Sediment load allocations for non-point sources in the SFC Subbasin.a Water Body Name
Excess Load (t/y) b
Target Load (t/y) b
Load Reduction (%)
Lower SFCR 7,754 21,964 25
Threemile Creek
780 235 77
Butcher Creek
203 132 61
Mid-Lower SFCR
1,434 4,302 25
a Loads presented for these sites are cumulative of all areas upstream of the control location. Loads for water bodies 1, 10, and 11 are total suspended solids loads, while loads for water bodies 12, 22, 30, and 36 are total sediment loads.
b t/y = tons per year
Table 6. Sediment excess loads by management responsibility in the SFCR Subbasin.
Control Location
Management Responsibilitya
Human-Caused Load (tons/year) b
Target Sediment Load
(tons/year) b
Excess Sediment Load
(tons/year) b All 29,718 21,964 7,754 State Highway 1,151 863 288 County Roads 516 387 129 Private 11,006 8,254 2,752
Stitesc
Cottonwood TMDLd
22,300 6,640 15,660
All 1,015 235 780 County Roads 134 39 95
Threemile Creekc
Private 881 196 685 All 335 132 203 Private 325 128 197
Butcher Creekc
County Roads 111 60 51 All 5,736 4,302 1,434 State Highway 1,151 863 288 County Roads 98 74 25
Harpster (Johns Creek to Threemile Creek) e Private 2,792 2,094 698
b Totals for Stites do not equal the sum of the parts because of different estimation methods used in the Cottonwood Creek TMDL; other totals do not all add up due to rounding c Total suspended solids (TSS)-based loading calculations d Derived from the Cottonwood Creek TMDL e Sediment budget-based calculations

South Fork Clearwater River Implementation Plan April 2006
44
Bacteria Levels of bacteria that exceed the state WQS were identified at several times throughout the year and at several locations in Threemile Creek. The target is set at the state WQS of a geometric mean of 126 cfu/100 ml. Available data indicate that effluent from the Grangeville WWTP is not contributing to the problem beyond its permitted level of 100 cfu/100 ml. Probable causes are livestock defecation near and in the creek, storm water runoff from the city of Grangeville, wildlife defecation near and in the creek, and possibly failing sewage disposal systems. While the precise sources of bacteria in Threemile Creek have not been identified, sources that are the result of human activity are known to exist. (Table 8)
Table 8: E. coli Non-point source allocations and wasteload allocations forThreemile Creek
Location
Headwaters to Grangeville
WWTP Outfalld Grangeville WWTP Outfall to Nez
Perce Reservation
Nez Perce Reservation Boundary to
mouth Target
(cfu/100 ml)a 126 126 126 126
Allocation Type NPS - LAe NPS - LA
PS - WLAf Grangeville
WWTP NPS - LA
Critical Flow (cfs)b 0.71 0.71 0.89 1.54
E. coli conc. (cfu/100 ml) 1530 903 53 196
E. coli Current Load
(cfu/day)c 2.70E+10 1.60E+10 1.20E+09 7.40E+09
E. coli Load Capacity (cfu/day) 2.20E+09 2.20E+09 2.70E+09 4.70E+09
E. coli Allocation (cfu/day) 2.20E+09 2.20E+09 2.70E+09 4.70E+09
E. coli Allocation
(cfu/100 ml)
126 - monthly geo. Mean
576 - daily max.
126 - monthly geo. Mean
576 - daily max.
126 - monthly geo. Mean
576 - daily max.
126 - monthly geo. Mean
576 - daily max. E. coli Load
Reduction 92% 86% 0.00% 36% a cfu/100 ml = colony forming units per 100 milliliters b cfs = cubic feet per second c cfu/day = colony forming units per day d WWTP = wastewater treatment plant e NPS-LA = non-point source load allocation f PS-LA = point source waste load allocation

South Fork Clearwater River Implementation Plan April 2006
45
Nutrients Monitored levels of nitrogen and phosphorus in Threemile Creek exceed USEPA recommended levels by as much as 2 orders of magnitude. Targets are set at 0.08 mg/L TP above the WWTP outfall, 0.10 mg/L TP from the WWTP outfall to the Big Barn site at the head of the canyon, and 0.30 mg/L TP at the mouth (Table 9). (DEQ 2004)
Table 9. Total phosphorus (TP) target and reduction for Threemile Creek. TP Target TP Load
Reduction Location
(mg/L)a (%) Headwaters to Grangeville
WWTP Outfall d 0.08 32 Grangeville WWTP Outfall to
Nez Perce Reservation Boundary 0.1 32
Nez Perce Reservation Boundary to Mouth 0.3 0 Applicable Period July1-Sept 15
a milligrams per liter d WWTP = wastewater treatment plant, The reach below the WWTP is phosphorus limited at all times of the year, and is the area of greatest concern due to the relatively low gradient, high nutrient concentrations, and low shade, conditions which tend to promote algae growth. (DEQ 2004)
Temperature The non-point source shade allocations result in the need to increase shade in most of the watershed historically managed by man. Current shade levels are highly variable in all land use types and reflect a wide range of natural and man-induced disturbance conditions and various vegetation types. The summary of needed shade increases shown in the last column of the following table (Table 10) provides a general impression of the average difference between current and target shade levels needed (Figure 6).
Table 10. Non-point source shade increase summary.
Land Use Type Current shade Average Percent Shade Increase
SFCR Mainstem 0 – 95% 19%
Forested areas 0 – 90% 21%
Upper Meadow areas 0 – 97% 24%
Agricultural areas 0 - 83% 19%

South Fork Clearwater River Implementation Plan April 2006
46
Figure 6. Current Percent Canopy Closure of Threemile and Butcher Creeks
However, landowners and land managers must consult detailed allocations within the TMDL, coupled with on-site field verification, in order to establish site specific targets. (DEQ 2004) In much of the watershed it is expected that shade targets will be achieved through passive restoration, that is, allowing vegetation to grow to a mature state. In some locations (e.g., dredge mined areas, grazed areas), active restoration through plantings and channel modification will likely be warranted. (DEQ 2004) Water Quality Monitoring Results Biological and Other Data The main stem SFCR below the NPNF, and tributaries including Threemile Creek, Butcher Creek, Mill Creek, and Sally Ann Creek, were assessed using the Matrix of Pathways and Indicators of Watershed Condition - Local Adaptation for the Clearwater Basin (NMFS et al. 1998). For most of the criteria evaluated, conditions in the lower SFCR and tributaries were sub optimal, rating "low" for habitat condition. The South Fork Clearwater River Biological Assessment (USFS 1999) rates the biological condition of 15 major watersheds in the SFCR Subbasin for ESA listed species using the Matrix of Pathways and Indicators of Watershed Condition - Local Adaptation for the Clearwater Basin (NMFS et al. 1998). The watersheds assessed included the SFCR main stem and the face drainages. Summarized at a watershed scale, the majority of water quality and habitat elements rate as "low" condition, while watershed condition (road parameters), channel conditions, and species take (harassment, redd disturbance, juvenile harvest) rate as "moderate" condition. Reference Stream Habitat Data was used to assess the condition of the streams and rivers of the SFCR Subbasin as they are affected by sediment. Two data sets for hydrologic systems considered to be in good to
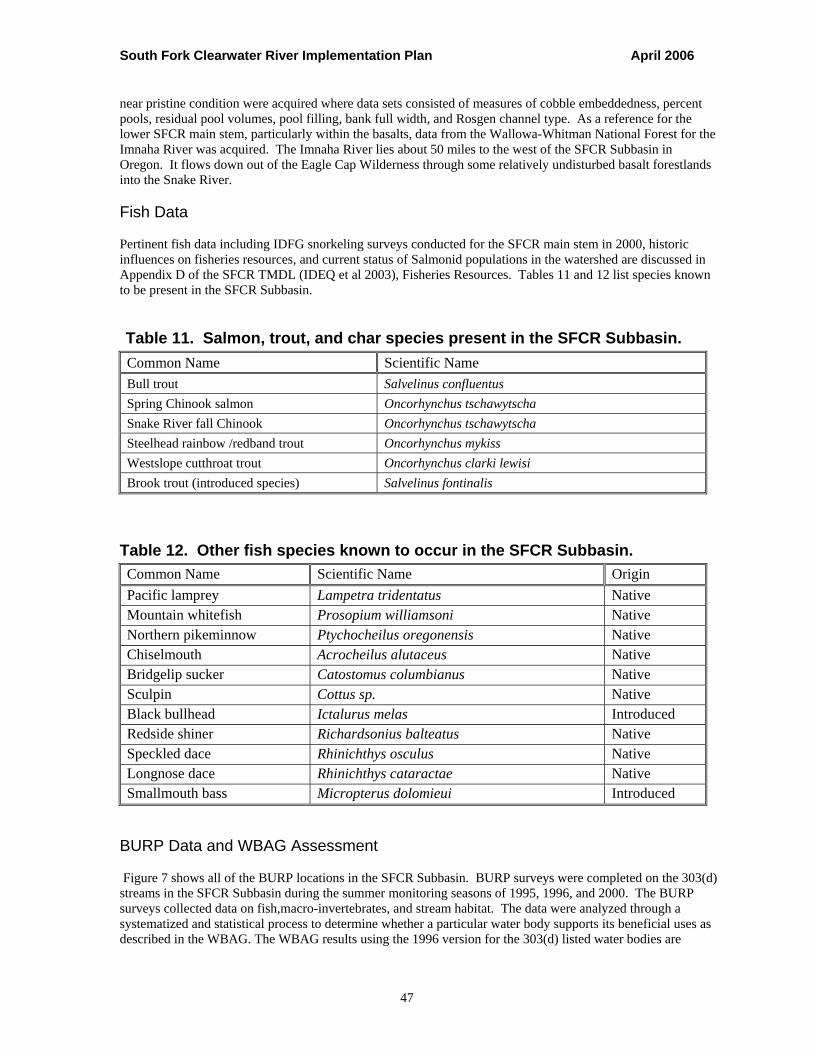
South Fork Clearwater River Implementation Plan April 2006
47
near pristine condition were acquired where data sets consisted of measures of cobble embeddedness, percent pools, residual pool volumes, pool filling, bank full width, and Rosgen channel type. As a reference for the lower SFCR main stem, particularly within the basalts, data from the Wallowa-Whitman National Forest for the Imnaha River was acquired. The Imnaha River lies about 50 miles to the west of the SFCR Subbasin in Oregon. It flows down out of the Eagle Cap Wilderness through some relatively undisturbed basalt forestlands into the Snake River.
Fish Data Pertinent fish data including IDFG snorkeling surveys conducted for the SFCR main stem in 2000, historic influences on fisheries resources, and current status of Salmonid populations in the watershed are discussed in Appendix D of the SFCR TMDL (IDEQ et al 2003), Fisheries Resources. Tables 11 and 12 list species known to be present in the SFCR Subbasin.
Table 11. Salmon, trout, and char species present in the SFCR Subbasin. Common Name Scientific Name Bull trout Salvelinus confluentus Spring Chinook salmon Oncorhynchus tschawytscha Snake River fall Chinook Oncorhynchus tschawytscha Steelhead rainbow /redband trout Oncorhynchus mykiss Westslope cutthroat trout Oncorhynchus clarki lewisi Brook trout (introduced species) Salvelinus fontinalis
Table 12. Other fish species known to occur in the SFCR Subbasin. Common Name Scientific Name Origin Pacific lamprey Lampetra tridentatus Native Mountain whitefish Prosopium williamsoni Native Northern pikeminnow Ptychocheilus oregonensis Native Chiselmouth Acrocheilus alutaceus Native Bridgelip sucker Catostomus columbianus Native Sculpin Cottus sp. Native Black bullhead Ictalurus melas Introduced Redside shiner Richardsonius balteatus Native Speckled dace Rhinichthys osculus Native Longnose dace Rhinichthys cataractae Native Smallmouth bass Micropterus dolomieui Introduced
BURP Data and WBAG Assessment Figure 7 shows all of the BURP locations in the SFCR Subbasin. BURP surveys were completed on the 303(d) streams in the SFCR Subbasin during the summer monitoring seasons of 1995, 1996, and 2000. The BURP surveys collected data on fish,macro-invertebrates, and stream habitat. The data were analyzed through a systematized and statistical process to determine whether a particular water body supports its beneficial uses as described in the WBAG. The WBAG results using the 1996 version for the 303(d) listed water bodies are

South Fork Clearwater River Implementation Plan April 2006
48
presented in Table 13. Several streams have two BURP sites; and therefore, two sets of results. These are the WBAG results that were used in the development of the 1998 303(d) list (DEQ 1999).
Figure 7. Locations of BURP Sites Throughout the SFCR Subbasin
Table 13. WBAG version 1996 results for 303(d) listed water bodies in the SFCR Subbasin.
Water Body Macro-invertebrate Biotic Index (MBI)
Salmonid Age Classesa
Temperature (0C)
Habitat Index (HI)
Support Statusb
Threemile Creek (L)c 3.30 1 16 104 NFS Threemile Creek (U)d 2.61 0 15 75 NFS Butcher Creek (L) 3.04 1 23 85 NFS Butcher Creek (U) 3.42 0 18 85 NV SF Clearwater *e * * * *
a+j = including juveniles bFS = Full support, NFS = Not full support, NV = Needs verification, from 1998 303(d) list (DEQ 1999) cL = Lower dU = Upper eTo be assessed using the Large River Protocol, which is not yet available fBeneficial Use Reconnaissance Program

South Fork Clearwater River Implementation Plan April 2006
49
The macroinvertebrate biotic index (MBI) is one of the primary indices used to confirm beneficial uses support status. The second indicator of full supprt of beneficial uses is the presence of salmonid species and their young of the year in a stream. If three age classes of fish, including juveniles (fish <100 mm in length) are present, then a water body is considered to be fully supporting salmonid spawning. Following a literal interpretation of the WBAG 1996 version, only Threemile Creek and Butcher Creek data are not fully supporting their beneficial uses.
Watershed Flow Characteristics The SFCR has a snowmelt runoff dominated flow pattern. Highest mean monthly flows occur in spring (April-June) and lowest flows occur in the fall and winter. It is likely that April high flows are predominantly prairie and other lower elevation snowmelt runoff events, whereas June high flows are predominantly high country snowmelt runoff. An average spring runoff peak at Stites is about 5,000 to 7,000 cfs. The annual runoff from the watershed as measured at Stites averages about 12 inches. The largest flood had an estimated peak of 17,500 cfs. Floods occasionally result from snowmelt or rain-on-snow events between November and March. Because the TMDLs developed in this document are heavily dependent on understanding the flows in Threemile and Butcher Creeks, as well as Cottonwood Creek, flow patterns were estimated in these drainages based on flow data from Lapwai Creek (IDEQ et al. 2003). Lapwai Creek drains the Camas prairie, at the same elevations as Threemile and Butcher Creeks, and has many of the same vegetative, geologic, landform, and land use characteristics.
Water Column Data Subbasin-wide water quality data is presented and discussed in the South Fork Clearwater Assessment and TMDL (2004). The conclusions of the water column data pertinent to agriculture and grazing are below. Turbidity, TSS, and flow data for Threemile Creek, Butcher Creek, and the lower main stem SFCR show exceedances of the WQS during periods of high flows throughout the three water bodies. The periods of high flows occur episodically during January through May. The exceedances occur with both fine and coarse sediment. Indicators of use impairment are cobble embeddedness, bank instability, and a lack of pools in Threemile and Butcher Creeks, and a lack of pools and cobble embeddedness in the main stem SFCR. Sediment TMDLs need to be developed for Threemile Creek, Butcher Creek, and the lower main stem SFCR. Summary and Analysis of Existing Water Quality Data for Threemile Creek and Butcher Creek Threemile Creek and Butcher Creek are 303 (d) listed for a number of pollutants in addition to sediment and temperature, including bacteria, dissolved oxygen, nutrients, and ammonia (Threemile Creek only). These additional pollutants are discussed below for each of these two waterbodies. Threemile Creek Threemile Creek has been designated by the state of Idaho for Salmonid spawning and secondary recreation beneficial uses. The Salmonid spawning WQS apply over the entire reach of the creek. There are portions of the creek not far from the mouth blocked by landslides, where the creek travels subsurface, which restricts fish migration during low flows. In addition, a series of 2-meter falls occurs approximately 9.5 kilometers upstream from the mouth, which may limit fish passage on a seasonal basis. Fuller et al. (1984) documented mature rainbow/steelhead above this potential barrier at stream kilometer 10.3. Currently, studies are underway to change the designation to Cold-Water Biota instead of Salmonid spawning due to the lack of juvenile Salmonid’s above the falls (Woodruff, 2003). Threemile Creek data were collected biweekly (February 2, 2000, through January 22, 2001) by DEQ at the six monitoring sites shown in Figure 8. Parameters sampled included continuous temperature at the mouth, flow, pH, DO, turbidity, TSS, total and ortho-phosphorous, nitrates and ammonia, and E. coli and coliform bacteria.

South Fork Clearwater River Implementation Plan April 2006
50
Sporadic measurements were taken at sites called “Big Barn” and “Headwaters.” A detailed discussion of these results is presented in the SFCR TMDL (IDEQ et al. 2003). Flow was below normal and air temperatures were higher than normal during the summer months that Threemile Creek was monitored. The low flow and high temperatures could indicate a year where there may have been less recreational use and higher than normal concentrations of pollutants in the creek. Pathogen levels in the creek are above the secondary contact criteria set by the state. Potential sources include grazing/livestock operations, septic systems, and waterfowl and animals. Dissolved oxygen levels were borderline at the mouth on two occasions and no data was available to evaluate diurnal DO stages. Further monitoring to verify DO levels at critical times is warranted In-stream ammonia concentrations were below the criteria set by the state of Idaho. The Grangeville WWTP discharges ammonia and is well within its permit limit. Since ammonia levels are below criteria, a TMDL will not be written. It was recommended that Threemile Creek be delisted for ammonia by the SFCR WAG. The nutrient levels in Threemile Creek are generally an order of magnitude or more higher than the USEPA guidelines. Nitrogen levels above the WWTP outfall are lower than the 0.3 mg/L guideline. At the WWTP outfall and below it, the N concentrations are much higher and are a cause for concern. At the mouth of the creek the level of N tends to be seasonal, decreasing in the summer when the concentration at the outfall reaches its maximum. This may indicate that plants are taking up the N. Phosphorus concentrations are at or below the target set by the USEPA above the WWTP outfall, but are higher than the target at and below the outfall. The P concentrations at and below the outfall also increase in the spring and summer. The WWTP outfall directly influences the site below it. There are no indications that the concentration of P has any seasonality at the mouth; the concentration of P remains at a steady 0.30 mg/L regardless of flow, temperature, or any other parameter measured during this monitoring period. Due to the significantly elevated levels of TP, a TMDL was written. Stream Visual Assessments conducted in 2004 indicated that the agricultural impacted portion of Threemile creek have banks that are not stable. The lower segment of Threemile is not stable due to high, flashy flows that cause large amounts of bedload to be moved down the creek. These same areas with unstable banks have low habitat, pools and fish cover. In general implementation activities should be focused on these agriculturally impacted areas.

South Fork Clearwater River Implementation Plan April 2006
51
Figure 8. Monitoring Sites on Threemile Creek Butcher Creek
Butcher Creek beneficial uses are currently undesignated by the state of Idaho. Prior to designation, according to Idaho Code, "undesignated waters shall be protected for beneficial uses, which includes all recreational use in and on the water and the protection and propagation of fish, shellfish, and wildlife, wherever attainable" (IDAPA 58.01.02.101). Studies by the NPT and DEQ (Fuller et al. 1984, DEQ 1995, NPT 2002) have established Salmonid spawning as an existing beneficial use. Butcher Creek also has the beneficial uses of primary and/or secondary contact recreation. The Salmonid spawning water quality criteria apply over the entire length of the Butcher Creek, although there is a series of falls approximately 6 miles upstream from the mouth that may limit fish movement upstream. This TMDL will use the mouth of the creek as the point of compliance for meeting Salmonid spawning water quality criteria. Butcher Creek data were collected by the NPT monthly (February 27, 2001, through February 26, 2002) approximately 1 mile upstream from its confluence with the SFCR. Parameters sampled included continuous temperature at the mouth, flow, pH, DO, turbidity, TSS, total and ortho-phosphorous, nitrates and ammonia, and E. coli and coliform bacteria. A detailed discussion of these results is presented in the SFCR TMDL (IDEQ et al. 2003). There were no instantaneous exceedances of either primary or secondary contact recreation E. coli criteria during the 15-month sampling period, although on two occasions levels exceeded 126 cfu. Since E. coli concentrations were below criteria on all sampling dates, a TMDL will not be written. It was recommended that Butcher Creek be delisted for bacteria.

South Fork Clearwater River Implementation Plan April 2006
52
Dissolved oxygen levels were never low enough to cause a concern and may indicate the lack of excessive algae growth in the creek at the monitoring site. Since the DO concentrations were above the criteria on all the sampling dates, a TMDL will not be written. It was recommended that Butcher Creek be delisted for DO. The nitrogen levels in Butcher Creek are generally higher than the USEPA guidelines, and generally occur in winter during periods of high flow. Phosphorus levels were generally within the guidelines set by USEPA. Nitrogen levels are elevated, but there is no indication that there is a DO or nuisance algae problem. A TMDL for nutrients will not be written; however, the implementation of the TMDLs being written for temperature and sediment is expected to lower the N levels. According to 2004 SVAP data Butcher creek in contrast to Threemile was characterized by its high volume flows and multiple blowouts that cause banks to be unstable in the canyon reaches. Upland reaches appeared to be moderately stable. Barriers to fish passage, low pools, low fish cover, low canopy cover, low macro-invertebrates and low invertebrate habitat were found in most segments surveyed. When the survey was conducted in 2004 water appearance, nutrient levels, riparian zone, hydrologic alteration and channel condition were in adequate condition. Critical Acres Definitions Critical acres are defined as those acres that have the potential to deliver the greatest amount of pollutant to the creek (Figure 9). Cropland where management practices allow gully, rill or sheet erosion on an annual basis are considered as critical acres. Feeding areas with direct access to live water are generally considered critical acres; unless management of the feeding area has limited access to stream banks thus reducing stream bank degradation and erosion. Grazing land critical acres are those acres where forage utilization levels exceed standards; or acres where direct access to live water has resulted in degraded stream banks and increased temperatures. Quantifications The following are quantifications of critical agriculture acres in the SFCR (excluding Cottonwood Creek which is covered in a separate implementation plan.). Cropland - Critical Acres: 30,432 acres Feeding Areas - Miles of stream with direct access: 25 miles of stream with greater than 4 tons of stream bank erosion Grazing lands – Acres of forage utilization exceedances: 0 acres Miles of degraded stream banks: 22 miles of stream with greater than 4 tons of stream bank erosion.

South Fork Clearwater River Implementation Plan April 2006
53
Location
i)
ii)
iii)
iv)
v)
vi)
vii)
viii)
ix) Figure 9. Location of Critical Acres in SFCR Subbasin ESA Issues Section 7 of the Endangered Species Act of 1973, “mandates all Federal agencies to determine how to use their existing authorities to further the purpose of the Act to aid in recovering listed species and address existing and potential conservation issues”. Section 7 (a)(2) states that “agencies shall consult with either the U. S. Fish and Wildlife Service (USFWS) or NOAA Fisheries, to insure that any action they authorize, fund or carry out is not likely to jeopardize the continued existence of a listed species or result in the destruction or adverse modification of designated critical habitat.” The Natural Resources Conservation Service (NRCS) is required to follow the above mandate for all project implementation and TMDL implementation within this plan will also follow this process. If it is determined that a proposed action is within close proximity to habitat used by a listed Threatened or Endangered species (T&E) or the known location of a T&E species, consultation is initiated with the appropriate regulatory agency. Consultation involves describing the project, assessing the potential project impacts, describing the mitigation effort for the project and determining the effect of the project on the species of concern. The consultation process results in the development of reasonable alternatives for implementation and helps to minimize the impacts of conservation practices to critical habitat. Generally, good communication between consulting agencies ensures the development of sound decisions being made. Federally listed species documented as occurring or potentially may occur Idaho County, South Fork Clearwater River Subbasin are as follows (NRCS, 1999; BLM, 2003): Mammals Gray wolf (Canis lupus) Canada lynx (Lynx cancdensis)

South Fork Clearwater River Implementation Plan April 2006
54
Birds Bald eagle (Haliaeetus leucocephalus)
Fish Bull trout (Salvelinus confluentus) West Coast steelhead (Oncorhynchus mykiss) Chinook salmon (Oncorhynchus ishawyascha)
Plants Macfarlane’s four-o’clock (Mirabilis macfarlanei) Spalding Silene (Silene spaldingii) BLM sensitive fish species occurring in the Subbasin: Spring/summer Chinook salmon Westslope cutthroat trout Redband trout Pacific lamprey Species of Concern in Idaho County include (NRCS, 1999):
Wolverine (Gulo gulo luscus) Long-legged myotis (Myotis volans) Townsend’s big-eared bat (Plecotus townsendii) Long-eared myotis (Myotis evotis) Yuma Myotis (Myotis yumannensis) Harlequin duck (Histrionicus histrionicus) Northern goshawk (Accipiter gentilis) Interior redband trout (Oncorhynchus mykiss gairdneri) Idaho banded mountainsnail (Oreohelix idahoensis) Boulder pile mountainsnail (Oreohelix jugalis) Whorled mountainsnail (Oreohelix vortex) Lava rock mountainsnail (Oreohelix waltoni) Columbia pebblesnail (Flumincola columbiana) Carinated striate banded mountainsnail (Oreohelix strigosa goniogyra) Palouse goldenweed (Haplapappus liatrifomres) Jessica’s aster (Aster jessicae) Broad-fruit mariposa (Calochortus nitidus)
Another tool available in the planning process is the Idaho Department of Fish and Game Conservation Data Center, 2002 Threatened and Endangered Species GIS database. The database contains documented locations for terrestrial species (plants and animals only!). This can help identify known locations of T&E species and identify critical habitat types that may harbor threatened or endangered species. Planners can reference habitat requirements to help landowners determine the potential benefits of their project implementation. These discussions remain confidential between the landowner and the planners. The South Fork Clearwater Subbasin contains numerous rare plants and species of concern. Impacts to these species will be taken into account in any TMDL project implementation. AFOs Some areas have large numbers of animals confined to relatively small areas with direct access to the creek. Currently none of these areas are officially designated as “confined animal feeding operations” (CAFOs) (Rowan 2002). There are however, a number of animal feeding operations in the watershed that will need to be addressed. Feeding areas with direct access to live water are generally considered critical acres; unless management of the feeding area has limited access to stream banks thus reducing stream bank degradation and erosion. Grazing land critical acres are those acres where forage utilization levels exceed standards; or acres where direct access to live water has resulted in degraded stream banks.

South Fork Clearwater River Implementation Plan April 2006
55
Nitrate Priority Area Historically, ground water throughout the west has been viewed as an inexhaustible resource: a resource that is inexpensive, readily available and invulnerable to the detrimental effects of activities occurring on the land surface. This perception has led to the widespread indiscriminate use of this natural resource. With the ever-expanding use of the resource, Idaho’s principle aquifers have been mapped. Four percent of the ground water is used for domestic drinking water. Generally, Idaho’s ground water is acceptable for drinking water and other beneficial uses. However, recent incidents of ground water contamination have occurred from such activities as agricultural chemicals, household chemicals, industrial chemicals and failing septic systems, which has created an awareness of ground water vulnerability (Figure 8). Protection of this resource can be achieved most effectively by preventing contamination through implementing best management practices and other measures that prevent contamination. During a ground water study of the Camas Prairie in 1998, entitled “A Reconnaissance of Nitrite/Nitrate in Camas Prairie Ground Water,” land use was recorded for each well site and those wells within 100 feet of cultivated farmland had elevated levels of nitrate concentrations. The Camas Prairie Nitrate Priority Area is ranked fifth in the state of Idaho due to the degradation of the groundwater resources in that area. A portion of the Camas Prairie Nitrate Priority Area extends into the SFCR Subbasin boundary (Figure 9). Figure 8 – Ground Water Vulnerability Areas in Idaho County.

South Fork Clearwater River Implementation Plan April 2006
56
x) Figure 9 – Camas Prairie Groundwater Nitrate Priority Areas
Implementation Priority Sub-Watersheds Sub-watersheds were prioritized by the SFCR Ag Implementation Committee using several criteria; which include sediment loads, and number of agricultural or grazing acres. The prioritization is as follows:
• Threemile Creek • Butcher Creek • Sally Ann Creek • Rabbit Creek • Lower SFCR • Mid-Lower SFCR • Grazing acres above the Forest Service Boundary
Critical Areas The following is the prioritization of pollutants (by the SFCR Ag Implementation Committee): Sediment, Nutrients and Bacteria, and Temperature. Sediment was established as a priority because of large sediment targets in the TMDL. Nutrients, Bacteria, and Temperature were given less priority due to the fact that management practices installed for treatment of sediment loads will decrease nutrient and bacteria loads and possibly increase shade therefore improving water quality. Critical acres will be prioritized within the sub-watersheds by their potential to reduce sediments loads, decrease nutrient and bacteria loads, and increase shade; respectively. The ultimate success of the implementation plan will be measured by meeting all pollutant targets in the agricultural watersheds, including nutrients, bacteria and temperature as well as sediment. Implementation efforts should focus on decreasing loads in all pollutant areas.

South Fork Clearwater River Implementation Plan April 2006
57
Treatment Treatment Units Cropland, Riparian, Pasture/Hayland and Rangeland were determined to be the primary agricultural and grazing treatment units of concern in the SF Clearwater watershed. The Cropland unit was split - greater than and less than 12 percent slope. Figure 10 shows an overview of the treatment units within each sub-watershed. Figure 10 - South Fork Clearwater Treatment Units

South Fork Clearwater River Implementation Plan April 2006
58
Threemile Creek Cropland <12% slopes Acres Soils Resource Problems TMDL Pollutants
~10,680 acres
NezPerce, Chicane, Shebang, Uhlorn, Ferdinand, Boles, Fenn, Uptmor, Meland, Caribel, Kooskia
Surface and groundwater quality; ephemeral and classic gully erosion; sheet and rill erosion; excess nutrients
Sediment, Nutrients
Cropland >12% slopes Acres Soils Resource Problems TMDL Pollutants
~1,700 acres
NezPerce, Chicane, Shebang, Uhlorn, Boles, Meland, Kooskia, Jacket
Surface and groundwater quality; ephemeral and classic gully erosion; sheet and rill erosion; excess nutrients
Sediment, Nutrients
Pasture/Hayland Acres Soils Resource Problems TMDL Pollutants
~2,550 acres Ferdinand, Fenn, Jacket, Riggins, Keuterville, Wilkins
Plant productivity; noxious and invasive plants; streambank degradation; excess nutrients; organics; surface and groundwater quality
Sediment, Nutrients, Bacteria, Temperature
Rangeland Acres Soils Resource Problems TMDL Pollutants
~2,740 acres
Flybow, Rockoutcrop, Bluesprin, Klickson, Keuterville, Ferdinand
Plant productivity; noxious and invasive plants; streambank degradation; excess nutrients; organics; surface and groundwater quality, sheet and rill erosion
Sediment, Nutrients, Bacteria, Temperature
Riparian Acres Soils Resource Problems TMDL Pollutants
~380 acres Westlake, Typic Xerofluvents
Excess nutrients, organics, streambank degradation, plant productivity
Sediment, Nutrients, Bacteria, Temperature
Butcher Creek Cropland <12% slopes Acres Soils Resource Problems TMDL Pollutants
~3,400 acres
NezPerce, Chicane, Shebang, Uhlorn, Ferdinand, Boles, Meland, Kooskia
Surface and groundwater quality; ephemeral and classic gully erosion; sheet and rill erosion; excess nutrients
Sediment, Nutrients

South Fork Clearwater River Implementation Plan April 2006
59
Cropland >12% slopes Acres Soils Resource Problems TMDL Pollutants
~1,140 acres
NezPerce, Chicane, Shebang, Boles, Kooskia, Ferdinand
Surface and groundwater quality; ephemeral and classic gully erosion; sheet and rill erosion; excess nutrients
Sediment, Nutrients
Pasture/Hayland Acres Soils Resource Problems TMDL Pollutants
~2,500 acres
Ferdinand, Fenn, Jacket, Riggins, Keuterville, Wilkins, Kooskia, Meland, Uhlorn, Fenn, Wilkins
Plant productivity; noxious and invasive plants; streambank degradation; excess nutrients; organics; surface and groundwater quality
Sediment, Nutrients, Bacteria, Temperature
Rangeland Acres Soils Resource Problems TMDL Pollutants
~1,000 acres
Flybow, Rockoutcrop, Bluesprin, Keuterville, Ferdinand, Gwin
Plant productivity; noxious and invasive plants; streambank degradation; excess nutrients; organics; surface and groundwater quality, sheet and rill erosion
Sediment, Nutrients, Bacteria, Temperature
Riparian Acres Soils Resource Problems TMDL Pollutants
~97 acres Westlake, Typic XerofluventsExcess nutrients, organics, streambank degradation, plant productivity
Sediment, Nutrients, Bacteria, Temperature
Sally Ann Creek Cropland <12% slopes Acres Soils Resource Problems TMDL Pollutants
~740 acres Kooskia
Surface and groundwater quality; ephemeral and classic gully erosion; sheet and rill erosion; excess nutrients Sediment
Pasture/Hayland Acres Soils Resource Problems TMDL Pollutants
~900 acres Kooskia, Caribel, Johnson, Nicodemus
Plant productivity; noxious and invasive plants; streambank degradation; excess nutrients; organics; surface and groundwater quality
Sediment, Temperature

South Fork Clearwater River Implementation Plan April 2006
60
Rangeland Acres Soils Resource Problems TMDL Pollutants
~1,700 acres Gwin, Mehlhorn, Jacknife, Yakus
Plant productivity; noxious and invasive plants; streambank degradation; excess nutrients; organics; surface and groundwater quality, sheet and rill erosion
Sediment, Temperature
(b) Rabbit Creek
Cropland <12% slopes Acres Soils Resource Problems TMDL Pollutants
~1,900 acres Kooskia, Potlatch
Surface and groundwater quality; ephemeral and classic gully erosion; sheet and rill erosion; excess nutrients Sediment
Pasture/Hayland Acres Soils Resource Problems TMDL Pollutants
~800 acres Kooskia, Jughandle
Plant productivity; noxious and invasive plants; streambank degradation; excess nutrients; organics; surface and groundwater quality
Sediment, Temperature
Rangeland Acres Soils Resource Problems TMDL Pollutants
~1,250 acres Gwin, Mehlhorn, Jacknife
Plant productivity; noxious and invasive plants; streambank degradation; excess nutrients; organics; surface and groundwater quality, sheet and rill erosion
Sediment, Temperature
Lower SFCR Cropland <12% slopes Acres Soils Resource Problems TMDL Pollutants
~4,600 acres
NezPerce, Chicane, Uhlorn, Ferdinand, Meland, Kooskia, Wilkins, Fenn, Nicodemus
Surface and groundwater quality; ephemeral and classic gully erosion; sheet and rill erosion; excess nutrients Sediment
Cropland >12% slopes Acres Soils Resource Problems TMDL Pollutants
~550 acres Meland, Uhlorn, Chicane, Ferdinand, NezPerce
Surface and groundwater quality; ephemeral and classic gully erosion; sheet and rill erosion; excess nutrients Sediment

South Fork Clearwater River Implementation Plan April 2006
61
Pasture/Hayland Acres Soils Resource Problems TMDL Pollutants
~3,000 acres
Jacket variant, Johnson, Uhlorn, Suloaf, Ferdinand, Kooskia, Rigggins, Meland
Plant productivity; noxious and invasive plants; streambank degradation; excess nutrients; organics; surface and groundwater quality
Sediment, Temperature
Rangeland Acres Soils Resource Problems TMDL Pollutants
~7,000 acres
Jacknife, Yakus, Gwin, Mehlhorn, Bluesprin, Keuterville, Rockoutcrop, Klickson
Plant productivity; noxious and invasive plants; streambank degradation; excess nutrients; organics; surface and groundwater quality, sheet and rill erosion
Sediment, Temperature
Riparian Acres Soils Resource Problems TMDL Pollutants
~85 acres
Typic Xerofluvents, Nicodemus variant, Riverwash
Excess nutrients, organics, streambank degradation, plant productivity
Sediment, Temperature
Mid-Lower SFCR Cropland <12% slopes Acres Soils Resource Problems TMDL Pollutants
~700 acres Ferdinand, Kooskia, Jacket
Surface and groundwater quality; ephemeral and classic gully erosion; sheet and rill erosion; excess nutrients Sediment
Cropland >12% slopes Acres Soils Resource Problems TMDL Pollutants
~200 acres Ferdinand, Boles, Uptmor
Surface and groundwater quality; ephemeral and classic gully erosion; sheet and rill erosion; excess nutrients Sediment
Pasture/Hayland Acres Soils Resource Problems TMDL Pollutants
~2,000 acres Ferdinand, Meland, Uhlorn, Kooskia, Lochsa
Plant productivity; noxious and invasive plants; streambank degradation; excess nutrients; organics; surface and groundwater quality
Sediment, Temperature
Rangeland Acres Soils Resource Problems TMDL Pollutants
~6,200 acres
Jacknife, Gwin, Bluesprin, Keuterville, Rockoutcrop, Sallyann, Lawyer
Plant productivity; noxious and invasive plants; streambank degradation; excess nutrients; organics; surface and groundwater quality, sheet and rill erosion
Sediment, Temperature

South Fork Clearwater River Implementation Plan April 2006
62
Riparian Acres Soils Resource Problems TMDL Pollutants
~30 acres Typic Xerofluvents Excess nutrients, organics, streambank degradation, plant productivity
Sediment, Temperature
Above Forest Service Boundary Rangeland / Grazing Acres Soils Resource Problems TMDL Pollutants
~6,200 acres Unknown
Plant productivity; noxious and invasive plants; streambank degradation; excess nutrients; organics; surface and groundwater quality, sheet and rill erosion Temperature
Alternatives and Costs Threemile Creek
BMP Practice Amount Units Cost Total Cost Cropland < 12% slopes Direct Seed 8,000 Acres $30.00 $240,000.00Minimum Till 8,000 Acres $0.00 $0.00Mulch Till 8,000 Acres $0.00 $0.00Crop Rotation 10,680 Acres $0.00 $0.00Nutrient Management - Soil tests 800 Each $55.00 $44,000.00Nutrient Management - Split Fertilizer Applications 8,000 Acres $5.00 $40,000.00Sediment Basins 15 Each $4,000.00 $60,000.00Water Control Structures 15 Each $5,000.00 $75,000.00Terraces 10,000 Feet $1.90 $19,000.00Filter Strips 15 Acres $80.00 $1,200.00Grass Waterways 15 Acres $1,500.00 $22,500.00Hayland Seedings 2,000 Acres $80.00 $160,000.00
BMP Practice Amount Units Cost Total Cost Cropland > 12% slopes Direct Seed 1,200 Acre $30.00 $36,000.00Minimum Till 1,200 Acre $0.00 $0.00Mulch Till 1,200 Acre $0.00 $0.00Crop Rotation 1,700 Acre $0.00 $0.00Nutrient Management - Soil tests 120 Each $55.00 $6,600.00Nutrient Management - Split Fertilizer Applications 1,200 Acre $5.00 $6,000.00Water Control Structures 5 Each $5,000.00 $25,000.00Filter Strips 10 Acre $80.00 $800.00Grass Waterways 10 Acre $1,500.00 $15,000.00

South Fork Clearwater River Implementation Plan April 2006
63
BMP Practice Amount Units Cost Total Cost Pasture / Hayland Off-Channel Water Facilities 7 Each $800.00 $5,600.00Spring Developments 7 Each $1,000.00 $7,000.00Fence 10,000 Feet $2.50 $25,000.00Roof-Runoff Structures 3 Each $3,000.00 $9,000.00Culvert Crossings 3 Each $3,000.00 $9,000.00Hardened Access Points 3 Each $3,000.00 $9,000.00Diversions 5,000 Feet $2.50 $12,500.00Streamside Vegetation Restoration 5,000 Feet $30.00 $150,000.00Pasture Management / Rotation 1,900 Acre $0.00 $0.00Buffer Strips 10 Acre $1,500.00 $15,000.00Forage Harvest Management 1,900 Acre $0.00 $0.00Hayland / Pasture Seedings 1,900 Acre $80.00 $152,000.00Riparian Pasture 25 Acre $25.00 $625.00
BMP Practice Amount Units Cost Total Cost Range Spring Developments 5 Each $1,000.00 $5,000.00Off-channel water facilities 5 Each $800.00 $4,000.00Fence 10,000 Feet $2.50 $25,000.00Riparian Pasture 15 Acre $25.00 $375.00Hardened Access Points 5 Each $3,000.00 $15,000.00Streamside Vegetation Restoration 2,500 Feet $30.00 $75,000.00Buffer Strips 7 Acre $1,500.00 $10,500.00
BMP Practice Amount Units Cost Total Cost Riparian Riparian Pasture 200 Acre $25.00 $5,000.00Streamside Vegetation Plantings 5,000 Feet $30.00 $150,000.00Buffer Strips 5 Acre $1,500.00 $7,500.00Tree and Shrub Plantings 5,000 Feet $15.00 $75,000.00Fence 5,000 Feet $2.50 $12,500.00Off-Channel Water Facilities 5 Each $800.00 $4,000.00Spring Developments 5 Each $1,000.00 $5,000.00Roof-Runoff Structures 2 Each $3,000.00 $6,000.00Waste Management Structures 2 Each $5,000.00 $10,000.00Culvert Crossings 5 Each $3,000.00 $15,000.00Diversions 1,000 Feet $2.50 $2,500.00

South Fork Clearwater River Implementation Plan April 2006
64
Butcher Creek
BMP Practice Amount Units Cost Total Cost Cropland < 12% slopes Direct Seed 2,500 Acres $30.00 $75,000.00Minimum Till 2,500 Acres $0.00 $0.00Mulch Till 2,500 Acres $0.00 $0.00Crop Rotation 3,400 Acres $0.00 $0.00Nutrient Management - Soil tests 250 Each $55.00 $13,750.00Nutrient Management - Split Fertilizer Applications 2,500 Acres $5.00 $12,500.00Sediment Basins 5 Each $4,000.00 $20,000.00Water Control Structures 5 Each $5,000.00 $25,000.00Terraces 5,000 Feet $1.90 $9,500.00Filter Strips 10 Acres $80.00 $800.00Grass Waterways 10 Acres $1,500.00 $15,000.00Hayland Seedings 1,000 Acres $80.00 $80,000.00
BMP Practice Amount Units Cost Total Cost Cropland > 12% slopes Direct Seed 800 Acre $30.00 $24,000.00Minimum Till 800 Acre $0.00 $0.00Mulch Till 800 Acre $0.00 $0.00Crop Rotation 1,100 Acre $0.00 $0.00Nutrient Management - Soil tests 80 Acre $55.00 $4,400.00Nutrient Management - Split Fertilizer Applications 800 Acre $5.00 $4,000.00Water Control Structures 3 Each $5,000.00 $15,000.00Filter Strips 5 Acre $80.00 $400.00Grass Waterways 5 Acre $1,500.00 $7,500.00
BMP Practice Amount Units Cost Total Cost Pasture / Hayland Off-Channel Water Facilities 7 Each $800.00 $5,600.00Spring Developments 7 Each $1,000.00 $7,000.00Fence 10,000 Feet $2.50 $25,000.00Roof-Runoff Structures 3 Each $3,000.00 $9,000.00Culvert Crossings 3 Each $3,000.00 $9,000.00Hardened Access Points 3 Each $3,000.00 $9,000.00Diversions 5,000 Feet $2.50 $12,500.00Streamside Vegetation Restoration 5,000 Feet $30.00 $150,000.00Pasture Management / Rotation 1,900 Acre $0.00 $0.00Buffer Strips 10 Acre $1,500.00 $15,000.00Forage Harvest Management 1,900 Acre $0.00 $0.00Hayland / Pasture Seedings 1,900 Acre $80.00 $152,000.00Riparian Pasture 25 Acre $25.00 $625.00
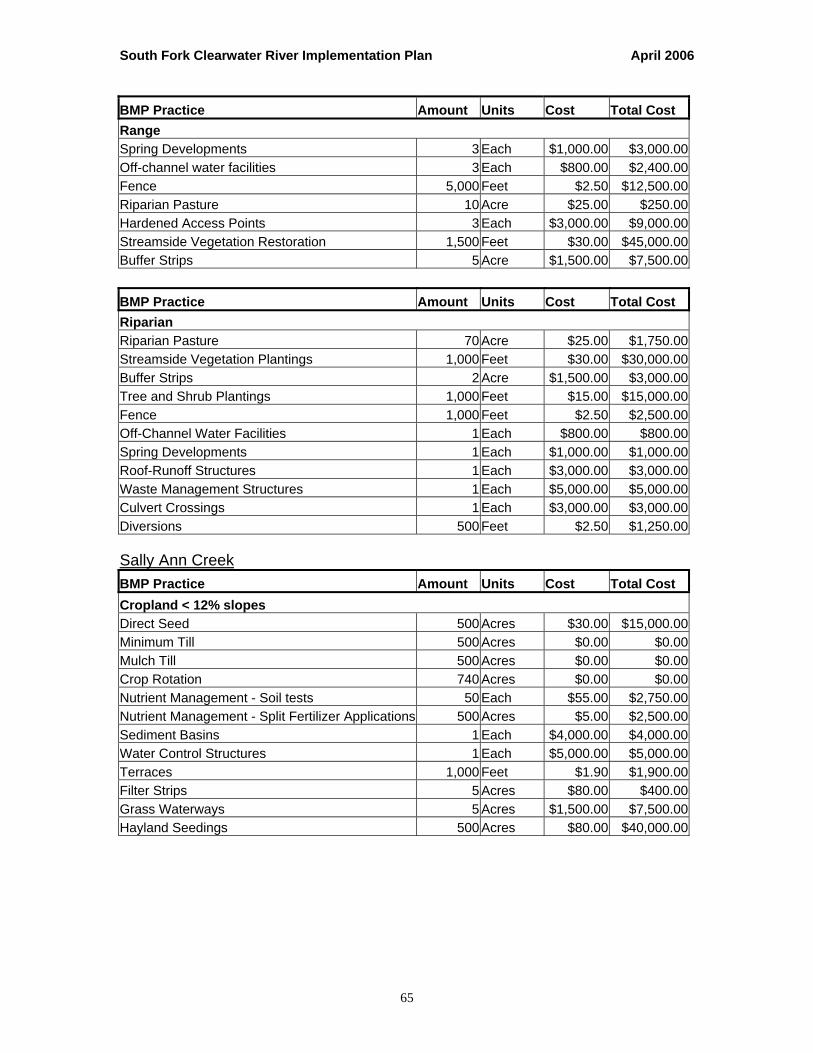
South Fork Clearwater River Implementation Plan April 2006
65
BMP Practice Amount Units Cost Total Cost Range Spring Developments 3 Each $1,000.00 $3,000.00Off-channel water facilities 3 Each $800.00 $2,400.00Fence 5,000 Feet $2.50 $12,500.00Riparian Pasture 10 Acre $25.00 $250.00Hardened Access Points 3 Each $3,000.00 $9,000.00Streamside Vegetation Restoration 1,500 Feet $30.00 $45,000.00Buffer Strips 5 Acre $1,500.00 $7,500.00
BMP Practice Amount Units Cost Total Cost Riparian Riparian Pasture 70 Acre $25.00 $1,750.00Streamside Vegetation Plantings 1,000 Feet $30.00 $30,000.00Buffer Strips 2 Acre $1,500.00 $3,000.00Tree and Shrub Plantings 1,000 Feet $15.00 $15,000.00Fence 1,000 Feet $2.50 $2,500.00Off-Channel Water Facilities 1 Each $800.00 $800.00Spring Developments 1 Each $1,000.00 $1,000.00Roof-Runoff Structures 1 Each $3,000.00 $3,000.00Waste Management Structures 1 Each $5,000.00 $5,000.00Culvert Crossings 1 Each $3,000.00 $3,000.00Diversions 500 Feet $2.50 $1,250.00 Sally Ann Creek
BMP Practice Amount Units Cost Total Cost Cropland < 12% slopes Direct Seed 500 Acres $30.00 $15,000.00Minimum Till 500 Acres $0.00 $0.00Mulch Till 500 Acres $0.00 $0.00Crop Rotation 740 Acres $0.00 $0.00Nutrient Management - Soil tests 50 Each $55.00 $2,750.00Nutrient Management - Split Fertilizer Applications 500 Acres $5.00 $2,500.00Sediment Basins 1 Each $4,000.00 $4,000.00Water Control Structures 1 Each $5,000.00 $5,000.00Terraces 1,000 Feet $1.90 $1,900.00Filter Strips 5 Acres $80.00 $400.00Grass Waterways 5 Acres $1,500.00 $7,500.00Hayland Seedings 500 Acres $80.00 $40,000.00

South Fork Clearwater River Implementation Plan April 2006
66
BMP Practice Amount Units Cost Total Cost Pasture / Hayland Off-Channel Water Facilities 5 Each $800.00 $4,000.00Spring Developments 5 Each $1,000.00 $5,000.00Fence 5,000 Feet $2.50 $12,500.00Roof-Runoff Structures 1 Each $3,000.00 $3,000.00Culvert Crossings 1 Each $3,000.00 $3,000.00Hardened Access Points 1 Each $3,000.00 $3,000.00Diversions 1,000 Feet $2.50 $2,500.00Streamside Vegetation Restoration 1,000 Feet $30.00 $30,000.00Pasture Management / Rotation 600 Acre $0.00 $0.00Buffer Strips 3 Acre $1,500.00 $4,500.00Forage Harvest Management 600 Acre $0.00 $0.00Hayland / Pasture Seedings 600 Acre $80.00 $48,000.00Riparian Pasture 5 Acre $25.00 $125.00
BMP Practice Amount Units Cost Total Cost Range Spring Developments 3 Each $1,000.00 $3,000.00Off-channel water facilities 3 Each $800.00 $2,400.00Fence 5,000 Feet $2.50 $12,500.00Riparian Pasture 10 Acre $25.00 $250.00Hardened Access Points 3 Each $3,000.00 $9,000.00Streamside Vegetation Restoration 1,500 Feet $30.00 $45,000.00Buffer Strips 5 Acre $1,500.00 $7,500.00
(c) Rabbit Creek
BMP Practice Amount Units Cost Total Cost Cropland < 12% slopes Direct Seed 1,400 Acres $30.00 $42,000.00Minimum Till 1,400 Acres $0.00 $0.00Mulch Till 1,400 Acres $0.00 $0.00Crop Rotation 1,900 Acres $0.00 $0.00Nutrient Management - Soil tests 140 Each $55.00 $7,700.00Nutrient Management - Split Fertilizer Applications 1,400 Acres $5.00 $7,000.00Sediment Basins 3 Each $4,000.00 $12,000.00Water Control Structures 3 Each $5,000.00 $15,000.00Terraces 1,000 Feet $1.90 $1,900.00Filter Strips 7 Acres $80.00 $560.00Grass Waterways 7 Acres $1,500.00 $10,500.00Hayland Seedings 1,000 Acres $80.00 $80,000.00

South Fork Clearwater River Implementation Plan April 2006
67
BMP Practice Amount Units Cost Total Cost Pasture / Hayland Off-Channel Water Facilities 5 Each $800.00 $4,000.00Spring Developments 5 Each $1,000.00 $5,000.00Fence 5,000 Feet $2.50 $12,500.00Roof-Runoff Structures 1 Each $3,000.00 $3,000.00Culvert Crossings 1 Each $3,000.00 $3,000.00Hardened Access Points 1 Each $3,000.00 $3,000.00Diversions 1,000 Feet $2.50 $2,500.00Streamside Vegetation Restoration 1,000 Feet $30.00 $30,000.00Pasture Management / Rotation 600 Acre $0.00 $0.00Buffer Strips 3 Acre $1,500.00 $4,500.00Forage Harvest Management 600 Acre $0.00 $0.00Hayland / Pasture Seedings 600 Acre $80.00 $48,000.00Riparian Pasture 5 Acre $25.00 $125.00
BMP Practice Amount Units Cost Total Cost Range Spring Developments 3 Each $1,000.00 $3,000.00Off-channel water facilities 3 Each $800.00 $2,400.00Fence 5,000 Feet $2.50 $12,500.00Riparian Pasture 10 Acre $25.00 $250.00Hardened Access Points 3 Each $3,000.00 $9,000.00Streamside Vegetation Restoration 1,500 Feet $30.00 $45,000.00Buffer Strips 5 Acre $1,500.00 $7,500.00 Lower SFCR
BMP Practice Amount Units Cost Total Cost Cropland < 12% slopes Direct Seed 3,400 Acres $30.00 $102,000.00Minimum Till 3,400 Acres $0.00 $0.00Mulch Till 3,400 Acres $0.00 $0.00Crop Rotation 4,600 Acres $0.00 $0.00Nutrient Management - Soil tests 340 Each $55.00 $18,700.00Nutrient Management - Split Fertilizer Applications 3,400 Acres $5.00 $17,000.00Sediment Basins 7 Each $4,000.00 $28,000.00Water Control Structures 7 Each $5,000.00 $35,000.00Terraces 5,000 Feet $1.90 $9,500.00Filter Strips 10 Acres $80.00 $800.00Grass Waterways 10 Acres $1,500.00 $15,000.00Hayland Seedings 2,000 Acres $80.00 $160,000.00

South Fork Clearwater River Implementation Plan April 2006
68
BMP Practice Amount Units Cost Total Cost Cropland > 12% slopes Direct Seed 400 Acre $30.00 $12,000.00Minimum Till 400 Acre $0.00 $0.00Mulch Till 400 Acre $0.00 $0.00Crop Rotation 550 Acre $0.00 $0.00Nutrient Management - Soil tests 40 Each $55.00 $2,200.00Nutrient Management - Split Fertilizer Applications 400 Acre $5.00 $2,000.00Water Control Structures 1 Each $5,000.00 $5,000.00Filter Strips 3 Acre $80.00 $240.00Grass Waterways 3 Acre $1,500.00 $4,500.00
BMP Practice Amount Units Cost Total Cost Pasture / Hayland Off-Channel Water Facilities 7 Each $800.00 $5,600.00Spring Developments 7 Each $1,000.00 $7,000.00Fence 10,000 Feet $2.50 $25,000.00Roof-Runoff Structures 3 Each $3,000.00 $9,000.00Culvert Crossings 3 Each $3,000.00 $9,000.00Hardened Access Points 3 Each $3,000.00 $9,000.00Diversions 5,000 Feet $2.50 $12,500.00Streamside Vegetation Restoration 5,000 Feet $30.00 $150,000.00Pasture Management / Rotation 1,900 Acre $0.00 $0.00Buffer Strips 10 Acre $1,500.00 $15,000.00Forage Harvest Management 1,900 Acre $0.00 $0.00Hayland / Pasture Seedings 1,900 Acre $80.00 $152,000.00Riparian Pasture 25 Acre $25.00 $625.00
BMP Practice Amount Units Cost Total Cost Range Spring Developments 10 Each $1,000.00 $10,000.00Off-channel water facilities 10 Each $800.00 $8,000.00Fence 10,000 Feet $2.50 $25,000.00Riparian Pasture 30 Acre $25.00 $750.00Hardened Access Points 7 Each $3,000.00 $21,000.00Streamside Vegetation Restoration 2,500 Feet $30.00 $75,000.00Buffer Strips 7 Acre $1,500.00 $10,500.00

South Fork Clearwater River Implementation Plan April 2006
69
BMP Practice Amount Units Cost Total Cost Riparian Riparian Pasture 70 Acre $25.00 $1,750.00Streamside Vegetation Plantings 1,000 Feet $30.00 $30,000.00Buffer Strips 2 Acre $1,500.00 $3,000.00Tree and Shrub Plantings 1,000 Feet $15.00 $15,000.00Fence 1,000 Feet $2.50 $2,500.00Off-Channel Water Facilities 1 Each $800.00 $800.00Spring Developments 1 Each $1,000.00 $1,000.00Roof-Runoff Structures 1 Each $3,000.00 $3,000.00Waste Management Structures 1 Each $5,000.00 $5,000.00Culvert Crossings 1 Each $3,000.00 $3,000.00Diversions 500 Feet $2.50 $1,250.00 Mid SFCR
BMP Practice Amount Units Cost Total Cost Cropland < 12% slopes Direct Seed 500 Acres $30.00 $15,000.00Minimum Till 500 Acres $0.00 $0.00Mulch Till 500 Acres $0.00 $0.00Crop Rotation 700 Acres $0.00 $0.00Nutrient Management - Soil tests 50 Each $55.00 $2,750.00Nutrient Management - Split Fertilizer Applications 500 Acres $5.00 $2,500.00Sediment Basins 3 Each $4,000.00 $12,000.00Water Control Structures 3 Each $5,000.00 $15,000.00Terraces 1,000 Feet $1.90 $1,900.00Filter Strips 5 Acres $80.00 $400.00Grass Waterways 5 Acres $1,500.00 $7,500.00Hayland Seedings 250 Acres $80.00 $20,000.00
BMP Practice Amount Units Cost Total Cost Cropland > 12% slopes Direct Seed 150 Acre $30.00 $4,500.00Minimum Till 150 Acre $0.00 $0.00Mulch Till 150 Acre $0.00 $0.00Crop Rotation 200 Acre $0.00 $0.00Nutrient Management - Soil tests 15 Each $55.00 $825.00Nutrient Management - Split Fertilizer Applications 150 Acre $5.00 $750.00Water Control Structures 1 Each $5,000.00 $5,000.00Filter Strips 3 Acre $80.00 $240.00Grass Waterways 3 Acre $1,500.00 $4,500.00

South Fork Clearwater River Implementation Plan April 2006
70
BMP Practice Amount Units Cost Total Cost Pasture / Hayland Off-Channel Water Facilities 7 Each $800.00 $5,600.00Spring Developments 7 Each $1,000.00 $7,000.00Fence 10,000 Feet $2.50 $25,000.00Roof-Runoff Structures 3 Each $3,000.00 $9,000.00Culvert Crossings 3 Each $3,000.00 $9,000.00Hardened Access Points 3 Each $3,000.00 $9,000.00Diversions 5,000 Feet $2.50 $12,500.00Streamside Vegetation Restoration 5,000 Feet $30.00 $150,000.00Pasture Management / Rotation 1,500 Acre $0.00 $0.00Buffer Strips 10 Acre $1,500.00 $15,000.00Forage Harvest Management 1,500 Acre $0.00 $0.00Hayland / Pasture Seedings 1,500 Acre $80.00 $120,000.00Riparian Pasture 25 Acre $25.00 $625.00
BMP Practice Amount Units Cost Total Cost Range Spring Developments 10 Each $1,000.00 $10,000.00Off-channel water facilities 10 Each $800.00 $8,000.00Fence 10,000 Feet $2.50 $25,000.00Riparian Pasture 30 Acre $25.00 $750.00Hardened Access Points 7 Each $3,000.00 $21,000.00Streamside Vegetation Restoration 2,500 Feet $30.00 $75,000.00Buffer Strips 7 Acre $1,500.00 $10,500.00
BMP Practice Amount Units Cost Total Cost Riparian Riparian Pasture 40 Acre $25.00 $1,000.00Streamside Vegetation Plantings 500 Feet $30.00 $15,000.00Buffer Strips 2 Acre $1,500.00 $3,000.00Tree and Shrub Plantings 500 Feet $15.00 $7,500.00Fence 500 Feet $2.50 $1,250.00Off-Channel Water Facilities 1 Each $800.00 $800.00Spring Developments 1 Each $1,000.00 $1,000.00Roof-Runoff Structures 1 Each $3,000.00 $3,000.00Waste Management Structures 1 Each $5,000.00 $5,000.00Culvert Crossings 1 Each $3,000.00 $3,000.00Diversions 500 Feet $2.50 $1,250.00

South Fork Clearwater River Implementation Plan April 2006
71
Above FS Boundary
BMP Practice Amount Units Cost Total Cost Range Spring Developments 10 Each $1,000.00 $10,000.00Off-channel water facilities 10 Each $800.00 $8,000.00Fence 10,000 Feet $2.50 $25,000.00Riparian Pasture 30 Acre $25.00 $750.00Hardened Access Points 7 Each $3,000.00 $21,000.00Streamside Vegetation Restoration 2,500 Feet $30.00 $75,000.00Buffer Strips 7 Acre $1,500.00 $10,500.00
Funding Financial and technical assistance for installation of BMPs is needed to ensure success of this implementation plan. There are many potential sources for funding that will be actively pursued by the Idaho SWCD to implement water quality improvements on private agricultural and grazing lands. These sources include (but are not limited to): CWA 319 projects refer to section 319 of the Clean Water Act. These are Environmental Protection Agency funds that are allocated to the Nez Perce Tribe and to Idaho State. The Idaho Department of Environmental Quality has primacy to administer the Clean Water Act §319 Non-point Source Management Program for areas outside the Nez Perce Reservation. Funds focus on projects to improve water quality and are usually related to the TMDL process. Source: Idaho Department of Environmental Quality. The Nez Perce tribe has CWA 319 funds available for projects on Tribal lands on a competitive basis. WQPA The Water Quality Program for Agriculture administered by the Idaho Soil Conservation Commission. This program is also coordinated with the TMDL process. Source: Idaho Soil Conservation Commission. http://www.scc.state.id.us/programs.htm The RCRDP program is the Resource Conservation and Rangeland Development Program administered by the Idaho Soil Conservation Commission. This is a grant/loan program for implementation of agricultural and rangeland best management practices or loans to purchase equipment to increase conservation. Source: Idaho Soil Conservation Commission. http://www.scc.state.id.us/programs.htm Conservation Improvement Grants are administered by the Idaho Soil Conservation Commission. http://www.scc.state.id.us/programs.htm PL-566 The small watershed program administered by the USDA Natural Resources Conservation Service (source). Agricultural Management Assistance (AMA): AMA provides cost-share assistance to agricultural producers for constructing or improving water management structures or irrigation structures; planting trees for windbreaks or to improve water quality; and mitigating risk through production diversification or resource conservation practices, including soil erosion control, integrated pest management, or transition to organic farming. http://www.nrcs.usda.gov/programs/ama/
Conservation Reserve Program (CRP): CRP is a land retirement program for blocks of land or strips of land that protect the soil and water resources, such as buffers and grassed waterways. http://www.nrcs.usda.gov/programs/crp/
Conservation Technical Assistance (CTA): CTA provides free technical assistance to help farmers and ranchers identify and solve natural resource problems on their farms and ranches. This might come as advice and

South Fork Clearwater River Implementation Plan April 2006
72
counsel, through the design and implementation of a practice or treatment, or as part of an active conservation plan. This is provided through your local Conservation District and NRCS. http://www.nrcs.usda.gov/programs/cta/
Environmental Quality Incentives Program (EQIP): EQIP offers cost-share and incentive payments and technical help to assist eligible participants in installing or implementing structural and management practices on eligible agricultural land. http://www.nrcs.usda.gov/programs/eqip/
Wetlands Reserve Program (WRP): WRP is a voluntary program offering landowners the opportunity to protect, restore, and enhance wetlands on their property. Easements and restoration payments are offered as part of the program. http://www.nrcs.usda.gov/programs/wrp/
Wildlife Habitat Incentives Program (WHIP): WHIP is a voluntary program for people who want to develop and improve wildlife habitat primarily on private land. Cost-share payments for construction or re-establishment of wetlands may be included. http://www.nrcs.usda.gov/programs/whip/ SRF State Revolving Loan Funds are administered through the Idaho Soil Conservation commission. http://www.scc.state.id.us/programs.htm Grassland Reserve Program (GRP) is a voluntary program offering landowners the opportunity to protect, restore, and enhance grasslands on their property. Administered by the NRCS. http://www.nrcs.usda.gov/programs/GRP/ CSP Conservation Security Program is a voluntary program that rewards the Nation’s premier farm and ranch land conservationists who meet the highest standards of conservation environmental management. More details can be found at http://www.nrcs.usda.gov FLEP Forest Land Enhancement Program is a new incentives program authorized in the 2002 Farm Bill to encourage the long-term sustainability of non-industrial private forestlands by providing financial assistance to forest owners for the implementation of a wide variety of non-commercial forest stewardship practices administered by the NRCS. http://www.forestadvice.com/news/flep.htm GLCI Grazing Land Conservation Initiative mission is to provide high quality technical assistance on privately owned grazing lands on a voluntary basis and to increase the awareness of the importance of grazing land resources. http://www.glci.org/ Existing watershed projects are those that have been coordinated through the Focus Program. These projects are sponsored by the Nez Perce Tribe Watershed Division or soil and water conservation districts and funded with Bonneville Power Administration funds in conjunction with other funding sources. Source: Clearwater Focus Program files Stewardship projects The U.S. Army Corps of Engineers conducts these projects to improve wildlife habitat. Source: US Army Corps of Engineers. Land acquisitions and conservation easements are estimated as part of the Nez Perce Tribes Wildlife program proposal before the Bonneville Power Administration and other potential acquisitions. Source: Nez Perce Tribe Wildlife Department and conservation districts. Craig/Wyden Bill Provides compensation to counties in lieu of lost tax revenue from diminished timber harvest. Source: Nez Perce National Forest staff NOAA Restoration Center Community-Based Restoration Funding source for habitat restoration for listed species. Source: NOAA Research/supplementation Idaho Department of Fish and Game, Nez Perce Tribe, and U.S. Fish and Wildlife Service work. Source: Bonneville Power Administration.

South Fork Clearwater River Implementation Plan April 2006
73
New Restoration monitoring Implementation and effectiveness monitoring for new projects started during the budget period. Source: Nez Perce Tribe and conservation districts. New RME Estimated for actions to address data gaps and research needs. Source: Idaho Department of Fish and Game and Nez Perce Tribe. The Dworshak Nez Perce Tribe Wildlife Mitigation Fund established in part to mitigate the losses of wildlife habitat from flooding caused by Dworshak Dam. The program is administered through the Nez Perce Tribe Wildlife Department. The Department also receives funding for project work from the Bureau of Indian Affairs. Source: Nez Perce Tribe Wildlife Department. NPT Wildlife Category reflects the Bureau of Indian Affairs budget component of the Nez Perce Tribe Wildlife Department annual budget. Source: Nez Perce Tribe Wildlife Department. Idaho Department of Fish and Wildlife and Potlatch Corporation Estimated total annual expenditures for restoration and monitoring. Source: Idaho Department of Fish and Wildlife and Potlatch Corporation. Many of these programs could be used in combination with each other to implement BMPs.
Outreach An intensive outreach program will be conducted through the Idaho Soil and Water Conservation District (ISWCD) and its partners, the Idaho Association of Soil Conservation Districts (IASCD), Idaho Soil Conservation commission (ISCC), and the Natural Resource Conservation Service (NRCS). The purpose of these outreach programs is to inform agricultural landowners and operators how water-quality BMP’s can benefit their farm or ranch. Newspaper articles, district newsletters, direct mailings, project tours, demonstration projects, landowner meetings, a sixth grade field day and personal contacts will be conducted as part of this outreach effort. Other outreach objectives include:
• Provision of information about the TMDL process • Accelerated technology transfer • Dissemination of water-quality monitoring results • Increased landowner support for water-quality BMP’s • Distribution of TMDL implementation progress reports • Greater awareness of agriculture’s involvement in the protection and enhancement of
natural resources • Increased public awareness of agriculture’s commitment to meeting the TMDL
challenge.

South Fork Clearwater River Implementation Plan April 2006
74
Monitoring and Evaluation Field Level Status Reviews At the field level the ISCC and NRCS will complete annual status reviews in cost-share programs such as EQIP, CRP, WQPA, 319, and RCRDP. Annual status reviews are field checks of progress towards meeting the individuals contract goals and objectives as well as a visual assessment of installed BMP’s. BMP Effectiveness Along with status reviews the ISCC will complete in-field BMP effectiveness evaluations throughout the implementation phase on installed BMP’s. The BMP effectiveness guide posted on the ISCC website will guide these efforts (Resource Planning Unlimited, 2003). Tools for BMP effectiveness evaluations such as on-site observations, client interviews, soil quality test kit measurements, field measurements on structures, soil samples and water quality samples will be used to help assess BMP effectiveness. Watershed Level Pollution Source and Transport BURP monitoring IDAPA 58.01.02.053 establishes a procedure to determine whether a water body fully supports designated and existing beneficial uses. The procedure detailed in the 1996 Water Body Assessment Guidance (WBAG) (DEQ 1996) and revised in 2000 (Grafe et al. 2000) relies on physical, chemical, and biological parameters to identify water quality limited segments that require TMDL development. The General Surface Water Quality Criteria (IDAPA 58.01.02.200) for Idaho set forth general guidance for surface water quality. The Surface Water Quality Criteria for Aquatic Life Use Designations (IDAPA 58.01.02.250) set forth specific numeric criteria to be met for particular beneficial uses. It also sets forth “narrative” standards that require a logical accumulation of evidence to determine whether a water body is supporting its beneficial uses. The WBAG sets forth a methodology whereby a water body is first assessed using the numeric criteria for a particular beneficial use, then identifies indices and methods for “narrative” assessment of pollutants for which numeric criteria do not apply or are not available (DEQ 1996a; Grafe et al. 2000). Sediment is the primary pollutant addressed by narrative means in the WBAG. Idaho determines if its narrative sediment criteria are being met by collecting BURP data to verify if viable communities of aquatic organisms are present and if evidence of beneficial use exists in the stream. The BURP is a consistent scientific process used statewide for collecting this data. The evaluatation of the BURP data using WBAG results in indices used to compare water quality with the standards to determine beneficial use support status. Bacteria monitoring The ISWCD would like to initiate a DNA fingerprinting study for the Cottonwood and Threemile watersheds where bacteria is listed as a pollutant. The purpose of this project is to use DNA fingerprinting technology to identify the actual sources of fecal coliform in the Cottonwood Creek and Threemile Creek. This will, in turn, show us how best to target our implementation plan and bacteria reduction efforts to meet the TMDL load

South Fork Clearwater River Implementation Plan April 2006
75
reductions. The results of the source groups that can be positively identified will be used to decide how to best allocate existing resources to reduce bacteria loads to the system. NezPerce Tribe Monitoring The Nez Perce Tribe WRD will continue trend monitoring in Reservation watersheds with completed TMDLs in 2005. In 2003 and 2004, WRD conducted water quality trend monitoring at 7 sites on the Nez Perce Reservation at 3 month intervals. Stream sites will be monitored quarterly. Water Quality Trend Monitoring Sites
Watershed Site Description Cottonwood Creek 1402A Mouth Cottonwood Creek 1412A Mainstem @ NPT Reservation boundary Threemile Creek 8401A Mouth Butcher Creek 701A Mouth
Water Quality parameters sampled would include: bacteria, flow, TSS, and nutrients (TP, NH4-N, TKN, NO3-NO2, orthophosphate), and ammonia. Hydrolab readings would be taken for temperature, dissolved oxygen, pH, turbidity, and specific conductivity. Temperature data loggers, installed by WRD staff, would also be located at the stream sites. The cost of analysis for each of the six stream sites is $160. Each site will be sampled 4 times for a total cost of $3,840. IASCD Monitoring The IASCD will have a monitoring program for the Cottonwood Creek watershed, Threemile and Butcher Creek. These plans will be posted on the Commission web site as well as summary reports with the data that was collected. Project / Program Reviews All projects and programs that involve cost-share have a system for review to ensure that cost-share dollars are being spent wisely and being used effectively to reduce TMDL pollutants and/or reduce resource pollutant concerns. All implementation activities that involve cost-share dollars will continue to be subject to these reviews. Progress Tracking and Reporting The ISCC and IDSWCD will write annual progress reports containing information on current BMP installations and any available monitoring data pertaining to implementation progress in the watershed. The ISCC will track installations of BMP’s in “tracker” (or the current tracking system). NRCS will track BMP installations installed under federal programs in the “PRS” system (or the current system). These two systems of tracking will be used to create annual progress reports. The Nez Perce Tribe is currently working on establishing GIS 319 project tracking by watershed that can be shared with ISCC and NRCS.

South Fork Clearwater River Implementation Plan April 2006
76
References BLM (Bureau of Land Management). 2003. Sensitive species list. Cottonwood, ID. BLM. 2003b. American River Biological Assessment. Cottonwood, ID. BLM. Jan 1999. Upper South Fork Clearwater River and Tributaries Biological Assessment. Cottonwood,
ID. BLM. Jan 1999b. Lower South Fork Clearwater River and Tributaries Biological Assessment.
Cottonwood, ID.
DEQ (Idaho Division of Environmental Quality) 1995. Unpublished Beneficial Use Reconnaissance Program data. Lewiston Regional Office, Idaho Department of Health and Welfare, Lewiston, ID.
DEQ (Idaho Division of Environmental Quality) 1996a. 1996 water body assessment guidance: A stream to
standards process. Prepared for the State of Idaho by the IDEQ Watershed Monitoring and Analysis Bureau. Idaho Dept. of Health and Welfare, Boise, ID. 109 pp.
DEQ (Idaho Division of Environmental Quality). 1999. Idaho Division of Environmental Quality 1998 303(d)
List. Idaho Department of Health and Welfare, Boise, ID. 5 chapters. DEQ (Idaho Division of Environmental quality), Nez Perce tribe, US Environmental Protection Agency. 2000.
Cottonwood Creek Total Maximum Daily Load (TMDL). Idaho Department of Health and Welfare, Boise, ID.
DEQ (Idaho Division of Environmental quality), Nez Perce tribe, US Environmental Protection Agency. 2004.
South Fork Clearwater River Subbasin Assessment and TMDLs. Idaho Department of Health and Welfare, Boise, ID
Fuller, R.K., P.A. Kucera, and D.B. Johnson. 1984. A biological and physical inventory of the streams within
the Nez Perce Reservation, synopsis of three years of stream inventory on the Nez Perce Reservation, Final Report. Nez Perce Tribe, Fisheries Resource Management, Lapwai, ID. 147 pp.
Grafe C.S., C.A. Mebane, M.J. McIntyre, D.A. Essig, D.H. Brandt, and D.T. Mosier. 2002. The Idaho
Department of Environmental Quality water body assessment guidance, 2nd edition. Idaho Department of Environmental quality, Boise, ID. 114pp.
IDAPA 58.01.02. Idaho water quality standards and wastewater treatment requirements. Idaho Department of Commerce. 2002. An informal survey conducted for the Kooskia, Idaho Chamber of
Commerce. Boise, ID. Idaho Division of Environmental Quality, Nez Perce Tribe, US Environmental Protection Agency.
2003. South Fork Clearwater Subbasin Assessment and TMDL. Idaho Department of Health and Welfare, Boise, ID. 258 pp. + app.
Idaho Soil Conservation Commission. 2001. Cottonwood Creek Watershed Implementation Plan.
Unpublished. 38pp.
Idaho Soil Conservation Commission. 2002. 2002 Progress Report – Cottonwood Creek phase 1 Implementation. Unpublished. 17 pp.

South Fork Clearwater River Implementation Plan April 2006
77
Idaho Soil Conservation Commission. 2002b. Idaho Agricultural Pollution Abatement Plan. Idaho Soil Conservation Commission. Boise. ID.
Johnson, C. 2002. Personal communication. Presence and magnitude of falls on Threemile Creek as the
result of an on-site visit. U.S. Department of the Interior, Bureau of Land Management, Cottonwood, ID.
Lake, Leonard. 2003. Personal communication. USFS. Grangeville, ID. LRK Communications. April 2003. Lower Red River Meadow Restoration Project – 1997 – 2001
Effectiveness Monitoring Report. Unpublished. 163 pp. NMFS et al. (National Marine Fisheries Service, Cottonwood Bureau of Land Management, Clearwater
National Forest, Nez Perce National Forest). 1998. Matrix of pathways and indicators for watershed condition for Chinook, steelhead and bull trout. Local adaptation for Clearwater Basin and lower Salmon. Orofino, ID. 9 pp.
Northwest Power Planning Council. 2001. Clearwater Watershed summary. Prepared by Ecovista, Pullman,
WA. 115 pp. NPT (Nez Perce Tribe). 2002. Conservation plan of operations. Natural Resource Department, Land Services
Division. Lapwai, ID. 4 pp NRCS (Natural Resource Conservation Service). 1999. Idaho County Technical Guidance section 2;
Threatened and Endangered Species. Resource Planning Unlimited, Inc. 2003. Idaho Agricultural Best Management Practices – A field guide for
evaluating BMP effectiveness. Idaho Soil Conservation Commission and Idaho Department of Environmental Quality. Boise, ID.
Rowan, E. 2002. Personal communication. Agricultural best management practices in place to implement
the Cottonwood Creek TMDL. Idaho Soil Conservation Commission, Grangeville, ID. Sickels, C. 2002. Personal communication. Farm Services Agency, Grangeville, ID. Spencer, R. 2002. Personal communication. Natural Resource Conservation Service, Grangeville, ID. USEPA (U.S. Environmental Protection Agency). Undated. Storet: EPA’s computerized water quality
Database. Storet User Assistance. USEPA, Washington DC. USFS (USDA Forest Service). 1998. South Fork Clearwater River landscape assessment. Volume 1 –
Narrative. Nez Perce National Forest, Grangeville, ID. 210 pp. USFS (USDA Forest Service). 1999. South Fork Clearwater River biological assessment. Nez Perce
National Forest, Grangeville, ID. 603 pp. +app. Woodruff, Leigh. Nov 19,2003. Personal communication. EPA. Boise, ID.

South Fork Clearwater River Implementation Plan April 2006
78

South Fork Clearwater River Implementation Plan April 2006
79
Appendix B. Sediment Monitoring Plan, US Forest Service

South Fork Clearwater River Implementation Plan April 2006
80

South Fork Clearwater River Implementation Plan April 2006
81
Sediment Monitoring Plan for the
Mainstem South Fork Clearwater River Nick Gerhardt
Nez Perce National Forest Version of April 3, 2006
Introduction The South Fork Clearwater Subbasin Assessment and TMDLs were approved in July, 2004. Subsequent to the TMDLs is development of the Implementation Plan, which includes a monitoring component. Monitoring associated with implementation of the TMDLs is multi-faceted, including both project and instream monitoring. It also takes place subbasin-wide, including affected tributaries and the mainstem South Fork Clearwater River. Aquatic monitoring is also required in documents approved under the National Environmental Policy Act (NEPA) and as a result of Endangered Species Act (ESA) consultations on projects occurring on federal lands. This monitoring plan addresses the sediment-related issues in the mainstem South Fork Clearwater River, as required under the TMDL, NEPA commitments and ESA biological opinions. Other monitoring required under the TMDLs is documented in the Implementation Plan. Examples of this include water temperature, canopy density and effective shade monitoring. Additional monitoring is also required and documented under various NEPA documents and ESA biological opinions. This version of the monitoring plan will be updated as needed to address changes in objectives, additional input on protocols and adjustments resulting from field experience. Objectives The general objectives of the mainstem sediment monitoring plan are as follows: 1) Determine compliance with the mainstem sediment TMDL; 2) Address NEPA cumulative effects requirements; 3) Address ESA biological opinion requirements; and 4) Providing data for testing of sediment model results. These objectives will be met by addressing following goals: 1) Compare annual sediment loads at several points; 2) Track sediment yield trends over time; and 3) Determine substrate conditions and track changes over time. In order to meet these objectives and goals, the following parameters are recommended. These are streamflow, suspended sediment concentration and transport, turbidity, bedload sediment transport, substrate particle size distribution, cobble embeddedness, percent surface fines and residual pool depth. These are parameters which reflect water quality and aquatic

South Fork Clearwater River Implementation Plan April 2006
82
habitat, can be affected by management practices and would be expected to change over time. In addition, channel morphology measurements including cross-sections, bed slope, water surface slope, sinuosity and bank angle will be measured to assist in interpretation. Sampling Locations The TMDL requires sampling in each of five control reaches along the mainstem. The control reaches are defined by the DEQ water body numbering system. From downstream to upstream, these reaches are as follows: Water Body ID #1 - Mouth to Threemile Creek; Water Body ID #12 - Threemile Creek to Johns Creek; Water Body ID #22 - Johns Creek to Tenmile Creek; Water Body ID #30 - Tenmile Creek to Crooked River; and Water Body ID #36 - Crooked River to confluence of American and Red Rivers.
WB 1
WB 12
WB 22WB 30
WB 36South Fork Clearwater River
South Fork Clearwater River Subbasin
-0 10 205
Miles
IDEQ Water Body Boundary
Proposed Water Column Monitoring Site
Figure 1 – South Fork Clearwater River subbasin showing control reaches and water column sampling sites Sediment yield monitoring is a labor and time-intensive proposition. Three sampling sites are considered optimal for addressing the objectives of the monitoring plan, while maintaining reasonable costs and logistics. It also requires stream discharge in order to

South Fork Clearwater River Implementation Plan April 2006
83
effectively compute sediment yields and trends over time. There are two active USGS stream gages on the mainstem. The most downstream of these is at Stites (#13338500). The upstream gage is located near Elk City, just upstream of Crooked River (#13337500). Since stream discharge is integral to meeting the sediment monitoring objectives and for estimating sediment loads and yields, these two sites are recommended for sampling. There are bridges and suitable sampling cross-sections associated with both stream gaging sites. There is also a need to separate the sediment yields from the forested, upper parts of the subbasin and the sediment yields from the agriculturally-dominated lower parts of the subbasin. There are also geologic and landform differences associated with these two areas. Since the mainstem is only wadable at low flows, sampling must be conducted from existing bridges. Several candidate sites were evaluated, including the Harpster Bridge on Highway 13, the private Wimer Bridge at about MP 2 on Highway 14, The Mt. Idaho Bridge at about MP 8 on Highway 14, and the Hungry Ridge Road Bridge, located at the mouth of Mill Creek. Although the Mt. Idaho Bridge more closely reflects upstream conditions relative to the Nez Perce National Forest, the Wimer Bridge is the recommended site for reasons of sampling logistics and safety. The cross-section under the Wimer Bridge is suitable for sampling both suspended sediment and bedload. This bridge was also used by the DEQ in the baseline water quality monitoring used to develop the sediment TMDL. The river under the Mt. Idaho Bridge is on a sharp bend and has uneven substrate and flow distribution. Sediment yield sampling is proposed to occur at three locations: 1) USGS gage near Elk City (above Crooked River); 2) Wimer Bridge; and 3) USGS gage at Stites. Substrate sampling is proposed to occur at one reach within each of the five DEQ water bodies delineated for the mainstem South Fork Clearwater River. Photographs of the stream gages and recommended bridge cross-sections are found on the following pages.

South Fork Clearwater River Implementation Plan April 2006
84
Figure 2 - USGS Gage at Stites
Figure 3 - South Fork Clearwater River upstream from bridge at Stites – May 17, 2005

South Fork Clearwater River Implementation Plan April 2006
85
Figure 4 - Wimer Bridge
Figure 5 - South Fork Clearwater River upstream of Wimer Bridge – September 28, 2005

South Fork Clearwater River Implementation Plan April 2006
86
Figure 6 - USGS Gage near Elk City
Figure 7 - South Fork Clearwater River upstream of Crooked River – May 10, 2005

South Fork Clearwater River Implementation Plan April 2006
87
Sediment Yield Sampling Protocols Sediment yield sampling will include suspended sediment concentration, turbidity and bedload sediment. Streamflow would be derived directly from the USGS gages at two of the sites. Streamflow would be estimated for the Wimer Bridge site. Sediment sampling would follow USGS protocols for depth-integrated, cross-sectional sampling (Glysson and Edwards, 1988). Since the river is only wadable at low flows, most sampling would be conducted using a bridge crane and sounding reel, along with either a D-74 sampler for suspended sediment or a Helley-Smith sampler for bedload sediment. Alternative suspension methods could include use of a small modified excavator mounted with a powered sounding reel. Sampling would be concentrated during spring runoff and in response to storm events. An estimated 12 to 18 sets of samples would be collected each year. Sampling would occur roughly on a schedule as follows: January through March – every 6 weeks (2 samples) April – bi-monthly (2 samples) May – weekly (4 samples) June – tri-monthly (3 samples) July through December – every 6 weeks (4 samples) Sampling would not occur when winter ice conditions preclude operation of the samplers. Additional sampling beyond the general schedule would occur in response to storm events. Event-based monitoring would be triggered when the USGS gage at Stites registers approximately 1,500 cfs, regardless of the time of year. As a daily mean, this figure represents an exceedence probability of about 20 to 25 percent. Samples would be analyzed in laboratories using certified equipment and staffed with qualified personnel. Standard methods for analysis would be used (American Public Health Association, et al, 1976). Data would be stored on lab sheets and electronically. Substrate and Channel Morphology Protocol Options Several substrate monitoring protocols were considered, including previous data collected by Western Watershed Analysts (WWA) for DEQ and data collected by the BLM. In addition, substrate monitoring protocols have been recommended by Kershner, at al (2004) and Huntington (1999). The Kershner et al protocol is also known as the Pacfish Infish Biological Opinion (PIBO) monitoring protocol. Substrate and channel morphology monitoring will occur at a minimum in each of the five control reaches described above. Below is a brief description of each substrate monitoring approach. A protocol recommendation is being made in this version of the monitoring plan, pending interagency review and discussion. The relative intensity, timing and cost of sampling are similar under each protocol.

South Fork Clearwater River Implementation Plan April 2006
88
In 2002, WWA collected pebble count and cobble embeddedness data in four reaches with eight transects per reach, for a total of 32 transects. Other data collected included channel cross-sections, channel stability index, stream classification and pool measurements. The WWA transect data were collected at ¼ mile intervals. The samples were taken in the following locations: Section 1 - from the mouth of Threemile Creek downstream 2 miles
Section 2 - from McAlister upstream 2 miles Section 3 - from the mouth of Tenmile Creek upstream 2 miles Section 4 - from the mouth of Crooked Creek upstream 2 miles
The BLM collects substrate data on the mainstem South Fork Clearwater River above the mouth of Crooked River. Protocols include cobble embeddedness, surface fines, pebble counts and fines by depth. The BLM cobble embeddedness and surface fines protocols entail sampling 20 to 30 hoops along 2 to 3 transects. Pebble counts are taken bankfull to bankfull with 200 counts along 1 to 2 transects. Fines by depth are sampled by taking 10 to 20 cores focused on spawning gravels. The PIBO protocols (Kershner, et al, 2004) call for sampling streambed particle size distribution, percent surface fines in pool tails and residual pool depth, among other parameters. Their streambed particle size distribution sampling is restricted to riffles and runs. The sampling protocols calls for sampling four riffles or runs per reach, bankfull to bankfull. Each riffle or run is subdivided into four equally spaced transects. A minimum of 100 particles are measured per reach. Applied to the five reaches in the South Fork mainstem, this would translate to minimum of twenty riffles and runs, eighty transects and 500 total particles sampled. The PIBO protocol for percent surface fines in pool tails calls for sampling the first four pool tails that meet certain criteria in each reach. Sampling is done in three locations per pool tailout using a 14 by 14 inch grid and counting the number of intersections of fines less than six millimeters in size. The PIBO protocol for residual pool depth involves measuring every pool that meets certain criteria within each reach. Measurements include the maximum pool depth and the maximum depth at the pool tail crest. The Huntington (1999) monitoring plan divided the South Fork Clearwater River mainstem into five sections as follows: Section I – Origin to Tenmile Creek Section II - Tenmile Creek to Mill Creek Section III – Mill Creek to Mt. Idaho Bridge Section IV – Mt. Idaho Bridge to Threemile Creek Section V - Threemile Creek to Mouth The plan covered sediment, temperature and channel conditions. With respect to substrate sediment, the plan recommended that high priority elements included cobble embeddedness, surface fines, pebble counts and residual pool depths and volumes. The plan’s

South Fork Clearwater River Implementation Plan April 2006
89
recommendations focused on the reaches within the Nez Perce National Forest. For cobble embeddedness, the plan recommended monitoring in Sections I and III, but not Section II, due to sampling limitations associated with the steep gradient and large substrate of that section. Huntington recommended sampling four stations each in Sections I and III. Stations would each be 300 to 500 meters long , consist of ten transects, with three hoops placed per transect. Cobble embeddedness would be sampled during even-numbered years. Under Huntington’s plan, surface fines would be monitored in pool tailouts, with four stations each in Sections I, II and III using a grid method. These would be sampled during even-numbered years. His plan also called for collecting pebble counts and channel cross-sections at four sites each in Sections I and III. These would be collected during odd-numbered years. Finally, Huntington recommended collecting residual pool depth in a total of ten pools and residual pool volume in a total of four pools in each of the three sections. These would be collected during odd-numbered years. The Idaho DEQ has sampled three reaches in the South Fork Clearwater River, using a modification of its Beneficial Use Reconnaisance Program (BURP) protocol. These sites were located in the lower, middle and upper reaches of the river. They will be considered during the reach selection process. Recommended Substrate and Channel Morphology Protocol The substrate and channel morphology protocol will consist of a combination of the above options, relying heavily upon Kershner et al (2004), Harrelson et al (1994) and Huntingtion (1999). One reach within each of the five DEQ water bodies will be selected for representativeness. The reaches will be surveyed and permanent benchmarks and cross-sections will be established. These will be physically marked on the ground and also located with GPS. Total station survey technology is preferred, but rod and level survey is acceptable. Substrate sampling would occur once each summer during the low flows, when the river is wadable. This is typically expected to occur in August or early September. The following measurements will be taken within each sampling reach. Specific sample numbers, spacing of cross-sections and transects, etc will be determined later. 1) Pool length and residual pool depth for each pool; 2) Percent surface fines and cobble embeddedness in pool tailouts; 3) Bankfull to bankfull pebble counts at selected cross-sections; 4) Channel cross-sections at selected locations; 5) Bank angle and bank stability rating at selected transects; 6) Reach thalweg bed gradient and water surface gradient; and 7) Reach sinuosity (valley and thalweg length). Additional measurements may be added as the protocol is further refined.

South Fork Clearwater River Implementation Plan April 2006
90
Laboratory Analysis Suspended sediment samples would be analyzed using standard methods (APHA, et al, 1976). The entire collected set of samples will be filtered for suspended sediment concentraqtion. A fully mixed decant of the sample will be analyzed for turbidity. Bedload samples are dried and weighed in their entirety. They are then sieved, followed by weighing of each fraction. Data Storage, Analysis and Reporting Lab data and associated metadata would be entered into electronic spreadsheets. Original field and lab data sheets would be retained. For the three water column sampling sites, regression equations of stream discharge versus suspended sediment concentration, stream discharge versus turbidity and suspended sediment concentration versus turbidity will be done annually. These data will also be pooled for multi-year analysis. Suspended and bedload sediment transport curves will be constructed and sediment transport characteristics evaluated at different stream discharge. The transport curves will be coupled with daily streamflow from the USGS gaging stations to estimate monthly and annual suspended and bed sediment loads (Colby, 1956). Sediment loads and yields will be estimated once sufficient data have been collected, typically about 15 to 20 samples. Analysis of sediment yield trends would occur once sufficient data have been collected. This will likely only be meaningful if data continue to be collected beyond the three to five year pilot period. Substrate data will be analyzed annually between sites. Comparisons will also be made between years at each site. An annual report will be written summarizing the previous year’s data collection and analysis efforts. The reports will be cumulative in that each successive year of sampling will be added to previous reports. The reports will be distributed to the parties of interest, including the participating agencies and others. Quality Assurance/Quality Control Training of the field crews will commence in April, 2006 for the sediment yield monitoring and July or August, 2006 for the substrate and channel morphology monitoring. Written protocols will be provided to the crews and agency oversight will occur until the crews are confident with the sampling procedures. Field data sheets will be provided and checked for completeness and accuracy after each of the initial sampling rounds. One member of the Northern Region PIBO training cadre is scheduled to be available for the initial training of the substrate and channel morphology monitoring crews. These crews will also participate in a PIBO training session, scheduled for August 17-18, 2006. This will

South Fork Clearwater River Implementation Plan April 2006
91
likely be in the middle of the summer monitoring phase and any adjustments in sampling protocols will be made as a result. Lab protocols will be initially be checked by the Nez Perce National Forest (NPNF) and DEQ to ensure that standard methods are being followed. Lab equipment will be checked and commercially calibrated. Periodic samples of known sediment concentration and turbidity will be supplied to the lab for consistency checks. Implementation and Funding The field sampling will be conducted by a combination of Framing Our Community (FOC) of Elk City, Idaho, the Palouse-Clearwater Environment Institute (PCEI) of Moscow, Idaho and the Nez Perce Tribe (NPT). FOC will conduct the sediment yield and substrate monitoring. FOC, PCEI and the NPT will participate in the substrate and channel morphology monitoring. Lab analysis for suspended sediment, turbidity and bedload will be provided by the Elk City Water Lab, operated by the Elk City Water District. Equipment and training will be provided by a combination of federal and state agencies, with the NPNF having the overall lead. Sampling equipment is being provided by the DEQ, NPT and NPNF. The NPNF will have the overall coordination role, with additional technical support being provided by the DEQ, NPT, USGS and BLM. Other agencies may have a supplemental role as the project progresses. The Nez Perce National Forest was contacted by the North Central Idaho Resource Advisory Committee (RAC), expressing interest in funding a monitoring program for the mainstem South Fork Clearwater River. The RAC’s interest was related to cumulative effects monitoring needed to support timber resource management in the subbasin. A three to five year funding proposal was drafted for consideration in January, 2006. The RAC voted unanimously to fund the first year. A revised proposal with a slightly higher cost estimate was submitted in February, 2006 and also funded for the first year. A detailed cost estimate, including agency contributions is available as a separate document. Plan Development Process and Acknowledgments Numerous individuals and agencies contributed to the development of this monitoring plan. A Technical Advisory Group (TAG) met on February 15, March 22 and April 22, 2005. These meetings included representatives from the BLM, DEQ, IASCD, IDFG, IDL, ISCC, ITD, NOAA Fisheries, NPT, USFWS, USGS and the South Fork Clearwater WAG, though not each agency or group attended each meeting. EPA also provided input to the TAG meetings. The monitoring plan was also discussed with and received input from the South Fork Clearwater WAG and the North Central Idaho RAC. The plan has benefited greatly from review and technical input from several individuals. These include John Cardwell and Daniel Stewart of the DEQ, Greg Clark and Terry Maret of the USGS, Susan Beattie of the NPT, Bob Ries of NOAA Fisheries, Leigh Woodruff of the EPA, Craig Johnson of the BLM, Boyd Bouwes and Brett Roper of the PIBO monitoring

South Fork Clearwater River Implementation Plan April 2006
92
team, and Dave Mays, Gayle Howard and Wayne Paradis of the NPNF. Tim MacDonald of the NPNF provided GIS support. Tom Dechert of the DEQ provided the foundation in his role as the principal author of the TMDLs. Bill Mulligan and Susan Borowicz of the North Central Idaho RAC provided input to the content and inspiration leading to development and funding of the plan. Joyce Dearstyne and Trent Woods of FOC, Tracy Brown of PCEI and Ben Holcomb of the NPT assisted with the content and logistics of implementation. Lois Geary of the NPNF is providing assistance in development of agreements needed to implement the plan. Russ Christensen and Rick Backsen of the USGS have agreed to assist in standardization of sediment sampling techniques. Scott Vuono of the NPNF has agreed to assist in field crew training relative to the PIBO sampling protocols. Phil Wimer has graciously allowed use his privately-owned bridge for sediment sampling. Other landowners will be contacted as the substrate and channel morphology monitoring sites are more specifically identified.

South Fork Clearwater River Implementation Plan April 2006
93
List of Abbreviations BAG – Clearwater Basin Advisory Group BLM- Bureau of Land Management BURP – Beneficial Use Reconnaisance Program DEQ – Idaho Department of Environmental Quality EPA – Environmental Protection Agency ESA – Endangered Species Act FOC – Framing Our Community GPS – Global Positioning System IASCD – Idaho Association of Soil Conservation Districts IDFG – Idaho Department of Fish and Game IDL – Idaho Department of Lands ISCC – Idaho Soil Conservation Commission ITD – Idaho Transportation Department MP – Milepost (refers to State Highways 13 and 14) NEPA – National Environmental Policy Act NOAA – National Oceanic and Atmospheric Administration NPNF – Nez Perce National Forest NPT – Nez Perce Tribe PCEI – Palouse-Clearwater Environmental Institute PIBO – PacFish/Infish Biological Opinion QA/QC – Quality Assurance/Quality Control RAC – North Central Idaho Resource Advisory Committee TAG – Technical Advisory Group TMDL – Total Maximum Daily Load USFWS – United States Fish and Wildlife Service USGS – United States Geological Survey WAG – South Fork Clearwater Watershed Advisory Group WB – DEQ Water Body WWA – Western Watershed Analysts

South Fork Clearwater River Implementation Plan April 2006
94
References American Public Health Association, American Water Works Association and Water Pollution Control Federation. 1976. Standard Methods for the Examination of Water and Wastewater. Fifteenth Edition.
Colby, B.R. 1956. Relationship of sediment discharge to streamflow: U.S. Geological Survey Open-File Report. 170 pp. Glysson, G. Douglas and Thomas K. Edwards. 1988. Field Methods for Measurement of Fluvial Sediment. U.S. Geological Survey Open-File Report 86-531. Harrelson, Cheryl, C. L. Rawlins, and John P. Potyondy. 1994. Stream Channel Reference Sites: An Illustratede Guide to Field Techniques. USDA Forest Service General Technical Report RM-245. Huntington, Charles. 1999. Plan for Monitoring Sediment, Temperature and Channel Conditions Along the Mainstem South Fork Clearwater River, Idaho. Clearwater BioStudies, Inc. Idaho Department of Environmental Quality, Nez Perce Tribe and U.S. Environmental Protection Agency. 2004. South Fork Clearwater River Subbasin Assessment and Total Maximum Daily Loads.
Kershner, Jeffrey L. and nine co-authors. 2004. Guide to Effective Monitoring of Aquatic and Riparian Resources. USDA Forest Service. Rocky Mountain Research Station. General Technical Report. RMRS-GTR-121.


![Middle Fork 11[1].06 - San Francisco State Universityonline.sfsu.edu/jerry/geo_642/studentProjects/2006/SanPedro... · The area for this study is located on the Middle Fork of San](https://img.pdfslide.us/doc/110x75/5e30263cf37c9c02f6494627/middle-fork-11106-san-francisco-state-the-area-for-this-study-is-located-on.jpg)