Embed Size (px)
DESCRIPTION
The 2006 South Florida Environmental Report details a year of restoration, scientific and engineering progress in the Kissimmee Basin, Lake Okeechobee, the Everglades and South Florida coastal areas. The independent peer-reviewed report is produced by the South Florida Water Management District and the Florida Department of Environmental Protection.
Citation preview
S O U T H F L O R I D A W A T E R M A N A G E M E N T D I S T R I C T
2006 SOUTH FLORIDA
On behalf of Florida’s Department of Environmental Protection and the South Florida Water Management District, we are pleased to present the results of another remarkable year restoring America’s Everglades and the entire South Florida ecosystem. Restoration work began just a decade ago, yet today is providing environmental returns
such as water quality improvements and pollution control. In a short time, the State of Florida has become a world leader in meeting the complex challenges of environmental restoration.
This 2006 South Florida Environmental Report provides a snapshot of Florida’s success over the past year. The report represents the dedicated work of wetland scientists, ecologists, hydrologists, engineers, planners, fi nancial analysts, program managers and agency support staff at both the state and federal levels. Their commitment to carrying out the work of environmental restoration is establishing a lasting legacy for all citizens.
Despite the impacts of the 2004 hurricanes, which inundated the natural system with stormwater fl ow and increased phosphorus concentrations, the Stormwater Treatment Areas treated almost 1.5 million acre-feet of water and prevented 189 metric tons of phosphorus from reaching the Everglades. Best Management Practices (BMPs) recorded its tenth consecutive year of outstanding results in reducing phosphorus inputs. The BMP program achieved a 59 percent phosphorus load reduction in the Everglades Agricultural Area this year, more than double the 25% required by law.
Florida has already invested $1 billion and committed more than $2.5 billion through the end of the decade to continue restoration progress. To further protect Florida’s natural environment and growing economy, Governor Bush ranked growth management reform as a top priority during the 2005 Legislative Session. Signed into law on June 24th, the growth management reforms – the fi rst in 20 years – created a stronger link between local water supply planning and regional plans. In the next fi ve years, alternative water supply projects will provide more than 300 million gallons of water per day to the communities of South Florida, supporting local economies, the environment and our quality of life.
These are just a few highlights from a broad and exciting environmental restoration effort. We invite you to turn the pages of the 2006 South Florida Environmental Report and review the fi rst-rate science, engineering and water resource management that is making environmental restoration a reality.
Sincerely,
Colleen M. Castille Carol Ann WehleSecretary Executive DirectorFlorida Department of South Florida Water Environmental Protection Management District

On the heels of success with the 2005 pilot project, the 2006 South Florida Environmental Report
(SFER) represents the first complete report consolidation effort following the newly authorized state legislation, Chapter 2005-36, Laws of Florida. Notably, the 2006 Report is also the eighth comprehensive publication authored cooperatively by the South Florida Water Management District and the Florida Department of Environmental Protection. The document consists of multiple reports presented in two volumes, providing the public and decision makers with diverse, up-to-date information on South Florida’s unique environment, while at the same time streamlining the publication process and legislative review.
Volume I, the South Florida Environment, updates last year’s consolidated report with relevant information from a year of scientifi c and engineering efforts by many outstanding technical professionals. This fi rst volume brings together information from across the entire 16-county South Florida Water Management District. In 13 chapters, it covers the Everglades, the Kissimmee River and Chain of Lakes, Lake Okeechobee, and South Florida’s coastal ecosystems. It also satisfi es various annual reporting requirements of the Everglades Forever Act, the Lake Okeechobee Protection Act, the Comprehensive Everglades Restoration Plan, and other state and federal laws.
Volume II, District Annual Plans and Reports,represents a signifi cant achievement toward unifi ed reporting standards across the state. For several months over the past year, the Florida Department of Environmental Protection and all fi ve of Florida’s water management districts worked closely together to determine which mandated annual reports
could be combined into a single volume to improve effi ciency and statewide communication. Stemming from this effort, the second volume is now comprised of six annual plans and reports required by all water management districts. Specifically, this volume docu ments the South Florida Water Management District’s progress in implementing plans developed to address areas of responsibility in the 11 programs outlined in the Strategic Plan. In its second year of development, the Volume II database provides a single source of project-related information and allows for greater effi ciency in project reporting and data retrieval.
The entire 2006 Report, as well as all previous consolidated reports, can be found on the District’s web site (http://www.sfwmd.gov/sfer/) and also on the compact disc inside the back cover of this booklet. Overall, the information provided in the SFER represents the scientifi c soundness of the District’s programs and projects that support prudent environmental management. This annual publication continues our communication with the public as we work toward sound management and restoration of the South Florida region.
FOREWORD
ENVIRONMENTAL REPORT
2
The Bottom Line
T he 2006 South Florida Environmental Report
combines more than 50 individual reports into a single, two-volume document. Key findings from
the South Florida Water Management District’s numerous research and monitoring projects during Water Year 2005 (WY2005) are presented in Volume I, The South Florida
Environment, on pages 2 and 3. These pages also include highlights of the District’s fi nancial resources management during Fiscal Year 2005 (FY2005). The fi ndings cover the entire South Florida region including the Kissimmee River basin, Lake Okeechobee, and coastal ecosystems. Some key highlights on the impacts of the 2004 hurricanes on the South Florida environment are also presented. Page 4 highlights Volume II, District Annual Plans and Reports,summarizing the FY2005 planning and project status for six annual reports required annually by all water management districts under various regulatory mandates.
VOLUME I, THE SOUTH FLORIDA ENVIRONMENT
Water Quality in the Everglades Ecosystem
• The Florida Department of Environmental Protection (FDEP) analyzed deviations (excursions) from water quality criteria for WY2005 and reported that Everglades water quality generally meets state numeric criteria. Overall, patterns seen in water quality constituents, except total phosphorus (TP) for WY2005 were very similar to recent years and varied across regions of the Everglades Protection Area (EPA) in association with local environmental conditions and water management activities. Everglades marshes also generally showed little change in water quality from previous years despite the 2004 hurricanes.
• Mercury continues to be an issue in the Everglades and it appears that its declining trend has ended. Mercury concentrations in bass in the Everglades National Park have increased since 1998, and presently exceed federal criteria. Further study is needed to understand the relative importance of local and global atmospheric mercury deposition on levels in Everglades fish. Everglades mercury management also requires confirmation of sulfur sources, research on sulfur cycling, and attention to controlling sulfur input.
• The revised rule for the phosphorus criterion of 10 parts per billion (ppb) received fi nal approval from the U.S. Environmental Protection Agency in July 2005. The FDEP is now working with the District and other interested parties to establish the monitoring networks to determine compliance with the rule.
• Phosphorus source control programs are continuing to exceed expectations. Stormwater Treatment Area (STAs) and Best Management Practices (BMPs) combined have prevented more than 2,200 metric tons (mt) of phosphorus from entering the Everglades over the past nine years.
Performance of the STAs
• Despite the 2004 hurricane-related impacts and increased flow and TP concentrations received, STA operations were able to reduce TP concentrations by 71 percent during WY2005. The operational STAs together treated almost 1.5 million acre-feet (ac-ft) of infl ow and removed 189 mt of TP from surface water. TP concentrations were reduced from an average infl ow of 147 ppb to an average outfl ow of 41 ppb.
3
• STA-3/4, the largest of the six wetland treatment areas, removed 77 mt of phosphorus by treating over 670,000 ac-ft of water to an impressive outflow concentration of just 13 ppb.
Performance of Agricultural BMPs
• Although the 2004 hurricanes did not have major effects on the Everglades source control programs as a whole, they did affect some water quality results in localized areas.
• BMPs continue to be a very effective tool for reducing phosphorus at its source in the Everglades Agricultural Area (EAA). In WY2005, the EAA reported a 59 percent TP load reduction with its BMP program as it continued outstanding performance at reducing nutrient inputs to the Everglades.
• The C-139 basin continued to be out of the compliance in WY2005, the third year of BMP program implementation. However, a reduction in TP concentrations was observed during the water year. Results suggest that the program is having positive effects, moving the basin toward compliance with regulatory requirements.
Hydrology and Ecology of South Florida
• South Florida experienced an extremely rare occurrence of a series of hurricanes in 2004. The region was hit by three major hurricanes and a remnant of a fourth in less than seven weeks. Collectively, the storms drove a cascade of impacts across the region beginning in mid-August and lasting in many areas to the present time.
• WY2005 wading bird nests in South Florida were down sharply from the positive trend observed since 1999, primarily due to fl uctuating water levels from the 2004 hurricanes and extreme hydrologic events.
• Widespread efforts to control invasive exotic species across South Florida continued in WY2005. Notably, the millionth acre of melaleuca was cleared in the CERP project area, while nearly 5,000 acres of Lygodium were treated in the Everglades region. A leaf-eating moth was also released for the fi rst time in South Florida as a biological control for Lygodium.
CERP Performance
• Many achievements for the Comprehensive Everglades Restoration Plan (CERP) were made in FY2005. Most notably, the Acceler8 initiative was launched in October 2004 to expedite the construction and operation of eight ecosystem restoration projects. With a projected total cost of $1.5 billion, the initiative is expected to achieve 70 percent of the restoration plan’s goals by 2011 – fi ve years ahead of the current schedule – while maintaining CERP’s overall momentum.
• More than 210,000 acres of land – approximately 50 percent of lands needed – have been acquired for use in CERP. During FY2005, total CERP revenues were
$237 million and total CERP expenditures were $260 million (unaudited). The anticipated expenditures for FY2006 are $442 million (unaudited).
• A key milestone for RECOVER is the completion of the Initial CERP Update in September 2005. This is the fi rst step in assuring that new technical information is integrated into CERP’s implementation, and will be used in determining if the goals and purposes of the plan are achieved.
Long-Term Plan for Achieving Water Quality Goals
• During FY2005, the District continued implementation of the numerous projects of the Long-Term Plan, as required by the amended Everglades Forever Act (EFA). Currently, the plan’s initial 13-year phase has a projected total cost of $749.8 million.
• The EFA requires that revisions to the Long-Term Plan be developed through an adaptive management approach and be approved by the FDEP. The FDEP approved the second requested revision to the Long-Term Plan in December 2004. This revision included STA expansion, revised STA enhancements, and the addition of recreational facilities at each STA.
Lake Okeechobee Protection Plan
• Projects on Lake Okeechobee watershed are moving forward as planned despite the 2004 hurricanes. The hurricanes led to high inflow and discharges and substantial increases in lake levels. Large TP loads and high sediment resuspension led to high phosphorus and suspended solids concentrations in the water column. TP loadings totaling 950 mt during WY2005 were extremely high and directly related to the unprecedented 2004 hurricanes, which drastically impacted the lake and its watershed.
• To aid in hurricane recovery and to minimize future impacts, the District and U.S. Army Corps of Engineers are currently refining the lake’s operating schedule. The overall goal is to establish favorable conditions to maintain the lake’s long-term ecological health and reduce large discharges to downstream ecosystems, while also minimizing water supply impacts.
Kissimmee Basin
• The District is working with the U.S. Army Corps of Engineers to implement Kissimmee River Basin restoration projects. These projects will reestablish the river-fl oodplain system’s ecological integrity, provide water storage, and increase shoreline fi sh and wildlife habitat in some lakes. Phased construction efforts are continuing, and these projects have an estimated combined cost of $578 million as of FY2005.
4
• The Kissimmee Chain of Lakes Long-Term Management Plan is being prepared to improve and sustain the lakes’ ecosystem health. A draft ecosystem model for the lakes has been completed, and will be used as a key tool for analyzing ecosystem components and developing associated performance measures. The Long-Term Management Plan is scheduled for completion in 2007.
Coastal Ecosystem Management
• The District is continuing efforts to scientifi cally establish freshwater infl ows that protect and restore South Florida coastal ecosystems. Ongoing research continues to focus on analyzing the effects of freshwater discharges on salinity and, in turn, the effects of altered salinity on seagrasses and oyster beds. The District is working with other regulatory agencies to produce a broad range of data and tools that will assist in achieving these challenging goals.
• During WY2005, the District made signifi cant progress toward developing the technical basis for Restoration Flows in the Northwest Fork of the Loxahatchee River, and for Minimum Flow and Level (MFL) criteria in Florida Bay and south-central Biscayne Bay.
EFA Financial Report
• The Everglades Construction Project is one of the nation’s largest environmental restoration projects, with a projected cost of $836.2 million over 20 years. The Florida Bay Restoration Program has a projected total cost of $367 million. EFA Program revenues totalling $551.1 million are forecast for the next fi ve years. The total current estimated cost of implementing the EFA Program for the next 10 years is $2 billion.
VOLUME II, DISTRICT ANNUAL PLANS AND REPORTS• The FY2005 Annual Work Plan Report shows that 202 out
of 249 major District projects – 81 percent – were within one quarter of schedule (coded green) as of September 30, 2005. Of the remainder, 29 projects were within two quarters of schedule (coded yellow), while 18 projects were behind schedule by more than two quarters (coded red). During FY2005, the District collected 81 percent of budgeted revenue, including more than 99 percent of budgeted taxes. The District expensed 71 percent of the total FY2005 budget of $765 million (excluding personnel and managerial reserves), which is 10 percentage points higher than the historical rate.
• Since 2001, Minimum Flow and Level criteria for 10 water bodies have been adopted by the District. The District completed MFLs for Lake Istokpoga during 2005; and will complete MFLs for southern Biscayne Bay in 2006 and Loxahatchee River tributaries in 2007. The Florida Bay MFL was delayed until 2006 to resolve restoration and long-term management issues.
• In accordance with the Five-Year Capital Improvements Plan, the District’s total budgeted capital expenditures for FY2006 are $676.4 million, which is 63.8 percent of the total annual budget of $1.1 billion and 18.2 percent of the total projected Five-Year Capital Improvements Plan budget of $3.7 billion. The FY2006 capital budget is $187.6 million greater than last year’s capital budget of $488.8 million, mainly due to substantial increases in the CERP and District Everglades programs, which in turn refl ect implementation of Acceler8.
• The District has allocated $12.8 million in FY2006 and anticipates spending $55.2 million over the next fi ve years on water resource development projects exclusive of CERP. These projects support development of Alternative Water Supply (AWS) projects that will make water available in future years. The District has also initiated an aggressive funding program for AWS projects in response to the 2005 Water Protection and Sustainability Program. For FY2006, almost $61 million is directed to water supply activities. The state is providing $30 million for FY2006 project funding. When completed, the 80 AWS projects will provide more than 300 million gallons per day of additional water supply.
• In FY2005, the Florida Forever Program funded acquisitions of nearly 11,000 acres of land, completing 85 percent of the required land acquisition for the Kissimmee River Restoration Project, and approximately 50 percent of land required for CERP projects, thereby enabling the launch of Acceler8.
• In FY2005, the District utilized a total of $3.7 million of mitigation funds to acquire 195 acres and restore more than 9,000 acres within the two approved regional mitigation areas – CREW and Pennsuco. Anticipated FY2006 expenditures for mitigation are $1.6 million.
VOLUME I
THE SOUTH FLORIDA ENVIRONMENT
6
VOLUME I • CHAPTER 1A
Introduction to the 2006 South Florida
Environmental Report – Volume I
Building on the success of last year’s pilot project, the 2006 South Florida Environmental Report
(SFER) streamlines and consolidates previous reporting efforts by the South Florida Water Management District and effi ciently unifi es more than 50 individual reports into a single, two-volume document. This introductory chapter provides the reader with a basic understanding of the governmental, scientifi c, and legal context behind Volume I of the 2006 South Florida
Environmental Report. The information presented in this volume continues to aid in Everglades restoration and to support restoration, management, and protection activities of Lake Okeechobee, the Kissimmee River, and South Florida’s coastal ecosystems. Collectively, this volume addresses numerous research and monitoring projects throughout the District (see map). Updates on these projects for the current reporting year, Water Year 2005 (May 1, 2004–April 30, 2005), are provided throughout this volume.
Similar to previous consolidated reports since 1999, the 2006 South Florida Environmental Report
– Volume I was subjected to an intensive review process, including posting the draft report on an interactive WebBoard, three days of public workshops, and peer review by an independent expert panel. This scrutiny ensures that the SFER continues to communicate the best information available in support of the District’s programs. This inclusive report continues to be used by the District, the Florida Department of Environmental Protection (FDEP), and other agencies to support environmental management decisions.
VOLUME I IS REORGANIZED TO FURTHER CONSOLIDATE AND ENHANCE REPORTING
The 2006 South Florida Environment Report is comprised of Volumes I and II, and the Executive Summary. Volume I, The South Florida Environment, is a technically based volume reorganized into a 13-chapter framework. Volume I provides data summaries for all major ecosystems in South Florida. Chapters 1 through 9 of this volume include all of the 2005 SFER topics, with new coverage of the Comprehensive Everglades Restoration Plan (CERP) Annual Report to complement annual reporting on RECOVER (Chapters 7A and 7B). These chapters continue the overall objective to summarize available data and fi ndings related to Everglades restoration.
Providing a more integrated perspective on water management in South Florida, this year’s report continues its coverage of the Lake Okeechobee Annual Report in Chapter 10, fulfilling the requirement of the Lake Okeechobee Protection Program on the lake and its large watershed. Technical information and project updates on the Kissimmee River and Upper Chain of Lakes (Chapter 11), and South Florida’s coastal ecosystems (Chapter 12) are also included. This volume’s expanded coverage also highlights the District’s fi scal resources management during Fiscal Year 2005 (October 1, 2004–September 30, 2005) for CERP, Lake Okeechobee and the Everglades (Chapters 7A, 10 and 13, respectively). Volume I chapters are supported and enhanced by an extensive amount of appended documentation providing data summaries and detailed analyses for the special-interest reader as well as to comply with various permit requirements. Volume II, District
Annual Plans and Reports, summarizes the planning and project status for District-wide annual reports required under several mandates (see page 42).
7
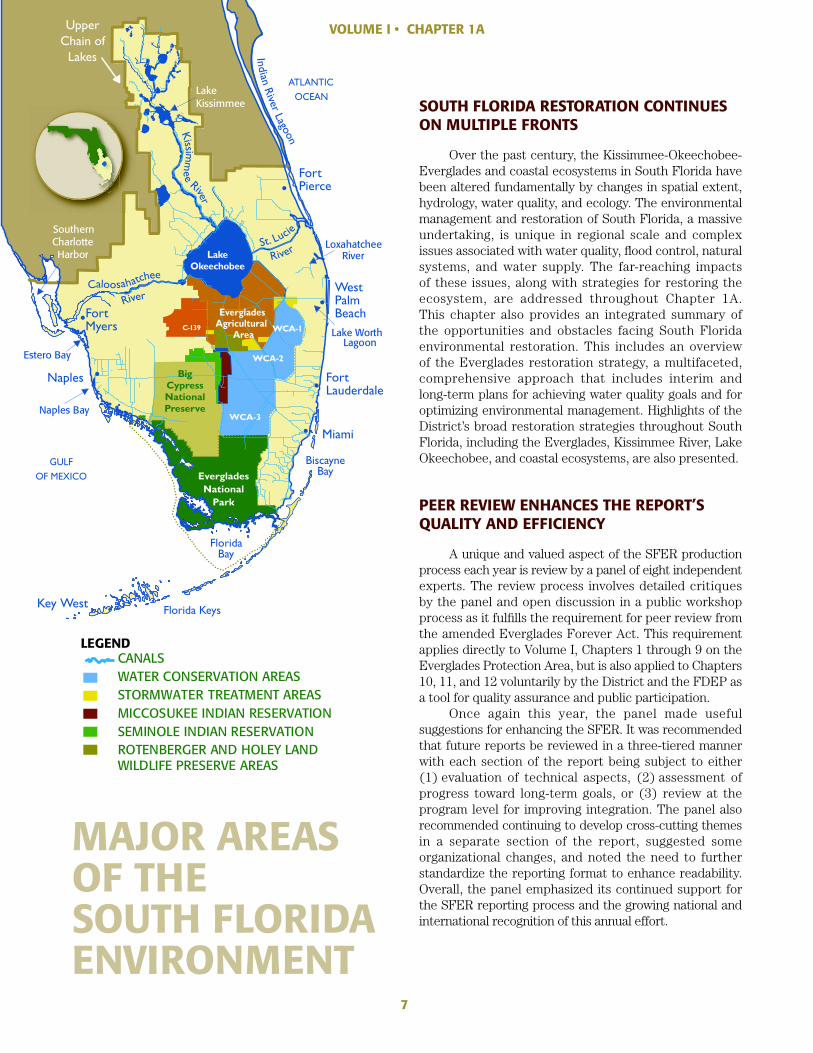
SOUTH FLORIDA RESTORATION CONTINUESON MULTIPLE FRONTS
Over the past century, the Kissimmee-Okeechobee-Everglades and coastal ecosystems in South Florida havebeen altered fundamentally by changes in spatial extent,hydrology, water quality, and ecology. The environmentalmanagement and restoration of South Florida, a massiveundertaking, is unique in regional scale and complexissues associated with water quality, fl ood control, naturalsystems, and water supply. The far-reaching impactsof these issues, along with strategies for restoring theecosystem, are addressed throughout Chapter 1A.This chapter also provides an integrated summary ofthe opportunities and obstacles facing South Floridaenvironmental restoration. This includes an overviewof the Everglades restoration strategy, a multifaceted,comprehensive approach that includes interim andlong-term plans for achieving water quality goals and foroptimizing environmental management. Highlights of theDistrict’s broad restoration strategies throughout SouthFlorida, including the Everglades, Kissimmee River, LakeOkeechobee, and coastal ecosystems, are also presented.
PEER REVIEW ENHANCES THE REPORT’SQUALITY AND EFFICIENCY
A unique and valued aspect of the SFER productionprocess each year is review by a panel of eight independentexperts. The review process involves detailed critiquesby the panel and open discussion in a public workshopprocess as it fulfi lls the requirement for peer review fromthe amended Everglades Forever Act. This requirementapplies directly to Volume I, Chapters 1 through 9 on theEverglades Protection Area, but is also applied to Chapters10, 11, and 12 voluntarily by the District and the FDEP asa tool for quality assurance and public participation.
Once again this year, the panel made usefulsuggestions for enhancing the SFER. It was recommendedthat future reports be reviewed in a three-tiered mannerwith each section of the report being subject to either(1) evaluation of technical aspects, (2) assessment ofprogress toward long-term goals, or (3) review at theprogram level for improving integration. The panel alsorecommended continuing to develop cross-cutting themesin a separate section of the report, suggested someorganizational changes, and noted the need to furtherstandardize the reporting format to enhance readability.Overall, the panel emphasized its continued support forthe SFER reporting process and the growing national andinternational recognition of this annual effort.
MAJOR AREASOF THESOUTH FLORIDAENVIRONMENT
LakeKissimmee
LoxahatcheeRiver
Naples Bay
Estero Bay
Lake WorthLagoon
CharlotteHarbor
Southern
Caloosahatchee
River
IndianRiver
LagoonKissim
me
e
River
ATLANTICOCEAN
WestPalmBeach
FortLauderdale
FortPierce
BiscayneBay
BigCypressNationalPreserve
EvergladesNational
Park
FortMyers
Miami
Naples
FloridaBay
Florida KeysKey West
St. Lucie
RiverLakeOkeechobee
UpperChain of
Lakes
WCA-3
WCA-2
WCA-1AgriculturalArea
Everglades
GULFOF MEXICO
C-139
LEGEND
MICCOSUKEE INDIAN RESERVATIONSEMINOLE INDIAN RESERVATION
STORMWATER TREATMENT AREASWATER CONSERVATION AREASCANALS
ROTENBERGER AND HOLEY LANDWILDLIFE PRESERVE AREAS
VOLUME I • CHAPTER 1A
VOLUME I • CHAPTER 1B
Cross-Cutting Issues in the 2006 South Florida
Environmental Report – Impacts of the 2004 Hurricanes on the South Florida Environment
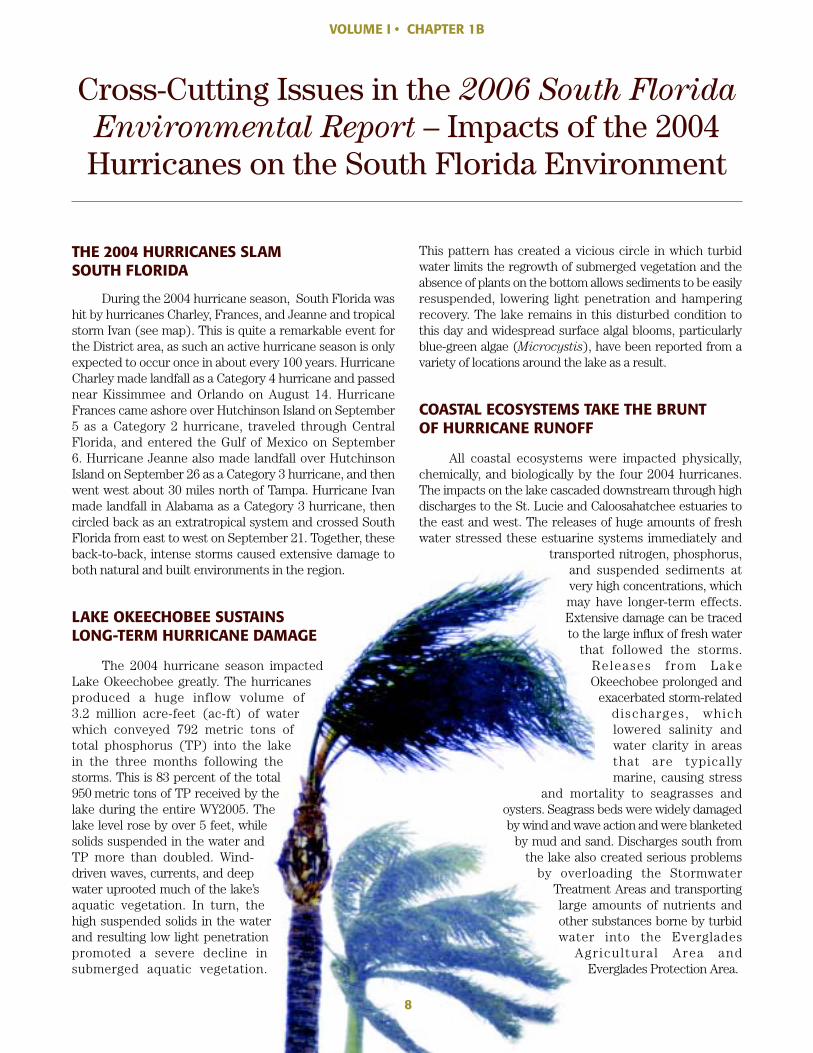
THE 2004 HURRICANES SLAM SOUTH FLORIDA
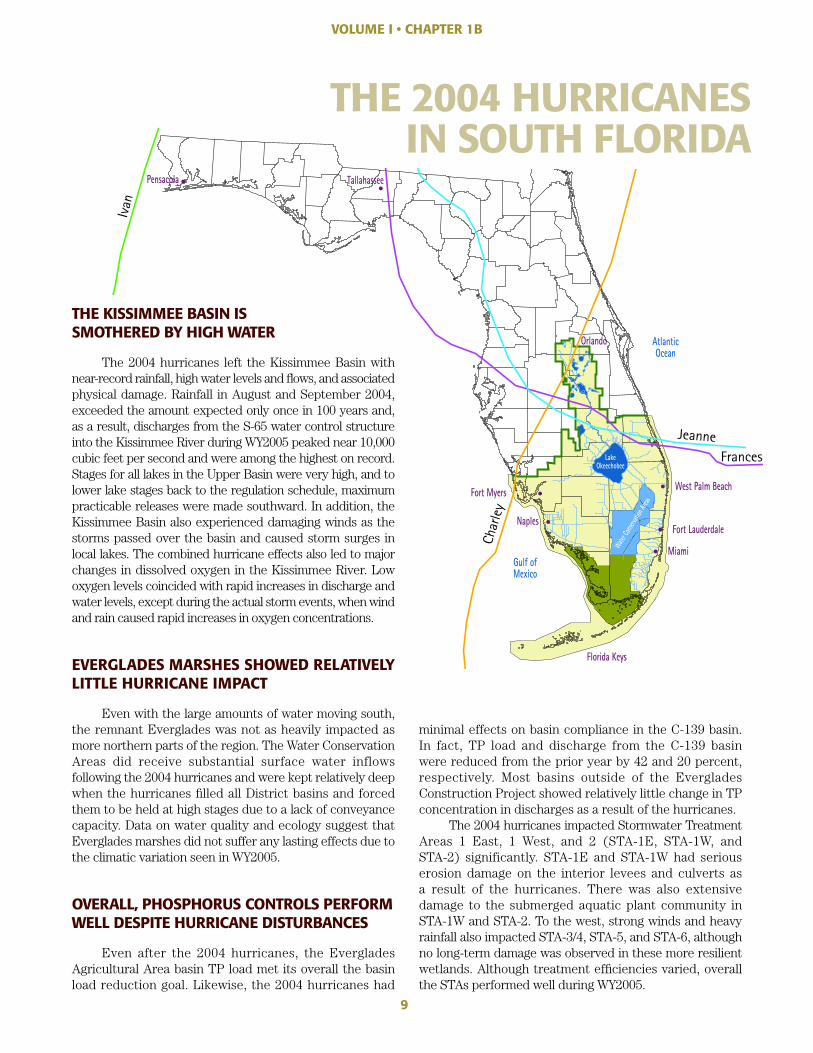
During the 2004 hurricane season, South Florida was hit by hurricanes Charley, Frances, and Jeanne and tropical storm Ivan (see map). This is quite a remarkable event for the District area, as such an active hurricane season is only expected to occur once in about every 100 years. Hurricane Charley made landfall as a Category 4 hurricane and passed near Kissimmee and Orlando on August 14. Hurricane Frances came ashore over Hutchinson Island on September 5 as a Category 2 hurricane, traveled through Central Florida, and entered the Gulf of Mexico on September 6. Hurricane Jeanne also made landfall over Hutchinson Island on September 26 as a Category 3 hurricane, and then went west about 30 miles north of Tampa. Hurricane Ivan made landfall in Alabama as a Category 3 hurricane, then circled back as an extratropical system and crossed South Florida from east to west on September 21. Together, these back-to-back, intense storms caused extensive damage to both natural and built environments in the region.
LAKE OKEECHOBEE SUSTAINS LONG-TERM HURRICANE DAMAGE
The 2004 hurricane season impacted Lake Okeechobee greatly. The hurricanes produced a huge inflow volume of 3.2 million acre-feet (ac-ft) of water which conveyed 792 metric tons of total phosphorus (TP) into the lake in the three months following the storms. This is 83 percent of the total 950 metric tons of TP received by the lake during the entire WY2005. The lake level rose by over 5 feet, while solids suspended in the water and TP more than doubled. Wind-driven waves, currents, and deep water uprooted much of the lake’s aquatic vegetation. In turn, the high suspended solids in the water and resulting low light penetration promoted a severe decline in submerged aquatic vegetation.
This pattern has created a vicious circle in which turbid water limits the regrowth of submerged vegetation and the absence of plants on the bottom allows sediments to be easily resuspended, lowering light penetration and hampering recovery. The lake remains in this disturbed condition to this day and widespread surface algal blooms, particularly blue-green algae (Microcystis), have been reported from a variety of locations around the lake as a result.
COASTAL ECOSYSTEMS TAKE THE BRUNT OF HURRICANE RUNOFF
All coastal ecosystems were impacted physically, chemically, and biologically by the four 2004 hurri canes. The impacts on the lake cascaded downstream through high discharges to the St. Lucie and Caloosahatchee estuaries to the east and west. The releases of huge amounts of fresh water stressed these estuarine systems im mediately and
transported nitrogen, phosphorus, and suspended sediments at very high concen trations, which may have longer-term effects. Extensive damage can be traced to the large infl ux of fresh water
that followed the storms. Releases from Lake Okeechobee prolonged and
exacerbated storm-related discharges, which lowered salinity and water clarity in areas that are typically marine, causing stress
and mortality to seagrasses and oysters. Seagrass beds were widely damaged by wind and wave action and were blanketed
by mud and sand. Discharges south from the lake also created serious problems
by overloading the Stormwater Treatment Areas and transporting large amounts of nutrients and other substances borne by turbid water into the Everglades
Agricultural Area and Everglades Protection Area.
8
THE KISSIMMEE BASIN ISSMOTHERED BY HIGH WATER
The 2004 hurricanes left the Kissimmee Basin withnear-record rainfall, high water levels and fl ows, and associatedphysical damage. Rainfall in August and September 2004,exceeded the amount expected only once in 100 years and,as a result, discharges from the S-65 water control structureinto the Kissimmee River during WY2005 peaked near 10,000cubic feet per second and were among the highest on record.Stages for all lakes in the Upper Basin were very high, and tolower lake stages back to the regulation schedule, maximumpracticable releases were made southward. In addition, theKissimmee Basin also experienced damaging winds as thestorms passed over the basin and caused storm surges inlocal lakes. The combined hurricane effects also led to majorchanges in dissolved oxygen in the Kissimmee River. Lowoxygen levels coincided with rapid increases in discharge andwater levels, except during the actual storm events, when windand rain caused rapid increases in oxygen concentrations.
EVERGLADES MARSHES SHOWED RELATIVELYLITTLE HURRICANE IMPACT
Even with the large amounts of water moving south,the remnant Everglades was not as heavily impacted asmore northern parts of the region. The Water ConservationAreas did receive substantial surface water inflowsfollowing the 2004 hurricanes and were kept relatively deepwhen the hurricanes fi lled all District basins and forcedthem to be held at high stages due to a lack of conveyancecapacity. Data on water quality and ecology suggest thatEverglades marshes did not suffer any lasting effects due tothe climatic variation seen in WY2005.
OVERALL, PHOSPHORUS CONTROLS PERFORMWELL DESPITE HURRICANE DISTURBANCES
Even after the 2004 hurricanes, the EvergladesAgricultural Area basin TP load met its overall the basinload reduction goal. Likewise, the 2004 hurricanes had
minimal effects on basin compliance in the C-139 basin.In fact, TP load and discharge from the C-139 basinwere reduced from the prior year by 42 and 20 percent,respectively. Most basins outside of the EvergladesConstruction Project showed relatively little change in TPconcentration in discharges as a result of the hurricanes.
The 2004 hurricanes impacted Stormwater TreatmentAreas 1 East, 1 West, and 2 (STA-1E, STA-1W, andSTA-2) significantly. STA-1E and STA-1W had seriouserosion damage on the interior levees and culverts asa result of the hurricanes. There was also extensivedamage to the submerged aquatic plant community inSTA-1W and STA-2. To the west, strong winds and heavyrainfall also impacted STA-3/4, STA-5, and STA-6, althoughno long-term damage was observed in these more resilientwetlands. Although treatment effi ciencies varied, overallthe STAs performed well during WY2005.
THE 2004 HURRICANESIN SOUTH FLORIDA
VOLUME I • CHAPTER 1B
9
10
Information from comprehensive water quality monitoring programs in the Everglades Protection Area (EPA) during WY2005 is evaluated in Chapter 2A of the
2006 South Florida Environmental Report – Volume
I. This chapter assesses water quality parameters that did not meet their state Class III water quality criteria during WY2005 and evaluates conditions affecting water quality on a regional scale in the EPA. These criteria are defi ned in Section 62-302.530, Florida Administrative Code, and establish enforceable management and societal goals for Everglades water quality conditions.
WATER QUALITY NETWORK CONTINUES TO TRACK COMPLIANCE
Most water quality data from the EPA continues to meet applicable water quality criteria. However, as in previous years, some concentrations exceeded state criteria (identifi ed as “excursions”). These excursions vary greatly across different EPA regions, as expected considering local environmental conditions and water management activities. Continuing the trend observed in previous years, water quality excursions in WY2005 were identifi ed for dissolved oxygen (DO), pH, alkalinity, conductivity, and un-ionized ammonia.
Dissolved oxygen excursions, primarily in the marsh interior, frequently occurred in phosphorus-enriched areas. Such areas are expected to remain impaired until total phosphorus (TP) concentrations in surface water and sediment are reduced and biological communities recover. When unenriched areas are evaluated separately, DO is generally considered a minimal concern in the EPA. Excursions from pH and alkalinity criteria continued to be localized mainly to the Arthur R. Marshall Loxahatchee National Wildlife Refuge (Refuge) and related to natural conditions within the area.
Two pesticides, atrazine and chlorpyrifos ethyl, which do not have numeric Class III water quality criteria, were detected at concentrations above toxicity-based guidelines. Pesticide exceedances occurred at the infl ows to the Refuge and Water Conservation Area 2 (WCA-2). These fi ndings are consistent with previous consolidated reports, which have noted similar levels in localized areas of the EPA.
2004 HURRICANES HAD MINIMAL IMPACT ON WATER QUALITY IN THE EPA
Everglades marshes generally showed little change in water quality as the result of the 2004 hurricanes. More rain from the hurricanes increased runoff discharged to the EPA from areas to the north, resulting in increased input of some parameters, such as phosphorus and nitrogen (see Volume I, Chapter 2C), while conversely diluting others, such as dissolved ions. Overall, any direct effects from the storms, such as disturbance of the water column and underlying sediments, were short-lived and appeared to have little or no adverse effect on the water quality reported in this region.
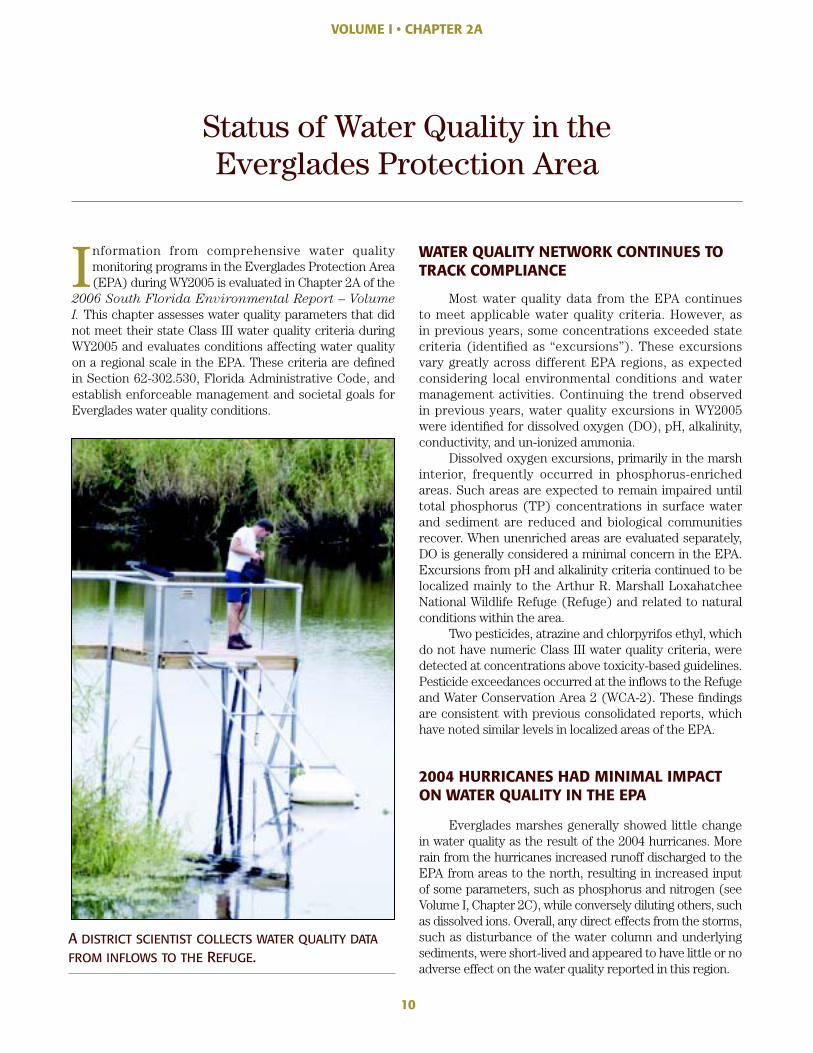
A DISTRICT SCIENTIST COLLECTS WATER QUALITY DATAFROM INFLOWS TO THE REFUGE.
VOLUME I • CHAPTER 2A
Status of Water Quality in the Everglades Protection Area
11
Mercury Monitoring, Research and Environmental Assessment in South Florida
The Florida Department of Environmental Protection (FDEP) and the South Florida Water Management District continue to support studies of the causes,
risks, and solutions to the Everglades mercury problem. Chapter 2B of the 2006 South Florida Environmental
Report – Volume I updates findings in program areas documented in previous consolidated reports.
FISH MERCURY CONCENTRATIONS REMAIN LEVEL IN THE WCAS, BUT ARE UP IN THE PARK
Methylmercury, a highly toxic mercury form, bioaccumulates strongly in aquatic food chains posing health risks to humans and fi sh-eating wildlife. Mercury in Everglades fi sh and wading birds has declined sharply over the past 10 to 15 years, with levels in largemouth bass in the WCAs down 40 to 80 percent. Despite these declines, mercury concentrations in bass – averaging about 0.5 milligrams per kilogram (mg/kg) – remain above the proposed U.S. Environmental Protection Agency (USEPA) water quality criterion of 0.3 mg/kg for fi sh consumption; mercury levels have not declined since about 1998. In contrast, mercury concentrations in bass have increased since 1998 in the Everglades National Park and are presently at levels exceeding federal criteria.
MORE RESEARCH IS NEEDED FOR FUTURE MANAGEMENT
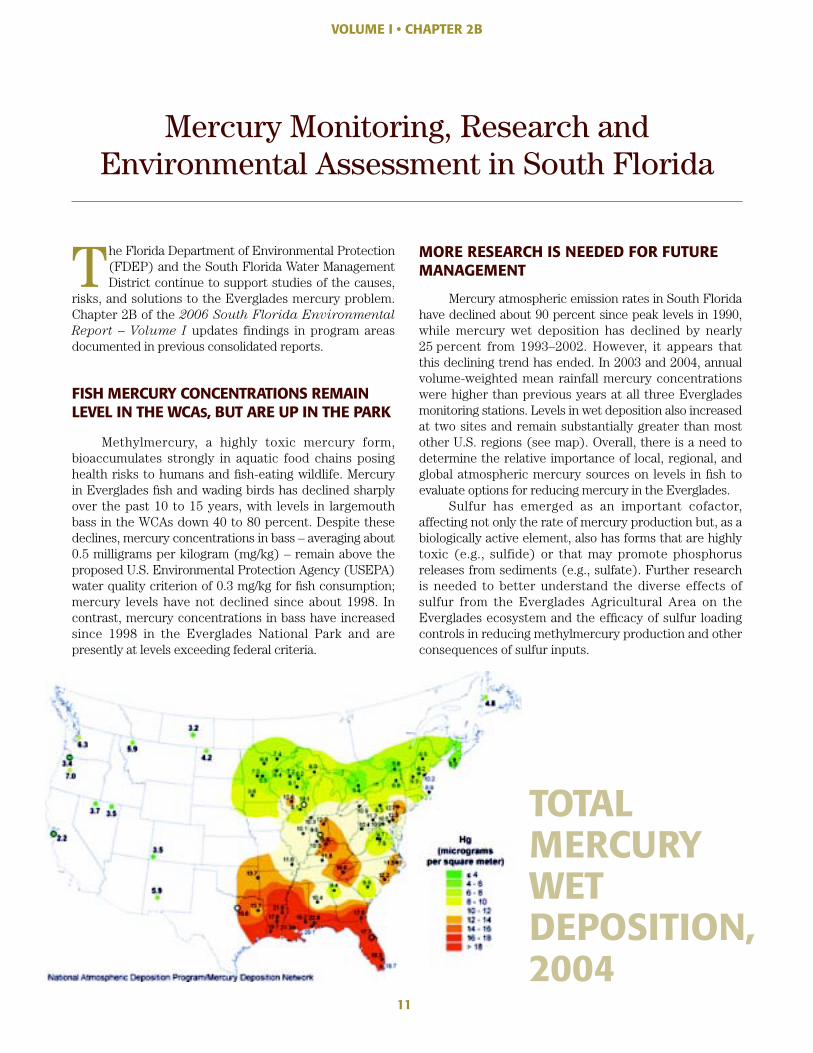
Mercury atmospheric emission rates in South Florida have declined about 90 percent since peak levels in 1990, while mercury wet deposition has declined by nearly 25 percent from 1993–2002. However, it appears that this declining trend has ended. In 2003 and 2004, annual volume-weighted mean rainfall mercury concentrations were higher than previous years at all three Everglades monitoring stations. Levels in wet deposition also increased at two sites and remain substantially greater than most other U.S. regions (see map). Overall, there is a need to determine the relative importance of local, regional, and global atmospheric mercury sources on levels in fi sh to evaluate options for reducing mercury in the Everglades.
Sulfur has emerged as an important cofactor, affecting not only the rate of mercury production but, as a biologically active element, also has forms that are highly toxic (e.g., sulfide) or that may promote phosphorus releases from sediments (e.g., sulfate). Further research is needed to better understand the diverse effects of sulfur from the Everglades Agricultural Area on the Everglades ecosystem and the effi cacy of sulfur loading controls in reducing methylmercury production and other consequences of sulfur inputs.
VOLUME I • CHAPTER 2B
TOTAL MERCURY WET DEPOSITION,2004
12
VOLUME I • CHAPTER 2C
Status of Phosphorus and Nitrogenin the Everglades Protection Area
The Everglades ecosystem evolved as a highly oligotrophic (nutrient-poor), phosphorus-limited system, with the natural fl ora and fauna adapting
to these harsh conditions in order to persist. Research has shown that relatively small additions of nutrients, especially phosphorus, can have dramatic effects on the biological conditions of the natural ecosystem. Chapter 2C of the 2006 South Florida Environmental Report – Volume
I presents an overview of the status of phosphorus and nitrogen levels in the surface waters within the Everglades Protection Area during WY2005. This chapter also provides an update on the establishment and application of a numeric phosphorus criterion for the EPA.
EXTREME CONDITIONS IMPACT PHOSPHORUS LEVELS IN WY2005
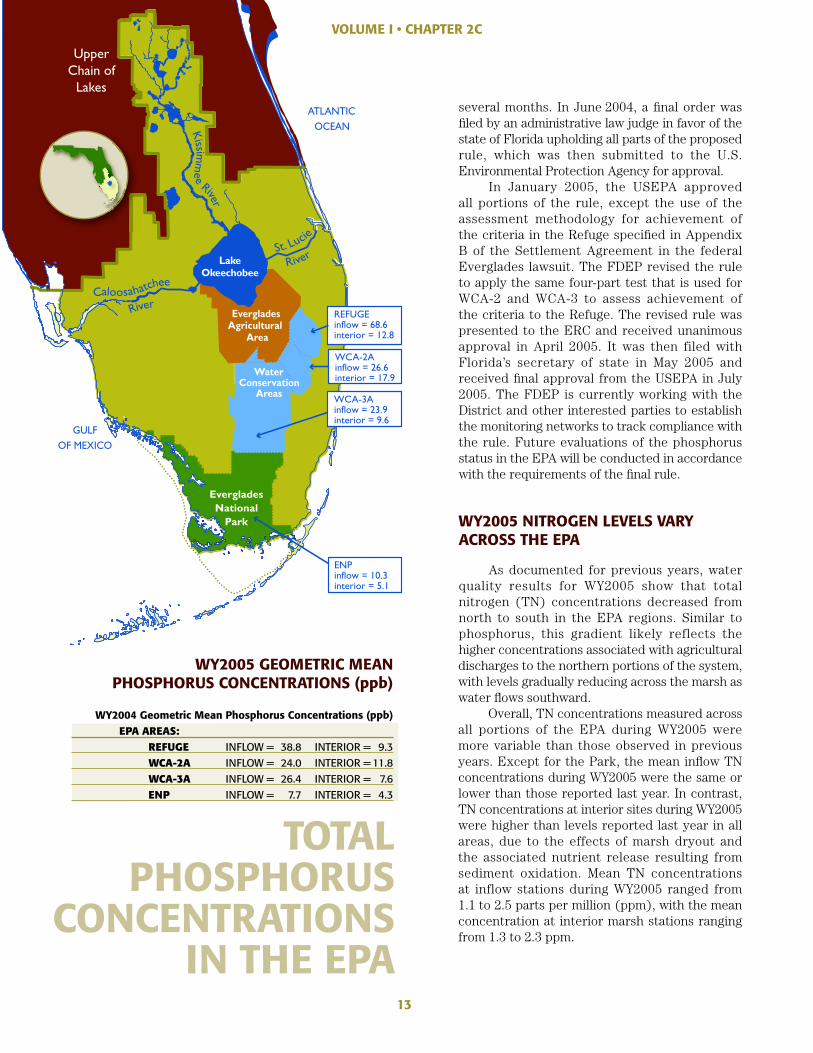
Similar to previous years, in WY2005 total phosphorus concentrations in surface water decreased from north to south in the EPA regions. As shown on the map on page 13, the highest levels were present in the infl ow to the Refuge and WCA-2, and concentrations decreased to a minimum within the Everglades National Park (Park or ENP).
TP concentrations measured across the EPA during WY2005 were strongly affected by climatic and hydrologic extremes, including both multiple hurricanes with intense rainfall, and periods of little or no rainfall, resulting in marsh dryout. As a result, annual TP concentrations measured during WY2005 were generally higher than those reported for last year, but were within the range of the historical period (WY1978–WY2003). TP concentrations at infl ow and interior marsh sites generally responded differently to external changes. TP concentrations at infl ow sites typically followed rainfall patterns in which high rainfall resulted in greater inputs of nutrient-laden stormwater runoff and elevated peaks at infl ow structures. During WY2005, the highest TP concentrations occurred from June–October 2004, corresponding to more rain received during the wet season and hurricanes Charley, Frances, and Jeanne. During periods of low rainfall, infl ow TP concentrations were generally at their lowest.
In contrast, TP concentrations at the interior marsh sites did not refl ect the peaks in infl ow concentration and exhibited a nearly opposite trend than the infl ows. During periods of high rainfall when infl ow concentrations were
maximized, the TP concentrations at interior marsh sites were generally low, likely due to dilution. Conversely, when rainfall was low for extended periods, and following marsh dryout, nutrients were released into surface waters during rainfall events. During WY2005, peak TP concentrations at interior sites generally occurred during two periods (May–June 2004 and February–March 2005), when portions of the marsh dried out and exposed sediments, followed by sufficient rainfall to transport released nutrients from the sediments. Notably, during more normal conditions, both inflow and interior TP concentrations in the EPA returned to levels similar to lower levels observed in last year. Similar trends during WY2005 were observed for soluble orthophosphate. This quick recovery suggests that the extreme conditions experienced during this water year did not result in any long-lasting impacts to the system.
During WY2005, infl ow and interior geometric mean TP concentrations exceeded levels reported in WY2004 and the historical period. The annual geometric mean TP concentration across interior marsh sites in WCA-3 and the Park remained below the phosphorus criterion of 10 parts per billion (ppb). The geometric mean concentrations for the interior marsh sites in WCA-1 and WCA-2 were slightly above the annual 11-ppb limit, due to the impacts from the unusual climatic events during WY2005. Again, these higher levels obviously reflect the extreme conditions experienced during WY2005 and are not considered to be a worsening of nutrient conditions in the marsh, or a reversal of the general decreasing concentration trend noted in previous consolidated reports.
FINAL PHOSPHORUS CRITERION RULE IS UNANIMOUSLY APPROVED
The Florida Department of Environmental Protection has used the results of extensive research to numerically interpret the existing narrative criterion, as directed by the Everglades Forever Act, to propose a total phosphorus criterion of 10 ppb for the EPA. The 10-ppb TP criterion rule was approved during the FDEP’s Environmental Regulation Commission (ERC) in July 2003. Following this approval, both environmental and agricultural interest groups filed administrative challenges, resulting in an administrative hearing over
13
several months. In June 2004, a fi nal order wasfi led by an administrative law judge in favor of thestate of Florida upholding all parts of the proposedrule, which was then submitted to the U.S.Environmental Protection Agency for approval.
In January 2005, the USEPA approvedall portions of the rule, except the use of theassessment methodology for achievement ofthe criteria in the Refuge specifi ed in AppendixB of the Settlement Agreement in the federalEverglades lawsuit. The FDEP revised the ruleto apply the same four-part test that is used forWCA-2 and WCA-3 to assess achievement ofthe criteria to the Refuge. The revised rule waspresented to the ERC and received unanimousapproval in April 2005. It was then filed withFlorida’s secretary of state in May 2005 andreceived fi nal approval from the USEPA in July2005. The FDEP is currently working with theDistrict and other interested parties to establishthe monitoring networks to track compliance withthe rule. Future evaluations of the phosphorusstatus in the EPA will be conducted in accordancewith the requirements of the fi nal rule.
WY2005 NITROGEN LEVELS VARYACROSS THE EPA
As documented for previous years, waterquality results for WY2005 show that totalnitrogen (TN) concentrations decreased fromnorth to south in the EPA regions. Similar tophosphorus, this gradient likely reflects thehigher concentrations associated with agriculturaldischarges to the northern portions of the system,with levels gradually reducing across the marsh aswater fl ows southward.
Overall, TN concentrations measured acrossall portions of the EPA during WY2005 weremore variable than those observed in previousyears. Except for the Park, the mean infl ow TNconcentrations during WY2005 were the same orlower than those reported last year. In contrast,TN concentrations at interior sites during WY2005were higher than levels reported last year in allareas, due to the effects of marsh dryout andthe associated nutrient release resulting fromsediment oxidation. Mean TN concentrationsat inflow stations during WY2005 ranged from1.1 to 2.5 parts per million (ppm), with the meanconcentration at interior marsh stations rangingfrom 1.3 to 2.3 ppm.
Caloosahatchee
River
Kissim
me
e
River
ATLANTICOCEAN
EvergladesNational
Park
St. Lucie
RiverLakeOkeechobee
UpperChain of
Lakes
AgriculturalArea
Everglades REFUGEinflow = 68.6interior = 12.8
WCA-2Ainflow = 26.6interior = 17.9
ENPinflow = 10.3interior = 5.1
WCA-3Ainflow = 23.9interior = 9.6
GULFOF MEXICO
WaterConservation
Areas
WY2005 GEOMETRIC MEANPHOSPHORUS CONCENTRATIONS (ppb)
WY2004 Geometric Mean Phosphorus Concentrations (ppb)EPA AREAS:
REFUGE INFLOW = 38.8 INTERIOR = 9.3 WCA-2A INFLOW = 24.0 INTERIOR = 11.8 WCA-3A INFLOW = 26.4 INTERIOR = 7.6 ENP INFLOW = 7.7 INTERIOR = 4.3
TOTALPHOSPHORUS
CONCENTRATIONSIN THE EPA
VOLUME I • CHAPTER 2C
14
1996 1997 1998 1999 2000 2001 2002 2003 2004 2005
WATER YEARS (MAY 1 TO APRIL 30)
PHO
SPHO
RU
S LOA
D R
EDU
CTION
(METR
IC TON
S)
Cumulative 25% Reduction Cumulative Observed Reduction
0
250
500
750
1,000
1,250
1,500
1,750
2,000
VOLUME I • CHAPTER 3
Phosphorus Controls for the BasinsTributary to the Everglades Protection Area
Chapter 3 of the 2006 South Florida Environmental
Report – Volume I updates the progress of theEverglades Program, mandated by the amended
Everglades Forever Act (EFA) to control phosphorus indischarges tributary to the Everglades Protection Area(EPA). The South Florida Water Management District mustcomply with specifi c requirements stipulated in FloridaDepartment of Environmental Protection (FDEP) permitsto assure that the District complies with the EFA. Thesepermits are the Everglades Construction Project (ECP) andnon-Everglades Construction Project (non-ECP) permits.Both permits have adopted a comprehensive approach ofcontrolling phosphorus at the source utilizing regulatory,voluntary, and educational programs.
Source controls are the foundation of the EvergladesProgram. The ECP permit requires the District toconstruct, maintain, and operate the ECP in the EvergladesAgricultural Area (EAA) and the C-139 basins (see mapon page 7), the largest tributary sources to the EPA. Italso requires the District to provide reasonable assurancethat a phosphorus source control program using BestManagement Practices (BMPs) has been implementedin the EAA and C-139 basins prior to discharging to theStormwater Treatment Areas (STAs).
The non-ECP permit regulates the operation andmaintenance of discharge structures within the District’scontrol, and that discharge into, within, or from the EPAbut are not included in the ECP. These drainage areasdischarge directly into the EPA with no downstreamtreatment through the STAs. They are known as thenon-ECP basins and have voluntary or cooperativesource control programs. The District is responsiblefor administering the non-ECP permit for eight basins,including the ACME Improvement District, North SpringsImprovement District, C-11 West, North New River Canal,Feeder Canal, L-28, Boynton Farms, and C-111 basins(see map on page 29).
In order to meet both ECP and non-ECP permitrequirements, basin-specific water quality data fortotal phosphorus (TP) collected by the District duringWY2005 is presented in this chapter. Notably, WY2005was characterized by an unprecedented active hurricaneseason, and some of the ECP and non-ECP basins were inthe direct path of hurricanes Charley, Frances, and Jeanne.Although the 2004 hurricanes did not have major effects onthe Everglades source control programs as a whole, they
did affect some water quality results. It appears that theeffects were caused primarily by localized, higher-than-average rainfall in specifi c areas.
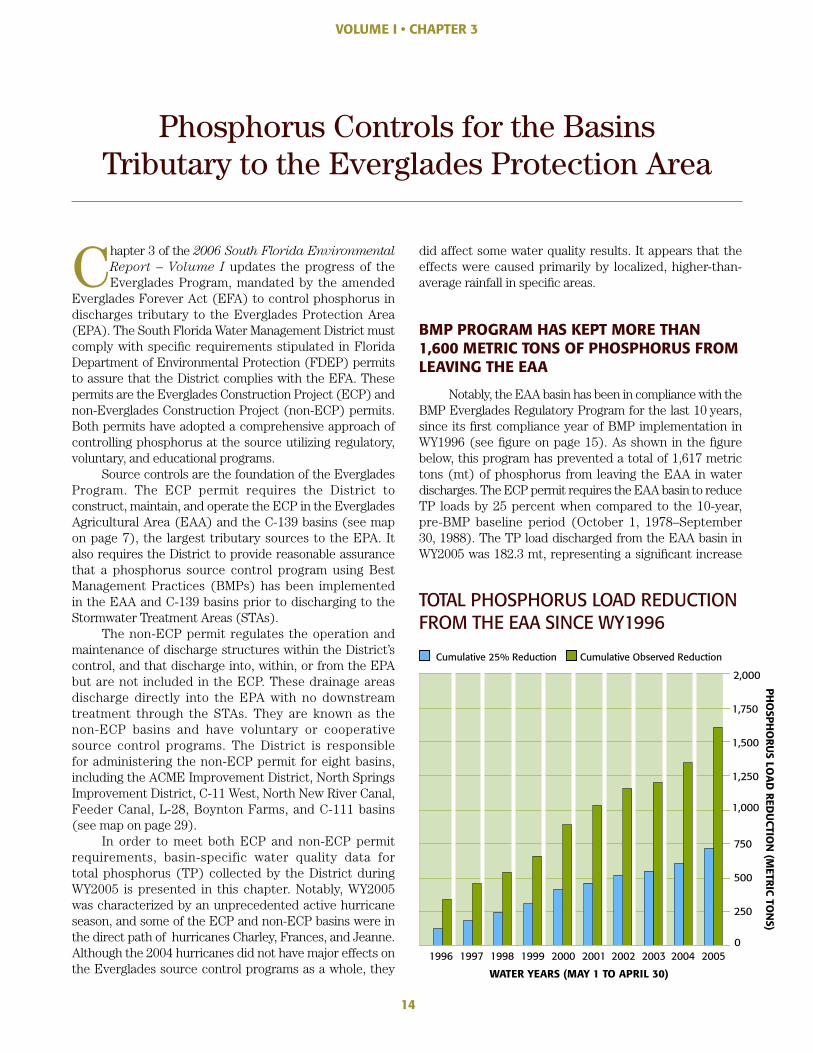
BMP PROGRAM HAS KEPT MORE THAN1,600 METRIC TONS OF PHOSPHORUS FROMLEAVING THE EAA
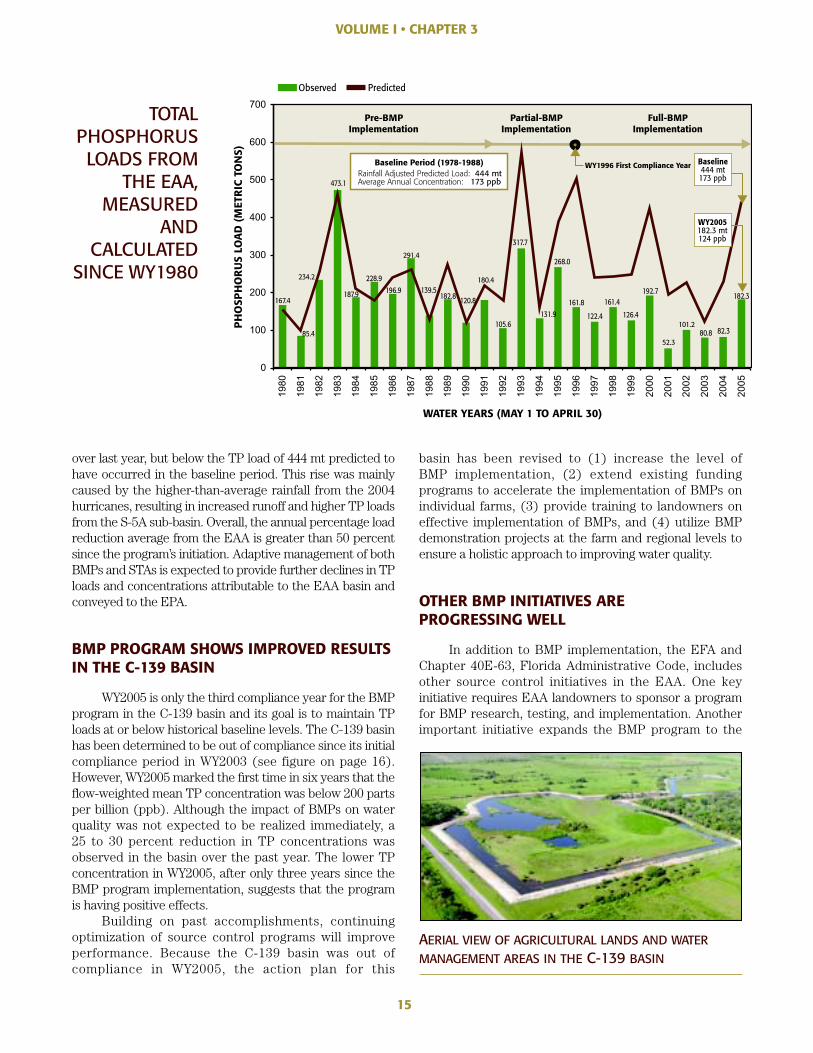
Notably, the EAA basin has been in compliance with theBMP Everglades Regulatory Program for the last 10 years,since its fi rst compliance year of BMP implementation inWY1996 (see fi gure on page 15). As shown in the fi gurebelow, this program has prevented a total of 1,617 metrictons (mt) of phosphorus from leaving the EAA in waterdischarges. The ECP permit requires the EAA basin to reduceTP loads by 25 percent when compared to the 10-year,pre-BMP baseline period (October 1, 1978–September30, 1988). The TP load discharged from the EAA basin inWY2005 was 182.3 mt, representing a signifi cant increase
TOTAL PHOSPHORUS LOAD REDUCTIONFROM THE EAA SINCE WY1996
15
over last year, but below the TP load of 444 mt predicted tohave occurred in the baseline period. This rise was mainlycaused by the higher-than-average rainfall from the 2004hurricanes, resulting in increased runoff and higher TP loadsfrom the S-5A sub-basin. Overall, the annual percentage loadreduction average from the EAA is greater than 50 percentsince the program’s initiation. Adaptive management of bothBMPs and STAs is expected to provide further declines in TPloads and concentrations attributable to the EAA basin andconveyed to the EPA.
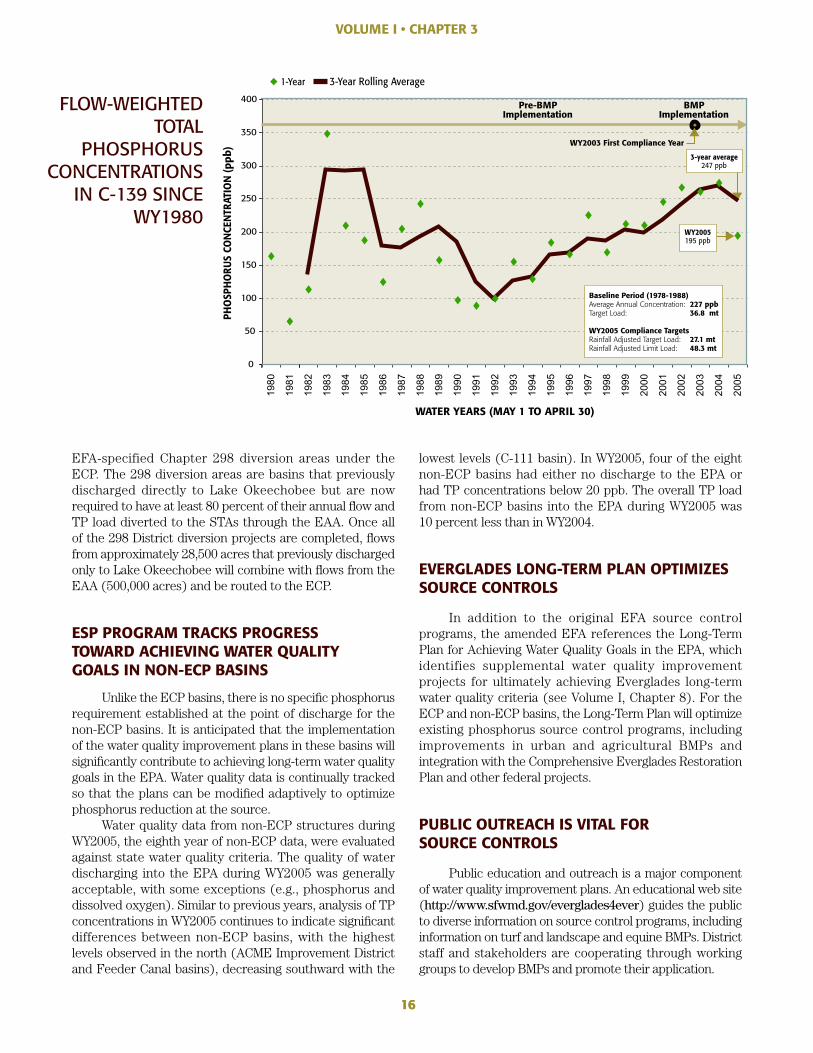
BMP PROGRAM SHOWS IMPROVED RESULTSIN THE C-139 BASIN
WY2005 is only the third compliance year for the BMPprogram in the C-139 basin and its goal is to maintain TPloads at or below historical baseline levels. The C-139 basinhas been determined to be out of compliance since its initialcompliance period in WY2003 (see figure on page 16).However, WY2005 marked the fi rst time in six years that thefl ow-weighted mean TP concentration was below 200 partsper billion (ppb). Although the impact of BMPs on waterquality was not expected to be realized immediately, a25 to 30 percent reduction in TP concentrations wasobserved in the basin over the past year. The lower TPconcentration in WY2005, after only three years since theBMP program implementation, suggests that the programis having positive effects.
Building on past accomplishments, continuingoptimization of source control programs will improveperformance. Because the C-139 basin was out ofcompliance in WY2005, the action plan for this
basin has been revised to (1) increase the level ofBMP implementation, (2) extend existing fundingprograms to accelerate the implementation of BMPs onindividual farms, (3) provide training to landowners oneffective implementation of BMPs, and (4) utilize BMPdemonstration projects at the farm and regional levels toensure a holistic approach to improving water quality.
OTHER BMP INITIATIVES AREPROGRESSING WELL
In addition to BMP implementation, the EFA andChapter 40E-63, Florida Administrative Code, includesother source control initiatives in the EAA. One keyinitiative requires EAA landowners to sponsor a programfor BMP research, testing, and implementation. Anotherimportant initiative expands the BMP program to the
VOLUME I • CHAPTER 3
Pre-BMPImplementation
Partial-BMPImplementation
Full-BMPImplementation
Baseline Period (1978-1988)Rainfall Adjusted Predicted Load: 444 mtAverage Annual Concentration: 173 ppb
WY1996 First Compliance Year
167.4
85.4
234.2 228.9
291.4
139.5182.8 120.8
180.4
105.6
317.7
131.9
268.0
161.8
122.4
161.4
126.4
192.7
52.3
101.280.8 82.3
182.3187.9 196.9
473.1
PH
OSP
HO
RU
S LO
AD
(M
ETR
IC T
ON
S)
WATER YEARS (MAY 1 TO APRIL 30)
Observed Predicted
WY2005182.3 mt124 ppb
Baseline444 mt173 ppb
TOTALPHOSPHORUSLOADS FROM
THE EAA,MEASURED
ANDCALCULATED
SINCE WY1980
AERIAL VIEW OF AGRICULTURAL LANDS AND WATERMANAGEMENT AREAS IN THE C-139 BASIN
16
EFA-specified Chapter 298 diversion areas under theECP. The 298 diversion areas are basins that previouslydischarged directly to Lake Okeechobee but are nowrequired to have at least 80 percent of their annual fl ow andTP load diverted to the STAs through the EAA. Once allof the 298 District diversion projects are completed, fl owsfrom approximately 28,500 acres that previously dischargedonly to Lake Okeechobee will combine with fl ows from theEAA (500,000 acres) and be routed to the ECP.
ESP PROGRAM TRACKS PROGRESSTOWARD ACHIEVING WATER QUALITYGOALS IN NON-ECP BASINS
Unlike the ECP basins, there is no specifi c phosphorusrequirement established at the point of discharge for thenon-ECP basins. It is anticipated that the implementationof the water quality improvement plans in these basins willsignifi cantly contribute to achieving long-term water qualitygoals in the EPA. Water quality data is continually trackedso that the plans can be modifi ed adaptively to optimizephosphorus reduction at the source.
Water quality data from non-ECP structures duringWY2005, the eighth year of non-ECP data, were evaluatedagainst state water quality criteria. The quality of waterdischarging into the EPA during WY2005 was generallyacceptable, with some exceptions (e.g., phosphorus anddissolved oxygen). Similar to previous years, analysis of TPconcentrations in WY2005 continues to indicate signifi cantdifferences between non-ECP basins, with the highestlevels observed in the north (ACME Improvement Districtand Feeder Canal basins), decreasing southward with the
lowest levels (C-111 basin). In WY2005, four of the eightnon-ECP basins had either no discharge to the EPA orhad TP concentrations below 20 ppb. The overall TP loadfrom non-ECP basins into the EPA during WY2005 was10 percent less than in WY2004.
EVERGLADES LONG-TERM PLAN OPTIMIZESSOURCE CONTROLS
In addition to the original EFA source controlprograms, the amended EFA references the Long-TermPlan for Achieving Water Quality Goals in the EPA, whichidentifies supplemental water quality improvementprojects for ultimately achieving Everglades long-termwater quality criteria (see Volume I, Chapter 8). For theECP and non-ECP basins, the Long-Term Plan will optimizeexisting phosphorus source control programs, includingimprovements in urban and agricultural BMPs andintegration with the Comprehensive Everglades RestorationPlan and other federal projects.
PUBLIC OUTREACH IS VITAL FORSOURCE CONTROLS
Public education and outreach is a major componentof water quality improvement plans. An educational web site(http://www.sfwmd.gov/everglades4ever) guides the publicto diverse information on source control programs, includinginformation on turf and landscape and equine BMPs. Districtstaff and stakeholders are cooperating through workinggroups to develop BMPs and promote their application.
Pre-BMPImplementation
BMPImplementation
WY2003 First Compliance Year
PHO
SPH
ORU
S CO
NCE
NTR
ATIO
N (p
pb)
WATER YEARS (MAY 1 TO APRIL 30)
0
50
100
150
200
250
300
350
400
3-year average247 ppb
Baseline Period (1978-1988)Average Annual Concentration: 227 ppbTarget Load: 36.8 mt
WY2005 Compliance TargetsRainfall Adjusted Target Load: 27.1 mtRainfall Adjusted Limit Load: 48.3 mt
WY2005195 ppb
1-Year 3-Year Rolling Average
FLOW-WEIGHTEDTOTAL
PHOSPHORUSCONCENTRATIONS
IN C-139 SINCEWY1980
16
VOLUME I • CHAPTER 3
17
VOLUME I • CHAPTER 4
STA Performance, Compliance and Optimization
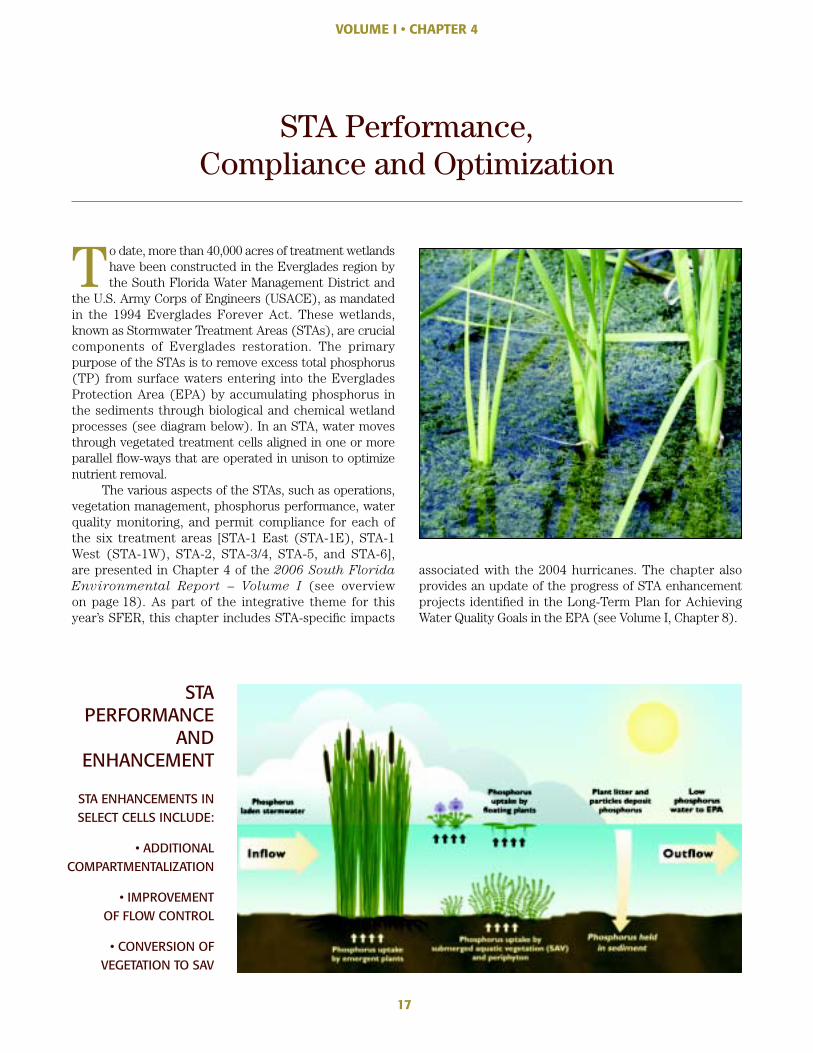
To date, more than 40,000 acres of treatment wetlands have been constructed in the Everglades region by the South Florida Water Management District and
the U.S. Army Corps of Engineers (USACE), as mandated in the 1994 Everglades Forever Act. These wetlands, known as Stormwater Treatment Areas (STAs), are crucial components of Everglades restoration. The primary purpose of the STAs is to remove excess total phosphorus (TP) from surface waters entering into the Everglades Protection Area (EPA) by accumulating phosphorus in the sediments through biological and chemical wetland processes (see diagram below). In an STA, water moves through vegetated treatment cells aligned in one or more parallel fl ow-ways that are operated in unison to optimize nutrient removal.
The various aspects of the STAs, such as operations, vegetation management, phosphorus performance, water quality monitoring, and permit compliance for each of the six treatment areas [STA-1 East (STA-1E), STA-1 West (STA-1W), STA-2, STA-3/4, STA-5, and STA-6], are presented in Chapter 4 of the 2006 South Florida
Environmental Report – Volume I (see overview on page 18). As part of the integrative theme for this year’s SFER, this chapter includes STA-specifi c impacts
associated with the 2004 hurricanes. The chapter also provides an update of the progress of STA enhancement projects identifi ed in the Long-Term Plan for Achieving Water Quality Goals in the EPA (see Volume I, Chapter 8).
STA PERFORMANCE
AND ENHANCEMENT
STA ENHANCEMENTS IN SELECT CELLS INCLUDE:
• ADDITIONAL COMPARTMENTALIZATION
• IMPROVEMENTOF FLOW CONTROL
• CONVERSION OF VEGETATION TO SAV
18
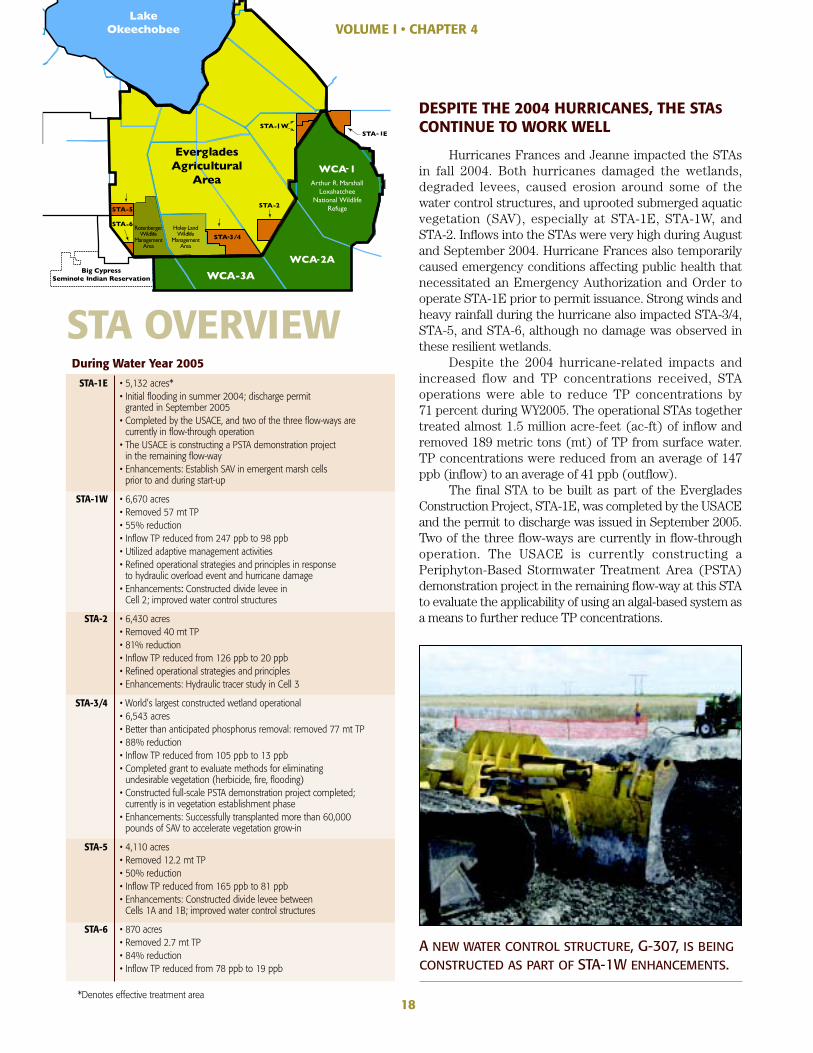
DESPITE THE 2004 HURRICANES, THE STASCONTINUE TO WORK WELL
Hurricanes Frances and Jeanne impacted the STAsin fall 2004. Both hurricanes damaged the wetlands,degraded levees, caused erosion around some of thewater control structures, and uprooted submerged aquaticvegetation (SAV), especially at STA-1E, STA-1W, andSTA-2. Infl ows into the STAs were very high during Augustand September 2004. Hurricane Frances also temporarilycaused emergency conditions affecting public health thatnecessitated an Emergency Authorization and Order tooperate STA-1E prior to permit issuance. Strong winds andheavy rainfall during the hurricane also impacted STA-3/4,STA-5, and STA-6, although no damage was observed inthese resilient wetlands.
Despite the 2004 hurricane-related impacts andincreased flow and TP concentrations received, STAoperations were able to reduce TP concentrations by71 percent during WY2005. The operational STAs togethertreated almost 1.5 million acre-feet (ac-ft) of infl ow andremoved 189 metric tons (mt) of TP from surface water.TP concentrations were reduced from an average of 147ppb (infl ow) to an average of 41 ppb (outfl ow).
The final STA to be built as part of the EvergladesConstruction Project, STA-1E, was completed by the USACEand the permit to discharge was issued in September 2005.Two of the three fl ow-ways are currently in fl ow-throughoperation. The USACE is currently constructing aPeriphyton-Based Stormwater Treatment Area (PSTA)demonstration project in the remaining fl ow-way at this STAto evaluate the applicability of using an algal-based system asa means to further reduce TP concentrations.
VOLUME I • CHAPTER 4
During Water Year 2005
STA-1E • 5,132 acres*• Initial fl ooding in summer 2004; discharge permit
granted in September 2005• Completed by the USACE, and two of the three fl ow-ways are
currently in fl ow-through operation• The USACE is constructing a PSTA demonstration project
in the remaining fl ow-way• Enhancements: Establish SAV in emergent marsh cells
prior to and during start-up
STA-1W • 6,670 acres• Removed 57 mt TP• 55% reduction• Infl ow TP reduced from 247 ppb to 98 ppb• Utilized adaptive management activities• Refi ned operational strategies and principles in response
to hydraulic overload event and hurricane damage• Enhancements: Constructed divide levee in
Cell 2; improved water control structures
STA-2 • 6,430 acres• Removed 40 mt TP• 81% reduction• Infl ow TP reduced from 126 ppb to 20 ppb• Refi ned operational strategies and principles• Enhancements: Hydraulic tracer study in Cell 3
STA-3/4 • World’s largest constructed wetland operational• 6,543 acres• Better than anticipated phosphorus removal: removed 77 mt TP• 88% reduction• Infl ow TP reduced from 105 ppb to 13 ppb• Completed grant to evaluate methods for eliminating
undesirable vegetation (herbicide, fi re, fl ooding)• Constructed full-scale PSTA demonstration project completed;
currently is in vegetation establishment phase• Enhancements: Successfully transplanted more than 60,000
pounds of SAV to accelerate vegetation grow-in
STA-5 • 4,110 acres• Removed 12.2 mt TP• 50% reduction• Infl ow TP reduced from 165 ppb to 81 ppb• Enhancements: Constructed divide levee between
Cells 1A and 1B; improved water control structures
STA-6 • 870 acres• Removed 2.7 mt TP• 84% reduction• Infl ow TP reduced from 78 ppb to 19 ppb
*Denotes effective treatment area
STA OVERVIEW
A NEW WATER CONTROL STRUCTURE, G-307, IS BEINGCONSTRUCTED AS PART OF STA-1W ENHANCEMENTS.
19
VOLUME I • CHAPTER 4
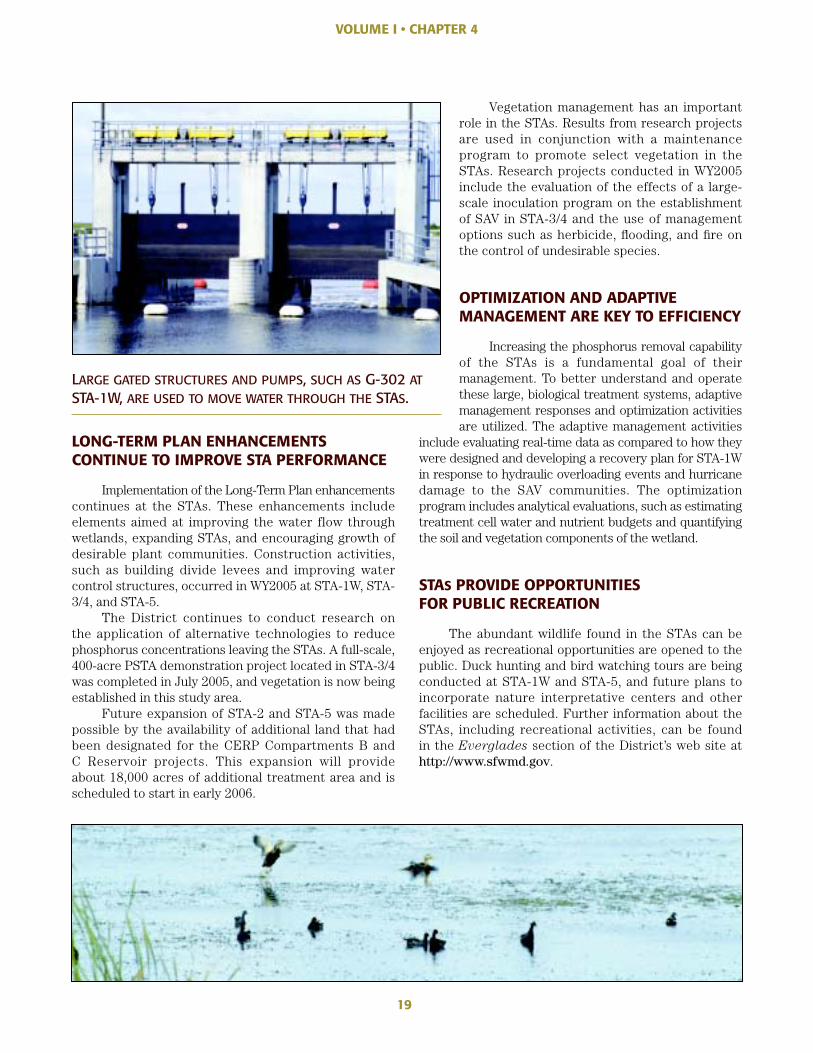
LONG-TERM PLAN ENHANCEMENTS CONTINUE TO IMPROVE STA PERFORMANCE
Implementation of the Long-Term Plan enhancements continues at the STAs. These enhancements include elements aimed at improving the water flow through wetlands, expanding STAs, and encouraging growth of desirable plant communities. Construction activities, such as building divide levees and improving water control structures, occurred in WY2005 at STA-1W, STA-3/4, and STA-5.
The District continues to conduct research on the application of alternative technologies to reduce phosphorus concentrations leaving the STAs. A full-scale, 400-acre PSTA demonstration project located in STA-3/4 was completed in July 2005, and vegetation is now being established in this study area.
Future expansion of STA-2 and STA-5 was made possible by the availability of additional land that had been designated for the CERP Compartments B and C Reservoir projects. This expansion will provide about 18,000 acres of additional treatment area and is scheduled to start in early 2006.
Vegetation management has an important role in the STAs. Results from research projects are used in conjunction with a maintenance program to promote select vegetation in the STAs. Research projects conducted in WY2005 include the evaluation of the effects of a large-scale inoculation program on the establishment of SAV in STA-3/4 and the use of management options such as herbicide, fl ooding, and fi re on the control of undesirable species.
OPTIMIZATION AND ADAPTIVE MANAGEMENT ARE KEY TO EFFICIENCY
Increasing the phosphorus removal capability of the STAs is a fundamental goal of their management. To better understand and operate these large, biological treatment systems, adaptive management responses and optimization activities are utilized. The adaptive management activities
include evaluating real-time data as compared to how they were designed and developing a recovery plan for STA-1W in response to hydraulic overloading events and hurricane damage to the SAV communities. The optimization program includes analytical evaluations, such as estimating treatment cell water and nutrient budgets and quantifying the soil and vegetation components of the wetland.
STAS PROVIDE OPPORTUNITIES FOR PUBLIC RECREATION
The abundant wildlife found in the STAs can be enjoyed as recreational opportunities are opened to the public. Duck hunting and bird watching tours are being conducted at STA-1W and STA-5, and future plans to incorporate nature interpretative centers and other facilities are scheduled. Further information about the STAs, including recreational activities, can be found in the Everglades section of the District’s web site at http://www.sfwmd.gov.
LARGE GATED STRUCTURES AND PUMPS, SUCH AS G-302 ATSTA-1W, ARE USED TO MOVE WATER THROUGH THE STAS.
20
VOLUME I • CHAPTER 5
Hydrology of the South Florida Environment
I nformation on hydrology is essential to the entire South Florida environmental restoration and water management functions of the South Florida Water
Management District. Therefore, an entire chapter in the 2006 South Florida Environmental Report – Volume
I is devoted to a detailed account of annual hydrology for the region. Chapter 5 updates hydrologic data and
analysis from the 2005 South Florida Environmental
Report with coverage on hydrology of the entire area within the District’s boundaries, providing a comprehensive overview of the South Florida hydrology in three chapter sections. The fi rst section presents an analysis on long-term temporal and spatial variation of South Florida hydrology. The second section documents the hydrologic impact of the 2004 hurricane season on South Florida and includes historical records of hurricane events on South Florida. The third section summarizes WY2005 hydrology – rainfall, potential evapotranspiration, water levels, infl ows, and outfl ows – collected during the water year for all major components of the South Florida region. In this section, hydrologic conditions in this water year were compared with the previous water year, WY2004. For comparison, historical hydrologic data also was analyzed and contrasted with the current and previous water year’s hydrology.
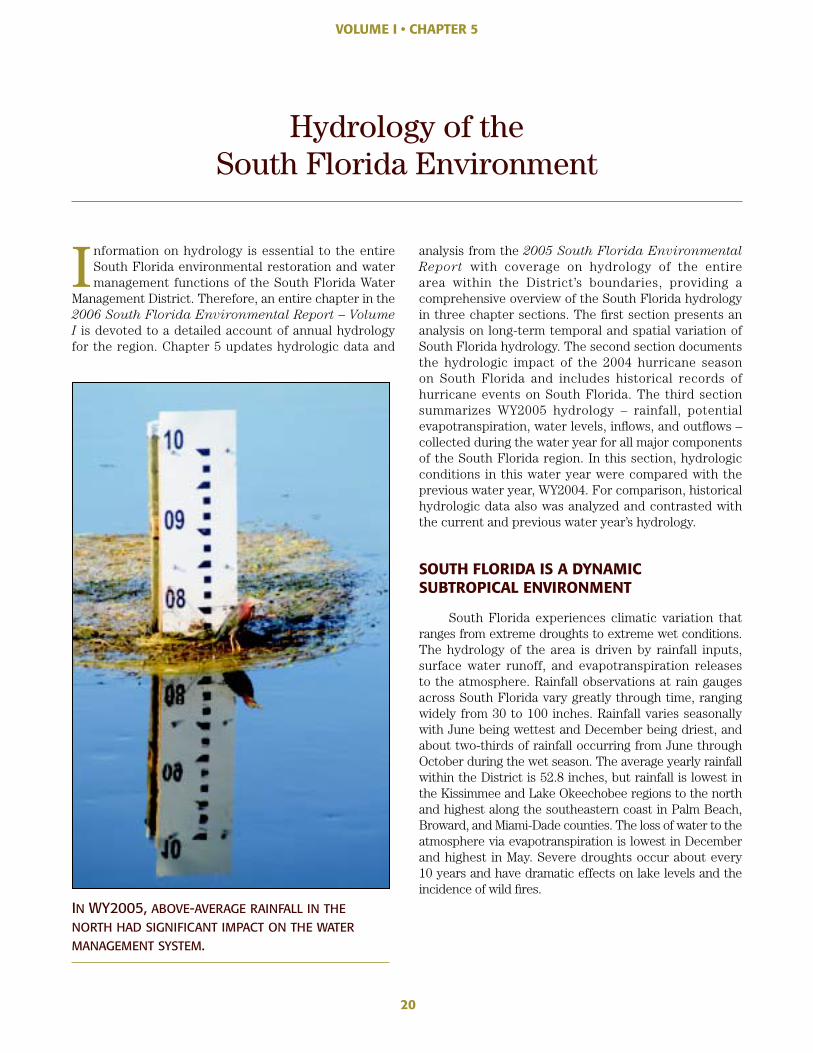
SOUTH FLORIDA IS A DYNAMIC SUBTROPICAL ENVIRONMENT
South Florida experiences climatic variation that ranges from extreme droughts to extreme wet conditions. The hydrology of the area is driven by rainfall inputs, surface water runoff, and evapotranspiration releases to the atmosphere. Rainfall observations at rain gauges across South Florida vary greatly through time, ranging widely from 30 to 100 inches. Rainfall varies seasonally with June being wettest and December being driest, and about two-thirds of rainfall occurring from June through October during the wet season. The average yearly rainfall within the District is 52.8 inches, but rainfall is lowest in the Kissimmee and Lake Okeechobee regions to the north and highest along the southeastern coast in Palm Beach, Broward, and Miami-Dade counties. The loss of water to the atmosphere via evapotranspiration is lowest in December and highest in May. Severe droughts occur about every 10 years and have dramatic effects on lake levels and the incidence of wild fi res.
IN WY2005, ABOVE-AVERAGE RAINFALL IN THENORTH HAD SIGNIFICANT IMPACT ON THE WATERMANAGEMENT SYSTEM.
TROPICAL SYSTEMS ARE COMMONOCCURRENCES IN SOUTH FLORIDA
Tropical systems, often accompanied by damagingwinds and surge, are an important source of rainfalland environmental stress for South Florida. As such,information on these systems is essential to understandingaspects of the region’s hydrology and ecology. Interestingly,Atlantic hurricanes have been observed for more than500 years. As part of the research for this year’s chapter,published historical records on tropical cyclones, storms,and hurricanes affecting Central and South Florida from1871–2004 were collected from the National HurricaneCenter and other available sources and conciselysummarized into a reference table. According to therecords, the average annual number of tropical storms andhurricanes in the North Atlantic Ocean from 1886–1994 wasabout nine per year, of which half were typically hurricanes.From 1871–1996, there were 114 hurricanes and tropicalstorms affecting peninsular Florida. On the average, Floridais impacted by about one named storm every year and ahurricane every two to three years. Narrowing down tothe District, South Florida has been affected by 91 namedstorms, including 48 hurricanes, from 1871–2005.
VOLUME I • CHAPTER 5
WY2005INFLOWS ANDOUTFLOWSINTO MAJORHYDROLOGICCOMPONENTSOF SOUTHFLORIDA
Caloosahatchee
River
Kissim
me
e Riv
ATLANTICOCEAN
EvergladesNational
Park
St. Lucie
River LakeOkeechobee
UpperChain of
Lakes
WCA-3
WCA-2
WCA-1EAA
GULFOF MEXICO
LakeKissimmee
LakeIstokpoga
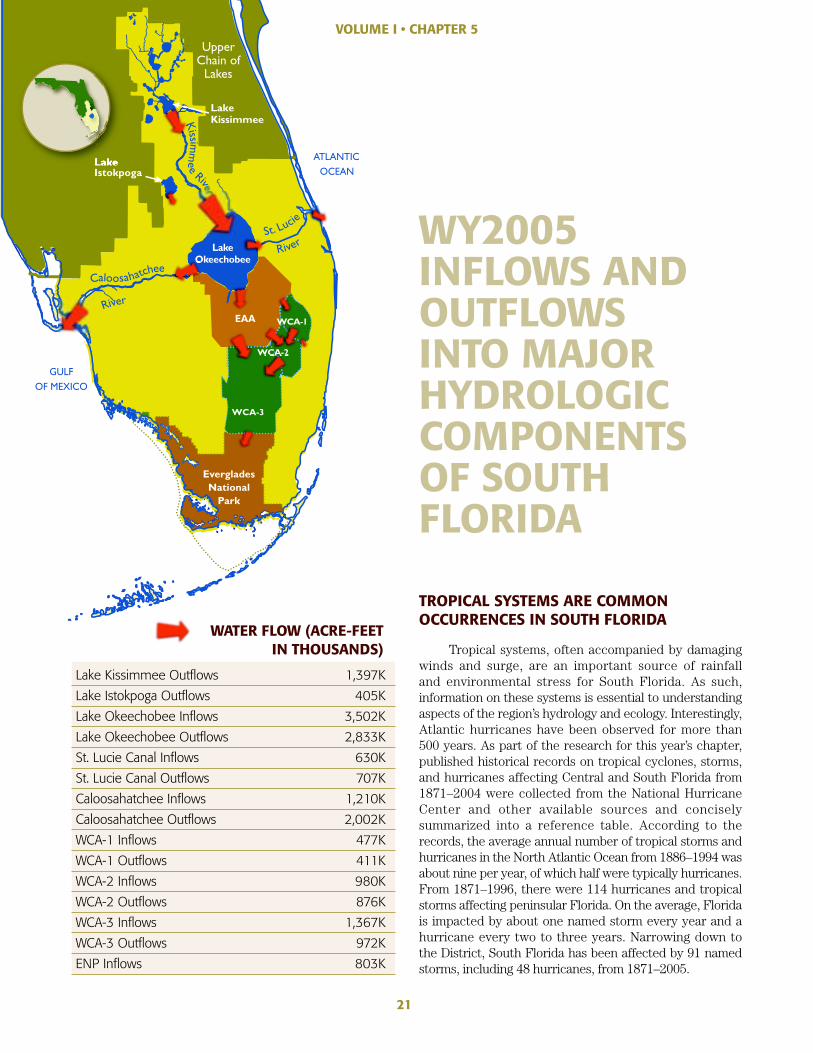
WATER FLOW (ACRE-FEETIN THOUSANDS)
Lake Kissimmee Outfl ows 1,397K
Lake Istokpoga Outfl ows 405K
Lake Okeechobee Infl ows 3,502K
Lake Okeechobee Outfl ows 2,833K
St. Lucie Canal Infl ows 630K
St. Lucie Canal Outfl ows 707K
Caloosahatchee Infl ows 1,210K
Caloosahatchee Outfl ows 2,002K
WCA-1 Infl ows 477K
WCA-1 Outfl ows 411K
WCA-2 Infl ows 980K
WCA-2 Outfl ows 876K
WCA-3 Infl ows 1,367K
WCA-3 Outfl ows 972K
ENP Infl ows 803K
21
22
VOLUME I • CHAPTER 5
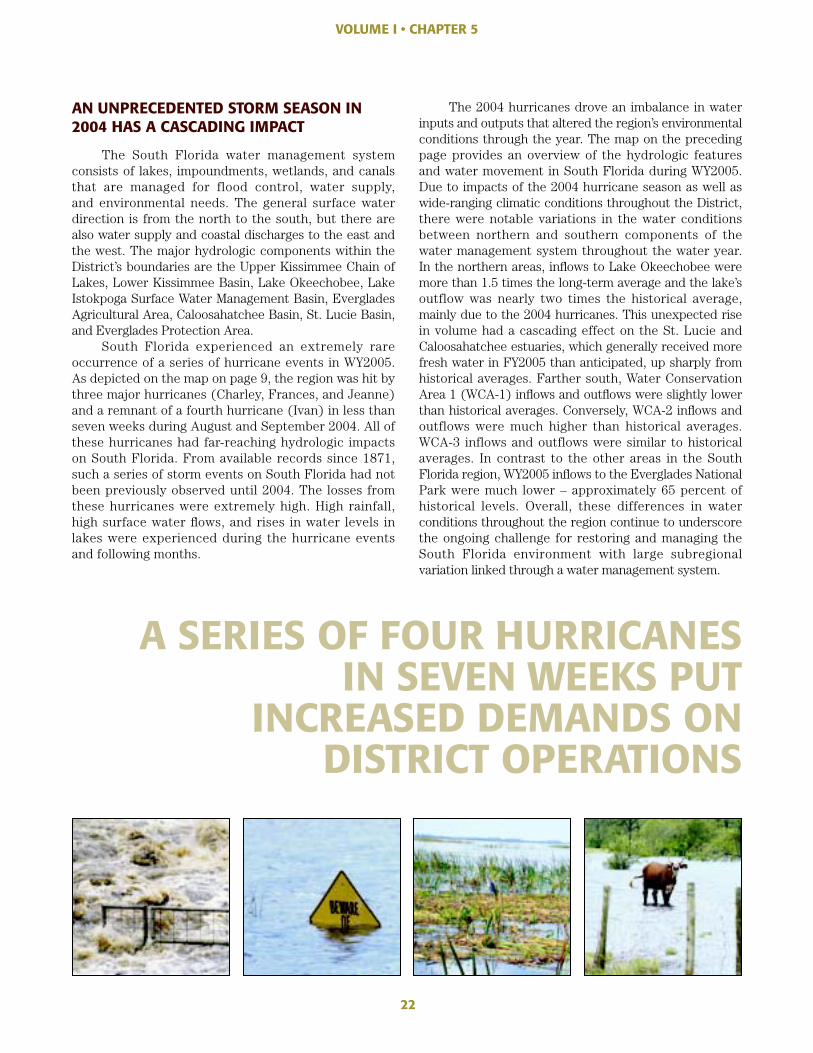
AN UNPRECEDENTED STORM SEASON IN 2004 HAS A CASCADING IMPACT
The South Florida water management system consists of lakes, impoundments, wetlands, and canals that are managed for flood control, water supply, and environmental needs. The general surface water direction is from the north to the south, but there are also water supply and coastal discharges to the east and the west. The major hydrologic components within the District’s boundaries are the Upper Kissimmee Chain of Lakes, Lower Kissimmee Basin, Lake Okeechobee, Lake Istokpoga Surface Water Management Basin, Everglades Agricultural Area, Caloosahatchee Basin, St. Lucie Basin, and Everglades Protection Area.
South Florida experienced an extremely rare occurrence of a series of hurricane events in WY2005. As depicted on the map on page 9, the region was hit by three major hurricanes (Charley, Frances, and Jeanne) and a remnant of a fourth hurricane (Ivan) in less than seven weeks during August and September 2004. All of these hurricanes had far-reaching hydrologic impacts on South Florida. From available records since 1871, such a series of storm events on South Florida had not been previously observed until 2004. The losses from these hurricanes were extremely high. High rainfall, high surface water fl ows, and rises in water levels in lakes were experienced during the hurricane events and following months.
The 2004 hurricanes drove an imbalance in water inputs and outputs that altered the region’s environmental conditions through the year. The map on the preceding page provides an overview of the hydrologic features and water movement in South Florida during WY2005. Due to impacts of the 2004 hurricane season as well as wide-ranging climatic conditions throughout the District, there were notable variations in the water conditions between northern and southern components of the water management system throughout the water year. In the northern areas, infl ows to Lake Okeechobee were more than 1.5 times the long-term average and the lake’s outflow was nearly two times the historical average, mainly due to the 2004 hurricanes. This unexpected rise in volume had a cascading effect on the St. Lucie and Caloosahatchee estuaries, which generally received more fresh water in FY2005 than anticipated, up sharply from historical averages. Farther south, Water Conservation Area 1 (WCA-1) infl ows and outfl ows were slightly lower than historical averages. Conversely, WCA-2 infl ows and outflows were much higher than historical averages. WCA-3 inflows and outflows were similar to historical averages. In contrast to the other areas in the South Florida region, WY2005 infl ows to the Everglades National Park were much lower – approximately 65 percent of historical levels. Overall, these differences in water conditions throughout the region continue to underscore the ongoing challenge for restoring and managing the South Florida environment with large subregional variation linked through a water management system.
A SERIES OF FOUR HURRICANES IN SEVEN WEEKS PUT
INCREASED DEMANDS ON DISTRICT OPERATIONS
23
VOLUME I • CHAPTER 5
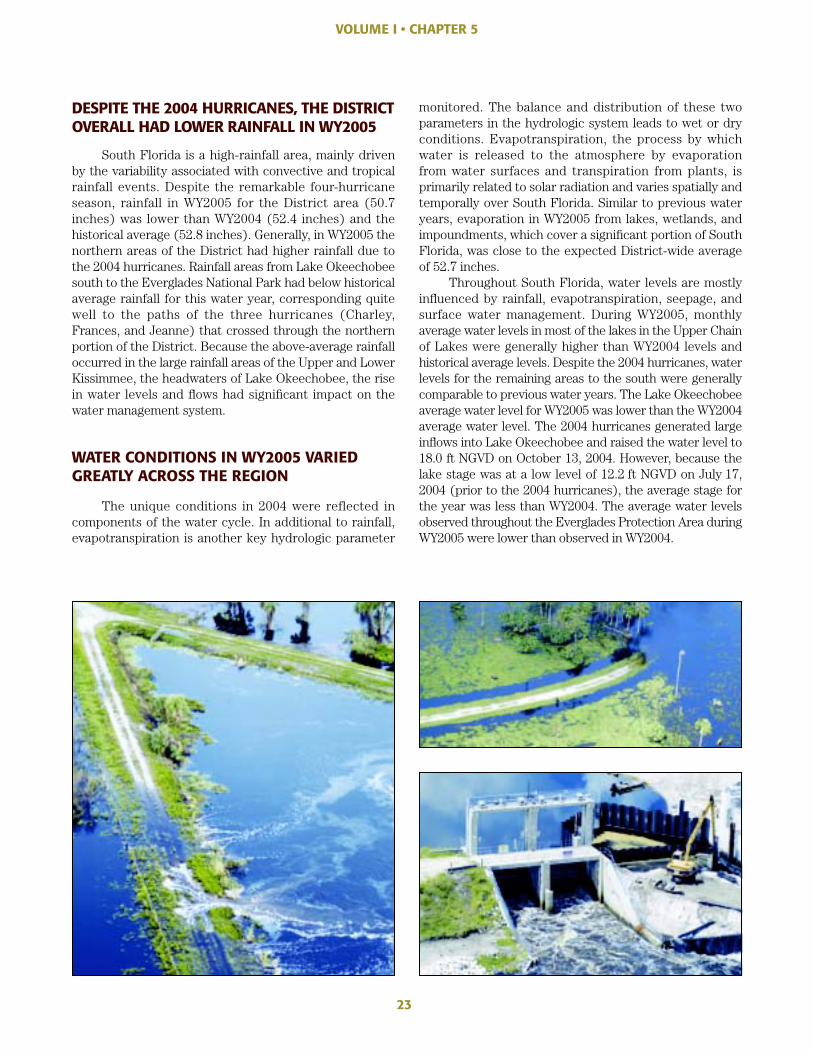
DESPITE THE 2004 HURRICANES, THE DISTRICT OVERALL HAD LOWER RAINFALL IN WY2005
South Florida is a high-rainfall area, mainly driven by the variability associated with convective and tropical rainfall events. Despite the remarkable four-hurricane season, rainfall in WY2005 for the District area (50.7 inches) was lower than WY2004 (52.4 inches) and the historical average (52.8 inches). Generally, in WY2005 the northern areas of the District had higher rainfall due to the 2004 hurricanes. Rainfall areas from Lake Okeechobee south to the Everglades National Park had below historical average rainfall for this water year, corresponding quite well to the paths of the three hurricanes (Charley, Frances, and Jeanne) that crossed through the northern portion of the District. Because the above-average rainfall occurred in the large rainfall areas of the Upper and Lower Kissimmee, the headwaters of Lake Okeechobee, the rise in water levels and fl ows had signifi cant impact on the water management system.
WATER CONDITIONS IN WY2005 VARIED GREATLY ACROSS THE REGION
The unique conditions in 2004 were reflected in components of the water cycle. In additional to rainfall, evapotranspiration is another key hydrologic parameter
monitored. The balance and distribution of these two parameters in the hydrologic system leads to wet or dry conditions. Evapotranspiration, the process by which water is released to the atmosphere by evaporation from water surfaces and transpiration from plants, is primarily related to solar radiation and varies spatially and temporally over South Florida. Similar to previous water years, evaporation in WY2005 from lakes, wetlands, and impoundments, which cover a signifi cant portion of South Florida, was close to the expected District-wide average of 52.7 inches.
Throughout South Florida, water levels are mostly infl uenced by rainfall, evapotranspiration, seepage, and surface water management. During WY2005, monthly average water levels in most of the lakes in the Upper Chain of Lakes were generally higher than WY2004 levels and historical average levels. Despite the 2004 hurricanes, water levels for the remaining areas to the south were generally comparable to previous water years. The Lake Okeechobee average water level for WY2005 was lower than the WY2004 average water level. The 2004 hurricanes generated large infl ows into Lake Okeechobee and raised the water level to 18.0 ft NGVD on October 13, 2004. However, because the lake stage was at a low level of 12.2 ft NGVD on July 17, 2004 (prior to the 2004 hurricanes), the average stage for the year was less than WY2004. The average water levels observed throughout the Everglades Protection Area during WY2005 were lower than observed in WY2004.
24
VOLUME I • CHAPTER 6
Over the last century, drainage of the Everglades has dramatically changed South Florida’s landscape. As a result of this altered hydrology, the Everglades
has been reduced to half its original size, water tables have dropped, hydroperiods have been altered, fl ows have been diverted, wetlands have been impounded, wildlife has been reduced, water quality has been degraded, and habitats have been invaded by nonindigenous plants. It is evident that several important factors – diminished extent of the Everglades and surrounding uplands, changes in the soil and topography, presence of exotic species, and the current system of canals and levees – all constitute constraints on environmental restoration to pre-drainage conditions. The challenge facing science and society is determining which key hydrologic driving forces will be restored to guide future succession in the remaining Everglades. Research efforts are essential to meet this challenge. Chapter 6 of the 2006 South Florida
Environmental Report – Volume I updates some recent ecological research programs associated with wildlife, plant, ecosystem, and landscape ecology of the Everglades Protection Area (EPA). These programs, sponsored by the South Florida Water Management District and other collaborating agencies, continues to focus on (1) characterizing the existing communities, (2) creating a baseline dataset, (3) relating patterns of distribution and abundance to hydrology, and (4) evaluating performance measures and alternatives for preservation and restoration.
RISING TREND OF WADING BIRD NESTING TAKES A TURN IN WY2005
Each year, the District and other supporting governmental agencies monitor wading bird nesting success in South Florida. The estimated number of wading bird nests in South Florida in 2005 was 31,869. This is a 41 percent decline since last year’s relatively successful season and a 54 percent decline from the record year of 2002, the best nesting year on record since the 1940s. Although the 2005 estimate is relatively high compared to the average of recent decades, it represents a sharp divergence from the general increasing trend recorded since 1999. Reduced prey availability, as a result of anthropogenic changes in hydrology, is considered the primary factor responsible for the decline in Everglades wading bird populations.
During WY2005, despite the substantially lower-than-average rainfall in each of the Everglades sub-basins, hydrologic conditions were generally higher than the average throughout most of the EPA. The inconsistency between lower-than-average rainfall and higher-than-average stage is due to two signifi cant hydrologic events. The fi rst event was an extended dry season that ended in mid-July 2004. This dry period was unusually severe due to the lack of rain in June, a month that normally contributes 10 to 12 inches of precipitation to the annual total. The second was a series of hurricanes in August and September 2004 that quickly fi lled all the District’s basins, which in turn could not be drained for an extended period due to a lack of conveyance. These extremes created unfavorable foraging habitat and resulted in an overall poor nesting season.
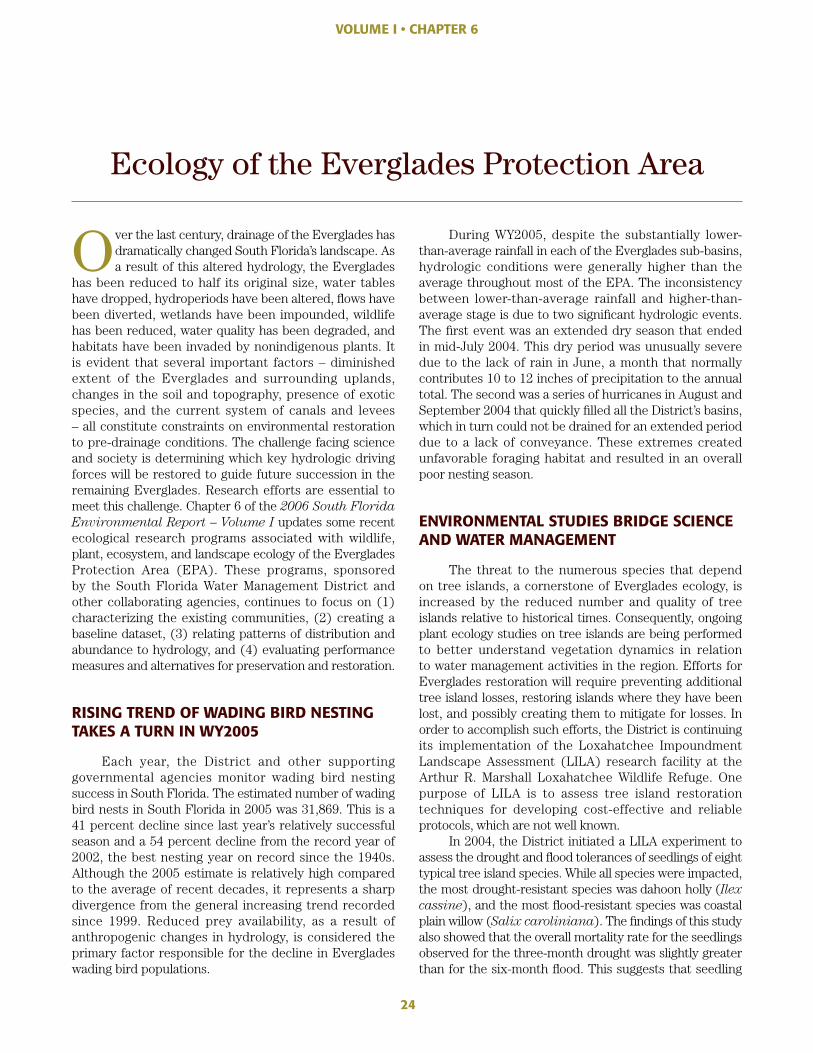
ENVIRONMENTAL STUDIES BRIDGE SCIENCE AND WATER MANAGEMENT
The threat to the numerous species that depend on tree islands, a cornerstone of Everglades ecology, is increased by the reduced number and quality of tree islands relative to historical times. Consequently, ongoing plant ecology studies on tree islands are being performed to better understand vegetation dynamics in relation to water management activities in the region. Efforts for Everglades restoration will require preventing additional tree island losses, restoring islands where they have been lost, and possibly creating them to mitigate for losses. In order to accomplish such efforts, the District is continuing its implementation of the Loxahatchee Impoundment Landscape Assessment (LILA) research facility at the Arthur R. Marshall Loxahatchee Wildlife Refuge. One purpose of LILA is to assess tree island restoration techniques for developing cost-effective and reliable protocols, which are not well known.
In 2004, the District initiated a LILA experiment to assess the drought and fl ood tolerances of seedlings of eight typical tree island species. While all species were impacted, the most drought-resistant species was dahoon holly (Ilex
cassine), and the most fl ood-resistant species was coastal plain willow (Salix caroliniana). The fi ndings of this study also showed that the overall mortality rate for the seedlings observed for the three-month drought was slightly greater than for the six-month fl ood. This suggests that seedling
Ecology of the Everglades Protection Area
25
populations may be more sensitive to drought than fl ooding. This year, the results from belowground root analysis on tree islands located on Water Conservation Area 3 (WCA-3) were also completed. Surprisingly, the tree islands with longer hydroperiods (that is, standing water present for at least seven months of the year) had a signifi cantly greater amount of live roots, which appears to be an adaptive response to the stress of flooding and reduced oxygen levels. As the District’s tree island program continues, more detailed studies will be performed to understand natural patterns on tree islands and the potential to restore islands that have been lost.
NEW RESEARCH REVEALS INFORMATION ON AQUATIC ECOSYSTEMS IN THE EVERGLADES
This year, the District initiated two new studies to evaluate how aquatic organisms interact with hydrology. The first study was conducted at the LILA facility to examine how populations of a key trophic species, the
slough crayfish (Procambarus fallax), responds to changing hydrologic conditions, and to determine the implications of this response for wading birds. The fi ndings of this study show that the crayfi sh responds to seasonal drawdown by remaining on the sawgrass ridges, which provide shelter from foraging wading birds until water levels become low. As water levels continue to decline, they move into the sloughs where they become more available to foraging birds. Understanding these types of crayfi sh responses may be essential for the successful restoration of Everglades wading bird populations.
Alarmingly, at least 36 nonindigenous fish species have become established in South Florida through anthropogenic introductions, and many species are now abundant within the canal system that surrounds and dissects the EPA. To better understand the impacts of such species on the Everglades ecosystem, the District has launched an extensive survey of exotic fi shes in the vicinity of the L-67 canal in WCA-3. Initial results suggest that at least two exotic species – and possibly a third – are now using Everglades marsh habitat for refuge or feeding. To date, little is known of the distribution and abundance of these invaders yet their potential effects on native aquatic communities, as well as wading bird populations, may be significant. Therefore, future studies will be needed to focus on the factors determining the distribution of invasive fi sh species and to reevaluate the specifi c physiological requirements that are necessary for these species to successfully adapt to regional conditions.
MAPPING TECHNIQUES CONTINUE TO DEFINE THE EVERGLADES LANDSCAPE
The District continues to map the Everglades landscape, building on existing vegetation maps created with special remote sensing and photointerpretation techniques. These techniques are important for the Water Conservation Areas, which were originally designed for fl ood control and water supply but are now recognized for the ecological value in restoring the Everglades. In addition to WCA-3, the District has recently completed the fi rst grid-based vegetation mapping projects for WCA-2A and the Rotenberger Wildlife Management Area utilizing 1:24,000 scale color infrared aerial photographs. Additionally, the District has initiated a new program to evaluate and monitor tree island hydrology by completing the construction of 31 new benchmarks in WCA-3. These benchmarks will be used to obtain reliable elevation and water depth measurements. To continue the analysis of the pre-drainage system and better understand the ecological processes that drive the Everglades, the District has also completed a new elevation contour that, when peer reviewed, will be used with the District’s Natural System Model to help set restoration performance goals.
VOLUME I • CHAPTER 6
POND APPLE SEEDLINGS WERE PLANTED IN THE LILA RESEARCH FACILITY AT THE REFUGE IN SPRING 2004.
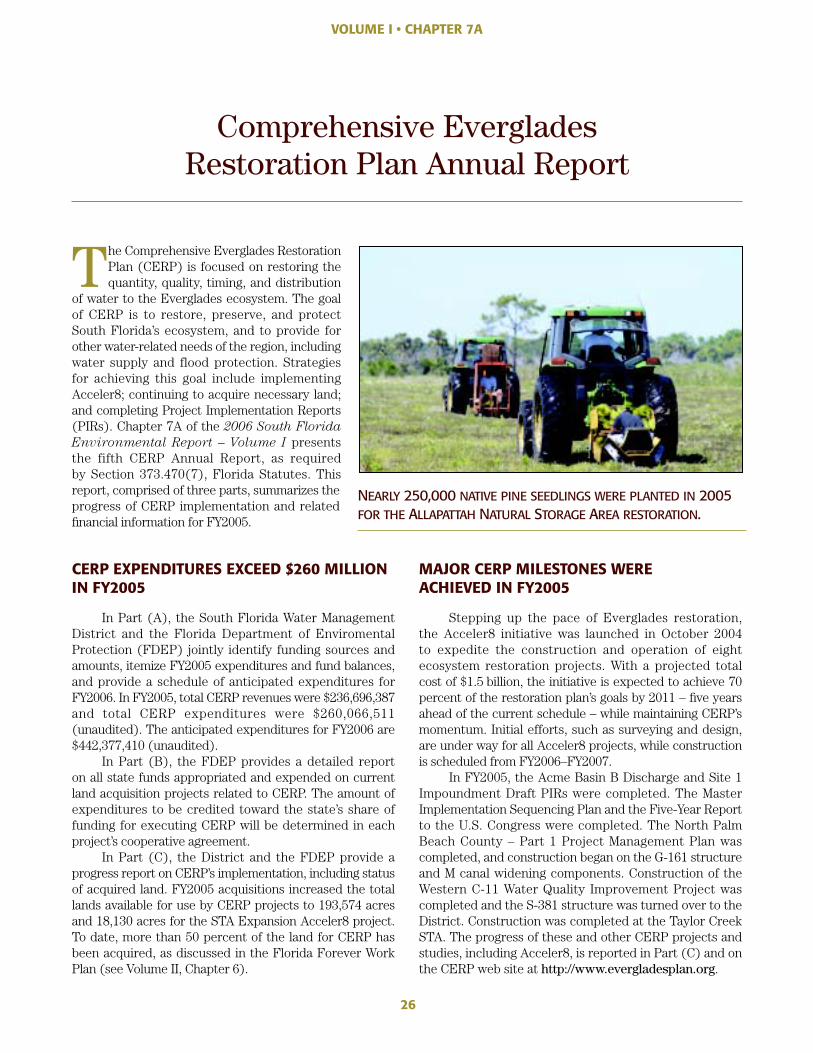
26
VOLUME I • CHAPTER 7A
Comprehensive Everglades Restoration Plan Annual Report
The Comprehensive Everglades Restoration Plan (CERP) is focused on restoring the quantity, quality, timing, and distribution
of water to the Everglades ecosystem. The goal of CERP is to restore, preserve, and protect South Florida’s ecosystem, and to provide for other water-related needs of the region, including water supply and flood protection. Strategies for achieving this goal include implementing Acceler8; continuing to acquire necessary land; and completing Project Implementation Reports (PIRs). Chapter 7A of the 2006 South Florida
Environmental Report – Volume I presentsthe fifth CERP Annual Report, as required by Section 373.470(7), Florida Statutes. This report, comprised of three parts, summarizes the progress of CERP implementation and related fi nancial information for FY2005.
CERP EXPENDITURES EXCEED $260 MILLION IN FY2005
In Part (A), the South Florida Water Management District and the Florida Department of Enviromental Protection (FDEP) jointly identify funding sources and amounts, itemize FY2005 expenditures and fund balances, and provide a schedule of anticipated expenditures for FY2006. In FY2005, total CERP revenues were $236,696,387 and total CERP expenditures were $260,066,511 (unaudited). The anticipated expenditures for FY2006 are $442,377,410 (unaudited).
In Part (B), the FDEP provides a detailed report on all state funds appropriated and expended on current land acquisition projects related to CERP. The amount of expenditures to be credited toward the state’s share of funding for executing CERP will be determined in each project’s cooperative agreement.
In Part (C), the District and the FDEP provide a progress report on CERP’s implementation, including status of acquired land. FY2005 acquisitions increased the total lands available for use by CERP projects to 193,574 acres and 18,130 acres for the STA Expansion Acceler8 project. To date, more than 50 percent of the land for CERP has been acquired, as discussed in the Florida Forever Work Plan (see Volume II, Chapter 6).
MAJOR CERP MILESTONES WERE ACHIEVED IN FY2005
Stepping up the pace of Everglades restoration, the Acceler8 initiative was launched in October 2004 to expedite the construction and operation of eight ecosystem restoration projects. With a projected total cost of $1.5 billion, the initiative is expected to achieve 70 percent of the restoration plan’s goals by 2011 – fi ve years ahead of the current schedule – while maintaining CERP’s momentum. Initial efforts, such as surveying and design, are under way for all Acceler8 projects, while construction is scheduled from FY2006–FY2007.
In FY2005, the Acme Basin B Discharge and Site 1 Impoundment Draft PIRs were completed. The Master Implementation Sequencing Plan and the Five-Year Report to the U.S. Congress were completed. The North Palm Beach County – Part 1 Project Management Plan was completed, and construction began on the G-161 structure and M canal widening components. Construction of the Western C-11 Water Quality Improvement Project was completed and the S-381 structure was turned over to the District. Construction was completed at the Taylor Creek STA. The progress of these and other CERP projects and studies, including Acceler8, is reported in Part (C) and on the CERP web site at http://www.evergladesplan.org.
NEARLY 250,000 NATIVE PINE SEEDLINGS WERE PLANTED IN 2005 FOR THE ALLAPATTAH NATURAL STORAGE AREA RESTORATION.
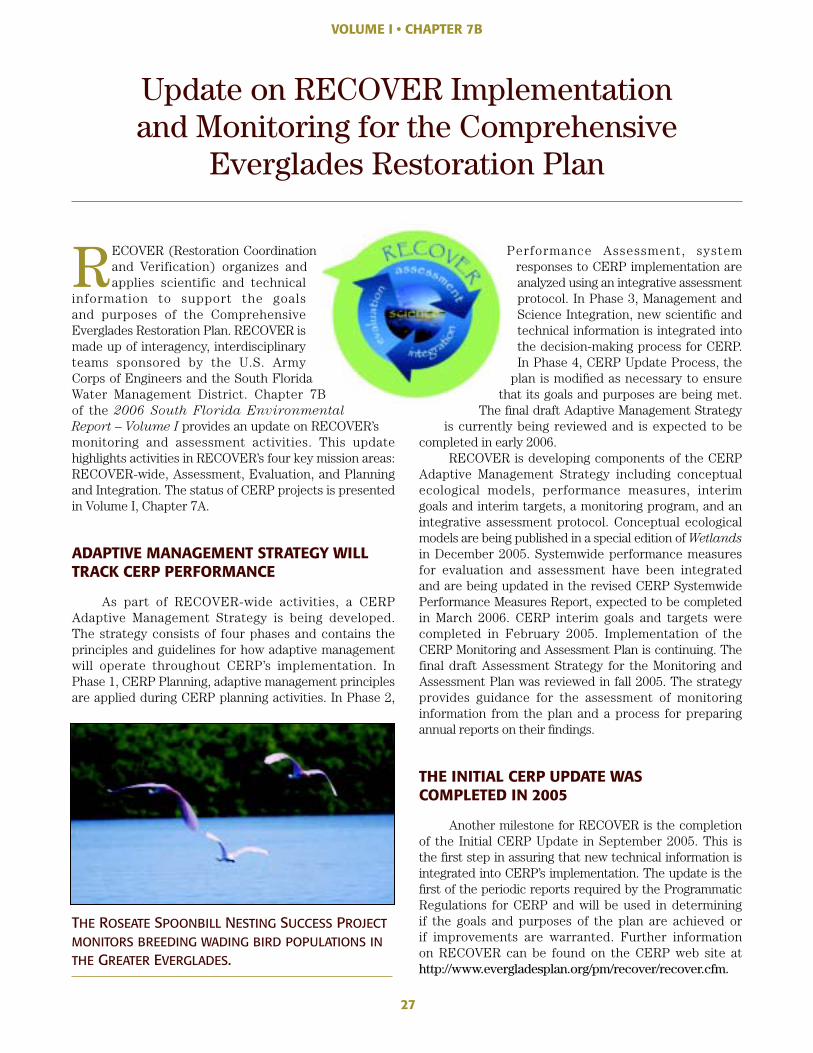
27
VOLUME I • CHAPTER 7B
RECOVER (Restoration Coordination and Verification) organizes and applies scientific and technical
information to support the goals and purposes of the Comprehensive Everglades Restoration Plan. RECOVER is made up of interagency, interdisciplinary teams sponsored by the U.S. Army Corps of Engineers and the South Florida Water Management District. Chapter 7B of the 2006 South Florida Environmental
Report – Volume I provides an update on RECOVER’s monitoring and assessment activities. This update highlights activities in RECOVER’s four key mission areas: RECOVER-wide, Assessment, Evaluation, and Planning and Integration. The status of CERP projects is presented in Volume I, Chapter 7A.
ADAPTIVE MANAGEMENT STRATEGY WILL TRACK CERP PERFORMANCE
As part of RECOVER-wide activities, a CERP Adaptive Management Strategy is being developed. The strategy consists of four phases and contains the principles and guidelines for how adaptive management will operate throughout CERP’s implementation. In Phase 1, CERP Planning, adaptive management principles are applied during CERP planning activities. In Phase 2,
Performance Assessment, system responses to CERP implementation are analyzed using an integrative assessment protocol. In Phase 3, Management and Science Integration, new scientifi c and technical information is integrated into the decision-making process for CERP. In Phase 4, CERP Update Process, the
plan is modifi ed as necessary to ensure that its goals and purposes are being met.
The fi nal draft Adaptive Management Strategy is currently being reviewed and is expected to be
completed in early 2006.RECOVER is developing components of the CERP
Adaptive Management Strategy including conceptual ecological models, performance measures, interim goals and interim targets, a monitoring program, and an integrative assessment protocol. Conceptual ecological models are being published in a special edition of Wetlands
in December 2005. Systemwide performance measures for evaluation and assessment have been integrated and are being updated in the revised CERP Systemwide Performance Measures Report, expected to be completed in March 2006. CERP interim goals and targets were completed in February 2005. Implementation of the CERP Monitoring and Assessment Plan is continuing. The final draft Assessment Strategy for the Monitoring and Assessment Plan was reviewed in fall 2005. The strategy provides guidance for the assessment of monitoring information from the plan and a process for preparing annual reports on their fi ndings.
THE INITIAL CERP UPDATE WAS COMPLETED IN 2005
Another milestone for RECOVER is the completion of the Initial CERP Update in September 2005. This is the fi rst step in assuring that new technical information is integrated into CERP’s implementation. The update is the fi rst of the periodic reports required by the Programmatic Regulations for CERP and will be used in determining if the goals and purposes of the plan are achieved or if improvements are warranted. Further information on RECOVER can be found on the CERP web site athttp://www.evergladesplan.org/pm/recover/recover.cfm.
THE ROSEATE SPOONBILL NESTING SUCCESS PROJECTMONITORS BREEDING WADING BIRD POPULATIONS INTHE GREATER EVERGLADES.
Update on RECOVER Implementation and Monitoring for the Comprehensive
Everglades Restoration Plan
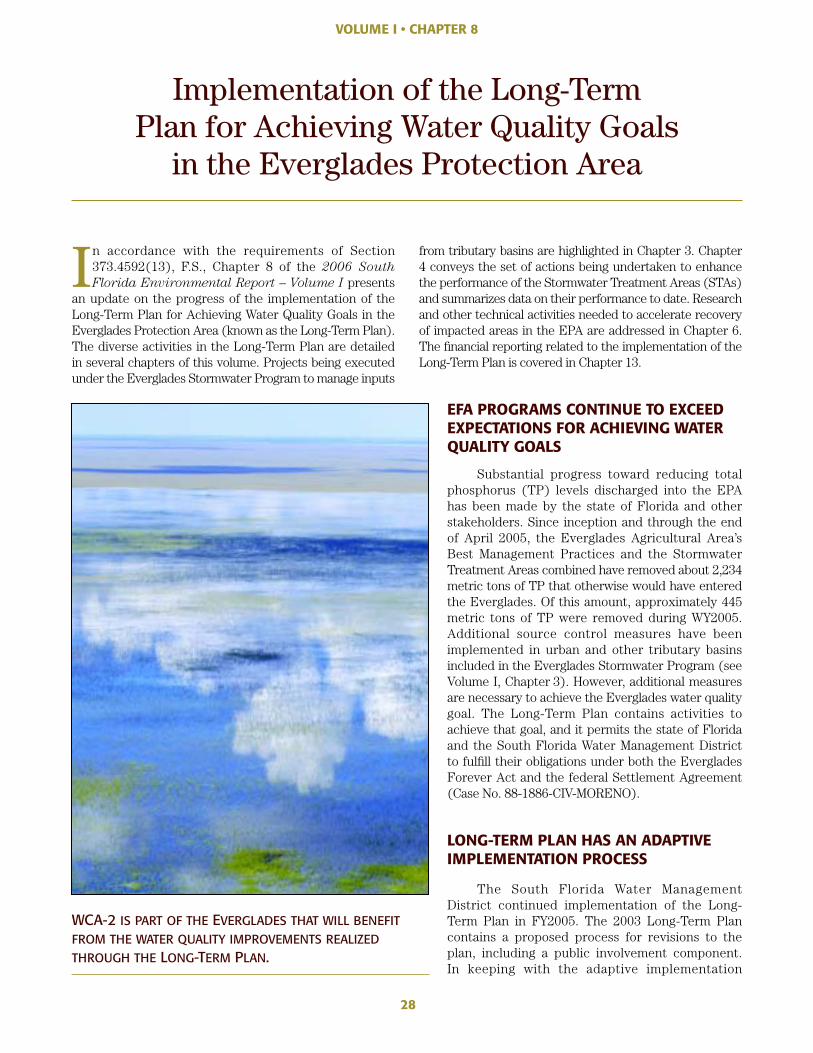
28
VOLUME I • CHAPTER 8
Implementation of the Long-Term Plan for Achieving Water Quality Goals
in the Everglades Protection Area
In accordance with the requirements of Section 373.4592(13), F.S., Chapter 8 of the 2006 South
Florida Environmental Report – Volume I presents an update on the progress of the implementation of the Long-Term Plan for Achieving Water Quality Goals in the Everglades Protection Area (known as the Long-Term Plan). The diverse activities in the Long-Term Plan are detailed in several chapters of this volume. Projects being executed under the Everglades Stormwater Program to manage inputs
from tributary basins are highlighted in Chapter 3. Chapter 4 conveys the set of actions being undertaken to enhance the performance of the Stormwater Treatment Areas (STAs) and summarizes data on their performance to date. Research and other technical activities needed to accelerate recovery of impacted areas in the EPA are addressed in Chapter 6. The fi nancial reporting related to the implementation of the Long-Term Plan is covered in Chapter 13.
EFA PROGRAMS CONTINUE TO EXCEEDEXPECTATIONS FOR ACHIEVING WATER QUALITY GOALS
Substantial progress toward reducing total phosphorus (TP) levels discharged into the EPA has been made by the state of Florida and other stakeholders. Since inception and through the end of April 2005, the Everglades Agricultural Area’s Best Management Practices and the Stormwater Treatment Areas combined have removed about 2,234 metric tons of TP that otherwise would have entered the Everglades. Of this amount, approximately 445 metric tons of TP were removed during WY2005. Additional source control measures have been implemented in urban and other tributary basins included in the Everglades Stormwater Program (see Volume I, Chapter 3). However, additional measures are necessary to achieve the Everglades water quality goal. The Long-Term Plan contains activities to achieve that goal, and it permits the state of Florida and the South Florida Water Management District to fulfi ll their obligations under both the Everglades Forever Act and the federal Settlement Agreement (Case No. 88-1886-CIV-MORENO).
LONG-TERM PLAN HAS AN ADAPTIVE IMPLEMENTATION PROCESS
The South Florida Water Management District continued implementation of the Long-Term Plan in FY2005. The 2003 Long-Term Plan contains a proposed process for revisions to the plan, including a public involvement component. In keeping with the adaptive implementation
WCA-2 IS PART OF THE EVERGLADES THAT WILL BENEFITFROM THE WATER QUALITY IMPROVEMENTS REALIZEDTHROUGH THE LONG-TERM PLAN.
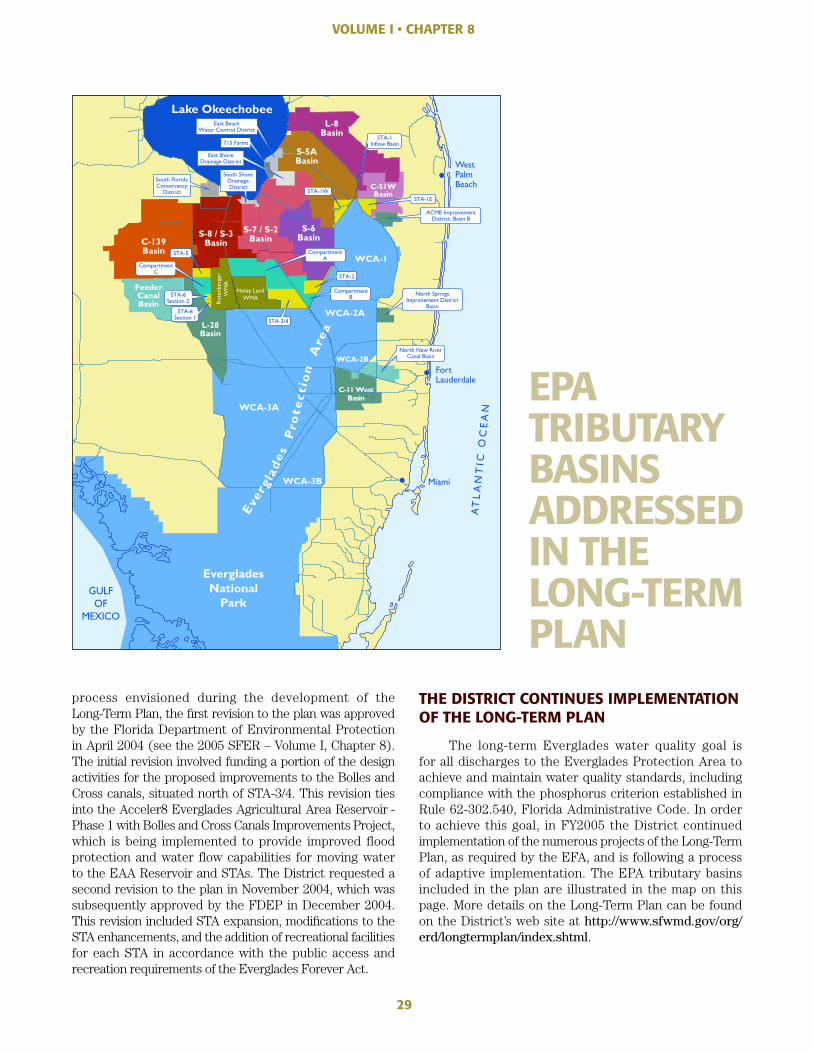
29
VOLUME I • CHAPTER 8
process envisioned during the development of theLong-Term Plan, the fi rst revision to the plan was approvedby the Florida Department of Environmental Protectionin April 2004 (see the 2005 SFER – Volume I, Chapter 8).The initial revision involved funding a portion of the designactivities for the proposed improvements to the Bolles andCross canals, situated north of STA-3/4. This revision tiesinto the Acceler8 Everglades Agricultural Area Reservoir -Phase 1 with Bolles and Cross Canals Improvements Project,which is being implemented to provide improved floodprotection and water flow capabilities for moving waterto the EAA Reservoir and STAs. The District requested asecond revision to the plan in November 2004, which wassubsequently approved by the FDEP in December 2004.This revision included STA expansion, modifi cations to theSTA enhancements, and the addition of recreational facilitiesfor each STA in accordance with the public access andrecreation requirements of the Everglades Forever Act.
THE DISTRICT CONTINUES IMPLEMENTATIONOF THE LONG-TERM PLAN
The long-term Everglades water quality goal isfor all discharges to the Everglades Protection Area toachieve and maintain water quality standards, includingcompliance with the phosphorus criterion established inRule 62-302.540, Florida Administrative Code. In orderto achieve this goal, in FY2005 the District continuedimplementation of the numerous projects of the Long-TermPlan, as required by the EFA, and is following a processof adaptive implementation. The EPA tributary basinsincluded in the plan are illustrated in the map on thispage. More details on the Long-Term Plan can be foundon the District’s web site at http://www.sfwmd.gov/org/erd/longtermplan/index.shtml.
EPATRIBUTARYBASINSADDRESSEDIN THELONG-TERMPLAN
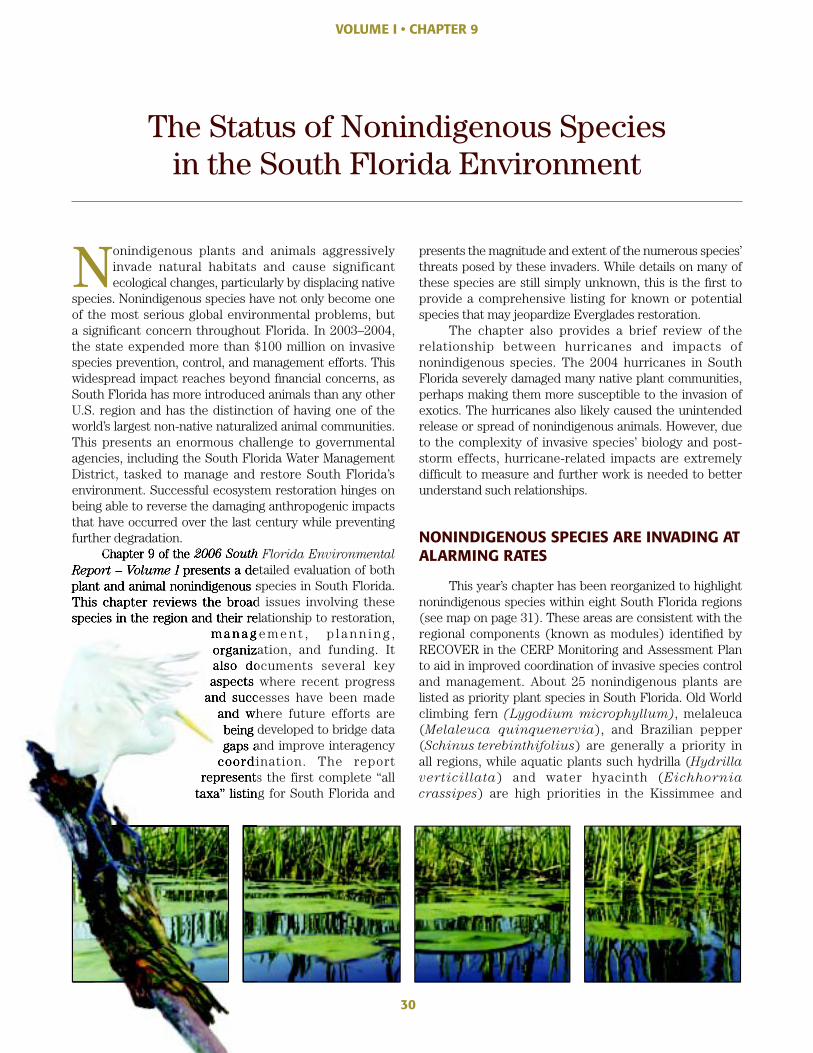
30
VOLUME I • CHAPTER 9
The Status of Nonindigenous Species in the South Florida Environment
Nonindigenous plants and animals aggressively invade natural habitats and cause significant ecological changes, particularly by displacing native
species. Nonindigenous species have not only become one of the most serious global environmental problems, but a signifi cant concern throughout Florida. In 2003–2004, the state expended more than $100 million on invasive species prevention, control, and management efforts. This widespread impact reaches beyond fi nancial concerns, as South Florida has more introduced animals than any other U.S. region and has the distinction of having one of the world’s largest non-native naturalized animal communities. This presents an enormous challenge to governmental agencies, including the South Florida Water Management District, tasked to manage and restore South Florida’s environment. Successful ecosystem restoration hinges on being able to reverse the damaging anthropogenic impacts that have occurred over the last century while preventing further degradation.
Chapter 9 of the 2006 South Florida Environmental
Report – Volume I presents a detailed evaluation of both plant and animal nonindigenous species in South Florida. This chapter reviews the broad issues involving these species in the region and their relationship to restoration,
m a n a g e m e n t , p l a n n i n g , organization, and funding. It also documents several key aspects where recent progress
and successes have been made and where future efforts are being developed to bridge data gaps and improve interagency
coordination. The report represents the first complete “all
taxa” listing for South Florida and
presents the magnitude and extent of the numerous species’ threats posed by these invaders. While details on many of these species are still simply unknown, this is the fi rst to provide a comprehensive listing for known or potential species that may jeopardize Everglades restoration.
The chapter also provides a brief review of the relationship between hurricanes and impacts of nonindigenous species. The 2004 hurricanes in South Florida severely damaged many native plant communities, perhaps making them more susceptible to the invasion of exotics. The hurricanes also likely caused the unintended release or spread of nonindigenous animals. However, due to the complexity of invasive species’ biology and post-storm effects, hurricane-related impacts are extremely diffi cult to measure and further work is needed to better understand such relationships.
NONINDIGENOUS SPECIES ARE INVADING AT ALARMING RATES
This year’s chapter has been reorganized to highlight nonindigenous species within eight South Florida regions (see map on page 31). These areas are consistent with the regional components (known as modules) identifi ed by RECOVER in the CERP Monitoring and Assessment Plan to aid in improved coordination of invasive species control and management. About 25 nonindigenous plants are listed as priority plant species in South Florida. Old World climbing fern (Lygodium microphyllum), melaleuca (Melaleuca quinquenervia), and Brazilian pepper (Schinus terebinthifolius) are generally a priority in all regions, while aquatic plants such hydrilla (Hydrilla
verticillata) and water hyacinth (Eichhornia
crassipes) are high priorities in the Kissimmee and
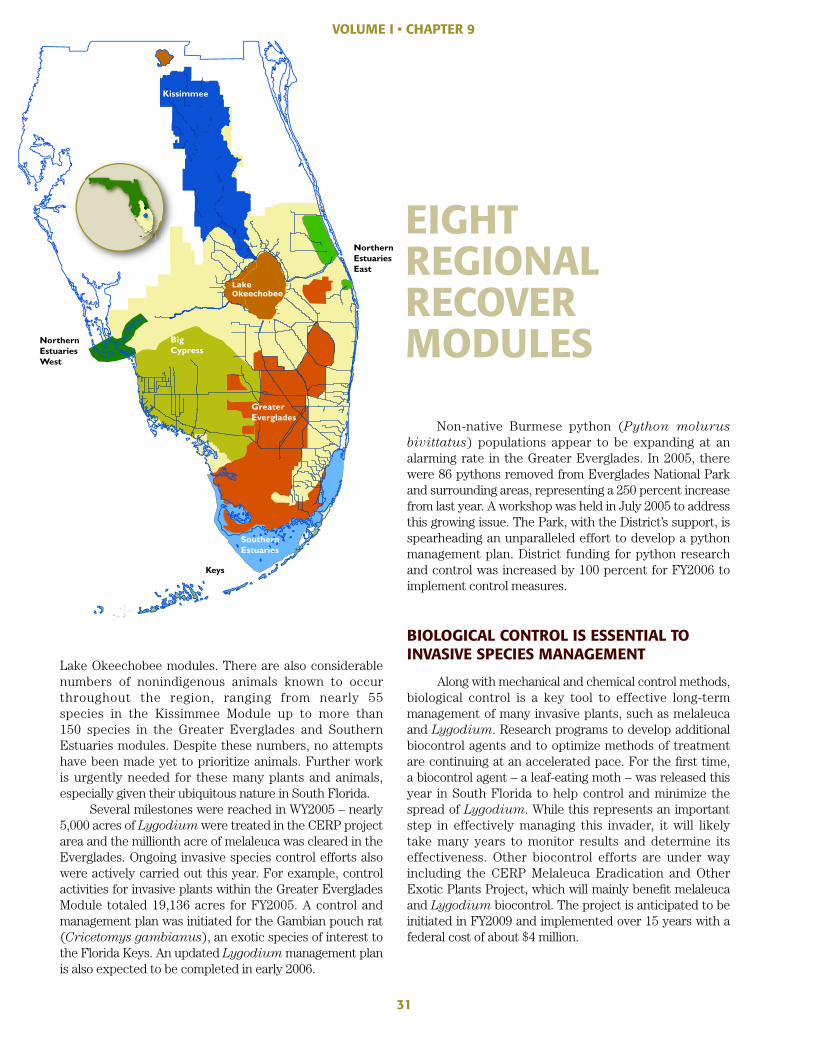
31
Lake Okeechobee modules. There are also considerablenumbers of nonindigenous animals known to occurthroughout the region, ranging from nearly 55species in the Kissimmee Module up to more than150 species in the Greater Everglades and SouthernEstuaries modules. Despite these numbers, no attemptshave been made yet to prioritize animals. Further workis urgently needed for these many plants and animals,especially given their ubiquitous nature in South Florida.
Several milestones were reached in WY2005 – nearly5,000 acres of Lygodium were treated in the CERP projectarea and the millionth acre of melaleuca was cleared in theEverglades. Ongoing invasive species control efforts alsowere actively carried out this year. For example, controlactivities for invasive plants within the Greater EvergladesModule totaled 19,136 acres for FY2005. A control andmanagement plan was initiated for the Gambian pouch rat(Cricetomys gambianus), an exotic species of interest tothe Florida Keys. An updated Lygodium management planis also expected to be completed in early 2006.
Non-native Burmese python (Python molurus
bivittatus) populations appear to be expanding at analarming rate in the Greater Everglades. In 2005, therewere 86 pythons removed from Everglades National Parkand surrounding areas, representing a 250 percent increasefrom last year. A workshop was held in July 2005 to addressthis growing issue. The Park, with the District’s support, isspearheading an unparalleled effort to develop a pythonmanagement plan. District funding for python researchand control was increased by 100 percent for FY2006 toimplement control measures.
BIOLOGICAL CONTROL IS ESSENTIAL TOINVASIVE SPECIES MANAGEMENT
Along with mechanical and chemical control methods,biological control is a key tool to effective long-termmanagement of many invasive plants, such as melaleucaand Lygodium. Research programs to develop additionalbiocontrol agents and to optimize methods of treatmentare continuing at an accelerated pace. For the fi rst time,a biocontrol agent – a leaf-eating moth – was released thisyear in South Florida to help control and minimize thespread of Lygodium. While this represents an importantstep in effectively managing this invader, it will likelytake many years to monitor results and determine itseffectiveness. Other biocontrol efforts are under wayincluding the CERP Melaleuca Eradication and OtherExotic Plants Project, which will mainly benefi t melaleucaand Lygodium biocontrol. The project is anticipated to beinitiated in FY2009 and implemented over 15 years with afederal cost of about $4 million.
VOLUME I • CHAPTER 9
EIGHTREGIONALRECOVERMODULES
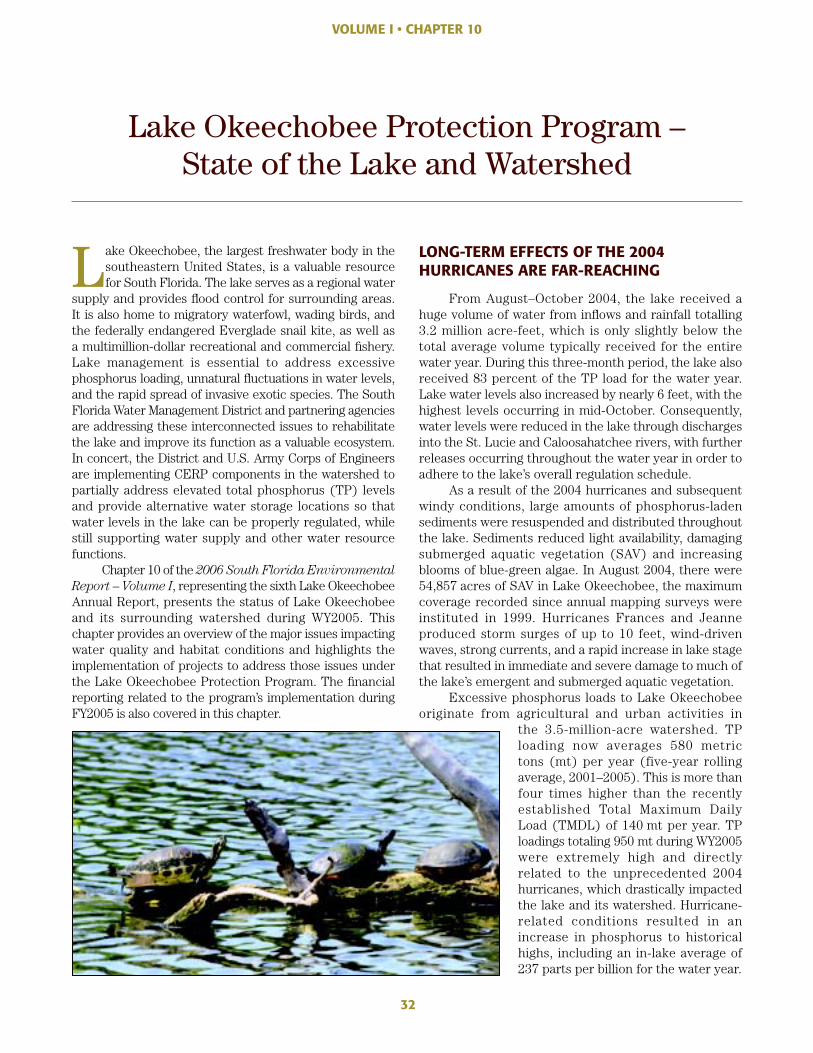
32
VOLUME I • CHAPTER 10
Lake Okeechobee Protection Program – State of the Lake and Watershed
Lake Okeechobee, the largest freshwater body in the southeastern United States, is a valuable resource for South Florida. The lake serves as a regional water
supply and provides fl ood control for surrounding areas. It is also home to migratory waterfowl, wading birds, and the federally endangered Everglade snail kite, as well as a multimillion-dollar recreational and commercial fi shery. Lake management is essential to address excessive phosphorus loading, unnatural fl uctuations in water levels, and the rapid spread of invasive exotic species. The South Florida Water Management District and partnering agencies are addressing these interconnected issues to rehabilitate the lake and improve its function as a valuable ecosystem. In concert, the District and U.S. Army Corps of Engineers are implementing CERP components in the watershed to partially address elevated total phosphorus (TP) levels and provide alternative water storage locations so that water levels in the lake can be properly regulated, while still supporting water supply and other water resource functions.
Chapter 10 of the 2006 South Florida Environmental
Report – Volume I, representing the sixth Lake Okeechobee Annual Report, presents the status of Lake Okeechobee and its surrounding watershed during WY2005. This chapter provides an overview of the major issues impacting water quality and habitat conditions and highlights the implementation of projects to address those issues under the Lake Okeechobee Protection Program. The fi nancial reporting related to the program’s implementation during FY2005 is also covered in this chapter.
LONG-TERM EFFECTS OF THE 2004 HURRICANES ARE FAR-REACHING
From August–October 2004, the lake received a huge volume of water from infl ows and rainfall totalling 3.2 million acre-feet, which is only slightly below the total average volume typically received for the entire water year. During this three-month period, the lake also received 83 percent of the TP load for the water year. Lake water levels also increased by nearly 6 feet, with the highest levels occurring in mid-October. Consequently, water levels were reduced in the lake through discharges into the St. Lucie and Caloosahatchee rivers, with further releases occurring throughout the water year in order to adhere to the lake’s overall regulation schedule.
As a result of the 2004 hurricanes and subsequent windy conditions, large amounts of phosphorus-laden sediments were resuspended and distributed throughout the lake. Sediments reduced light availability, damaging submerged aquatic vegetation (SAV) and increasing blooms of blue-green algae. In August 2004, there were 54,857 acres of SAV in Lake Okeechobee, the maximum coverage recorded since annual mapping surveys were instituted in 1999. Hurricanes Frances and Jeanne produced storm surges of up to 10 feet, wind-driven waves, strong currents, and a rapid increase in lake stage that resulted in immediate and severe damage to much of the lake’s emergent and submerged aquatic vegetation.
Excessive phosphorus loads to Lake Okeechobee originate from agricultural and urban activities in
the 3.5-million-acre watershed. TP loading now averages 580 metric tons (mt) per year (five-year rolling average, 2001–2005). This is more than four times higher than the recently established Total Maximum Daily Load (TMDL) of 140 mt per year. TP loadings totaling 950 mt during WY2005 were extremely high and directly related to the unprecedented 2004 hurricanes, which drastically impacted the lake and its watershed. Hurricane-related conditions resulted in an increase in phosphorus to historical highs, including an in-lake average of 237 parts per billion for the water year.
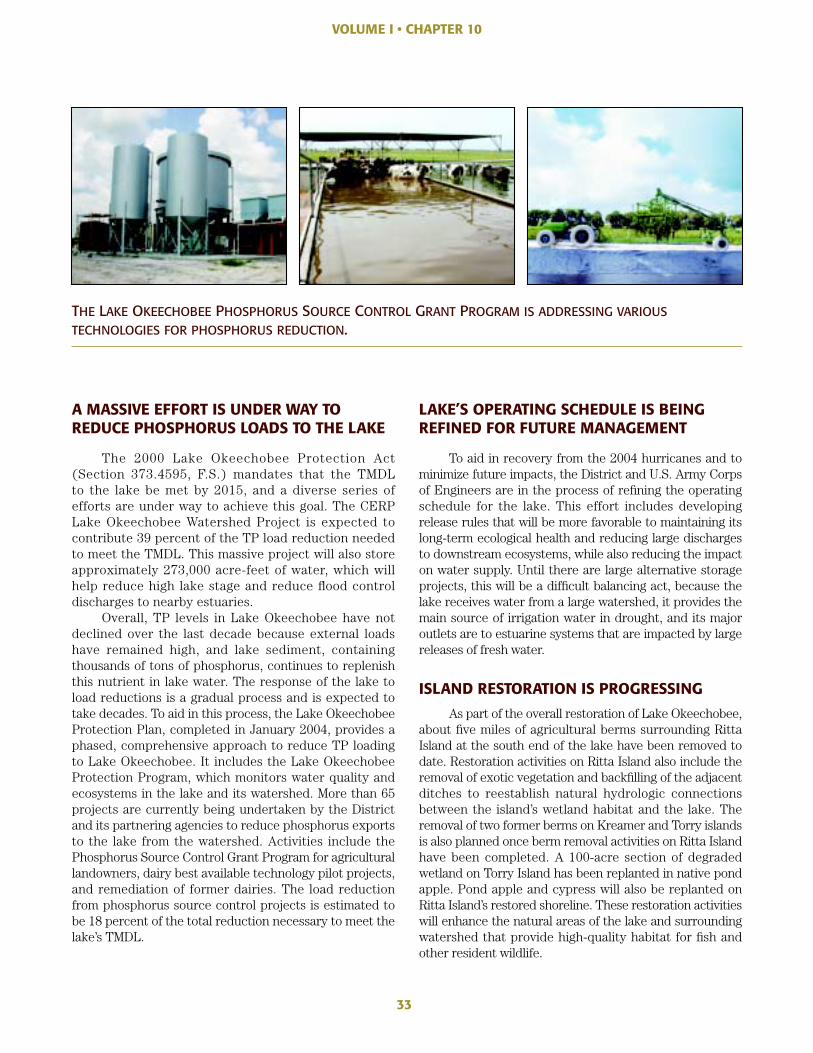
33
VOLUME I • CHAPTER 10
A MASSIVE EFFORT IS UNDER WAY TO REDUCE PHOSPHORUS LOADS TO THE LAKE
The 2000 Lake Okeechobee Protection Act (Section 373.4595, F.S.) mandates that the TMDL to the lake be met by 2015, and a diverse series of efforts are under way to achieve this goal. The CERP Lake Okeechobee Watershed Project is expected to contribute 39 percent of the TP load reduction needed to meet the TMDL. This massive project will also store approximately 273,000 acre-feet of water, which will help reduce high lake stage and reduce fl ood control discharges to nearby estuaries.
Overall, TP levels in Lake Okeechobee have not declined over the last decade because external loads have remained high, and lake sediment, containing thousands of tons of phosphorus, continues to replenish this nutrient in lake water. The response of the lake to load reductions is a gradual process and is expected to take decades. To aid in this process, the Lake Okeechobee Protection Plan, completed in January 2004, provides a phased, comprehensive approach to reduce TP loading to Lake Okeechobee. It includes the Lake Okeechobee Protection Program, which monitors water quality and ecosystems in the lake and its watershed. More than 65 projects are currently being undertaken by the District and its partnering agencies to reduce phosphorus exports to the lake from the watershed. Activities include the Phosphorus Source Control Grant Program for agricultural landowners, dairy best available technology pilot projects, and remediation of former dairies. The load reduction from phosphorus source control projects is estimated to be 18 percent of the total reduction necessary to meet the lake’s TMDL.
LAKE’S OPERATING SCHEDULE IS BEING REFINED FOR FUTURE MANAGEMENT
To aid in recovery from the 2004 hurricanes and to minimize future impacts, the District and U.S. Army Corps of Engineers are in the process of refi ning the operating schedule for the lake. This effort includes developing release rules that will be more favorable to maintaining its long-term ecological health and reducing large discharges to downstream ecosystems, while also reducing the impact on water supply. Until there are large alternative storage projects, this will be a diffi cult balancing act, because the lake receives water from a large watershed, it provides the main source of irrigation water in drought, and its major outlets are to estuarine systems that are impacted by large releases of fresh water.
ISLAND RESTORATION IS PROGRESSING
As part of the overall restoration of Lake Okeechobee, about fi ve miles of agricultural berms surrounding Ritta Island at the south end of the lake have been removed to date. Restoration activities on Ritta Island also include the removal of exotic vegetation and backfi lling of the adjacent ditches to reestablish natural hydrologic connections between the island’s wetland habitat and the lake. The removal of two former berms on Kreamer and Torry islands is also planned once berm removal activities on Ritta Island have been completed. A 100-acre section of degraded wetland on Torry Island has been replanted in native pond apple. Pond apple and cypress will also be replanted on Ritta Island’s restored shoreline. These restoration activities will enhance the natural areas of the lake and surrounding watershed that provide high-quality habitat for fi sh and other resident wildlife.
THE LAKE OKEECHOBEE PHOSPHORUS SOURCE CONTROL GRANT PROGRAM IS ADDRESSING VARIOUSTECHNOLOGIES FOR PHOSPHORUS REDUCTION.
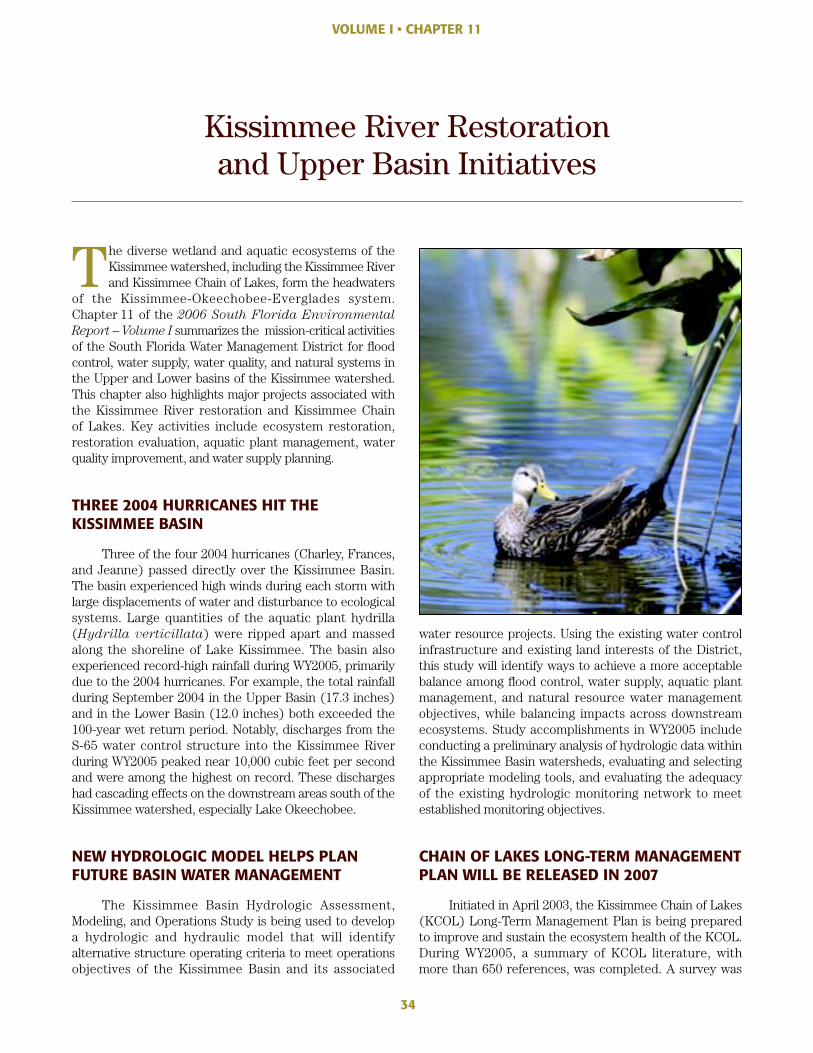
34
VOLUME I • CHAPTER 11
Kissimmee River Restoration and Upper Basin Initiatives
The diverse wetland and aquatic ecosystems of the Kissimmee watershed, including the Kissimmee River and Kissimmee Chain of Lakes, form the headwaters
of the Kissimmee-Okeechobee-Everglades system. Chapter 11 of the 2006 South Florida Environmental
Report – Volume I summarizes the mission-critical activities of the South Florida Water Management District for fl ood control, water supply, water quality, and natural systems in the Upper and Lower basins of the Kissimmee watershed. This chapter also highlights major projects associated with the Kissimmee River restoration and Kissimmee Chain of Lakes. Key activities include ecosystem restoration, restoration evaluation, aquatic plant management, water quality improvement, and water supply planning.
THREE 2004 HURRICANES HIT THE KISSIMMEE BASIN
Three of the four 2004 hurricanes (Charley, Frances, and Jeanne) passed directly over the Kissimmee Basin. The basin experienced high winds during each storm with large displacements of water and disturbance to ecological systems. Large quantities of the aquatic plant hydrilla (Hydrilla verticillata) were ripped apart and massed along the shoreline of Lake Kissimmee. The basin also experienced record-high rainfall during WY2005, primarily due to the 2004 hurricanes. For example, the total rainfall during September 2004 in the Upper Basin (17.3 inches) and in the Lower Basin (12.0 inches) both exceeded the 100-year wet return period. Notably, discharges from the S-65 water control structure into the Kissimmee River during WY2005 peaked near 10,000 cubic feet per second and were among the highest on record. These discharges had cascading effects on the downstream areas south of the Kissimmee watershed, especially Lake Okeechobee.
NEW HYDROLOGIC MODEL HELPS PLAN FUTURE BASIN WATER MANAGEMENT
The Kissimmee Basin Hydrologic Assessment, Modeling, and Operations Study is being used to develop a hydrologic and hydraulic model that will identify alternative structure operating criteria to meet operations objectives of the Kissimmee Basin and its associated
water resource projects. Using the existing water control infrastructure and existing land interests of the District, this study will identify ways to achieve a more acceptable balance among fl ood control, water supply, aquatic plant management, and natural resource water management objectives, while balancing impacts across downstream ecosystems. Study accomplishments in WY2005 include conducting a preliminary analysis of hydrologic data within the Kissimmee Basin watersheds, evaluating and selecting appropriate modeling tools, and evaluating the adequacy of the existing hydrologic monitoring network to meet established monitoring objectives.
CHAIN OF LAKES LONG-TERM MANAGEMENT PLAN WILL BE RELEASED IN 2007
Initiated in April 2003, the Kissimmee Chain of Lakes (KCOL) Long-Term Management Plan is being prepared to improve and sustain the ecosystem health of the KCOL. During WY2005, a summary of KCOL literature, with more than 650 references, was completed. A survey was
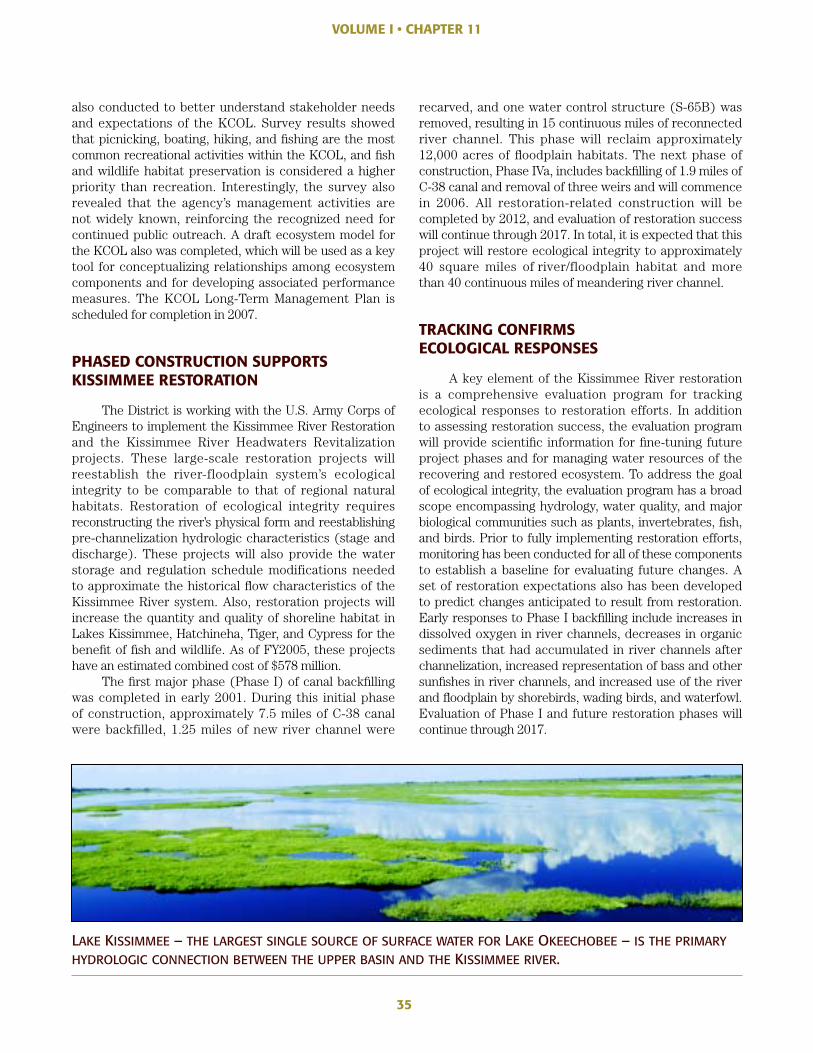
35
VOLUME I • CHAPTER 11
also conducted to better understand stakeholder needs and expectations of the KCOL. Survey results showed that picnicking, boating, hiking, and fi shing are the most common recreational activities within the KCOL, and fi sh and wildlife habitat preservation is considered a higher priority than recreation. Interestingly, the survey also revealed that the agency’s management activities are not widely known, reinforcing the recognized need for continued public outreach. A draft ecosystem model for the KCOL also was completed, which will be used as a key tool for conceptualizing relationships among ecosystem components and for developing associated performance measures. The KCOL Long-Term Management Plan is scheduled for completion in 2007.
PHASED CONSTRUCTION SUPPORTS KISSIMMEE RESTORATION
The District is working with the U.S. Army Corps of Engineers to implement the Kissimmee River Restoration and the Kissimmee River Headwaters Revitalization projects. These large-scale restoration projects will reestablish the river-floodplain system’s ecological integrity to be comparable to that of regional natural habitats. Restoration of ecological integrity requires reconstructing the river’s physical form and reestablishing pre-channelization hydrologic characteristics (stage and discharge). These projects will also provide the water storage and regulation schedule modifications needed to approximate the historical fl ow characteristics of the Kissimmee River system. Also, restoration projects will increase the quantity and quality of shoreline habitat in Lakes Kissimmee, Hatchineha, Tiger, and Cypress for the benefi t of fi sh and wildlife. As of FY2005, these projects have an estimated combined cost of $578 million.
The fi rst major phase (Phase I) of canal backfi lling was completed in early 2001. During this initial phase of construction, approximately 7.5 miles of C-38 canal were backfilled, 1.25 miles of new river channel were
recarved, and one water control structure (S-65B) was removed, resulting in 15 continuous miles of reconnected river channel. This phase will reclaim approximately 12,000 acres of fl oodplain habitats. The next phase of construction, Phase IVa, includes backfi lling of 1.9 miles of C-38 canal and removal of three weirs and will commence in 2006. All restoration-related construction will be completed by 2012, and evaluation of restoration success will continue through 2017. In total, it is expected that this project will restore ecological integrity to approximately 40 square miles of river/floodplain habitat and more than 40 continuous miles of meandering river channel.
TRACKING CONFIRMSECOLOGICAL RESPONSES
A key element of the Kissimmee River restoration is a comprehensive evaluation program for tracking ecological responses to restoration efforts. In addition to assessing restoration success, the evaluation program will provide scientifi c information for fi ne-tuning future project phases and for managing water resources of the recovering and restored ecosystem. To address the goal of ecological integrity, the evaluation program has a broad scope encompassing hydrology, water quality, and major biological communities such as plants, invertebrates, fi sh, and birds. Prior to fully implementing restoration efforts, monitoring has been conducted for all of these components to establish a baseline for evaluating future changes. A set of restoration expectations also has been developed to predict changes anticipated to result from restoration. Early responses to Phase I backfi lling include increases in dissolved oxygen in river channels, decreases in organic sediments that had accumulated in river channels after channelization, increased representation of bass and other sunfi shes in river channels, and increased use of the river and fl oodplain by shorebirds, wading birds, and waterfowl. Evaluation of Phase I and future restoration phases will continue through 2017.
LAKE KISSIMMEE – THE LARGEST SINGLE SOURCE OF SURFACE WATER FOR LAKE OKEECHOBEE – IS THE PRIMARYHYDROLOGIC CONNECTION BETWEEN THE UPPER BASIN AND THE KISSIMMEE RIVER.
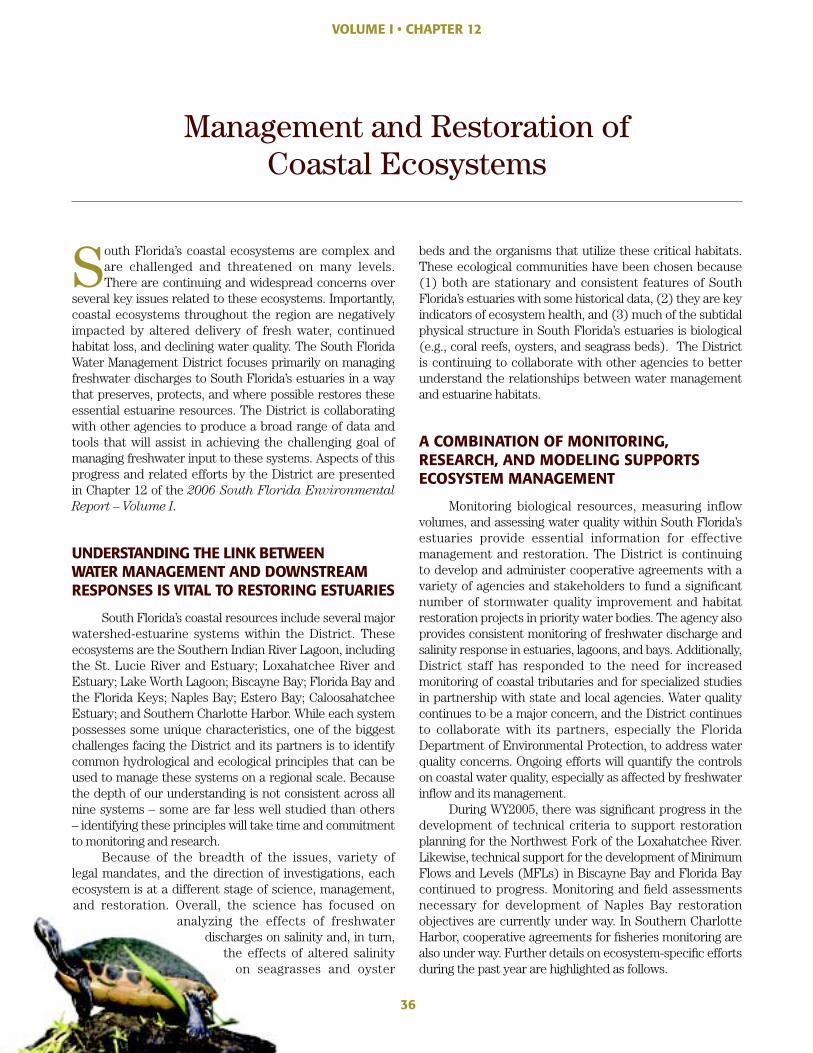
36
VOLUME I • CHAPTER 12
Management and Restoration of Coastal Ecosystems
South Florida’s coastal ecosystems are complex and are challenged and threatened on many levels. There are continuing and widespread concerns over
several key issues related to these ecosystems. Importantly, coastal ecosystems throughout the region are negatively impacted by altered delivery of fresh water, continued habitat loss, and declining water quality. The South Florida Water Management District focuses primarily on managing freshwater discharges to South Florida’s estuaries in a way that preserves, protects, and where possible restores these essential estuarine resources. The District is collaborating with other agencies to produce a broad range of data and tools that will assist in achieving the challenging goal of managing freshwater input to these systems. Aspects of this progress and related efforts by the District are presented in Chapter 12 of the 2006 South Florida Environmental
Report – Volume I.
UNDERSTANDING THE LINK BETWEEN WATER MANAGEMENT AND DOWNSTREAM RESPONSES IS VITAL TO RESTORING ESTUARIES
South Florida’s coastal resources include several major watershed-estuarine systems within the District. These ecosystems are the Southern Indian River Lagoon, including the St. Lucie River and Estuary; Loxahatchee River and Estuary; Lake Worth Lagoon; Biscayne Bay; Florida Bay and the Florida Keys; Naples Bay; Estero Bay; Caloosahatchee Estuary; and Southern Charlotte Harbor. While each system possesses some unique characteristics, one of the biggest challenges facing the District and its partners is to identify common hydrological and ecological principles that can be used to manage these systems on a regional scale. Because the depth of our understanding is not consistent across all nine systems – some are far less well studied than others – identifying these principles will take time and commitment to monitoring and research.
Because of the breadth of the issues, variety of legal mandates, and the direction of investigations, each ecosystem is at a different stage of science, management, and restoration. Overall, the science has focused on
analyzing the effects of freshwater discharges on salinity and, in turn,
the effects of altered salinity on seagrasses and oyster
beds and the organisms that utilize these critical habitats. These ecological communities have been chosen because (1) both are stationary and consistent features of South Florida’s estuaries with some historical data, (2) they are key indicators of ecosystem health, and (3) much of the subtidal physical structure in South Florida’s estuaries is biological (e.g., coral reefs, oysters, and seagrass beds). The District is continuing to collaborate with other agencies to better understand the relationships between water management and estuarine habitats.
A COMBINATION OF MONITORING, RESEARCH, AND MODELING SUPPORTS ECOSYSTEM MANAGEMENT
Monitoring biological resources, measuring inflow volumes, and assessing water quality within South Florida’s estuaries provide essential information for effective management and restoration. The District is continuing to develop and administer cooperative agreements with a variety of agencies and stakeholders to fund a signifi cant number of stormwater quality improvement and habitat restoration projects in priority water bodies. The agency also provides consistent monitoring of freshwater discharge and salinity response in estuaries, lagoons, and bays. Additionally, District staff has responded to the need for increased monitoring of coastal tributaries and for specialized studies in partnership with state and local agencies. Water quality continues to be a major concern, and the District continues to collaborate with its partners, especially the Florida Department of Environmental Protection, to address water quality concerns. Ongoing efforts will quantify the controls on coastal water quality, especially as affected by freshwater infl ow and its management.
During WY2005, there was signifi cant progress in the development of technical criteria to support restoration planning for the Northwest Fork of the Loxahatchee River. Likewise, technical support for the development of Minimum Flows and Levels (MFLs) in Biscayne Bay and Florida Bay continued to progress. Monitoring and fi eld assessments necessary for development of Naples Bay restoration objectives are currently under way. In Southern Charlotte Harbor, cooperative agreements for fi sheries monitoring are also under way. Further details on ecosystem-specifi c efforts during the past year are highlighted as follows.
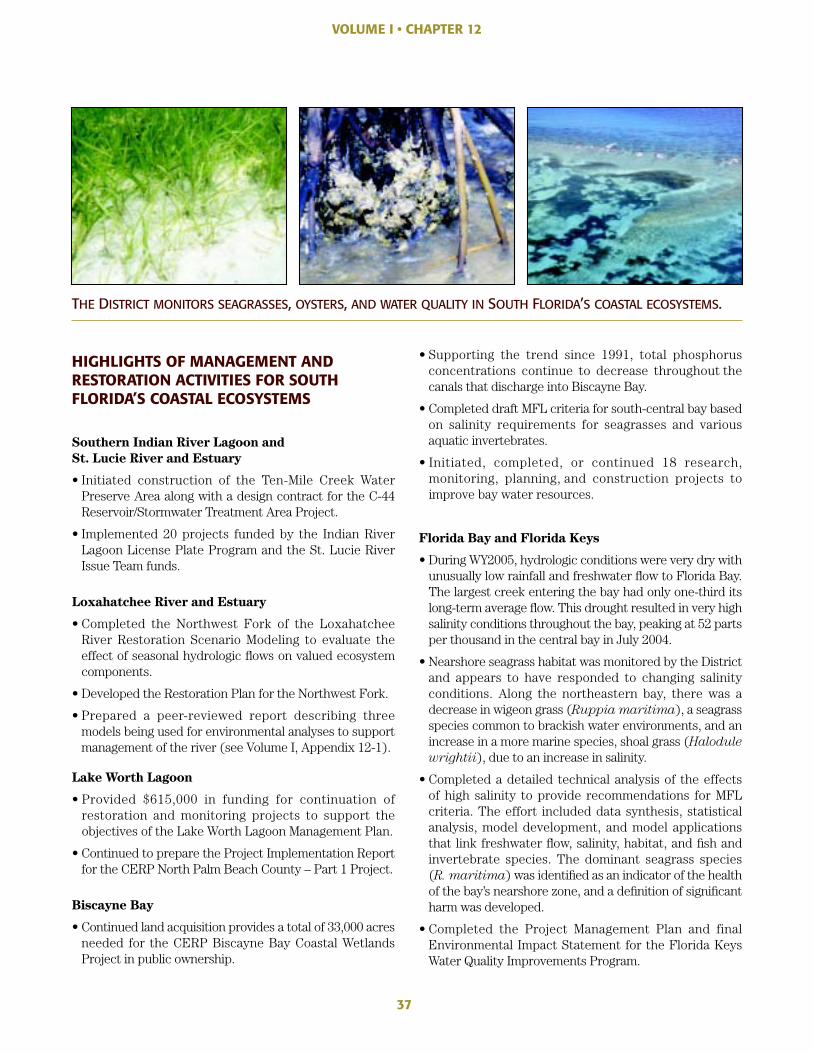
37
VOLUME I • CHAPTER 12
HIGHLIGHTS OF MANAGEMENT AND RESTORATION ACTIVITIES FOR SOUTH FLORIDA’S COASTAL ECOSYSTEMS
Southern Indian River Lagoon and
St. Lucie River and Estuary
• Initiated construction of the Ten-Mile Creek Water Preserve Area along with a design contract for the C-44 Reservoir/Stormwater Treatment Area Project.
• Implemented 20 projects funded by the Indian River Lagoon License Plate Program and the St. Lucie River Issue Team funds.
Loxahatchee River and Estuary
• Completed the Northwest Fork of the Loxahatchee River Restoration Scenario Modeling to evaluate the effect of seasonal hydrologic fl ows on valued ecosystem components.
• Developed the Restoration Plan for the Northwest Fork.
• Prepared a peer-reviewed report describing three models being used for environmental analyses to support management of the river (see Volume I, Appendix 12-1).
Lake Worth Lagoon
• Provided $615,000 in funding for continuation of restoration and monitoring projects to support the objectives of the Lake Worth Lagoon Management Plan.
• Continued to prepare the Project Implementation Report for the CERP North Palm Beach County – Part 1 Project.
Biscayne Bay
• Continued land acquisition provides a total of 33,000 acres needed for the CERP Biscayne Bay Coastal Wetlands Project in public ownership.
• Supporting the trend since 1991, total phosphorus concentrations continue to decrease throughout the canals that discharge into Biscayne Bay.
• Completed draft MFL criteria for south-central bay based on salinity requirements for seagrasses and various aquatic invertebrates.
• Initiated, completed, or continued 18 research, monitoring, planning, and construction projects to improve bay water resources.
Florida Bay and Florida Keys
• During WY2005, hydrologic conditions were very dry with unusually low rainfall and freshwater fl ow to Florida Bay. The largest creek entering the bay had only one-third its long-term average fl ow. This drought resulted in very high salinity conditions throughout the bay, peaking at 52 parts per thousand in the central bay in July 2004.
• Nearshore seagrass habitat was monitored by the District and appears to have responded to changing salinity conditions. Along the northeastern bay, there was a decrease in wigeon grass (Ruppia maritima), a seagrass species common to brackish water environments, and an increase in a more marine species, shoal grass (Halodule
wrightii), due to an increase in salinity.
• Completed a detailed technical analysis of the effects of high salinity to provide recommendations for MFL criteria. The effort included data synthesis, statistical analysis, model development, and model applications that link freshwater fl ow, salinity, habitat, and fi sh and invertebrate species. The dominant seagrass species (R. maritima) was identifi ed as an indicator of the health of the bay’s nearshore zone, and a defi nition of signifi cant harm was developed.
• Completed the Project Management Plan and final Environmental Impact Statement for the Florida Keys Water Quality Improvements Program.
THE DISTRICT MONITORS SEAGRASSES, OYSTERS, AND WATER QUALITY IN SOUTH FLORIDA’S COASTAL ECOSYSTEMS.
38
VOLUME I • CHAPTER 12
Naples Bay
• Assessed current and historical water quality conditions and trends, and collected water quality and bathymetric data to support a hydrodynamic and water quality model of Naples Bay.
• Cooperated with the Conservancy of Southwest Florida to produce a chronological account of human development and changes to the mangrove shoreline.
• Authorized a Surface Water Improvement and Management Reconnaissance Report for the bay in WY2005, scheduled to be fi nalized early in WY2006.
• Collaborated with Collier County to enhance a stormwater management system, improve water quality, and reduce stormwater runoff to the bay.
Estero Bay
• Developed a two-dimensional hydrodynamic/salinity model of Estero Bay for the South West Florida Feasibility Study (SWFFS). Present-day bathymetry was produced, and fi ve major tributaries fl owing into the bay were used to enhance the model grid.
• Conducted a study in collaboration with the Florida Gulf Coast University to characterize temporal hydrologic changes that have occurred in the bay.
• Funded the expansion of Florida Fish and Wildlife Conservation Commission’s Fisheries Independent Monitoring Program and began collaborative studies with Florida Gulf Coast University to examine effects of freshwater infl ow on the bay’s ecology.
• Collaborated with local communities to improve stormwater management through restoration of flow-ways, enhancements of drainage, and cleaning, repairing, and replacing structures.
Caloosahatchee River and Estuary
• Observed indirect effects of decreased salinity and water clarity from increased basin runoff and Lake Okeechobee releases related to Hurricane Charley and the subsequent wet season, including the decline of plant coverage and habitat availability.
• Despite deviations from the MFL criteria in WY2005, the brackish-freshwater plant Vallisneria americana (tape grass) continued recovery since its die-off during the 2001 drought.
• The University of Florida refi ned its habitat suitability model for assessing alternatives for CERP and the SWFFS. The model depends on habitat suitability indices that were developed this year for a range of key species and on the Caloosahatchee hydrodynamic/salinity model, which underwent further improvements this year to achieve its supportive requirements.
• The relationship between nutrient loading and phytoplankton production was further defi ned this year in order to develop targets for nutrient loading. These targets will protect submerged plants from decreased water clarity and estuarine species inhabiting the near-bottom ecosystem from depressed dissolved oxygen levels.
Southern Charlotte Harbor
• Continued restoration activities including removal of exotics and reestablishment of native vegetation, the reestablishment of mangroves along disturbed shoreline, and the restoration of oyster reefs in San Carlos Bay.
• Collaborated with Lee County and the city of Sanibel to improve surface water management through planning, construction of culverts to improve or reestablish flow-ways, and improvement of drainage to prevent fl ooding.
39
VOLUME I • CHAPTER 13
Everglades Forever Act Annual Financial Report
The South Florida Water Management District is required to provide detailed fi nancial information on Everglades restoration. The 1997 Everglades
Oversight Act requires the reporting of fi nancial information for Everglades restoration. The Everglades Forever Act (EFA) requires the District to account for all monies used to fund the 1994 Everglades Construction Project (ECP) and the 2003 Long-Term Plan for Achieving Water Quality Goals for Everglades Protection Area Tributary Basins (Long-Term Plan), and to provide a comparison annually of actual versus projected revenues and a projection of costs and revenues over the successive fi ve-year period. These financial reports are central to Chapter 13 of the 2006
South Florida Environmental Report – Volume I.
DEDICATED FUNDING CONTINUES TO SUPPORT SOUTH FLORIDA RESTORATION
Dedicated funding is vital to the Everglades and Florida Bay protection and restoration programs. The 1994 ECP, a major element of the Everglades Restoration Program and the 1994 EFA, is one of the nation’s largest environmental restoration projects, with a projected cost of $836.2 million over 20 years. The 2003 state legislative session amended the 1994 EFA to include the Long-Term Plan as the strategy for achieving the long-term water quality goals for the Everglades Protection Area. The amended EFA also expanded the use of the 1/10 mill ad valorem tax to include the initial phase of the Long-Term Plan, including Stormwater Treatment Area (STA) enhancements, research, and operation and maintenance of the Everglades Construction Project.
The 2003 Long-Term Plan continues and expands the goals and objectives of the 1994 ECP and is a critical component of the overall effort to restore and protect the Everglades. Currently, the Long-Term Plan’s initial 13-year phase has a projected total cost of $749.8 million. This revised estimate reflects the addition of STAs on Compartments B and C, the addition of recreational facilities at each of the STAs, and other revisions to the pre-2006 projects contained in the Revised Part 2 of the Long-Term Plan dated November 2004. Further information on the STAs and the Long-Term Plan can be found in Volume I, Chapters 4 and 8, respectively.
The Florida Bay Restoration Program has a projected total cost of $367 million. In 1996, the District and the Florida Department of Transportation (FDOT) received federal authorization to redirect the use of Alligator Alley tolls for both restoration programs. A total of $33.1 million – split equally between both restoration programs – has been received from the FDOT since 1997. Further information on Florida Bay can be found in Volume I, Chapter 12.
FUNDING SOURCES RAISE MORE THAN $63 MILLION IN FY2005
The District, other agencies, and the agricultural community share the cost of implementing the ECP, the Long-Term Plan, and other EFA-related activities. Funding sources designated by the EFA for the ECP, the Long-Term Plan, and other EFA-related activities include 1/10 mill ad
valorem tax, agricultural privilege taxes, state land funds, federal funds, excess revenues from Alligator Alley tolls, other environmental mitigation funds, and any additional funds that become available. Since 1994, net revenues received were $613.8 million. In FY2005, net revenues totaled $63.6 million (unaudited), of which $61.2 million came from tax collections, and the remaining $2.4 million were from the other sources listed above.
Since the EFA’s enactment, the District has dedicated its maximum Lake Okeechobee basin 1/10 mill ad valorem
taxing authority to the ECP, the Long-Term Plan, and other EFA-related activities. Through FY2005, $374.4 million
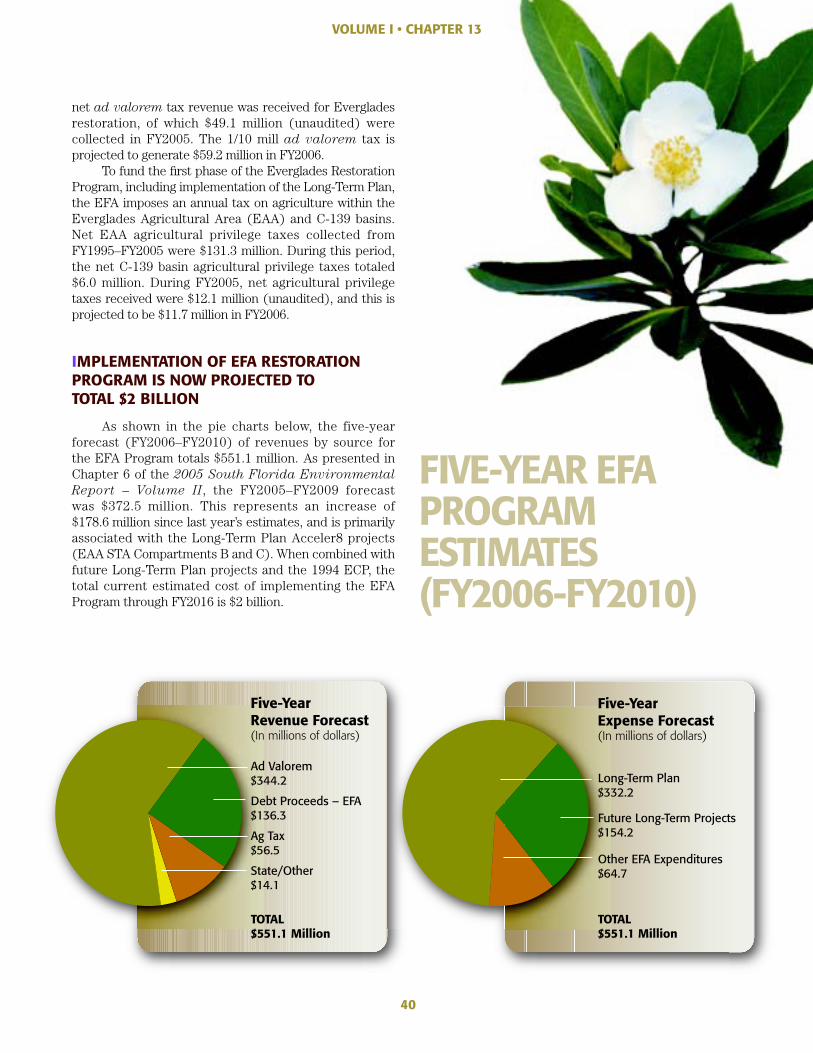
40
net ad valorem tax revenue was received for Everglades restoration, of which $49.1 million (unaudited) were collected in FY2005. The 1/10 mill ad valorem tax is projected to generate $59.2 million in FY2006.
To fund the fi rst phase of the Everglades Restoration Program, including implementation of the Long-Term Plan, the EFA imposes an annual tax on agriculture within the Everglades Agricultural Area (EAA) and C-139 basins. Net EAA agricultural privilege taxes collected from FY1995–FY2005 were $131.3 million. During this period, the net C-139 basin agricultural privilege taxes totaled $6.0 million. During FY2005, net agricultural privilege taxes received were $12.1 million (unaudited), and this is projected to be $11.7 million in FY2006.
IMPLEMENTATION OF EFA RESTORATION PROGRAM IS NOW PROJECTED TO TOTAL $2 BILLION
As shown in the pie charts below, the five-year forecast (FY2006–FY2010) of revenues by source for the EFA Program totals $551.1 million. As presented in Chapter 6 of the 2005 South Florida Environmental
Report – Volume II, the FY2005–FY2009 forecast was $372.5 million. This represents an increase of $178.6 million since last year’s estimates, and is primarily associated with the Long-Term Plan Acceler8 projects (EAA STA Compartments B and C). When combined with future Long-Term Plan projects and the 1994 ECP, the total current estimated cost of implementing the EFA Program through FY2016 is $2 billion.
FIVE-YEAR EFA PROGRAM ESTIMATES (FY2006-FY2010)
VOLUME I • CHAPTER 13
VOLUME II
DISTRICT ANNUAL PLANS AND REPORTS
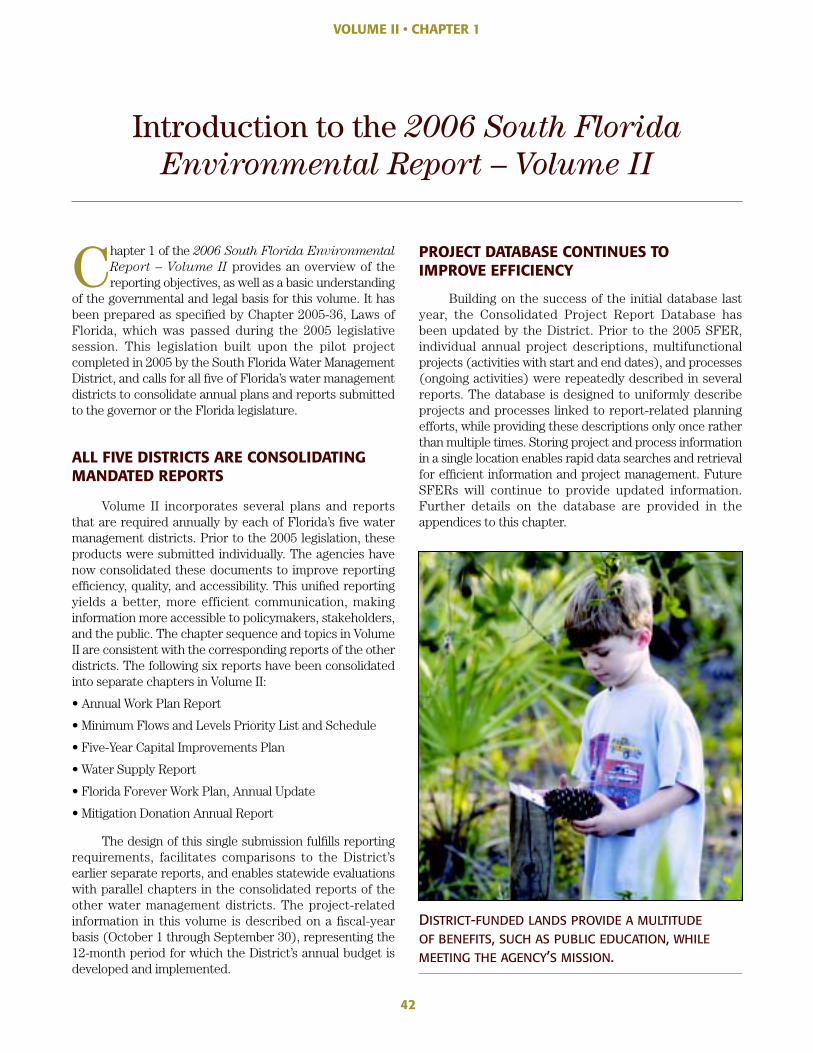
42
VOLUME II • CHAPTER 1
Introduction to the 2006 South Florida
Environmental Report – Volume II
Chapter 1 of the 2006 South Florida Environmental
Report – Volume II provides an overview of the reporting objectives, as well as a basic understanding
of the governmental and legal basis for this volume. It has been prepared as specifi ed by Chapter 2005-36, Laws of Florida, which was passed during the 2005 legislative session. This legislation built upon the pilot project completed in 2005 by the South Florida Water Management District, and calls for all fi ve of Florida’s water management districts to consolidate annual plans and reports submitted to the governor or the Florida legislature.
ALL FIVE DISTRICTS ARE CONSOLIDATING MANDATED REPORTS
Volume II incorporates several plans and reports that are required annually by each of Florida’s fi ve water management districts. Prior to the 2005 legislation, these products were submitted individually. The agencies have now consolidated these documents to improve reporting effi ciency, quality, and accessibility. This unifi ed reporting yields a better, more efficient communication, making information more accessible to policymakers, stakeholders, and the public. The chapter sequence and topics in Volume II are consistent with the corresponding reports of the other districts. The following six reports have been consolidated into separate chapters in Volume II:
• Annual Work Plan Report
• Minimum Flows and Levels Priority List and Schedule
• Five-Year Capital Improvements Plan
• Water Supply Report
• Florida Forever Work Plan, Annual Update
• Mitigation Donation Annual Report
The design of this single submission fulfi lls reporting requirements, facilitates comparisons to the District’s earlier separate reports, and enables statewide evaluations with parallel chapters in the consolidated reports of the other water management districts. The project-related information in this volume is described on a fi scal-year basis (October 1 through September 30), representing the 12-month period for which the District’s annual budget is developed and implemented.
PROJECT DATABASE CONTINUES TO IMPROVE EFFICIENCY
Building on the success of the initial database last year, the Consolidated Project Report Database has been updated by the District. Prior to the 2005 SFER, individual annual project descriptions, multifunctional projects (activities with start and end dates), and processes (ongoing activities) were repeatedly described in several reports. The database is designed to uniformly describe projects and processes linked to report-related planning efforts, while providing these descriptions only once rather than multiple times. Storing project and process information in a single location enables rapid data searches and retrieval for effi cient information and project management. Future SFERs will continue to provide updated information. Further details on the database are provided in the appendices to this chapter.
DISTRICT-FUNDED LANDS PROVIDE A MULTITUDEOF BENEFITS, SUCH AS PUBLIC EDUCATION, WHILEMEETING THE AGENCY’S MISSION.
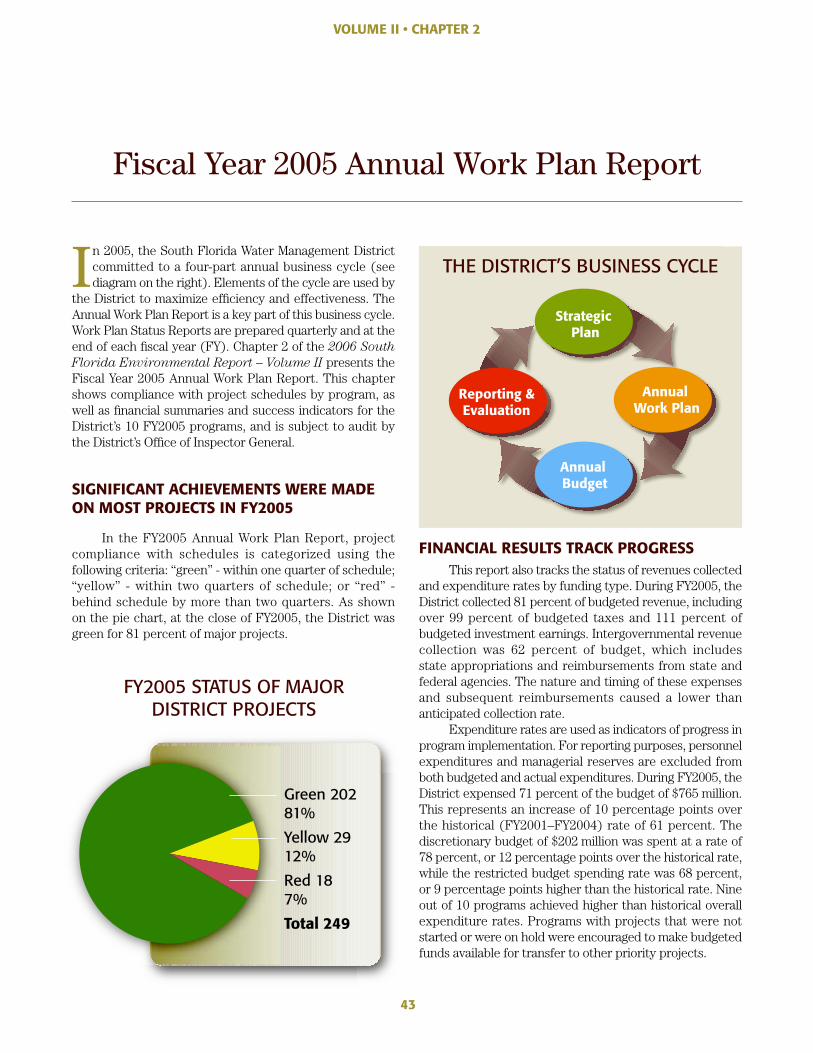
VOLUME II • CHAPTER 2
Fiscal Year 2005 Annual Work Plan Report
In 2005, the South Florida Water Management District committed to a four-part annual business cycle (see diagram on the right). Elements of the cycle are used by
the District to maximize effi ciency and effectiveness. The Annual Work Plan Report is a key part of this business cycle. Work Plan Status Reports are prepared quarterly and at the end of each fi scal year (FY). Chapter 2 of the 2006 South
Florida Environmental Report – Volume II presents the Fiscal Year 2005 Annual Work Plan Report. This chapter shows compliance with project schedules by program, as well as fi nancial summaries and success indicators for the District’s 10 FY2005 programs, and is subject to audit by the District’s Offi ce of Inspector General.
SIGNIFICANT ACHIEVEMENTS WERE MADE ON MOST PROJECTS IN FY2005
In the FY2005 Annual Work Plan Report, project compliance with schedules is categorized using the following criteria: “green” - within one quarter of schedule; “yellow” - within two quarters of schedule; or “red” - behind schedule by more than two quarters. As shown on the pie chart, at the close of FY2005, the District was green for 81 percent of major projects.
FINANCIAL RESULTS TRACK PROGRESSThis report also tracks the status of revenues collected
and expenditure rates by funding type. During FY2005, the District collected 81 percent of budgeted revenue, including over 99 percent of budgeted taxes and 111 percent of budgeted investment earnings. Intergovernmental revenue collection was 62 percent of budget, which includes state appropriations and reimbursements from state and federal agencies. The nature and timing of these expenses and subsequent reimbursements caused a lower than anticipated collection rate.
Expenditure rates are used as indicators of progress in program implementation. For reporting purposes, personnel expenditures and managerial reserves are excluded from both budgeted and actual expenditures. During FY2005, the District expensed 71 percent of the budget of $765 million. This represents an increase of 10 percentage points over the historical (FY2001–FY2004) rate of 61 percent. The discretionary budget of $202 million was spent at a rate of 78 percent, or 12 percentage points over the historical rate, while the restricted budget spending rate was 68 percent, or 9 percentage points higher than the historical rate. Nine out of 10 programs achieved higher than historical overall expenditure rates. Programs with projects that were not started or were on hold were encouraged to make budgeted funds available for transfer to other priority projects.
43
THE DISTRICT’S BUSINESS CYCLE
FY2005 STATUS OF MAJOR DISTRICT PROJECTS
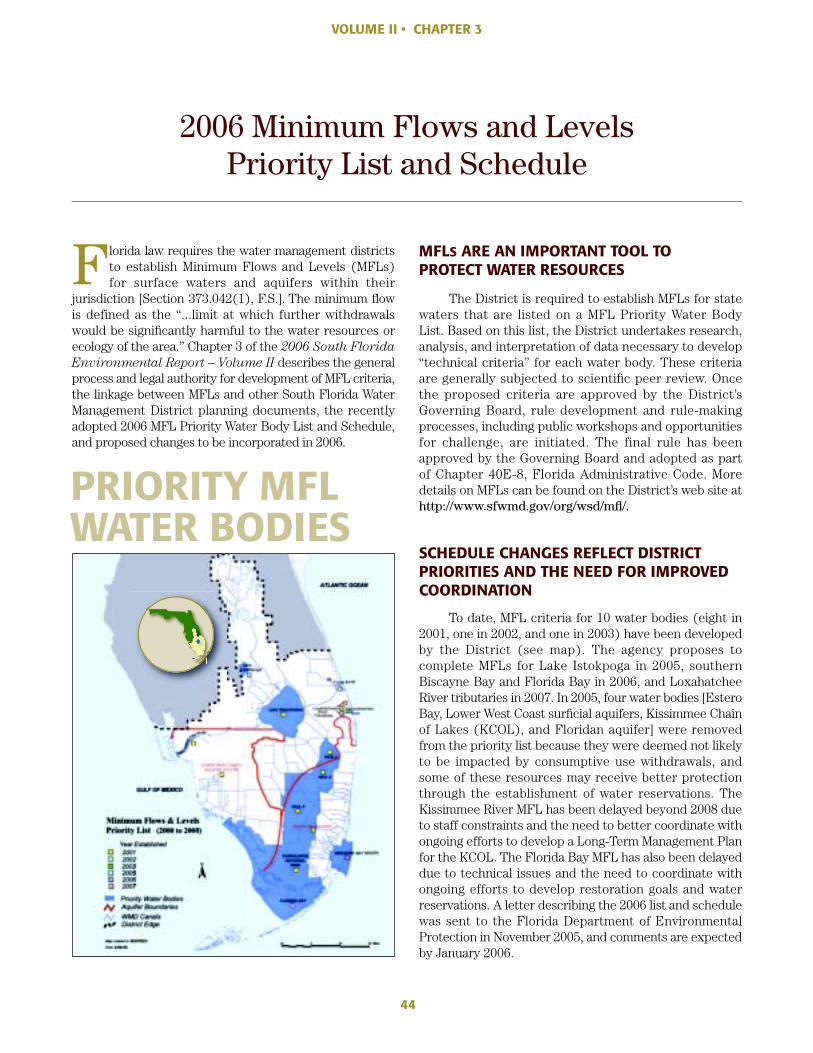
44
VOLUME II • CHAPTER 3
2006 Minimum Flows and Levels Priority List and Schedule
F lorida law requires the water management districts to establish Minimum Flows and Levels (MFLs) for surface waters and aquifers within their
jurisdiction [Section 373.042(1), F.S.]. The minimum fl ow is defined as the “...limit at which further withdrawals would be signifi cantly harmful to the water resources or ecology of the area.” Chapter 3 of the 2006 South Florida
Environmental Report – Volume II describes the general process and legal authority for development of MFL criteria, the linkage between MFLs and other South Florida Water Management District planning documents, the recently adopted 2006 MFL Priority Water Body List and Schedule, and proposed changes to be incorporated in 2006.
MFLS ARE AN IMPORTANT TOOL TO PROTECT WATER RESOURCES
The District is required to establish MFLs for state waters that are listed on a MFL Priority Water Body List. Based on this list, the District undertakes research, analysis, and interpretation of data necessary to develop “technical criteria” for each water body. These criteria are generally subjected to scientifi c peer review. Once the proposed criteria are approved by the District’s Governing Board, rule development and rule-making processes, including public workshops and opportunities for challenge, are initiated. The final rule has been approved by the Governing Board and adopted as part of Chapter 40E-8, Florida Administrative Code. More details on MFLs can be found on the District’s web site at http://www.sfwmd.gov/org/wsd/mfl /.
SCHEDULE CHANGES REFLECT DISTRICT PRIORITIES AND THE NEED FOR IMPROVED COORDINATION
To date, MFL criteria for 10 water bodies (eight in 2001, one in 2002, and one in 2003) have been developed by the District (see map). The agency proposes to complete MFLs for Lake Istokpoga in 2005, southern Biscayne Bay and Florida Bay in 2006, and Loxahatchee River tributaries in 2007. In 2005, four water bodies [Estero Bay, Lower West Coast surfi cial aquifers, Kissimmee Chain of Lakes (KCOL), and Floridan aquifer] were removed from the priority list because they were deemed not likely to be impacted by consumptive use withdrawals, and some of these resources may receive better protection through the establishment of water reservations. The Kissimmee River MFL has been delayed beyond 2008 due to staff constraints and the need to better coordinate with ongoing efforts to develop a Long-Term Management Plan for the KCOL. The Florida Bay MFL has also been delayed due to technical issues and the need to coordinate with ongoing efforts to develop restoration goals and water reservations. A letter describing the 2006 list and schedule was sent to the Florida Department of Environmental Protection in November 2005, and comments are expected by January 2006.
PRIORITY MFL WATER BODIES
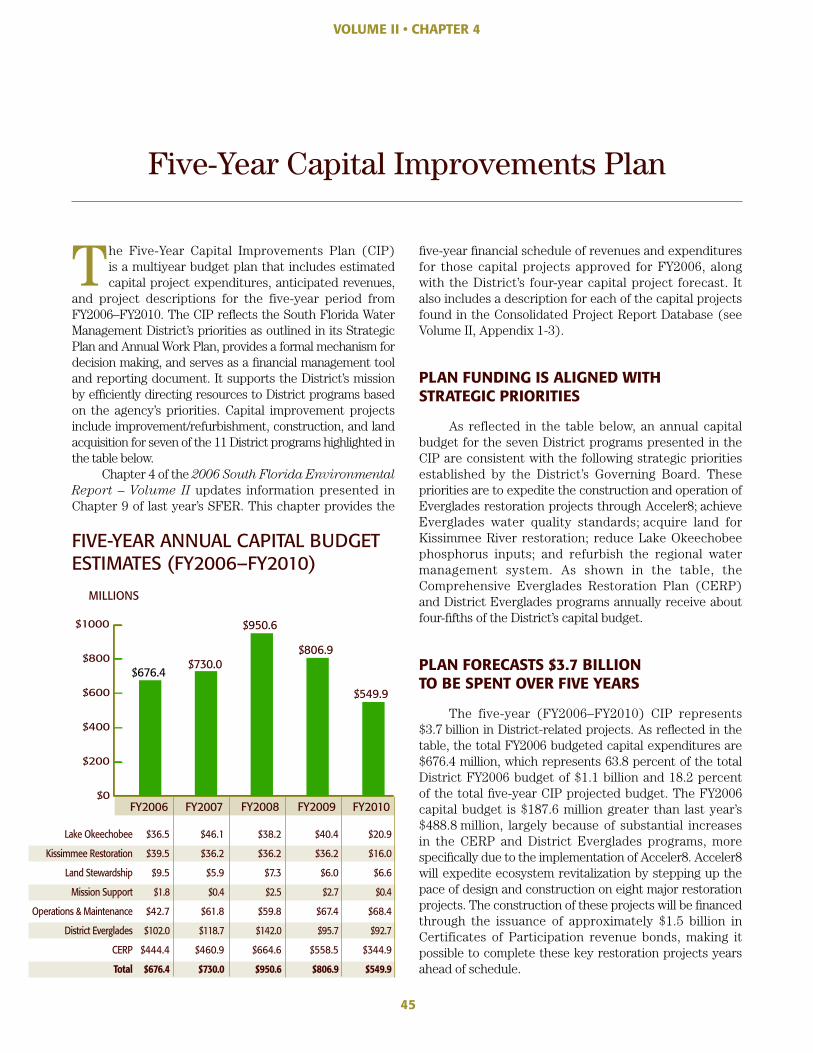
VOLUME II • CHAPTER 4
Five-Year Capital Improvements Plan
The Five-Year Capital Improvements Plan (CIP)is a multiyear budget plan that includes estimated capital project expenditures, anticipated revenues,
and project descriptions for the five-year period from FY2006–FY2010. The CIP refl ects the South Florida Water Management District’s priorities as outlined in its Strategic Plan and Annual Work Plan, provides a formal mechanism for decision making, and serves as a fi nancial management tool and reporting document. It supports the District’s mission by effi ciently directing resources to District programs based on the agency’s priorities. Capital improvement projects include improvement/refurbishment, construction, and land acquisition for seven of the 11 District programs highlighted in the table below.
Chapter 4 of the 2006 South Florida Environmental
Report – Volume II updates information presented in Chapter 9 of last year’s SFER. This chapter provides the
fi ve-year fi nancial schedule of revenues and expenditures for those capital projects approved for FY2006, along with the District’s four-year capital project forecast. It also includes a description for each of the capital projects found in the Consolidated Project Report Database (see Volume II, Appendix 1-3).
PLAN FUNDING IS ALIGNED WITH STRATEGIC PRIORITIES
As reflected in the table below, an annual capital budget for the seven District programs presented in the CIP are consistent with the following strategic priorities established by the District’s Governing Board. These priorities are to expedite the construction and operation of Everglades restoration projects through Acceler8; achieve Everglades water quality standards; acquire land for Kissimmee River restoration; reduce Lake Okeechobee phosphorus inputs; and refurbish the regional water management system. As shown in the table, the Comprehensive Everglades Restoration Plan (CERP) and District Everglades programs annually receive about four-fi fths of the District’s capital budget.
PLAN FORECASTS $3.7 BILLION TO BE SPENT OVER FIVE YEARS
The five-year (FY2006–FY2010) CIP represents $3.7 billion in District-related projects. As refl ected in the table, the total FY2006 budgeted capital expenditures are $676.4 million, which represents 63.8 percent of the total District FY2006 budget of $1.1 billion and 18.2 percent of the total fi ve-year CIP projected budget. The FY2006 capital budget is $187.6 million greater than last year’s $488.8 million, largely because of substantial increases in the CERP and District Everglades programs, more specifi cally due to the implementation of Acceler8. Acceler8 will expedite ecosystem revitalization by stepping up the pace of design and construction on eight major restoration projects. The construction of these projects will be fi nanced through the issuance of approximately $1.5 billion in Certificates of Participation revenue bonds, making it possible to complete these key restoration projects years ahead of schedule.
45
$0
$200
$400
$600
$800
$1000
MILLIONS
FY2006 FY2007 FY2008 FY2009 FY2010
$676.4 $730.0
$950.6
$806.9
$549.9
Lake Okeechobee $36.5 $46.1 $38.2 $40.4 $20.9
Kissimmee Restoration $39.5 $36.2 $36.2 $36.2 $16.0
Land Stewardship $9.5 $5.9 $7.3 $6.0 $6.6
Mission Support $1.8 $0.4 $2.5 $2.7 $0.4
Operations & Maintenance $42.7 $61.8 $59.8 $67.4 $68.4
District Everglades $102.0 $118.7 $142.0 $95.7 $92.7
CERP $444.4 $460.9 $664.6 $558.5 $344.9
Total $676.4 $730.0 $950.6 $806.9 $549.9
FIVE-YEAR ANNUAL CAPITAL BUDGET ESTIMATES (FY2006–FY2010)
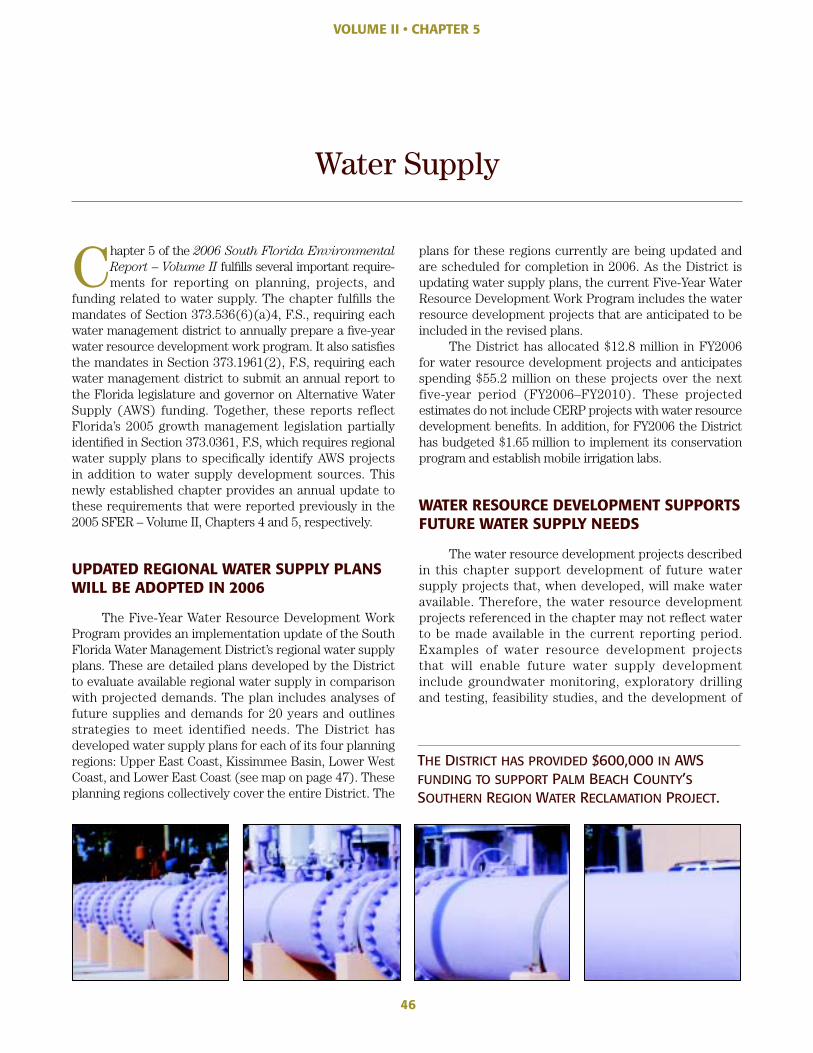
46
Chapter 5 of the 2006 South Florida Environmental
Report – Volume II fulfi lls several important require-ments for reporting on planning, projects, and
funding related to water supply. The chapter fulfi lls the mandates of Section 373.536(6)(a)4, F.S., requiring each water management district to annually prepare a fi ve-year water resource development work program. It also satisfi es the mandates in Section 373.1961(2), F.S, requiring each water management district to submit an annual report to the Florida legislature and governor on Alternative Water Supply (AWS) funding. Together, these reports reflect Florida’s 2005 growth management legislation partially identifi ed in Section 373.0361, F.S, which requires regional water supply plans to specifi cally identify AWS projects in addition to water supply development sources. This newly established chapter provides an annual update to these requirements that were reported previously in the 2005 SFER – Volume II, Chapters 4 and 5, respectively.
UPDATED REGIONAL WATER SUPPLY PLANS WILL BE ADOPTED IN 2006
The Five-Year Water Resource Development Work Program provides an implementation update of the South Florida Water Management District’s regional water supply plans. These are detailed plans developed by the District to evaluate available regional water supply in comparison with projected demands. The plan includes analyses of future supplies and demands for 20 years and outlines strategies to meet identified needs. The District has developed water supply plans for each of its four planning regions: Upper East Coast, Kissimmee Basin, Lower West Coast, and Lower East Coast (see map on page 47). These planning regions collectively cover the entire District. The
plans for these regions currently are being updated and are scheduled for completion in 2006. As the District is updating water supply plans, the current Five-Year Water Resource Development Work Program includes the water resource development projects that are anticipated to be included in the revised plans.
The District has allocated $12.8 million in FY2006 for water resource development projects and anticipates spending $55.2 million on these projects over the next five-year period (FY2006–FY2010). These projected estimates do not include CERP projects with water resource development benefi ts. In addition, for FY2006 the District has budgeted $1.65 million to implement its conservation program and establish mobile irrigation labs.
WATER RESOURCE DEVELOPMENT SUPPORTS FUTURE WATER SUPPLY NEEDS
The water resource development projects described in this chapter support development of future water supply projects that, when developed, will make water available. Therefore, the water resource development projects referenced in the chapter may not refl ect water to be made available in the current reporting period. Examples of water resource development projects that will enable future water supply development include groundwater monitoring, exploratory drilling and testing, feasibility studies, and the development of
VOLUME II • CHAPTER 5
Water Supply
THE DISTRICT HAS PROVIDED $600,000 IN AWS FUNDING TO SUPPORT PALM BEACH COUNTY’SSOUTHERN REGION WATER RECLAMATION PROJECT.
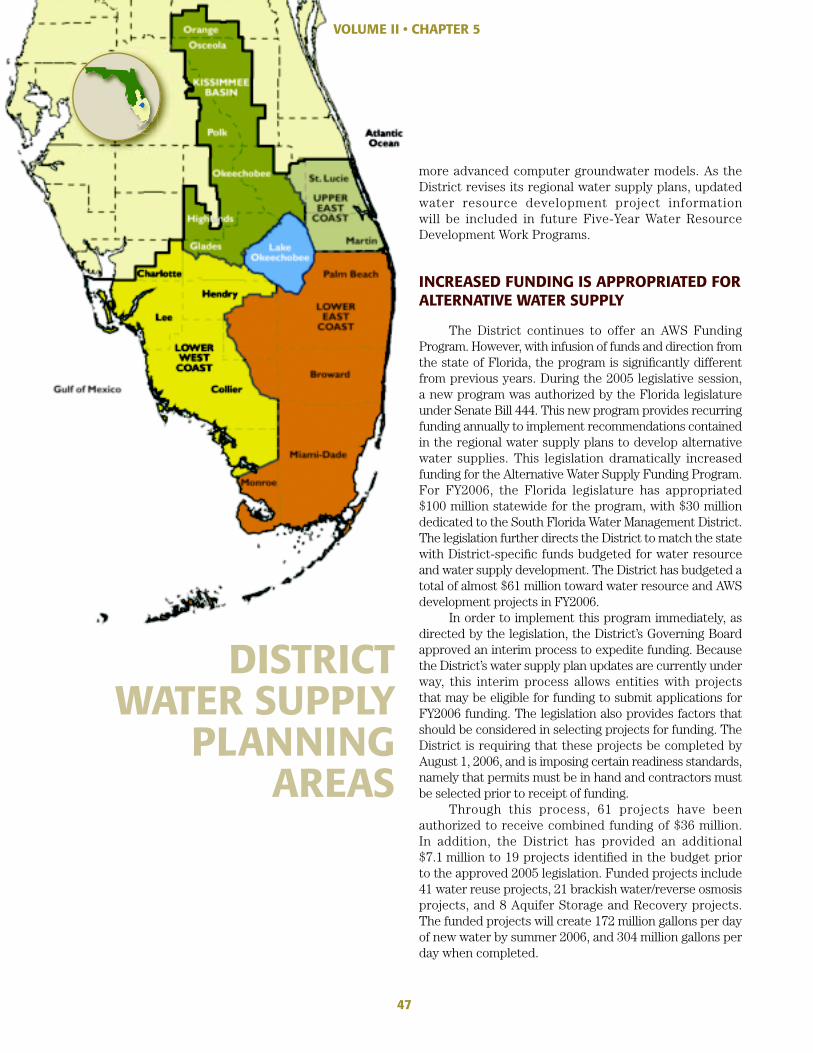
more advanced computer groundwater models. As the District revises its regional water supply plans, updated water resource development project information will be included in future Five-Year Water Resource Development Work Programs.
INCREASED FUNDING IS APPROPRIATED FOR ALTERNATIVE WATER SUPPLY
The District continues to offer an AWS Funding Program. However, with infusion of funds and direction from the state of Florida, the program is signifi cantly different from previous years. During the 2005 legislative session, a new program was authorized by the Florida legislature under Senate Bill 444. This new program provides recurring funding annually to implement recommendations contained in the regional water supply plans to develop alternative water supplies. This legislation dramatically increased funding for the Alternative Water Supply Funding Program. For FY2006, the Florida legislature has appropriated $100 million statewide for the program, with $30 million dedicated to the South Florida Water Management District. The legislation further directs the District to match the state with District-specifi c funds budgeted for water resource and water supply development. The District has budgeted a total of almost $61 million toward water resource and AWS development projects in FY2006.
In order to implement this program immediately, as directed by the legislation, the District’s Governing Board approved an interim process to expedite funding. Because the District’s water supply plan updates are currently under way, this interim process allows entities with projects that may be eligible for funding to submit applications for FY2006 funding. The legislation also provides factors that should be considered in selecting projects for funding. The District is requiring that these projects be completed by August 1, 2006, and is imposing certain readiness standards, namely that permits must be in hand and contractors must be selected prior to receipt of funding.
Through this process, 61 projects have been authorized to receive combined funding of $36 million. In addition, the District has provided an additional $7.1 million to 19 projects identifi ed in the budget prior to the approved 2005 legislation. Funded projects include 41 water reuse projects, 21 brackish water/reverse osmosis projects, and 8 Aquifer Storage and Recovery projects. The funded projects will create 172 million gallons per day of new water by summer 2006, and 304 million gallons per day when completed.
DISTRICT WATER SUPPLY
PLANNING AREAS
47
VOLUME II • CHAPTER 5
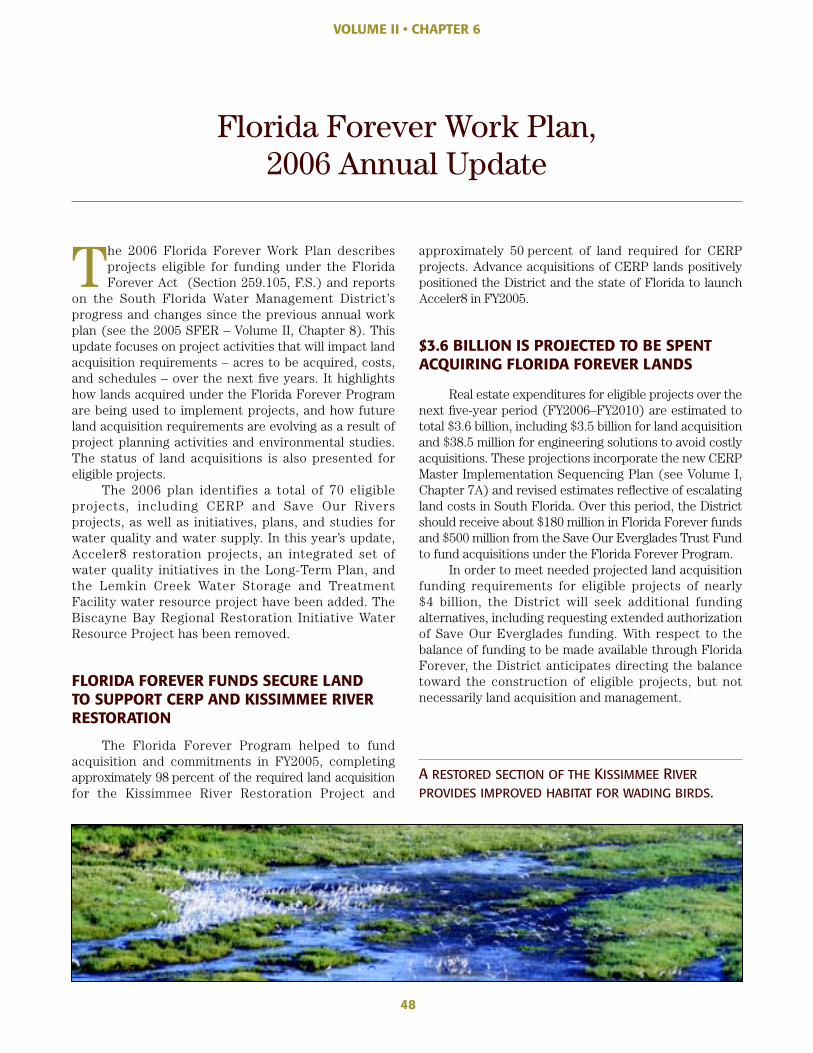
48
VOLUME II • CHAPTER 6
Florida Forever Work Plan, 2006 Annual Update
The 2006 Florida Forever Work Plan describes projects eligible for funding under the Florida Forever Act (Section 259.105, F.S.) and reports
on the South Florida Water Management District’s progress and changes since the previous annual work plan (see the 2005 SFER – Volume II, Chapter 8). This update focuses on project activities that will impact land acquisition requirements – acres to be acquired, costs, and schedules – over the next fi ve years. It highlights how lands acquired under the Florida Forever Program are being used to implement projects, and how future land acquisition requirements are evolving as a result of project planning activities and environmental studies. The status of land acquisitions is also presented for eligible projects.
The 2006 plan identifies a total of 70 eligible projects, including CERP and Save Our Rivers projects, as well as initiatives, plans, and studies for water quality and water supply. In this year’s update, Acceler8 restoration projects, an integrated set of water quality initiatives in the Long-Term Plan, and the Lemkin Creek Water Storage and Treatment Facility water resource project have been added. The Biscayne Bay Regional Restoration Initiative Water Resource Project has been removed.
FLORIDA FOREVER FUNDS SECURE LAND TO SUPPORT CERP AND KISSIMMEE RIVER RESTORATION
The Florida Forever Program helped to fund acquisition and commitments in FY2005, completing approximately 98 percent of the required land acquisition for the Kissimmee River Restoration Project and
approximately 50 percent of land required for CERP projects. Advance acquisitions of CERP lands positively positioned the District and the state of Florida to launch Acceler8 in FY2005.
$3.6 BILLION IS PROJECTED TO BE SPENT ACQUIRING FLORIDA FOREVER LANDS
Real estate expenditures for eligible projects over the next fi ve-year period (FY2006–FY2010) are estimated to total $3.6 billion, including $3.5 billion for land acquisition and $38.5 million for engineering solutions to avoid costly acquisitions. These projections incorporate the new CERP Master Implementation Sequencing Plan (see Volume I, Chapter 7A) and revised estimates refl ective of escalating land costs in South Florida. Over this period, the District should receive about $180 million in Florida Forever funds and $500 million from the Save Our Everglades Trust Fund to fund acquisitions under the Florida Forever Program.
In order to meet needed projected land acquisition funding requirements for eligible projects of nearly $4 billion, the District will seek additional funding alternatives, including requesting extended authorization of Save Our Everglades funding. With respect to the balance of funding to be made available through Florida Forever, the District anticipates directing the balance toward the construction of eligible projects, but not necessarily land acquisition and management.
A RESTORED SECTION OF THE KISSIMMEE RIVERPROVIDES IMPROVED HABITAT FOR WADING BIRDS.
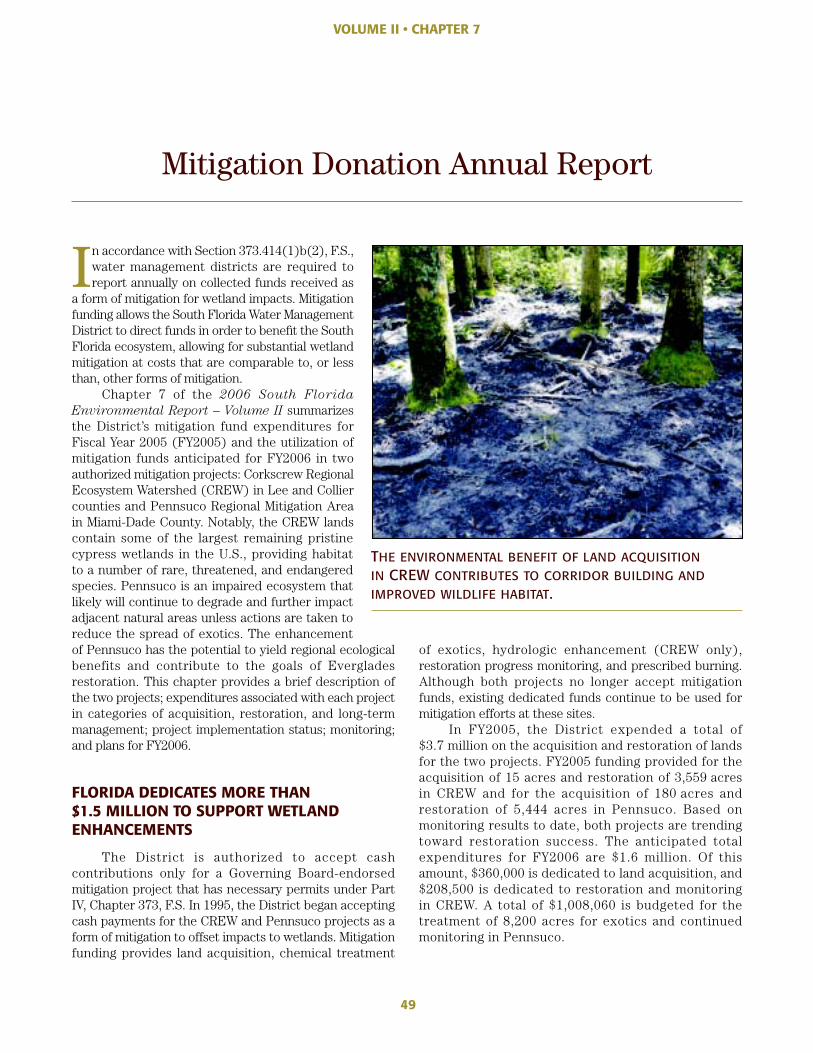
VOLUME II • CHAPTER 7
Mitigation Donation Annual Report
In accordance with Section 373.414(1)b(2), F.S., water management districts are required to report annually on collected funds received as
a form of mitigation for wetland impacts. Mitigation funding allows the South Florida Water Management District to direct funds in order to benefi t the South Florida ecosystem, allowing for substantial wetland mitigation at costs that are comparable to, or less than, other forms of mitigation.
Chapter 7 of the 2006 South Florida
Environmental Report – Volume II sum marizes the District’s mitigation fund expenditures for Fiscal Year 2005 (FY2005) and the utilization of mitigation funds anticipated for FY2006 in two authorized mitigation projects: Corkscrew Regional Ecosystem Watershed (CREW) in Lee and Collier counties and Pennsuco Regional Mitigation Area in Miami-Dade County. Notably, the CREW lands contain some of the largest remaining pristine cypress wetlands in the U.S., providing habitat to a number of rare, threatened, and endangered species. Pennsuco is an impaired ecosystem that likely will continue to degrade and further impact adjacent natural areas unless actions are taken to reduce the spread of exotics. The enhancement of Pennsuco has the potential to yield regional ecological benefits and contribute to the goals of Everglades restoration. This chapter provides a brief description of the two projects; expenditures associated with each project in categories of acquisition, restoration, and long-term management; project implementation status; monitoring; and plans for FY2006.
FLORIDA DEDICATES MORE THAN $1.5 MILLION TO SUPPORT WETLAND ENHANCEMENTS
The District is authorized to accept cash contributions only for a Governing Board-endorsed mitigation project that has necessary permits under Part IV, Chapter 373, F.S. In 1995, the District began accepting cash payments for the CREW and Pennsuco projects as a form of mitigation to offset impacts to wetlands. Mitigation funding provides land acquisition, chemical treatment
of exotics, hydrologic enhancement (CREW only), restoration progress monitoring, and prescribed burning. Although both projects no longer accept mitigation funds, existing dedicated funds continue to be used for mitigation efforts at these sites.
In FY2005, the District expended a total of $3.7 million on the acquisition and restoration of lands for the two projects. FY2005 funding provided for the acquisition of 15 acres and restoration of 3,559 acres in CREW and for the acquisition of 180 acres and restoration of 5,444 acres in Pennsuco. Based on monitoring results to date, both projects are trending toward restoration success. The anticipated total expenditures for FY2006 are $1.6 million. Of this amount, $360,000 is dedicated to land acquisition, and $208,500 is dedicated to restoration and monitoring in CREW. A total of $1,008,060 is budgeted for the treatment of 8,200 acres for exotics and continued monitoring in Pennsuco.
49
THE ENVIRONMENTAL BENEFIT OF LAND ACQUISITIONIN CREW CONTRIBUTES TO CORRIDOR BUILDING ANDIMPROVED WILDLIFE HABITAT.
50
Acre-feet (ac-ft) : The volume required to cover one acre to a depth of one foot, commonly used to express large volumes of water (1 acre-foot = 325,900 gallons).
Adaptive management: The application of scientifi c information and explicit feedback mechanisms to refi ne and improve future management decisions.
Ad valorem tax: A tax imposed on the value of real and personal property, as certifi ed by the property appraiser in each county.
Alternative Water Supply (AWS): A supply of water that has been reclaimed after municipal, commercial, and/or agricultural uses; or a supply of storm water, or brackish or salt water, that has been treated in accordance with applicable rules and standards suffi cient to supply an intended use.
Aquifer Storage and Recovery (ASR): The injection of fresh water into a confi ned saline aquifer (underground, water-bearing layer) during times when supply exceeds demand (wet season), and recovering it during times when there is a supply defi cit (dry season).
Best Management Practices (BMPs): Land, agricultural, industrial, and waste management techniques that reduce pollutant export from a specifi ed area.
Capital projects: Individual facilities and land acquisition projects identifi ed in the District’s Five-Year Capital Improvements Plan.
Compliance monitoring: In a water quality management program, compliance is associated with meeting permit conditions as well as ambient standards. Ongoing monitoring provides periodic water quality data, which are used to assess compliance.
Discharge (or fl ow): The rate of water movement past a reference point, measured as volume per unit time (usually expressed as cubic feet or cubic meters per second).
Drawdown: A lowering of the water level in a reservoir or other body of water.
Ecosystem: Biological communities together with their environment, functioning as a unit.
Estuary: The part of the wide lower course of a river where its current is met by ocean tides or an arm of the sea at the lower end of a river where fresh and salt water meet.
Everglades Agricultural Area (EAA): An area extending south from Lake Okeechobee to the northern levee of Water Conservation Area 3A, from its eastern boundary at the L-8 canal to the western boundary along the L-1, L-2, and L-3 levees. The EAA incorporates almost 3,000 square kilometers (1,158 square miles) of highly productive agricultural land.
Everglades Construction Project (ECP): The foundation of a large ecosystem restoration program, composed of twelve interrelated construction projects between Lake Okeechobee and the Everglades, including about 40,000 acres of Stormwater Treatment Areas. It also contains four hydropattern restoration projects that will improve the volume, timing, and distribution of water entering the Everglades.
Everglades Forever Act (EFA): A 1994 Florida law (Section 373.4592, Florida Statutes), amended in 2003, to promote Everglades restoration and protection. This will be achieved through comprehensive and innovative solutions to issues of water quality, water quantity, hydroperiod, and invasion of exotic species to the Everglades ecosystem.
Everglades Protection Area (EPA): As defi ned in the Everglades Forever Act, the EPA is comprised of Water Conservation Areas 1, 2A, 2B, 3A, and 3B; the Arthur R. Marshall Loxahatchee National Wildlife Refuge; and Everglades National Park.
Expenditure: The disbursement of appropriated funds to purchase goods or services.
Fiscal Year (FY): The 12-month period for which the annual budget is developed and implemented. The fi scal year for the District begins on October 1 and ends on September 30.
Florida Forever Act: A 1999 Florida law (Section 259.105, Florida Statutes) authorizing the issuance of up to $3 billion in bonds over a 10-year period. This funding is used for land acquisition, water resource development, stormwater management projects, water body restoration activities, recreational facilities, public access improvements, and invasive plant removal.
Glossary
Florida Statutes (F.S.): A permanent collection of state laws organized by subject area into a code made up of titles, chapters, parts, and sections. The Florida Statutes are updated annually by laws that create, amend, or repeal statutory material.
Flow-weighted mean (FWM) concentration: The average concentration of a substance in water, corrected for the volume of water fl ow at the time of sampling. Samples taken when fl ow is high are given greater weight in the average.
Geometric mean: A statistical average of a set of transformed numbers, often used to represent a central tendency in highly variable data, such as water quality. It is calculated from data transformed using powers or logarithms and then transformed back to original scale after averaging.
Lake Okeechobee Construction Project (LOCP): As required by the Lake Okeechobee Protection Act, a project designed to improve the hydrology and water quality of the lake and downstream receiving waters.
Loading (or mass loading): The amount of material carried by water into a specifi ed area, expressed as mass per unit of time. One example is phosphorus loading into Water Conservation Area 2A, measured in metric tons per year.
Mitigation: Acquisition, creation, restoration, or enhancement of wetlands to compensate for permitted wetland impacts.
Parts per billion (ppb): A unit of measure, equivalent to micrograms per liter (1 ppb = 1 µg/L).
Phosphorus: An element that is essential for life. In freshwater aquatic environments, phosphorus is often in short supply; increased levels of this nutrient can promote the growth of algae and other plants.
Revenue: Monies received from all sources (with the exception of fund balances) that will be used to fund expenditures in a fi scal year.
Slough: A depression associated with swamps and marshlands containing areas of slightly deeper water and a slow current, such as the broad, shallow rivers of the Everglades.
Stage: The height of a water surface above an established reference point.
Stormwater Treatment Area (STA): A large, constructed wetland designed to remove pollutants, particularly nutrients, from stormwater runoff using natural processes.
Submerged aquatic vegetation (SAV): Wetland plants that exist completely below the water surface.
Total Maximum Daily Load (TMDL): The maximum allowed level of pollutant loading for a water body, while still protecting its uses and maintaining compliance with water quality standards, as defi ned in the Clean Water Act.
Water Conservation Areas (WCAs): Diked areas of the remnant Everglades that are hydrologically controlled for fl ood control and water supply purposes. They are primary targets of the Everglades restoration and are major components of the Everglades Protection Area.
Water quality (WQ) criteria: Constituent concentrations based on scientifi c data and judgments on the relationship between pollutant concentrations and environmental and human health effects.
Water quality standards (WQS): State-mandated water quality levels that are comprised of a benefi cial use classifi cation, water quality criteria applicable to that classifi cation, Florida antidegradation policy, and several provisions in other rules.
Watershed: A region or area bounded peripherally by a water parting and draining ultimately to a particular watercourse or body of water.
Water Year 2005 (WY2005): The period from May 1, 2004, through April 30, 2005, during which water quality and other data were collected and reported on in the 2006 South Florida Environmental Report.
Wetland: An area that is inundated or saturated by surface water or groundwater with vegetation adapted for life under those soil conditions (for example, lakes, swamps, marshes).
51
The South Florida Water Management District wishes to gratefully acknowledge the contributions of the many professionals who have made the 2006 South
Florida Environmental Report a reality. Authors: The 2006 South Florida Environmental
Report could not exist without the diligent effort of its many authors. The professionalism and dedication of these individuals are gratefully acknowledged. Names of the contributing authors are presented at the beginning of each chapter and are compiled in the acknowledgments page in each volume of the main report.
Editorial and Production Team: The authors’ products were organized, edited, and formatted by an editorial and production team of skilled professionals. Stacey Efron, SFER Production Manager, plays a remarkable role in leading the team’s efforts. The exceptional teamwork and productivity of many individuals are respectfully acknowledged: Ken Chen, Christopher King, Patrick Lynch, Trudy Morris, Kathy Ronan, Barbara Ross, Diane Smith, and Wendy Wagman (Metcalf & Eddy). The outstanding work by Gail Marcarelli, graphic designer for the Executive Summary, is immensely appreciated.
Project Team: Garth Redfi eld, Chief Environmental Scientist in the District’s Environmental Resource Assessment Department, serves as the project manager of the 2006 South Florida Environmental Report
– Volume I, managing its development in association with colleagues Stacey Efron and Kirk Burns. This staff works closely with Frank Nearhoof of the Florida Department of Environmental Protection’s Water Quality Standards and Special Projects Program to jointly coordinate the creation of Volume I, Chapter 2 and its associated appendices. David
Gilpin-Hudson, Lead Planner in the District’s Finance and Administration Department, serves as the project manager for the 2006 South Florida Environmental Report
– Volume II.This large, multidisciplinary document could not
be produced without the guidance of the SFER Project Management Oversight Group – Debra Azeredo, Aaron Basinger, Douglas Bergstrom, Alejandro Perez, and Steve Reel. This accomplishment was also successfully completed with the thoughtful oversight of senior management. In particular, the effective leadership of Linda Lindstrom, Debra Azeredo, Doug Bergstrom, Julianne LaRock, and Jan Loftin from the District are gratefully acknowledged.
Other Contributors: The extensive amount of data and other information provided throughout Volume I are greatly supported by the three divisions of the District’s Environmental Resource Assessment Department – Water Quality Monitoring, Water Quality Analysis, and Water Quality Assessment. The long list of individuals throughout these divisions that have contributed to the essential data collection, monitoring, analyses, validation, and technical assessments for multiple report chapters and appendices continues to contribute to the enormous success of this massive report and their efforts are greatly appreciated. The following District staff is also acknowledged for their vital assistance in conducting the peer review and public workshops: Robin Chesser, Linda Davis, Trudy Morris, Todd Nesst, and Michael Wedding. Project managers and chapter authors are acknowledged for updating the Consolidated Project Report Database.
FOR FURTHER INFORMATION PLEASE CONTACT:
FOR VOLUME I: FOR VOLUME II:
Garth Redfi eld, PhD David Gilpin-HudsonEnvironmental Resource Assessment Department Finance and Administration Department
South Florida Water Management District South Florida Water Management District 3301 Gun Club Road, West Palm Beach, FL 33406 3301 Gun Club Road, West Palm Beach, FL 33406561-682-6611 gredfi [email protected] 561-682-6784 [email protected]
FOR VOLUME I, CHAPTER 2:
Frank NearhoofWater Quality Standards and Special Projects Program
Florida Department of Environmental Protection2600 Blair Stone Road, Mail Station 3560, Tallahassee, FL 32399850-245-8420 [email protected] .us
For additional 2006 South Florida Environmental
Report copies, or for the Consolidated Project Report Database CD, please contact the District’s Reference Center at 561-682-2850. The complete 2006 report is also available on the World Wide Web at www.sfwmd.gov/sfer/
Acknowledgments
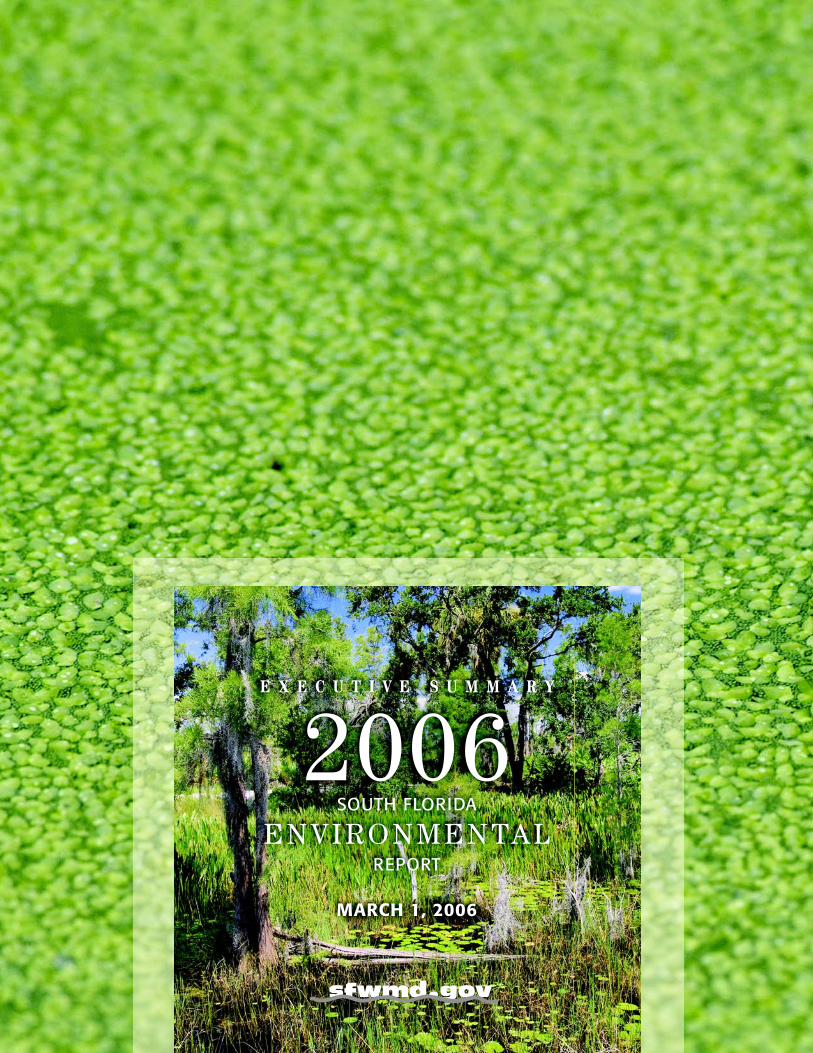
E X E C U T I V E S U M M A R Y
2006SOUTH FLORIDA
ENVIRONMENTALREPORT
MARCH 1, 2006
On the cover: The Sumica Wildlife Management Area, in the Kissimmee Chainof Lakes region, is located in Polk County near Lake Weohyakapka (“Walk-in-Water”) and Lake Kissimmee. The site of a former logging community andsawmill—the 1920s “timber town” of Sumica—it now serves an important rolein the South Florida environment. The area contains diverse native habitats(pine fl atwoods and oak hammock), unique and rare wildlife and plants,numerous wetlands, and lake shoreline.
Flatwood marsh habitat on the property (front cover) is dominated bypickerelweed (Pontedaria cordata), fragrant water lily (Nymphaea odorata),and pond cypress (Taxodium ascendens). Deeper marsh habitat is abundantin fragrant water lily (back cover).
In 1999, the South Florida Water Management District and Polk Countypartnered to make the initial 4,100-acre purchase for creation of the SumicaWildlife Management Area. Polk County is now actively managing the propertywith fi nancial assistance from the District. The area is open to the publicfor year-round recreational use, such as hiking, picnicking, horseback riding,and fi shing. For more information, visit the Polk County Environmental Landsweb site at http://www.polk-county.net/county_offi ces/natural_resources/environmental_lands/sumica_lands.aspx