Embed Size (px)
Citation preview

SOUTH DAKOTA MATHEMATICS STANDARDS 6-8
Sixth Grade Algebra Grade Standards, Supporting Skills, and Examples
Indicator 1: Use procedures to transform algebraic expressions.
Bloom’s Taxonomy Level Standard, Supporting Skills, and Examples
(Application)
6.A.1.1. Students are able to use order of operations, excluding nested parentheses and exponents, to simplify whole number expressions.
Examples: 1) 5347 −•+
2) )2
10(7)53(2 ++
3) Ms. Smith’s class is going to the movies. Tickets cost $3 for children and $5 for adults. Write and simplify the expression that shows the cost for 20 children and 4 adults.
(Application)
6.A.1.2. Students are able to write algebraic expressions involving addition or multiplication using whole numbers.
• Show multiplication in various forms: 32 • or n2 or )3(2 . Example: 1) A number increased by 6
2) Twice a number

Indicator 2: Use a variety of algebraic concepts and methods to solve equations and inequalities.
Bloom’s Taxonomy Level Standard, Supporting Skills, and Examples
(Application)
6.A.2.1. Students are able to write and solve one-step 1st degree equations, with one variable, involving inverse operations using the set of whole numbers.
Examples: 1) Choose the correct answer to solve this equation using inverse
operations, 73 =+x
a) 373 −=+x b) 3733 −=−+x c) 7733 −=−+x d) 3733 +=−+x
2) Write an equation for this statement and find the solution: Four
times a number is eight.
Indicator 3: Interpret and develop mathematical models. Bloom’s Taxonomy
Level Standard, Supporting Skills, and Examples
(Knowledge) 6.A.3.1. Students are able to identify and graph ordered pairs in Quadrant I on a coordinate plane.
(Application)
6.A.3.2. Students are able to solve one-step problems involving ratios and rates.
Example: 15 ounces costs $0.75. What does it cost for one ounce?
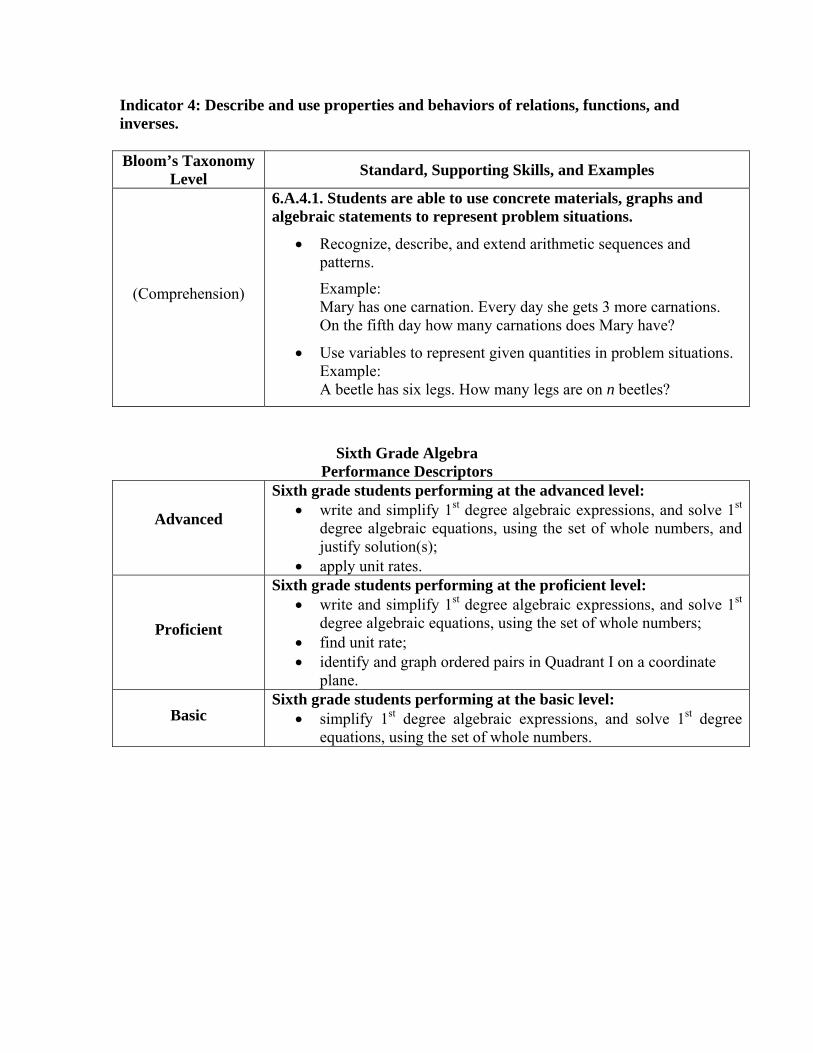
Indicator 4: Describe and use properties and behaviors of relations, functions, and inverses. Bloom’s Taxonomy
Level Standard, Supporting Skills, and Examples
(Comprehension)
6.A.4.1. Students are able to use concrete materials, graphs and algebraic statements to represent problem situations.
• Recognize, describe, and extend arithmetic sequences and patterns.
Example: Mary has one carnation. Every day she gets 3 more carnations. On the fifth day how many carnations does Mary have?
• Use variables to represent given quantities in problem situations. Example: A beetle has six legs. How many legs are on n beetles?
Sixth Grade Algebra Performance Descriptors
Advanced
Sixth grade students performing at the advanced level: • write and simplify 1st degree algebraic expressions, and solve 1st
degree algebraic equations, using the set of whole numbers, and justify solution(s);
• apply unit rates.
Proficient
Sixth grade students performing at the proficient level: • write and simplify 1st degree algebraic expressions, and solve 1st
degree algebraic equations, using the set of whole numbers; • find unit rate; • identify and graph ordered pairs in Quadrant I on a coordinate
plane.
Basic
Sixth grade students performing at the basic level: • simplify 1st degree algebraic expressions, and solve 1st degree
equations, using the set of whole numbers.
50°
40°90° 72°
70°
38°35°30°
115°
37
9
3
5 5 8
8
8
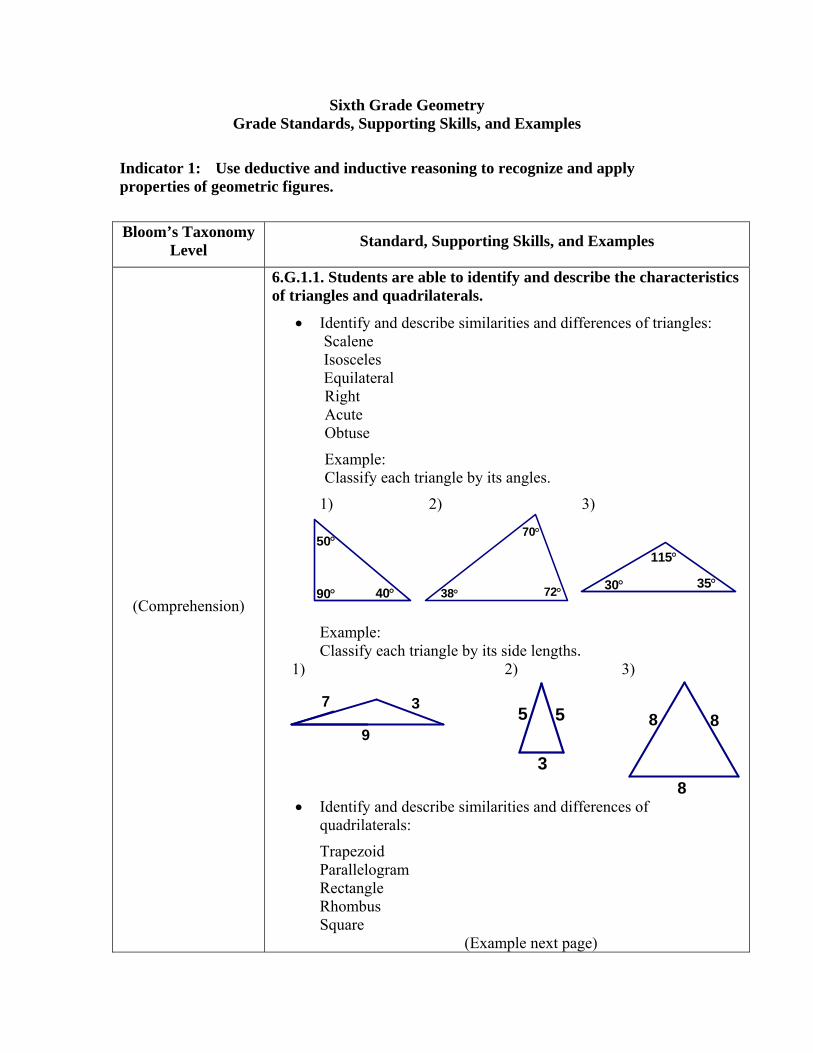
Sixth Grade Geometry Grade Standards, Supporting Skills, and Examples
Indicator 1: Use deductive and inductive reasoning to recognize and apply properties of geometric figures.
Bloom’s Taxonomy Level Standard, Supporting Skills, and Examples
(Comprehension)
6.G.1.1. Students are able to identify and describe the characteristics of triangles and quadrilaterals.
• Identify and describe similarities and differences of triangles: Scalene Isosceles Equilateral Right Acute Obtuse
Example: Classify each triangle by its angles.
1) 2) 3)
Example: Classify each triangle by its side lengths.
1) 2) 3)
• Identify and describe similarities and differences of quadrilaterals:
Trapezoid Parallelogram Rectangle Rhombus Square
(Example next page)
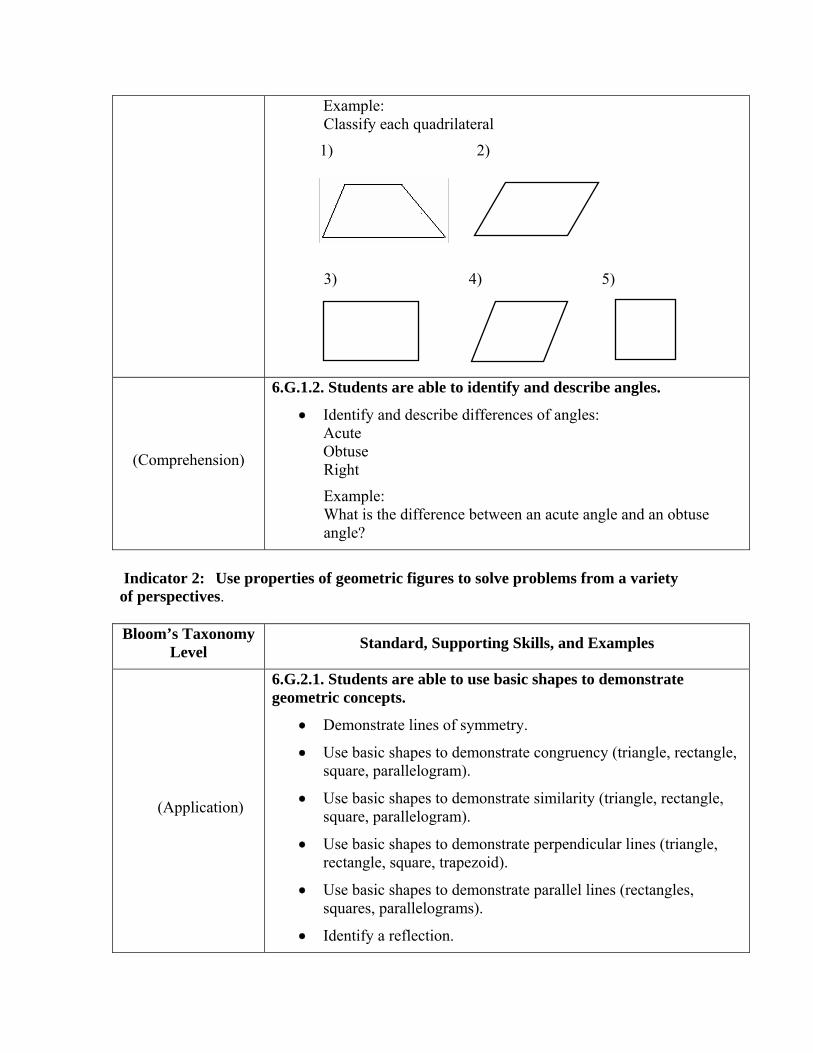
Example: Classify each quadrilateral
1) 2)
3) 4) 5)
(Comprehension)
6.G.1.2. Students are able to identify and describe angles.
• Identify and describe differences of angles: Acute Obtuse Right
Example: What is the difference between an acute angle and an obtuse angle?
Indicator 2: Use properties of geometric figures to solve problems from a variety of perspectives. Bloom’s Taxonomy
Level Standard, Supporting Skills, and Examples
(Application)
6.G.2.1. Students are able to use basic shapes to demonstrate geometric concepts.
• Demonstrate lines of symmetry.
• Use basic shapes to demonstrate congruency (triangle, rectangle, square, parallelogram).
• Use basic shapes to demonstrate similarity (triangle, rectangle, square, parallelogram).
• Use basic shapes to demonstrate perpendicular lines (triangle, rectangle, square, trapezoid).
• Use basic shapes to demonstrate parallel lines (rectangles, squares, parallelograms).
• Identify a reflection.

Sixth Grade Geometry Performance Descriptors
Advanced
Sixth grade students performing at the advanced level: • develop and apply a variety of strategies and properties to analyze
two-dimensional geometric figures.
Proficient
Sixth grade students performing at the proficient level: • use geometric concepts to identify and describe characteristics of
lines, angles, triangles, and quadrilaterals.
Basic
Sixth grade students performing at the basic level: • identify characteristics of lines, angles, triangles, and
quadrilaterals.

Sixth Grade Measurement Grade Standards, Supporting Skills, and Examples
Indicator 1: Apply measurement concepts in practical applications.
Bloom’s Taxonomy Level Standard, Supporting Skills, and Examples
(Comprehension)
6.M.1.1. Students are able to select, use, and convert appropriate unit of measurement for a situation.
• Determine elapsed time.
Example: Alfredo went to the park at 11:15 a.m. and came home at 2:00 p.m. How long was he at the park?
• Convert length, capacity, and mass within the Metric system (kilo-, base unit, centi-, milli-).
• Convert weight and length within U.S. Customary system.
Convert capacity within U.S. Customary system (fluid ounce, cup, pint, quart, gallon).
Measure angles.
(Comprehension)
6.M.1.2. Students are able to find the perimeter and area of squares and rectangles (whole number measurements).
• Apply strategies and/or formulas.
• Use appropriate unit of measure.
Sixth Grade Measurement Performance Descriptors
Advanced
Sixth students performing at the advanced level: • convert units of measure; • use perimeter and area formulas to solve problems.
Proficient
Sixth grade students performing at the proficient level: • convert basic units of measure; • select and use the appropriate formula to find the perimeter and
area of selected polygons.
Basic
Sixth grade students performing at the basic level: • convert units of weight and length (inches, feet, and yards) in the
U.S. Customary system; • given the formula find the perimeter and area of selected
polygons.

Sixth Grade Number Sense Grade Standards, Supporting Skills, and Examples
Indicator 1: Analyze the structural characteristics of the real number system and its various subsystems. Analyze the concept of value, magnitude, and relative magnitude of real numbers.
Bloom’s Taxonomy Level Standard, Supporting Skills, and Examples
(Comprehension)
6.N.1.1. Students are able to represent fractions in equivalent forms and convert between fractions, decimals, and percents using halves, fourths, tenths, hundredths.
Examples:
1) Write 21 as a decimal and a percent.
2) In the following equation, what value of x would make the
relationship true? 21 =
8x
3) Choose the number that represents 41 :
a) 0.4 b) 1.4 c) 0.14 d) 0.25 e) 2.5 • Identify both standard and word forms (millions to ten-
thousandths) of positive rational numbers.
Identify, represent, compare, and order rational numbers and represent them on a number line.
Describe and compare two numbers using ratios including
appropriate notation, e.g., a:b, ba , a to b.
(Knowledge)
6.N.1.2. Students are able to find factors and multiples of whole numbers.
Examples: The area of a rectangle is 24 square units. What are the possible whole number dimensions?
• Classify numbers as prime or composite.
Indicator 2: Apply number operations with real numbers and other number systems.
Bloom’s Taxonomy Level Standard, Supporting Skills, and Examples
(Comprehension) 6.N.2.1. Students are able to add, subtract, multiply, and divide decimals.
√ Operations with fractions and integers.
Indicator 3: Develop conjectures, predictions, or estimations to solve problems and verify or justify the results.
Bloom’s Taxonomy Level Standard, Supporting Skills, and Examples
(Application)
6.N.3.1. Students are able to use various strategies to solve one- and two-step problems involving positive decimals.
• Formulate rules to solve practical problems (problem solving).
• Use estimation strategies to make predictions and test the reasonableness of answer.
• Explain strategies and justify answers.
Example: Tom bought one pair of jeans for $19.95 and 2 shirts for $14.99 each. He gave the clerk $60.00. What is his change? Explain the strategy and justify the answer.
Sixth Grade Number Sense Performance Descriptors
Advanced
Sixth grade students performing at the advanced level: • justify problem-solving strategies used in two-step situations
with decimals; • apply problem-solving strategies using factors and multiples with
the set of whole numbers.
Proficient
Sixth grade students performing at the proficient level: • read, represent, estimate, and calculate decimals; • apply problem-solving strategies in one- and two-step situations
with decimals; • represent numbers in a variety of forms; • find factors and multiples using the set of whole numbers.
Basic
Sixth grade students performing at the basic level: • read, represent, estimate, and calculate whole numbers; • apply problem-solving strategies in one-step situations using the
set of whole numbers; • find multiples using the set of whole numbers.
Sixth Grade Statistics & Probability Grade Standards, Supporting Skills, and Examples
Indicator 1: Use statistical models to gather, analyze, and display data to draw conclusions.
Bloom’s Taxonomy Level Standard, Supporting Skills, and Examples
(Comprehension)
6.S.1.1. Students are able to find the mean, mode, and range of an ordered set of positive data.
Example: Find the mean, mode, and range of the following test scores: 72, 76, 82, 82, 87, 90, 92
√ Find the median.
(Application)
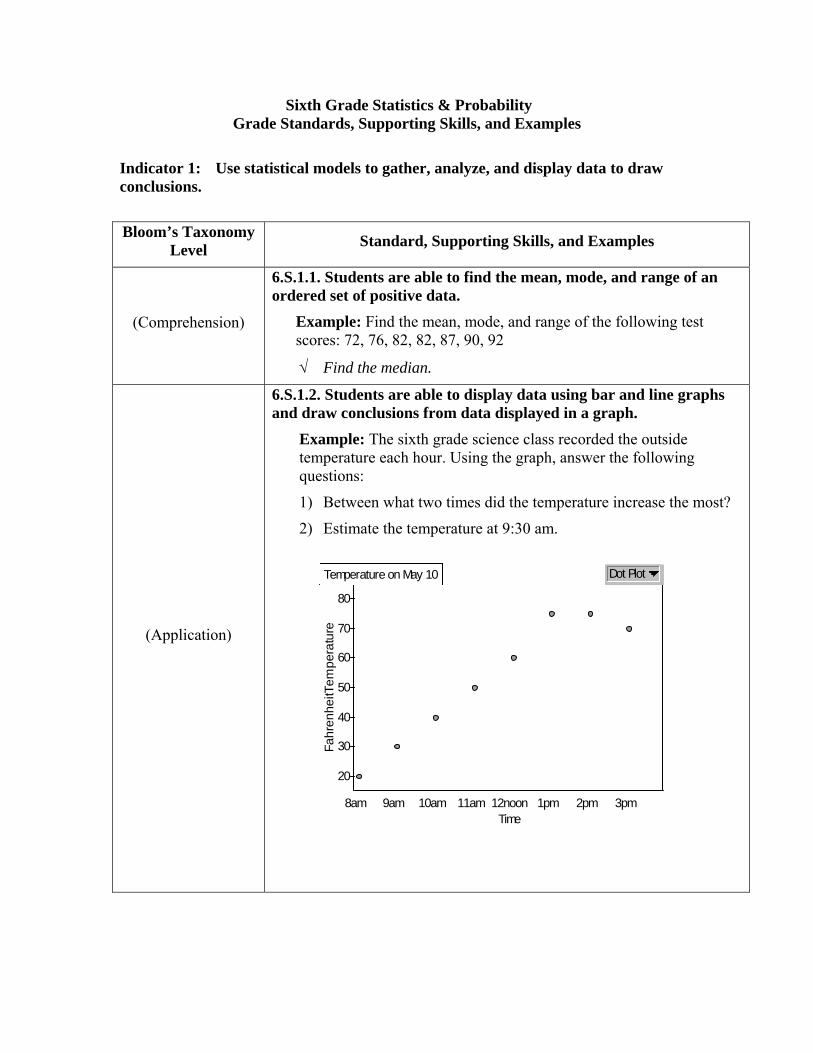
6.S.1.2. Students are able to display data using bar and line graphs and draw conclusions from data displayed in a graph.
Example: The sixth grade science class recorded the outside temperature each hour. Using the graph, answer the following questions:
1) Between what two times did the temperature increase the most?
2) Estimate the temperature at 9:30 am.
Fahr
enhe
itTem
pera
ture
20
30
40
50
60
70
80
Time10am 11am 12noon 1pm 2pm 3pm8am 9am
Temperature on May 10 Dot Plot
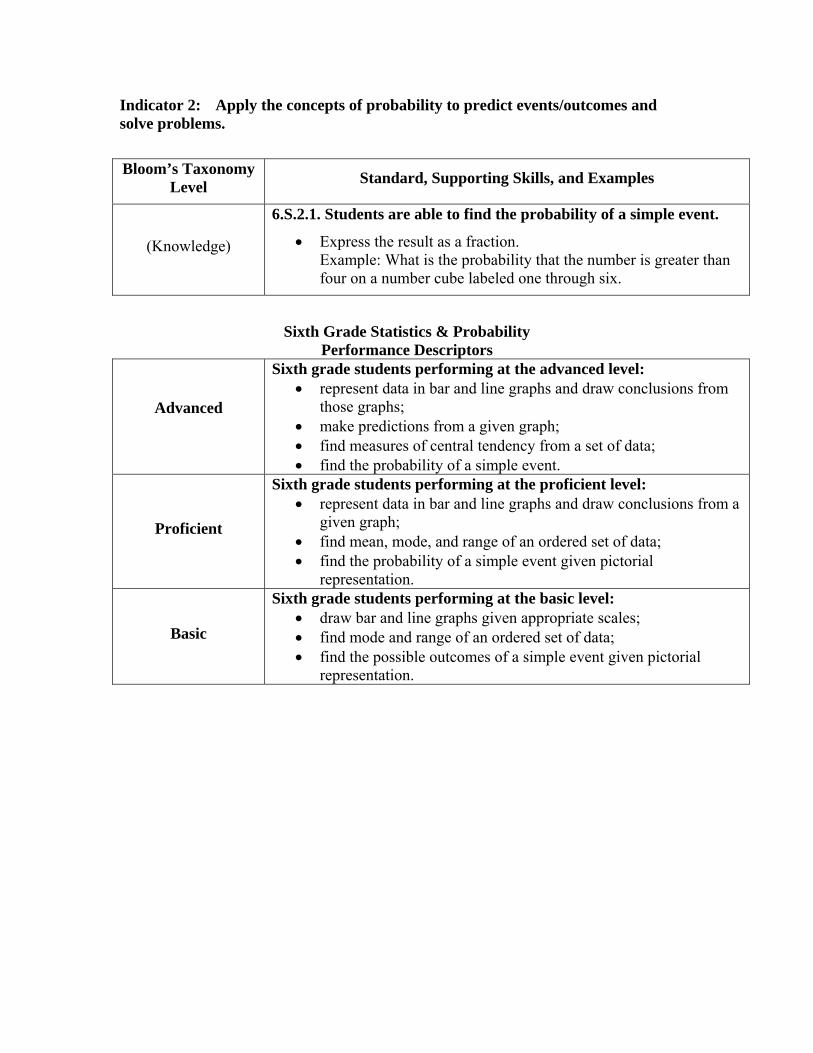
Indicator 2: Apply the concepts of probability to predict events/outcomes and solve problems.
Bloom’s Taxonomy Level Standard, Supporting Skills, and Examples
(Knowledge)
6.S.2.1. Students are able to find the probability of a simple event.
• Express the result as a fraction. Example: What is the probability that the number is greater than four on a number cube labeled one through six.
Sixth Grade Statistics & Probability Performance Descriptors
Advanced
Sixth grade students performing at the advanced level: • represent data in bar and line graphs and draw conclusions from
those graphs; • make predictions from a given graph; • find measures of central tendency from a set of data; • find the probability of a simple event.
Proficient
Sixth grade students performing at the proficient level: • represent data in bar and line graphs and draw conclusions from a
given graph; • find mean, mode, and range of an ordered set of data; • find the probability of a simple event given pictorial
representation.
Basic
Sixth grade students performing at the basic level: • draw bar and line graphs given appropriate scales; • find mode and range of an ordered set of data; • find the possible outcomes of a simple event given pictorial
representation.
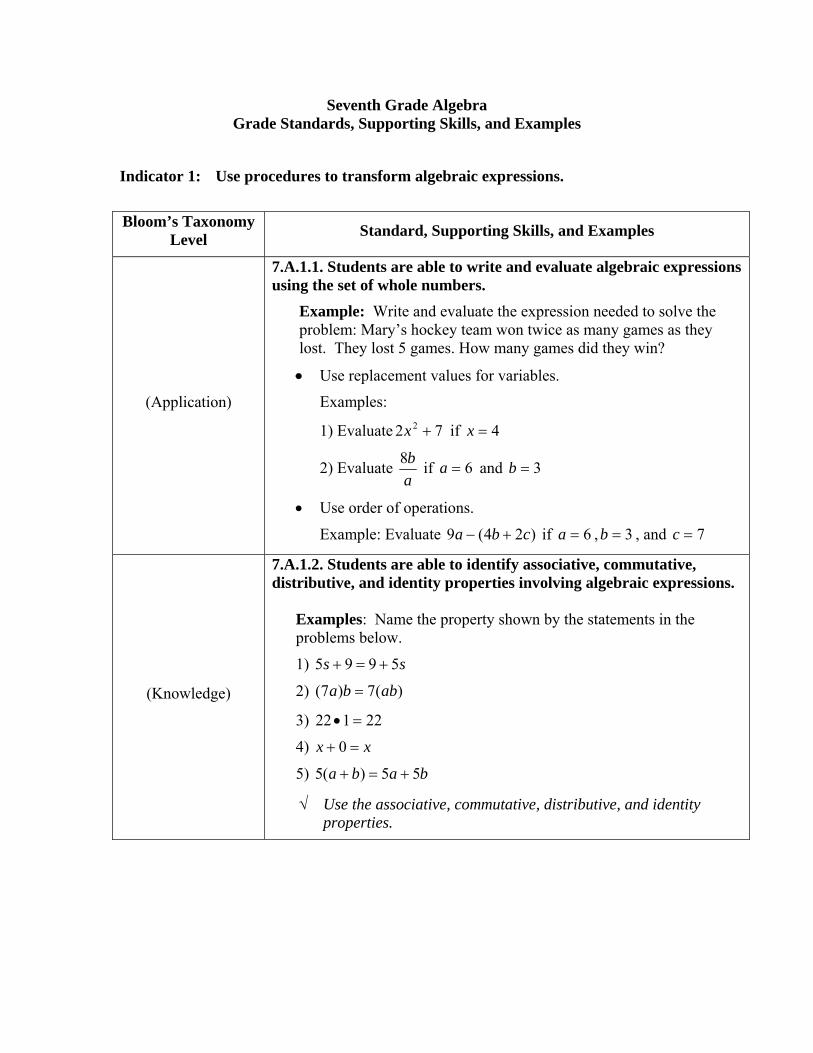
Seventh Grade Algebra Grade Standards, Supporting Skills, and Examples
Indicator 1: Use procedures to transform algebraic expressions.
Bloom’s Taxonomy Level Standard, Supporting Skills, and Examples
(Application)
7.A.1.1. Students are able to write and evaluate algebraic expressions using the set of whole numbers.
Example: Write and evaluate the expression needed to solve the problem: Mary’s hockey team won twice as many games as they lost. They lost 5 games. How many games did they win?
• Use replacement values for variables.
Examples:
1) Evaluate 72 2 +x if 4=x
2) Evaluate ab8 if 6=a and 3=b
• Use order of operations.
Example: Evaluate )24(9 cba +− if 6=a , 3=b , and 7=c
(Knowledge)
7.A.1.2. Students are able to identify associative, commutative, distributive, and identity properties involving algebraic expressions.
Examples: Name the property shown by the statements in the problems below.
1) ss 5995 +=+
2) )(7)7( abba =
3) 22122 =•
4) xx =+ 0
5) baba 55)(5 +=+
√ Use the associative, commutative, distributive, and identity properties.
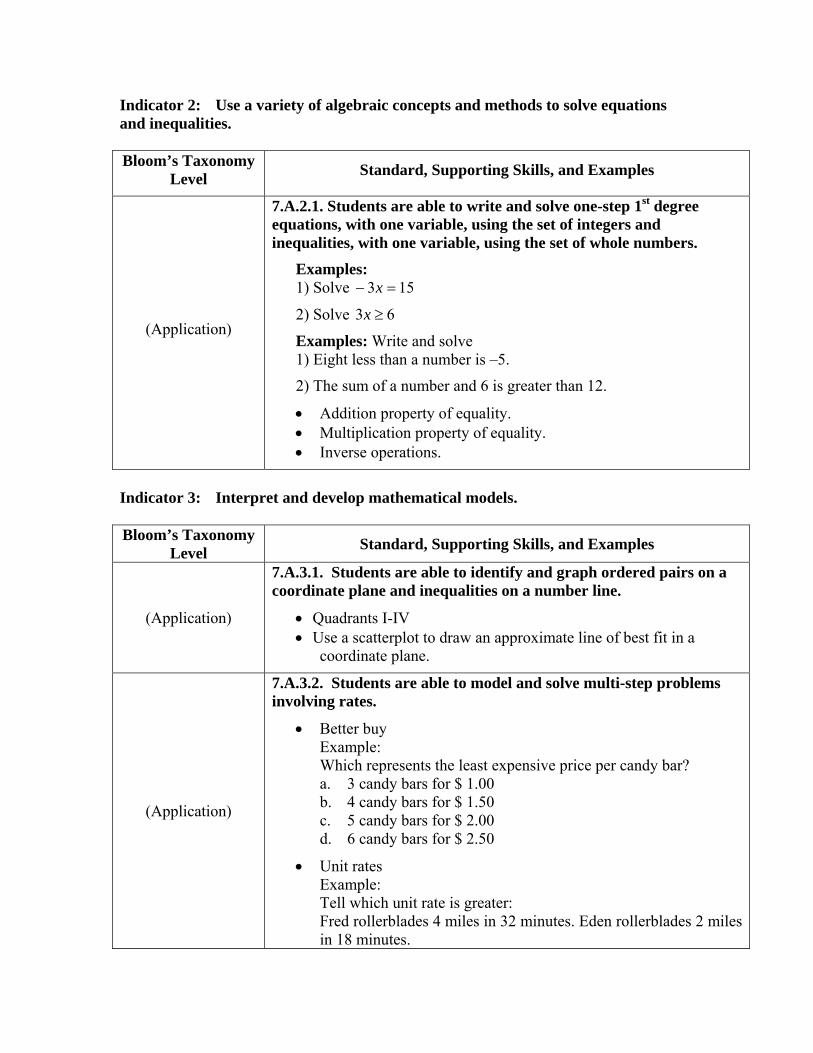
Indicator 2: Use a variety of algebraic concepts and methods to solve equations and inequalities. Bloom’s Taxonomy
Level Standard, Supporting Skills, and Examples
(Application)
7.A.2.1. Students are able to write and solve one-step 1st degree equations, with one variable, using the set of integers and inequalities, with one variable, using the set of whole numbers.
Examples: 1) Solve 153 =− x
2) Solve 63 ≥x
Examples: Write and solve 1) Eight less than a number is –5.
2) The sum of a number and 6 is greater than 12.
• Addition property of equality. • Multiplication property of equality. • Inverse operations.
Indicator 3: Interpret and develop mathematical models. Bloom’s Taxonomy
Level Standard, Supporting Skills, and Examples
(Application)
7.A.3.1. Students are able to identify and graph ordered pairs on a coordinate plane and inequalities on a number line.
• Quadrants I-IV • Use a scatterplot to draw an approximate line of best fit in a
coordinate plane.
(Application)
7.A.3.2. Students are able to model and solve multi-step problems involving rates.
• Better buy Example: Which represents the least expensive price per candy bar? a. 3 candy bars for $ 1.00 b. 4 candy bars for $ 1.50 c. 5 candy bars for $ 2.00 d. 6 candy bars for $ 2.50
• Unit rates Example: Tell which unit rate is greater: Fred rollerblades 4 miles in 32 minutes. Eden rollerblades 2 miles in 18 minutes.
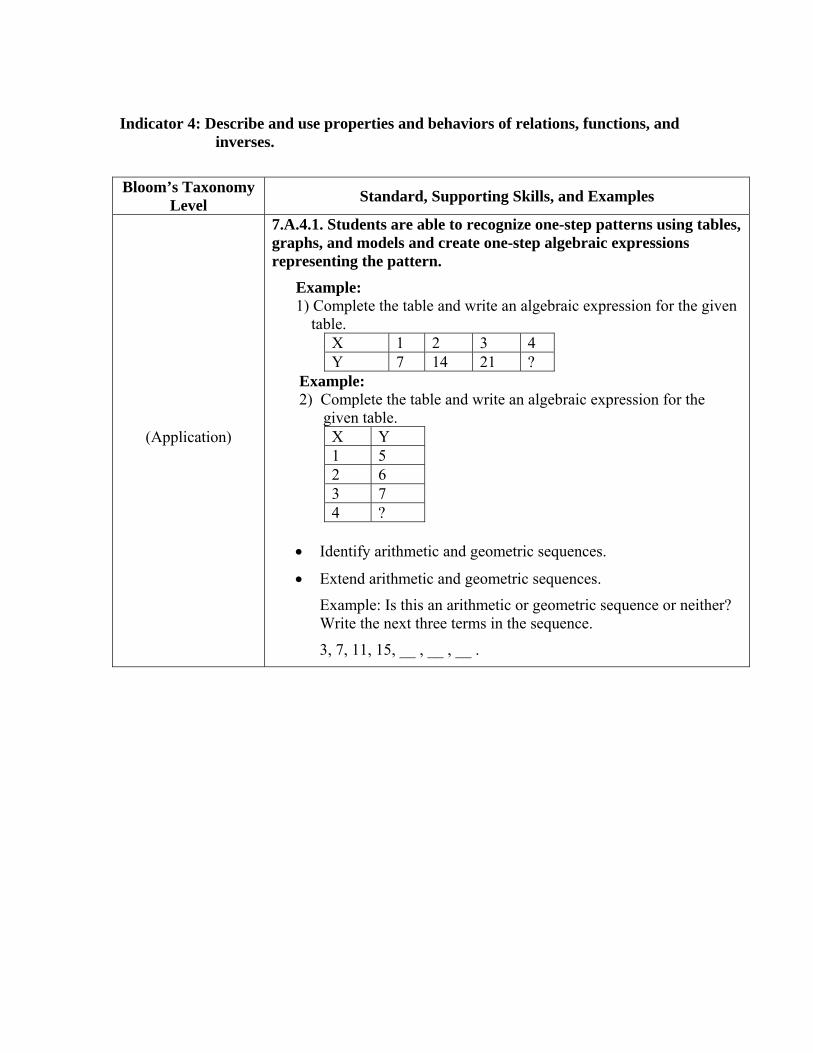
Indicator 4: Describe and use properties and behaviors of relations, functions, and
inverses.
Bloom’s Taxonomy Level Standard, Supporting Skills, and Examples
(Application)
7.A.4.1. Students are able to recognize one-step patterns using tables, graphs, and models and create one-step algebraic expressions representing the pattern.
Example: 1) Complete the table and write an algebraic expression for the given
table. X 1 2 3 4 Y 7 14 21 ?
Example: 2) Complete the table and write an algebraic expression for the
given table. X Y 1 5 2 6 3 7 4 ?
• Identify arithmetic and geometric sequences.
• Extend arithmetic and geometric sequences.
Example: Is this an arithmetic or geometric sequence or neither? Write the next three terms in the sequence.
3, 7, 11, 15, __ , __ , __ .
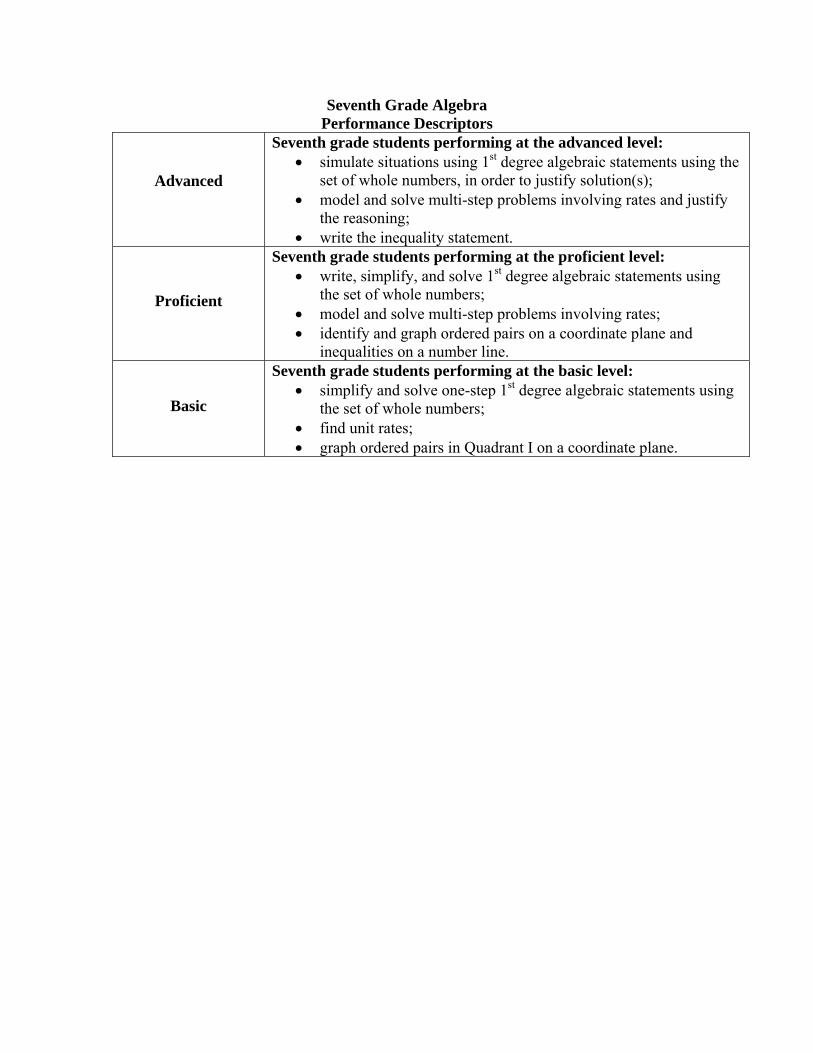
Seventh Grade Algebra Performance Descriptors
Advanced
Seventh grade students performing at the advanced level: • simulate situations using 1st degree algebraic statements using the
set of whole numbers, in order to justify solution(s); • model and solve multi-step problems involving rates and justify
the reasoning; • write the inequality statement.
Proficient
Seventh grade students performing at the proficient level: • write, simplify, and solve 1st degree algebraic statements using
the set of whole numbers; • model and solve multi-step problems involving rates; • identify and graph ordered pairs on a coordinate plane and
inequalities on a number line.
Basic
Seventh grade students performing at the basic level: • simplify and solve one-step 1st degree algebraic statements using
the set of whole numbers; • find unit rates; • graph ordered pairs in Quadrant I on a coordinate plane.
Seventh Grade Geometry Grade Standards, Supporting Skills, and Examples
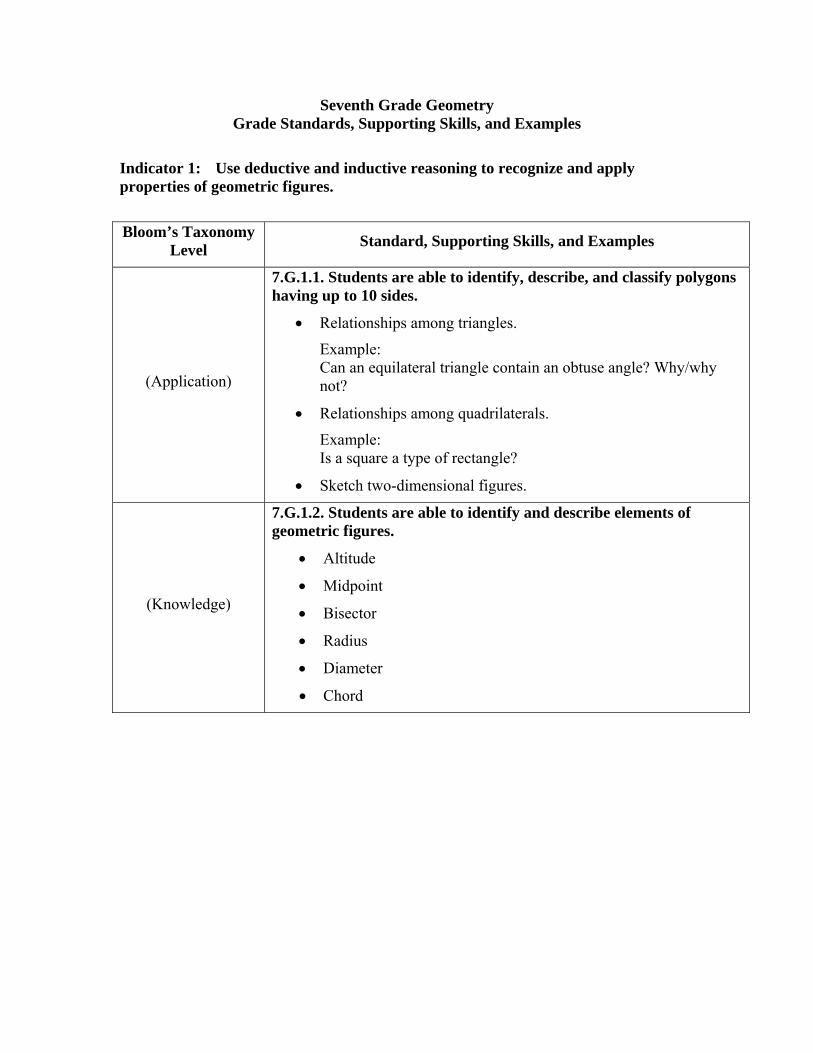
Indicator 1: Use deductive and inductive reasoning to recognize and apply properties of geometric figures.
Bloom’s Taxonomy Level Standard, Supporting Skills, and Examples
(Application)
7.G.1.1. Students are able to identify, describe, and classify polygons having up to 10 sides.
• Relationships among triangles.
Example: Can an equilateral triangle contain an obtuse angle? Why/why not?
• Relationships among quadrilaterals.
Example: Is a square a type of rectangle?
• Sketch two-dimensional figures.
(Knowledge)
7.G.1.2. Students are able to identify and describe elements of geometric figures.
• Altitude
• Midpoint
• Bisector
• Radius
• Diameter
• Chord
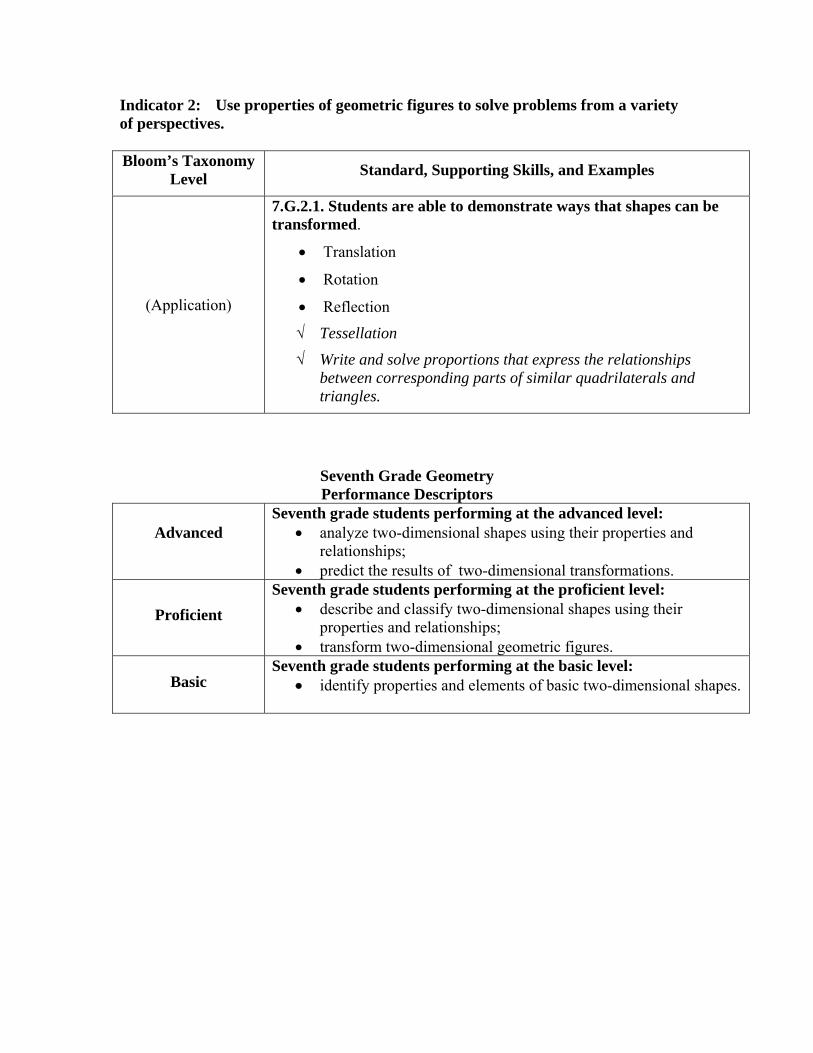
Indicator 2: Use properties of geometric figures to solve problems from a variety of perspectives. Bloom’s Taxonomy
Level Standard, Supporting Skills, and Examples
(Application)
7.G.2.1. Students are able to demonstrate ways that shapes can be transformed.
• Translation
• Rotation
• Reflection
√ Tessellation
√ Write and solve proportions that express the relationships between corresponding parts of similar quadrilaterals and triangles.
Seventh Grade Geometry Performance Descriptors
Advanced
Seventh grade students performing at the advanced level: • analyze two-dimensional shapes using their properties and
relationships; • predict the results of two-dimensional transformations.
Proficient
Seventh grade students performing at the proficient level: • describe and classify two-dimensional shapes using their
properties and relationships; • transform two-dimensional geometric figures.
Basic
Seventh grade students performing at the basic level: • identify properties and elements of basic two-dimensional shapes.
Seventh Grade Measurement Grade Standards, Supporting Skills, and Examples
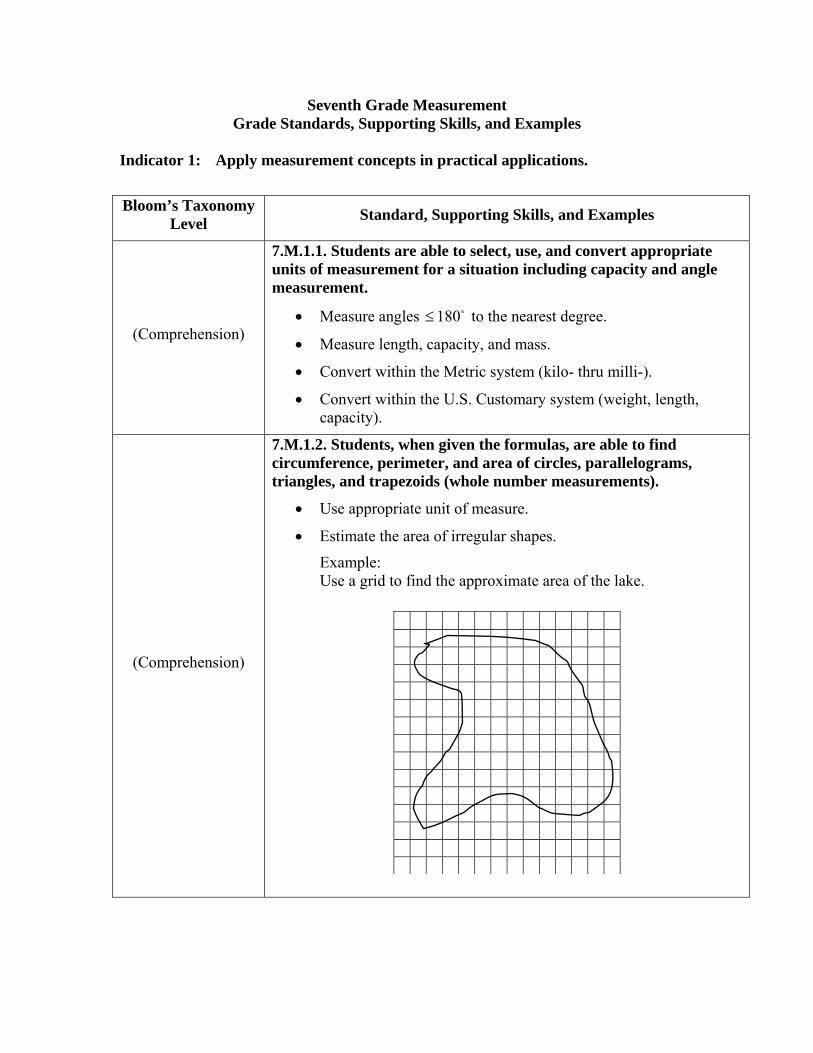
Indicator 1: Apply measurement concepts in practical applications.
Bloom’s Taxonomy Level Standard, Supporting Skills, and Examples
(Comprehension)
7.M.1.1. Students are able to select, use, and convert appropriate units of measurement for a situation including capacity and angle measurement.
• Measure angles o180≤ to the nearest degree.
• Measure length, capacity, and mass.
• Convert within the Metric system (kilo- thru milli-).
• Convert within the U.S. Customary system (weight, length, capacity).
(Comprehension)
7.M.1.2. Students, when given the formulas, are able to find circumference, perimeter, and area of circles, parallelograms, triangles, and trapezoids (whole number measurements).
• Use appropriate unit of measure.
• Estimate the area of irregular shapes.
Example: Use a grid to find the approximate area of the lake.
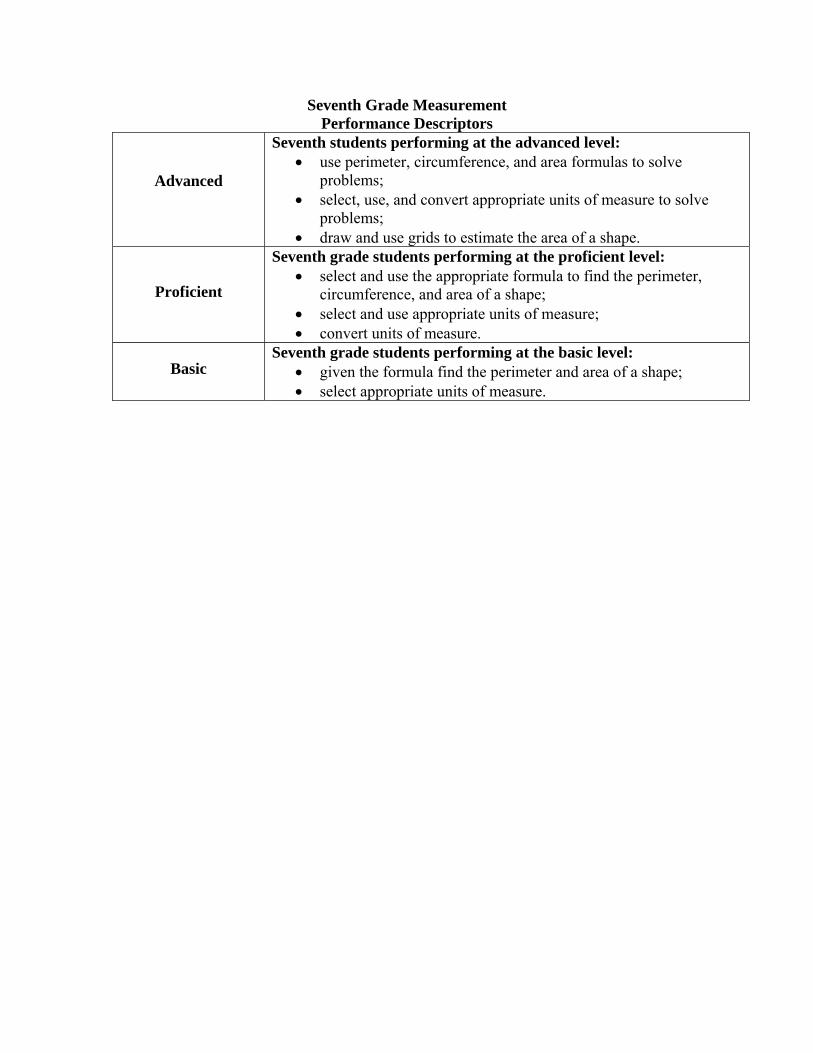
Seventh Grade Measurement Performance Descriptors
Advanced
Seventh students performing at the advanced level: • use perimeter, circumference, and area formulas to solve
problems; • select, use, and convert appropriate units of measure to solve
problems; • draw and use grids to estimate the area of a shape.
Proficient
Seventh grade students performing at the proficient level: • select and use the appropriate formula to find the perimeter,
circumference, and area of a shape; • select and use appropriate units of measure; • convert units of measure.
Basic
Seventh grade students performing at the basic level: • given the formula find the perimeter and area of a shape; • select appropriate units of measure.
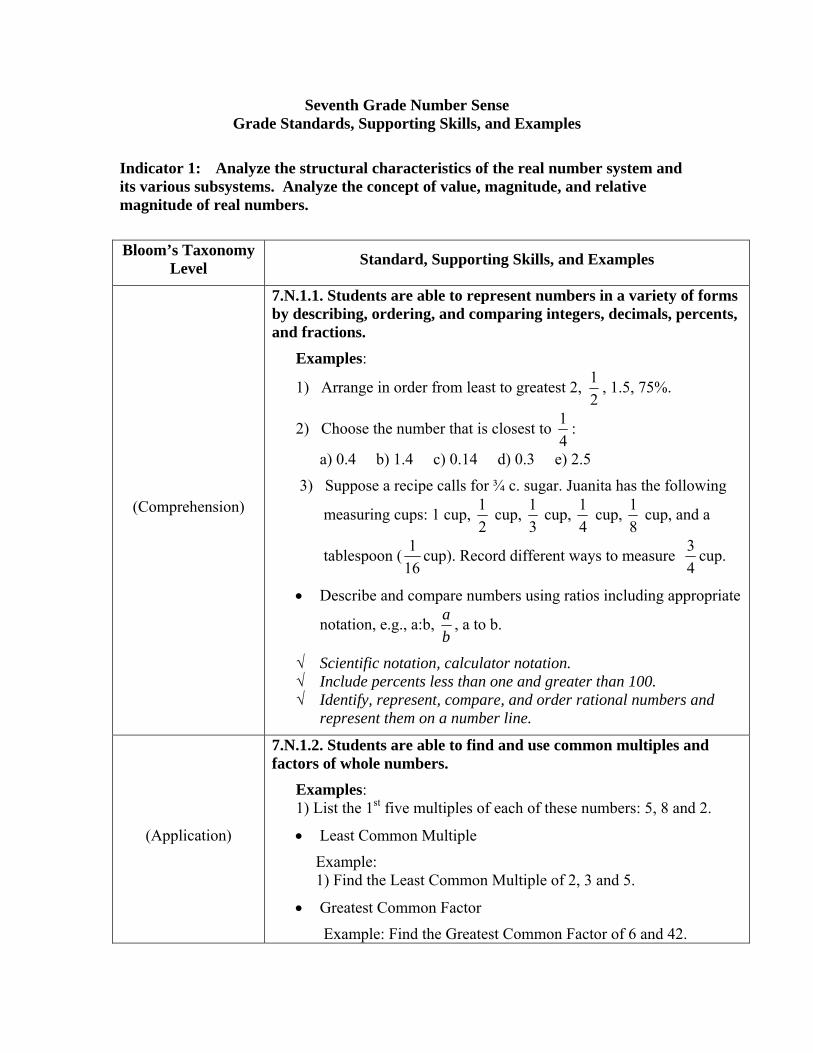
Seventh Grade Number Sense Grade Standards, Supporting Skills, and Examples
Indicator 1: Analyze the structural characteristics of the real number system and its various subsystems. Analyze the concept of value, magnitude, and relative magnitude of real numbers.
Bloom’s Taxonomy Level Standard, Supporting Skills, and Examples
(Comprehension)
7.N.1.1. Students are able to represent numbers in a variety of forms by describing, ordering, and comparing integers, decimals, percents, and fractions.
Examples:
1) Arrange in order from least to greatest 2, 21 , 1.5, 75%.
2) Choose the number that is closest to 41 :
a) 0.4 b) 1.4 c) 0.14 d) 0.3 e) 2.5
3) Suppose a recipe calls for ¾ c. sugar. Juanita has the following
measuring cups: 1 cup, 21 cup,
31 cup,
41 cup,
81 cup, and a
tablespoon (161 cup). Record different ways to measure
43 cup.
• Describe and compare numbers using ratios including appropriate
notation, e.g., a:b, ba , a to b.
√ Scientific notation, calculator notation. √ Include percents less than one and greater than 100. √ Identify, represent, compare, and order rational numbers and
represent them on a number line.
(Application)
7.N.1.2. Students are able to find and use common multiples and factors of whole numbers.
Examples: 1) List the 1st five multiples of each of these numbers: 5, 8 and 2.
• Least Common Multiple
Example: 1) Find the Least Common Multiple of 2, 3 and 5.
• Greatest Common Factor
Example: Find the Greatest Common Factor of 6 and 42.
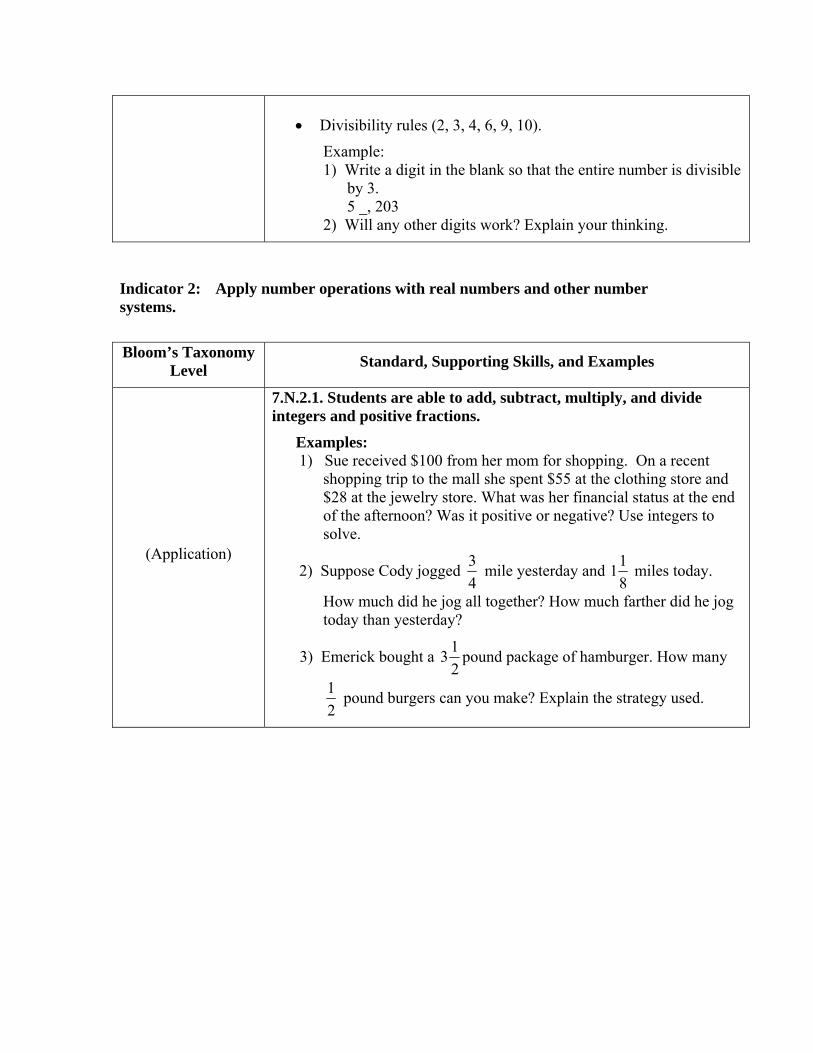
• Divisibility rules (2, 3, 4, 6, 9, 10).
Example: 1) Write a digit in the blank so that the entire number is divisible
by 3. 5 _, 203
2) Will any other digits work? Explain your thinking.
Indicator 2: Apply number operations with real numbers and other number systems.
Bloom’s Taxonomy Level Standard, Supporting Skills, and Examples
(Application)
7.N.2.1. Students are able to add, subtract, multiply, and divide integers and positive fractions.
Examples: 1) Sue received $100 from her mom for shopping. On a recent
shopping trip to the mall she spent $55 at the clothing store and $28 at the jewelry store. What was her financial status at the end of the afternoon? Was it positive or negative? Use integers to solve.
2) Suppose Cody jogged 43 mile yesterday and
811 miles today.
How much did he jog all together? How much farther did he jog today than yesterday?
3) Emerick bought a 213 pound package of hamburger. How many
21 pound burgers can you make? Explain the strategy used.
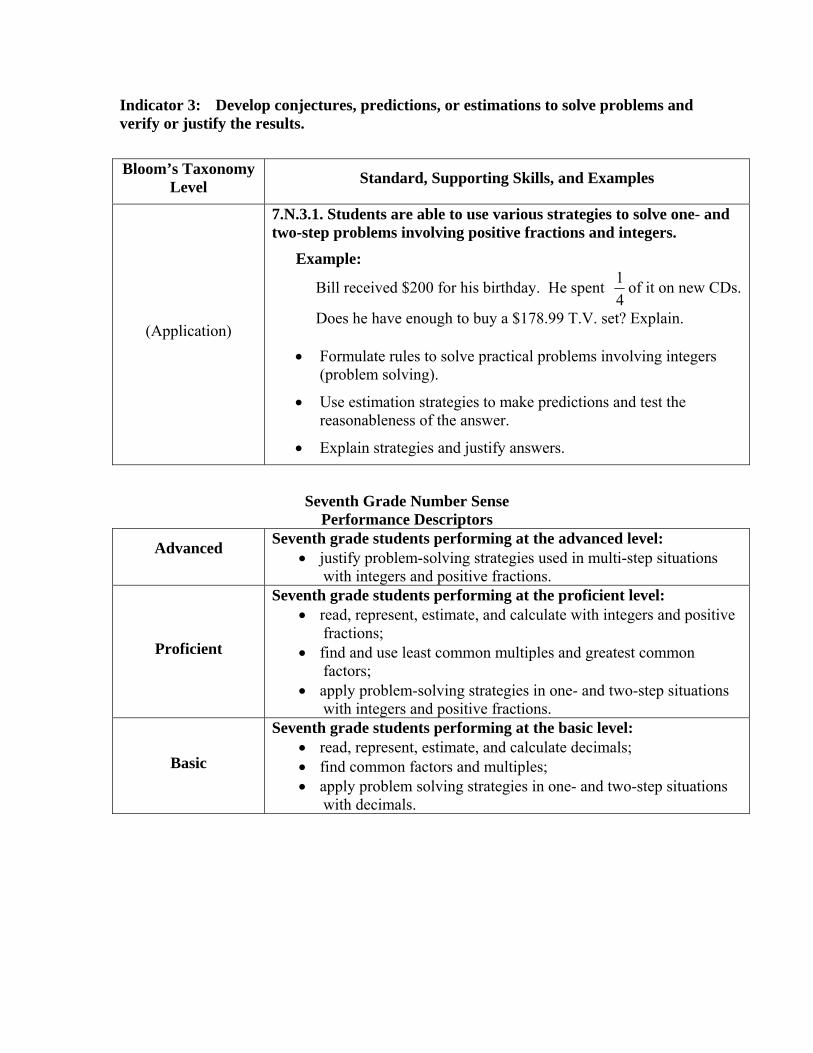
Indicator 3: Develop conjectures, predictions, or estimations to solve problems and verify or justify the results.
Bloom’s Taxonomy Level Standard, Supporting Skills, and Examples
(Application)
7.N.3.1. Students are able to use various strategies to solve one- and two-step problems involving positive fractions and integers.
Example:
Bill received $200 for his birthday. He spent 41 of it on new CDs.
Does he have enough to buy a $178.99 T.V. set? Explain.
• Formulate rules to solve practical problems involving integers (problem solving).
• Use estimation strategies to make predictions and test the reasonableness of the answer.
• Explain strategies and justify answers.
Seventh Grade Number Sense Performance Descriptors
Advanced
Seventh grade students performing at the advanced level: • justify problem-solving strategies used in multi-step situations
with integers and positive fractions.
Proficient
Seventh grade students performing at the proficient level: • read, represent, estimate, and calculate with integers and positive
fractions; • find and use least common multiples and greatest common
factors; • apply problem-solving strategies in one- and two-step situations
with integers and positive fractions.
Basic
Seventh grade students performing at the basic level: • read, represent, estimate, and calculate decimals; • find common factors and multiples; • apply problem solving strategies in one- and two-step situations
with decimals.
Seventh Grade Statistics & Probability Grade Standards, Supporting Skills, and Examples
Indicator 1: Use statistical models to gather, analyze, and display data to draw conclusions.
Bloom’s Taxonomy Level Standard, Supporting Skills, and Examples
(Comprehension)
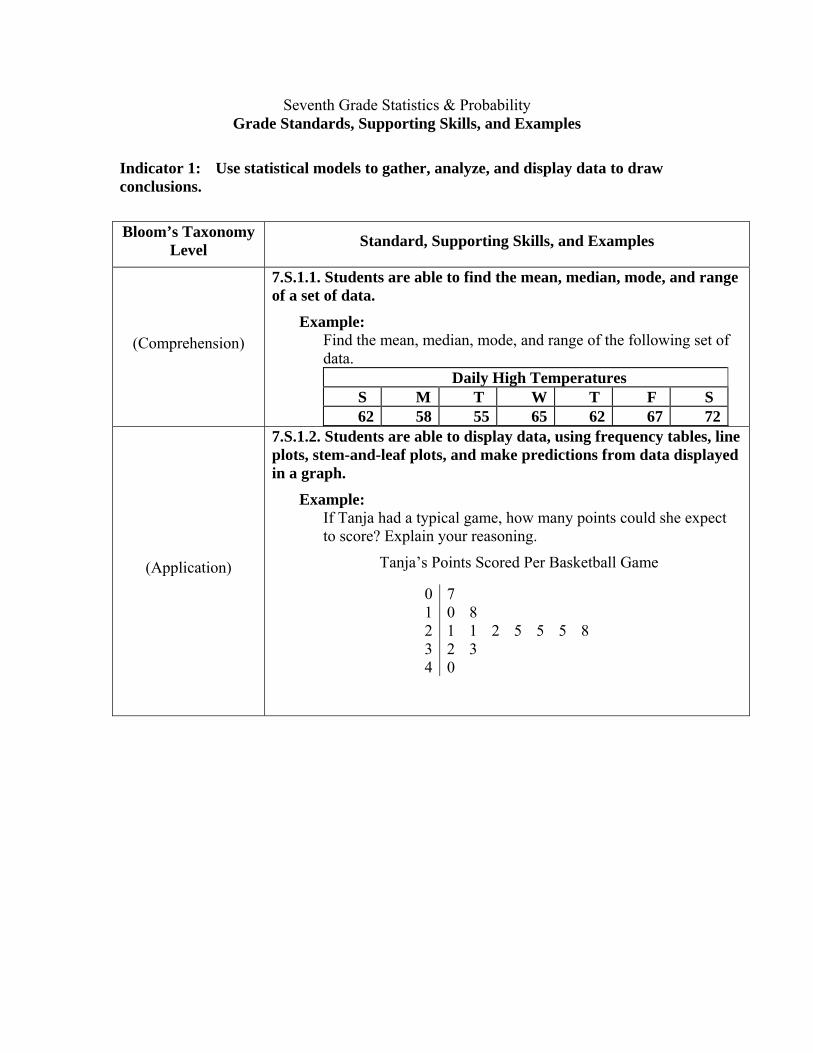
7.S.1.1. Students are able to find the mean, median, mode, and range of a set of data.
Example: Find the mean, median, mode, and range of the following set of data.
Daily High Temperatures S M T W T F S 62 58 55 65 62 67 72
(Application)
7.S.1.2. Students are able to display data, using frequency tables, line plots, stem-and-leaf plots, and make predictions from data displayed in a graph.
Example: If Tanja had a typical game, how many points could she expect to score? Explain your reasoning.
Tanja’s Points Scored Per Basketball Game
0 7 1 0 8 2 1 1 2 5 5 5 8 3 2 3 4 0
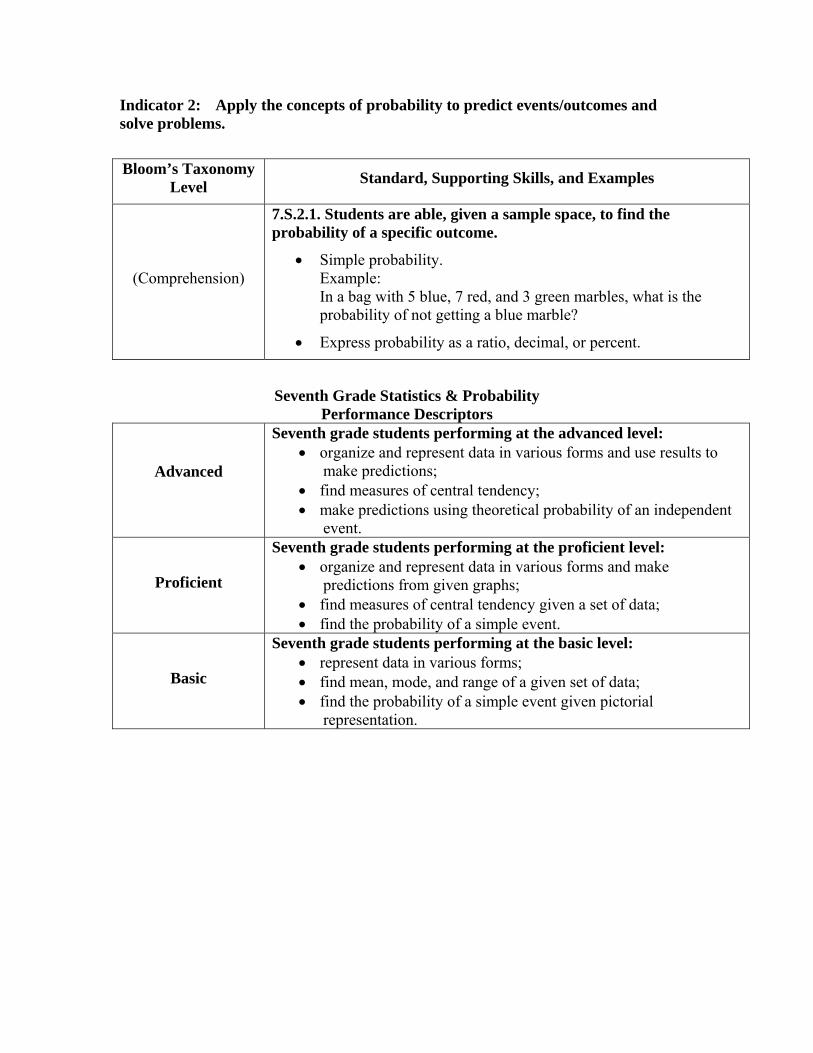
Indicator 2: Apply the concepts of probability to predict events/outcomes and solve problems.
Bloom’s Taxonomy Level Standard, Supporting Skills, and Examples
(Comprehension)
7.S.2.1. Students are able, given a sample space, to find the probability of a specific outcome.
• Simple probability. Example: In a bag with 5 blue, 7 red, and 3 green marbles, what is the probability of not getting a blue marble?
• Express probability as a ratio, decimal, or percent.
Seventh Grade Statistics & Probability Performance Descriptors
Advanced
Seventh grade students performing at the advanced level: • organize and represent data in various forms and use results to
make predictions; • find measures of central tendency; • make predictions using theoretical probability of an independent
event.
Proficient
Seventh grade students performing at the proficient level: • organize and represent data in various forms and make
predictions from given graphs; • find measures of central tendency given a set of data; • find the probability of a simple event.
Basic
Seventh grade students performing at the basic level: • represent data in various forms; • find mean, mode, and range of a given set of data; • find the probability of a simple event given pictorial
representation.
Eighth Grade Algebra Grade Standards, Supporting Skills, and Examples
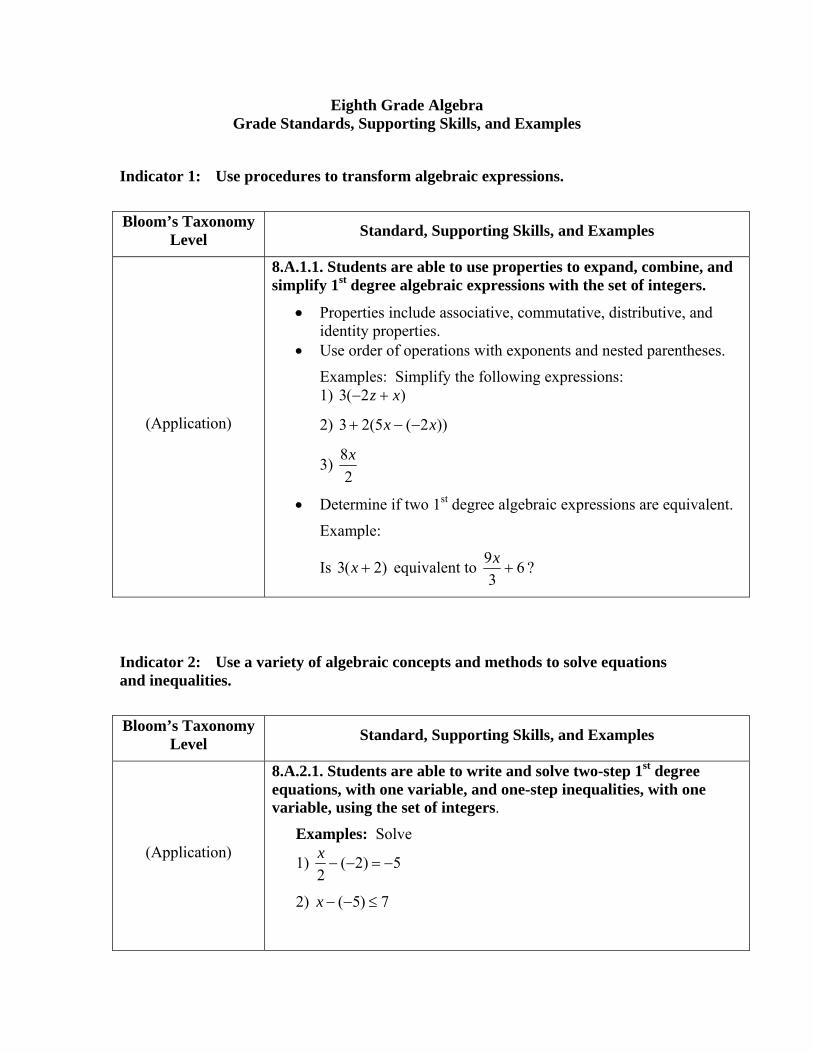
Indicator 1: Use procedures to transform algebraic expressions.
Bloom’s Taxonomy Level Standard, Supporting Skills, and Examples
(Application)
8.A.1.1. Students are able to use properties to expand, combine, and simplify 1st degree algebraic expressions with the set of integers.
• Properties include associative, commutative, distributive, and identity properties.
• Use order of operations with exponents and nested parentheses.
Examples: Simplify the following expressions: 1) )2(3 xz +−
2) ))2(5(23 xx −−+
3) 2
8x
• Determine if two 1st degree algebraic expressions are equivalent.
Example:
Is )2(3 +x equivalent to 63
9+
x ?
Indicator 2: Use a variety of algebraic concepts and methods to solve equations and inequalities.
Bloom’s Taxonomy Level Standard, Supporting Skills, and Examples
(Application)
8.A.2.1. Students are able to write and solve two-step 1st degree equations, with one variable, and one-step inequalities, with one variable, using the set of integers.
Examples: Solve
1) 5)2(2
−=−−x
2) 7)5( ≤−−x
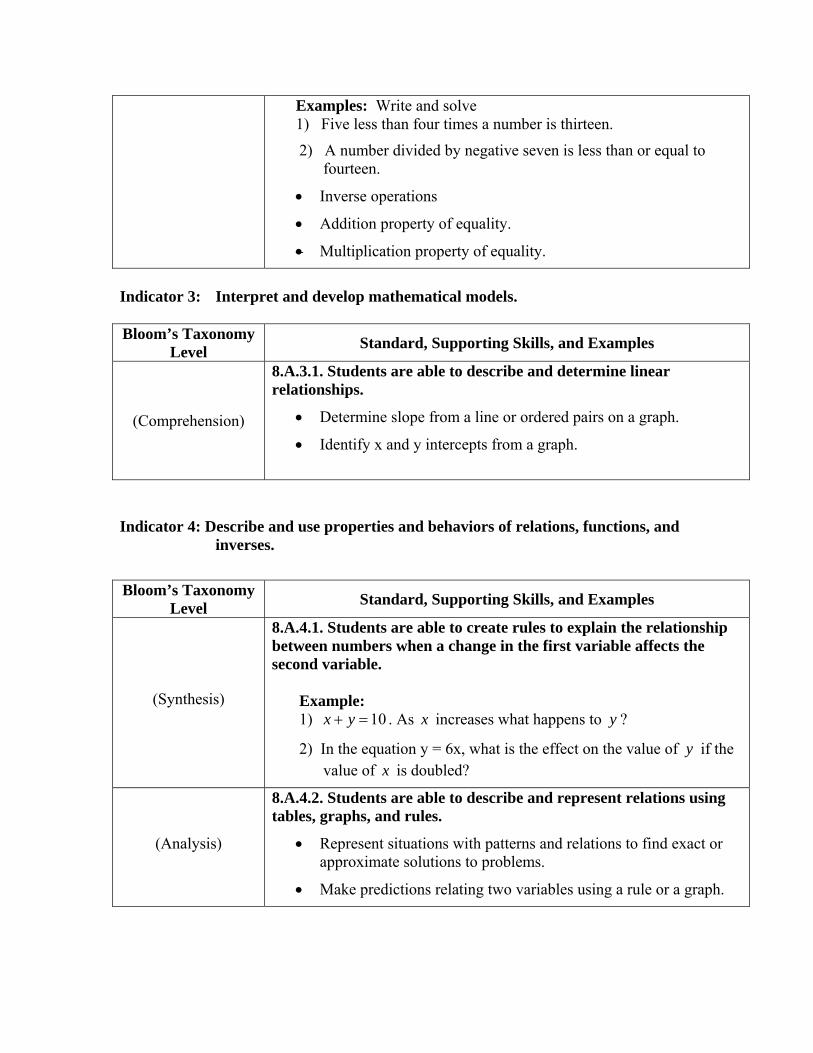
Examples: Write and solve 1) Five less than four times a number is thirteen.
2) A number divided by negative seven is less than or equal to fourteen.
• Inverse operations
• Addition property of equality.
• Multiplication property of equality.
Indicator 3: Interpret and develop mathematical models. Bloom’s Taxonomy
Level Standard, Supporting Skills, and Examples
(Comprehension)
8.A.3.1. Students are able to describe and determine linear relationships.
• Determine slope from a line or ordered pairs on a graph.
• Identify x and y intercepts from a graph.
Indicator 4: Describe and use properties and behaviors of relations, functions, and
inverses.
Bloom’s Taxonomy Level Standard, Supporting Skills, and Examples
(Synthesis)
8.A.4.1. Students are able to create rules to explain the relationship between numbers when a change in the first variable affects the second variable.
Example: 1) 10=+ yx . As x increases what happens to y ?
2) In the equation y = 6x, what is the effect on the value of y if the value of x is doubled?
(Analysis)
8.A.4.2. Students are able to describe and represent relations using tables, graphs, and rules.
• Represent situations with patterns and relations to find exact or approximate solutions to problems.
• Make predictions relating two variables using a rule or a graph.
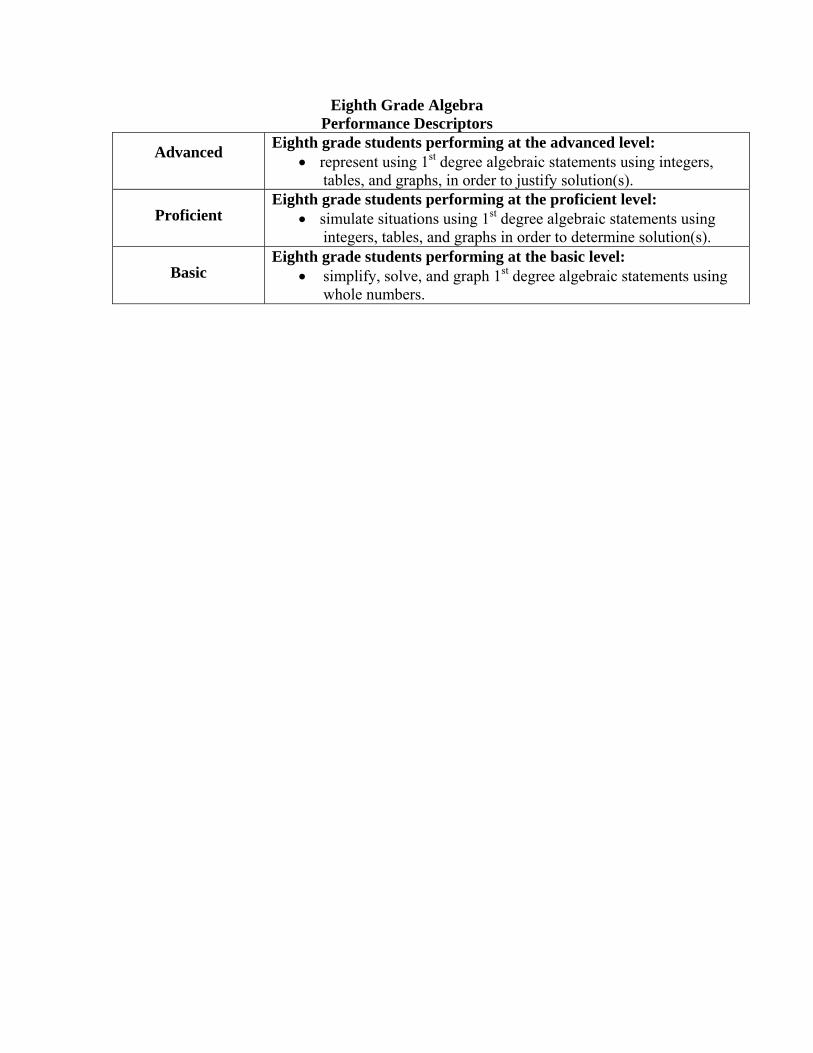
Eighth Grade Algebra Performance Descriptors
Advanced
Eighth grade students performing at the advanced level: • represent using 1st degree algebraic statements using integers,
tables, and graphs, in order to justify solution(s).
Proficient
Eighth grade students performing at the proficient level: • simulate situations using 1st degree algebraic statements using
integers, tables, and graphs in order to determine solution(s).
Basic
Eighth grade students performing at the basic level: • simplify, solve, and graph 1st degree algebraic statements using
whole numbers.

Eighth Grade Geometry
Grade Standards, Supporting Skills, and Examples
Indicator 1: Use deductive and inductive reasoning to recognize and apply properties of geometric figures.
Bloom’s Taxonomy Level
Standard, Supporting Skills, and Examples
(Application) 8.G.1.1. Students are able to describe and classify prisms, pyramids, cylinders, and cone.
Example: Classify the solid. How many edges does it have? How many vertices? How many faces does it have?
• Faces, edges, and vertices.
√ Nets.
(Application)
8.G.1.2. Students, when given any two sides of an illustrated right triangle, are able to use the Pythagorean Theorem to find the third side.
Example: A baseball diamond is a square. How far does the catcher have to throw when he throws the ball to second?
90 ft
90 ft 90 ft
90 ft
second
home plate
• Given the formula.
• Using whole numbers for the known values.
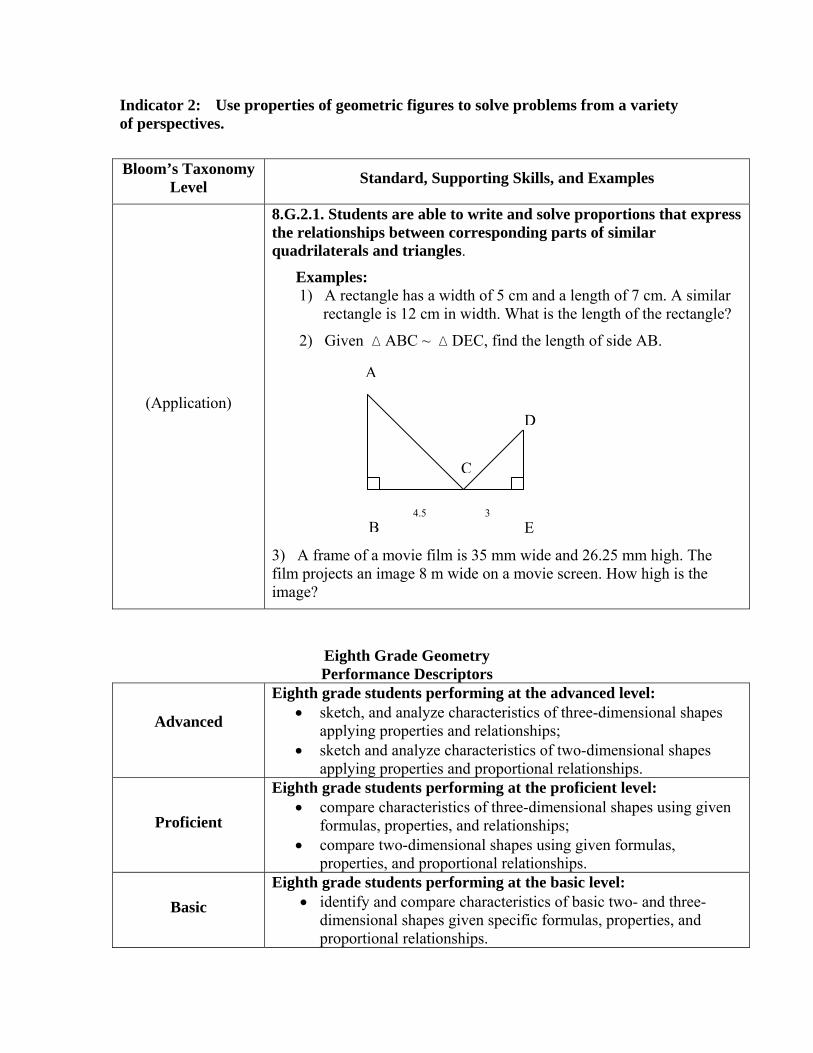
Indicator 2: Use properties of geometric figures to solve problems from a variety of perspectives.
Bloom’s Taxonomy Level Standard, Supporting Skills, and Examples
(Application)
8.G.2.1. Students are able to write and solve proportions that express the relationships between corresponding parts of similar quadrilaterals and triangles.
Examples: 1) A rectangle has a width of 5 cm and a length of 7 cm. A similar
rectangle is 12 cm in width. What is the length of the rectangle?
2) Given ∆ ABC ~ ∆ DEC, find the length of side AB.
3) A frame of a movie film is 35 mm wide and 26.25 mm high. The film projects an image 8 m wide on a movie screen. How high is the image?
Eighth Grade Geometry Performance Descriptors
Advanced
Eighth grade students performing at the advanced level: • sketch, and analyze characteristics of three-dimensional shapes
applying properties and relationships; • sketch and analyze characteristics of two-dimensional shapes
applying properties and proportional relationships.
Proficient
Eighth grade students performing at the proficient level: • compare characteristics of three-dimensional shapes using given
formulas, properties, and relationships; • compare two-dimensional shapes using given formulas,
properties, and proportional relationships.
Basic
Eighth grade students performing at the basic level: • identify and compare characteristics of basic two- and three-
dimensional shapes given specific formulas, properties, and proportional relationships.
A
4.5 3
C
B
D
E

8
8
4
44
4
Eighth Grade Measurement Grade Standards, Supporting Skills, and Examples
Indicator 1: Apply measurement concepts in practical applications.
Bloom’s Taxonomy Level Standard, Supporting Skills, and Examples
(Application)
8.M.1.1. Students are able to apply proportional reasoning to solve measurement problems with rational number measurements.
• Conversion within measurement systems.
• Use scale drawings to represent situations.
• Indirect measurement.
Examples: 1) One of the models of King Kong was 18 inches tall. How
tall was King Kong in the movie if the scale is 3 in. = 4 ft.? 2) A lake front building that is 26 ft. high casts a shadow on the
water. How long is the shadow if a 10 ft. high truck parked nearby casts a 7 ft. shadow?
(Comprehension)
8.M.1.2. Students are able to find area, volume, and surface area with whole number measurements.
• Use appropriate unit of measure
• Apply strategies and/or formulas.
• Volume of rectangular prisms, rectangular pyramids, cylinders, and cones.
• Surface area of rectangular prisms and cylinders.
• Area of composite shapes.
Example: Find the area of the figure.

Eighth Grade Measurement Performance Descriptors
Advanced
Eighth students performing at the advanced level: • solve measurement problems without pictorial representation; • apply formulas for volume and surface area to solve problems; • write appropriate formulas to find the area of composite shapes.
Proficient
Eighth grade students performing at the proficient level: • solve measurement problems given pictorial representation; • select and use formulas to find volume and surface area; • find area of composite shapes.
Basic
Eighth grade students performing at the basic level: • convert units within a measurement system; • find area and volume given the formula.
Eighth Grade Number Sense
Grade Standards, Supporting Skills, and Examples
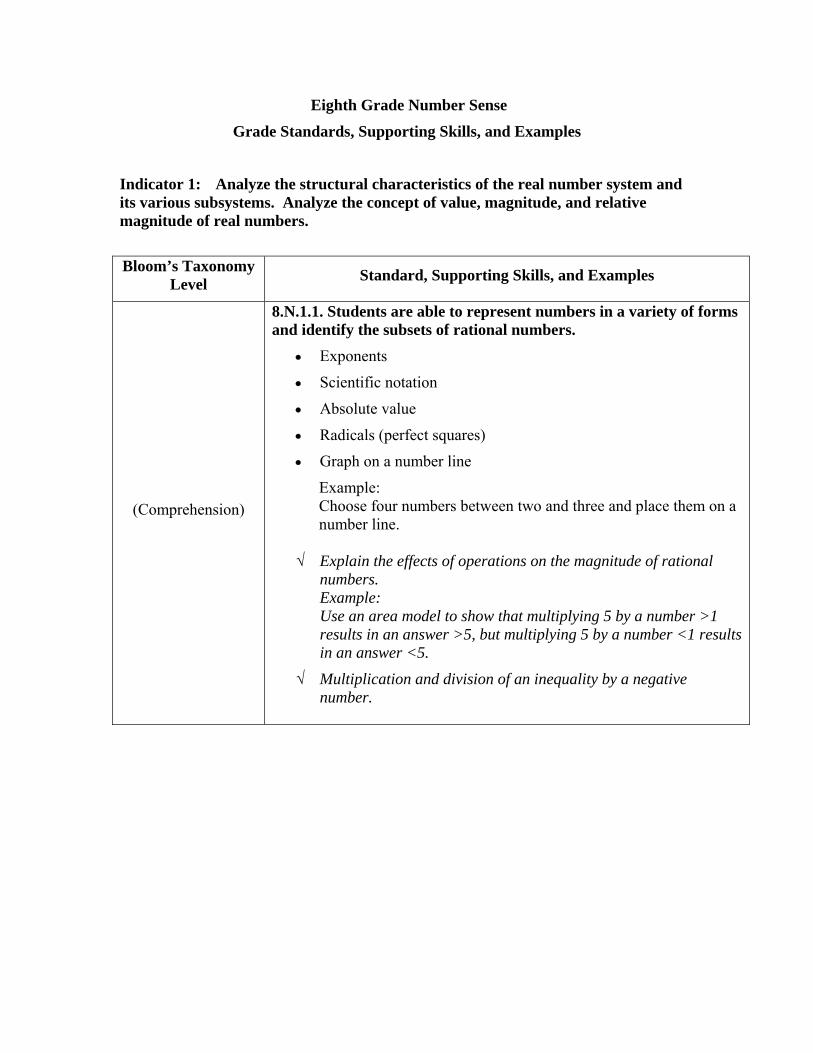
Indicator 1: Analyze the structural characteristics of the real number system and its various subsystems. Analyze the concept of value, magnitude, and relative magnitude of real numbers.
Bloom’s Taxonomy Level Standard, Supporting Skills, and Examples
(Comprehension)
8.N.1.1. Students are able to represent numbers in a variety of forms and identify the subsets of rational numbers.
• Exponents
• Scientific notation
• Absolute value
• Radicals (perfect squares)
• Graph on a number line
Example: Choose four numbers between two and three and place them on a number line.
√ Explain the effects of operations on the magnitude of rational numbers. Example: Use an area model to show that multiplying 5 by a number >1 results in an answer >5, but multiplying 5 by a number <1 results in an answer <5.
√ Multiplication and division of an inequality by a negative number.
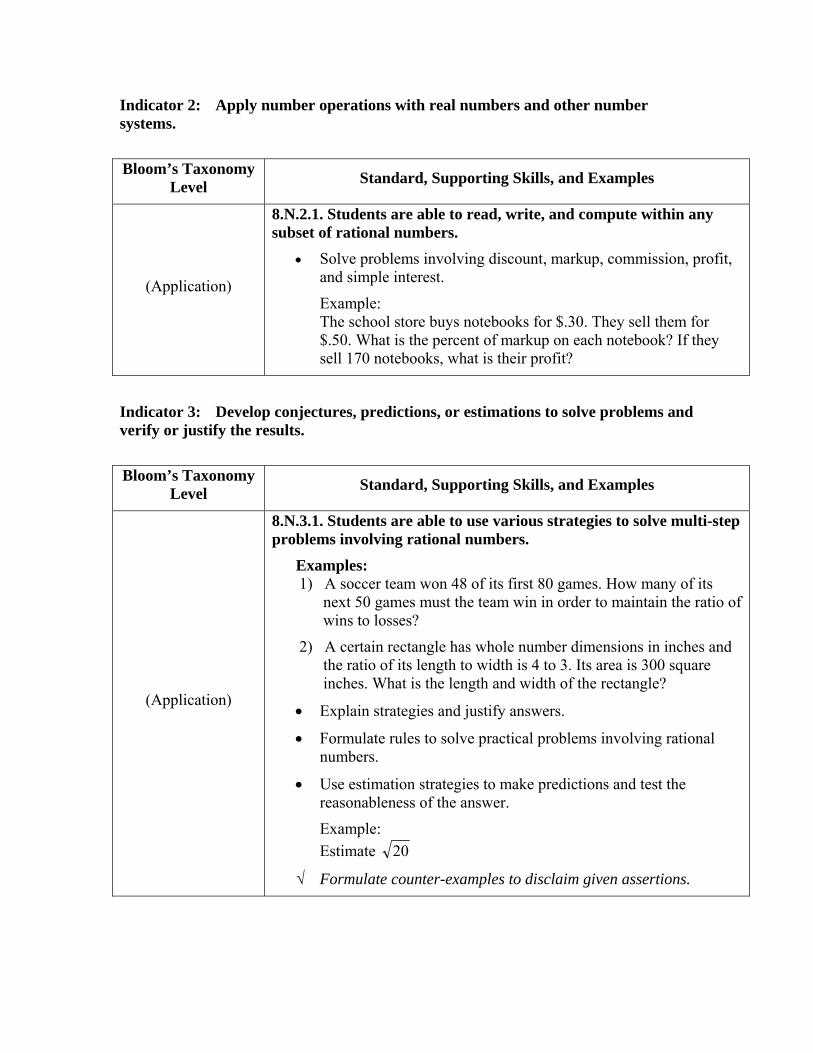
Indicator 2: Apply number operations with real numbers and other number systems.
Bloom’s Taxonomy Level Standard, Supporting Skills, and Examples
(Application)
8.N.2.1. Students are able to read, write, and compute within any subset of rational numbers.
• Solve problems involving discount, markup, commission, profit, and simple interest.
Example: The school store buys notebooks for $.30. They sell them for $.50. What is the percent of markup on each notebook? If they sell 170 notebooks, what is their profit?
Indicator 3: Develop conjectures, predictions, or estimations to solve problems and verify or justify the results.
Bloom’s Taxonomy Level Standard, Supporting Skills, and Examples
(Application)
8.N.3.1. Students are able to use various strategies to solve multi-step problems involving rational numbers.
Examples: 1) A soccer team won 48 of its first 80 games. How many of its
next 50 games must the team win in order to maintain the ratio of wins to losses?
2) A certain rectangle has whole number dimensions in inches and the ratio of its length to width is 4 to 3. Its area is 300 square inches. What is the length and width of the rectangle?
• Explain strategies and justify answers.
• Formulate rules to solve practical problems involving rational numbers.
• Use estimation strategies to make predictions and test the reasonableness of the answer.
Example: Estimate 20
√ Formulate counter-examples to disclaim given assertions.
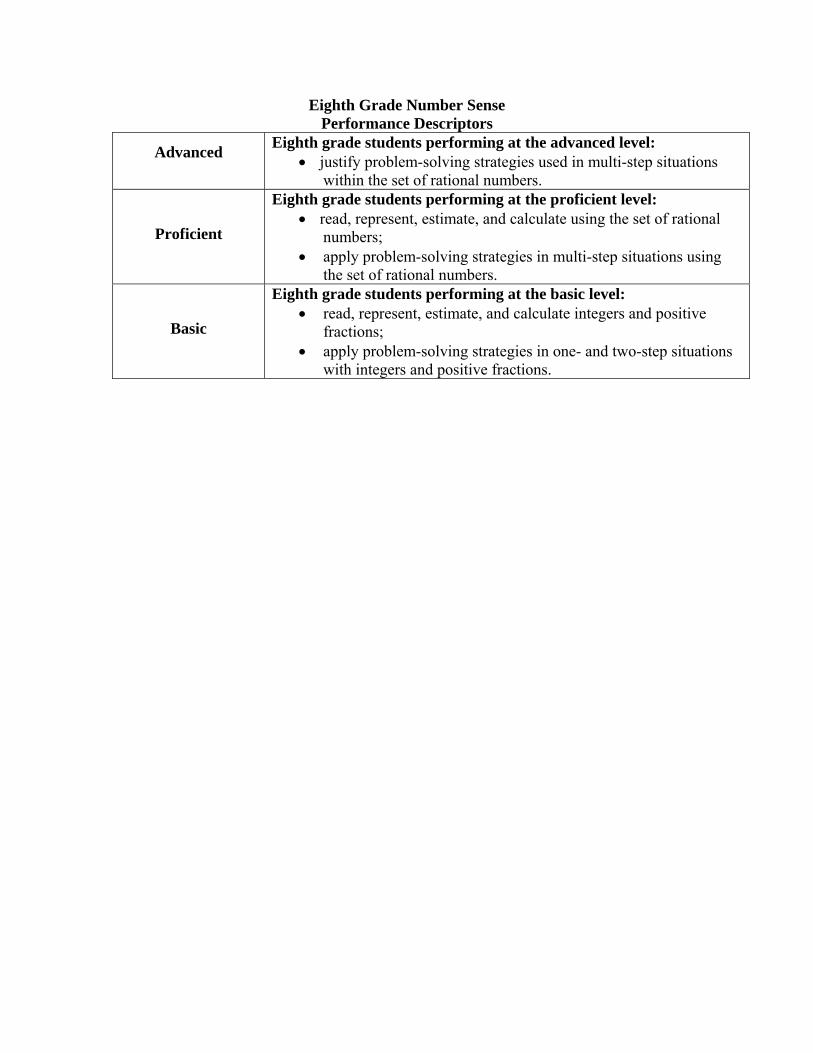
Eighth Grade Number Sense Performance Descriptors
Advanced
Eighth grade students performing at the advanced level: • justify problem-solving strategies used in multi-step situations
within the set of rational numbers.
Proficient
Eighth grade students performing at the proficient level: • read, represent, estimate, and calculate using the set of rational
numbers; • apply problem-solving strategies in multi-step situations using
the set of rational numbers.
Basic
Eighth grade students performing at the basic level: • read, represent, estimate, and calculate integers and positive
fractions; • apply problem-solving strategies in one- and two-step situations
with integers and positive fractions.
Eighth Grade Statistics & Probability Grade Standards, Supporting Skills, and Examples
Indicator 1: Use statistical models to gather, analyze, and display data to draw conclusions.
Bloom’s Taxonomy Level Standard, Supporting Skills, and Examples
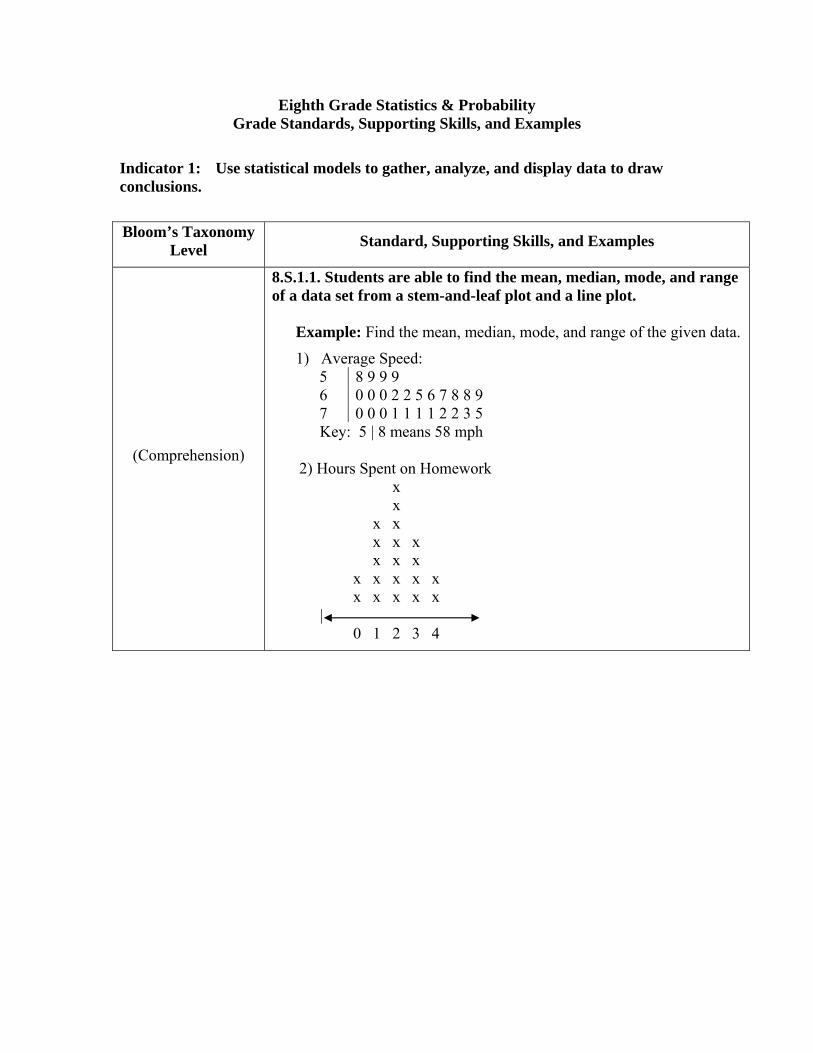
(Comprehension)
8.S.1.1. Students are able to find the mean, median, mode, and range of a data set from a stem-and-leaf plot and a line plot.
Example: Find the mean, median, mode, and range of the given data.
1) Average Speed: 5 8 9 9 9 6 0 0 0 2 2 5 6 7 8 8 9 7 0 0 0 1 1 1 1 2 2 3 5 Key: 5 | 8 means 58 mph
2) Hours Spent on Homework xx
xxxxx
xxxxxxx
xxxx
xx
| 0 1 2 3 4
(Application)
8.S.1.2. Students are able to use a variety of visual representations to display data to make comparisons and predictions.
• Double bar graph
• Double line graph
• Scatterplot Example: At 10 minutes, predict the amount of water that had been leaked.
ml_
Wat
erLe
aked
10
20
30
40
50
min_Time1 2 3 4 5 6 7 8 9
Faucet Water Leak Scatter Plot
Indicator 2: Apply the concepts of probability to predict events/outcomes and solve problems.
Bloom’s Taxonomy Level Standard, Supporting Skills, and Examples
(Comprehension)
8.S.2.1. Students are able to find the sample space and compute probability for two simultaneous independent events.
Examples: 1) What is the probability of getting a head and a three when
flipping a coin and rolling a number cube? 2) Jamie has three different colored shirts and two different colored
pairs of pants. Using a tree diagram, table or organized list, find how many different outfits she can make.
• Express probability as a ratio, decimal, or percent.

Eighth Grade Statistics & Probability Performance Descriptors
Advanced
Eighth grade students performing at the advanced level: • choose the measure of central tendency that best represents the
data; • make predictions using probability for two independent events.
Proficient
Eighth grade students performing at the proficient level: • represent data in various forms and use results to make
predictions and comparisons; • find measures of central tendency; • compute the probability for two independent events.
Basic
Eighth grade students performing at the basic level: • represent data in various forms; • find the mean and mode of a given set of data; • find the probability of a simple event.
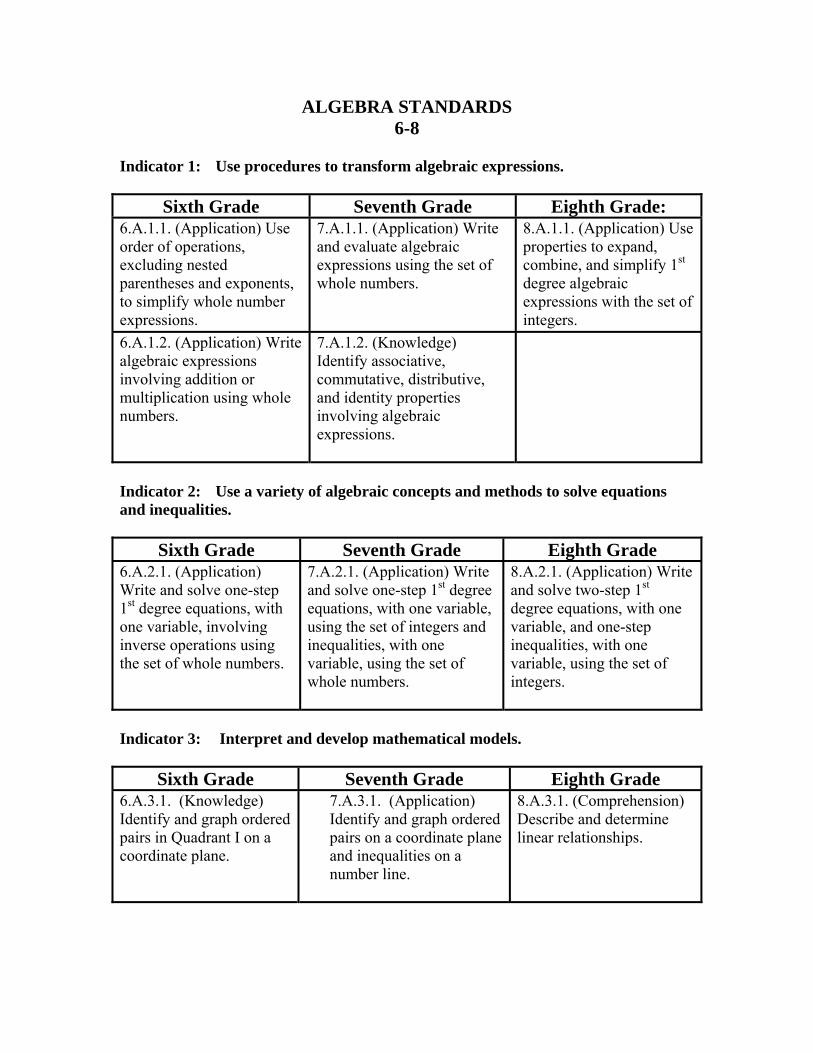
ALGEBRA STANDARDS 6-8
Indicator 1: Use procedures to transform algebraic expressions.
Sixth Grade Seventh Grade Eighth Grade: 6.A.1.1. (Application) Use order of operations, excluding nested parentheses and exponents, to simplify whole number expressions.
7.A.1.1. (Application) Write and evaluate algebraic expressions using the set of whole numbers.
8.A.1.1. (Application) Use properties to expand, combine, and simplify 1st degree algebraic expressions with the set of integers.
6.A.1.2. (Application) Write algebraic expressions involving addition or multiplication using whole numbers.
7.A.1.2. (Knowledge) Identify associative, commutative, distributive, and identity properties involving algebraic expressions.
Indicator 2: Use a variety of algebraic concepts and methods to solve equations and inequalities.
Sixth Grade Seventh Grade Eighth Grade 6.A.2.1. (Application) Write and solve one-step 1st degree equations, with one variable, involving inverse operations using the set of whole numbers.
7.A.2.1. (Application) Write and solve one-step 1st degree equations, with one variable, using the set of integers and inequalities, with one variable, using the set of whole numbers.
8.A.2.1. (Application) Write and solve two-step 1st degree equations, with one variable, and one-step inequalities, with one variable, using the set of integers.
Indicator 3: Interpret and develop mathematical models.
Sixth Grade Seventh Grade Eighth Grade 6.A.3.1. (Knowledge) Identify and graph ordered pairs in Quadrant I on a coordinate plane.
7.A.3.1. (Application) Identify and graph ordered pairs on a coordinate plane and inequalities on a number line.
8.A.3.1. (Comprehension) Describe and determine linear relationships.
6.A.3.2. (Application) Solve one-step problems involving ratios and rates.
7.A.3.2. (Application) Model and solve multi-step problems involving rates.
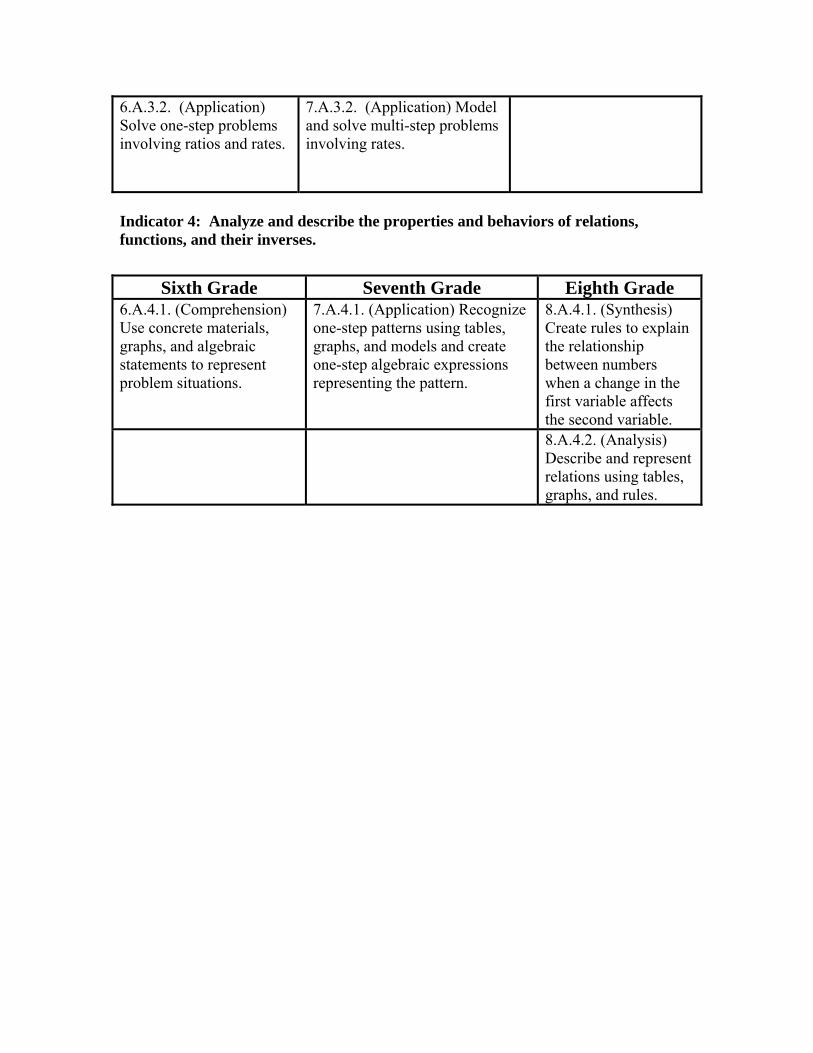
Indicator 4: Analyze and describe the properties and behaviors of relations, functions, and their inverses.
Sixth Grade Seventh Grade Eighth Grade
6.A.4.1. (Comprehension) Use concrete materials, graphs, and algebraic statements to represent problem situations.
7.A.4.1. (Application) Recognize one-step patterns using tables, graphs, and models and create one-step algebraic expressions representing the pattern.
8.A.4.1. (Synthesis) Create rules to explain the relationship between numbers when a change in the first variable affects the second variable.
8.A.4.2. (Analysis) Describe and represent relations using tables, graphs, and rules.

GEOMETRY STANDARDS 6-8
Indicator 1: Use deductive and inductive reasoning to recognize and apply properties of geometric figures.
Sixth Grade Seventh Grade Eighth Grade 6.G.1.1. (Comprehension) Identify and describe the characteristics of triangles and quadrilaterals.
7.G.1.1. (Application) Identify, describe, and classify polygons having up to 10 sides.
8.G.1.1. Describe and classify prisms, pyramids, cylinders, and cones.
6.G.1.2. (Comprehension) Identify and describe angles.
7.G.1.2. (Knowledge) Identify and describe elements of geometric figures.
8.G.1.2. (Application) Given any two sides of an illustrated right triangle, use the Pythagorean Theorem to find the third side.
Indicator 2: Use properties of geometric figures to solve problems from a variety of perspectives
Sixth Grade Seventh Grade Eighth Grade 6.G.2.1. (Application) Use basic shapes to demonstrate geometric concepts.
7.G.2.1. (Application) Demonstrate ways that shapes can be transformed.
8.G.2.1. (Application) Write and solve proportions that express the relationships between corresponding parts of similar quadrilaterals and triangles.
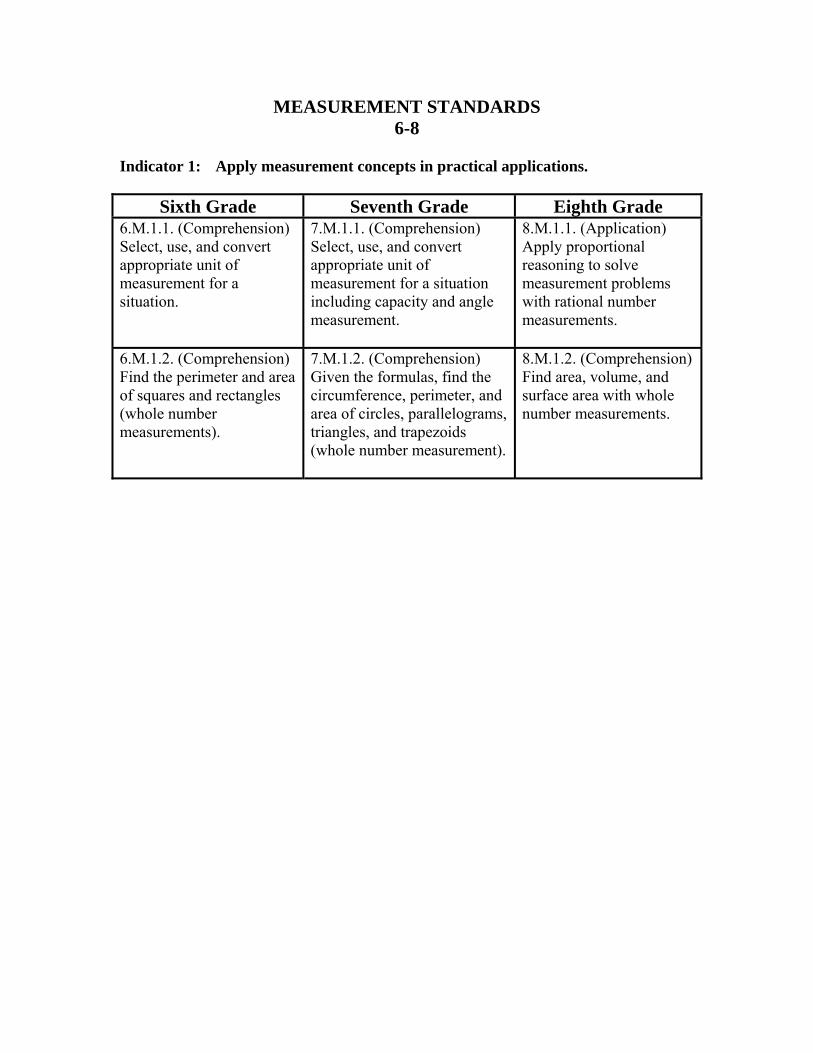
MEASUREMENT STANDARDS 6-8
Indicator 1: Apply measurement concepts in practical applications.
Sixth Grade Seventh Grade Eighth Grade 6.M.1.1. (Comprehension) Select, use, and convert appropriate unit of measurement for a situation.
7.M.1.1. (Comprehension) Select, use, and convert appropriate unit of measurement for a situation including capacity and angle measurement.
8.M.1.1. (Application) Apply proportional reasoning to solve measurement problems with rational number measurements.
6.M.1.2. (Comprehension) Find the perimeter and area of squares and rectangles (whole number measurements).
7.M.1.2. (Comprehension) Given the formulas, find the circumference, perimeter, and area of circles, parallelograms, triangles, and trapezoids (whole number measurement).
8.M.1.2. (Comprehension) Find area, volume, and surface area with whole number measurements.
NUMBER SENSE STANDARDS 6-8
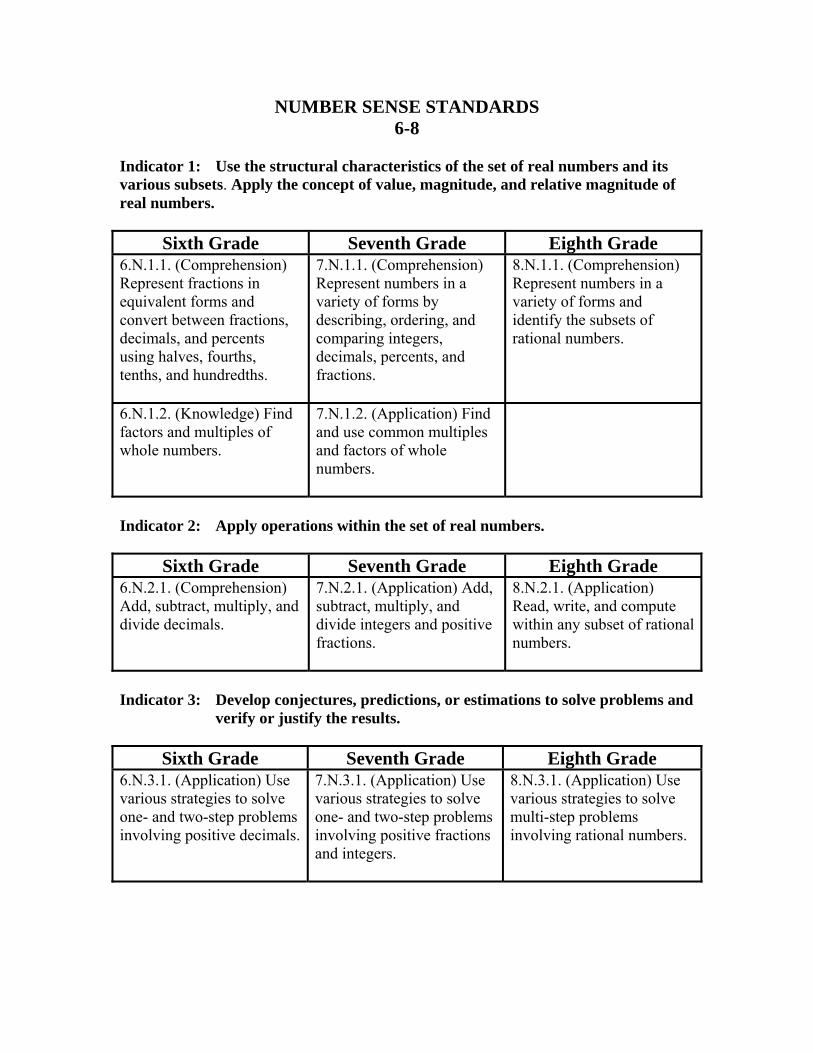
Indicator 1: Use the structural characteristics of the set of real numbers and its various subsets. Apply the concept of value, magnitude, and relative magnitude of real numbers.
Sixth Grade Seventh Grade Eighth Grade 6.N.1.1. (Comprehension) Represent fractions in equivalent forms and convert between fractions, decimals, and percents using halves, fourths, tenths, and hundredths.
7.N.1.1. (Comprehension) Represent numbers in a variety of forms by describing, ordering, and comparing integers, decimals, percents, and fractions.
8.N.1.1. (Comprehension) Represent numbers in a variety of forms and identify the subsets of rational numbers.
6.N.1.2. (Knowledge) Find factors and multiples of whole numbers.
7.N.1.2. (Application) Find and use common multiples and factors of whole numbers.
Indicator 2: Apply operations within the set of real numbers.
Sixth Grade Seventh Grade Eighth Grade 6.N.2.1. (Comprehension) Add, subtract, multiply, and divide decimals.
7.N.2.1. (Application) Add, subtract, multiply, and divide integers and positive fractions.
8.N.2.1. (Application) Read, write, and compute within any subset of rational numbers.
Indicator 3: Develop conjectures, predictions, or estimations to solve problems and
verify or justify the results.
Sixth Grade Seventh Grade Eighth Grade 6.N.3.1. (Application) Use various strategies to solve one- and two-step problems involving positive decimals.
7.N.3.1. (Application) Use various strategies to solve one- and two-step problems involving positive fractions and integers.
8.N.3.1. (Application) Use various strategies to solve multi-step problems involving rational numbers.
STATISTICS & PROBABILITY 6-8
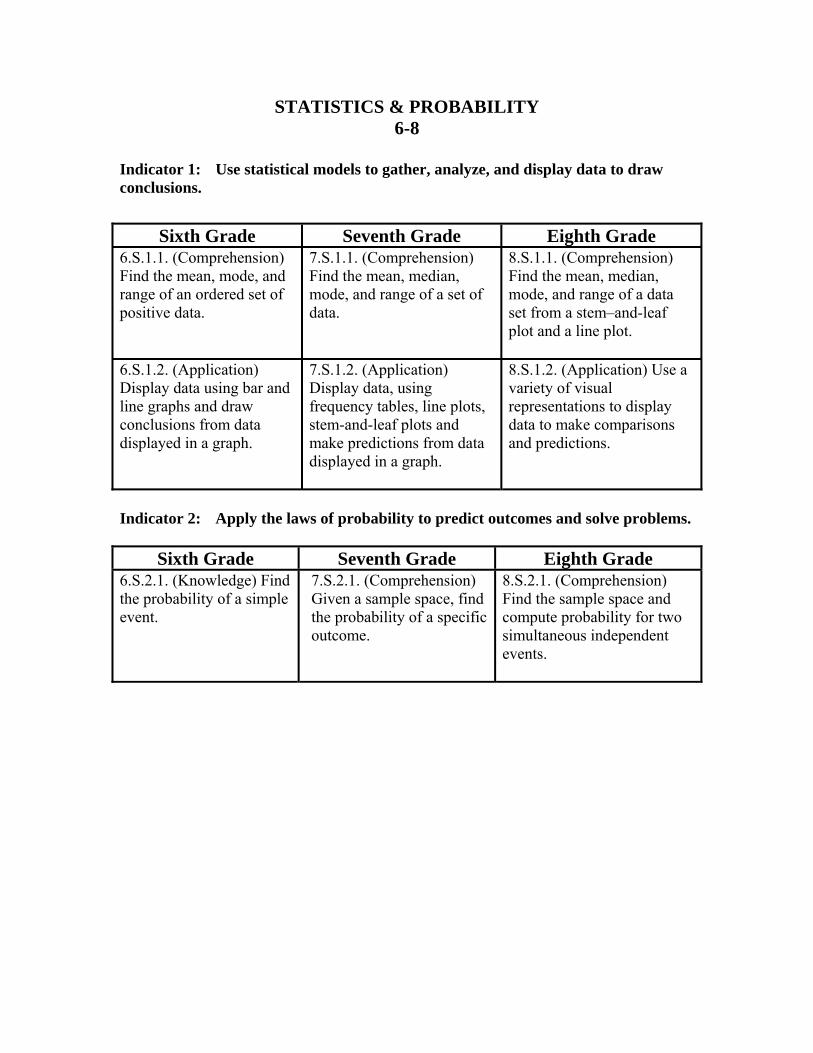
Indicator 1: Use statistical models to gather, analyze, and display data to draw conclusions.
Sixth Grade Seventh Grade Eighth Grade
6.S.1.1. (Comprehension) Find the mean, mode, and range of an ordered set of positive data.
7.S.1.1. (Comprehension) Find the mean, median, mode, and range of a set of data.
8.S.1.1. (Comprehension) Find the mean, median, mode, and range of a data set from a stem–and-leaf plot and a line plot.
6.S.1.2. (Application) Display data using bar and line graphs and draw conclusions from data displayed in a graph.
7.S.1.2. (Application) Display data, using frequency tables, line plots, stem-and-leaf plots and make predictions from data displayed in a graph.
8.S.1.2. (Application) Use a variety of visual representations to display data to make comparisons and predictions.
Indicator 2: Apply the laws of probability to predict outcomes and solve problems.
Sixth Grade Seventh Grade Eighth Grade 6.S.2.1. (Knowledge) Find the probability of a simple event.
7.S.2.1. (Comprehension) Given a sample space, find the probability of a specific outcome.
8.S.2.1. (Comprehension) Find the sample space and compute probability for two simultaneous independent events.