Embed Size (px)
Citation preview
South Dakota
Ambient Air Monitoring
Annual Network Plan
2012
South Dakota Department of Environment and
Natural Resources
Air Quality Program
i
Table of Contents
Section Page
Executive Summary .................................................................................................................... vii
1.0 INTRODUCTION.............................................................................................................. 1
2.0 AMBIENT AIR MONITORING NETWORK HISTORY ............................................ 1
3.0 AIR MONITORING GOALS ........................................................................................... 3
4.0 AIR MONITORING PLAN .............................................................................................. 3 4.1 State and Local Air Monitoring Stations (SLAMS) ............................................ 4 4.2 Special Purpose Monitoring (SPM) ....................................................................... 4 4.3 Air Toxics Monitoring Sites ................................................................................... 5
4.4 Prevention of Significant Deterioration (PSD) Monitoring Sites ....................... 5 4.5 IMPROVE Network ............................................................................................... 5 4.6 Radiation Network (RadNet) ................................................................................. 6
4.7 National Core Multi-Pollutant Site ....................................................................... 6
5.0 AMBIENT AIR MONITORING NEEDS ....................................................................... 8
5.1 Monitoring State’s Largest Population Centers .................................................. 8 5.2 Real Time Data ........................................................................................................ 9 5.3 Class I Areas ............................................................................................................ 9
5.4 Ozone Monitoring ................................................................................................. 10 5.5 PM2.5 Monitoring .................................................................................................. 10
5.6 Metropolitan Statistical Areas ............................................................................. 10 5.7 Future Monitoring ................................................................................................ 14
6.0 COMPLIANCE WITH NAAQS .................................................................................... 14 6.1 Particulate Matter (PM10) .................................................................................... 14
6.2 Particulate Matter (PM2.5) ................................................................................... 17 6.2.1 PM2.5 24-Hour Standard .......................................................................... 17 6.2.2 PM2.5 Annual Standard ............................................................................ 20
6.3 Lead ........................................................................................................................ 22 6.4 Ozone ...................................................................................................................... 23 6.5 Sulfur Dioxide........................................................................................................ 25
6.5.1 Sulfur Dioxide 1-Hour Standard ............................................................. 25 6.5.2 Sulfur Dioxide 3-Hour Secondary Standard ........................................... 26
6.6 Nitrogen Dioxide ................................................................................................... 27 6.6.1 Nitrogen Dioxide 1-Hour Standard ......................................................... 27
6.6.2 Nitrogen Dioxide Annual Standard ......................................................... 29 6.7 Carbon Monoxide ................................................................................................. 30
7.0 AIR MONITORING SITE EVALUATION AND TRENDS ...................................... 31 7.1 Rapid City Area .................................................................................................... 31
7.1.1 RC Library Site ......................................................................................... 32
ii
7.1.2 RC National Guard Site ........................................................................... 35
7.1.3 RC Credit Union Site ................................................................................ 37 7.2 RC Credit Union Site – Sulfur Dioxide ............................................................... 41
7.3 Black Hawk Site .................................................................................................... 42 7.3.1 Black Hawk Site – PM10 Data .................................................................. 44 7.3.2 Black Hawk Site – Ozone Data ................................................................ 45
7.4 Badlands Site ......................................................................................................... 46 7.4.1 Badlands Site – PM10 Data ...................................................................... 48
7.4.2 Badlands Site – PM2.5 Data ...................................................................... 49 7.4.3 Badlands Site – Sulfur Dioxide Data ...................................................... 49 7.4.4 Badlands Site – Ozone Data ..................................................................... 50 7.4.5 Badlands Site – Nitrogen Dioxide Data .................................................. 51
7.5 Wind Cave Site ...................................................................................................... 52
7.5.1 Wind Cave Site – PM10 Data .................................................................... 53 7.5.2 Wind Cave Site – PM 2.5 Data................................................................. 54
7.5.3 Wind Cave Site – Sulfur Dioxide Data .................................................... 55
7.5.4 Wind Cave Site – Nitrogen Dioxide Data ................................................ 55 7.5.5 Wind Cave Site – Ozone Data .................................................................. 56
7.5 Sioux Falls Area .................................................................................................... 57
7.5.1 KELO Site ................................................................................................. 57 7.5.2 SD School Site .......................................................................................... 59
7.5.3 SD School Site – Nitrogen Dioxide Data ................................................. 65 7.6 Aberdeen Area ...................................................................................................... 66
7.6.1 Fire Station #1 Site – PM10 Data ............................................................. 67
7.6.2 Fire Station #1 Site – PM2.5 Data ............................................................ 68 7.7 Brookings Area...................................................................................................... 69
7.7.1 City Hall Site ............................................................................................. 69 7.7.2 Research Farm Site .................................................................................. 72
7.8 Watertown Area .................................................................................................... 74 7.8.1 Watertown Site – PM10 Data .................................................................... 76 7.8.2 Watertown Site – PM2.5 Data ................................................................... 76
7.9 Union County Area ............................................................................................... 77 7.9.1 UC #1 Site ................................................................................................. 77
7.9.2 UC #2 Site ................................................................................................. 79 7.9.3 UC #1 and UC #2 Sites – PM10 Data ....................................................... 81 7.9.4 UC #1 and UC #2 Sites – PM2.5 Data ...................................................... 82
7.9.5 UC #1 and UC #2 Sites – Sulfur Dioxide Data ....................................... 83 7.9.6 UC #1 and UC #2 Sites – Nitrogen Dioxide Data ................................... 84
7.9.7 UC #1 Site – Carbon Monoxide Data ...................................................... 84 7.9.8 UC #3 Site ................................................................................................. 85
8.0 SPECIAL AIR QUALITY MONITORING .................................................................. 87 8.1 Urban Air Toxics Monitoring Program .............................................................. 87 8.2 PM2.5 Speciation Monitoring Program ................................................................ 89
iii
9.0 NETWORK MODIFICATIONS FOR 2011 and 2012 ................................................. 91
9.1 New Sites ................................................................................................................ 91 9.2 Modifications ......................................................................................................... 92
9.3 Sites Closed ............................................................................................................ 92
10.0 REQUEST FOR WAIVER ............................................................................................. 92
11.0 CONCLUSIONS .............................................................................................................. 92
12.0 REFERENCES ................................................................................................................. 93
iv
List of Tables Table Page
Table 5-1 – 10 Largest Cities in South Dakota ............................................................................... 8 Table 5-2 – 10 Counties With the Highest Populations .................................................................. 8 Table 5-3 – 40 CFR Part 58, Appendix D Requirements for MSA .............................................. 12 Table 6-1 – Statewide PM10 24-Hour Concentrations .................................................................. 15
Table 6-2 – Statewide PM2.5 24-Hour Concentrations ................................................................. 18 Table 6-3 – Statewide PM2.5 Annual Concentrations ................................................................... 20 Table 6-4 – Statewide Ozone 4
th highest Concentrations ............................................................. 23
Table 6-5 – 2011 Statewide Sulfur Dioxide 1-hour Design Values ............................................. 25 Table 6-6 – Nitrogen Dioxide 1-hour 98
th Percentile Concentrations .......................................... 28
Table 7-1 – RC Library Site Specifics .......................................................................................... 33 Table 7-2 – RC National Guard Site Specifics ............................................................................. 36
Table 7-3 – RC Credit Union Site Specifics ................................................................................. 38 Table 7-4 – Black Hawk Site Specifics ........................................................................................ 44 Table 7-5 – Badlands Site Specifics ............................................................................................. 47 Table 7-6 – Wind Cave Site Specifics .......................................................................................... 52 Table 7-7 - KELO Site Specifics .................................................................................................. 58 Table 7-8 – SD School Site Specifics ........................................................................................... 60 Table 7-9 – Fire Station #1 Site Specifics .................................................................................... 67
Table 7-10 – City Hall Site Specifics ........................................................................................... 70 Table 7-11 – Research Farm Site Specifics .................................................................................. 73
Table 7-12 – Watertown Site Specifics ........................................................................................ 75 Table 7-13 – UC #1 Site Specifics ................................................................................................ 78 Table 7-14 – UC #2 Site Specifics ................................................................................................ 80
Table 7-15 – UC #3 Site Specifics ................................................................................................ 86
v
List of Figures
Figure Page
Figure 4-1 –South Dakota Air Monitoring Sites............................................................................. 4 Figure 4-2 – SD School Site Area Map .......................................................................................... 7 Figure 6-1 – 2011 PM10 Design Values Statewide ....................................................................... 16 Figure 6-2 – 2011 PM2.5 Statewide 24-Hour design values .......................................................... 19 Figure 6-3 – 2011 PM2.5 Statewide Annual Design Values .......................................................... 22
Figure 6-4 – 2011 Ozone Design Values Statewide ..................................................................... 24 Figure 6-5 – 2010 Sulfur Dioxide 1-Hour Concentrations ........................................................... 26 Figure 6-6 – 2011 Sulfur Dioxide 3-hour Concentrations ............................................................ 27 Figure 6-7 – 2011 Nitrogen Dioxide 1-hour Design Values ........................................................ 29 Figure 6-8 – 2011 Nitrogen Dioxide Annual Concentration ........................................................ 29
Figure 7-1 – RC Library Site ........................................................................................................ 33
Figure 7-2 – RC Library Site – PM10 Annual Averages ............................................................... 34 Figure 7-3 – RC Library Site PM2.5 Annual Averages ................................................................. 35 Figure 7-4 – RC National Guard Site ........................................................................................... 36
Figure 7-5 – RC National Guard PM10 Annual Averages ............................................................ 37 Figure 7-6 – RC Credit Union Site ............................................................................................... 38
Figure 7-7 – RC Credit Union Site PM10 Annual Averages ......................................................... 40 Figure 7-8 – RC Credit Union Site PM2.5 Annual Averages ........................................................ 41 Figure 7-9 –RC Credit Union Site Sulfur Dioxide 1-hour Averages............................................ 42
Figure 7-10 – RC Credit Union Site Nitrogen Dioxide Annual Averages ................................... 42 Figure 7-11 – Black Hawk Site ..................................................................................................... 43
Figure 7-12 – Black Hawk Site – PM10 Annual Averages .......................................................... 45
Figure 7-13 – Black Hawk Site Ozone Yearly 4th Highest 8-hour Averages .............................. 45
Figure 7-14 –Badlands Site ........................................................................................................... 46 Figure 7-15 – Badlands Site – PM10 Annual Averages ............................................................... 48
Figure 7-16 – Badlands Site PM2.5 Annual Averages ................................................................. 49 Figure 7-17 – Badlands Site Sulfur Dioxide Annual Averages .................................................... 50 Figure 7-18 – Ozone Yearly 4th Highest 8-hour Averages .......................................................... 51
Figure 7-19 – Badlands Site – Nitrogen Dioxide Annual Averages ............................................. 51 Figure 7-20 – Wind Cave Site ...................................................................................................... 52
Figure 7-21 - Wind Cave Site PM10 Annual Averages ............................................................... 54 Figure 7-22 Wind Cave Site PM2.5 Annual Averages ................................................................. 54 Figure 7-23 - Wind Cave Site Sulfur Dioxide 1-hour Average Yearly 99th Percentile ............... 55 Figure 7-24 – Wind Cave NO2 Annual Averages ........................................................................ 56 Figure 7-25 – Wind Cave Ozone Yearly 4th Highest 8-hour Averages ....................................... 56
Figure 7-26 – KELO Site .............................................................................................................. 57 Figure 7-27 – KELO Site PM2.5 Annual Averages ..................................................................... 59
Figure 7-28 – SD School Site ....................................................................................................... 60 Figure 7-29 – SD School Site PM10 Annual Averages ................................................................ 62 Figure 7-30 – SD School Site PM2.5 Annual Averages ............................................................... 63
vi
Figure 7-31 – SD School Site Ozone Yearly 4th
Highest 8-Hour Averages ................................. 64
Figure 7-32 – SD School Site Sulfur Dioxide Yearly 1-hour 99th Percentile .............................. 65 Figure 7-33 – SD School Site Nitrogen Dioxide Annual Averages ............................................. 66 Figure 7-34 – Aberdeen’s Fire Station #1 Site ............................................................................. 66
Figure 7-35 – Fire Station #1 Site PM10 Annual Averages ......................................................... 68 Figure 7-36 – Fire Station #1 Site PM2.5 Annual Averages ........................................................ 69 Figure 7-37 – City Hall Site .......................................................................................................... 70 Figure 7-38 – City Hall Site PM10 Annual Averages .................................................................. 71 Figure 7-39 – City Hall Site PM2.5 Annual Averages ................................................................. 72
Figure 7-40 – Research Farm Site ................................................................................................ 73 Figure 7-41 – Research Farm Site Ozone Yearly 4th Highest 8-Hour Averages ......................... 74 Figure 7-42 – Watertown Site ....................................................................................................... 75 Figure 7-43 – Watertown Site PM10 Annual Averages ................................................................ 76
Figure 7-44 – Watertown Site PM2.5 Annual Averages .............................................................. 77 Figure 7-45 – UC #1 Site .............................................................................................................. 78
Figure 7-46 – UC #2 Site .............................................................................................................. 80 Figure 7-47 – Union County Annual PM10 Concentrations ........................................................ 82
Figure 7-48 – Union County Annual PM2.5 Concentrations ....................................................... 82 Figure 7-49 – Union County Sulfur Dioxide Concentrations ....................................................... 83 Figure 7-50 – Union County Nitrogen Dioxide Concentrations ................................................... 84
Figure 7-51 – UC #1 Site Carbon Monoxide Concentrations....................................................... 85 Figure 7-52 – UC #3 Site .............................................................................................................. 85
Figure 7-53 – UC #3 Site Ozone Concentrations ......................................................................... 86 Figure 8-1 – Average Total NMOC .............................................................................................. 88 Figure 8-2 – Average PM2.5 Concentration .................................................................................. 90
Figure 8-3 – Average Carbon Concentrations .............................................................................. 90
Figure 8-4 – Average Nitrate and Sulfate Concentrations ............................................................ 91
vii
Executive Summary
The South Dakota Department of Environment and Natural Resources (department) develops an
annual ambient air monitoring network plan which is a review of the ambient air monitoring
network each year as required by Title 40 of the Code of Federal Regulation (CFR), Part 58. The
review finds the state’s ambient air quality concentrations are demonstrating attainment with
EPA’s National Ambient Air Quality Standards (NAAQS).
The annual plan is published in the department’s air quality website to provide public review and
comments so adjustments can be made to meet the needs of the general public before the annual
plan is finalized. The annual plan includes the following major sections:
1. Ambient air monitoring goals, plans and needs are in Sections 3.0 through 5.0,
respectively;
2. Evaluation of collected data compared to the NAAQS is in Section 6.0;
3. Determination of air pollution trends are in Sections 7.0 and 8.0; and
4. Proposed modifications to the ambient air monitoring network to meet the changing
trends, national requirements, and state needs are in Section 9.0.
The department will continue to evaluate the following areas for the need to modify the ambient
air monitoring network:
1. With the change in deicing operations in Rapid City, the department will continue to
evaluate the need for other air monitoring sites in the city if problems with dust indicate a
need; and
2. As monitoring rules are finalized by EPA there may be a need for modifications to the
PM2.5 and ozone testing site locations.
The department is planning the following site modifications in 2012 and 2013 based on the
state’s needs:
1. The department will complete the replacement of the RAAS PM2.5 manual method
monitors with Partisol 2000 PM2.5 manual method monitors. The RAAS PM2.5 manual
method monitors have been discontinued by the manufacturer and replacement parts are
no longer be available. Rapid City Library Site is the last site to operate the RAAS PM2.5
monitors and they will be replaced by the middle of 2012;
2. The department will continue to evaluate locations where continuous PM monitors can
replace manual monitors in the network; and
3. The department will evaluate the need to close UC #3 and move the ozone analyzer to
UC #2 or UC #1. The shelter at UC #3 is in poor condition which has allowed water and
mice into the building destroying the insulation and making the building a health threat.
1
1.0 INTRODUCTION
The United States Environmental Protection Agency (EPA) through Title 40 of the Code of
Federal Regulation (CFR) and the Performance Partnership Agreement requires the South
Dakota Department of Environment and Natural Resources (department) to complete an annual
ambient air monitoring network plan. EPA’s requirements for the annual plan are listed in 40
CFR § 58.10. The annual plan will cover a review of the ambient air monitoring sites and
determine if the network is meeting the monitoring objectives in 40 CFR Part 58, Appendixes A,
C, D, and E. The annual plan will identify needed modifications to the network such as the
termination or relocation of a monitor, termination of an existing station, addition of new
parameters, or the establishment of new stations.
The department is required to public notice the annual ambient air monitoring network plan for
30 days prior to submitting the plan to EPA. The department will comply with this requirement
by posting this document on the department’s Air Quality Program website at the following
location for 30 days:
http://denr.sd.gov/des/aq/airprogr.aspx
All comments received by the department during this 30 day period will be addressed by the
department and the appropriate changes will be incorporated in the plan. If a substantial change
is made to the plan because of a comment, another 30 day public comment period will be
completed. The final annual plan will be submitted to EPA for review including all public
comments and the department’s responses to the comments.
2.0 AMBIENT AIR MONITORING NETWORK HISTORY
In 1972, South Dakota developed and EPA approved a State Implementation Plan (SIP) which
included the establishment and operation of an ambient air monitoring network for the state. In
1980, South Dakota submitted a revision to its SIP to upgrade the program by establishing a
network of state and local air monitoring stations (SLAMS) and special purpose monitoring
(SPM) stations.
In 1985, the state set up the first samplers to test for levels of particulate matter 10 microns in
diameter or less (PM10) in anticipation of EPA adopting a PM10 National Ambient Air Quality
Standards (NAAQS). In 1987, the total suspended particulate (TSP) standard was replaced with
the new PM10 standard. South Dakota submitted a revised ambient air monitoring network plan
to include sampling sites for the new PM10 standard and shutdown the TSP monitoring network
in 1987.
A new standard was added by EPA for particulate matter 2.5 microns in diameter or less (PM2.5)
in 1997. South Dakota submitted a revised ambient air monitoring network plan to include
sampling sites for the new PM2.5 standard. In 1999, PM2.5 samplers were added to the ambient
air monitoring network to determine compliance with the new standard.
In 1997, a new standard was also set for ozone that lowered the concentration level and moved
from a one hour to an eight hour average standard. Due to the standard change and concern with
2
the modeling results by the Ozone Transport Assessment Group, the state started an ozone
monitoring network which by 2006 included sites in Sioux Falls, Rapid City, and Wind Cave
National Park. South Dakota submitted an attainment designation to EPA on April 15, 2003,
designating each county as attaining the new ozone standard. On April 30, 2004, EPA published
a federal register notice designating each county in the state as attainment/unclassifiable.
In 2006, EPA revised the PM2.5 standard significantly by reducing the 24-hour standard from 65
to 35 micrograms per cubic meter. South Dakota submitted an attainment designation to EPA on
December 11, 2007, designating each county as attaining the new PM2.5 standard. On December
22, 2008, EPA notified the department they were designating each county in the state as
attainment/unclassifiable.
In 2008, EPA revised the ozone standard and reduced the standard from 0.08 to 0.075 parts per
million. South Dakota is attaining the new standard and submitted a proposed attainment
designation package for all counties in the state to EPA on March 6, 2009. The new presidential
administration in 2009 asked EPA to stay the implementation of the new ozone standard and re-
evaluate the standard. EPA decided to implement the 2008 standard in 2012 so the current
standard is 0.075 ppm. The department is waiting on EPA’s decision on the state’s
recommended designations.
The nitrogen dioxide (NO2) standard was reviewed and a new one-hour standard was set by EPA
in 2009. The annual standard was retained without any change in concentration level. The
department began monitoring for nitrogen dioxide in 2003 and currently operates nitrogen
dioxide monitors in Sioux Falls, Union County, Badlands, and Rapid City. South Dakota
submitted an attainment designation to EPA on January 24, 2011, designating each county as
attaining the new one-hour nitrogen dioxide standard. On January 20, 2012, EPA notified the
department they were designating each county in the state as attainment/unclassifiable.
EPA also made changes to the air monitoring requirements for lead in 2009. The final rule did
not require lead monitoring at the National Core site and all sources in South Dakota have
emission levels less than 0.5 ton per year. Therefore, testing for lead is not required at this time.
Based on previous lead monitoring and the types of sources in South Dakota, the department
submitted an attainment designation to EPA on October 15, 2009, designated each county as
attaining the new lead standard. On November 8, 2011, EPA notified the department they were
designating each county in the state as attainment/unclassifiable.
The sulfur dioxide (SO2) standard was reviewed and the 24-hour and annual standards were
replaced by a new 1-hour standard set by EPA in 2010. The department began monitoring for
sulfur dioxide in 2002 and currently operates sulfur dioxide monitors in Sioux Falls, Union
County, Badlands, and Rapid City. South Dakota submitted an attainment designation to EPA on
June 2, 2011, designating each county as attaining the new one-hour sulfur dioxide standard. The
department is waiting on EPA’s decision on the state’s recommended designations.
Data collected from the ambient air monitoring network is entered into the federal database
called the Air Quality System (AQS). Individuals interested in reviewing the air quality data can
go to the EPA website at the following address: http://www.epa.gov/airexplorer/index.htm
3
3.0 AIR MONITORING GOALS
The department’s Air Quality Program was established with the primary goal of protecting the
health, welfare and property of South Dakotans from the detrimental effects of air pollution. The
Clean Air Act of 1970 and subsequent amendments define air quality standards for various air
pollutants necessary to protect the public from injurious pollution concentrations. Air pollution
concentrations that exceed these established standards can cause "a public health hazard,
nuisance, annoyance or damage buildings, property, animals, plants, forests, crops, exposed
metals or otherwise interfere with the enjoyment of life or property."
In order to attain and maintain the NAAQS, the department developed regulations that restrict air
pollution from sources, establishes these restrictions in an air quality permit, requires periodic
inspections to ensure compliance, and maintains an ambient air monitoring network to provide
air quality information and monitor the success of the Air Quality Program.
4.0 AIR MONITORING PLAN
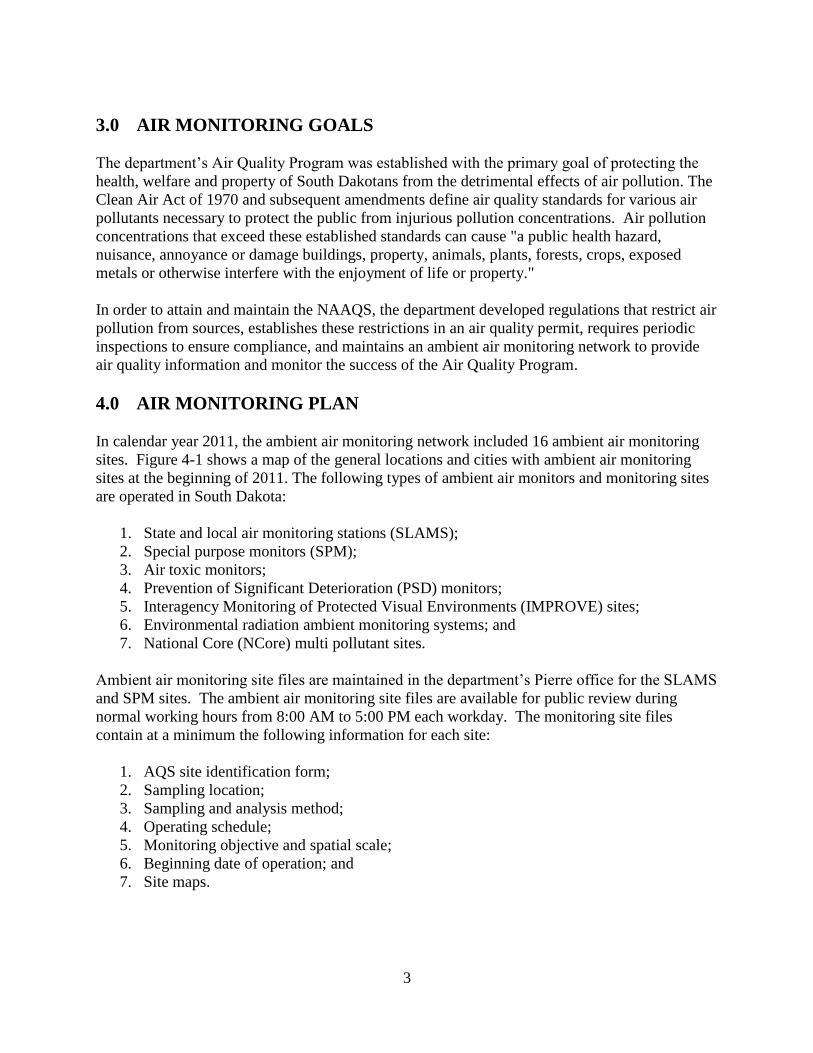
In calendar year 2011, the ambient air monitoring network included 16 ambient air monitoring
sites. Figure 4-1 shows a map of the general locations and cities with ambient air monitoring
sites at the beginning of 2011. The following types of ambient air monitors and monitoring sites
are operated in South Dakota:
1. State and local air monitoring stations (SLAMS);
2. Special purpose monitors (SPM);
3. Air toxic monitors;
4. Prevention of Significant Deterioration (PSD) monitors;
5. Interagency Monitoring of Protected Visual Environments (IMPROVE) sites;
6. Environmental radiation ambient monitoring systems; and
7. National Core (NCore) multi pollutant sites.
Ambient air monitoring site files are maintained in the department’s Pierre office for the SLAMS
and SPM sites. The ambient air monitoring site files are available for public review during
normal working hours from 8:00 AM to 5:00 PM each workday. The monitoring site files
contain at a minimum the following information for each site:
1. AQS site identification form;
2. Sampling location;
3. Sampling and analysis method;
4. Operating schedule;
5. Monitoring objective and spatial scale;
6. Beginning date of operation; and
7. Site maps.
4
Figure 4-1 – South Dakota Air Monitoring Sites
4.1 State and Local Air Monitoring Stations (SLAMS)
A State and Local Air Monitoring Station consists of an air monitor selected by the state or local
air programs to determine compliance with the NAAQS. At the beginning of 2011, fourteen of
the networks sites have at least one SLAMS monitor for at least one air pollutant parameter. The
sites in the network collected PM10 data at twelve sites, PM2.5 data at eleven sites, sulfur dioxide
and nitrogen dioxide at five sites, and ozone at six sites throughout South Dakota.
4.2 Special Purpose Monitoring (SPM)
A SPM monitor is a generic term for all monitors used for special studies. The data is reported
to EPA, the equipment is EPA or non-EPA designated monitoring methods, and the monitoring
data is used for special circumstances or needs. Five of the ambient air monitoring network sites
operated some kind of SPM monitor in 2011. The parameters tested by the SPM monitors in
South Dakota include:
1. Weather stations at the Black Hawk, SD School, and UC #1 sites;
2. Air toxic monitors at the SD School and UC #1 sites;
3. PMcoarse monitor, NOy analyzer, and PM2.5 speciation monitors at the SD School Site;
4. RC National Guard Site has a SPM monitor to help define the extent of the PM10 high
concentration area in western Rapid City; and
5. Radiation monitors operated at the Pierre and RC National Guard sites.
5
4.3 Air Toxics Monitoring Sites
As part of a national research project, air monitors testing for pollutants classified as air toxics
are being operated at the SD School Site in Sioux Falls and at the UC #1 Site in Union County.
Testing for air toxic parameters began in Sioux Falls at the Hilltop Site in 2000 and continued at
the SD School Site in 2008. The SD School Site is located near the South Dakota School for the
Deaf and the Terry Redlin Elementary grade school. The goal is to determine current
concentration levels in South Dakota’s largest city.
In 2002, a second air toxics site was established in Custer. This location was established because
EPA’s modeling estimates of air toxic emissions showed that Custer County had the potential for
some parameters to be the highest ambient concentrations in the state. The city of Custer is the
largest city in Custer County. In March 2008, five years of sampling data was completed at this
site and concentration levels did not indicate trends that would require continuation of the site.
The Custer Site was closed in December 2008 and the equipment was moved to the UC #1 Site.
The UC #1 Site is operated as part of three sites in Union County to determine background
concentrations in anticipation of construction of the proposed oil refinery at the Hyperion Energy
Center. At the end of 2011, air toxic sampling completed three years of testing at the UC #1
Site. No further testing is planned until the Hyperion Energy Center begins to operate so the
sampling device was removed from the site.
The air toxic data is reported to the AQS database by the EPA contractor so it can be compared
with other national sites and provide baseline levels for South Dakota and used in health studies.
Currently, the data collected between 2000 and 2010 have been added by the EPA contractor into
the AQS and the National Air Toxic Assessment database. If an individual is interested in
reviewing the data they may register with EPA at:
http://www.epa.gov/ttn/atw/natamain/
4.4 Prevention of Significant Deterioration (PSD) Monitoring Sites
In 2011, no Prevention of Significant Deterioration monitoring project were started or
completed.
4.5 IMPROVE Network
Two Interagency Monitoring of Protected Visual Environments (IMPROVE) sites are being
operated by the National Parks Service in South Dakota. The site locations are at the Badlands
and Wind Cave National Park. Data results for parameters collected by the National Park
Service can be requested from the individual national parks at:
http://vista.cira.colostate.edu/views/Web/Data/DataWizard.aspx.
6
4.6 Radiation Network (RadNet)
The RadNet sites in Pierre and Rapid City are being operated as a part of the national network of
sampling sites. The Pierre Site has been operated since the early 1980s. The state has a limited
role in operating the monitor. The state collects the samples, takes preliminary readings of
radioactivity levels, and ships the samples to the EPA office of Radiation and Indoor Air. The
type of sample collected is airborne particulates and measurements taken are gross beta radiation
levels.
In 2009, EPA requested a second site in the state to be located in the Rapid City area. The new
RadNet monitor was installed at the RC National Guard Site on May 7, 2009. The site is
operated by the department’s Rapid City Regional Office in conjunction with the Rapid City
National Guard.
The general objectives of the sampling sites are to provide a means of estimating ambient levels
of radioactive pollutants in our environment, to follow trends in environmental radioactivity
levels, and to assess the impact of fallout and other intrusions of radioactive materials.
Specifically, the RadNet monitor was designed to:
1. Provide a direct assessment of the population’s intake of radioactive pollutants due to
fallout;
2. Provide data for developing a set of dose computational models for specific sources and a
national dose computational model to aggregate all sources and determine total
population dose;
3. Monitor pathways for significant population exposure from routine, accidental, and
terrorist releases of radioactivity from major sources;
4. Provide data for indicating additional sampling needs or other actions required to ensure
public health and environmental quality in the event of a major release of radioactivity to
the environment; and
5. Serve as a reference for data comparison with other localized and limited monitoring
programs.
The radiation data collected at this site may be reviewed at:
http://oaspub.epa.gov/enviro/erams_query.simple_query
4.7 National Core Multi-Pollutant Site
The National Core (NCore) multi-pollutant monitoring site will provide data on several
pollutants at lower detection levels and replaces the National Air Monitoring Station (NAMS)
sites that have existed for several years. Each state’s ambient air monitoring network is required
to have at least one NCore site. At the beginning of 2011, all required parameters were operating
at the SD School Site. The NCore site addresses the following monitoring objectives:
1. Timely reporting of data to the public through AirNow for air quality forecasting and
other public reporting mechanisms;
7
2. Support development of emission strategies through air quality model evaluation and
other observational methods;
3. Accountability of emission strategy progress through tracking long-term trends of criteria
and non-criteria pollutants and their precursors;
4. Support long-term health assessments that contribute to ongoing reviews of the NAAQS;
5. Compliance through establishing nonattainment/attainment areas by comparison with the
NAAQS; and
6. Support multiple disciplines of scientific research including public health, atmospheric
and ecological.
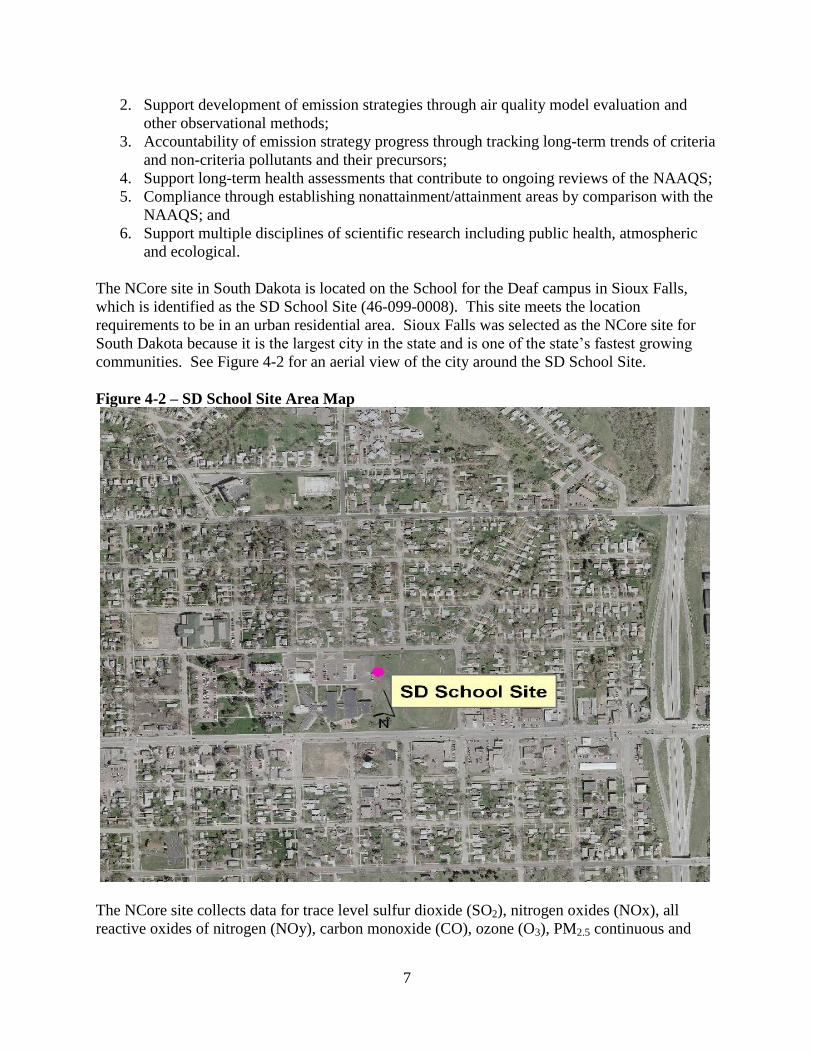
The NCore site in South Dakota is located on the School for the Deaf campus in Sioux Falls,
which is identified as the SD School Site (46-099-0008). This site meets the location
requirements to be in an urban residential area. Sioux Falls was selected as the NCore site for
South Dakota because it is the largest city in the state and is one of the state’s fastest growing
communities. See Figure 4-2 for an aerial view of the city around the SD School Site.
Figure 4-2 – SD School Site Area Map
The NCore site collects data for trace level sulfur dioxide (SO2), nitrogen oxides (NOx), all
reactive oxides of nitrogen (NOy), carbon monoxide (CO), ozone (O3), PM2.5 continuous and
8
filter based manual monitors, PM10-2.5 mass, PM2.5 speciated, PM10, and meteorological
parameters of wind speed, wind direction, relative humidity, and ambient temperature.
5.0 AMBIENT AIR MONITORING NEEDS
5.1 Monitoring State’s Largest Population Centers
South Dakota's industrial base and population centers are typical of the northern plains states.
The largest industry in the state is agriculture. Most of the other industries are located in several
localized areas. The industries in these locations are typically small (less than 50 employees)
and generally do not produce large quantities of air pollutants. Most are considered service
oriented businesses or light industrial. The only heavy industrial facilities are the Big Stone
Power Plant in Grant County and the quarry area in Rapid City.
The population distribution of the state follows the general industrial distribution. Most of the
state's population of 814,180, in the 2010 Census, lives either on the eastern or western third of
South Dakota. The two largest cities in South Dakota are Sioux Falls and Rapid City located in
southeastern and western South Dakota, respectively. The remaining population is primarily
spread across the eastern third of the state with the remaining portion of the state sparsely
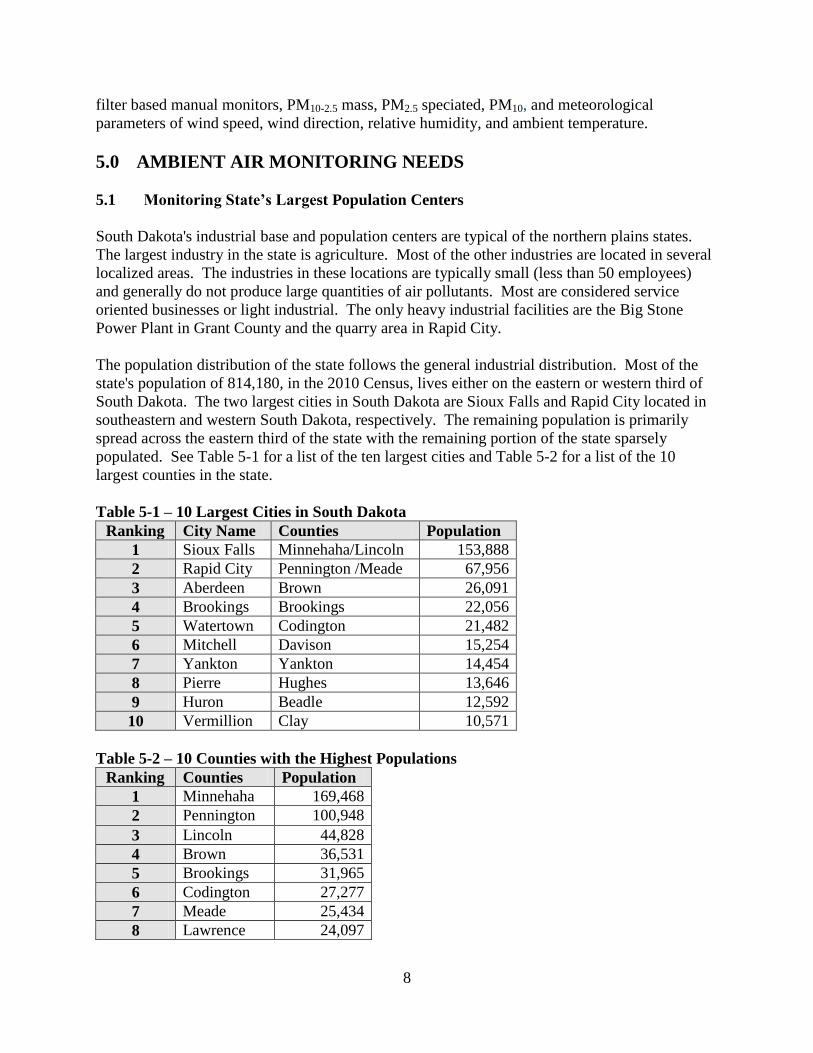
populated. See Table 5-1 for a list of the ten largest cities and Table 5-2 for a list of the 10
largest counties in the state.
Table 5-1 – 10 Largest Cities in South Dakota
Ranking City Name Counties Population
1 Sioux Falls Minnehaha/Lincoln 153,888
2 Rapid City Pennington /Meade 67,956
3 Aberdeen Brown 26,091
4 Brookings Brookings 22,056
5 Watertown Codington 21,482
6 Mitchell Davison 15,254
7 Yankton Yankton 14,454
8 Pierre Hughes 13,646
9 Huron Beadle 12,592
10 Vermillion Clay 10,571
Table 5-2 – 10 Counties with the Highest Populations
Ranking Counties Population
1 Minnehaha 169,468
2 Pennington 100,948
3 Lincoln 44,828
4 Brown 36,531
5 Brookings 31,965
6 Codington 27,277
7 Meade 25,434
8 Lawrence 24,097
9
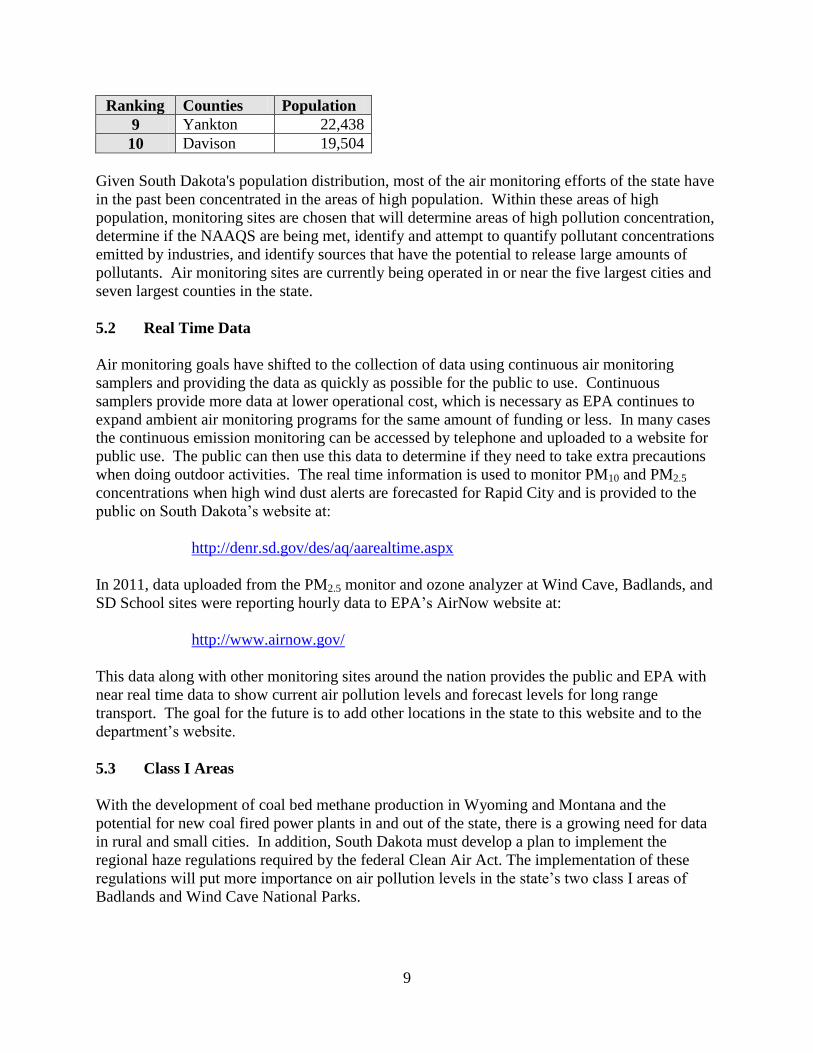
Ranking Counties Population
9 Yankton 22,438
10 Davison 19,504
Given South Dakota's population distribution, most of the air monitoring efforts of the state have
in the past been concentrated in the areas of high population. Within these areas of high
population, monitoring sites are chosen that will determine areas of high pollution concentration,
determine if the NAAQS are being met, identify and attempt to quantify pollutant concentrations
emitted by industries, and identify sources that have the potential to release large amounts of
pollutants. Air monitoring sites are currently being operated in or near the five largest cities and
seven largest counties in the state.
5.2 Real Time Data
Air monitoring goals have shifted to the collection of data using continuous air monitoring
samplers and providing the data as quickly as possible for the public to use. Continuous
samplers provide more data at lower operational cost, which is necessary as EPA continues to
expand ambient air monitoring programs for the same amount of funding or less. In many cases
the continuous emission monitoring can be accessed by telephone and uploaded to a website for
public use. The public can then use this data to determine if they need to take extra precautions
when doing outdoor activities. The real time information is used to monitor PM10 and PM2.5
concentrations when high wind dust alerts are forecasted for Rapid City and is provided to the
public on South Dakota’s website at:
http://denr.sd.gov/des/aq/aarealtime.aspx
In 2011, data uploaded from the PM2.5 monitor and ozone analyzer at Wind Cave, Badlands, and
SD School sites were reporting hourly data to EPA’s AirNow website at:
http://www.airnow.gov/
This data along with other monitoring sites around the nation provides the public and EPA with
near real time data to show current air pollution levels and forecast levels for long range
transport. The goal for the future is to add other locations in the state to this website and to the
department’s website.
5.3 Class I Areas
With the development of coal bed methane production in Wyoming and Montana and the
potential for new coal fired power plants in and out of the state, there is a growing need for data
in rural and small cities. In addition, South Dakota must develop a plan to implement the
regional haze regulations required by the federal Clean Air Act. The implementation of these
regulations will put more importance on air pollution levels in the state’s two class I areas of
Badlands and Wind Cave National Parks.
10
Ambient air monitors were placed in these areas in order to determine background levels and the
impact of long range transport of air pollutants like particulate matter, ozone, sulfur dioxide, and
nitrogen dioxide. In addition, continuous data is needed for modeling purposes to help in
determining air quality permit requirements. The National Park sites collect data from
IMPROVE monitors for PM10, PM2.5, and chemical analysis of the collected particulates. The
department collects PM10, PM2.5, sulfur dioxide, nitrogen dioxide, and ozone data at the
Badlands Site and PM10, PM2.5, and ozone data at the Wind Cave Site.
5.4 Ozone Monitoring
Ozone levels in the nation are being impacted by long range transport from within the nation and
internationally. In some cases, states are observing rural ozone levels higher than ozone levels in
large cities. This is a serious problem for states in the eastern half of the nation in meeting the
current ozone standard and beginning to be a problem in the western half of the nation.
Colorado, Wyoming and Utah are having issues with high ozone levels in their rural areas with
some of the highest levels coming in winter months. It will be important to maintain ozone
monitoring in all areas of South Dakota to determine if long range transport of air pollution
affects ozone concentration in rural and urban areas.
Past national modeling efforts show there is potential for having ozone concentrations near the
standard in the east and southeastern parts of the state. Monitoring sites were added in 2008 in
Union and Brookings counties to more accurately determine if the population is being exposed to
high ozone levels. The eastern third of the state now has three ozone monitoring sites.
5.5 PM2.5 Monitoring
In 2006, EPA significantly lowered the 24-hour PM2.5 standard from 65 micrograms per cubic
meter (ug/m3) to 35 ug/m
3. EPA has currently completed a 5-year review of the PM2.5 standard
and has proposed a change to the standard which will be published in July 2012. The proposal
recommends set a lower annual standard and a secondary standard for visibility in urban areas so
sampling for PM2.5 levels will continue to be a priority in the state.
5.6 Metropolitan Statistical Areas
40 CFR Part 58, Appendix D, contains information used to design an ambient air monitoring
network and lists three basic objectives in designing an ambient air monitoring network. The
three basic objects are listed below:
1. Provide air pollution data to the general public in a timely manner. The department
accomplishes this objective by providing Near Real Time data on the department’s
website at:
http://denr.sd.gov/des/aq/aarealtime.aspx
The data on this website includes hourly data from the Sioux Falls and Rapid City sites.
It also includes other cities like Black Hawk and Watertown sites and rural areas like
11
Union County, Badlands and Wind Cave sites. Specifically in the Rapid City area, High
Wind Dust Alerts are called when meteorological conditions are forecasted that could
cause high PM10 concentrations. This information along with a report graphing hourly
concentrations recorded during the alert is also provided to the public through the
department’s website;
2. Support compliance with ambient air quality standards and emissions strategy
development. The department accomplishes this objective by locating the sites
throughout the state to assess the permit control measures and pollution emission impacts
on the state. For example, the Rapid City air monitoring sites specifically evaluate the
permit control measures and the special measures taken to reduce fugitive dust levels;
and
3. Support for air pollution research studies. The department supports research by loading
the air quality data into EPA’s AQS database site and by supporting local studies when
requested by the state’s colleges.
EPA identified in Appendix D the air monitoring requirements for ozone, carbon monoxide,
nitrogen dioxide, sulfur dioxide, particulate matter, and lead. The number of required air
monitoring sites for ozone and particulate matter is based on the state’s Metropolitan Statistical
Areas (e.g., determined by the population of the MSA and each pollutant’s design value in the
MSA). Each design value is specific to the pollutant and form of the standard. To determine the
number of monitoring sites, the design value is calculated based on the pollutant concentration
and the applicable form of the standard in 40 CFR Part 50, divided by the applicable pollutant’s
standard in 40 CFR Part 50, and the results multiplied by 100. The percentage is compared to the
values in Appendix D to determine the minimum number of monitoring sites.
If there is no ambient air monitoring data for the MSA, only the minimum number of sites listed
in Appendix D is required to be operated. If there is a minimum of three years of air quality data
for the MSA, a design value is calculated. If the MSA has a design value greater than 85% of the
standards for ozone and PM2.5 and 80% of the standard for PM10 the required number of
sampling sites continues to increase as the population increases. If the highest concentration site
in a MSA has a design value less than 80% for PM10 and 85% of the standard for other pollution
parameters the required number of sites may be one or even zero depending on the design value
and population of the MSA.
There is one additional ambient air monitoring requirement in Appendix D for an ozone network.
If a MSA is required to have one or more ozone monitor, at least one of the ozone monitoring
sites is required to be located at the expected high concentration area for the MSA.
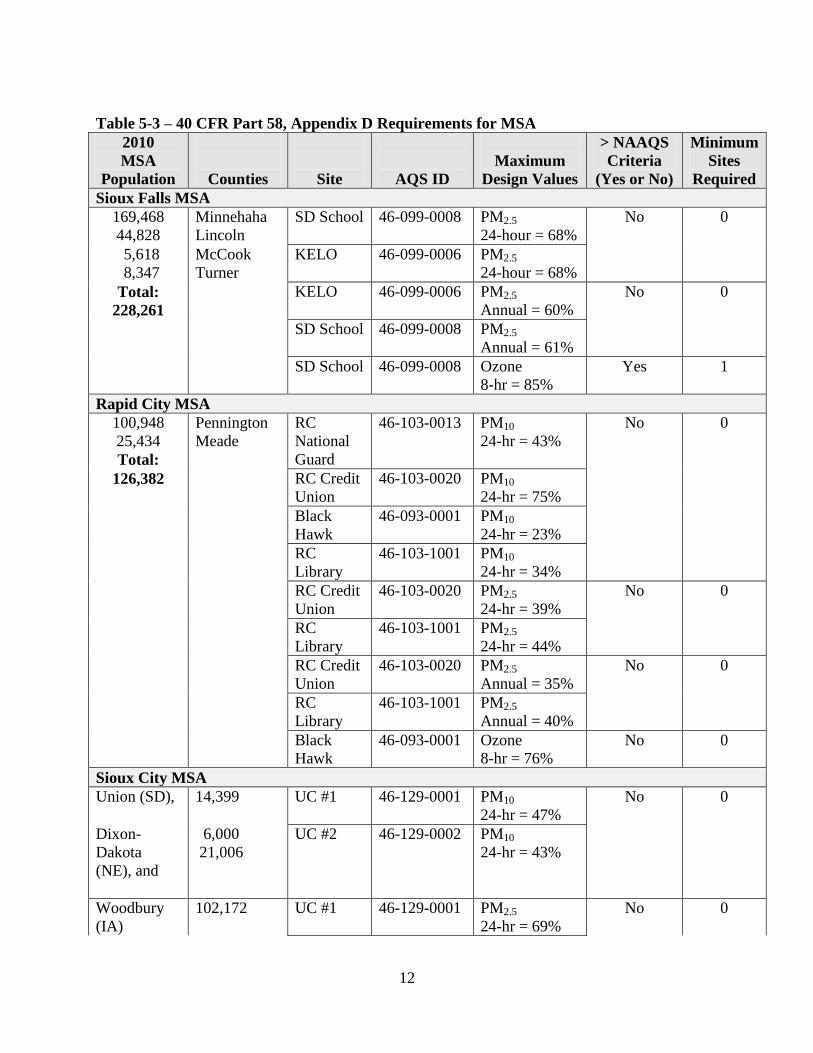
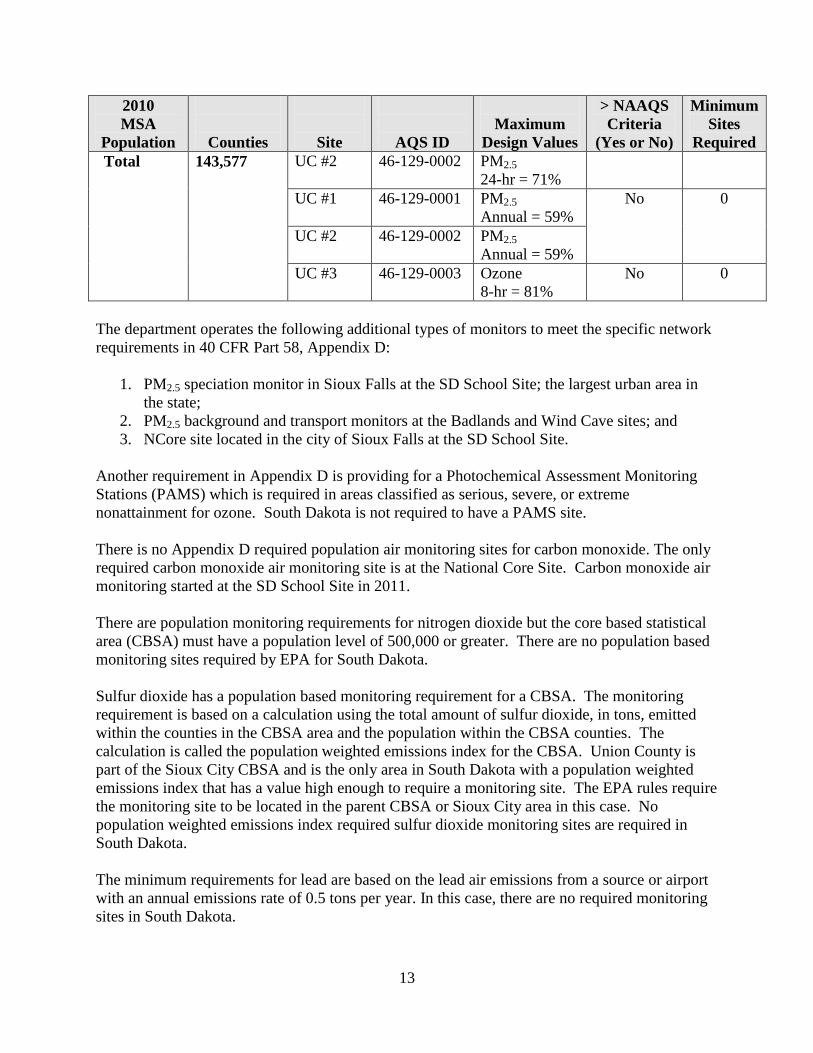
Table 5-3 shows the population, design values and the minimum site requirements for the Sioux
Falls, Rapid City, and Sioux City MSAs in the state using data through the 2011 sampling year.
12
Table 5-3 – 40 CFR Part 58, Appendix D Requirements for MSA
2010
MSA
Population
Counties
Site
AQS ID
Maximum
Design Values
> NAAQS
Criteria
(Yes or No)
Minimum
Sites
Required
Sioux Falls MSA
169,468
44,828
Minnehaha
Lincoln
SD School 46-099-0008 PM2.5
24-hour = 68%
No 0
5,618
8,347
McCook
Turner
KELO 46-099-0006 PM2.5
24-hour = 68%
Total:
228,261
KELO 46-099-0006 PM2.5
Annual = 60%
No 0
SD School 46-099-0008 PM2.5
Annual = 61%
SD School 46-099-0008 Ozone
8-hr = 85%
Yes 1
Rapid City MSA
100,948
25,434
Total:
Pennington
Meade
RC
National
Guard
46-103-0013 PM10
24-hr = 43%
No 0
126,382 RC Credit
Union
46-103-0020 PM10
24-hr = 75%
Black
Hawk
46-093-0001 PM10
24-hr = 23%
RC
Library
46-103-1001 PM10
24-hr = 34%
RC Credit
Union
46-103-0020 PM2.5
24-hr = 39%
No 0
RC
Library
46-103-1001 PM2.5
24-hr = 44%
RC Credit
Union
46-103-0020 PM2.5
Annual = 35%
No 0
RC
Library
46-103-1001 PM2.5
Annual = 40%
Black
Hawk
46-093-0001 Ozone
8-hr = 76%
No 0
Sioux City MSA
Union (SD), 14,399 UC #1 46-129-0001 PM10
24-hr = 47%
No 0
Dixon-
Dakota
(NE), and
6,000
21,006
UC #2 46-129-0002
PM10
24-hr = 43%
Woodbury
(IA)
102,172 UC #1 46-129-0001 PM2.5
24-hr = 69%
No 0
13
2010
MSA
Population
Counties
Site
AQS ID
Maximum
Design Values
> NAAQS
Criteria
(Yes or No)
Minimum
Sites
Required
Total 143,577 UC #2 46-129-0002
PM2.5
24-hr = 71%
UC #1 46-129-0001 PM2.5
Annual = 59%
No 0
UC #2 46-129-0002
PM2.5
Annual = 59%
UC #3 46-129-0003
Ozone
8-hr = 81%
No 0
The department operates the following additional types of monitors to meet the specific network
requirements in 40 CFR Part 58, Appendix D:
1. PM2.5 speciation monitor in Sioux Falls at the SD School Site; the largest urban area in
the state;
2. PM2.5 background and transport monitors at the Badlands and Wind Cave sites; and
3. NCore site located in the city of Sioux Falls at the SD School Site.
Another requirement in Appendix D is providing for a Photochemical Assessment Monitoring
Stations (PAMS) which is required in areas classified as serious, severe, or extreme
nonattainment for ozone. South Dakota is not required to have a PAMS site.
There is no Appendix D required population air monitoring sites for carbon monoxide. The only
required carbon monoxide air monitoring site is at the National Core Site. Carbon monoxide air
monitoring started at the SD School Site in 2011.
There are population monitoring requirements for nitrogen dioxide but the core based statistical
area (CBSA) must have a population level of 500,000 or greater. There are no population based
monitoring sites required by EPA for South Dakota.
Sulfur dioxide has a population based monitoring requirement for a CBSA. The monitoring
requirement is based on a calculation using the total amount of sulfur dioxide, in tons, emitted
within the counties in the CBSA area and the population within the CBSA counties. The
calculation is called the population weighted emissions index for the CBSA. Union County is
part of the Sioux City CBSA and is the only area in South Dakota with a population weighted
emissions index that has a value high enough to require a monitoring site. The EPA rules require
the monitoring site to be located in the parent CBSA or Sioux City area in this case. No
population weighted emissions index required sulfur dioxide monitoring sites are required in
South Dakota.
The minimum requirements for lead are based on the lead air emissions from a source or airport
with an annual emissions rate of 0.5 tons per year. In this case, there are no required monitoring
sites in South Dakota.
14
5.7 Future Monitoring
There is currently minimal monitoring being completed in other parts of the state that have small,
but expanding populations and industries. These areas include the northeastern and the northern
Black Hills portions of the state. These areas will continue to be evaluated to determine whether
additional monitoring efforts need to be conducted in those areas.
PM10, PM2.5, sulfur dioxide, nitrogen dioxide, and ozone will be the focus of the ambient air
monitoring network as levels of these pollutants have the greatest potential to have
concentrations close to the standard as EPA continues to lower the NAAQS for these pollutants.
6.0 COMPLIANCE WITH NAAQS
This section provides a comparison of the collected data to the NAAQS. The comparison will
determine if an area is attaining the standard. In addition, the comparison will assist in
determining if more monitoring stations for certain parameters is needed in an area or an area no
longer needs to monitor for a certain parameter or parameters.
6.1 Particulate Matter (PM10)
The PM10 NAAQS is based on a 24-hour average concentration. The maximum 24-hour average
concentration allowed is 150 micrograms per cubic meter (ug/m3). Attainment with the 24-hour
standard is demonstrated when there is less than or equal to one expected exceedance per year
averaged over three years. A 24-hour average concentration of 154.4 ug/m3 is the highest level
that still attains the 24-hour standard for PM10.
In 2011, the statewide PM10 monitoring network included 12 monitoring locations. Five of the
sites recorded data using manual monitors providing 24-hour sample concentrations. Seven of
the sites have continuous samplers providing 1-hour concentrations. The main distribution of the
PM10 air monitoring sites is located in Rapid City with three sites. Two sites are operated in
central Union County for preconstruction, construction and post construction of the Hyperion
Energy Center. Other locations with one site include the Badlands, Wind Cave, Aberdeen,
Watertown, Black Hawk, and Brookings.
In 2011, the Sioux Falls SD School Site operated a PM10 monitor but the data were collected
under actual conditions and not reference conditions so the data cannot be used to compare to the
national PM10 standard. EPA requires that PM10 data be corrected to reference conditions for
temperature and pressure. The continuous monitors collecting the PM10, PM2.5 and PM10-2.5 data
was set only to collect data in actual conditions for temperature and pressure. The programing
was changed to calculate both actual and reference conditions.
Table 6-1 contains a list of the expected exceedance rate, 2nd
highest 24-hour PM10
concentrations, three year average of 2nd
highest 24-hour PM10 concentration (design value), and
attainment status for the PM10 ambient air monitors throughout the state for calendar year 2009
to 2011. Since the 24-hour standard allows for one expected exceedance per year the 2nd
highest
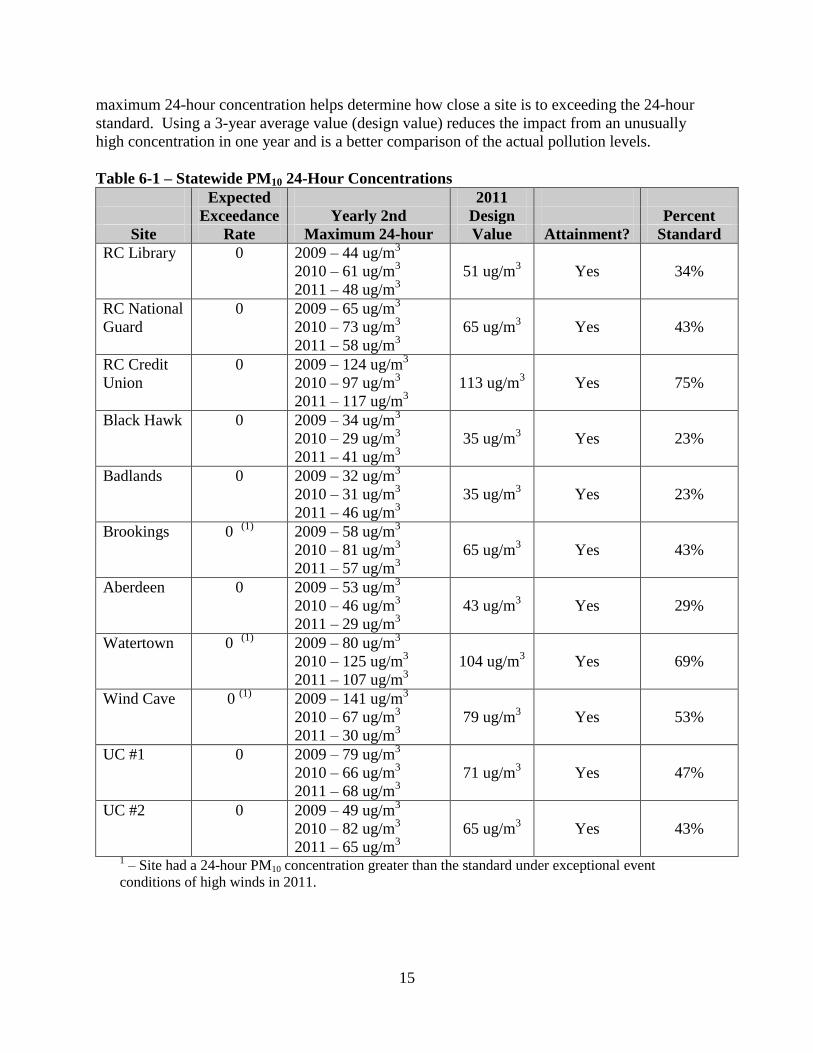
15
maximum 24-hour concentration helps determine how close a site is to exceeding the 24-hour
standard. Using a 3-year average value (design value) reduces the impact from an unusually
high concentration in one year and is a better comparison of the actual pollution levels.
Table 6-1 – Statewide PM10 24-Hour Concentrations
Expected 2011
Exceedance Yearly 2nd Design Percent
Site Rate Maximum 24-hour Value Attainment? Standard
RC Library 0 2009 – 44 ug/m3
2010 – 61 ug/m3
2011 – 48 ug/m3
51 ug/m3 Yes 34%
RC National
Guard
0 2009 – 65 ug/m3
2010 – 73 ug/m3
2011 – 58 ug/m3
65 ug/m3 Yes 43%
RC Credit
Union
0 2009 – 124 ug/m3
2010 – 97 ug/m3
2011 – 117 ug/m3
113 ug/m3 Yes 75%
Black Hawk 0 2009 – 34 ug/m3
2010 – 29 ug/m3
2011 – 41 ug/m3
35 ug/m3 Yes 23%
Badlands 0 2009 – 32 ug/m3
2010 – 31 ug/m3
2011 – 46 ug/m3
35 ug/m3 Yes 23%
Brookings 0 (1)
2009 – 58 ug/m3
2010 – 81 ug/m3
2011 – 57 ug/m3
65 ug/m3 Yes 43%
Aberdeen 0 2009 – 53 ug/m3
2010 – 46 ug/m3
2011 – 29 ug/m3
43 ug/m3 Yes 29%
Watertown 0 (1)
2009 – 80 ug/m3
2010 – 125 ug/m3
2011 – 107 ug/m3
104 ug/m3 Yes 69%
Wind Cave 0 (1)
2009 – 141 ug/m3
2010 – 67 ug/m3
2011 – 30 ug/m3
79 ug/m3 Yes 53%
UC #1 0 2009 – 79 ug/m3
2010 – 66 ug/m3
2011 – 68 ug/m3
71 ug/m3 Yes 47%
UC #2 0 2009 – 49 ug/m3
2010 – 82 ug/m3
2011 – 65 ug/m3
65 ug/m3 Yes 43%
1 – Site had a 24-hour PM10 concentration greater than the standard under exceptional event
conditions of high winds in 2011.
16
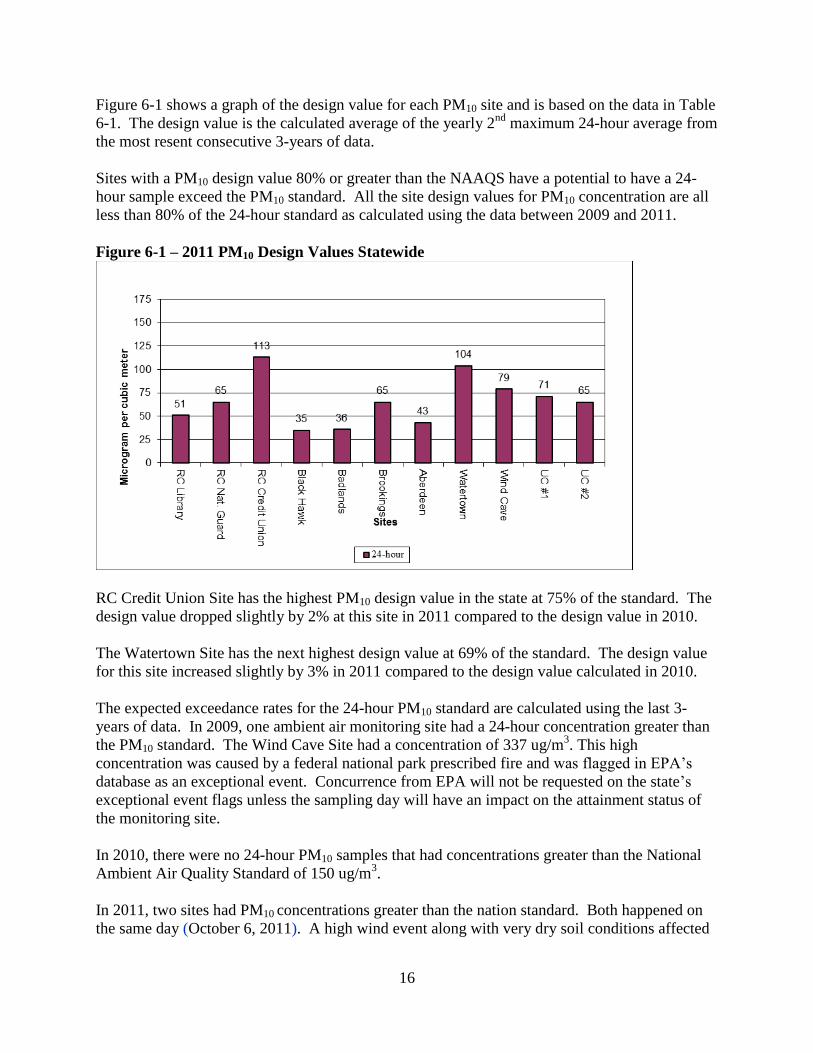
Figure 6-1 shows a graph of the design value for each PM10 site and is based on the data in Table
6-1. The design value is the calculated average of the yearly 2nd
maximum 24-hour average from
the most resent consecutive 3-years of data.
Sites with a PM10 design value 80% or greater than the NAAQS have a potential to have a 24-
hour sample exceed the PM10 standard. All the site design values for PM10 concentration are all
less than 80% of the 24-hour standard as calculated using the data between 2009 and 2011.
Figure 6-1 – 2011 PM10 Design Values Statewide
RC Credit Union Site has the highest PM10 design value in the state at 75% of the standard. The
design value dropped slightly by 2% at this site in 2011 compared to the design value in 2010.
The Watertown Site has the next highest design value at 69% of the standard. The design value
for this site increased slightly by 3% in 2011 compared to the design value calculated in 2010.
The expected exceedance rates for the 24-hour PM10 standard are calculated using the last 3-
years of data. In 2009, one ambient air monitoring site had a 24-hour concentration greater than
the PM10 standard. The Wind Cave Site had a concentration of 337 ug/m3. This high
concentration was caused by a federal national park prescribed fire and was flagged in EPA’s
database as an exceptional event. Concurrence from EPA will not be requested on the state’s
exceptional event flags unless the sampling day will have an impact on the attainment status of
the monitoring site.
In 2010, there were no 24-hour PM10 samples that had concentrations greater than the National
Ambient Air Quality Standard of 150 ug/m3.
In 2011, two sites had PM10 concentrations greater than the nation standard. Both happened on
the same day (October 6, 2011). A high wind event along with very dry soil conditions affected
17
both sites. The Watertown Site had a 24-hour concentration of 157 ug/m3. The Brookings Site
had a 24-hour concentration of 161 ug/m3. The sampling days will affect the attainment status of
the Brookings Site so the sampling days were flagged by the department and an exceptional
event package is being put together. The department will be requesting EPA’s concurrence on
the high wind event for both the Brookings and Watertown sites.
Currently, all the sites in South Dakota are attaining the PM10 24-hour standard.
6.2 Particulate Matter (PM2.5)
The PM2.5 NAAQS consists of a 24-hour and annual standard. The 24-hour standard is 35 ug/m3.
Attainment of the 24-hour standard is achieved when the maximum 24-hour average
concentration, based on the annual 98th
percentile averaged over three years (24-hour average
design value), is less than or equal to 35 ug/m3. The PM2.5 annual standard is 15 ug/m
3.
Attainment is demonstrated when the maximum annual arithmetic mean averaged over three
consecutive years (annual design value) is equal to or less than 15 ug/m3.
Spatial averaging of more than one site’s annual average is an option when having multiple sites
within an area with similar topography and meteorological conditions. The department elected
not to do spatial averaging in any of the sampling areas in South Dakota to determine compliance
with the annual PM2.5 standard.
In 2011, there were eleven PM2.5 SLAMS sites operated in the state. Federal Reference Method
manual monitors Andersen RASS and Partisol 2000 were operated at six of the PM2.5 sites. Met
One BAM continuous PM2.5 monitors with Federal Equivalent Method designation were
operated at six of the sites. One site SD School operates both methods and the remaining five
sites have only the Met One BAM continuous PM2.5 monitor
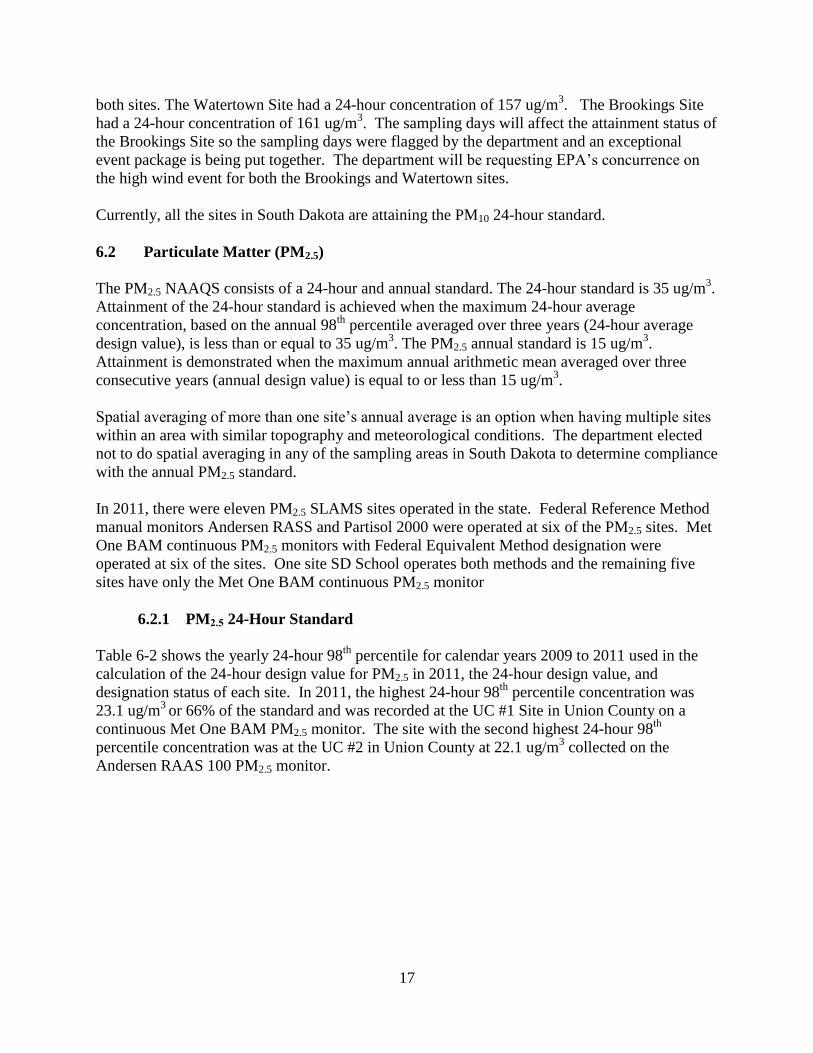
6.2.1 PM2.5 24-Hour Standard
Table 6-2 shows the yearly 24-hour 98th
percentile for calendar years 2009 to 2011 used in the
calculation of the 24-hour design value for PM2.5 in 2011, the 24-hour design value, and
designation status of each site. In 2011, the highest 24-hour 98th
percentile concentration was
23.1 ug/m3
or 66% of the standard and was recorded at the UC #1 Site in Union County on a
continuous Met One BAM PM2.5 monitor. The site with the second highest 24-hour 98th
percentile concentration was at the UC #2 in Union County at 22.1 ug/m3 collected on the
Andersen RAAS 100 PM2.5 monitor.
18
Table 6-2 – Statewide PM2.5 24-Hour Concentrations
Site
Yearly 98th
Percentile
2011 24-hour Design
Value
Attainment
Status
RC Library 2009 – 13.1 ug/m3
2010 – 20.7 ug/m3
2011 – 12.3 ug/m3
15.4 ug/m3
Yes
RC Credit Union 2009 – 14.3 ug/m3
2010 – 14.0 ug/m3
2011 – 13.1 ug/m3
13.7 ug/m3
Yes
Badlands 2009 – 10.4 ug/m3
2010 – 13.6 ug/m3
2011 – 10.0 ug/m3
11.3 ug/m3
Yes
SD KELO 2009 – 22.2 ug/m3
2010 – 27.8 ug/m3
2011 – 21.5 ug/m3
23.8 ug/m3
Yes
SD School 2009 – 21.9 ug/m3
2010 – 27.9 ug/m3
2011 – 21.6 ug/m3
23.8 ug/m3
Yes
Brookings 2009 – 25.7 ug/m3
2010 – 25.7 ug/m3
2011 – 18.4 ug/m3
23.3 ug/m3
Yes
Fire Station #1 2009 – 23.0 ug/m3
2010 – 26.2 ug/m3
2011 – 15.6 ug/m3
21.6 ug/m3
Yes
Watertown 2009 – 23.1 ug/m3
2010 – 23.9 ug/m3
2011 – 18.4 ug/m3
21.8 ug/m3
Yes
Wind Cave 2009 – 9.6 ug/m3
2010 – 12.4 ug/m3
2011 – 11.5 ug/m3
11.2 ug/m3
Yes
UC #1 2009 – 21.3 ug/m3
2010 – 27.8 ug/m3
2011 – 23.1 ug/m3
24.1 ug/m3
Yes
UC # 2 2009 – 23.3 ug/m3
2010 – 29.7 ug/m3
2011 – 22.1 ug/m3
25.0 ug/m3
Yes
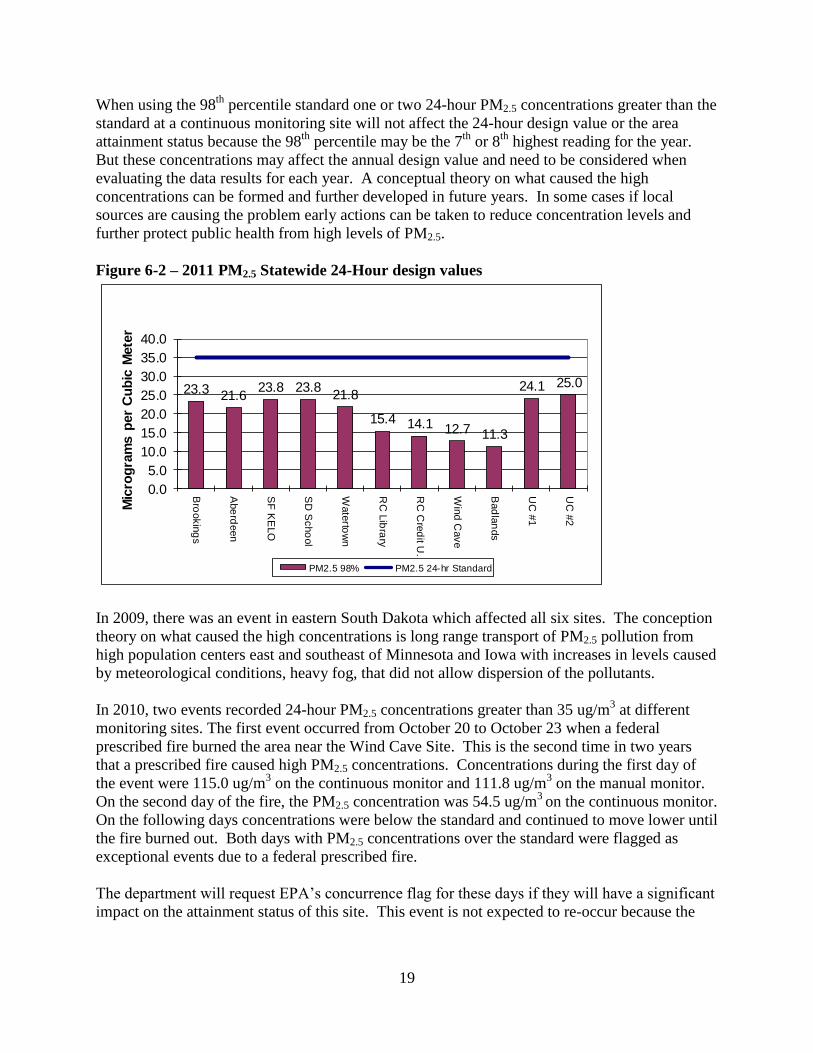
Figure 6-2 contains a graph of the 24-hour design values for each site. The highest design value
was recorded at the UC #2 Site with a concentration of 25.0 ug/m3 or 71% of the standard. UC
#1 Site followed closely with a concentration of 24.1 ug/m3. The School and KELO sites in
Sioux Falls have the next highest design value at 23.8 ug/m3. As expected, the background sites
at Badlands and Wind Cave had the lowest 24-hour design values for PM2.5 at 11.3 ug/m3
and
11.2 ug/m3, respectively. All sites had small drops in concentration levels with the addition of
the 2011 data and all sites are attaining the 24-hour PM2.5 standard.
19
When using the 98th
percentile standard one or two 24-hour PM2.5 concentrations greater than the
standard at a continuous monitoring site will not affect the 24-hour design value or the area
attainment status because the 98th
percentile may be the 7th
or 8th
highest reading for the year.
But these concentrations may affect the annual design value and need to be considered when
evaluating the data results for each year. A conceptual theory on what caused the high
concentrations can be formed and further developed in future years. In some cases if local
sources are causing the problem early actions can be taken to reduce concentration levels and
further protect public health from high levels of PM2.5.
Figure 6-2 – 2011 PM2.5 Statewide 24-Hour design values
23.321.6
23.8 23.821.8
15.4 14.1 12.7 11.3
24.1 25.0
0.0
5.0
10.0
15.0
20.0
25.0
30.0
35.0
40.0
Bro
okin
gs
Abe
rdeen
SF
KE
LO
SD
Scho
ol
Wate
rtow
n
RC
Lib
rary
RC
Cre
dit U
.
Win
d C
ave
Bad
lan
ds
UC
#1
UC
#2
Mic
rog
ram
s p
er
Cu
bic
Mete
r
PM2.5 98% PM2.5 24-hr Standard
In 2009, there was an event in eastern South Dakota which affected all six sites. The conception
theory on what caused the high concentrations is long range transport of PM2.5 pollution from
high population centers east and southeast of Minnesota and Iowa with increases in levels caused
by meteorological conditions, heavy fog, that did not allow dispersion of the pollutants.
In 2010, two events recorded 24-hour PM2.5 concentrations greater than 35 ug/m3 at different
monitoring sites. The first event occurred from October 20 to October 23 when a federal
prescribed fire burned the area near the Wind Cave Site. This is the second time in two years
that a prescribed fire caused high PM2.5 concentrations. Concentrations during the first day of
the event were 115.0 ug/m3 on the continuous monitor and 111.8 ug/m
3 on the manual monitor.
On the second day of the fire, the PM2.5 concentration was 54.5 ug/m3
on the continuous monitor.
On the following days concentrations were below the standard and continued to move lower until
the fire burned out. Both days with PM2.5 concentrations over the standard were flagged as
exceptional events due to a federal prescribed fire.
The department will request EPA’s concurrence flag for these days if they will have a significant
impact on the attainment status of this site. This event is not expected to re-occur because the
20
department is working with the federal land managers on a Smoke Management Plan as part of
the Regional Haze Program to minimize the impacts of federal prescribed fires in South Dakota.
The second event in 2010 with PM2.5 concentrations greater than the standard occurred on
February 5 and 6 on the eastern edge of the state. An alert notice was issued by Minnesota and
Iowa because meteorological conditions were expected to increase pollution levels and transport
PM2.5 air pollution into the region. The Minnesota alert notice indicated the high concentration
levels were an artifact from long range transport of PM2.5 air pollution to the east and southeast.
The weather during this period of time included light winds and fog with snow on the ground
which further reduces the dispersion of PM2.5 pollutants.
On February 5 all three continuous PM2.5 monitor sites on the southeastern corner of the state
had concentrations over the standard. UC #1 had the highest concentration at 46.1 ug/m3
followed close by SD School and UC #2 in the lower 40 ug/m3 range. On February 6 only UC
#1 had a concentration over the standard at 36.2 ug/m3. SD School and UC #2 had
concentrations just under the standard. The other sites in the eastern half of the state are on an
every third day schedule and did not have samples for these days.
During 2011, none of the monitoring sites had a concentration greater than the 24-hour PM2.5
standard. The highest 24-hour PM2.5 concentrations were recorded in the southeast part of the
state. On March 8, 2011, the continuous PM2.5 monitors at SD School, UC #1 and UC #2 had
concentrations in the low 30 ug/m3 range. Just as in 2009 and 2010 the high PM2.5 levels were
high over a large part of southeastern South Dakota. Once again it was associated with high
concentrations in Iowa and Minnesota pointing to long range transport of air pollution.
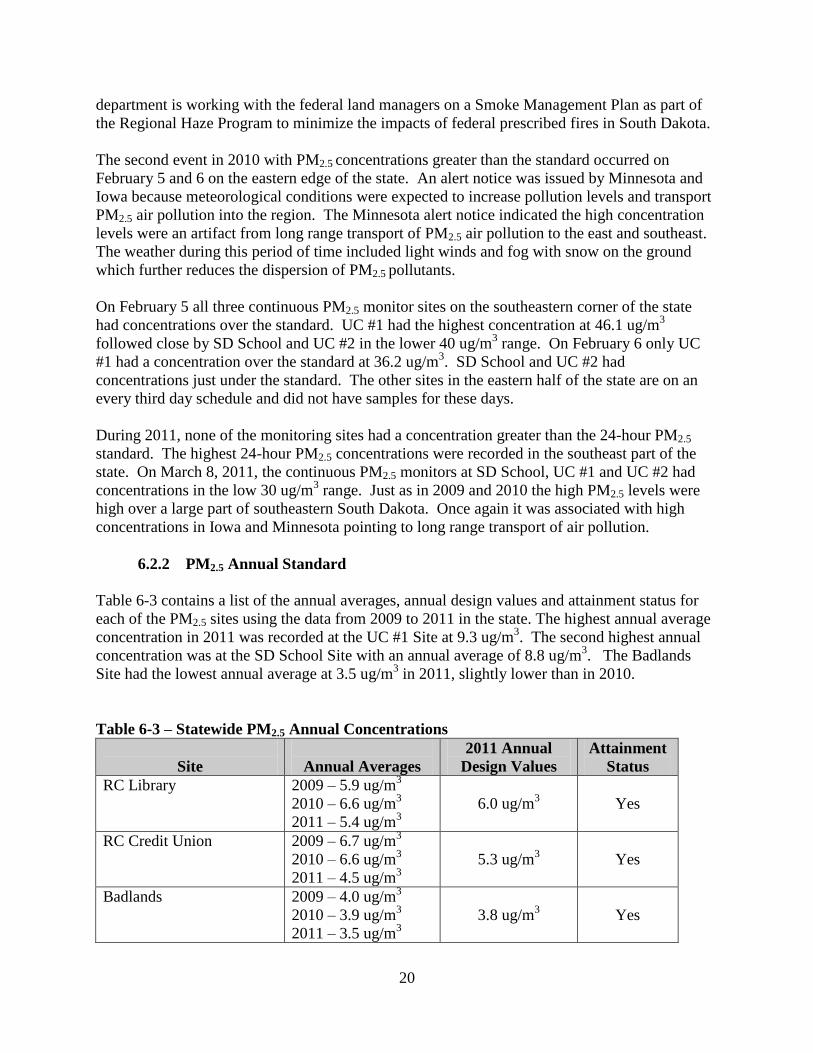
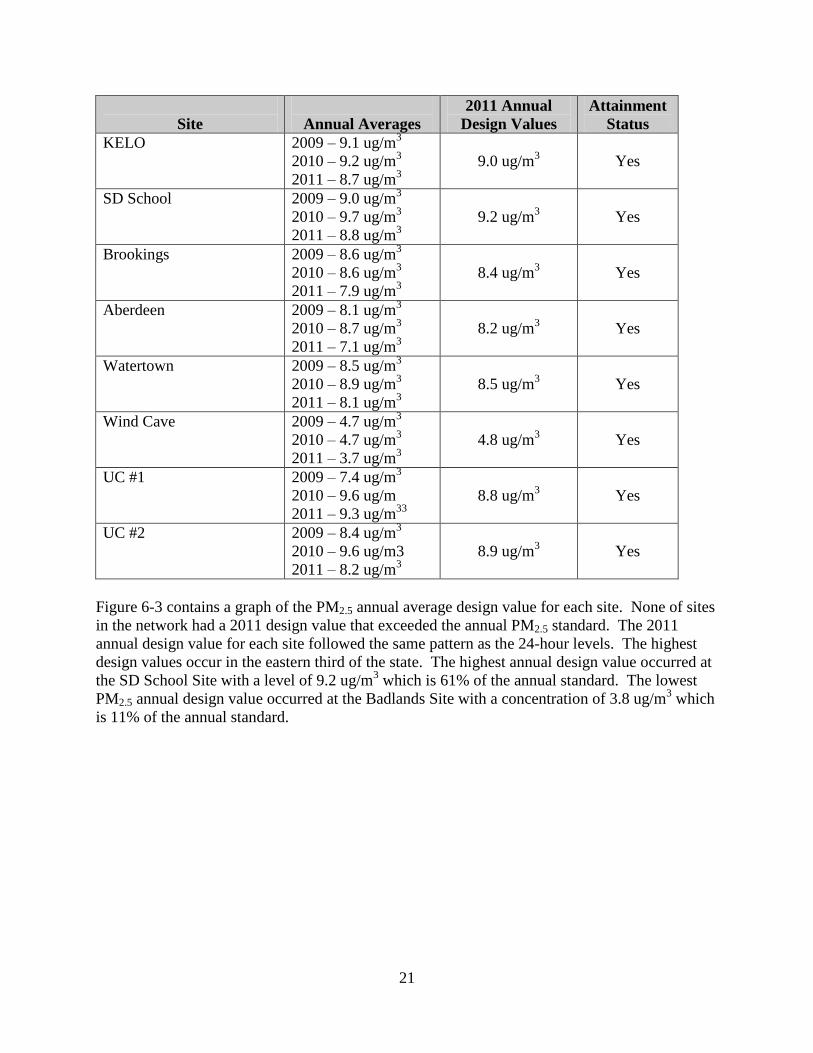
6.2.2 PM2.5 Annual Standard
Table 6-3 contains a list of the annual averages, annual design values and attainment status for
each of the PM2.5 sites using the data from 2009 to 2011 in the state. The highest annual average
concentration in 2011 was recorded at the UC #1 Site at 9.3 ug/m3. The second highest annual
concentration was at the SD School Site with an annual average of 8.8 ug/m3. The Badlands
Site had the lowest annual average at 3.5 ug/m3 in 2011, slightly lower than in 2010.
Table 6-3 – Statewide PM2.5 Annual Concentrations
Site
Annual Averages
2011 Annual
Design Values
Attainment
Status
RC Library 2009 – 5.9 ug/m3
2010 – 6.6 ug/m3
2011 – 5.4 ug/m3
6.0 ug/m3
Yes
RC Credit Union 2009 – 6.7 ug/m3
2010 – 6.6 ug/m3
2011 – 4.5 ug/m3
5.3 ug/m3
Yes
Badlands 2009 – 4.0 ug/m3
2010 – 3.9 ug/m3
2011 – 3.5 ug/m3
3.8 ug/m3
Yes
21
Site
Annual Averages
2011 Annual
Design Values
Attainment
Status
KELO 2009 – 9.1 ug/m3
2010 – 9.2 ug/m3
2011 – 8.7 ug/m3
9.0 ug/m3
Yes
SD School 2009 – 9.0 ug/m3
2010 – 9.7 ug/m3
2011 – 8.8 ug/m3
9.2 ug/m3
Yes
Brookings 2009 – 8.6 ug/m3
2010 – 8.6 ug/m3
2011 – 7.9 ug/m3
8.4 ug/m3
Yes
Aberdeen 2009 – 8.1 ug/m3
2010 – 8.7 ug/m3
2011 – 7.1 ug/m3
8.2 ug/m3
Yes
Watertown 2009 – 8.5 ug/m3
2010 – 8.9 ug/m3
2011 – 8.1 ug/m3
8.5 ug/m3
Yes
Wind Cave 2009 – 4.7 ug/m3
2010 – 4.7 ug/m3
2011 – 3.7 ug/m3
4.8 ug/m3
Yes
UC #1 2009 – 7.4 ug/m3
2010 – 9.6 ug/m
2011 – 9.3 ug/m33
8.8 ug/m3
Yes
UC #2 2009 – 8.4 ug/m3
2010 – 9.6 ug/m3
2011 – 8.2 ug/m3
8.9 ug/m3
Yes
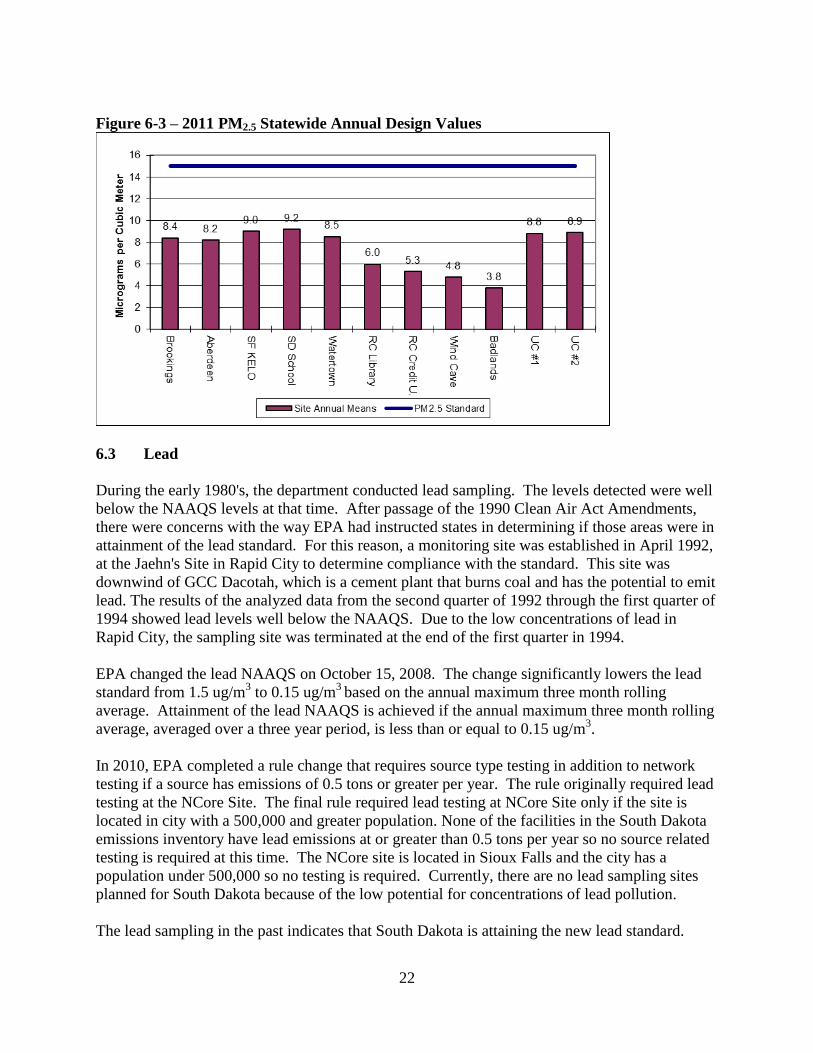
Figure 6-3 contains a graph of the PM2.5 annual average design value for each site. None of sites
in the network had a 2011 design value that exceeded the annual PM2.5 standard. The 2011
annual design value for each site followed the same pattern as the 24-hour levels. The highest
design values occur in the eastern third of the state. The highest annual design value occurred at
the SD School Site with a level of 9.2 ug/m3 which is 61% of the annual standard. The lowest
PM2.5 annual design value occurred at the Badlands Site with a concentration of 3.8 ug/m3 which
is 11% of the annual standard.
22
Figure 6-3 – 2011 PM2.5 Statewide Annual Design Values
6.3 Lead
During the early 1980's, the department conducted lead sampling. The levels detected were well
below the NAAQS levels at that time. After passage of the 1990 Clean Air Act Amendments,
there were concerns with the way EPA had instructed states in determining if those areas were in
attainment of the lead standard. For this reason, a monitoring site was established in April 1992,
at the Jaehn's Site in Rapid City to determine compliance with the standard. This site was
downwind of GCC Dacotah, which is a cement plant that burns coal and has the potential to emit
lead. The results of the analyzed data from the second quarter of 1992 through the first quarter of
1994 showed lead levels well below the NAAQS. Due to the low concentrations of lead in
Rapid City, the sampling site was terminated at the end of the first quarter in 1994.
EPA changed the lead NAAQS on October 15, 2008. The change significantly lowers the lead
standard from 1.5 ug/m3 to 0.15 ug/m
3 based on the annual maximum three month rolling
average. Attainment of the lead NAAQS is achieved if the annual maximum three month rolling
average, averaged over a three year period, is less than or equal to 0.15 ug/m3.
In 2010, EPA completed a rule change that requires source type testing in addition to network
testing if a source has emissions of 0.5 tons or greater per year. The rule originally required lead
testing at the NCore Site. The final rule required lead testing at NCore Site only if the site is
located in city with a 500,000 and greater population. None of the facilities in the South Dakota
emissions inventory have lead emissions at or greater than 0.5 tons per year so no source related
testing is required at this time. The NCore site is located in Sioux Falls and the city has a
population under 500,000 so no testing is required. Currently, there are no lead sampling sites
planned for South Dakota because of the low potential for concentrations of lead pollution.
The lead sampling in the past indicates that South Dakota is attaining the new lead standard.
23
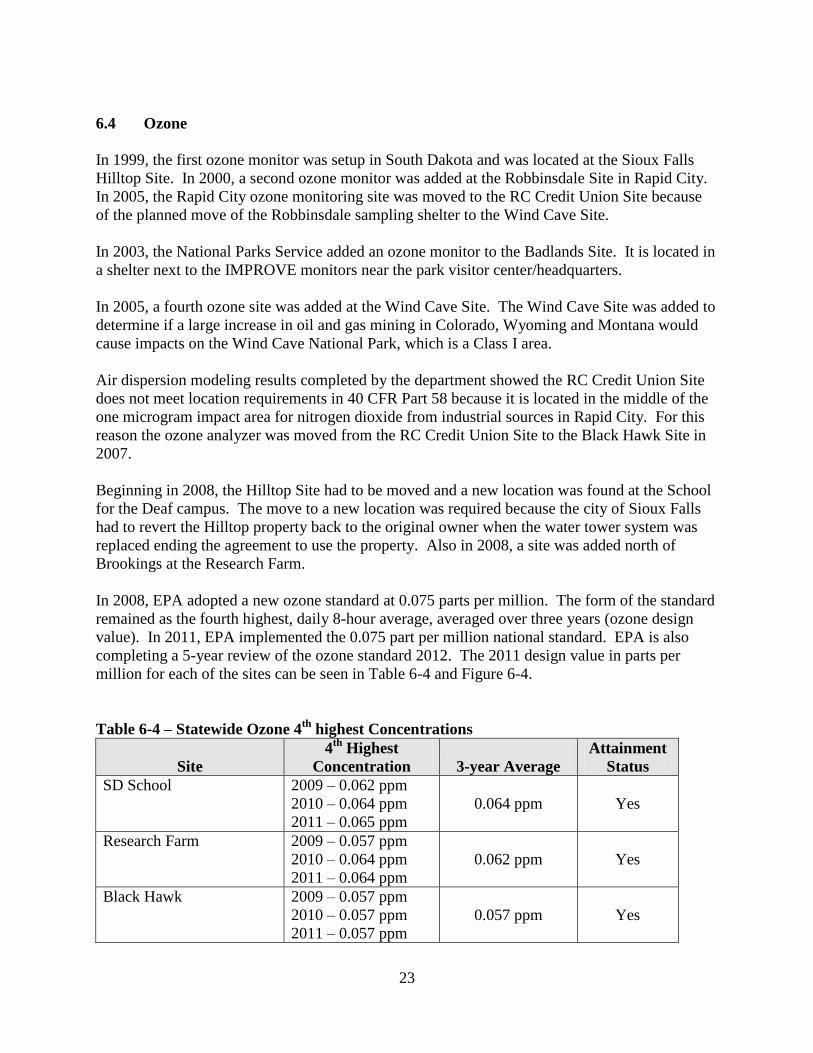
6.4 Ozone
In 1999, the first ozone monitor was setup in South Dakota and was located at the Sioux Falls
Hilltop Site. In 2000, a second ozone monitor was added at the Robbinsdale Site in Rapid City.
In 2005, the Rapid City ozone monitoring site was moved to the RC Credit Union Site because
of the planned move of the Robbinsdale sampling shelter to the Wind Cave Site.
In 2003, the National Parks Service added an ozone monitor to the Badlands Site. It is located in
a shelter next to the IMPROVE monitors near the park visitor center/headquarters.
In 2005, a fourth ozone site was added at the Wind Cave Site. The Wind Cave Site was added to
determine if a large increase in oil and gas mining in Colorado, Wyoming and Montana would
cause impacts on the Wind Cave National Park, which is a Class I area.
Air dispersion modeling results completed by the department showed the RC Credit Union Site
does not meet location requirements in 40 CFR Part 58 because it is located in the middle of the
one microgram impact area for nitrogen dioxide from industrial sources in Rapid City. For this
reason the ozone analyzer was moved from the RC Credit Union Site to the Black Hawk Site in
2007.
Beginning in 2008, the Hilltop Site had to be moved and a new location was found at the School
for the Deaf campus. The move to a new location was required because the city of Sioux Falls
had to revert the Hilltop property back to the original owner when the water tower system was
replaced ending the agreement to use the property. Also in 2008, a site was added north of
Brookings at the Research Farm.
In 2008, EPA adopted a new ozone standard at 0.075 parts per million. The form of the standard
remained as the fourth highest, daily 8-hour average, averaged over three years (ozone design
value). In 2011, EPA implemented the 0.075 part per million national standard. EPA is also
completing a 5-year review of the ozone standard 2012. The 2011 design value in parts per
million for each of the sites can be seen in Table 6-4 and Figure 6-4.
Table 6-4 – Statewide Ozone 4th
highest Concentrations
Site
4th
Highest
Concentration
3-year Average
Attainment
Status
SD School 2009 – 0.062 ppm
2010 – 0.064 ppm
2011 – 0.065 ppm
0.064 ppm
Yes
Research Farm 2009 – 0.057 ppm
2010 – 0.064 ppm
2011 – 0.064 ppm
0.062 ppm
Yes
Black Hawk 2009 – 0.057 ppm
2010 – 0.057 ppm
2011 – 0.057 ppm
0.057 ppm
Yes
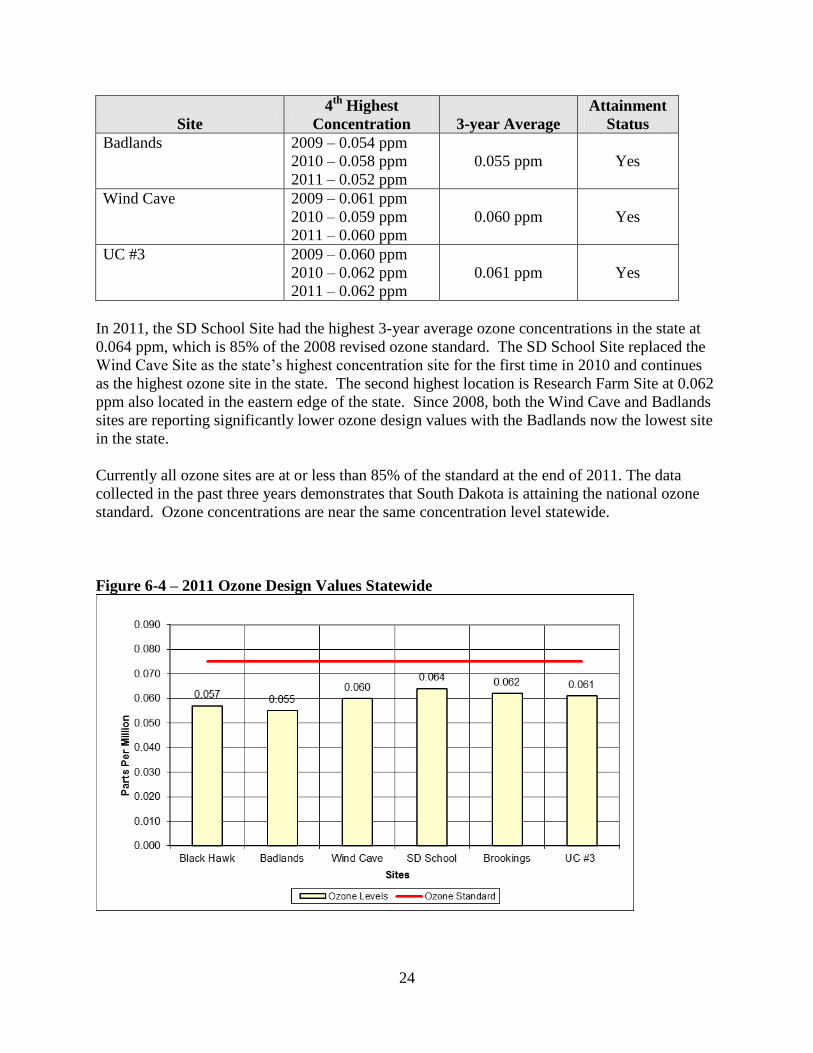
24
Site
4th
Highest
Concentration
3-year Average
Attainment
Status
Badlands 2009 – 0.054 ppm
2010 – 0.058 ppm
2011 – 0.052 ppm
0.055 ppm
Yes
Wind Cave 2009 – 0.061 ppm
2010 – 0.059 ppm
2011 – 0.060 ppm
0.060 ppm
Yes
UC #3 2009 – 0.060 ppm
2010 – 0.062 ppm
2011 – 0.062 ppm
0.061 ppm
Yes
In 2011, the SD School Site had the highest 3-year average ozone concentrations in the state at
0.064 ppm, which is 85% of the 2008 revised ozone standard. The SD School Site replaced the
Wind Cave Site as the state’s highest concentration site for the first time in 2010 and continues
as the highest ozone site in the state. The second highest location is Research Farm Site at 0.062
ppm also located in the eastern edge of the state. Since 2008, both the Wind Cave and Badlands
sites are reporting significantly lower ozone design values with the Badlands now the lowest site
in the state.
Currently all ozone sites are at or less than 85% of the standard at the end of 2011. The data
collected in the past three years demonstrates that South Dakota is attaining the national ozone
standard. Ozone concentrations are near the same concentration level statewide.
Figure 6-4 – 2011 Ozone Design Values Statewide
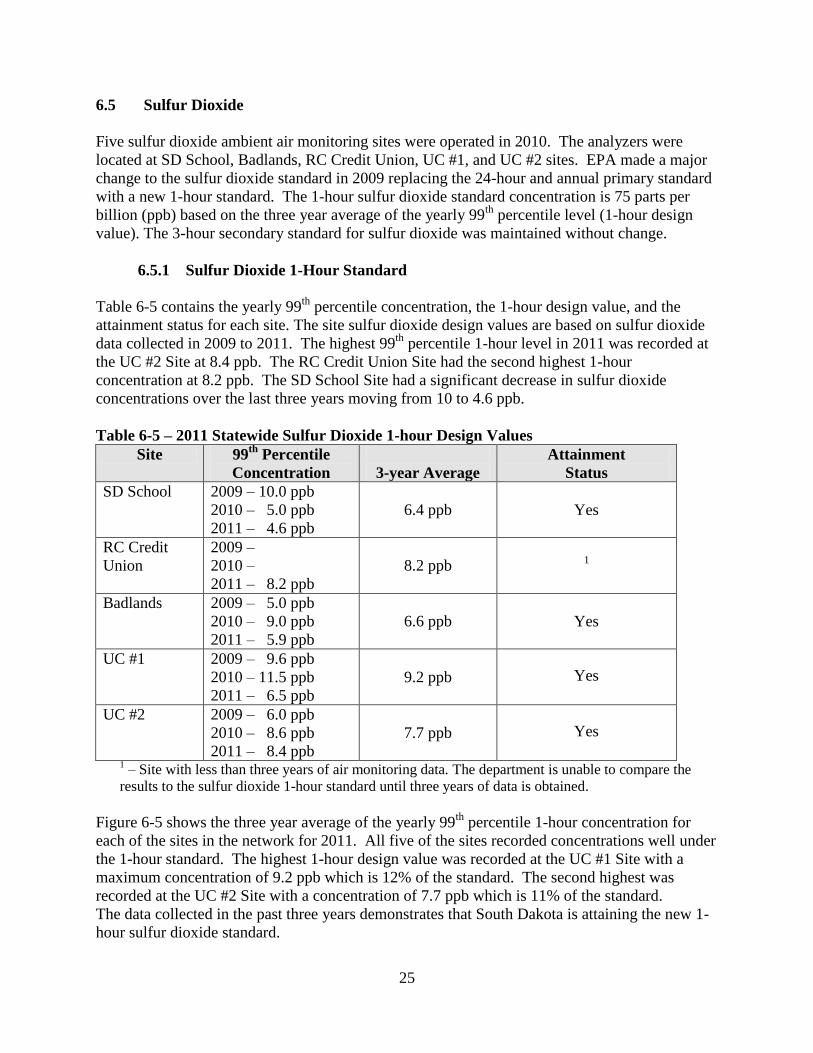
25
6.5 Sulfur Dioxide
Five sulfur dioxide ambient air monitoring sites were operated in 2010. The analyzers were
located at SD School, Badlands, RC Credit Union, UC #1, and UC #2 sites. EPA made a major
change to the sulfur dioxide standard in 2009 replacing the 24-hour and annual primary standard
with a new 1-hour standard. The 1-hour sulfur dioxide standard concentration is 75 parts per
billion (ppb) based on the three year average of the yearly 99th
percentile level (1-hour design
value). The 3-hour secondary standard for sulfur dioxide was maintained without change.
6.5.1 Sulfur Dioxide 1-Hour Standard
Table 6-5 contains the yearly 99th
percentile concentration, the 1-hour design value, and the
attainment status for each site. The site sulfur dioxide design values are based on sulfur dioxide
data collected in 2009 to 2011. The highest 99th
percentile 1-hour level in 2011 was recorded at
the UC #2 Site at 8.4 ppb. The RC Credit Union Site had the second highest 1-hour
concentration at 8.2 ppb. The SD School Site had a significant decrease in sulfur dioxide
concentrations over the last three years moving from 10 to 4.6 ppb.
Table 6-5 – 2011 Statewide Sulfur Dioxide 1-hour Design Values
Site 99th
Percentile
Concentration
3-year Average
Attainment
Status
SD School 2009 – 10.0 ppb
2010 – 5.0 ppb
2011 – 4.6 ppb
6.4 ppb
Yes
RC Credit
Union
2009 –
2010 –
2011 – 8.2 ppb
8.2 ppb
1
Badlands 2009 – 5.0 ppb
2010 – 9.0 ppb
2011 – 5.9 ppb
6.6 ppb
Yes
UC #1 2009 – 9.6 ppb
2010 – 11.5 ppb
2011 – 6.5 ppb
9.2 ppb
Yes
UC #2 2009 – 6.0 ppb
2010 – 8.6 ppb
2011 – 8.4 ppb
7.7 ppb
Yes
1 – Site with less than three years of air monitoring data. The department is unable to compare the
results to the sulfur dioxide 1-hour standard until three years of data is obtained.
Figure 6-5 shows the three year average of the yearly 99th
percentile 1-hour concentration for
each of the sites in the network for 2011. All five of the sites recorded concentrations well under
the 1-hour standard. The highest 1-hour design value was recorded at the UC #1 Site with a
maximum concentration of 9.2 ppb which is 12% of the standard. The second highest was
recorded at the UC #2 Site with a concentration of 7.7 ppb which is 11% of the standard.
The data collected in the past three years demonstrates that South Dakota is attaining the new 1-
hour sulfur dioxide standard.
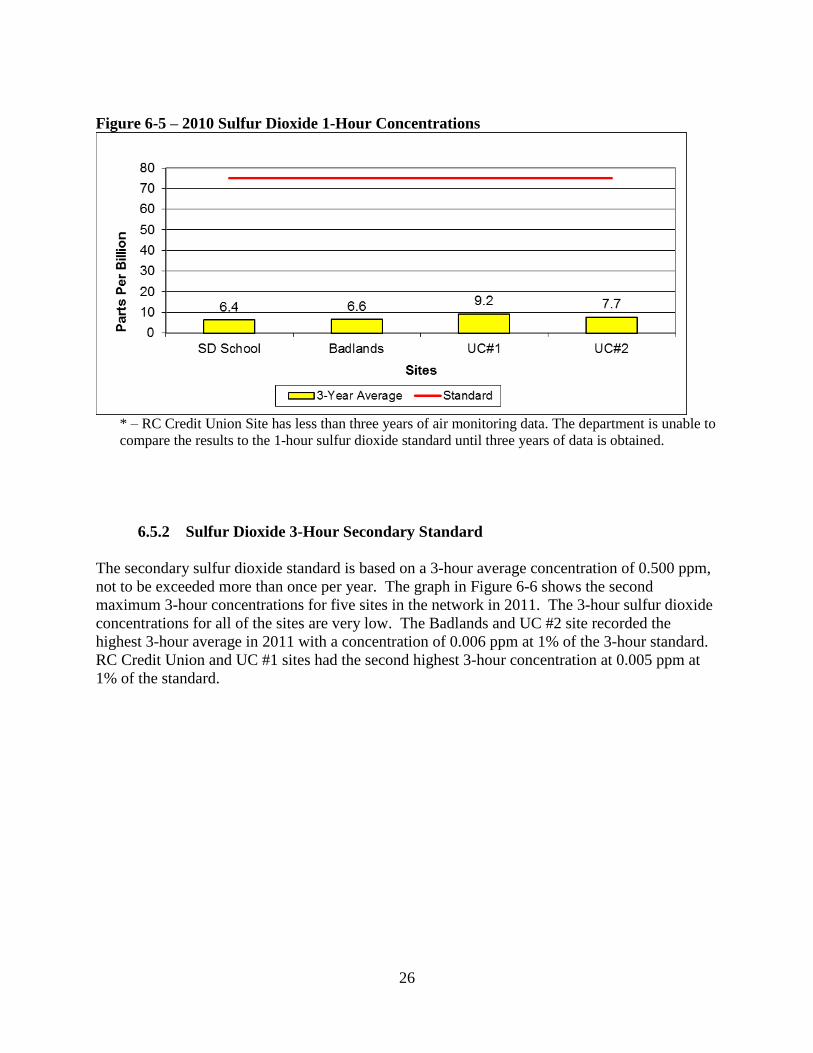
26
Figure 6-5 – 2010 Sulfur Dioxide 1-Hour Concentrations
* – RC Credit Union Site has less than three years of air monitoring data. The department is unable to
compare the results to the 1-hour sulfur dioxide standard until three years of data is obtained.
6.5.2 Sulfur Dioxide 3-Hour Secondary Standard
The secondary sulfur dioxide standard is based on a 3-hour average concentration of 0.500 ppm,
not to be exceeded more than once per year. The graph in Figure 6-6 shows the second
maximum 3-hour concentrations for five sites in the network in 2011. The 3-hour sulfur dioxide
concentrations for all of the sites are very low. The Badlands and UC #2 site recorded the
highest 3-hour average in 2011 with a concentration of 0.006 ppm at 1% of the 3-hour standard.
RC Credit Union and UC #1 sites had the second highest 3-hour concentration at 0.005 ppm at
1% of the standard.
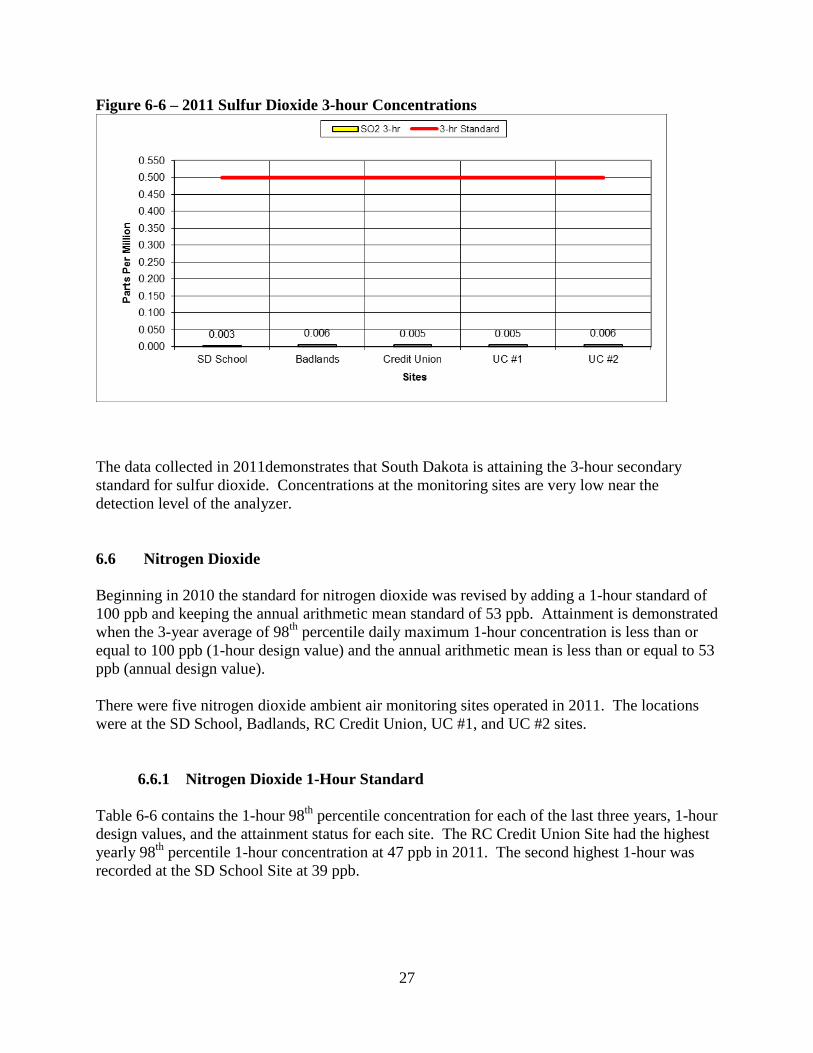
27
Figure 6-6 – 2011 Sulfur Dioxide 3-hour Concentrations
The data collected in 2011demonstrates that South Dakota is attaining the 3-hour secondary
standard for sulfur dioxide. Concentrations at the monitoring sites are very low near the
detection level of the analyzer.
6.6 Nitrogen Dioxide
Beginning in 2010 the standard for nitrogen dioxide was revised by adding a 1-hour standard of
100 ppb and keeping the annual arithmetic mean standard of 53 ppb. Attainment is demonstrated
when the 3-year average of 98th
percentile daily maximum 1-hour concentration is less than or
equal to 100 ppb (1-hour design value) and the annual arithmetic mean is less than or equal to 53
ppb (annual design value).
There were five nitrogen dioxide ambient air monitoring sites operated in 2011. The locations
were at the SD School, Badlands, RC Credit Union, UC #1, and UC #2 sites.
6.6.1 Nitrogen Dioxide 1-Hour Standard
Table 6-6 contains the 1-hour 98th
percentile concentration for each of the last three years, 1-hour
design values, and the attainment status for each site. The RC Credit Union Site had the highest
yearly 98th
percentile 1-hour concentration at 47 ppb in 2011. The second highest 1-hour was
recorded at the SD School Site at 39 ppb.
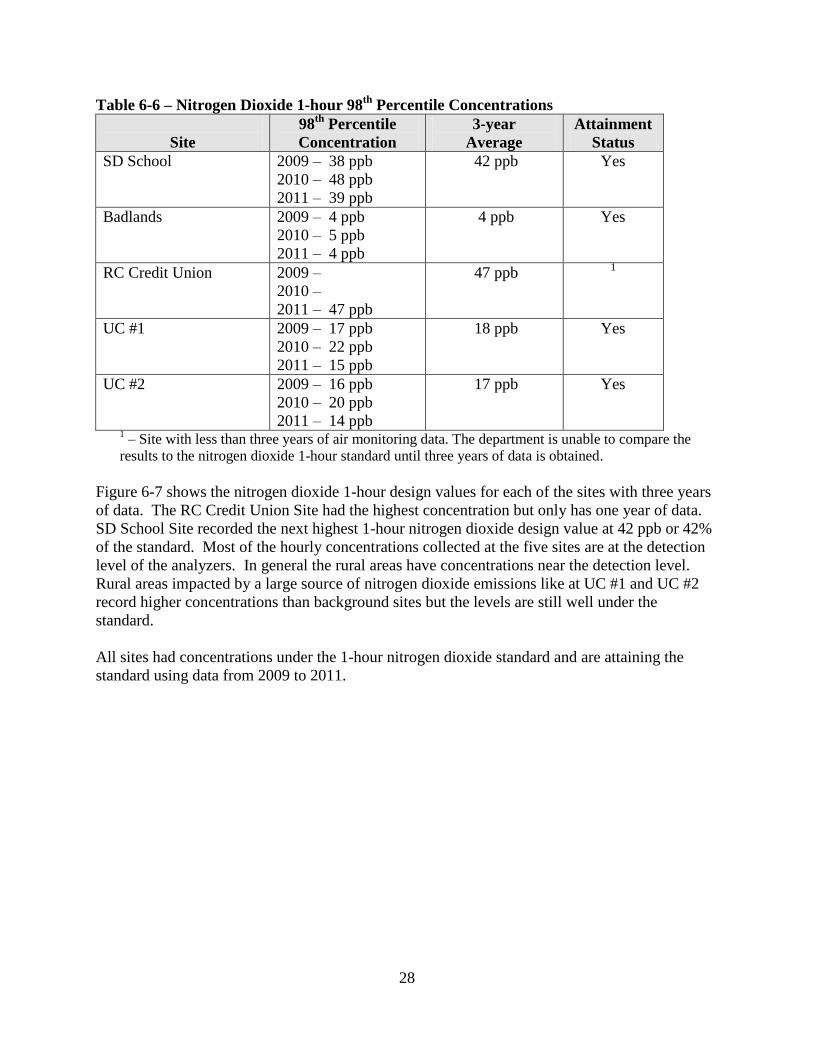
28
Table 6-6 – Nitrogen Dioxide 1-hour 98th
Percentile Concentrations
Site
98th
Percentile
Concentration
3-year
Average
Attainment
Status
SD School 2009 – 38 ppb
2010 – 48 ppb
2011 – 39 ppb
42 ppb Yes
Badlands 2009 – 4 ppb
2010 – 5 ppb
2011 – 4 ppb
4 ppb Yes
RC Credit Union 2009 –
2010 –
2011 – 47 ppb
47 ppb 1
UC #1 2009 – 17 ppb
2010 – 22 ppb
2011 – 15 ppb
18 ppb Yes
UC #2 2009 – 16 ppb
2010 – 20 ppb
2011 – 14 ppb
17 ppb Yes
1 – Site with less than three years of air monitoring data. The department is unable to compare the
results to the nitrogen dioxide 1-hour standard until three years of data is obtained.
Figure 6-7 shows the nitrogen dioxide 1-hour design values for each of the sites with three years
of data. The RC Credit Union Site had the highest concentration but only has one year of data.
SD School Site recorded the next highest 1-hour nitrogen dioxide design value at 42 ppb or 42%
of the standard. Most of the hourly concentrations collected at the five sites are at the detection
level of the analyzers. In general the rural areas have concentrations near the detection level.
Rural areas impacted by a large source of nitrogen dioxide emissions like at UC #1 and UC #2
record higher concentrations than background sites but the levels are still well under the
standard.
All sites had concentrations under the 1-hour nitrogen dioxide standard and are attaining the
standard using data from 2009 to 2011.

29
Figure 6-7 – 2011 Nitrogen Dioxide 1-hour Design Values
* - RC Credit Union Site has less than three years of air monitoring data. The department is unable to
compare the results to the 1-hour nitrogen dioxide standard until three years of data is obtained.
6.6.2 Nitrogen Dioxide Annual Standard
Figure 6-8 shows the annual average for the five sites operated in 2011. The highest nitrogen
dioxide annual average was recorded at the UC #2 Site at 8.4 ppb at 16% of the standard. The
Badlands Site remained at about same level near the detection concentration level. In 2011, all
five sites attained the annual standard for nitrogen dioxide.
Figure 6-8 – 2011 Nitrogen Dioxide Annual Concentration
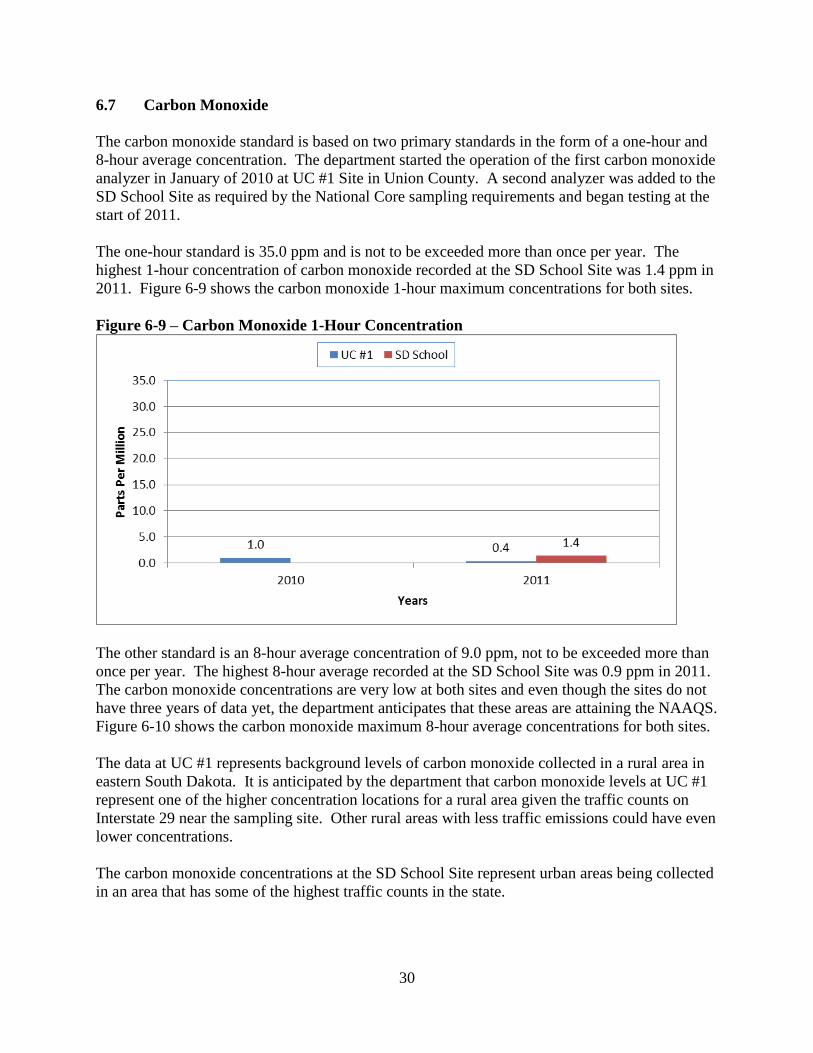
30
6.7 Carbon Monoxide
The carbon monoxide standard is based on two primary standards in the form of a one-hour and
8-hour average concentration. The department started the operation of the first carbon monoxide
analyzer in January of 2010 at UC #1 Site in Union County. A second analyzer was added to the
SD School Site as required by the National Core sampling requirements and began testing at the
start of 2011.
The one-hour standard is 35.0 ppm and is not to be exceeded more than once per year. The
highest 1-hour concentration of carbon monoxide recorded at the SD School Site was 1.4 ppm in
2011. Figure 6-9 shows the carbon monoxide 1-hour maximum concentrations for both sites.
Figure 6-9 – Carbon Monoxide 1-Hour Concentration
The other standard is an 8-hour average concentration of 9.0 ppm, not to be exceeded more than
once per year. The highest 8-hour average recorded at the SD School Site was 0.9 ppm in 2011.
The carbon monoxide concentrations are very low at both sites and even though the sites do not
have three years of data yet, the department anticipates that these areas are attaining the NAAQS.
Figure 6-10 shows the carbon monoxide maximum 8-hour average concentrations for both sites.
The data at UC #1 represents background levels of carbon monoxide collected in a rural area in
eastern South Dakota. It is anticipated by the department that carbon monoxide levels at UC #1
represent one of the higher concentration locations for a rural area given the traffic counts on
Interstate 29 near the sampling site. Other rural areas with less traffic emissions could have even
lower concentrations.
The carbon monoxide concentrations at the SD School Site represent urban areas being collected
in an area that has some of the highest traffic counts in the state.
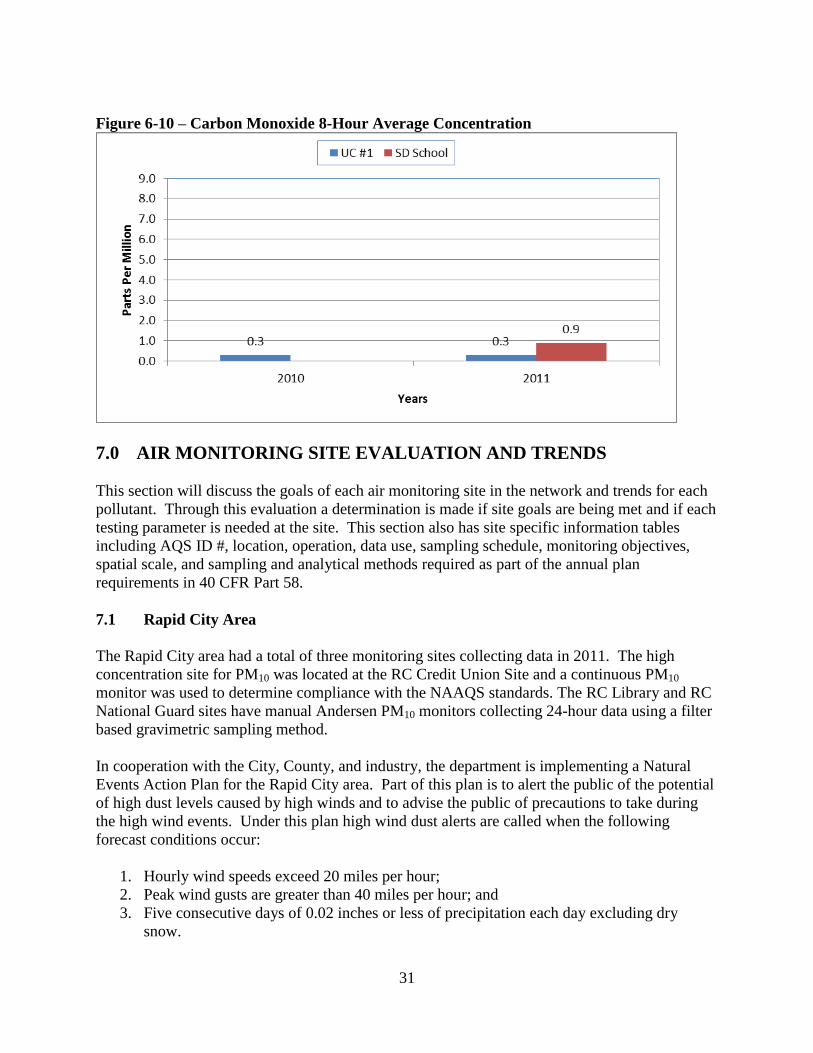
31
Figure 6-10 – Carbon Monoxide 8-Hour Average Concentration
7.0 AIR MONITORING SITE EVALUATION AND TRENDS
This section will discuss the goals of each air monitoring site in the network and trends for each
pollutant. Through this evaluation a determination is made if site goals are being met and if each
testing parameter is needed at the site. This section also has site specific information tables
including AQS ID #, location, operation, data use, sampling schedule, monitoring objectives,
spatial scale, and sampling and analytical methods required as part of the annual plan
requirements in 40 CFR Part 58.
7.1 Rapid City Area
The Rapid City area had a total of three monitoring sites collecting data in 2011. The high
concentration site for PM10 was located at the RC Credit Union Site and a continuous PM10
monitor was used to determine compliance with the NAAQS standards. The RC Library and RC
National Guard sites have manual Andersen PM10 monitors collecting 24-hour data using a filter
based gravimetric sampling method.
In cooperation with the City, County, and industry, the department is implementing a Natural
Events Action Plan for the Rapid City area. Part of this plan is to alert the public of the potential
of high dust levels caused by high winds and to advise the public of precautions to take during
the high wind events. Under this plan high wind dust alerts are called when the following
forecast conditions occur:
1. Hourly wind speeds exceed 20 miles per hour;
2. Peak wind gusts are greater than 40 miles per hour; and
3. Five consecutive days of 0.02 inches or less of precipitation each day excluding dry
snow.
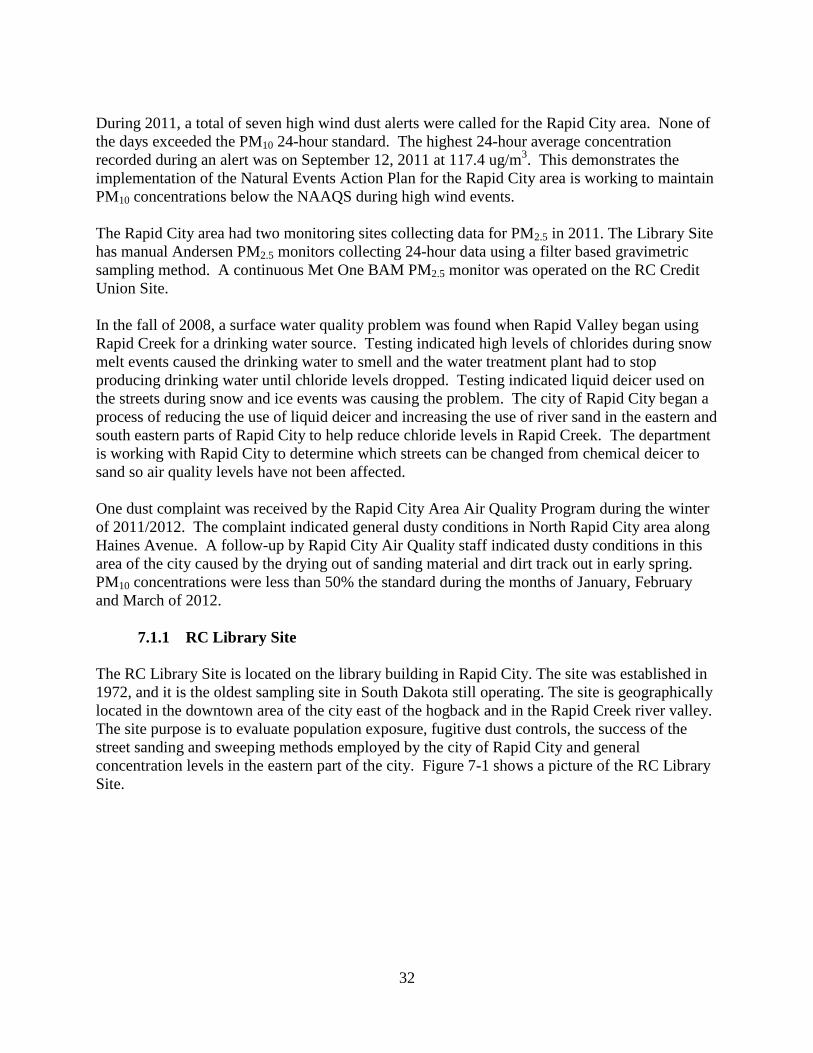
32
During 2011, a total of seven high wind dust alerts were called for the Rapid City area. None of
the days exceeded the PM10 24-hour standard. The highest 24-hour average concentration
recorded during an alert was on September 12, 2011 at 117.4 ug/m3. This demonstrates the
implementation of the Natural Events Action Plan for the Rapid City area is working to maintain
PM10 concentrations below the NAAQS during high wind events.
The Rapid City area had two monitoring sites collecting data for PM2.5 in 2011. The Library Site
has manual Andersen PM2.5 monitors collecting 24-hour data using a filter based gravimetric
sampling method. A continuous Met One BAM PM2.5 monitor was operated on the RC Credit
Union Site.
In the fall of 2008, a surface water quality problem was found when Rapid Valley began using
Rapid Creek for a drinking water source. Testing indicated high levels of chlorides during snow
melt events caused the drinking water to smell and the water treatment plant had to stop
producing drinking water until chloride levels dropped. Testing indicated liquid deicer used on
the streets during snow and ice events was causing the problem. The city of Rapid City began a
process of reducing the use of liquid deicer and increasing the use of river sand in the eastern and
south eastern parts of Rapid City to help reduce chloride levels in Rapid Creek. The department
is working with Rapid City to determine which streets can be changed from chemical deicer to
sand so air quality levels have not been affected.
One dust complaint was received by the Rapid City Area Air Quality Program during the winter
of 2011/2012. The complaint indicated general dusty conditions in North Rapid City area along
Haines Avenue. A follow-up by Rapid City Air Quality staff indicated dusty conditions in this
area of the city caused by the drying out of sanding material and dirt track out in early spring.
PM10 concentrations were less than 50% the standard during the months of January, February
and March of 2012.
7.1.1 RC Library Site
The RC Library Site is located on the library building in Rapid City. The site was established in
1972, and it is the oldest sampling site in South Dakota still operating. The site is geographically
located in the downtown area of the city east of the hogback and in the Rapid Creek river valley.
The site purpose is to evaluate population exposure, fugitive dust controls, the success of the
street sanding and sweeping methods employed by the city of Rapid City and general
concentration levels in the eastern part of the city. Figure 7-1 shows a picture of the RC Library
Site.
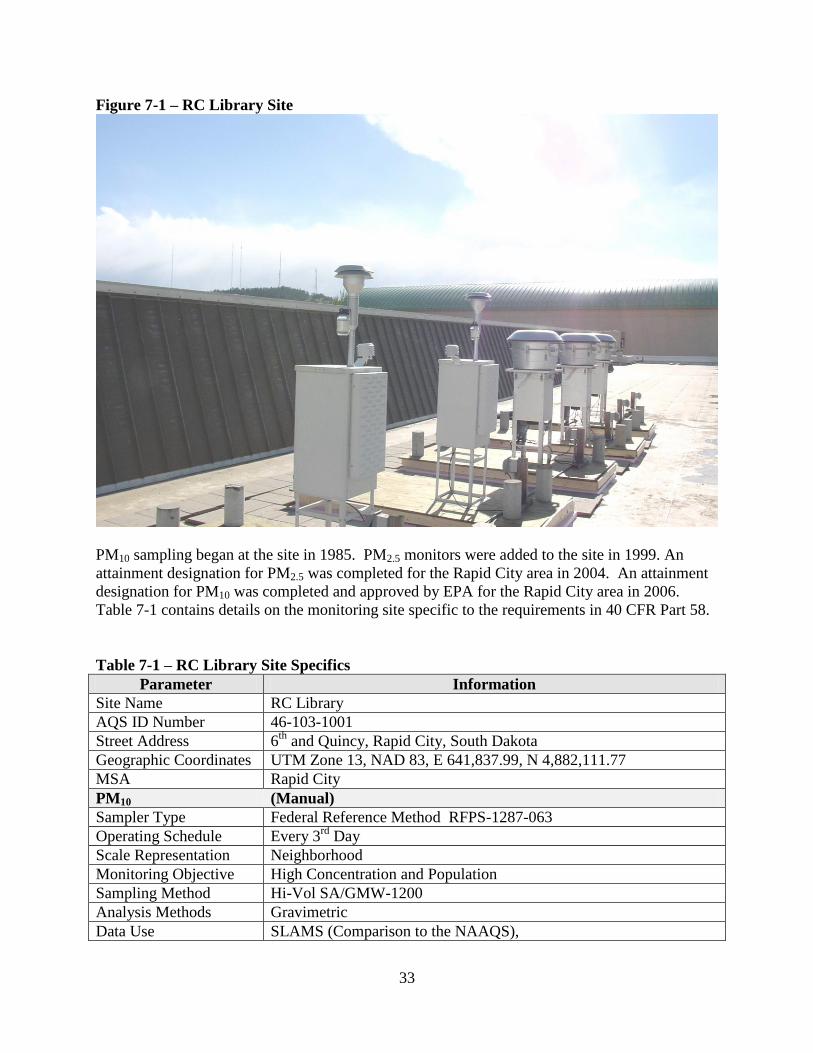
33
Figure 7-1 – RC Library Site
PM10 sampling began at the site in 1985. PM2.5 monitors were added to the site in 1999. An
attainment designation for PM2.5 was completed for the Rapid City area in 2004. An attainment
designation for PM10 was completed and approved by EPA for the Rapid City area in 2006.
Table 7-1 contains details on the monitoring site specific to the requirements in 40 CFR Part 58.
Table 7-1 – RC Library Site Specifics
Parameter Information
Site Name RC Library
AQS ID Number 46-103-1001
Street Address 6th
and Quincy, Rapid City, South Dakota
Geographic Coordinates UTM Zone 13, NAD 83, E 641,837.99, N 4,882,111.77
MSA Rapid City
PM10 (Manual)
Sampler Type Federal Reference Method RFPS-1287-063
Operating Schedule Every 3rd
Day
Scale Representation Neighborhood
Monitoring Objective High Concentration and Population
Sampling Method Hi-Vol SA/GMW-1200
Analysis Methods Gravimetric
Data Use SLAMS (Comparison to the NAAQS),
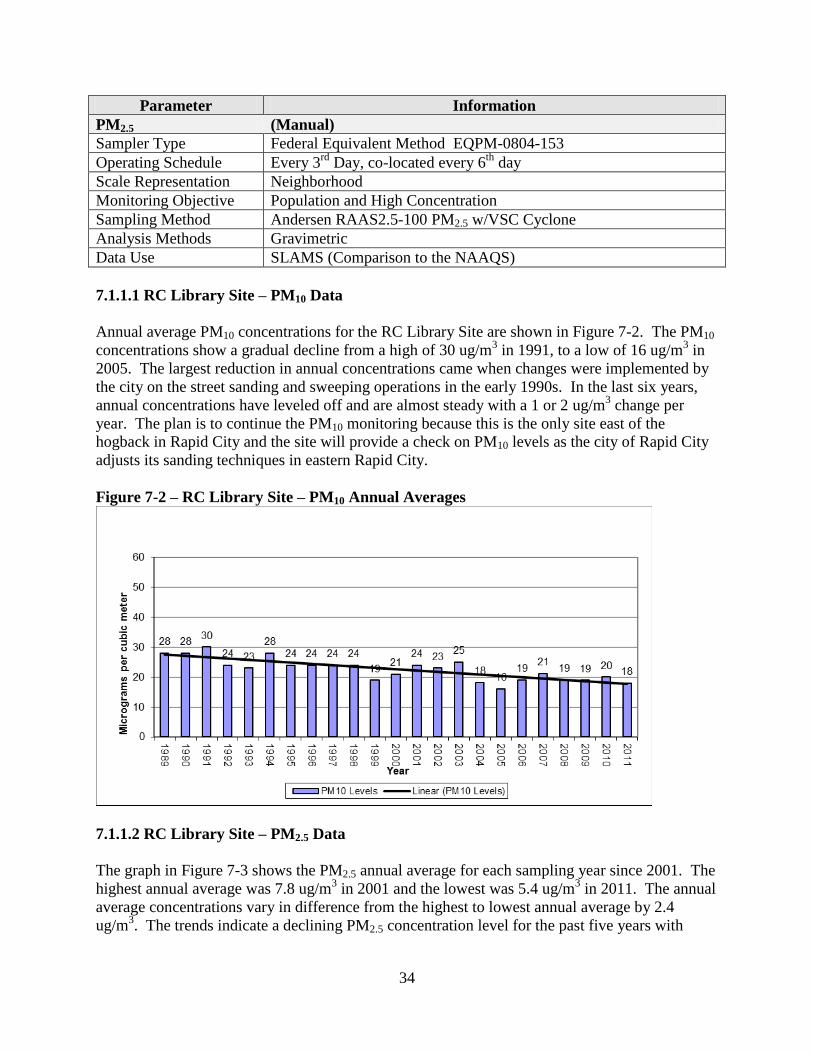
34
Parameter Information
PM2.5 (Manual)
Sampler Type Federal Equivalent Method EQPM-0804-153
Operating Schedule Every 3rd
Day, co-located every 6th
day
Scale Representation Neighborhood
Monitoring Objective Population and High Concentration
Sampling Method Andersen RAAS2.5-100 PM2.5 w/VSC Cyclone
Analysis Methods Gravimetric
Data Use SLAMS (Comparison to the NAAQS)
7.1.1.1 RC Library Site – PM10 Data
Annual average PM10 concentrations for the RC Library Site are shown in Figure 7-2. The PM10
concentrations show a gradual decline from a high of 30 ug/m3 in 1991, to a low of 16 ug/m
3 in
2005. The largest reduction in annual concentrations came when changes were implemented by
the city on the street sanding and sweeping operations in the early 1990s. In the last six years,
annual concentrations have leveled off and are almost steady with a 1 or 2 ug/m3 change per
year. The plan is to continue the PM10 monitoring because this is the only site east of the
hogback in Rapid City and the site will provide a check on PM10 levels as the city of Rapid City
adjusts its sanding techniques in eastern Rapid City.
Figure 7-2 – RC Library Site – PM10 Annual Averages
7.1.1.2 RC Library Site – PM2.5 Data
The graph in Figure 7-3 shows the PM2.5 annual average for each sampling year since 2001. The
highest annual average was 7.8 ug/m3 in 2001 and the lowest was 5.4 ug/m
3 in 2011. The annual
average concentrations vary in difference from the highest to lowest annual average by 2.4
ug/m3. The trends indicate a declining PM2.5 concentration level for the past five years with
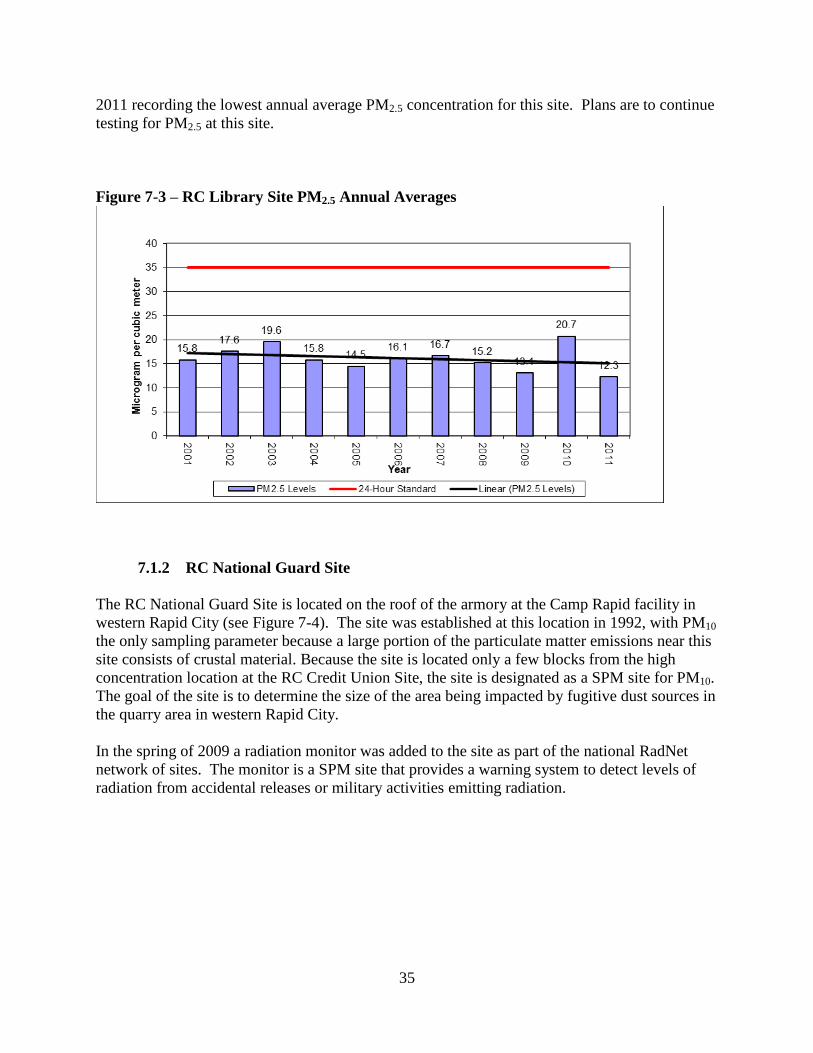
35
2011 recording the lowest annual average PM2.5 concentration for this site. Plans are to continue
testing for PM2.5 at this site.
Figure 7-3 – RC Library Site PM2.5 Annual Averages
7.1.2 RC National Guard Site
The RC National Guard Site is located on the roof of the armory at the Camp Rapid facility in
western Rapid City (see Figure 7-4). The site was established at this location in 1992, with PM10
the only sampling parameter because a large portion of the particulate matter emissions near this
site consists of crustal material. Because the site is located only a few blocks from the high
concentration location at the RC Credit Union Site, the site is designated as a SPM site for PM10.
The goal of the site is to determine the size of the area being impacted by fugitive dust sources in
the quarry area in western Rapid City.
In the spring of 2009 a radiation monitor was added to the site as part of the national RadNet
network of sites. The monitor is a SPM site that provides a warning system to detect levels of
radiation from accidental releases or military activities emitting radiation.
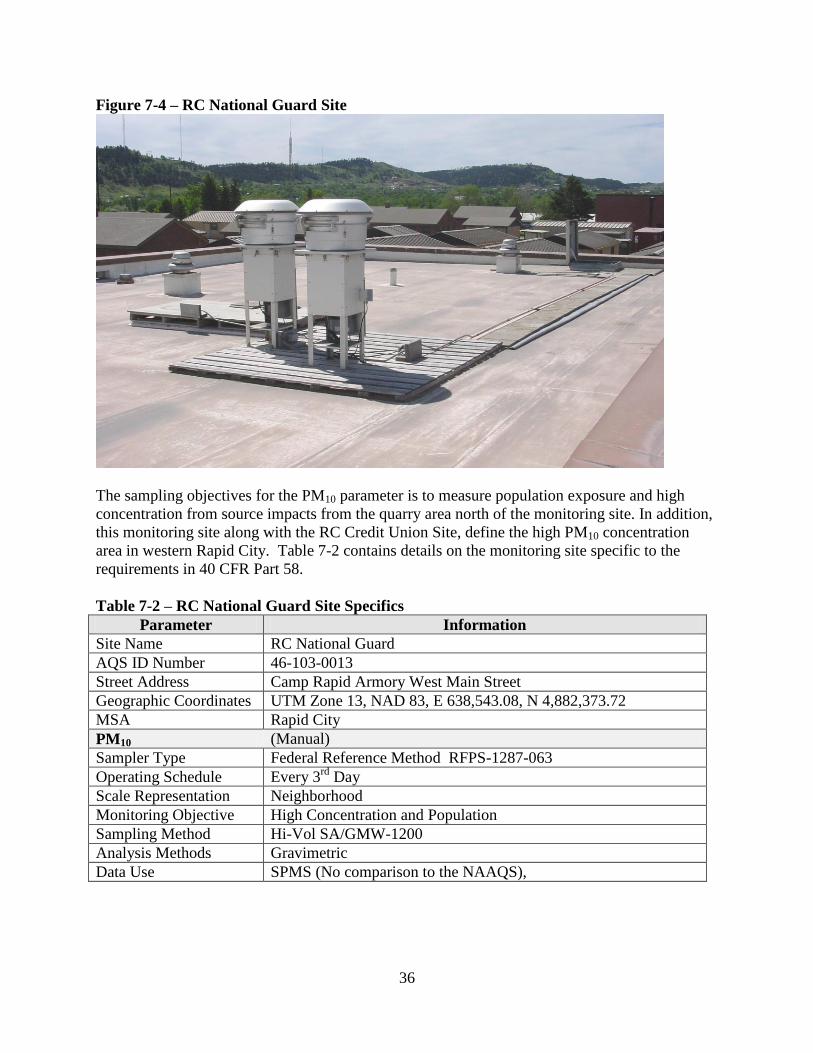
36
Figure 7-4 – RC National Guard Site
The sampling objectives for the PM10 parameter is to measure population exposure and high
concentration from source impacts from the quarry area north of the monitoring site. In addition,
this monitoring site along with the RC Credit Union Site, define the high PM10 concentration
area in western Rapid City. Table 7-2 contains details on the monitoring site specific to the
requirements in 40 CFR Part 58.
Table 7-2 – RC National Guard Site Specifics
Parameter Information
Site Name RC National Guard
AQS ID Number 46-103-0013
Street Address Camp Rapid Armory West Main Street
Geographic Coordinates UTM Zone 13, NAD 83, E 638,543.08, N 4,882,373.72
MSA Rapid City
PM10 (Manual)
Sampler Type Federal Reference Method RFPS-1287-063
Operating Schedule Every 3rd
Day
Scale Representation Neighborhood
Monitoring Objective High Concentration and Population
Sampling Method Hi-Vol SA/GMW-1200
Analysis Methods Gravimetric
Data Use SPMS (No comparison to the NAAQS),
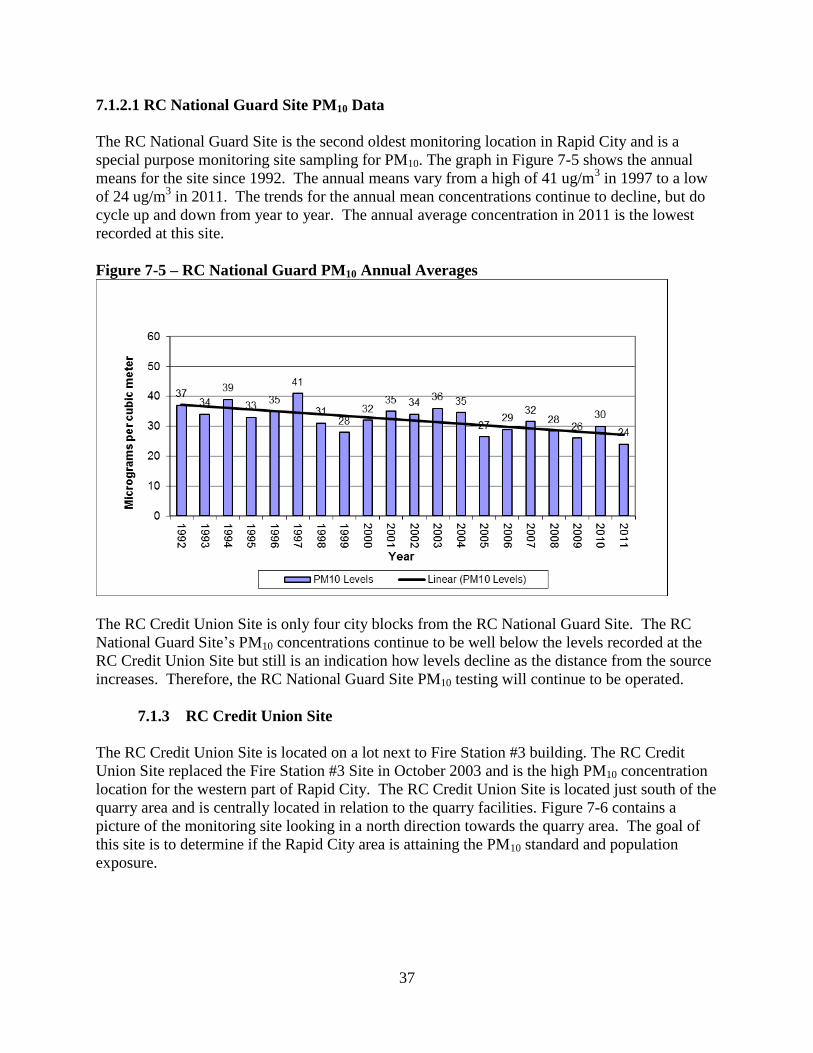
37
7.1.2.1 RC National Guard Site PM10 Data
The RC National Guard Site is the second oldest monitoring location in Rapid City and is a
special purpose monitoring site sampling for PM10. The graph in Figure 7-5 shows the annual
means for the site since 1992. The annual means vary from a high of 41 ug/m3 in 1997 to a low
of 24 ug/m3 in 2011. The trends for the annual mean concentrations continue to decline, but do
cycle up and down from year to year. The annual average concentration in 2011 is the lowest
recorded at this site.
Figure 7-5 – RC National Guard PM10 Annual Averages
The RC Credit Union Site is only four city blocks from the RC National Guard Site. The RC
National Guard Site’s PM10 concentrations continue to be well below the levels recorded at the
RC Credit Union Site but still is an indication how levels decline as the distance from the source
increases. Therefore, the RC National Guard Site PM10 testing will continue to be operated.
7.1.3 RC Credit Union Site
The RC Credit Union Site is located on a lot next to Fire Station #3 building. The RC Credit
Union Site replaced the Fire Station #3 Site in October 2003 and is the high PM10 concentration
location for the western part of Rapid City. The RC Credit Union Site is located just south of the
quarry area and is centrally located in relation to the quarry facilities. Figure 7-6 contains a
picture of the monitoring site looking in a north direction towards the quarry area. The goal of
this site is to determine if the Rapid City area is attaining the PM10 standard and population
exposure.
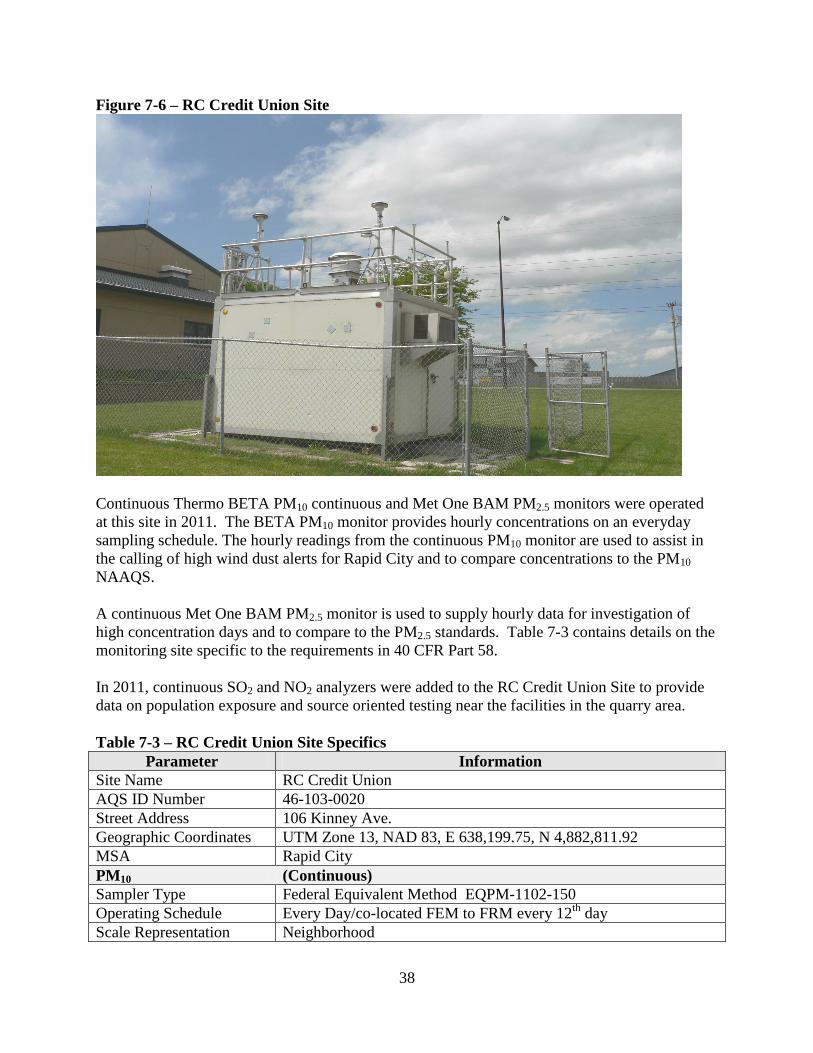
38
Figure 7-6 – RC Credit Union Site
Continuous Thermo BETA PM10 continuous and Met One BAM PM2.5 monitors were operated
at this site in 2011. The BETA PM10 monitor provides hourly concentrations on an everyday
sampling schedule. The hourly readings from the continuous PM10 monitor are used to assist in
the calling of high wind dust alerts for Rapid City and to compare concentrations to the PM10
NAAQS.
A continuous Met One BAM PM2.5 monitor is used to supply hourly data for investigation of
high concentration days and to compare to the PM2.5 standards. Table 7-3 contains details on the
monitoring site specific to the requirements in 40 CFR Part 58.
In 2011, continuous SO2 and NO2 analyzers were added to the RC Credit Union Site to provide
data on population exposure and source oriented testing near the facilities in the quarry area.
Table 7-3 – RC Credit Union Site Specifics
Parameter Information
Site Name RC Credit Union
AQS ID Number 46-103-0020
Street Address 106 Kinney Ave.
Geographic Coordinates UTM Zone 13, NAD 83, E 638,199.75, N 4,882,811.92
MSA Rapid City
PM10 (Continuous)
Sampler Type Federal Equivalent Method EQPM-1102-150
Operating Schedule Every Day/co-located FEM to FRM every 12th
day
Scale Representation Neighborhood
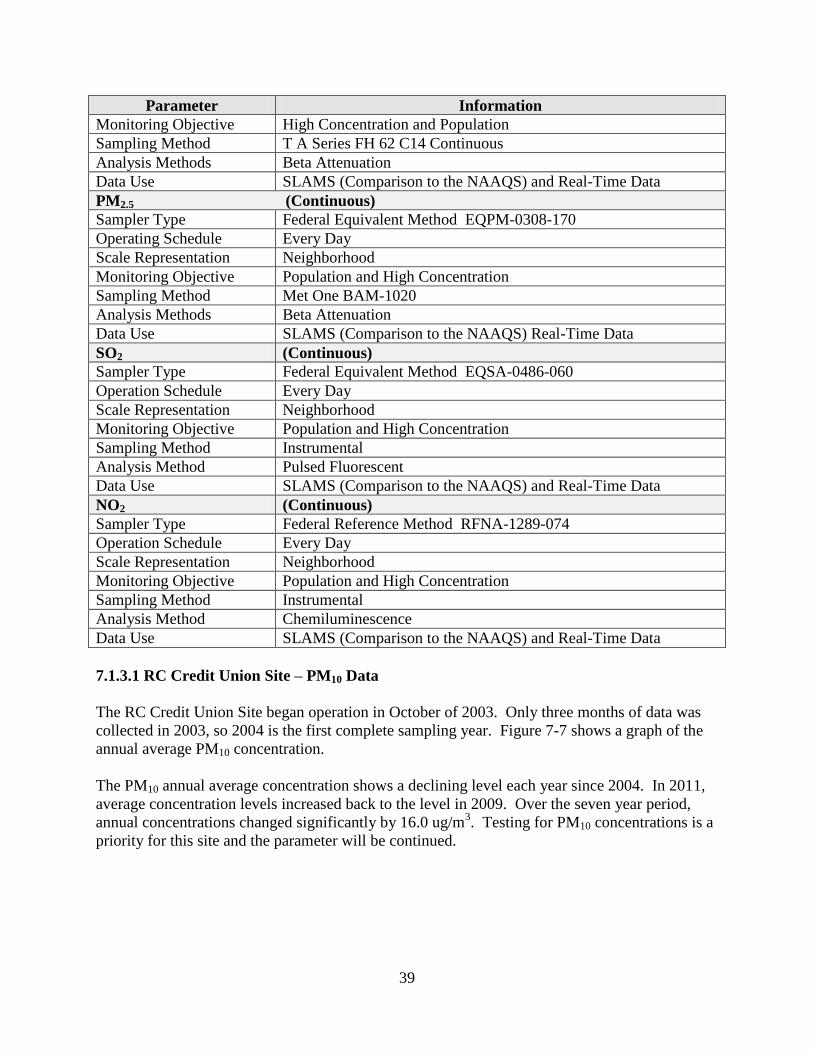
39
Parameter Information
Monitoring Objective High Concentration and Population
Sampling Method T A Series FH 62 C14 Continuous
Analysis Methods Beta Attenuation
Data Use SLAMS (Comparison to the NAAQS) and Real-Time Data
PM2.5 (Continuous)
Sampler Type Federal Equivalent Method EQPM-0308-170
Operating Schedule Every Day
Scale Representation Neighborhood
Monitoring Objective Population and High Concentration
Sampling Method Met One BAM-1020
Analysis Methods Beta Attenuation
Data Use SLAMS (Comparison to the NAAQS) Real-Time Data
SO2 (Continuous)
Sampler Type Federal Equivalent Method EQSA-0486-060
Operation Schedule Every Day
Scale Representation Neighborhood
Monitoring Objective Population and High Concentration
Sampling Method Instrumental
Analysis Method Pulsed Fluorescent
Data Use SLAMS (Comparison to the NAAQS) and Real-Time Data
NO2 (Continuous)
Sampler Type Federal Reference Method RFNA-1289-074
Operation Schedule Every Day
Scale Representation Neighborhood
Monitoring Objective Population and High Concentration
Sampling Method Instrumental
Analysis Method Chemiluminescence
Data Use SLAMS (Comparison to the NAAQS) and Real-Time Data
7.1.3.1 RC Credit Union Site – PM10 Data
The RC Credit Union Site began operation in October of 2003. Only three months of data was
collected in 2003, so 2004 is the first complete sampling year. Figure 7-7 shows a graph of the
annual average PM10 concentration.
The PM10 annual average concentration shows a declining level each year since 2004. In 2011,
average concentration levels increased back to the level in 2009. Over the seven year period,
annual concentrations changed significantly by 16.0 ug/m3. Testing for PM10 concentrations is a
priority for this site and the parameter will be continued.
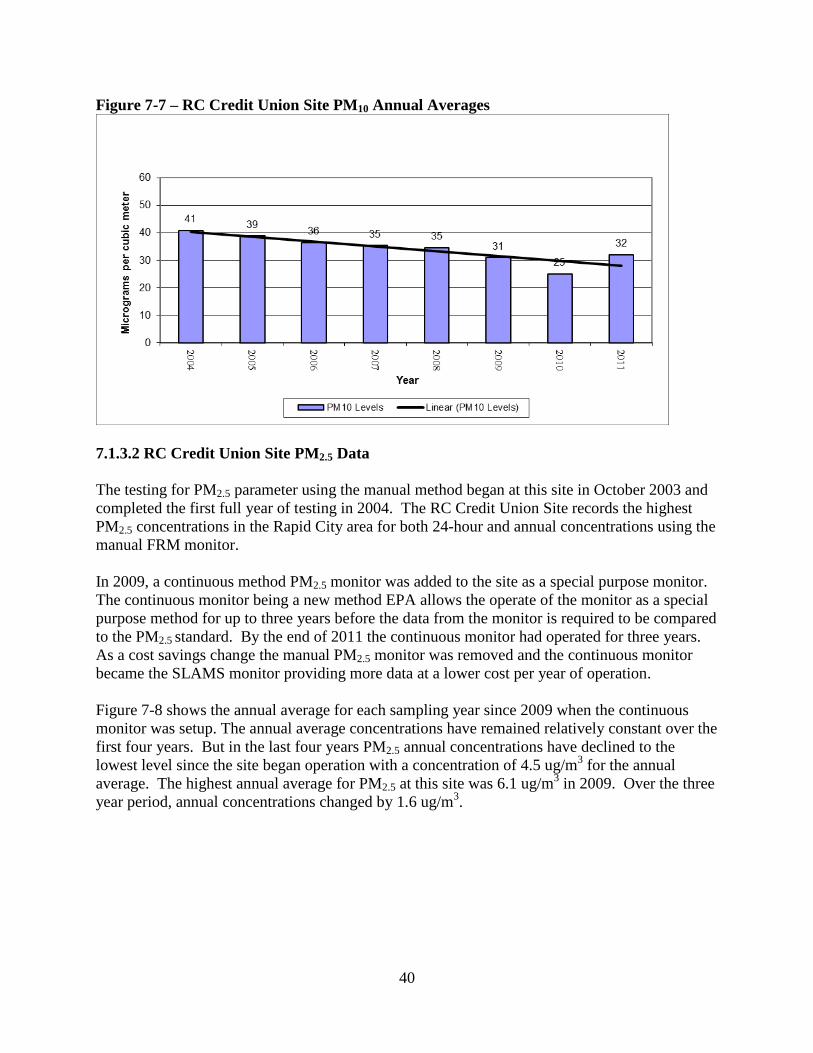
40
Figure 7-7 – RC Credit Union Site PM10 Annual Averages
7.1.3.2 RC Credit Union Site PM2.5 Data
The testing for PM2.5 parameter using the manual method began at this site in October 2003 and
completed the first full year of testing in 2004. The RC Credit Union Site records the highest
PM2.5 concentrations in the Rapid City area for both 24-hour and annual concentrations using the
manual FRM monitor.
In 2009, a continuous method PM2.5 monitor was added to the site as a special purpose monitor.
The continuous monitor being a new method EPA allows the operate of the monitor as a special
purpose method for up to three years before the data from the monitor is required to be compared
to the PM2.5 standard. By the end of 2011 the continuous monitor had operated for three years.
As a cost savings change the manual PM2.5 monitor was removed and the continuous monitor
became the SLAMS monitor providing more data at a lower cost per year of operation.
Figure 7-8 shows the annual average for each sampling year since 2009 when the continuous
monitor was setup. The annual average concentrations have remained relatively constant over the
first four years. But in the last four years PM2.5 annual concentrations have declined to the
lowest level since the site began operation with a concentration of 4.5 ug/m3 for the annual
average. The highest annual average for PM2.5 at this site was 6.1 ug/m3 in 2009. Over the three
year period, annual concentrations changed by 1.6 ug/m3.
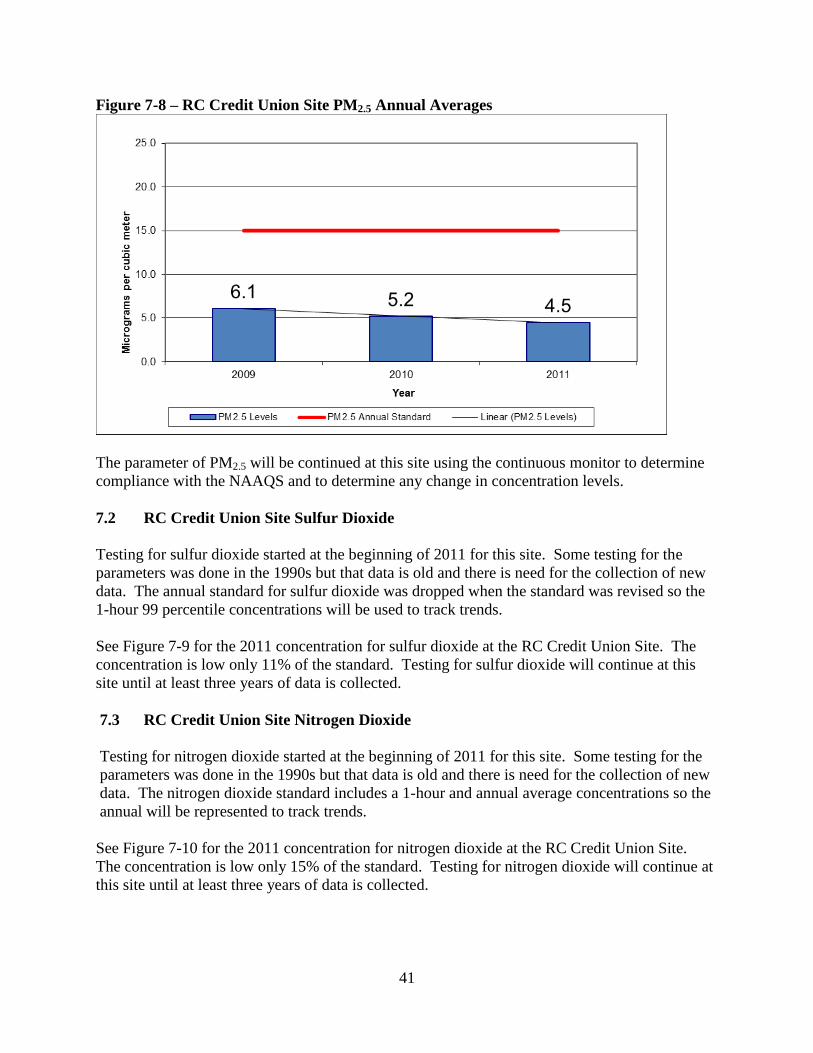
41
Figure 7-8 – RC Credit Union Site PM2.5 Annual Averages
The parameter of PM2.5 will be continued at this site using the continuous monitor to determine
compliance with the NAAQS and to determine any change in concentration levels.
7.2 RC Credit Union Site Sulfur Dioxide
Testing for sulfur dioxide started at the beginning of 2011 for this site. Some testing for the
parameters was done in the 1990s but that data is old and there is need for the collection of new
data. The annual standard for sulfur dioxide was dropped when the standard was revised so the
1-hour 99 percentile concentrations will be used to track trends.
See Figure 7-9 for the 2011 concentration for sulfur dioxide at the RC Credit Union Site. The
concentration is low only 11% of the standard. Testing for sulfur dioxide will continue at this
site until at least three years of data is collected.
7.3 RC Credit Union Site Nitrogen Dioxide
Testing for nitrogen dioxide started at the beginning of 2011 for this site. Some testing for the
parameters was done in the 1990s but that data is old and there is need for the collection of new
data. The nitrogen dioxide standard includes a 1-hour and annual average concentrations so the
annual will be represented to track trends.
See Figure 7-10 for the 2011 concentration for nitrogen dioxide at the RC Credit Union Site.
The concentration is low only 15% of the standard. Testing for nitrogen dioxide will continue at
this site until at least three years of data is collected.
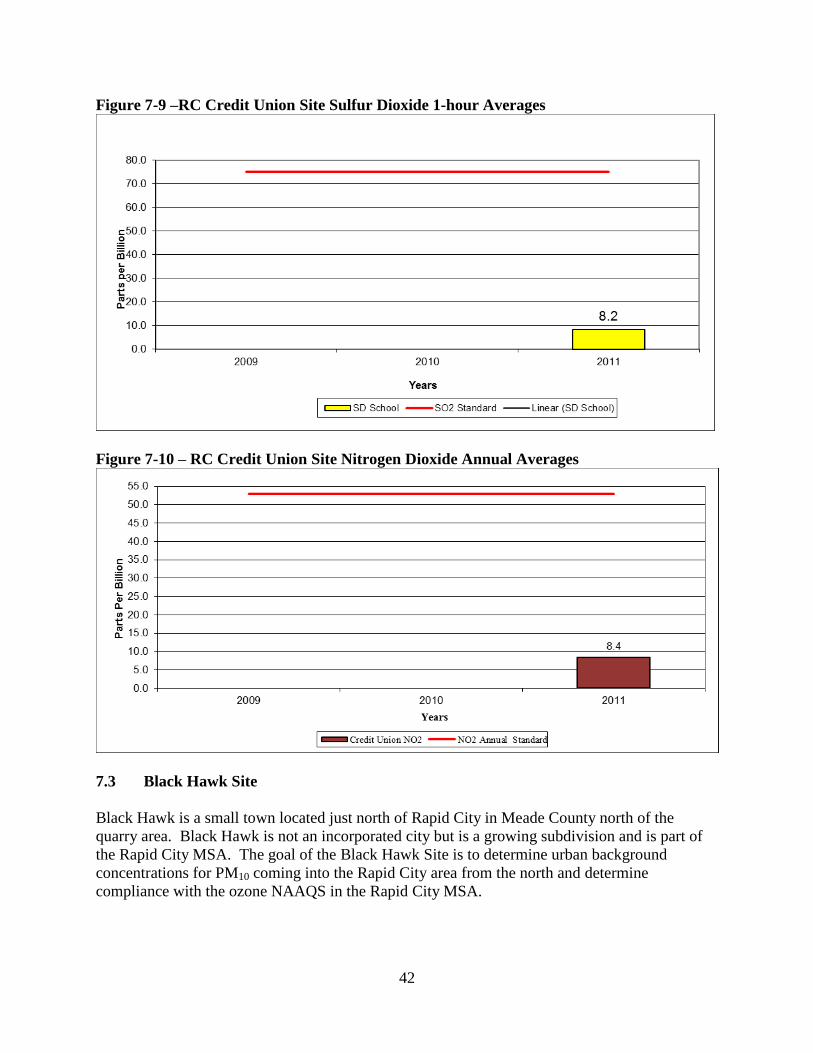
42
Figure 7-9 –RC Credit Union Site Sulfur Dioxide 1-hour Averages
Figure 7-10 – RC Credit Union Site Nitrogen Dioxide Annual Averages
7.3 Black Hawk Site
Black Hawk is a small town located just north of Rapid City in Meade County north of the
quarry area. Black Hawk is not an incorporated city but is a growing subdivision and is part of
the Rapid City MSA. The goal of the Black Hawk Site is to determine urban background
concentrations for PM10 coming into the Rapid City area from the north and determine
compliance with the ozone NAAQS in the Rapid City MSA.
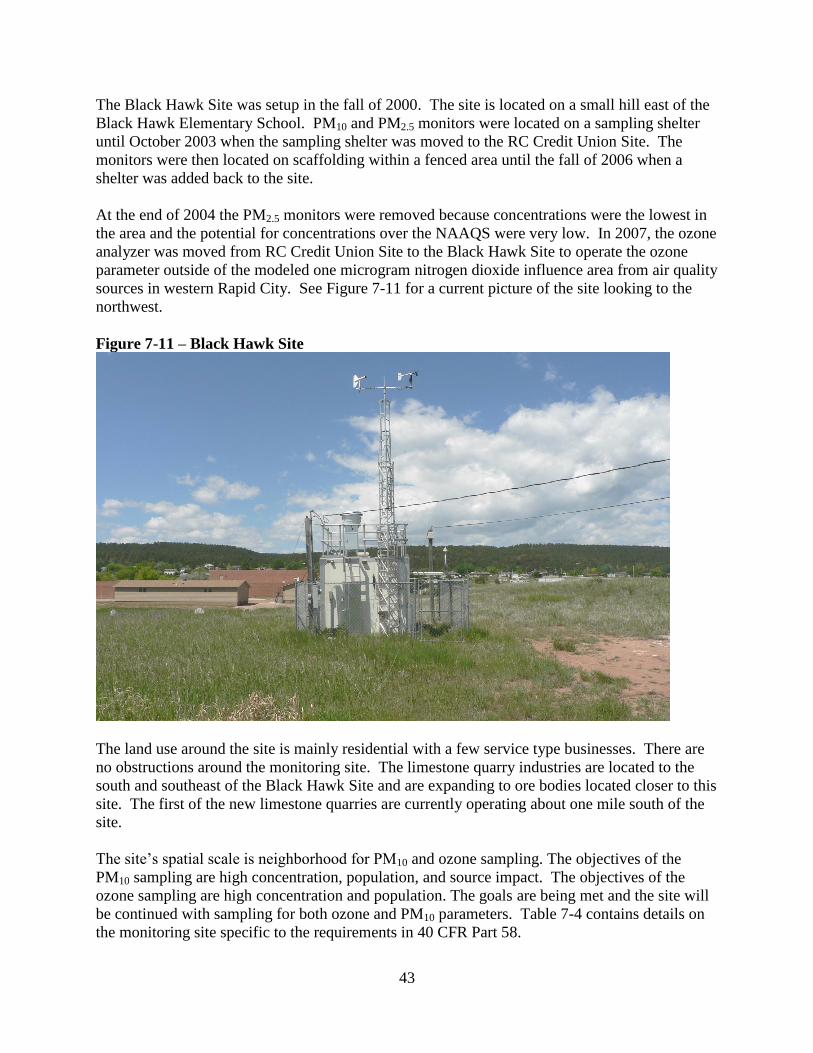
43
The Black Hawk Site was setup in the fall of 2000. The site is located on a small hill east of the
Black Hawk Elementary School. PM10 and PM2.5 monitors were located on a sampling shelter
until October 2003 when the sampling shelter was moved to the RC Credit Union Site. The
monitors were then located on scaffolding within a fenced area until the fall of 2006 when a
shelter was added back to the site.
At the end of 2004 the PM2.5 monitors were removed because concentrations were the lowest in
the area and the potential for concentrations over the NAAQS were very low. In 2007, the ozone
analyzer was moved from RC Credit Union Site to the Black Hawk Site to operate the ozone
parameter outside of the modeled one microgram nitrogen dioxide influence area from air quality
sources in western Rapid City. See Figure 7-11 for a current picture of the site looking to the
northwest.
Figure 7-11 – Black Hawk Site
The land use around the site is mainly residential with a few service type businesses. There are
no obstructions around the monitoring site. The limestone quarry industries are located to the
south and southeast of the Black Hawk Site and are expanding to ore bodies located closer to this
site. The first of the new limestone quarries are currently operating about one mile south of the
site.
The site’s spatial scale is neighborhood for PM10 and ozone sampling. The objectives of the
PM10 sampling are high concentration, population, and source impact. The objectives of the
ozone sampling are high concentration and population. The goals are being met and the site will
be continued with sampling for both ozone and PM10 parameters. Table 7-4 contains details on
the monitoring site specific to the requirements in 40 CFR Part 58.
44
Table 7-4 – Black Hawk Site Specifics
Parameter Information
Site Name Black Hawk Elementary
AQS ID Number 46-093-0001
Street Address 7108 Seeaire Street
Geographic Coordinates UTM Zone 13, NAD 83, E 634,683.07 N 4,890,309.65
MSA Rapid City
PM10 (Manual)
Sampler Type Federal Reference Method RFPS-1287-063
Operating Schedule Every Third Day
Scale Representation Neighborhood
Monitoring Objective Population, Urban Background
Sampling Method Hi-Vol SA/GMW-1200
Analysis Methods Gravimetric
Data Use SLAMS (Comparison to the NAAQS)
Ozone (Continuous)
Sampler Type Federal Equivalent Method EQOA-0880-147
Operating Schedule Every Day
Scale Representation Neighborhood
Monitoring Objective Population and High Concentration
Sampling Method Instrumental Thermo 49i
Analysis Methods Ultraviolet
Data Use SLAMS (Comparison to the NAAQS) and Real-time Data
7.3.1 Black Hawk Site – PM10 Data
Figure 7-12 contains a graph showing the PM10 annual averages for the Black Hawk Site. The
first four years of PM10 concentration levels remained about the same. In 2005, the annual
average dropped significantly by approximately 4 ug/m3 from the 2004 level. The highest annual
average was 21 ug/m3 recorded in both 2001 and 2003. The lowest level of 12 ug/m
3 was
recorded in 2011. In 2011, the PM10 concentrations dropped 2 ug/m3 from the concentration in
2010. The overall trend shows a significant decrease in concentrations over the eleven year
period.
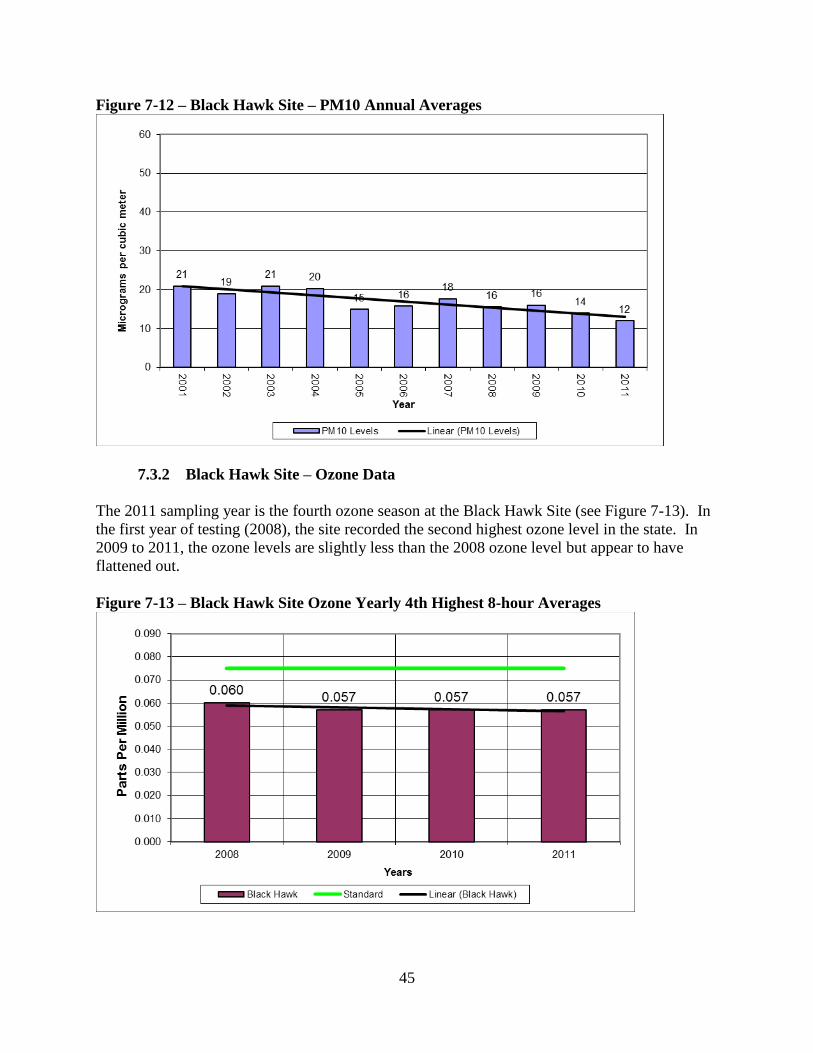
45
Figure 7-12 – Black Hawk Site – PM10 Annual Averages
7.3.2 Black Hawk Site – Ozone Data
The 2011 sampling year is the fourth ozone season at the Black Hawk Site (see Figure 7-13). In
the first year of testing (2008), the site recorded the second highest ozone level in the state. In
2009 to 2011, the ozone levels are slightly less than the 2008 ozone level but appear to have
flattened out.
Figure 7-13 – Black Hawk Site Ozone Yearly 4th Highest 8-hour Averages
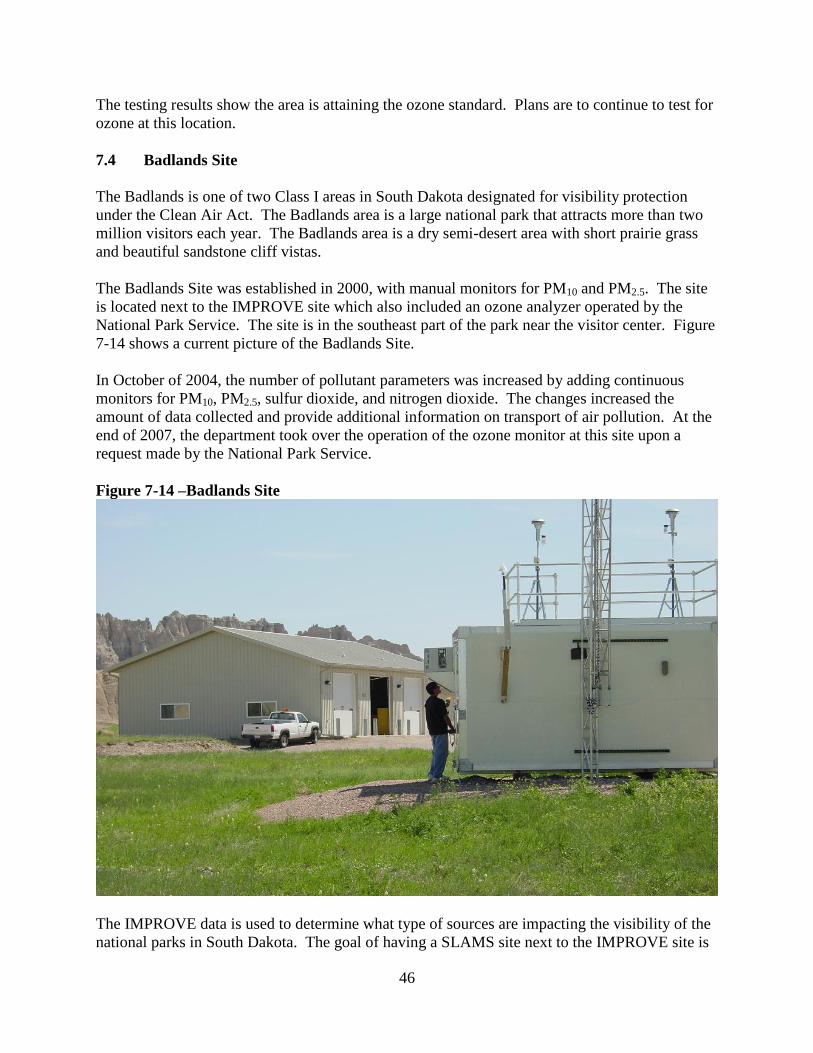
46
The testing results show the area is attaining the ozone standard. Plans are to continue to test for
ozone at this location.
7.4 Badlands Site
The Badlands is one of two Class I areas in South Dakota designated for visibility protection
under the Clean Air Act. The Badlands area is a large national park that attracts more than two
million visitors each year. The Badlands area is a dry semi-desert area with short prairie grass
and beautiful sandstone cliff vistas.
The Badlands Site was established in 2000, with manual monitors for PM10 and PM2.5. The site
is located next to the IMPROVE site which also included an ozone analyzer operated by the
National Park Service. The site is in the southeast part of the park near the visitor center. Figure
7-14 shows a current picture of the Badlands Site.
In October of 2004, the number of pollutant parameters was increased by adding continuous
monitors for PM10, PM2.5, sulfur dioxide, and nitrogen dioxide. The changes increased the
amount of data collected and provide additional information on transport of air pollution. At the
end of 2007, the department took over the operation of the ozone monitor at this site upon a
request made by the National Park Service.
Figure 7-14 –Badlands Site
The IMPROVE data is used to determine what type of sources are impacting the visibility of the
national parks in South Dakota. The goal of having a SLAMS site next to the IMPROVE site is
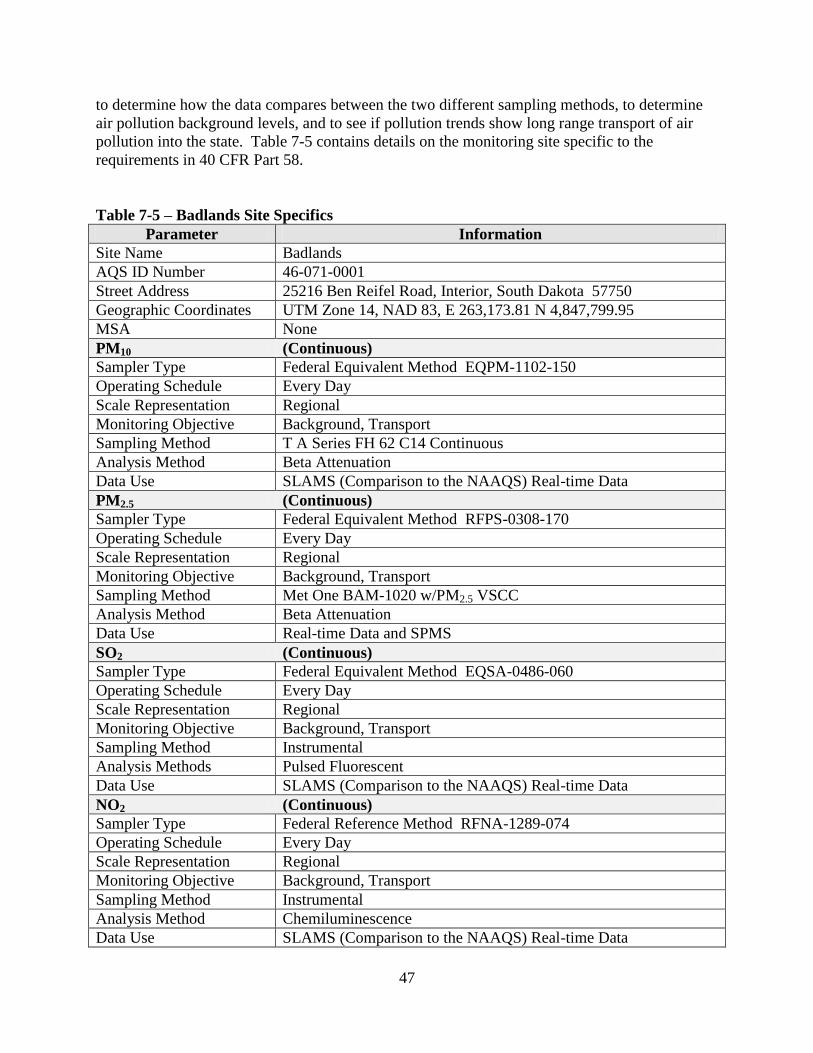
47
to determine how the data compares between the two different sampling methods, to determine
air pollution background levels, and to see if pollution trends show long range transport of air
pollution into the state. Table 7-5 contains details on the monitoring site specific to the
requirements in 40 CFR Part 58.
Table 7-5 – Badlands Site Specifics
Parameter Information
Site Name Badlands
AQS ID Number 46-071-0001
Street Address 25216 Ben Reifel Road, Interior, South Dakota 57750
Geographic Coordinates UTM Zone 14, NAD 83, E 263,173.81 N 4,847,799.95
MSA None
PM10 (Continuous)
Sampler Type Federal Equivalent Method EQPM-1102-150
Operating Schedule Every Day
Scale Representation Regional
Monitoring Objective Background, Transport
Sampling Method T A Series FH 62 C14 Continuous
Analysis Method Beta Attenuation
Data Use SLAMS (Comparison to the NAAQS) Real-time Data
PM2.5 (Continuous)
Sampler Type Federal Equivalent Method RFPS-0308-170
Operating Schedule Every Day
Scale Representation Regional
Monitoring Objective Background, Transport
Sampling Method Met One BAM-1020 w/PM2.5 VSCC
Analysis Method Beta Attenuation
Data Use Real-time Data and SPMS
SO2 (Continuous)
Sampler Type Federal Equivalent Method EQSA-0486-060
Operating Schedule Every Day
Scale Representation Regional
Monitoring Objective Background, Transport
Sampling Method Instrumental
Analysis Methods Pulsed Fluorescent
Data Use SLAMS (Comparison to the NAAQS) Real-time Data
NO2 (Continuous)
Sampler Type Federal Reference Method RFNA-1289-074
Operating Schedule Every Day
Scale Representation Regional
Monitoring Objective Background, Transport
Sampling Method Instrumental
Analysis Method Chemiluminescence
Data Use SLAMS (Comparison to the NAAQS) Real-time Data
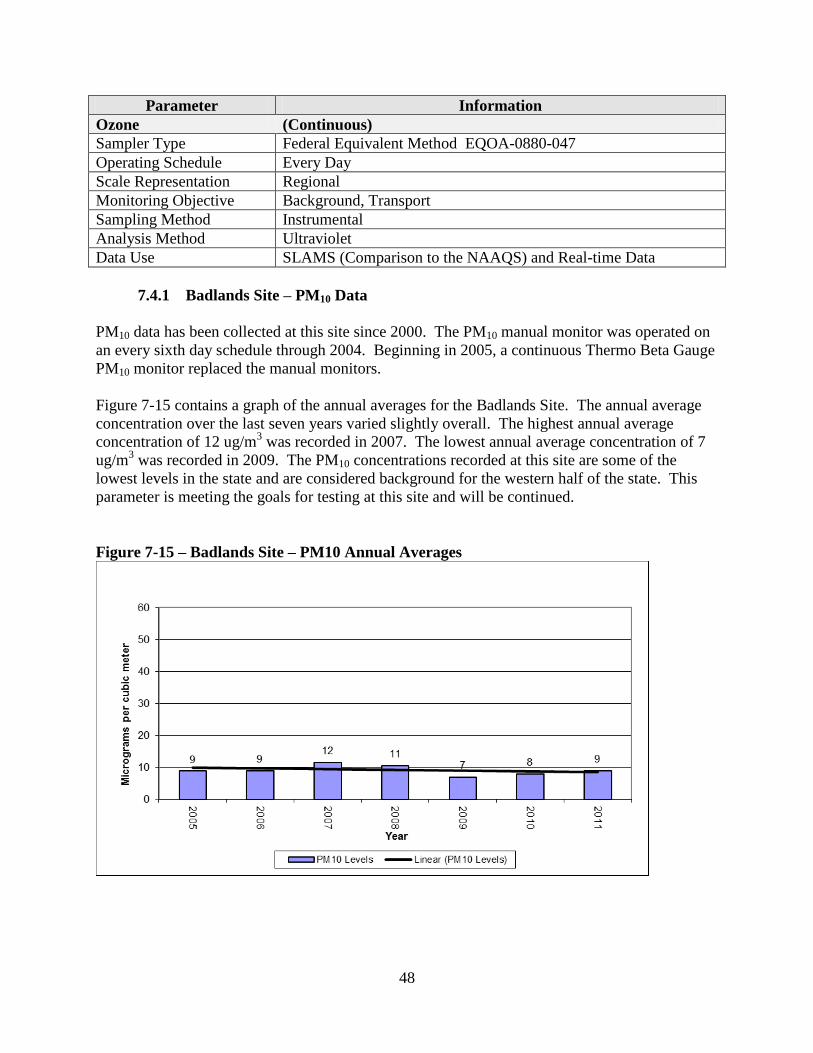
48
Parameter Information
Ozone (Continuous)
Sampler Type Federal Equivalent Method EQOA-0880-047
Operating Schedule Every Day
Scale Representation Regional
Monitoring Objective Background, Transport
Sampling Method Instrumental
Analysis Method Ultraviolet
Data Use SLAMS (Comparison to the NAAQS) and Real-time Data
7.4.1 Badlands Site – PM10 Data
PM10 data has been collected at this site since 2000. The PM10 manual monitor was operated on
an every sixth day schedule through 2004. Beginning in 2005, a continuous Thermo Beta Gauge
PM10 monitor replaced the manual monitors.
Figure 7-15 contains a graph of the annual averages for the Badlands Site. The annual average
concentration over the last seven years varied slightly overall. The highest annual average
concentration of 12 ug/m3 was recorded in 2007. The lowest annual average concentration of 7
ug/m3 was recorded in 2009. The PM10 concentrations recorded at this site are some of the
lowest levels in the state and are considered background for the western half of the state. This
parameter is meeting the goals for testing at this site and will be continued.
Figure 7-15 – Badlands Site – PM10 Annual Averages
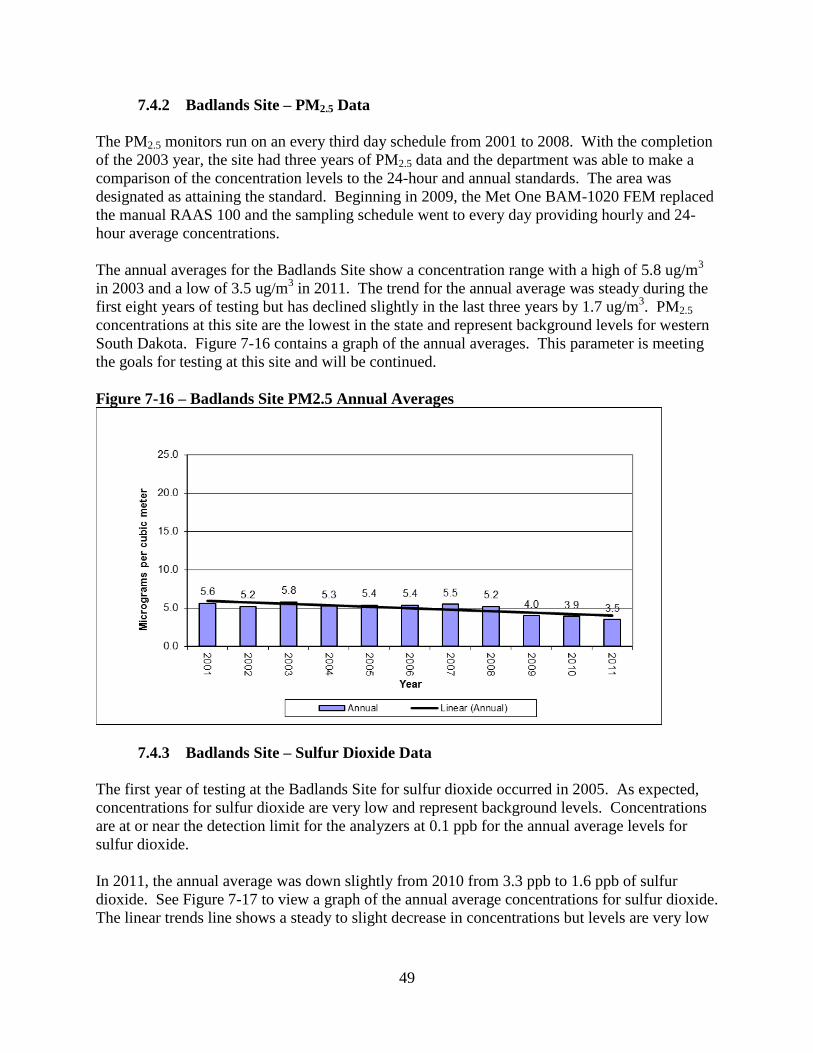
49
7.4.2 Badlands Site – PM2.5 Data
The PM2.5 monitors run on an every third day schedule from 2001 to 2008. With the completion
of the 2003 year, the site had three years of PM2.5 data and the department was able to make a
comparison of the concentration levels to the 24-hour and annual standards. The area was
designated as attaining the standard. Beginning in 2009, the Met One BAM-1020 FEM replaced
the manual RAAS 100 and the sampling schedule went to every day providing hourly and 24-
hour average concentrations.
The annual averages for the Badlands Site show a concentration range with a high of 5.8 ug/m3
in 2003 and a low of 3.5 ug/m3 in 2011. The trend for the annual average was steady during the
first eight years of testing but has declined slightly in the last three years by 1.7 ug/m3. PM2.5
concentrations at this site are the lowest in the state and represent background levels for western
South Dakota. Figure 7-16 contains a graph of the annual averages. This parameter is meeting
the goals for testing at this site and will be continued.
Figure 7-16 – Badlands Site PM2.5 Annual Averages
7.4.3 Badlands Site – Sulfur Dioxide Data
The first year of testing at the Badlands Site for sulfur dioxide occurred in 2005. As expected,
concentrations for sulfur dioxide are very low and represent background levels. Concentrations
are at or near the detection limit for the analyzers at 0.1 ppb for the annual average levels for
sulfur dioxide.
In 2011, the annual average was down slightly from 2010 from 3.3 ppb to 1.6 ppb of sulfur
dioxide. See Figure 7-17 to view a graph of the annual average concentrations for sulfur dioxide.
The linear trends line shows a steady to slight decrease in concentrations but levels are very low
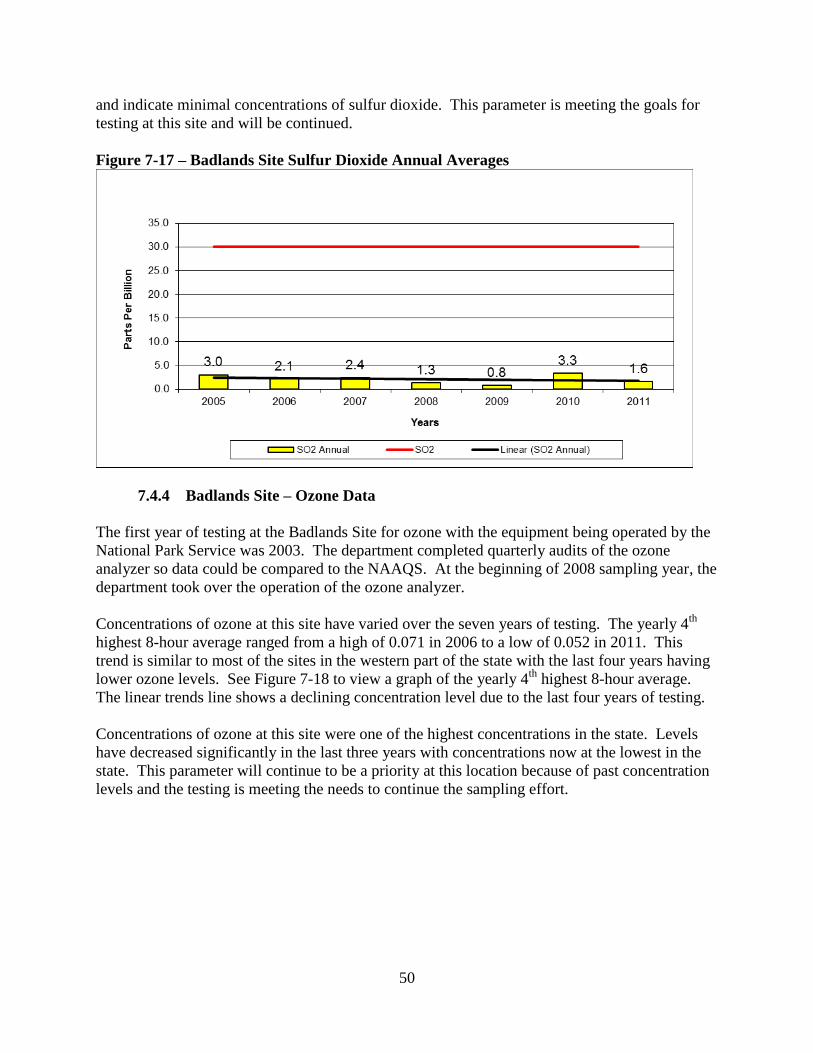
50
and indicate minimal concentrations of sulfur dioxide. This parameter is meeting the goals for
testing at this site and will be continued.
Figure 7-17 – Badlands Site Sulfur Dioxide Annual Averages
7.4.4 Badlands Site – Ozone Data
The first year of testing at the Badlands Site for ozone with the equipment being operated by the
National Park Service was 2003. The department completed quarterly audits of the ozone
analyzer so data could be compared to the NAAQS. At the beginning of 2008 sampling year, the
department took over the operation of the ozone analyzer.
Concentrations of ozone at this site have varied over the seven years of testing. The yearly 4th
highest 8-hour average ranged from a high of 0.071 in 2006 to a low of 0.052 in 2011. This
trend is similar to most of the sites in the western part of the state with the last four years having
lower ozone levels. See Figure 7-18 to view a graph of the yearly 4th
highest 8-hour average.
The linear trends line shows a declining concentration level due to the last four years of testing.
Concentrations of ozone at this site were one of the highest concentrations in the state. Levels
have decreased significantly in the last three years with concentrations now at the lowest in the
state. This parameter will continue to be a priority at this location because of past concentration
levels and the testing is meeting the needs to continue the sampling effort.
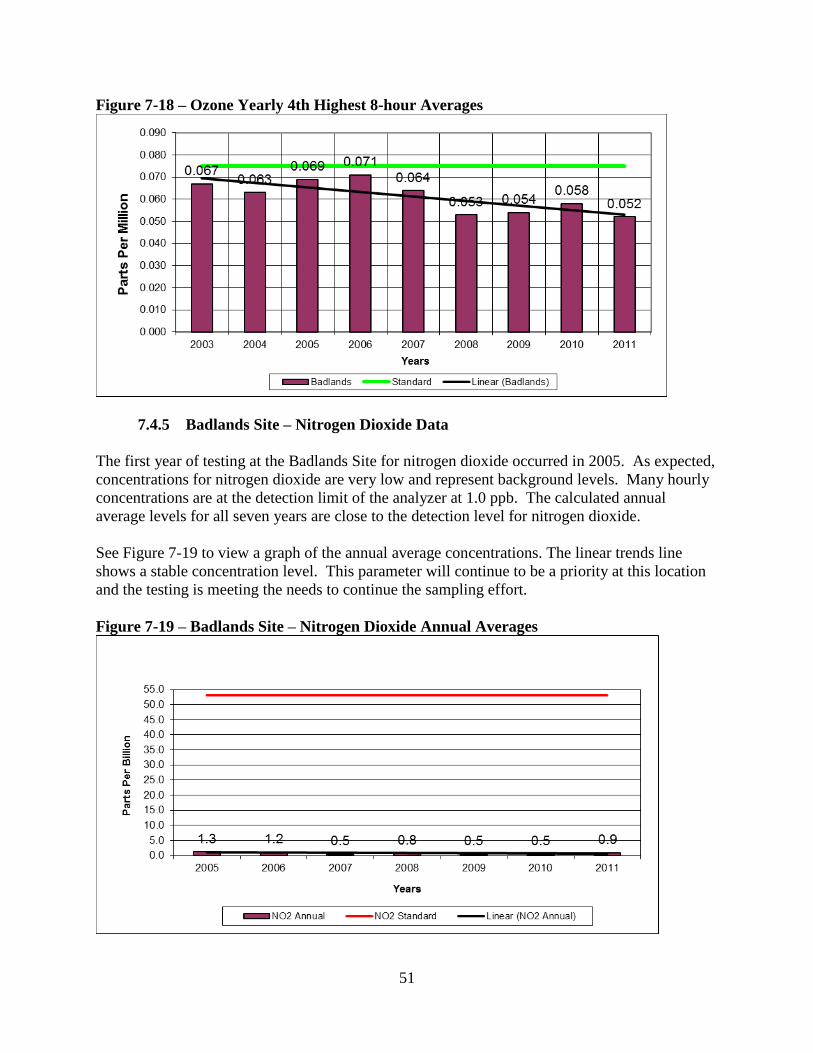
51
Figure 7-18 – Ozone Yearly 4th Highest 8-hour Averages
7.4.5 Badlands Site – Nitrogen Dioxide Data
The first year of testing at the Badlands Site for nitrogen dioxide occurred in 2005. As expected,
concentrations for nitrogen dioxide are very low and represent background levels. Many hourly
concentrations are at the detection limit of the analyzer at 1.0 ppb. The calculated annual
average levels for all seven years are close to the detection level for nitrogen dioxide.
See Figure 7-19 to view a graph of the annual average concentrations. The linear trends line
shows a stable concentration level. This parameter will continue to be a priority at this location
and the testing is meeting the needs to continue the sampling effort.
Figure 7-19 – Badlands Site – Nitrogen Dioxide Annual Averages
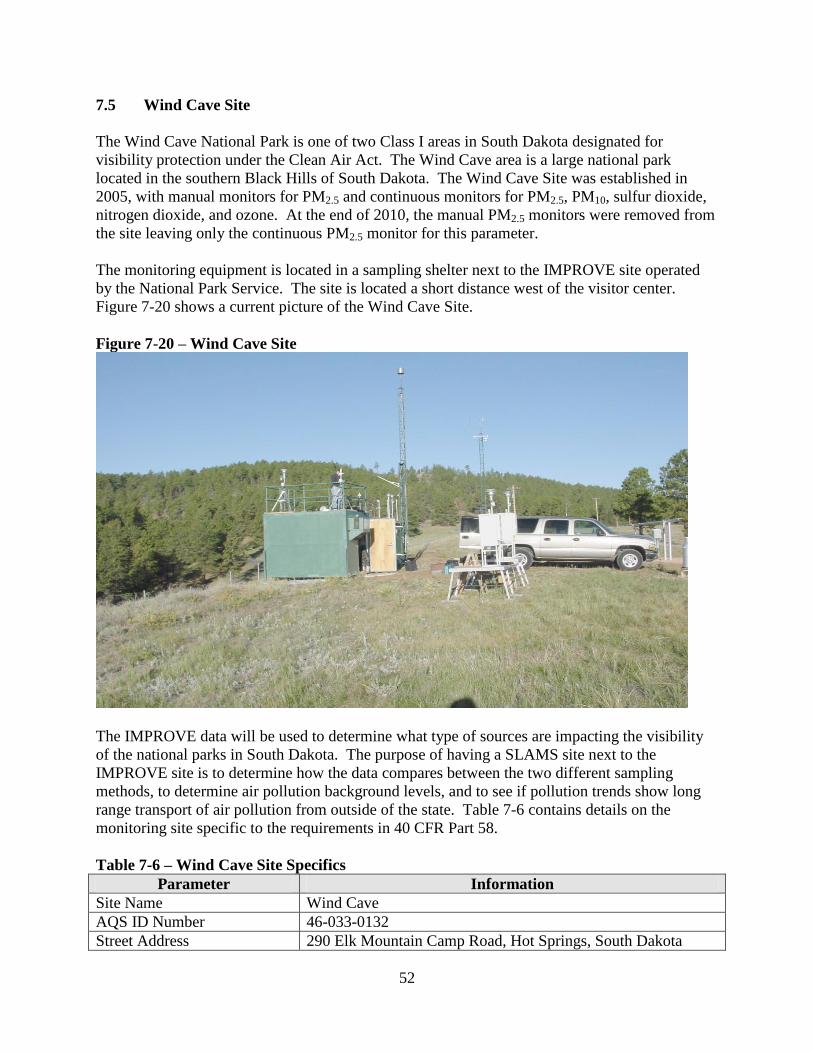
52
7.5 Wind Cave Site
The Wind Cave National Park is one of two Class I areas in South Dakota designated for
visibility protection under the Clean Air Act. The Wind Cave area is a large national park
located in the southern Black Hills of South Dakota. The Wind Cave Site was established in
2005, with manual monitors for PM2.5 and continuous monitors for PM2.5, PM10, sulfur dioxide,
nitrogen dioxide, and ozone. At the end of 2010, the manual PM2.5 monitors were removed from
the site leaving only the continuous PM2.5 monitor for this parameter.
The monitoring equipment is located in a sampling shelter next to the IMPROVE site operated
by the National Park Service. The site is located a short distance west of the visitor center.
Figure 7-20 shows a current picture of the Wind Cave Site.
Figure 7-20 – Wind Cave Site
The IMPROVE data will be used to determine what type of sources are impacting the visibility
of the national parks in South Dakota. The purpose of having a SLAMS site next to the
IMPROVE site is to determine how the data compares between the two different sampling
methods, to determine air pollution background levels, and to see if pollution trends show long
range transport of air pollution from outside of the state. Table 7-6 contains details on the
monitoring site specific to the requirements in 40 CFR Part 58.
Table 7-6 – Wind Cave Site Specifics
Parameter Information
Site Name Wind Cave
AQS ID Number 46-033-0132
Street Address 290 Elk Mountain Camp Road, Hot Springs, South Dakota
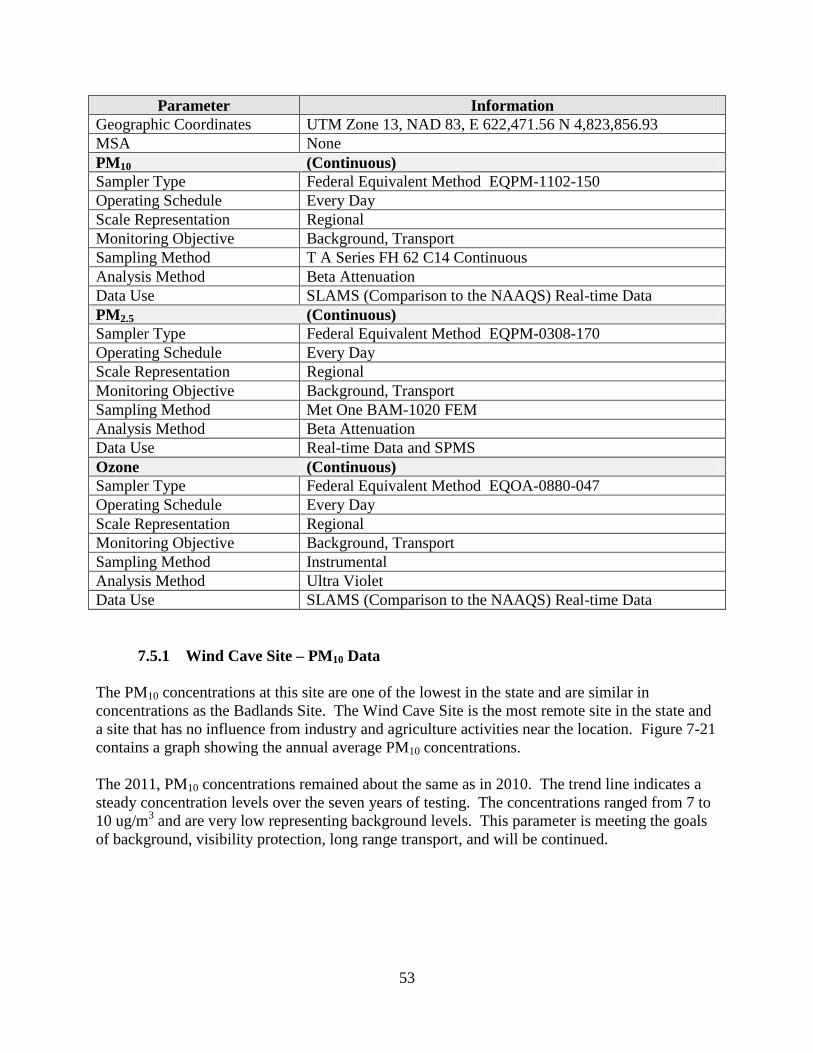
53
Parameter Information
Geographic Coordinates UTM Zone 13, NAD 83, E 622,471.56 N 4,823,856.93
MSA None
PM10 (Continuous)
Sampler Type Federal Equivalent Method EQPM-1102-150
Operating Schedule Every Day
Scale Representation Regional
Monitoring Objective Background, Transport
Sampling Method T A Series FH 62 C14 Continuous
Analysis Method Beta Attenuation
Data Use SLAMS (Comparison to the NAAQS) Real-time Data
PM2.5 (Continuous)
Sampler Type Federal Equivalent Method EQPM-0308-170
Operating Schedule Every Day
Scale Representation Regional
Monitoring Objective Background, Transport
Sampling Method Met One BAM-1020 FEM
Analysis Method Beta Attenuation
Data Use Real-time Data and SPMS
Ozone (Continuous)
Sampler Type Federal Equivalent Method EQOA-0880-047
Operating Schedule Every Day
Scale Representation Regional
Monitoring Objective Background, Transport
Sampling Method Instrumental
Analysis Method Ultra Violet
Data Use SLAMS (Comparison to the NAAQS) Real-time Data
7.5.1 Wind Cave Site – PM10 Data
The PM10 concentrations at this site are one of the lowest in the state and are similar in
concentrations as the Badlands Site. The Wind Cave Site is the most remote site in the state and
a site that has no influence from industry and agriculture activities near the location. Figure 7-21
contains a graph showing the annual average PM10 concentrations.
The 2011, PM10 concentrations remained about the same as in 2010. The trend line indicates a
steady concentration levels over the seven years of testing. The concentrations ranged from 7 to
10 ug/m3 and are very low representing background levels. This parameter is meeting the goals
of background, visibility protection, long range transport, and will be continued.
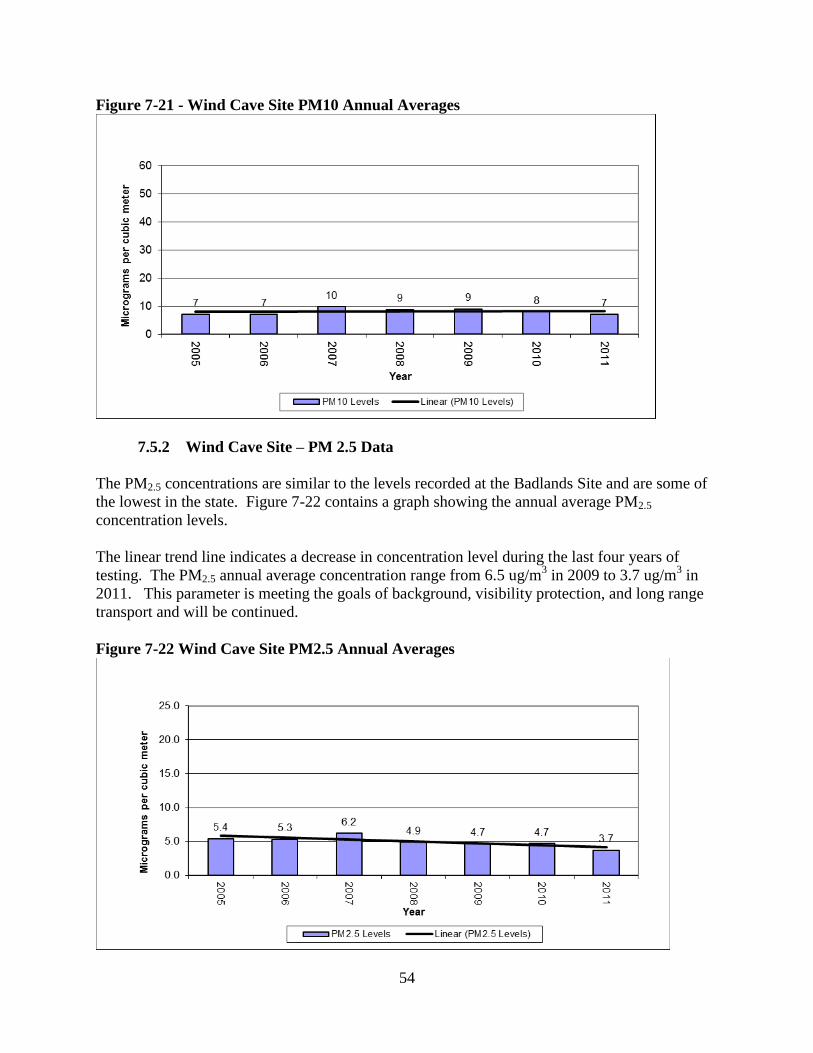
54
Figure 7-21 - Wind Cave Site PM10 Annual Averages
7.5.2 Wind Cave Site – PM 2.5 Data
The PM2.5 concentrations are similar to the levels recorded at the Badlands Site and are some of
the lowest in the state. Figure 7-22 contains a graph showing the annual average PM2.5
concentration levels.
The linear trend line indicates a decrease in concentration level during the last four years of
testing. The PM2.5 annual average concentration range from 6.5 ug/m3 in 2009 to 3.7 ug/m
3 in
2011. This parameter is meeting the goals of background, visibility protection, and long range
transport and will be continued.
Figure 7-22 Wind Cave Site PM2.5 Annual Averages
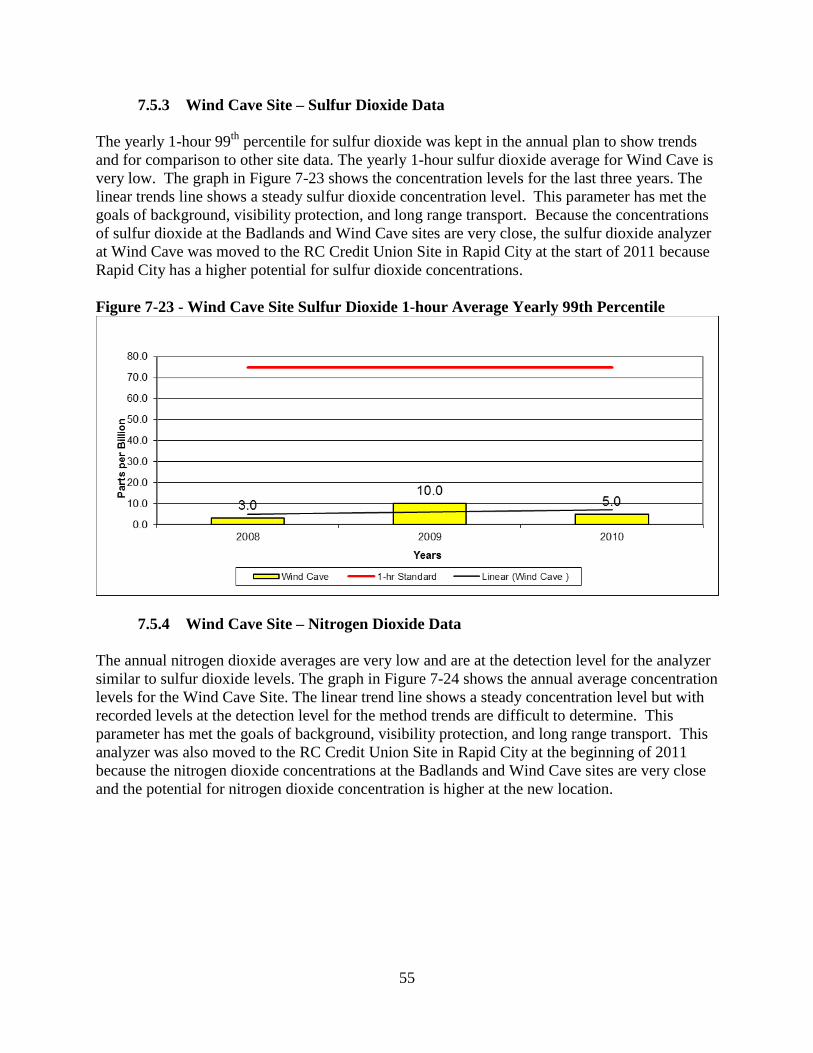
55
7.5.3 Wind Cave Site – Sulfur Dioxide Data
The yearly 1-hour 99th
percentile for sulfur dioxide was kept in the annual plan to show trends
and for comparison to other site data. The yearly 1-hour sulfur dioxide average for Wind Cave is
very low. The graph in Figure 7-23 shows the concentration levels for the last three years. The
linear trends line shows a steady sulfur dioxide concentration level. This parameter has met the
goals of background, visibility protection, and long range transport. Because the concentrations
of sulfur dioxide at the Badlands and Wind Cave sites are very close, the sulfur dioxide analyzer
at Wind Cave was moved to the RC Credit Union Site in Rapid City at the start of 2011 because
Rapid City has a higher potential for sulfur dioxide concentrations.
Figure 7-23 - Wind Cave Site Sulfur Dioxide 1-hour Average Yearly 99th Percentile
7.5.4 Wind Cave Site – Nitrogen Dioxide Data
The annual nitrogen dioxide averages are very low and are at the detection level for the analyzer
similar to sulfur dioxide levels. The graph in Figure 7-24 shows the annual average concentration
levels for the Wind Cave Site. The linear trend line shows a steady concentration level but with
recorded levels at the detection level for the method trends are difficult to determine. This
parameter has met the goals of background, visibility protection, and long range transport. This
analyzer was also moved to the RC Credit Union Site in Rapid City at the beginning of 2011
because the nitrogen dioxide concentrations at the Badlands and Wind Cave sites are very close
and the potential for nitrogen dioxide concentration is higher at the new location.
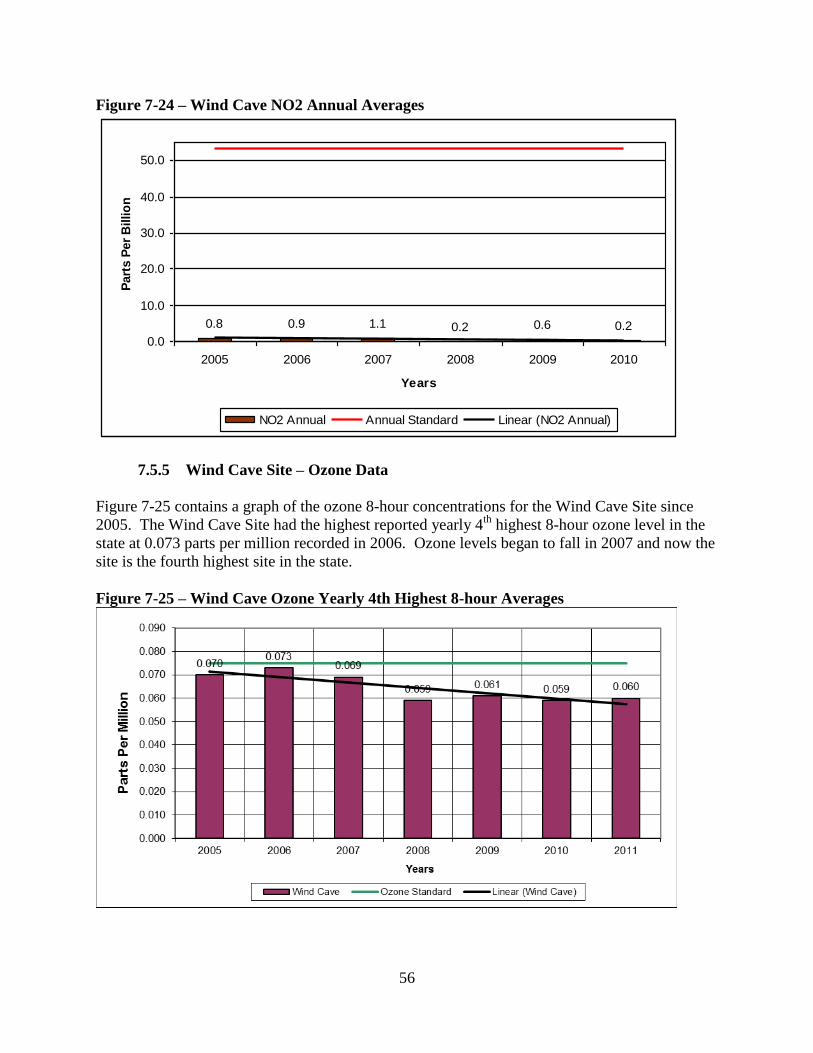
56
Figure 7-24 – Wind Cave NO2 Annual Averages
0.8 0.9 1.1 0.2 0.6 0.2
0.0
10.0
20.0
30.0
40.0
50.0
2005 2006 2007 2008 2009 2010
Years
Part
s P
er
Billio
n
NO2 Annual Annual Standard Linear (NO2 Annual)
7.5.5 Wind Cave Site – Ozone Data
Figure 7-25 contains a graph of the ozone 8-hour concentrations for the Wind Cave Site since
2005. The Wind Cave Site had the highest reported yearly 4th
highest 8-hour ozone level in the
state at 0.073 parts per million recorded in 2006. Ozone levels began to fall in 2007 and now the
site is the fourth highest site in the state.
Figure 7-25 – Wind Cave Ozone Yearly 4th Highest 8-hour Averages
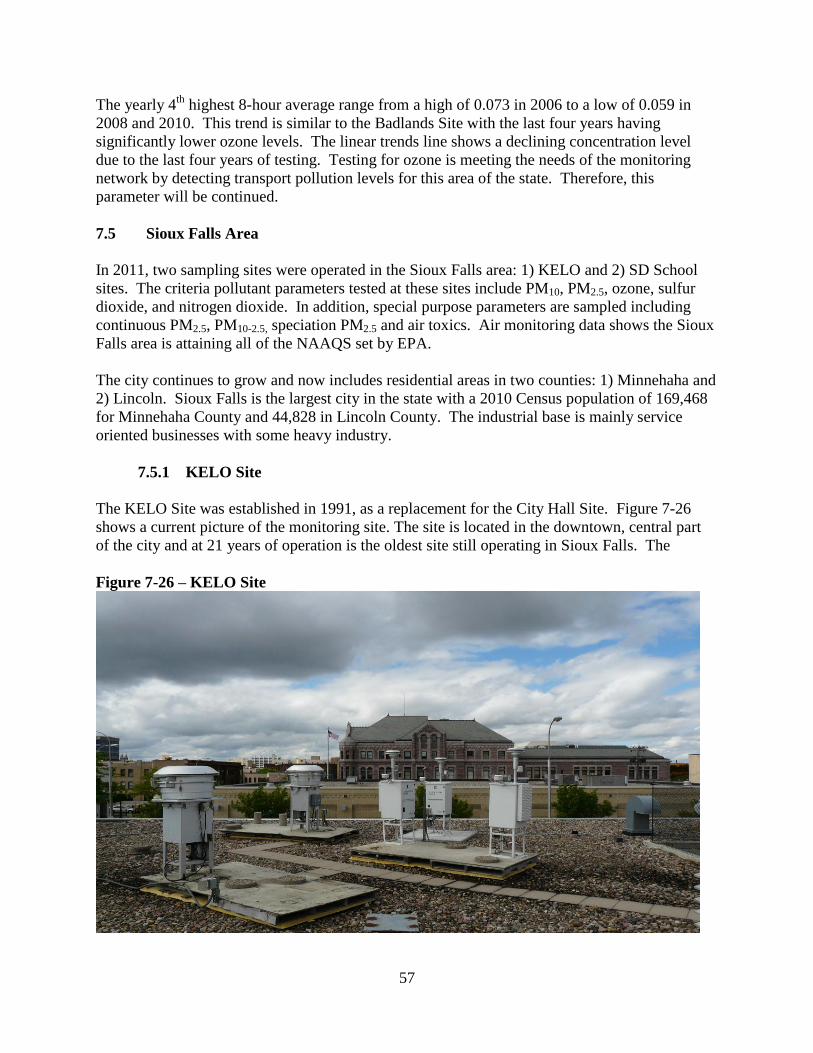
57
The yearly 4th
highest 8-hour average range from a high of 0.073 in 2006 to a low of 0.059 in
2008 and 2010. This trend is similar to the Badlands Site with the last four years having
significantly lower ozone levels. The linear trends line shows a declining concentration level
due to the last four years of testing. Testing for ozone is meeting the needs of the monitoring
network by detecting transport pollution levels for this area of the state. Therefore, this
parameter will be continued.
7.5 Sioux Falls Area
In 2011, two sampling sites were operated in the Sioux Falls area: 1) KELO and 2) SD School
sites. The criteria pollutant parameters tested at these sites include PM10, PM2.5, ozone, sulfur
dioxide, and nitrogen dioxide. In addition, special purpose parameters are sampled including
continuous PM2.5, PM10-2.5, speciation PM2.5 and air toxics. Air monitoring data shows the Sioux
Falls area is attaining all of the NAAQS set by EPA.
The city continues to grow and now includes residential areas in two counties: 1) Minnehaha and
2) Lincoln. Sioux Falls is the largest city in the state with a 2010 Census population of 169,468
for Minnehaha County and 44,828 in Lincoln County. The industrial base is mainly service
oriented businesses with some heavy industry.
7.5.1 KELO Site
The KELO Site was established in 1991, as a replacement for the City Hall Site. Figure 7-26
shows a current picture of the monitoring site. The site is located in the downtown, central part
of the city and at 21 years of operation is the oldest site still operating in Sioux Falls. The
Figure 7-26 – KELO Site
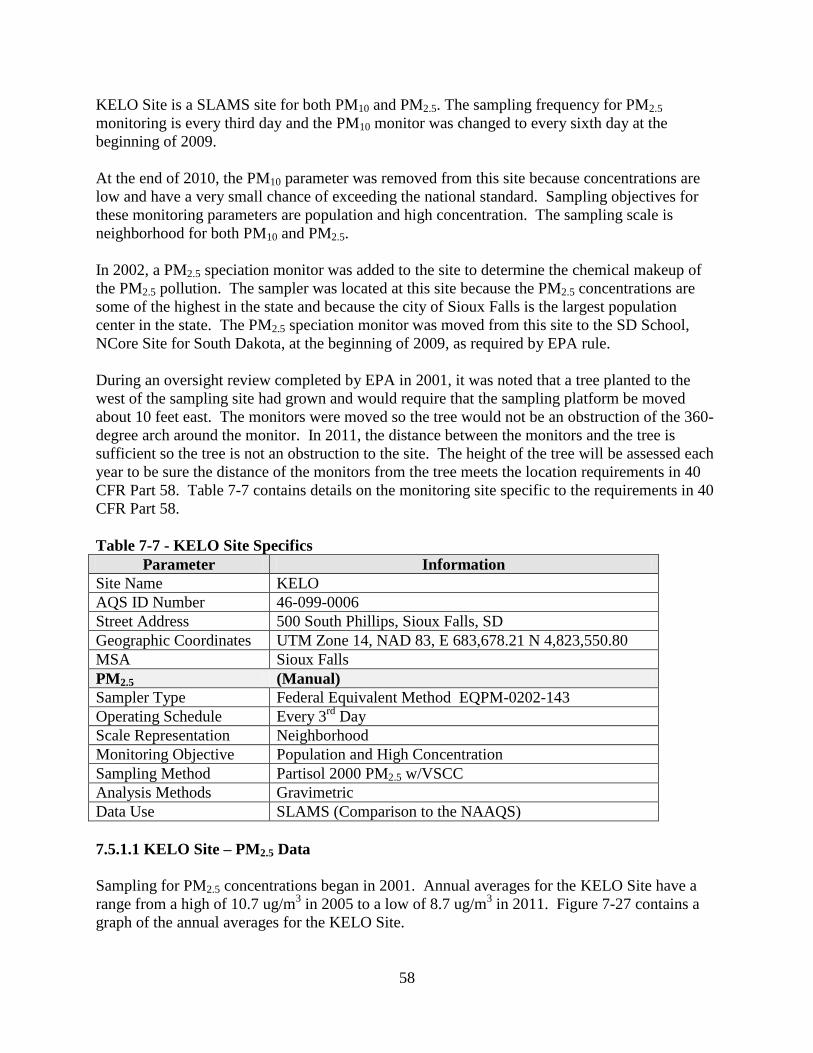
58
KELO Site is a SLAMS site for both PM10 and PM2.5. The sampling frequency for PM2.5
monitoring is every third day and the PM10 monitor was changed to every sixth day at the
beginning of 2009.
At the end of 2010, the PM10 parameter was removed from this site because concentrations are
low and have a very small chance of exceeding the national standard. Sampling objectives for
these monitoring parameters are population and high concentration. The sampling scale is
neighborhood for both PM10 and PM2.5.
In 2002, a PM2.5 speciation monitor was added to the site to determine the chemical makeup of
the PM2.5 pollution. The sampler was located at this site because the PM2.5 concentrations are
some of the highest in the state and because the city of Sioux Falls is the largest population
center in the state. The PM2.5 speciation monitor was moved from this site to the SD School,
NCore Site for South Dakota, at the beginning of 2009, as required by EPA rule.
During an oversight review completed by EPA in 2001, it was noted that a tree planted to the
west of the sampling site had grown and would require that the sampling platform be moved
about 10 feet east. The monitors were moved so the tree would not be an obstruction of the 360-
degree arch around the monitor. In 2011, the distance between the monitors and the tree is
sufficient so the tree is not an obstruction to the site. The height of the tree will be assessed each
year to be sure the distance of the monitors from the tree meets the location requirements in 40
CFR Part 58. Table 7-7 contains details on the monitoring site specific to the requirements in 40
CFR Part 58.
Table 7-7 - KELO Site Specifics
Parameter Information
Site Name KELO
AQS ID Number 46-099-0006
Street Address 500 South Phillips, Sioux Falls, SD
Geographic Coordinates UTM Zone 14, NAD 83, E 683,678.21 N 4,823,550.80
MSA Sioux Falls
PM2.5 (Manual)
Sampler Type Federal Equivalent Method EQPM-0202-143
Operating Schedule Every 3rd
Day
Scale Representation Neighborhood
Monitoring Objective Population and High Concentration
Sampling Method Partisol 2000 PM2.5 w/VSCC
Analysis Methods Gravimetric
Data Use SLAMS (Comparison to the NAAQS)
7.5.1.1 KELO Site – PM2.5 Data
Sampling for PM2.5 concentrations began in 2001. Annual averages for the KELO Site have a
range from a high of 10.7 ug/m3 in 2005 to a low of 8.7 ug/m
3 in 2011. Figure 7-27 contains a
graph of the annual averages for the KELO Site.
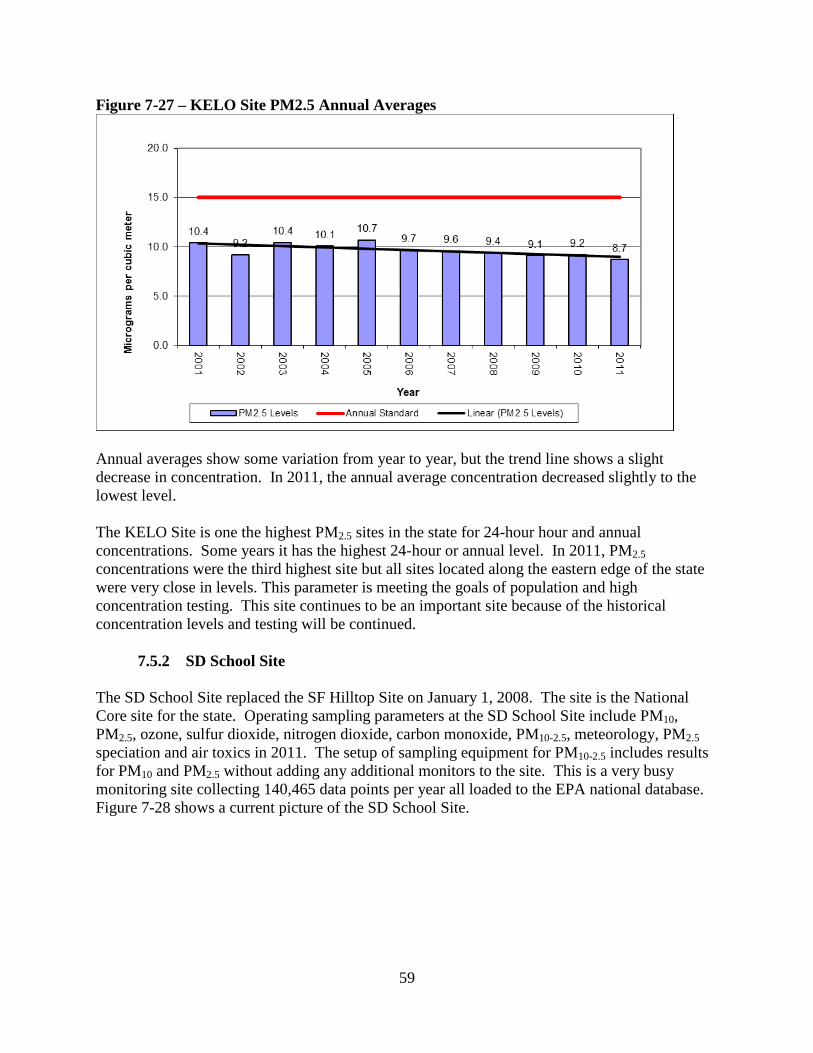
59
Figure 7-27 – KELO Site PM2.5 Annual Averages
Annual averages show some variation from year to year, but the trend line shows a slight
decrease in concentration. In 2011, the annual average concentration decreased slightly to the
lowest level.
The KELO Site is one the highest PM2.5 sites in the state for 24-hour hour and annual
concentrations. Some years it has the highest 24-hour or annual level. In 2011, PM2.5
concentrations were the third highest site but all sites located along the eastern edge of the state
were very close in levels. This parameter is meeting the goals of population and high
concentration testing. This site continues to be an important site because of the historical
concentration levels and testing will be continued.
7.5.2 SD School Site
The SD School Site replaced the SF Hilltop Site on January 1, 2008. The site is the National
Core site for the state. Operating sampling parameters at the SD School Site include PM10,
PM2.5, ozone, sulfur dioxide, nitrogen dioxide, carbon monoxide, PM10-2.5, meteorology, PM2.5
speciation and air toxics in 2011. The setup of sampling equipment for PM10-2.5 includes results
for PM10 and PM2.5 without adding any additional monitors to the site. This is a very busy
monitoring site collecting 140,465 data points per year all loaded to the EPA national database.
Figure 7-28 shows a current picture of the SD School Site.
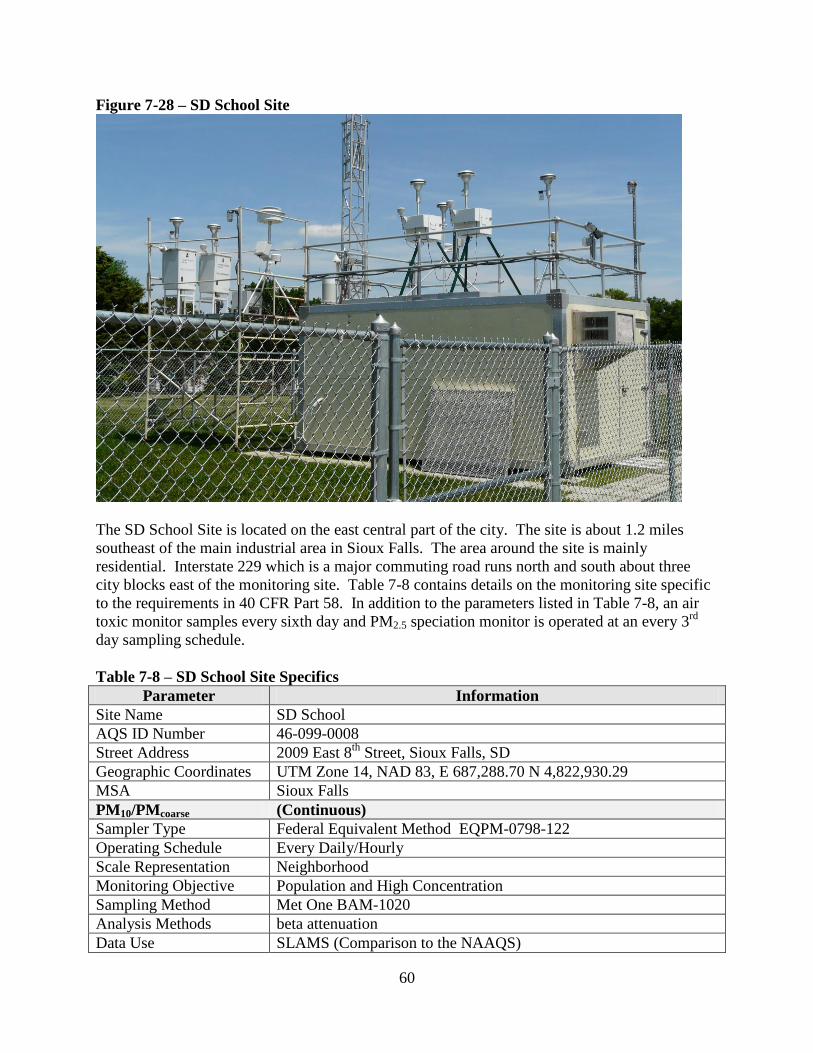
60
Figure 7-28 – SD School Site
The SD School Site is located on the east central part of the city. The site is about 1.2 miles
southeast of the main industrial area in Sioux Falls. The area around the site is mainly
residential. Interstate 229 which is a major commuting road runs north and south about three
city blocks east of the monitoring site. Table 7-8 contains details on the monitoring site specific
to the requirements in 40 CFR Part 58. In addition to the parameters listed in Table 7-8, an air
toxic monitor samples every sixth day and PM2.5 speciation monitor is operated at an every 3rd
day sampling schedule.
Table 7-8 – SD School Site Specifics
Parameter Information
Site Name SD School
AQS ID Number 46-099-0008
Street Address 2009 East 8th
Street, Sioux Falls, SD
Geographic Coordinates UTM Zone 14, NAD 83, E 687,288.70 N 4,822,930.29
MSA Sioux Falls
PM10/PMcoarse (Continuous)
Sampler Type Federal Equivalent Method EQPM-0798-122
Operating Schedule Every Daily/Hourly
Scale Representation Neighborhood
Monitoring Objective Population and High Concentration
Sampling Method Met One BAM-1020
Analysis Methods beta attenuation
Data Use SLAMS (Comparison to the NAAQS)
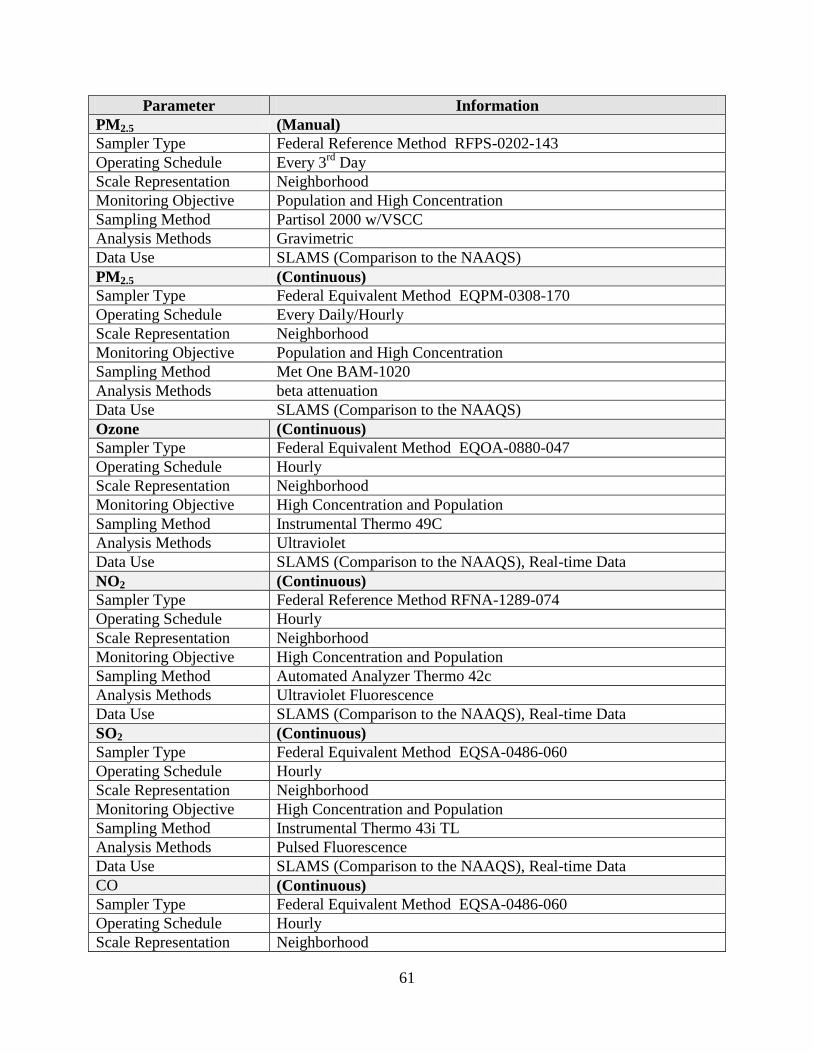
61
Parameter Information
PM2.5 (Manual)
Sampler Type Federal Reference Method RFPS-0202-143
Operating Schedule Every 3rd
Day
Scale Representation Neighborhood
Monitoring Objective Population and High Concentration
Sampling Method Partisol 2000 w/VSCC
Analysis Methods Gravimetric
Data Use SLAMS (Comparison to the NAAQS)
PM2.5 (Continuous)
Sampler Type Federal Equivalent Method EQPM-0308-170
Operating Schedule Every Daily/Hourly
Scale Representation Neighborhood
Monitoring Objective Population and High Concentration
Sampling Method Met One BAM-1020
Analysis Methods beta attenuation
Data Use SLAMS (Comparison to the NAAQS)
Ozone (Continuous)
Sampler Type Federal Equivalent Method EQOA-0880-047
Operating Schedule Hourly
Scale Representation Neighborhood
Monitoring Objective High Concentration and Population
Sampling Method Instrumental Thermo 49C
Analysis Methods Ultraviolet
Data Use SLAMS (Comparison to the NAAQS), Real-time Data
NO2 (Continuous)
Sampler Type Federal Reference Method RFNA-1289-074
Operating Schedule Hourly
Scale Representation Neighborhood
Monitoring Objective High Concentration and Population
Sampling Method Automated Analyzer Thermo 42c
Analysis Methods Ultraviolet Fluorescence
Data Use SLAMS (Comparison to the NAAQS), Real-time Data
SO2 (Continuous)
Sampler Type Federal Equivalent Method EQSA-0486-060
Operating Schedule Hourly
Scale Representation Neighborhood
Monitoring Objective High Concentration and Population
Sampling Method Instrumental Thermo 43i TL
Analysis Methods Pulsed Fluorescence
Data Use SLAMS (Comparison to the NAAQS), Real-time Data
CO (Continuous)
Sampler Type Federal Equivalent Method EQSA-0486-060
Operating Schedule Hourly
Scale Representation Neighborhood
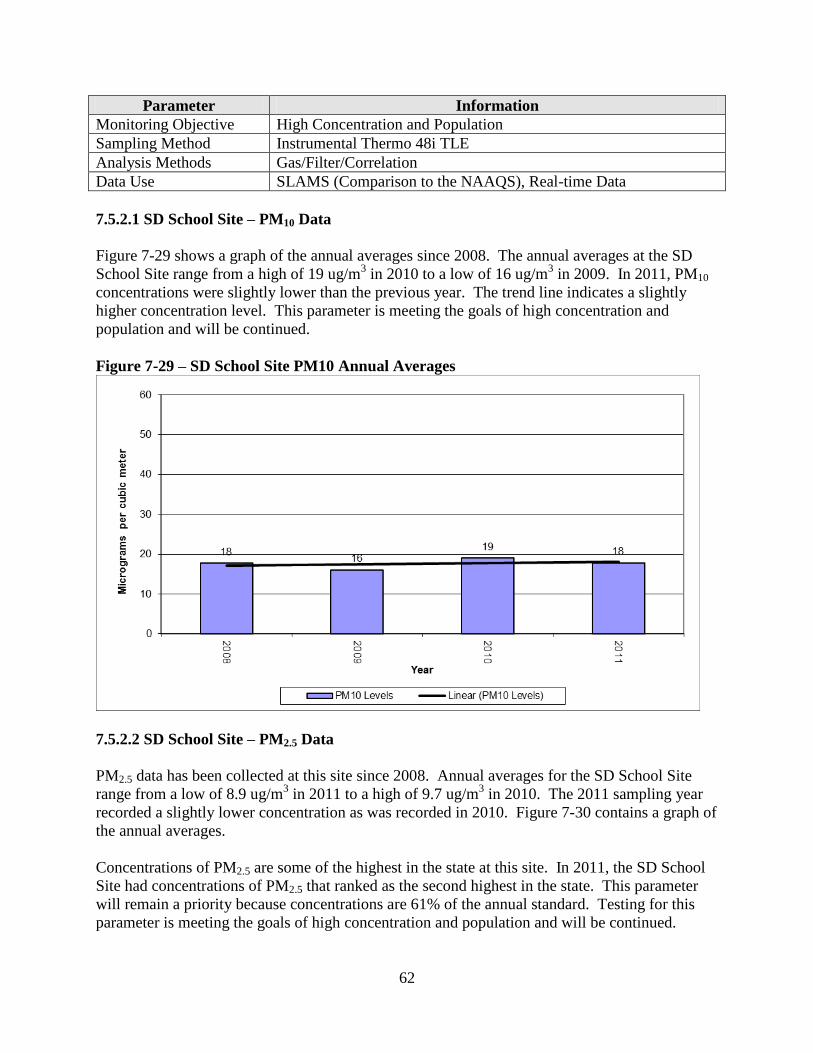
62
Parameter Information
Monitoring Objective High Concentration and Population
Sampling Method Instrumental Thermo 48i TLE
Analysis Methods Gas/Filter/Correlation
Data Use SLAMS (Comparison to the NAAQS), Real-time Data
7.5.2.1 SD School Site – PM10 Data
Figure 7-29 shows a graph of the annual averages since 2008. The annual averages at the SD
School Site range from a high of 19 ug/m3 in 2010 to a low of 16 ug/m
3 in 2009. In 2011, PM10
concentrations were slightly lower than the previous year. The trend line indicates a slightly
higher concentration level. This parameter is meeting the goals of high concentration and
population and will be continued.
Figure 7-29 – SD School Site PM10 Annual Averages
7.5.2.2 SD School Site – PM2.5 Data
PM2.5 data has been collected at this site since 2008. Annual averages for the SD School Site
range from a low of 8.9 ug/m3 in 2011 to a high of 9.7 ug/m
3 in 2010. The 2011 sampling year
recorded a slightly lower concentration as was recorded in 2010. Figure 7-30 contains a graph of
the annual averages.
Concentrations of PM2.5 are some of the highest in the state at this site. In 2011, the SD School
Site had concentrations of PM2.5 that ranked as the second highest in the state. This parameter
will remain a priority because concentrations are 61% of the annual standard. Testing for this
parameter is meeting the goals of high concentration and population and will be continued.
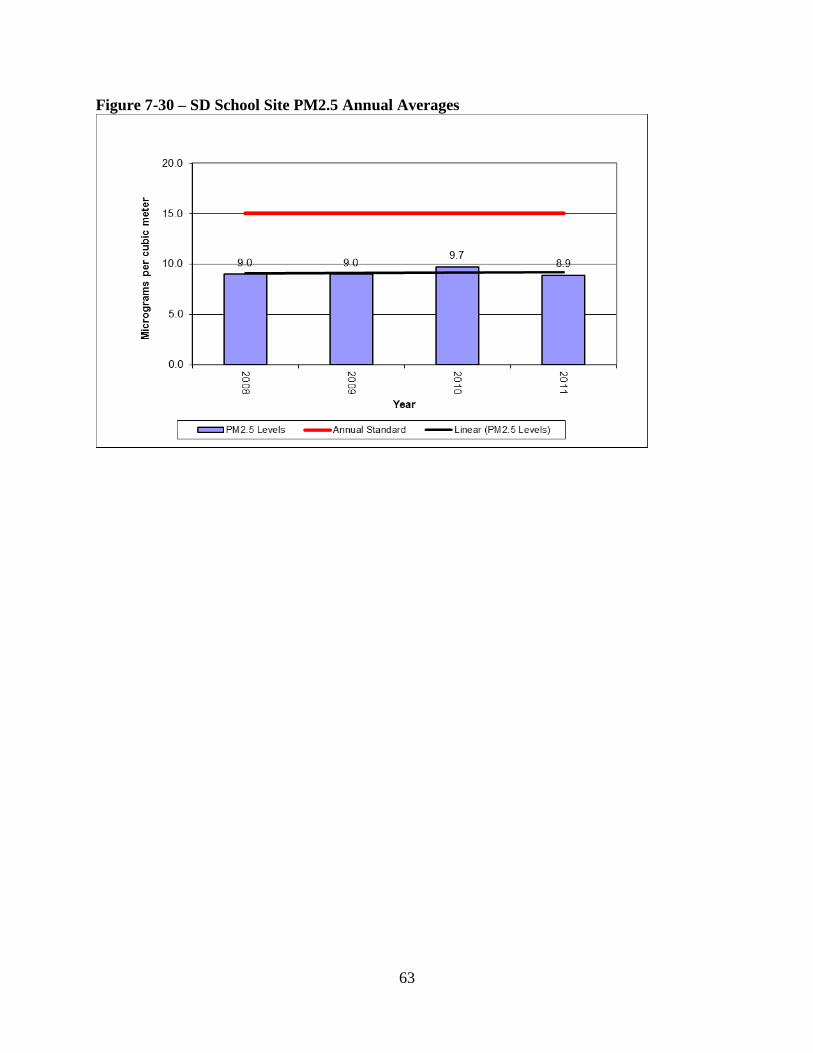
63
Figure 7-30 – SD School Site PM2.5 Annual Averages
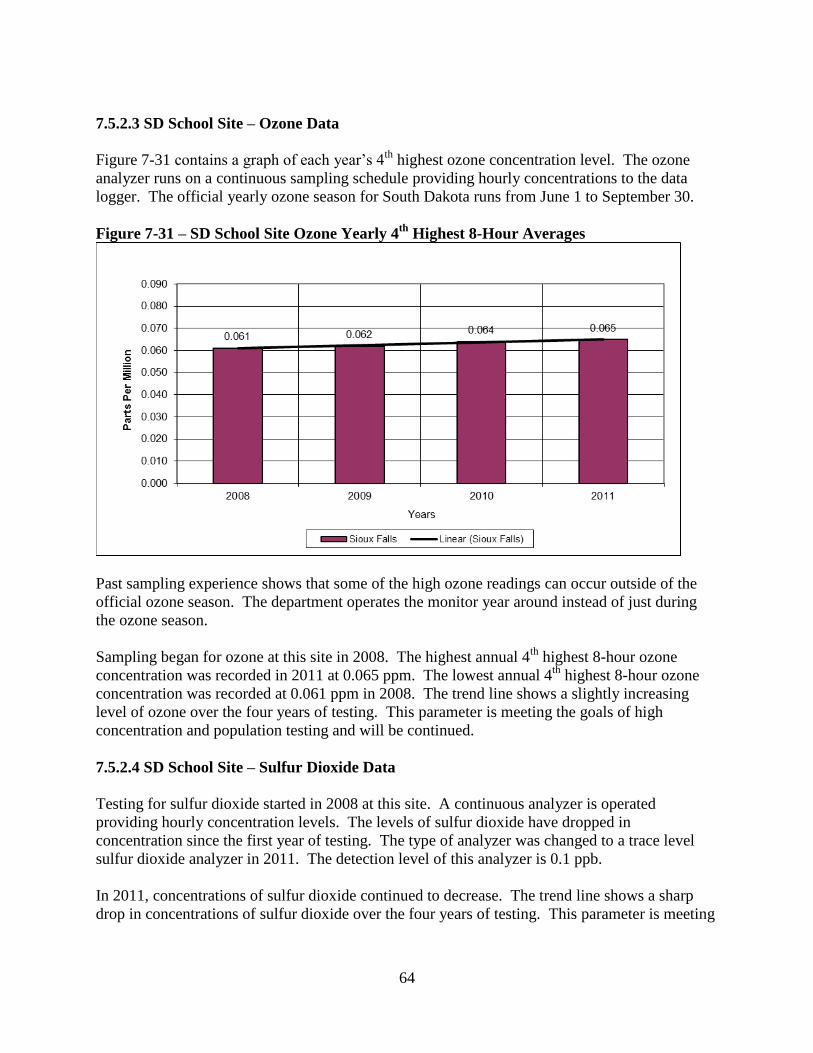
64
7.5.2.3 SD School Site – Ozone Data
Figure 7-31 contains a graph of each year’s 4th
highest ozone concentration level. The ozone
analyzer runs on a continuous sampling schedule providing hourly concentrations to the data
logger. The official yearly ozone season for South Dakota runs from June 1 to September 30.
Figure 7-31 – SD School Site Ozone Yearly 4th
Highest 8-Hour Averages
Past sampling experience shows that some of the high ozone readings can occur outside of the
official ozone season. The department operates the monitor year around instead of just during
the ozone season.
Sampling began for ozone at this site in 2008. The highest annual 4th
highest 8-hour ozone
concentration was recorded in 2011 at 0.065 ppm. The lowest annual 4th
highest 8-hour ozone
concentration was recorded at 0.061 ppm in 2008. The trend line shows a slightly increasing
level of ozone over the four years of testing. This parameter is meeting the goals of high
concentration and population testing and will be continued.
7.5.2.4 SD School Site – Sulfur Dioxide Data
Testing for sulfur dioxide started in 2008 at this site. A continuous analyzer is operated
providing hourly concentration levels. The levels of sulfur dioxide have dropped in
concentration since the first year of testing. The type of analyzer was changed to a trace level
sulfur dioxide analyzer in 2011. The detection level of this analyzer is 0.1 ppb.
In 2011, concentrations of sulfur dioxide continued to decrease. The trend line shows a sharp
drop in concentrations of sulfur dioxide over the four years of testing. This parameter is meeting
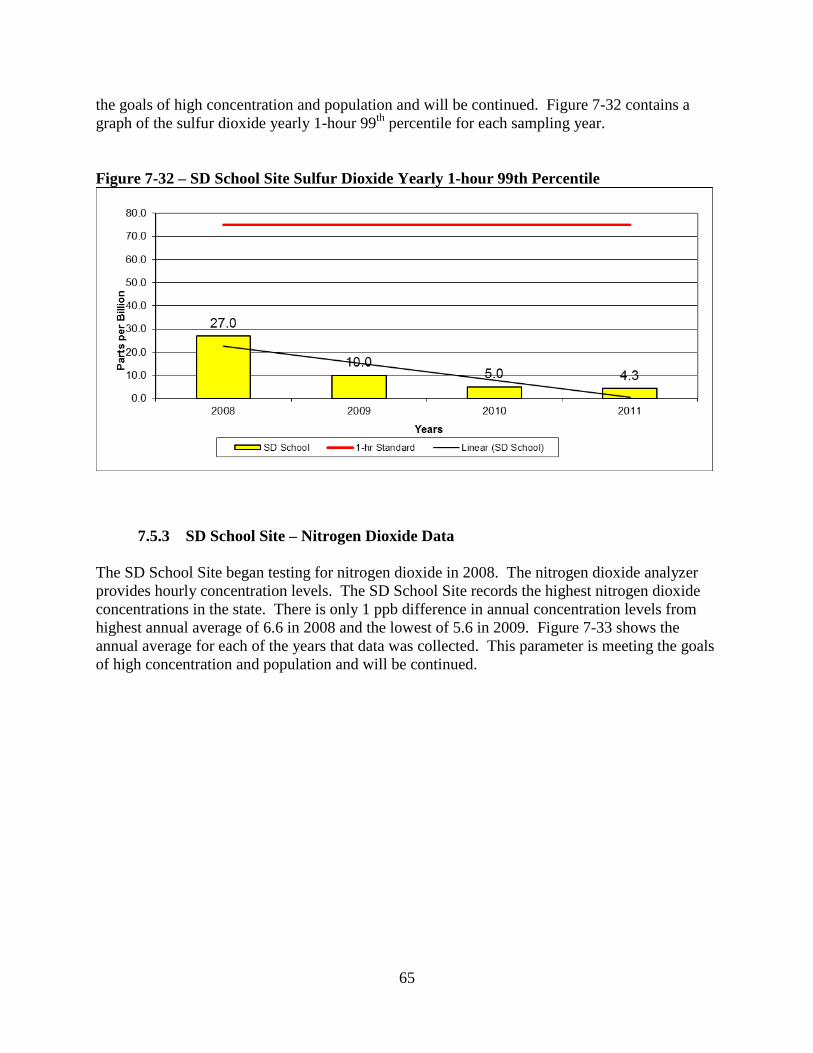
65
the goals of high concentration and population and will be continued. Figure 7-32 contains a
graph of the sulfur dioxide yearly 1-hour 99th
percentile for each sampling year.
Figure 7-32 – SD School Site Sulfur Dioxide Yearly 1-hour 99th Percentile
7.5.3 SD School Site – Nitrogen Dioxide Data
The SD School Site began testing for nitrogen dioxide in 2008. The nitrogen dioxide analyzer
provides hourly concentration levels. The SD School Site records the highest nitrogen dioxide
concentrations in the state. There is only 1 ppb difference in annual concentration levels from
highest annual average of 6.6 in 2008 and the lowest of 5.6 in 2009. Figure 7-33 shows the
annual average for each of the years that data was collected. This parameter is meeting the goals
of high concentration and population and will be continued.
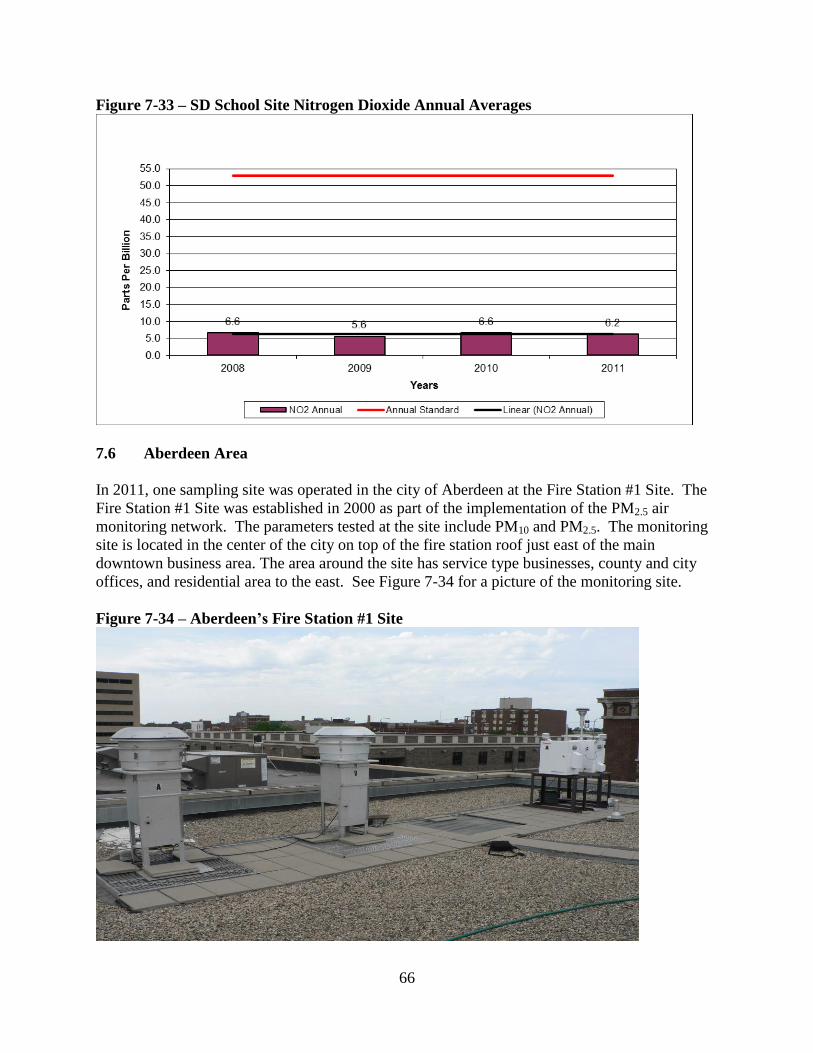
66
Figure 7-33 – SD School Site Nitrogen Dioxide Annual Averages
7.6 Aberdeen Area
In 2011, one sampling site was operated in the city of Aberdeen at the Fire Station #1 Site. The
Fire Station #1 Site was established in 2000 as part of the implementation of the PM2.5 air
monitoring network. The parameters tested at the site include PM10 and PM2.5. The monitoring
site is located in the center of the city on top of the fire station roof just east of the main
downtown business area. The area around the site has service type businesses, county and city
offices, and residential area to the east. See Figure 7-34 for a picture of the monitoring site.
Figure 7-34 – Aberdeen’s Fire Station #1 Site
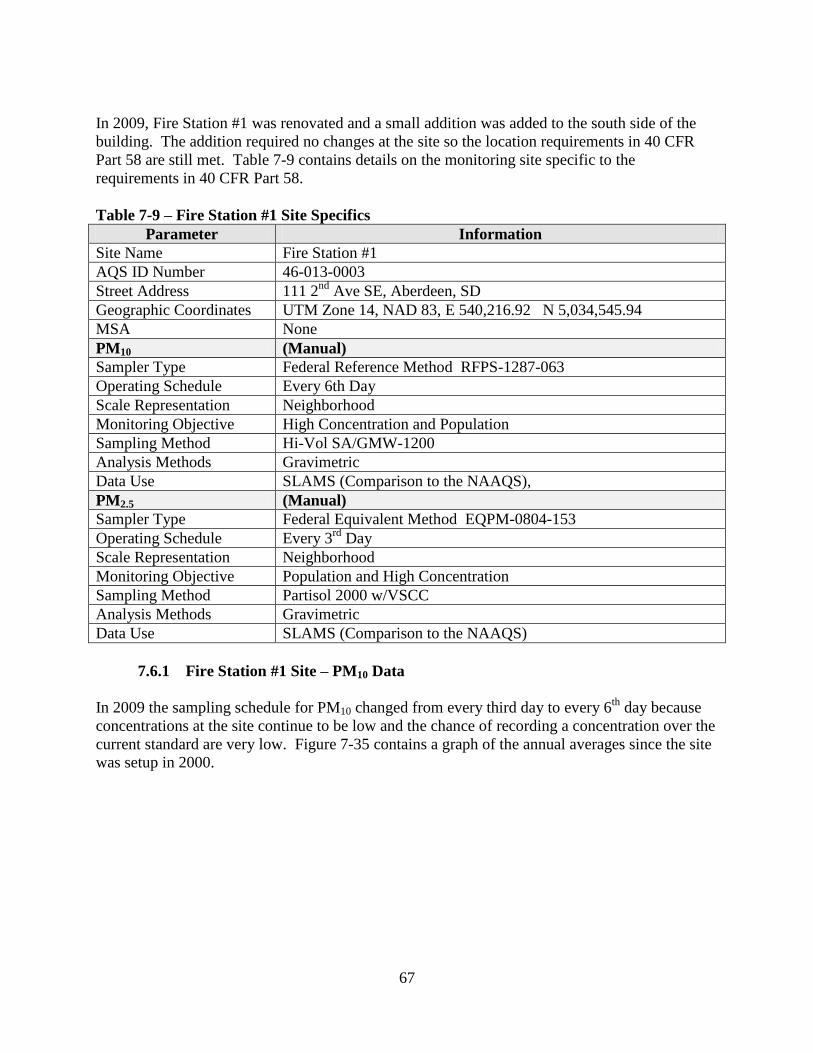
67
In 2009, Fire Station #1 was renovated and a small addition was added to the south side of the
building. The addition required no changes at the site so the location requirements in 40 CFR
Part 58 are still met. Table 7-9 contains details on the monitoring site specific to the
requirements in 40 CFR Part 58.
Table 7-9 – Fire Station #1 Site Specifics
Parameter Information
Site Name Fire Station #1
AQS ID Number 46-013-0003
Street Address 111 2nd
Ave SE, Aberdeen, SD
Geographic Coordinates UTM Zone 14, NAD 83, E 540,216.92 N 5,034,545.94
MSA None
PM10 (Manual)
Sampler Type Federal Reference Method RFPS-1287-063
Operating Schedule Every 6th Day
Scale Representation Neighborhood
Monitoring Objective High Concentration and Population
Sampling Method Hi-Vol SA/GMW-1200
Analysis Methods Gravimetric
Data Use SLAMS (Comparison to the NAAQS),
PM2.5 (Manual)
Sampler Type Federal Equivalent Method EQPM-0804-153
Operating Schedule Every 3rd
Day
Scale Representation Neighborhood
Monitoring Objective Population and High Concentration
Sampling Method Partisol 2000 w/VSCC
Analysis Methods Gravimetric
Data Use SLAMS (Comparison to the NAAQS)
7.6.1 Fire Station #1 Site – PM10 Data
In 2009 the sampling schedule for PM10 changed from every third day to every 6th
day because
concentrations at the site continue to be low and the chance of recording a concentration over the
current standard are very low. Figure 7-35 contains a graph of the annual averages since the site
was setup in 2000.
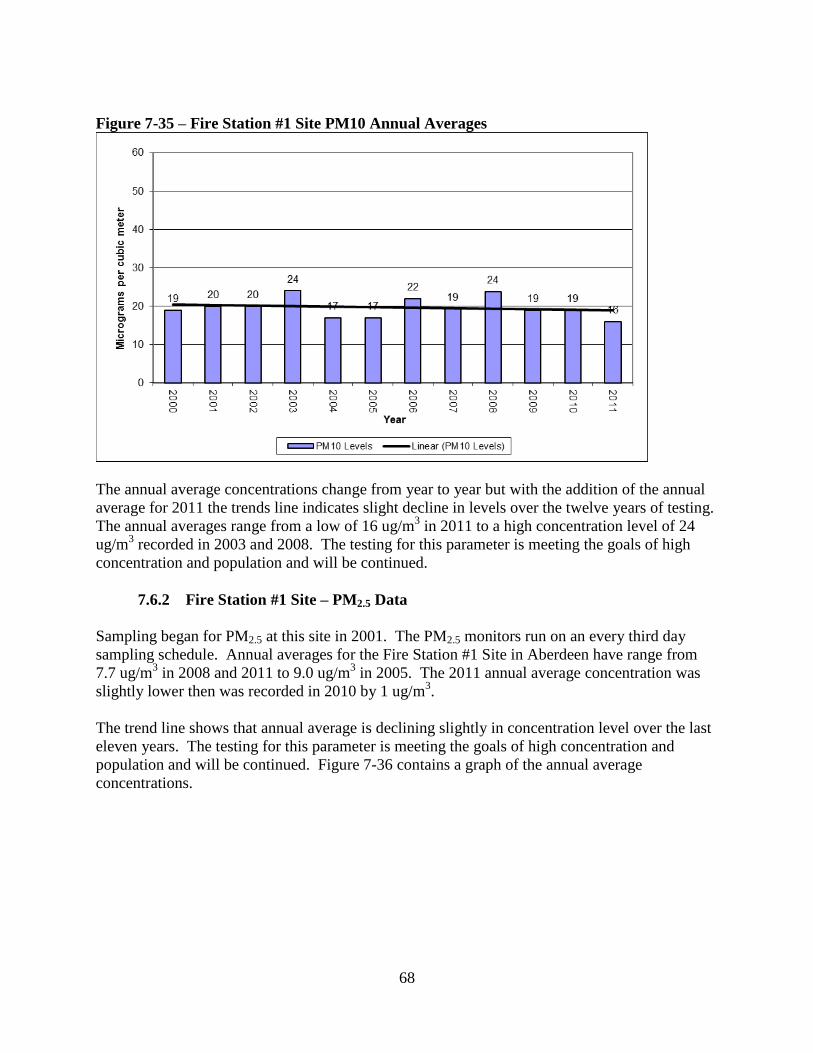
68
Figure 7-35 – Fire Station #1 Site PM10 Annual Averages
The annual average concentrations change from year to year but with the addition of the annual
average for 2011 the trends line indicates slight decline in levels over the twelve years of testing.
The annual averages range from a low of 16 ug/m3 in 2011 to a high concentration level of 24
ug/m3 recorded in 2003 and 2008. The testing for this parameter is meeting the goals of high
concentration and population and will be continued.
7.6.2 Fire Station #1 Site – PM2.5 Data
Sampling began for PM2.5 at this site in 2001. The PM2.5 monitors run on an every third day
sampling schedule. Annual averages for the Fire Station #1 Site in Aberdeen have range from
7.7 ug/m3 in 2008 and 2011 to 9.0 ug/m
3 in 2005. The 2011 annual average concentration was
slightly lower then was recorded in 2010 by 1 ug/m3.
The trend line shows that annual average is declining slightly in concentration level over the last
eleven years. The testing for this parameter is meeting the goals of high concentration and
population and will be continued. Figure 7-36 contains a graph of the annual average
concentrations.
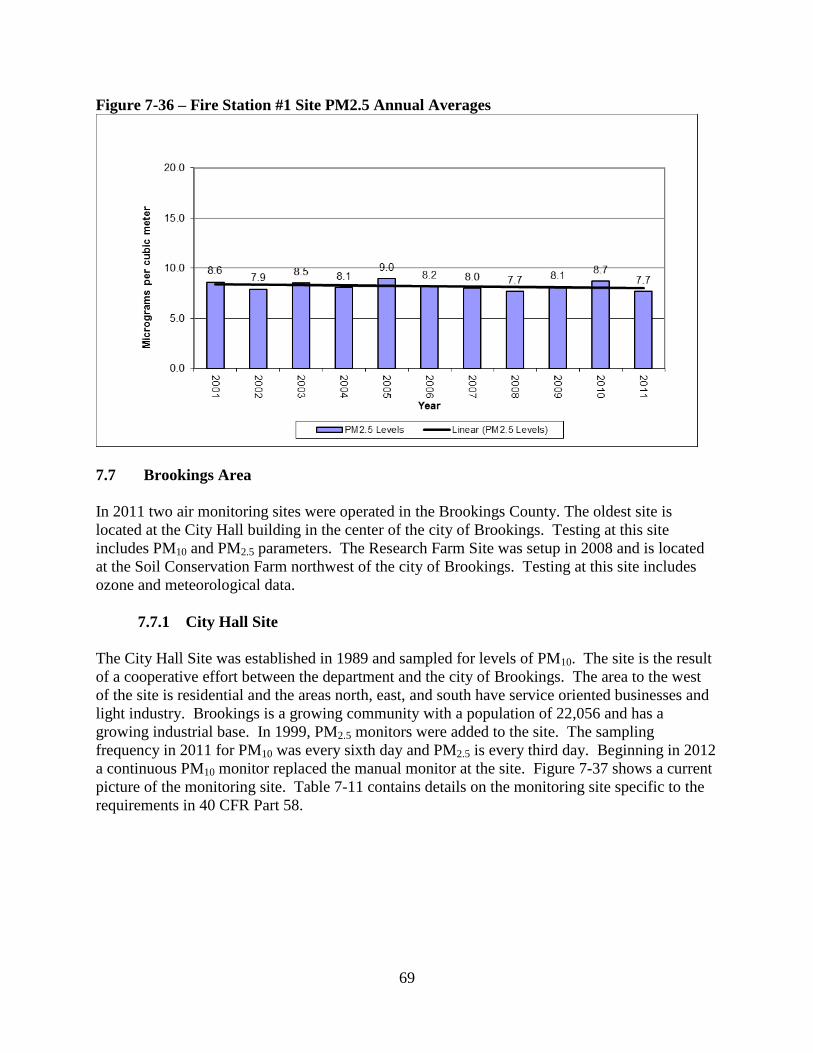
69
Figure 7-36 – Fire Station #1 Site PM2.5 Annual Averages
7.7 Brookings Area
In 2011 two air monitoring sites were operated in the Brookings County. The oldest site is
located at the City Hall building in the center of the city of Brookings. Testing at this site
includes PM10 and PM2.5 parameters. The Research Farm Site was setup in 2008 and is located
at the Soil Conservation Farm northwest of the city of Brookings. Testing at this site includes
ozone and meteorological data.
7.7.1 City Hall Site
The City Hall Site was established in 1989 and sampled for levels of PM10. The site is the result
of a cooperative effort between the department and the city of Brookings. The area to the west
of the site is residential and the areas north, east, and south have service oriented businesses and
light industry. Brookings is a growing community with a population of 22,056 and has a
growing industrial base. In 1999, PM2.5 monitors were added to the site. The sampling
frequency in 2011 for PM10 was every sixth day and PM2.5 is every third day. Beginning in 2012
a continuous PM10 monitor replaced the manual monitor at the site. Figure 7-37 shows a current
picture of the monitoring site. Table 7-11 contains details on the monitoring site specific to the
requirements in 40 CFR Part 58.
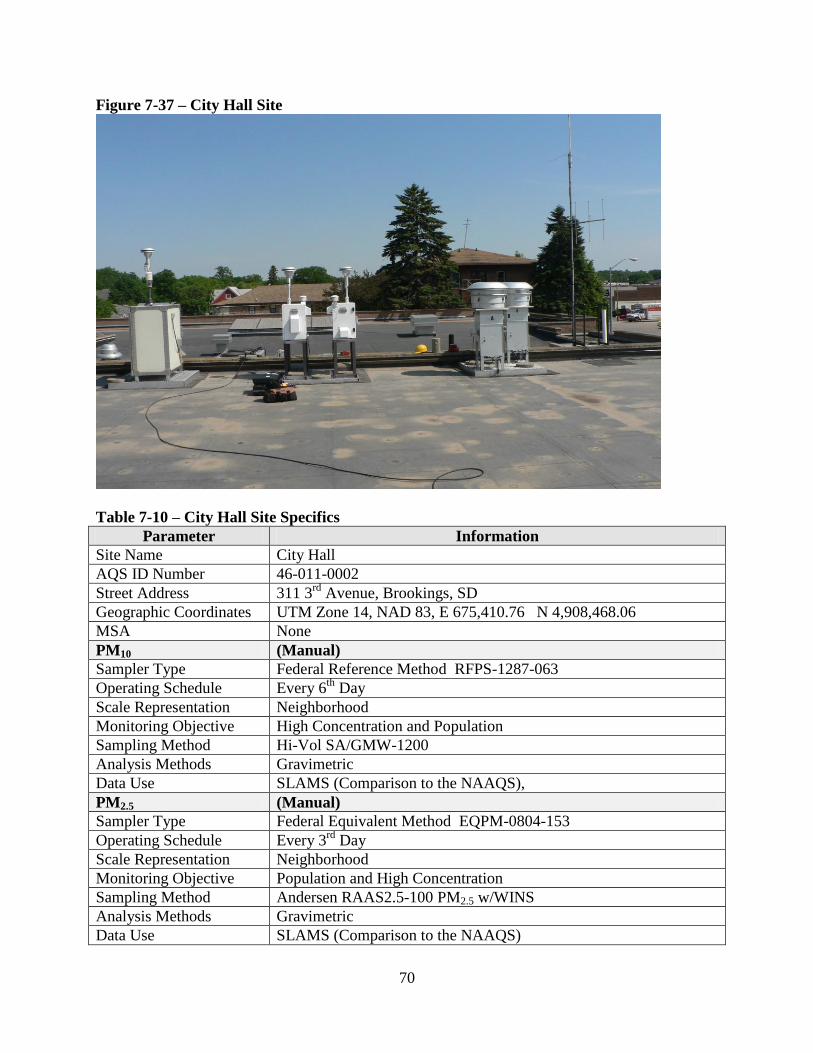
70
Figure 7-37 – City Hall Site
Table 7-10 – City Hall Site Specifics
Parameter Information
Site Name City Hall
AQS ID Number 46-011-0002
Street Address 311 3rd
Avenue, Brookings, SD
Geographic Coordinates UTM Zone 14, NAD 83, E 675,410.76 N 4,908,468.06
MSA None
PM10 (Manual)
Sampler Type Federal Reference Method RFPS-1287-063
Operating Schedule Every 6th
Day
Scale Representation Neighborhood
Monitoring Objective High Concentration and Population
Sampling Method Hi-Vol SA/GMW-1200
Analysis Methods Gravimetric
Data Use SLAMS (Comparison to the NAAQS),
PM2.5 (Manual)
Sampler Type Federal Equivalent Method EQPM-0804-153
Operating Schedule Every 3rd
Day
Scale Representation Neighborhood
Monitoring Objective Population and High Concentration
Sampling Method Andersen RAAS2.5-100 PM2.5 w/WINS
Analysis Methods Gravimetric
Data Use SLAMS (Comparison to the NAAQS)
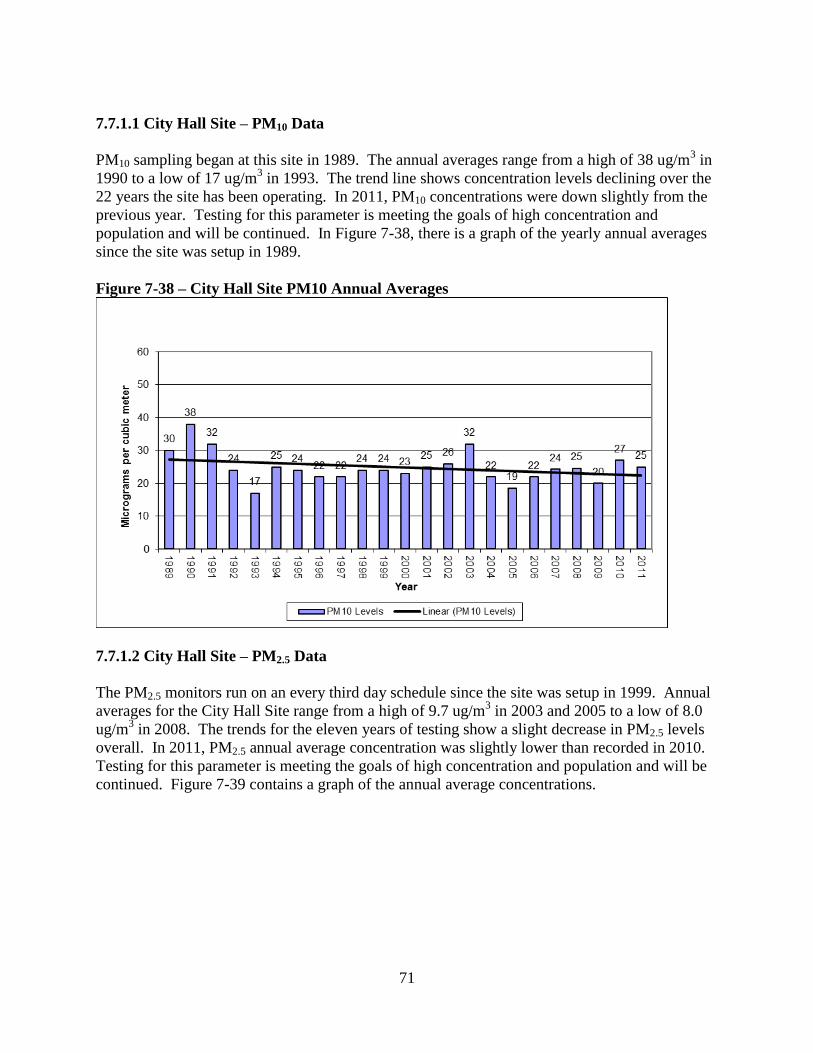
71
7.7.1.1 City Hall Site – PM10 Data
PM10 sampling began at this site in 1989. The annual averages range from a high of 38 ug/m3 in
1990 to a low of 17 ug/m3 in 1993. The trend line shows concentration levels declining over the
22 years the site has been operating. In 2011, PM10 concentrations were down slightly from the
previous year. Testing for this parameter is meeting the goals of high concentration and
population and will be continued. In Figure 7-38, there is a graph of the yearly annual averages
since the site was setup in 1989.
Figure 7-38 – City Hall Site PM10 Annual Averages
7.7.1.2 City Hall Site – PM2.5 Data
The PM2.5 monitors run on an every third day schedule since the site was setup in 1999. Annual
averages for the City Hall Site range from a high of 9.7 ug/m3 in 2003 and 2005 to a low of 8.0
ug/m3 in 2008. The trends for the eleven years of testing show a slight decrease in PM2.5 levels
overall. In 2011, PM2.5 annual average concentration was slightly lower than recorded in 2010.
Testing for this parameter is meeting the goals of high concentration and population and will be
continued. Figure 7-39 contains a graph of the annual average concentrations.
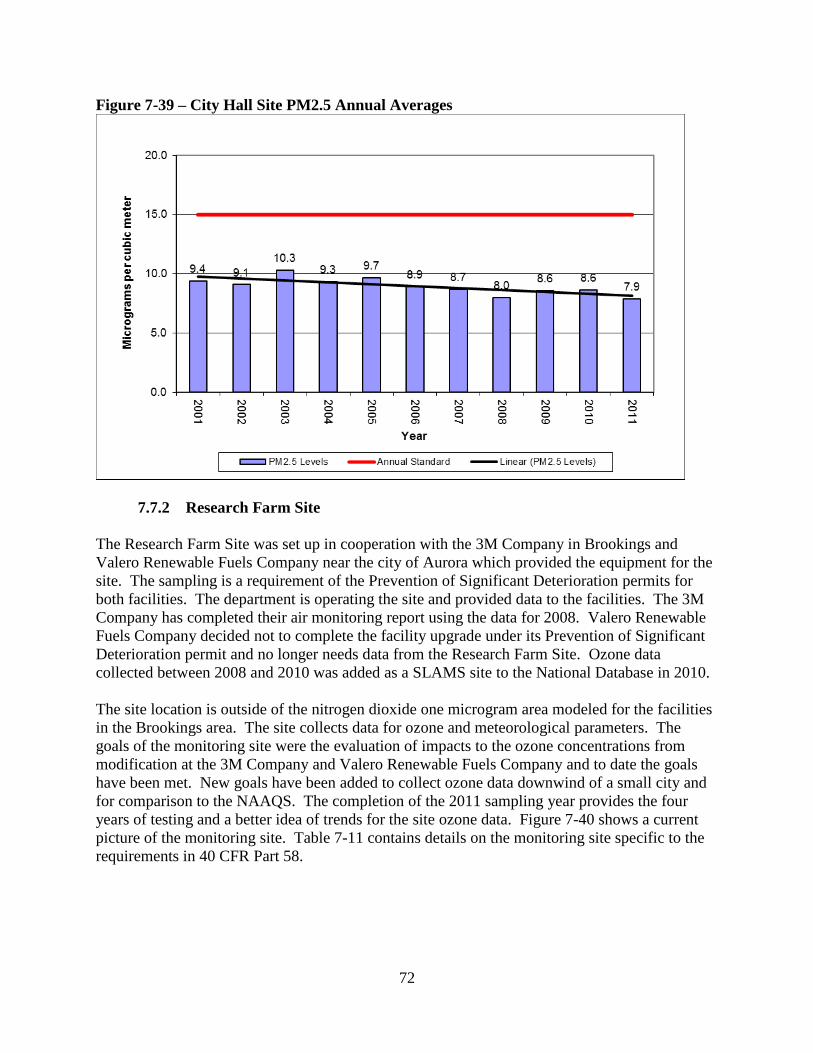
72
Figure 7-39 – City Hall Site PM2.5 Annual Averages
7.7.2 Research Farm Site
The Research Farm Site was set up in cooperation with the 3M Company in Brookings and
Valero Renewable Fuels Company near the city of Aurora which provided the equipment for the
site. The sampling is a requirement of the Prevention of Significant Deterioration permits for
both facilities. The department is operating the site and provided data to the facilities. The 3M
Company has completed their air monitoring report using the data for 2008. Valero Renewable
Fuels Company decided not to complete the facility upgrade under its Prevention of Significant
Deterioration permit and no longer needs data from the Research Farm Site. Ozone data
collected between 2008 and 2010 was added as a SLAMS site to the National Database in 2010.
The site location is outside of the nitrogen dioxide one microgram area modeled for the facilities
in the Brookings area. The site collects data for ozone and meteorological parameters. The
goals of the monitoring site were the evaluation of impacts to the ozone concentrations from
modification at the 3M Company and Valero Renewable Fuels Company and to date the goals
have been met. New goals have been added to collect ozone data downwind of a small city and
for comparison to the NAAQS. The completion of the 2011 sampling year provides the four
years of testing and a better idea of trends for the site ozone data. Figure 7-40 shows a current
picture of the monitoring site. Table 7-11 contains details on the monitoring site specific to the
requirements in 40 CFR Part 58.
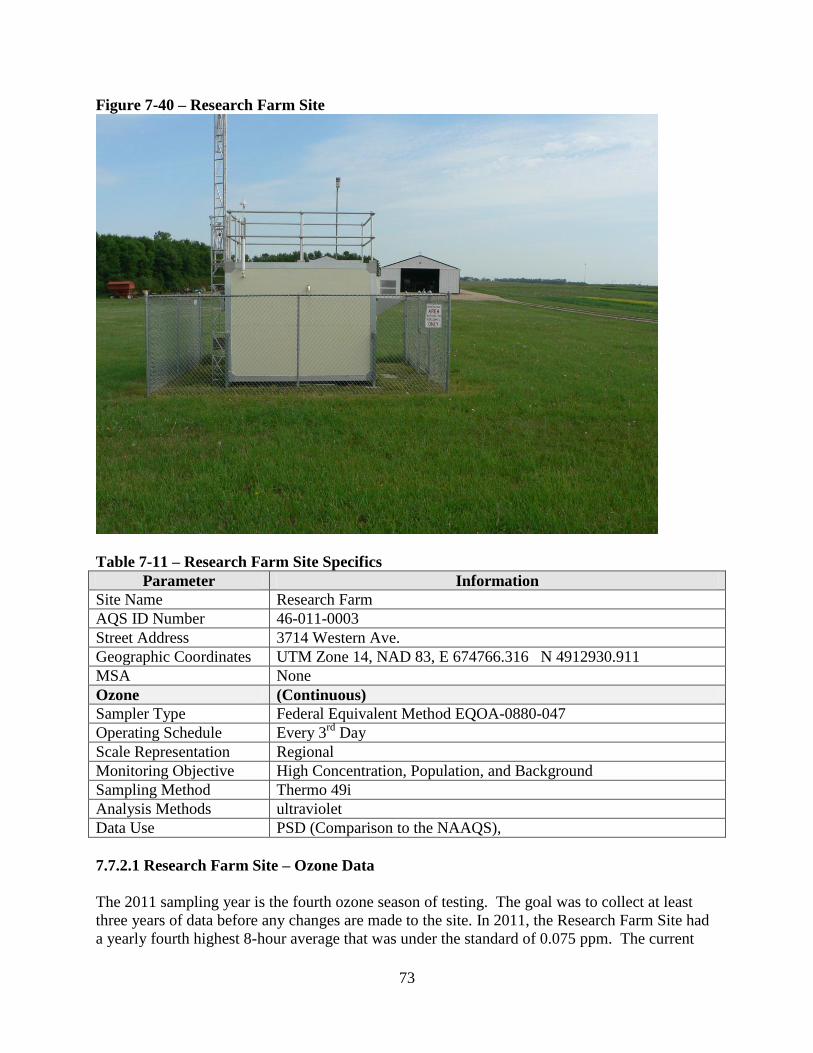
73
Figure 7-40 – Research Farm Site
Table 7-11 – Research Farm Site Specifics
Parameter Information
Site Name Research Farm
AQS ID Number 46-011-0003
Street Address 3714 Western Ave.
Geographic Coordinates UTM Zone 14, NAD 83, E 674766.316 N 4912930.911
MSA None
Ozone (Continuous)
Sampler Type Federal Equivalent Method EQOA-0880-047
Operating Schedule Every 3rd
Day
Scale Representation Regional
Monitoring Objective High Concentration, Population, and Background
Sampling Method Thermo 49i
Analysis Methods ultraviolet
Data Use PSD (Comparison to the NAAQS),
7.7.2.1 Research Farm Site – Ozone Data
The 2011 sampling year is the fourth ozone season of testing. The goal was to collect at least
three years of data before any changes are made to the site. In 2011, the Research Farm Site had
a yearly fourth highest 8-hour average that was under the standard of 0.075 ppm. The current
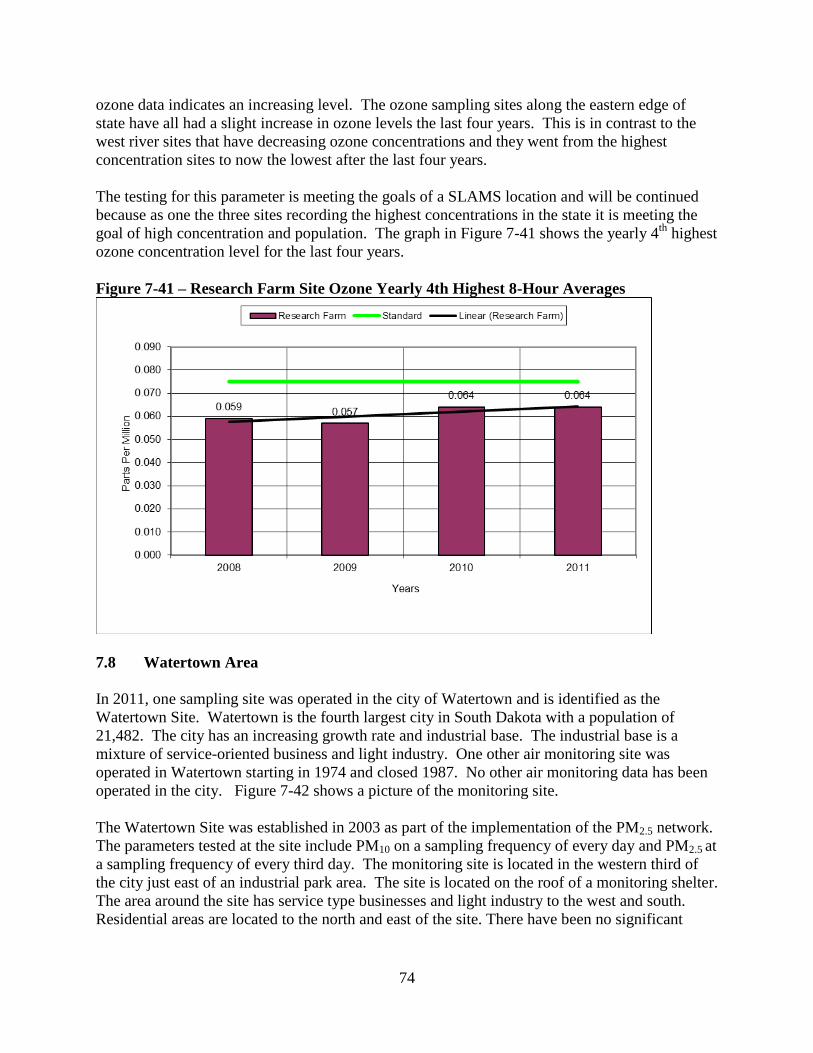
74
ozone data indicates an increasing level. The ozone sampling sites along the eastern edge of
state have all had a slight increase in ozone levels the last four years. This is in contrast to the
west river sites that have decreasing ozone concentrations and they went from the highest
concentration sites to now the lowest after the last four years.
The testing for this parameter is meeting the goals of a SLAMS location and will be continued
because as one the three sites recording the highest concentrations in the state it is meeting the
goal of high concentration and population. The graph in Figure 7-41 shows the yearly 4th
highest
ozone concentration level for the last four years.
Figure 7-41 – Research Farm Site Ozone Yearly 4th Highest 8-Hour Averages
7.8 Watertown Area
In 2011, one sampling site was operated in the city of Watertown and is identified as the
Watertown Site. Watertown is the fourth largest city in South Dakota with a population of
21,482. The city has an increasing growth rate and industrial base. The industrial base is a
mixture of service-oriented business and light industry. One other air monitoring site was
operated in Watertown starting in 1974 and closed 1987. No other air monitoring data has been
operated in the city. Figure 7-42 shows a picture of the monitoring site.
The Watertown Site was established in 2003 as part of the implementation of the PM2.5 network.
The parameters tested at the site include PM10 on a sampling frequency of every day and PM2.5 at
a sampling frequency of every third day. The monitoring site is located in the western third of
the city just east of an industrial park area. The site is located on the roof of a monitoring shelter.
The area around the site has service type businesses and light industry to the west and south.
Residential areas are located to the north and east of the site. There have been no significant
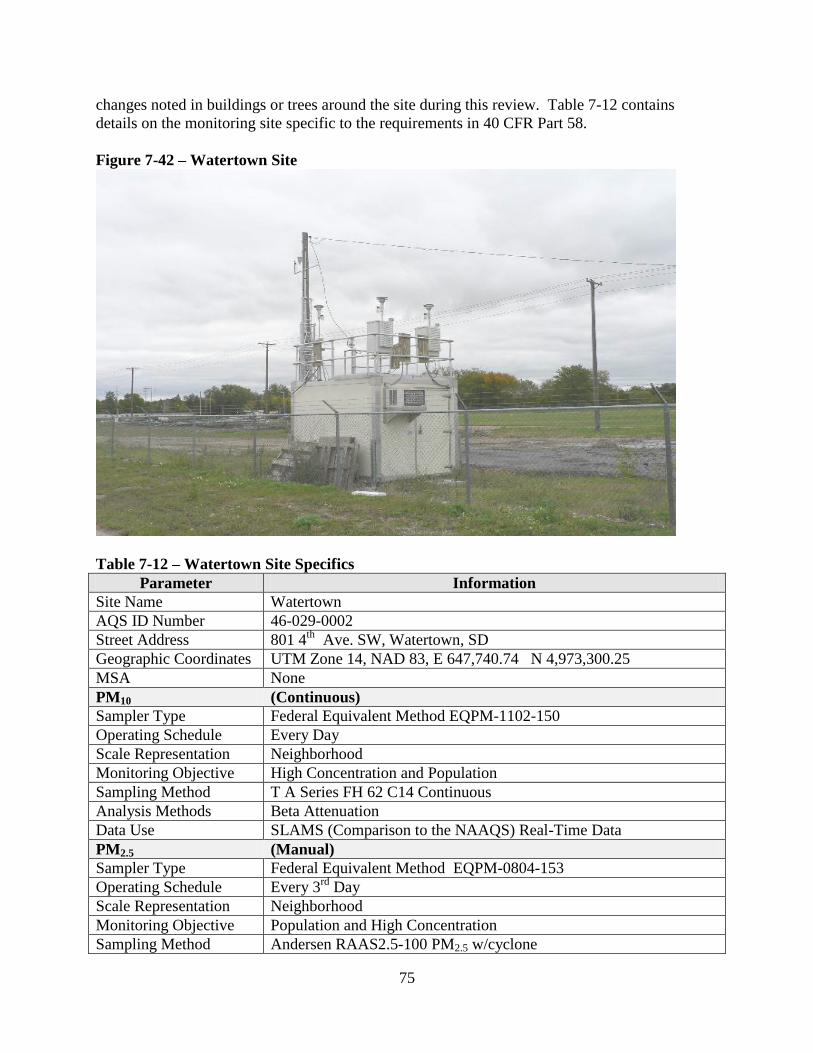
75
changes noted in buildings or trees around the site during this review. Table 7-12 contains
details on the monitoring site specific to the requirements in 40 CFR Part 58.
Figure 7-42 – Watertown Site
Table 7-12 – Watertown Site Specifics
Parameter Information
Site Name Watertown
AQS ID Number 46-029-0002
Street Address 801 4th
Ave. SW, Watertown, SD
Geographic Coordinates UTM Zone 14, NAD 83, E 647,740.74 N 4,973,300.25
MSA None
PM10 (Continuous)
Sampler Type Federal Equivalent Method EQPM-1102-150
Operating Schedule Every Day
Scale Representation Neighborhood
Monitoring Objective High Concentration and Population
Sampling Method T A Series FH 62 C14 Continuous
Analysis Methods Beta Attenuation
Data Use SLAMS (Comparison to the NAAQS) Real-Time Data
PM2.5 (Manual)
Sampler Type Federal Equivalent Method EQPM-0804-153
Operating Schedule Every 3rd
Day
Scale Representation Neighborhood
Monitoring Objective Population and High Concentration
Sampling Method Andersen RAAS2.5-100 PM2.5 w/cyclone
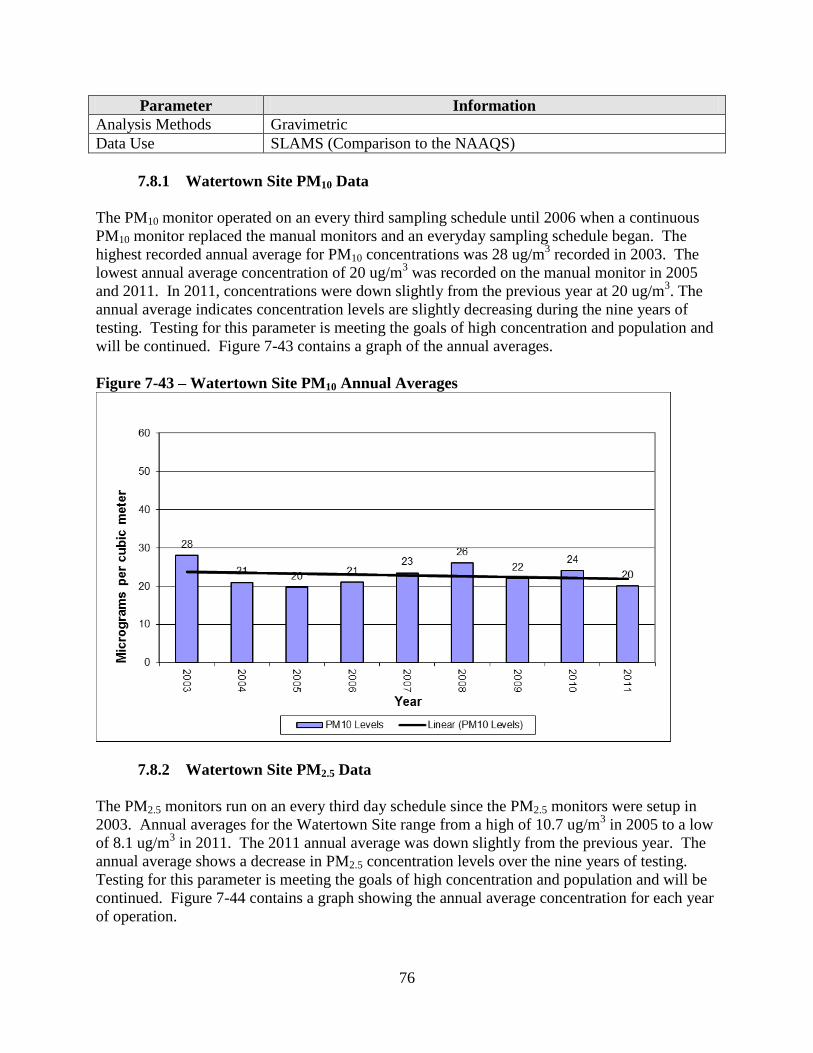
76
Parameter Information
Analysis Methods Gravimetric
Data Use SLAMS (Comparison to the NAAQS)
7.8.1 Watertown Site PM10 Data
The PM10 monitor operated on an every third sampling schedule until 2006 when a continuous
PM10 monitor replaced the manual monitors and an everyday sampling schedule began. The
highest recorded annual average for PM10 concentrations was 28 ug/m3 recorded in 2003. The
lowest annual average concentration of 20 ug/m3 was recorded on the manual monitor in 2005
and 2011. In 2011, concentrations were down slightly from the previous year at 20 ug/m3. The
annual average indicates concentration levels are slightly decreasing during the nine years of
testing. Testing for this parameter is meeting the goals of high concentration and population and
will be continued. Figure 7-43 contains a graph of the annual averages.
Figure 7-43 – Watertown Site PM10 Annual Averages
7.8.2 Watertown Site PM2.5 Data
The PM2.5 monitors run on an every third day schedule since the PM2.5 monitors were setup in
2003. Annual averages for the Watertown Site range from a high of 10.7 ug/m3 in 2005 to a low
of 8.1 ug/m3 in 2011. The 2011 annual average was down slightly from the previous year. The
annual average shows a decrease in PM2.5 concentration levels over the nine years of testing.
Testing for this parameter is meeting the goals of high concentration and population and will be
continued. Figure 7-44 contains a graph showing the annual average concentration for each year
of operation.
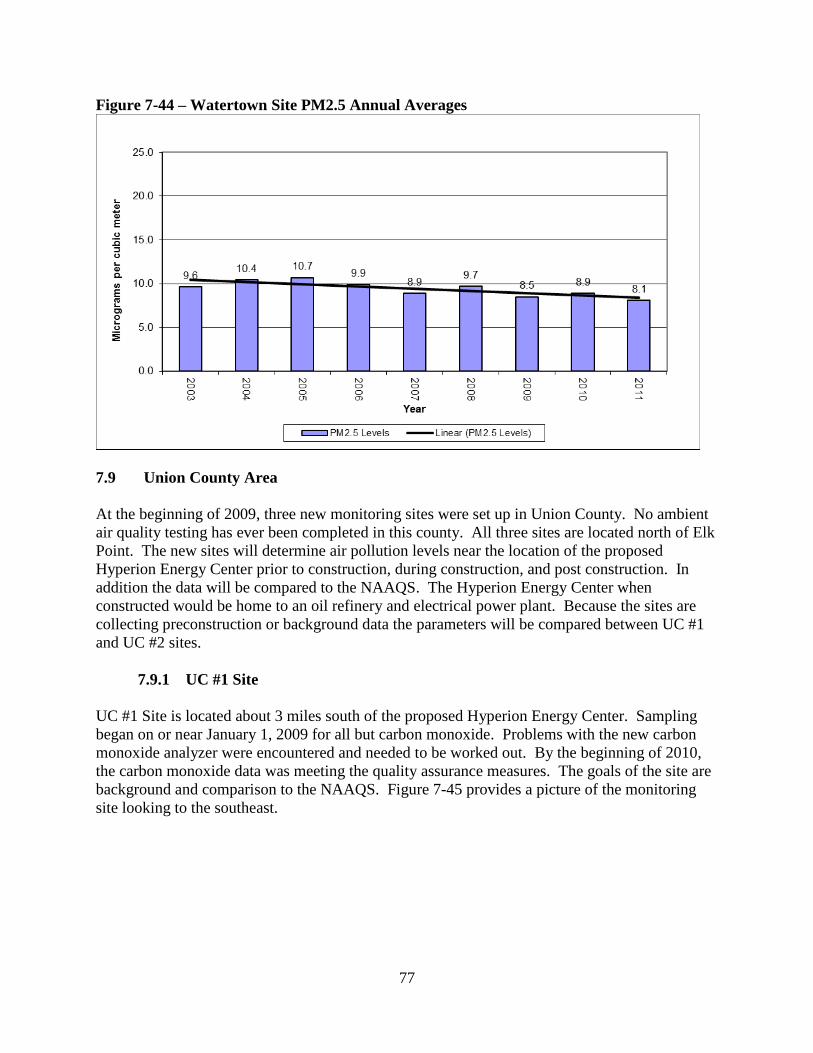
77
Figure 7-44 – Watertown Site PM2.5 Annual Averages
7.9 Union County Area
At the beginning of 2009, three new monitoring sites were set up in Union County. No ambient
air quality testing has ever been completed in this county. All three sites are located north of Elk
Point. The new sites will determine air pollution levels near the location of the proposed
Hyperion Energy Center prior to construction, during construction, and post construction. In
addition the data will be compared to the NAAQS. The Hyperion Energy Center when
constructed would be home to an oil refinery and electrical power plant. Because the sites are
collecting preconstruction or background data the parameters will be compared between UC #1
and UC #2 sites.
7.9.1 UC #1 Site
UC #1 Site is located about 3 miles south of the proposed Hyperion Energy Center. Sampling
began on or near January 1, 2009 for all but carbon monoxide. Problems with the new carbon
monoxide analyzer were encountered and needed to be worked out. By the beginning of 2010,
the carbon monoxide data was meeting the quality assurance measures. The goals of the site are
background and comparison to the NAAQS. Figure 7-45 provides a picture of the monitoring
site looking to the southeast.
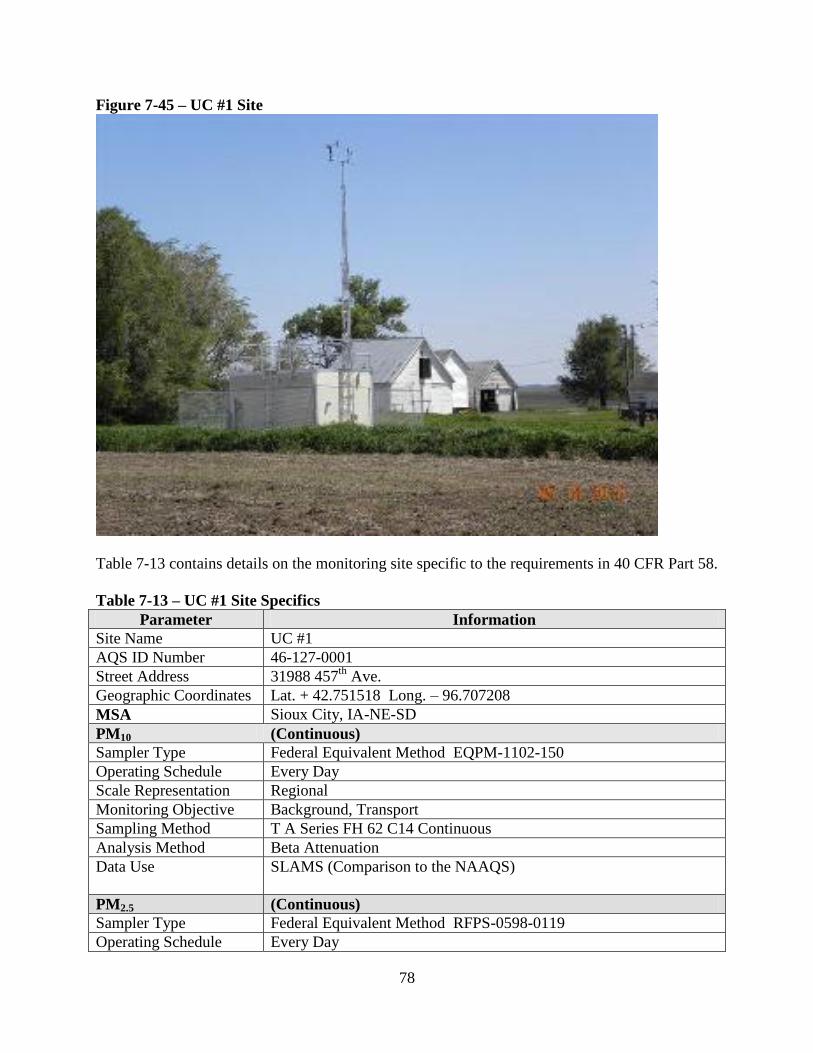
78
Figure 7-45 – UC #1 Site
Table 7-13 contains details on the monitoring site specific to the requirements in 40 CFR Part 58.
Table 7-13 – UC #1 Site Specifics
Parameter Information
Site Name UC #1
AQS ID Number 46-127-0001
Street Address 31988 457th
Ave.
Geographic Coordinates Lat. + 42.751518 Long. – 96.707208
MSA Sioux City, IA-NE-SD
PM10 (Continuous)
Sampler Type Federal Equivalent Method EQPM-1102-150
Operating Schedule Every Day
Scale Representation Regional
Monitoring Objective Background, Transport
Sampling Method T A Series FH 62 C14 Continuous
Analysis Method Beta Attenuation
Data Use SLAMS (Comparison to the NAAQS)
PM2.5 (Continuous)
Sampler Type Federal Equivalent Method RFPS-0598-0119
Operating Schedule Every Day
79
Parameter Information
Scale Representation Regional
Monitoring Objective Background, Transport
Sampling Method Met One BAM-1020 w/PM2.5 VSCC
Analysis Method Beta Attenuation
Data Use Real-time Data and SPMS
SO2 (Continuous)
Sampler Type Federal Equivalent Method EQSA-0486-060
Operating Schedule Every Day
Scale Representation Regional
Monitoring Objective Background, Transport
Sampling Method Instrumental 43i Trace Level Thermo
Analysis Methods Pulsed Fluorescent
Data Use SLAMS (Comparison to the NAAQS)
NO2 (Continuous)
Sampler Type Federal Reference Method RFNA-1289-074
Operating Schedule Every Day
Scale Representation Regional
Monitoring Objective Background, Transport
Sampling Method Instrumental 42i Thermo/Fisher
Analysis Method Chemiluminescence
Data Use SLAMS (Comparison to the NAAQS)
CO (Continuous)
Sampler Type Federal Equivalent Method EQOA-0880-047
Operating Schedule Every Day
Scale Representation Regional
Monitoring Objective Background, Transport
Sampling Method Instrumental API 300EU Trace Level
Analysis Method Ultraviolet
Data Use SLAMS (Comparison to the NAAQS)
7.9.2 UC #2 Site
UC#2 Site is located about 1 ½ miles north northwest of the proposed Hyperion Energy Center.
Table 7-14 contains details on the monitoring site specific to the requirements in 40 CFR Part 58.
At the end of 2011, the manual PM2.5 monitors were removed so only the continuous monitor
will be operated in future years. Figure 7-46 contains a picture of the monitoring site looking
west.
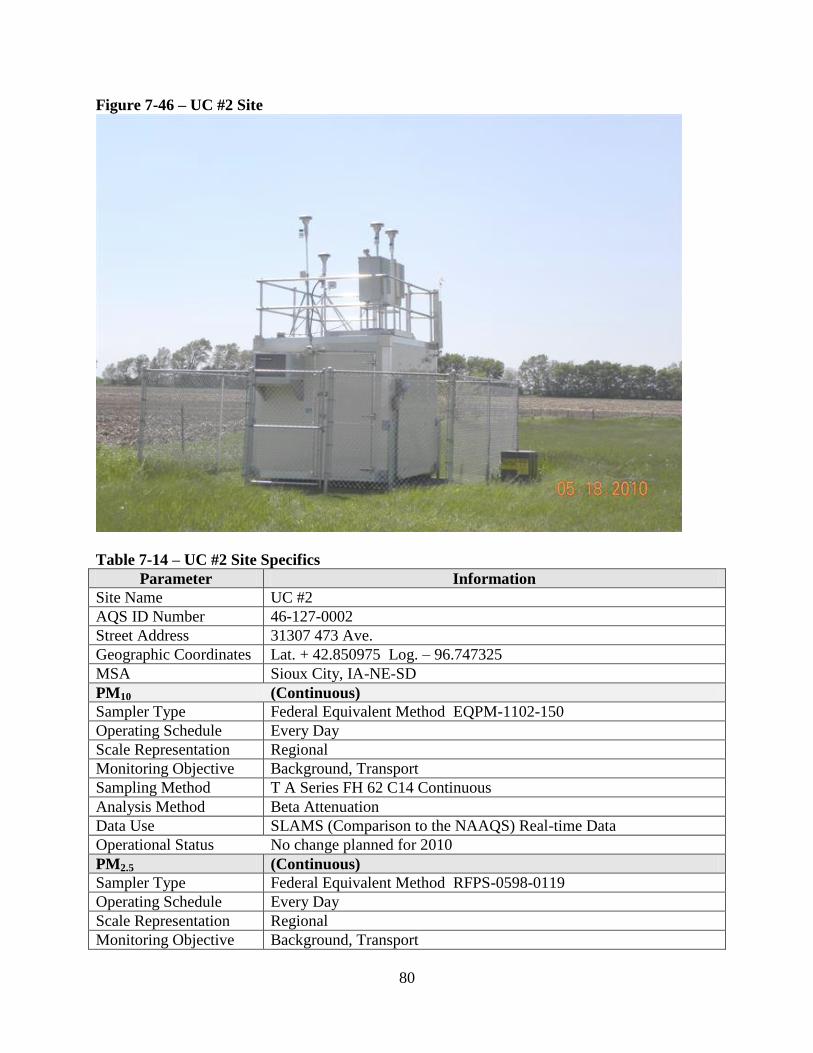
80
Figure 7-46 – UC #2 Site
Table 7-14 – UC #2 Site Specifics
Parameter Information
Site Name UC #2
AQS ID Number 46-127-0002
Street Address 31307 473 Ave.
Geographic Coordinates Lat. + 42.850975 Log. – 96.747325
MSA Sioux City, IA-NE-SD
PM10 (Continuous)
Sampler Type Federal Equivalent Method EQPM-1102-150
Operating Schedule Every Day
Scale Representation Regional
Monitoring Objective Background, Transport
Sampling Method T A Series FH 62 C14 Continuous
Analysis Method Beta Attenuation
Data Use SLAMS (Comparison to the NAAQS) Real-time Data
Operational Status No change planned for 2010
PM2.5 (Continuous)
Sampler Type Federal Equivalent Method RFPS-0598-0119
Operating Schedule Every Day
Scale Representation Regional
Monitoring Objective Background, Transport
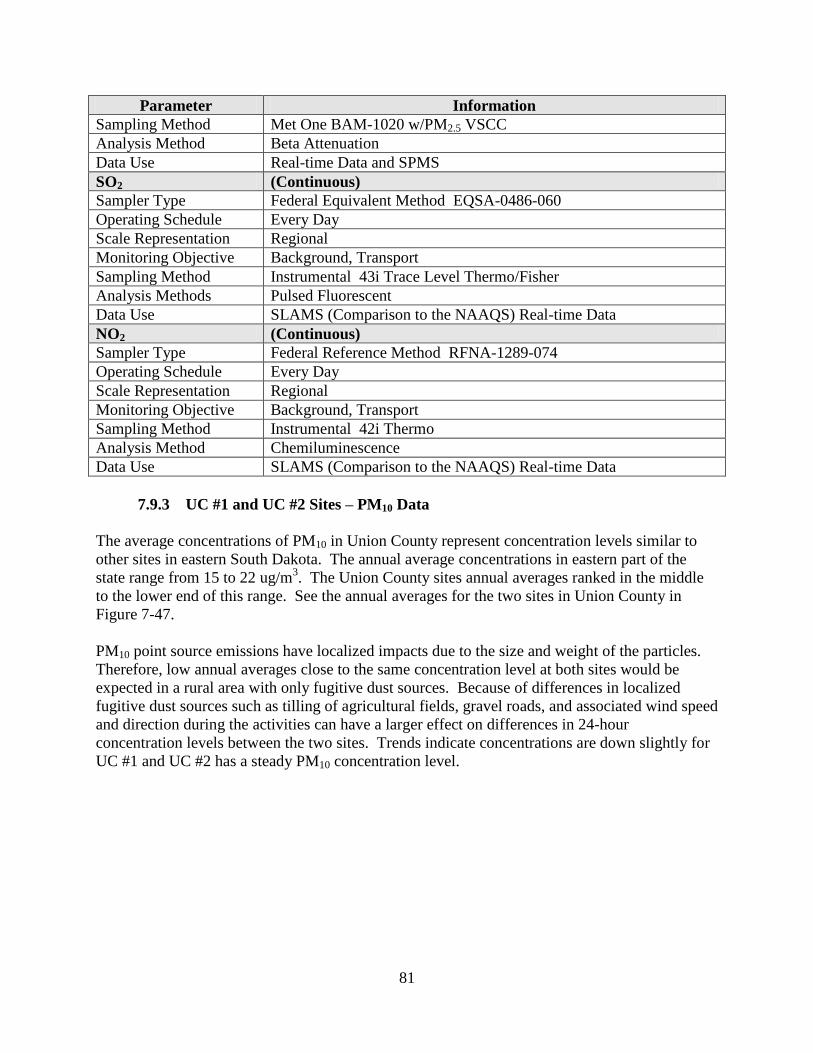
81
Parameter Information
Sampling Method Met One BAM-1020 w/PM2.5 VSCC
Analysis Method Beta Attenuation
Data Use Real-time Data and SPMS
SO2 (Continuous)
Sampler Type Federal Equivalent Method EQSA-0486-060
Operating Schedule Every Day
Scale Representation Regional
Monitoring Objective Background, Transport
Sampling Method Instrumental 43i Trace Level Thermo/Fisher
Analysis Methods Pulsed Fluorescent
Data Use SLAMS (Comparison to the NAAQS) Real-time Data
NO2 (Continuous)
Sampler Type Federal Reference Method RFNA-1289-074
Operating Schedule Every Day
Scale Representation Regional
Monitoring Objective Background, Transport
Sampling Method Instrumental 42i Thermo
Analysis Method Chemiluminescence
Data Use SLAMS (Comparison to the NAAQS) Real-time Data
7.9.3 UC #1 and UC #2 Sites – PM10 Data
The average concentrations of PM10 in Union County represent concentration levels similar to
other sites in eastern South Dakota. The annual average concentrations in eastern part of the
state range from 15 to 22 ug/m3. The Union County sites annual averages ranked in the middle
to the lower end of this range. See the annual averages for the two sites in Union County in
Figure 7-47.
PM10 point source emissions have localized impacts due to the size and weight of the particles.
Therefore, low annual averages close to the same concentration level at both sites would be
expected in a rural area with only fugitive dust sources. Because of differences in localized
fugitive dust sources such as tilling of agricultural fields, gravel roads, and associated wind speed
and direction during the activities can have a larger effect on differences in 24-hour
concentration levels between the two sites. Trends indicate concentrations are down slightly for
UC #1 and UC #2 has a steady PM10 concentration level.
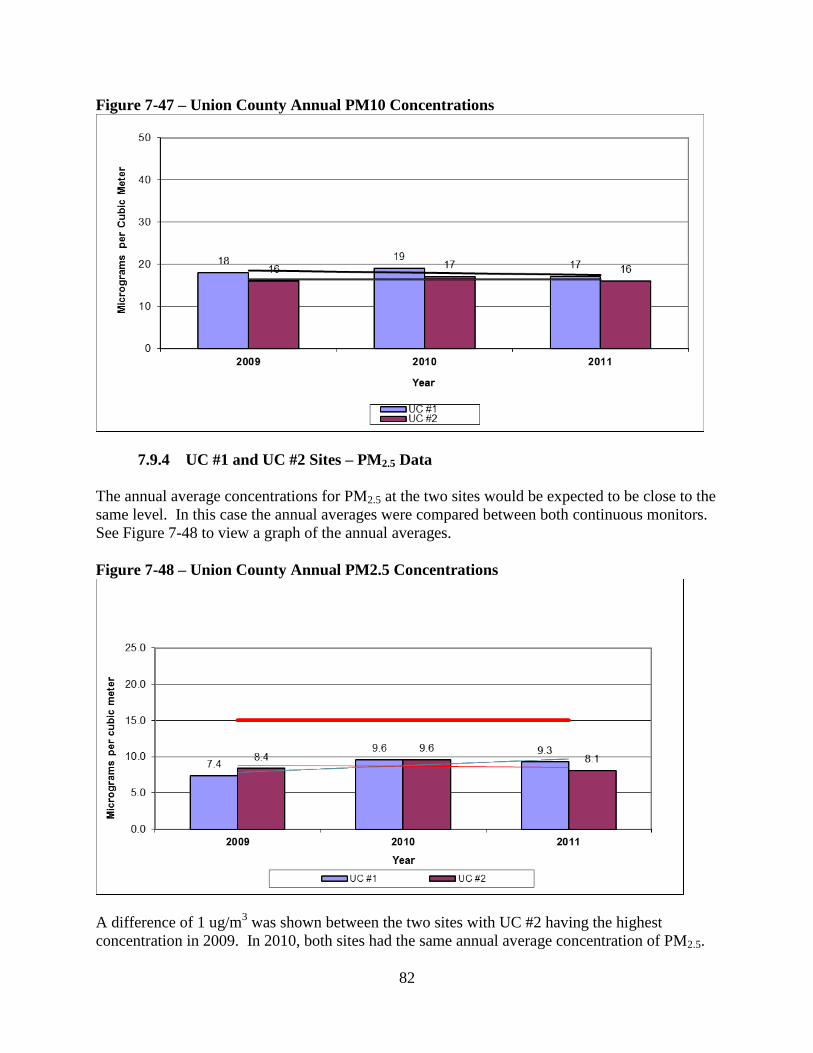
82
Figure 7-47 – Union County Annual PM10 Concentrations
7.9.4 UC #1 and UC #2 Sites – PM2.5 Data
The annual average concentrations for PM2.5 at the two sites would be expected to be close to the
same level. In this case the annual averages were compared between both continuous monitors.
See Figure 7-48 to view a graph of the annual averages.
Figure 7-48 – Union County Annual PM2.5 Concentrations
A difference of 1 ug/m3 was shown between the two sites with UC #2 having the highest
concentration in 2009. In 2010, both sites had the same annual average concentration of PM2.5.
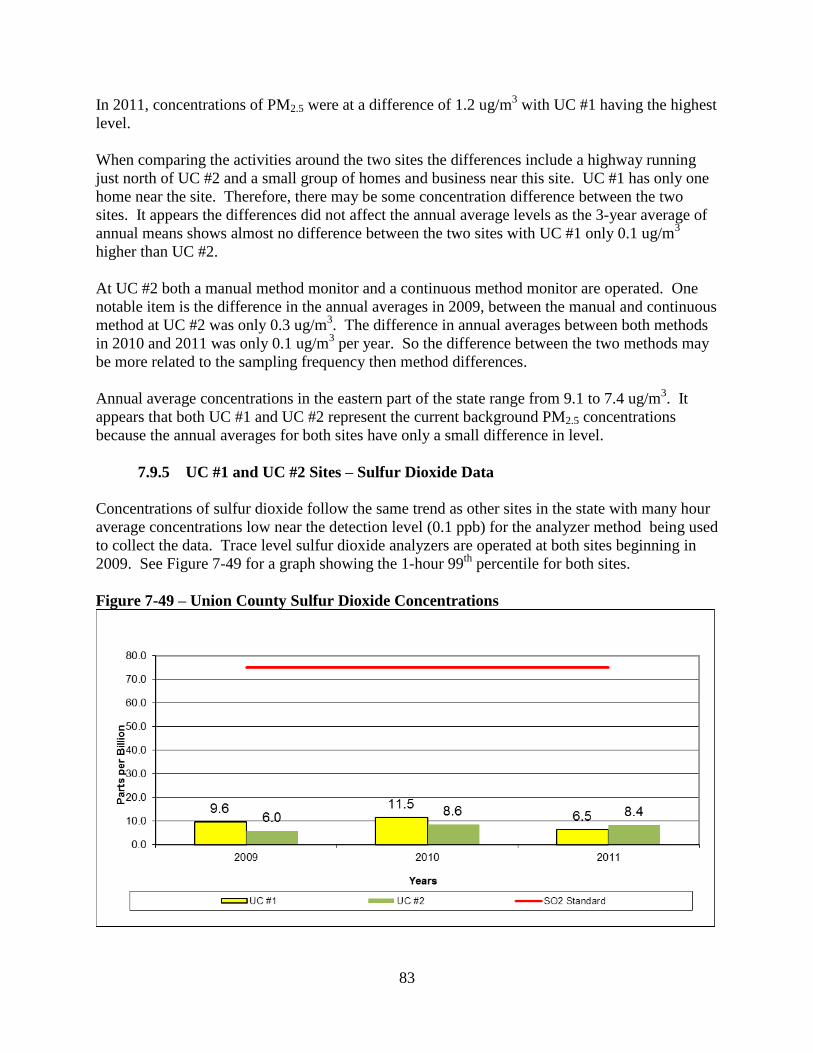
83
In 2011, concentrations of PM2.5 were at a difference of 1.2 ug/m3 with UC #1 having the highest
level.
When comparing the activities around the two sites the differences include a highway running
just north of UC #2 and a small group of homes and business near this site. UC #1 has only one
home near the site. Therefore, there may be some concentration difference between the two
sites. It appears the differences did not affect the annual average levels as the 3-year average of
annual means shows almost no difference between the two sites with UC #1 only 0.1 ug/m3
higher than UC #2.
At UC #2 both a manual method monitor and a continuous method monitor are operated. One
notable item is the difference in the annual averages in 2009, between the manual and continuous
method at UC #2 was only 0.3 ug/m3. The difference in annual averages between both methods
in 2010 and 2011 was only 0.1 ug/m3 per year. So the difference between the two methods may
be more related to the sampling frequency then method differences.
Annual average concentrations in the eastern part of the state range from 9.1 to 7.4 ug/m3. It
appears that both UC #1 and UC #2 represent the current background PM2.5 concentrations
because the annual averages for both sites have only a small difference in level.
7.9.5 UC #1 and UC #2 Sites – Sulfur Dioxide Data
Concentrations of sulfur dioxide follow the same trend as other sites in the state with many hour
average concentrations low near the detection level (0.1 ppb) for the analyzer method being used
to collect the data. Trace level sulfur dioxide analyzers are operated at both sites beginning in
2009. See Figure 7-49 for a graph showing the 1-hour 99th
percentile for both sites.
Figure 7-49 – Union County Sulfur Dioxide Concentrations
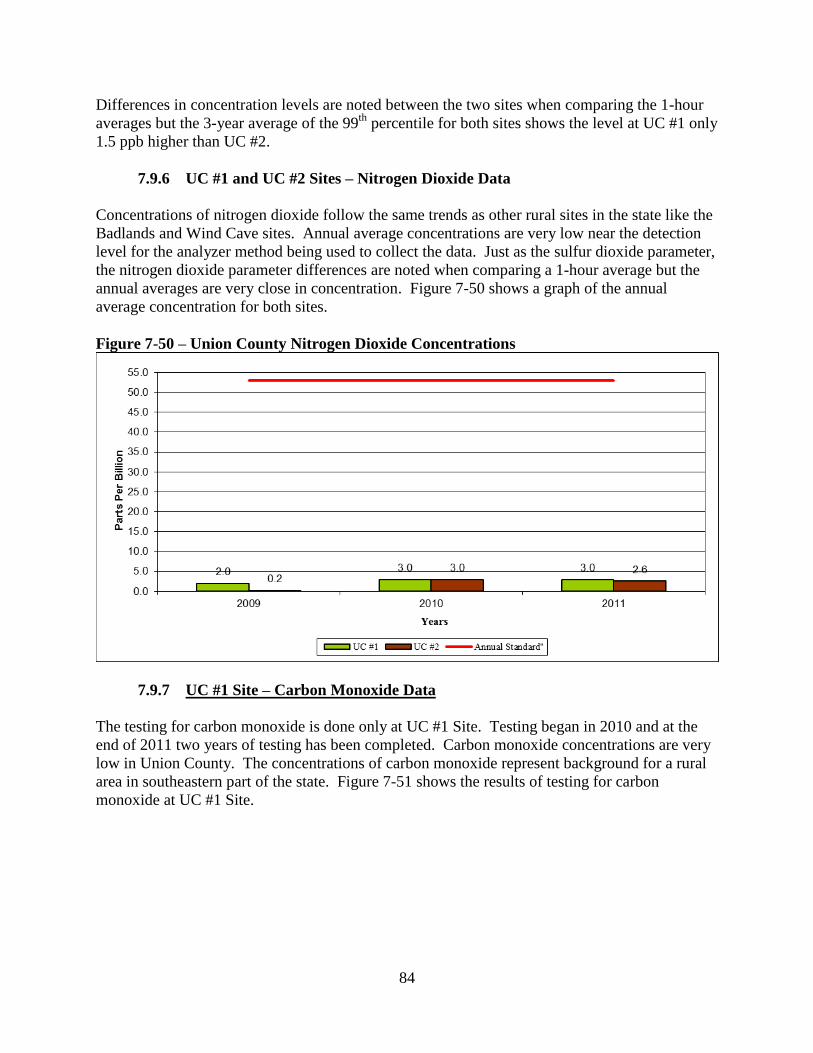
84
Differences in concentration levels are noted between the two sites when comparing the 1-hour
averages but the 3-year average of the 99th
percentile for both sites shows the level at UC #1 only
1.5 ppb higher than UC #2.
7.9.6 UC #1 and UC #2 Sites – Nitrogen Dioxide Data
Concentrations of nitrogen dioxide follow the same trends as other rural sites in the state like the
Badlands and Wind Cave sites. Annual average concentrations are very low near the detection
level for the analyzer method being used to collect the data. Just as the sulfur dioxide parameter,
the nitrogen dioxide parameter differences are noted when comparing a 1-hour average but the
annual averages are very close in concentration. Figure 7-50 shows a graph of the annual
average concentration for both sites.
Figure 7-50 – Union County Nitrogen Dioxide Concentrations
7.9.7 UC #1 Site – Carbon Monoxide Data
The testing for carbon monoxide is done only at UC #1 Site. Testing began in 2010 and at the
end of 2011 two years of testing has been completed. Carbon monoxide concentrations are very
low in Union County. The concentrations of carbon monoxide represent background for a rural
area in southeastern part of the state. Figure 7-51 shows the results of testing for carbon
monoxide at UC #1 Site.
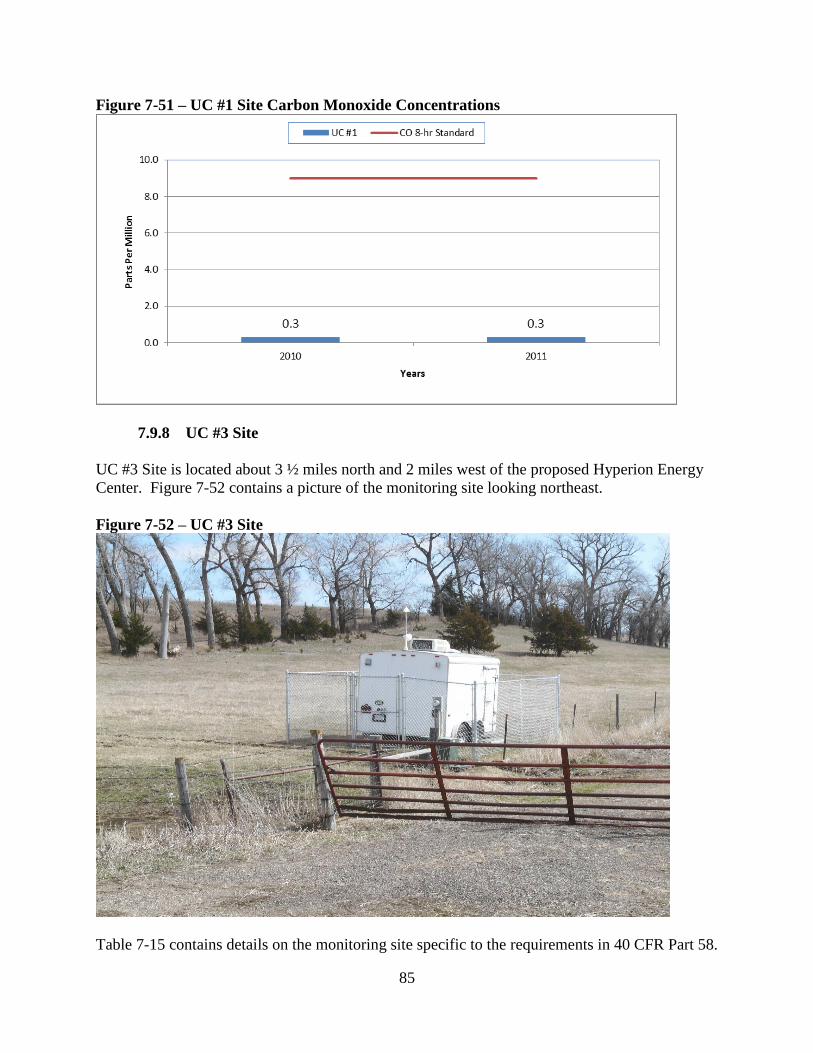
85
Figure 7-51 – UC #1 Site Carbon Monoxide Concentrations
7.9.8 UC #3 Site
UC #3 Site is located about 3 ½ miles north and 2 miles west of the proposed Hyperion Energy
Center. Figure 7-52 contains a picture of the monitoring site looking northeast.
Figure 7-52 – UC #3 Site
Table 7-15 contains details on the monitoring site specific to the requirements in 40 CFR Part 58.
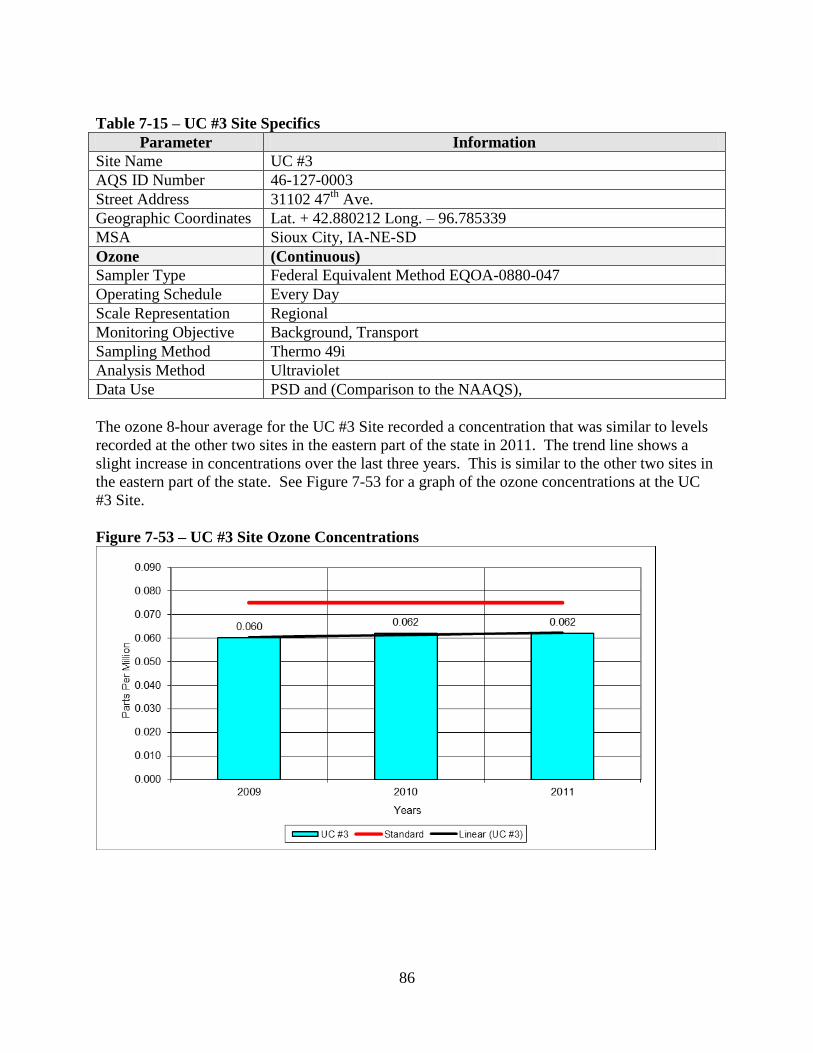
86
Table 7-15 – UC #3 Site Specifics
Parameter Information
Site Name UC #3
AQS ID Number 46-127-0003
Street Address 31102 47th
Ave.
Geographic Coordinates Lat. + 42.880212 Long. – 96.785339
MSA Sioux City, IA-NE-SD
Ozone (Continuous)
Sampler Type Federal Equivalent Method EQOA-0880-047
Operating Schedule Every Day
Scale Representation Regional
Monitoring Objective Background, Transport
Sampling Method Thermo 49i
Analysis Method Ultraviolet
Data Use PSD and (Comparison to the NAAQS),
The ozone 8-hour average for the UC #3 Site recorded a concentration that was similar to levels
recorded at the other two sites in the eastern part of the state in 2011. The trend line shows a
slight increase in concentrations over the last three years. This is similar to the other two sites in
the eastern part of the state. See Figure 7-53 for a graph of the ozone concentrations at the UC
#3 Site.
Figure 7-53 – UC #3 Site Ozone Concentrations
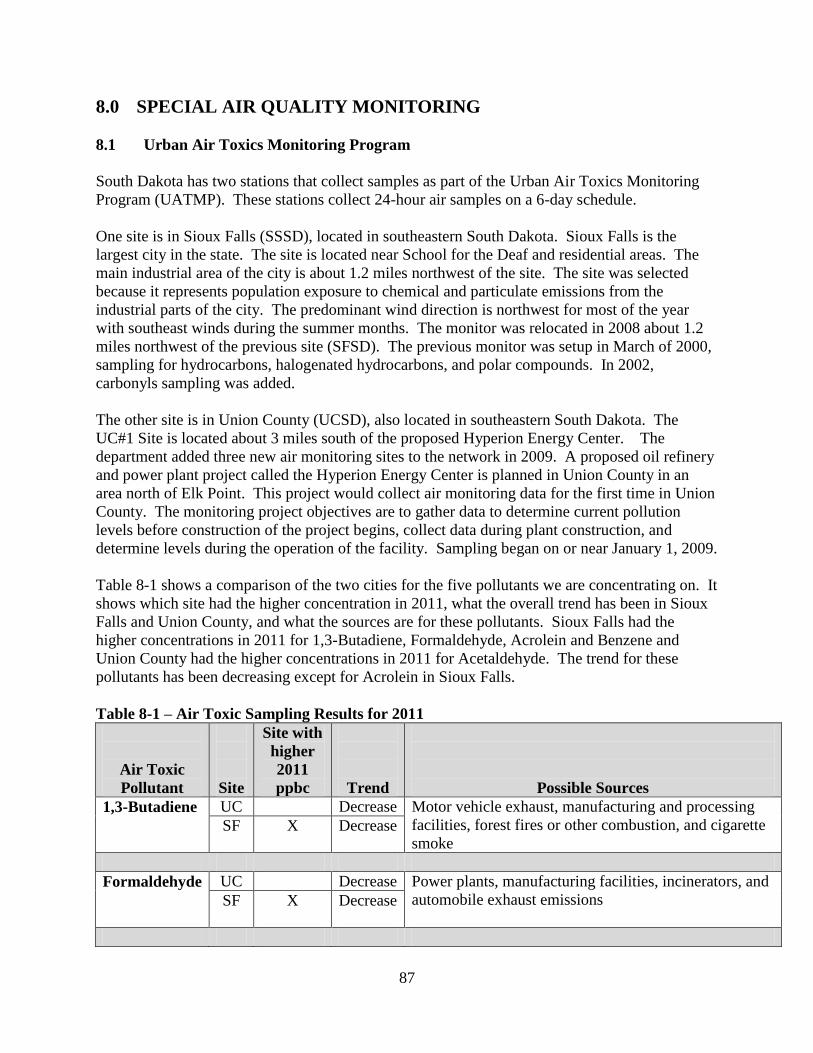
87
8.0 SPECIAL AIR QUALITY MONITORING
8.1 Urban Air Toxics Monitoring Program
South Dakota has two stations that collect samples as part of the Urban Air Toxics Monitoring
Program (UATMP). These stations collect 24-hour air samples on a 6-day schedule.
One site is in Sioux Falls (SSSD), located in southeastern South Dakota. Sioux Falls is the
largest city in the state. The site is located near School for the Deaf and residential areas. The
main industrial area of the city is about 1.2 miles northwest of the site. The site was selected
because it represents population exposure to chemical and particulate emissions from the
industrial parts of the city. The predominant wind direction is northwest for most of the year
with southeast winds during the summer months. The monitor was relocated in 2008 about 1.2
miles northwest of the previous site (SFSD). The previous monitor was setup in March of 2000,
sampling for hydrocarbons, halogenated hydrocarbons, and polar compounds. In 2002,
carbonyls sampling was added.
The other site is in Union County (UCSD), also located in southeastern South Dakota. The
UC#1 Site is located about 3 miles south of the proposed Hyperion Energy Center. The
department added three new air monitoring sites to the network in 2009. A proposed oil refinery
and power plant project called the Hyperion Energy Center is planned in Union County in an
area north of Elk Point. This project would collect air monitoring data for the first time in Union
County. The monitoring project objectives are to gather data to determine current pollution
levels before construction of the project begins, collect data during plant construction, and
determine levels during the operation of the facility. Sampling began on or near January 1, 2009.
Table 8-1 shows a comparison of the two cities for the five pollutants we are concentrating on. It
shows which site had the higher concentration in 2011, what the overall trend has been in Sioux
Falls and Union County, and what the sources are for these pollutants. Sioux Falls had the
higher concentrations in 2011 for 1,3-Butadiene, Formaldehyde, Acrolein and Benzene and
Union County had the higher concentrations in 2011 for Acetaldehyde. The trend for these
pollutants has been decreasing except for Acrolein in Sioux Falls.
Table 8-1 – Air Toxic Sampling Results for 2011
Air Toxic
Pollutant
Site
Site with
higher
2011
ppbc
Trend
Possible Sources
1,3-Butadiene UC Decrease Motor vehicle exhaust, manufacturing and processing
facilities, forest fires or other combustion, and cigarette
smoke SF X Decrease
Formaldehyde UC Decrease Power plants, manufacturing facilities, incinerators, and
automobile exhaust emissions
SF X Decrease
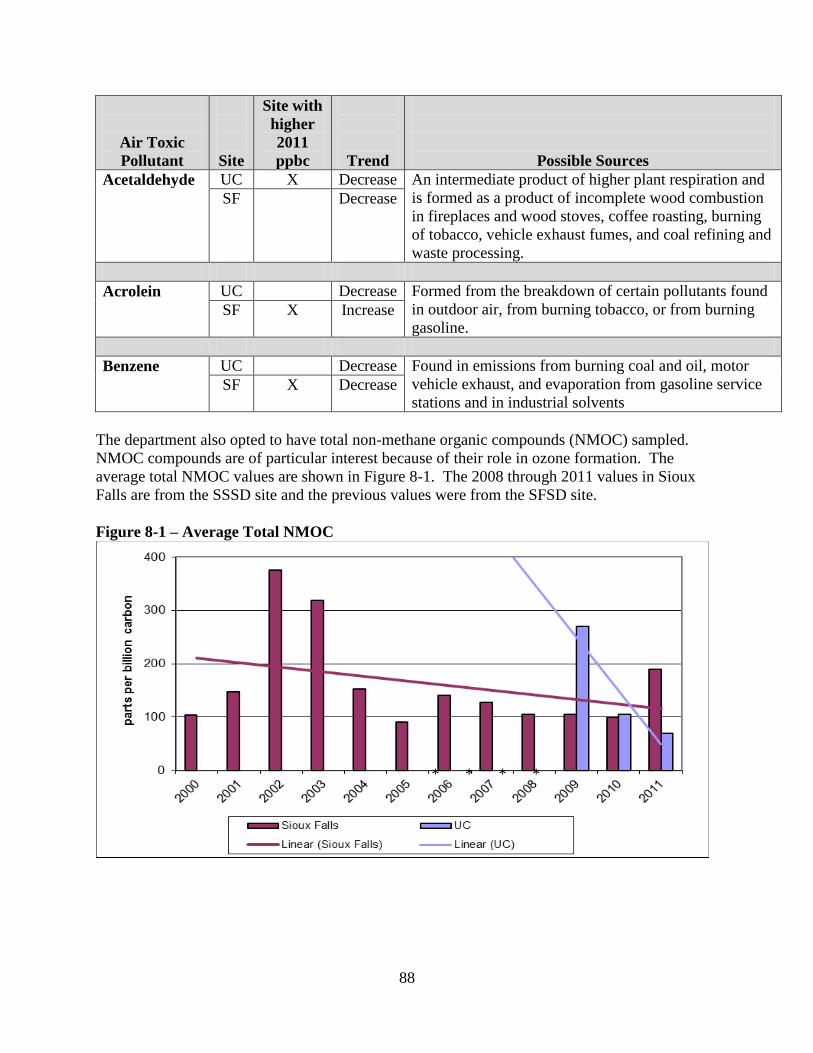
88
Air Toxic
Pollutant
Site
Site with
higher
2011
ppbc
Trend
Possible Sources
Acetaldehyde UC X Decrease An intermediate product of higher plant respiration and
is formed as a product of incomplete wood combustion
in fireplaces and wood stoves, coffee roasting, burning
of tobacco, vehicle exhaust fumes, and coal refining and
waste processing.
SF Decrease
Acrolein UC Decrease Formed from the breakdown of certain pollutants found
in outdoor air, from burning tobacco, or from burning
gasoline. SF X Increase
Benzene UC Decrease Found in emissions from burning coal and oil, motor
vehicle exhaust, and evaporation from gasoline service
stations and in industrial solvents SF X Decrease
The department also opted to have total non-methane organic compounds (NMOC) sampled.
NMOC compounds are of particular interest because of their role in ozone formation. The
average total NMOC values are shown in Figure 8-1. The 2008 through 2011 values in Sioux
Falls are from the SSSD site and the previous values were from the SFSD site.
Figure 8-1 – Average Total NMOC
* * * *
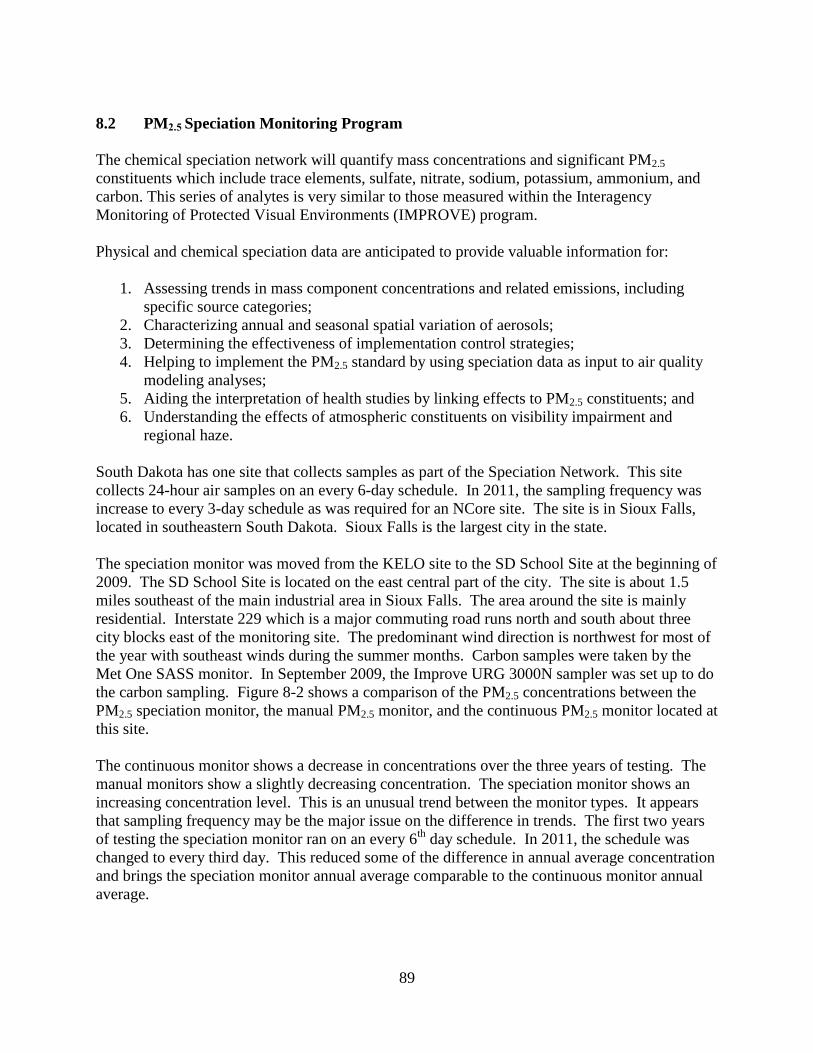
89
8.2 PM2.5 Speciation Monitoring Program
The chemical speciation network will quantify mass concentrations and significant PM2.5
constituents which include trace elements, sulfate, nitrate, sodium, potassium, ammonium, and
carbon. This series of analytes is very similar to those measured within the Interagency
Monitoring of Protected Visual Environments (IMPROVE) program.
Physical and chemical speciation data are anticipated to provide valuable information for:
1. Assessing trends in mass component concentrations and related emissions, including
specific source categories;
2. Characterizing annual and seasonal spatial variation of aerosols;
3. Determining the effectiveness of implementation control strategies;
4. Helping to implement the PM2.5 standard by using speciation data as input to air quality
modeling analyses;
5. Aiding the interpretation of health studies by linking effects to PM2.5 constituents; and
6. Understanding the effects of atmospheric constituents on visibility impairment and
regional haze.
South Dakota has one site that collects samples as part of the Speciation Network. This site
collects 24-hour air samples on an every 6-day schedule. In 2011, the sampling frequency was
increase to every 3-day schedule as was required for an NCore site. The site is in Sioux Falls,
located in southeastern South Dakota. Sioux Falls is the largest city in the state.
The speciation monitor was moved from the KELO site to the SD School Site at the beginning of
2009. The SD School Site is located on the east central part of the city. The site is about 1.5
miles southeast of the main industrial area in Sioux Falls. The area around the site is mainly
residential. Interstate 229 which is a major commuting road runs north and south about three
city blocks east of the monitoring site. The predominant wind direction is northwest for most of
the year with southeast winds during the summer months. Carbon samples were taken by the
Met One SASS monitor. In September 2009, the Improve URG 3000N sampler was set up to do
the carbon sampling. Figure 8-2 shows a comparison of the PM2.5 concentrations between the
PM2.5 speciation monitor, the manual PM2.5 monitor, and the continuous PM2.5 monitor located at
this site.
The continuous monitor shows a decrease in concentrations over the three years of testing. The
manual monitors show a slightly decreasing concentration. The speciation monitor shows an
increasing concentration level. This is an unusual trend between the monitor types. It appears
that sampling frequency may be the major issue on the difference in trends. The first two years
of testing the speciation monitor ran on an every 6th
day schedule. In 2011, the schedule was
changed to every third day. This reduced some of the difference in annual average concentration
and brings the speciation monitor annual average comparable to the continuous monitor annual
average.
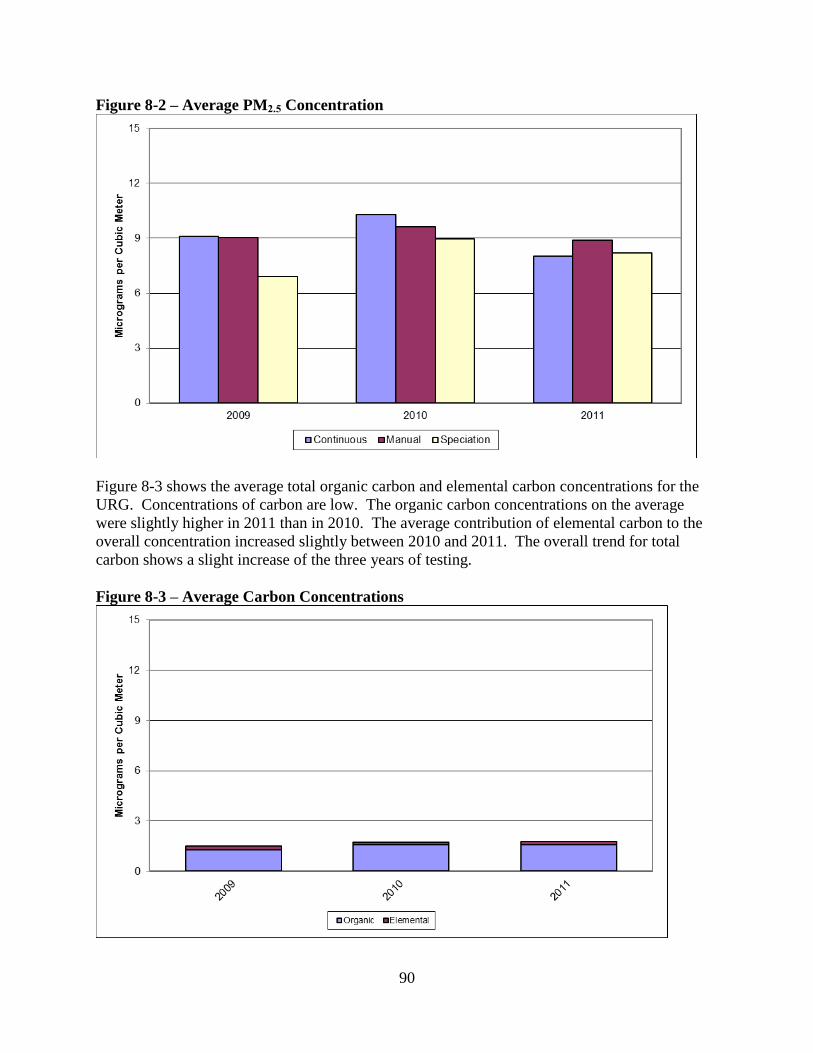
90
Figure 8-2 – Average PM2.5 Concentration
Figure 8-3 shows the average total organic carbon and elemental carbon concentrations for the
URG. Concentrations of carbon are low. The organic carbon concentrations on the average
were slightly higher in 2011 than in 2010. The average contribution of elemental carbon to the
overall concentration increased slightly between 2010 and 2011. The overall trend for total
carbon shows a slight increase of the three years of testing.
Figure 8-3 – Average Carbon Concentrations
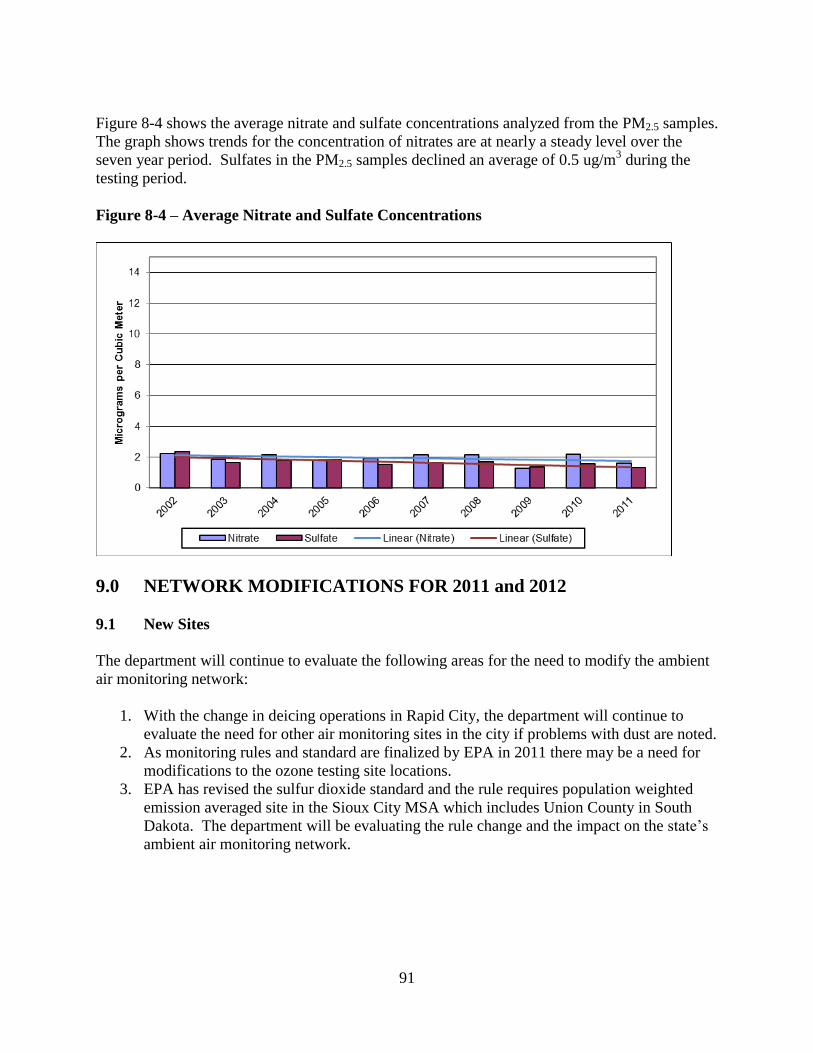
91
Figure 8-4 shows the average nitrate and sulfate concentrations analyzed from the PM2.5 samples.
The graph shows trends for the concentration of nitrates are at nearly a steady level over the
seven year period. Sulfates in the PM2.5 samples declined an average of 0.5 ug/m3 during the
testing period.
Figure 8-4 – Average Nitrate and Sulfate Concentrations
9.0 NETWORK MODIFICATIONS FOR 2011 and 2012
9.1 New Sites
The department will continue to evaluate the following areas for the need to modify the ambient
air monitoring network:
1. With the change in deicing operations in Rapid City, the department will continue to
evaluate the need for other air monitoring sites in the city if problems with dust are noted.
2. As monitoring rules and standard are finalized by EPA in 2011 there may be a need for
modifications to the ozone testing site locations.
3. EPA has revised the sulfur dioxide standard and the rule requires population weighted
emission averaged site in the Sioux City MSA which includes Union County in South
Dakota. The department will be evaluating the rule change and the impact on the state’s
ambient air monitoring network.
92
9.2 Modifications
The department is planning the following site modifications:
1. Replacement of the RAAS PM2.5 manual method monitors with Partisol 2000 PM2.5
manual method monitors continues. The RAAS PM2.5 manual method monitors,
purchase in 1997 to 2000, have been discontinued by the manufacturer and replacement
parts are no longer available. Rapid City Library Site is the last site to operate the RAAS
PM2.5 monitors and they will be replaced by the middle of 2012; and
2. The department will continue to evaluate locations were continuous PM monitors can
replace manual monitors in the network.
9.3 Sites Closed
The department will evaluate the need to close UC #3 and move the ozone analyzer to UC #2
or UC #1. The shelter at UC #3 is in poor condition which has allowed water and mice into
the building destroying the insulation and making the building a health threat.
10.0 REQUEST FOR WAIVER
There were no sampling frequency waivers requested for the 2011 sampling year and none are
proposed for 2012.
11.0 CONCLUSIONS
The ambient air quality monitoring network has demonstrated or is in the process of
demonstrating that South Dakota is attaining the federal NAAQS. The Air Quality Program is
working to ensure that any changes in the air quality of the state are reviewed for possible health
effects to the public. The ambient air quality monitoring network is continually reviewed to
ensure that there is adequate coverage of populated areas in the state. As the state’s population
and industry changes, monitoring sites will be added or moved to new locations.
There is an ongoing effort to maintain staff training regarding the latest monitoring techniques
and procedures to perform these studies. It is anticipated that the ambient air monitoring
network will operate in much the same manner as it has in the past. This will include the
identification of pollution problems, measurement and evaluation of the extent of the problem,
and determination of action to be taken to protect the environment and the health of the people of
South Dakota.
93
12.0 REFERENCES
1 Environmental Protection Agency, May 1977. Quality Assurance Handbook for Air
Pollution Measurement Systems Volume II, Ambient Air Specific Methods (as
amended), EPA-600/4-77-027a, Office of Air Quality Planning and Standards, Research
Triangle Park, N.C.;
2 Environmental Protection Agency, January 2003. Title 40 Code of Federal Regulation,
Parts 50 and 58 (as amended), United States Government Printing Office, Superintendent
of Documents, Washington, D.C.; and
3 Environmental Protection Agency, March 1998. SLAMS / NAMS / PAMS Network
Review Guidance, EPA-454/R-98-003, Office of Air Quality Planning and Standards,
Research Triangle Park, N.C.