Embed Size (px)
Citation preview
Estuary Environments Spring 2013
Cindy Ricks Myers
Curry Watersheds Partnership
Water
Quality
Water Quality
Water Uses
Water Quality Parameters
Aquatic Life Requirements
Measurement and Standards
Demonstrations
Sampling Objectives & Design
Clean Water Act Framework
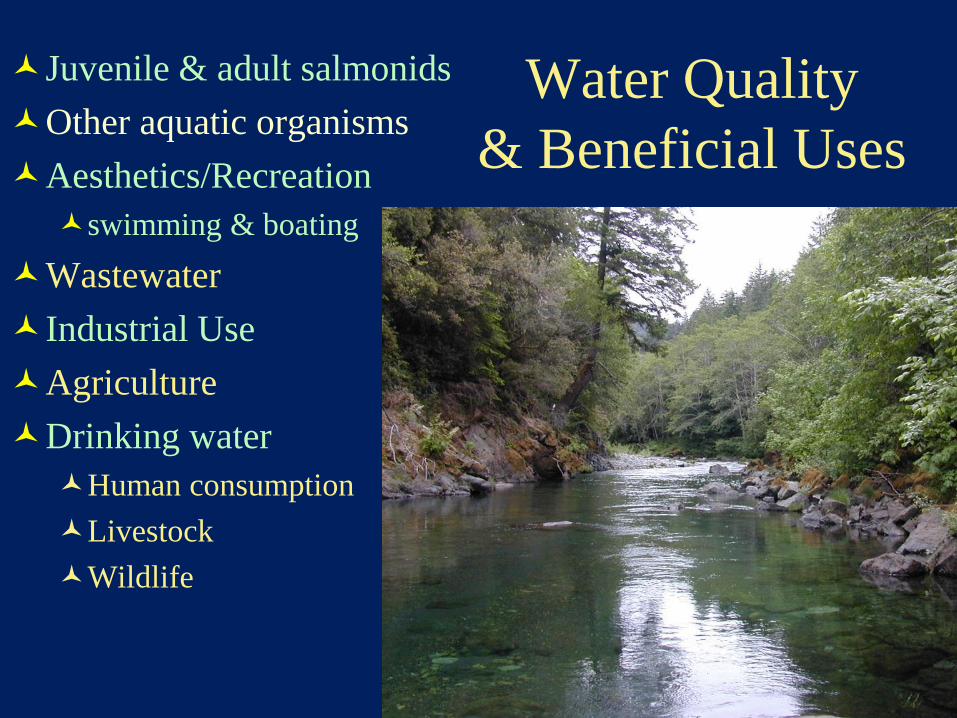
Water Quality
& Beneficial Uses
Juvenile & adult salmonids
Other aquatic organisms
Aesthetics/Recreation
swimming & boating
Wastewater
Industrial Use
Agriculture
Drinking water
Human consumption
Livestock
Wildlife

Water quality monitoring is
like…
being a veterinarian
interviewing a rebellious teenager
solving a puzzle with missing
pieces
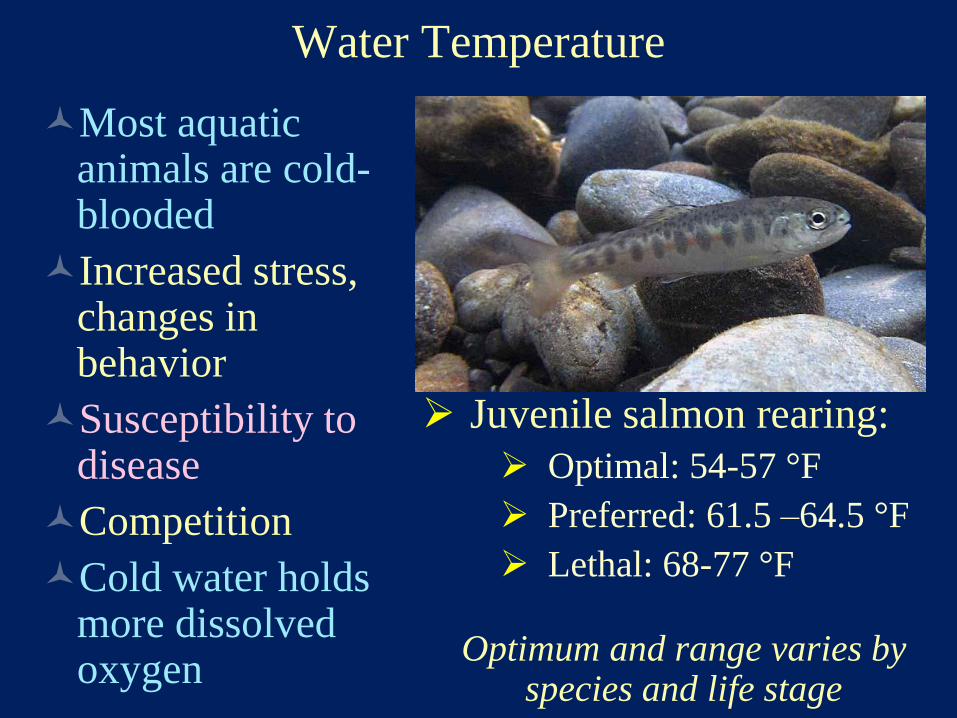
Water Temperature
Most aquatic animals are cold-blooded
Increased stress, changes in behavior
Susceptibility to disease
Competition
Cold water holds more dissolved oxygen
Juvenile salmon rearing:
Optimal: 54-57 °F
Preferred: 61.5 –64.5 °F
Lethal: 68-77 °F
Optimum and range varies by species and life stage
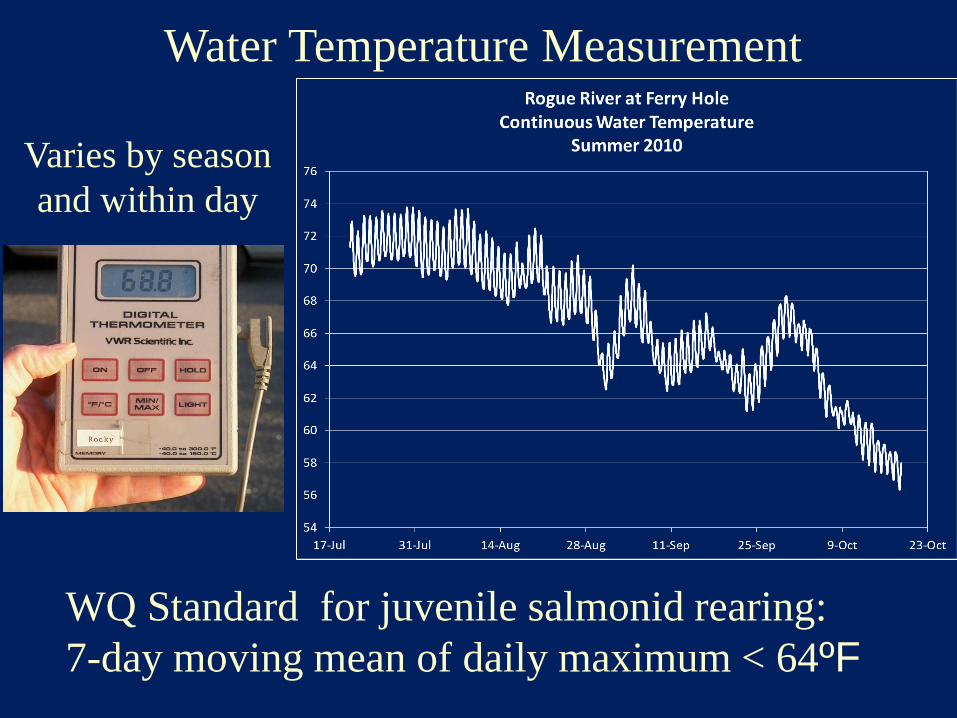
Varies by season
and within day
Water Temperature Measurement
WQ Standard for juvenile salmonid rearing:
7-day moving mean of daily maximum < 64ºF
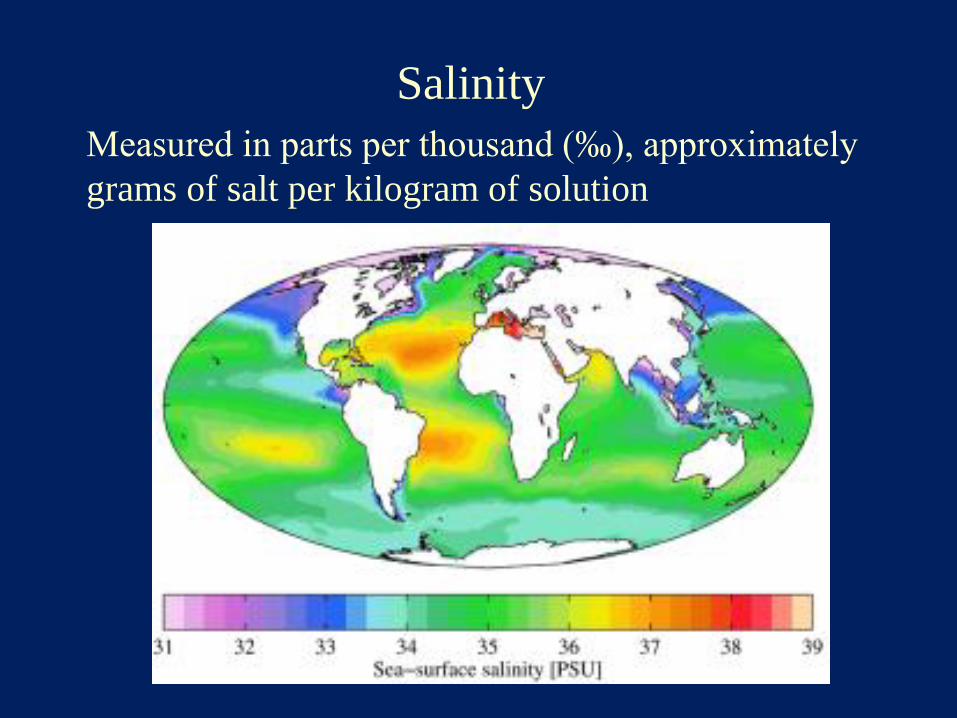
Salinity
Measured in parts per thousand (‰), approximately
grams of salt per kilogram of solution
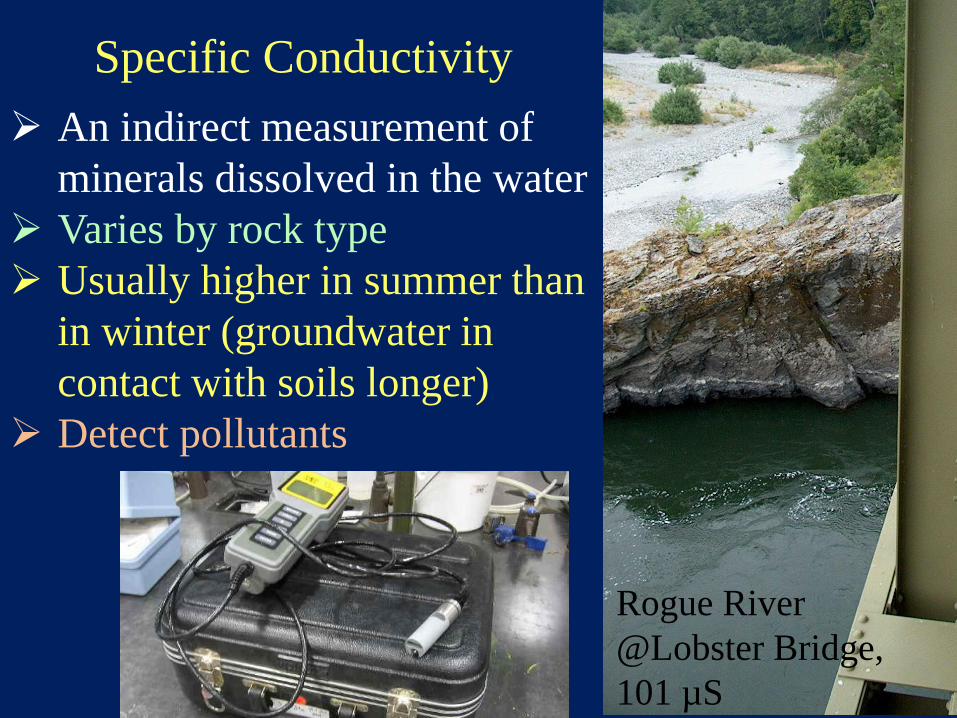
Specific Conductivity
An indirect measurement of
minerals dissolved in the water
Varies by rock type
Usually higher in summer than
in winter (groundwater in
contact with soils longer)
Detect pollutants
Rogue River
@Lobster Bridge,
101 µS
Demonstrations
1) Measure specific conductivity on water
samples leached from Rogue sandy
sediments, collected upstream and
downstream of the influence of salinity.
Which is upstream and which is downstream?
2) Simulate the ocean water wedge moving
upstream at high tide by introducing cold salt
water to one end of the “estuary.” Does the
meter detect the salt at the same time we see it
arrive?
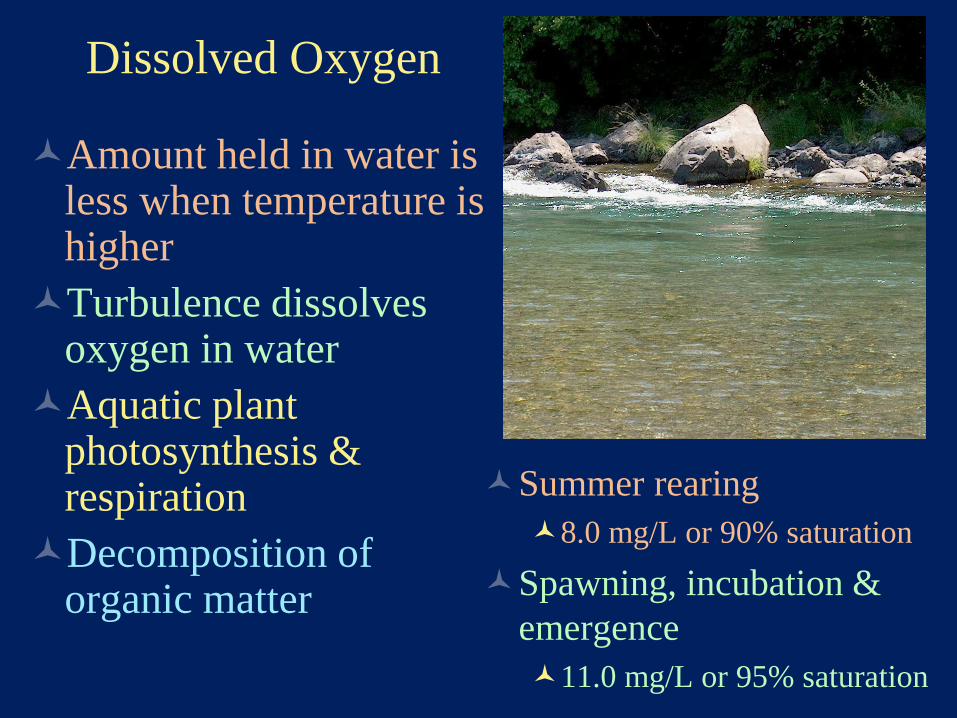
Dissolved Oxygen
Amount held in water is less when temperature is higher
Turbulence dissolves oxygen in water
Aquatic plant photosynthesis & respiration
Decomposition of organic matter
Summer rearing
8.0 mg/L or 90% saturation
Spawning, incubation &
emergence
11.0 mg/L or 95% saturation
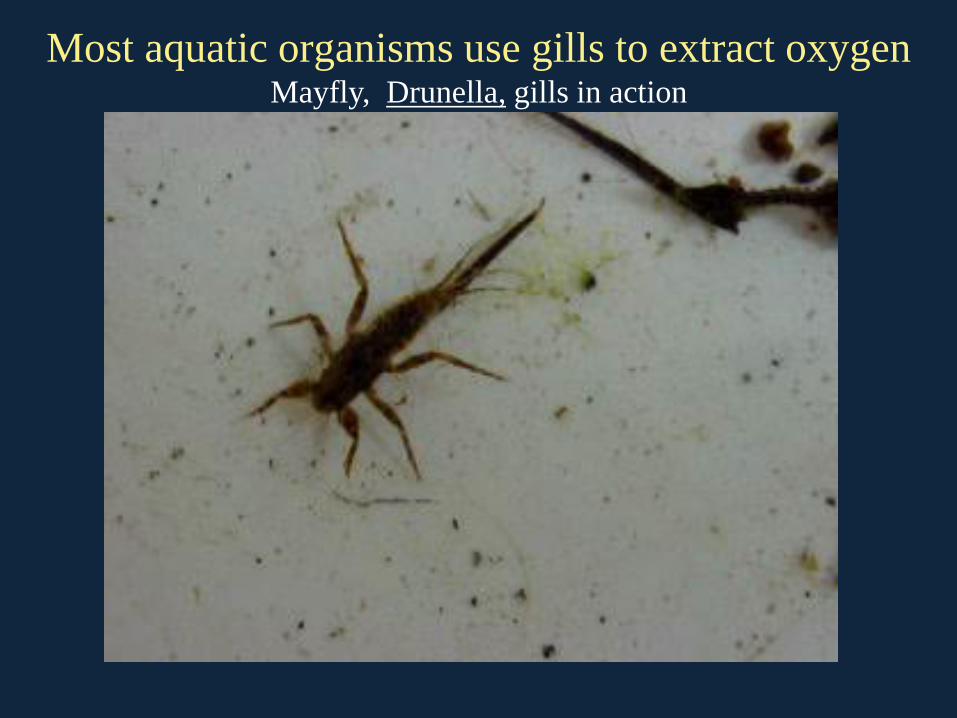
Most aquatic organisms use gills to extract oxygen Mayfly, Drunella, gills in action
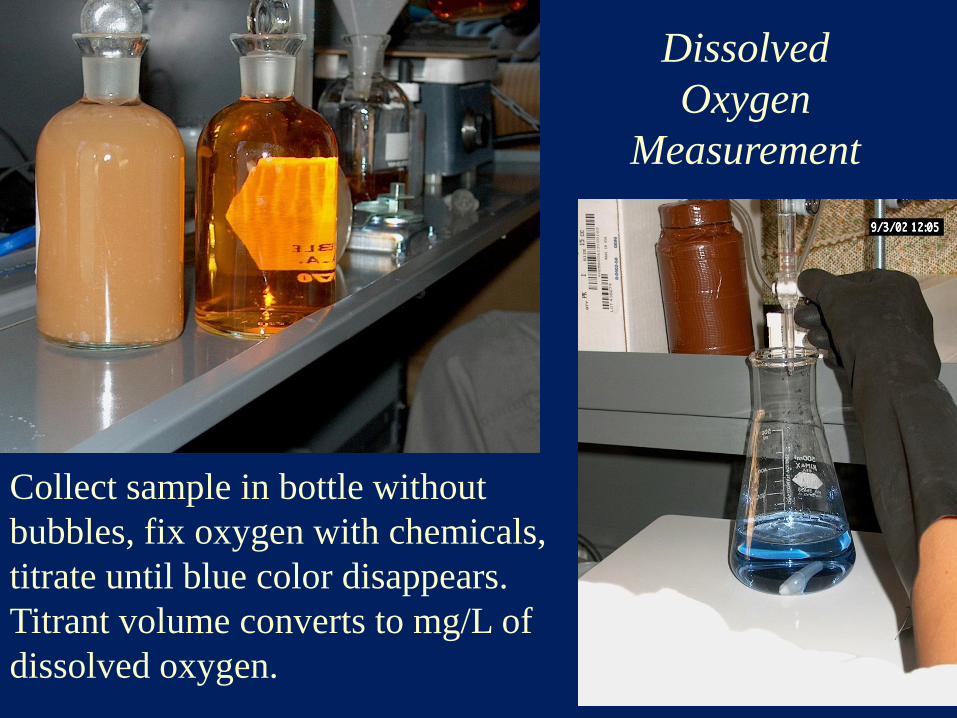
Dissolved
Oxygen
Measurement
Collect sample in bottle without
bubbles, fix oxygen with chemicals,
titrate until blue color disappears.
Titrant volume converts to mg/L of
dissolved oxygen.
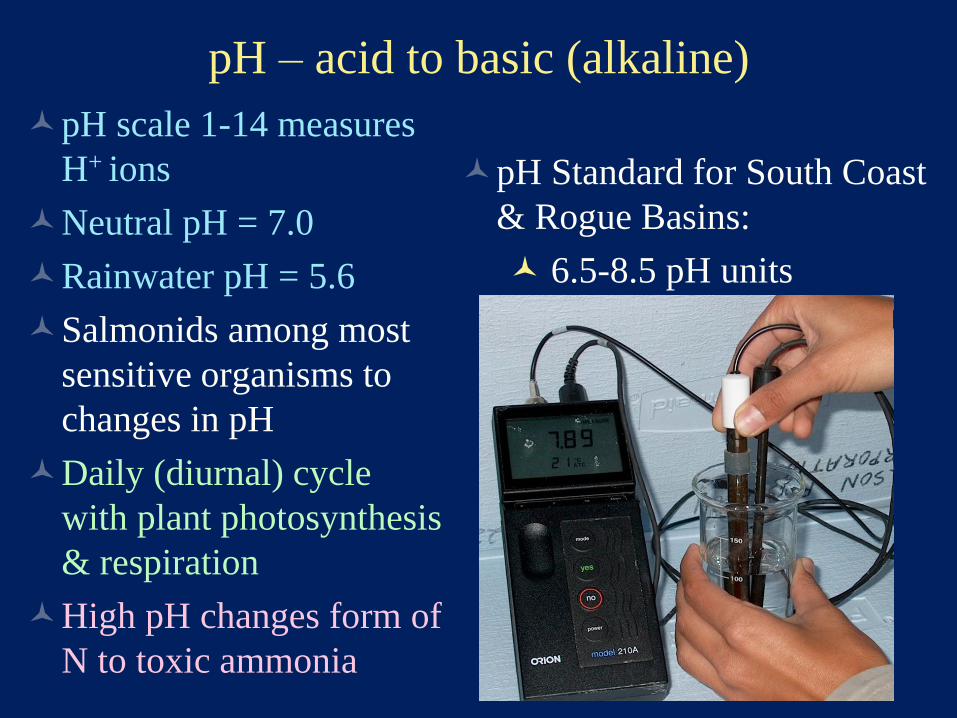
pH – acid to basic (alkaline)
pH scale 1-14 measures
H+ ions
Neutral pH = 7.0
Rainwater pH = 5.6
Salmonids among most
sensitive organisms to
changes in pH
Daily (diurnal) cycle
with plant photosynthesis
& respiration
High pH changes form of
N to toxic ammonia
pH Standard for South Coast
& Rogue Basins:
6.5-8.5 pH units
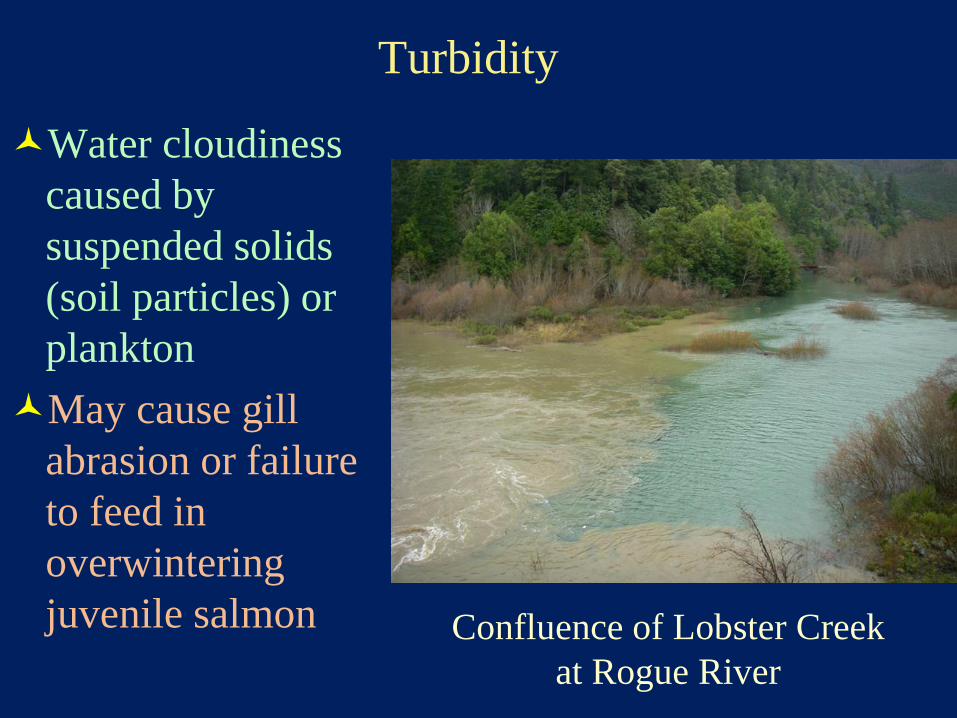
Turbidity
Water cloudiness
caused by
suspended solids
(soil particles) or
plankton
May cause gill
abrasion or failure
to feed in
overwintering
juvenile salmon
Confluence of Lobster Creek
at Rogue River
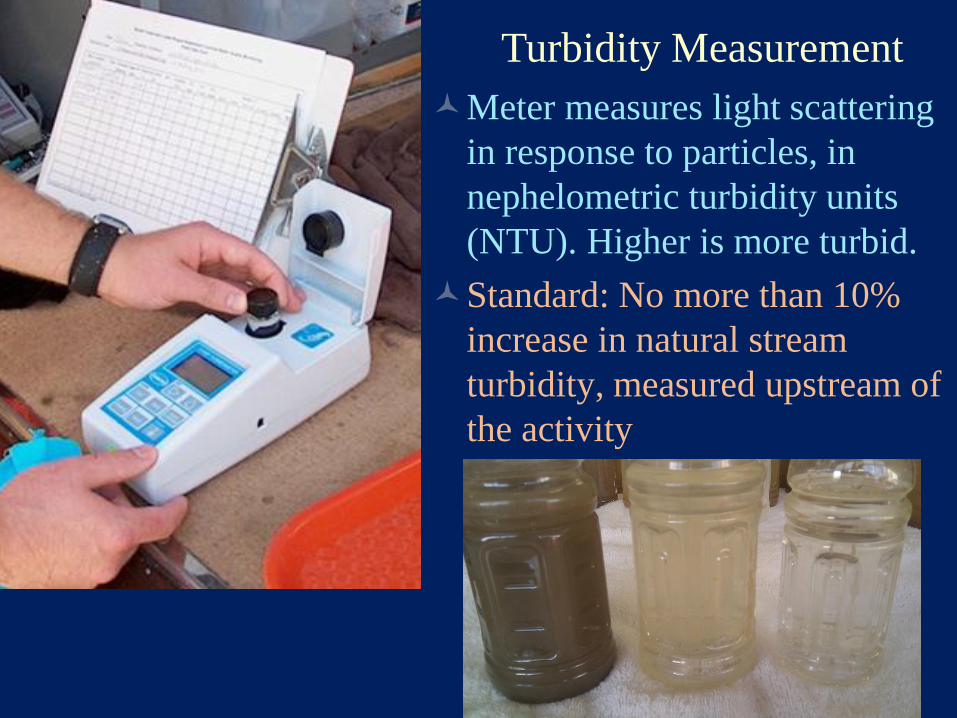
Meter measures light scattering
in response to particles, in
nephelometric turbidity units
(NTU). Higher is more turbid.
Standard: No more than 10%
increase in natural stream
turbidity, measured upstream of
the activity
Turbidity Measurement
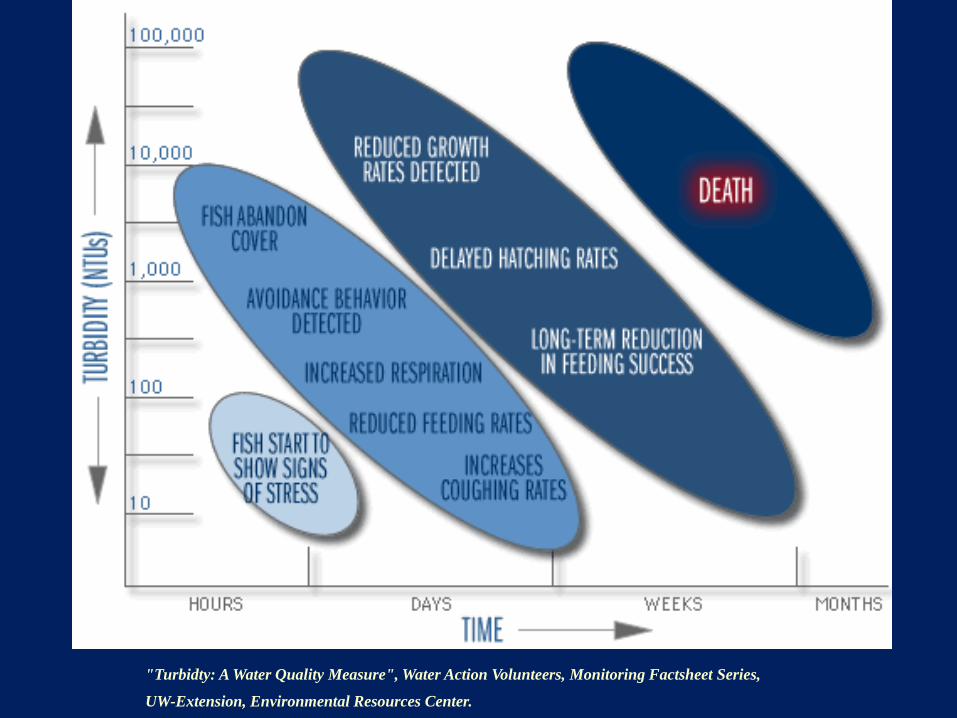
"Turbidty: A Water Quality Measure", Water Action Volunteers, Monitoring Factsheet Series,
UW-Extension, Environmental Resources Center.
Demonstrations (continued)
3) Test turbidity on the Rogue samples. Guess the
turbidity of the water in the container after adding
1 teaspoon of soil.
Assume it will settle until the end of class.
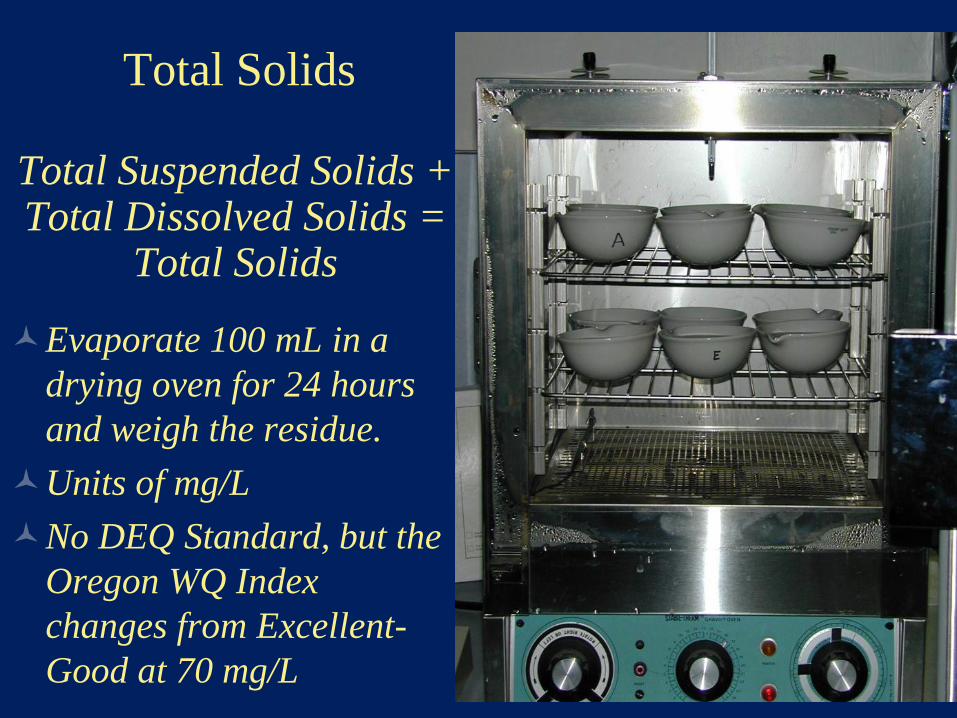
Total Solids
Total Suspended Solids + Total Dissolved Solids =
Total Solids
Evaporate 100 mL in a
drying oven for 24 hours
and weigh the residue.
Units of mg/L
No DEQ Standard, but the
Oregon WQ Index
changes from Excellent-
Good at 70 mg/L
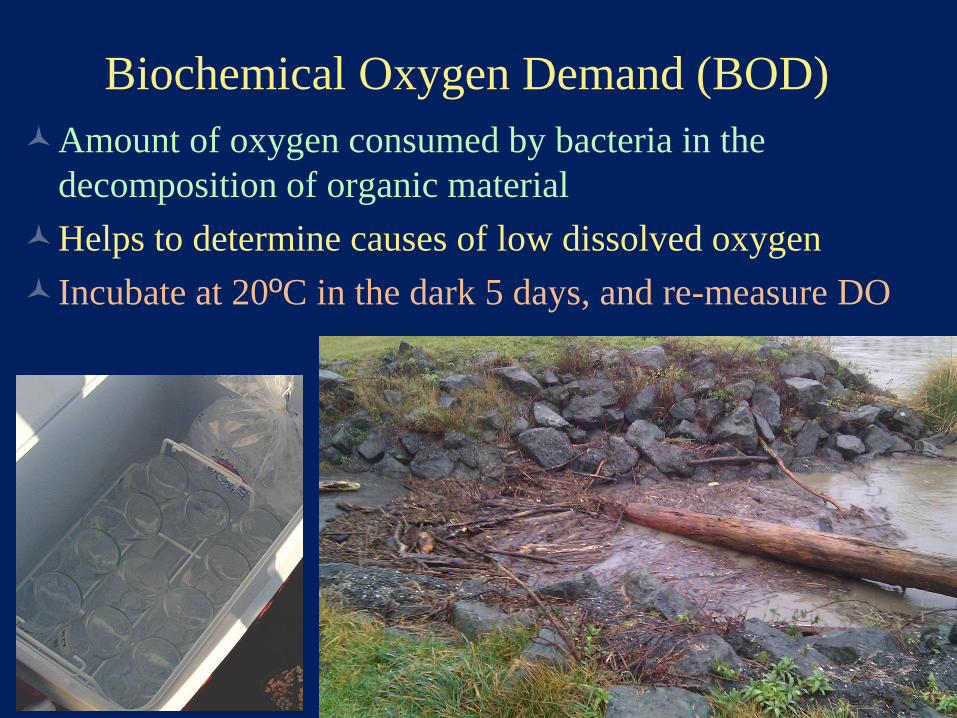
Biochemical Oxygen Demand (BOD)
Amount of oxygen consumed by bacteria in the
decomposition of organic material
Helps to determine causes of low dissolved oxygen
Incubate at 20ºC in the dark 5 days, and re-measure DO
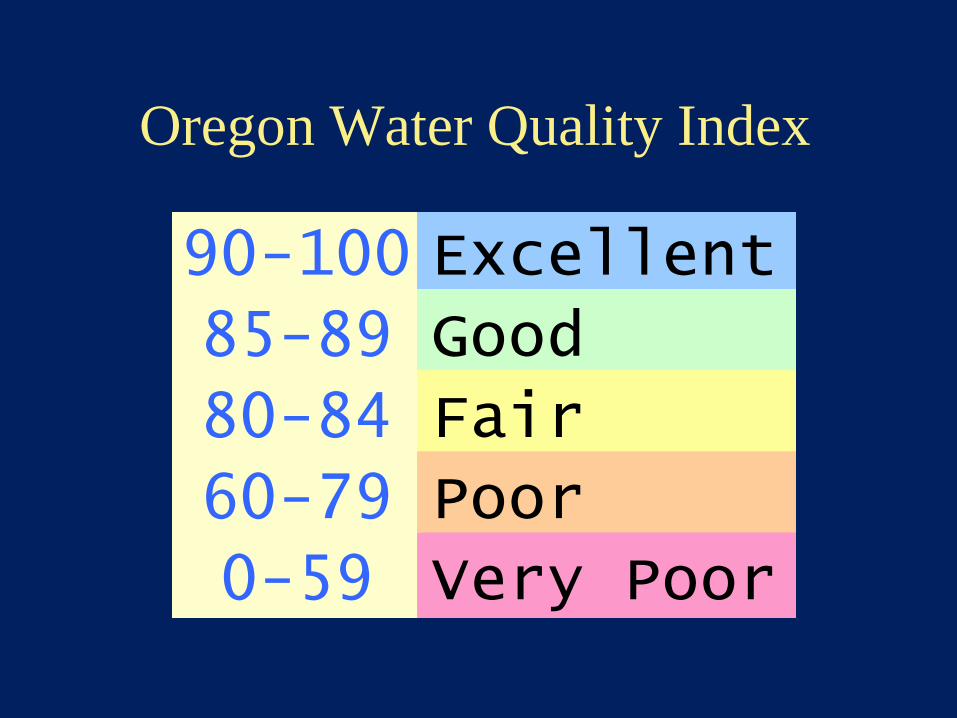
90-100 Excellent
85-89 Good
80-84 Fair
60-79 Poor
0-59 Very Poor
Oregon Water Quality Index
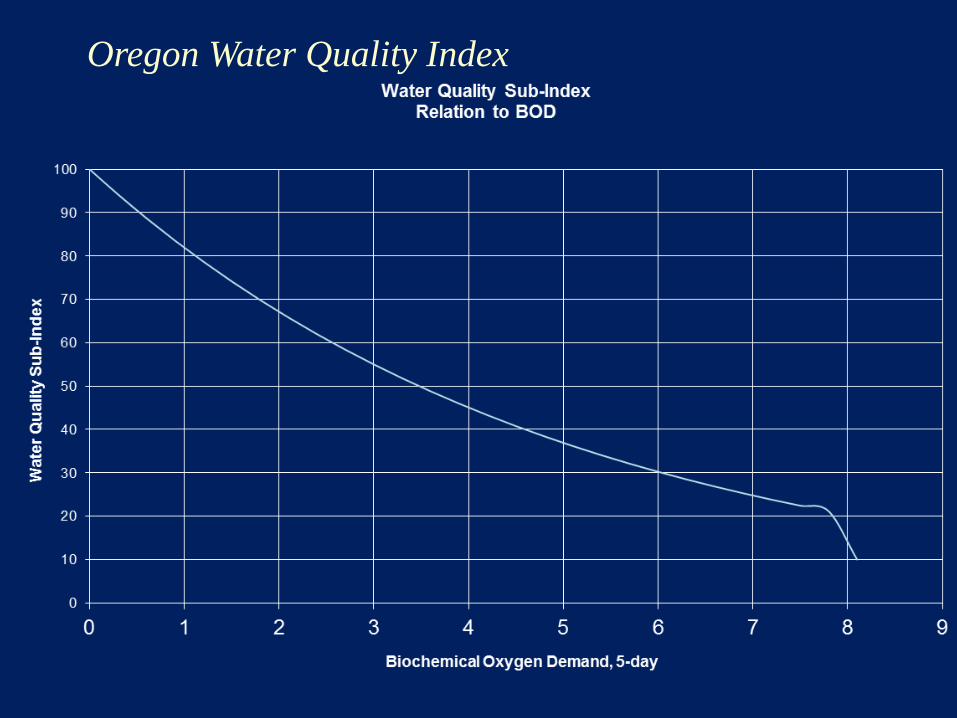
Oregon Water Quality Index
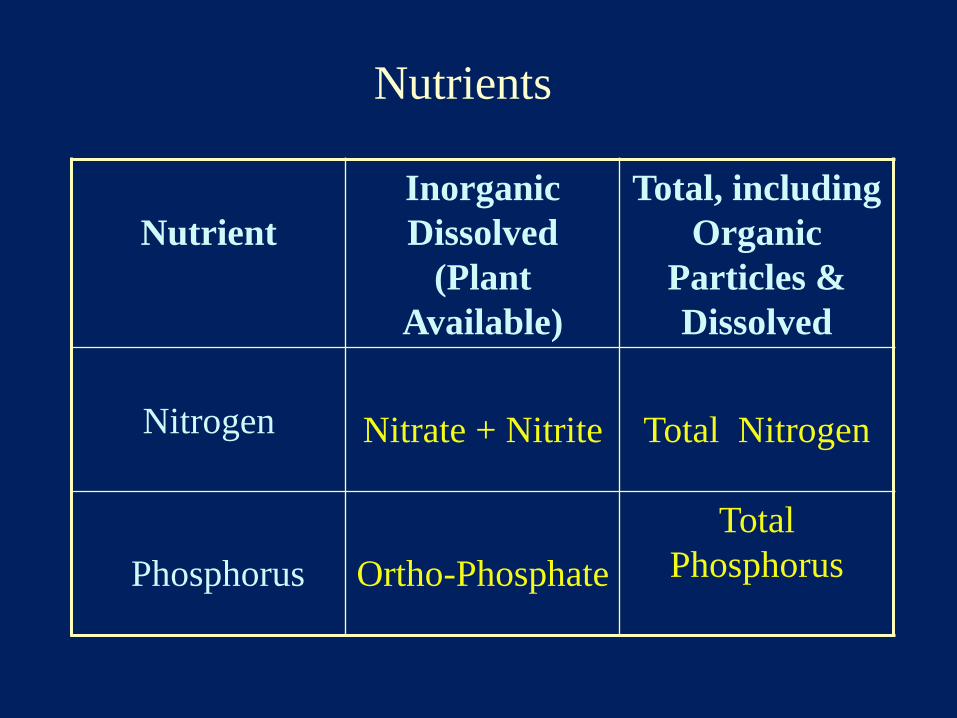
Nutrient
Inorganic
Dissolved
(Plant
Available)
Total, including
Organic
Particles &
Dissolved
Nitrogen
Nitrate + Nitrite
Total Nitrogen
Phosphorus
Ortho-Phosphate
Total
Phosphorus
Nutrients
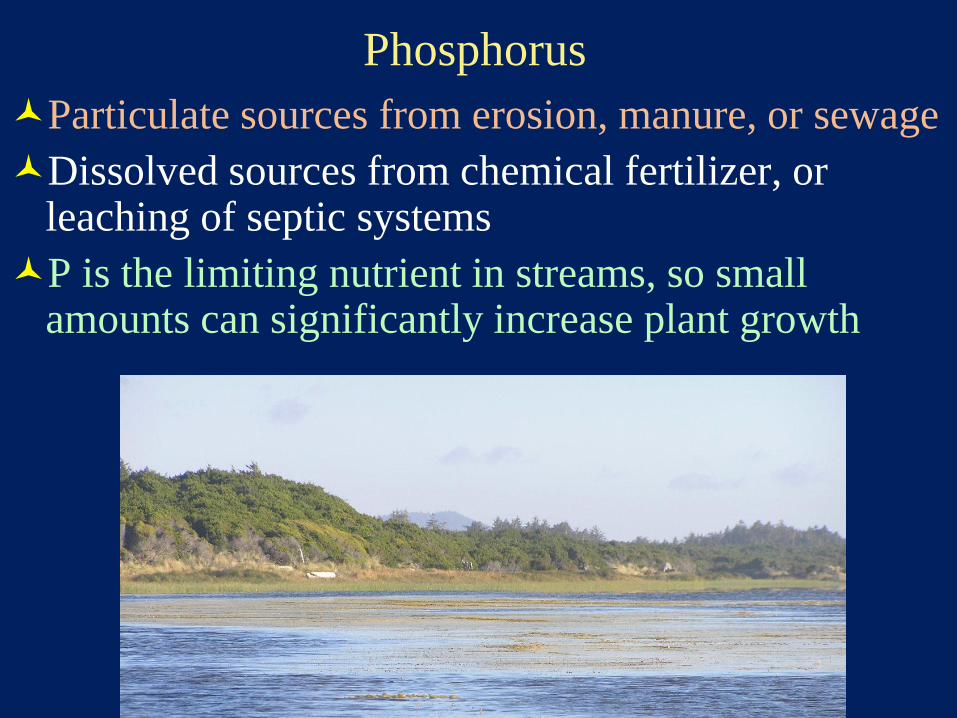
Phosphorus
Particulate sources from erosion, manure, or sewage
Dissolved sources from chemical fertilizer, or leaching of septic systems
P is the limiting nutrient in streams, so small amounts can significantly increase plant growth
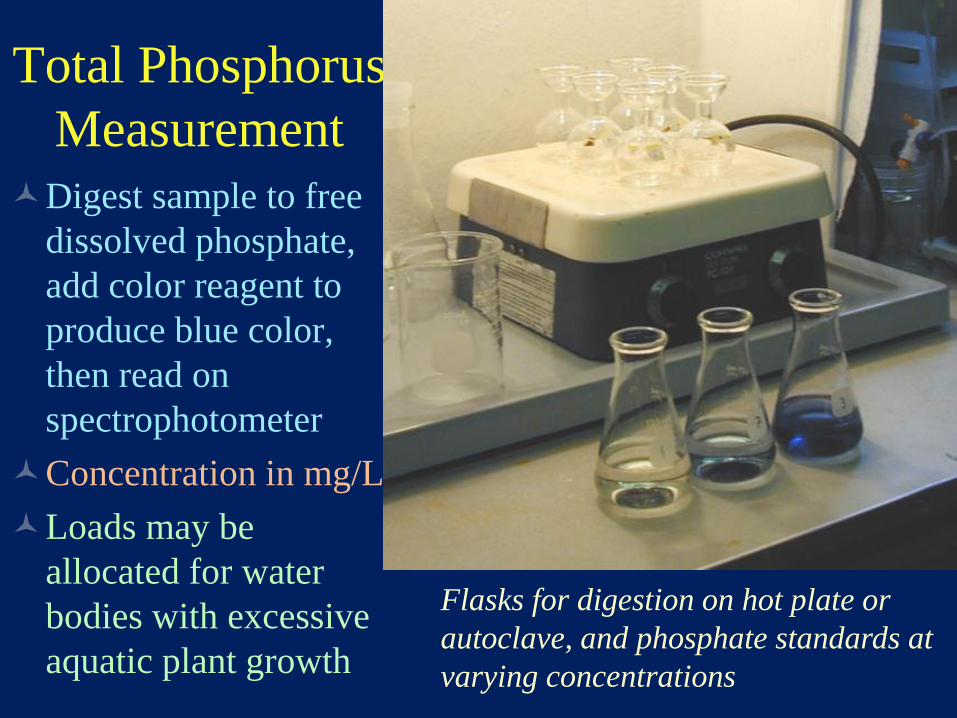
Total Phosphorus
Measurement
Digest sample to free
dissolved phosphate,
add color reagent to
produce blue color,
then read on
spectrophotometer
Concentration in mg/L
Loads may be
allocated for water
bodies with excessive
aquatic plant growth
Flasks for digestion on hot plate or
autoclave, and phosphate standards at
varying concentrations
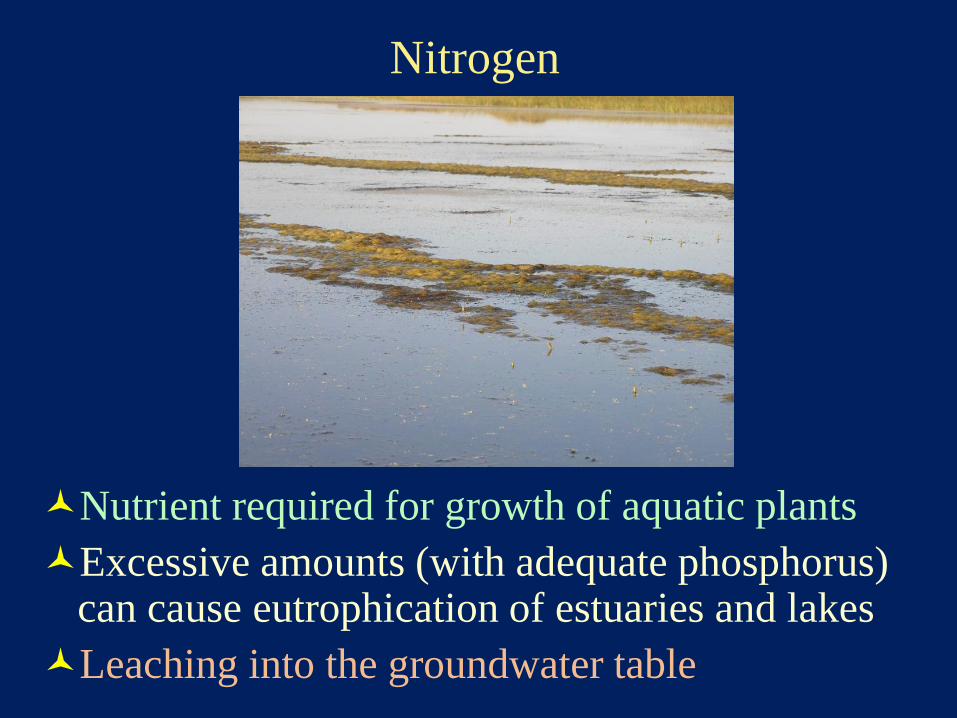
Nitrogen
Nutrient required for growth of aquatic plants
Excessive amounts (with adequate phosphorus) can cause eutrophication of estuaries and lakes
Leaching into the groundwater table
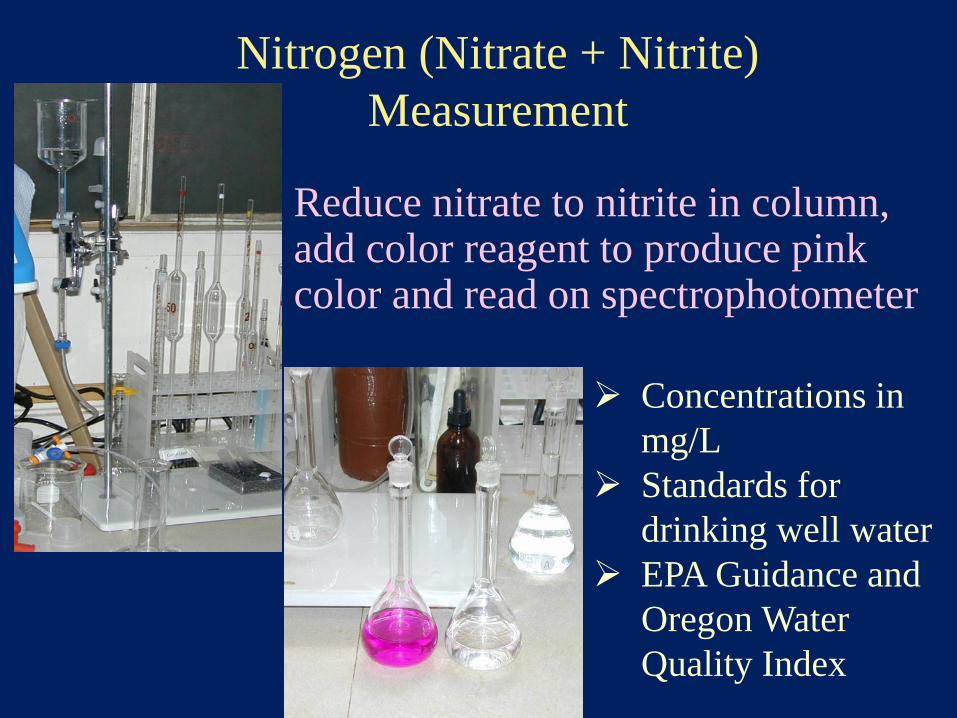
Reduce nitrate to nitrite in column, add color reagent to produce pink color and read on spectrophotometer
Nitrogen (Nitrate + Nitrite)
Measurement
Concentrations in
mg/L
Standards for
drinking well water
EPA Guidance and
Oregon Water
Quality Index
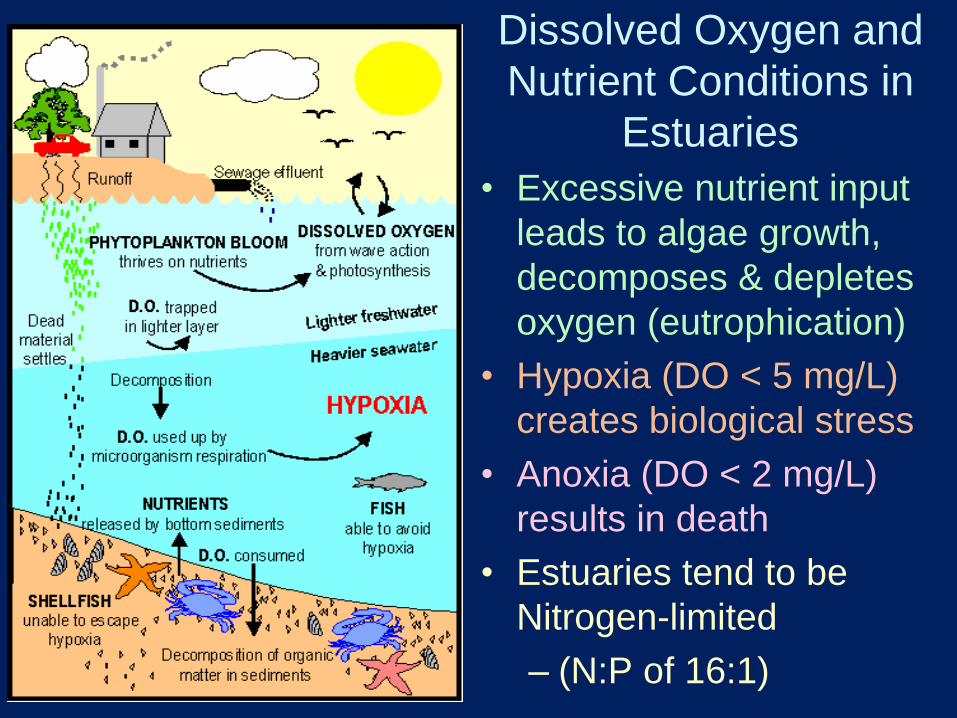
Dissolved Oxygen and
Nutrient Conditions in
Estuaries
• Excessive nutrient input
leads to algae growth,
decomposes & depletes
oxygen (eutrophication)
• Hypoxia (DO < 5 mg/L)
creates biological stress
• Anoxia (DO < 2 mg/L)
results in death
• Estuaries tend to be
Nitrogen-limited
– (N:P of 16:1)
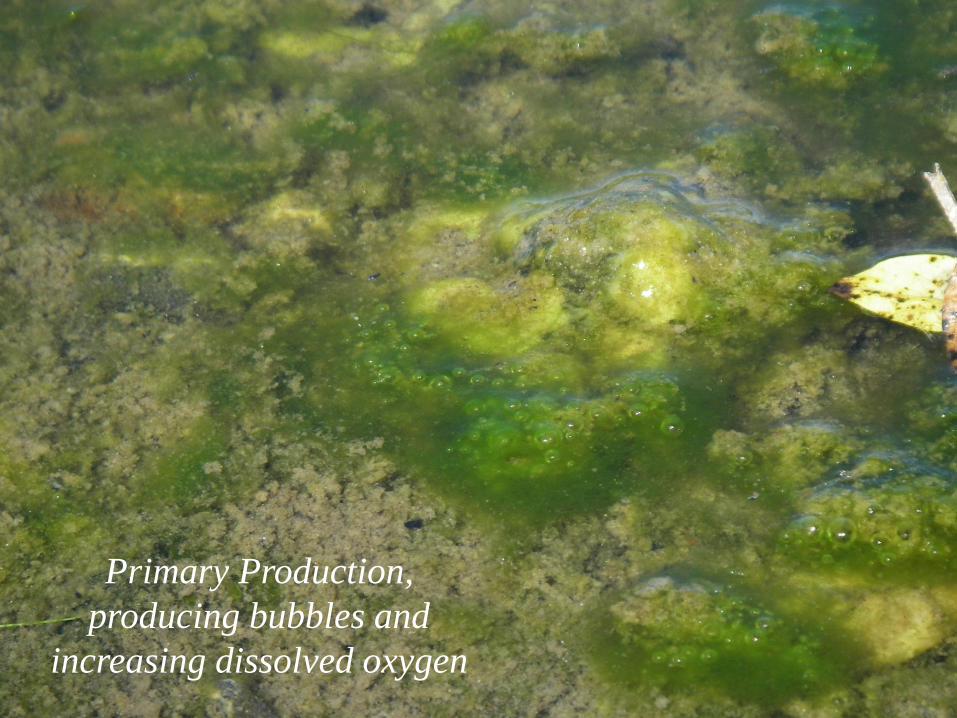
Primary Production,
producing bubbles and
increasing dissolved oxygen
2
4
6
8
10
12
14
16
18
20
22
24
26
21:00 0:00 3:00 6:00 9:00 12:00 15:00 18:00 21:00
Dis
so
lve
d O
xyg
en
Co
nc
en
tra
tio
n, m
g/L
Time of Day
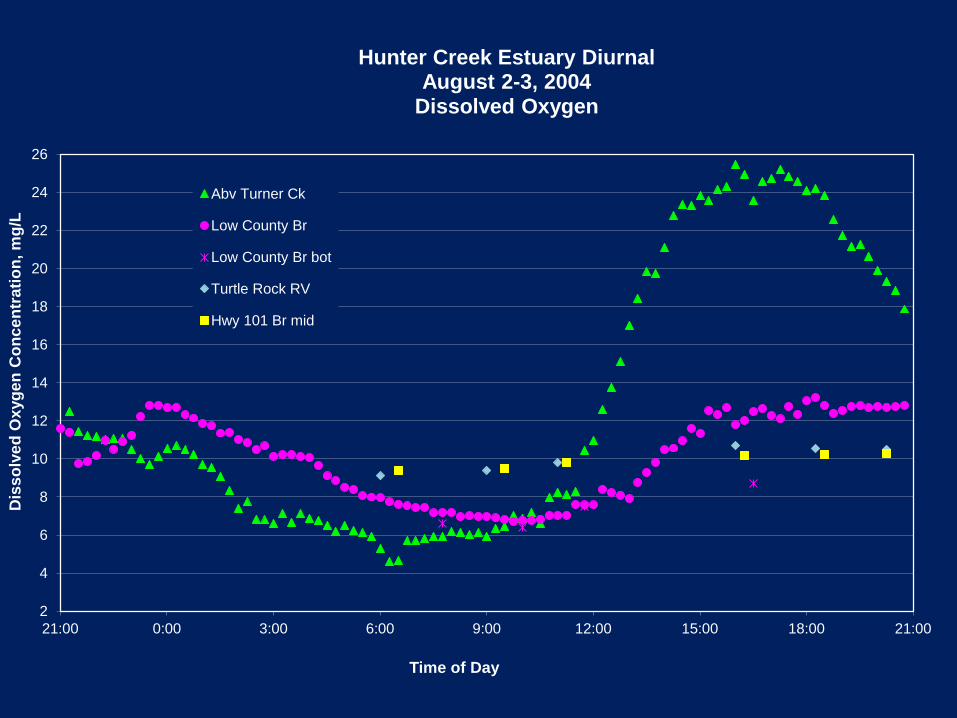
Hunter Creek Estuary Diurnal August 2-3, 2004
Dissolved Oxygen
Abv Turner Ck
Low County Br
Low County Br bot
Turtle Rock RV
Hwy 101 Br mid
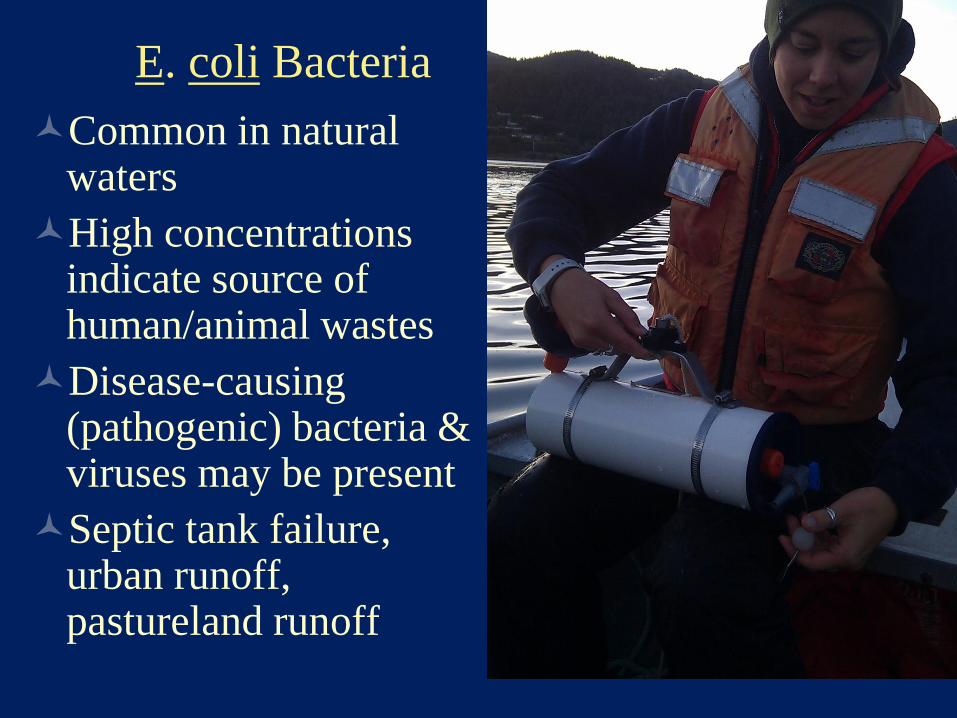
E. coli Bacteria
Common in natural waters
High concentrations indicate source of human/animal wastes
Disease-causing (pathogenic) bacteria & viruses may be present
Septic tank failure, urban runoff, pastureland runoff
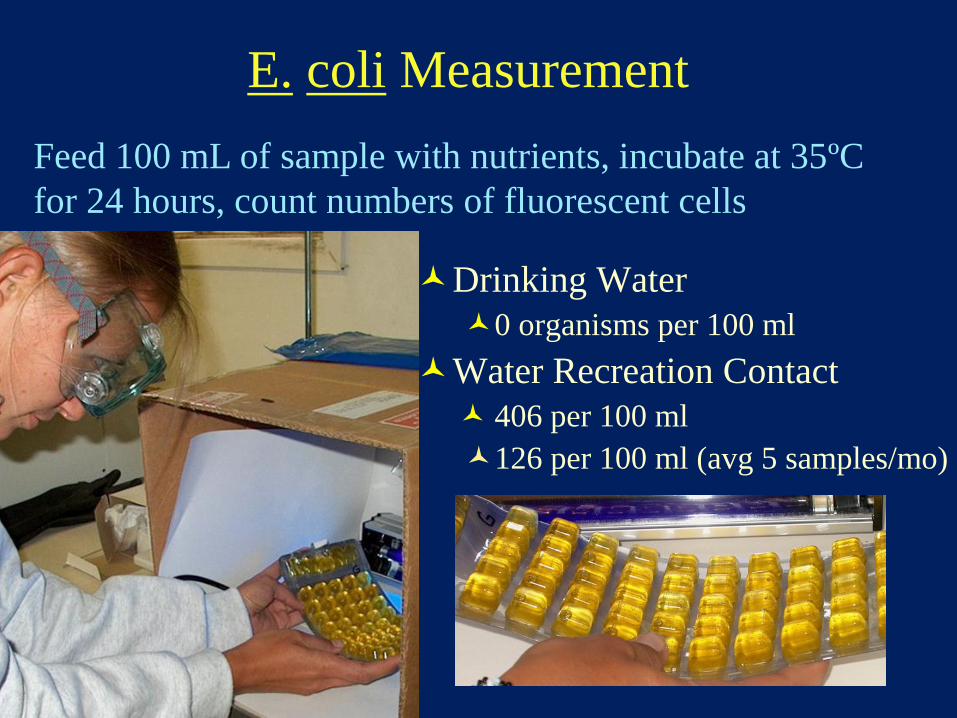
E. coli Measurement
Drinking Water
0 organisms per 100 ml
Water Recreation Contact
406 per 100 ml
126 per 100 ml (avg 5 samples/mo)
Feed 100 mL of sample with nutrients, incubate at 35ºC
for 24 hours, count numbers of fluorescent cells
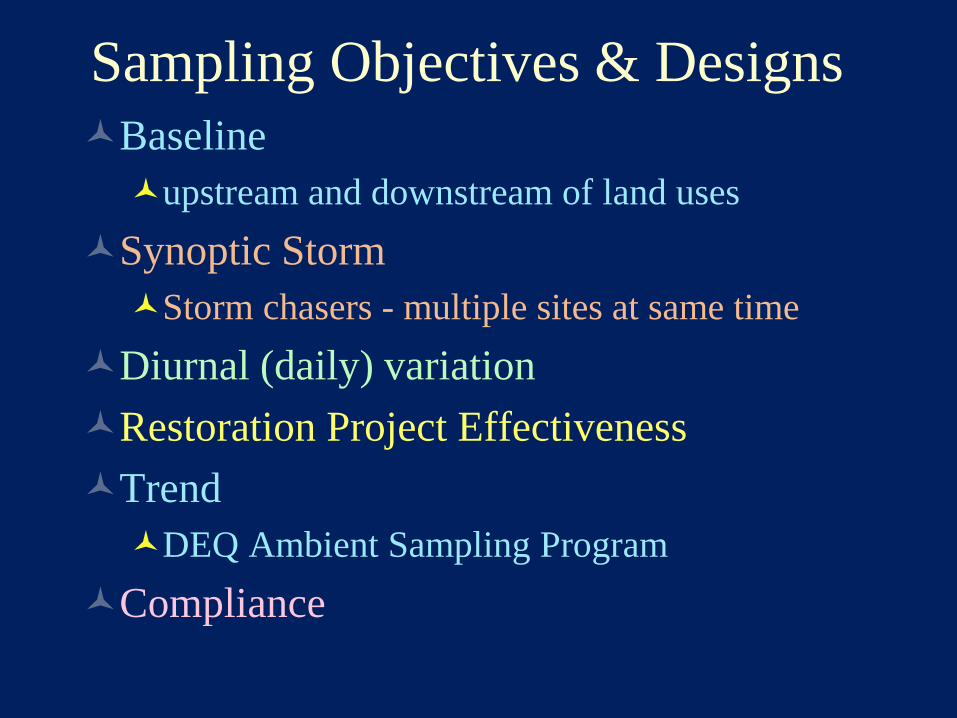
Sampling Objectives & Designs
Baseline
upstream and downstream of land uses
Synoptic Storm
Storm chasers - multiple sites at same time
Diurnal (daily) variation
Restoration Project Effectiveness
Trend
DEQ Ambient Sampling Program
Compliance
#S#SÊÚ
#SÊÚ
#S
ÊÚ
ÊÚ
#S
#S
ÊÚ
#S
#S
#SÊÚ
#S
ÊÚ
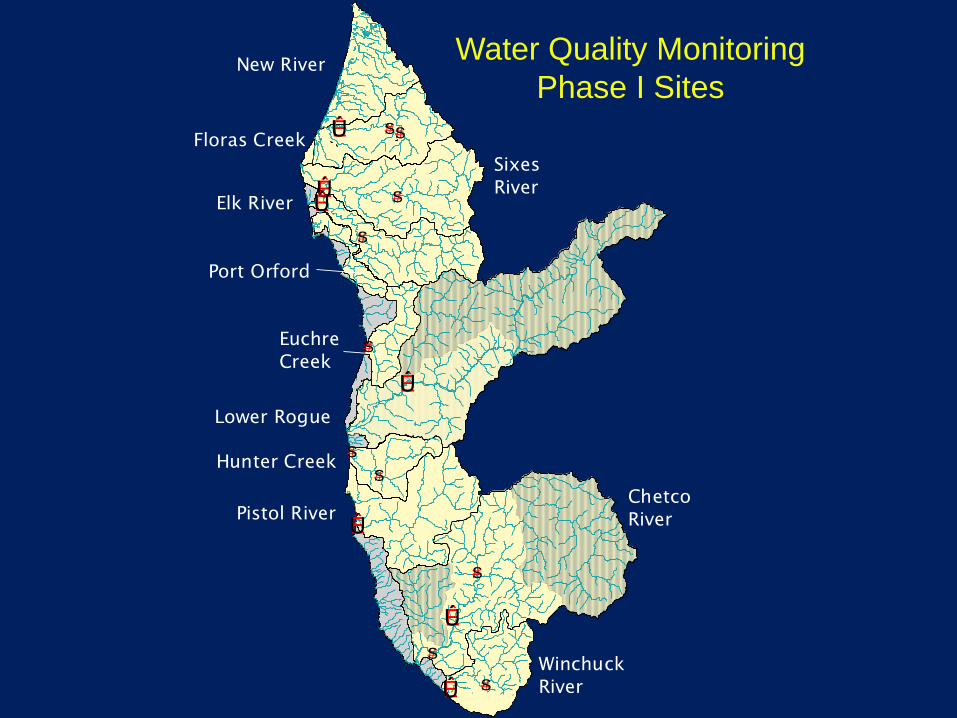
Floras Creek
Port Orford
Sixes
River
Pistol River
Lower Rogue
Elk River
New River
Euchre
Creek
Winchuck
River
Hunter Creek
Chetco
River
Water Quality Monitoring
Phase I Sites
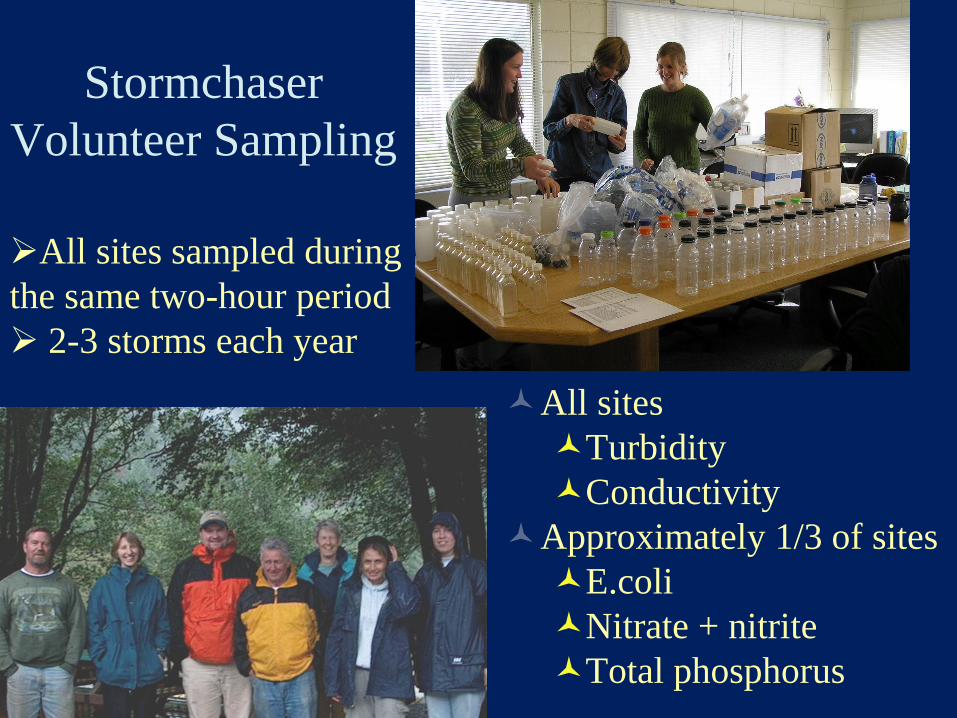
Stormchaser
Volunteer Sampling
All sites
Turbidity
Conductivity
Approximately 1/3 of sites
E.coli
Nitrate + nitrite
Total phosphorus
All sites sampled during
the same two-hour period
2-3 storms each year
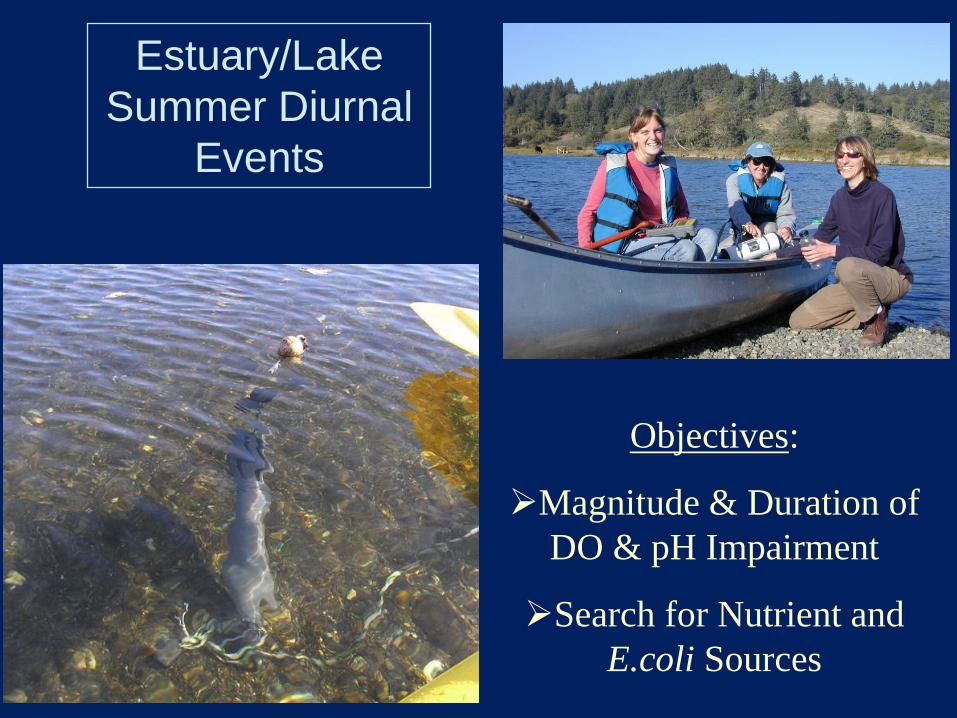
Estuary/Lake
Summer Diurnal
Events
Objectives:
Magnitude & Duration of
DO & pH Impairment
Search for Nutrient and
E.coli Sources
Using two adjacent reaches allows you to “control” variables
weather, rainfall, precipitation
discharge, land use
Using before/after helps you interpret your results better
Requires advance planning and time
Adjacent Stream Reaches:
Experimental and Control
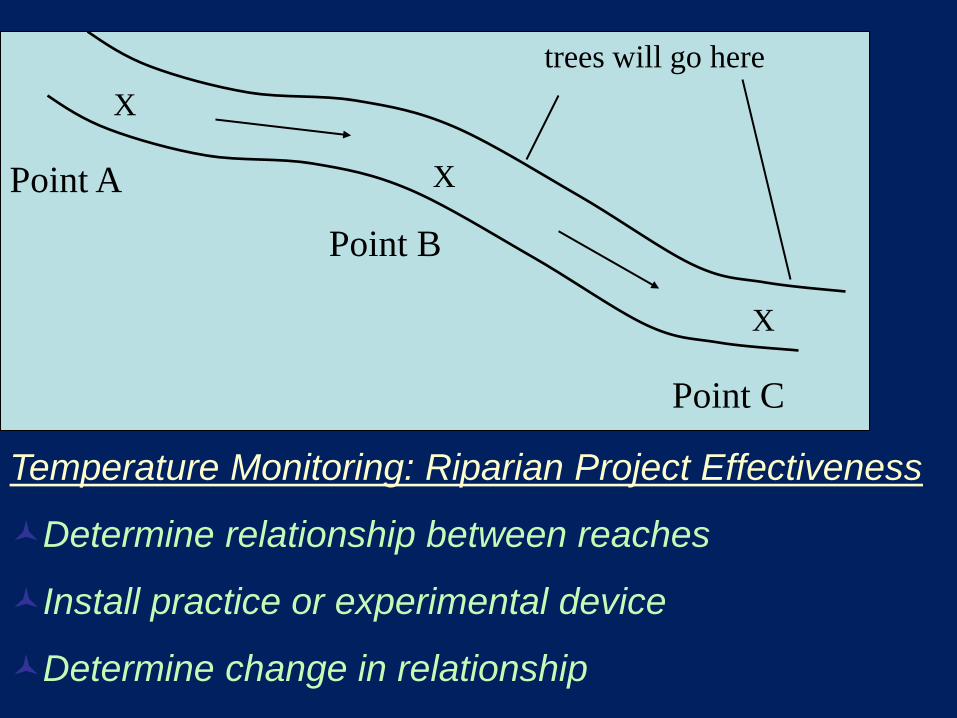
X
X
X
Point A
Point B
Point C
trees will go here
Temperature Monitoring: Riparian Project Effectiveness
Determine relationship between reaches
Install practice or experimental device
Determine change in relationship
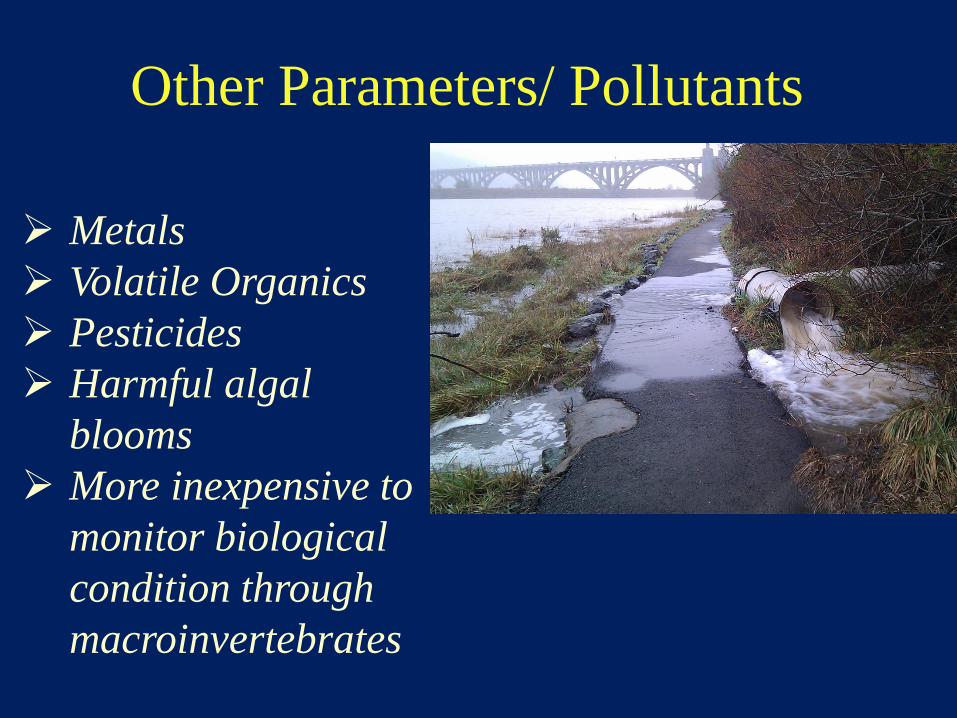
Other Parameters/ Pollutants
Metals
Volatile Organics
Pesticides
Harmful algal
blooms
More inexpensive to
monitor biological
condition through
macroinvertebrates
Clean Water Act Framework
Water Quality Standards
Point Source and Non-point Source Pollution
303(d) list combined with 305(b) report
Total Maximum Daily Load
Water Quality Management Plans
Rogue Basin Listed for E.coli and Temperature