Embed Size (px)
Citation preview
SOUTH-CENTRAL MINNESOTA REGIONAL ENERGY STUDY
Covering the Counties of: Blue Earth, Brown, Faribault, Le Sueur, Martin,
Nicollet, Sibley, Waseca & Watonwan
PART III: Appendices
Study completed by Region Nine Development Commission on the behalf of the Southern Minnesota Initiative Foundation and the Clean Energy Resource Teams.
- 1 -
Contents
CHAPTER 1 INTRODUCTION .......................................................................................................... - 2 -
CHAPTER 2 SUMMARY TABLES .................................................................................................... - 3 -
Appendix A: Consumption .............................................................................................................. - 3 -
Appendix B: Common Units of Fuel.......................................................................................... - 20 -
Appendix C: Cost ............................................................................................................................. - 21 -
Appendix D: Greenhouse Gas Emissions ................................................................................ - 22 -
Appendix E: Renewable Energy Potential ............................................................................. - 24 -
CHAPTER 3 CALCULATION TABLES ......................................................................................... - 25 -
Appendix F: Agricultural Consumption Spreadsheets ...................................................... - 25 -
Appendix G: Commercial Consumption Spreadsheets ...................................................... - 34 -
Appendix H: Industrial Consumption Spreadsheets.......................................................... - 38 -
Appendix I: Residential Consumption Spreadsheets ........................................................ - 48 -
Appendix J: Transportation Consumption Spreadsheets ................................................ - 64 -
Appendix K: Conversion from Btu’s to Common Units..................................................... - 71 -
Appendix L: Energy Costs ........................................................................................................... - 74 -
Appendix M: Greenhouse Gas Emissions .............................................................................. - 83 -
Appendix N: Biomass-Crops Spreadsheets ....................................................................... - 106 -
Appendix O: Biomass-Livestock Spreadsheets ................................................................ - 115 -
Appendix P: Biomass-Wood Spreadsheets ........................................................................ - 124 -
Appendix Q: Wind Spreadsheets........................................................................................... - 125 -
- 2 -
Chapter 1 INTRODUCTION This report is the result of a study performed by Region Nine Development Commission. The study was funded by grants from the Southern Minnesota Initiative Foundation, the Southwest Clean Energy Resource Team and the Southeast Clean Energy Resource Team. The study consisted of inventorying energy consumption and renewable energy potential and calculating the region’s energy costs and greenhouse gas emissions. The inventory portion of the study relied on the Agricultural Utilization Research Institute’s (AURI) Template for Estimating County Level Energy Use and Renewable Energy Potential. This report is envisioned as a planning tool designed to aid in the development of the region. The complete results of the report are presented in three parts: Part I contains study background information, methodology, and a description of south-central Minnesota’s energy characteristics collectively as a region. Part II contains individual descriptions for each of the region’s nine counties: Blue Earth, Brown, Faribault, Le Sueur, Martin, Nicollet, Sibley, Waseca and Watonwan. Part III contains the data, formulas and calculations that were used to derive the series of estimates presented in Parts I and II.
- 3 -
Chapter 2 SUMMARY TABLES Appendix A: Consumption
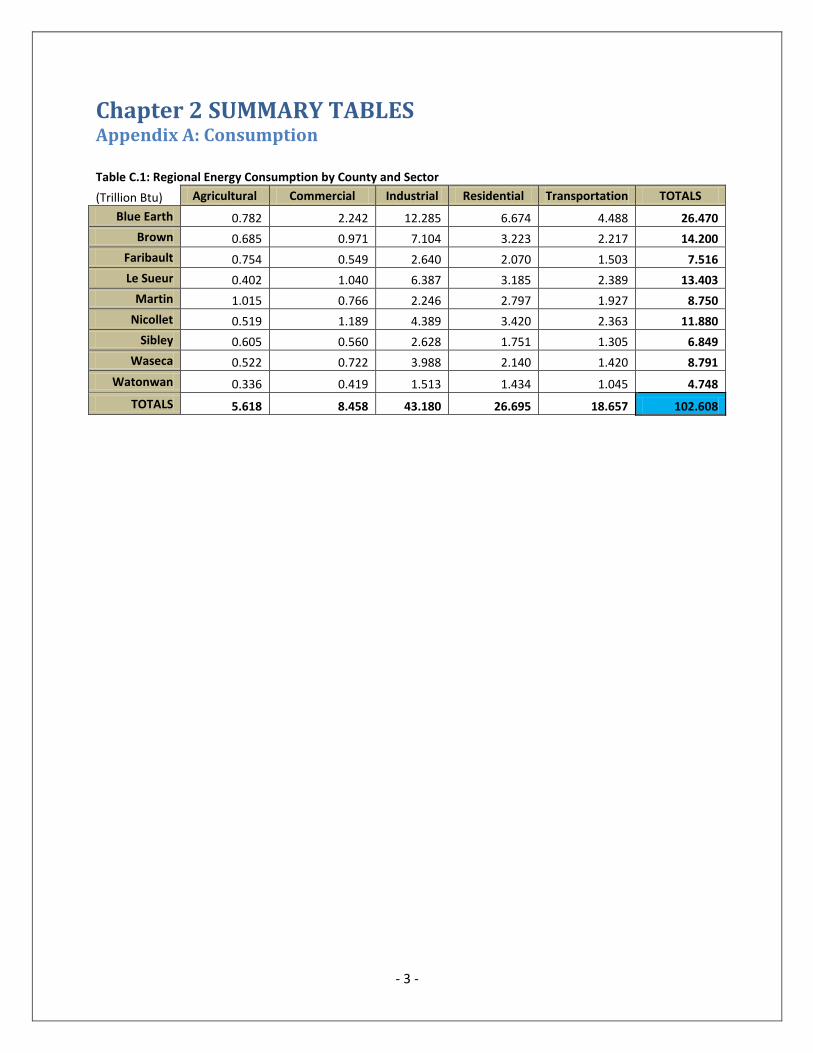
Table C.1: Regional Energy Consumption by County and Sector (Trillion Btu) Agricultural Commercial Industrial Residential Transportation TOTALS
Blue Earth 0.782 2.242 12.285 6.674 4.488 26.470
Brown 0.685 0.971 7.104 3.223 2.217 14.200
Faribault 0.754 0.549 2.640 2.070 1.503 7.516
Le Sueur 0.402 1.040 6.387 3.185 2.389 13.403
Martin 1.015 0.766 2.246 2.797 1.927 8.750
Nicollet 0.519 1.189 4.389 3.420 2.363 11.880
Sibley 0.605 0.560 2.628 1.751 1.305 6.849
Waseca 0.522 0.722 3.988 2.140 1.420 8.791
Watonwan 0.336 0.419 1.513 1.434 1.045 4.748
TOTALS 5.618 8.458 43.180 26.695 18.657 102.608
- 4 -
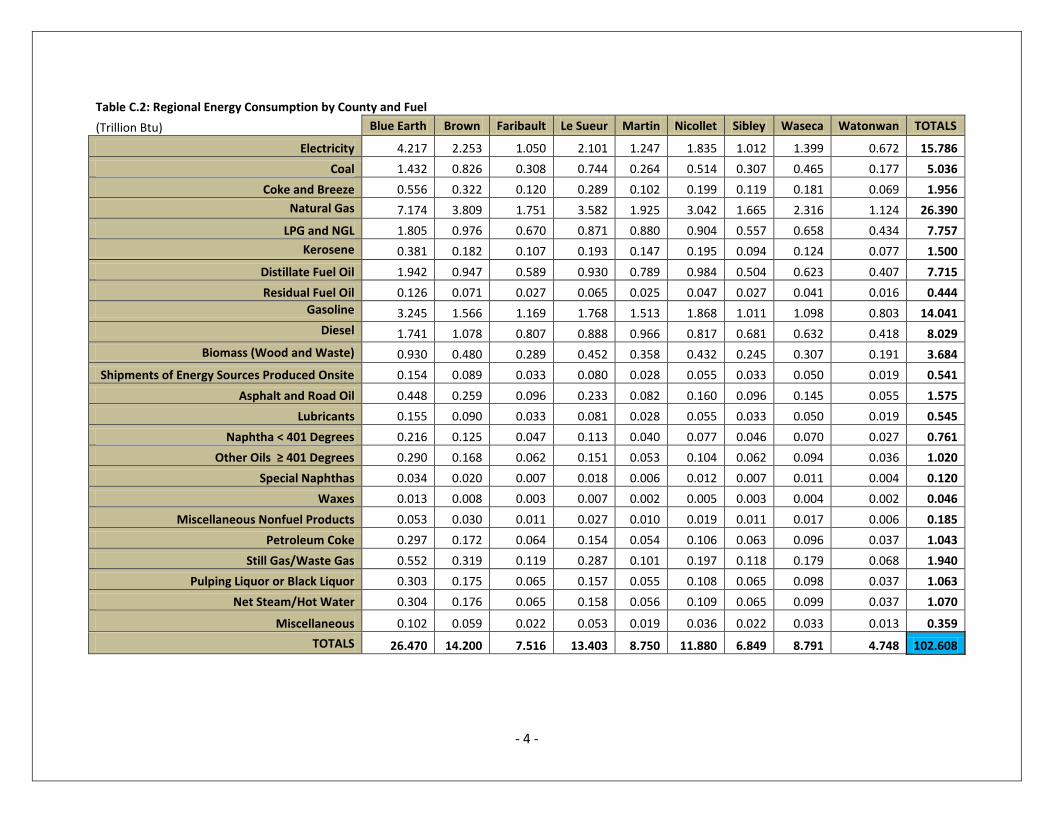
Table C.2: Regional Energy Consumption by County and Fuel
(Trillion Btu) Blue Earth Brown Faribault Le Sueur Martin Nicollet Sibley Waseca Watonwan TOTALS
Electricity 4.217 2.253 1.050 2.101 1.247 1.835 1.012 1.399 0.672 15.786
Coal 1.432 0.826 0.308 0.744 0.264 0.514 0.307 0.465 0.177 5.036
Coke and Breeze 0.556 0.322 0.120 0.289 0.102 0.199 0.119 0.181 0.069 1.956
Natural Gas 7.174 3.809 1.751 3.582 1.925 3.042 1.665 2.316 1.124 26.390
LPG and NGL 1.805 0.976 0.670 0.871 0.880 0.904 0.557 0.658 0.434 7.757
Kerosene 0.381 0.182 0.107 0.193 0.147 0.195 0.094 0.124 0.077 1.500
Distillate Fuel Oil 1.942 0.947 0.589 0.930 0.789 0.984 0.504 0.623 0.407 7.715
Residual Fuel Oil 0.126 0.071 0.027 0.065 0.025 0.047 0.027 0.041 0.016 0.444
Gasoline 3.245 1.566 1.169 1.768 1.513 1.868 1.011 1.098 0.803 14.041
Diesel 1.741 1.078 0.807 0.888 0.966 0.817 0.681 0.632 0.418 8.029
Biomass (Wood and Waste) 0.930 0.480 0.289 0.452 0.358 0.432 0.245 0.307 0.191 3.684
Shipments of Energy Sources Produced Onsite 0.154 0.089 0.033 0.080 0.028 0.055 0.033 0.050 0.019 0.541
Asphalt and Road Oil 0.448 0.259 0.096 0.233 0.082 0.160 0.096 0.145 0.055 1.575
Lubricants 0.155 0.090 0.033 0.081 0.028 0.055 0.033 0.050 0.019 0.545
Naphtha < 401 Degrees 0.216 0.125 0.047 0.113 0.040 0.077 0.046 0.070 0.027 0.761
Other Oils ≥ 401 Degrees 0.290 0.168 0.062 0.151 0.053 0.104 0.062 0.094 0.036 1.020
Special Naphthas 0.034 0.020 0.007 0.018 0.006 0.012 0.007 0.011 0.004 0.120
Waxes 0.013 0.008 0.003 0.007 0.002 0.005 0.003 0.004 0.002 0.046
Miscellaneous Nonfuel Products 0.053 0.030 0.011 0.027 0.010 0.019 0.011 0.017 0.006 0.185
Petroleum Coke 0.297 0.172 0.064 0.154 0.054 0.106 0.063 0.096 0.037 1.043
Still Gas/Waste Gas 0.552 0.319 0.119 0.287 0.101 0.197 0.118 0.179 0.068 1.940
Pulping Liquor or Black Liquor 0.303 0.175 0.065 0.157 0.055 0.108 0.065 0.098 0.037 1.063
Net Steam/Hot Water 0.304 0.176 0.065 0.158 0.056 0.109 0.065 0.099 0.037 1.070
Miscellaneous 0.102 0.059 0.022 0.053 0.019 0.036 0.022 0.033 0.013 0.359
TOTALS 26.470 14.200 7.516 13.403 8.750 11.880 6.849 8.791 4.748 102.608
- 5 -
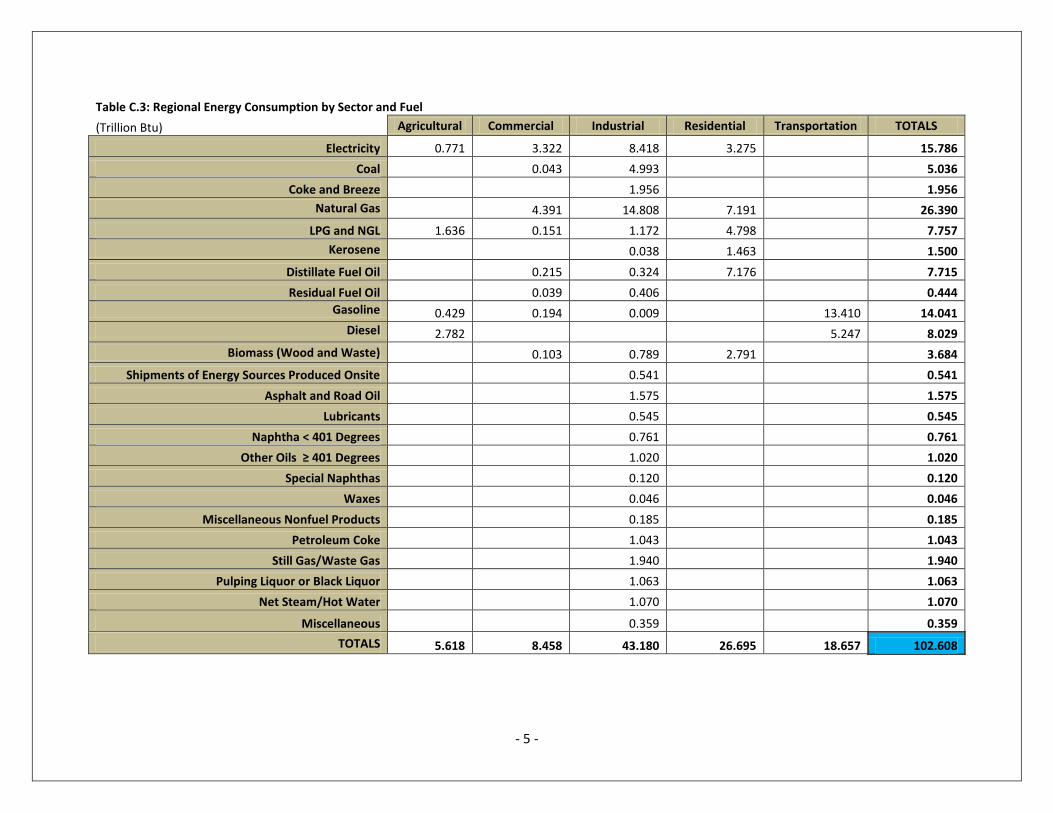
Table C.3: Regional Energy Consumption by Sector and Fuel
(Trillion Btu) Agricultural Commercial Industrial Residential Transportation TOTALS
Electricity 0.771 3.322 8.418 3.275 15.786
Coal 0.043 4.993 5.036
Coke and Breeze 1.956 1.956
Natural Gas 4.391 14.808 7.191 26.390
LPG and NGL 1.636 0.151 1.172 4.798 7.757
Kerosene 0.038 1.463 1.500
Distillate Fuel Oil 0.215 0.324 7.176 7.715
Residual Fuel Oil 0.039 0.406 0.444
Gasoline 0.429 0.194 0.009 13.410 14.041
Diesel 2.782 5.247 8.029
Biomass (Wood and Waste) 0.103 0.789 2.791 3.684
Shipments of Energy Sources Produced Onsite 0.541 0.541
Asphalt and Road Oil 1.575 1.575
Lubricants 0.545 0.545
Naphtha < 401 Degrees 0.761 0.761
Other Oils ≥ 401 Degrees 1.020 1.020
Special Naphthas 0.120 0.120
Waxes 0.046 0.046
Miscellaneous Nonfuel Products 0.185 0.185
Petroleum Coke 1.043 1.043
Still Gas/Waste Gas 1.940 1.940
Pulping Liquor or Black Liquor 1.063 1.063
Net Steam/Hot Water 1.070 1.070
Miscellaneous 0.359 0.359
TOTALS 5.618 8.458 43.180 26.695 18.657 102.608
- 6 -
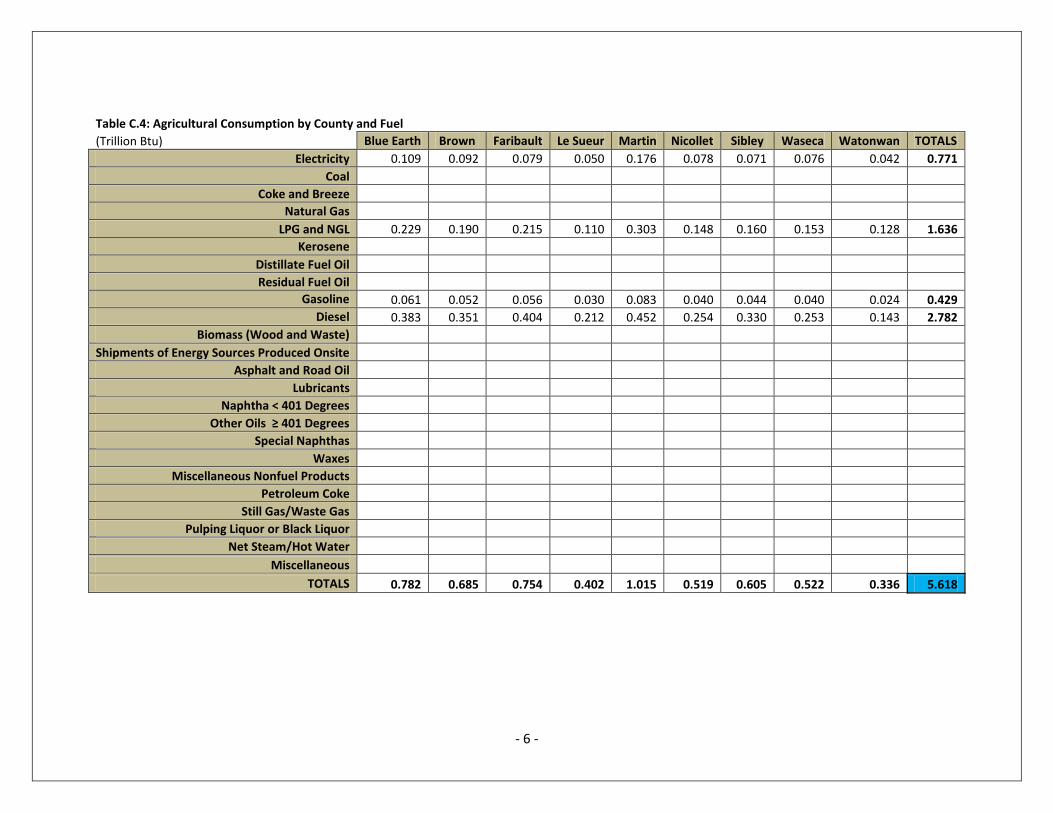
Table C.4: Agricultural Consumption by County and Fuel
(Trillion Btu) Blue Earth Brown Faribault Le Sueur Martin Nicollet Sibley Waseca Watonwan TOTALS
Electricity 0.109 0.092 0.079 0.050 0.176 0.078 0.071 0.076 0.042 0.771
Coal
Coke and Breeze
Natural Gas
LPG and NGL 0.229 0.190 0.215 0.110 0.303 0.148 0.160 0.153 0.128 1.636
Kerosene
Distillate Fuel Oil
Residual Fuel Oil
Gasoline 0.061 0.052 0.056 0.030 0.083 0.040 0.044 0.040 0.024 0.429
Diesel 0.383 0.351 0.404 0.212 0.452 0.254 0.330 0.253 0.143 2.782
Biomass (Wood and Waste)
Shipments of Energy Sources Produced Onsite
Asphalt and Road Oil
Lubricants
Naphtha < 401 Degrees
Other Oils ≥ 401 Degrees
Special Naphthas
Waxes
Miscellaneous Nonfuel Products
Petroleum Coke
Still Gas/Waste Gas
Pulping Liquor or Black Liquor
Net Steam/Hot Water
Miscellaneous
TOTALS 0.782 0.685 0.754 0.402 1.015 0.519 0.605 0.522 0.336 5.618
- 7 -
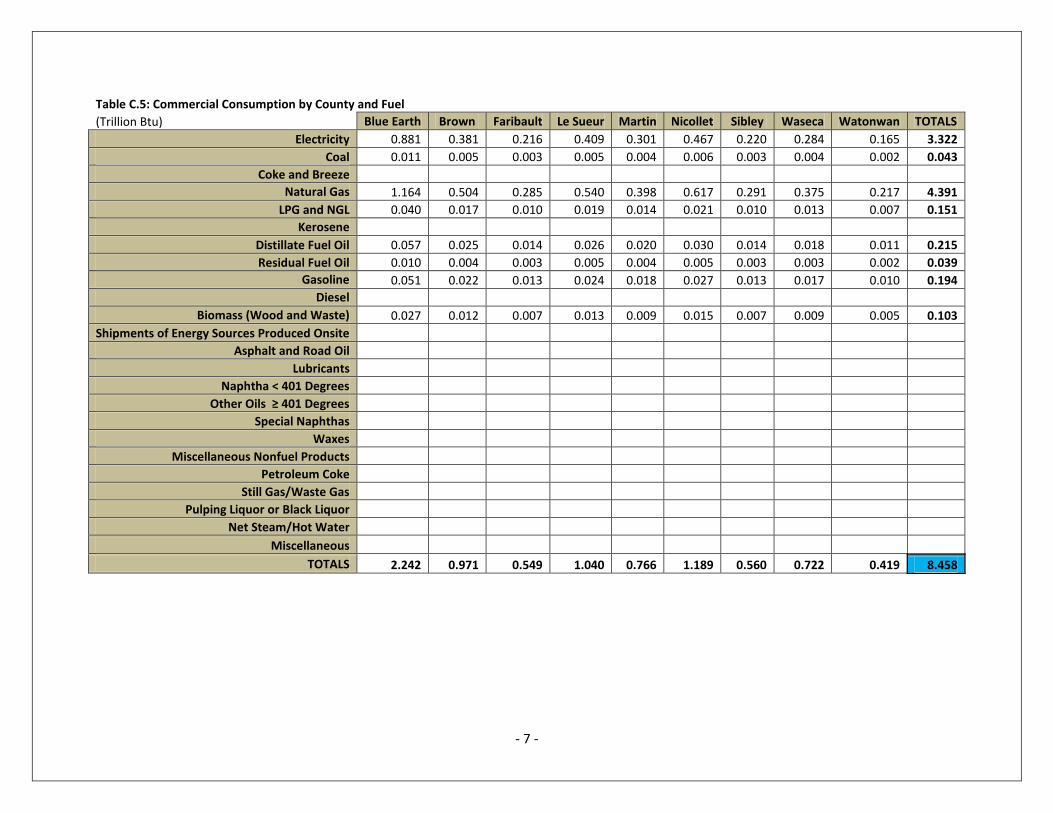
Table C.5: Commercial Consumption by County and Fuel (Trillion Btu) Blue Earth Brown Faribault Le Sueur Martin Nicollet Sibley Waseca Watonwan TOTALS
Electricity 0.881 0.381 0.216 0.409 0.301 0.467 0.220 0.284 0.165 3.322
Coal 0.011 0.005 0.003 0.005 0.004 0.006 0.003 0.004 0.002 0.043
Coke and Breeze
Natural Gas 1.164 0.504 0.285 0.540 0.398 0.617 0.291 0.375 0.217 4.391
LPG and NGL 0.040 0.017 0.010 0.019 0.014 0.021 0.010 0.013 0.007 0.151
Kerosene
Distillate Fuel Oil 0.057 0.025 0.014 0.026 0.020 0.030 0.014 0.018 0.011 0.215
Residual Fuel Oil 0.010 0.004 0.003 0.005 0.004 0.005 0.003 0.003 0.002 0.039
Gasoline 0.051 0.022 0.013 0.024 0.018 0.027 0.013 0.017 0.010 0.194
Diesel
Biomass (Wood and Waste) 0.027 0.012 0.007 0.013 0.009 0.015 0.007 0.009 0.005 0.103
Shipments of Energy Sources Produced Onsite
Asphalt and Road Oil
Lubricants
Naphtha < 401 Degrees
Other Oils ≥ 401 Degrees
Special Naphthas
Waxes
Miscellaneous Nonfuel Products
Petroleum Coke
Still Gas/Waste Gas
Pulping Liquor or Black Liquor
Net Steam/Hot Water
Miscellaneous
TOTALS 2.242 0.971 0.549 1.040 0.766 1.189 0.560 0.722 0.419 8.458

- 8 -
Table C.6: Industrial Consumption by County and Fuel (Trillion Btu) Blue Earth Brown Faribault Le Sueur Martin Nicollet Sibley Waseca Watonwan TOTALS
Electricity 2.395 1.385 0.515 1.245 0.438 0.856 0.512 0.777 0.295 8.418
Coal 1.420 0.821 0.305 0.739 0.260 0.508 0.304 0.461 0.175 4.993
Coke and Breeze 0.556 0.322 0.120 0.289 0.102 0.199 0.119 0.181 0.069 1.956
Natural Gas 4.213 2.436 0.905 2.190 0.770 1.505 0.901 1.368 0.519 14.808
LPG and NGL 0.333 0.193 0.072 0.173 0.061 0.119 0.071 0.108 0.041 1.172
Kerosene 0.011 0.006 0.002 0.006 0.002 0.004 0.002 0.003 0.001 0.038
Distillate Fuel Oil 0.092 0.053 0.020 0.048 0.017 0.033 0.020 0.030 0.011 0.324
Residual Fuel Oil 0.115 0.067 0.025 0.060 0.021 0.041 0.025 0.037 0.014 0.406
Gasoline 0.002 0.001 0.001 0.001 0.000 0.001 0.001 0.001 0.000 0.009
Diesel
Biomass (Wood and Waste) 0.225 0.130 0.048 0.117 0.041 0.080 0.048 0.073 0.028 0.789
Shipments of Energy Sources Produced Onsite 0.154 0.089 0.033 0.080 0.028 0.055 0.033 0.050 0.019 0.541
Asphalt and Road Oil 0.448 0.259 0.096 0.233 0.082 0.160 0.096 0.145 0.055 1.575
Lubricants 0.155 0.090 0.033 0.081 0.028 0.055 0.033 0.050 0.019 0.545
Naphtha < 401 Degrees 0.216 0.125 0.047 0.113 0.040 0.077 0.046 0.070 0.027 0.761
Other Oils ≥ 401 Degrees 0.290 0.168 0.062 0.151 0.053 0.104 0.062 0.094 0.036 1.020
Special Naphthas 0.034 0.020 0.007 0.018 0.006 0.012 0.007 0.011 0.004 0.120
Waxes 0.013 0.008 0.003 0.007 0.002 0.005 0.003 0.004 0.002 0.046
Miscellaneous Nonfuel Products 0.053 0.030 0.011 0.027 0.010 0.019 0.011 0.017 0.006 0.185
Petroleum Coke 0.297 0.172 0.064 0.154 0.054 0.106 0.063 0.096 0.037 1.043
Still Gas/Waste Gas 0.552 0.319 0.119 0.287 0.101 0.197 0.118 0.179 0.068 1.940
Pulping Liquor or Black Liquor 0.303 0.175 0.065 0.157 0.055 0.108 0.065 0.098 0.037 1.063
Net Steam/Hot Water 0.304 0.176 0.065 0.158 0.056 0.109 0.065 0.099 0.037 1.070
Miscellaneous 0.102 0.059 0.022 0.053 0.019 0.036 0.022 0.033 0.013 0.359
TOTALS 12.285 7.104 2.640 6.387 2.246 4.389 2.628 3.988 1.513 43.180
- 9 -
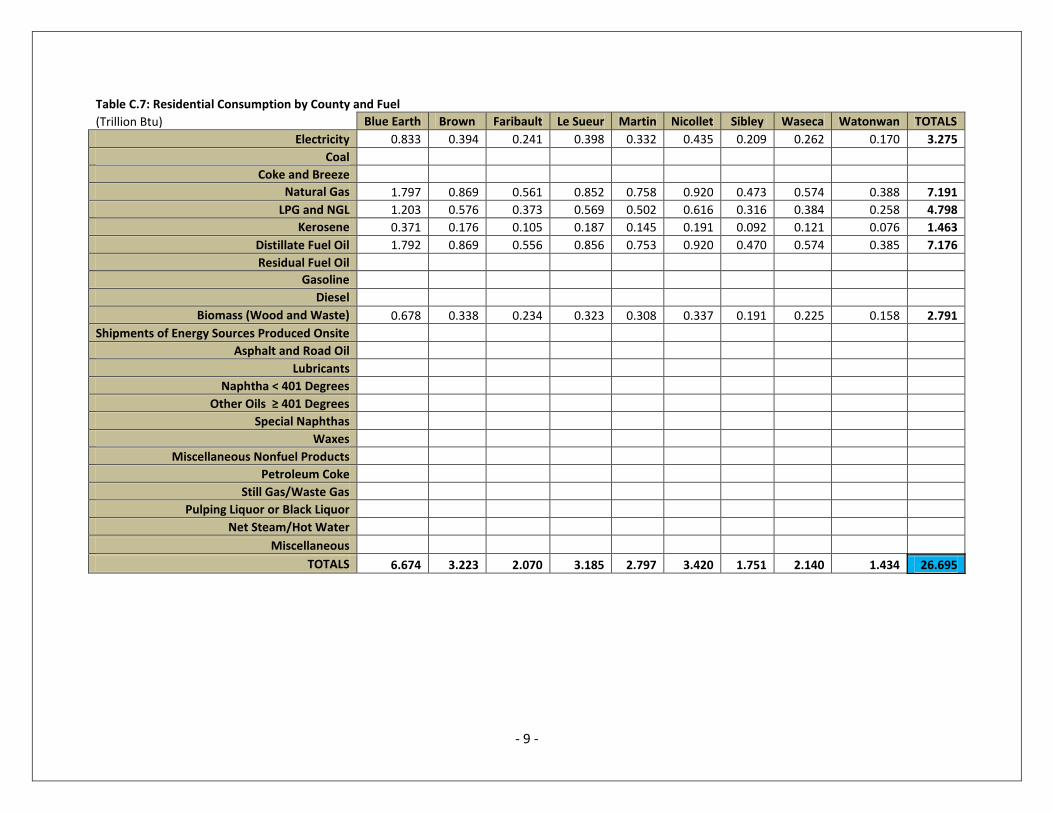
Table C.7: Residential Consumption by County and Fuel (Trillion Btu) Blue Earth Brown Faribault Le Sueur Martin Nicollet Sibley Waseca Watonwan TOTALS
Electricity 0.833 0.394 0.241 0.398 0.332 0.435 0.209 0.262 0.170 3.275
Coal
Coke and Breeze
Natural Gas 1.797 0.869 0.561 0.852 0.758 0.920 0.473 0.574 0.388 7.191
LPG and NGL 1.203 0.576 0.373 0.569 0.502 0.616 0.316 0.384 0.258 4.798
Kerosene 0.371 0.176 0.105 0.187 0.145 0.191 0.092 0.121 0.076 1.463
Distillate Fuel Oil 1.792 0.869 0.556 0.856 0.753 0.920 0.470 0.574 0.385 7.176
Residual Fuel Oil
Gasoline
Diesel
Biomass (Wood and Waste) 0.678 0.338 0.234 0.323 0.308 0.337 0.191 0.225 0.158 2.791
Shipments of Energy Sources Produced Onsite
Asphalt and Road Oil
Lubricants
Naphtha < 401 Degrees
Other Oils ≥ 401 Degrees
Special Naphthas
Waxes
Miscellaneous Nonfuel Products
Petroleum Coke
Still Gas/Waste Gas
Pulping Liquor or Black Liquor
Net Steam/Hot Water
Miscellaneous
TOTALS 6.674 3.223 2.070 3.185 2.797 3.420 1.751 2.140 1.434 26.695
- 10 -
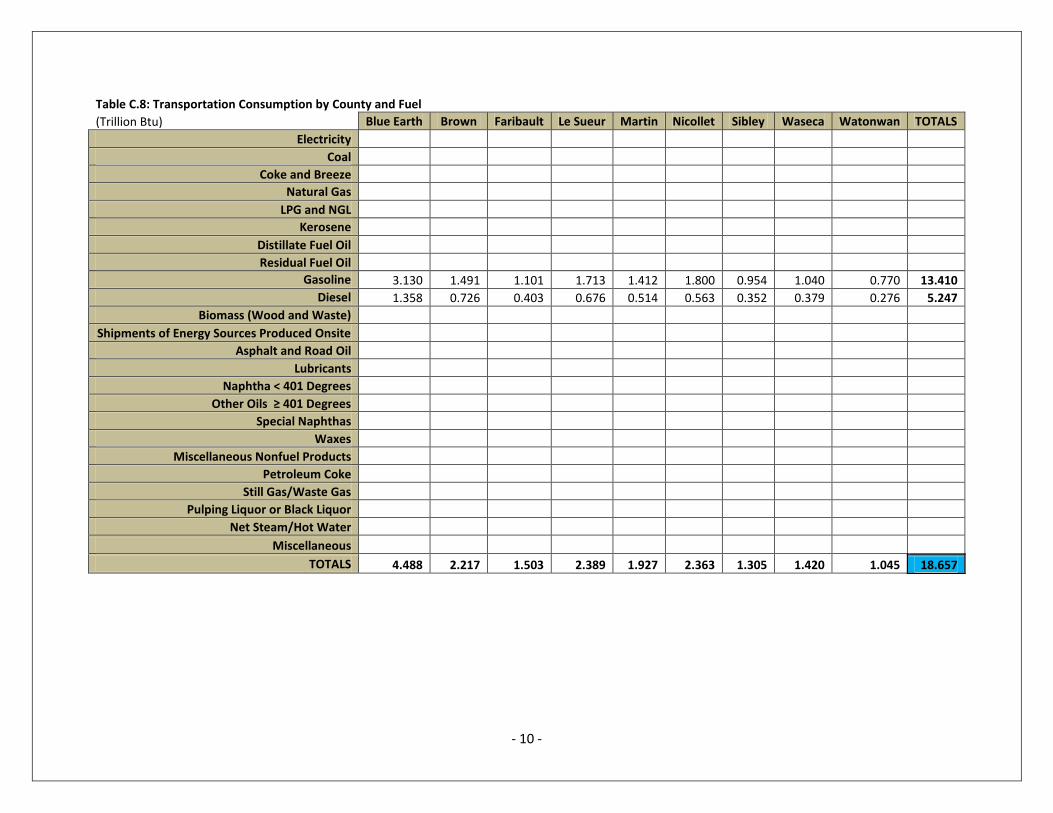
Table C.8: Transportation Consumption by County and Fuel (Trillion Btu) Blue Earth Brown Faribault Le Sueur Martin Nicollet Sibley Waseca Watonwan TOTALS
Electricity
Coal
Coke and Breeze
Natural Gas
LPG and NGL
Kerosene
Distillate Fuel Oil
Residual Fuel Oil
Gasoline 3.130 1.491 1.101 1.713 1.412 1.800 0.954 1.040 0.770 13.410
Diesel 1.358 0.726 0.403 0.676 0.514 0.563 0.352 0.379 0.276 5.247
Biomass (Wood and Waste)
Shipments of Energy Sources Produced Onsite
Asphalt and Road Oil
Lubricants
Naphtha < 401 Degrees
Other Oils ≥ 401 Degrees
Special Naphthas
Waxes
Miscellaneous Nonfuel Products
Petroleum Coke
Still Gas/Waste Gas
Pulping Liquor or Black Liquor
Net Steam/Hot Water
Miscellaneous
TOTALS 4.488 2.217 1.503 2.389 1.927 2.363 1.305 1.420 1.045 18.657

- 11 -
Table C.9: Blue Earth Co. Consumption by Sector and Fuel
(Trillion Btu) Agricultural Commercial Industrial Residential Transportation TOTALS
Electricity 0.109 0.881 2.395 0.833 4.217
Coal 0.011 1.420 1.432
Coke and Breeze 0.556 0.556
Natural Gas 1.164 4.213 1.797 7.174
LPG and NGL 0.229 0.040 0.333 1.203 1.805
Kerosene 0.011 0.371 0.381
Distillate Fuel Oil 0.057 0.092 1.792 1.942
Residual Fuel Oil 0.010 0.115
0.126
Gasoline 0.061 0.051 0.002 3.130 3.245
Diesel 0.383 1.358 1.741
Biomass (Wood and Waste) 0.027 0.225 0.678 0.930
Shipments of Energy Sources Produced Onsite 0.154 0.154
Asphalt and Road Oil 0.448 0.448
Lubricants 0.155 0.155
Naphtha < 401 Degrees 0.216 0.216
Other Oils ≥ 401 Degrees 0.290 0.290
Special Naphthas 0.034 0.034
Waxes 0.013 0.013
Miscellaneous Nonfuel Products 0.053 0.053
Petroleum Coke 0.297 0.297
Still Gas/Waste Gas 0.552 0.552
Pulping Liquor or Black Liquor 0.303 0.303
Net Steam/Hot Water 0.304 0.304
Miscellaneous 0.102 0.102
TOTALS 0.782 2.242 12.285 6.674 4.488 26.470

- 12 -
Table C.10: Brown Co. Consumption by Sector and Fuel
(Trillion Btu) Agricultural Commercial Industrial Residential Transportation TOTALS
Electricity 0.092 0.381 1.385 0.394 2.253
Coal 0.005 0.821 0.826
Coke and Breeze 0.322 0.322
Natural Gas 0.504 2.436 0.869 3.809
LPG and NGL 0.190 0.017 0.193 0.576 0.976
Kerosene 0.006 0.176 0.182
Distillate Fuel Oil 0.025 0.053 0.869 0.947
Residual Fuel Oil 0.004 0.067
0.071
Gasoline 0.052 0.022 0.001 1.491 1.566
Diesel 0.351 0.726 1.078
Biomass (Wood and Waste) 0.012 0.130 0.338 0.480
Shipments of Energy Sources Produced Onsite 0.089 0.089
Asphalt and Road Oil 0.259 0.259
Lubricants 0.090 0.090
Naphtha < 401 Degrees 0.125 0.125
Other Oils ≥ 401 Degrees 0.168 0.168
Special Naphthas 0.020 0.020
Waxes 0.008 0.008
Miscellaneous Nonfuel Products 0.030 0.030
Petroleum Coke 0.172 0.172
Still Gas/Waste Gas 0.319 0.319
Pulping Liquor or Black Liquor 0.175 0.175
Net Steam/Hot Water 0.176 0.176
Miscellaneous 0.059 0.059
TOTALS 0.685 0.971 7.104 3.223 2.217 14.200

- 13 -
Table C.11: Faribault Co. Consumption by Sector and Fuel
(Trillion Btu) Agricultural Commercial Industrial Residential Transportation TOTALS
Electricity 0.079 0.216 0.515 0.241 1.050
Coal 0.003 0.305 0.308
Coke and Breeze 0.120 0.120
Natural Gas 0.285 0.905 0.561 1.751
LPG and NGL 0.215 0.010 0.072 0.373 0.670
Kerosene 0.002 0.105 0.107
Distillate Fuel Oil 0.014 0.020 0.556 0.589
Residual Fuel Oil 0.003 0.025
0.027
Gasoline 0.056 0.013 0.001 1.101 1.169
Diesel 0.404 0.403 0.807
Biomass (Wood and Waste) 0.007 0.048 0.234 0.289
Shipments of Energy Sources Produced Onsite 0.033 0.033
Asphalt and Road Oil 0.096 0.096
Lubricants 0.033 0.033
Naphtha < 401 Degrees 0.047 0.047
Other Oils ≥ 401 Degrees 0.062 0.062
Special Naphthas 0.007 0.007
Waxes 0.003 0.003
Miscellaneous Nonfuel Products 0.011 0.011
Petroleum Coke 0.064 0.064
Still Gas/Waste Gas 0.119 0.119
Pulping Liquor or Black Liquor 0.065 0.065
Net Steam/Hot Water 0.065 0.065
Miscellaneous 0.022 0.022
TOTALS 0.754 0.549 2.640 2.070 1.503 7.516

- 14 -
Table C.12: Le Sueur Co. Consumption by Sector and Fuel
(Trillion Btu) Agricultural Commercial Industrial Residential Transportation TOTALS
Electricity 0.050 0.409 1.245 0.398 2.101
Coal 0.005 0.739 0.744
Coke and Breeze 0.289 0.289
Natural Gas 0.540 2.190 0.852 3.582
LPG and NGL 0.110 0.019 0.173 0.569 0.871
Kerosene 0.006 0.187 0.193
Distillate Fuel Oil 0.026 0.048 0.856 0.930
Residual Fuel Oil 0.005 0.060 0.065
Gasoline 0.030 0.024 0.001 1.713 1.768
Diesel 0.212 0.676 0.888
Biomass (Wood and Waste) 0.013 0.117 0.323 0.452
Shipments of Energy Sources Produced Onsite 0.080 0.080
Asphalt and Road Oil 0.233 0.233
Lubricants 0.081 0.081
Naphtha < 401 Degrees 0.113 0.113
Other Oils ≥ 401 Degrees 0.151 0.151
Special Naphthas 0.018 0.018
Waxes 0.007 0.007
Miscellaneous Nonfuel Products 0.027 0.027
Petroleum Coke 0.154 0.154
Still Gas/Waste Gas 0.287 0.287
Pulping Liquor or Black Liquor 0.157 0.157
Net Steam/Hot Water 0.158 0.158
Miscellaneous 0.053 0.053
TOTALS 0.402 1.040 6.387 3.185 2.389 13.403
- 15 -
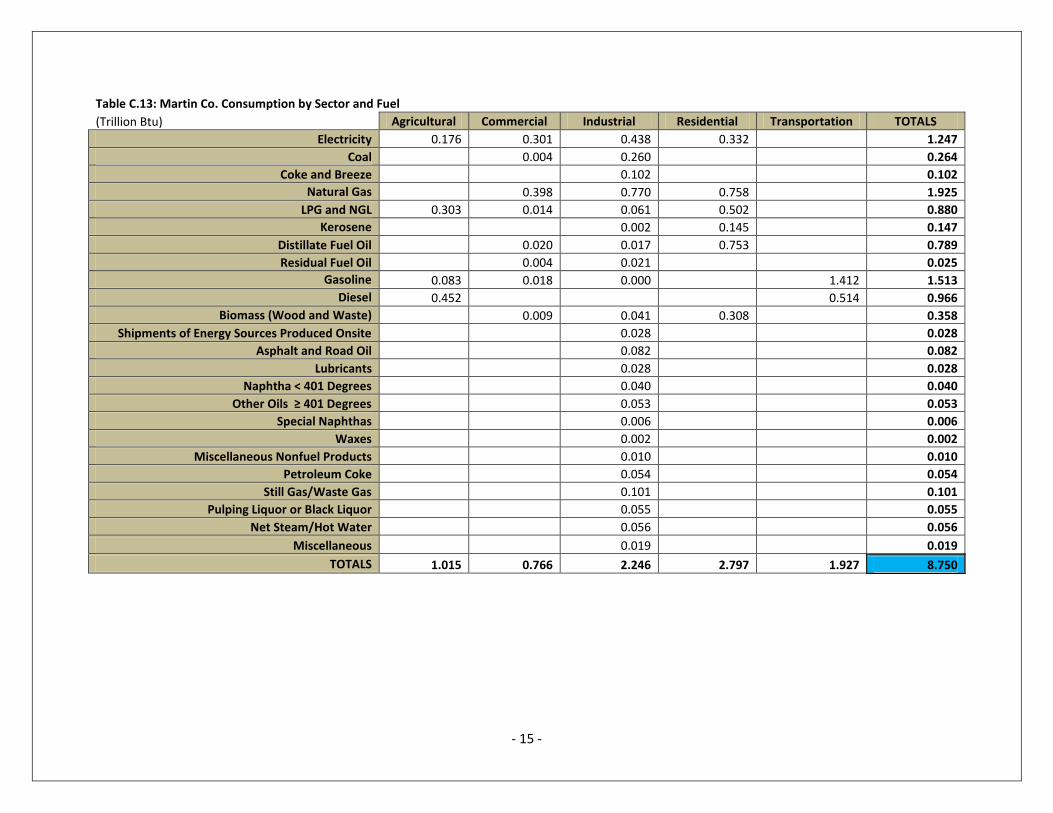
Table C.13: Martin Co. Consumption by Sector and Fuel
(Trillion Btu) Agricultural Commercial Industrial Residential Transportation TOTALS
Electricity 0.176 0.301 0.438 0.332 1.247
Coal 0.004 0.260 0.264
Coke and Breeze 0.102 0.102
Natural Gas 0.398 0.770 0.758 1.925
LPG and NGL 0.303 0.014 0.061 0.502 0.880
Kerosene 0.002 0.145 0.147
Distillate Fuel Oil 0.020 0.017 0.753 0.789
Residual Fuel Oil 0.004 0.021 0.025
Gasoline 0.083 0.018 0.000 1.412 1.513
Diesel 0.452 0.514 0.966
Biomass (Wood and Waste) 0.009 0.041 0.308 0.358
Shipments of Energy Sources Produced Onsite 0.028 0.028
Asphalt and Road Oil 0.082 0.082
Lubricants 0.028 0.028
Naphtha < 401 Degrees 0.040 0.040
Other Oils ≥ 401 Degrees 0.053 0.053
Special Naphthas 0.006 0.006
Waxes 0.002 0.002
Miscellaneous Nonfuel Products 0.010 0.010
Petroleum Coke 0.054 0.054
Still Gas/Waste Gas 0.101 0.101
Pulping Liquor or Black Liquor 0.055 0.055
Net Steam/Hot Water 0.056 0.056
Miscellaneous 0.019 0.019
TOTALS 1.015 0.766 2.246 2.797 1.927 8.750
- 16 -
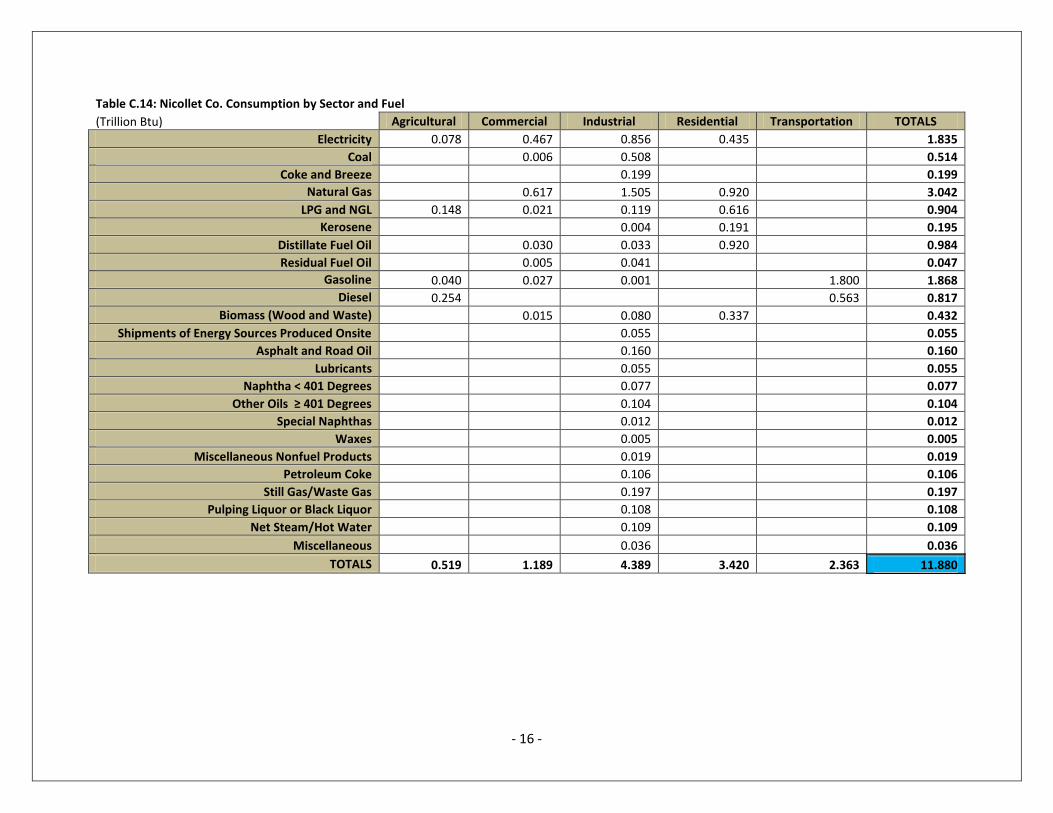
Table C.14: Nicollet Co. Consumption by Sector and Fuel
(Trillion Btu) Agricultural Commercial Industrial Residential Transportation TOTALS
Electricity 0.078 0.467 0.856 0.435 1.835
Coal 0.006 0.508 0.514
Coke and Breeze 0.199 0.199
Natural Gas 0.617 1.505 0.920 3.042
LPG and NGL 0.148 0.021 0.119 0.616 0.904
Kerosene 0.004 0.191 0.195
Distillate Fuel Oil 0.030 0.033 0.920 0.984
Residual Fuel Oil 0.005 0.041 0.047
Gasoline 0.040 0.027 0.001 1.800 1.868
Diesel 0.254 0.563 0.817
Biomass (Wood and Waste) 0.015 0.080 0.337 0.432
Shipments of Energy Sources Produced Onsite 0.055 0.055
Asphalt and Road Oil 0.160 0.160
Lubricants 0.055 0.055
Naphtha < 401 Degrees 0.077 0.077
Other Oils ≥ 401 Degrees 0.104 0.104
Special Naphthas 0.012 0.012
Waxes 0.005 0.005
Miscellaneous Nonfuel Products 0.019 0.019
Petroleum Coke 0.106 0.106
Still Gas/Waste Gas 0.197 0.197
Pulping Liquor or Black Liquor 0.108 0.108
Net Steam/Hot Water 0.109 0.109
Miscellaneous 0.036 0.036
TOTALS 0.519 1.189 4.389 3.420 2.363 11.880
- 17 -
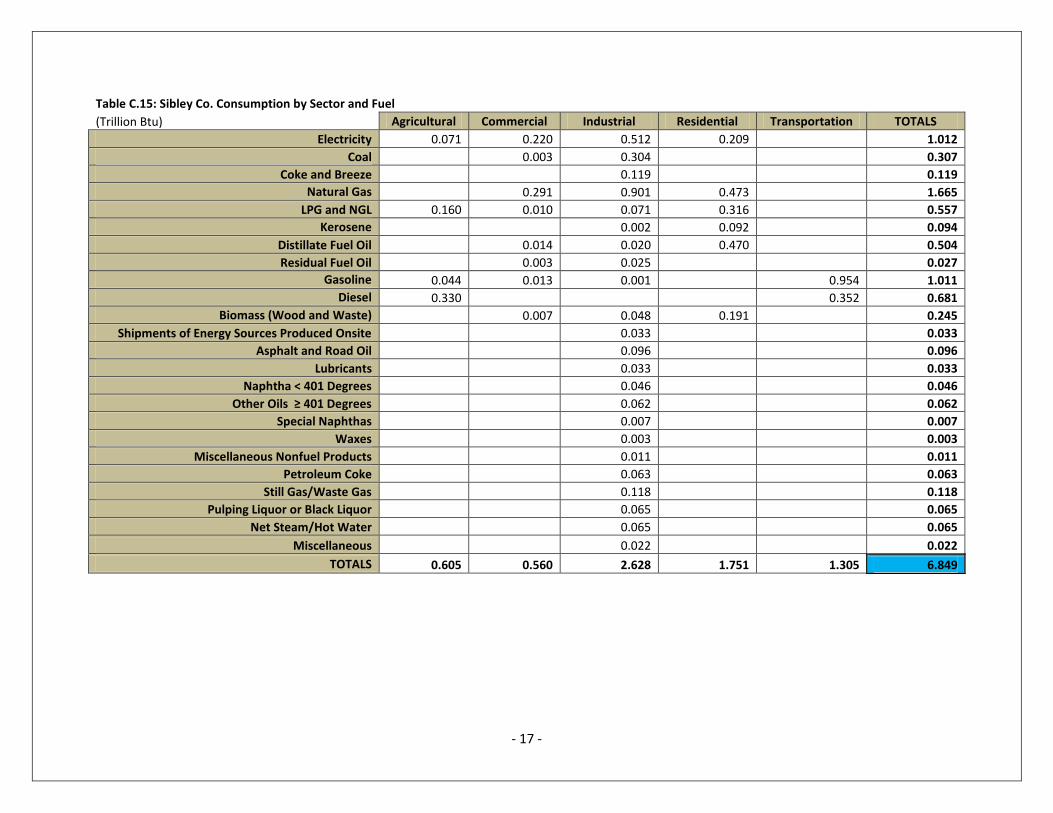
Table C.15: Sibley Co. Consumption by Sector and Fuel
(Trillion Btu) Agricultural Commercial Industrial Residential Transportation TOTALS
Electricity 0.071 0.220 0.512 0.209 1.012
Coal 0.003 0.304 0.307
Coke and Breeze 0.119 0.119
Natural Gas 0.291 0.901 0.473 1.665
LPG and NGL 0.160 0.010 0.071 0.316 0.557
Kerosene 0.002 0.092 0.094
Distillate Fuel Oil 0.014 0.020 0.470 0.504
Residual Fuel Oil 0.003 0.025 0.027
Gasoline 0.044 0.013 0.001 0.954 1.011
Diesel 0.330 0.352 0.681
Biomass (Wood and Waste) 0.007 0.048 0.191 0.245
Shipments of Energy Sources Produced Onsite 0.033 0.033
Asphalt and Road Oil 0.096 0.096
Lubricants 0.033 0.033
Naphtha < 401 Degrees 0.046 0.046
Other Oils ≥ 401 Degrees 0.062 0.062
Special Naphthas 0.007 0.007
Waxes 0.003 0.003
Miscellaneous Nonfuel Products 0.011 0.011
Petroleum Coke 0.063 0.063
Still Gas/Waste Gas 0.118 0.118
Pulping Liquor or Black Liquor 0.065 0.065
Net Steam/Hot Water 0.065 0.065
Miscellaneous 0.022 0.022
TOTALS 0.605 0.560 2.628 1.751 1.305 6.849

- 18 -
Table C.16: Waseca Co. Consumption by Sector and Fuel
(Trillion Btu) Agricultural Commercial Industrial Residential Transportation TOTALS
Electricity 0.076 0.284 0.777 0.262 1.399
Coal 0.004 0.461 0.465
Coke and Breeze 0.181 0.181
Natural Gas 0.375 1.368 0.574 2.316
LPG and NGL 0.153 0.013 0.108 0.384 0.658
Kerosene 0.003 0.121 0.124
Distillate Fuel Oil 0.018 0.030 0.574 0.623
Residual Fuel Oil 0.003 0.037 0.041
Gasoline 0.040 0.017 0.001 1.040 1.098
Diesel 0.253 0.379 0.632
Biomass (Wood and Waste) 0.009 0.073 0.225 0.307
Shipments of Energy Sources Produced Onsite 0.050 0.050
Asphalt and Road Oil 0.145 0.145
Lubricants 0.050 0.050
Naphtha < 401 Degrees 0.070 0.070
Other Oils ≥ 401 Degrees 0.094 0.094
Special Naphthas 0.011 0.011
Waxes 0.004 0.004
Miscellaneous Nonfuel Products 0.017 0.017
Petroleum Coke 0.096 0.096
Still Gas/Waste Gas 0.179 0.179
Pulping Liquor or Black Liquor 0.098 0.098
Net Steam/Hot Water 0.099 0.099
Miscellaneous 0.033 0.033
TOTALS 0.522 0.722 3.988 2.140 1.420 8.791

- 19 -
Table C.17: Watonwan Co. Consumption by Sector and Fuel
(Trillion Btu) Agricultural Commercial Industrial Residential Transportation TOTALS
Electricity 0.042 0.165 0.295 0.170 0.672
Coal 0.002 0.175 0.177
Coke and Breeze 0.069 0.069
Natural Gas 0.217 0.519 0.388 1.124
LPG and NGL 0.128 0.007 0.041 0.258 0.434
Kerosene 0.001 0.076 0.077
Distillate Fuel Oil 0.011 0.011 0.385 0.407
Residual Fuel Oil 0.002 0.014 0.016
Gasoline 0.024 0.010 0.000 0.770 0.803
Diesel 0.143 0.276 0.418
Biomass (Wood and Waste) 0.005 0.028 0.158 0.191
Shipments of Energy Sources Produced Onsite 0.019 0.019
Asphalt and Road Oil 0.055 0.055
Lubricants 0.019 0.019
Naphtha < 401 Degrees 0.027 0.027
Other Oils ≥ 401 Degrees 0.036 0.036
Special Naphthas 0.004 0.004
Waxes 0.002 0.002
Miscellaneous Nonfuel Products 0.006 0.006
Petroleum Coke 0.037 0.037
Still Gas/Waste Gas 0.068 0.068
Pulping Liquor or Black Liquor 0.037 0.037
Net Steam/Hot Water 0.037 0.037
Miscellaneous 0.013 0.013
TOTALS 0.336 0.419 1.513 1.434 1.045 4.748
- 20 -
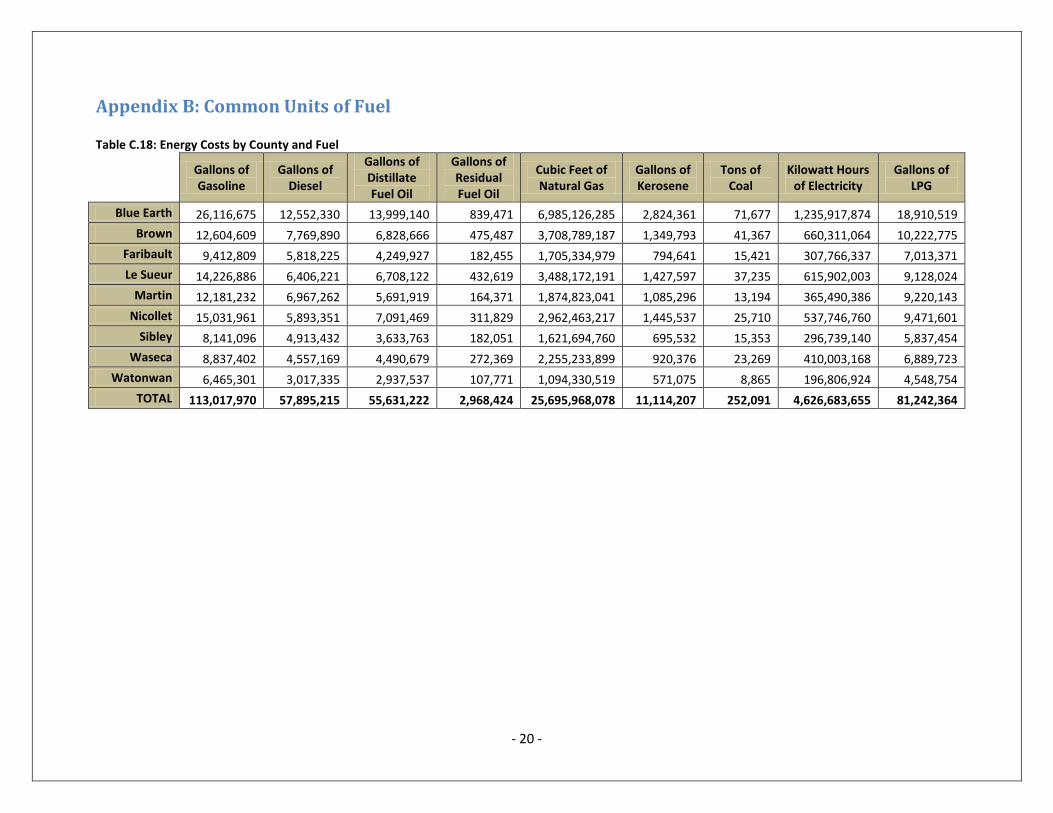
Appendix B: Common Units of Fuel Table C.18: Energy Costs by County and Fuel
Gallons of Gasoline
Gallons of Diesel
Gallons of Distillate Fuel Oil
Gallons of Residual Fuel Oil
Cubic Feet of Natural Gas
Gallons of Kerosene
Tons of Coal
Kilowatt Hours of Electricity
Gallons of LPG
Blue Earth 26,116,675 12,552,330 13,999,140 839,471 6,985,126,285 2,824,361 71,677 1,235,917,874 18,910,519
Brown 12,604,609 7,769,890 6,828,666 475,487 3,708,789,187 1,349,793 41,367 660,311,064 10,222,775
Faribault 9,412,809 5,818,225 4,249,927 182,455 1,705,334,979 794,641 15,421 307,766,337 7,013,371
Le Sueur 14,226,886 6,406,221 6,708,122 432,619 3,488,172,191 1,427,597 37,235 615,902,003 9,128,024
Martin 12,181,232 6,967,262 5,691,919 164,371 1,874,823,041 1,085,296 13,194 365,490,386 9,220,143
Nicollet 15,031,961 5,893,351 7,091,469 311,829 2,962,463,217 1,445,537 25,710 537,746,760 9,471,601
Sibley 8,141,096 4,913,432 3,633,763 182,051 1,621,694,760 695,532 15,353 296,739,140 5,837,454
Waseca 8,837,402 4,557,169 4,490,679 272,369 2,255,233,899 920,376 23,269 410,003,168 6,889,723
Watonwan 6,465,301 3,017,335 2,937,537 107,771 1,094,330,519 571,075 8,865 196,806,924 4,548,754
TOTAL 113,017,970 57,895,215 55,631,222 2,968,424 25,695,968,078 11,114,207 252,091 4,626,683,655 81,242,364
- 21 -
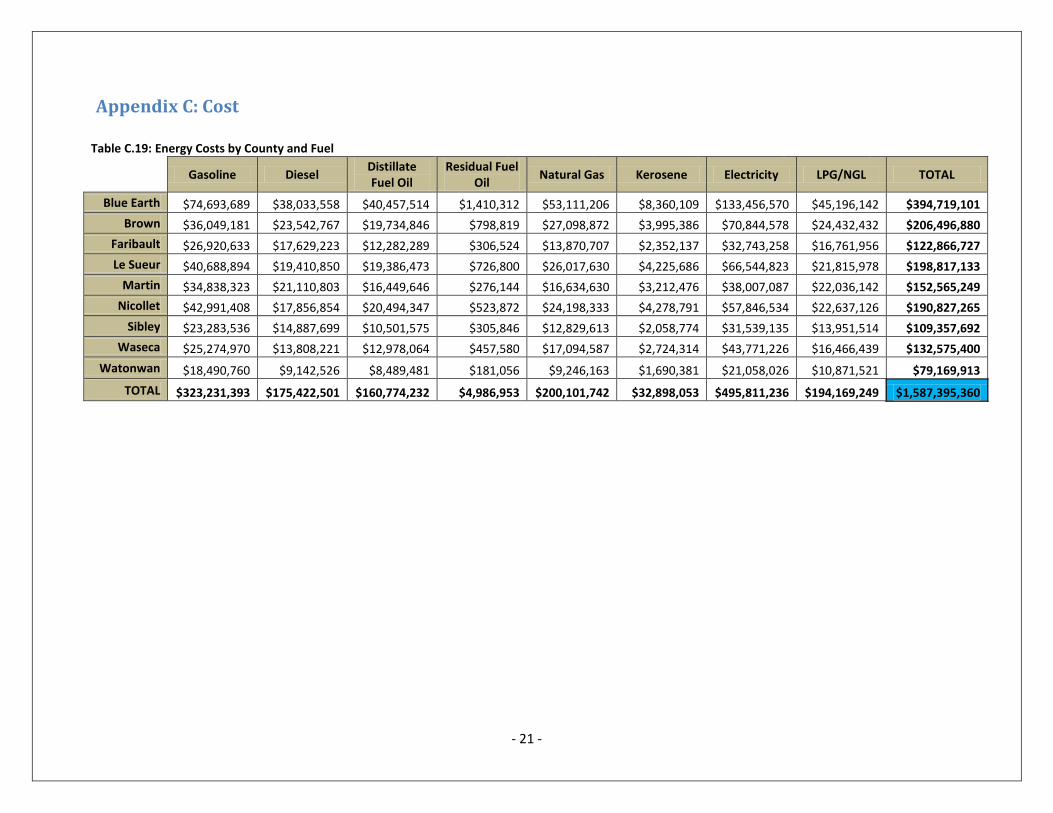
Appendix C: Cost
Table C.19: Energy Costs by County and Fuel
Gasoline Diesel
Distillate Fuel Oil
Residual Fuel Oil
Natural Gas Kerosene Electricity LPG/NGL TOTAL
Blue Earth $74,693,689 $38,033,558 $40,457,514 $1,410,312 $53,111,206 $8,360,109 $133,456,570 $45,196,142 $394,719,101
Brown $36,049,181 $23,542,767 $19,734,846 $798,819 $27,098,872 $3,995,386 $70,844,578 $24,432,432 $206,496,880
Faribault $26,920,633 $17,629,223 $12,282,289 $306,524 $13,870,707 $2,352,137 $32,743,258 $16,761,956 $122,866,727
Le Sueur $40,688,894 $19,410,850 $19,386,473 $726,800 $26,017,630 $4,225,686 $66,544,823 $21,815,978 $198,817,133
Martin $34,838,323 $21,110,803 $16,449,646 $276,144 $16,634,630 $3,212,476 $38,007,087 $22,036,142 $152,565,249
Nicollet $42,991,408 $17,856,854 $20,494,347 $523,872 $24,198,333 $4,278,791 $57,846,534 $22,637,126 $190,827,265
Sibley $23,283,536 $14,887,699 $10,501,575 $305,846 $12,829,613 $2,058,774 $31,539,135 $13,951,514 $109,357,692
Waseca $25,274,970 $13,808,221 $12,978,064 $457,580 $17,094,587 $2,724,314 $43,771,226 $16,466,439 $132,575,400
Watonwan $18,490,760 $9,142,526 $8,489,481 $181,056 $9,246,163 $1,690,381 $21,058,026 $10,871,521 $79,169,913
TOTAL $323,231,393 $175,422,501 $160,774,232 $4,986,953 $200,101,742 $32,898,053 $495,811,236 $194,169,249 $1,587,395,360

- 22 -
Appendix D: Greenhouse Gas Emissions Table C.20: Greenhouse Gas Emissions by County and Fuel
(Tons of GHG) Blue Earth Brown Faribault Le Sueur Martin Nicollet Sibley Waseca Watonwan Totals
Electricity 1,128,073 602,693 280,911 562,159 333,598 490,823 270,846 374,227 179,634 4,225,074
Coal 151,208 87,267 32,531 78,549 27,833 54,237 32,389 49,088 18,701 532,070
Coke and Breeze 62,428 36,101 13,416 32,458 11,412 22,306 13,354 20,268 7,689 219,541
Natural Gas 418,228 222,060 102,105 208,851 112,253 177,375 97,098 135,030 65,522 1,539,292
LPG and NGL 125,120 67,638 46,403 60,395 61,004 62,668 38,623 45,585 30,096 537,802
Kerosene 30,198 14,432 8,496 15,264 11,604 15,456 7,437 9,841 6,106 118,893
Distillate Fuel Oil 155,906 76,050 47,331 74,707 63,390 78,976 40,469 50,012 32,715 619,864
Residual Fuel Oil 10,920 6,185 2,373 5,628 2,138 4,056 2,368 3,543 1,402 38,633
Gasoline 262,543 126,710 94,624 143,018 122,454 151,111 81,840 88,840 64,994 1,136,701
Diesel 143,599 88,888 66,560 73,287 79,705 67,420 56,210 52,134 34,518 662,652
Petroleum Coke 33,305 19,260 7,157 17,316 6,088 11,900 7,124 10,813 4,102 117,126
Totals 2,521,527 1,347,285 701,908 1,271,632 831,481 1,136,330 647,757 839,379 445,479 9,747,648
- 23 -
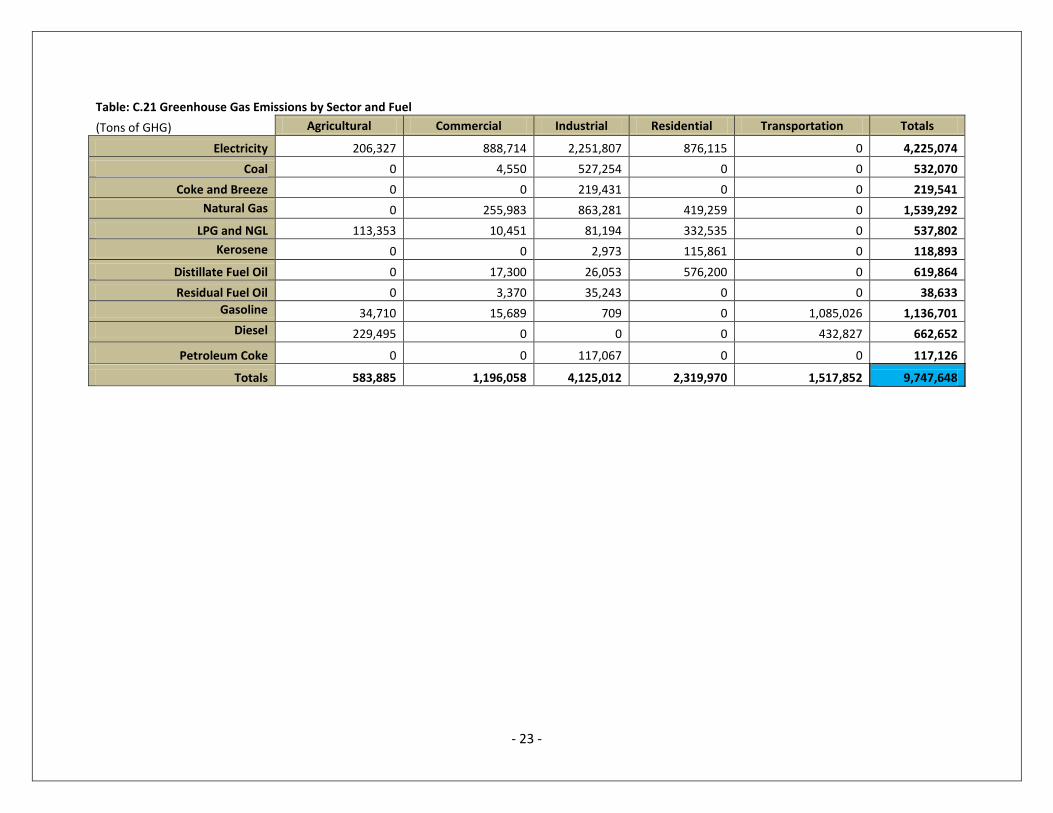
Table: C.21 Greenhouse Gas Emissions by Sector and Fuel (Tons of GHG) Agricultural Commercial Industrial Residential Transportation Totals
Electricity 206,327 888,714 2,251,807 876,115 0 4,225,074
Coal 0 4,550 527,254 0 0 532,070
Coke and Breeze 0 0 219,431 0 0 219,541
Natural Gas 0 255,983 863,281 419,259 0 1,539,292
LPG and NGL 113,353 10,451 81,194 332,535 0 537,802
Kerosene 0 0 2,973 115,861 0 118,893
Distillate Fuel Oil 0 17,300 26,053 576,200 0 619,864
Residual Fuel Oil 0 3,370 35,243 0 0 38,633
Gasoline 34,710 15,689 709 0 1,085,026 1,136,701
Diesel 229,495 0 0 0 432,827 662,652
Petroleum Coke 0 0 117,067 0 0 117,126
Totals 583,885 1,196,058 4,125,012 2,319,970 1,517,852 9,747,648
- 24 -
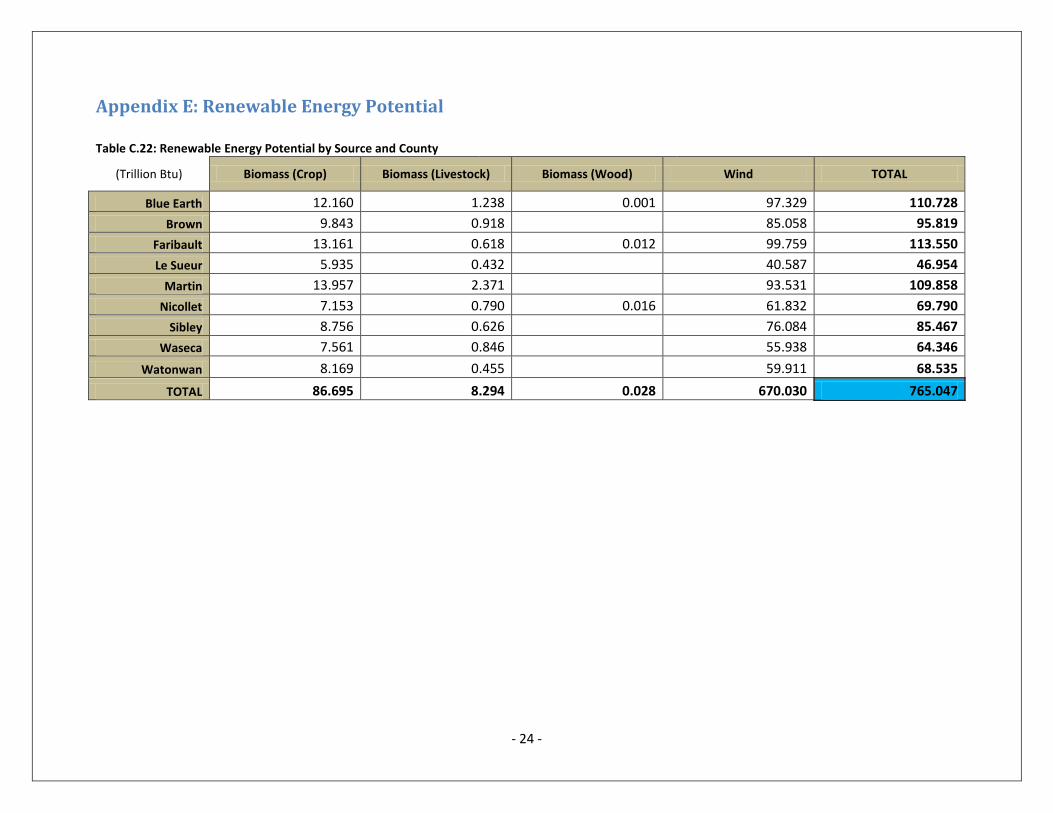
Appendix E: Renewable Energy Potential
Table C.22: Renewable Energy Potential by Source and County
(Trillion Btu) Biomass (Crop) Biomass (Livestock) Biomass (Wood) Wind TOTAL
Blue Earth 12.160 1.238 0.001 97.329 110.728
Brown 9.843 0.918
85.058 95.819
Faribault 13.161 0.618 0.012 99.759 113.550
Le Sueur 5.935 0.432
40.587 46.954
Martin 13.957 2.371
93.531 109.858
Nicollet 7.153 0.790 0.016 61.832 69.790
Sibley 8.756 0.626
76.084 85.467
Waseca 7.561 0.846
55.938 64.346
Watonwan 8.169 0.455
59.911 68.535
TOTAL 86.695 8.294 0.028 670.030 765.047
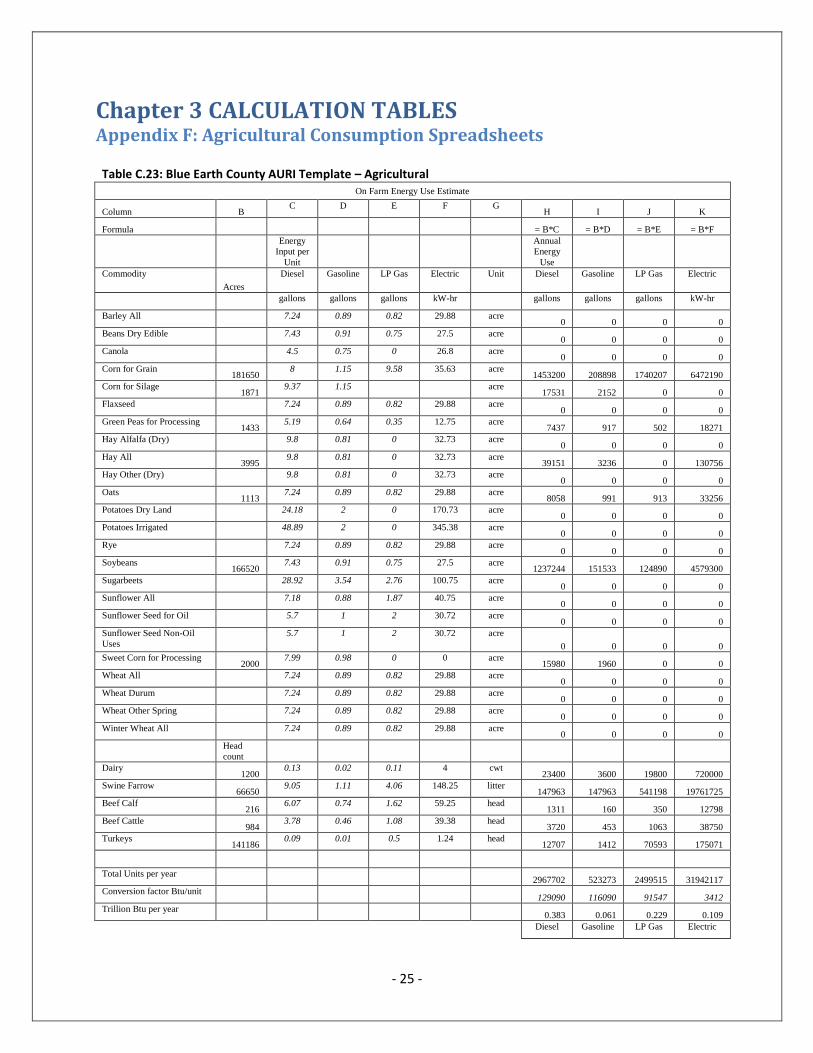
- 25 -
Chapter 3 CALCULATION TABLES Appendix F: Agricultural Consumption Spreadsheets
Table C.23: Blue Earth County AURI Template – Agricultural On Farm Energy Use Estimate
Column B C D E F G
H I J K
Formula
= B*C = B*D = B*E = B*F
Energy
Input per
Unit
Annual
Energy
Use
Commodity
Acres
Diesel Gasoline LP Gas Electric Unit Diesel Gasoline LP Gas Electric
gallons gallons gallons kW-hr gallons gallons gallons kW-hr
Barley All
7.24 0.89 0.82 29.88 acre 0 0 0 0
Beans Dry Edible
7.43 0.91 0.75 27.5 acre 0 0 0 0
Canola
4.5 0.75 0 26.8 acre 0 0 0 0
Corn for Grain 181650
8 1.15 9.58 35.63 acre 1453200 208898 1740207 6472190
Corn for Silage 1871
9.37 1.15 acre 17531 2152 0 0
Flaxseed
7.24 0.89 0.82 29.88 acre 0 0 0 0
Green Peas for Processing 1433
5.19 0.64 0.35 12.75 acre 7437 917 502 18271
Hay Alfalfa (Dry)
9.8 0.81 0 32.73 acre 0 0 0 0
Hay All 3995
9.8 0.81 0 32.73 acre 39151 3236 0 130756
Hay Other (Dry)
9.8 0.81 0 32.73 acre 0 0 0 0
Oats 1113
7.24 0.89 0.82 29.88 acre 8058 991 913 33256
Potatoes Dry Land
24.18 2 0 170.73 acre 0 0 0 0
Potatoes Irrigated
48.89 2 0 345.38 acre 0 0 0 0
Rye
7.24 0.89 0.82 29.88 acre 0 0 0 0
Soybeans 166520
7.43 0.91 0.75 27.5 acre 1237244 151533 124890 4579300
Sugarbeets
28.92 3.54 2.76 100.75 acre 0 0 0 0
Sunflower All
7.18 0.88 1.87 40.75 acre 0 0 0 0
Sunflower Seed for Oil
5.7 1 2 30.72 acre 0 0 0 0
Sunflower Seed Non-Oil
Uses
5.7 1 2 30.72 acre
0 0 0 0
Sweet Corn for Processing 2000
7.99 0.98 0 0 acre 15980 1960 0 0
Wheat All
7.24 0.89 0.82 29.88 acre 0 0 0 0
Wheat Durum
7.24 0.89 0.82 29.88 acre 0 0 0 0
Wheat Other Spring
7.24 0.89 0.82 29.88 acre 0 0 0 0
Winter Wheat All
7.24 0.89 0.82 29.88 acre 0 0 0 0
Head
count
Dairy 1200
0.13 0.02 0.11 4 cwt 23400 3600 19800 720000
Swine Farrow 66650
9.05 1.11 4.06 148.25 litter 147963 147963 541198 19761725
Beef Calf 216
6.07 0.74 1.62 59.25 head 1311 160 350 12798
Beef Cattle 984
3.78 0.46 1.08 39.38 head 3720 453 1063 38750
Turkeys 141186
0.09 0.01 0.5 1.24 head 12707 1412 70593 175071
Total Units per year
2967702 523273 2499515 31942117
Conversion factor Btu/unit
129090 116090 91547 3412
Trillion Btu per year
0.383 0.061 0.229 0.109
Diesel Gasoline LP Gas Electric
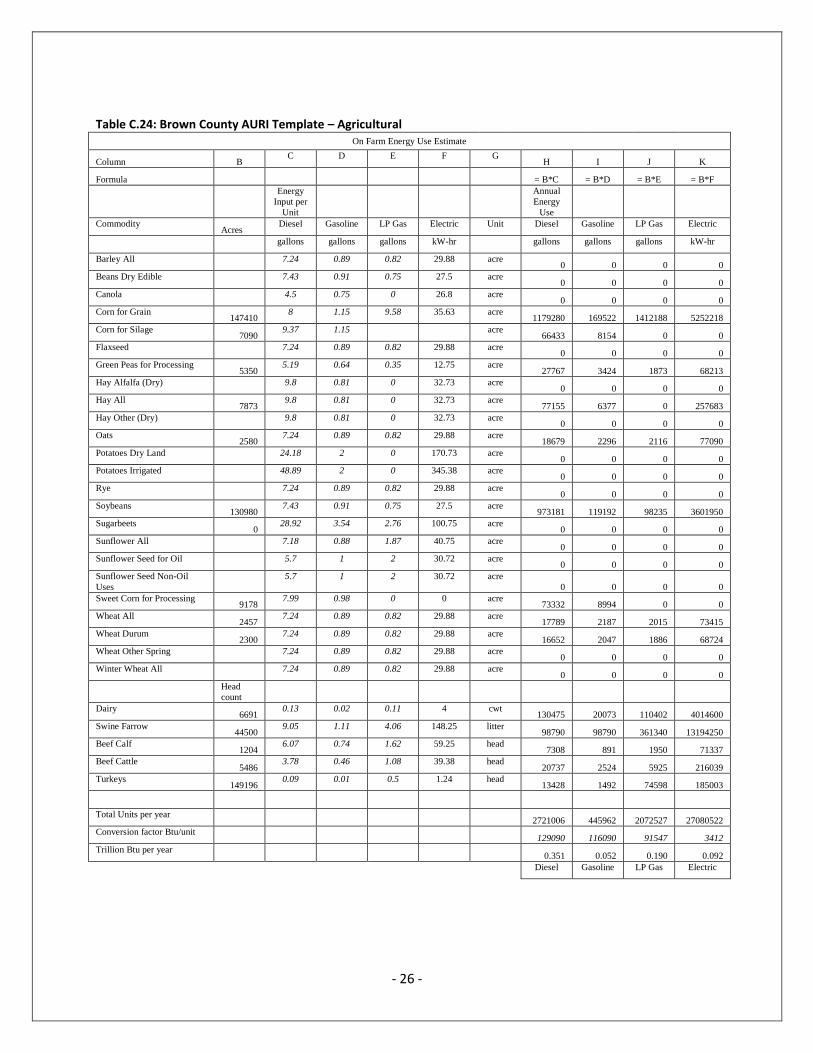
- 26 -
Table C.24: Brown County AURI Template – Agricultural
On Farm Energy Use Estimate
Column B C D E F G
H I J K
Formula
= B*C = B*D = B*E = B*F
Energy
Input per
Unit
Annual
Energy
Use
Commodity Acres
Diesel Gasoline LP Gas Electric Unit Diesel Gasoline LP Gas Electric
gallons gallons gallons kW-hr gallons gallons gallons kW-hr
Barley All
7.24 0.89 0.82 29.88 acre 0 0 0 0
Beans Dry Edible
7.43 0.91 0.75 27.5 acre 0 0 0 0
Canola
4.5 0.75 0 26.8 acre 0 0 0 0
Corn for Grain 147410
8 1.15 9.58 35.63 acre 1179280 169522 1412188 5252218
Corn for Silage 7090
9.37 1.15 acre 66433 8154 0 0
Flaxseed
7.24 0.89 0.82 29.88 acre 0 0 0 0
Green Peas for Processing 5350
5.19 0.64 0.35 12.75 acre 27767 3424 1873 68213
Hay Alfalfa (Dry)
9.8 0.81 0 32.73 acre 0 0 0 0
Hay All 7873
9.8 0.81 0 32.73 acre 77155 6377 0 257683
Hay Other (Dry)
9.8 0.81 0 32.73 acre 0 0 0 0
Oats 2580
7.24 0.89 0.82 29.88 acre 18679 2296 2116 77090
Potatoes Dry Land
24.18 2 0 170.73 acre 0 0 0 0
Potatoes Irrigated
48.89 2 0 345.38 acre 0 0 0 0
Rye
7.24 0.89 0.82 29.88 acre 0 0 0 0
Soybeans 130980
7.43 0.91 0.75 27.5 acre 973181 119192 98235 3601950
Sugarbeets 0
28.92 3.54 2.76 100.75 acre 0 0 0 0
Sunflower All
7.18 0.88 1.87 40.75 acre 0 0 0 0
Sunflower Seed for Oil
5.7 1 2 30.72 acre 0 0 0 0
Sunflower Seed Non-Oil
Uses
5.7 1 2 30.72 acre
0 0 0 0
Sweet Corn for Processing 9178
7.99 0.98 0 0 acre 73332 8994 0 0
Wheat All 2457
7.24 0.89 0.82 29.88 acre 17789 2187 2015 73415
Wheat Durum 2300
7.24 0.89 0.82 29.88 acre 16652 2047 1886 68724
Wheat Other Spring
7.24 0.89 0.82 29.88 acre 0 0 0 0
Winter Wheat All
7.24 0.89 0.82 29.88 acre 0 0 0 0
Head
count
Dairy 6691
0.13 0.02 0.11 4 cwt 130475 20073 110402 4014600
Swine Farrow 44500
9.05 1.11 4.06 148.25 litter 98790 98790 361340 13194250
Beef Calf 1204
6.07 0.74 1.62 59.25 head 7308 891 1950 71337
Beef Cattle 5486
3.78 0.46 1.08 39.38 head 20737 2524 5925 216039
Turkeys 149196
0.09 0.01 0.5 1.24 head 13428 1492 74598 185003
Total Units per year
2721006 445962 2072527 27080522
Conversion factor Btu/unit
129090 116090 91547 3412
Trillion Btu per year
0.351 0.052 0.190 0.092
Diesel Gasoline LP Gas Electric

- 27 -
Table C.25: Faribault County AURI Template – Agricultural On Farm Energy Use Estimate
Column B C D E F G
H I J K
Formula
= B*C = B*D = B*E = B*F
Energy
Input per
Unit
Annual
Energy
Use
Commodity Acres
Diesel Gasoline LP Gas Electric Unit Diesel Gasoline LP Gas Electric
gallons gallons gallons kW-hr gallons gallons gallons kW-hr
Barley All
7.24 0.89 0.82 29.88 acre 0 0 0 0
Beans Dry Edible
7.43 0.91 0.75 27.5 acre 0 0 0 0
Canola
4.5 0.75 0 26.8 acre 0 0 0 0
Corn for Grain 200270
8 1.15 9.58 35.63 acre 1602160 230311 1918587 7135620
Corn for Silage 2475
9.37 1.15 acre 23191 2846 0 0
Flaxseed
7.24 0.89 0.82 29.88 acre 0 0 0 0
Green Peas for Processing 2738
5.19 0.64 0.35 12.75 acre 14210 1752 958 34910
Hay Alfalfa (Dry)
9.8 0.81 0 32.73 acre 0 0 0 0
Hay All 3285
9.8 0.81 0 32.73 acre 32193 2661 0 107518
Hay Other (Dry)
9.8 0.81 0 32.73 acre 0 0 0 0
Oats 1080
7.24 0.89 0.82 29.88 acre 7819 961 886 32270
Potatoes Dry Land
24.18 2 0 170.73 acre 0 0 0 0
Potatoes Irrigated
48.89 2 0 345.38 acre 0 0 0 0
Rye
7.24 0.89 0.82 29.88 acre 0 0 0 0
Soybeans 171840
7.43 0.91 0.75 27.5 acre 1276771 156374 128880 4725600
Sugarbeets 0
28.92 3.54 2.76 100.75 acre 0 0 0 0
Sunflower All
7.18 0.88 1.87 40.75 acre 0 0 0 0
Sunflower Seed for Oil
5.7 1 2 30.72 acre 0 0 0 0
Sunflower Seed Non-Oil
Uses
5.7 1 2 30.72 acre
0 0 0 0
Sweet Corn for Processing 6078
7.99 0.98 0 0 acre 48563 5956 0 0
Wheat All 700
7.24 0.89 0.82 29.88 acre 5068 623 574 20916
Wheat Durum 0
7.24 0.89 0.82 29.88 acre 0 0 0 0
Wheat Other Spring
7.24 0.89 0.82 29.88 acre 0 0 0 0
Winter Wheat All 0
7.24 0.89 0.82 29.88 acre 0 0 0 0
Head
count
Dairy 2280
0.13 0.02 0.11 4 cwt 44460 6840 37620 1368000
Swine Farrow 32200
9.05 1.11 4.06 148.25 litter 71484 71484 261464 9547300
Beef Calf 495
6.07 0.74 1.62 59.25 head 3005 366 802 29329
Beef Cattle 990
3.78 0.46 1.08 39.38 head 3742 455 1069 38986
Turkeys 104
0.09 0.01 0.5 1.24 head 9 1 52 129
Total Units per year
3132676 480632 2350892 23040578
Conversion factor Btu/unit
129090 116090 91547 3412
Trillion Btu per year
0.404 0.056 0.215 0.079
Diesel Gasoline LP Gas Electric
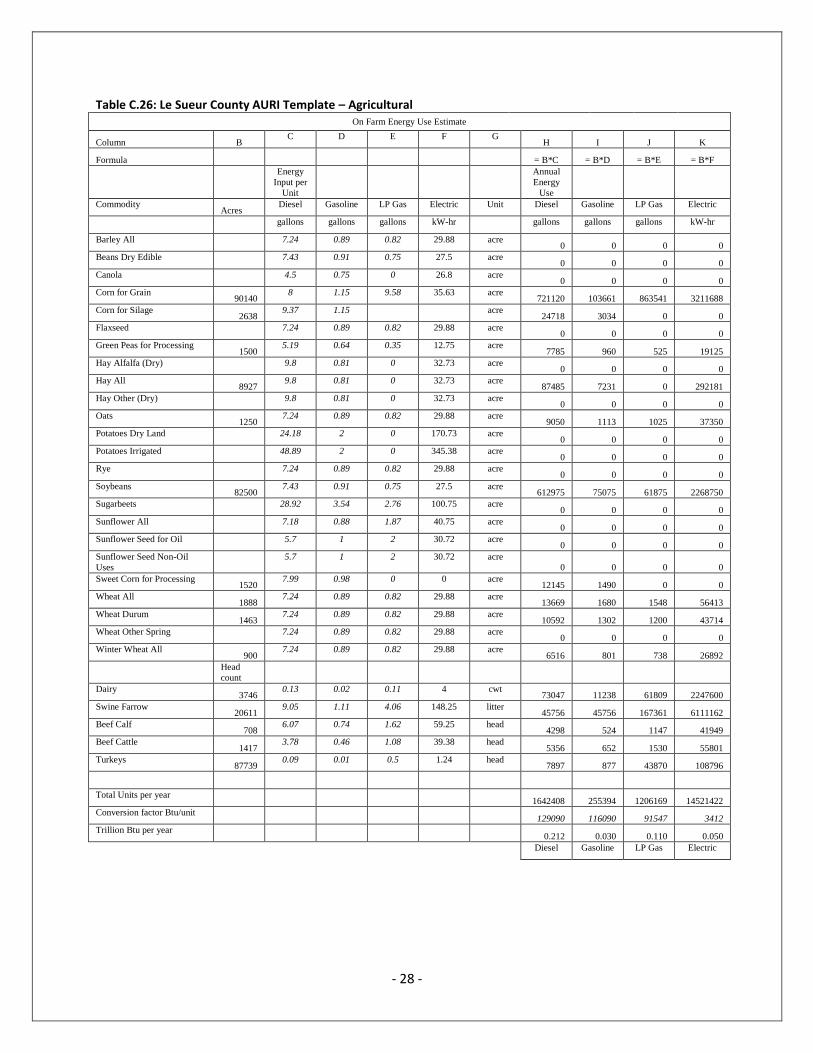
- 28 -
Table C.26: Le Sueur County AURI Template – Agricultural On Farm Energy Use Estimate
Column B C D E F G
H I J K
Formula
= B*C = B*D = B*E = B*F
Energy
Input per
Unit
Annual
Energy
Use
Commodity Acres
Diesel Gasoline LP Gas Electric Unit Diesel Gasoline LP Gas Electric
gallons gallons gallons kW-hr gallons gallons gallons kW-hr
Barley All
7.24 0.89 0.82 29.88 acre 0 0 0 0
Beans Dry Edible
7.43 0.91 0.75 27.5 acre 0 0 0 0
Canola
4.5 0.75 0 26.8 acre 0 0 0 0
Corn for Grain 90140
8 1.15 9.58 35.63 acre 721120 103661 863541 3211688
Corn for Silage 2638
9.37 1.15 acre 24718 3034 0 0
Flaxseed
7.24 0.89 0.82 29.88 acre 0 0 0 0
Green Peas for Processing 1500
5.19 0.64 0.35 12.75 acre 7785 960 525 19125
Hay Alfalfa (Dry)
9.8 0.81 0 32.73 acre 0 0 0 0
Hay All 8927
9.8 0.81 0 32.73 acre 87485 7231 0 292181
Hay Other (Dry)
9.8 0.81 0 32.73 acre 0 0 0 0
Oats 1250
7.24 0.89 0.82 29.88 acre 9050 1113 1025 37350
Potatoes Dry Land
24.18 2 0 170.73 acre 0 0 0 0
Potatoes Irrigated
48.89 2 0 345.38 acre 0 0 0 0
Rye
7.24 0.89 0.82 29.88 acre 0 0 0 0
Soybeans 82500
7.43 0.91 0.75 27.5 acre 612975 75075 61875 2268750
Sugarbeets
28.92 3.54 2.76 100.75 acre 0 0 0 0
Sunflower All
7.18 0.88 1.87 40.75 acre 0 0 0 0
Sunflower Seed for Oil
5.7 1 2 30.72 acre 0 0 0 0
Sunflower Seed Non-Oil
Uses
5.7 1 2 30.72 acre
0 0 0 0
Sweet Corn for Processing 1520
7.99 0.98 0 0 acre 12145 1490 0 0
Wheat All 1888
7.24 0.89 0.82 29.88 acre 13669 1680 1548 56413
Wheat Durum 1463
7.24 0.89 0.82 29.88 acre 10592 1302 1200 43714
Wheat Other Spring
7.24 0.89 0.82 29.88 acre 0 0 0 0
Winter Wheat All 900
7.24 0.89 0.82 29.88 acre 6516 801 738 26892
Head
count
Dairy 3746
0.13 0.02 0.11 4 cwt 73047 11238 61809 2247600
Swine Farrow 20611
9.05 1.11 4.06 148.25 litter 45756 45756 167361 6111162
Beef Calf 708
6.07 0.74 1.62 59.25 head 4298 524 1147 41949
Beef Cattle 1417
3.78 0.46 1.08 39.38 head 5356 652 1530 55801
Turkeys 87739
0.09 0.01 0.5 1.24 head 7897 877 43870 108796
Total Units per year
1642408 255394 1206169 14521422
Conversion factor Btu/unit
129090 116090 91547 3412
Trillion Btu per year
0.212 0.030 0.110 0.050
Diesel Gasoline LP Gas Electric
- 29 -
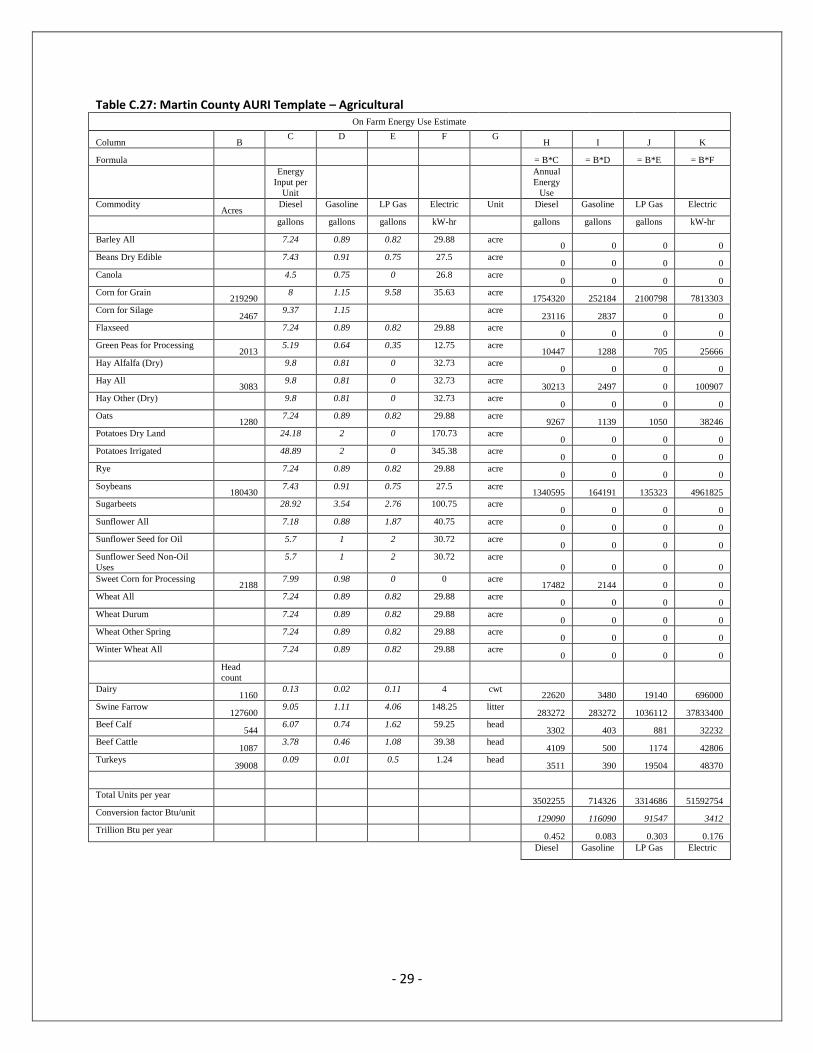
Table C.27: Martin County AURI Template – Agricultural On Farm Energy Use Estimate
Column B C D E F G
H I J K
Formula
= B*C = B*D = B*E = B*F
Energy
Input per
Unit
Annual
Energy
Use
Commodity Acres
Diesel Gasoline LP Gas Electric Unit Diesel Gasoline LP Gas Electric
gallons gallons gallons kW-hr gallons gallons gallons kW-hr
Barley All
7.24 0.89 0.82 29.88 acre 0 0 0 0
Beans Dry Edible
7.43 0.91 0.75 27.5 acre 0 0 0 0
Canola
4.5 0.75 0 26.8 acre 0 0 0 0
Corn for Grain 219290
8 1.15 9.58 35.63 acre 1754320 252184 2100798 7813303
Corn for Silage 2467
9.37 1.15 acre 23116 2837 0 0
Flaxseed
7.24 0.89 0.82 29.88 acre 0 0 0 0
Green Peas for Processing 2013
5.19 0.64 0.35 12.75 acre 10447 1288 705 25666
Hay Alfalfa (Dry)
9.8 0.81 0 32.73 acre 0 0 0 0
Hay All 3083
9.8 0.81 0 32.73 acre 30213 2497 0 100907
Hay Other (Dry)
9.8 0.81 0 32.73 acre 0 0 0 0
Oats 1280
7.24 0.89 0.82 29.88 acre 9267 1139 1050 38246
Potatoes Dry Land
24.18 2 0 170.73 acre 0 0 0 0
Potatoes Irrigated
48.89 2 0 345.38 acre 0 0 0 0
Rye
7.24 0.89 0.82 29.88 acre 0 0 0 0
Soybeans 180430
7.43 0.91 0.75 27.5 acre 1340595 164191 135323 4961825
Sugarbeets
28.92 3.54 2.76 100.75 acre 0 0 0 0
Sunflower All
7.18 0.88 1.87 40.75 acre 0 0 0 0
Sunflower Seed for Oil
5.7 1 2 30.72 acre 0 0 0 0
Sunflower Seed Non-Oil
Uses
5.7 1 2 30.72 acre
0 0 0 0
Sweet Corn for Processing 2188
7.99 0.98 0 0 acre 17482 2144 0 0
Wheat All
7.24 0.89 0.82 29.88 acre 0 0 0 0
Wheat Durum
7.24 0.89 0.82 29.88 acre 0 0 0 0
Wheat Other Spring
7.24 0.89 0.82 29.88 acre 0 0 0 0
Winter Wheat All
7.24 0.89 0.82 29.88 acre 0 0 0 0
Head
count
Dairy 1160
0.13 0.02 0.11 4 cwt 22620 3480 19140 696000
Swine Farrow 127600
9.05 1.11 4.06 148.25 litter 283272 283272 1036112 37833400
Beef Calf 544
6.07 0.74 1.62 59.25 head 3302 403 881 32232
Beef Cattle 1087
3.78 0.46 1.08 39.38 head 4109 500 1174 42806
Turkeys 39008
0.09 0.01 0.5 1.24 head 3511 390 19504 48370
Total Units per year
3502255 714326 3314686 51592754
Conversion factor Btu/unit
129090 116090 91547 3412
Trillion Btu per year
0.452 0.083 0.303 0.176
Diesel Gasoline LP Gas Electric
- 30 -
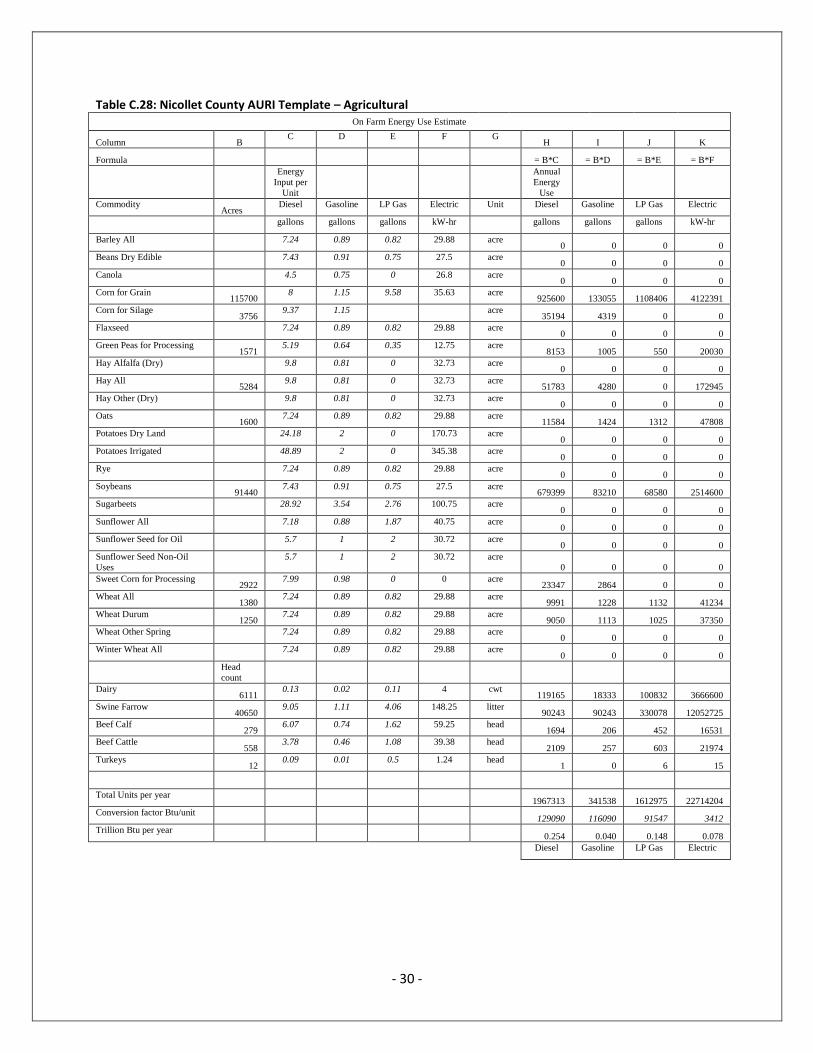
Table C.28: Nicollet County AURI Template – Agricultural On Farm Energy Use Estimate
Column B C D E F G
H I J K
Formula
= B*C = B*D = B*E = B*F
Energy
Input per
Unit
Annual
Energy
Use
Commodity Acres
Diesel Gasoline LP Gas Electric Unit Diesel Gasoline LP Gas Electric
gallons gallons gallons kW-hr gallons gallons gallons kW-hr
Barley All
7.24 0.89 0.82 29.88 acre 0 0 0 0
Beans Dry Edible
7.43 0.91 0.75 27.5 acre 0 0 0 0
Canola
4.5 0.75 0 26.8 acre 0 0 0 0
Corn for Grain 115700
8 1.15 9.58 35.63 acre 925600 133055 1108406 4122391
Corn for Silage 3756
9.37 1.15 acre 35194 4319 0 0
Flaxseed
7.24 0.89 0.82 29.88 acre 0 0 0 0
Green Peas for Processing 1571
5.19 0.64 0.35 12.75 acre 8153 1005 550 20030
Hay Alfalfa (Dry)
9.8 0.81 0 32.73 acre 0 0 0 0
Hay All 5284
9.8 0.81 0 32.73 acre 51783 4280 0 172945
Hay Other (Dry)
9.8 0.81 0 32.73 acre 0 0 0 0
Oats 1600
7.24 0.89 0.82 29.88 acre 11584 1424 1312 47808
Potatoes Dry Land
24.18 2 0 170.73 acre 0 0 0 0
Potatoes Irrigated
48.89 2 0 345.38 acre 0 0 0 0
Rye
7.24 0.89 0.82 29.88 acre 0 0 0 0
Soybeans 91440
7.43 0.91 0.75 27.5 acre 679399 83210 68580 2514600
Sugarbeets
28.92 3.54 2.76 100.75 acre 0 0 0 0
Sunflower All
7.18 0.88 1.87 40.75 acre 0 0 0 0
Sunflower Seed for Oil
5.7 1 2 30.72 acre 0 0 0 0
Sunflower Seed Non-Oil
Uses
5.7 1 2 30.72 acre
0 0 0 0
Sweet Corn for Processing 2922
7.99 0.98 0 0 acre 23347 2864 0 0
Wheat All 1380
7.24 0.89 0.82 29.88 acre 9991 1228 1132 41234
Wheat Durum 1250
7.24 0.89 0.82 29.88 acre 9050 1113 1025 37350
Wheat Other Spring
7.24 0.89 0.82 29.88 acre 0 0 0 0
Winter Wheat All
7.24 0.89 0.82 29.88 acre 0 0 0 0
Head
count
Dairy 6111
0.13 0.02 0.11 4 cwt 119165 18333 100832 3666600
Swine Farrow 40650
9.05 1.11 4.06 148.25 litter 90243 90243 330078 12052725
Beef Calf 279
6.07 0.74 1.62 59.25 head 1694 206 452 16531
Beef Cattle 558
3.78 0.46 1.08 39.38 head 2109 257 603 21974
Turkeys 12
0.09 0.01 0.5 1.24 head 1 0 6 15
Total Units per year
1967313 341538 1612975 22714204
Conversion factor Btu/unit
129090 116090 91547 3412
Trillion Btu per year
0.254 0.040 0.148 0.078
Diesel Gasoline LP Gas Electric

- 31 -
Table C.29: Sibley County AURI Template – Agricultural On Farm Energy Use Estimate
Column B C D E F G
H I J K
Formula
= B*C = B*D = B*E = B*F
Energy
Input per
Unit
Annual
Energy
Use
Commodity Acres
Diesel Gasoline LP Gas Electric Unit Diesel Gasoline LP Gas Electric
gallons gallons gallons kW-hr gallons gallons gallons kW-hr
Barley All
7.24 0.89 0.82 29.88 acre 0 0 0 0
Beans Dry Edible
7.43 0.91 0.75 27.5 acre 0 0 0 0
Canola
4.5 0.75 0 26.8 acre 0 0 0 0
Corn for Grain 137630
8 1.15 9.58 35.63 acre 1101040 158275 1318495 4903757
Corn for Silage 5411
9.37 1.15 acre 50701 6223 0 0
Flaxseed
7.24 0.89 0.82 29.88 acre 0 0 0 0
Green Peas for Processing 5088
5.19 0.64 0.35 12.75 acre 26407 3256 1781 64872
Hay Alfalfa (Dry)
9.8 0.81 0 32.73 acre 0 0 0 0
Hay All 9773
9.8 0.81 0 32.73 acre 95775 7916 0 319870
Hay Other (Dry)
9.8 0.81 0 32.73 acre 0 0 0 0
Oats 1575
7.24 0.89 0.82 29.88 acre 11403 1402 1292 47061
Potatoes Dry Land
24.18 2 0 170.73 acre 0 0 0 0
Potatoes Irrigated
48.89 2 0 345.38 acre 0 0 0 0
Rye
7.24 0.89 0.82 29.88 acre 0 0 0 0
Soybeans 115690
7.43 0.91 0.75 27.5 acre 859577 105278 86768 3181475
Sugarbeets 3000
28.92 3.54 2.76 100.75 acre 86760 10620 8280 302250
Sunflower All
7.18 0.88 1.87 40.75 acre 0 0 0 0
Sunflower Seed for Oil
5.7 1 2 30.72 acre 0 0 0 0
Sunflower Seed Non-Oil
Uses
5.7 1 2 30.72 acre
0 0 0 0
Sweet Corn for Processing 8125
7.99 0.98 0 0 acre 64919 7963 0 0
Wheat All 2800
7.24 0.89 0.82 29.88 acre 20272 2492 2296 83664
Wheat Durum 2656
7.24 0.89 0.82 29.88 acre 19229 2364 2178 79361
Wheat Other Spring
7.24 0.89 0.82 29.88 acre 0 0 0 0
Winter Wheat All 750
7.24 0.89 0.82 29.88 acre 5430 668 615 22410
Head
count
Dairy 7800
0.13 0.02 0.11 4 cwt 152100 23400 128700 4680000
Swine Farrow 23400
9.05 1.11 4.06 148.25 litter 51948 51948 190008 6938100
Beef Calf 718
6.07 0.74 1.62 59.25 head 4358 531 1163 42542
Beef Cattle 1435
3.78 0.46 1.08 39.38 head 5424 660 1550 56510
Turkeys 67
0.09 0.01 0.5 1.24 head 6 1 34 83
Total Units per year
2555350 382995 1743159 20721955
Conversion factor Btu/unit
129090 116090 91547 3412
Trillion Btu per year
0.330 0.044 0.160 0.071
Diesel Gasoline LP Gas Electric

- 32 -
Table C.30: Waseca County AURI Template – Agricultural On Farm Energy Use Estimate
Column B C D E F G
H I J K
Formula
= B*C = B*D = B*E = B*F
Energy
Input per
Unit
Annual
Energy
Use
Commodity Acres
Diesel Gasoline LP Gas Electric Unit Diesel Gasoline LP Gas Electric
gallons gallons gallons kW-hr gallons gallons gallons kW-hr
Barley All
7.24 0.89 0.82 29.88 acre 0 0 0 0
Beans Dry Edible
7.43 0.91 0.75 27.5 acre 0 0 0 0
Canola
4.5 0.75 0 26.8 acre 0 0 0 0
Corn for Grain 117160
8 1.15 9.58 35.63 acre 937280 134734 1122393 4174411
Corn for Silage 2443
9.37 1.15 acre 22891 2809 0 0
Flaxseed
7.24 0.89 0.82 29.88 acre 0 0 0 0
Green Peas for Processing 2475
5.19 0.64 0.35 12.75 acre 12845 1584 866 31556
Hay Alfalfa (Dry)
9.8 0.81 0 32.73 acre 0 0 0 0
Hay All 4435
9.8 0.81 0 32.73 acre 43463 3592 0 145158
Hay Other (Dry)
9.8 0.81 0 32.73 acre 0 0 0 0
Oats 975
7.24 0.89 0.82 29.88 acre 7059 868 800 29133
Potatoes Dry Land
24.18 2 0 170.73 acre 0 0 0 0
Potatoes Irrigated
48.89 2 0 345.38 acre 0 0 0 0
Rye
7.24 0.89 0.82 29.88 acre 0 0 0 0
Soybeans 96080
7.43 0.91 0.75 27.5 acre 713874 87433 72060 2642200
Sugarbeets
28.92 3.54 2.76 100.75 acre 0 0 0 0
Sunflower All
7.18 0.88 1.87 40.75 acre 0 0 0 0
Sunflower Seed for Oil
5.7 1 2 30.72 acre 0 0 0 0
Sunflower Seed Non-Oil
Uses
5.7 1 2 30.72 acre
0 0 0 0
Sweet Corn for Processing 5788
7.99 0.98 0 0 acre 46246 5672 0 0
Wheat All 800
7.24 0.89 0.82 29.88 acre 5792 712 656 23904
Wheat Durum
7.24 0.89 0.82 29.88 acre 0 0 0 0
Wheat Other Spring
7.24 0.89 0.82 29.88 acre 0 0 0 0
Winter Wheat All
7.24 0.89 0.82 29.88 acre 0 0 0 0
Head
count
Dairy 2580
0.13 0.02 0.11 4 cwt 50310 7740 42570 1548000
Swine Farrow 45200
9.05 1.11 4.06 148.25 litter 100344 100344 367024 13401800
Beef Calf 457
6.07 0.74 1.62 59.25 head 2774 338 740 27077
Beef Cattle 913
3.78 0.46 1.08 39.38 head 3451 420 986 35954
Turkeys 121467
0.09 0.01 0.5 1.24 head 10932 1215 60734 150619
Total Units per year
1957262 347461 1668828 22209812
Conversion factor Btu/unit
129090 116090 91547 3412
Trillion Btu per year
0.253 0.040 0.153 0.076
Diesel Gasoline LP Gas Electric
- 33 -
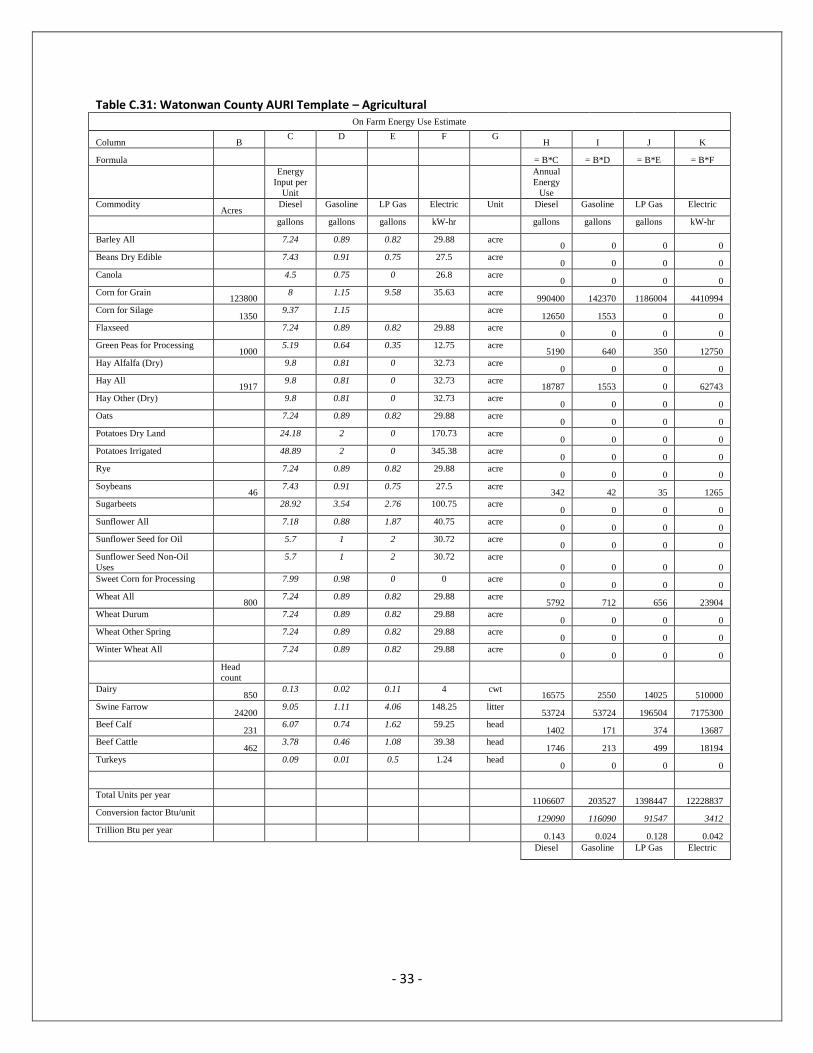
Table C.31: Watonwan County AURI Template – Agricultural On Farm Energy Use Estimate
Column B C D E F G
H I J K
Formula
= B*C = B*D = B*E = B*F
Energy
Input per
Unit
Annual
Energy
Use
Commodity Acres
Diesel Gasoline LP Gas Electric Unit Diesel Gasoline LP Gas Electric
gallons gallons gallons kW-hr gallons gallons gallons kW-hr
Barley All
7.24 0.89 0.82 29.88 acre 0 0 0 0
Beans Dry Edible
7.43 0.91 0.75 27.5 acre 0 0 0 0
Canola
4.5 0.75 0 26.8 acre 0 0 0 0
Corn for Grain 123800
8 1.15 9.58 35.63 acre 990400 142370 1186004 4410994
Corn for Silage 1350
9.37 1.15 acre 12650 1553 0 0
Flaxseed
7.24 0.89 0.82 29.88 acre 0 0 0 0
Green Peas for Processing 1000
5.19 0.64 0.35 12.75 acre 5190 640 350 12750
Hay Alfalfa (Dry)
9.8 0.81 0 32.73 acre 0 0 0 0
Hay All 1917
9.8 0.81 0 32.73 acre 18787 1553 0 62743
Hay Other (Dry)
9.8 0.81 0 32.73 acre 0 0 0 0
Oats
7.24 0.89 0.82 29.88 acre 0 0 0 0
Potatoes Dry Land
24.18 2 0 170.73 acre 0 0 0 0
Potatoes Irrigated
48.89 2 0 345.38 acre 0 0 0 0
Rye
7.24 0.89 0.82 29.88 acre 0 0 0 0
Soybeans 46
7.43 0.91 0.75 27.5 acre 342 42 35 1265
Sugarbeets
28.92 3.54 2.76 100.75 acre 0 0 0 0
Sunflower All
7.18 0.88 1.87 40.75 acre 0 0 0 0
Sunflower Seed for Oil
5.7 1 2 30.72 acre 0 0 0 0
Sunflower Seed Non-Oil
Uses
5.7 1 2 30.72 acre
0 0 0 0
Sweet Corn for Processing
7.99 0.98 0 0 acre 0 0 0 0
Wheat All 800
7.24 0.89 0.82 29.88 acre 5792 712 656 23904
Wheat Durum
7.24 0.89 0.82 29.88 acre 0 0 0 0
Wheat Other Spring
7.24 0.89 0.82 29.88 acre 0 0 0 0
Winter Wheat All
7.24 0.89 0.82 29.88 acre 0 0 0 0
Head
count
Dairy 850
0.13 0.02 0.11 4 cwt 16575 2550 14025 510000
Swine Farrow 24200
9.05 1.11 4.06 148.25 litter 53724 53724 196504 7175300
Beef Calf 231
6.07 0.74 1.62 59.25 head 1402 171 374 13687
Beef Cattle 462
3.78 0.46 1.08 39.38 head 1746 213 499 18194
Turkeys
0.09 0.01 0.5 1.24 head 0 0 0 0
Total Units per year
1106607 203527 1398447 12228837
Conversion factor Btu/unit
129090 116090 91547 3412
Trillion Btu per year
0.143 0.024 0.128 0.042
Diesel Gasoline LP Gas Electric
- 34 -
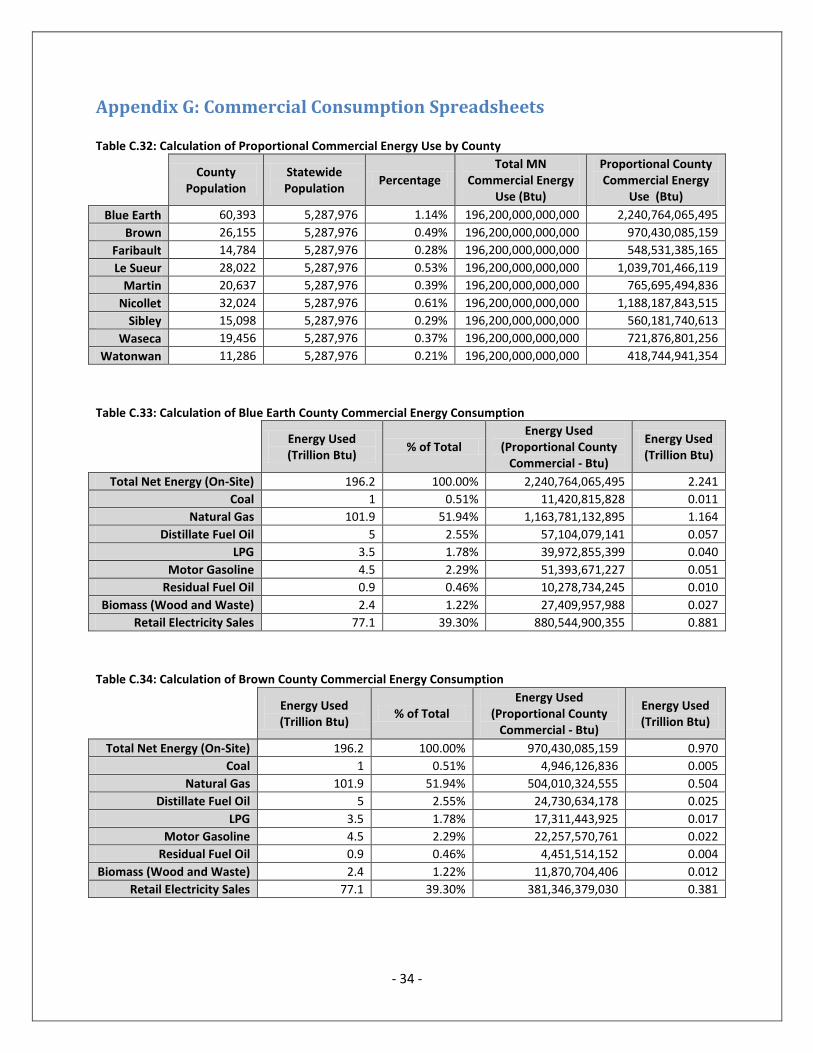
Appendix G: Commercial Consumption Spreadsheets Table C.32: Calculation of Proportional Commercial Energy Use by County
County Population
Statewide Population
Percentage Total MN
Commercial Energy Use (Btu)
Proportional County Commercial Energy
Use (Btu)
Blue Earth 60,393 5,287,976 1.14% 196,200,000,000,000 2,240,764,065,495
Brown 26,155 5,287,976 0.49% 196,200,000,000,000 970,430,085,159
Faribault 14,784 5,287,976 0.28% 196,200,000,000,000 548,531,385,165
Le Sueur 28,022 5,287,976 0.53% 196,200,000,000,000 1,039,701,466,119
Martin 20,637 5,287,976 0.39% 196,200,000,000,000 765,695,494,836
Nicollet 32,024 5,287,976 0.61% 196,200,000,000,000 1,188,187,843,515
Sibley 15,098 5,287,976 0.29% 196,200,000,000,000 560,181,740,613
Waseca 19,456 5,287,976 0.37% 196,200,000,000,000 721,876,801,256
Watonwan 11,286 5,287,976 0.21% 196,200,000,000,000 418,744,941,354
Table C.33: Calculation of Blue Earth County Commercial Energy Consumption
Energy Used (Trillion Btu)
% of Total Energy Used
(Proportional County Commercial - Btu)
Energy Used (Trillion Btu)
Total Net Energy (On-Site) 196.2 100.00% 2,240,764,065,495 2.241
Coal 1 0.51% 11,420,815,828 0.011
Natural Gas 101.9 51.94% 1,163,781,132,895 1.164
Distillate Fuel Oil 5 2.55% 57,104,079,141 0.057
LPG 3.5 1.78% 39,972,855,399 0.040
Motor Gasoline 4.5 2.29% 51,393,671,227 0.051
Residual Fuel Oil 0.9 0.46% 10,278,734,245 0.010
Biomass (Wood and Waste) 2.4 1.22% 27,409,957,988 0.027
Retail Electricity Sales 77.1 39.30% 880,544,900,355 0.881
Table C.34: Calculation of Brown County Commercial Energy Consumption
Energy Used (Trillion Btu)
% of Total Energy Used
(Proportional County Commercial - Btu)
Energy Used (Trillion Btu)
Total Net Energy (On-Site) 196.2 100.00% 970,430,085,159 0.970
Coal 1 0.51% 4,946,126,836 0.005
Natural Gas 101.9 51.94% 504,010,324,555 0.504
Distillate Fuel Oil 5 2.55% 24,730,634,178 0.025
LPG 3.5 1.78% 17,311,443,925 0.017
Motor Gasoline 4.5 2.29% 22,257,570,761 0.022
Residual Fuel Oil 0.9 0.46% 4,451,514,152 0.004
Biomass (Wood and Waste) 2.4 1.22% 11,870,704,406 0.012
Retail Electricity Sales 77.1 39.30% 381,346,379,030 0.381
- 35 -
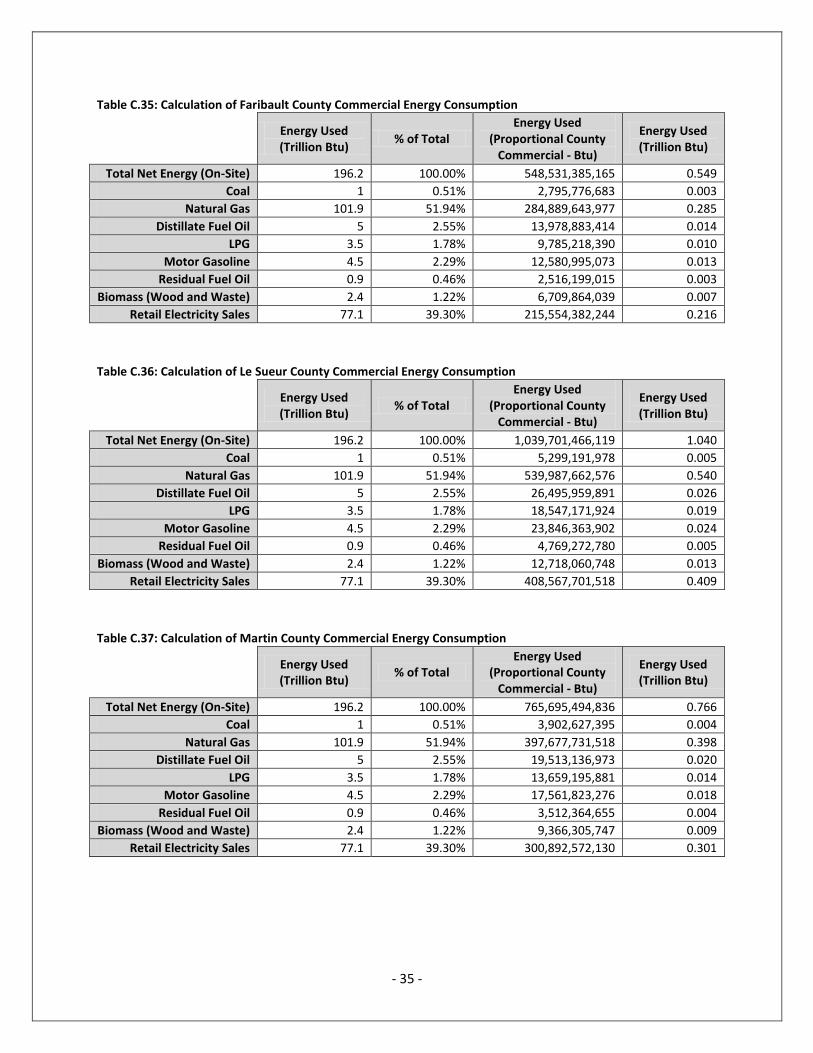
Table C.35: Calculation of Faribault County Commercial Energy Consumption
Energy Used (Trillion Btu)
% of Total Energy Used
(Proportional County Commercial - Btu)
Energy Used (Trillion Btu)
Total Net Energy (On-Site) 196.2 100.00% 548,531,385,165 0.549
Coal 1 0.51% 2,795,776,683 0.003
Natural Gas 101.9 51.94% 284,889,643,977 0.285
Distillate Fuel Oil 5 2.55% 13,978,883,414 0.014
LPG 3.5 1.78% 9,785,218,390 0.010
Motor Gasoline 4.5 2.29% 12,580,995,073 0.013
Residual Fuel Oil 0.9 0.46% 2,516,199,015 0.003
Biomass (Wood and Waste) 2.4 1.22% 6,709,864,039 0.007
Retail Electricity Sales 77.1 39.30% 215,554,382,244 0.216
Table C.36: Calculation of Le Sueur County Commercial Energy Consumption
Energy Used (Trillion Btu)
% of Total Energy Used
(Proportional County Commercial - Btu)
Energy Used (Trillion Btu)
Total Net Energy (On-Site) 196.2 100.00% 1,039,701,466,119 1.040
Coal 1 0.51% 5,299,191,978 0.005
Natural Gas 101.9 51.94% 539,987,662,576 0.540
Distillate Fuel Oil 5 2.55% 26,495,959,891 0.026
LPG 3.5 1.78% 18,547,171,924 0.019
Motor Gasoline 4.5 2.29% 23,846,363,902 0.024
Residual Fuel Oil 0.9 0.46% 4,769,272,780 0.005
Biomass (Wood and Waste) 2.4 1.22% 12,718,060,748 0.013
Retail Electricity Sales 77.1 39.30% 408,567,701,518 0.409
Table C.37: Calculation of Martin County Commercial Energy Consumption
Energy Used (Trillion Btu)
% of Total Energy Used
(Proportional County Commercial - Btu)
Energy Used (Trillion Btu)
Total Net Energy (On-Site) 196.2 100.00% 765,695,494,836 0.766
Coal 1 0.51% 3,902,627,395 0.004
Natural Gas 101.9 51.94% 397,677,731,518 0.398
Distillate Fuel Oil 5 2.55% 19,513,136,973 0.020
LPG 3.5 1.78% 13,659,195,881 0.014
Motor Gasoline 4.5 2.29% 17,561,823,276 0.018
Residual Fuel Oil 0.9 0.46% 3,512,364,655 0.004
Biomass (Wood and Waste) 2.4 1.22% 9,366,305,747 0.009
Retail Electricity Sales 77.1 39.30% 300,892,572,130 0.301
- 36 -
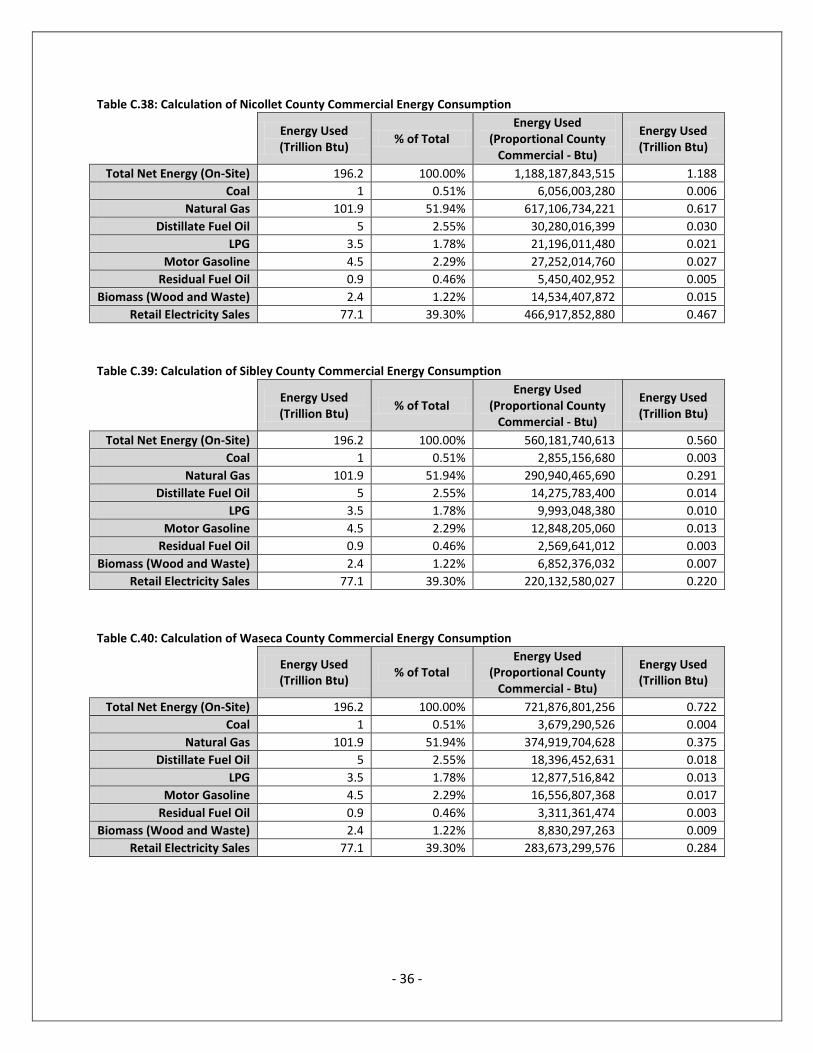
Table C.38: Calculation of Nicollet County Commercial Energy Consumption
Energy Used (Trillion Btu)
% of Total Energy Used
(Proportional County Commercial - Btu)
Energy Used (Trillion Btu)
Total Net Energy (On-Site) 196.2 100.00% 1,188,187,843,515 1.188
Coal 1 0.51% 6,056,003,280 0.006
Natural Gas 101.9 51.94% 617,106,734,221 0.617
Distillate Fuel Oil 5 2.55% 30,280,016,399 0.030
LPG 3.5 1.78% 21,196,011,480 0.021
Motor Gasoline 4.5 2.29% 27,252,014,760 0.027
Residual Fuel Oil 0.9 0.46% 5,450,402,952 0.005
Biomass (Wood and Waste) 2.4 1.22% 14,534,407,872 0.015
Retail Electricity Sales 77.1 39.30% 466,917,852,880 0.467
Table C.39: Calculation of Sibley County Commercial Energy Consumption
Energy Used (Trillion Btu)
% of Total Energy Used
(Proportional County Commercial - Btu)
Energy Used (Trillion Btu)
Total Net Energy (On-Site) 196.2 100.00% 560,181,740,613 0.560
Coal 1 0.51% 2,855,156,680 0.003
Natural Gas 101.9 51.94% 290,940,465,690 0.291
Distillate Fuel Oil 5 2.55% 14,275,783,400 0.014
LPG 3.5 1.78% 9,993,048,380 0.010
Motor Gasoline 4.5 2.29% 12,848,205,060 0.013
Residual Fuel Oil 0.9 0.46% 2,569,641,012 0.003
Biomass (Wood and Waste) 2.4 1.22% 6,852,376,032 0.007
Retail Electricity Sales 77.1 39.30% 220,132,580,027 0.220
Table C.40: Calculation of Waseca County Commercial Energy Consumption
Energy Used (Trillion Btu)
% of Total Energy Used
(Proportional County Commercial - Btu)
Energy Used (Trillion Btu)
Total Net Energy (On-Site) 196.2 100.00% 721,876,801,256 0.722
Coal 1 0.51% 3,679,290,526 0.004
Natural Gas 101.9 51.94% 374,919,704,628 0.375
Distillate Fuel Oil 5 2.55% 18,396,452,631 0.018
LPG 3.5 1.78% 12,877,516,842 0.013
Motor Gasoline 4.5 2.29% 16,556,807,368 0.017
Residual Fuel Oil 0.9 0.46% 3,311,361,474 0.003
Biomass (Wood and Waste) 2.4 1.22% 8,830,297,263 0.009
Retail Electricity Sales 77.1 39.30% 283,673,299,576 0.284
- 37 -
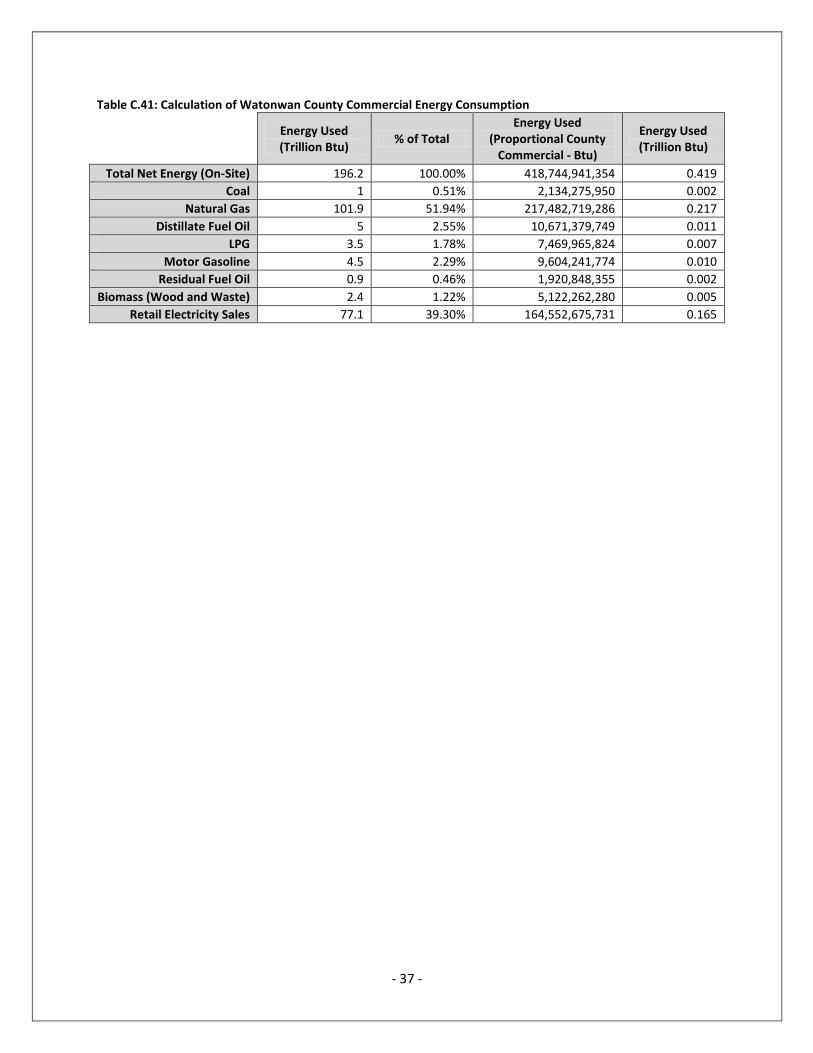
Table C.41: Calculation of Watonwan County Commercial Energy Consumption
Energy Used (Trillion Btu)
% of Total Energy Used
(Proportional County Commercial - Btu)
Energy Used (Trillion Btu)
Total Net Energy (On-Site) 196.2 100.00% 418,744,941,354 0.419
Coal 1 0.51% 2,134,275,950 0.002
Natural Gas 101.9 51.94% 217,482,719,286 0.217
Distillate Fuel Oil 5 2.55% 10,671,379,749 0.011
LPG 3.5 1.78% 7,469,965,824 0.007
Motor Gasoline 4.5 2.29% 9,604,241,774 0.010
Residual Fuel Oil 0.9 0.46% 1,920,848,355 0.002
Biomass (Wood and Waste) 2.4 1.22% 5,122,262,280 0.005
Retail Electricity Sales 77.1 39.30% 164,552,675,731 0.165
- 38 -
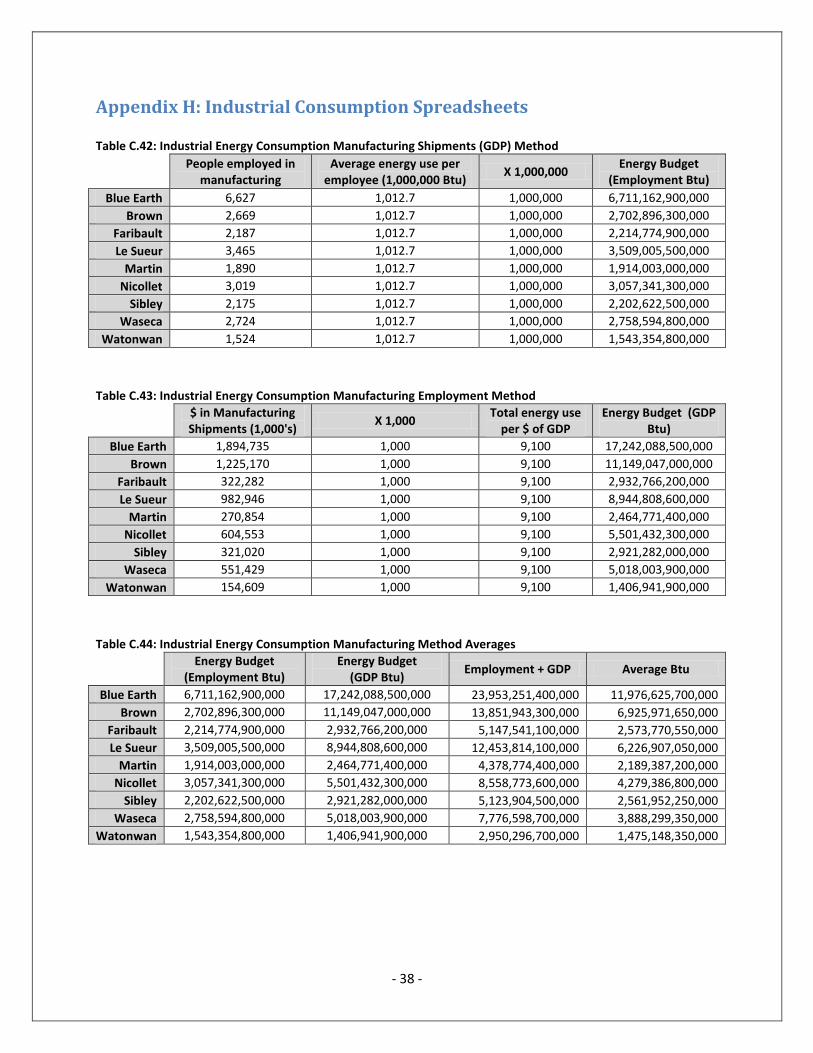
Appendix H: Industrial Consumption Spreadsheets Table C.42: Industrial Energy Consumption Manufacturing Shipments (GDP) Method
People employed in
manufacturing Average energy use per
employee (1,000,000 Btu) X 1,000,000
Energy Budget (Employment Btu)
Blue Earth 6,627 1,012.7 1,000,000 6,711,162,900,000
Brown 2,669 1,012.7 1,000,000 2,702,896,300,000
Faribault 2,187 1,012.7 1,000,000 2,214,774,900,000
Le Sueur 3,465 1,012.7 1,000,000 3,509,005,500,000
Martin 1,890 1,012.7 1,000,000 1,914,003,000,000
Nicollet 3,019 1,012.7 1,000,000 3,057,341,300,000
Sibley 2,175 1,012.7 1,000,000 2,202,622,500,000
Waseca 2,724 1,012.7 1,000,000 2,758,594,800,000
Watonwan 1,524 1,012.7 1,000,000 1,543,354,800,000
Table C.43: Industrial Energy Consumption Manufacturing Employment Method
$ in Manufacturing Shipments (1,000's)
X 1,000 Total energy use
per $ of GDP Energy Budget (GDP
Btu)
Blue Earth 1,894,735 1,000 9,100 17,242,088,500,000
Brown 1,225,170 1,000 9,100 11,149,047,000,000
Faribault 322,282 1,000 9,100 2,932,766,200,000
Le Sueur 982,946 1,000 9,100 8,944,808,600,000
Martin 270,854 1,000 9,100 2,464,771,400,000
Nicollet 604,553 1,000 9,100 5,501,432,300,000
Sibley 321,020 1,000 9,100 2,921,282,000,000
Waseca 551,429 1,000 9,100 5,018,003,900,000
Watonwan 154,609 1,000 9,100 1,406,941,900,000
Table C.44: Industrial Energy Consumption Manufacturing Method Averages
Energy Budget (Employment Btu)
Energy Budget (GDP Btu)
Employment + GDP Average Btu
Blue Earth 6,711,162,900,000 17,242,088,500,000 23,953,251,400,000 11,976,625,700,000
Brown 2,702,896,300,000 11,149,047,000,000 13,851,943,300,000 6,925,971,650,000
Faribault 2,214,774,900,000 2,932,766,200,000 5,147,541,100,000 2,573,770,550,000
Le Sueur 3,509,005,500,000 8,944,808,600,000 12,453,814,100,000 6,226,907,050,000
Martin 1,914,003,000,000 2,464,771,400,000 4,378,774,400,000 2,189,387,200,000
Nicollet 3,057,341,300,000 5,501,432,300,000 8,558,773,600,000 4,279,386,800,000
Sibley 2,202,622,500,000 2,921,282,000,000 5,123,904,500,000 2,561,952,250,000
Waseca 2,758,594,800,000 5,018,003,900,000 7,776,598,700,000 3,888,299,350,000
Watonwan 1,543,354,800,000 1,406,941,900,000 2,950,296,700,000 1,475,148,350,000

- 39 -
Table C.45: Calculation of Blue Earth Co. Industrial Energy Consumption
Energy Used (Minnesota, Trillion Btu)
% of Total Energy Used
(Employee Method - Btu's)
Energy Used (Trillion Btu)
Total 4,671 100.0% 11,976,625,700,000 11.977
Net Electricity 934 20.0% 2,394,812,332,220 2.395
Residual Fuel Oil 45 1.0% 115,381,750,482 0.115
Distillate Fuel Oil 36 0.8% 92,305,400,385 0.092
Natural Gas 1,643 35.2% 4,212,715,912,032 4.213
LPG and NGL 130 2.8% 333,325,056,947 0.333
Coal 554 11.9% 1,420,477,550,375 1.420
Coke and Breeze 217 4.6% 556,396,441,212 0.556
*S.E.S.P.O. 60 1.3% 153,842,333,976 0.154
Total Other 8,443 100% 3,005,053,590,323 3.005
Asphalt and Road Oil 1,259 15% 448,106,415,992 0.448
Lubricants 436 5% 155,182,206,015 0.155
Naphtha < 401 Degrees 608 7% 216,400,874,442 0.216
Other Oils ≥ 401 Degrees 815 10% 290,076,830,050 0.290
Special Naphthas 96 1% 34,168,559,122 0.034
Waxes 37 0.4% 13,169,132,162 0.013
Miscellaneous Nonfuel Products 148 2% 52,676,528,647 0.053
Kerosene 30 0.4% 10,677,674,726 0.011
Motor Gasoline 7 0.1% 2,491,457,436 0.002
Petroleum Coke 834 10% 296,839,357,376 0.297
Still Gas/Waste Gas 1,551 18% 552,035,783,322 0.552
Pulping Liquor or Black Liquor 850 10% 302,534,117,230 0.303
Biomass 631 7% 224,587,091,732 0.225
Net Steam/Hot Water 855 10% 304,313,729,685 0.304
Miscellaneous 287 3% 102,149,754,877 0.102
*Shipments of Energy Sources Produced Onsite

- 40 -
Table C.46: Calculation of Brown Co. Industrial Energy Consumption
Energy Used (Minnesota, Trillion Btu)
% of Total Energy Used
(Employee Method - Btu's)
Energy Used (Trillion Btu)
Total 4,671 100.0% 6,925,971,650,000 6.926
Net Electricity 934 20.0% 1,384,897,778,013 1.385
Residual Fuel Oil 45 1.0% 66,724,197,013 0.067
Distillate Fuel Oil 36 0.8% 53,379,357,611 0.053
Natural Gas 1,643 35.2% 2,436,174,570,959 2.436
LPG and NGL 130 2.8% 192,758,791,372 0.193
Coal 554 11.9% 821,449,003,233 0.821
Coke and Breeze 217 4.6% 321,758,905,598 0.322
*S.E.S.P.O. 60 1.3% 88,965,596,018 0.089
Total Other 8,443 100% 1,737,794,642,218 1.738
Asphalt and Road Oil 1,259 15% 259,135,787,582 0.259
Lubricants 436 5% 89,740,431,601 0.090
Naphtha < 401 Degrees 608 7% 125,142,620,214 0.125
Other Oils ≥ 401 Degrees 815 10% 167,748,742,557 0.168
Special Naphthas 96 1% 19,759,361,086 0.020
Waxes 37 0.4% 7,615,587,085 0.008
Miscellaneous Nonfuel Products 148 2% 30,462,348,342 0.030
Kerosene 30 0.4% 6,174,800,340 0.006
Motor Gasoline 7 0.1% 1,440,786,746 0.001
Petroleum Coke 834 10% 171,659,449,439 0.172
Still Gas/Waste Gas 1,551 18% 319,237,177,553 0.319
Pulping Liquor or Black Liquor 850 10% 174,952,676,286 0.175
Biomass 631 7% 129,876,633,808 0.130
Net Steam/Hot Water 855 10% 175,981,809,676 0.176
Miscellaneous 287 3% 59,072,256,581 0.059
*Shipments of Energy Sources Produced Onsite

- 41 -
Table C.47: Calculation of Faribault Co. Industrial Energy Consumption
Energy Used (Minnesota, Trillion Btu)
% of Total Energy Used
(Employee Method - Btu's)
Energy Used (Trillion Btu)
Total 4,671 100.0% 2,573,770,550,000 2.574
Net Electricity 934 20.0% 514,643,907,878 0.515
Residual Fuel Oil 45 1.0% 24,795,477,360 0.025
Distillate Fuel Oil 36 0.8% 19,836,381,888 0.020
Natural Gas 1,643 35.2% 905,310,428,955 0.905
LPG and NGL 130 2.8% 71,631,379,041 0.072
Coal 554 11.9% 305,259,876,836 0.305
Coke and Breeze 217 4.6% 119,569,301,937 0.120
*S.E.S.P.O. 60 1.3% 33,060,636,480 0.033
Total Other 8,443 100% 645,784,432,584 0.646
Asphalt and Road Oil 1,259 15% 96,297,832,598 0.096
Lubricants 436 5% 33,348,574,275 0.033
Naphtha < 401 Degrees 608 7% 46,504,433,852 0.047
Other Oils ≥ 401 Degrees 815 10% 62,337,357,877 0.062
Special Naphthas 96 1% 7,342,805,345 0.007
Waxes 37 0.4% 2,830,039,560 0.003
Miscellaneous Nonfuel Products 148 2% 11,320,158,240 0.011
Kerosene 30 0.4% 2,294,626,670 0.002
Motor Gasoline 7 0.1% 535,412,890 0.001
Petroleum Coke 834 10% 63,790,621,435 0.064
Still Gas/Waste Gas 1,551 18% 118,632,198,856 0.119
Pulping Liquor or Black Liquor 850 10% 65,014,422,326 0.065
Biomass 631 7% 48,263,647,632 0.048
Net Steam/Hot Water 855 10% 65,396,860,104 0.065
Miscellaneous 287 3% 21,951,928,479 0.022
*Shipments of Energy Sources Produced Onsite

- 42 -
Table C.48: Calculation of Le Sueur Co. Industrial Energy Consumption
Energy Used (Minnesota, Trillion Btu)
% of Total Energy Used
(Employee Method - Btu's)
Energy Used (Trillion Btu)
Total 4,671 100.0% 6,226,907,050,000 6.227
Net Electricity 934 20.0% 1,245,114,790,131 1.245
Residual Fuel Oil 45 1.0% 59,989,470,617 0.060
Distillate Fuel Oil 36 0.8% 47,991,576,493 0.048
Natural Gas 1,643 35.2% 2,190,282,227,178 2.190
LPG and NGL 130 2.8% 173,302,915,115 0.173
Coal 554 11.9% 738,537,038,257 0.739
Coke and Breeze 217 4.6% 289,282,558,307 0.289
*S.E.S.P.O. 60 1.3% 79,985,960,822 0.080
Total Other 8,443 100% 1,562,392,434,725 1.562
Asphalt and Road Oil 1,259 15% 232,980,229,222 0.233
Lubricants 436 5% 80,682,589,309 0.081
Naphtha < 401 Degrees 608 7% 112,511,500,688 0.113
Other Oils ≥ 401 Degrees 815 10% 150,817,225,429 0.151
Special Naphthas 96 1% 17,764,973,793 0.018
Waxes 37 0.4% 6,846,916,983 0.007
Miscellaneous Nonfuel Products 148 2% 27,387,667,931 0.027
Kerosene 30 0.4% 5,551,554,310 0.006
Motor Gasoline 7 0.1% 1,295,362,672 0.001
Petroleum Coke 834 10% 154,333,209,826 0.154
Still Gas/Waste Gas 1,551 18% 287,015,357,842 0.287
Pulping Liquor or Black Liquor 850 10% 157,294,038,791 0.157
Biomass 631 7% 116,767,692,326 0.117
Net Steam/Hot Water 855 10% 158,219,297,843 0.158
Miscellaneous 287 3% 53,109,869,568 0.053
*Shipments of Energy Sources Produced Onsite

- 43 -
Table C.49: Calculation of Martin Co. Industrial Energy Consumption
Energy Used (Minnesota, Trillion Btu)
% of Total Energy Used
(Employee Method - Btu's)
Energy Used (Trillion Btu)
Total 4,671 100.0% 2,189,387,200,000 2.189
Net Electricity 934 20.0% 437,783,696,168 0.438
Residual Fuel Oil 45 1.0% 21,092,362,235 0.021
Distillate Fuel Oil 36 0.8% 16,873,889,788 0.017
Natural Gas 1,643 35.2% 770,105,581,160 0.770
LPG and NGL 130 2.8% 60,933,490,901 0.061
Coal 554 11.9% 259,670,415,072 0.260
Coke and Breeze 217 4.6% 101,712,057,889 0.102
*S.E.S.P.O. 60 1.3% 28,123,149,647 0.028
Total Other 8,443 100% 549,338,856,433 0.549
Asphalt and Road Oil 1,259 15% 81,916,098,573 0.082
Lubricants 436 5% 28,368,084,970 0.028
Naphtha < 401 Degrees 608 7% 39,559,164,362 0.040
Other Oils ≥ 401 Degrees 815 10% 53,027,498,282 0.053
Special Naphthas 96 1% 6,246,183,847 0.006
Waxes 37 0.4% 2,407,383,358 0.002
Miscellaneous Nonfuel Products 148 2% 9,629,533,430 0.010
Kerosene 30 0.4% 1,951,932,452 0.002
Motor Gasoline 7 0.1% 455,450,905 0.000
Petroleum Coke 834 10% 54,263,722,168 0.054
Still Gas/Waste Gas 1,551 18% 100,914,907,773 0.101
Pulping Liquor or Black Liquor 850 10% 55,304,752,809 0.055
Biomass 631 7% 41,055,645,909 0.041
Net Steam/Hot Water 855 10% 55,630,074,885 0.056
Miscellaneous 287 3% 18,673,487,125 0.019
*Shipments of Energy Sources Produced Onsite

- 44 -
Table C.50: Calculation of Nicollet Co. Industrial Energy Consumption
Energy Used (Minnesota, Trillion Btu)
% of Total Energy Used
(Employee Method - Btu's)
Energy Used (Trillion Btu)
Total 4,671 100.0% 4,279,386,800,000 4.279
Net Electricity 934 20.0% 855,694,127,853 0.856
Residual Fuel Oil 45 1.0% 41,227,233,141 0.041
Distillate Fuel Oil 36 0.8% 32,981,786,513 0.033
Natural Gas 1,643 35.2% 1,505,252,090,002 1.505
LPG and NGL 130 2.8% 119,100,895,740 0.119
Coal 554 11.9% 507,553,047,998 0.508
Coke and Breeze 217 4.6% 198,806,879,812 0.199
*S.E.S.P.O. 60 1.3% 54,969,644,188 0.055
Total Other 8,443 100% 1,073,740,383,130 1.074
Asphalt and Road Oil 1,259 15% 160,113,602,080 0.160
Lubricants 436 5% 55,448,395,955 0.055
Naphtha < 401 Degrees 608 7% 77,322,533,808 0.077
Other Oils ≥ 401 Degrees 815 10% 103,647,804,365 0.104
Special Naphthas 96 1% 12,208,821,128 0.012
Waxes 37 0.4% 4,705,483,143 0.005
Miscellaneous Nonfuel Products 148 2% 18,821,932,572 0.019
Kerosene 30 0.4% 3,815,256,602 0.004
Motor Gasoline 7 0.1% 890,226,541 0.001
Petroleum Coke 834 10% 106,064,133,546 0.106
Still Gas/Waste Gas 1,551 18% 197,248,766,343 0.197
Pulping Liquor or Black Liquor 850 10% 108,098,937,067 0.108
Biomass 631 7% 80,247,563,870 0.080
Net Steam/Hot Water 855 10% 108,734,813,168 0.109
Miscellaneous 287 3% 36,499,288,163 0.036
*Shipments of Energy Sources Produced Onsite
- 45 -
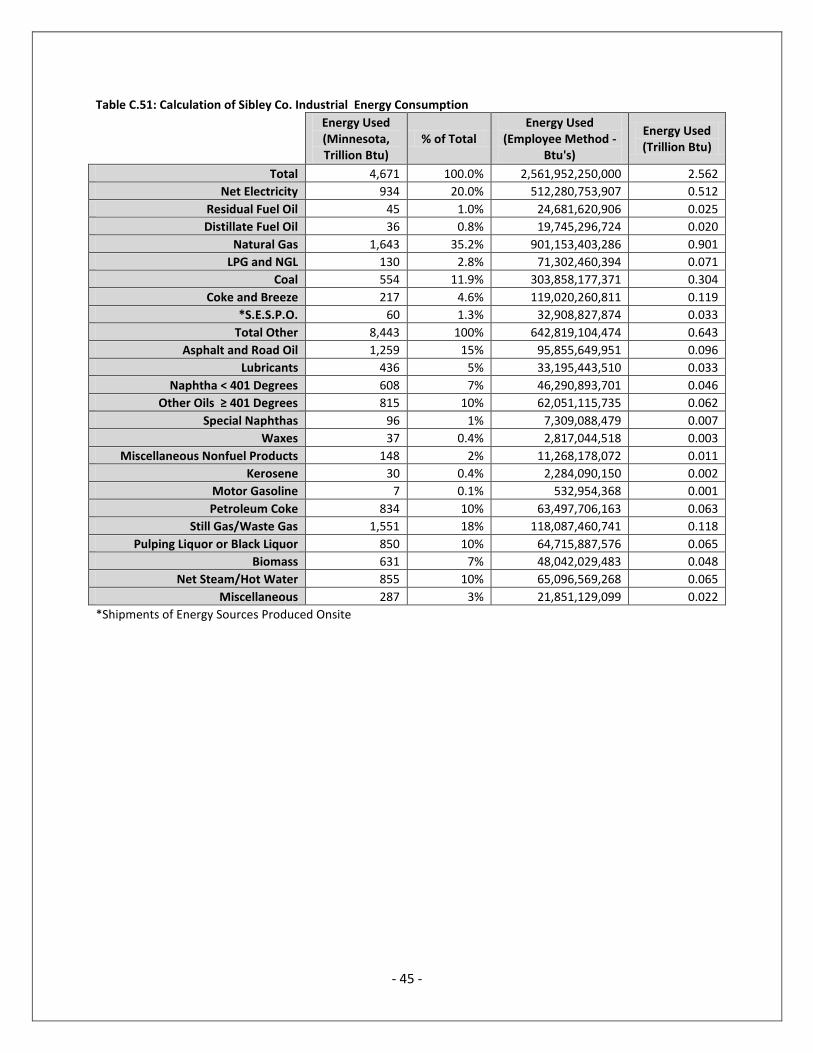
Table C.51: Calculation of Sibley Co. Industrial Energy Consumption
Energy Used (Minnesota, Trillion Btu)
% of Total Energy Used
(Employee Method - Btu's)
Energy Used (Trillion Btu)
Total 4,671 100.0% 2,561,952,250,000 2.562
Net Electricity 934 20.0% 512,280,753,907 0.512
Residual Fuel Oil 45 1.0% 24,681,620,906 0.025
Distillate Fuel Oil 36 0.8% 19,745,296,724 0.020
Natural Gas 1,643 35.2% 901,153,403,286 0.901
LPG and NGL 130 2.8% 71,302,460,394 0.071
Coal 554 11.9% 303,858,177,371 0.304
Coke and Breeze 217 4.6% 119,020,260,811 0.119
*S.E.S.P.O. 60 1.3% 32,908,827,874 0.033
Total Other 8,443 100% 642,819,104,474 0.643
Asphalt and Road Oil 1,259 15% 95,855,649,951 0.096
Lubricants 436 5% 33,195,443,510 0.033
Naphtha < 401 Degrees 608 7% 46,290,893,701 0.046
Other Oils ≥ 401 Degrees 815 10% 62,051,115,735 0.062
Special Naphthas 96 1% 7,309,088,479 0.007
Waxes 37 0.4% 2,817,044,518 0.003
Miscellaneous Nonfuel Products 148 2% 11,268,178,072 0.011
Kerosene 30 0.4% 2,284,090,150 0.002
Motor Gasoline 7 0.1% 532,954,368 0.001
Petroleum Coke 834 10% 63,497,706,163 0.063
Still Gas/Waste Gas 1,551 18% 118,087,460,741 0.118
Pulping Liquor or Black Liquor 850 10% 64,715,887,576 0.065
Biomass 631 7% 48,042,029,483 0.048
Net Steam/Hot Water 855 10% 65,096,569,268 0.065
Miscellaneous 287 3% 21,851,129,099 0.022
*Shipments of Energy Sources Produced Onsite

- 46 -
Table C.52: Calculation of Waseca Co. Industrial Energy Consumption
Energy Used (Minnesota, Trillion Btu)
% of Total Energy Used
(Employee Method - Btu's)
Energy Used (Trillion Btu)
Total 4,671 100.0% 3,888,299,350,000 3.888
Net Electricity 934 20.0% 777,493,383,194 0.777
Residual Fuel Oil 45 1.0% 37,459,531,310 0.037
Distillate Fuel Oil 36 0.8% 29,967,625,048 0.030
Natural Gas 1,643 35.2% 1,367,689,109,837 1.368
LPG and NGL 130 2.8% 108,216,423,785 0.108
Coal 554 11.9% 461,168,452,130 0.461
Coke and Breeze 217 4.6% 180,638,184,318 0.181
*S.E.S.P.O. 60 1.3% 49,946,041,747 0.050
Total Other 8,443 100% 975,612,682,124 0.976
Asphalt and Road Oil 1,259 15% 145,481,033,613 0.145
Lubricants 436 5% 50,381,041,029 0.050
Naphtha < 401 Degrees 608 7% 70,256,130,609 0.070
Other Oils ≥ 401 Degrees 815 10% 94,175,569,813 0.094
Special Naphthas 96 1% 11,093,073,254 0.011
Waxes 37 0.4% 4,275,455,317 0.004
Miscellaneous Nonfuel Products 148 2% 17,101,821,267 0.017
Kerosene 30 0.4% 3,466,585,392 0.003
Motor Gasoline 7 0.1% 808,869,925 0.001
Petroleum Coke 834 10% 96,371,073,894 0.096
Still Gas/Waste Gas 1,551 18% 179,222,464,761 0.179
Pulping Liquor or Black Liquor 850 10% 98,219,919,437 0.098
Biomass 631 7% 72,913,846,076 0.073
Net Steam/Hot Water 855 10% 98,797,683,669 0.099
Miscellaneous 287 3% 33,163,666,916 0.033
*Shipments of Energy Sources Produced Onsite

- 47 -
Table C.53: Calculation of Watonwan Co. Industrial Energy Consumption
Energy Used (Minnesota, Trillion Btu)
% of Total Energy Used
(Employee Method - Btu's)
Energy Used (Trillion Btu)
Total 4,671 100.0% 1,475,148,350,000 1.475
Net Electricity 934 20.0% 294,966,508,007 0.295
Residual Fuel Oil 45 1.0% 14,211,448,459 0.014
Distillate Fuel Oil 36 0.8% 11,369,158,767 0.011
Natural Gas 1,643 35.2% 518,875,773,721 0.519
LPG and NGL 130 2.8% 41,055,295,547 0.041
Coal 554 11.9% 174,958,721,023 0.175
Coke and Breeze 217 4.6% 68,530,762,567 0.069
*S.E.S.P.O. 60 1.3% 18,948,597,945 0.019
Total Other 8,443 100% 370,129,279,854 0.370
Asphalt and Road Oil 1,259 15% 55,192,794,426 0.055
Lubricants 436 5% 19,113,628,570 0.019
Naphtha < 401 Degrees 608 7% 26,653,867,364 0.027
Other Oils ≥ 401 Degrees 815 10% 35,728,457,075 0.036
Special Naphthas 96 1% 4,208,505,373 0.004
Waxes 37 0.4% 1,622,028,113 0.002
Miscellaneous Nonfuel Products 148 2% 6,488,112,450 0.006
Kerosene 30 0.4% 1,315,157,929 0.001
Motor Gasoline 7 0.1% 306,870,183 0.000
Petroleum Coke 834 10% 36,561,390,430 0.037
Still Gas/Waste Gas 1,551 18% 67,993,664,936 0.068
Pulping Liquor or Black Liquor 850 10% 37,262,807,992 0.037
Biomass 631 7% 27,662,155,109 0.028
Net Steam/Hot Water 855 10% 37,482,000,980 0.037
Miscellaneous 287 3% 12,581,677,522 0.013
*Shipments of Energy Sources Produced Onsite
- 48 -
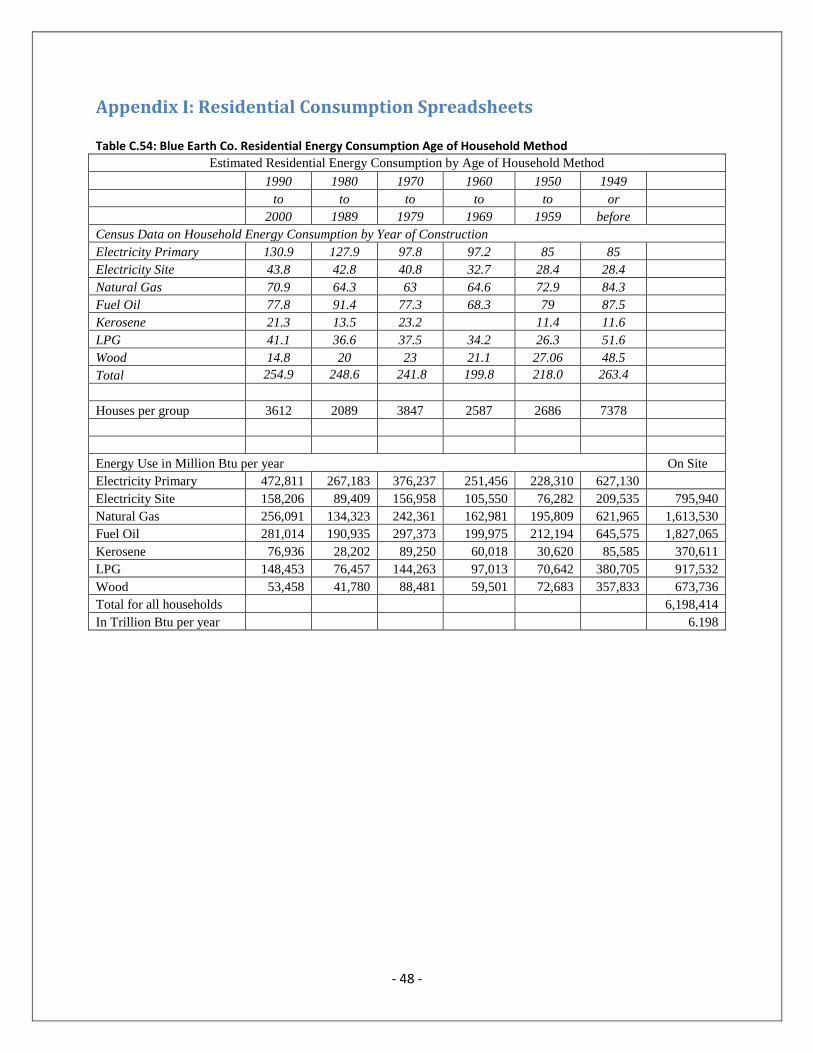
Appendix I: Residential Consumption Spreadsheets Table C.54: Blue Earth Co. Residential Energy Consumption Age of Household Method
Estimated Residential Energy Consumption by Age of Household Method
1990 1980 1970 1960 1950 1949
to to to to to or
2000 1989 1979 1969 1959 before
Census Data on Household Energy Consumption by Year of Construction
Electricity Primary 130.9 127.9 97.8 97.2 85 85
Electricity Site 43.8 42.8 40.8 32.7 28.4 28.4
Natural Gas 70.9 64.3 63 64.6 72.9 84.3
Fuel Oil 77.8 91.4 77.3 68.3 79 87.5
Kerosene 21.3 13.5 23.2 11.4 11.6
LPG 41.1 36.6 37.5 34.2 26.3 51.6
Wood 14.8 20 23 21.1 27.06 48.5
Total 254.9 248.6 241.8 199.8 218.0 263.4
Houses per group 3612 2089 3847 2587 2686 7378
Energy Use in Million Btu per year On Site
Electricity Primary 472,811 267,183 376,237 251,456 228,310 627,130
Electricity Site 158,206 89,409 156,958 105,550 76,282 209,535 795,940
Natural Gas 256,091 134,323 242,361 162,981 195,809 621,965 1,613,530
Fuel Oil 281,014 190,935 297,373 199,975 212,194 645,575 1,827,065
Kerosene 76,936 28,202 89,250 60,018 30,620 85,585 370,611
LPG 148,453 76,457 144,263 97,013 70,642 380,705 917,532
Wood 53,458 41,780 88,481 59,501 72,683 357,833 673,736
Total for all households 6,198,414
In Trillion Btu per year 6.198

- 49 -
Table C.55: Brown Co. Residential Energy Consumption Age of Household Method
Estimated Residential Energy Consumption by Age of Household Method
1990 1980 1970 1960 1950 1949
to to to to to or
2000 1989 1979 1969 1959 before
Census Data on Household Energy Consumption by Year of Construction
Electricity Primary 130.9 127.9 97.8 97.2 85 85
Electricity Site 43.8 42.8 40.8 32.7 28.4 28.4
Natural Gas 70.9 64.3 63 64.6 72.9 84.3
Fuel Oil 77.8 91.4 77.3 68.3 79 87.5
Kerosene 21.3 13.5 23.2 11.4 11.6
LPG 41.1 36.6 37.5 34.2 26.3 51.6
Wood 14.8 20 23 21.1 27.06 48.5
Total 254.9 248.6 241.8 199.8 218.0 263.4
Houses per group 1126 1120 1898 1036 1655 4311
Energy Use in Million Btu per year On Site
Electricity Primary 147,393 143,248 185,624 100,699 140,675 366,435
Electricity Site 49,319 47,936 77,438 42,269 47,002 122,432 386,396
Natural Gas 79,833 72,016 119,574 65,268 120,650 363,417 820,758
Fuel Oil 87,603 102,368 146,715 80,083 130,745 377,213 924,727
Kerosene 23,984 15,120 44,034 24,035 18,867 50,008 176,047
LPG 46,279 40,992 71,175 38,850 43,527 222,448 463,270
Wood 16,665 22,400 43,654 23,828 44,784 209,084 360,415
Total for all households 3,131,613
In Trillion Btu per year 3.132
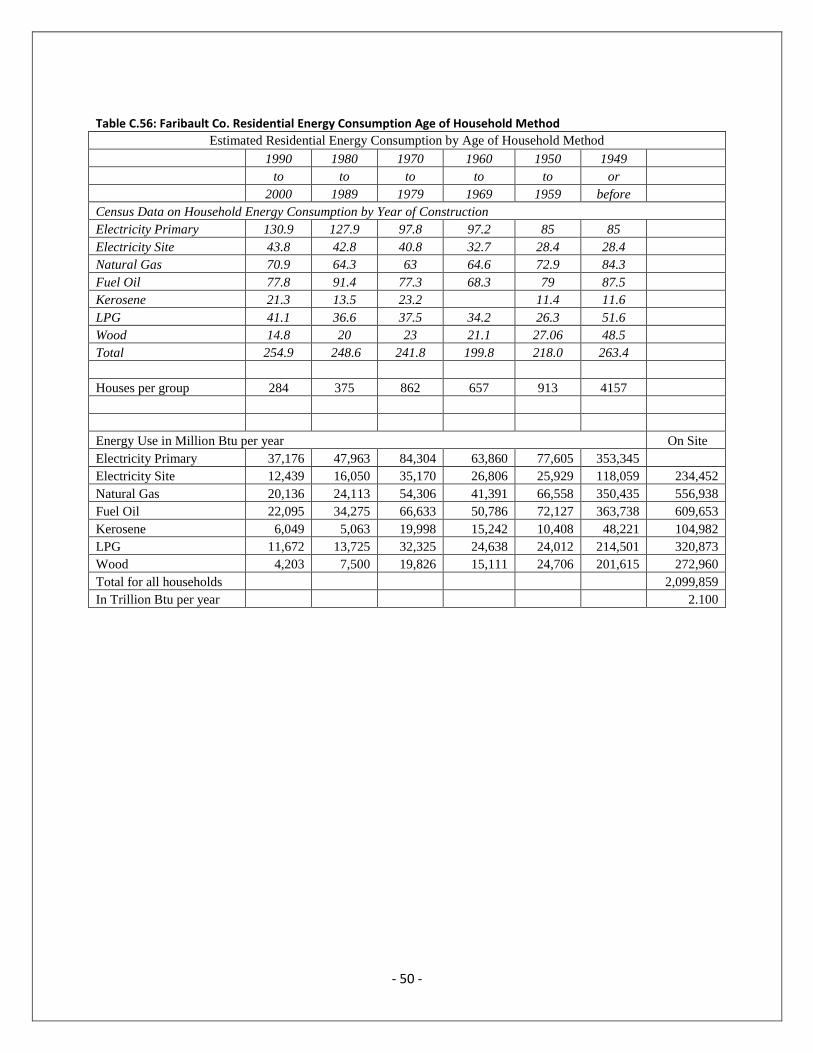
- 50 -
Table C.56: Faribault Co. Residential Energy Consumption Age of Household Method
Estimated Residential Energy Consumption by Age of Household Method
1990 1980 1970 1960 1950 1949
to to to to to or
2000 1989 1979 1969 1959 before
Census Data on Household Energy Consumption by Year of Construction
Electricity Primary 130.9 127.9 97.8 97.2 85 85
Electricity Site 43.8 42.8 40.8 32.7 28.4 28.4
Natural Gas 70.9 64.3 63 64.6 72.9 84.3
Fuel Oil 77.8 91.4 77.3 68.3 79 87.5
Kerosene 21.3 13.5 23.2 11.4 11.6
LPG 41.1 36.6 37.5 34.2 26.3 51.6
Wood 14.8 20 23 21.1 27.06 48.5
Total 254.9 248.6 241.8 199.8 218.0 263.4
Houses per group 284 375 862 657 913 4157
Energy Use in Million Btu per year On Site
Electricity Primary 37,176 47,963 84,304 63,860 77,605 353,345
Electricity Site 12,439 16,050 35,170 26,806 25,929 118,059 234,452
Natural Gas 20,136 24,113 54,306 41,391 66,558 350,435 556,938
Fuel Oil 22,095 34,275 66,633 50,786 72,127 363,738 609,653
Kerosene 6,049 5,063 19,998 15,242 10,408 48,221 104,982
LPG 11,672 13,725 32,325 24,638 24,012 214,501 320,873
Wood 4,203 7,500 19,826 15,111 24,706 201,615 272,960
Total for all households 2,099,859
In Trillion Btu per year 2.100

- 51 -
Table C.57: Le Sueur Co. Residential Energy Consumption Age of Household Method
Estimated Residential Energy Consumption by Age of Household Method
1990 1980 1970 1960 1950 1949
to to to to to or
2000 1989 1979 1969 1959 before
Census Data on Household Energy Consumption by Year of Construction
Electricity Primary 130.9 127.9 97.8 97.2 85 85
Electricity Site 43.8 42.8 40.8 32.7 28.4 28.4
Natural Gas 70.9 64.3 63 64.6 72.9 84.3
Fuel Oil 77.8 91.4 77.3 68.3 79 87.5
Kerosene 21.3 13.5 23.2 11.4 11.6
LPG 41.1 36.6 37.5 34.2 26.3 51.6
Wood 14.8 20 23 21.1 27.06 48.5
Total 254.9 248.6 241.8 199.8 218.0 263.4
Houses per group 1737 1095 2213 1265 1111 3624
Energy Use in Million Btu per year On Site
Electricity Primary 227,373 140,051 216,431 122,958 94,435 308,040
Electricity Site 76,081 46,866 90,290 51,612 31,552 102,922 399,323
Natural Gas 123,153 70,409 139,419 79,695 80,992 305,503 799,171
Fuel Oil 135,139 100,083 171,065 97,785 87,769 317,100 908,940
Kerosene 36,998 14,783 51,342 29,348 12,665 42,038 187,174
LPG 71,391 40,077 82,988 47,438 29,219 186,998 458,110
Wood 25,708 21,900 50,899 29,095 30,064 175,764 333,429
Total for all households 3,086,148
In Trillion Btu per year 3.086

- 52 -
Table C.58: Martin Co. Residential Energy Consumption Age of Household Method
Estimated Residential Energy Consumption by Age of Household Method
1990 1980 1970 1960 1950 1949
to to to to to or
2000 1989 1979 1969 1959 before
Census Data on Household Energy Consumption by Year of Construction
Electricity Primary 130.9 127.9 97.8 97.2 85 85
Electricity Site 43.8 42.8 40.8 32.7 28.4 28.4
Natural Gas 70.9 64.3 63 64.6 72.9 84.3
Fuel Oil 77.8 91.4 77.3 68.3 79 87.5
Kerosene 21.3 13.5 23.2 11.4 11.6
LPG 41.1 36.6 37.5 34.2 26.3 51.6
Wood 14.8 20 23 21.1 27.06 48.5
Total 254.9 248.6 241.8 199.8 218.0 263.4
Houses per group 468 704 1453 823 1469 4788
Energy Use in Million Btu per year On Site
Electricity Primary 61,261 90,042 142,103 79,996 124,865 406,980
Electricity Site 20,498 30,131 59,282 33,578 41,720 135,979 321,189
Natural Gas 33,181 45,267 91,539 51,849 107,090 403,628 732,555
Fuel Oil 36,410 64,346 112,317 63,618 116,051 418,950 811,692
Kerosene 9,968 9,504 33,710 19,094 16,747 55,541 144,563
LPG 19,235 25,766 54,488 30,863 38,635 247,061 416,047
Wood 6,926 14,080 33,419 18,929 39,751 232,218 345,324
Total for all households 2,771,369
In Trillion Btu per year 2.771
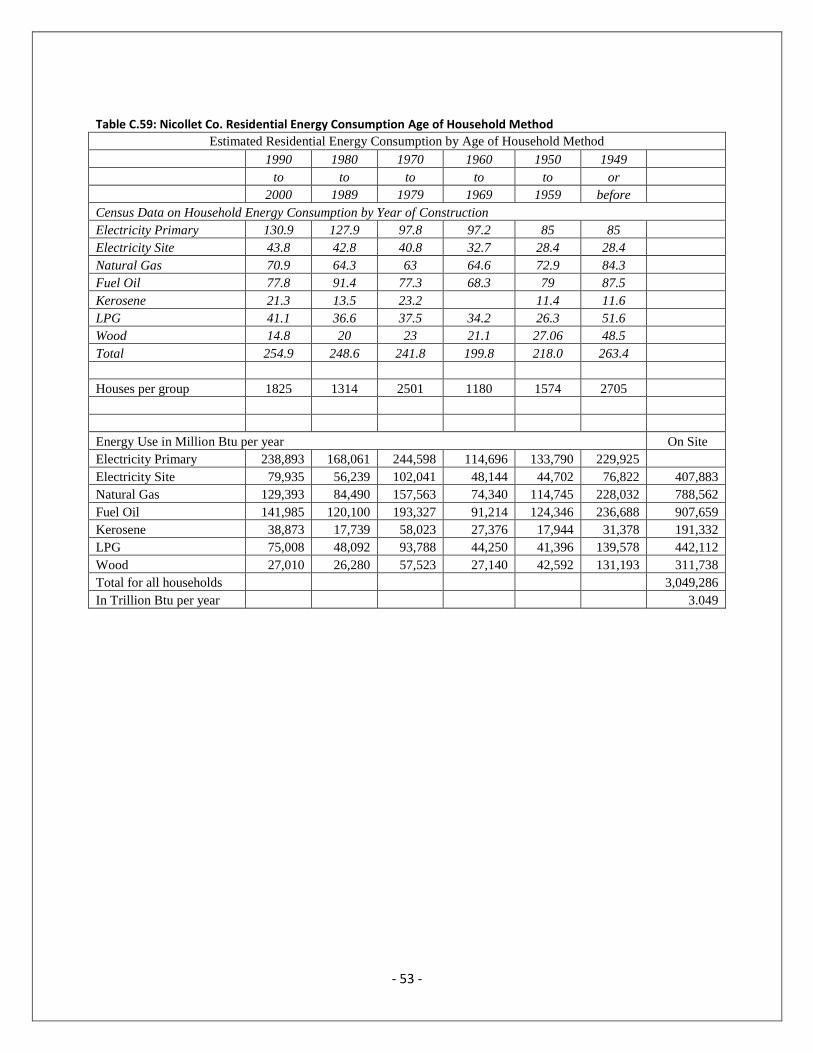
- 53 -
Table C.59: Nicollet Co. Residential Energy Consumption Age of Household Method
Estimated Residential Energy Consumption by Age of Household Method
1990 1980 1970 1960 1950 1949
to to to to to or
2000 1989 1979 1969 1959 before
Census Data on Household Energy Consumption by Year of Construction
Electricity Primary 130.9 127.9 97.8 97.2 85 85
Electricity Site 43.8 42.8 40.8 32.7 28.4 28.4
Natural Gas 70.9 64.3 63 64.6 72.9 84.3
Fuel Oil 77.8 91.4 77.3 68.3 79 87.5
Kerosene 21.3 13.5 23.2 11.4 11.6
LPG 41.1 36.6 37.5 34.2 26.3 51.6
Wood 14.8 20 23 21.1 27.06 48.5
Total 254.9 248.6 241.8 199.8 218.0 263.4
Houses per group 1825 1314 2501 1180 1574 2705
Energy Use in Million Btu per year On Site
Electricity Primary 238,893 168,061 244,598 114,696 133,790 229,925
Electricity Site 79,935 56,239 102,041 48,144 44,702 76,822 407,883
Natural Gas 129,393 84,490 157,563 74,340 114,745 228,032 788,562
Fuel Oil 141,985 120,100 193,327 91,214 124,346 236,688 907,659
Kerosene 38,873 17,739 58,023 27,376 17,944 31,378 191,332
LPG 75,008 48,092 93,788 44,250 41,396 139,578 442,112
Wood 27,010 26,280 57,523 27,140 42,592 131,193 311,738
Total for all households 3,049,286
In Trillion Btu per year 3.049

- 54 -
Table C.60: Sibley Co. Residential Energy Consumption Age of Household Method
Estimated Residential Energy Consumption by Age of Household Method
1990 1980 1970 1960 1950 1949
to to to to to or
2000 1989 1979 1969 1959 before
Census Data on Household Energy Consumption by Year of Construction
Electricity Primary 130.9 127.9 97.8 97.2 85 85
Electricity Site 43.8 42.8 40.8 32.7 28.4 28.4
Natural Gas 70.9 64.3 63 64.6 72.9 84.3
Fuel Oil 77.8 91.4 77.3 68.3 79 87.5
Kerosene 21.3 13.5 23.2 11.4 11.6
LPG 41.1 36.6 37.5 34.2 26.3 51.6
Wood 14.8 20 23 21.1 27.06 48.5
Total 254.9 248.6 241.8 199.8 218.0 263.4
Houses per group 645 462 773 495 602 3048
Energy Use in Million Btu per year On Site
Electricity Primary 84,431 59,090 75,599 48,114 51,170 259,080
Electricity Site 28,251 19,774 31,538 20,196 17,097 86,563 203,419
Natural Gas 45,731 29,707 48,699 31,185 43,886 256,946 456,153
Fuel Oil 50,181 42,227 59,753 38,264 47,558 266,700 504,682
Kerosene 13,739 6,237 17,934 11,484 6,863 35,357 91,613
LPG 26,510 16,909 28,988 18,563 15,833 157,277 264,078
Wood 9,546 9,240 17,779 11,385 16,290 147,828 212,068
Total for all households 1,732,013
In Trillion Btu per year 1.732

- 55 -
Table C.61: Waseca Co. Residential Energy Consumption Age of Household Method
Estimated Residential Energy Consumption by Age of Household Method
1990 1980 1970 1960 1950 1949
to to to to to or
2000 1989 1979 1969 1959 before
Census Data on Household Energy Consumption by Year of Construction
Electricity Primary 130.9 127.9 97.8 97.2 85 85
Electricity Site 43.8 42.8 40.8 32.7 28.4 28.4
Natural Gas 70.9 64.3 63 64.6 72.9 84.3
Fuel Oil 77.8 91.4 77.3 68.3 79 87.5
Kerosene 21.3 13.5 23.2 11.4 11.6
LPG 41.1 36.6 37.5 34.2 26.3 51.6
Wood 14.8 20 23 21.1 27.06 48.5
Total 254.9 248.6 241.8 199.8 218.0 263.4
Houses per group 807 689 1435 774 652 3070
Energy Use in Million Btu per year On Site
Electricity Primary 105,636 88,123 140,343 75,233 55,420 260,950
Electricity Site 35,347 29,489 58,548 31,579 18,517 87,188 260,668
Natural Gas 57,216 44,303 90,405 48,762 47,531 258,801 547,018
Fuel Oil 62,785 62,975 110,926 59,830 51,508 268,625 616,648
Kerosene 17,189 9,302 33,292 17,957 7,433 35,612 120,784
LPG 33,168 25,217 53,813 29,025 17,148 158,412 316,782
Wood 11,944 13,780 33,005 17,802 17,643 148,895 243,069
Total for all households 2,104,969
In Trillion Btu per year 2.105
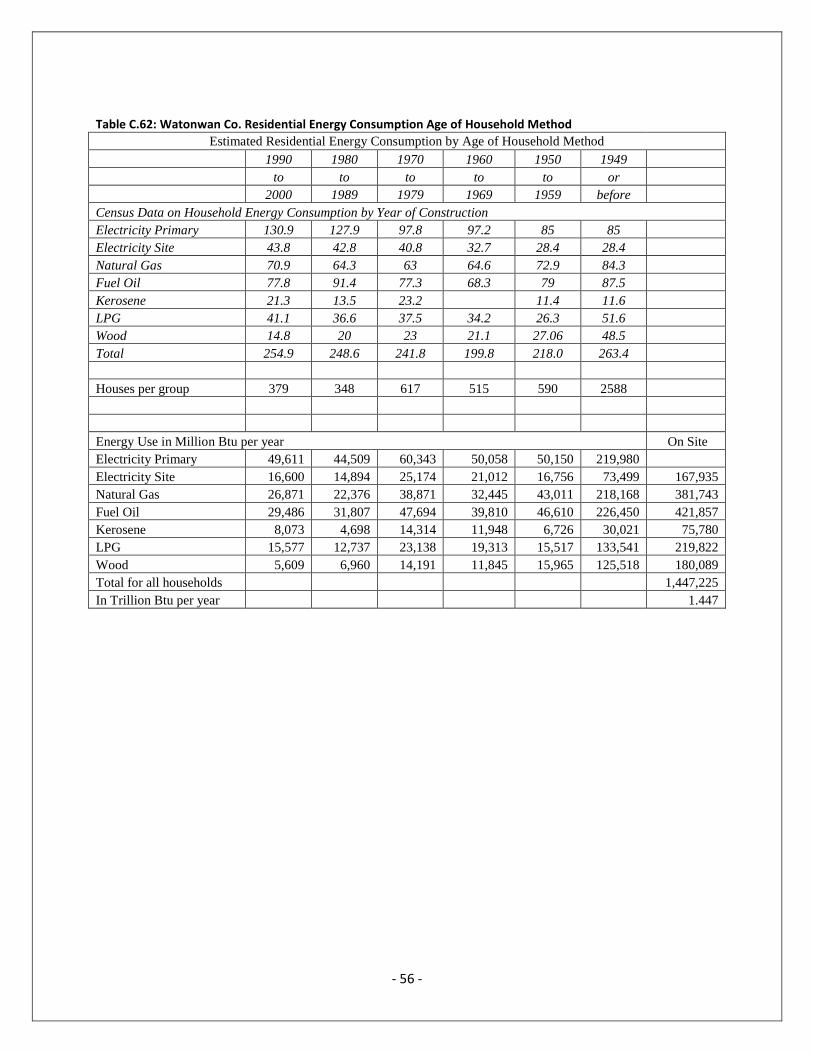
- 56 -
Table C.62: Watonwan Co. Residential Energy Consumption Age of Household Method
Estimated Residential Energy Consumption by Age of Household Method
1990 1980 1970 1960 1950 1949
to to to to to or
2000 1989 1979 1969 1959 before
Census Data on Household Energy Consumption by Year of Construction
Electricity Primary 130.9 127.9 97.8 97.2 85 85
Electricity Site 43.8 42.8 40.8 32.7 28.4 28.4
Natural Gas 70.9 64.3 63 64.6 72.9 84.3
Fuel Oil 77.8 91.4 77.3 68.3 79 87.5
Kerosene 21.3 13.5 23.2 11.4 11.6
LPG 41.1 36.6 37.5 34.2 26.3 51.6
Wood 14.8 20 23 21.1 27.06 48.5
Total 254.9 248.6 241.8 199.8 218.0 263.4
Houses per group 379 348 617 515 590 2588
Energy Use in Million Btu per year On Site
Electricity Primary 49,611 44,509 60,343 50,058 50,150 219,980
Electricity Site 16,600 14,894 25,174 21,012 16,756 73,499 167,935
Natural Gas 26,871 22,376 38,871 32,445 43,011 218,168 381,743
Fuel Oil 29,486 31,807 47,694 39,810 46,610 226,450 421,857
Kerosene 8,073 4,698 14,314 11,948 6,726 30,021 75,780
LPG 15,577 12,737 23,138 19,313 15,517 133,541 219,822
Wood 5,609 6,960 14,191 11,845 15,965 125,518 180,089
Total for all households 1,447,225
In Trillion Btu per year 1.447
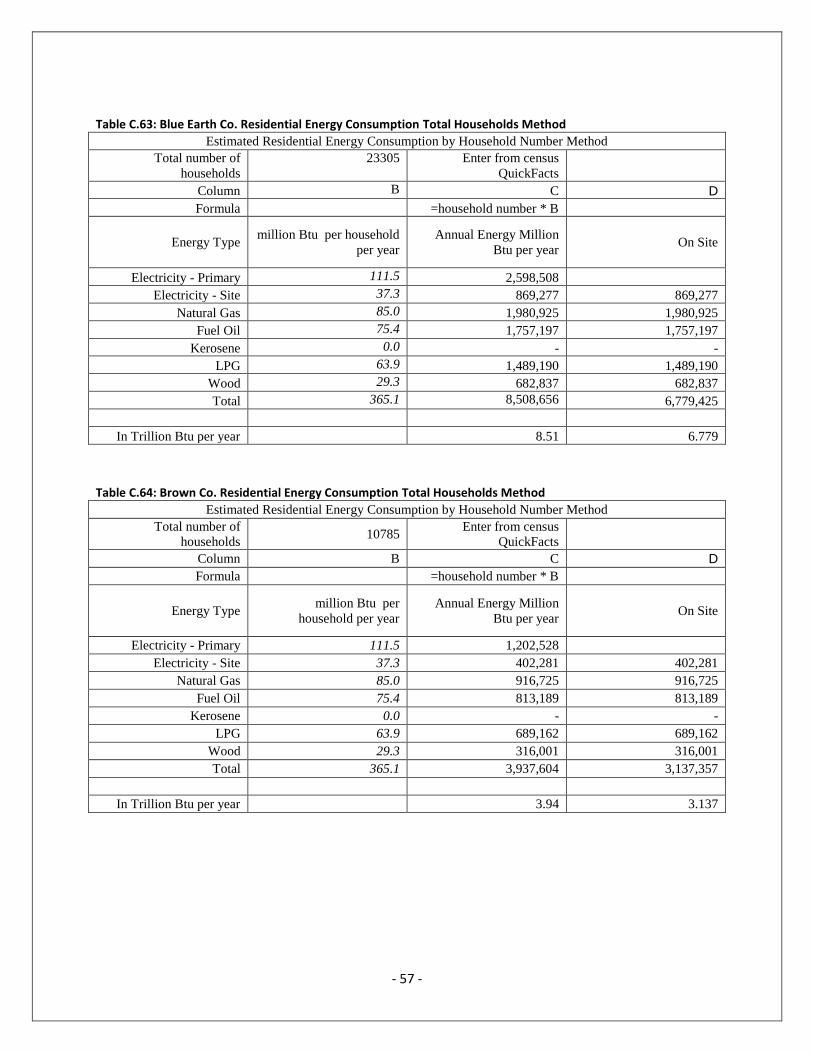
- 57 -
Table C.63: Blue Earth Co. Residential Energy Consumption Total Households Method
Estimated Residential Energy Consumption by Household Number Method
Total number of
households
23305 Enter from census
QuickFacts
Column B C D
Formula =household number * B
Energy Type million Btu per household
per year
Annual Energy Million
Btu per year On Site
Electricity - Primary 111.5 2,598,508
Electricity - Site 37.3 869,277 869,277
Natural Gas 85.0 1,980,925 1,980,925
Fuel Oil 75.4 1,757,197 1,757,197
Kerosene 0.0 - -
LPG 63.9 1,489,190 1,489,190
Wood 29.3 682,837 682,837
Total 365.1 8,508,656 6,779,425
In Trillion Btu per year 8.51 6.779
Table C.64: Brown Co. Residential Energy Consumption Total Households Method
Estimated Residential Energy Consumption by Household Number Method
Total number of
households 10785
Enter from census
QuickFacts
Column B C D
Formula =household number * B
Energy Type million Btu per
household per year
Annual Energy Million
Btu per year On Site
Electricity - Primary 111.5 1,202,528
Electricity - Site 37.3 402,281 402,281
Natural Gas 85.0 916,725 916,725
Fuel Oil 75.4 813,189 813,189
Kerosene 0.0 - -
LPG 63.9 689,162 689,162
Wood 29.3 316,001 316,001
Total 365.1 3,937,604 3,137,357
In Trillion Btu per year 3.94 3.137
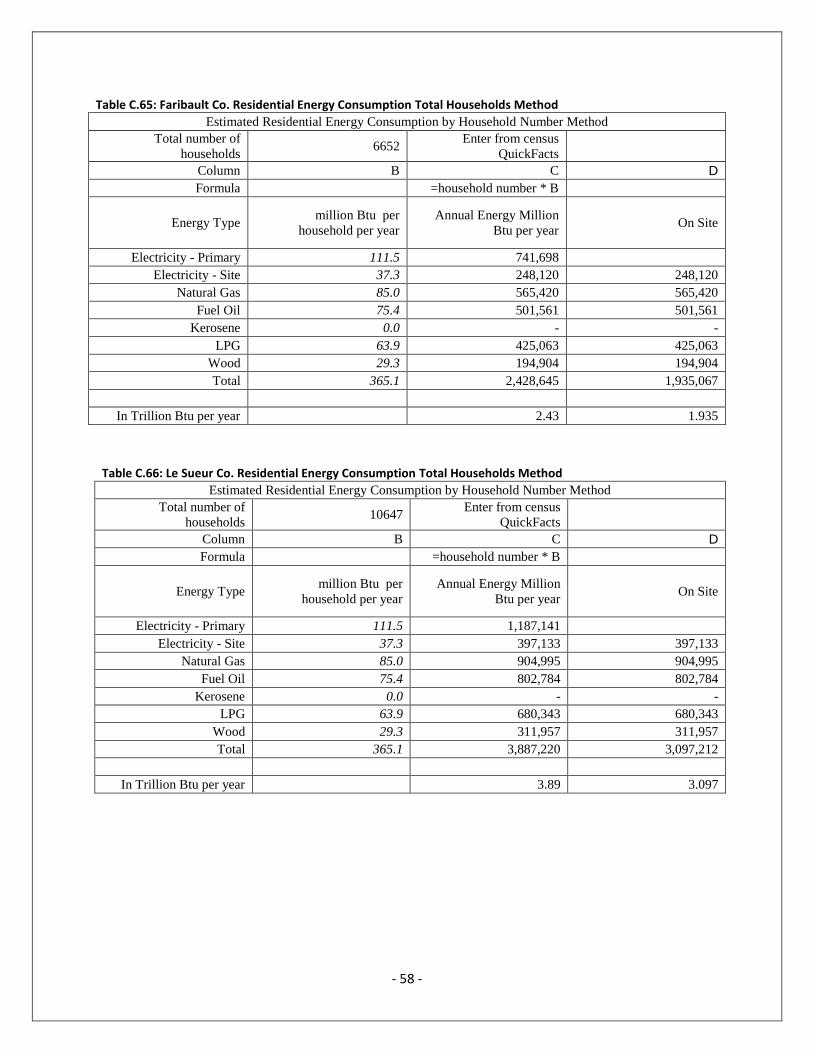
- 58 -
Table C.65: Faribault Co. Residential Energy Consumption Total Households Method
Estimated Residential Energy Consumption by Household Number Method
Total number of
households 6652
Enter from census
QuickFacts
Column B C D
Formula =household number * B
Energy Type million Btu per
household per year
Annual Energy Million
Btu per year On Site
Electricity - Primary 111.5 741,698
Electricity - Site 37.3 248,120 248,120
Natural Gas 85.0 565,420 565,420
Fuel Oil 75.4 501,561 501,561
Kerosene 0.0 - -
LPG 63.9 425,063 425,063
Wood 29.3 194,904 194,904
Total 365.1 2,428,645 1,935,067
In Trillion Btu per year 2.43 1.935
Table C.66: Le Sueur Co. Residential Energy Consumption Total Households Method
Estimated Residential Energy Consumption by Household Number Method
Total number of
households 10647
Enter from census
QuickFacts
Column B C D
Formula =household number * B
Energy Type million Btu per
household per year
Annual Energy Million
Btu per year On Site
Electricity - Primary 111.5 1,187,141
Electricity - Site 37.3 397,133 397,133
Natural Gas 85.0 904,995 904,995
Fuel Oil 75.4 802,784 802,784
Kerosene 0.0 - -
LPG 63.9 680,343 680,343
Wood 29.3 311,957 311,957
Total 365.1 3,887,220 3,097,212
In Trillion Btu per year 3.89 3.097
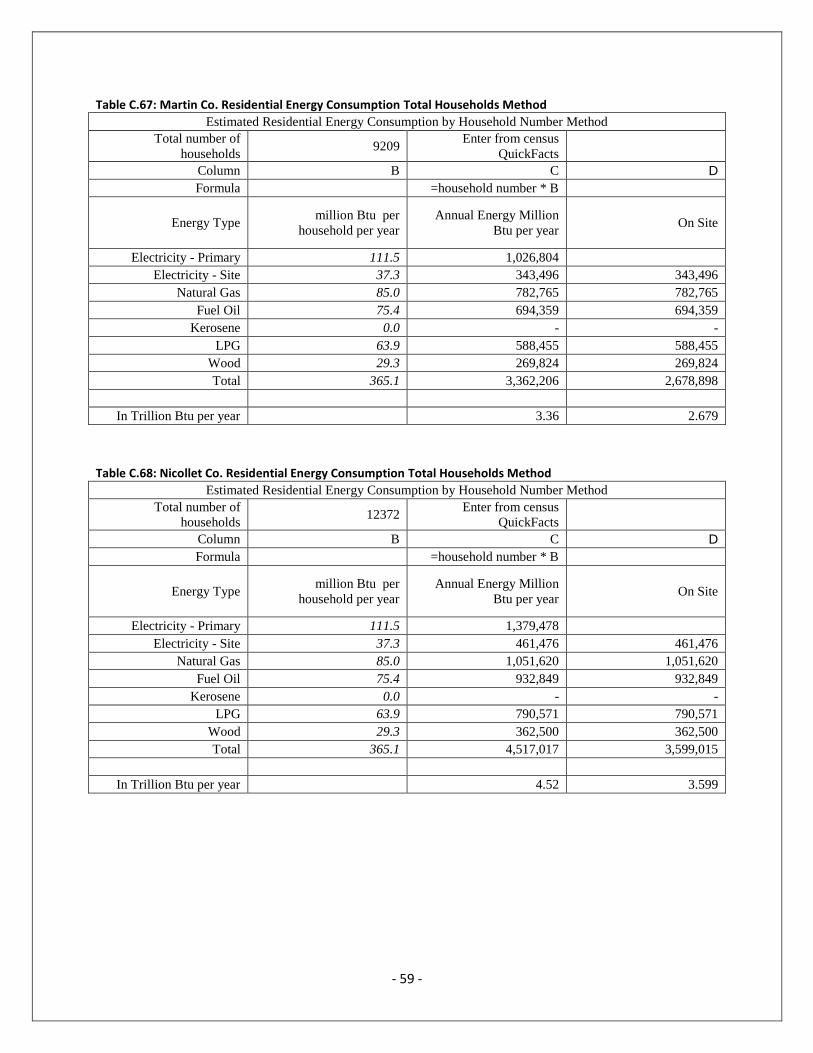
- 59 -
Table C.67: Martin Co. Residential Energy Consumption Total Households Method
Estimated Residential Energy Consumption by Household Number Method
Total number of
households 9209
Enter from census
QuickFacts
Column B C D
Formula =household number * B
Energy Type million Btu per
household per year
Annual Energy Million
Btu per year On Site
Electricity - Primary 111.5 1,026,804
Electricity - Site 37.3 343,496 343,496
Natural Gas 85.0 782,765 782,765
Fuel Oil 75.4 694,359 694,359
Kerosene 0.0 - -
LPG 63.9 588,455 588,455
Wood 29.3 269,824 269,824
Total 365.1 3,362,206 2,678,898
In Trillion Btu per year 3.36 2.679
Table C.68: Nicollet Co. Residential Energy Consumption Total Households Method
Estimated Residential Energy Consumption by Household Number Method
Total number of
households 12372
Enter from census
QuickFacts
Column B C D
Formula =household number * B
Energy Type million Btu per
household per year
Annual Energy Million
Btu per year On Site
Electricity - Primary 111.5 1,379,478
Electricity - Site 37.3 461,476 461,476
Natural Gas 85.0 1,051,620 1,051,620
Fuel Oil 75.4 932,849 932,849
Kerosene 0.0 - -
LPG 63.9 790,571 790,571
Wood 29.3 362,500 362,500
Total 365.1 4,517,017 3,599,015
In Trillion Btu per year 4.52 3.599

- 60 -
Table C.69: Sibley Co. Residential Energy Consumption Total Households Method
Estimated Residential Energy Consumption by Household Number Method
Total number of
households 5772
Enter from census
QuickFacts
Column B C D
Formula =household number * B
Energy Type million Btu per
household per year
Annual Energy Million
Btu per year On Site
Electricity - Primary 111.5 643,578
Electricity - Site 37.3 215,296 215,296
Natural Gas 85.0 490,620 490,620
Fuel Oil 75.4 435,209 435,209
Kerosene 0.0 - -
LPG 63.9 368,831 368,831
Wood 29.3 169,120 169,120
Total 365.1 2,107,357 1,679,075
In Trillion Btu per year 2.11 1.679
Table C.70: Waseca Co. Residential Energy Consumption Total Households Method
Estimated Residential Energy Consumption by Household Number Method
Total number of
households 7059
Enter from census
QuickFacts
Column B C D
Formula =household number * B
Energy Type million Btu per
household per year
Annual Energy Million
Btu per year On Site
Electricity - Primary 111.5 787,079
Electricity - Site 37.3 263,301 263,301
Natural Gas 85.0 600,015 600,015
Fuel Oil 75.4 532,249 532,249
Kerosene 0.0 - -
LPG 63.9 451,070 451,070
Wood 29.3 206,829 206,829
Total 365.1 2,577,241 2,053,463
In Trillion Btu per year 2.58 2.053
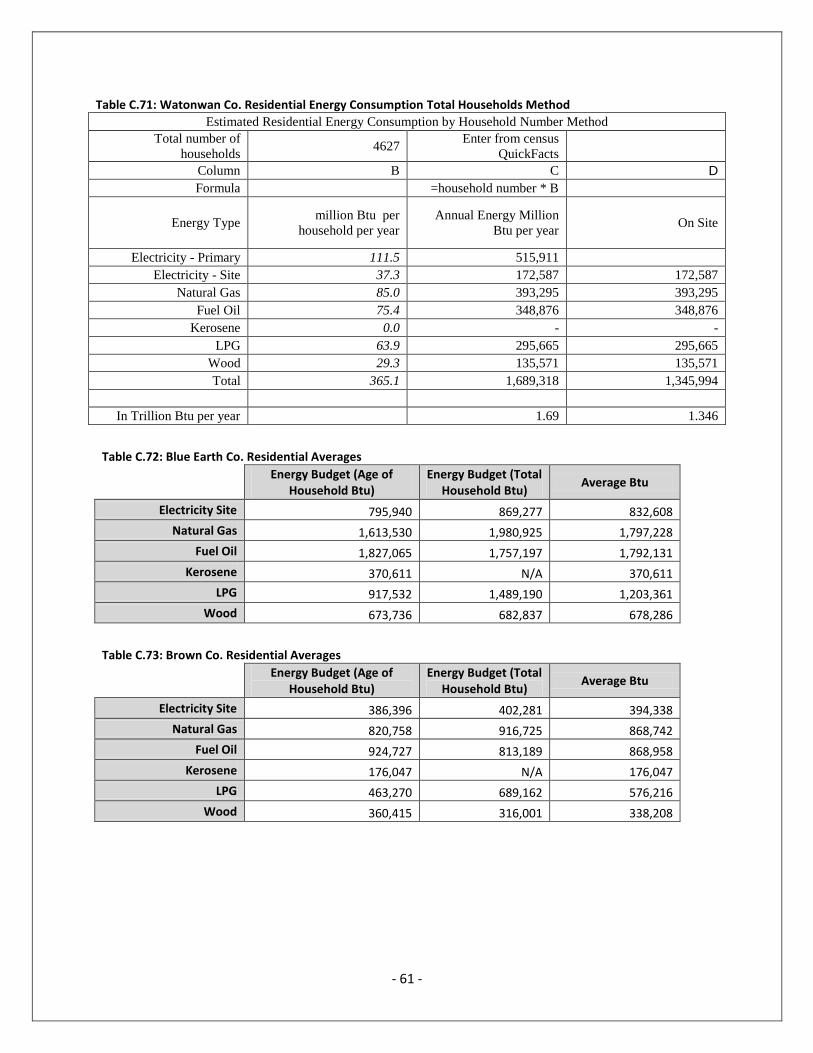
- 61 -
Table C.71: Watonwan Co. Residential Energy Consumption Total Households Method
Estimated Residential Energy Consumption by Household Number Method
Total number of
households 4627
Enter from census
QuickFacts
Column B C D
Formula =household number * B
Energy Type million Btu per
household per year
Annual Energy Million
Btu per year On Site
Electricity - Primary 111.5 515,911
Electricity - Site 37.3 172,587 172,587
Natural Gas 85.0 393,295 393,295
Fuel Oil 75.4 348,876 348,876
Kerosene 0.0 - -
LPG 63.9 295,665 295,665
Wood 29.3 135,571 135,571
Total 365.1 1,689,318 1,345,994
In Trillion Btu per year 1.69 1.346
Table C.72: Blue Earth Co. Residential Averages
Energy Budget (Age of Household Btu)
Energy Budget (Total Household Btu)
Average Btu
Electricity Site 795,940 869,277 832,608
Natural Gas 1,613,530 1,980,925 1,797,228
Fuel Oil 1,827,065 1,757,197 1,792,131
Kerosene 370,611 N/A 370,611
LPG 917,532 1,489,190 1,203,361
Wood 673,736 682,837 678,286
Table C.73: Brown Co. Residential Averages
Energy Budget (Age of
Household Btu) Energy Budget (Total
Household Btu) Average Btu
Electricity Site 386,396 402,281 394,338
Natural Gas 820,758 916,725 868,742
Fuel Oil 924,727 813,189 868,958
Kerosene 176,047 N/A 176,047
LPG 463,270 689,162 576,216
Wood 360,415 316,001 338,208
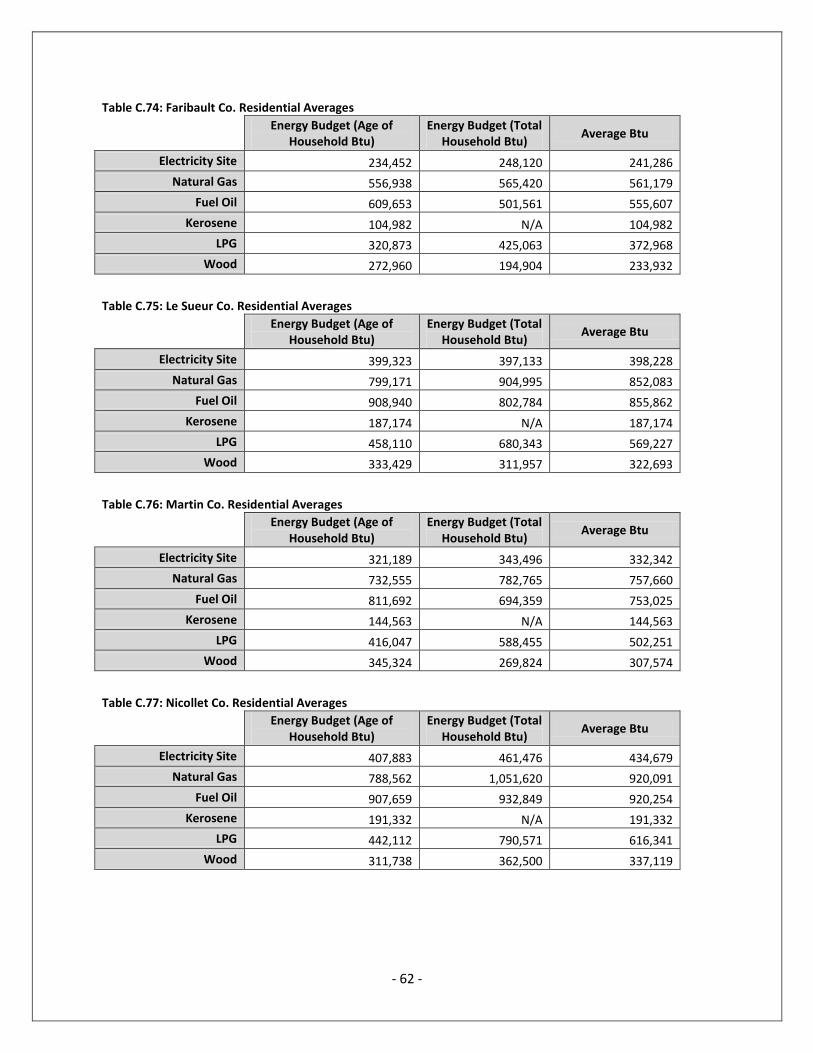
- 62 -
Table C.74: Faribault Co. Residential Averages
Energy Budget (Age of Household Btu)
Energy Budget (Total Household Btu)
Average Btu
Electricity Site 234,452 248,120 241,286
Natural Gas 556,938 565,420 561,179
Fuel Oil 609,653 501,561 555,607
Kerosene 104,982 N/A 104,982
LPG 320,873 425,063 372,968
Wood 272,960 194,904 233,932
Table C.75: Le Sueur Co. Residential Averages
Energy Budget (Age of Household Btu)
Energy Budget (Total Household Btu)
Average Btu
Electricity Site 399,323 397,133 398,228
Natural Gas 799,171 904,995 852,083
Fuel Oil 908,940 802,784 855,862
Kerosene 187,174 N/A 187,174
LPG 458,110 680,343 569,227
Wood 333,429 311,957 322,693
Table C.76: Martin Co. Residential Averages
Energy Budget (Age of Household Btu)
Energy Budget (Total Household Btu)
Average Btu
Electricity Site 321,189 343,496 332,342
Natural Gas 732,555 782,765 757,660
Fuel Oil 811,692 694,359 753,025
Kerosene 144,563 N/A 144,563
LPG 416,047 588,455 502,251
Wood 345,324 269,824 307,574
Table C.77: Nicollet Co. Residential Averages
Energy Budget (Age of Household Btu)
Energy Budget (Total Household Btu)
Average Btu
Electricity Site 407,883 461,476 434,679
Natural Gas 788,562 1,051,620 920,091
Fuel Oil 907,659 932,849 920,254
Kerosene 191,332 N/A 191,332
LPG 442,112 790,571 616,341
Wood 311,738 362,500 337,119
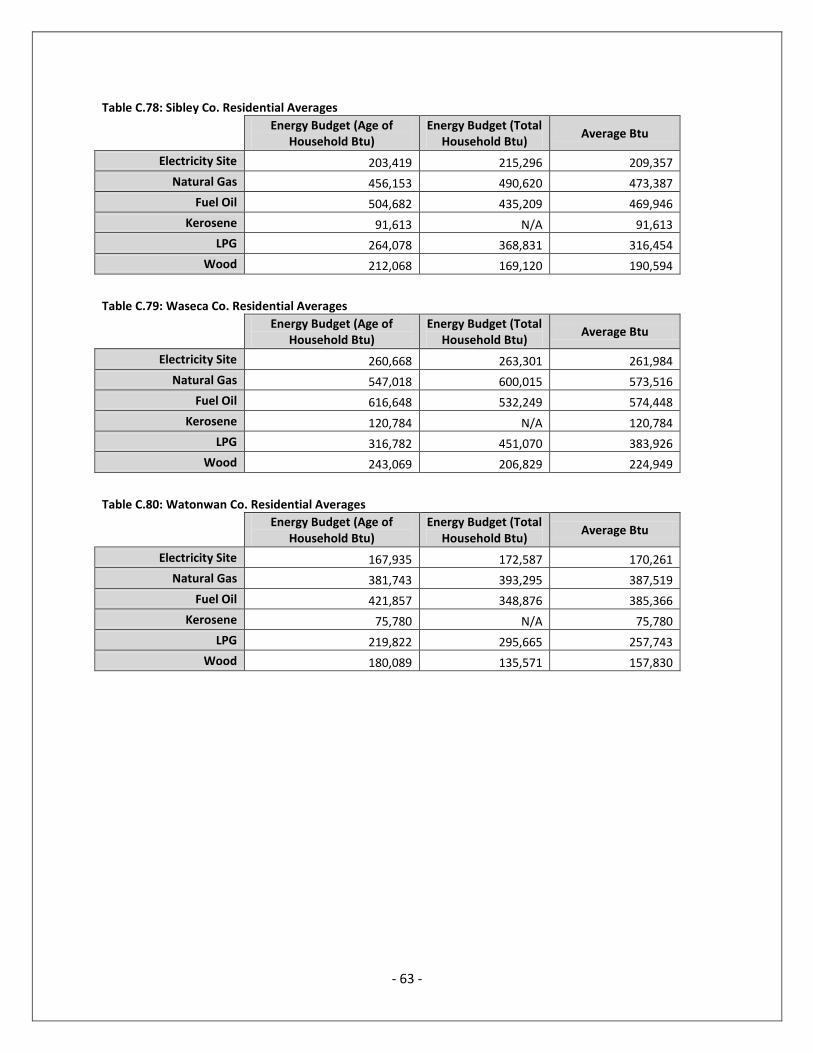
- 63 -
Table C.78: Sibley Co. Residential Averages
Energy Budget (Age of Household Btu)
Energy Budget (Total Household Btu)
Average Btu
Electricity Site 203,419 215,296 209,357
Natural Gas 456,153 490,620 473,387
Fuel Oil 504,682 435,209 469,946
Kerosene 91,613 N/A 91,613
LPG 264,078 368,831 316,454
Wood 212,068 169,120 190,594
Table C.79: Waseca Co. Residential Averages
Energy Budget (Age of Household Btu)
Energy Budget (Total Household Btu)
Average Btu
Electricity Site 260,668 263,301 261,984
Natural Gas 547,018 600,015 573,516
Fuel Oil 616,648 532,249 574,448
Kerosene 120,784 N/A 120,784
LPG 316,782 451,070 383,926
Wood 243,069 206,829 224,949
Table C.80: Watonwan Co. Residential Averages
Energy Budget (Age of Household Btu)
Energy Budget (Total Household Btu)
Average Btu
Electricity Site 167,935 172,587 170,261
Natural Gas 381,743 393,295 387,519
Fuel Oil 421,857 348,876 385,366
Kerosene 75,780 N/A 75,780
LPG 219,822 295,665 257,743
Wood 180,089 135,571 157,830
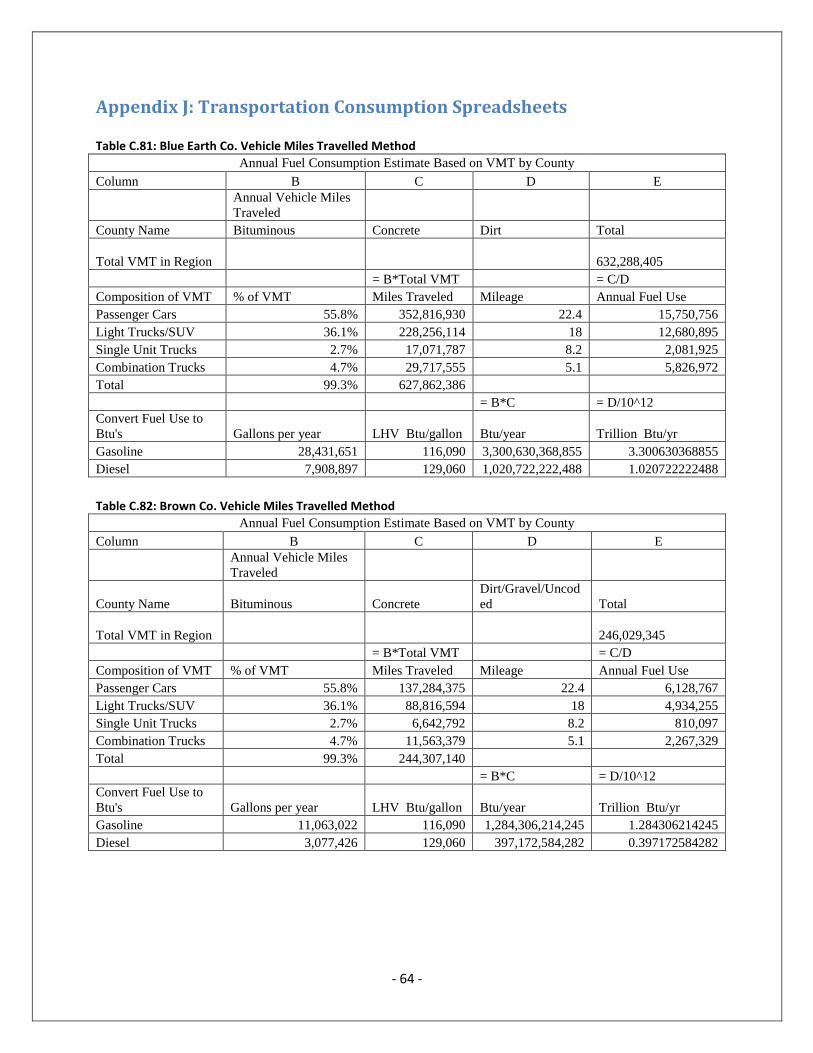
- 64 -
Appendix J: Transportation Consumption Spreadsheets Table C.81: Blue Earth Co. Vehicle Miles Travelled Method
Annual Fuel Consumption Estimate Based on VMT by County
Column B C D E
Annual Vehicle Miles
Traveled
County Name Bituminous Concrete Dirt Total
Total VMT in Region
632,288,405
= B*Total VMT = C/D
Composition of VMT % of VMT Miles Traveled Mileage Annual Fuel Use
Passenger Cars 55.8% 352,816,930 22.4 15,750,756
Light Trucks/SUV 36.1% 228,256,114 18 12,680,895
Single Unit Trucks 2.7% 17,071,787 8.2 2,081,925
Combination Trucks 4.7% 29,717,555 5.1 5,826,972
Total 99.3% 627,862,386
= B*C = D/10^12
Convert Fuel Use to
Btu's Gallons per year LHV Btu/gallon Btu/year Trillion Btu/yr
Gasoline 28,431,651 116,090 3,300,630,368,855 3.300630368855
Diesel 7,908,897 129,060 1,020,722,222,488 1.020722222488
Table C.82: Brown Co. Vehicle Miles Travelled Method
Annual Fuel Consumption Estimate Based on VMT by County
Column B C D E
Annual Vehicle Miles
Traveled
County Name Bituminous Concrete
Dirt/Gravel/Uncod
ed Total
Total VMT in Region
246,029,345
= B*Total VMT = C/D
Composition of VMT % of VMT Miles Traveled Mileage Annual Fuel Use
Passenger Cars 55.8% 137,284,375 22.4 6,128,767
Light Trucks/SUV 36.1% 88,816,594 18 4,934,255
Single Unit Trucks 2.7% 6,642,792 8.2 810,097
Combination Trucks 4.7% 11,563,379 5.1 2,267,329
Total 99.3% 244,307,140
= B*C = D/10^12
Convert Fuel Use to
Btu's Gallons per year LHV Btu/gallon Btu/year Trillion Btu/yr
Gasoline 11,063,022 116,090 1,284,306,214,245 1.284306214245
Diesel 3,077,426 129,060 397,172,584,282 0.397172584282
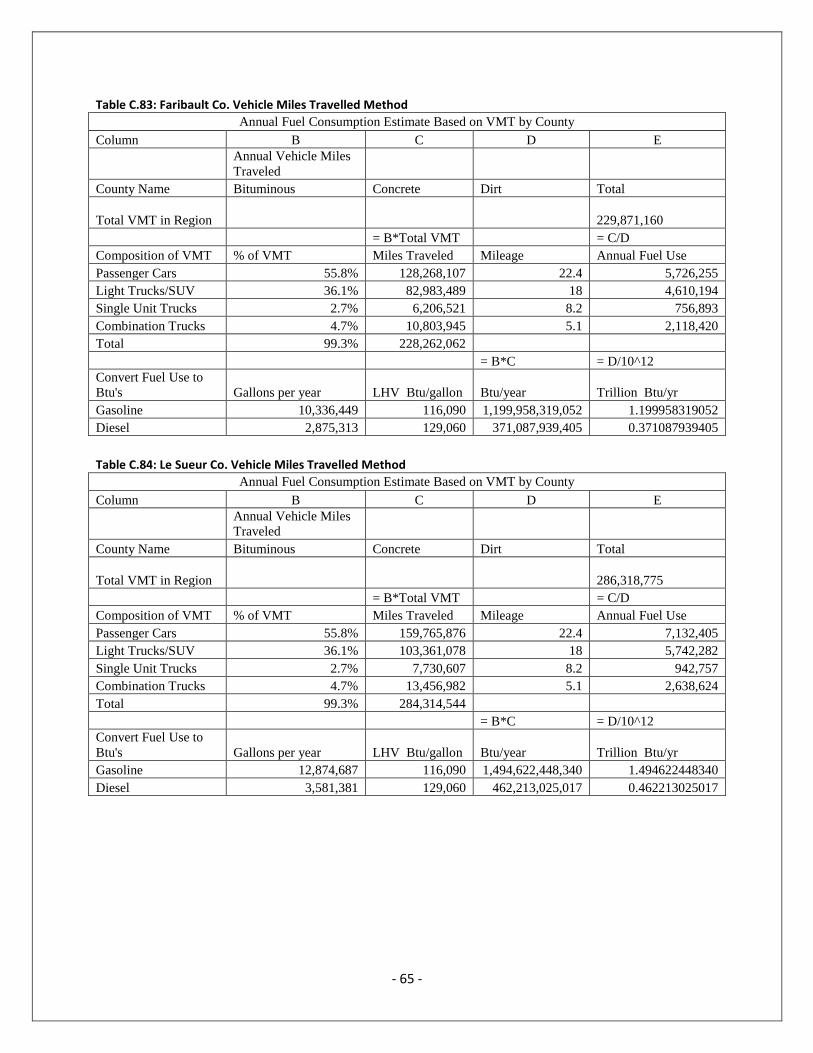
- 65 -
Table C.83: Faribault Co. Vehicle Miles Travelled Method
Annual Fuel Consumption Estimate Based on VMT by County
Column B C D E
Annual Vehicle Miles
Traveled
County Name Bituminous Concrete Dirt Total
Total VMT in Region
229,871,160
= B*Total VMT = C/D
Composition of VMT % of VMT Miles Traveled Mileage Annual Fuel Use
Passenger Cars 55.8% 128,268,107 22.4 5,726,255
Light Trucks/SUV 36.1% 82,983,489 18 4,610,194
Single Unit Trucks 2.7% 6,206,521 8.2 756,893
Combination Trucks 4.7% 10,803,945 5.1 2,118,420
Total 99.3% 228,262,062
= B*C = D/10^12
Convert Fuel Use to
Btu's Gallons per year LHV Btu/gallon Btu/year Trillion Btu/yr
Gasoline 10,336,449 116,090 1,199,958,319,052 1.199958319052
Diesel 2,875,313 129,060 371,087,939,405 0.371087939405
Table C.84: Le Sueur Co. Vehicle Miles Travelled Method
Annual Fuel Consumption Estimate Based on VMT by County
Column B C D E
Annual Vehicle Miles
Traveled
County Name Bituminous Concrete Dirt Total
Total VMT in Region
286,318,775
= B*Total VMT = C/D
Composition of VMT % of VMT Miles Traveled Mileage Annual Fuel Use
Passenger Cars 55.8% 159,765,876 22.4 7,132,405
Light Trucks/SUV 36.1% 103,361,078 18 5,742,282
Single Unit Trucks 2.7% 7,730,607 8.2 942,757
Combination Trucks 4.7% 13,456,982 5.1 2,638,624
Total 99.3% 284,314,544
= B*C = D/10^12
Convert Fuel Use to
Btu's Gallons per year LHV Btu/gallon Btu/year Trillion Btu/yr
Gasoline 12,874,687 116,090 1,494,622,448,340 1.494622448340
Diesel 3,581,381 129,060 462,213,025,017 0.462213025017
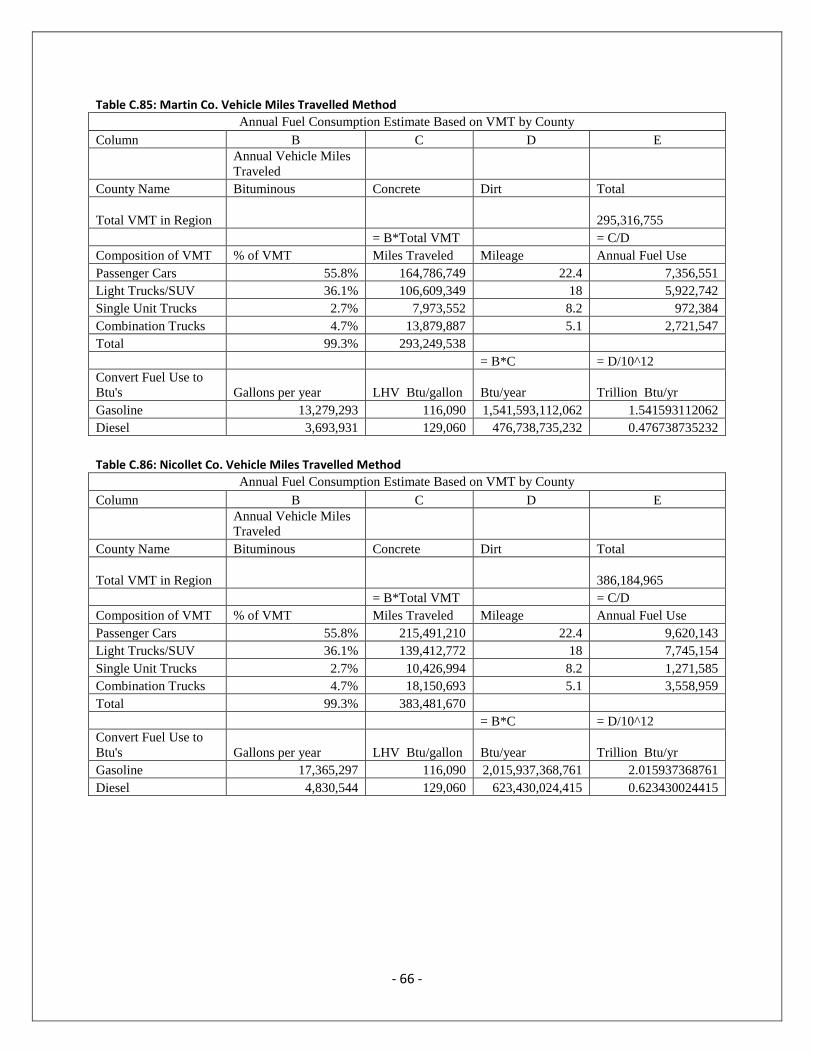
- 66 -
Table C.85: Martin Co. Vehicle Miles Travelled Method
Annual Fuel Consumption Estimate Based on VMT by County
Column B C D E
Annual Vehicle Miles
Traveled
County Name Bituminous Concrete Dirt Total
Total VMT in Region
295,316,755
= B*Total VMT = C/D
Composition of VMT % of VMT Miles Traveled Mileage Annual Fuel Use
Passenger Cars 55.8% 164,786,749 22.4 7,356,551
Light Trucks/SUV 36.1% 106,609,349 18 5,922,742
Single Unit Trucks 2.7% 7,973,552 8.2 972,384
Combination Trucks 4.7% 13,879,887 5.1 2,721,547
Total 99.3% 293,249,538
= B*C = D/10^12
Convert Fuel Use to
Btu's Gallons per year LHV Btu/gallon Btu/year Trillion Btu/yr
Gasoline 13,279,293 116,090 1,541,593,112,062 1.541593112062
Diesel 3,693,931 129,060 476,738,735,232 0.476738735232
Table C.86: Nicollet Co. Vehicle Miles Travelled Method
Annual Fuel Consumption Estimate Based on VMT by County
Column B C D E
Annual Vehicle Miles
Traveled
County Name Bituminous Concrete Dirt Total
Total VMT in Region
386,184,965
= B*Total VMT = C/D
Composition of VMT % of VMT Miles Traveled Mileage Annual Fuel Use
Passenger Cars 55.8% 215,491,210 22.4 9,620,143
Light Trucks/SUV 36.1% 139,412,772 18 7,745,154
Single Unit Trucks 2.7% 10,426,994 8.2 1,271,585
Combination Trucks 4.7% 18,150,693 5.1 3,558,959
Total 99.3% 383,481,670
= B*C = D/10^12
Convert Fuel Use to
Btu's Gallons per year LHV Btu/gallon Btu/year Trillion Btu/yr
Gasoline 17,365,297 116,090 2,015,937,368,761 2.015937368761
Diesel 4,830,544 129,060 623,430,024,415 0.623430024415
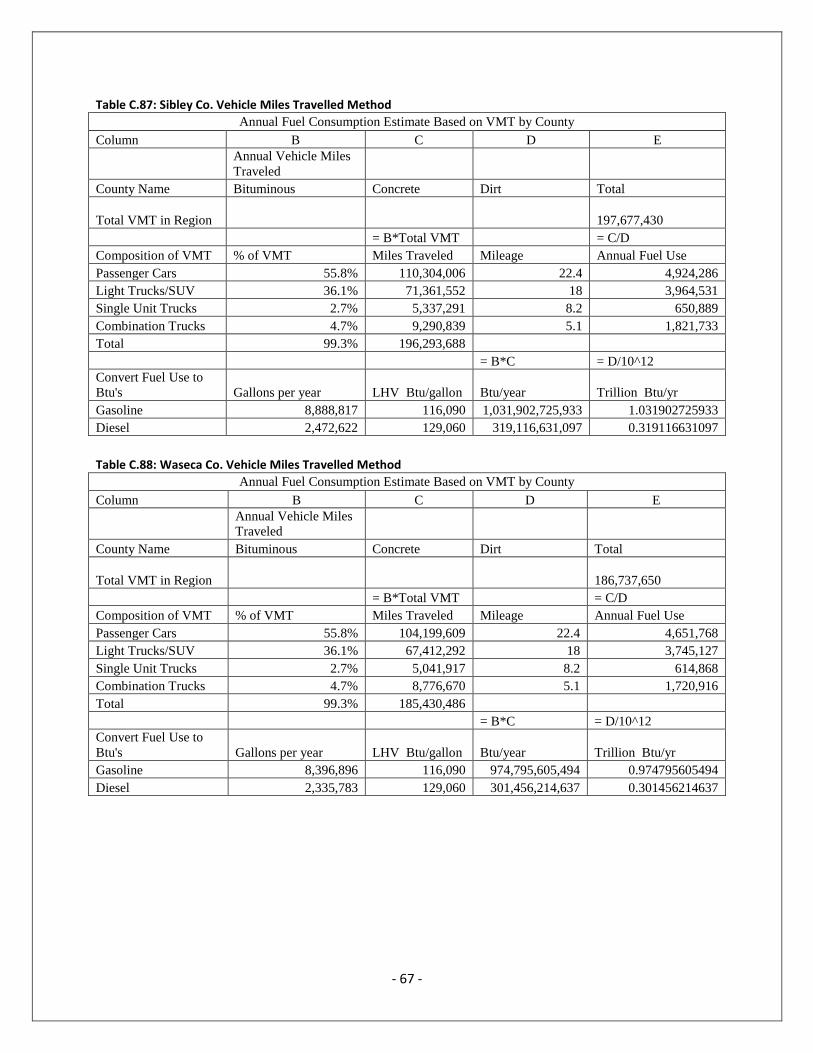
- 67 -
Table C.87: Sibley Co. Vehicle Miles Travelled Method
Annual Fuel Consumption Estimate Based on VMT by County
Column B C D E
Annual Vehicle Miles
Traveled
County Name Bituminous Concrete Dirt Total
Total VMT in Region
197,677,430
= B*Total VMT = C/D
Composition of VMT % of VMT Miles Traveled Mileage Annual Fuel Use
Passenger Cars 55.8% 110,304,006 22.4 4,924,286
Light Trucks/SUV 36.1% 71,361,552 18 3,964,531
Single Unit Trucks 2.7% 5,337,291 8.2 650,889
Combination Trucks 4.7% 9,290,839 5.1 1,821,733
Total 99.3% 196,293,688
= B*C = D/10^12
Convert Fuel Use to
Btu's Gallons per year LHV Btu/gallon Btu/year Trillion Btu/yr
Gasoline 8,888,817 116,090 1,031,902,725,933 1.031902725933
Diesel 2,472,622 129,060 319,116,631,097 0.319116631097
Table C.88: Waseca Co. Vehicle Miles Travelled Method
Annual Fuel Consumption Estimate Based on VMT by County
Column B C D E
Annual Vehicle Miles
Traveled
County Name Bituminous Concrete Dirt Total
Total VMT in Region
186,737,650
= B*Total VMT = C/D
Composition of VMT % of VMT Miles Traveled Mileage Annual Fuel Use
Passenger Cars 55.8% 104,199,609 22.4 4,651,768
Light Trucks/SUV 36.1% 67,412,292 18 3,745,127
Single Unit Trucks 2.7% 5,041,917 8.2 614,868
Combination Trucks 4.7% 8,776,670 5.1 1,720,916
Total 99.3% 185,430,486
= B*C = D/10^12
Convert Fuel Use to
Btu's Gallons per year LHV Btu/gallon Btu/year Trillion Btu/yr
Gasoline 8,396,896 116,090 974,795,605,494 0.974795605494
Diesel 2,335,783 129,060 301,456,214,637 0.301456214637
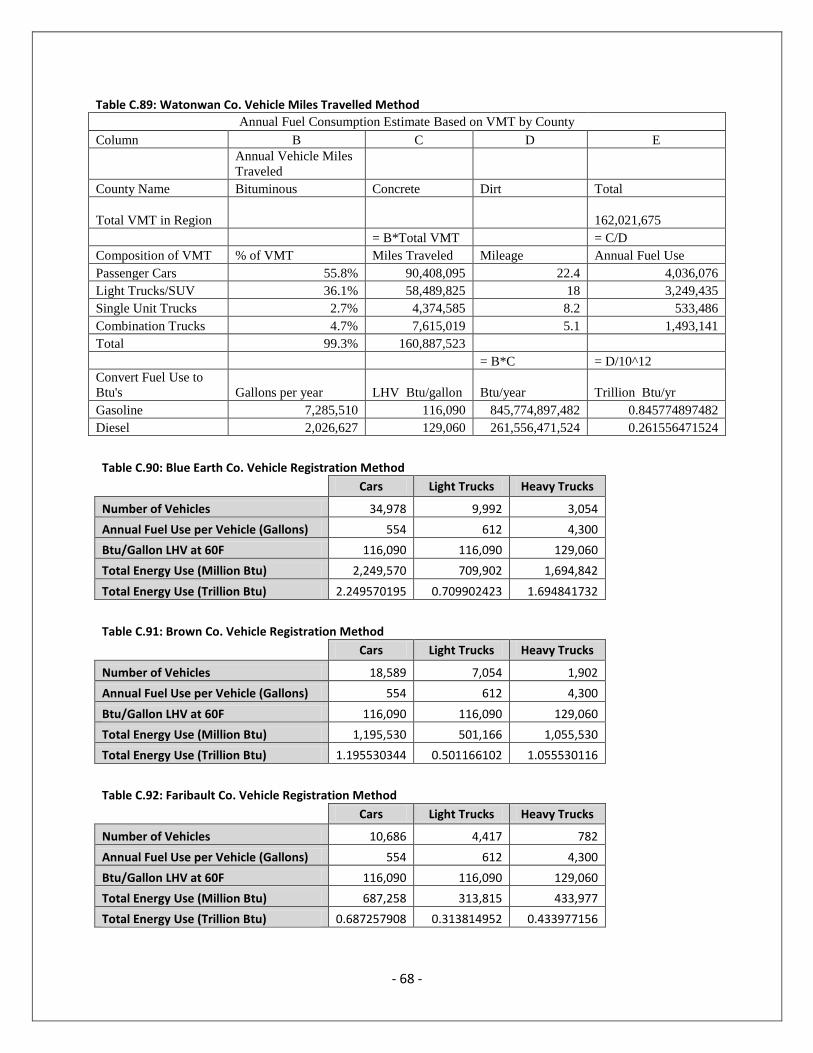
- 68 -
Table C.89: Watonwan Co. Vehicle Miles Travelled Method Annual Fuel Consumption Estimate Based on VMT by County
Column B C D E
Annual Vehicle Miles
Traveled
County Name Bituminous Concrete Dirt Total
Total VMT in Region
162,021,675
= B*Total VMT = C/D
Composition of VMT % of VMT Miles Traveled Mileage Annual Fuel Use
Passenger Cars 55.8% 90,408,095 22.4 4,036,076
Light Trucks/SUV 36.1% 58,489,825 18 3,249,435
Single Unit Trucks 2.7% 4,374,585 8.2 533,486
Combination Trucks 4.7% 7,615,019 5.1 1,493,141
Total 99.3% 160,887,523
= B*C = D/10^12
Convert Fuel Use to
Btu's Gallons per year LHV Btu/gallon Btu/year Trillion Btu/yr
Gasoline 7,285,510 116,090 845,774,897,482 0.845774897482
Diesel 2,026,627 129,060 261,556,471,524 0.261556471524
Table C.90: Blue Earth Co. Vehicle Registration Method
Cars Light Trucks Heavy Trucks
Number of Vehicles 34,978 9,992 3,054
Annual Fuel Use per Vehicle (Gallons) 554 612 4,300
Btu/Gallon LHV at 60F 116,090 116,090 129,060
Total Energy Use (Million Btu) 2,249,570 709,902 1,694,842
Total Energy Use (Trillion Btu) 2.249570195 0.709902423 1.694841732
Table C.91: Brown Co. Vehicle Registration Method
Cars Light Trucks Heavy Trucks
Number of Vehicles 18,589 7,054 1,902
Annual Fuel Use per Vehicle (Gallons) 554 612 4,300
Btu/Gallon LHV at 60F 116,090 116,090 129,060
Total Energy Use (Million Btu) 1,195,530 501,166 1,055,530
Total Energy Use (Trillion Btu) 1.195530344 0.501166102 1.055530116
Table C.92: Faribault Co. Vehicle Registration Method
Cars Light Trucks Heavy Trucks
Number of Vehicles 10,686 4,417 782
Annual Fuel Use per Vehicle (Gallons) 554 612 4,300
Btu/Gallon LHV at 60F 116,090 116,090 129,060
Total Energy Use (Million Btu) 687,258 313,815 433,977
Total Energy Use (Trillion Btu) 0.687257908 0.313814952 0.433977156

- 69 -
Table C.93: Le Sueur Co. Vehicle Registration Method
Cars Light Trucks Heavy Trucks
Number of Vehicles 21,527 7,690 1,605
Annual Fuel Use per Vehicle (Gallons) 554 612 4,300
Btu/Gallon LHV at 60F 116,090 116,090 129,060
Total Energy Use (Million Btu) 1,384,484 546,352 890,708
Total Energy Use (Trillion Btu) 1.384484464 0.546352045 0.89070759
Table C.94: Martin Co. Vehicle Registration Method
Cars Light Trucks Heavy Trucks
Number of Vehicles 14,222 5,188 994
Annual Fuel Use per Vehicle (Gallons) 554 612 4,300
Btu/Gallon LHV at 60F 116,090 116,090 129,060
Total Energy Use (Million Btu) 914,672 368,592 551,628
Total Energy Use (Trillion Btu) 0.914671717 0.368592251 0.551628252
Table C.95: Nicollet Co. Vehicle Registration Method
Cars Light Trucks Heavy Trucks
Number of Vehicles 19,068 5,028 907
Annual Fuel Use per Vehicle (Gallons) 554 612 4,300
Btu/Gallon LHV at 60F 116,090 116,090 129,060
Total Energy Use (Million Btu) 1,226,337 357,225 503,347
Total Energy Use (Trillion Btu) 1.226336682 0.357224718 0.503346906
Table C.96: Sibley Co. Vehicle Registration Method
Cars Light Trucks Heavy Trucks
Number of Vehicles 9,542 3,682 692
Annual Fuel Use per Vehicle (Gallons) 554 612 4,300
Btu/Gallon LHV at 60F 116,090 116,090 129,060
Total Energy Use (Million Btu) 613,683 261,595 384,031
Total Energy Use (Trillion Btu) 0.613682852 0.261595349 0.384030936
Table C.97: Waseca Co. Vehicle Registration Method
Cars Light Trucks Heavy Trucks
Number of Vehicles 12,539 4,212 824
Annual Fuel Use per Vehicle 554 612 4,300
Btu/gallon LHV at 60F 116,090 116,090 129,060
Total Energy Use 806,431 299,250 457,285
Trilling Btu/year 0.806431491 0.299250301 0.457285392

- 70 -
Table C.98: Watonwan Co. Vehicle Registration Method
Cars Light Trucks Heavy Trucks
Number of Vehicles 7,578 2,903 522
Annual Fuel Use per Vehicle (Gallons) 554 612 4,300
Btu/Gallon LHV at 60F 116,090 116,090 129,060
Total Energy Use (Million Btu) 487,370 206,250 289,688
Total Energy Use (Trillion Btu) 0.487370431 0.206249673 0.289688076
Table C.99: All Counties Transportation Average - Gasoline Trillion Btu License Method VMT Method Gasoline Average
Blue Earth 2.959472618440 3.300630368855 3.130051493647
Brown 1.696696445860 1.284306214245 1.490501330052
Faribault 1.001072860320 1.199958319052 1.100515589686
Le Sueur 1.930836509420 1.494622448340 1.712729478880
Martin 1.283263967960 1.541593112062 1.412428540011
Nicollet 1.583561400720 2.015937368761 1.799749384741
Sibley 0.875278200680 1.031902725933 0.953590463306
Waseca 1.105681791500 0.974795605494 1.040238698497
Watonwan 0.693620104320 0.845774897482 0.769697500901
Table C.100: All Counties Transportation Average - Diesel Trillion Btu License Method VMT Method Diesel Average
Blue Earth 1.694841732000 1.020722222488 1.357781977244
Brown 1.055530116000 0.397172584282 0.726351350141
Fariabult 0.433977156000 0.371087939405 0.402532547702
Le Sueur 0.890707590000 0.462213025017 0.676460307508
Martin 0.551628252000 0.476738735232 0.514183493616
Nicollet 0.503346906000 0.623430024415 0.563388465207
Sibley 0.384030936000 0.319116631097 0.351573783548
Waseca 0.457285392000 0.301456214637 0.379370803318
Watonwan 0.289688076000 0.261556471524 0.275622273762
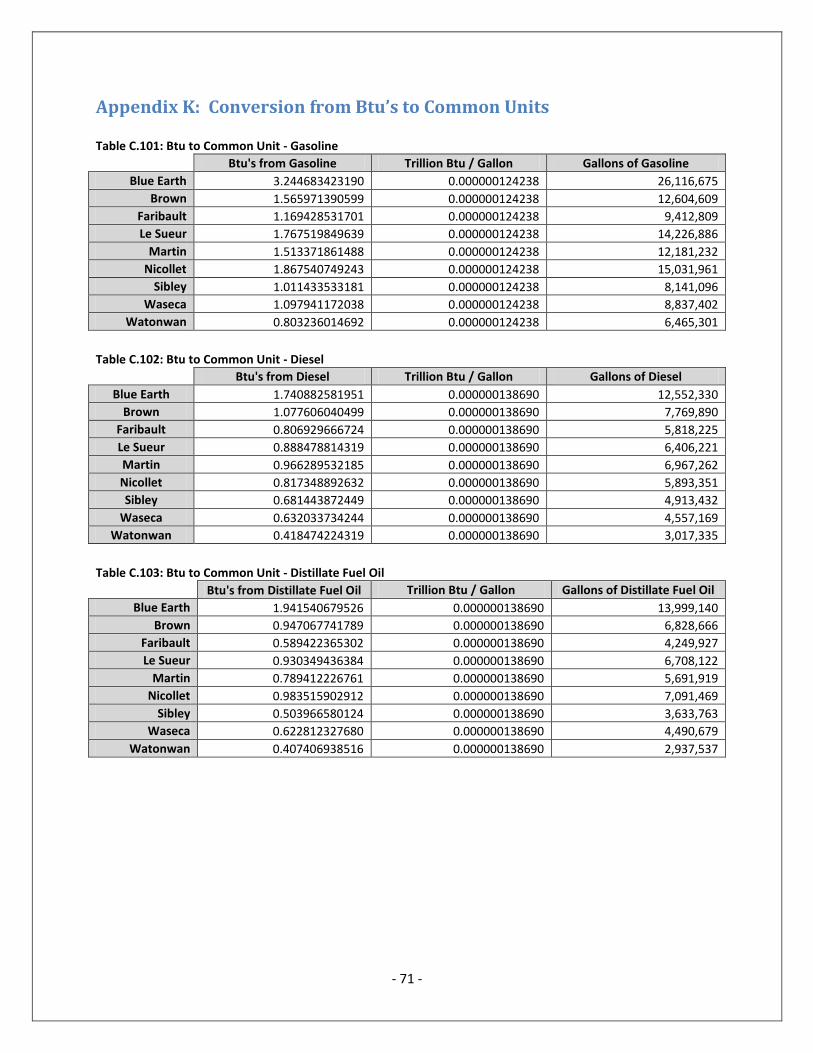
- 71 -
Appendix K: Conversion from Btu’s to Common Units Table C.101: Btu to Common Unit - Gasoline
Btu's from Gasoline Trillion Btu / Gallon Gallons of Gasoline
Blue Earth 3.244683423190 0.000000124238 26,116,675
Brown 1.565971390599 0.000000124238 12,604,609
Faribault 1.169428531701 0.000000124238 9,412,809
Le Sueur 1.767519849639 0.000000124238 14,226,886
Martin 1.513371861488 0.000000124238 12,181,232
Nicollet 1.867540749243 0.000000124238 15,031,961
Sibley 1.011433533181 0.000000124238 8,141,096
Waseca 1.097941172038 0.000000124238 8,837,402
Watonwan 0.803236014692 0.000000124238 6,465,301
Table C.102: Btu to Common Unit - Diesel
Btu's from Diesel Trillion Btu / Gallon Gallons of Diesel
Blue Earth 1.740882581951 0.000000138690 12,552,330
Brown 1.077606040499 0.000000138690 7,769,890
Faribault 0.806929666724 0.000000138690 5,818,225
Le Sueur 0.888478814319 0.000000138690 6,406,221
Martin 0.966289532185 0.000000138690 6,967,262
Nicollet 0.817348892632 0.000000138690 5,893,351
Sibley 0.681443872449 0.000000138690 4,913,432
Waseca 0.632033734244 0.000000138690 4,557,169
Watonwan 0.418474224319 0.000000138690 3,017,335
Table C.103: Btu to Common Unit - Distillate Fuel Oil
Btu's from Distillate Fuel Oil Trillion Btu / Gallon Gallons of Distillate Fuel Oil
Blue Earth 1.941540679526 0.000000138690 13,999,140
Brown 0.947067741789 0.000000138690 6,828,666
Faribault 0.589422365302 0.000000138690 4,249,927
Le Sueur 0.930349436384 0.000000138690 6,708,122
Martin 0.789412226761 0.000000138690 5,691,919
Nicollet 0.983515902912 0.000000138690 7,091,469
Sibley 0.503966580124 0.000000138690 3,633,763
Waseca 0.622812327680 0.000000138690 4,490,679
Watonwan 0.407406938516 0.000000138690 2,937,537
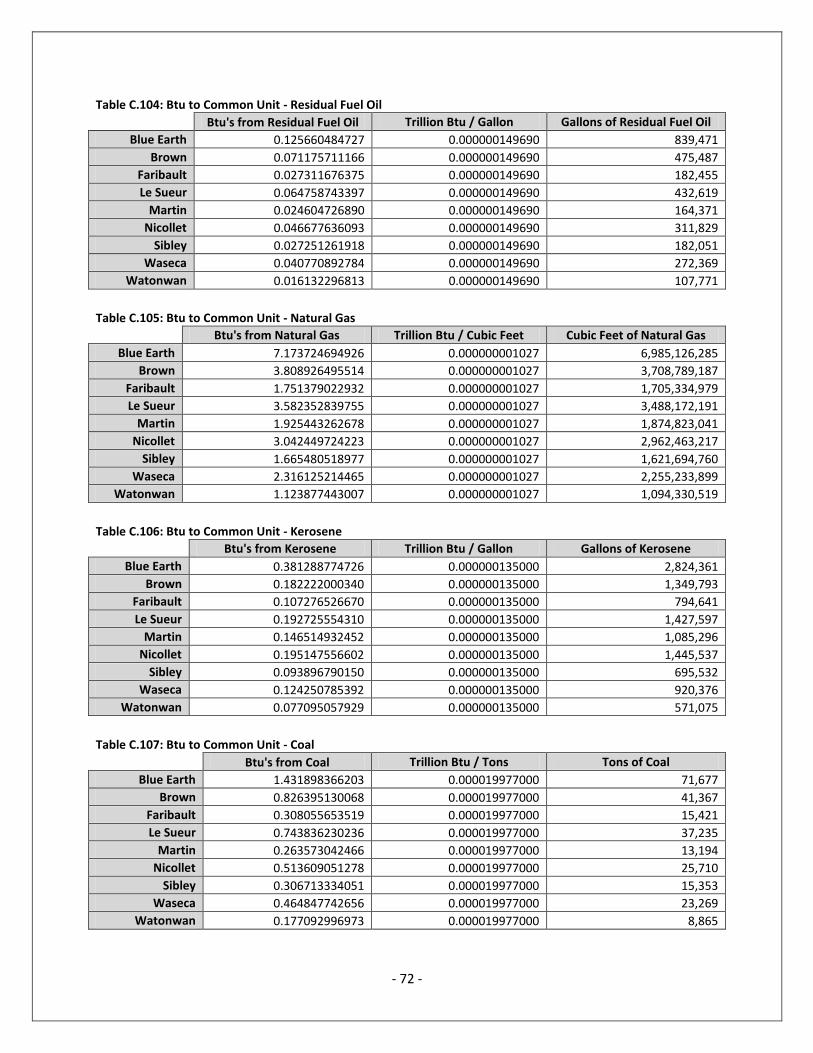
- 72 -
Table C.104: Btu to Common Unit - Residual Fuel Oil
Btu's from Residual Fuel Oil Trillion Btu / Gallon Gallons of Residual Fuel Oil
Blue Earth 0.125660484727 0.000000149690 839,471
Brown 0.071175711166 0.000000149690 475,487
Faribault 0.027311676375 0.000000149690 182,455
Le Sueur 0.064758743397 0.000000149690 432,619
Martin 0.024604726890 0.000000149690 164,371
Nicollet 0.046677636093 0.000000149690 311,829
Sibley 0.027251261918 0.000000149690 182,051
Waseca 0.040770892784 0.000000149690 272,369
Watonwan 0.016132296813 0.000000149690 107,771
Table C.105: Btu to Common Unit - Natural Gas
Btu's from Natural Gas Trillion Btu / Cubic Feet Cubic Feet of Natural Gas
Blue Earth 7.173724694926 0.000000001027 6,985,126,285
Brown 3.808926495514 0.000000001027 3,708,789,187
Faribault 1.751379022932 0.000000001027 1,705,334,979
Le Sueur 3.582352839755 0.000000001027 3,488,172,191
Martin 1.925443262678 0.000000001027 1,874,823,041
Nicollet 3.042449724223 0.000000001027 2,962,463,217
Sibley 1.665480518977 0.000000001027 1,621,694,760
Waseca 2.316125214465 0.000000001027 2,255,233,899
Watonwan 1.123877443007 0.000000001027 1,094,330,519
Table C.106: Btu to Common Unit - Kerosene
Btu's from Kerosene Trillion Btu / Gallon Gallons of Kerosene
Blue Earth 0.381288774726 0.000000135000 2,824,361
Brown 0.182222000340 0.000000135000 1,349,793
Faribault 0.107276526670 0.000000135000 794,641
Le Sueur 0.192725554310 0.000000135000 1,427,597
Martin 0.146514932452 0.000000135000 1,085,296
Nicollet 0.195147556602 0.000000135000 1,445,537
Sibley 0.093896790150 0.000000135000 695,532
Waseca 0.124250785392 0.000000135000 920,376
Watonwan 0.077095057929 0.000000135000 571,075
Table C.107: Btu to Common Unit - Coal
Btu's from Coal Trillion Btu / Tons Tons of Coal
Blue Earth 1.431898366203 0.000019977000 71,677
Brown 0.826395130068 0.000019977000 41,367
Faribault 0.308055653519 0.000019977000 15,421
Le Sueur 0.743836230236 0.000019977000 37,235
Martin 0.263573042466 0.000019977000 13,194
Nicollet 0.513609051278 0.000019977000 25,710
Sibley 0.306713334051 0.000019977000 15,353
Waseca 0.464847742656 0.000019977000 23,269
Watonwan 0.177092996973 0.000019977000 8,865
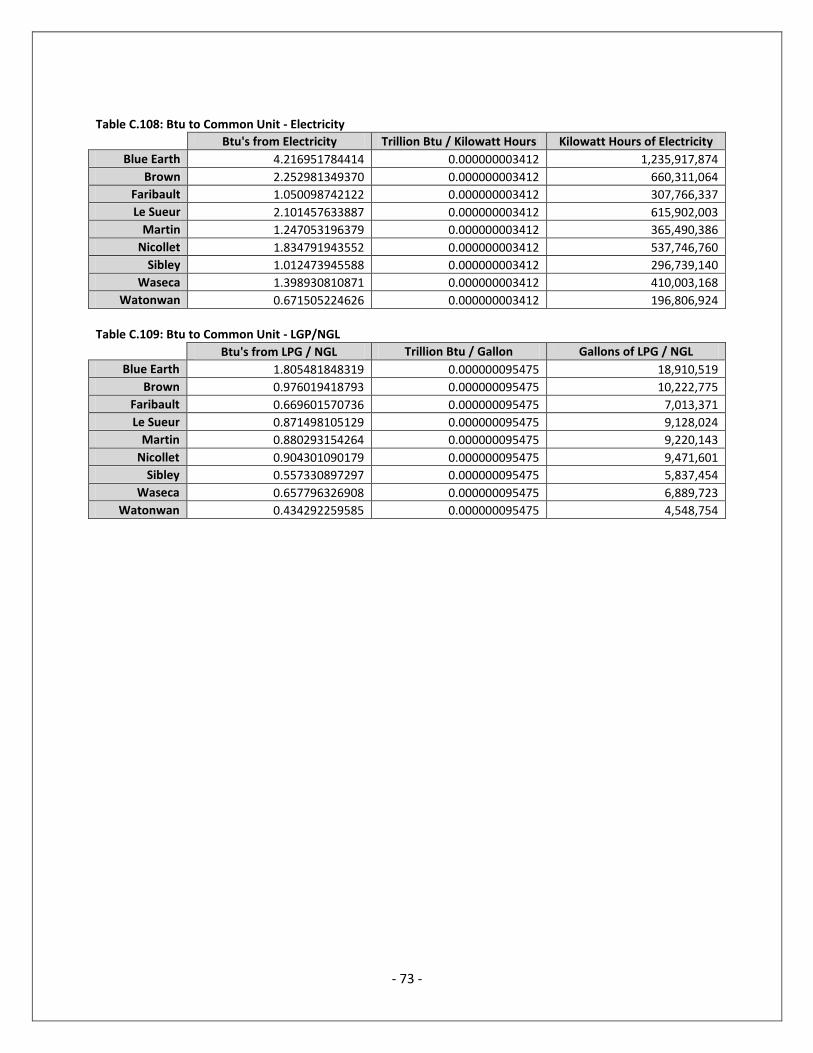
- 73 -
Table C.108: Btu to Common Unit - Electricity
Btu's from Electricity Trillion Btu / Kilowatt Hours Kilowatt Hours of Electricity
Blue Earth 4.216951784414 0.000000003412 1,235,917,874
Brown 2.252981349370 0.000000003412 660,311,064
Faribault 1.050098742122 0.000000003412 307,766,337
Le Sueur 2.101457633887 0.000000003412 615,902,003
Martin 1.247053196379 0.000000003412 365,490,386
Nicollet 1.834791943552 0.000000003412 537,746,760
Sibley 1.012473945588 0.000000003412 296,739,140
Waseca 1.398930810871 0.000000003412 410,003,168
Watonwan 0.671505224626 0.000000003412 196,806,924
Table C.109: Btu to Common Unit - LGP/NGL
Btu's from LPG / NGL Trillion Btu / Gallon Gallons of LPG / NGL
Blue Earth 1.805481848319 0.000000095475 18,910,519
Brown 0.976019418793 0.000000095475 10,222,775
Faribault 0.669601570736 0.000000095475 7,013,371
Le Sueur 0.871498105129 0.000000095475 9,128,024
Martin 0.880293154264 0.000000095475 9,220,143
Nicollet 0.904301090179 0.000000095475 9,471,601
Sibley 0.557330897297 0.000000095475 5,837,454
Waseca 0.657796326908 0.000000095475 6,889,723
Watonwan 0.434292259585 0.000000095475 4,548,754
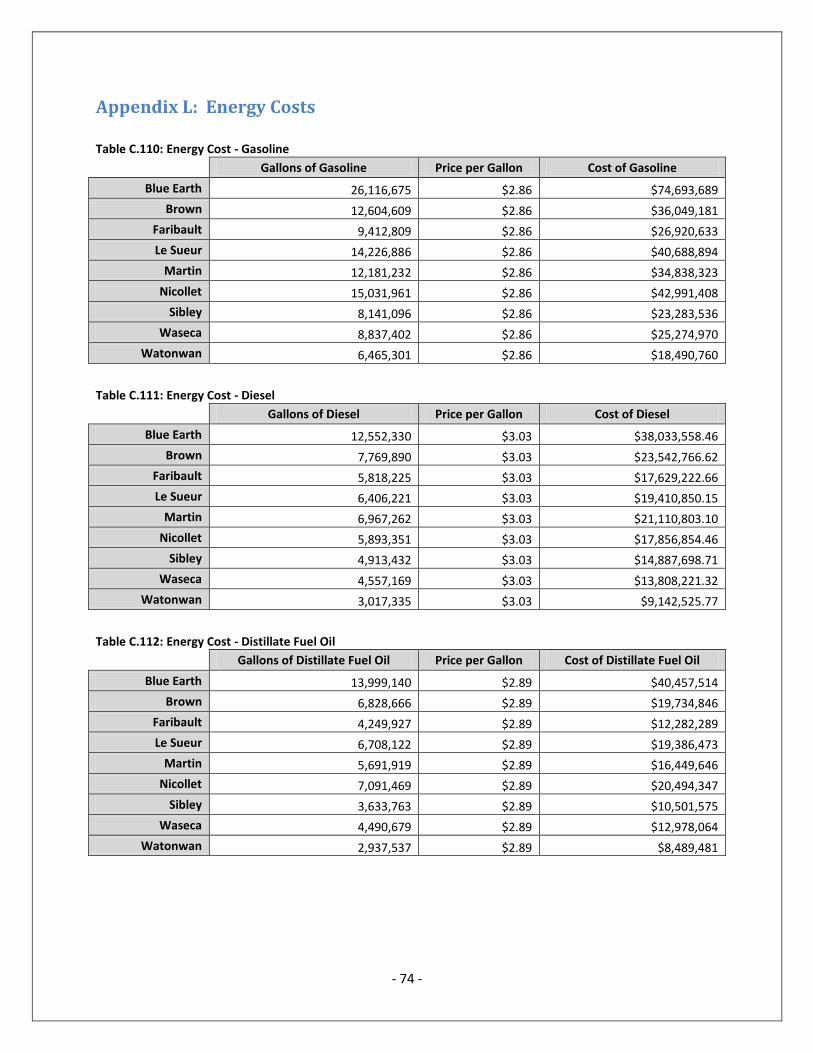
- 74 -
Appendix L: Energy Costs
Table C.110: Energy Cost - Gasoline
Gallons of Gasoline Price per Gallon Cost of Gasoline
Blue Earth 26,116,675 $2.86 $74,693,689
Brown 12,604,609 $2.86 $36,049,181
Faribault 9,412,809 $2.86 $26,920,633
Le Sueur 14,226,886 $2.86 $40,688,894
Martin 12,181,232 $2.86 $34,838,323
Nicollet 15,031,961 $2.86 $42,991,408
Sibley 8,141,096 $2.86 $23,283,536
Waseca 8,837,402 $2.86 $25,274,970
Watonwan 6,465,301 $2.86 $18,490,760
Table C.111: Energy Cost - Diesel
Gallons of Diesel Price per Gallon Cost of Diesel
Blue Earth 12,552,330 $3.03 $38,033,558.46
Brown 7,769,890 $3.03 $23,542,766.62
Faribault 5,818,225 $3.03 $17,629,222.66
Le Sueur 6,406,221 $3.03 $19,410,850.15
Martin 6,967,262 $3.03 $21,110,803.10
Nicollet 5,893,351 $3.03 $17,856,854.46
Sibley 4,913,432 $3.03 $14,887,698.71
Waseca 4,557,169 $3.03 $13,808,221.32
Watonwan 3,017,335 $3.03 $9,142,525.77
Table C.112: Energy Cost - Distillate Fuel Oil
Gallons of Distillate Fuel Oil Price per Gallon Cost of Distillate Fuel Oil
Blue Earth 13,999,140 $2.89 $40,457,514
Brown 6,828,666 $2.89 $19,734,846
Faribault 4,249,927 $2.89 $12,282,289
Le Sueur 6,708,122 $2.89 $19,386,473
Martin 5,691,919 $2.89 $16,449,646
Nicollet 7,091,469 $2.89 $20,494,347
Sibley 3,633,763 $2.89 $10,501,575
Waseca 4,490,679 $2.89 $12,978,064
Watonwan 2,937,537 $2.89 $8,489,481
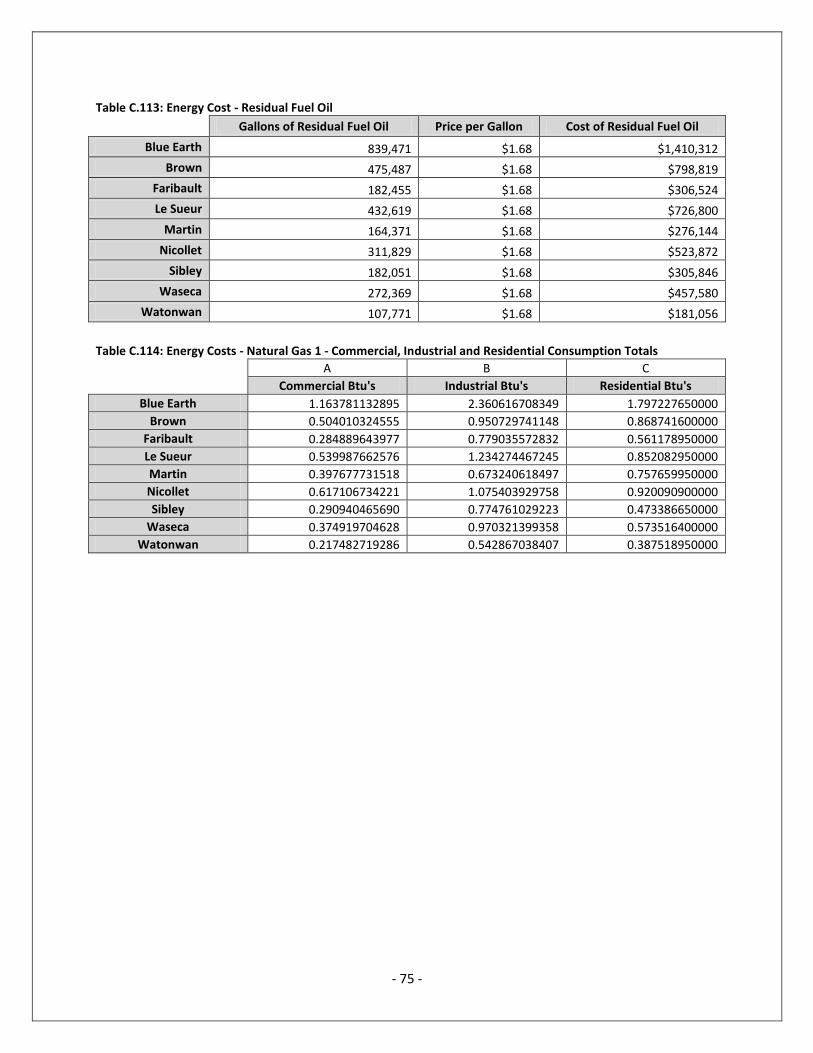
- 75 -
Table C.113: Energy Cost - Residual Fuel Oil
Gallons of Residual Fuel Oil Price per Gallon Cost of Residual Fuel Oil
Blue Earth 839,471 $1.68 $1,410,312
Brown 475,487 $1.68 $798,819
Faribault 182,455 $1.68 $306,524
Le Sueur 432,619 $1.68 $726,800
Martin 164,371 $1.68 $276,144
Nicollet 311,829 $1.68 $523,872
Sibley 182,051 $1.68 $305,846
Waseca 272,369 $1.68 $457,580
Watonwan 107,771 $1.68 $181,056
Table C.114: Energy Costs - Natural Gas 1 - Commercial, Industrial and Residential Consumption Totals
A B C
Commercial Btu's Industrial Btu's Residential Btu's
Blue Earth 1.163781132895 2.360616708349 1.797227650000
Brown 0.504010324555 0.950729741148 0.868741600000
Faribault 0.284889643977 0.779035572832 0.561178950000
Le Sueur 0.539987662576 1.234274467245 0.852082950000
Martin 0.397677731518 0.673240618497 0.757659950000
Nicollet 0.617106734221 1.075403929758 0.920090900000
Sibley 0.290940465690 0.774761029223 0.473386650000
Waseca 0.374919704628 0.970321399358 0.573516400000
Watonwan 0.217482719286 0.542867038407 0.387518950000
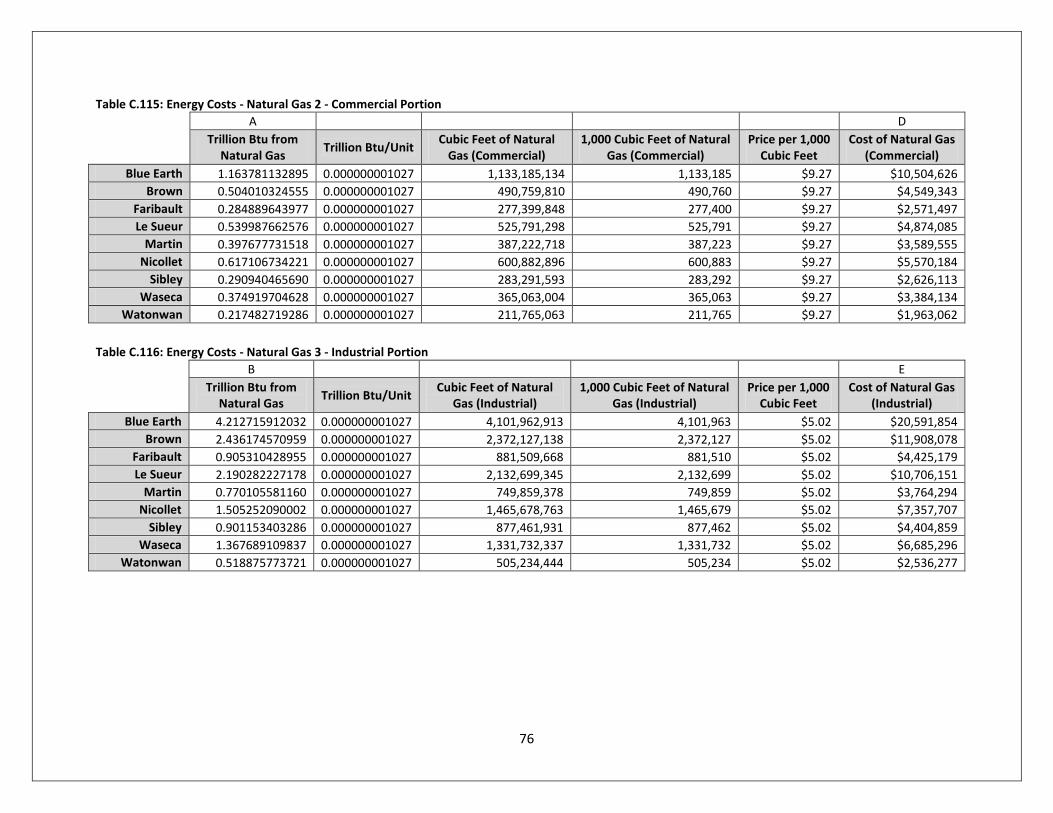
76
Table C.115: Energy Costs - Natural Gas 2 - Commercial Portion
A D
Trillion Btu from
Natural Gas Trillion Btu/Unit
Cubic Feet of Natural Gas (Commercial)
1,000 Cubic Feet of Natural Gas (Commercial)
Price per 1,000 Cubic Feet
Cost of Natural Gas (Commercial)
Blue Earth 1.163781132895 0.000000001027 1,133,185,134 1,133,185 $9.27 $10,504,626
Brown 0.504010324555 0.000000001027 490,759,810 490,760 $9.27 $4,549,343
Faribault 0.284889643977 0.000000001027 277,399,848 277,400 $9.27 $2,571,497
Le Sueur 0.539987662576 0.000000001027 525,791,298 525,791 $9.27 $4,874,085
Martin 0.397677731518 0.000000001027 387,222,718 387,223 $9.27 $3,589,555
Nicollet 0.617106734221 0.000000001027 600,882,896 600,883 $9.27 $5,570,184
Sibley 0.290940465690 0.000000001027 283,291,593 283,292 $9.27 $2,626,113
Waseca 0.374919704628 0.000000001027 365,063,004 365,063 $9.27 $3,384,134
Watonwan 0.217482719286 0.000000001027 211,765,063 211,765 $9.27 $1,963,062
Table C.116: Energy Costs - Natural Gas 3 - Industrial Portion
B E
Trillion Btu from
Natural Gas Trillion Btu/Unit
Cubic Feet of Natural Gas (Industrial)
1,000 Cubic Feet of Natural Gas (Industrial)
Price per 1,000 Cubic Feet
Cost of Natural Gas (Industrial)
Blue Earth 4.212715912032 0.000000001027 4,101,962,913 4,101,963 $5.02 $20,591,854
Brown 2.436174570959 0.000000001027 2,372,127,138 2,372,127 $5.02 $11,908,078
Faribault 0.905310428955 0.000000001027 881,509,668 881,510 $5.02 $4,425,179
Le Sueur 2.190282227178 0.000000001027 2,132,699,345 2,132,699 $5.02 $10,706,151
Martin 0.770105581160 0.000000001027 749,859,378 749,859 $5.02 $3,764,294
Nicollet 1.505252090002 0.000000001027 1,465,678,763 1,465,679 $5.02 $7,357,707
Sibley 0.901153403286 0.000000001027 877,461,931 877,462 $5.02 $4,404,859
Waseca 1.367689109837 0.000000001027 1,331,732,337 1,331,732 $5.02 $6,685,296
Watonwan 0.518875773721 0.000000001027 505,234,444 505,234 $5.02 $2,536,277
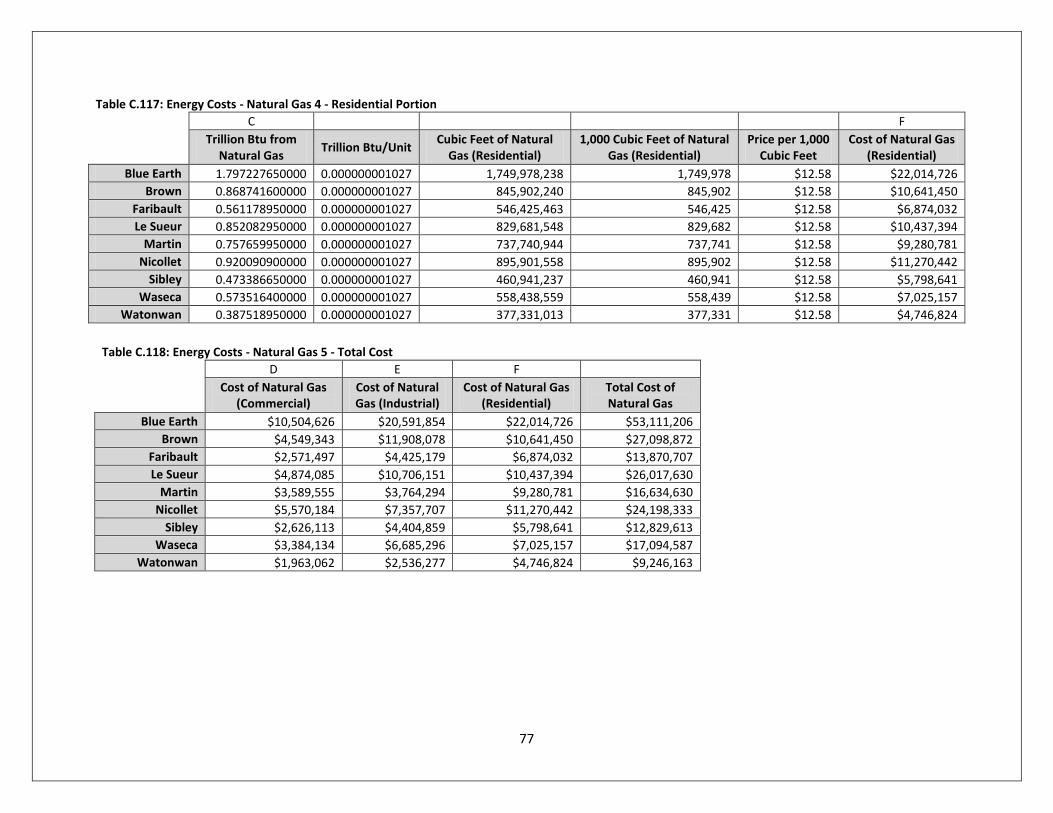
77
Table C.117: Energy Costs - Natural Gas 4 - Residential Portion
C F
Trillion Btu from
Natural Gas Trillion Btu/Unit
Cubic Feet of Natural Gas (Residential)
1,000 Cubic Feet of Natural Gas (Residential)
Price per 1,000 Cubic Feet
Cost of Natural Gas (Residential)
Blue Earth 1.797227650000 0.000000001027 1,749,978,238 1,749,978 $12.58 $22,014,726
Brown 0.868741600000 0.000000001027 845,902,240 845,902 $12.58 $10,641,450
Faribault 0.561178950000 0.000000001027 546,425,463 546,425 $12.58 $6,874,032
Le Sueur 0.852082950000 0.000000001027 829,681,548 829,682 $12.58 $10,437,394
Martin 0.757659950000 0.000000001027 737,740,944 737,741 $12.58 $9,280,781
Nicollet 0.920090900000 0.000000001027 895,901,558 895,902 $12.58 $11,270,442
Sibley 0.473386650000 0.000000001027 460,941,237 460,941 $12.58 $5,798,641
Waseca 0.573516400000 0.000000001027 558,438,559 558,439 $12.58 $7,025,157
Watonwan 0.387518950000 0.000000001027 377,331,013 377,331 $12.58 $4,746,824
Table C.118: Energy Costs - Natural Gas 5 - Total Cost
D E F
Cost of Natural Gas (Commercial)
Cost of Natural Gas (Industrial)
Cost of Natural Gas (Residential)
Total Cost of Natural Gas
Blue Earth $10,504,626 $20,591,854 $22,014,726 $53,111,206
Brown $4,549,343 $11,908,078 $10,641,450 $27,098,872
Faribault $2,571,497 $4,425,179 $6,874,032 $13,870,707
Le Sueur $4,874,085 $10,706,151 $10,437,394 $26,017,630
Martin $3,589,555 $3,764,294 $9,280,781 $16,634,630
Nicollet $5,570,184 $7,357,707 $11,270,442 $24,198,333
Sibley $2,626,113 $4,404,859 $5,798,641 $12,829,613
Waseca $3,384,134 $6,685,296 $7,025,157 $17,094,587
Watonwan $1,963,062 $2,536,277 $4,746,824 $9,246,163
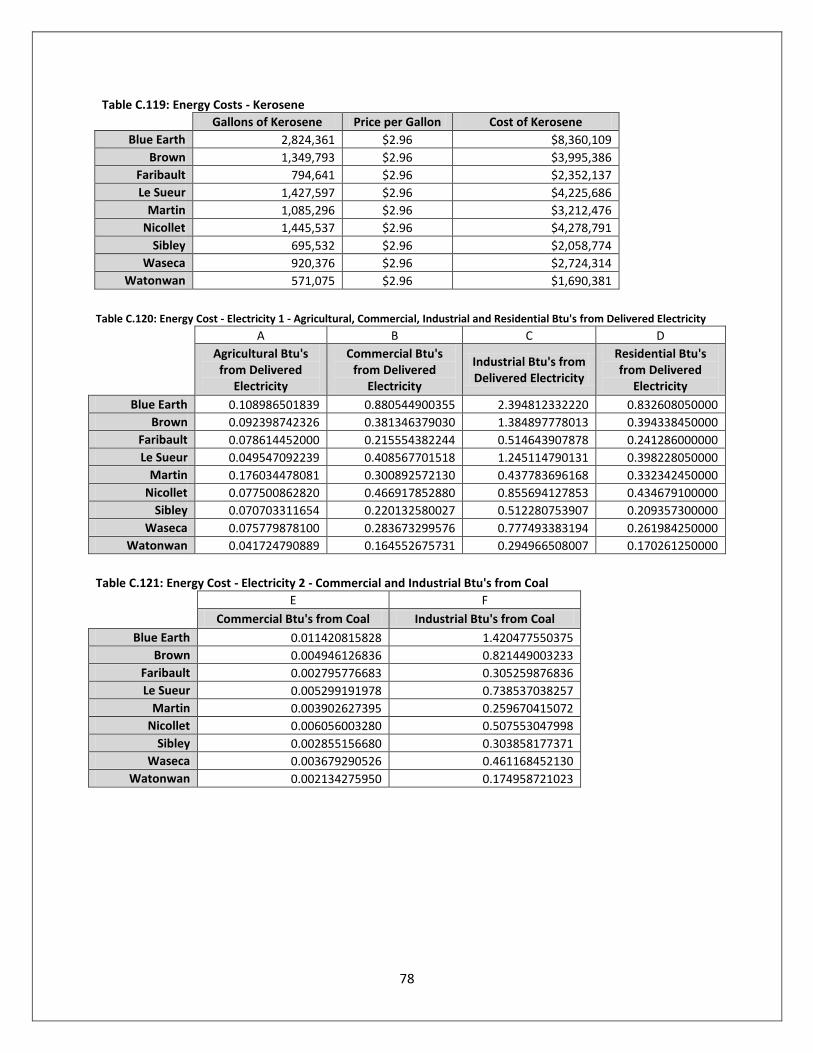
78
Table C.119: Energy Costs - Kerosene
Gallons of Kerosene Price per Gallon Cost of Kerosene
Blue Earth 2,824,361 $2.96 $8,360,109
Brown 1,349,793 $2.96 $3,995,386
Faribault 794,641 $2.96 $2,352,137
Le Sueur 1,427,597 $2.96 $4,225,686
Martin 1,085,296 $2.96 $3,212,476
Nicollet 1,445,537 $2.96 $4,278,791
Sibley 695,532 $2.96 $2,058,774
Waseca 920,376 $2.96 $2,724,314
Watonwan 571,075 $2.96 $1,690,381
Table C.120: Energy Cost - Electricity 1 - Agricultural, Commercial, Industrial and Residential Btu's from Delivered Electricity
A B C D
Agricultural Btu's from Delivered
Electricity
Commercial Btu's from Delivered
Electricity
Industrial Btu's from Delivered Electricity
Residential Btu's from Delivered
Electricity
Blue Earth 0.108986501839 0.880544900355 2.394812332220 0.832608050000
Brown 0.092398742326 0.381346379030 1.384897778013 0.394338450000
Faribault 0.078614452000 0.215554382244 0.514643907878 0.241286000000
Le Sueur 0.049547092239 0.408567701518 1.245114790131 0.398228050000
Martin 0.176034478081 0.300892572130 0.437783696168 0.332342450000
Nicollet 0.077500862820 0.466917852880 0.855694127853 0.434679100000
Sibley 0.070703311654 0.220132580027 0.512280753907 0.209357300000
Waseca 0.075779878100 0.283673299576 0.777493383194 0.261984250000
Watonwan 0.041724790889 0.164552675731 0.294966508007 0.170261250000
Table C.121: Energy Cost - Electricity 2 - Commercial and Industrial Btu's from Coal
E F
Commercial Btu's from Coal Industrial Btu's from Coal
Blue Earth 0.011420815828 1.420477550375
Brown 0.004946126836 0.821449003233
Faribault 0.002795776683 0.305259876836
Le Sueur 0.005299191978 0.738537038257
Martin 0.003902627395 0.259670415072
Nicollet 0.006056003280 0.507553047998
Sibley 0.002855156680 0.303858177371
Waseca 0.003679290526 0.461168452130
Watonwan 0.002134275950 0.174958721023
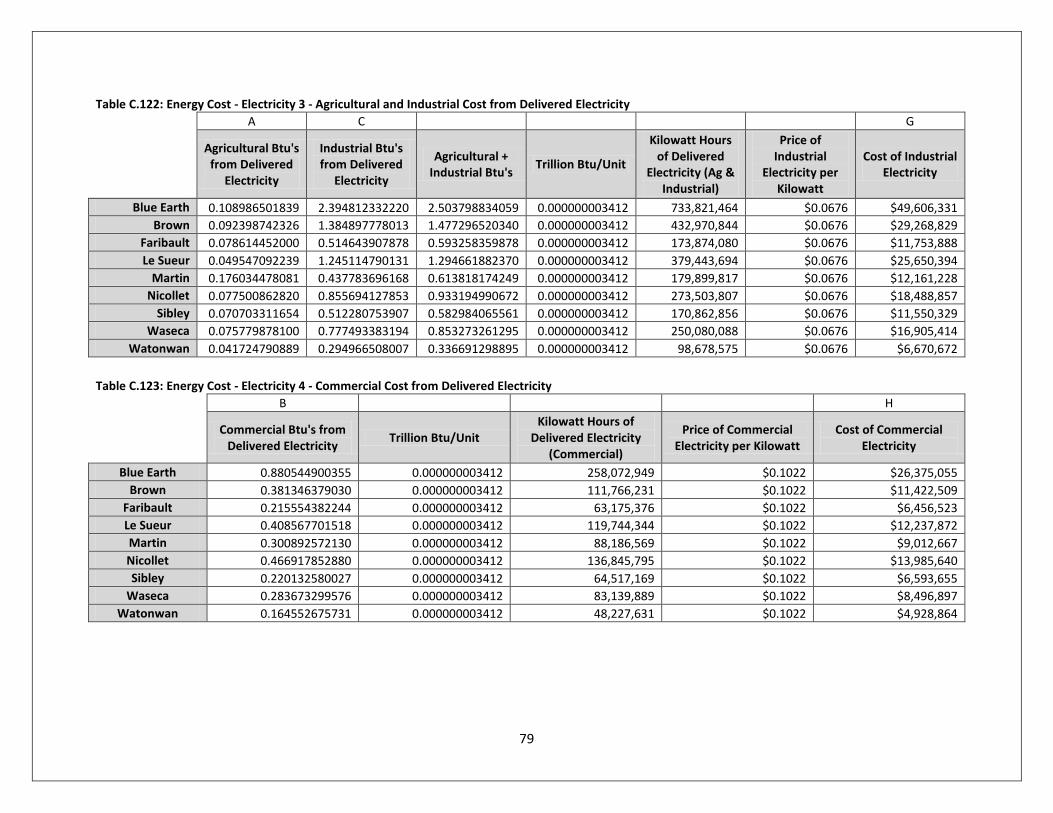
79
Table C.122: Energy Cost - Electricity 3 - Agricultural and Industrial Cost from Delivered Electricity
A C G
Agricultural Btu's from Delivered
Electricity
Industrial Btu's from Delivered
Electricity
Agricultural + Industrial Btu's
Trillion Btu/Unit
Kilowatt Hours of Delivered
Electricity (Ag & Industrial)
Price of Industrial
Electricity per Kilowatt
Cost of Industrial Electricity
Blue Earth 0.108986501839 2.394812332220 2.503798834059 0.000000003412 733,821,464 $0.0676 $49,606,331
Brown 0.092398742326 1.384897778013 1.477296520340 0.000000003412 432,970,844 $0.0676 $29,268,829
Faribault 0.078614452000 0.514643907878 0.593258359878 0.000000003412 173,874,080 $0.0676 $11,753,888
Le Sueur 0.049547092239 1.245114790131 1.294661882370 0.000000003412 379,443,694 $0.0676 $25,650,394
Martin 0.176034478081 0.437783696168 0.613818174249 0.000000003412 179,899,817 $0.0676 $12,161,228
Nicollet 0.077500862820 0.855694127853 0.933194990672 0.000000003412 273,503,807 $0.0676 $18,488,857
Sibley 0.070703311654 0.512280753907 0.582984065561 0.000000003412 170,862,856 $0.0676 $11,550,329
Waseca 0.075779878100 0.777493383194 0.853273261295 0.000000003412 250,080,088 $0.0676 $16,905,414
Watonwan 0.041724790889 0.294966508007 0.336691298895 0.000000003412 98,678,575 $0.0676 $6,670,672
Table C.123: Energy Cost - Electricity 4 - Commercial Cost from Delivered Electricity
B H
Commercial Btu's from
Delivered Electricity Trillion Btu/Unit
Kilowatt Hours of Delivered Electricity
(Commercial)
Price of Commercial Electricity per Kilowatt
Cost of Commercial Electricity
Blue Earth 0.880544900355 0.000000003412 258,072,949 $0.1022 $26,375,055
Brown 0.381346379030 0.000000003412 111,766,231 $0.1022 $11,422,509
Faribault 0.215554382244 0.000000003412 63,175,376 $0.1022 $6,456,523
Le Sueur 0.408567701518 0.000000003412 119,744,344 $0.1022 $12,237,872
Martin 0.300892572130 0.000000003412 88,186,569 $0.1022 $9,012,667
Nicollet 0.466917852880 0.000000003412 136,845,795 $0.1022 $13,985,640
Sibley 0.220132580027 0.000000003412 64,517,169 $0.1022 $6,593,655
Waseca 0.283673299576 0.000000003412 83,139,889 $0.1022 $8,496,897
Watonwan 0.164552675731 0.000000003412 48,227,631 $0.1022 $4,928,864
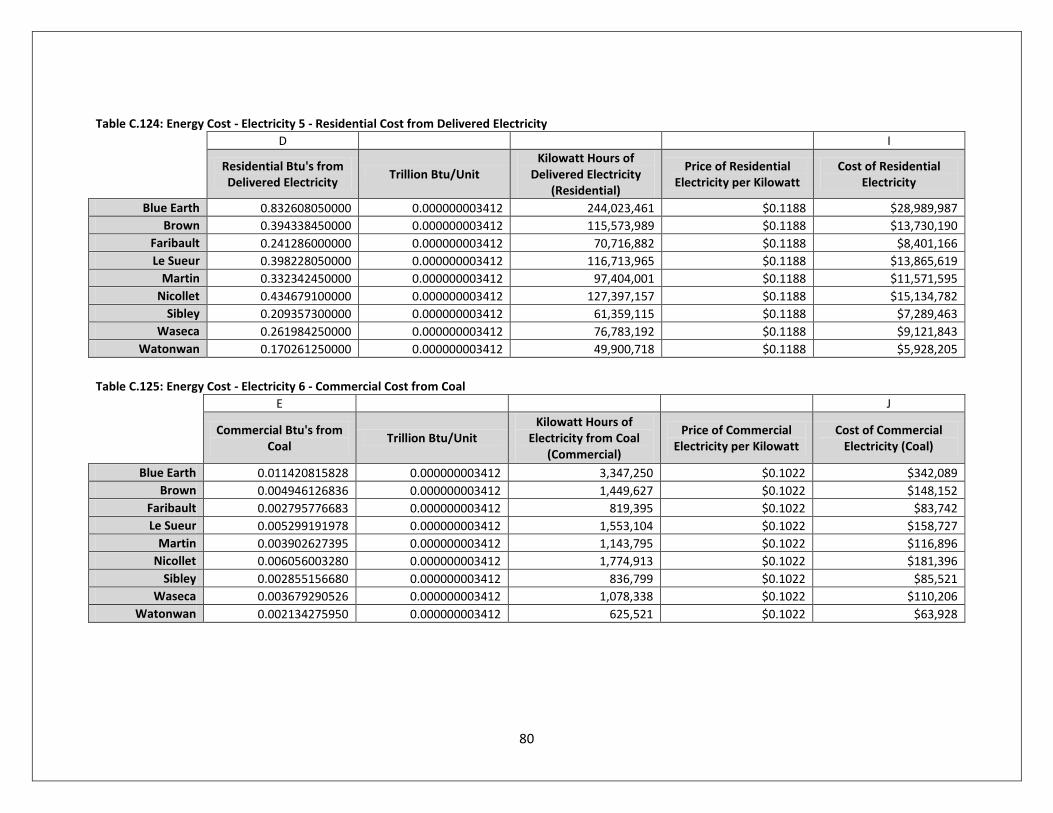
80
Table C.124: Energy Cost - Electricity 5 - Residential Cost from Delivered Electricity
D I
Residential Btu's from Delivered Electricity
Trillion Btu/Unit Kilowatt Hours of
Delivered Electricity (Residential)
Price of Residential Electricity per Kilowatt
Cost of Residential Electricity
Blue Earth 0.832608050000 0.000000003412 244,023,461 $0.1188 $28,989,987
Brown 0.394338450000 0.000000003412 115,573,989 $0.1188 $13,730,190
Faribault 0.241286000000 0.000000003412 70,716,882 $0.1188 $8,401,166
Le Sueur 0.398228050000 0.000000003412 116,713,965 $0.1188 $13,865,619
Martin 0.332342450000 0.000000003412 97,404,001 $0.1188 $11,571,595
Nicollet 0.434679100000 0.000000003412 127,397,157 $0.1188 $15,134,782
Sibley 0.209357300000 0.000000003412 61,359,115 $0.1188 $7,289,463
Waseca 0.261984250000 0.000000003412 76,783,192 $0.1188 $9,121,843
Watonwan 0.170261250000 0.000000003412 49,900,718 $0.1188 $5,928,205
Table C.125: Energy Cost - Electricity 6 - Commercial Cost from Coal
E J
Commercial Btu's from
Coal Trillion Btu/Unit
Kilowatt Hours of Electricity from Coal
(Commercial)
Price of Commercial Electricity per Kilowatt
Cost of Commercial Electricity (Coal)
Blue Earth 0.011420815828 0.000000003412 3,347,250 $0.1022 $342,089
Brown 0.004946126836 0.000000003412 1,449,627 $0.1022 $148,152
Faribault 0.002795776683 0.000000003412 819,395 $0.1022 $83,742
Le Sueur 0.005299191978 0.000000003412 1,553,104 $0.1022 $158,727
Martin 0.003902627395 0.000000003412 1,143,795 $0.1022 $116,896
Nicollet 0.006056003280 0.000000003412 1,774,913 $0.1022 $181,396
Sibley 0.002855156680 0.000000003412 836,799 $0.1022 $85,521
Waseca 0.003679290526 0.000000003412 1,078,338 $0.1022 $110,206
Watonwan 0.002134275950 0.000000003412 625,521 $0.1022 $63,928
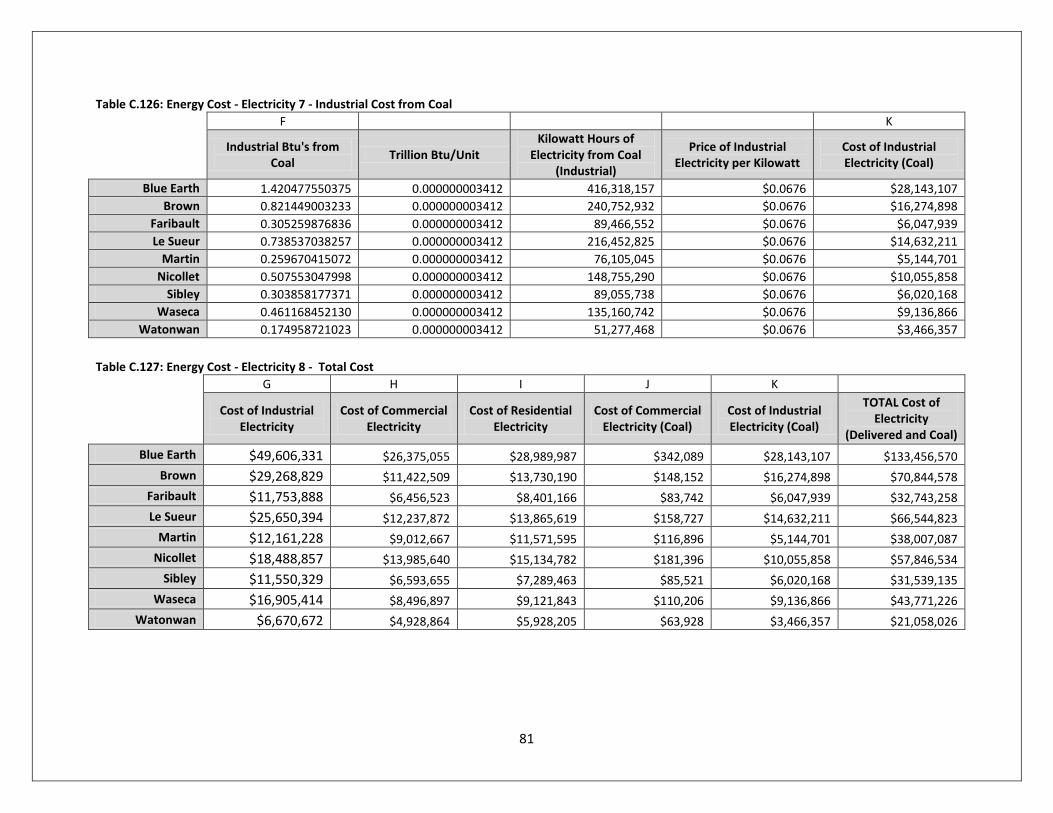
81
Table C.126: Energy Cost - Electricity 7 - Industrial Cost from Coal
F K
Industrial Btu's from
Coal Trillion Btu/Unit
Kilowatt Hours of Electricity from Coal
(Industrial)
Price of Industrial Electricity per Kilowatt
Cost of Industrial Electricity (Coal)
Blue Earth 1.420477550375 0.000000003412 416,318,157 $0.0676 $28,143,107
Brown 0.821449003233 0.000000003412 240,752,932 $0.0676 $16,274,898
Faribault 0.305259876836 0.000000003412 89,466,552 $0.0676 $6,047,939
Le Sueur 0.738537038257 0.000000003412 216,452,825 $0.0676 $14,632,211
Martin 0.259670415072 0.000000003412 76,105,045 $0.0676 $5,144,701
Nicollet 0.507553047998 0.000000003412 148,755,290 $0.0676 $10,055,858
Sibley 0.303858177371 0.000000003412 89,055,738 $0.0676 $6,020,168
Waseca 0.461168452130 0.000000003412 135,160,742 $0.0676 $9,136,866
Watonwan 0.174958721023 0.000000003412 51,277,468 $0.0676 $3,466,357
Table C.127: Energy Cost - Electricity 8 - Total Cost
G H I J K
Cost of Industrial Electricity
Cost of Commercial Electricity
Cost of Residential Electricity
Cost of Commercial Electricity (Coal)
Cost of Industrial Electricity (Coal)
TOTAL Cost of Electricity
(Delivered and Coal)
Blue Earth $49,606,331 $26,375,055 $28,989,987 $342,089 $28,143,107 $133,456,570
Brown $29,268,829 $11,422,509 $13,730,190 $148,152 $16,274,898 $70,844,578
Faribault $11,753,888 $6,456,523 $8,401,166 $83,742 $6,047,939 $32,743,258
Le Sueur $25,650,394 $12,237,872 $13,865,619 $158,727 $14,632,211 $66,544,823
Martin $12,161,228 $9,012,667 $11,571,595 $116,896 $5,144,701 $38,007,087
Nicollet $18,488,857 $13,985,640 $15,134,782 $181,396 $10,055,858 $57,846,534
Sibley $11,550,329 $6,593,655 $7,289,463 $85,521 $6,020,168 $31,539,135
Waseca $16,905,414 $8,496,897 $9,121,843 $110,206 $9,136,866 $43,771,226
Watonwan $6,670,672 $4,928,864 $5,928,205 $63,928 $3,466,357 $21,058,026
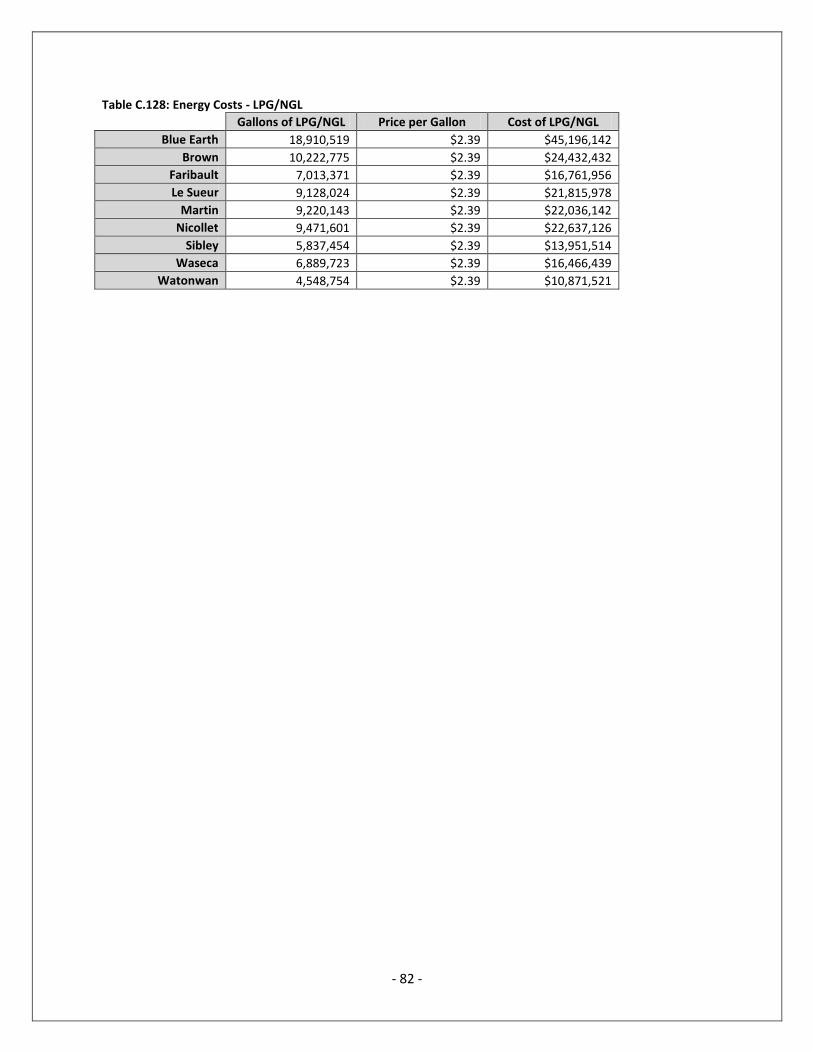
- 82 -
Table C.128: Energy Costs - LPG/NGL
Gallons of LPG/NGL Price per Gallon Cost of LPG/NGL
Blue Earth 18,910,519 $2.39 $45,196,142
Brown 10,222,775 $2.39 $24,432,432
Faribault 7,013,371 $2.39 $16,761,956
Le Sueur 9,128,024 $2.39 $21,815,978
Martin 9,220,143 $2.39 $22,036,142
Nicollet 9,471,601 $2.39 $22,637,126
Sibley 5,837,454 $2.39 $13,951,514
Waseca 6,889,723 $2.39 $16,466,439
Watonwan 4,548,754 $2.39 $10,871,521

- 83 -
Appendix M: Greenhouse Gas Emissions
Table C.129: Blue Earth Co. Greenhouse Gas Emissions from Agriculture
Agricultural Consumption (Trillion Btu)
Pounds of GHG per Trillion Btu
Pounds of GHG from Agricultural
Tons of GHG from Agricultural
Electricity 0.108986501839 535,018,000 58,309,740 29,155
Coal 211,200,000 0 0
Coke and Breeze 224,400,000 0 0
Natural Gas 116,600,000 0 0
LPG and NGL 0.228823085973 138,600,000 31,714,880 15,857
Kerosene 158,400,000 0 0
Distillate Fuel Oil 160,600,000 0 0
Residual Fuel Oil 173,800,000 0 0
Gasoline 0.060746800880 161,829,376 9,830,617 4,915
Diesel 0.383100604708 164,972,240 63,200,965 31,600
Petroleum Coke 224,400,000 0 0
Total 163,056,202 81,528
Table C.130: Blue Earth Co. Greenhouse Gas Emissions from Commercial
Commercial Consumption (Trillion Btu)
Pounds of GHG per Trillion Btu
Pounds of GHG from Commercial
Tons of GHG from Commerical
Electricity 0.880544900355 535,018,000 471,107,371 235,554
Coal 0.011420815828 211,200,000 2,412,076 1,206
Coke and Breeze 224,400,000 0 0
Natural Gas 1.163781132895 116,600,000 135,696,880 67,848
LPG and NGL 0.039972855399 138,600,000 5,540,238 2,770
Kerosene 158,400,000 0 0
Distillate Fuel Oil 0.057104079141 160,600,000 9,170,915 4,585
Residual Fuel Oil 0.010278734245 173,800,000 1,786,444 893
Gasoline 0.051393671227 161,829,376 8,317,006 4,159
Diesel 164,972,240 0 0
Petroleum Coke 224,400,000 0 0
Total 634,030,930 317,015
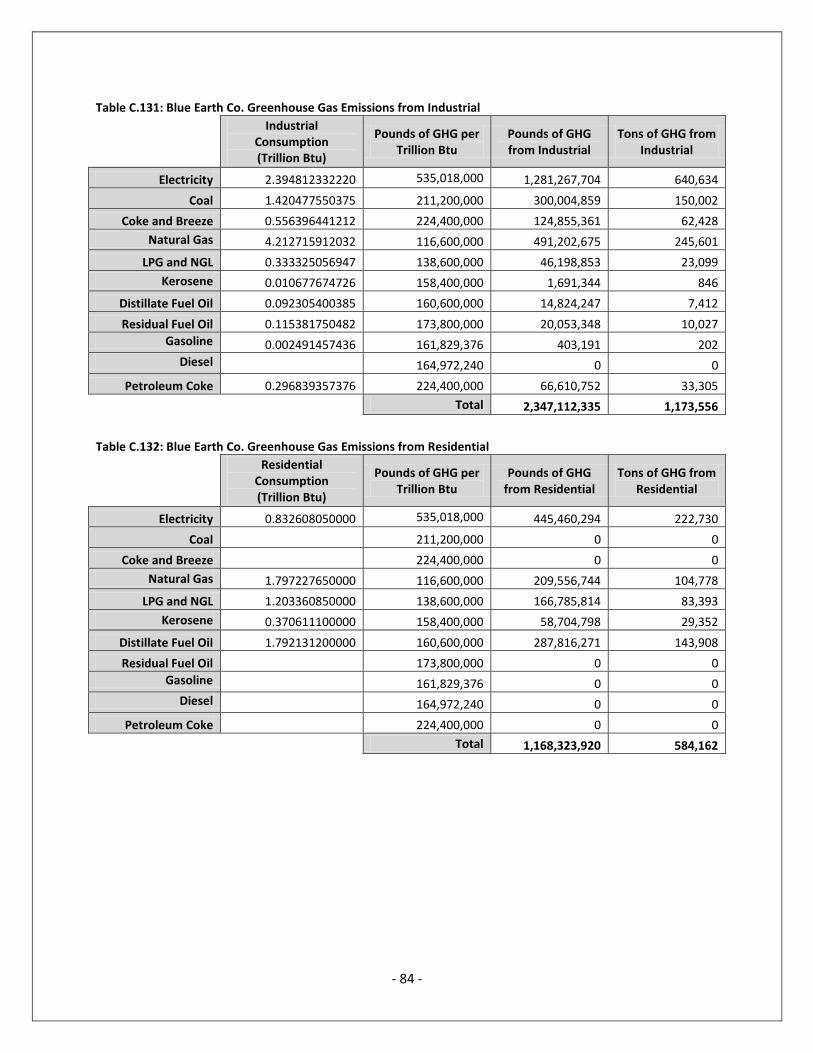
- 84 -
Table C.131: Blue Earth Co. Greenhouse Gas Emissions from Industrial
Industrial Consumption (Trillion Btu)
Pounds of GHG per Trillion Btu
Pounds of GHG from Industrial
Tons of GHG from Industrial
Electricity 2.394812332220 535,018,000 1,281,267,704 640,634
Coal 1.420477550375 211,200,000 300,004,859 150,002
Coke and Breeze 0.556396441212 224,400,000 124,855,361 62,428
Natural Gas 4.212715912032 116,600,000 491,202,675 245,601
LPG and NGL 0.333325056947 138,600,000 46,198,853 23,099
Kerosene 0.010677674726 158,400,000 1,691,344 846
Distillate Fuel Oil 0.092305400385 160,600,000 14,824,247 7,412
Residual Fuel Oil 0.115381750482 173,800,000 20,053,348 10,027
Gasoline 0.002491457436 161,829,376 403,191 202
Diesel 164,972,240 0 0
Petroleum Coke 0.296839357376 224,400,000 66,610,752 33,305
Total 2,347,112,335 1,173,556
Table C.132: Blue Earth Co. Greenhouse Gas Emissions from Residential
Residential Consumption (Trillion Btu)
Pounds of GHG per Trillion Btu
Pounds of GHG from Residential
Tons of GHG from Residential
Electricity 0.832608050000 535,018,000 445,460,294 222,730
Coal 211,200,000 0 0
Coke and Breeze 224,400,000 0 0
Natural Gas 1.797227650000 116,600,000 209,556,744 104,778
LPG and NGL 1.203360850000 138,600,000 166,785,814 83,393
Kerosene 0.370611100000 158,400,000 58,704,798 29,352
Distillate Fuel Oil 1.792131200000 160,600,000 287,816,271 143,908
Residual Fuel Oil 173,800,000 0 0
Gasoline 161,829,376 0 0
Diesel 164,972,240 0 0
Petroleum Coke 224,400,000 0 0
Total 1,168,323,920 584,162

- 85 -
Table C.133: Blue Earth Co. Greenhouse Gas Emissions from Transportation
Transportation Consumption (Trillion Btu)
Pounds of GHG per Trillion Btu
Pounds of GHG from
Transportation
Tons of GHG from Transportation
Electricity 535,018,000 0 0
Coal 211,200,000 0 0
Coke and Breeze 224,400,000 0 0
Natural Gas 116,600,000 0 0
LPG and NGL 138,600,000 0 0
Kerosene 158,400,000 0 0
Distillate Fuel Oil 160,600,000 0 0
Residual Fuel Oil 173,800,000 0 0
Gasoline 3.130051493647 161,829,376 506,534,279 253,267
Diesel 1.357781977244 164,972,240 223,996,335 111,998
Petroleum Coke 224,400,000 0 0
Total 730,530,613 365,265
Table C.134: Brown Co. Greenhouse Gas Emissions from Agriculture
Agricultural Consumption (Trillion Btu)
Pounds of GHG per Trillion Btu
Pounds of GHG from Agricultural
Tons of GHG from Agricultural
Electricity 0.092398742326 535,018,000 49,434,990 24,717
Coal 211,200,000 0 0
Coke and Breeze 224,400,000 0 0
Natural Gas 116,600,000 0 0
LPG and NGL 0.189733583496 138,600,000 26,297,075 13,149
Kerosene 158,400,000 0 0
Distillate Fuel Oil 160,600,000 0 0
Residual Fuel Oil 173,800,000 0 0
Gasoline 0.051771703040 161,829,376 8,378,182 4,189
Diesel 0.351254690358 164,972,240 57,947,273 28,974
Petroleum Coke 224,400,000 0 0
Total 142,057,521 71,029

- 86 -
Table C.135: Brown Co. Greenhouse Gas Emissions from Commercial
Commercial Consumption (Trillion Btu)
Pounds of GHG per Trillion Btu
Pounds of GHG from Commercial
Tons of GHG from Commerical
Electricity 0.381346379030 535,018,000 204,027,177 102,014
Coal 0.004946126836 211,200,000 1,044,622 522
Coke and Breeze 224,400,000 0 0
Natural Gas 0.504010324555 116,600,000 58,767,604 29,384
LPG and NGL 0.017311443925 138,600,000 2,399,366 1,200
Kerosene 158,400,000 0 0
Distillate Fuel Oil 0.024730634178 160,600,000 3,971,740 1,986
Residual Fuel Oil 0.004451514152 173,800,000 773,673 387
Gasoline 0.022257570761 161,829,376 3,601,929 1,801
Diesel 164,972,240 0 0
Petroleum Coke 224,400,000 0 0
Total 274,586,111 137,293
Table C.136: Brown Co. Greenhouse Gas Emissions from Industrial
Industrial Consumption (Trillion Btu)
Pounds of GHG per Trillion Btu
Pounds of GHG from Industrial
Tons of GHG from Industrial
Electricity 1.384897778013 535,018,000 740,945,239 370,473
Coal 0.821449003233 211,200,000 173,490,029 86,745
Coke and Breeze 0.321758905598 224,400,000 72,202,698 36,101
Natural Gas 2.436174570959 116,600,000 284,057,955 142,029
LPG and NGL 0.192758791372 138,600,000 26,716,368 13,358
Kerosene 0.006174800340 158,400,000 978,088 489
Distillate Fuel Oil 0.053379357611 160,600,000 8,572,725 4,286
Residual Fuel Oil 0.066724197013 173,800,000 11,596,665 5,798
Gasoline 0.001440786746 161,829,376 233,162 117
Diesel 164,972,240 0 0
Petroleum Coke 0.171659449439 224,400,000 38,520,380 19,260
Total 1,357,313,311 678,657

- 87 -
Table C.137: Brown Co. Greenhouse Gas Emissions from Residential
Residential Consumption (Trillion Btu)
Pounds of GHG per Trillion Btu
Pounds of GHG from Residential
Tons of GHG from Residential
Electricity 0.394338450000 535,018,000 210,978,169 105,489
Coal 211,200,000 0 0
Coke and Breeze 224,400,000 0 0
Natural Gas 0.868741600000 116,600,000 101,295,271 50,648
LPG and NGL 0.576215600000 138,600,000 79,863,482 39,932
Kerosene 0.176047200000 158,400,000 27,885,876 13,943
Distillate Fuel Oil 0.868957750000 160,600,000 139,554,615 69,777
Residual Fuel Oil 173,800,000 0 0
Gasoline 161,829,376 0 0
Diesel 164,972,240 0 0
Petroleum Coke 224,400,000 0 0
Total 559,577,413 279,789
Table C.138: Brown Co. Greenhouse Gas Emissions from Transportation
Transportation Consumption (Trillion Btu)
Pounds of GHG per Trillion Btu
Pounds of GHG from
Transportation
Tons of GHG from Transportation
Electricity 535,018,000 0 0
Coal 211,200,000 0 0
Coke and Breeze 224,400,000 0 0
Natural Gas 116,600,000 0 0
LPG and NGL 138,600,000 0 0
Kerosene 158,400,000 0 0
Distillate Fuel Oil 160,600,000 0 0
Residual Fuel Oil 173,800,000 0 0
Gasoline 1.490501330052 161,829,376 241,206,899 120,603
Diesel 0.726351350141 164,972,240 119,827,809 59,914
Petroleum Coke 224,400,000 0 0
Total 361,034,709 180,517
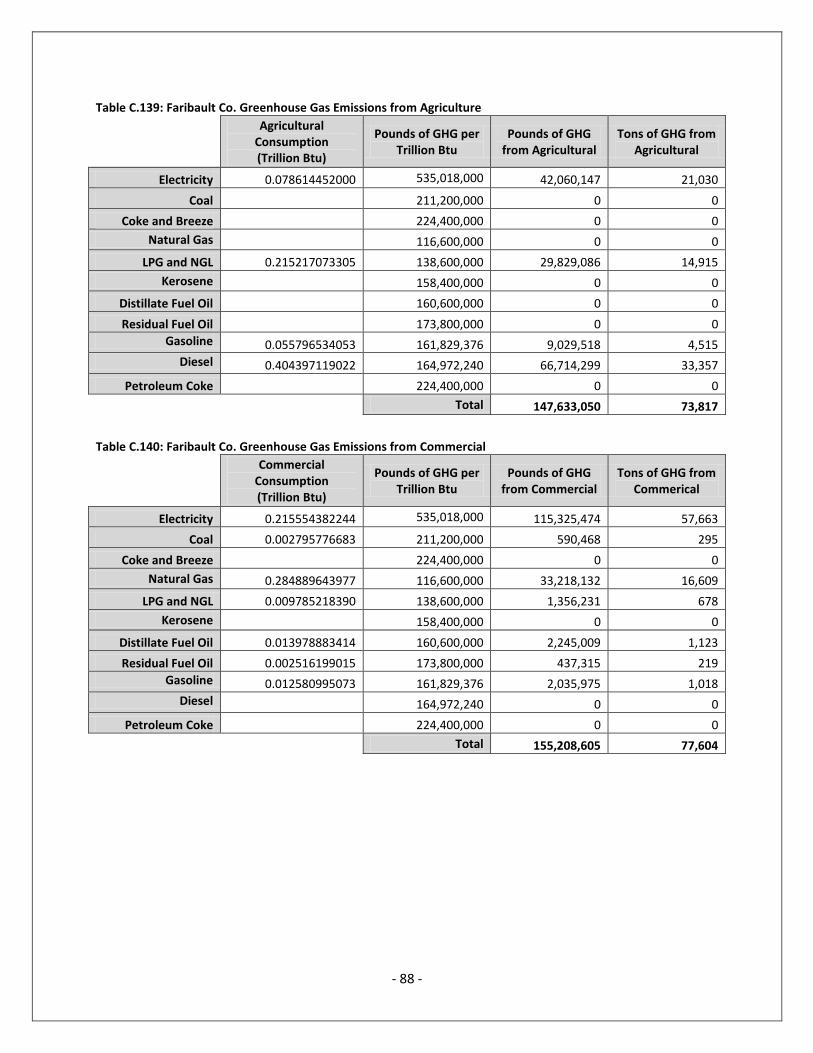
- 88 -
Table C.139: Faribault Co. Greenhouse Gas Emissions from Agriculture
Agricultural Consumption (Trillion Btu)
Pounds of GHG per Trillion Btu
Pounds of GHG from Agricultural
Tons of GHG from Agricultural
Electricity 0.078614452000 535,018,000 42,060,147 21,030
Coal 211,200,000 0 0
Coke and Breeze 224,400,000 0 0
Natural Gas 116,600,000 0 0
LPG and NGL 0.215217073305 138,600,000 29,829,086 14,915
Kerosene 158,400,000 0 0
Distillate Fuel Oil 160,600,000 0 0
Residual Fuel Oil 173,800,000 0 0
Gasoline 0.055796534053 161,829,376 9,029,518 4,515
Diesel 0.404397119022 164,972,240 66,714,299 33,357
Petroleum Coke 224,400,000 0 0
Total 147,633,050 73,817
Table C.140: Faribault Co. Greenhouse Gas Emissions from Commercial
Commercial Consumption (Trillion Btu)
Pounds of GHG per Trillion Btu
Pounds of GHG from Commercial
Tons of GHG from Commerical
Electricity 0.215554382244 535,018,000 115,325,474 57,663
Coal 0.002795776683 211,200,000 590,468 295
Coke and Breeze 224,400,000 0 0
Natural Gas 0.284889643977 116,600,000 33,218,132 16,609
LPG and NGL 0.009785218390 138,600,000 1,356,231 678
Kerosene 158,400,000 0 0
Distillate Fuel Oil 0.013978883414 160,600,000 2,245,009 1,123
Residual Fuel Oil 0.002516199015 173,800,000 437,315 219
Gasoline 0.012580995073 161,829,376 2,035,975 1,018
Diesel 164,972,240 0 0
Petroleum Coke 224,400,000 0 0
Total 155,208,605 77,604
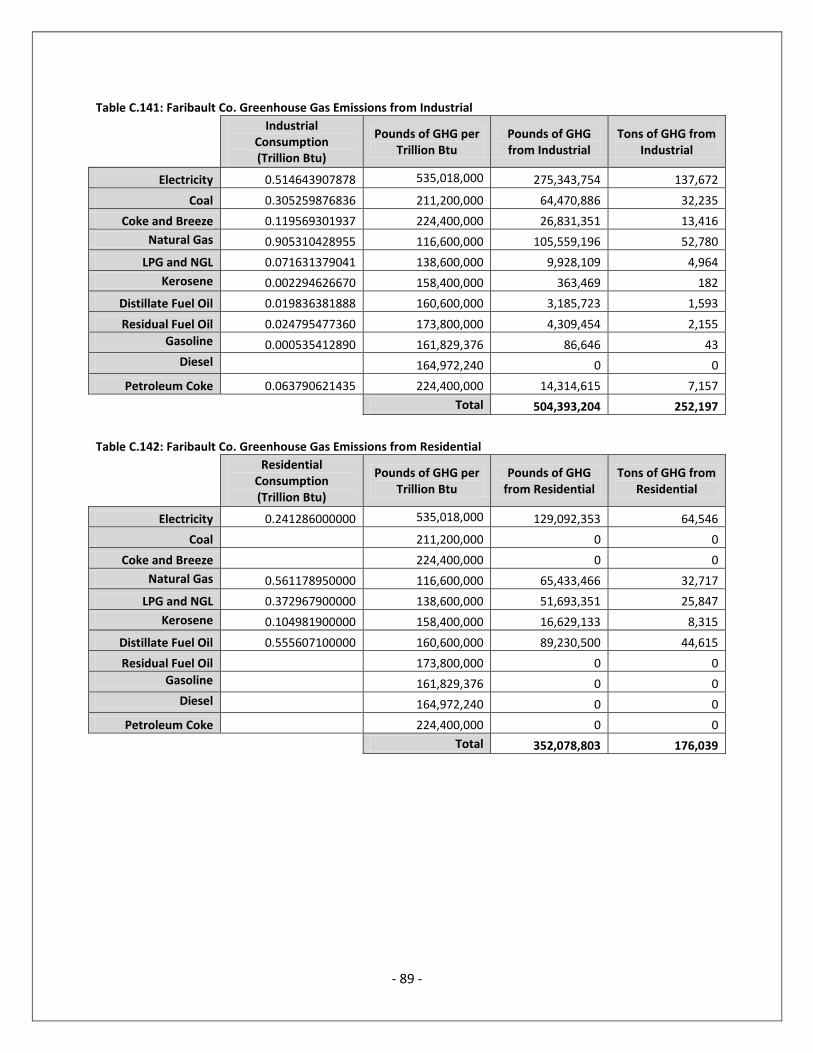
- 89 -
Table C.141: Faribault Co. Greenhouse Gas Emissions from Industrial
Industrial Consumption (Trillion Btu)
Pounds of GHG per Trillion Btu
Pounds of GHG from Industrial
Tons of GHG from Industrial
Electricity 0.514643907878 535,018,000 275,343,754 137,672
Coal 0.305259876836 211,200,000 64,470,886 32,235
Coke and Breeze 0.119569301937 224,400,000 26,831,351 13,416
Natural Gas 0.905310428955 116,600,000 105,559,196 52,780
LPG and NGL 0.071631379041 138,600,000 9,928,109 4,964
Kerosene 0.002294626670 158,400,000 363,469 182
Distillate Fuel Oil 0.019836381888 160,600,000 3,185,723 1,593
Residual Fuel Oil 0.024795477360 173,800,000 4,309,454 2,155
Gasoline 0.000535412890 161,829,376 86,646 43
Diesel 164,972,240 0 0
Petroleum Coke 0.063790621435 224,400,000 14,314,615 7,157
Total 504,393,204 252,197
Table C.142: Faribault Co. Greenhouse Gas Emissions from Residential
Residential Consumption (Trillion Btu)
Pounds of GHG per Trillion Btu
Pounds of GHG from Residential
Tons of GHG from Residential
Electricity 0.241286000000 535,018,000 129,092,353 64,546
Coal 211,200,000 0 0
Coke and Breeze 224,400,000 0 0
Natural Gas 0.561178950000 116,600,000 65,433,466 32,717
LPG and NGL 0.372967900000 138,600,000 51,693,351 25,847
Kerosene 0.104981900000 158,400,000 16,629,133 8,315
Distillate Fuel Oil 0.555607100000 160,600,000 89,230,500 44,615
Residual Fuel Oil 173,800,000 0 0
Gasoline 161,829,376 0 0
Diesel 164,972,240 0 0
Petroleum Coke 224,400,000 0 0
Total 352,078,803 176,039

- 90 -
Table C.143: Faribault Co. Greenhouse Gas Emissions from Transportation
Transportation Consumption (Trillion Btu)
Pounds of GHG per Trillion Btu
Pounds of GHG from
Transportation
Tons of GHG from Transportation
Electricity 535,018,000 0 0
Coal 211,200,000 0 0
Coke and Breeze 224,400,000 0 0
Natural Gas 116,600,000 0 0
LPG and NGL 138,600,000 0 0
Kerosene 158,400,000 0 0
Distillate Fuel Oil 160,600,000 0 0
Residual Fuel Oil 173,800,000 0 0
Gasoline 1.100515589686 161,829,376 178,095,751 89,048
Diesel 0.402532547702 164,972,240 66,406,696 33,203
Petroleum Coke 224,400,000 0 0
Total 244,502,447 122,251
Table C.144: Le Sueur Co. Greenhouse Gas Emissions from Agriculture
Agricultural Consumption (Trillion Btu)
Pounds of GHG per Trillion Btu
Pounds of GHG from Agricultural
Tons of GHG from Agricultural
Electricity 0.049547092239 535,018,000 26,508,586 13,254
Coal 211,200,000 0 0
Coke and Breeze 224,400,000 0 0
Natural Gas 116,600,000 0 0
LPG and NGL 0.110421168091 138,600,000 15,304,374 7,652
Kerosene 158,400,000 0 0
Distillate Fuel Oil 160,600,000 0 0
Residual Fuel Oil 173,800,000 0 0
Gasoline 0.029648644185 161,829,376 4,798,022 2,399
Diesel 0.212018506811 164,972,240 34,977,168 17,489
Petroleum Coke 224,400,000 0 0
Total 81,588,150 40,794

- 91 -
Table C.145: Le Sueur Co. Greenhouse Gas Emissions from Commercial
Commercial Consumption (Trillion Btu)
Pounds of GHG per Trillion Btu
Pounds of GHG from Commercial
Tons of GHG from Commerical
Electricity 0.408567701518 535,018,000 218,591,075 109,296
Coal 0.005299191978 211,200,000 1,119,189 560
Coke and Breeze 224,400,000 0 0
Natural Gas 0.539987662576 116,600,000 62,962,561 31,481
LPG and NGL 0.018547171924 138,600,000 2,570,638 1,285
Kerosene 158,400,000 0 0
Distillate Fuel Oil 0.026495959891 160,600,000 4,255,251 2,128
Residual Fuel Oil 0.004769272780 173,800,000 828,900 414
Gasoline 0.023846363902 161,829,376 3,859,042 1,930
Diesel 164,972,240 0 0
Petroleum Coke 224,400,000 0 0
Total 294,186,656 147,093
Table C.146: Le Sueur Co. Greenhouse Gas Emissions from Industrial
Industrial Consumption (Trillion Btu)
Pounds of GHG per Trillion Btu
Pounds of GHG from Industrial
Tons of GHG from Industrial
Electricity 1.245114790131 535,018,000 666,158,825 333,079
Coal 0.738537038257 211,200,000 155,979,022 77,990
Coke and Breeze 0.289282558307 224,400,000 64,915,006 32,458
Natural Gas 2.190282227178 116,600,000 255,386,908 127,693
LPG and NGL 0.173302915115 138,600,000 24,019,784 12,010
Kerosene 0.005551554310 158,400,000 879,366 440
Distillate Fuel Oil 0.047991576493 160,600,000 7,707,447 3,854
Residual Fuel Oil 0.059989470617 173,800,000 10,426,170 5,213
Gasoline 0.001295362672 161,829,376 209,628 105
Diesel 164,972,240 0 0
Petroleum Coke 0.154333209826 224,400,000 34,632,372 17,316
Total 1,220,314,528 610,157

- 92 -
Table C.147: Le Sueur Co. Greenhouse Gas Emissions from Residential
Residential Consumption (Trillion Btu)
Pounds of GHG per Trillion Btu
Pounds of GHG from Residential
Tons of GHG from Residential
Electricity 0.398228050000 535,018,000 213,059,175 106,530
Coal 211,200,000 0 0
Coke and Breeze 224,400,000 0 0
Natural Gas 0.852082950000 116,600,000 99,352,872 49,676
LPG and NGL 0.569226850000 138,600,000 78,894,841 39,447
Kerosene 0.187174000000 158,400,000 29,648,362 14,824
Distillate Fuel Oil 0.855861900000 160,600,000 137,451,421 68,726
Residual Fuel Oil 173,800,000 0 0
Gasoline 161,829,376 0 0
Diesel 164,972,240 0 0
Petroleum Coke 224,400,000 0 0
Total 558,406,671 279,203
Table C.148: Le Sueur Co. Greenhouse Gas Emissions from Transportation
Transportation Consumption (Trillion Btu)
Pounds of GHG per Trillion Btu
Pounds of GHG from
Transportation
Tons of GHG from Transportation
Electricity 535,018,000 0 0
Coal 211,200,000 0 0
Coke and Breeze 224,400,000 0 0
Natural Gas 116,600,000 0 0
LPG and NGL 138,600,000 0 0
Kerosene 158,400,000 0 0
Distillate Fuel Oil 160,600,000 0 0
Residual Fuel Oil 173,800,000 0 0
Gasoline 1.712729478880 161,829,376 277,169,942 138,585
Diesel 0.676460307508 164,972,240 111,597,172 55,799
Petroleum Coke 224,400,000 0 0
Total 388,767,114 194,384

- 93 -
Table C.149: Martin Co. Greenhouse Gas Emissions from Agriculture
Agricultural Consumption (Trillion Btu)
Pounds of GHG per Trillion Btu
Pounds of GHG from Agricultural
Tons of GHG from Agricultural
Electricity 0.176034478081 535,018,000 94,181,614 47,091
Coal 211,200,000 0 0
Coke and Breeze 224,400,000 0 0
Natural Gas 116,600,000 0 0
LPG and NGL 0.303449567481 138,600,000 42,058,110 21,029
Kerosene 158,400,000 0 0
Distillate Fuel Oil 160,600,000 0 0
Residual Fuel Oil 173,800,000 0 0
Gasoline 0.082926047295 161,829,376 13,419,870 6,710
Diesel 0.452106038569 164,972,240 74,584,946 37,292
Petroleum Coke 224,400,000 0 0
Total 224,244,541 112,122
Table C.150: Martin Co. Greenhouse Gas Emissions from Commercial
Commercial Consumption (Trillion Btu)
Pounds of GHG per Trillion Btu
Pounds of GHG from Commercial
Tons of GHG from Commerical
Electricity 0.300892572130 535,018,000 160,982,942 80,491
Coal 0.003902627395 211,200,000 824,235 412
Coke and Breeze 224,400,000 0 0
Natural Gas 0.397677731518 116,600,000 46,369,223 23,185
LPG and NGL 0.013659195881 138,600,000 1,893,165 947
Kerosene 158,400,000 0 0
Distillate Fuel Oil 0.019513136973 160,600,000 3,133,810 1,567
Residual Fuel Oil 0.003512364655 173,800,000 610,449 305
Gasoline 0.017561823276 161,829,376 2,842,019 1,421
Diesel 164,972,240 0 0
Petroleum Coke 224,400,000 0 0
Total 216,655,843 108,328

- 94 -
Table C.151: Martin Co. Greenhouse Gas Emissions from Industrial
Industrial Consumption (Trillion Btu)
Pounds of GHG per Trillion Btu
Pounds of GHG from Industrial
Tons of GHG from Industrial
Electricity 0.437783696168 535,018,000 234,222,158 117,111
Coal 0.259670415072 211,200,000 54,842,392 27,421
Coke and Breeze 0.101712057889 224,400,000 22,824,186 11,412
Natural Gas 0.770105581160 116,600,000 89,794,311 44,897
LPG and NGL 0.060933490901 138,600,000 8,445,382 4,223
Kerosene 0.001951932452 158,400,000 309,186 155
Distillate Fuel Oil 0.016873889788 160,600,000 2,709,947 1,355
Residual Fuel Oil 0.021092362235 173,800,000 3,665,853 1,833
Gasoline 0.000455450905 161,829,376 73,705 37
Diesel 164,972,240 0 0
Petroleum Coke 0.054263722168 224,400,000 12,176,779 6,088
Total 429,063,898 214,532
Table C.152: Martin Co. Greenhouse Gas Emissions from Residential
Residential Consumption (Trillion Btu)
Pounds of GHG per Trillion Btu
Pounds of GHG from Residential
Tons of GHG from Residential
Electricity 0.332342450000 535,018,000 177,809,193 88,905
Coal 211,200,000 0 0
Coke and Breeze 224,400,000 0 0
Natural Gas 0.757659950000 116,600,000 88,343,150 44,172
LPG and NGL 0.502250900000 138,600,000 69,611,975 34,806
Kerosene 0.144563000000 158,400,000 22,898,779 11,449
Distillate Fuel Oil 0.753025200000 160,600,000 120,935,847 60,468
Residual Fuel Oil 173,800,000 0 0
Gasoline 161,829,376 0 0
Diesel 164,972,240 0 0
Petroleum Coke 224,400,000 0 0
Total 479,598,944 239,799
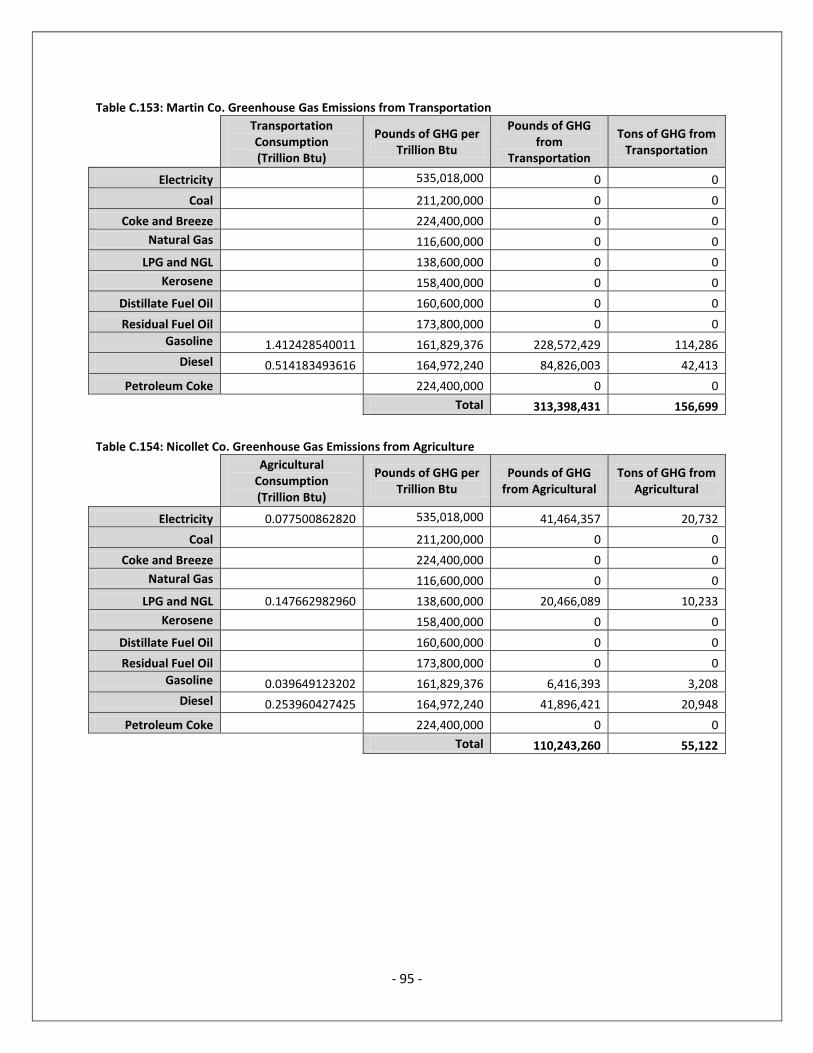
- 95 -
Table C.153: Martin Co. Greenhouse Gas Emissions from Transportation
Transportation Consumption (Trillion Btu)
Pounds of GHG per Trillion Btu
Pounds of GHG from
Transportation
Tons of GHG from Transportation
Electricity 535,018,000 0 0
Coal 211,200,000 0 0
Coke and Breeze 224,400,000 0 0
Natural Gas 116,600,000 0 0
LPG and NGL 138,600,000 0 0
Kerosene 158,400,000 0 0
Distillate Fuel Oil 160,600,000 0 0
Residual Fuel Oil 173,800,000 0 0
Gasoline 1.412428540011 161,829,376 228,572,429 114,286
Diesel 0.514183493616 164,972,240 84,826,003 42,413
Petroleum Coke 224,400,000 0 0
Total 313,398,431 156,699
Table C.154: Nicollet Co. Greenhouse Gas Emissions from Agriculture
Agricultural Consumption (Trillion Btu)
Pounds of GHG per Trillion Btu
Pounds of GHG from Agricultural
Tons of GHG from Agricultural
Electricity 0.077500862820 535,018,000 41,464,357 20,732
Coal 211,200,000 0 0
Coke and Breeze 224,400,000 0 0
Natural Gas 116,600,000 0 0
LPG and NGL 0.147662982960 138,600,000 20,466,089 10,233
Kerosene 158,400,000 0 0
Distillate Fuel Oil 160,600,000 0 0
Residual Fuel Oil 173,800,000 0 0
Gasoline 0.039649123202 161,829,376 6,416,393 3,208
Diesel 0.253960427425 164,972,240 41,896,421 20,948
Petroleum Coke 224,400,000 0 0
Total 110,243,260 55,122
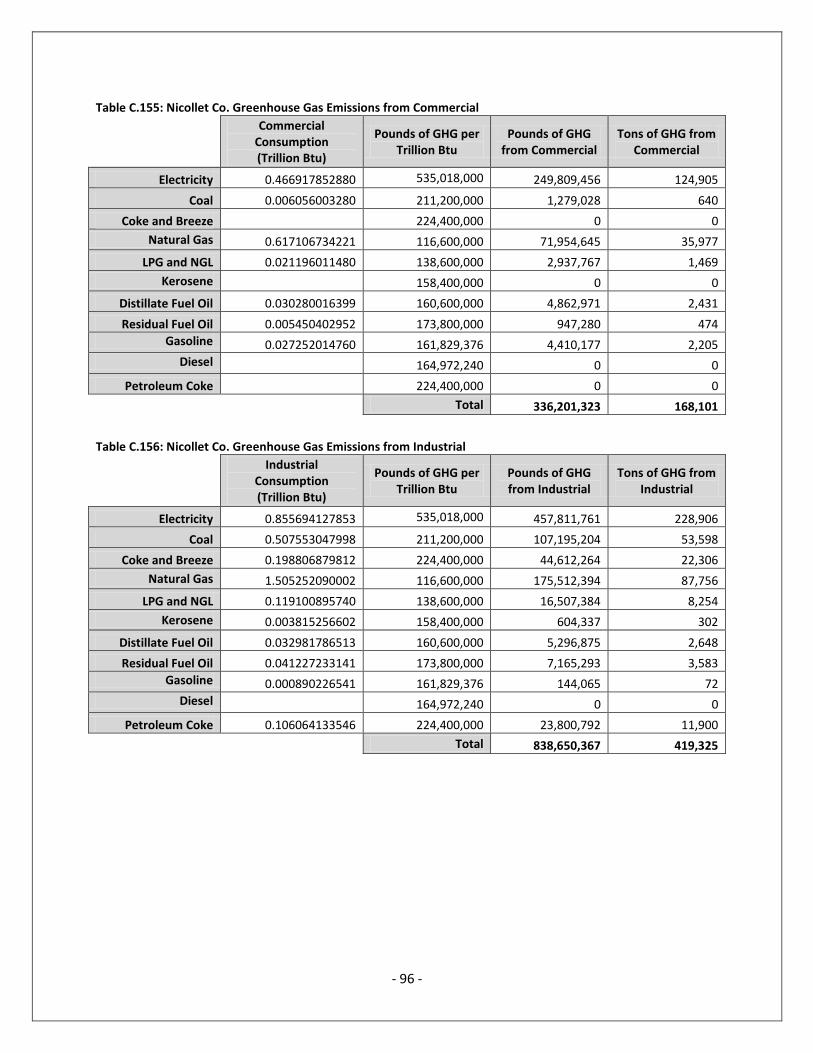
- 96 -
Table C.155: Nicollet Co. Greenhouse Gas Emissions from Commercial
Commercial Consumption (Trillion Btu)
Pounds of GHG per Trillion Btu
Pounds of GHG from Commercial
Tons of GHG from Commercial
Electricity 0.466917852880 535,018,000 249,809,456 124,905
Coal 0.006056003280 211,200,000 1,279,028 640
Coke and Breeze 224,400,000 0 0
Natural Gas 0.617106734221 116,600,000 71,954,645 35,977
LPG and NGL 0.021196011480 138,600,000 2,937,767 1,469
Kerosene 158,400,000 0 0
Distillate Fuel Oil 0.030280016399 160,600,000 4,862,971 2,431
Residual Fuel Oil 0.005450402952 173,800,000 947,280 474
Gasoline 0.027252014760 161,829,376 4,410,177 2,205
Diesel 164,972,240 0 0
Petroleum Coke 224,400,000 0 0
Total 336,201,323 168,101
Table C.156: Nicollet Co. Greenhouse Gas Emissions from Industrial
Industrial Consumption (Trillion Btu)
Pounds of GHG per Trillion Btu
Pounds of GHG from Industrial
Tons of GHG from Industrial
Electricity 0.855694127853 535,018,000 457,811,761 228,906
Coal 0.507553047998 211,200,000 107,195,204 53,598
Coke and Breeze 0.198806879812 224,400,000 44,612,264 22,306
Natural Gas 1.505252090002 116,600,000 175,512,394 87,756
LPG and NGL 0.119100895740 138,600,000 16,507,384 8,254
Kerosene 0.003815256602 158,400,000 604,337 302
Distillate Fuel Oil 0.032981786513 160,600,000 5,296,875 2,648
Residual Fuel Oil 0.041227233141 173,800,000 7,165,293 3,583
Gasoline 0.000890226541 161,829,376 144,065 72
Diesel 164,972,240 0 0
Petroleum Coke 0.106064133546 224,400,000 23,800,792 11,900
Total 838,650,367 419,325

- 97 -
Table C.157: Nicollet Co. Greenhouse Gas Emissions from Residential
Residential Consumption (Trillion Btu)
Pounds of GHG per Trillion Btu
Pounds of GHG from Residential
Tons of GHG from Residential
Electricity 0.434679100000 535,018,000 232,561,143 116,281
Coal 211,200,000 0 0
Coke and Breeze 224,400,000 0 0
Natural Gas 0.920090900000 116,600,000 107,282,599 53,641
LPG and NGL 0.616341200000 138,600,000 85,424,890 42,712
Kerosene 0.191332300000 158,400,000 30,307,036 15,154
Distillate Fuel Oil 0.920254100000 160,600,000 147,792,808 73,896
Residual Fuel Oil 173,800,000 0 0
Gasoline 161,829,376 0 0
Diesel 164,972,240 0 0
Petroleum Coke 224,400,000 0 0
Total 603,368,477 301,684
Table C.158: Nicollet Co. Greenhouse Gas Emissions from Transportation
Transportation Consumption (Trillion Btu)
Pounds of GHG per Trillion Btu
Pounds of GHG from
Transportation
Tons of GHG from Transportation
Electricity 535,018,000 0 0
Coal 211,200,000 0 0
Coke and Breeze 224,400,000 0 0
Natural Gas 116,600,000 0 0
LPG and NGL 138,600,000 0 0
Kerosene 158,400,000 0 0
Distillate Fuel Oil 160,600,000 0 0
Residual Fuel Oil 173,800,000 0 0
Gasoline 1.799749384741 161,829,376 291,252,319 145,626
Diesel 0.563388465207 164,972,240 92,943,457 46,472
Petroleum Coke 224,400,000 0 0
Total 384,195,776 192,098
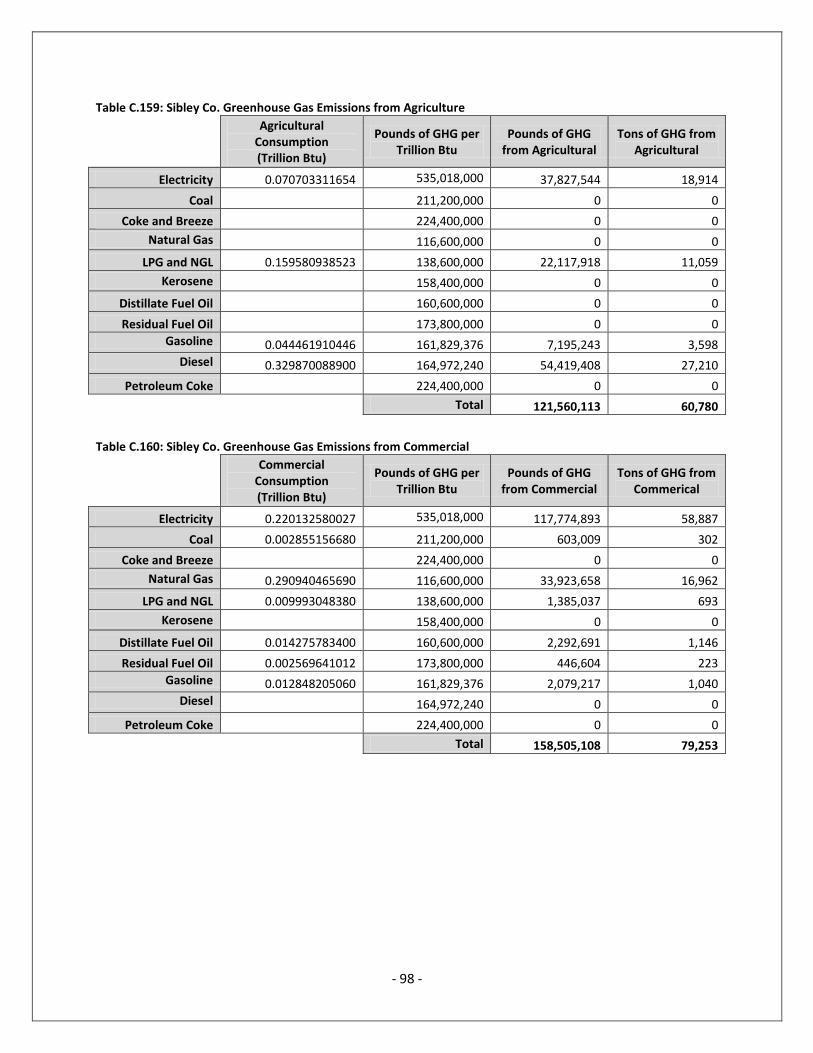
- 98 -
Table C.159: Sibley Co. Greenhouse Gas Emissions from Agriculture
Agricultural Consumption (Trillion Btu)
Pounds of GHG per Trillion Btu
Pounds of GHG from Agricultural
Tons of GHG from Agricultural
Electricity 0.070703311654 535,018,000 37,827,544 18,914
Coal 211,200,000 0 0
Coke and Breeze 224,400,000 0 0
Natural Gas 116,600,000 0 0
LPG and NGL 0.159580938523 138,600,000 22,117,918 11,059
Kerosene 158,400,000 0 0
Distillate Fuel Oil 160,600,000 0 0
Residual Fuel Oil 173,800,000 0 0
Gasoline 0.044461910446 161,829,376 7,195,243 3,598
Diesel 0.329870088900 164,972,240 54,419,408 27,210
Petroleum Coke 224,400,000 0 0
Total 121,560,113 60,780
Table C.160: Sibley Co. Greenhouse Gas Emissions from Commercial
Commercial Consumption (Trillion Btu)
Pounds of GHG per Trillion Btu
Pounds of GHG from Commercial
Tons of GHG from Commerical
Electricity 0.220132580027 535,018,000 117,774,893 58,887
Coal 0.002855156680 211,200,000 603,009 302
Coke and Breeze 224,400,000 0 0
Natural Gas 0.290940465690 116,600,000 33,923,658 16,962
LPG and NGL 0.009993048380 138,600,000 1,385,037 693
Kerosene 158,400,000 0 0
Distillate Fuel Oil 0.014275783400 160,600,000 2,292,691 1,146
Residual Fuel Oil 0.002569641012 173,800,000 446,604 223
Gasoline 0.012848205060 161,829,376 2,079,217 1,040
Diesel 164,972,240 0 0
Petroleum Coke 224,400,000 0 0
Total 158,505,108 79,253

- 99 -
Table C.161: Sibley Co. Greenhouse Gas Emissions from Industrial
Industrial Consumption (Trillion Btu)
Pounds of GHG per Trillion Btu
Pounds of GHG from Industrial
Tons of GHG from Industrial
Electricity 0.512280753907 535,018,000 274,079,424 137,040
Coal 0.303858177371 211,200,000 64,174,847 32,087
Coke and Breeze 0.119020260811 224,400,000 26,708,147 13,354
Natural Gas 0.901153403286 116,600,000 105,074,487 52,537
LPG and NGL 0.071302460394 138,600,000 9,882,521 4,941
Kerosene 0.002284090150 158,400,000 361,800 181
Distillate Fuel Oil 0.019745296724 160,600,000 3,171,095 1,586
Residual Fuel Oil 0.024681620906 173,800,000 4,289,666 2,145
Gasoline 0.000532954368 161,829,376 86,248 43
Diesel 164,972,240 0 0
Petroleum Coke 0.063497706163 224,400,000 14,248,885 7,124
Total 502,077,119 251,039
Table C.162: Sibley Co. Greenhouse Gas Emissions from Residential
Residential Consumption (Trillion Btu)
Pounds of GHG per Trillion Btu
Pounds of GHG from Residential
Tons of GHG from Residential
Electricity 0.209357300000 535,018,000 112,009,924 56,005
Coal 211,200,000 0 0
Coke and Breeze 224,400,000 0 0
Natural Gas 0.473386650000 116,600,000 55,196,883 27,598
LPG and NGL 0.316454450000 138,600,000 43,860,587 21,930
Kerosene 0.091612700000 158,400,000 14,511,452 7,256
Distillate Fuel Oil 0.469945500000 160,600,000 75,473,247 37,737
Residual Fuel Oil 173,800,000 0 0
Gasoline 161,829,376 0 0
Diesel 164,972,240 0 0
Petroleum Coke 224,400,000 0 0
Total 301,052,093 150,526

- 100 -
Table C.163: Sibley Co. Greenhouse Gas Emissions from Transportation
Transportation Consumption (Trillion Btu)
Pounds of GHG per Trillion Btu
Pounds of GHG from
Transportation
Tons of GHG from Transportation
Electricity 535,018,000 0 0
Coal 211,200,000 0 0
Coke and Breeze 224,400,000 0 0
Natural Gas 116,600,000 0 0
LPG and NGL 138,600,000 0 0
Kerosene 158,400,000 0 0
Distillate Fuel Oil 160,600,000 0 0
Residual Fuel Oil 173,800,000 0 0
Gasoline 0.953590463306 161,829,376 154,318,949 77,159
Diesel 0.351573783548 164,972,240 57,999,915 29,000
Petroleum Coke 224,400,000 0 0
Total 212,318,864 106,159
Table C.164: Waseca Co. Greenhouse Gas Emissions from Agriculture
Agricultural Consumption (Trillion Btu)
Pounds of GHG per Trillion Btu
Pounds of GHG from Agricultural
Tons of GHG from Agricultural
Electricity 0.075779878100 535,018,000 40,543,599 20,272
Coal 211,200,000 0 0
Coke and Breeze 224,400,000 0 0
Natural Gas 116,600,000 0 0
LPG and NGL 0.152776236281 138,600,000 21,174,786 10,587
Kerosene 158,400,000 0 0
Distillate Fuel Oil 160,600,000 0 0
Residual Fuel Oil 173,800,000 0 0
Gasoline 0.040336796248 161,829,376 6,527,679 3,264
Diesel 0.252662930926 164,972,240 41,682,370 20,841
Petroleum Coke 224,400,000 0 0
Total 109,928,433 54,964

- 101 -
Table C.165: Waseca Co. Greenhouse Gas Emissions from Commercial
Commercial Consumption (Trillion Btu)
Pounds of GHG per Trillion Btu
Pounds of GHG from Commercial
Tons of GHG from Commerical
Electricity 0.283673299576 535,018,000 151,770,321 75,885
Coal 0.003679290526 211,200,000 777,066 389
Coke and Breeze 224,400,000 0 0
Natural Gas 0.374919704628 116,600,000 43,715,638 21,858
LPG and NGL 0.012877516842 138,600,000 1,784,824 892
Kerosene 158,400,000 0 0
Distillate Fuel Oil 0.018396452631 160,600,000 2,954,470 1,477
Residual Fuel Oil 0.003311361474 173,800,000 575,515 288
Gasoline 0.016556807368 161,829,376 2,679,378 1,340
Diesel 164,972,240 0 0
Petroleum Coke 224,400,000 0 0
Total 204,257,212 102,129
Table C.166: Waseca Co. Greenhouse Gas Emissions from Industrial
Industrial Consumption (Trillion Btu)
Pounds of GHG per Trillion Btu
Pounds of GHG from Industrial
Tons of GHG from Industrial
Electricity 0.777493383194 535,018,000 415,972,955 207,986
Coal 0.461168452130 211,200,000 97,398,777 48,699
Coke and Breeze 0.180638184318 224,400,000 40,535,209 20,268
Natural Gas 1.367689109837 116,600,000 159,472,550 79,736
LPG and NGL 0.108216423785 138,600,000 14,998,796 7,499
Kerosene 0.003466585392 158,400,000 549,107 275
Distillate Fuel Oil 0.029967625048 160,600,000 4,812,801 2,406
Residual Fuel Oil 0.037459531310 173,800,000 6,510,467 3,255
Gasoline 0.000808869925 161,829,376 130,899 65
Diesel 164,972,240 0 0
Petroleum Coke 0.096371073894 224,400,000 21,625,669 10,813
Total 762,007,229 381,004
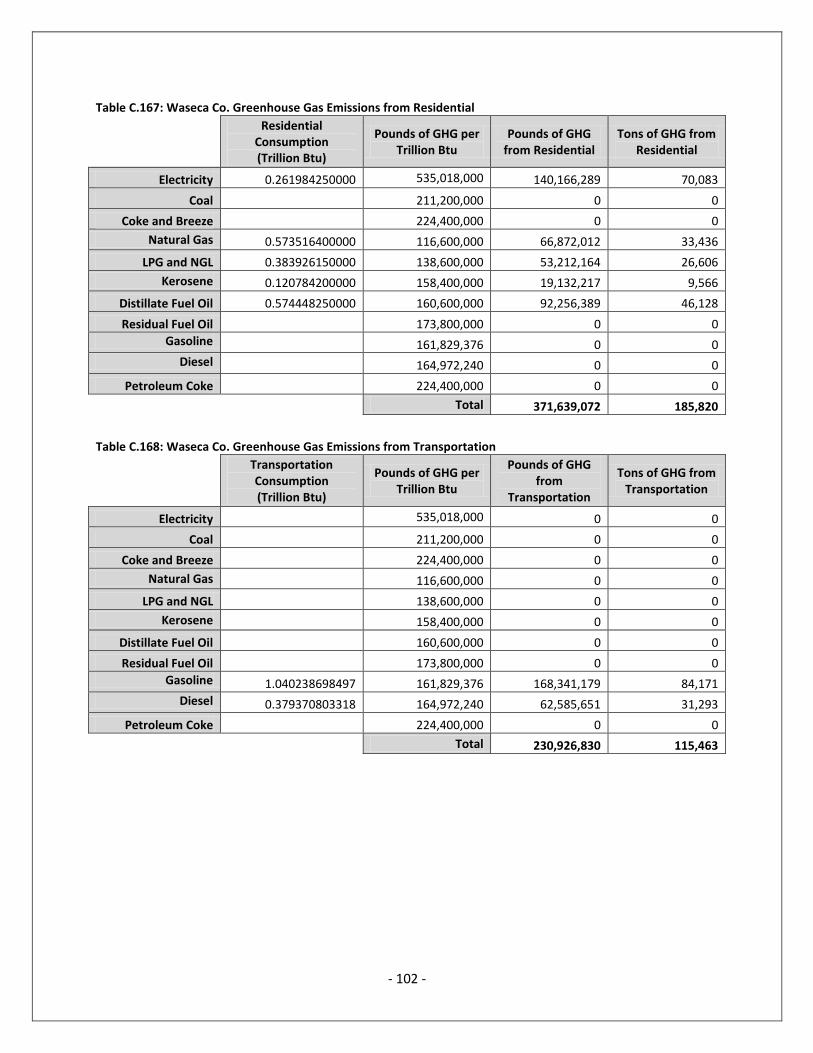
- 102 -
Table C.167: Waseca Co. Greenhouse Gas Emissions from Residential
Residential Consumption (Trillion Btu)
Pounds of GHG per Trillion Btu
Pounds of GHG from Residential
Tons of GHG from Residential
Electricity 0.261984250000 535,018,000 140,166,289 70,083
Coal 211,200,000 0 0
Coke and Breeze 224,400,000 0 0
Natural Gas 0.573516400000 116,600,000 66,872,012 33,436
LPG and NGL 0.383926150000 138,600,000 53,212,164 26,606
Kerosene 0.120784200000 158,400,000 19,132,217 9,566
Distillate Fuel Oil 0.574448250000 160,600,000 92,256,389 46,128
Residual Fuel Oil 173,800,000 0 0
Gasoline 161,829,376 0 0
Diesel 164,972,240 0 0
Petroleum Coke 224,400,000 0 0
Total 371,639,072 185,820
Table C.168: Waseca Co. Greenhouse Gas Emissions from Transportation
Transportation Consumption (Trillion Btu)
Pounds of GHG per Trillion Btu
Pounds of GHG from
Transportation
Tons of GHG from Transportation
Electricity 535,018,000 0 0
Coal 211,200,000 0 0
Coke and Breeze 224,400,000 0 0
Natural Gas 116,600,000 0 0
LPG and NGL 138,600,000 0 0
Kerosene 158,400,000 0 0
Distillate Fuel Oil 160,600,000 0 0
Residual Fuel Oil 173,800,000 0 0
Gasoline 1.040238698497 161,829,376 168,341,179 84,171
Diesel 0.379370803318 164,972,240 62,585,651 31,293
Petroleum Coke 224,400,000 0 0
Total 230,926,830 115,463

- 103 -
Table C.169: Watonwan Co. Greenhouse Gas Emissions from Agriculture
Agricultural Consumption (Trillion Btu)
Pounds of GHG per Trillion Btu
Pounds of GHG from Agricultural
Tons of GHG from Agricultural
Electricity 0.041724790889 535,018,000 22,323,514 11,162
Coal 211,200,000 0 0
Coke and Breeze 224,400,000 0 0
Natural Gas 116,600,000 0 0
LPG and NGL 0.128023598214 138,600,000 17,744,071 8,872
Kerosene 158,400,000 0 0
Distillate Fuel Oil 160,600,000 0 0
Residual Fuel Oil 173,800,000 0 0
Gasoline 0.023627401833 161,829,376 3,823,608 1,912
Diesel 0.142851950557 164,972,240 23,566,606 11,783
Petroleum Coke 224,400,000 0 0
Total 67,457,799 33,729
Table C.170: Watonwan Co. Greenhouse Gas Emissions from Commercial
Commercial Consumption (Trillion Btu)
Pounds of GHG per Trillion Btu
Pounds of GHG from Commercial
Tons of GHG from Commerical
Electricity 0.164552675731 535,018,000 88,038,643 44,019
Coal 0.002134275950 211,200,000 450,759 225
Coke and Breeze 224,400,000 0 0
Natural Gas 0.217482719286 116,600,000 25,358,485 12,679
LPG and NGL 0.007469965824 138,600,000 1,035,337 518
Kerosene 158,400,000 0 0
Distillate Fuel Oil 0.010671379749 160,600,000 1,713,824 857
Residual Fuel Oil 0.001920848355 173,800,000 333,843 167
Gasoline 0.009604241774 161,829,376 1,554,248 777
Diesel 164,972,240 0 0
Petroleum Coke 224,400,000 0 0
Total 118,485,140 59,243

- 104 -
Table C.171: Watonwan Co. Greenhouse Gas Emissions from Industrial
Industrial Consumption (Trillion Btu)
Pounds of GHG per Trillion Btu
Pounds of GHG from Industrial
Tons of GHG from Industrial
Electricity 0.294966508007 535,018,000 157,812,391 78,906
Coal 0.174958721023 211,200,000 36,951,282 18,476
Coke and Breeze 0.068530762567 224,400,000 15,378,303 7,689
Natural Gas 0.518875773721 116,600,000 60,500,915 30,250
LPG and NGL 0.041055295547 138,600,000 5,690,264 2,845
Kerosene 0.001315157929 158,400,000 208,321 104
Distillate Fuel Oil 0.011369158767 160,600,000 1,825,887 913
Residual Fuel Oil 0.014211448459 173,800,000 2,469,950 1,235
Gasoline 0.000306870183 161,829,376 49,661 25
Diesel 164,972,240 0 0
Petroleum Coke 0.036561390430 224,400,000 8,204,376 4,102
Total 289,091,350 144,546
Table C.172: Watonwan Co. Greenhouse Gas Emissions from Residential
Residential Consumption (Trillion Btu)
Pounds of GHG per Trillion Btu
Pounds of GHG from Residential
Tons of GHG from Residential
Electricity 0.170261250000 535,018,000 91,092,833 45,546
Coal 211,200,000 0 0
Coke and Breeze 224,400,000 0 0
Natural Gas 0.387518950000 116,600,000 45,184,710 22,592
LPG and NGL 0.257743400000 138,600,000 35,723,235 17,862
Kerosene 0.075779900000 158,400,000 12,003,536 6,002
Distillate Fuel Oil 0.385366400000 160,600,000 61,889,844 30,945
Residual Fuel Oil 173,800,000 0 0
Gasoline 161,829,376 0 0
Diesel 164,972,240 0 0
Petroleum Coke 224,400,000 0 0
Total 245,894,158 122,947

- 105 -
Table C.173: Watonwan Co. Greenhouse Gas Emissions from Transportation
Transportation Consumption (Trillion Btu)
Pounds of GHG per Trillion Btu
Pounds of GHG from
Transportation
Tons of GHG from Transportation
Electricity 535,018,000 0 0
Coal 211,200,000 0 0
Coke and Breeze 224,400,000 0 0
Natural Gas 116,600,000 0 0
LPG and NGL 138,600,000 0 0
Kerosene 158,400,000 0 0
Distillate Fuel Oil 160,600,000 0 0
Residual Fuel Oil 173,800,000 0 0
Gasoline 0.769697500901 161,829,376 124,559,666 62,280
Diesel 0.275622273762 164,972,240 45,470,024 22,735
Petroleum Coke 224,400,000 0 0
Total 170,029,690 85,015
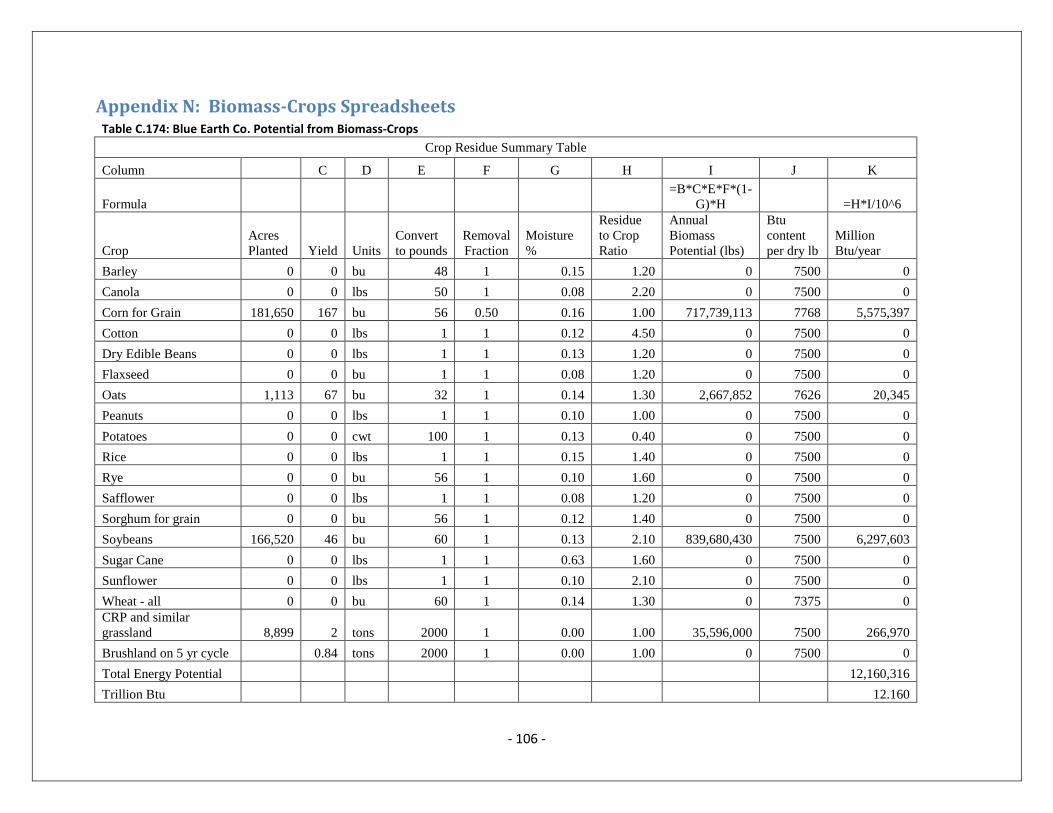
- 106 -
Appendix N: Biomass-Crops Spreadsheets
Table C.174: Blue Earth Co. Potential from Biomass-Crops
Crop Residue Summary Table
Column C D E F G H I J K
Formula
=B*C*E*F*(1-
G)*H =H*I/10^6
Crop
Acres
Planted Yield Units
Convert
to pounds
Removal
Fraction
Moisture
%
Residue
to Crop
Ratio
Annual
Biomass
Potential (lbs)
Btu
content
per dry lb
Million
Btu/year
Barley 0 0 bu 48 1 0.15 1.20 0 7500 0
Canola 0 0 lbs 50 1 0.08 2.20 0 7500 0
Corn for Grain 181,650 167 bu 56 0.50 0.16 1.00 717,739,113 7768 5,575,397
Cotton 0 0 lbs 1 1 0.12 4.50 0 7500 0
Dry Edible Beans 0 0 lbs 1 1 0.13 1.20 0 7500 0
Flaxseed 0 0 bu 1 1 0.08 1.20 0 7500 0
Oats 1,113 67 bu 32 1 0.14 1.30 2,667,852 7626 20,345
Peanuts 0 0 lbs 1 1 0.10 1.00 0 7500 0
Potatoes 0 0 cwt 100 1 0.13 0.40 0 7500 0
Rice 0 0 lbs 1 1 0.15 1.40 0 7500 0
Rye 0 0 bu 56 1 0.10 1.60 0 7500 0
Safflower 0 0 lbs 1 1 0.08 1.20 0 7500 0
Sorghum for grain 0 0 bu 56 1 0.12 1.40 0 7500 0
Soybeans 166,520 46 bu 60 1 0.13 2.10 839,680,430 7500 6,297,603
Sugar Cane 0 0 lbs 1 1 0.63 1.60 0 7500 0
Sunflower 0 0 lbs 1 1 0.10 2.10 0 7500 0
Wheat - all 0 0 bu 60 1 0.14 1.30 0 7375 0
CRP and similar
grassland 8,899 2 tons 2000 1 0.00 1.00 35,596,000 7500 266,970
Brushland on 5 yr cycle 0.84 tons 2000 1 0.00 1.00 0 7500 0
Total Energy Potential 12,160,316
Trillion Btu 12.160
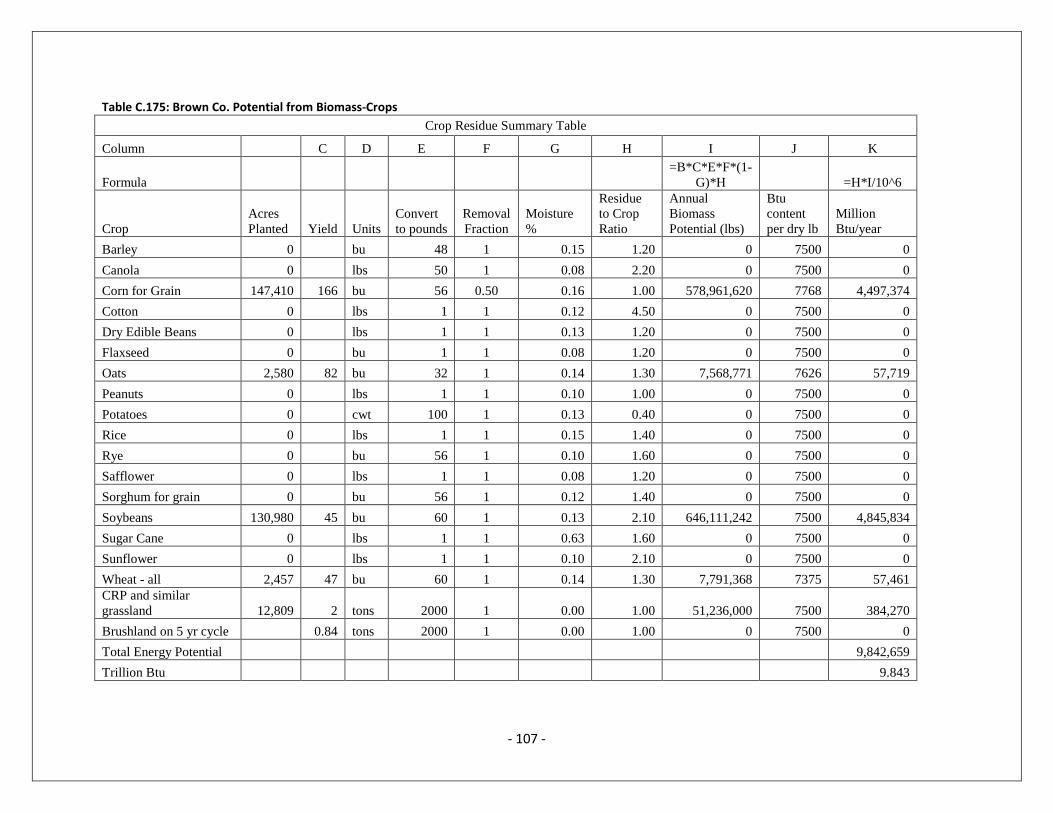
- 107 -
Table C.175: Brown Co. Potential from Biomass-Crops
Crop Residue Summary Table
Column C D E F G H I J K
Formula
=B*C*E*F*(1-
G)*H =H*I/10^6
Crop
Acres
Planted Yield Units
Convert
to pounds
Removal
Fraction
Moisture
%
Residue
to Crop
Ratio
Annual
Biomass
Potential (lbs)
Btu
content
per dry lb
Million
Btu/year
Barley 0 bu 48 1 0.15 1.20 0 7500 0
Canola 0 lbs 50 1 0.08 2.20 0 7500 0
Corn for Grain 147,410 166 bu 56 0.50 0.16 1.00 578,961,620 7768 4,497,374
Cotton 0 lbs 1 1 0.12 4.50 0 7500 0
Dry Edible Beans 0 lbs 1 1 0.13 1.20 0 7500 0
Flaxseed 0 bu 1 1 0.08 1.20 0 7500 0
Oats 2,580 82 bu 32 1 0.14 1.30 7,568,771 7626 57,719
Peanuts 0 lbs 1 1 0.10 1.00 0 7500 0
Potatoes 0 cwt 100 1 0.13 0.40 0 7500 0
Rice 0 lbs 1 1 0.15 1.40 0 7500 0
Rye 0 bu 56 1 0.10 1.60 0 7500 0
Safflower 0 lbs 1 1 0.08 1.20 0 7500 0
Sorghum for grain 0 bu 56 1 0.12 1.40 0 7500 0
Soybeans 130,980 45 bu 60 1 0.13 2.10 646,111,242 7500 4,845,834
Sugar Cane 0 lbs 1 1 0.63 1.60 0 7500 0
Sunflower 0 lbs 1 1 0.10 2.10 0 7500 0
Wheat - all 2,457 47 bu 60 1 0.14 1.30 7,791,368 7375 57,461
CRP and similar
grassland 12,809 2 tons 2000 1 0.00 1.00 51,236,000 7500 384,270
Brushland on 5 yr cycle 0.84 tons 2000 1 0.00 1.00 0 7500 0
Total Energy Potential 9,842,659
Trillion Btu 9.843

- 108 -
Table C.176: Faribault Co. Potential from Biomass-Crops
Crop Residue Summary Table
Column C D E F G H I J K
Formula
=B*C*E*F*(1-
G)*H =H*I/10^6
Crop
Acres
Planted Yield Units
Convert
to pounds
Removal
Fraction
Moisture
%
Residue
to Crop
Ratio
Annual
Biomass
Potential (lbs)
Btu
content
per dry lb
Million
Btu/year
Barley 0 0 bu 48 1 0.15 1.20 0 7500 0
Canola 0 0 lbs 50 1 0.08 2.20 0 7500 0
Corn for Grain 200,270 172 bu 56 0.50 0.16 1.00 815,002,770 7768 6,330,942
Cotton 0 0 lbs 1 1 0.12 4.50 0 7500 0
Dry Edible Beans 0 0 lbs 1 1 0.13 1.20 0 7500 0
Flaxseed 0 0 bu 1 1 0.08 1.20 0 7500 0
Oats 1,080 80 bu 32 1 0.14 1.30 3,091,046 7626 23,572
Peanuts 0 0 lbs 1 1 0.10 1.00 0 7500 0
Potatoes 0 0 cwt 100 1 0.13 0.40 0 7500 0
Rice 0 0 lbs 1 1 0.15 1.40 0 7500 0
Rye 0 0 bu 56 1 0.10 1.60 0 7500 0
Safflower 0 0 lbs 1 1 0.08 1.20 0 7500 0
Sorghum for grain 0 0 bu 56 1 0.12 1.40 0 7500 0
Soybeans 171,840 47 bu 60 1 0.13 2.10 885,343,738 7500 6,640,078
Sugar Cane 0 0 lbs 1 1 0.63 1.60 0 7500 0
Sunflower 0 0 lbs 1 1 0.10 2.10 0 7500 0
Wheat - all 700 57 bu 60 1 0.14 1.30 2,692,053 7375 19,854
CRP and similar
grassland 4,898 2 tons 2000 1 0.00 1.00 19,592,000 7500 146,940
Brushland on 5 yr cycle 0.84 tons 2000 1 0.00 1.00 0 7500 0
Total Energy Potential 13,161,386
Trillion Btu 13.161
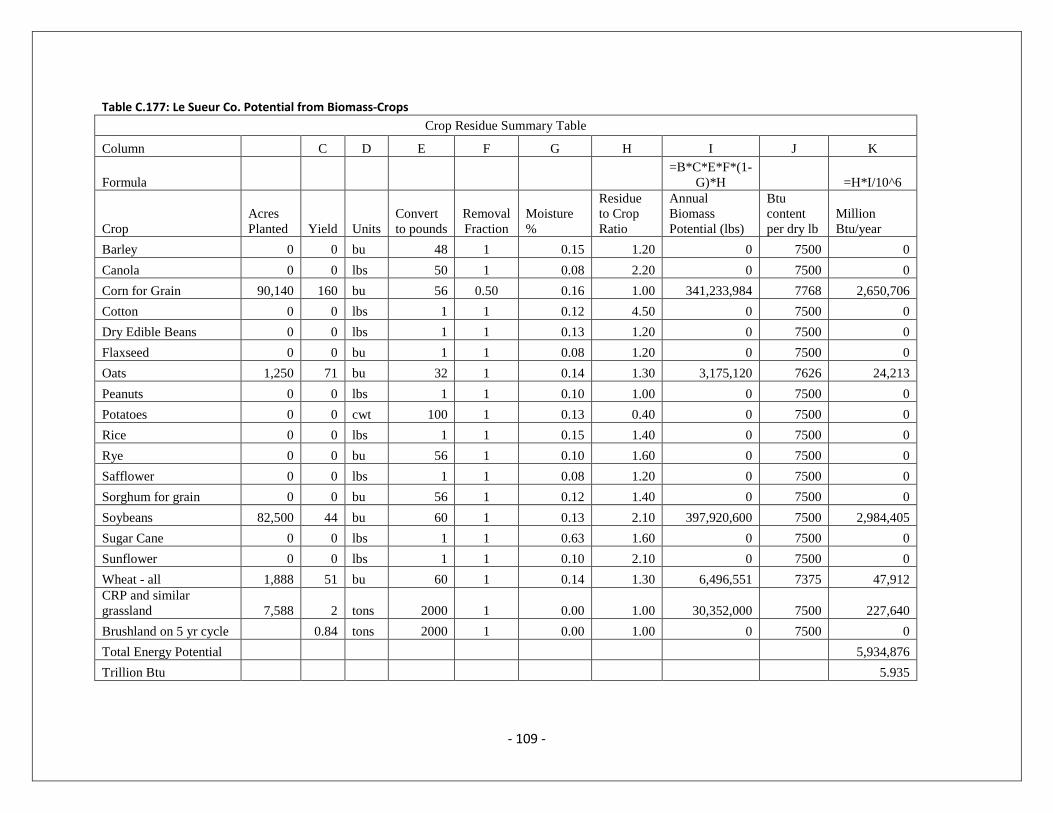
- 109 -
Table C.177: Le Sueur Co. Potential from Biomass-Crops
Crop Residue Summary Table
Column C D E F G H I J K
Formula
=B*C*E*F*(1-
G)*H =H*I/10^6
Crop
Acres
Planted Yield Units
Convert
to pounds
Removal
Fraction
Moisture
%
Residue
to Crop
Ratio
Annual
Biomass
Potential (lbs)
Btu
content
per dry lb
Million
Btu/year
Barley 0 0 bu 48 1 0.15 1.20 0 7500 0
Canola 0 0 lbs 50 1 0.08 2.20 0 7500 0
Corn for Grain 90,140 160 bu 56 0.50 0.16 1.00 341,233,984 7768 2,650,706
Cotton 0 0 lbs 1 1 0.12 4.50 0 7500 0
Dry Edible Beans 0 0 lbs 1 1 0.13 1.20 0 7500 0
Flaxseed 0 0 bu 1 1 0.08 1.20 0 7500 0
Oats 1,250 71 bu 32 1 0.14 1.30 3,175,120 7626 24,213
Peanuts 0 0 lbs 1 1 0.10 1.00 0 7500 0
Potatoes 0 0 cwt 100 1 0.13 0.40 0 7500 0
Rice 0 0 lbs 1 1 0.15 1.40 0 7500 0
Rye 0 0 bu 56 1 0.10 1.60 0 7500 0
Safflower 0 0 lbs 1 1 0.08 1.20 0 7500 0
Sorghum for grain 0 0 bu 56 1 0.12 1.40 0 7500 0
Soybeans 82,500 44 bu 60 1 0.13 2.10 397,920,600 7500 2,984,405
Sugar Cane 0 0 lbs 1 1 0.63 1.60 0 7500 0
Sunflower 0 0 lbs 1 1 0.10 2.10 0 7500 0
Wheat - all 1,888 51 bu 60 1 0.14 1.30 6,496,551 7375 47,912
CRP and similar
grassland 7,588 2 tons 2000 1 0.00 1.00 30,352,000 7500 227,640
Brushland on 5 yr cycle 0.84 tons 2000 1 0.00 1.00 0 7500 0
Total Energy Potential 5,934,876
Trillion Btu 5.935

- 110 -
Table C.178: Martin Co. Potential from Biomass-Crops
Crop Residue Summary Table
Column C D E F G H I J K
Formula
=B*C*E*F*(1-
G)*H =H*I/10^6
Crop
Acres
Planted Yield Units
Convert
to pounds
Removal
Fraction
Moisture
%
Residue
to Crop
Ratio
Annual
Biomass
Potential (lbs)
Btu
content
per dry lb
Million
Btu/year
Barley 0 0 bu 48 1 0.15 1.20 0 7500 0
Canola 0 0 lbs 50 1 0.08 2.20 0 7500 0
Corn for Grain 219,290 172 bu 56 0.50 0.16 1.00 892,405,041 7768 6,932,202
Cotton 0 0 lbs 1 1 0.12 4.50 0 7500 0
Dry Edible Beans 0 0 lbs 1 1 0.13 1.20 0 7500 0
Flaxseed 0 0 bu 1 1 0.08 1.20 0 7500 0
Oats 1,280 80 bu 32 1 0.14 1.30 3,663,462 7626 27,938
Peanuts 0 0 lbs 1 1 0.10 1.00 0 7500 0
Potatoes 0 0 cwt 100 1 0.13 0.40 0 7500 0
Rice 0 0 lbs 1 1 0.15 1.40 0 7500 0
Rye 0 0 bu 56 1 0.10 1.60 0 7500 0
Safflower 0 0 lbs 1 1 0.08 1.20 0 7500 0
Sorghum for grain 0 0 bu 56 1 0.12 1.40 0 7500 0
Soybeans 180,430 46 bu 60 1 0.13 2.10 909,821,884 7500 6,823,664
Sugar Cane 0 0 lbs 1 1 0.63 1.60 0 7500 0
Sunflower 0 0 lbs 1 1 0.10 2.10 0 7500 0
Wheat - all 0 0 bu 60 1 0.14 1.30 0 7375 0
CRP and similar
grassland 5,761 2 tons 2000 1 0.00 1.00 23,044,000 7500 172,830
Brushland on 5 yr cycle 0.84 tons 2000 1 0.00 1.00 0 7500 0
Total Energy Potential 13,956,634
Trillion Btu 13.957

- 111 -
Table C.179: Nicollet Co. Potential from Biomass-Crops
Crop Residue Summary Table
Column C D E F G H I J K
Formula
=B*C*E*F*(1-
G)*H =H*I/10^6
Crop
Acres
Planted Yield Units
Convert
to pounds
Removal
Fraction
Moisture
%
Residue
to Crop
Ratio
Annual
Biomass
Potential (lbs)
Btu
content
per dry lb
Million
Btu/year
Barley 0 0 bu 48 1 0.15 1.20 0 7500 0
Canola 0 0 lbs 50 1 0.08 2.20 0 7500 0
Corn for Grain 115,700 168 bu 56 0.50 0.16 1.00 459,893,616 7768 3,572,454
Cotton 0 0 lbs 1 1 0.12 4.50 0 7500 0
Dry Edible Beans 0 0 lbs 1 1 0.13 1.20 0 7500 0
Flaxseed 0 0 bu 1 1 0.08 1.20 0 7500 0
Oats 1,600 79 bu 32 1 0.14 1.30 4,522,086 7626 34,485
Peanuts 0 0 lbs 1 1 0.10 1.00 0 7500 0
Potatoes 0 0 cwt 100 1 0.13 0.40 0 7500 0
Rice 0 0 lbs 1 1 0.15 1.40 0 7500 0
Rye 0 0 bu 56 1 0.10 1.60 0 7500 0
Safflower 0 0 lbs 1 1 0.08 1.20 0 7500 0
Sorghum for grain 0 0 bu 56 1 0.12 1.40 0 7500 0
Soybeans 91,440 45 bu 60 1 0.13 2.10 451,064,376 7500 3,382,983
Sugar Cane 0 0 lbs 1 1 0.63 1.60 0 7500 0
Sunflower 0 0 lbs 1 1 0.10 2.10 0 7500 0
Wheat - all 1,380 50 bu 60 1 0.14 1.30 4,655,430 7375 34,334
CRP and similar
grassland 4,289 2 tons 2000 1 0.00 1.00 17,156,000 7500 128,670
Brushland on 5 yr cycle 0.84 tons 2000 1 0.00 1.00 0 7500 0
Total Energy Potential 7,152,926
Trillion Btu 7.153

- 112 -
Table C.180: Sibley Co. Potential from Biomass-Crops
Crop Residue Summary Table
Column C D E F G H I J K
Formula
=B*C*E*F*(1-
G)*H =H*I/10^6
Crop
Acres
Planted Yield Units
Convert
to pounds
Removal
Fraction
Moisture
%
Residue
to Crop
Ratio
Annual
Biomass
Potential (lbs)
Btu
content
per dry lb
Million
Btu/year
Barley 0 0 bu 48 1 0.15 1.20 0 7500 0
Canola 0 0 lbs 50 1 0.08 2.20 0 7500 0
Corn for Grain 137,630 169 bu 56 0.50 0.16 1.00 550,319,060 7768 4,274,878
Cotton 0 0 lbs 1 1 0.12 4.50 0 7500 0
Dry Edible Beans 0 0 lbs 1 1 0.13 1.20 0 7500 0
Flaxseed 0 0 bu 1 1 0.08 1.20 0 7500 0
Oats 1,575 75 bu 32 1 0.14 1.30 4,226,040 7626 32,228
Peanuts 0 0 lbs 1 1 0.10 1.00 0 7500 0
Potatoes 0 0 cwt 100 1 0.13 0.40 0 7500 0
Rice 0 0 lbs 1 1 0.15 1.40 0 7500 0
Rye 0 0 bu 56 1 0.10 1.60 0 7500 0
Safflower 0 0 lbs 1 1 0.08 1.20 0 7500 0
Sorghum for grain 0 0 bu 56 1 0.12 1.40 0 7500 0
Soybeans 115,690 45 bu 60 1 0.13 2.10 570,687,201 7500 4,280,154
Sugar Cane 0 0 lbs 1 1 0.63 1.60 0 7500 0
Sunflower 0 0 lbs 1 1 0.10 2.10 0 7500 0
Wheat - all 2,800 48 bu 60 1 0.14 1.30 9,067,968 7375 66,876
CRP and similar
grassland 3,402 2 tons 2000 1 0.00 1.00 13,608,000 7500 102,060
Brushland on 5 yr cycle 0.84 tons 2000 1 0.00 1.00 0 7500 0
Total Energy Potential 8,756,197
Trillion Btu 8.756

- 113 -
Table C.181: Waseca Co. Potential from Biomass-Crops
Crop Residue Summary Table
Column C D E F G H I J K
Formula
=B*C*E*F*(1-
G)*H =H*I/10^6
Crop
Acres
Planted Yield Units
Convert
to pounds
Removal
Fraction
Moisture
%
Residue
to Crop
Ratio
Annual
Biomass
Potential (lbs)
Btu
content
per dry lb
Million
Btu/year
Barley 0 0 bu 48 1 0.15 1.20 0 7500 0
Canola 0 0 lbs 50 1 0.08 2.20 0 7500 0
Corn for Grain 117,160 169 bu 56 0.50 0.16 1.00 468,468,946 7768 3,639,067
Cotton 0 0 lbs 1 1 0.12 4.50 0 7500 0
Dry Edible Beans 0 0 lbs 1 1 0.13 1.20 0 7500 0
Flaxseed 0 0 bu 1 1 0.08 1.20 0 7500 0
Oats 975 76 bu 32 1 0.14 1.30 2,651,002 7626 20,217
Peanuts 0 0 lbs 1 1 0.10 1.00 0 7500 0
Potatoes 0 0 cwt 100 1 0.13 0.40 0 7500 0
Rice 0 0 lbs 1 1 0.15 1.40 0 7500 0
Rye 0 0 bu 56 1 0.10 1.60 0 7500 0
Safflower 0 0 lbs 1 1 0.08 1.20 0 7500 0
Sorghum for grain 0 0 bu 56 1 0.12 1.40 0 7500 0
Soybeans 96,080 47 bu 60 1 0.13 2.10 495,017,611 7500 3,712,632
Sugar Cane 0 0 lbs 1 1 0.63 1.60 0 7500 0
Sunflower 0 0 lbs 1 1 0.10 2.10 0 7500 0
Wheat - all 800 58 bu 60 1 0.14 1.30 3,130,608 7375 23,088
CRP and similar
grassland 5,540 2 tons 2000 1 0.00 1.00 22,160,000 7500 166,200
Brushland on 5 yr cycle 0.84 tons 2000 1 0.00 1.00 0 7500 0
Total Energy Potential 7,561,204
Trillion Btu 7.561
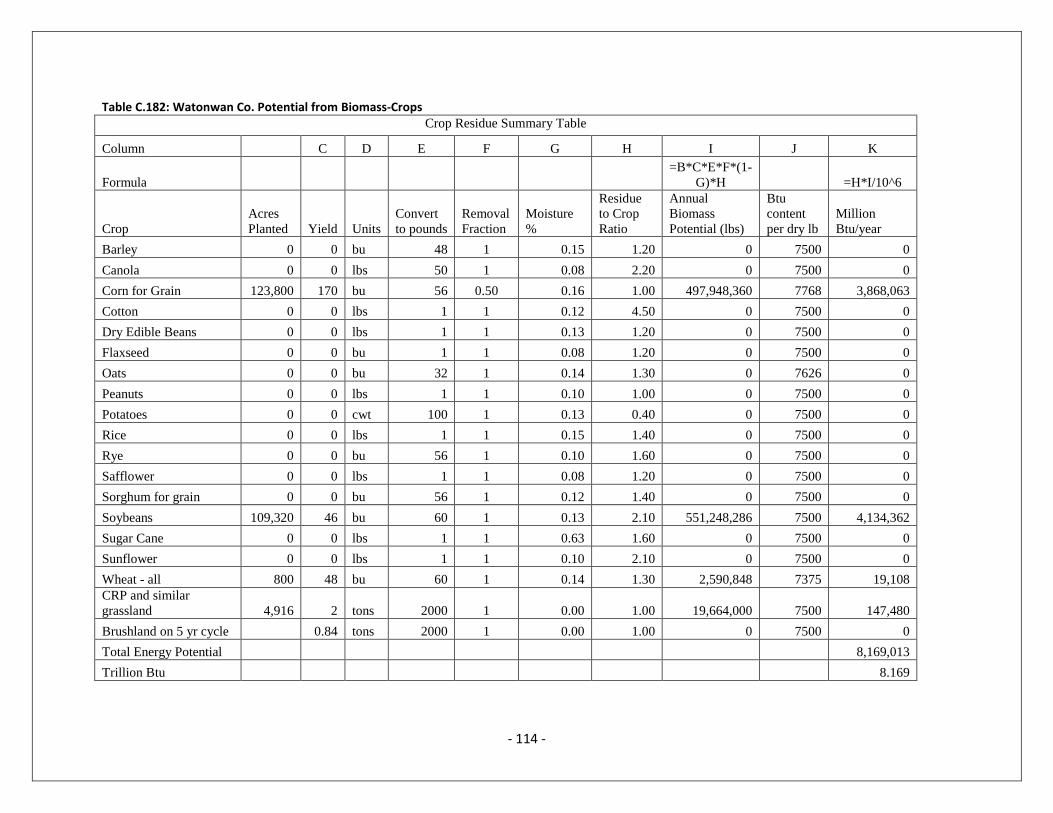
- 114 -
Table C.182: Watonwan Co. Potential from Biomass-Crops Crop Residue Summary Table
Column C D E F G H I J K
Formula
=B*C*E*F*(1-
G)*H =H*I/10^6
Crop
Acres
Planted Yield Units
Convert
to pounds
Removal
Fraction
Moisture
%
Residue
to Crop
Ratio
Annual
Biomass
Potential (lbs)
Btu
content
per dry lb
Million
Btu/year
Barley 0 0 bu 48 1 0.15 1.20 0 7500 0
Canola 0 0 lbs 50 1 0.08 2.20 0 7500 0
Corn for Grain 123,800 170 bu 56 0.50 0.16 1.00 497,948,360 7768 3,868,063
Cotton 0 0 lbs 1 1 0.12 4.50 0 7500 0
Dry Edible Beans 0 0 lbs 1 1 0.13 1.20 0 7500 0
Flaxseed 0 0 bu 1 1 0.08 1.20 0 7500 0
Oats 0 0 bu 32 1 0.14 1.30 0 7626 0
Peanuts 0 0 lbs 1 1 0.10 1.00 0 7500 0
Potatoes 0 0 cwt 100 1 0.13 0.40 0 7500 0
Rice 0 0 lbs 1 1 0.15 1.40 0 7500 0
Rye 0 0 bu 56 1 0.10 1.60 0 7500 0
Safflower 0 0 lbs 1 1 0.08 1.20 0 7500 0
Sorghum for grain 0 0 bu 56 1 0.12 1.40 0 7500 0
Soybeans 109,320 46 bu 60 1 0.13 2.10 551,248,286 7500 4,134,362
Sugar Cane 0 0 lbs 1 1 0.63 1.60 0 7500 0
Sunflower 0 0 lbs 1 1 0.10 2.10 0 7500 0
Wheat - all 800 48 bu 60 1 0.14 1.30 2,590,848 7375 19,108
CRP and similar
grassland 4,916 2 tons 2000 1 0.00 1.00 19,664,000 7500 147,480
Brushland on 5 yr cycle 0.84 tons 2000 1 0.00 1.00 0 7500 0
Total Energy Potential 8,169,013
Trillion Btu 8.169
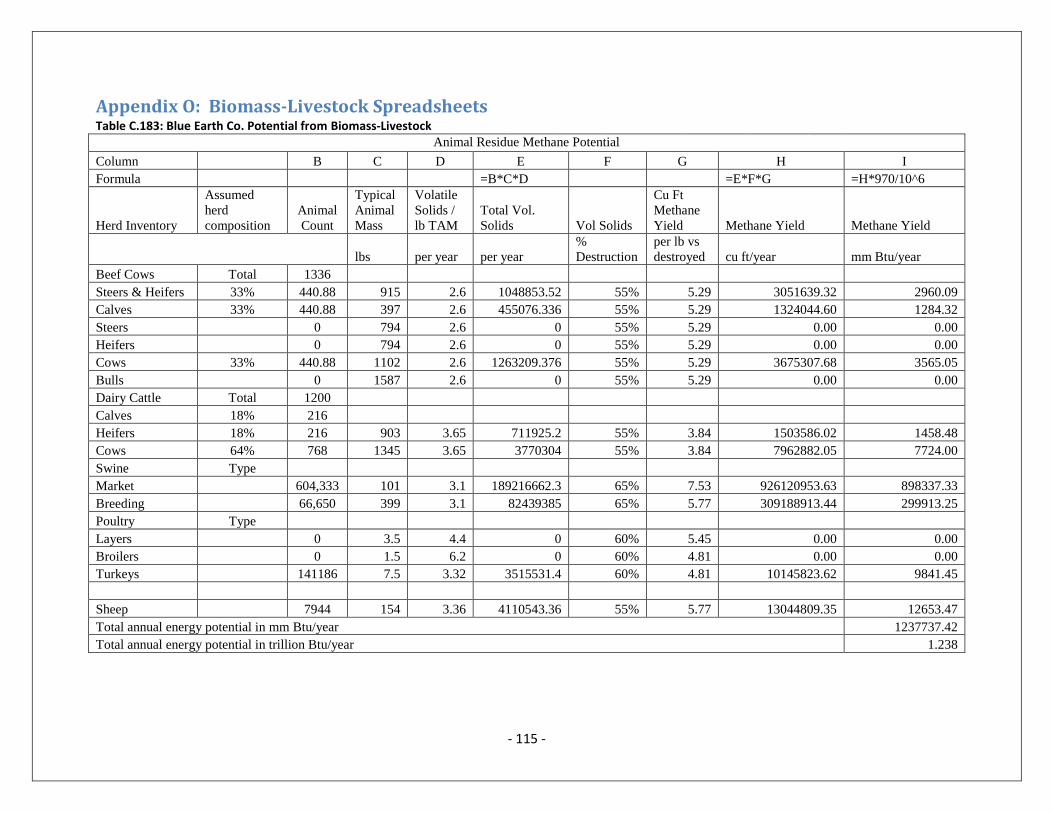
- 115 -
Appendix O: Biomass-Livestock Spreadsheets Table C.183: Blue Earth Co. Potential from Biomass-Livestock
Animal Residue Methane Potential
Column B C D E F G H I
Formula =B*C*D =E*F*G =H*970/10^6
Herd Inventory
Assumed
herd
composition
Animal
Count
Typical
Animal
Mass
Volatile
Solids /
lb TAM
Total Vol.
Solids Vol Solids
Cu Ft
Methane
Yield Methane Yield Methane Yield
lbs per year per year
%
Destruction
per lb vs
destroyed cu ft/year mm Btu/year
Beef Cows Total 1336
Steers & Heifers 33% 440.88 915 2.6 1048853.52 55% 5.29 3051639.32 2960.09
Calves 33% 440.88 397 2.6 455076.336 55% 5.29 1324044.60 1284.32
Steers 0 794 2.6 0 55% 5.29 0.00 0.00
Heifers 0 794 2.6 0 55% 5.29 0.00 0.00
Cows 33% 440.88 1102 2.6 1263209.376 55% 5.29 3675307.68 3565.05
Bulls 0 1587 2.6 0 55% 5.29 0.00 0.00
Dairy Cattle Total 1200
Calves 18% 216
Heifers 18% 216 903 3.65 711925.2 55% 3.84 1503586.02 1458.48
Cows 64% 768 1345 3.65 3770304 55% 3.84 7962882.05 7724.00
Swine Type
Market 604,333 101 3.1 189216662.3 65% 7.53 926120953.63 898337.33
Breeding 66,650 399 3.1 82439385 65% 5.77 309188913.44 299913.25
Poultry Type
Layers 0 3.5 4.4 0 60% 5.45 0.00 0.00
Broilers 0 1.5 6.2 0 60% 4.81 0.00 0.00
Turkeys 141186 7.5 3.32 3515531.4 60% 4.81 10145823.62 9841.45
Sheep 7944 154 3.36 4110543.36 55% 5.77 13044809.35 12653.47
Total annual energy potential in mm Btu/year 1237737.42
Total annual energy potential in trillion Btu/year 1.238
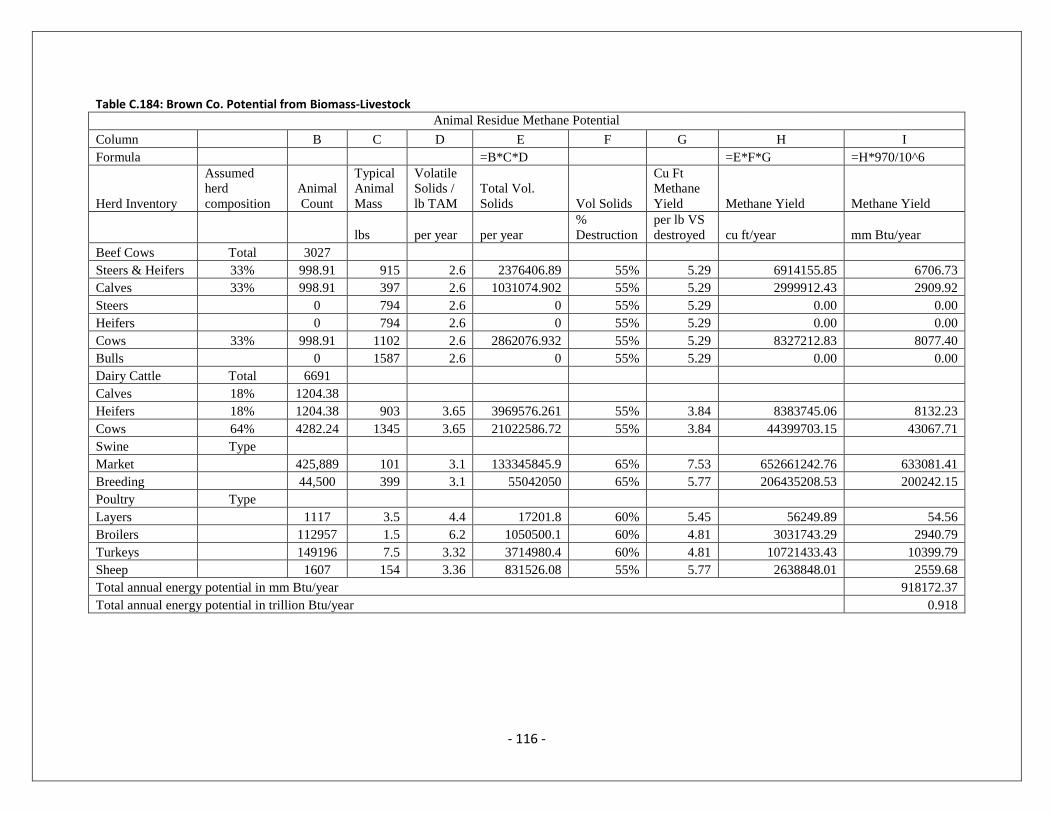
- 116 -
Table C.184: Brown Co. Potential from Biomass-Livestock Animal Residue Methane Potential
Column B C D E F G H I
Formula =B*C*D =E*F*G =H*970/10^6
Herd Inventory
Assumed
herd
composition
Animal
Count
Typical
Animal
Mass
Volatile
Solids /
lb TAM
Total Vol.
Solids Vol Solids
Cu Ft
Methane
Yield Methane Yield Methane Yield
lbs per year per year
%
Destruction
per lb VS
destroyed cu ft/year mm Btu/year
Beef Cows Total 3027
Steers & Heifers 33% 998.91 915 2.6 2376406.89 55% 5.29 6914155.85 6706.73
Calves 33% 998.91 397 2.6 1031074.902 55% 5.29 2999912.43 2909.92
Steers 0 794 2.6 0 55% 5.29 0.00 0.00
Heifers 0 794 2.6 0 55% 5.29 0.00 0.00
Cows 33% 998.91 1102 2.6 2862076.932 55% 5.29 8327212.83 8077.40
Bulls 0 1587 2.6 0 55% 5.29 0.00 0.00
Dairy Cattle Total 6691
Calves 18% 1204.38
Heifers 18% 1204.38 903 3.65 3969576.261 55% 3.84 8383745.06 8132.23
Cows 64% 4282.24 1345 3.65 21022586.72 55% 3.84 44399703.15 43067.71
Swine Type
Market 425,889 101 3.1 133345845.9 65% 7.53 652661242.76 633081.41
Breeding 44,500 399 3.1 55042050 65% 5.77 206435208.53 200242.15
Poultry Type
Layers 1117 3.5 4.4 17201.8 60% 5.45 56249.89 54.56
Broilers 112957 1.5 6.2 1050500.1 60% 4.81 3031743.29 2940.79
Turkeys 149196 7.5 3.32 3714980.4 60% 4.81 10721433.43 10399.79
Sheep 1607 154 3.36 831526.08 55% 5.77 2638848.01 2559.68
Total annual energy potential in mm Btu/year 918172.37
Total annual energy potential in trillion Btu/year 0.918
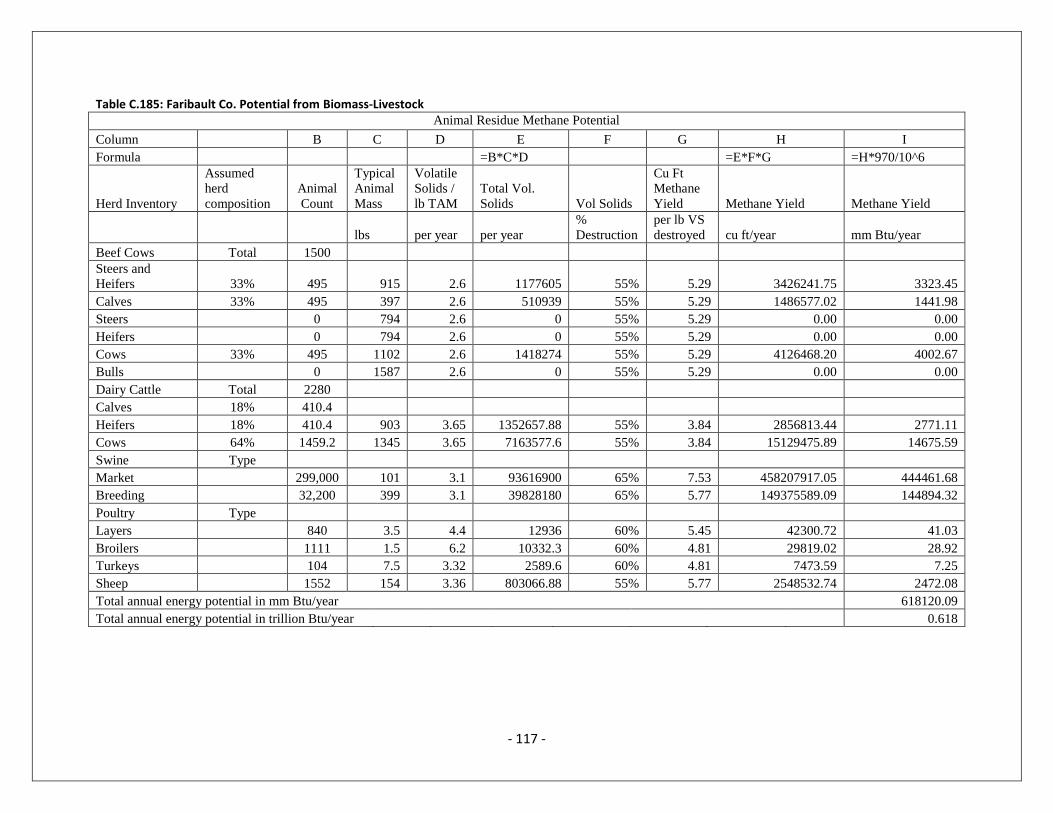
- 117 -
Table C.185: Faribault Co. Potential from Biomass-Livestock
Animal Residue Methane Potential
Column B C D E F G H I
Formula =B*C*D =E*F*G =H*970/10^6
Herd Inventory
Assumed
herd
composition
Animal
Count
Typical
Animal
Mass
Volatile
Solids /
lb TAM
Total Vol.
Solids Vol Solids
Cu Ft
Methane
Yield Methane Yield Methane Yield
lbs per year per year
%
Destruction
per lb VS
destroyed cu ft/year mm Btu/year
Beef Cows Total 1500
Steers and
Heifers 33% 495 915 2.6 1177605 55% 5.29 3426241.75 3323.45
Calves 33% 495 397 2.6 510939 55% 5.29 1486577.02 1441.98
Steers 0 794 2.6 0 55% 5.29 0.00 0.00
Heifers 0 794 2.6 0 55% 5.29 0.00 0.00
Cows 33% 495 1102 2.6 1418274 55% 5.29 4126468.20 4002.67
Bulls 0 1587 2.6 0 55% 5.29 0.00 0.00
Dairy Cattle Total 2280
Calves 18% 410.4
Heifers 18% 410.4 903 3.65 1352657.88 55% 3.84 2856813.44 2771.11
Cows 64% 1459.2 1345 3.65 7163577.6 55% 3.84 15129475.89 14675.59
Swine Type
Market 299,000 101 3.1 93616900 65% 7.53 458207917.05 444461.68
Breeding 32,200 399 3.1 39828180 65% 5.77 149375589.09 144894.32
Poultry Type
Layers 840 3.5 4.4 12936 60% 5.45 42300.72 41.03
Broilers 1111 1.5 6.2 10332.3 60% 4.81 29819.02 28.92
Turkeys 104 7.5 3.32 2589.6 60% 4.81 7473.59 7.25
Sheep 1552 154 3.36 803066.88 55% 5.77 2548532.74 2472.08
Total annual energy potential in mm Btu/year 618120.09
Total annual energy potential in trillion Btu/year 0.618

- 118 -
Table C.186: Le Sueur Co. Potential from Biomass- Livestock
Animal Residue Methane Potential
Column B C D E F G H I
Formula =B*C*D =E*F*G =H*970/10^6
Herd Inventory
Assumed herd
composition
Animal
Count
Typical
Animal
Mass
Volatile
Solids /
lb TAM
Total Vol.
Solids Vol Solids
Cu Ft
Methane
Yield Methane Yield Methane Yield
lbs per year per year
%
Destruction
per lb VS
destroyed cu ft/year mm Btu/year
Beef Cows Total 2146
Steers & Heifers 33% 708.18 915 2.6 1684760.22 55% 5.29 4901809.86 4754.76
Calves 33% 708.18 397 2.6 730983.396 55% 5.29 2126796.19 2062.99
Steers 0 794 2.6 0 55% 5.29 0.00 0.00
Heifers 0 794 2.6 0 55% 5.29 0.00 0.00
Cows 33% 708.18 1102 2.6 2029077.336 55% 5.29 5903600.51 5726.49
Bulls 0 1587 2.6 0 55% 5.29 0.00 0.00
Dairy Cattle Total 3746
Calves 18% 674.28
Heifers 18% 674.28 903 3.65 2222393.166 55% 3.84 4693694.37 4552.88
Cows 64% 2397.44 1345 3.65 11769632.32 55% 3.84 24857463.46 24111.74
Swine Type
Market 193,000 101 3.1 60428300 65% 7.53 295766314.35 286893.32
Breeding 20,611 399 3.1 25493745.9 65% 5.77 95614294.00 92745.87
Poultry Type
Layers 1604 3.5 4.4 24701.6 60% 5.45 80774.23 78.35
Broilers 728 1.5 6.2 6770.4 60% 4.81 19539.37 18.95
Turkeys 87739 7.5 3.32 2184701.1 60% 4.81 6305047.37 6115.90
Sheep 2884 154 3.36 1492296.96 55% 5.77 4735804.40 4593.73
Total annual energy potential in mm Btu/year 431654.98
Total annual energy potential in trillion Btu/year 0.432

- 119 -
Table C.187: Martin Co. Potential from Biomass-Livestock
Animal Residue Methane Potential
Column B C D E F G H I
Formula =B*C*D =E*F*G =H*970/10^6
Herd Inventory
Assumed herd
composition
Animal
Count
Typical
Animal
Mass
Volatile
Solids /
lb TAM
Total Vol.
Solids Vol Solids
Cu Ft
Methane
Yield Methane Yield Methane Yield
lbs per year per year
%
Destruction
per lb VS
destroyed cu ft/year mm Btu/year
Beef Cows Total 1646
Steers & Heifers 33% 543.18 915 2.6 1292225.22 55% 5.29 3759729.28 3646.94
Calves 33% 543.18 397 2.6 560670.396 55% 5.29 1631270.52 1582.33
Steers 0 794 2.6 0 55% 5.29 0.00 0.00
Heifers 0 794 2.6 0 55% 5.29 0.00 0.00
Cows 33% 543.18 1102 2.6 1556319.336 55% 5.29 4528111.11 4392.27
Bulls 0 1587 2.6 0 55% 5.29 0.00 0.00
Dairy Cattle Total 1160
Calves 18% 208.8
Heifers 18% 208.8 903 3.65 688194.36 55% 3.84 1453466.49 1409.86
Cows 64% 742.4 1345 3.65 3644627.2 55% 3.84 7697452.65 7466.53
Swine Type
Market ###### 101 3.1 372867345.9 65% 7.53 1824999224.51 1770249.25
Breeding 127,600 399 3.1 157828440 65% 5.77 591935564.22 574177.50
Poultry Type
Layers 662 3.5 4.4 10194.8 60% 5.45 33337.00 32.34
Broilers 338 1.5 6.2 3143.4 60% 4.81 9071.85 8.80
Turkeys 39008 7.5 3.32 971299.2 60% 4.81 2803169.49 2719.07
Sheep 3058 154 3.36 1582331.52 55% 5.77 5021529.08 4870.88
Total annual energy potential in mm Btu/year 2370555.77
Total annual energy potential in trillion Btu/year 2.371

- 120 -
Table C.188: Nicollet Co. Potential from Biomass-Livestock
Animal Residue Methane Potential
Column B C D E F G H I
Formula =B*C*D =E*F*G =H*970/10^6
Herd Inventory
Assumed
herd
composition
Animal
Count
Typical
Animal
Mass
Volatile
Solids /
lb TAM
Total Vol.
Solids Vol Solids
Cu Ft
Methane
Yield Methane Yield Methane Yield
lbs per year per year
%
Destruction
per lb VS
destroyed cu ft/year mm Btu/year
Beef Cows Total 844
Steers & Heifers 33% 278.52 915 2.6 662599.08 55% 5.29 1927832.02 1870.00
Calves 33% 278.52 397 2.6 287488.344 55% 5.29 836447.34 811.35
Steers 0 794 2.6 0 55% 5.29 0.00 0.00
Heifers 0 794 2.6 0 55% 5.29 0.00 0.00
Cows 33% 278.52 1102 2.6 798015.504 55% 5.29 2321826.11 2252.17
Bulls 0 1587 2.6 0 55% 5.29 0.00 0.00
Dairy Cattle Total 6111
Calves 18% 1099.98
Heifers 18% 1099.98 903 3.65 3625479.081 55% 3.84 7657011.82 7427.30
Cows 64% 3911.04 1345 3.65 19200273.12 55% 3.84 40550976.83 39334.45
Swine Type
Market 371,667 101 3.1 116368937.7 65% 7.53 569567765.57 552480.73
Breeding 40,650 399 3.1 50279985 65% 5.77 188575083.74 182917.83
Poultry Type
Layers 0 3.5 4.4 0 60% 5.45 0.00 0.00
Broilers 0 1.5 6.2 0 60% 4.81 0.00 0.00
Turkeys 12 7.5 3.32 298.8 60% 4.81 862.34 0.84
Sheep 1859 154 3.36 961920.96 55% 5.77 3052656.17 2961.08
Total annual energy potential in mm Btu/year 790055.75
Total annual energy potential in trillion Btu/year 0.790
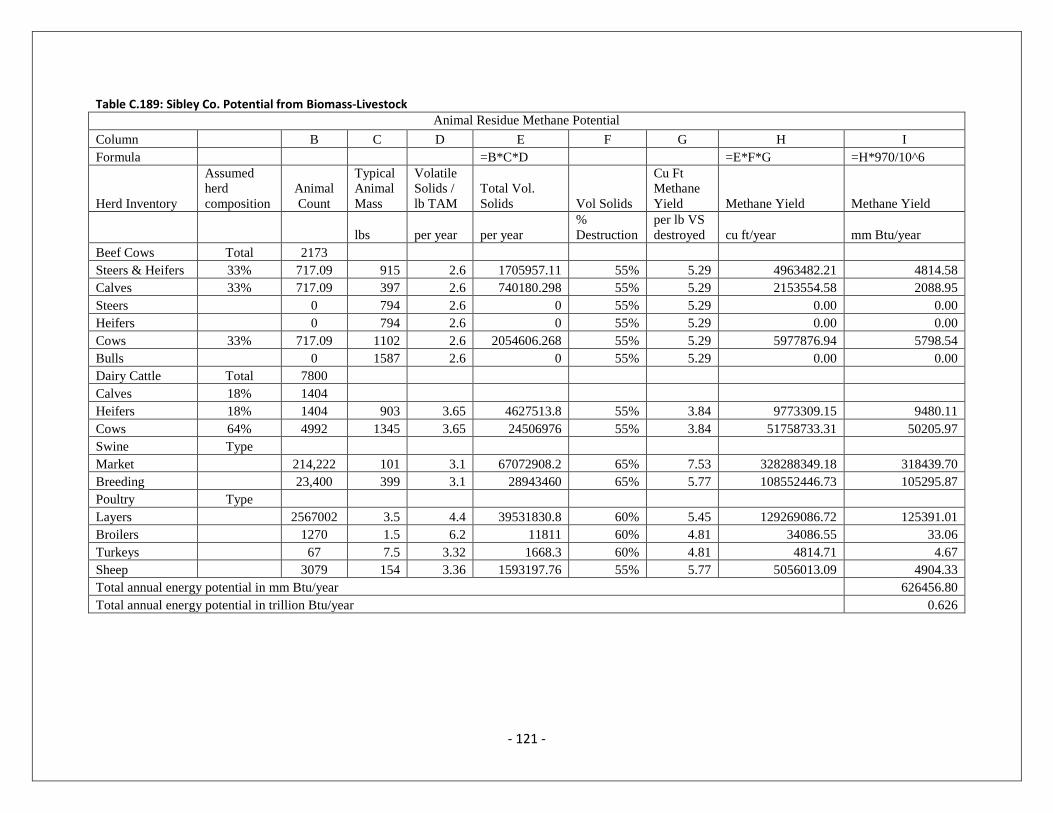
- 121 -
Table C.189: Sibley Co. Potential from Biomass-Livestock
Animal Residue Methane Potential
Column B C D E F G H I
Formula =B*C*D =E*F*G =H*970/10^6
Herd Inventory
Assumed
herd
composition
Animal
Count
Typical
Animal
Mass
Volatile
Solids /
lb TAM
Total Vol.
Solids Vol Solids
Cu Ft
Methane
Yield Methane Yield Methane Yield
lbs per year per year
%
Destruction
per lb VS
destroyed cu ft/year mm Btu/year
Beef Cows Total 2173
Steers & Heifers 33% 717.09 915 2.6 1705957.11 55% 5.29 4963482.21 4814.58
Calves 33% 717.09 397 2.6 740180.298 55% 5.29 2153554.58 2088.95
Steers 0 794 2.6 0 55% 5.29 0.00 0.00
Heifers 0 794 2.6 0 55% 5.29 0.00 0.00
Cows 33% 717.09 1102 2.6 2054606.268 55% 5.29 5977876.94 5798.54
Bulls 0 1587 2.6 0 55% 5.29 0.00 0.00
Dairy Cattle Total 7800
Calves 18% 1404
Heifers 18% 1404 903 3.65 4627513.8 55% 3.84 9773309.15 9480.11
Cows 64% 4992 1345 3.65 24506976 55% 3.84 51758733.31 50205.97
Swine Type
Market 214,222 101 3.1 67072908.2 65% 7.53 328288349.18 318439.70
Breeding 23,400 399 3.1 28943460 65% 5.77 108552446.73 105295.87
Poultry Type
Layers 2567002 3.5 4.4 39531830.8 60% 5.45 129269086.72 125391.01
Broilers 1270 1.5 6.2 11811 60% 4.81 34086.55 33.06
Turkeys 67 7.5 3.32 1668.3 60% 4.81 4814.71 4.67
Sheep 3079 154 3.36 1593197.76 55% 5.77 5056013.09 4904.33
Total annual energy potential in mm Btu/year 626456.80
Total annual energy potential in trillion Btu/year 0.626
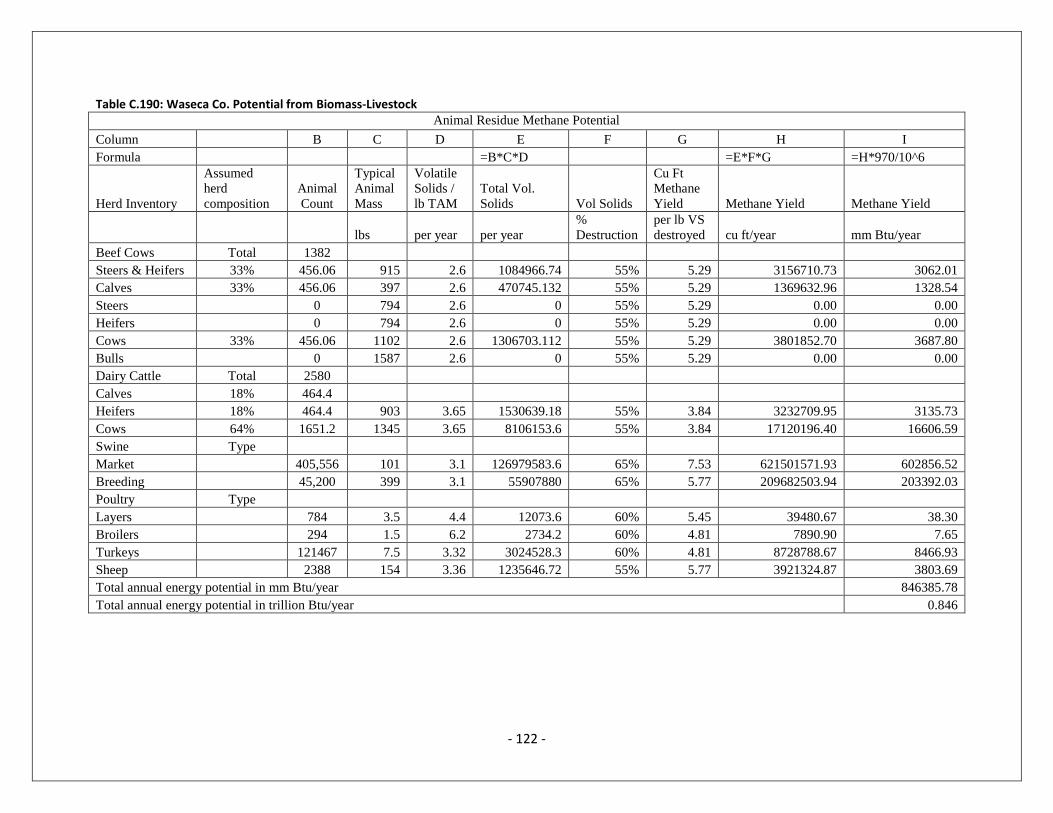
- 122 -
Table C.190: Waseca Co. Potential from Biomass-Livestock
Animal Residue Methane Potential
Column B C D E F G H I
Formula =B*C*D =E*F*G =H*970/10^6
Herd Inventory
Assumed
herd
composition
Animal
Count
Typical
Animal
Mass
Volatile
Solids /
lb TAM
Total Vol.
Solids Vol Solids
Cu Ft
Methane
Yield Methane Yield Methane Yield
lbs per year per year
%
Destruction
per lb VS
destroyed cu ft/year mm Btu/year
Beef Cows Total 1382
Steers & Heifers 33% 456.06 915 2.6 1084966.74 55% 5.29 3156710.73 3062.01
Calves 33% 456.06 397 2.6 470745.132 55% 5.29 1369632.96 1328.54
Steers 0 794 2.6 0 55% 5.29 0.00 0.00
Heifers 0 794 2.6 0 55% 5.29 0.00 0.00
Cows 33% 456.06 1102 2.6 1306703.112 55% 5.29 3801852.70 3687.80
Bulls 0 1587 2.6 0 55% 5.29 0.00 0.00
Dairy Cattle Total 2580
Calves 18% 464.4
Heifers 18% 464.4 903 3.65 1530639.18 55% 3.84 3232709.95 3135.73
Cows 64% 1651.2 1345 3.65 8106153.6 55% 3.84 17120196.40 16606.59
Swine Type
Market 405,556 101 3.1 126979583.6 65% 7.53 621501571.93 602856.52
Breeding 45,200 399 3.1 55907880 65% 5.77 209682503.94 203392.03
Poultry Type
Layers 784 3.5 4.4 12073.6 60% 5.45 39480.67 38.30
Broilers 294 1.5 6.2 2734.2 60% 4.81 7890.90 7.65
Turkeys 121467 7.5 3.32 3024528.3 60% 4.81 8728788.67 8466.93
Sheep 2388 154 3.36 1235646.72 55% 5.77 3921324.87 3803.69
Total annual energy potential in mm Btu/year 846385.78
Total annual energy potential in trillion Btu/year 0.846
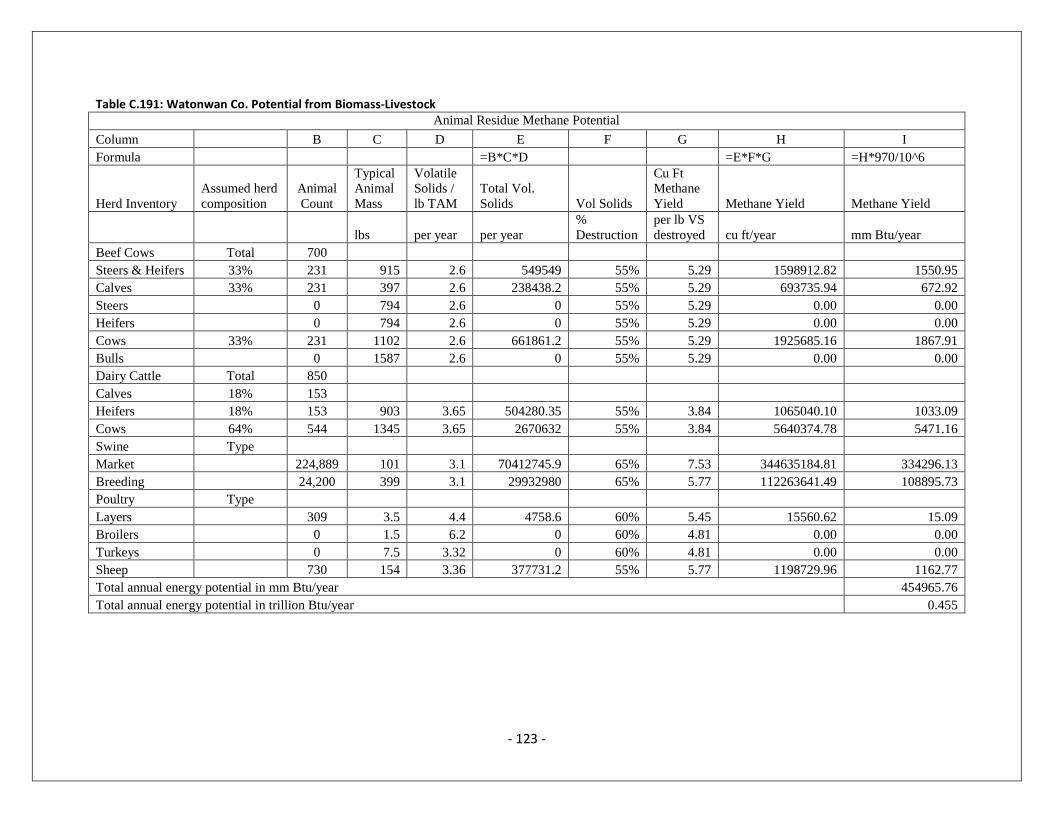
- 123 -
Table C.191: Watonwan Co. Potential from Biomass-Livestock
Animal Residue Methane Potential
Column B C D E F G H I
Formula =B*C*D =E*F*G =H*970/10^6
Herd Inventory
Assumed herd
composition
Animal
Count
Typical
Animal
Mass
Volatile
Solids /
lb TAM
Total Vol.
Solids Vol Solids
Cu Ft
Methane
Yield Methane Yield Methane Yield
lbs per year per year
%
Destruction
per lb VS
destroyed cu ft/year mm Btu/year
Beef Cows Total 700
Steers & Heifers 33% 231 915 2.6 549549 55% 5.29 1598912.82 1550.95
Calves 33% 231 397 2.6 238438.2 55% 5.29 693735.94 672.92
Steers 0 794 2.6 0 55% 5.29 0.00 0.00
Heifers 0 794 2.6 0 55% 5.29 0.00 0.00
Cows 33% 231 1102 2.6 661861.2 55% 5.29 1925685.16 1867.91
Bulls 0 1587 2.6 0 55% 5.29 0.00 0.00
Dairy Cattle Total 850
Calves 18% 153
Heifers 18% 153 903 3.65 504280.35 55% 3.84 1065040.10 1033.09
Cows 64% 544 1345 3.65 2670632 55% 3.84 5640374.78 5471.16
Swine Type
Market 224,889 101 3.1 70412745.9 65% 7.53 344635184.81 334296.13
Breeding 24,200 399 3.1 29932980 65% 5.77 112263641.49 108895.73
Poultry Type
Layers 309 3.5 4.4 4758.6 60% 5.45 15560.62 15.09
Broilers 0 1.5 6.2 0 60% 4.81 0.00 0.00
Turkeys 0 7.5 3.32 0 60% 4.81 0.00 0.00
Sheep 730 154 3.36 377731.2 55% 5.77 1198729.96 1162.77
Total annual energy potential in mm Btu/year 454965.76
Total annual energy potential in trillion Btu/year 0.455
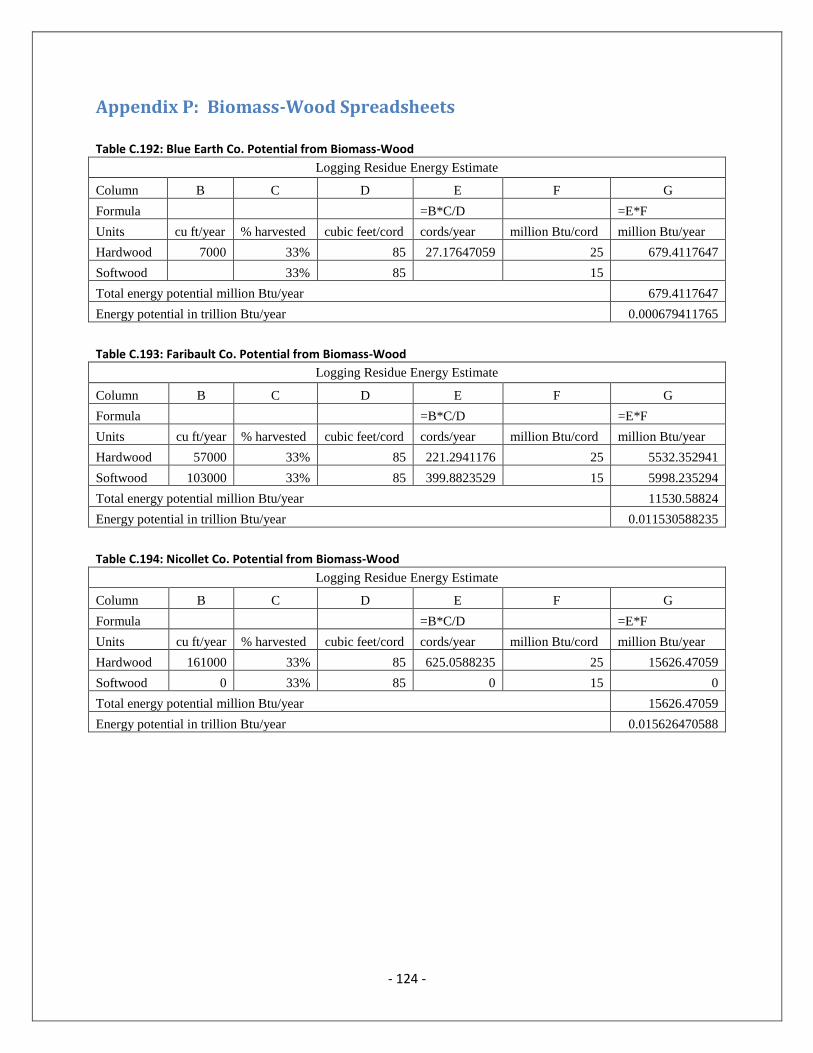
- 124 -
Appendix P: Biomass-Wood Spreadsheets
Table C.192: Blue Earth Co. Potential from Biomass-Wood
Logging Residue Energy Estimate
Column B C D E F G
Formula =B*C/D =E*F
Units cu ft/year % harvested cubic feet/cord cords/year million Btu/cord million Btu/year
Hardwood 7000 33% 85 27.17647059 25 679.4117647
Softwood 33% 85 15
Total energy potential million Btu/year 679.4117647
Energy potential in trillion Btu/year 0.000679411765
Table C.193: Faribault Co. Potential from Biomass-Wood
Logging Residue Energy Estimate
Column B C D E F G
Formula =B*C/D =E*F
Units cu ft/year % harvested cubic feet/cord cords/year million Btu/cord million Btu/year
Hardwood 57000 33% 85 221.2941176 25 5532.352941
Softwood 103000 33% 85 399.8823529 15 5998.235294
Total energy potential million Btu/year 11530.58824
Energy potential in trillion Btu/year 0.011530588235
Table C.194: Nicollet Co. Potential from Biomass-Wood
Logging Residue Energy Estimate
Column B C D E F G
Formula =B*C/D =E*F
Units cu ft/year % harvested cubic feet/cord cords/year million Btu/cord million Btu/year
Hardwood 161000 33% 85 625.0588235 25 15626.47059
Softwood 0 33% 85 0 15 0
Total energy potential million Btu/year 15626.47059
Energy potential in trillion Btu/year 0.015626470588
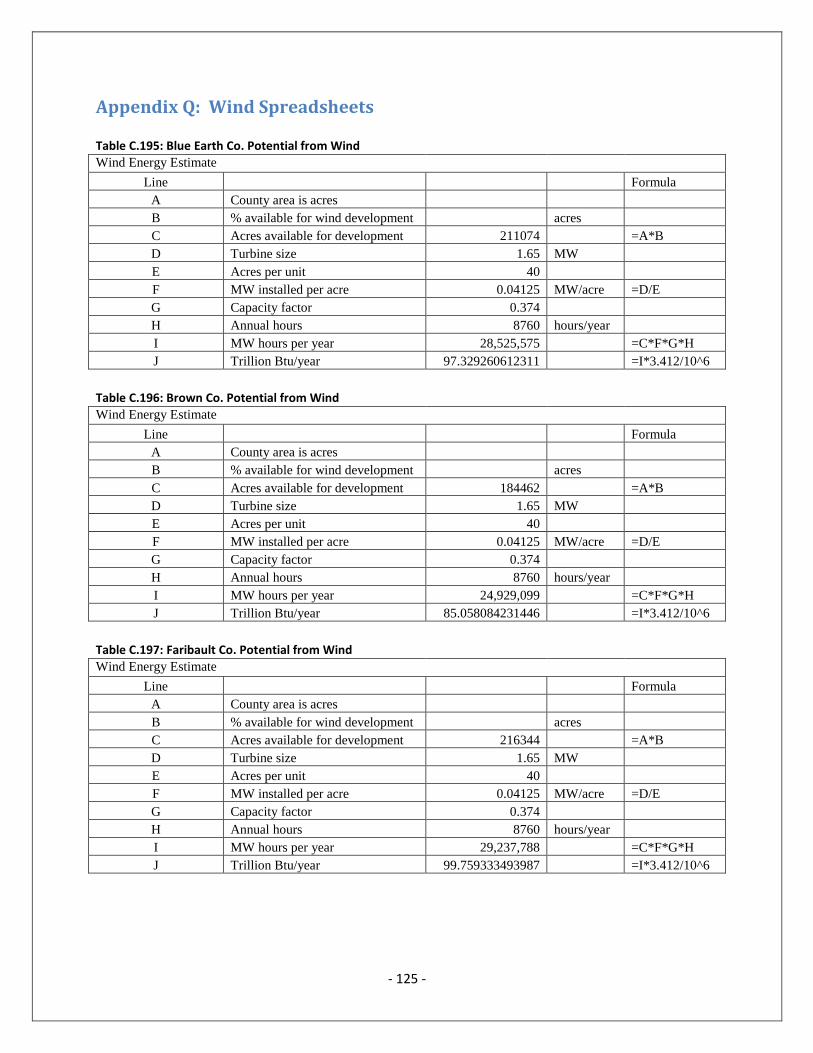
- 125 -
Appendix Q: Wind Spreadsheets Table C.195: Blue Earth Co. Potential from Wind
Wind Energy Estimate
Line Formula
A County area is acres
B % available for wind development acres
C Acres available for development 211074 =A*B
D Turbine size 1.65 MW
E Acres per unit 40
F MW installed per acre 0.04125 MW/acre =D/E
G Capacity factor 0.374
H Annual hours 8760 hours/year
I MW hours per year 28,525,575 =C*F*G*H
J Trillion Btu/year 97.329260612311 =I*3.412/10^6
Table C.196: Brown Co. Potential from Wind
Wind Energy Estimate
Line Formula
A County area is acres
B % available for wind development acres
C Acres available for development 184462 =A*B
D Turbine size 1.65 MW
E Acres per unit 40
F MW installed per acre 0.04125 MW/acre =D/E
G Capacity factor 0.374
H Annual hours 8760 hours/year
I MW hours per year 24,929,099 =C*F*G*H
J Trillion Btu/year 85.058084231446 =I*3.412/10^6
Table C.197: Faribault Co. Potential from Wind
Wind Energy Estimate
Line Formula
A County area is acres
B % available for wind development acres
C Acres available for development 216344 =A*B
D Turbine size 1.65 MW
E Acres per unit 40
F MW installed per acre 0.04125 MW/acre =D/E
G Capacity factor 0.374
H Annual hours 8760 hours/year
I MW hours per year 29,237,788 =C*F*G*H
J Trillion Btu/year 99.759333493987 =I*3.412/10^6

- 126 -
Table C.198: Le Sueur Co. Potential from Wind Wind Energy Estimate
Line Formula
A County area is acres
B % available for wind development acres
C Acres available for development 88020 =A*B
D Turbine size 1.65 MW
E Acres per unit 40
F MW installed per acre 0.04125 MW/acre =D/E
G Capacity factor 0.374
H Annual hours 8760 hours/year
I MW hours per year 11,895,454 =C*F*G*H
J Trillion Btu/year 40.587289382376 =I*3.412/10^6
Table C.199: Martin Co. Potential from Wind
Wind Energy Estimate
Line Formula
A County area is acres
B % available for wind development acres
C Acres available for development 202837 =A*B
D Turbine size 1.65 MW
E Acres per unit 40
F MW installed per acre 0.04125 MW/acre =D/E
G Capacity factor 0.374
H Annual hours 8760 hours/year
I MW hours per year 27,412,386 =C*F*G*H
J Trillion Btu/year 93.531061309396 =I*3.412/10^6
Table C.200: Nicollet Co. Potential from Wind
Wind Energy Estimate
Line Formula
A County area is acres
B % available for wind development acres
C Acres available for development 134092 =A*B
D Turbine size 1.65 MW
E Acres per unit 40
F MW installed per acre 0.04125 MW/acre =D/E
G Capacity factor 0.374
H Annual hours 8760 hours/year
I MW hours per year 18,121,850 =C*F*G*H
J Trillion Btu/year 61.831751963890 =I*3.412/10^6
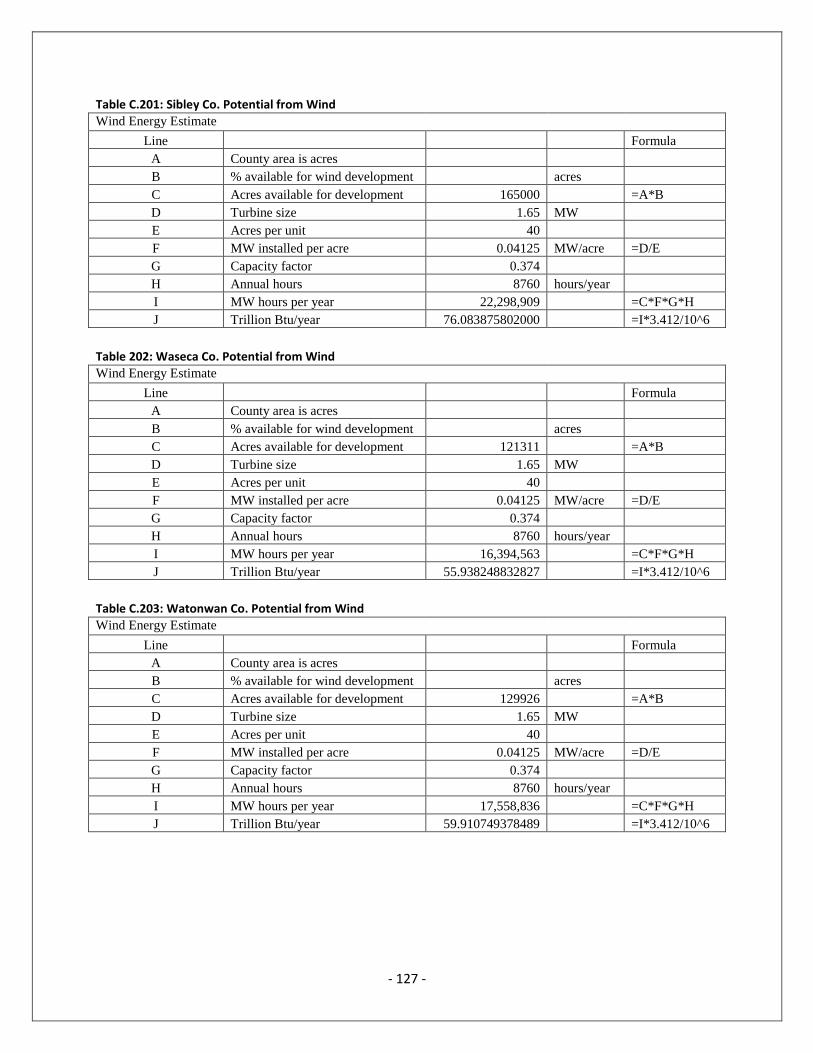
- 127 -
Table C.201: Sibley Co. Potential from Wind Wind Energy Estimate
Line Formula
A County area is acres
B % available for wind development acres
C Acres available for development 165000 =A*B
D Turbine size 1.65 MW
E Acres per unit 40
F MW installed per acre 0.04125 MW/acre =D/E
G Capacity factor 0.374
H Annual hours 8760 hours/year
I MW hours per year 22,298,909 =C*F*G*H
J Trillion Btu/year 76.083875802000 =I*3.412/10^6
Table 202: Waseca Co. Potential from Wind
Wind Energy Estimate
Line Formula
A County area is acres
B % available for wind development acres
C Acres available for development 121311 =A*B
D Turbine size 1.65 MW
E Acres per unit 40
F MW installed per acre 0.04125 MW/acre =D/E
G Capacity factor 0.374
H Annual hours 8760 hours/year
I MW hours per year 16,394,563 =C*F*G*H
J Trillion Btu/year 55.938248832827 =I*3.412/10^6
Table C.203: Watonwan Co. Potential from Wind
Wind Energy Estimate
Line Formula
A County area is acres
B % available for wind development acres
C Acres available for development 129926 =A*B
D Turbine size 1.65 MW
E Acres per unit 40
F MW installed per acre 0.04125 MW/acre =D/E
G Capacity factor 0.374
H Annual hours 8760 hours/year
I MW hours per year 17,558,836 =C*F*G*H
J Trillion Btu/year 59.910749378489 =I*3.412/10^6