Embed Size (px)
Citation preview

South-Central Minnesota Groundwater Monitoring of the Mt. Simon AquiferJames A. Berg and Scott R. PearsonMinnesota Department of Natural ResourcesEcological and Water Resources DivisionSt. Paul, Minnesota
November 2012

Funding for this project was provided by the Minnesota Environment and Natural Resources Trust Fund as recommended by the Legislative Commission on Minnesota Resources (LCCMR).
This is the final project report of Result 2 of the LCCMR project titled “South-Central Ground-water Monitoring and County Geologic Atlases” (M.L. 2008 Chap. 367, Sec. 2 Subd. 4 (h)).
AuthorsJames A. BergScott R. Pearson
Contributors and ReviewersJeanette LeeteNeil Cunningham Bob TippingTony RunkelJohn Mossler
If you have questions or would like additional information, please contact James Berg at 651-259-5680.
Minnesota Department of Natural Resources500 Layfayette Road North | Saint Paul, MN 55155-4040 | www.dnr.state.mn.us | 651-296-6157 Toll free 888-MINNDNR | TTY 651-296-5484
This report is available in additional formats upon request, and online at www.dnr.state.mn.us
Last version: Version 3.1, June 2011Current version: Version 3.2, November 2012 (text update)

Contents
Abstract......................................................................................................................................................6
Introduction and Purpose.........................................................................................................................7
Geology of South-Central Minnesota.......................................................................................................8
Investigation Methods................................................................................................................................9 Site selection Drilling methods and well construction Aquifer interval selection for monitoring Geophysical well logging Well development Groundwater sample collection Specific capacity procedures and results Continuous water level measurements
Thickness of the Mt. Simon Aquifer Near the Western Subcrop.........................................................13
Groundwater Movement and Potentiometric Surface - Mt. Simon Aquifer........................................13
Geochemistry...........................................................................................................................................14 Groundwater Residence Time Stable isotopes, 18O and deuterium Source water temperature and mixing Evaporation of source water Major ions Trace elements
Hydrogeology Illustrated by Cross Sections and Hydrographs from Observation Well Nests.......18 Cross section A-A’ and Severence Lake WMA hydrograph Cross section B-B’ and Sibley County landfill property hydrograph Cross section C-C’ and Norwegian Grove WMA hydrograph Cross section D-D’ and Peterson unit hydrograph Cross section E-E’ and Courtland West/Nicollet Bay hydrographs Cross section F-F’ and Helget-Braulick WMA hydrograph Cross section G-G’ and Bergdahl WMA hydrograph Cross section H-H’ and Case WMA hydrograph Cross section I-I’ and Madelia WMA hydrograph Cross section J-J ‘and Long Lake WA hydrograph Cross section K-K’ and Exceder WMA hydrograph Cross section L-L’ and Rooney Run WMA hydrograph
Paleohydrology and recharge estimates...............................................................................................22 Southern area recharge Northern area recharge

4 South-Central Minnesota Groundwater Monitoring of the Mt. Simon Aquifer
2009 Groundwater Appropriation..........................................................................................23 Southern area appropriation Northern area appropriation
Conclusions............................................................................................................................24
References..............................................................................................................................25
Attachments Section
Tables......................................................................................................................................27 1: Well summary 2: Specific capacity and water level data summary 3: Field sample collection and handling 4: Residence time indicators, stable isotopes, and selected trace elements 5: Selected anion and cation data
Figures....................................................................................................................................33 1: Mt. Simon observation well nest locations 2: Cambrian and older stratigraphy in study area 3: County and state Paleozoic bedrock map 4: Mt. Simon Sandstone thickness 5: Mt. Simon potentiometric surface and groundwater flow directions 6: Cross section Z-Z’, Mt. Simon potentiometric surface 7: Carbon-14 residence time data from the shallower aquifers at each observation well nest 8: Mt. Simon carbon-14 residence time, potentiometric surface, and groundwater flow directions 9: Stable isotope data compared with North American meteoric line 10: Ternary diagram-relative abundances of major cations and anions 11: Mt. Simon sulfate concentrations (mg/l), and groundwater flow directions 12: Mt. Simon chloride concentrations (mg/l), and groundwater flow directions 13: Mt. Simon arsenic concentrations (mg/l), and groundwater flow directions 14: Precipitation departure from normal October 2009-September 2010 15a: Cross section A-A’ 15b: Severance Lake WMA hydrograph 16a: Cross section B-B’ 16b: Sibley County landfill hydrograph 17a: Cross section C-C’ 17b: Norwegian Grove WMA hydrograph 18a: Cross section D-D’ 18b: Peterson Unit hydrograph 19a: Cross section E-E’ 19b: Courtland West Unit hydrograph 19c: Nicollet Bay Unit hydrograph 20a: Cross section F-F’

5South-Central Minnesota Groundwater Monitoring of the Mt. Simon Aquifer
20b: Helget Braulick WMA hydrograph 21a: Cross section G-G’ 21b: Bergdahl WMA hydrograph 22a: Cross section H-H’ 22b: Case WMA hydrograph 23a: Cross section I-I’ 23b: Madelia WMA hydrograph 24a: Cross section J-J’ 24b: Long Lake WA hydrograph 25a: Cross section K-K’ 25b: Exceder WMA hydrograph 26a: Cross section L-L’ 26b: Rooney Run WMA hydrograph 27: Mt. Simon recharge interpretation 28: Generalized cross section Z-Z’ and geochemical data 29: Cross section Z-Z’, Mt. Simon recharge and discharge 30: Mt. Simon observation well nest locations and 2009 groundwater appropriation
Appendix A: Geological/Geophysical Logs and Well Construction Diagrams..................77 Geological Log Legend Severance Lake WMA Rooney Run WMA Swan Lake WMA - Peterson Unit Norwegian Grove WMA Swan Lake WMA - Nicollet Bay Unit Madelia WMA Long Lake WA Lake Hanska WA Helget Braulick WMA Exceder WMA Swan Lake WMA - Courtland West Unit Case WMA Bergdahl WMA Sibley County Landfill
.
6 South-Central Minnesota Groundwater Monitoring of the Mt. Simon Aquifer
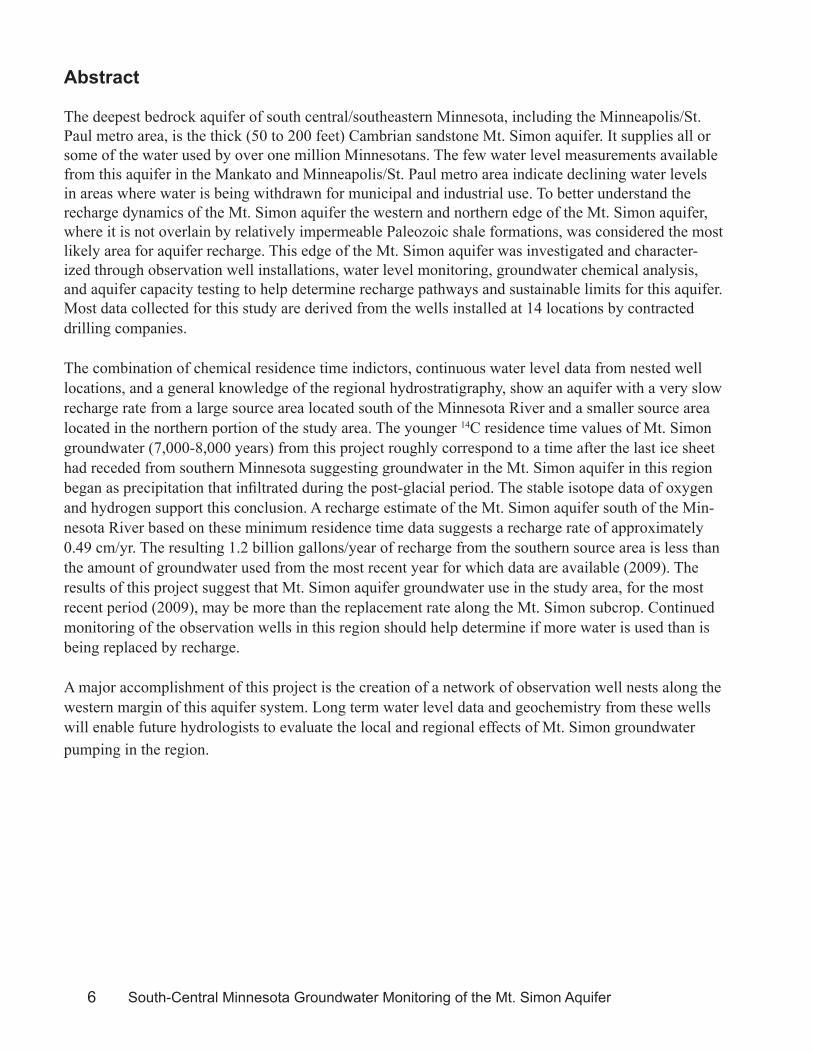
Abstract
The deepest bedrock aquifer of south central/southeastern Minnesota, including the Minneapolis/St. Paul metro area, is the thick (50 to 200 feet) Cambrian sandstone Mt. Simon aquifer. It supplies all or some of the water used by over one million Minnesotans. The few water level measurements available from this aquifer in the Mankato and Minneapolis/St. Paul metro area indicate declining water levels in areas where water is being withdrawn for municipal and industrial use. To better understand the recharge dynamics of the Mt. Simon aquifer the western and northern edge of the Mt. Simon aquifer, where it is not overlain by relatively impermeable Paleozoic shale formations, was considered the most likely area for aquifer recharge. This edge of the Mt. Simon aquifer was investigated and character-ized through observation well installations, water level monitoring, groundwater chemical analysis, and aquifer capacity testing to help determine recharge pathways and sustainable limits for this aquifer. Most data collected for this study are derived from the wells installed at 14 locations by contracted drilling companies.
The combination of chemical residence time indictors, continuous water level data from nested well locations, and a general knowledge of the regional hydrostratigraphy, show an aquifer with a very slow recharge rate from a large source area located south of the Minnesota River and a smaller source area located in the northern portion of the study area. The younger 14C residence time values of Mt. Simon groundwater (7,000-8,000 years) from this project roughly correspond to a time after the last ice sheet had receded from southern Minnesota suggesting groundwater in the Mt. Simon aquifer in this region began as precipitation that infiltrated during the post-glacial period. The stable isotope data of oxygen and hydrogen support this conclusion. A recharge estimate of the Mt. Simon aquifer south of the Min-nesota River based on these minimum residence time data suggests a recharge rate of approximately 0.49 cm/yr. The resulting 1.2 billion gallons/year of recharge from the southern source area is less than the amount of groundwater used from the most recent year for which data are available (2009). The results of this project suggest that Mt. Simon aquifer groundwater use in the study area, for the most recent period (2009), may be more than the replacement rate along the Mt. Simon subcrop. Continued monitoring of the observation wells in this region should help determine if more water is used than is being replaced by recharge.
A major accomplishment of this project is the creation of a network of observation well nests along the western margin of this aquifer system. Long term water level data and geochemistry from these wells will enable future hydrologists to evaluate the local and regional effects of Mt. Simon groundwater pumping in the region.

7South-Central Minnesota Groundwater Monitoring of the Mt. Simon Aquifer
Introduction and Purpose
The 2008 and 2009 legislatures allocated funding from the Environment and Natural Resources Trust Fund for an aquifer investigation, mapping, and monitoring project in south-central and east-central Minnesota (Figure 1). The 2008/2009 allocations provide $4,295,000 for a 4-year project. The allocation is being shared by the Department of Natural Resources (DNR, $2,769,000) and the Minnesota Geological Survey (MGS, $1,526,000) to evaluate the Mt. Simon aquifer and produce geologic atlases. The purpose of this report is to compile, summarize, and interpret data collected from the first phase of the DNR portion of this project as required by the statute (ML 2008, Chap. 367, Sec. 2, Subd. 4 (h)). A report summarizing the sec-ond phase of the project west and northwest of the Twin Cities Metropolitan area is scheduled for comple-tion June 30, 2012.
The deepest bedrock aquifer of south central/southeastern Minnesota, including the Minneapolis/St. Paul metro area, is the thick (50 to 200 feet) Cambrian sandstone Mt. Simon aquifer. It supplies all or some of the water used by over one million Minnesotans. The few water level measurements available from this aquifer in the Mankato and Minneapolis/St. Paul metro area indicate declining water levels in some parts of these areas where water is being withdrawn for municipal and commercial use. While efforts currently are underway through other agency and additional Minnesota Department of Natural Resources projects to lo-cally map and understand these depressed Mt. Simon water level areas, we believed a project to regionally understand the recharge dynamics of the Mt. Simon aquifer was needed. The western and northern edge of the Mt. Simon aquifer (Figure 1), where it is not overlain by relatively impermeable Paleozoic shale for-mations, was considered the most likely area for aquifer recharge. This edge of the Mt. Simon aquifer also was investigated and characterized through observation well installations, water level monitoring, ground-water chemical analysis, and aquifer capacity testing to help determine recharge pathways and sustainable limits for this aquifer. These data will help determine aquifer recharge characteristics and potential limita-tions for future use.
Most data collected for this study are derived from well nests (two or more observation wells completed at the same location but at different depths) installed at 14 locations by contracted drilling companies. A total of 13 Mt. Simon Sandstone wells and 15 wells in other geologic units were drilled; one Mt. Simon sandstone well was sealed following drilling. Staff from the DNR Ecological and Water Resource Division coordinated the installation of these wells, which are known among groundwater professionals as observa-tion wells. Drilling in the northern portion of the investigation area (Phase 2) began in the fall of 2009 to complete well nests at an additional 10 locations. The wells are completed in the Mt. Simon aquifer and shallower aquifers on public property in the project area to depths of 70 feet to 718 feet (Table 1). The wells were sampled for chemical constituents such as tritium and carbon-14 that will help determine the residence time or age of the groundwater in this aquifer and overlying aquifers. The wells were also instru-mented with equipment to continuously record groundwater levels.

8 South-Central Minnesota Groundwater Monitoring of the Mt. Simon Aquifer
Geology of South-Central Minnesota
The focus of this investigation was the Cambrian Mt. Simon Sandstone (Figure 2) which is located at the base of a thick sequence of marine Paleozoic carbonate, shale, and sandstone formations that underlie central and southeastern Minnesota in a broad structural basin known as the Hollandale embayment (Figure 3). The Mt. Simon Sandstone is generally a medium to coarse-grained quartz-ose sandstone (Mossler, 2008). The Mt. Simon formation cuttings observed from drill holes for this project generally indicated the unit is dominated by thick beds of gray and white silty, very fine to medium-grained quartzose to feldspathic sandstones with thin white-grey and light green shale beds. The basal portion of the Mt. Simon Sandstone has somewhat thicker shale beds and coarse yellowish quartz grains ranging from very coarse sand to medium pebble size.
Various Precambrian rocks underlie the Mt. Simon Sandstone due to a complicated geologic history prior to the deposition of the Paleozoic rocks. These older underlying rocks include Middle Protero-zoic sedimentary rocks, such as the Hinckley Sandstone and the Fond du Lac Formation, Early Pro-terozoic igneous and metamorphic rocks, and in some southern areas, the Lower Proterozoic Sioux Quartzite. None of these underlying rocks have desirable aquifer properties for most purposes. There-fore, the Mt. Simon Sandstone is the deepest bedrock aquifer in the region. Furthermore, along the western edge of the Hollandale embayment (Figure 3), the Mt. Simon aquifer is commonly the only aquifer available for large capacity (i.e., municipal and industrial) use.
Following the deposition of sand and other sediments that would become the Mt. Simon Sandstone and overlying formations, there was a long period of exposure and non-deposition of rock materi-als. During the Late Cretaceous period marine and non-marine sedimentary rocks (mostly shale and sandstone) were deposited along the western edge of the Hollandale embayment in south-central Min-nesota. During this period a shallow epicontinental (inland) sea covered the western interior of North America. Relatively thick sections of these types are rocks are common in the southern portion of the investigation area.
Following another long period of exposure and non-deposition of rock materials after the Cretaceous period, the region was affected by repeated continental glaciations during the Quaternary period. These glaciations deposited thick alternating layers of glacial outwash (sand and gravel), glacial till (dense mixture of silt, sand, and clay), and other types of deposits. Thus the depositional history for most of southeastern and south-central Minnesota has left a legacy of both bedrock and glacial aquifer systems.

9South-Central Minnesota Groundwater Monitoring of the Mt. Simon Aquifer
Investigation Methods
Site SelectionThe wells for this investigation were drilled on public land to help ensure the longevity of these moni-toring locations. With the exception of one location, all the wells are on state land managed by the Department of Natural Resources, on either wildlife management areas (WMAs) or at water access (WA) locations. One well site in Sibley County is owned by the county. At that location special access permission for that location was obtained from the County Board of Commissioners.
Site locations were chosen in suspected recharge areas for the Mt. Simon aquifer near the western edge of the Hollandale embayment at location where the Mt. Simon Sandstone was likely to be the uppermost bedrock to be found beneath the surficial glacial deposits or Cretaceous shale and sand-stone. A shallow and deep well were drilled at most locations to provide data on the vertical hydraulic head gradients, changes in groundwater chemistry, and residence time with depth. These sites were spaced as evenly as possible across the recharge area given the existing distribution of public land in the region. The well nest locations are typically near existing roads and parking lots for easy access and to minimize disturbance of undeveloped parts of these properties.
Drilling Methods and Well ConstructionTwo different kinds of drilling methods were used to install wells for this project (Table 1). Mud rotary (MR) is a commonly used and widely available method for drilling and completing water wells. Typically a hollow tricone drilling bit is attached to hollow drilling rods that are turned by the drilling rig. During the drilling process, a drilling mud mixture is pumped through the interior of the hollow rod and bit assembly which pushes the ground rock and sediment upward through the annular space between the drilling rods and the larger diameter borehole to the surface. The drilling mud flows into an open tank at the surface and is subsequently recirculated back down the inside of the drill bit/rod assembly to the bottom of the borehole. The advantage of this method is that it is relatively fast and inexpensive. The disadvantage of this method is that the ground-up bits of rock and sediment (also known as “cuttings”) that the driller and geologist use to identify drilling progress become difficult or impossible to identify below a depth of several hundred feet because of mixing and mechanical degra-dation of the cuttings on their way to the surface.
Another type of drilling method called dual rotary/ reverse circulation (DR/RC) was used in selected areas. During DR/RC drilling, the drill cuttings are returned to surface inside the rods. Reverse circu-lation is achieved by pumping air down the outer tube of the rods with a large compressor. The dif-ferential pressure at the drill bit creates suction that pulls the water and cuttings up the “inner tube” which is inside the rod. Once the water and cuttings reach the surface, the cuttings move through a sample hose and are collected in a sample pail. DR/RC drilling produces discrete and easily identifi-able rock chips from all depths and is therefore ideal for drilling in unknown areas where the geolo-gist does not know exactly what to expect at depth. DR/RC drilling is slower and more expensive than mud rotary.

10 South-Central Minnesota Groundwater Monitoring of the Mt. Simon Aquifer
Aquifer Interval Selection for MonitoringMethods for well construction were somewhat different for boreholes drilled with the two methods. For the dual rotary holes, an 8- inch or 10-inch diameter temporary steel surface casing was driven simultaneously during drilling to the base of the unconsolidated or poorly consolidated Quaternary and Cretaceous layers. Once solid bedrock was reached, the remainder of the hole was drilled with-out casing because the hole was unlikely to collapse. Drilling continued until Precambrian bedrock was encountered beneath the Mt. Simon Sandstone. A geophysical log of the hole was then made by geologists from the Minnesota Geological Survey at which time the depth of the permanent 4-inch diameter casing was determined based on the gamma log characteristics of the Mt. Simon Sandstone. The relatively shale-free portions of the formation were typically left as open hole. The casing was then constructed by the drilling crew and grouted in place and the temporary casing was removed. The advantage of this procedure was that the depth of the permanent casing could be chosen based on the cuttings and the geophysical log ensuring that the open-hole portion of the well was in the correct depth range such as the most transmissive portion of the Mt. Simon sandstone.
Drilling with the mud rotary method followed a different sequence. A seven-inch diameter borehole was drilled into the top of the Mt. Simon Sandstone and a four-inch steel casing was grouted in place. Once the grout had set, the drilling crew would drill inside the four-inch casing with a smaller drill bit and rod assembly until they had drilled through the Mt. Simon Sandstone into the underlying Pre-cambrian bedrock. The depth at which the Mt. Simon is encountered is estimated by reference to logs of nearby wells and careful observation of changes in the cuttings that come to the surface with the drilling mud. The main disadvantage of this method is that if the top of the Mt. Simon Sandstone is misidentified, the base of the permanent casing might not be placed at an ideal depth.
Once the deep Mt. Simon well aquifer was completed and logged with geophysical tools, the aquifer for the shallower well in the nest was chosen based on gamma log and cuttings characteristics. These shallow wells were completed in the discontinuous sand and sandstone layers of the Quaternary and Cretaceous units at a relatively wide range of depths. In general, we were seeking the shallowest aqui-fer that might be used for domestic or larger capacity purposes.
Geophysical Well LoggingWell logging is the practice of making a detailed record (a well log) of the geologic formations pen-etrated by a borehole. The geologic log is a compilation visual description and interpretations of samples brought to the surface. The geophysical well log is a record of formation physical properties with electrically powered instruments. The main geophysical log types collected for this project in-clude passive nuclear measurements (natural gamma rays) and resistivity. After the borehole has been completed, but before the permanent casing has been grouted in the borehole, the logging tool (or probe) is lowered into the open wellbore on a wire connected to the surface. Once lowered to the bot-tom of the hole, measurements are taken as the probe is withdrawn from the wellbore. Measurements are recorded continuously while the probe is moving.

11South-Central Minnesota Groundwater Monitoring of the Mt. Simon Aquifer
Gamma ray logging is a method of measuring naturally occurring gamma radiation to characterize the rock or sediment in a borehole. Different types of rock emit different amounts and spectra of natural gamma radiation (Driscoll, 1986). Shale and clay usually emit more gamma rays than other sedimen-tary rocks, such as sandstone, or sand and gravel because radioactive potassium, uranium, and thorium are common components in their clay content. This difference in radioactivity between clay-rich and non-clay-rich formations allows the geologist to distinguish between shale and sandstone/carbonate rocks and fine or coarse grain glacial sediments with the natural gamma log.
Resistivity is a property of all materials which represents how strongly a material opposes the flow of electric current. This log is recorded in boreholes containing electrically conductive fluid (drilling mud or water). Sand and sandstone tend to be insulators (high resistivity); clay and shale tend to be conduc-tors (low resistivity). Similar to the gamma log, this difference in resistivity between shale (or clay-rich sediments) and sandstones/carbonate rocks (or non-clay-rich sediments) allows the geologist to distin-guish between the two general categories of sediments or sedimentary rocks using the resistivity log.
Generalized versions of the gamma logs completed by the staff of the Minnesota Geological Survey (MGS) are shown with the lithologic logs for each of the project well nests in Appendix A. The litho-logic descriptions on each of these logs are summarized from MGS interpretations of cuttings. De-tailed copies of these logs can be obtained from the MGS.
Well DevelopmentAfter the borehole is drilled and the permanent well casing is grouted in the well, the well is purged for one to two hours to remove sediment that may have accumulated at the base of the well. This well development procedure is designed to ensure that all or most of the open hole portion of the well is unclogged and water level measurements from the well are representative of water levels in the aquifer at that location.
Groundwater Sample CollectionProtocols commonly employed for the collection of groundwater samples generally require the re-moval of much of the standing water in the borehole prior to the collection of groundwater samples. This is done so that the sample represents fresh groundwater and is representative of the resource. Removing groundwater from a well can be completed through the use of many mechanical methods; including bailers, air injection and pumping. An electric submersible well pump was selected for this project because it is capable of removing hundreds of gallons of water from depths greater than 150 feet in a relatively short period of time time in preparation for groundwater sampling. In addition, well performance testing information was collected during the same field event. Therefore, the collection of water samples was organized to complete two tasks; the collection of groundwater samples and a short duration well performance test.
To accomplish these two tasks, a submersible water well pump was temporarily installed and operated by a State-certified water well contractor. An electric generator was used to provide power to the pump and a combination of piping and flexible hose were installed to deliver the groundwater to the surface. During the course of the field sampling events two different pumps were used. The first pump had a

12 South-Central Minnesota Groundwater Monitoring of the Mt. Simon Aquifer
capacity of eight gallons per minute which proved too low to pump out the required volumes of water at an acceptable rate. This pump was replaced by a pump capable of producing pumping rates of 25 gallons per minute. Table 2 presents the basic information collected during these procedures.
Groundwater was pumped through a hose from the flow meter to a clean, white five gallon bucket that allowed field observations of color and odor. The bucket was also used as a flow through chamber into which the probes of several instruments were suspended. Sequential measurements of temperature, pH and specific conductance were made. The wells were pumped until constant values of pH, temperature and specific conductance were observed. The groundwater sample was collected after the values of these parameters remained stable and at least one well volume of water had been removed from the well.
The sampling consisted of filling prepared and labeled containers with groundwater from the hose dis-charge at the stabilization bucket. The carbon-14 (14C) sample size was approximately 30 gallons and required special handling and containers. Analytes and sampling protocol are summarized in Table 3. Samples were sent to the University of Minnesota Hydrochemistry Laboratory (U of M) and the Uni-versity of Waterloo Laboratory (Waterloo).
Specific Capacity Procedures and Results A specific capacity test provides an estimate of the potential yield from a water well. Specific capacity can be calculated from the results of a short duration pumping test. Specific capacity is the pumping rate (gallons per minute) divided by the measured drawdown (feet) and is reported in units of gallons per minute per foot of drawdown (gpm/ft). In Minnesota’s principal aquifers, the observed specific capacities (Minnesota DNR, 2004) range from less than 1.0 gpm/ft. to values greater than 100 gpm/ft. Specific capacities for the Mt. Simon- Hinckley wells typically range from 1 to 33 gpm/ft; specific capacities for glacial drift wells show greater variability from less than 1 to greater than 50 gpm/ft. As shown in Table 2, the observed specific capacities for the Mt. Simon wells ranged from 13 gpm/ft at Exceder WMA to less than 1 gpm/ft at Helget-Braulick WMA.
The depths to groundwater were measured from dedicated measuring points located at the top of the well casings. For this project the measuring points elevations were measured using engineering grade global positioning systems (GPS) that use the Minnesota Department of Transportation Continuously Operating Reference Station (CORS) network. The measuring point at each well is on the north side of the top of the four-inch diameter steel well casing (top of casing or TOC). Groundwater depth measure-ments were collected before, during and after pumping using electronic tapes and electronic pressure transducer instruments.
A flow meter was used to measure rate and a flow totalizer was used to measure total water discharge in gallons. The flow rate from the well was controlled with the well head check valve. At the start of each pumping test the valve was opened to allow the full pumping rate. Some of the wells were pumped at rates lower than the capacity of the pump to maintain water levels above the pump intake. Graphs of changes in the water level and water temperatures over time (hydrographs) are included in Appendix B. DNR observation well 83012 and Flandrau State Park campground well were not accessible for water level instrumentation and are not represented in Appendix B with a hydrograph. These two wells were, however, sampled for groundwater chemical analysis.

13South-Central Minnesota Groundwater Monitoring of the Mt. Simon Aquifer
Continuous Water Level MeasurementsUnattended continuous water level measurements can be made with pressure transducers – instru-ments that respond to changes in pressure created by the water column above the instrument. A data logger can record the measurements taken by a pressure transducer at specific intervals set by the user. Improvements in technology over the last decade have resulted in combined data logger and pressure transducer units that are about the size of a small flashlight.
Sealed data logger/pressure transducer units were submerged in each well to a depth of 20 to 25 feet below the water surface. Sealed units record changes in total pressure including barometric pressure. To discriminate changes in pressure readings that are related to barometric pressure change from real water level changes, a record of barometric pressure must also be made. Three data logger/barometer units were deployed across the study area for this purpose. All of the instruments were programmed to collect and store hourly readings.
Data are stored in the data logger until downloaded during quarterly site visit occurs. Communication cables connected to the instruments are accessible from the top of each well. At each location, the data are downloaded from the instruments, and a water level measurement is taken with a measuring tape. Following data downloads, computer software calibrates the data stream to the actual measurements and adjusts for changes in barometric pressure.
Thickness of the Mt. Simon Sandstone Near the Western Subcrop
One of the objectives of the project was to better define the physical boundaries of the Mt. Simon Sandstone in the study area to help with future water resource evaluations. With the exception of the well at the Nicollet Bay unit, all the Mt. Simon aquifer wells drilled for this project penetrated to the base of the formation. Most existing wells in this area (Figure 4) provide a minimum thickness value since most of the wells are domestic and are only drilled into the top of the aquifer to provide rela-tively small quantities of water.
Across the study area thicknesses of the Mt. Simon Sandstone increase toward the east over a short distance with the exception of an apparently broad and thin (0-50 feet) area in eastern Brown county. East of the western formation edge, the Mt. Simon Sandstone is commonly 200 feet thick or greater (Mossler, 1992).
Groundwater Movement and Potentiometric Surface – Mt. Simon Aquifer
A key aspect of understanding the hydrogeology of any area is to develop a basic understanding of the groundwater flow pathways. Aquifers and systems of aquifers are rarely static or unchangeable. Water is usually moving into the aquifers (recharge), through the aquifers, and out of the aquifers (discharge) in complicated but definable patterns. Three primary types of data are used by investigators to under-stand these relationships: chemical data from collected samples, aquifer test data gathered by pumping wells under controlled conditions, and static (non-pumping) data measured from wells and surface water bodies. Static water-level data and potentiometric surfaces are the primary focus of this section.
14 South-Central Minnesota Groundwater Monitoring of the Mt. Simon Aquifer
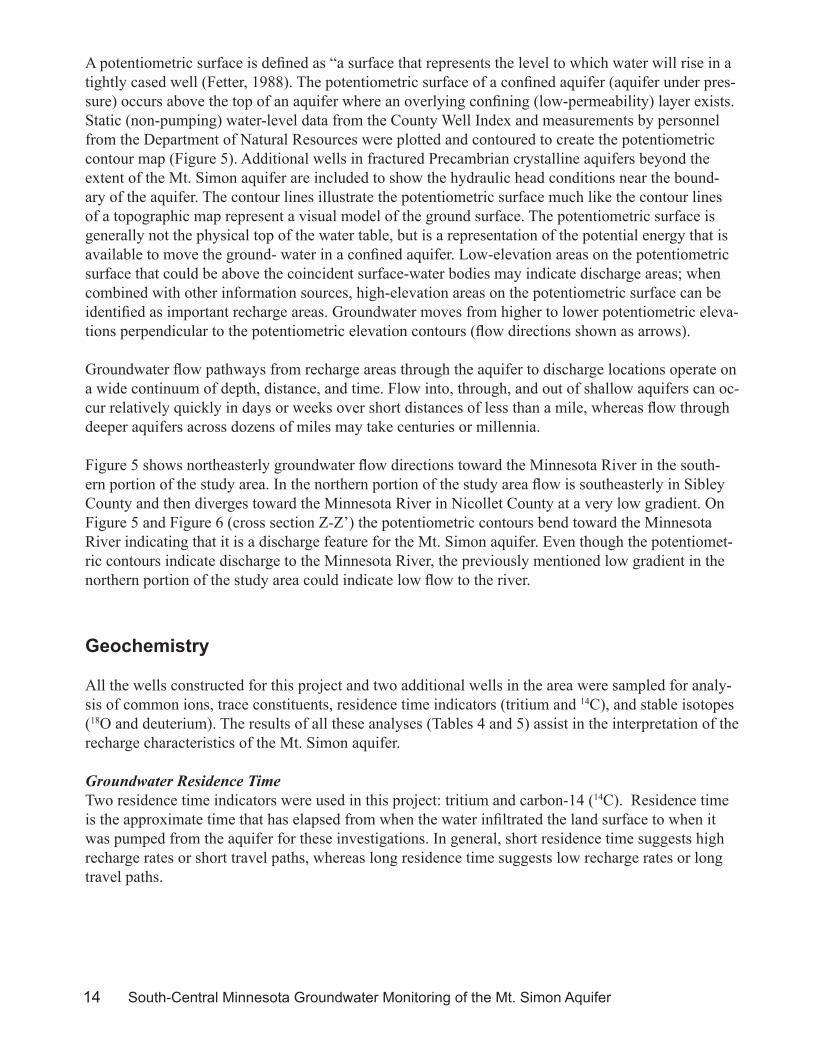
A potentiometric surface is defined as “a surface that represents the level to which water will rise in a tightly cased well (Fetter, 1988). The potentiometric surface of a confined aquifer (aquifer under pres-sure) occurs above the top of an aquifer where an overlying confining (low-permeability) layer exists. Static (non-pumping) water-level data from the County Well Index and measurements by personnel from the Department of Natural Resources were plotted and contoured to create the potentiometric contour map (Figure 5). Additional wells in fractured Precambrian crystalline aquifers beyond the extent of the Mt. Simon aquifer are included to show the hydraulic head conditions near the bound-ary of the aquifer. The contour lines illustrate the potentiometric surface much like the contour lines of a topographic map represent a visual model of the ground surface. The potentiometric surface is generally not the physical top of the water table, but is a representation of the potential energy that is available to move the ground- water in a confined aquifer. Low-elevation areas on the potentiometric surface that could be above the coincident surface-water bodies may indicate discharge areas; when combined with other information sources, high-elevation areas on the potentiometric surface can be identified as important recharge areas. Groundwater moves from higher to lower potentiometric eleva-tions perpendicular to the potentiometric elevation contours (flow directions shown as arrows).
Groundwater flow pathways from recharge areas through the aquifer to discharge locations operate on a wide continuum of depth, distance, and time. Flow into, through, and out of shallow aquifers can oc-cur relatively quickly in days or weeks over short distances of less than a mile, whereas flow through deeper aquifers across dozens of miles may take centuries or millennia.
Figure 5 shows northeasterly groundwater flow directions toward the Minnesota River in the south-ern portion of the study area. In the northern portion of the study area flow is southeasterly in Sibley County and then diverges toward the Minnesota River in Nicollet County at a very low gradient. On Figure 5 and Figure 6 (cross section Z-Z’) the potentiometric contours bend toward the Minnesota River indicating that it is a discharge feature for the Mt. Simon aquifer. Even though the potentiomet-ric contours indicate discharge to the Minnesota River, the previously mentioned low gradient in the northern portion of the study area could indicate low flow to the river.
Geochemistry
All the wells constructed for this project and two additional wells in the area were sampled for analy-sis of common ions, trace constituents, residence time indicators (tritium and 14C), and stable isotopes (18O and deuterium). The results of all these analyses (Tables 4 and 5) assist in the interpretation of the recharge characteristics of the Mt. Simon aquifer.
Groundwater Residence TimeTwo residence time indicators were used in this project: tritium and carbon-14 (14C). Residence time is the approximate time that has elapsed from when the water infiltrated the land surface to when it was pumped from the aquifer for these investigations. In general, short residence time suggests high recharge rates or short travel paths, whereas long residence time suggests low recharge rates or long travel paths.

15South-Central Minnesota Groundwater Monitoring of the Mt. Simon Aquifer
Tritium (3H) is a naturally occurring isotope of hydrogen. Concentrations of this isotope in the atmo-sphere were greatly increased from 1953 through 1963 by above ground detonation of hydrogen bombs (Alexander and Alexander, 1989). This isotope decays at a known rate, with a half-life of 12.43 years. Groundwater samples with concentrations of tritium equal to or greater than 10 tritium units (TU) are considered recent water (mostly recharged in the past 60 years). Concentrations equal to or less than 1 TU are considered vintage water (recharged prior to 1953). Concentrations between these two limits are considered a mixture of recent and vintage water and are referred to as mixed water.
The carbon-14 (14C) isotope, which also occurs naturally, has a much longer half-life than tritium (5730 years). Carbon-14 is used to estimate groundwater residence in a time span from about 100 years to 40,000 years (Alexander and Alexander, 1989).
With one exception, none of the groundwater samples contained detectable tritium concentrations (Table 4) and therefore, the residence time for these samples is greater than approximately 60 years. This is con-sistent with the generally greater depths of the sampled aquifers and general lack of thick surficial sand and gravel in the study area. The one mixed tritium sample was from the shallow well at the Long Lake WA that was screened in a sand and gravel aquifer at a depth of 128 feet.
Figure 7 shows the distribution of 14C residence time values from the shallow wells constructed for this project. These values represent data from aquifers with a wide depth range (70 to 444 feet). This map, therefore, is not intended to show any regional trends or tendencies but is shown to illustrate the wide range of values in these settings. These values are more interesting in comparison to the values discussed below and shown in Figure 8 from the underlying Mt. Simon aquifer.
Figure 8 shows the distribution of 14C residence time values from the Mt. Simon aquifer wells con-structed for this project, two additional Mt. Simon aquifer wells sampled for this project, and Mt. Simon aquifer data from other studies (Lively and others, 1992; Alexander, personal communication). Values in the southern portion of the study area range from 7,000–8,000 years in central Watonwan County to 30,000 years near the Minnesota River following a pattern of increasing age away from central Waton-wan County. The youngest values (8,000–10,000 years) in the northern portion of the study area occur in northeastern Sibley County and also increase in age toward the Minnesota River to the south and east.
The younger 14C residence time values (7,000–8,000 years) roughly correspond to a time not only after the last ice sheet had receded from southern Minnesota, but also after the time when the modern day Minnesota River Valley (Glacial River Warren) ceased to be the main discharge route for the glacial melt water (9,500 years) that was stored in Glacial Lake Agassiz (Wright, 1987). These 14C values and the unique glacial history of the region suggest groundwater in the Mt. Simon aquifer in this region began as precipitation that infiltrated during the post-glacial period. The stable isotope data described in the fol-lowing section provided important corroborating evidence for this conclusion.
Stable Isotopes, 18O and DeuteriumAll groundwater samples collected from the study area were analyzed for stable isotopes of oxygen and hydrogen, the two atoms found in water. Analysis of the results provides an additional tool for character-izing the area groundwater. Isotopes of a particular element have the same number of protons but differ-ent numbers of neutrons. Stable isotopes are not involved in any natural radioactive decay. They are used to understand water sources or the processes affecting them (Kendall, 2003). Commonly used isotopes

16 South-Central Minnesota Groundwater Monitoring of the Mt. Simon Aquifer
for these purposes include oxygen isotopes 16O and 18O and hydrogen isotopes 1H and 2H. The heavy hydrogen (2H) is called deuterium. The mass differences between 16O and 18O or 1H and 2H result in water molecules that evaporate or condense at different rates. Thus the concentrations of these isotopes in water changes (fractionates) during evaporation and precipitation, resulting in different 16O/18O and 1H/2H ratios in rain, snow, rivers, and lakes. The values are expressed as del2H and del18O. The ab-breviation “del” denotes the relative difference from standard mean ocean water and express the rela-tive abundance or the rarer heavy isotopes, del2H and del18O. These values from precipitation water generally plot close to a straight line known as the meteoric water line (Figure 9). The departure of 18O and 2H values from the meteoric water line can indicate evaporation or mixing of water from different sources.
Figure 9 shows a plot of del18O and del2H values from groundwater samples collected in the study area compared to the meteoric water line. Three types of information regarding the origin and history of these water samples can be interpreted from this graph: relative atmospheric temperature during source water precipitation, relative mixing of water from cold and warm sources, and evaporation of source water.
Source Water Temperature and MixingFor the samples that plot along the same slope as the meteoric water line, the samples more depleted in heavy isotopes (samples that plot closer to the bottom left of the graph) suggest water that precipitated from a colder atmosphere (Siegel, 1989). Person et al (2007) provided a compilation of paleohydrologi-cal studies of groundwater systems in North America that were affected by the advance and retreat of the Laurentide ice sheet. He concluded that the range of del18O groundwater values from cold ice or snow melt sources ranges from del -25 to -9. Most values of groundwater samples from south central Minnesota ranged from approximately del -8 to del -10 suggesting a mixture of glacial meltwater and a larger component of post-glacial precipitation. The data are consistent with the younger 14C ages dates (7,000 to 8,000 years) from the post-glacial and post River Warren era as discussed previously.
It is also significant to note that many of the older 14C values in this area are in the range of the last glacial advance in the upper Midwest (12,000 to 24,000 years BP) but the del18O values are just slightly within the range of water from ice melt sources (del-25 to del-9). This apparent discrepancy suggests that these waters are from mixed sources and time periods, indicating a combination of much younger and much older water. Recognizing that all groundwater is a mixture, Mt. Simon 14C residence time values greater than 9,000 or 10,000 years may represent a minimum age in these areas.
Fractionation of Source Water and Evaporative SignaturesDeuterium (2H) is an isotope of hydrogen consisting of a proton and a neutron, whereas hydrogen (1H) consists of a proton. Deuterium, therefore, has approximately twice the mass of common hydrogen. Similarly, oxygen-18 (18O) has more mass than the more common oxygen-16 (16O). Fractionation occurs because of these mass differences. Molecules of water with the more common hydrogen and oxygen are lighter and more readily evaporated, leaving the remaining water more concentrated in the heavier isotopes. As a result, lake water typically shows an evaporative signature (a higher concentra-tion of the heavier isotopes than precipitation). Water that directly infiltrates the ground is not fraction-ated in this manner, so it has a meteoric signature (higher concentration of the lighter, more prevalent isotopes). The effect of this type of fractionation is that isotopic values from samples with an evapora-tive signature will plot along a line with a slope less than the slope of the meteoric water line.

17South-Central Minnesota Groundwater Monitoring of the Mt. Simon Aquifer
On Figure 9 the evaporated types of samples are shown on the right upper portion of the graph (Peter-son unit, Helget Braulick WMA, and the Nicollet Bay unit). These three samples, from buried sand and gravel aquifers, show evidence of water that infiltrated from lakes or wetlands.
The majority of samples plotted in the center portion of the graph along the meteoric water line (Figure 9) suggest sources from post ice-age precipitation (normal rain and snow meltwater) that infiltrated directly into the subsurface and did not reside for long periods in lakes or similar water bodies.
Major IonsSome evidence of distinct source water types and mixing of these waters can be understood by con-sidering the relative abundances of some common cations and anions as ion concentrations plotted as percentages from area groundwater samples. Figure 10 shows the relative abundances of these common ions plotted on a ternary plot. Table 5 also shows the concentrations of these constituents in mg/l. The most common type of water in this area has Ca and Mg (Ca+Mg) as the predominant cation. There is a fairly even distribution between waters containing bicarbonate as the primary anion and waters contain-ing sulfate as the predominant anion. The bicarbonate type of water is common in glacial aquifers of the upper Midwest (Freeze and Cherry, 1979, p. 284) and is derived from dissolution of calcite and dolomite minerals in soil and glacial sediments by infiltrating precipitation. Higher sulfate concentra-tions in the Mt. Simon aquifer tend to occur in the southern and western portions of the study area (Fig-ure 11) where infiltrating water has passed through Cretaceous sandstone and shale layers that contain sulfate minerals such as gypsum and anhydrite.
The data from a few samples plotted on the lower right corner of the cation ternary plot show that some Na/K waters are also present in the area. These Na/K type waters (Mt. Simon aquifer: Norwegian Grove and Flandreau; Sioux Quartzite: Courtland West) may have a partial deep bedrock origin. Other evidence of deep isolated groundwater or upwelling from deep crystalline bedrock sources is suggested by some elevated chloride values of samples collected near the Minnesota River Valley (Figure 12). El-evated chloride values at the Helget Braulick and Peterson unit sites should be dismissed since samples from these wells probably contain some chloride from the chloride disinfectant that was added to these wells during the well construction process.
Trace ElementsAnalysis of groundwater samples for a suite of trace element constituents reveal exceedences of drink-ing water standards for boron (one sample) and arsenic (five samples). A boron concentration of 1,910 ug/l (ppb) was measured in water from the Lake Hanska well that was completed in a Cretaceous sand-stone aquifer. The Minnesota Department of Health (MDH) health risk limit (HRL) for this element is 600 ug/l. This elevated value is not typical of concentrations measured in the rest of the samples which otherwise ranged from 74 to 497 ug/l (Table 4). The reason for the elevated concentration of boron is unknown; however, the most negative 18O value (del -10.27) of all the samples collected in the study area was also detected in the sample from this well which suggests that this aquifer is relatively stag-nant and isolated.
Arsenic concentrations that exceeded the federal drinking water standard of 10 ug/l were detected in samples collected from five wells, three from buried sand and gravel aquifers and two from the Mt. Simon aquifer (Table 4 and Figure 13). Two of the exceedences (Nicollet Bay unit and Helget-Braulick WMA) from buried sand and gravel aquifers also contained water from sources with an evaporative

18 South-Central Minnesota Groundwater Monitoring of the Mt. Simon Aquifer
surface water signature (discussed in the fractionation of source water section). Arsenic in groundwa-ter tends to come from disseminated mineral sources in glacial till (MDH, 2001; Erickson and Barnes, 2005). Arsenic can be released from these minerals into solution by oxygenated water. Infiltrated lake water could be a possible source of oxygenated water resulting in the elevated arsenic concentrations found in these samples.
Two of the elevated arsenic samples were collected from the Mt. Simon aquifer wells at the Peterson unit and the Nicollet Bay unit. Both of these wells are near Swan Lake in Nicollet County, the ap-parent source of water with an evaporative signature sampled at the shallow Nicollet Bay unit well. Elevated arsenic values in the Mt. Simon aquifer may be also due to mobilization of arsenic by oxy-genated lake water that has infiltrated through multiple interconnected layers of glacial sand and till.
Hydrogeology Illustrated by Cross Sections and Hydrographs from Observation Well Nests
A set of 12 geologic cross sections were created for this report to provide location-specific represen-tations of the stratigraphy and geologic structure for each well nest and to provide a hydrogeologic context for the hydrograph and geochemical data. The cross sections were constructed by projecting lithologic, stratigraphic, and well construction information onto the line of each cross section (Figure 3) from within a one kilometer zone on either side of the cross section.
Water level data were plotted to create hydrographs illustrating water elevation changes over time. Hydrographs provide a method of representing large amounts of data from one or more wells. The water elevation hydrographs are provided for each corresponding cross section. Each hydrograph dis-plays the water levels recorded in two wells nested at the same site, the Mt. Simon aquifer well (blue) and the shallower depth well (red). Nested wells are located at the same site within a few feet of each other. On several hydrographs the difference in water elevation is large enough to require the use of a secondary axis. The shallower well information is set on the secondary axis and the corresponding units are indicated on the right side of the hydrograph.
Seasonal high and low water level cycles are apparent on most hydrographs. These are yearly cycles where groundwater levels decline during the summer months and increase during the winter and spring. In many cases both nested wells follow similar trends. Average cumulative precipitation in-creased throughout the period of record for the water level data (Figure 14). A corresponding rise of water levels throughout 2010 is apparent from the hydrographs at several sites and is consistent with the cumulative increases in rainfall for the region compared to normal. Considering the relatively long residence times typical of most aquifers that were sampled for this study most of these water level fluctuations are not caused by rapid infiltration of precipitation (recharge) but a pressure response to the increased volume and weight of additional groundwater in the overlying water table aquifer and shallow buried aquifers (Maliva et al, 2011).

19South-Central Minnesota Groundwater Monitoring of the Mt. Simon Aquifer
The hydrograph data of the nested observation wells, shown on Figures 15b through 26b, show two general patterns of vertical gradients: downward and upward. Most of the hydrograph comparisons show a downward gradient. A downward gradient exists where the groundwater elevation in the shal-lower well is higher than the groundwater elevation in the deeper well. This condition indicates that groundwater will move downward, if a flow pathway is available. Within this group of downward gradient hydrograph pairs most of the hydrographs follow identical although offset patterns (Sibley County Landfill, Peterson Unit, Bergdahl WMA, Case WMA, Madelia WMA, Exceder WMA, and Rooney Run WMA). These identical patterns strongly suggest that fluctuations within both the shallow and Mt. Simon aquifer well pairs are due to pressure effects of changes in the overlying water weight of the water table aquifer. A smaller group of downward gradient nests (Severance Lake WMA, Nicol-let Bay Unit, and Helget Braulick WMA) show shallow aquifer hydrograph patterns that are different from the Mt. Simon aquifer hydrograph pattern suggesting local pumping or surficial influences in the shallow aquifer.
The Courtland West Unit (Figure 19b), Long Lake WA (Figure 24b), and possibly Norwegian Grove WMA (Figure 17b) sites demonstrate locations where upward groundwater movement is apparently oc-curring. At these locations the groundwater elevation from the shallower well is lower than the deeper bedrock groundwater elevations indicating an upward gradient condition. An upward gradient suggests that groundwater from the deeper bedrock will move upward if a flow pathway is available. Upward gradient maybe due to local pumping influences or proximity to major discharge zones such as the Minnesota River.
Cross Section A-A’ and Severence Lake WMA Hydrograph (Figures 15a and b) The Severence Lake WMA is located in northern Sibley County near the subcrop (eastern edge) of the Mt. Simon Sandstone. The shallow well was completed in a buried sand and gravel aquifer that appears to be part of a stack of interspersed and hydraulically connected sand bodies. The hydrograph from this well shows several feet of variation throughout 2010 with low water levels occurring during summer and early fall (high water use period). Water levels recovered beginning late fall and continued through early spring. A similar but more muted pattern is apparent for the Mt. Simon aquifer, suggesting no connection or a very minor connection to the summer pumping that is occurring in the area.
Cross Section B-B’ and Sibley County Landfill Property (Figures 16a and b)The well nest on the Sibley County landfill property in central Sibley County is located near the City of Gaylord. The Gaylord city wells and some domestic wells completed in the same buried sand aquifer as the shallow well are shown northwest of the well nest. The stratigraphy and geochemistry shown on Cross section B-B’ (Figure 16a) suggest a direct hydraulic connection between the buried sand and gravel aquifer in which the shallow well is completed and the Mt. Simon aquifer. The well nest hy-drographs (Figure 16b) show a downward gradient from the buried sand and gravel aquifer. The area stratigraphy, long residence times, and identical water level hydrograph trends suggest that the water level fluctuations are a pressure response to changes in the weight of water in the overlying water table aquifer. Cross Section C-C’ and Norwegian Grove WMA Hydrograph (Figures 17a and b) The Norwegian Grove WMA well nest in northern Nicollet County is located at the eastern edge of the Mt. Simon subcrop. The cross section (Figure 17a) shows the shallow well is completed in a stack of interspersed, and hydraulically connected sand bodies and a nearly direct connection of these buried

20 South-Central Minnesota Groundwater Monitoring of the Mt. Simon Aquifer
sand aquifers to the underlying Mt. Simon aquifer. The hydrographs (Figure 17b) shows a very slight upward gradient from the Mt. Simon to the buried sand and gravel aquifer. The hydraulic connec-tion between the two aquifers, however, may not be very extensive since there is a large difference in groundwater residence time (4,000 years in the shallow aquifer versus 20,000 years in the Mt. Simon aquifer) and aquifer chloride/sodium concentrations.
Cross Section D-D’ and Peterson Unit Hydrograph (Figures 18a and b) The Peterson Unit well nest in central Nicollet County is located near the eastern edge of the Mt. Simon Sandstone subcrop. The aquifer hydrographs (Figure 18a) shows very little fluctuation in water levels (approximately one foot). The buried sand aquifer water levels are about eight feet higher than those of the Mt. Simon aquifer. These water level data and the 14C residence time of 22,000 year of the Mt. Simon aquifer suggest that these aquifers are not directly connected and are both relatively iso-lated.
Cross Section E-E’ and Courtland West/Nicollet Bay unit hydrographs (Figures 19a, b and c) The geologic setting of two well nests (Courtland West unit and Nicollet Bay unit) in south cen-tral Nicollet County and an existing well that was sampled (Flandreau State Park) in eastern Brown County, is shown on this cross section. An upward gradient exists at the Courtland West site, east of the Minnesota River, which may result in upward groundwater flow direction due to the proximity of the river. Upward gradients are commonly found near major rivers where groundwater discharges to the al-luvial aquifer from underlying aquifers locally. West of the Minnesota River a similar upward gradient is suggested by a 14C residence time of 30,000 years and high sodium-chloride concentrations (Table 5 and Figure 12). These chemical characteristics suggest old, isolated groundwater from the underlying crystalline bedrock is moving upward through the thin Mt. Simon aquifer to the base of the Minnesota River alluvium.
At the Nicollet Bay unit location at the east side of the cross section the shallow well is shown complet-ed in a stacked complex of buried sand and gravel aquifers. The graph of stable isotope values (Figure 9) shows that the sample from this well contains some water that had an evaporative signature from a surface water source. The detectable tritium concentration from this sample is also good evidence of focused recharge at this location. The relatively constant water level elevation shown in the hydrograph from this well (Figure 19c) and these chemical characteristics suggest a strong hydraulic connection to a stable surface water source such as Swan Lake. The hydrograph of the Mt. Simon aquifer well at this location appears to show some influence from local pumping possibly from the wells shown on the cross section west of the Nicollet Bay well nest.
Cross Section F-F’ and Helget-Braulick WMA hydrograph (Figures 20a and b) The Helget-Braulick WMA well nest is located in central Brown County near the western edge of the Mt. Simon Sandstone subcrop. The shallow well, completed in a buried sand and gravel aquifer, contained some groundwater tht had an evaporative signature from a surface water source (Figure 9). A very short 14C residence value (500 years) is consistent with this stable isotope data. In addition, the shallow well hydrograph trend follows the precipitation trend of higher than average rainfall during the summer of 2010, also suggesting a hydraulic connection and pressure response to the additional water at or near the surface. The muted but similar hydrograph pattern of the Mt. Simon aquifer well hydro-graph is probably a pressure response.

21South-Central Minnesota Groundwater Monitoring of the Mt. Simon Aquifer
Cross Section G-G’ and Bergdahl WMA hydrograph (Figure 21a and b) The Bergdahl WMA well nest of northeastern Watonwan County and a shallower well completed in Cretaceous sandstone at the SE Lake Hanska WA are shown on this cross section. The deeper well that was planned for the Lake Hanska site was not built since no Mt. Simon Sandstone was found at this site during drilling. Both hydrographs in the Bergdahl WMA well nest show for 2010 a rising pressure response corresponding to a cumulative increase in precipitation in the area.
Cross Section H-H’ and Case WMA hydrograph (Figures 22a and b) The Case WMA well nest located in eastern Watonwan County and an irrigation well that was sampled for this project are shown on this cross section. Some of the youngest Mt. Simon aquifer groundwa-ter in the area was collected from the irrigation well which is located at the eastern edge of the Mt. Simon Sandstone subcrop. The 14C residence time of 7,000 years from this well is actually younger than groundwater that was sampled from the shallower buried sand and gravel aquifer at the Case WMA well nest. This irrigation well sample also contained elevated concentrations of sulfate indicat-ing migration through the overlying sulfate mineral rich Cretaceous sandstone and shale. Both hydro-graphs at the Case WMA well nest show an approximate 4.5 foot pressure response rise in water levels throughout 2010 which corresponds to a cumulative increase in precipitation in the area.
Cross Section I-I’ and Madelia WMA hydrograph (Figures 23a and b) The Madelia WMA well nest located in eastern Watonwan County is shown on the eastern side of this cross section. The Mt. Simon aquifer sample from this location also had one of the youngest 14C resi-dence time values, suggesting a closer proximity to the eastern edge of the Mt. Simon sandstone sub-crop than is suggested by this cross section or Figure 4. Both hydrographs at the Madelia WMA well nest show an approximate 4.5 foot pressure response rise in water levels throughout 2010 correspond-ing to a cumulative increase in precipitation in the area.
Cross Section J-J’ and Long Lake WA hydrograph (Figures 24a and b) The Long Lake WA well nest located in south central Watonwan County is shown on the western side of this cross section possibly near the center of the Mt. Simon Sandstone subcrop. Similar to the sites described on cross sections H-H’ and I-I’, the 14C residence time value of the Mt. Simon aquifer at this location is among the youngest (8,000 years). Elevated sulfate concentrations indicate groundwater migration through the overlying Cretaceous sandstone and shale.
The shallow well was completed in a buried sand and gravel aquifer just above the Cretaceous sand-stone and shale. The gradient between the shallow aquifer and the Mt. Simon aquifer is upward (lower hydraulic head in the shallow aquifer compared to the deeper aquifer) possibly due to intensive pump-ing of the shallow buried aquifers from domestic wells surrounding Long Lake. The approximate 1.5 to 2.5 foot rise of water levels in both wells throughout 2010 corresponds to a cumulative increase in precipitation in the area.
Cross Section K-K’ and Exceder WMA hydrograph (Figures 25a and b) The Exceder WMA well nest, located in north central Martin County, is shown near the center of this cross section. The approximate two-foot pressure response rise of water levels in both wells throughout 2010 corresponds to a cumulative increase in precipitation in the area.

22 South-Central Minnesota Groundwater Monitoring of the Mt. Simon Aquifer
Cross Section L-L’ and Rooney Run WMA hydrograph (Figures 26a and b)The bedrock geology of the Rooney Run area is relatively unknown. The top of the Mt. Simon Sand-stone at the DNR observation well site was deeper than the top of the Mt. Simon Sandstone at wells drilled in the Welcome area (Figure 26a). Therefore, a fault is shown on cross section L-L’ northwest of Welcome to account for this elevation difference. Southwick (2002) also shows a fault in this area described as an “Inferred fault, mapped beneath the Sioux Quartzite or Paleozoic strata.” The hydro-graphs of the buried sand and gravel and Mt. Simon wells show very little fluctuation during 2010 and are difficult to interpret without a longer period of record.
Paleohydrology and Recharge Estimates
Data and interpretations generated by this project provide some basis for a general estimate of ground-water recharge through overlying glacial sediments and Cretaceous formations to the Mt. Simon Sand-stone subcrop in south central Minnesota. In addition to improving understanding of the aquifer bound-aries, thickness, permeability, and extent of overlying confining units, basic data have been generated regarding the residence time of groundwater in the Mt. Simon aquifer and its source water characteristics.
The 7,000-8,000 year residence time of Mt. Simon aquifer groundwater in the region (see Figure 27, Watonwan County and adjoining areas and northern Sibley County near the City of Arlington) and development of post-glacial drainage conditions in the Minnesota River Valley at approximately 9,000 years BP (before present) suggests the current flow conditions toward the valley and slow recharge of the aquifer began at approximately that time. Prior to that time the much larger volume of water flowing through the valley as glacial River Warren would have created higher head conditions in that area and a lower gradient that would have inhibited flow toward the valley in the Mt. Simon and over-lying aquifers. Siegel (1989) suggests that flow in the Mt. Simon aquifer during the glacial maximum (16,000-14,000 years BP) was easterly toward the ancestral Mississippi River.
A conceptual model of recharge to the Mt. Simon subcrop is based on geochemical data shown on the generalized cross section Z-Z’ (Figure 28) which extends from the Long Lake WA site in southwestern Watonwan County to the North Star WMA observation well in the Minnesota River Valley. This cross section is drawn perpendicular to the potentiometric contours of the Mt. Simon aquifer (Figure 8) and is meant to represent a flow path from the recharge areas southwest of the Minnesota River to the Min-nesota discharge area.
On cross section Z-Z’ 14C residence times are younger in areas to the southwest in the Mt. Simon aqui-fer and overlying aquifers. Higher sulfate concentrations in the Mt. Simon aquifer in the southwest in-dicate downward groundwater flow through the overlying Cretaceous formations. Slightly higher chlo-ride concentrations have been detected in wells closer to the discharge area suggesting some upward migration of older water from Precambrian crystalline bedrock. Finally, the least negative (warmer) del 18O values are found in Mt. Simon wells on the left portion (upgradient) of the cross section and in the shallower wells, whereas the more negative del 18O values (colder) were found in wells on the right (downgradient) portion of the cross section.

23South-Central Minnesota Groundwater Monitoring of the Mt. Simon Aquifer
Southern Area RechargeA conceptual recharge model based on this information is shown in Figure 29. The groundwater resi-dence times of most of the Mt. Simon wells are assumed to be an average value of age-stratified water in the well. Actual values from discrete intervals within the wells might vary from top to bottom. There-fore, an assumed 5,000 year value contour was placed near the top of the Mt. Simon aquifer for the wells in the “post-glacial recharge” area. The depth to the top of this contour in this area ranges from approximately 350 to 450 feet. Assuming an average depth of 400 feet (12,192 cm), an average porosity of the material overlying the Mt. Simon at 20 %, the amount of recharge moving downward to the top of the Mt. Simon aquifer would be approximately 0.49 cm/year. The area labeled “post-glacial recharge” (Figure 27) is approximately 960 square km. The volume of recharge across this area would be approxi-mately 4.7 million cubic meters/year or about 1.2 billion gallons/year.
Northern Area RechargeA similar recharge estimate of the Mt. Simon aquifer for the eastern portions of Nicollet and Sibley Counties (area north and west of the Minnesota River) is more difficult since only a small portion of the area west of the City of Arlington and the Severance Lake WMA is shown as post-glacial recharge (Figure 27). In most of this area 14C residence time values are approximately three times older than the youngest values southwest of the Minnesota River. In general, groundwater recharge of the Mt. Simon in the northern portion of this region (north and west of the Minnesota River) is probably lower than in the southern part of this region (south of the Minnesota River).
2009 Groundwater Appropriation
Southern Area AppropriationFor this appropriation discussion the southern area is defined as a triangular area that extends from the southernmost well nest (Rooney Run WMA) to Mankato and along the Minnesota River to New Ulm (Figure 30). Mt. Simon aquifer groundwater in the southern area is currently used by permitted (large capacity) municipal wells, agricultural processing wells, and irrigation wells (DNR web page). The DNR 2009 reported use data indicate approximately 2.2 billion gallons were pumped out of the Mt. Simon aquifer in this area. However, the actual volume pumped from just the Mt. Simon aquifer is less since some of the older municipal wells in the area are also open to overlying aquifers. The Mt. Simon aquifer annual pumped volume, therefore, may be more than the recharge described in the previous sec-tion. Permitted volumes (volume of water that the users are allowed to pump) for appropriators in this area are approximately 4.7 billion gallons per year.
Northern Area AppropriationThe northern area is defined as the eastern parts of Nicollet and Sibley Counties. Mt. Simon ground-water in the northern area is currently used by permitted (large capacity) municipal wells, agricultural processing wells, and crop irrigation wells, and golf course irrigation wells (DNR web page). The DNR 2009 reported use data indicate approximately 1.1 billion gallons were pumped out of the Mt. Simon aquifer in this area. As in the southern area, the actual volume pumped from just the Mt. Simon aquifer is less since some of the older municipal wells in the area are also open to overlying aquifers. Permitted volumes for appropriators in this area are approximately 1.9 billion gallons per year.

24 South-Central Minnesota Groundwater Monitoring of the Mt. Simon Aquifer
Conclusions
The results of this project suggest that Mt. Simon aquifer groundwater use in the study area, for the most recent period (2009), may be more than the replacement rate along the Mt. Simon Sandstone subcrop. Continued monitoring of the observation wells in this region should help determine if more water is being used compared to recharge. A major accomplishment of this project is the creation of a network of observation well nests along the western margin of the Mt. Simon Sandstone that is considered an important recharge area for the aquifer. Long term water level and geochemistry data from these wells will enable future hydrologists to evaluate the local and regional effects of Mt. Simon aquifer groundwater pumping in the region. In addition, this project demonstrated the value of continuous, nested water level measurements, groundwater chemistry, and residence time data in constructing conceptual models of groundwater flow and recharge.

25South-Central Minnesota Groundwater Monitoring of the Mt. Simon Aquifer
References
Alexander, S.C., and Alexander, E.C., Jr., 1989, Residence times of Minnesota groundwaters: Minnesota Academy of Sciences Journal, v. 55, no.1, p. 48-52.
Alexander, S.C., personal communication, e-mail correspondence received May 26, 2009 containing 14C and general chemistry information from wells in southeastern Minnesota.
Anderson, Julia R, 2010, Bedrock geology, Plate 2 of Geologic Atlas in Blue Earth County, Minnesota: Minnesota Geological Survey County Geologic Atlas C-26 (in progress), scale 1:100,000.
Chandler, Val. W. and Mossler, John H., 2009, Bedrock Geology, Plate 2 of Geologic Atlas in Mcleod County, Minnesota: Minnesota Geological Survey County Geologic Atlas Geologic Atlas of McLeod County, C-20, 6 pls., scale 1:100,000.
Driscoll, Fletcher G., 1986, Groundwater and wells (2d ed.): St. Paul, Minnesota, Johnson Screens, 1089 p.
Erickson, M.L., and Barnes, R.J., 2005, Glacial sediment causing regional-scale elevated arsenic in drinking water: Ground Water, November-December, v. 43, no. 6, p. 796–805.
Fetter, C.W., 1988, Applied hydrogeology (2d ed.): Columbus, Ohio, Merrill, 592 p.
Freeze, R. Allan, and Cherry, John A., 1979, Groundwater, Englewood Cliffs, NJ, Prentice Hall, Inc., 604 p.
Jirsa, Mark A. and others, 2011, Geologic Map of Minnesota Bedrock Geology, Minnesota Geological Survey State Map Series S-21, scale 1:500,000.
Kendall, C. and Doctor, D., 2003, Stable isotope applications in Hydrologic studies, Holland, H.D. and Turekian, K.K., editors, chap. 11 of v. 5, Surface and ground water, weathering, and soils, in Treatise on geochemistry: Amsterdam, The Netherlands, Elsevier, Inc., p. 319-364.
Lively, Richard S. et al, 1992, Radium in the Mt. Simon-Hinckley aquifer, east-central and southeastern Minnesota, Information Circular 36, Minnesota Geological Survey, 58 p.
Maliva, Robert G. et al, 2011, Confined aquifer loading: Implications for groundwater management, Groundwater, May-June 2011, vol. 49, No. 3, p. 302-304.
Minnesota Department of Health, 2001, Minnesota arsenic study (MARS): St. Paul, Minnesota Department of Health, 3 p.
Minnesota Department of Natural Resources, 2004, Selected aquifer parameters for groundwater provinces – Groundwater Provinces web page, accessed at < http://www.dnr.state.mn.us/groundwater/ provinces/data.html>.
Minnesota Department of Natural Resources, Water use – Water Appropriations Permit Program web page, accessed at <http://www.dnr.state.mn.us/waters/watermgmt_section/appropriations/wateruse.html>.

26 South-Central Minnesota Groundwater Monitoring of the Mt. Simon Aquifer
Mossler, J.H., 1992, Sedimentary rocks of Dresbachian age (Late Cambrian), Hollandale embayment, southeastern Minnesota: Minnesota Geological Survey Report of Investigations 40, 71 p.
Mossler, J.H., 2008, Paleozoic stratigraphic nomenclature for Minnesota: Minnesota Geological Survey Report of Investigations 65, 76 p., 1 pl.
Mossler, J.H., and V.W. Chandler, 2009, Bedrock geology, Plate 2 in Geologic Atlas of Carver County, Minnesota: Minnesota Geological Survey County Atlas C-21, 5 pls., scale 1:100,000.
Mossler, J.H., and V.W. Chandler, 2010, Bedrock geology, Plate 2 in Geologic Atlas of Sibley County, Minnesota: Minnesota Geological Survey County Geologic Atlas C-24 (in progress).
Mossler, J.H., and V.W. Chandler, 2010, Bedrock geology, Plate 2 in Geologic Atlas of Nicollet County, Minnesota: Minnesota Geological Survey County Geologic Atlas C-25 (in progress).
Person, M., J. McIntosh, V. Bense, and V. H. Remenda, 2007, Pleistocene hydrology of North America: The role of ice sheets in reorganizing groundwater flow systems, Rev. Geophys., 45, RG3007, doi:10. 1029/2006RG000206.
Siegel, D.I., 1989, Geochemistry of the Cambrian-Ordovician aquifer system in the northern Midwest, United States: U.S. Geological Survey Professional Paper 1405-D, 76 p.
Southwick, D.L., 2002, M-121 Geologic map of pre-Cretaceous bedrock in southwest Minnesota. Minnesota Geological Survey map series M-121, scale 1:250,000
Wright, H. E., 1987, Quaternary History of Minnesota in Geology of Minnesota, Minnesota Geological Survey, University of Minnesota, St. Paul, Minnesota p. 515-548.

27South-Central Minnesota Groundwater Monitoring of the Mt. Simon Aquifer
Tables

28 South-Central Minnesota Groundwater Monitoring of the Mt. Simon Aquifer
Tabl
e 1
- Wel
l Sum
mar
y
Dep
ths
ofTo
p ca
sing
Gro
und
open
hol
e or
DN
RM
ND
rillin
gU
TMU
TMel
evat
ion
elev
atio
nsc
reen
edD
epth
toO
B#
Uni
que
Cou
nty
Site
Nam
eFo
rmat
ion
Met
hod
Dep
thEa
stin
gN
orth
ing
(ft a
bove
msl
)(ft
abo
ve m
sl)
inte
rval
(ft)
wat
er (f
t)
5200
176
8263
Nic
olle
tN
icol
let B
ayC
MTS
DR
/RC
519
4009
38.2
0349
0280
7.50
399
0.66
998
8.37
041
0-51
915
7.07
5200
276
8264
Nic
olle
tN
icol
let B
ayQ
BA
AM
R19
840
0936
.287
4902
804.
578
990.
761
988.
448
188-
198
145.
6052
003
7682
61N
icol
let
Cou
rtlan
d W
est
PM
SX
DR
/RC
463
3920
95.6
1649
0556
5.04
799
6.32
199
2.73
035
6-46
310
8.87
5200
476
8262
Nic
olle
tC
ourtl
and
Wes
tQ
BA
AM
R20
239
2095
.445
4905
567.
941
994.
935
992.
493
195-
205
108.
2152
005
7704
49N
icol
let
Pet
erso
nC
MTS
DR
/RC
545
3979
39.2
449
1111
0.02
499
3.46
799
1.33
339
0-54
516
3.92
5200
677
0450
Nic
olle
tP
eter
son
QB
AA
MR
223
3979
37.8
5249
1110
6.35
993.
752
991.
497
215-
223
156.
1252
007
7704
44N
icol
let
Nor
weg
ian
Gro
veC
MTS
DR
/RC
537
4056
53.7
1749
2301
8.88
598
1.18
897
8.37
839
0-53
715
2.71
5200
877
0445
Nic
olle
tN
orw
egia
n G
rove
QB
AA
MR
260
4056
55.5
6449
2301
5.73
598
0.87
697
8.34
924
5-25
315
2.37
0801
276
8259
Bro
wn
Heg
et B
raul
ick
CM
TSD
R/R
C28
236
9435
.816
4896
564.
649
1021
.947
1019
.757
267-
282
40.1
008
013
7682
60B
row
nH
eget
Bra
ulic
kQ
BA
AR
S70
.536
9438
.015
4896
564.
977
1021
.900
1019
.371
65.5
-70.
526
.23
seal
ed76
0651
Bro
wn
Lake
Han
ska
CM
TSM
R31
637
4745
.213
4885
215.
946
1004
.311
1004
.161
seal
edse
aled
0801
476
0692
Bro
wn
Lake
Han
ska
KR
ET
MR
164
3747
43.7
3848
8521
8.59
910
09.4
1410
03.5
8215
5-16
43.
5283
017
7606
87W
aton
wan
Cas
eC
MTS
MR
672
3894
50.7
748
7199
1.53
310
41.9
2210
38.8
0349
5-67
255
.30
8301
876
0686
Wat
onw
anC
ase
QB
AA
MR
206
3894
53.6
8248
7198
9.96
910
41.9
6710
39.1
6019
7-20
638
.62
8301
976
0689
Wat
onw
anM
adel
iaC
MTS
MR
648
3821
01.0
4848
7009
3.55
510
67.0
1110
63.8
4249
5-64
848
.65
8302
076
0688
Wat
onw
anM
adel
iaK
RE
TM
R12
038
2101
.235
4870
090.
087
1067
.303
1064
.408
109-
119
28.1
083
021
7606
91W
aton
wan
Ber
gdah
lC
MTS
MR
479
3885
08.6
9948
8326
7.00
299
9.80
299
6.85
741
5-47
940
.31
8302
276
0690
Wat
onw
anB
ergd
ahl
QB
AA
MR
129
3885
04.0
7448
8326
7.28
010
02.7
5710
00.7
1211
9-12
936
.67
8302
377
0427
Wat
onw
anLo
ng L
ake
CM
TSD
R/R
C54
736
5169
.986
4862
854.
602
1131
.407
1129
.111
373-
547
32.6
983
024
7704
39W
aton
wan
Long
Lak
eQ
BA
AM
R12
836
5174
.415
4862
852.
802
1131
.731
1129
.249
118-
128
32.5
946
006
7681
25M
artin
Exc
eder
C
MTS
MR
680
3726
99.8
5948
5131
8.45
011
76.8
5611
74.0
1549
7-68
075
.24
4600
776
8139
Mar
tinE
xced
er
KR
ET
MR
232
3727
00.1
5948
5132
2.78
711
76.9
6611
74.0
8622
2-23
281
.95
4600
877
1163
Mar
tinR
oone
y R
unC
MTS
MR
718
3667
04.5
2248
4343
1.03
012
03.8
7312
01.2
3664
0-71
869
.06
4600
977
1161
Mar
tinR
oone
y R
unQ
BA
AM
R44
436
6705
.458
4843
427.
544
1204
.317
1201
.381
434-
444
68.1
272
000
7704
40S
ible
yS
ible
y C
o. L
FC
MTS
MR
*57
540
5883
.249
4932
926.
374
995.
742
993.
624
460-
575
126.
9072
001
7704
41S
ible
yS
ible
y C
o. L
FQ
BA
AM
R43
040
5888
.095
4932
926.
352
996.
049
993.
974
420-
430
126.
7372
002
7704
42S
ible
yS
ever
ance
Lak
eC
MTS
DR
/RC
630
4106
98.7
8949
4736
9.75
610
10.6
4810
08.5
2945
8-63
014
4.23
7200
377
0443
Sib
ley
Sev
eran
ce L
ake
QB
AA
DR
/RC
280
4106
96.3
1749
4736
9.95
510
09.9
7710
08.1
8227
2-28
088
.32
Dril
ling
met
hods
:M
R =
mud
rota
ryQ
BA
A =
Qua
tern
ary
burie
d aq
uife
rC
MTS
= C
ambr
ian
Mt.
Sim
on s
ands
tone
DR
/RC
= d
ual r
otar
y/re
vers
e ci
rcul
atio
nK
RE
T =
Cre
tace
ous
sand
ston
eP
MS
X =
Pre
cam
bria
n S
ioux
qua
rtzite

29South-Central Minnesota Groundwater Monitoring of the Mt. Simon Aquifer
Tabl
e 2
- Spe
cific
Cap
acity
and
Wat
er L
evel
Dat
a Su
mm
ary
Dep
th to
Stat
icst
atic
wat
erw
ater
Pu
mpe
dAv
erag
eW
ater
leve
lSp
ecifi
cD
ate
M
Nfr
om to
pel
evat
ion
Pum
ping
volu
me
pum
ping
dr
awdo
wn
capa
city
sam
pled
uniq
ueC
ount
ySi
te n
ame
Form
atio
nca
sing
(ft)
(ft a
bove
msl
)(m
inut
es)
(gal
lons
)ra
te (g
pm)
(feet
)(g
pm/d
raw
dow
n)
10/7
/200
977
0442
Sib
ley
Sev
eran
ce L
ake
CM
TS14
4.18
866.
468
156
1240
8.0
1.22
6.5
10/7
/200
977
0443
Sib
ley
Sev
eran
ce L
ake
QB
AA
88.7
892
1.19
778
620
7.9
0.86
9.2
10/8
/200
977
0440
Sib
ley
Sib
ley
Co.
LF
CM
TS12
6.95
868.
792
114
970
8.5
1.69
5.0
10/8
/200
977
0441
Sib
ley
Sib
ley
Co.
LF
QB
AA
126.
7486
9.30
970
590
8.4
0.30
28.0
10/8
/200
977
0444
Nic
olle
tN
orw
egia
n G
rove
CM
TS15
2.38
828.
808
107
880
8.2
1.18
7.0
10/9
/200
977
0445
Nic
olle
tN
orw
egia
n G
rove
QB
AA
152.
2582
8.62
644
310
7.1
0.88
8.0
10/9
/200
977
0449
Nic
olle
tP
eter
son
CM
TS16
3.69
829.
777
120
834
7.0
1.22
5.7
10/9
/200
977
0450
Nic
olle
tP
eter
son
QB
AA
155.
9483
7.81
240
326
8.2
2.66
3.1
10/1
3/20
0976
8261
Nic
olle
tC
ourtl
and
Wes
tP
MS
X10
9.65
886.
670
9012
61.
418
6.25
0.00
7510
/9/2
009
7682
62N
icol
let
Cou
rtlan
d W
est
QB
AA
108.
5788
6.36
539
320
8.1
0.69
11.8
10/1
4/20
0976
8263
Nic
olle
tN
icol
let B
ayC
MTS
157.
7383
2.94
057
1200
21.2
8.27
2.6
10/1
4/20
0976
8264
Nic
olle
tN
icol
let B
ayQ
BA
A14
6.52
844.
240
1325
020
4.8
4.2
10/1
4/20
0976
8259
Bro
wn
Heg
et B
raul
ick
CM
TS40
.71
981.
237
103
230
263
0.03
610
/14/
2009
7682
60B
row
nH
eget
Bra
ulic
kQ
BA
A25
.95
995.
950
2933
711
.732
.00.
367
10/1
5/20
0976
0691
Wat
onw
anB
ergd
ahl
CM
TS42
.03
957.
770
3694
426
22.8
1.1
10/1
4/20
0976
0690
Wat
onw
anB
ergd
ahl
QB
AA
38.4
596
4.30
720
536
2690
.20.
310
/15/
2009
7606
87W
aton
wan
Cas
eC
MTS
57.2
098
4.72
240
1040
264.
75.
510
/15/
2009
7606
86W
aton
wan
Cas
eQ
BA
A40
.10
1001
.867
3893
025
8.7
2.8
10/1
5/20
0976
0689
Wat
onw
anM
adel
iaC
MTS
50.4
310
16.5
8162
1610
267.
23.
610
/15/
2009
7606
88W
aton
wan
Mad
elia
KR
ET
29.4
010
37.9
0323
627
275.
35.
110
/15/
2009
7704
27W
aton
wan
Long
Lak
eC
MTS
32.4
910
98.9
1774
1887
263.
86.
710
/15/
2009
7704
39W
aton
wan
Long
Lak
eQ
BA
A32
.70
1099
.031
2358
625
11.3
2.2
10/1
6/20
0976
8125
Mar
tinE
xced
er
CM
TS76
.38
1100
.476
6415
0323
1.8
13.1
10/1
6/20
0976
8139
Mar
tinE
xced
er
KR
ET
63.2
011
13.7
6648
967
2016
.71.
210
/26/
2009
7711
63M
artin
Roo
ney
Run
CM
TS69
.06
1134
.813
6510
7017
12.5
1.3
10/2
6/20
0977
1161
Mar
tinR
oone
y R
unQ
BA
A68
.12
1136
.197
5312
7024
12.6
1.9
10/2
8/20
0976
0692
Bro
wn
Lake
Han
ska
KR
ET
4.33
1005
.084
5717
13
0.6
4.8
11/2
4/20
0913
2275
Wat
onw
an83
012
CM
TS8.
8910
25.8
716
1440
090
0na
na10
/26/
2009
4053
38B
row
nFl
andr
au S
PC
MTS
nana
150
450
3na
na
QB
AA
= Q
uate
rnar
y bu
ried
aqui
fer
CM
TS =
Cam
bria
n M
t. S
imon
san
dsto
ne
KR
ET
= C
reta
ceou
s sa
ndst
one
PM
SX
= P
reca
mbr
ian
Sio
ux q
uartz
ite

30 South-Central Minnesota Groundwater Monitoring of the Mt. Simon Aquifer
Tabl
e 3
Fie
ld S
ampl
e C
olle
ctio
n an
d H
andl
ing
Det
ails
Para
met
erLa
bSa
mpl
e co
ntai
ner
Hea
d sp
ace
Rin
seFi
lter
Pres
erva
tive
Ref
riger
atio
nSh
elf l
ifeFi
eld
dupl
icat
eFi
eld
blan
kSt
orag
e du
plic
ate
Triti
umW
ater
loo
500
ml,
HD
PEye
sN
Ono
nono
long
1 fo
r eve
ry 2
0no
neye
s
18O
, D
eute
rium
Wat
erlo
o60
ml,
HD
PEye
sN
Ono
nono
long
1 fo
r eve
ry 2
0no
neye
s
Cat
ions
U o
f M15
ml,
Fish
erbr
and
BLU
E ca
p
yes
yes
*ye
s1
drop
6N
HC
lye
s2-
3 w
eeks
1 fo
r eve
ry 2
01
for e
very
20
****
no
Anio
nsU
of M
50 m
l, Ar
gos
BLAC
K **
*
yes
yes
*ye
sno
yes
2-3
wee
ks1
for e
very
20
1 fo
r eve
ry 2
0 **
**no
Trac
e co
nstit
uent
sU
of M
15 m
l, Sa
rste
dt
RED
cap
yes
yes
*ye
s5
drop
s
15N
HN
O3
yes
2-3
wee
ks1
for e
very
20
1 fo
r eve
ry 2
0 **
**no
Alka
linity
onsi
te50
0 m
l, pl
astic
NO
yes
**no
noYe
s, if
not
an
alyz
ed
onsi
te
24-4
8 ho
urs
none
none
no
14C
U o
f M30
gal
lon
barr
elye
sno
yes
NH
4OH
to p
H
8.5
noye
ars
none
none
no
* R
inse
the
bottl
e on
ce w
ith F
ILTE
RE
D s
ampl
e w
ater
prio
r to
colle
ctin
g th
e sa
mpl
e. R
insi
ng m
eans
fill
the
bottl
e w
ith s
ampl
e w
ater
(FIL
TER
ED
if s
ampl
e is
filte
red)
and
then
pou
r the
con
tent
s ou
t ove
r the
cap
.
***
Fill
50 m
l ani
on b
ottle
unl
ess
filte
ring
is v
ery
diffi
cult.
Bot
tle m
ust b
e at
leas
t 1/3
full.
****
Use
DI w
ater
from
sm
all b
ottle
for f
ield
bla
nks
(NO
T TH
E C
AR
BO
Y).
Pou
r DI w
ater
into
the
back
of t
he s
yrin
ge w
hen
the
plun
ger i
s re
mov
ed. F
ill b
ottle
s th
roug
h fil
ter.
** R
inse
the
bottl
e th
ree
times
with
sam
ple
wat
er p
rior t
o co
llect
ing
the
sam
ple.
Fill
bot
tle s
ubm
erge
d w
ith c
ap in
han
d. S
eal b
ottle
sub
mer
ged
ensu
ring
no re
mna
nt b
ubbl
es.

31South-Central Minnesota Groundwater Monitoring of the Mt. Simon Aquifer
Tabl
e 4
Res
iden
ce ti
me
indi
cato
rs, s
tabl
e is
otop
es, a
nd s
elec
ted
trac
e el
emen
ts
Trac
e el
emen
ts**
Res
iden
ce ti
me
indi
cato
rsSt
able
isot
opes
****
MN
uni
que
Site
nam
eC
ount
yFo
rmat
ion
Dep
th (f
t)D
ate
sam
pled
AsB
14C
(yea
rs)
Triti
um**
*D
eute
rium
18O
0040
5338
Flan
drau
Sta
te P
ark
Brow
nC
MTS
200
10/2
6/20
090.
1989
30,0
00<0
.8-6
8.61
-9.9
500
7606
92La
ke H
ansk
a W
MA
Brow
nKr
et16
410
/28/
2009
0.13
1910
11,0
00<0
.8-6
8.69
-10.
2700
7682
59H
elge
t-Bra
ulic
k W
MA
Brow
nC
MTS
284
10/1
4/20
090.
2936
113
,000
<0.8
-63.
42-8
.56
0076
8260
Hel
get-B
raul
ick
WM
ABr
own
QBA
A70
.510
/14/
2009
41.2
376
500
<0.8
-50.
23-6
.39
0076
8125
Exce
der W
MA
Mar
tinC
MTS
680
10/1
6/20
090.
3717
313
,000
<0.8
-69.
97-9
.85
0076
8139
Exce
der W
MA
Mar
tinKR
ET23
110
/16/
2009
0.44
272
11,0
00<0
.8-6
5.92
-9.1
100
7711
61R
oone
y R
un W
MA
Mar
tinQ
BAA
444
10/2
6/20
093.
7833
58,
000
<0.8
-66.
69-9
.88
0077
1163
Roo
ney
Run
WM
AM
artin
CM
TS71
810
/26/
2009
0.61
193
10,0
00<0
.8-6
9.42
-9.7
000
7682
61C
ourtl
and
Wes
t Uni
t*N
icol
let
PMSX
463
10/9
/200
90.
2357
1N
A<0
.8-7
2.7
-9.8
100
7682
62C
ourtl
and
Wes
t Uni
t*N
icol
let
QBA
A20
210
/9/2
009
1.45
742,
300
<0.8
-54.
04-7
.72
0076
8263
Nic
olle
t Bay
Uni
t*N
icol
let
CM
TS47
410
/14/
2009
44.2
152
18,0
00<0
.8-6
5.90
-9.6
600
7682
64N
icol
let B
ay U
nit*
Nic
olle
tQ
BAA
198
10/1
4/20
0914
.311
4R
ecen
t<0
.8-4
0.89
-4.8
400
7704
44N
orw
egia
n G
rove
WM
AN
icol
let
CM
TS54
010
/8/2
009
1.93
497
20,0
00<0
.8-6
6.42
-9.5
900
7704
45N
orw
egia
n G
rove
WM
AN
icol
let
QBA
A26
010
/9/2
009
1.75
452
4,00
0<0
.8-6
4.82
-8.6
500
7704
49Pe
ters
on U
nit*
Nic
olle
tC
MTS
545
10/9
/200
922
.889
22,0
00<0
.8-6
0.05
-8.2
300
7704
50Pe
ters
on U
nit*
Nic
olle
tQ
BAA
223
10/9
/200
91.
3732
28,
000
<0.8
-56.
77-7
.45
0077
0440
Sibl
ey C
o La
ndfil
lSi
bley
CM
TS57
510
/8/2
009
2.41
336
17,0
00<0
.8-6
7.46
-9.7
500
7704
41Si
bley
Co
Land
fill
Sibl
eyQ
BAA
430
10/8
/200
90.
3634
418
,000
<0.8
-67.
27-1
0.09
0077
0442
Seve
ranc
e La
ke W
MA
Sibl
eyC
MTS
630
10/7
/200
91.
8824
110
,000
<0.8
-66.
70-9
.28
0077
0443
Seve
ranc
e La
ke W
MA
Sibl
eyQ
BAA
280
10/7
/200
90.
4219
25,
000
<0.8
-61.
30-8
.88
0013
2275
Dar
rin B
ococ
kW
aton
wan
CM
TS48
411
/24/
2009
0.21
357
7,00
0<0
.8-5
8.41
-9.1
500
7606
86C
ase
WM
AW
aton
wan
QBA
A20
910
/15/
2009
0.26
317
9,00
0<0
.8-6
5.65
-9.0
700
7606
87C
ase
WM
AW
aton
wan
CM
TS67
210
/15/
2009
0.1
213
10,0
00<0
.8-6
6.38
-9.3
600
7606
88M
adel
ia W
MA
Wat
onw
anQ
BAA
120
10/1
5/20
095.
1118
34,
000
<0.8
-63.
67-9
.04
0076
0689
Mad
elia
WM
AW
aton
wan
CM
TS64
810
/15/
2009
0.37
244
7,00
0<0
.8-6
5.18
-9.1
800
7606
90Be
rgda
hl W
MA
Wat
onw
anQ
BAA
129
10/1
4/20
0910
.326
08,
000
<0.8
-65.
96-9
.19
0076
0691
Berg
dahl
WM
AW
aton
wan
CM
TS47
910
/15/
2009
0.13
225
20,0
00<0
.8-6
7.30
-9.3
900
7704
27Lo
ng L
ake
WA
Wat
onw
anC
MTS
547
10/1
5/20
091.
6746
48,
000
<0.8
-61.
71-8
.64
0077
0439
Long
Lak
e W
AW
aton
wan
QBA
A12
810
/15/
2009
5.27
295
2,60
02.
9-5
8.81
-8.3
1*p
art o
f Sw
an L
ake
WM
A**
** d
elta
val
ues
repo
rted
in u
nits
Q
BAA
= Q
uate
rnar
y bu
ried
aqui
fer
CM
TS =
Cam
bria
n M
t. Si
mon
San
dsto
ne**
ug/
l (pa
rts p
er b
illio
n)pe
r tho
usan
d re
lativ
e to
sta
ndar
dKR
ET =
Cre
tace
ous
sand
ston
ePM
SX =
Pre
cam
bria
n Si
oux
Qua
rtzite
*** t
ritiu
m u
nits
(TU
), <
mea
ns n
ot d
etec
ted
NA
= no
t ana
lyze
d

32 South-Central Minnesota Groundwater Monitoring of the Mt. Simon Aquifer
Tabl
e 5
Sel
ecte
d an
ion
and
catio
n da
ta
Anio
ns m
g/l
Cat
ions
mg/
lM
N u
niqu
eSi
te n
ame
Cou
nty
Form
atio
nD
epth
(ft)
Dat
e sa
mpl
edC
lSO
4Br
Cl/B
rC
aM
gN
aK
Fe00
4053
38Fl
andr
au S
tate
Par
kBr
own
CM
TS20
010
/26/
2009
130.
923
90.
450
291
47.2
22.0
203
10.0
21.
3000
7606
92La
ke H
ansk
a W
ABr
own
KRET
164
10/2
8/20
094.
2154
40.
052
8121
971
.257
.45.
213.
7200
7682
59H
elge
t-Bra
ulic
k W
MA
Brow
nC
MTS
284
10/1
4/20
0934
.619
10.
038
911
96.0
42.7
45.3
12.4
1.28
0076
8260
Hel
get-B
raul
ick
WM
ABr
own
QBA
A70
.510
/14/
2009
0.60
481
0.01
346
168
106.
548
.710
.38
4.26
0076
8125
Exce
der W
MA
Mar
tinC
MTS
680
10/1
6/20
092.
6749
30.
049
5419
058
.465
.65.
492.
1200
7681
39Ex
cede
r WM
AM
artin
KRET
231
10/1
6/20
092.
2543
50.
043
5218
657
.554
.45.
491.
9100
7711
61R
oone
y R
un W
MA
Mar
tinQ
BAA
444
10/2
6/20
092.
1061
50.
043
4920
860
.982
.25.
712.
9000
7711
63R
oone
y R
un W
MA
Mar
tinC
MTS
718
10/2
6/20
097.
0447
50.
057
124
172
51.9
70.1
7.64
2.55
0076
8261
Cou
rtlan
d W
est U
nit*
Nic
olle
tPM
SX46
310
/9/2
009
10.1
433
0.05
917
18.
6260
.913
127
.10.
012
0076
8262
Cou
rtlan
d W
est U
nit*
Nic
olle
tQ
BAA
202
10/9
/200
91.
1063
.60.
016
6912
336
.68.
274.
243.
9000
7682
63N
icol
let B
ay U
nit*
Nic
olle
tC
MTS
474
10/1
4/20
0918
.017
50.
062
290
109
35.8
39.9
6.71
0.24
600
7682
64N
icol
let B
ay U
nit*
Nic
olle
tQ
BAA
198
10/1
4/20
092.
9331
.40.
041
7115
065
.822
.38.
713.
5200
7704
44N
orw
egia
n G
rove
WM
AN
icol
let
CM
TS54
010
/8/2
009
60.9
162
0.24
924
586
.936
.715
08.
700.
920
0077
0445
Nor
weg
ian
Gro
ve W
MA
Nic
olle
tQ
BAA
260
10/9
/200
92.
520
60.
060
4210
8.7
45.5
95.1
5.85
2.02
0077
0449
Pete
rson
Uni
t*N
icol
let
CM
TS54
510
/9/2
009
48.7
181
0.01
630
4412
644
.453
.45.
250.
780
0077
0450
Pete
rson
Uni
t*N
icol
let
QBA
A22
310
/9/2
009
3.36
705
0.07
843
198
63.3
170
4.67
2.30
0077
0440
Sibl
ey C
o La
ndfil
lSi
bley
CM
TS57
510
/8/2
009
3.59
45.1
0.05
368
90.5
38.7
75.0
5.62
1.68
0077
0441
Sibl
ey C
o La
ndfil
lSi
bley
QBA
A43
010
/8/2
009
3.43
29.8
0.05
464
93.5
39.5
73.3
5.64
2.21
0077
0442
Seve
ranc
e La
ke W
MA
Sibl
eyC
MTS
630
10/7
/200
921
.413
1.7
0.07
329
310
4.6
40.1
64.4
9.50
2.06
0077
0443
Seve
ranc
e La
ke W
MA
Sibl
eyQ
BAA
280
10/7
/200
90.
6551
.70.
043
1511
143
.631
.44.
931.
1800
1322
75D
arrin
Boc
ock
Wat
onw
anC
MTS
484
11/2
4/20
091.
2175
10.
037
3326
9.4
95.8
52.3
7.79
5.91
0076
0686
Cas
e W
MA
Wat
onw
anQ
BAA
209
10/1
5/20
091.
8332
00.
033
5515
055
.849
.05.
773.
8100
7606
87C
ase
WM
AW
aton
wan
CM
TS67
210
/15/
2009
1.75
523
0.04
242
227
66.3
45.1
4.96
2.92
0076
0688
Mad
elia
WM
AW
aton
wan
QBA
A12
010
/15/
2009
0.56
99.1
0.01
537
112
35.3
22.1
4.88
3.18
0076
0689
Mad
elia
WM
AW
aton
wan
CM
TS64
810
/15/
2009
0.99
388
0.02
835
192
58.1
33.0
6.25
3.44
0076
0690
Berg
dahl
WM
AW
aton
wan
QBA
A12
910
/14/
2009
1.98
544
0.04
247
210
66.4
68.7
5.49
2.92
0076
0691
Berg
dahl
WM
AW
aton
wan
CM
TS47
910
/15/
2009
11.2
586
0.06
716
721
277
.677
.36.
623.
2500
7704
27Lo
ng L
ake
WA
Wat
onw
anC
MTS
547
10/1
5/20
091.
4911
140.
048
3136
311
777
.66.
921.
0500
7704
39Lo
ng L
ake
WA
Wat
onw
anQ
BAA
128
10/1
5/20
097.
7766
50.
056
139
255
84.9
53.2
6.77
3.62
*par
t of S
wan
Lak
e W
MA
QB
AA
= Q
uate
rnar
y bu
ried
aqui
fer
CM
TS =
Cam
bria
n M
t. S
imon
san
dsto
neK
RE
T =
Cre
tace
ous
sand
ston
eP
MS
X =
Pre
cam
bria
n S
ioux
qua
rtzite
Mn
0.07
40.
215
0.30
40.
143
0.19
20.
256
0.27
40.
210
0.01
850.
429
0.12
60.
311
0.14
10.
838
0.16
50.
191
0.09
250.
203
0.11
40.
271
0.19
70.
1126
0.20
30.
313
0.11
340.
891
0.21
81.
037
0.38
8

33South-Central Minnesota Groundwater Monitoring of the Mt. Simon Aquifer
Figures
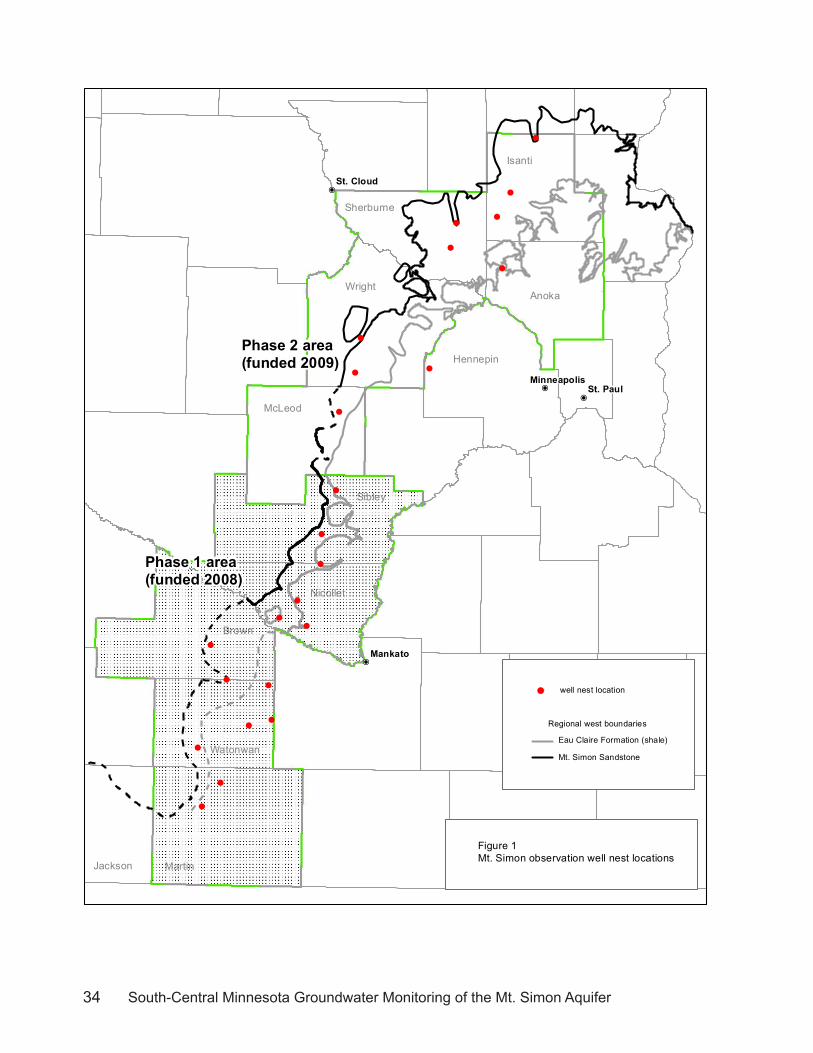
34 South-Central Minnesota Groundwater Monitoring of the Mt. Simon Aquifer
!
!
!
!!
!
!
!
!
!
!
!
!
!
!
!
!
!
!
!
!
!
!
!
!P
!P
!P
!P
Isanti
Anoka
Hennepin
Martin
Brown
Jackson
Nicollet
Watonwan
Wright
Sibley
McLeod
Sherburne
Mankato
St. Paul
St. Cloud
Minneapolis
Figure 1Mt. Simon observation well nest locations
well nest location
Phase 1 area(funded 2008)
Phase 2 area(funded 2009)
Regional west boundaries
Mt. Simon Sandstone
Eau Claire Formation (shale)

35South-Central Minnesota Groundwater Monitoring of the Mt. Simon Aquifer
Figure 2 Cambrian and older stratigraphy in study area (Modified from Mossler 2008)

36 South-Central Minnesota Groundwater Monitoring of the Mt. Simon Aquifer
!
!
!
!
!
!
!
!
!
!
!
!
!
!
!
!
!
!
!
!
!
!
!
!
!!
!
!
#
#
Cmu
Cu
Omu
Cmu
Case WMA
Madelia WMA
Exceder WMA
Long Lake WA
SE Hanska WA
Bergdahl WMA
Peterson unit
Rooney Run WMA
Nicollet Bay unit
Sibley Co property
Severence Lake WMA
Norwegian Grove WMA
Courtland West unit
Helget-Braulick WMA
irrigation
Flandreau State Park
Cmu
Clr
Csl
Oo
Cj
Cm
Clr
Ce
Cj
Os
Cj
Csl
Phf
Clr
Cw
Cj
Osp
Cj
Cm
Csl
CwOs
Op
Csl
Ps
Ce
Csl
Op
Os
Os
Cj
Ol
Os
Cw
Omu
Cw
Ce
Op
Csl
Ol
Clr
Op
Ce
Cm
Cm
Oo
Ou
Csl
Ol
Cu
I
J
E
H
F
A
KL
G
D
C
B
I'
J'
E'
H'
F'
K'
L'
G'
D'
C'
Brown
Sibley
Martin
Renville
Nicollet
Blue Earth
Watonwan
Faribault
McLeod
Jackson
Redwood
Cottonwood
Le Sueur
Carver
Scott
St. Peter Sandstone, Osp
Prairie du Chien Group, Op and Oo
Jordan Sandstone, Cj
St. Lawrence Fm, Csl
Tunnel City Gp (Lone Rock Fm), Clr
Wonewoc Sandstone, Cw
Eau Claire Fm, Ce
Mt. Simon Sandstone, Cm
County Atlas unitsPaleozoic bedrock
Precambrian bedrock
Hinckley Sandstoneand/or Fond du Lac Formation, Phf
Sioux Quartzite, Ps
State map units
Upper Cambrian, Cu(includes Cj, Csl, and Clr)
Lower Ordovician, Ol(includes Op and Oo)
Middle and Upper Cambrian, Cmu(includes Cm, Ce, and Cw)
Upper Ordovician, OuMiddle and Upper Ordovician, Omu
Paleozoic bedrock
Figure 3County and state Paleozoic bedrock map
Regional west boundary Ce(dashed where uncertain)Regional west boundary Cm(dashed where uncertain)
! New well nests for this project
# Existing water supply wells
Samples wells
Study area location in Hollandaleembayment (modified from Siegel 1989)

37South-Central Minnesota Groundwater Monitoring of the Mt. Simon Aquifer
!
!
!
!!
!
!
!
!
!
!
!
!
!
!
!
!
!
!
!
!
!
!
!
!
!
!
!
!
!
!
!
!
!
!
!
!
!
!
!
!
!
!
!
!
!!
!
!
!
!
!
!
!
!
!
!
!
!
!
! !
!
!
!
!!
!
!
!
!
!
!
!
!
!
!
!
!
!!
!
!
!
!
!
!!
!
!
!
!
!
!
!
!
!
!
!!
!
!
!
!
!
!! !
!
!
!
! !
!
!
!
!
!
!
!
!
!
!
!
!
!
!
!
!
!
!
!
!
!
!
!
!
!
!
!
!
!
!
!
!
!
!!
!
!
!
!
!
!
!
!
!
!
!
!
!!
!
!
!
!
!
!
!
!
!
!
!
!
!
!
!
!
!
!
!
!
!
!
!
!
!
!
!!
!
!
!
!
!
!
!
!
!
!!
!
!
!
!
!
!
!
!
!
!
!
!
!
!
!
!
!
!
!
!
!
!
!
!
!
!
!
!
!
!
!
!
!
!
!
!
!
!
!
!
!
!
!
!
!
!
!
!
!
!
!
!
!
!
!
!
!!
!
!
!
!
150
200
50
100
50
50
100
I
J
E
H
F
K
A
L
G
D
C
B
I'
J'
E'
H'
F'
K'
L'
G'
D'
C'
B'
Brown
Sibley
Martin
Blue Earth
Nicollet
Renville
Faribault
Watonwan
Jackson
Redwood
McLeod
Cottonwood
Le Sueur
Carver
Scott
Figure 4Mt. Simon Sandstone thickness
Mt. Simon wells
Existing water supply wells
! New well nests for this project
!
Contour interval = 50 feet
Regional west boundary Cm

38 South-Central Minnesota Groundwater Monitoring of the Mt. Simon Aquifer
!
!
!
!
!
!
!
!
!
!
!
!
!
!
!
!
!
!
!
!
!
!
!
!
!
!
!
!
!
!
!
!
!
!
!
!
!
!
!
!
!
!
!
!
!
!
!!
!
!
!
!
!
!
!
!
!
!
!
!
!
!
!
!
!
!
!
!
!
!
!
!
!
!
!
!
! !
!
!
!
!
!
!
!
!
!
!
!
!
!
!
!
!
!
!
!
!
!
!
!
!
!
!
!
!
!
!
!
!
!
!
!
!!
!
!
!
!
!
!
!! !
!
!
!
!
!
!
!!
!
!
!
!
!
!
!
!
!
!
!
!
!
!
!
!
!
!
!
!
!
!
!
!
!
!
!
!
!
!
!
!
!
!
!
!
!
!
!
!
!!
!
!
!
!
!
!
!
!
!
!
!
!
!
!
!
!
!!
!
!
!
!
!
!
!
!
!
!
!
!
!
!
!
!
!
!
!
!
!
! !
!
!
!
!
!
!
!
!
!
!
!
!
!
!
!
!
!
!
!
!
!
!
!
!
!
!
!
!
!
!
!
!
!
!
!
!
!
!
!
!
!
!
!
!
!
!
!
!
!!
!
!
!
!
!
!
!
!
!
!
!
!
!
!
!
!
Z
Z'
825
850
800
900
950
1100
1000
1150
1050
1200
850
900
850
Sibley
Martin
Brown
Blue Earth
Nicollet
Faribault
Renville
Watonwan
Le Sueur
McLeod
Jackson
Redwood
Cottonwood
Carver
Scott
Waseca
Regional west boundary Ce
Regional west boundary Cm
Figure 5Mt. Simon potentiometric surfaceand groundwater flow directions
Mt. Simon potentiometric surface contours
50 feet
25 feet
Mt. Simon groundwater flow directions

39South-Central Minnesota Groundwater Monitoring of the Mt. Simon Aquifer
Und
iffer
entia
ted
Cre
tace
ous
sand
ston
ean
d sh
ale
glac
ial s
edim
ents
(in
terb
edde
d sa
nd,
clay
, and
silt
)
Mt.
Sim
on
Sand
ston
e
Eau
Cla
ire F
m
Tunn
el C
ity g
roup W
onew
oc S
s
Prec
ambr
ian
crys
talin
e be
droc
k(ig
neou
s an
d m
etam
orph
ic)
Long
Lak
e W
A w
ell n
est
City
of S
t. Ja
mes
Irrig
atio
n w
ells
City
of M
edal
ia*
Ber
gdah
l WM
A w
ell n
est
Nor
th S
tar
WM
A ob
serv
artio
nw
ell
Minnesota River Valley
*Cas
e W
MA
wel
l dat
a pr
ojec
ted
Mt.
Sim
on a
quife
r pot
entio
met
ric s
urfa
ce
Z
Z'
Figu
re 6
Cro
ss s
ectio
n Z-
Z'
Mt.
Sim
on p
oten
tiom
etric
sur
face

40 South-Central Minnesota Groundwater Monitoring of the Mt. Simon Aquifer
8000444QBAA
0198QBAA
4000119QBAA
5000280QBAA
2600121QBAA
50070.5QBAA
4000253QBAA
8000223QBAA
2300205QBAA
8000129QBAA
11000232KRET
18000438QBAA
11000164KRET
9000206QBAA
Brown
Sibley
Blue Earth
Nicollet
Martin
Watonwan
Figure 7Carbon-14 residence time data from the shallower aquifers at each observationwell nest
Estimated residencetime in years (carbon-14)
10001 - 25000
25001 - 60000
33 - 100
101 - 1000
1001 - 10000
8000 (residence time, years)206 (well depth, feet)QBAA (aquifer code)
Regional west boundary Ce
Regional west boundary Cm

41South-Central Minnesota Groundwater Monitoring of the Mt. Simon Aquifer
Z
Z'
Brown
Sibley
Blue Earth
Martin
Nicollet
Watonwan
825
850
800
900
950
1100
1000
1150
1050
1200
850
900
850
7000
7000
8000
10000
13000
10000
10000
17000
20000
13000
20000
22000
18000
30000
8000
30000
20000
30000
20000
20000
20000
* With addtional data from Richard Lively (MGS), Scott Alexander and Calvin Alexander (U of M)
Figure 8Mt. Simon carbon-14 residence time,potentiometric surface and groundwaterflow directions
-9.85 - delta 18O value
Estimated residencetime in years (carbon-14)*
10001 - 25000
25001 - 60000
33 - 100
101 - 1000
1001 - 10000
Regional west boundary Ce
Regional west boundary Cm

42 South-Central Minnesota Groundwater Monitoring of the Mt. Simon Aquifer
-90
-80
-70
-60
-50
-40
-30
-12
-11
-10
-9-8
-7-6
-5-4
del 2H
del 1
8 O
QB
AA
- Q
uate
rnar
y bu
ried
aqui
fer
KR
ET
- Cre
tace
ous
sand
ston
e
CM
TS -
Cam
bria
n M
t. Si
mon
san
dsto
ne
PM
SX
- P
reca
mbr
ian
Sio
ux q
uartz
ite
Line
ar (N
Am
eric
an P
reci
p D
ata)
Figu
re 9
Sta
ble
isot
ope
data
com
pare
d w
ith N
orth
Am
eric
an m
eteo
ric li
ne
Evap
orat
ed w
ater
fro
m s
urfa
ce s
ourc
es
Wat
erfro
m d
irect
in
filtra
tion
of p
reci
pita
tion
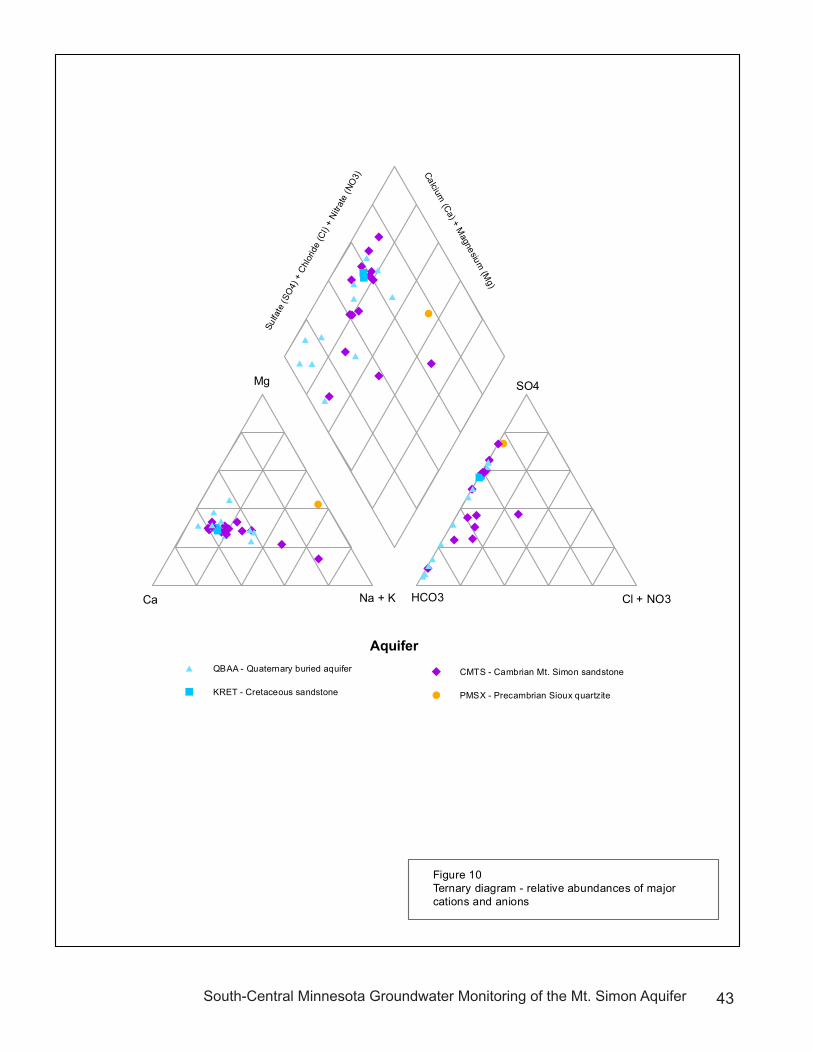
43South-Central Minnesota Groundwater Monitoring of the Mt. Simon Aquifer
"
"
#
"
#
"
#""""
"
#
!
#
"
#
"
#
"#
"
#
"
#"
##
"
"
"
#
"
#
"#""""
"
#
!
#
"
#
"
#
"#
"
#
"
#
"
#
#"
"
"
#"#" #""
"""
#!
#"
#
"# "#"#
"
#"
##"
Cl + NO3
SO4
HCO3Na + K
Mg
Ca
Calcium (Ca) + M
agnesium (M
g)
Sulfa
te (S
O4)
+ C
hlor
ide
(Cl)
+ Ni
trate
(NO
3)
Aquifer
Figure 10Ternary diagram - relative abundances of major cations and anions
" CMTS - Cambrian Mt. Simon sandstone
! PMSX - Precambrian Sioux quartzite
# QBAA - Quaternary buried aquifer
KRET - Cretaceous sandstone"
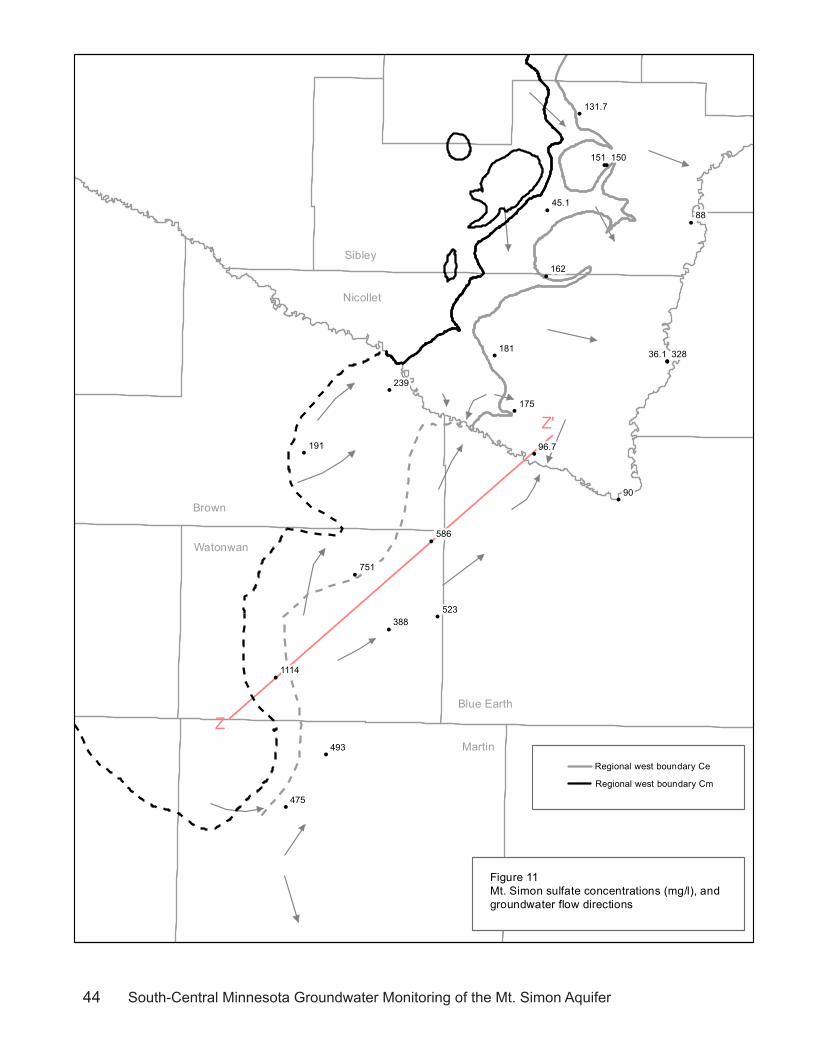
44 South-Central Minnesota Groundwater Monitoring of the Mt. Simon Aquifer
!
!!
!!
!
!!
!
!
!
!
!
!
!
!
!
!
!
!
!
!
!
!
!
!
Z
Z'
Brown
Sibley
Blue Earth
Martin
Nicollet
Watonwan
239
751
388523
493
475
586
191
162
181
175
45.1
1114
131.7
90
88
328
150151
96.7
36.1
Figure 11Mt. Simon sulfate concentrations (mg/l), and groundwater flow directions
Regional west boundary Ce
Regional west boundary Cm

45South-Central Minnesota Groundwater Monitoring of the Mt. Simon Aquifer
!
!!
!!
!
!!
!
!
!
!
!
!
!
!
!
!
!
!
!
!
!
!
!
!
Z
Z'
Brown
Sibley
Blue Earth
Nicollet
Martin
Watonwan
440
28.4
5.50
17.5
6.08
2.011.94
1.21
0.991.75
2.67
21.4
7.04
3.59
1.49
11.2
60.9
18.0
130.9
34.6*
48.7*
Figure 12Mt. Simon chloride concentrations (mg/l) and groundwater flow directions
* Samples appear to contain added chloride from well construction disinfectants
Regional west boundary Ce
Regional west boundary Cm

46 South-Central Minnesota Groundwater Monitoring of the Mt. Simon Aquifer
!
!
!
!
!
!
!
!
!
!
!
!
!
!
Z
Z'
Brown
Sibley
Blue Earth
Martin
Nicollet
Watonwan
0.1
0.19
0.21
0.37
0.37
1.88
0.61
2.41
1.67
0.13
0.29
1.93
22.8
44.2
Figure 13Mt. Simon arsenic concentrations (ug/l) and groundwater flow directions
Regional west boundary Ce
Regional west boundary Cm

47South-Central Minnesota Groundwater Monitoring of the Mt. Simon Aquifer
Figure 14 Precipitation departure from normal October 2009 – September 2010

48 South-Central Minnesota Groundwater Monitoring of the Mt. Simon Aquifer
!
!!
!!
!!
!
!!
!!
!
!
!
!
!
!
!!
!
!
!
!
!
!
!
!!
!
!
!
!!
!
!!
!
!
!
!
!
!
!
!!
!
!!
!!
!
!!
!!
!
!
!!
!
!!
!
!!
!!
!!
!
!!
!
!
!
!!
!
!!
!!
!!!
AA
'
Hin
ckle
y an
d Fo
nd d
u La
c F
mM
t. Si
mon
Ss
Eau
Cla
ire F
mWon
ewoc
SsTu
nnel
City
Gp
St.
Law
renc
e Fm
Jord
an S
s
Pre
cam
bria
n cr
ysta
lline
rock
Cre
tace
ous
shal
e an
d sa
ndst
one*
Seve
ranc
e La
ke W
MA
Nor
woo
d Yo
ung
Am
eric
a
5000
feet
Verti
cal e
xagg
erat
ion
= 50
X
Elevation (feet msl)
glac
ial
sedi
men
ts (t
ill)
glac
ial s
and/
grav
el
950
900
850
800
750
700
650
600
550
500
450
400
350
300
250
200
1000
10,0
00-9
.28
131.
721
.4
5,00
0-8
.88
51.7
0.65
00454022
00255294
00430494
00132256
0077
0442
0077
0443
00463678
00211962
0067232800420969
00218997
00449067
Wel
l cas
ing
Wel
l scr
een
or o
pen
hole
00760692
Uni
que
num
ber (
CW
I)
7000
(14
C re
side
nce
time,
yea
rs)
-9.1
5 (d
elta
18O
, * m
eans
sam
ple
cont
ains
som
e ev
apor
ated
wat
er fr
om a
sur
face
wat
er s
ourc
e)58
4
(Sul
fate
mg/
l - p
pm)
2.3
(C
l mg/
l - p
pm)
Figu
re 1
5aC
ross
sec
tion
A-A
'

49South-Central Minnesota Groundwater Monitoring of the Mt. Simon Aquifer
Figu
re 1
5b
Seve
ranc
e La
ke W
MA
H
ydro
grap
h

50 South-Central Minnesota Groundwater Monitoring of the Mt. Simon Aquifer
!!
!
!!
!
!
!
!
!
!
!
!
!
!!
!
!!
!!
!
!!
!
!
!!
!
!!
!
!!
!
!
!!
!!
BB'
Hin
ckle
y an
d Fo
nd d
u La
c Fm
Mt.
Sim
on S
s
Eau
Cla
ire F
m
Won
ewoc
Ss
Tunn
el C
ity G
p
Prec
ambr
ian
crys
tallin
e ro
ck
Sibl
ey C
o pr
oper
tyG
aylo
rd
5000
feet
Verti
cal e
xagg
erat
ion
= 50
X
Elevation (feet msl)
glac
ial
sedi
men
ts (t
ill)
glac
ial
sand
/gra
vel
950
900
850
800
750
700
650
600
550
500
450
400
350
1000
17,0
00-9
.75
45.1
3.5918
,000
-10.
0929
.8
3.43
00675744
0077
0440
0077
0441
00218043
Wel
l cas
ing
Wel
l scr
een
or o
pen
hole
00760692
Uni
que
num
ber (
CW
I)
7000
(14
C re
side
nce
time,
yea
rs)
-9.1
5 (d
elta
18O
, * m
eans
sam
ple
cont
ains
som
e ev
apor
ated
wat
er fr
om a
sur
face
wat
er s
ourc
e)58
4
(Sul
fate
mg/
l - p
pm)
2.3
(C
l mg/
l - p
pm)
Figu
re 1
6aC
ross
sec
tion
B-B'

51South-Central Minnesota Groundwater Monitoring of the Mt. Simon Aquifer
Figu
re 1
6b
Sib
ley
Cou
nty
Land
fill
Hyd
rogr
aph

52 South-Central Minnesota Groundwater Monitoring of the Mt. Simon Aquifer
!!
!
!
!
!
!!
!!
!
!
!
!
!
!!
!
!!
!
!!
!!
CC
'
Hin
ckle
y an
d Fo
nd d
u La
c F
m
Mt.
Sim
on S
s
Eau
Cla
ire F
m
Won
ewoc
Ss
Pre
cam
bria
n cr
ysta
lline
rock
Nor
weg
ian
Gro
ve W
MA
4,00
0-8
.65
206
2.5
5000
feet
Verti
cal e
xagg
erat
ion
= 50
X
Elevation (feet msl)
glac
ial
sedi
men
ts (t
ill)
glac
ial s
and/
grav
el
0077
0445
950
900
850
800
750
700
650
600
550
500
450
400
1000
20,0
00-9
.59
162
60.9
0077
0444
00210024
Wel
l cas
ing
Wel
l scr
een
or o
pen
hole
00760692
Uni
que
num
ber (
CW
I)
7000
(14
C re
side
nce
time,
yea
rs)
-9.1
5 (d
elta
18O
, * m
eans
sam
ple
cont
ains
som
e ev
apor
ated
wat
er fr
om a
sur
face
wat
er s
ourc
e)58
4
(Sul
fate
mg/
l - p
pm)
2.3
(C
l mg/
l - p
pm)
Figu
re 1
7aC
ross
sec
tion
C-C
'

53South-Central Minnesota Groundwater Monitoring of the Mt. Simon Aquifer
Figu
re 1
7b
Nor
weg
ian
Gro
ve W
MA
Hyd
rogr
aph

54 South-Central Minnesota Groundwater Monitoring of the Mt. Simon Aquifer
!
!
!
!
!!
!
!
!!
!
!!
!!
!!
!
!
!
!!
!!
!
!
!
!!
!
!
!
!!
!
!
!
!!
!!
!
!!
!
!
!!
!!
!
!
!
!
!!
!
!
!!
!!
!!
!!
DD
'
Mt.
Sim
on S
s
Eau
Cla
ire F
m
Won
ewoc
Ss
Tunn
el C
ity G
p
Pre
cam
bria
n cr
ysta
lline
rock
Swan
Lak
e W
MA
Pete
rson
Uni
t
5000
feet
Verti
cal e
xagg
erat
ion
= 50
X
Elevation (feet msl)
glac
ial
sedi
men
ts (t
ill)
glac
ial s
and/
grav
el
950
900
850
800
750
700
650
600
550
500
450
400
350
1000
22,0
00-8
.23
181
48.7
8,00
0-7
.45*
705
3.36
00183249W0006966
00675716
00645281
00138800
00185156
00678989
00749477
0077
0449
0077
0450
00513029
00113074
Wel
l cas
ing
Wel
l scr
een
or o
pen
hole
00760692
Uni
que
num
ber (
CW
I)
7000
(14
C re
side
nce
time,
yea
rs)
-9.1
5 (d
elta
18O
, * m
eans
sam
ple
cont
ains
som
e ev
apor
ated
wat
er fr
om a
sur
face
wat
er s
ourc
e)58
4
(Sul
fate
mg/
l - p
pm)
2.3
(C
l mg/
l - p
pm)
Figu
re 1
8aC
ross
sec
tion
D-D
'
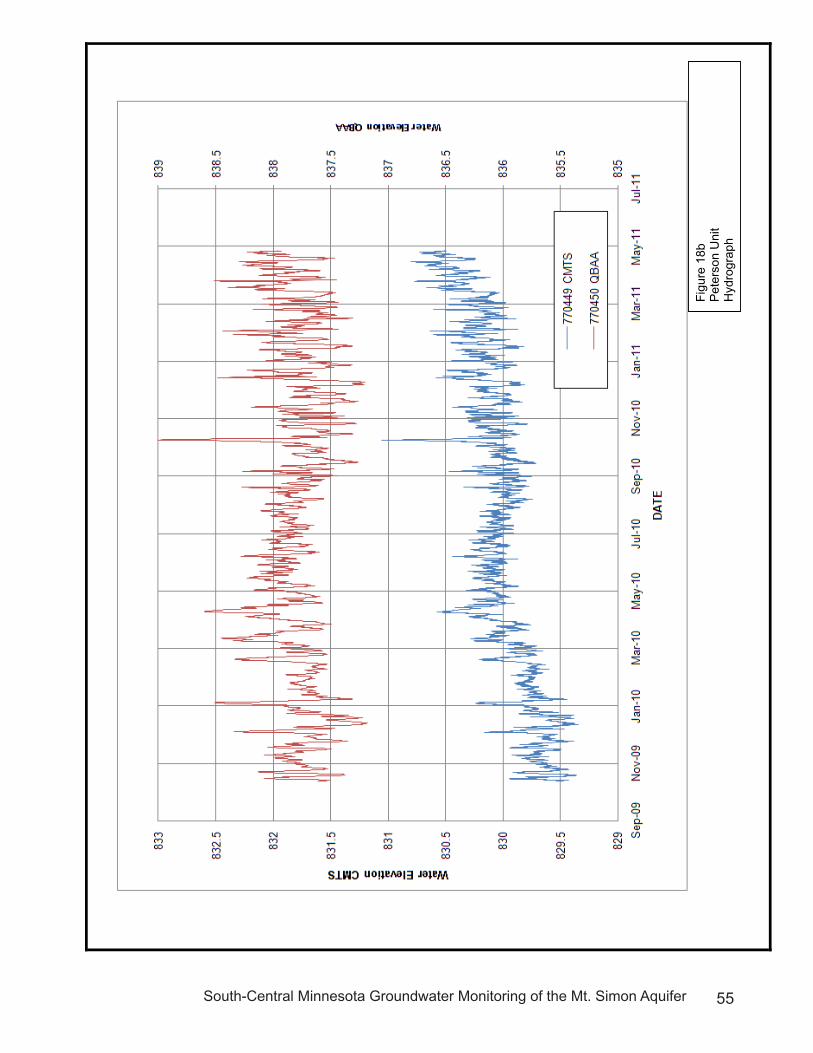
55South-Central Minnesota Groundwater Monitoring of the Mt. Simon Aquifer
Figu
re 1
8b
Pet
erso
n U
nit
Hyd
rogr
aph

56 South-Central Minnesota Groundwater Monitoring of the Mt. Simon Aquifer
!
!
!!
!
!
!
!
!
!
!
!
!!
!!
!
!
!
!
!
!
!
!!
!!
!!
!
!
!
!
!
!
!
!!
!
!
!
!
!
!
!
!
!
!!
!
!!
!
!
!
!
!
!!
!!
!
!
!
!
!
!
!!
!
!
!
!
!
!
!
!
!
!
!
!
!
!
!
!
!
!
!
!
!!
!
!
EE'
Mt.
Sim
on S
s
Eau
Clai
re F
m
Won
ewoc
Ss
Tunn
el C
ity G
p
Prec
ambr
ian
crys
tallin
e ro
ck
Cret
aceo
us sh
ale
and
sand
ston
e*
Swan
Lak
e W
MA
Cour
tland
Wes
t Uni
t
Siou
x Q
uartz
ite
Flandreau State Park
Swan
Lak
e W
MA
Nico
llet B
ay U
nit
(no
14C
data
)-9
.81
433
10.1
5000
feet
Verti
cal e
xagg
erat
ion =
50X
Elevation (feet msl)
glacia
l se
dim
ents
(till)
glacia
l sa
nd/g
rave
l
Minnesota River
950
900
850
800
750
700
650
600
550
500
450
400
1000
18,0
00-9
.66
175
18.0
30,0
00-9
.95
239
130.
9
2,30
0-7
.72
63.6
1.10
Mixe
d tri
tium
-4.4
8*31
.4
2.93
00554027
00108295
00262400
00214920
00215048
00554024
00214942
00145236
00237119
00209863
00102034
00214966
00214922
00209001
00760673
00523805
00405338
00209600
00213537
00214970
00471771
00696363
0014460700144606
00607008
0076
8261
0076
8262
007511000076
8263
0076
8264
00209860
Wel
l cas
ing
Wel
l scr
een
or o
pen
hole
00760692
Uniq
ue n
umbe
r (CW
I)
7000
(14
C re
side
nce
time,
yea
rs)
-9.1
5 (d
elta
18O
, * m
eans
sam
ple
cont
ains
som
e ev
apor
ated
wat
er fr
om a
sur
face
wat
er s
ourc
e)58
4
(Sul
fate
mg/
l - p
pm)
2.3
(C
l mg/
l - p
pm)
Figu
re 1
9aCr
oss
sect
ion
E-E'

57South-Central Minnesota Groundwater Monitoring of the Mt. Simon Aquifer
Figu
re 1
9b
Cou
rtlan
d W
est U
nit
Hyd
rogr
aph

58 South-Central Minnesota Groundwater Monitoring of the Mt. Simon Aquifer
Figu
re 1
9c
Nic
olle
t Bay
Uni
tH
ydro
grap
h
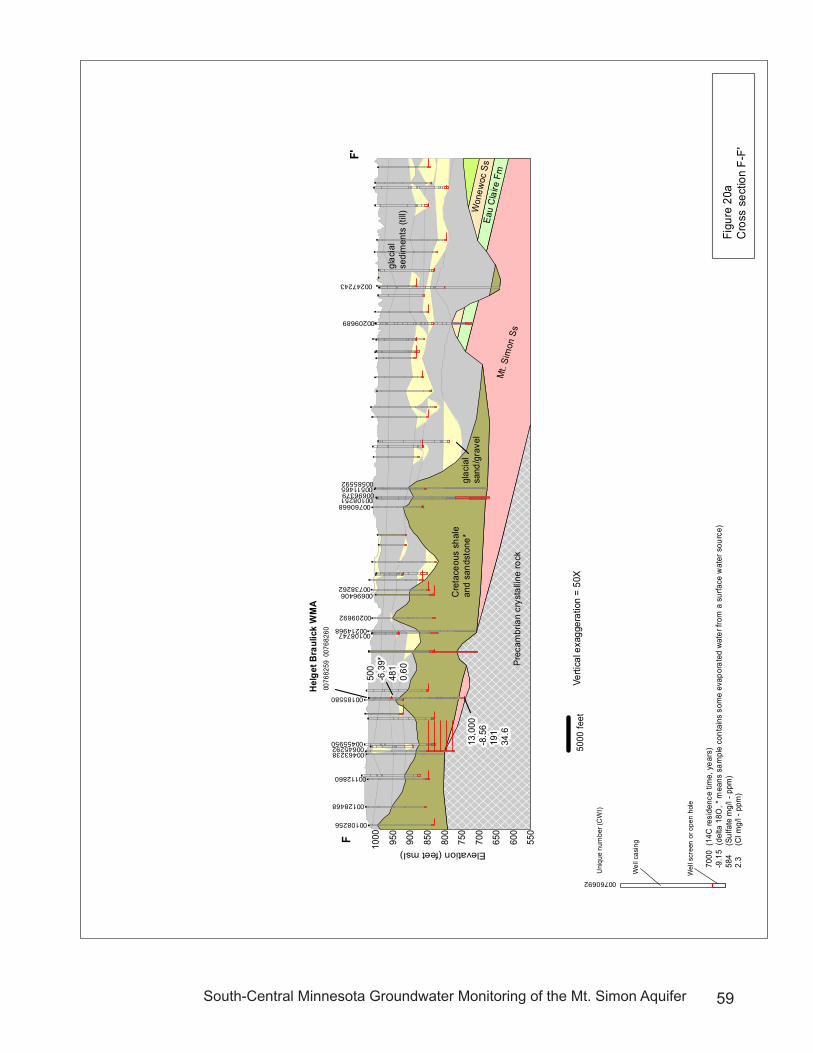
59South-Central Minnesota Groundwater Monitoring of the Mt. Simon Aquifer
!
!
!
!!
!!
!!
!
!
!
!
!
!
!!
!
!!
!
!
!
!!
!
!
!
!!
!
!
!
!
!
!
!!
!!
!!
!
!
!
!!
!
!!
!
!!
!
!
!
!
!!
!
FF'
Mt.
Sim
on S
s
Eau
Cla
ire F
m
Won
ewoc
Ss
Prec
ambr
ian
crys
tallin
e ro
ck
Cre
tace
ous
shal
e an
d sa
ndst
one*
Hel
get B
raul
ick
WM
A
5000
feet
Verti
cal e
xagg
erat
ion
= 50
X
Elevation (feet msl)
glac
ial
sedi
men
ts (t
ill)
glac
ial
sand
/gra
vel
00247243
950
900
850
800
750
700
650
600
550
1000
13,0
00-8
.56
191
34.6
500
-6.3
9*48
1 0.
60
00209689
00645292
00108256
00108747
00760668
00112860
0051146500696379
00128468
00738262
00185580
00209692
00463238
00455950
0076
8259
0076
8260
00214968
00696406
00108251
00585592
Wel
l cas
ing
Wel
l scr
een
or o
pen
hole
00760692
Uni
que
num
ber (
CW
I)
7000
(14
C re
side
nce
time,
yea
rs)
-9.1
5 (d
elta
18O
, * m
eans
sam
ple
cont
ains
som
e ev
apor
ated
wat
er fr
om a
sur
face
wat
er s
ourc
e)58
4
(Sul
fate
mg/
l - p
pm)
2.3
(C
l mg/
l - p
pm)
Figu
re 2
0aC
ross
sec
tion
F-F'
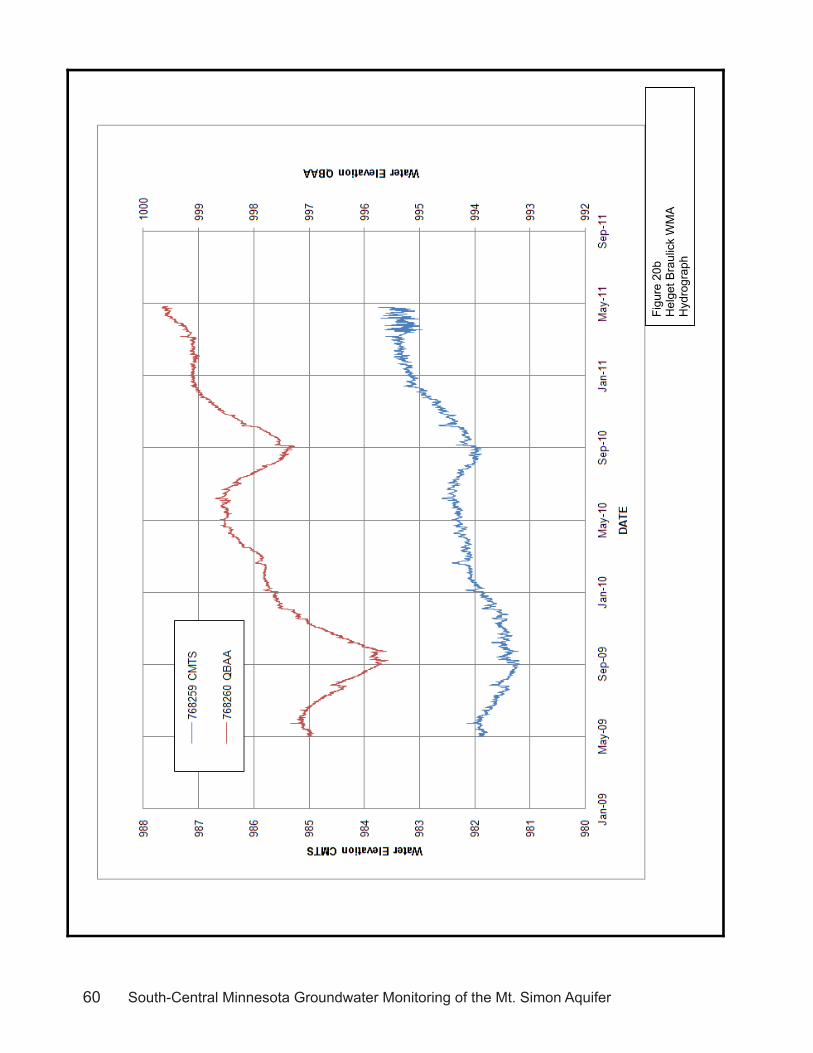
60 South-Central Minnesota Groundwater Monitoring of the Mt. Simon Aquifer
Figu
re 2
0b
Hel
get B
raul
ick
WM
A
Hyd
rogr
aph

61South-Central Minnesota Groundwater Monitoring of the Mt. Simon Aquifer
!
!
!
!
!!
!
!!
!
!
!!
!!!
!
!
!
!
!
!!
!!
!
!
!
!
!
!
!
!
!!
!
!
!
!!
!!
!
!
!
!
GG
'
Hin
ckle
y an
d Fo
nd d
u La
c F
m
Mt.
Sim
on S
s
Eau
Cla
ire F
m
Won
ewoc
Ss
Tunn
el C
ity G
p
Pre
cam
bria
n cr
ysta
lline
rock
Cre
tace
ous
shal
e an
d sa
ndst
one*
Ber
gdah
l WM
ALa
ke C
ryst
al
5000
feet
Verti
cal e
xagg
erat
ion
= 50
X
Elevation (feet msl)
Lake
Han
ska
WA
glac
ial
sedi
men
ts (t
ill)
glac
ial s
and/
grav
el
950
900
850
800
750
700
650
600
550
500
450
400
350
300
1000
20,0
00-9
.39
586
11.2
11,0
00-1
0.27
544
4.21
8,00
0-9
.19
544
1.98
00209991
00439297
0076
0692
0076
0651
0076
0691
0076
0690
00209878007217170050817300209877
Wel
l cas
ing
Wel
l scr
een
or o
pen
hole
00760692
Uni
que
num
ber (
CW
I)
7000
(14
C re
side
nce
time,
yea
rs)
-9.1
5 (d
elta
18O
, * m
eans
sam
ple
cont
ains
som
e ev
apor
ated
wat
er fr
om a
sur
face
wat
er s
ourc
e)58
4
(Sul
fate
mg/
l - p
pm)
2.3
(C
l mg/
l - p
pm)
Figu
re 2
1aC
ross
sec
tion
G-G
'

62 South-Central Minnesota Groundwater Monitoring of the Mt. Simon Aquifer
Figu
re 2
1b
Ber
gdah
l WM
A
Hyd
rogr
aph

63South-Central Minnesota Groundwater Monitoring of the Mt. Simon Aquifer
!
! !
!
!!
!
!
!
!
!
!
!
!
!
!!
!!
!!
!
!
!
!!
!
!
!
!!
!
!
!!
HH
'
Mt.
Sim
on S
s
Eau
Cla
ire F
m
Won
ewoc
Ss
Tunn
el C
ity G
p
Pre
cam
bria
n cr
ysta
lline
rock
Cre
tace
ous
shal
e an
d sa
ndst
one*
Cas
e W
MA
Irrig
atio
n w
ell
5000
feet
Verti
cal e
xagg
erat
ion
= 50
X
Elevation (feet msl)
glac
ial
sedi
men
ts (t
ill)
glac
ial s
and/
grav
el
950
900
850
800
750
700
650
600
550
500
450
400
350
1050
1000
7,00
0-9
.15
751
1.21
10,0
00-9
.36
523
1.75
9,00
0-9
.07
320
1.83
00666239
00666237
00624247
0013
2275
0076
0686
0076
0687
Wel
l cas
ing
Wel
l scr
een
or o
pen
hole
00760692
Uni
que
num
ber (
CW
I)
7000
(14
C re
side
nce
time,
yea
rs)
-9.1
5 (d
elta
18O
, * m
eans
sam
ple
cont
ains
som
e ev
apor
ated
wat
er fr
om a
sur
face
wat
er s
ourc
e)58
4
(Sul
fate
mg/
l - p
pm)
2.3
(C
l mg/
l - p
pm)
Figu
re 2
2aC
ross
sec
tion
H-H
'

64 South-Central Minnesota Groundwater Monitoring of the Mt. Simon Aquifer
Figu
re 2
2b
Cas
e W
MA
H
ydro
grap
h
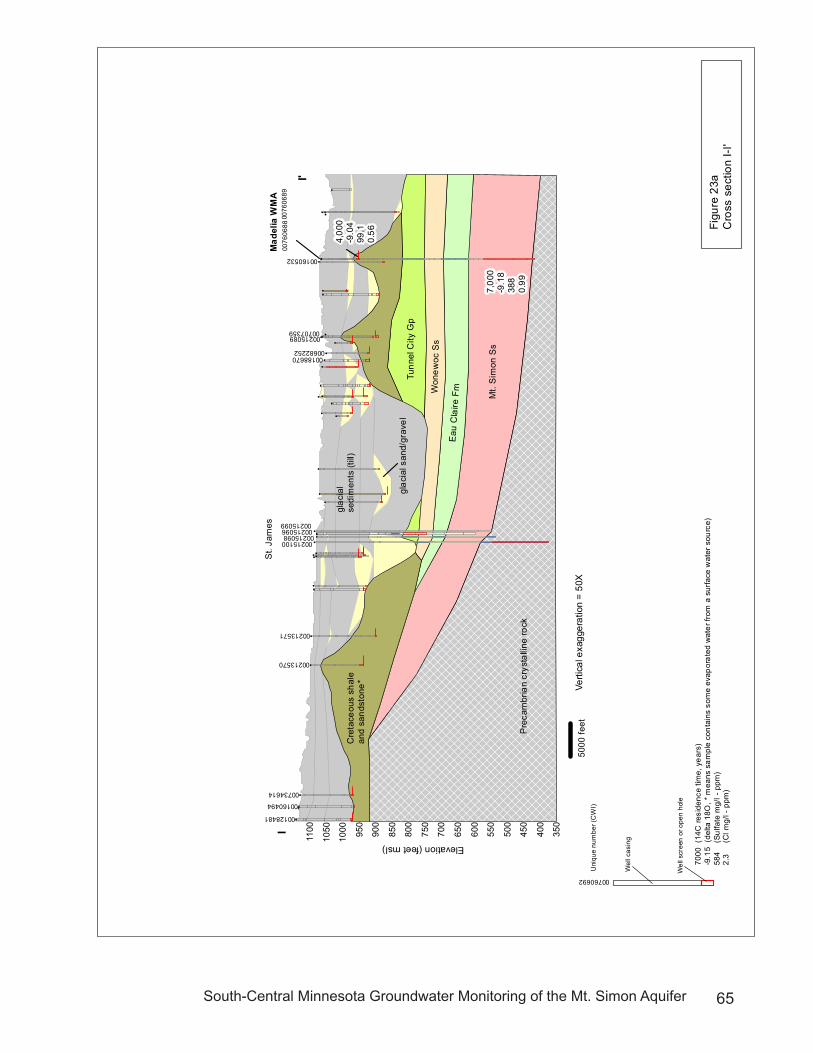
65South-Central Minnesota Groundwater Monitoring of the Mt. Simon Aquifer
!
!
!
!
!
!
!
!
!
!
!
!
!
!
!
!
!
!
!
!
!
!
!!
!
!
!!
!
!!
!
!!
!
!
!!
!!
!
!
I
I'
Mt.
Sim
on S
s
Eau
Cla
ire F
mWon
ewoc
Ss
Tunn
el C
ity G
p
Pre
cam
bria
n cr
ysta
lline
rock
Cre
tace
ous
shal
e an
d sa
ndst
one*
St.
Jam
esM
adel
ia W
MA
5000
feet
Verti
cal e
xagg
erat
ion
= 50
X
Elevation (feet msl)
glac
ial
sedi
men
ts (t
ill)
glac
ial s
and/
grav
el
950
900
850
800
750
700
650
600
550
500
450
400
350
1100
1050
1000
7,00
0-9
.18
388
0.99
4,00
0-9
.04
99.1
0.56
00215100
00215096
00188670
00707359
00128481
00213571
00160494
00213570
00734614
00215098
00215099
00682252
00215089
00160532
0076
0688
0076
0689
Wel
l cas
ing
Wel
l scr
een
or o
pen
hole
00760692
Uni
que
num
ber (
CW
I)
7000
(14
C re
side
nce
time,
yea
rs)
-9.1
5 (d
elta
18O
, * m
eans
sam
ple
cont
ains
som
e ev
apor
ated
wat
er fr
om a
sur
face
wat
er s
ourc
e)58
4
(Sul
fate
mg/
l - p
pm)
2.3
(C
l mg/
l - p
pm)
Figu
re 2
3aC
ross
sec
tion
I-I'
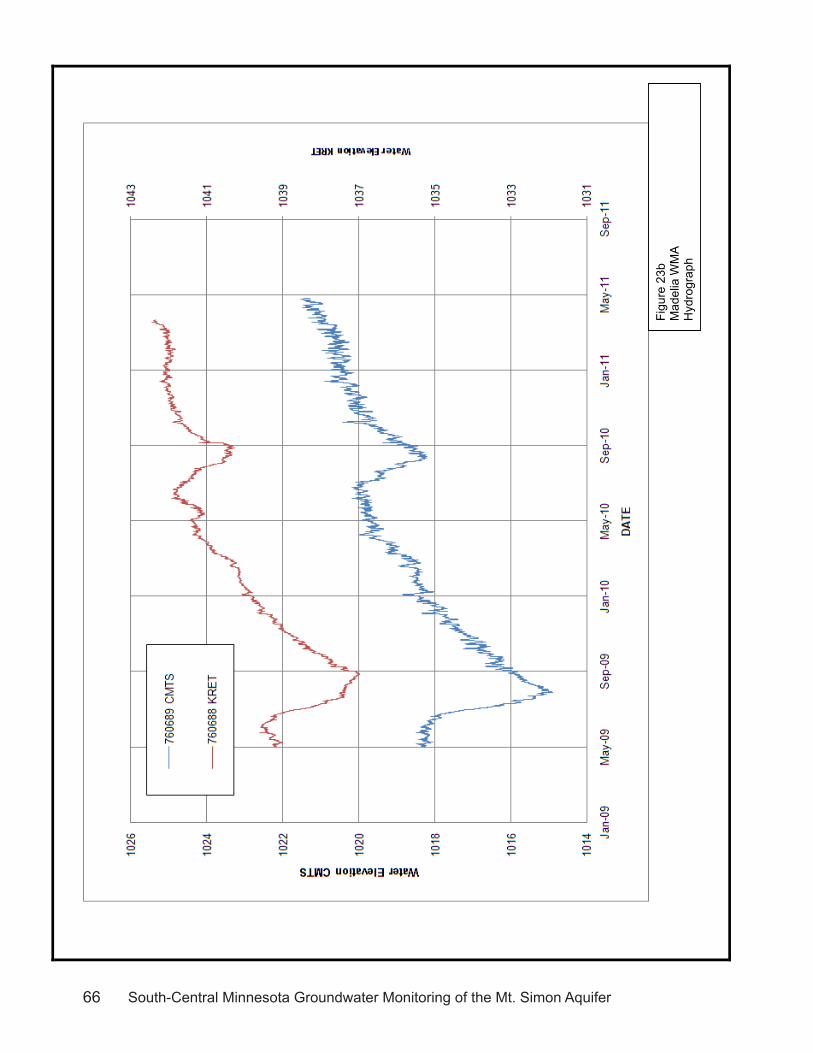
66 South-Central Minnesota Groundwater Monitoring of the Mt. Simon Aquifer
Figu
re 2
3b
Mad
elia
WM
A
Hyd
rogr
aph
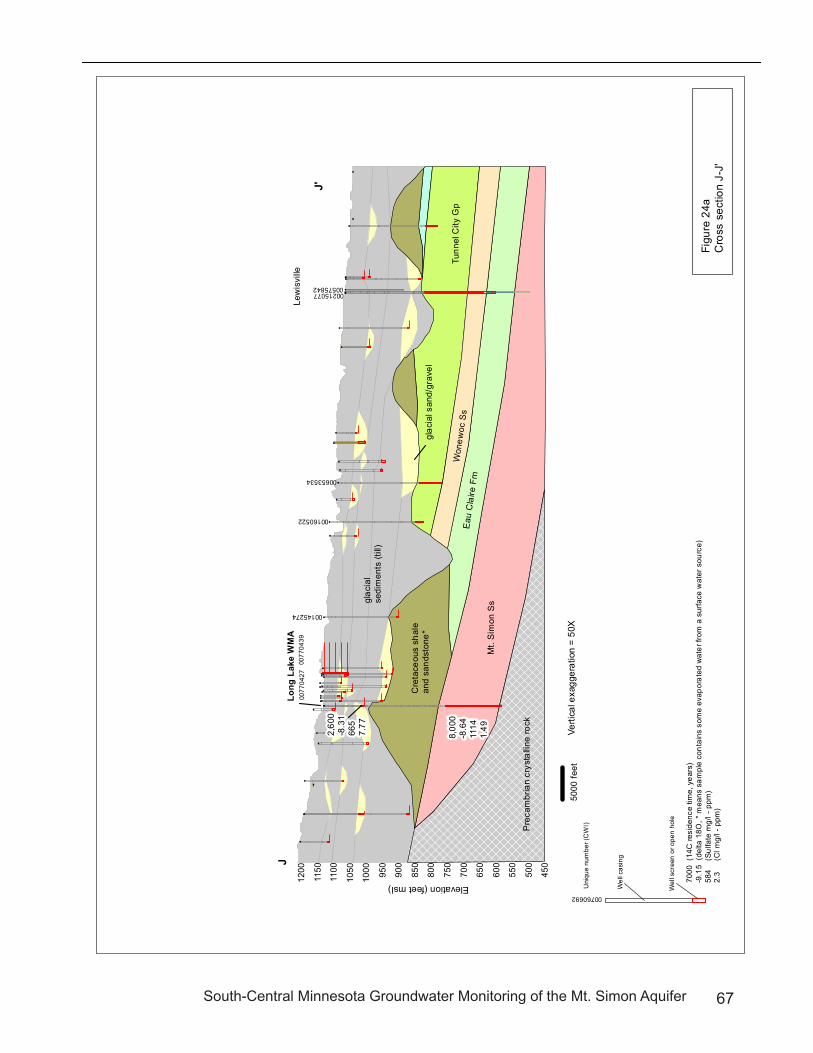
67South-Central Minnesota Groundwater Monitoring of the Mt. Simon Aquifer
!
!
!
!!
!
!
!
!!
!
!
!
!
!
!
!
!
!
!
!
!
!
!
!
!
!
!
!
!
!
!!
!
!
!
!
!!
!
!
!
!
!!
!
J
J'
Mt.
Sim
on S
s
Eau
Cla
ire F
m
Won
ewoc
Ss
Tunn
el C
ity G
p
Pre
cam
bria
n cr
ysta
lline
rock
Cre
tace
ous
shal
e an
d sa
ndst
one*
Long
Lak
e W
MA
Lew
isvi
lle
5000
feet
Verti
cal e
xagg
erat
ion
= 50
X
Elevation (feet msl)
glac
ial
sedi
men
ts (t
ill)
glac
ial s
and/
grav
el
950
900
850
800
750
700
650
600
550
500
450
1200
1150
1100
1050
1000
8,00
0-8
.64
1114
1.492,60
0 -8
.31
665
7.77
00145274
00160522
00653534
0077
0427
0077
0439
0021507700575842
Wel
l cas
ing
Wel
l scr
een
or o
pen
hole
00760692
Uni
que
num
ber (
CW
I)
7000
(14
C re
side
nce
time,
yea
rs)
-9.1
5 (d
elta
18O
, * m
eans
sam
ple
cont
ains
som
e ev
apor
ated
wat
er fr
om a
sur
face
wat
er s
ourc
e)58
4
(Sul
fate
mg/
l - p
pm)
2.3
(C
l mg/
l - p
pm)
Figu
re 2
4aC
ross
sec
tion
J-J'

68 South-Central Minnesota Groundwater Monitoring of the Mt. Simon Aquifer
Figu
re 2
4b
Long
Lak
e W
A
Hyd
rogr
aph
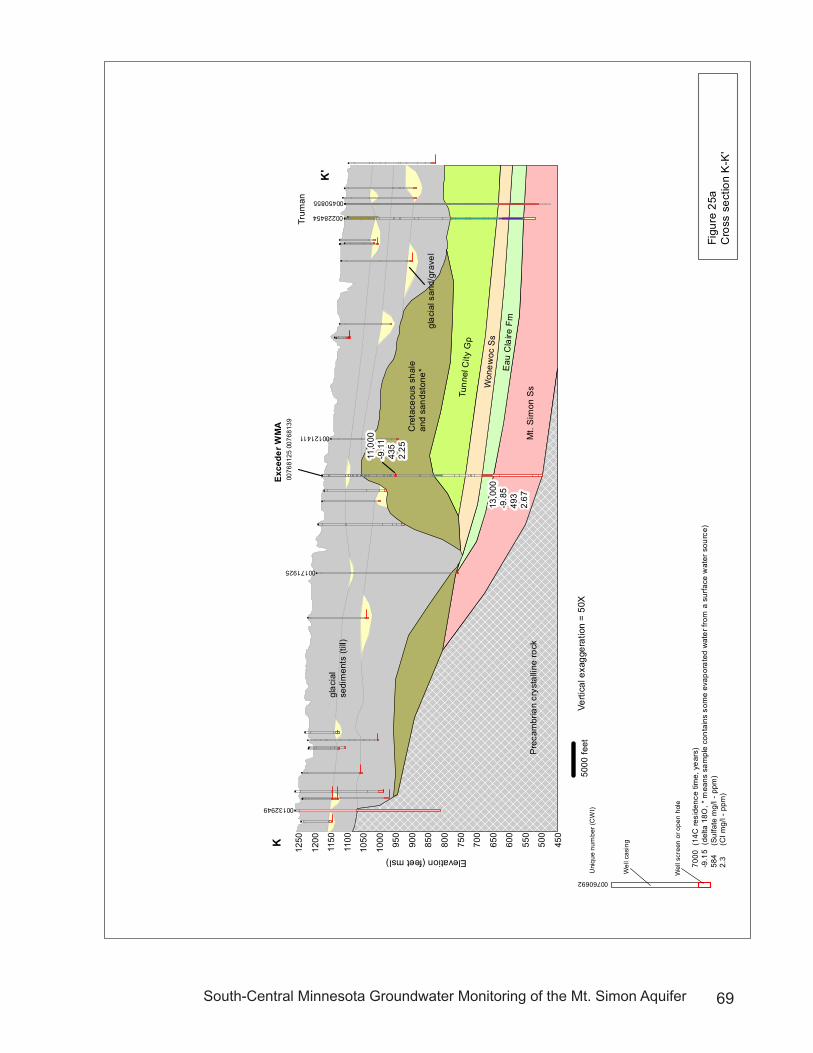
69South-Central Minnesota Groundwater Monitoring of the Mt. Simon Aquifer
!
!
!
!
!
!!
!
!
!
!
!
!
!
!
!
!
!
!
!!!
!
!
!
!
!
!
!
!
!
!
!
!
K
K'
Mt.
Sim
on S
s
Eau
Cla
ire F
m
Won
ewoc
Ss
Tunn
el C
ity G
p
Pre
cam
bria
n cr
ysta
lline
rock
Cre
tace
ous
shal
e an
d sa
ndst
one*
Exce
der W
MA
Trum
an
5000
feet
Verti
cal e
xagg
erat
ion
= 50
X
Elevation (feet msl)
glac
ial
sedi
men
ts (t
ill)
glac
ial s
and/
grav
el
950
900
850
800
750
700
650
600
550
500
450
1250
1200
1150
1100
1050
1000
13,0
00
-9.8
549
3 2.
67
11,0
00-9
.11
435
2.25
00228454
00121411
00450855
00132949
00171925
0076
8139
0076
8125
Wel
l cas
ing
Wel
l scr
een
or o
pen
hole
00760692
Uni
que
num
ber (
CW
I)
7000
(14
C re
side
nce
time,
yea
rs)
-9.1
5 (d
elta
18O
, * m
eans
sam
ple
cont
ains
som
e ev
apor
ated
wat
er fr
om a
sur
face
wat
er s
ourc
e)58
4
(Sul
fate
mg/
l - p
pm)
2.3
(C
l mg/
l - p
pm)
Figu
re 2
5aC
ross
sec
tion
K-K
'

70 South-Central Minnesota Groundwater Monitoring of the Mt. Simon Aquifer
Figu
re 2
5b
Exce
der W
MA
H
ydro
grap
h
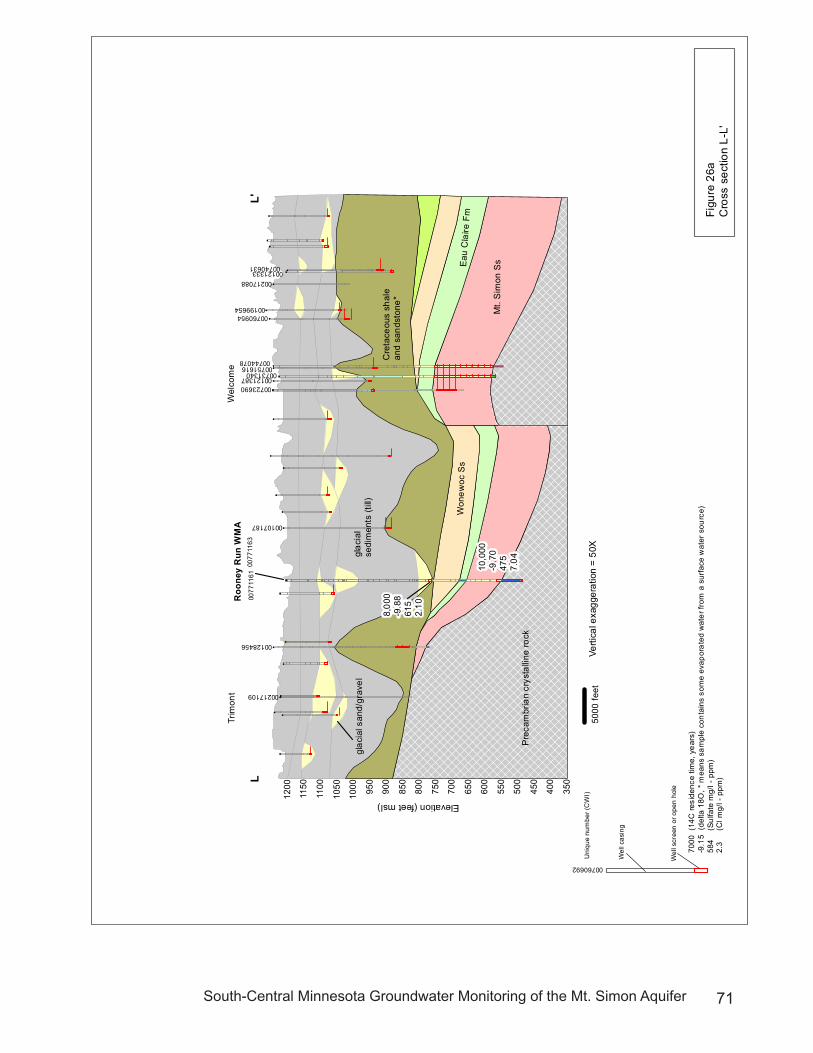
71South-Central Minnesota Groundwater Monitoring of the Mt. Simon Aquifer
!
!!
!
!
!
!
!!
!
!
!
!
!
!
!
!!
!
!
!
!
!
!
!
!
!
!
!!!
!
LL'
Mt.
Sim
on S
sEau
Cla
ire F
mW
onew
oc S
s
Pre
cam
bria
n cr
ysta
lline
rock
Cre
tace
ous
shal
e an
d sa
ndst
one*
Roo
ney
Run
WM
ATr
imon
tW
elco
me
5000
feet
Verti
cal e
xagg
erat
ion
= 50
X
Elevation (feet msl)
glac
ial
sedi
men
ts (t
ill)
glac
ial s
and/
grav
el95
0
900
850
800
750
700
650
600
550
500
450
400
350
1200
1150
1100
1050
1000
10,0
00
-9.7
047
5 7.
04
8,00
0 -9
.88
615
2.10
00740631
00760954
00121387
00751616
00217088
00723690
00199654
00107187
00217109
00128456
0077
1161
0077
1163
00731340
00744078
00121333
Wel
l cas
ing
Wel
l scr
een
or o
pen
hole
00760692
Uni
que
num
ber (
CW
I)
7000
(14
C re
side
nce
time,
yea
rs)
-9.1
5 (d
elta
18O
, * m
eans
sam
ple
cont
ains
som
e ev
apor
ated
wat
er fr
om a
sur
face
wat
er s
ourc
e)58
4
(Sul
fate
mg/
l - p
pm)
2.3
(C
l mg/
l - p
pm)
Figu
re 2
6aC
ross
sec
tion
L-L'

72 South-Central Minnesota Groundwater Monitoring of the Mt. Simon Aquifer
Figu
re 2
6b
Roo
ney
Run
WM
A
Hyd
rogr
aph

73South-Central Minnesota Groundwater Monitoring of the Mt. Simon Aquifer
Z
Z'
Brown
Sibley
Blue Earth
Martin
Nicollet
Watonwan
8000
30000
20000
30000
20000
20000
20000
7000-9.15
7000-9.18
8000-8.64
10000-9.36
13000-9.85
10000-9.28
10000-9.70
17000-9.75
20000-9.39
13000-8.56
20000-9.59
22000-8.23
18000-9.66
30000
Figure 27Mt. Simon recharge interpretation
Mixedpost-glacial rechargeand olderwater
Post-glacial recharge
Mt. Simon groundwater flow directions
-9.85 - delta 18O value
Estimated residencetime in years (carbon-14)
10001 - 25000
25001 - 60000
33 - 100
101 - 1000
1001 - 10000
Regional west boundary Ce
Regional west boundary Cm
Post-glacial recharge

74 South-Central Minnesota Groundwater Monitoring of the Mt. Simon Aquifer
Und
iffer
entia
ted
Cre
tace
ous
sand
ston
ean
d sh
ale
glac
ial s
edim
ents
(in
terb
edde
d sa
nd,
clay
, and
silt
)
Mt.
Sim
on
Sand
ston
e
Eau
Cla
ire F
m
Tunn
el C
ity g
roup W
onew
oc S
s
Prec
ambr
ian
crys
talin
e be
droc
k(ig
neou
s an
d m
etam
orph
ic)
Long
Lak
e W
A w
ell n
est
City
of S
t. Ja
mes
Irrig
atio
n w
ells
City
of M
edal
ia*
Ber
gdah
l WM
A w
ell n
est
Nor
th S
tar
WM
A ob
serv
artio
nw
ell
Minnesota River Valley
8,00
0 yr
s1,
114
mg/
l sul
fate
1 m
g/l C
l-8
.64
del 1
8O7,
000
yrs
751
mg/
l sul
fate
1 m
g/l C
l-9
.15
del 1
8O10
,000
yrs
*52
3 m
g/l s
ulfa
te2
mg/
l Cl
-9.3
6 de
l 18O
20,0
00 y
rs58
6 m
g/l s
ulfa
te11
mg/
l Cl
-9.3
9 de
l 18O
30,0
00 y
rs97
mg/
l sul
fate
28 m
g/l C
l
*Cas
e W
MA
wel
l dat
a pr
ojec
ted
Mt.
Sim
on a
quife
r pot
entio
met
ric s
urfa
ce8,
000
yrs
544
mg/
l sul
fate
2 m
g/l C
l-9
.19
del 1
8O9,
000
yrs*
320
mg/
l sul
fate
2 m
g/l C
l-9
.07
del 1
8O
2,60
0 yr
s66
5 m
g/l s
ulfa
te8
mg/
l Cl
-8.3
1 de
l 18O
Z
Z'
Figu
re 2
8G
ener
aliz
ed c
ross
sec
tion
Z-Z'
and
sel
ecte
dge
oche
mic
al d
ata

75South-Central Minnesota Groundwater Monitoring of the Mt. Simon Aquifer
Mt.
Sim
on
Sand
ston
eEa
u C
laire
Fm
Tunn
el C
ity g
roup Won
ewoc
Ss
Prec
ambr
ian
crys
talin
e be
droc
k(ig
neou
s an
d m
etam
orph
ic)
Long
Lak
e W
A w
ell n
est
City
of S
t. Ja
mes
Irrig
atio
n w
ells
City
of M
edal
ia*
Ber
gdah
l WM
A w
ell n
est
Nor
th S
tar
WM
A ob
serv
artio
nw
ell
Minnesota River Valley
*Cas
e W
MA
wel
l dat
a pr
ojec
ted
glac
ial s
edim
ents
(in
terb
edde
d sa
nd,
clay
, and
silt
)U
ndiff
eren
tiate
d C
reta
ceou
s sa
ndst
one
and
shal
e
5,00
0 ye
ars
2,50
0 ye
ars
10,000 years
20,000 years
30,00
0 years
Z
Z'
Figu
re 2
9 C
ross
sec
tion
Z-Z'
M
t. S
imon
rech
arge
and
dis
char
ge
Post
-gla
cial
rech
arge
mix
ed p
ost-g
laci
al a
nd o
lder

76 South-Central Minnesota Groundwater Monitoring of the Mt. Simon Aquifer
!
!
!
!
!
!
!
!
!
!
!
!
!
!
!
!
!
!
!
!
!
!
!
!
!!
!
!
Fairmont
Mankato
Victoria
New Ulm
Saint Peter
Le Sueur
Jackson
Windom
Olivia
Waconia
Belle P la ine
Nor th Mankato
Redwood F alls
Glencoe
Blue Ear th
Courtland
Hector
Sanborn
Wel ls
Evan
Mapleton
Winnebago
Madel ia
Gaylord
Fair fax
Saint James
Morton
Springfie ld
Sleepy Eye
Kasota
Arl ington
Le C enter
Mayer
Trum an
Bird Island
Lafayette
Easton
Eagle Lake
Minnesota Lake
Cobden
Delavan
Cologne
Nicol let
Lake Crysta l
Winthrop
Elysian
Janesvil le
Stew ar t
Trimont
Sherburn
Henderson
Franklin
Mounta in Lake
Welcom e
Gibbon
Ceylon
Frost
Odin
Danube
Green Isle
NorwoodYoung America
Morgan
Plato
Granada
Kiester
Cleveland
Darfur
Buffa lo Lake
Saint Cla ir
Bingham Lake
Lester Pra irie
Waldorf
Com frey
New Germany
Ormsby
Good Thunder
Butterfie ld
Amboy
Brownton
Clem ents
New Auburn
Dunnell
Bricelyn
Alpha
Madison Lake
Wal ters
Vernon C enter
Hanska
Lewisville
Skyline
Ham burg
Pemberton
Nor throp
Biscay
La Salle
Case WMA
Madelia WMA
Exceder WMA
Long Lake WA
SE Hanska WA
Bergdahl WMA
Peterson unit
Rooney Run WMA
Nicollet Bay unit
Sibley Co property
Severence Lake WMA
Norwegian Grove WMA
Courtland West unit
Helget-Braulick WMA
J'
E'
H'
F'
A'
K'
L'
G'
D'
C'
B'
I
J
E
H
F
A
KL
G
D
C
BSibley
Brown
Martin
Blue Earth
Nicollet
Renville
Faribault
Watonwan
McLeod
Le Sueur
Jackson
Redwood
Carver
Cottonwood
Scott
Waseca
Groundwater appropriation 2009 (million gallons/year)
Mt. Simon and combinations
Unconsolidatedsand and gravel
well nest location
Regional west boundaries
Mt. Simon Sandstone
Eau Claire Formation (shale)
0.0 - 20.0
20.1 - 40.0
40.1 - 60.0
60.1 - 80.0
80.1 - 100.0
100.1 - 857.5
0.0 - 20.0
20.1 - 40.0
40.1 - 60.0
60.1 - 80.0
80.1 - 100.0
100.1 - 1370.1
Figure 30Mt. Simon observation well nestlocations and 2009 groundwater appropriation(millions of gallons/year)

77South-Central Minnesota Groundwater Monitoring of the Mt. Simon Aquifer
Appendix A

78 South-Central Minnesota Groundwater Monitoring of the Mt. Simon Aquifer
Lithologic Description Lithologic Symbol
Geological Log Legend
Top Soil
Till
Lake Deposit
Outwash
Sandstone
Sandstoneand shale
Shale
Quartzite
Igneous ormetamorphic
bedrock
Geological Log Legend

79South-Central Minnesota Groundwater Monitoring of the Mt. Simon Aquifer
Site Name
County
ElevationDepth Lithology Gamma0 250
MN Unique
Nested Well Construction
Geological / Geophysical Logs and Well Construction Diagrams
1000
900
800
700
600
500
400
0
100
200
300
400
500
600
Severance Lake WMA
Sibley
770443770442
Topsoil
Till (multiple sources withoutwash)
Outwash
Till (multiple sources withoutwash)
Outwash - Undifferentiated
Lake deposit
Eau Claire Formation
Mount Simon Sandstone
Hinckley Sandstone
Grout
Waterlevel
4 Inchcasing
Wellscreen
Grout
Waterlevel
4 InchCasing
OpenHole

80 South-Central Minnesota Groundwater Monitoring of the Mt. Simon Aquifer
Site Name
County
ElevationDepth Lithology Gamma0 250
MN Unique
Nested Well Construction
Geological / Geophysical Logs and Well Construction Diagrams
1200
1100
1000
900
800
700
600
500
0
100
200
300
400
500
600
700
Rooney Run WMA
Martin
771161771163
Topsoil
Till - New Ulm Formation
Outwash (NW source)
Till (NW source)
Lake deposits (NW source)
Till (NW source)
Lake deposits -undifferentiated
Outwash (NE Rainy source)
Wonewoc Sandstone (UpperCambrian)
Eau Claire Formation (Middleto Upper Cambrian)
Mount Simon Sandstone(Middle Cambrian)
Pre-Mount Simon saprolith(?)
Granitic rock? (Neoarchean)
Grout
Waterlevel
4-inchcasing
WellScreen
Grout
Waterlevel
4 inchcasing
Openhole

81South-Central Minnesota Groundwater Monitoring of the Mt. Simon Aquifer
Site Name
County
ElevationDepth Lithology Gamma0 250
MN Unique
Nested Well Construction
Geological / Geophysical Logs and Well Construction Diagrams
900
800
700
600
500
0
100
200
300
400
500
Swan Lake WMA Peterson Unit
Nicollet
770450770449
Topsoil
Till - Des Moines Lobe (highshale member)
Outwash - Des Moines Lobe(moderate shale member)
Till - Des Moines Lobe(moderate shale member)
Outwash
Unnamed formation (Lowerto Upper Cretaceous, Albianto Cenomanian)
Eau Claire Formation
Mt. Simon sandstone
Unnamed granite/gneiss(Archean)
Grout
4-inchcasing
Waterlevel
Wellscreen
Grout
Waterlevel
4 inchcasing
Openhole

82 South-Central Minnesota Groundwater Monitoring of the Mt. Simon Aquifer
Site Name
County
ElevationDepth Lithology Gamma0 150
MN Unique
Nested Well Construction
Geological / Geophysical Logs and Well Construction Diagrams
900
800
700
600
500
0
100
200
300
400
500
Norwegian Grove WMA
Nicollet
770445770444
Topsoil
Till - Des Moines Lobe (highshale member)
Outwash - Traverse desSioux Formation (Rainy lobe)
Till - Traverse des SiouxFormation (Rainy lobe)
Outwash - Traverse desSioux
Till - Traverse des Sioux
Outwash (NW source)
Till (NW source)
Outwash (NW source)
Lake deposits
Outwash (NW source)
Lake deposits - Undiff.
Outwash - Undifferentiated
Eau Claire Formation
Mt. Simon sandstone
Fond du Lac Formation
Grout
4-inchcasing
Waterlevel
Wellscreen
Grout
Waterlevel
10inchcasing
4 inchcasing
Openhole

83South-Central Minnesota Groundwater Monitoring of the Mt. Simon Aquifer
Site Name
County
ElevationDepth Lithology Gamma0 250
MN Unique
Nested Well Construction
Geological / Geophysical Logs and Well Construction Diagrams
900
800
700
600
500
0
100
200
300
400
500
Swan Lake WMA - Nicollet Bay Unit
Nicollet
768264768263
Topsoil
Till - Des Moines Lobe
Outwash - Des Moines Lobe
Outwash - Undifferentiated
Outwash (NW source)
Lake Deposits -Undifferentiated
Wonewoc Sandstone
Eau Claire Formation
Mount Simon Sandstone
Grout
4-inchcasing
Waterlevel
Wellscreen
Grout
8 inchcasing
Waterlevel
4 inchcasing
Openhole
Stabilizerpack
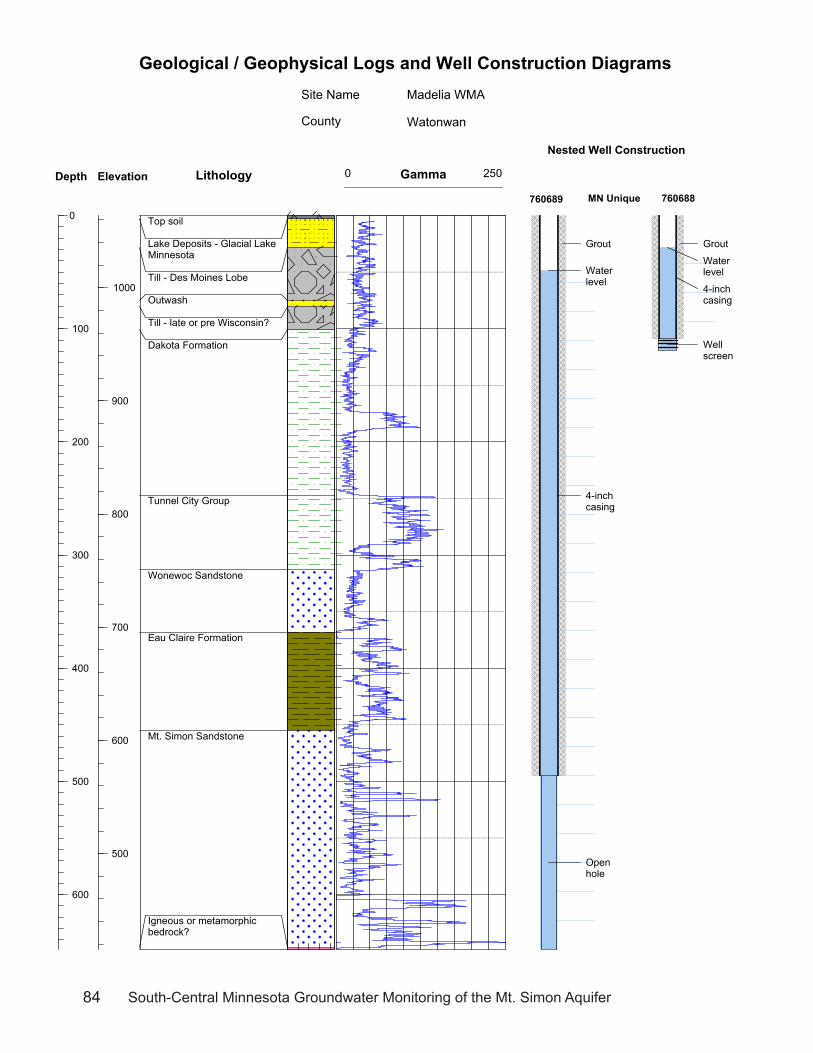
84 South-Central Minnesota Groundwater Monitoring of the Mt. Simon Aquifer
Site Name
County
ElevationDepth Lithology Gamma0 250
MN Unique
Nested Well Construction
Geological / Geophysical Logs and Well Construction Diagrams
1000
900
800
700
600
500
0
100
200
300
400
500
600
Madelia WMA
Watonwan
760688760689
Top soil
Lake Deposits - Glacial LakeMinnesota
Till - Des Moines Lobe
Outwash
Till - late or pre Wisconsin?
Dakota Formation
Tunnel City Group
Wonewoc Sandstone
Eau Claire Formation
Mt. Simon Sandstone
Igneous or metamorphicbedrock?
Grout
Waterlevel
4-inchcasing
Wellscreen
Grout
Waterlevel
4-inchcasing
Openhole

85South-Central Minnesota Groundwater Monitoring of the Mt. Simon Aquifer
Site Name
County
ElevationDepth Lithology Gamma0 100
MN Unique
Nested Well Construction
Geological / Geophysical Logs and Well Construction Diagrams
1100
1000
900
800
700
600
0
100
200
300
400
500
Long Lake WA
Watowan
770439770427
Topsoil
Till - Des Moines Lobe (lowshale member)
Till - Des Moines Lobe(moderate shale member)
Outwash - Unnamedcarbonate-rich formation(northwest source)
Dakota Formation(Cretaceous, Cenomanian)shale and sandstone
Unnamed unit (Cretaceous?,Albian/Cenomanian) shaleand sandstone
Mount Simon Sandstone(Middle Cambrian)
Saprolith (pre-Mount Simon;Middle Cambrian?)
Granite/gneiss(Neoarchean/Mesoarchean)
Grout
Waterlevel
4-inchcasing
Wellscreen
Grout
Waterlevel
4 inchcasing
Openhole

86 South-Central Minnesota Groundwater Monitoring of the Mt. Simon Aquifer
Site Name
County
ElevationDepth Lithology Gamma0 600
MN Unique
Nested Well Construction
Geological / Geophysical Logs and Well Construction Diagrams
1000
900
800
700
0
100
200
300
Lake Hanska WA
Brown
760692760651
Top soil
outwash
Till - Des Moines Lobe
Outwash - Des Moines Lobe
Till - Des Moines Lobe
Dakota Formation Sandstoneand Shale
Undifferentiated CretaceousShale and sandstone
Mount Simon sandstone?
Igneous or metamorphicbedrock
Waterlevel
Grout
4 inchcasing
Wellscreen
Surfaceseal
Grout
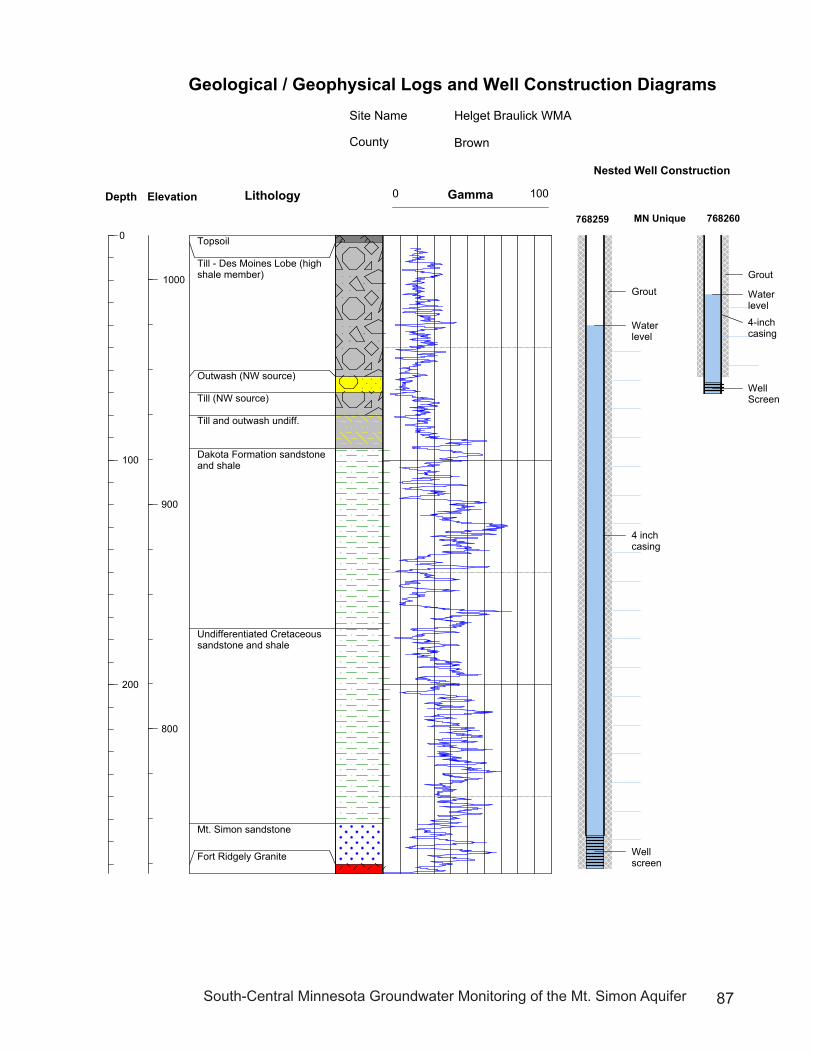
87South-Central Minnesota Groundwater Monitoring of the Mt. Simon Aquifer
Site Name
County
ElevationDepth Lithology Gamma0 100
MN Unique
Nested Well Construction
Geological / Geophysical Logs and Well Construction Diagrams
1000
900
800
0
100
200
Helget Braulick WMA
Brown
768260768259
Topsoil
Till - Des Moines Lobe (highshale member)
Outwash (NW source)
Till (NW source)
Till and outwash undiff.
Dakota Formation sandstoneand shale
Undifferentiated Cretaceoussandstone and shale
Mt. Simon sandstone
Fort Ridgely Granite
Grout
Waterlevel
4-inchcasing
WellScreen
Grout
Waterlevel
4 inchcasing
Wellscreen

88 South-Central Minnesota Groundwater Monitoring of the Mt. Simon Aquifer
Site Name
County
ElevationDepth Lithology Gamma0 200
MN Unique
Nested Well Construction
Geological / Geophysical Logs and Well Construction Diagrams
1100
1000
900
800
700
600
500
0
100
200
300
400
500
600
Exceder WMA
Martin
768139768125
Top soil
Till - Des Moines Lobe (lowshale member)
Till (NW source)
Outwash (NW source)
Till (NW source)
Till or lake deposit - Undiff.
Dakota Formation (UpperCretaceous)
Tunnel City Group, LoneRock Formation
Wonewoc Sandstone
Eau Claire Formation
Mount Simon Sandstone
Grout
Waterlevel
4-inchcasing
WellScreen
Grout
Waterlevel
4 inchcasing
Openhole

89South-Central Minnesota Groundwater Monitoring of the Mt. Simon Aquifer
Site Name
County
ElevationDepth Lithology Gamma0 400
MN Unique
Nested Well Construction
Geological / Geophysical Logs and Well Construction Diagrams
900
800
700
600
0
100
200
300
400
Swan Lake WMA - Courtland West Unit
Nicollet
768262768261
Topsoil
Till - Des Moines Lobe
Till (nw source)
Lacustrine Deposits - preWisc.
Outwash - pre Wisc.
Till - pre Wisc.
Outwash - pre Wisc.
Dakota Formation -Cretaceous
Cretaceous Deposits
Wonewoc Sandstone
Sioux Quartzite
Grout
4-inchcasing
Waterlevel
Wellscreen
Grout
Waterlevel
8 inchcasing
4 inchcasing
Openhole

90 South-Central Minnesota Groundwater Monitoring of the Mt. Simon Aquifer
Site Name
County
ElevationDepth Lithology Gamma0 250
MN Unique
Nested Well Construction
Geological / Geophysical Logs and Well Construction Diagrams
1000
900
800
700
600
500
400
0
100
200
300
400
500
600
Case WMA
Watonwan
760686760687
Top soil
Lake Deposits
Outwash - Des Moines Lobe
Till - undiff.
Till (NW source)
ice contact - Unnamed
Till (NE source)
Lake deposits - Undiff.
Tunnel City Group
Birkmose Member
Wonewoc Sandstone
Eau Claire Formation
Mt. Simon sandstone
Rhyolite
Grout
Waterlevel
4-inchcasing
Wellscreen
Grout
Waterlevel
Openhole

91South-Central Minnesota Groundwater Monitoring of the Mt. Simon Aquifer
Site Name
County
ElevationDepth Lithology Gamma0 350
MN Unique
Nested Well Construction
Geological / Geophysical Logs and Well Construction Diagrams
900
800
700
600
0
100
200
300
400
Bergdahl WMA
Watonwan
760690760691
Lake Deposits - Glacial LakeMinnesota
Till - Des Moines Lobe (highshale member)
Till - Des Moines Lobe (lowshale member)
Outwash - Des Moines orRainy Lobe?
Till & outwash - ice contactdeposits Des Moines orRainy Lobe?
Till - Browerville Formation
Till - Unamed low tomoderate carbonate (Rainysource)
Eau Claire Formation
Mt. Simon sandstone
Granite/Gniess
Grout
Waterlevel
4-inchcasing
Wellscreen
Grout
Waterlevel
4-inchcasing
Openhole

92 South-Central Minnesota Groundwater Monitoring of the Mt. Simon Aquifer
Site Name
County
ElevationDepth Lithology Gamma0 250
MN Unique
Nested Well Construction
Geological / Geophysical Logs and Well Construction Diagrams
900
800
700
600
500
400
0
100
200
300
400
500
600
Sibley County Landfill
Sibley
770441770440
Top Soil
Till - New Ulm Formation
Lake deposits - Undiff.
Till - Traverse des Sioux Fm
Till - Browerville Formation
Till - Unnamed carbonate-rich formation (northwestsource)
Outwash - Undifferentiated
Outwash - Unnamed low tomoderate carbonateformation (northeast Rainysource)
Lake deposit -Undifferentiated
Outwash - Undifferentiated
Lake deposit -Undifferentiated
Mount Simon Sandstone(Middle Cambrian)
Fond du Lac (?)Mesoproterozoic
Grout
Waterlevel
4-inchcasing
WellScreen
Grout
Waterlevel
4 inchcasing
Openhole
Firstboring(270298sealed)