Embed Size (px)
Citation preview

South Carolina
Traffic Collision
Fact Book
2015

Intentionally Left Blank

TABLE OF CONTENTS
South Carolina Traffic Collision Fact Book 2015 South Carolina Department of Public Safety
TABLE OF CONTENTS
Part I - GENERAL INFORMATION ..............................................................................................5
Quick Facts .....................................................................................................................6
Ten Year Traffic Trends ....................................................................................................7
Traffic Collisions, Fatalities and Injuries – 40 Years ...............................................................8
Mileage Death Rate and Vehicle Miles of Travel – 40 Years .....................................................8
SC vs. US Traffic Fatality Rates .........................................................................................9
Traffic Collisions by Primary Contributing Factor ............................................................ 10-12
Traffic Collisions by First Harmful Event ....................................................................... 13-14
Primary Contributing Factor and First Harmful Event Narrative ............................................ 15
Part II - COLLISION CHARACTERISTICS ................................................................................... 16
A. The Driver ............................................................................................................ 17
South Carolina Drivers Licensed by Age and Gender ................................................. 18
Age and Gender of Drivers Involved in Traffic Collisions ............................................ 19
Out-of-State Drivers Involved in SC Traffic Collisions ................................................ 20
Drivers Involved in Fatal Collisions by Route Category and License State ..................... 21
B. Time ................................................................................................................... 22
Traffic Collisions by Time of Day ............................................................................. 23
Traffic Collisions by Day of Week ............................................................................ 24
Traffic Collisions by Month ..................................................................................... 25
Time, Day, Month ................................................................................................. 26
Holiday Traffic Fatalities ................................................................................... 27-28
South Carolina Traffic Fatality Calendar .............................................................. 29-30
C. Location .............................................................................................................. 31
Traffic Collisions by Investigating Agency Type ........................................................ 32
South Carolina by Highway Patrol Troops ................................................................ 33
Fatality and Collision Rate per Vehicle Miles Traveled ................................................ 34
Traffic Collisions by Route Category ........................................................................ 35
Traffic Collisions on Interstates ............................................................................... 36
Traffic Collisions by Harmful Event Location and Junction Type ................................... 37
D. Environment ........................................................................................................ 38
Traffic Collisions by Road Surface, Weather and Light Conditions ................................ 39
Traffic Collisions by Traffic Control Type, Trafficway and Road Character ..................... 40
Traffic Collisions by Work Zone Type, Location, Workers Present, and Crosswalk ........... 41

TABLE OF CONTENTS
South Carolina Traffic Collision Fact Book 2015 South Carolina Department of Public Safety
TABLE OF CONTENTS (cont.)
E. Units .................................................................................................................. 42
SC Motor Vehicle Registrations by County ............................................................... 43
Unit Types and Vehicle Use Involved in Traffic Collisions ........................................... 44
Most Harmful Event for Units Involved in Traffic Collisions ......................................... 45
Unit Action Prior to Impact in All Traffic Collisions ..................................................... 46
Traffic Collisions Involving Motorcycles ............................................................... 47-50
Traffic Collisions Involving Motorized Bikes ......................................................... 51-52
Traffic Collisions Involving Pedalcycles ................................................................ 53-54
Traffic Collisions Involving School Buses ............................................................. 55-56
Traffic Collisions Involving Pedestrians ............................................................... 57-58
Traffic Collisions Involving Trains ...................................................................... 59-60
Traffic Collisions Involving SUV’s ....................................................................... 61-62
Traffic Collisions Involving Truck Tractors ........................................................... 63-64
Traffic Collisions Involving Full-Size and Mini-Vans .............................................. 65-66
Traffic Collisions Involving Pickup Trucks ............................................................ 67-68
Part III - COLLISION CONSEQUENCES ....................................................................................... 69
Traffic Collision Victim Profile ................................................................................. 70
Traffic Injuries by Restraint Usage and Air Bag Deployment ........................................ 71
Ejection Status and/or Extrication .......................................................................... 72
Location After Impact ........................................................................................... 72
Transported to Medical Facility and Restraint Use for Children Under Six ...................... 73
Motor Vehicle Occupant Fatalities by Seating Location ............................................... 74
Part IV - DRIVING UNDER THE INFLUENCE ............................................................................... 75
NHTSA’s Estimated Alcohol Impaired Driving Fatalities by County ................................ 76
NHTSA’s Alcohol Impaired Driving Fatalities by South Carolina and the U.S. ................. 77
Driver BAC Reporting in Fatal Collisions ................................................................... 78
State Non-Fatal DUI Collisions by County – 5 Years ................................................... 79
State Non-Fatal DUI Collisions by Route Category and Day of Week ............................ 80
State Non-Fatal DUI Collisions by Month and Time of Day .......................................... 80
Part V - COUNTIES ................................................................................................................... 81
SC Motor Vehicle Traffic Collisions by County ............................................................ 82 Vehicle Miles of Travel (VMT) and VMT Death Rate by County ..................................... 83 Traffic Collision Summaries by County ...............................................................84-129
TRAFFIC COLLISION REPORT FORM (TR-310) ....................................................130-131 DEFINITIONS .....................................................................................................132-133
INDEX .................................................................................................................134-135 ACKNOWLEDGMENTS .................................................................................................. 136
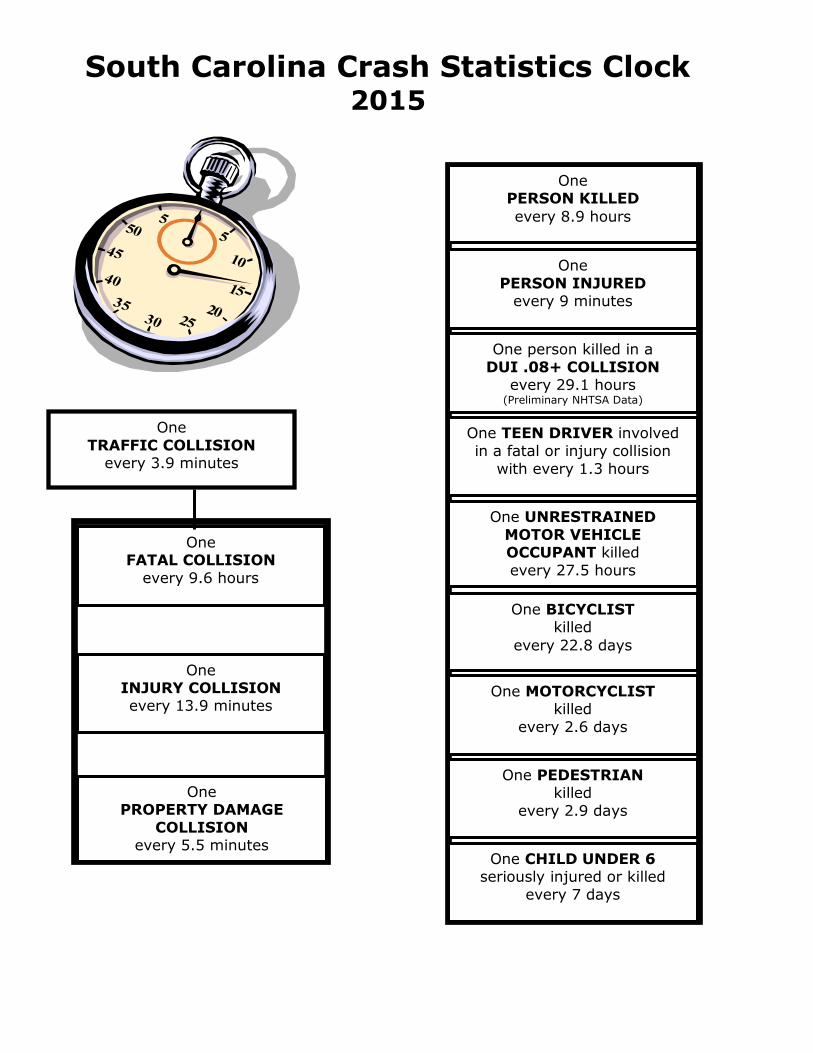
South Carolina Crash Statistics Clock 2015
One
PERSON INJURED every 9 minutes
One PERSON KILLED
every 8.9 hours
One person killed in a
DUI .08+ COLLISION every 29.1 hours
(Preliminary NHTSA Data)
One TEEN DRIVER involved
in a fatal or injury collision
with every 1.3 hours
One UNRESTRAINED
MOTOR VEHICLE OCCUPANT killed
every 27.5 hours
One BICYCLIST killed
every 22.8 days
One MOTORCYCLIST killed
every 2.6 days
One PEDESTRIAN killed
every 2.9 days
One CHILD UNDER 6 seriously injured or killed
every 7 days
One PROPERTY DAMAGE
COLLISION every 5.5 minutes
One INJURY COLLISION every 13.9 minutes
One
TRAFFIC COLLISION every 3.9 minutes
One FATAL COLLISION
every 9.6 hours

Intentionally Left Blank

PART I – GENERAL INFORMATION
South Carolina Traffic Collision Fact Book 2015
South Carolina Department of Public Safety
5
In accordance with Section 56-5-1350 of the South Carolina Code of Laws,
a tabulation and analysis of collision reports has been completed for the
year 2015 as disclosed in this publication.
The number of traffic fatalities increased from 823 in 2014 to 979 in 2015,
a 19% increase. There was also an increase in the mileage death rate
(MDR) as well. It increased to 1.89 deaths per hundred million vehicle
miles of travel from 1.65 in 2014.
Traffic fatalities are the most severe consequence of motor vehicle
collisions, but even in non-fatal collisions, the cost in human suffering can
be severe. There were 58,604 reported traffic injuries in 2015, up 10.5%
from 2014.
Traffic collisions are responsible for billions of dollars in economic loss to
South Carolina each year. Economic loss as estimated in this publication
includes property damage, medical costs and lost productivity, but does
not include intangible costs such as grief and suffering. In 2015, $4.12
billion dollars in estimated loss was incurred which is a 15% increase from
2014.
What is responsible for the tragedy of motor vehicle collisions and what
strategies should concerned individuals employ in the reduction of
collisions in the future? On the following pages, statistics are presented
which describe the characteristics, causes and effects of traffic collisions in
South Carolina. It is hoped that this information will be useful to all
persons interested in fostering a safer operating environment for motorists
in South Carolina.
All collision statistics included in this publication are based on the Uniform
Traffic Collision Report Forms (TR-310) received from investigating
officers. By law, any collision that results in at least $1,000 in total
property damage, or results in injury or death and occurs on a public
highway must be reported to the South Carolina Department of Public
Safety on the appropriate form. If these collisions occur on private
property or are reported on any form other than the TR-310, they are
excluded.
The statistics contained in the South Carolina Traffic Collision Fact Book
are based on the latest available information at the time that they were
compiled. Due to the complex nature of the data, occasionally new
information is received after the publication cut-off date. It is therefore
possible that some discrepancies may exist between the data published
here and other sources.
Part
I –
Gen
eral
In
form
ati
on

6South Carolina Department of Public Safety
South Carolina Traffic Collision Fact Book 2015
PART I - GENERAL INFORMATION
SOUTH CAROLINA TRAFFIC COLLISON QUICK FACTS 2015
Collision Statistics 2011 2012 2013 2014 2015
%Change
2011 - 2015
%Change
2014 - 2015Fatal Collisions 768 806 719 756 911 18.6% 20.5%Injury Collisions 29,756 32,325 32,854 34,062 37,861 27.2% 11.2%Property Damage Only Collisions 71,318 75,130 79,687 84,355 95,189 33.5% 12.8%Total Collisions 101,842 108,261 113,260 119,173 133,961 31.5% 12.4%Fatalities 828 863 767 823 979 18.2% 19.0%Non-fatal Injuries 46,057 50,064 50,938 53,029 58,604 27.2% 10.5%
Fatalities From CollisionsInvolving*: 2011 2012 2013 2014 2015
%Change
2011 - 2015
%Change
2014 - 2015Automobile 426 442 380 429 500 17.4% 16.6%Pickup Truck 196 201 185 212 250 27.6% 17.9%Truck Tractor 73 69 49 47 88 20.5% 87.2%Other Truck 21 18 15 20 35 66.7% 75.0%Full Size Van 14 20 24 8 28 100.0% 250.0%Mini Van 41 33 26 33 46 12.2% 39.4%SUV 204 213 188 221 264 29.4% 19.5%Motorcycle 104 109 127 89 141 35.6% 58.4%Other Motorbike 23 38 25 32 45 95.7% 40.6%Pedalcycle 16 14 15 14 16 0.0% 14.3%Animal Drawn Vehicle 0 0 0 0 0 0.0% 0.0%Animal - Ridden 0 0 0 0 0 0.0% 0.0%Pedestrian 113 125 100 110 131 15.9% 19.1%Train 4 0 2 2 5 25.0% 150.0%School Bus 0 4 7 1 3 0.0% 200.0%Passenger Bus 1 2 3 0 2 100.0% 0.0%Other 4 11 8 9 11 175.0% 22.2%Unknown (Hit & Run Only) 9 14 9 5 7 -22.2% 40.0%
Other Statistics 2011 2012 2013 2014 2015
%Change
2011 - 2015
%Change
2014 - 2015Economic Loss (billions) $2.71 $2.87 $2.90 $3.77 $4.32 59.4% 14.7%Vehicle Miles Traveled (billions) 48.73 48.90 48.99 49.95 51.72 6.1% 3.6%Roadway Miles 65,997 66,244 66,232 76,301 76,250 15.5% -0.1%Motor Vehicle Registrations 3,998,948 4,050,858 4,192,087 4,229,277 4,336,240 8.4% 2.5%Licensed Drivers 3,471,654 3,532,421 3,607,101 3,668,378 3,748,514 8.0% 2.2%Mileage Injury Rate** 94.51 102.38 103.98 106.16 113.30 19.9% 6.7%Mileage Death Rate*** 1.70 1.76 1.57 1.65 1.89 11.4% 14.9%Registration Fatality Rate@ 207.05 213.04 182.96 194.60 225.77 9.0% 16.0%
*Includes all fatalities of all unit types in the collisions**Traffic injuries per 100 million vehicle miles of travel***Traffic fatalities per 100 million vehicle miles of travel@Traffic fatalities per million registered vehicles
Data Sources:Economic Loss Formula: National Safety CouncilVehicle Miles Traveled and Roadway Miles: South Carolina Department of TransportationMotor Vehicle Registrations and Licensed Drivers: South Carolina Department of Motor Vehicles

PART I - GENERAL INFORMATION
TEN YEAR TRAFFIC COLLISION TRENDS 2006 - 2015
7South Carolina Department of Public Safety
South Carolina Traffic Collision Fact Book 2015
MOTOR VEHICLE REGISTRATIONSMillions of Vehicles
3.703.83 3.88 3.91 3.95 4.00 4.05
4.19 4.23 4.34
2006 2007 2008 2009 2010 2011 2012 2013 2014 2015
VEHICLE MILES TRAVELEDBillions of Miles
49.80 50.5849.06 48.60 49.12 48.73 48.90 48.99 49.95
51.72
2006 2007 2008 2009 2010 2011 2012 2013 2014 2015
INJURIESThousands of Injuries
50.1 49.346.9 48.3 48.7
46.150.1 50.9
53.0
58.6
2006 2007 2008 2009 2010 2011 2012 2013 2014 2015
TRAFFIC FATALITIESNumber of Fatalities
1,0441,077
921894
809 828863
767823
979
2006 2007 2008 2009 2010 2011 2012 2013 2014 2015
LICENSED DRIVERSMillions of Drivers
3.10 3.15 3.213.34 3.41 3.47 3.53 3.61 3.67 3.75
2006 2007 2008 2009 2010 2011 2012 2013 2014 2015
ECONOMIC LOSSBillions of Dollars
2.82 2.84 2.71 2.67 2.74 2.712.87 2.90
3.77
4.32
2006 2007 2008 2009 2010 2011 2012 2013 2014 2015
MILEAGE DEATH RATEDeaths per 100 Million Vehicle Miles
2.10 2.13
1.88 1.841.65 1.70 1.76
1.571.65
1.89
2006 2007 2008 2009 2010 2011 2012 2013 2014 2015
MOTOR VEHICLE COLLISIONSThousands of Collisions
112.9 112.1107.3 106.9 107.7
101.8108.3
113.3119.2
134.0
2006 2007 2008 2009 2010 2011 2012 2013 2014 2015
8South Carolina Department of Public Safety
South Carolina Traffic Collision Fact Book 2015
PART I - GENERAL INFORMATION
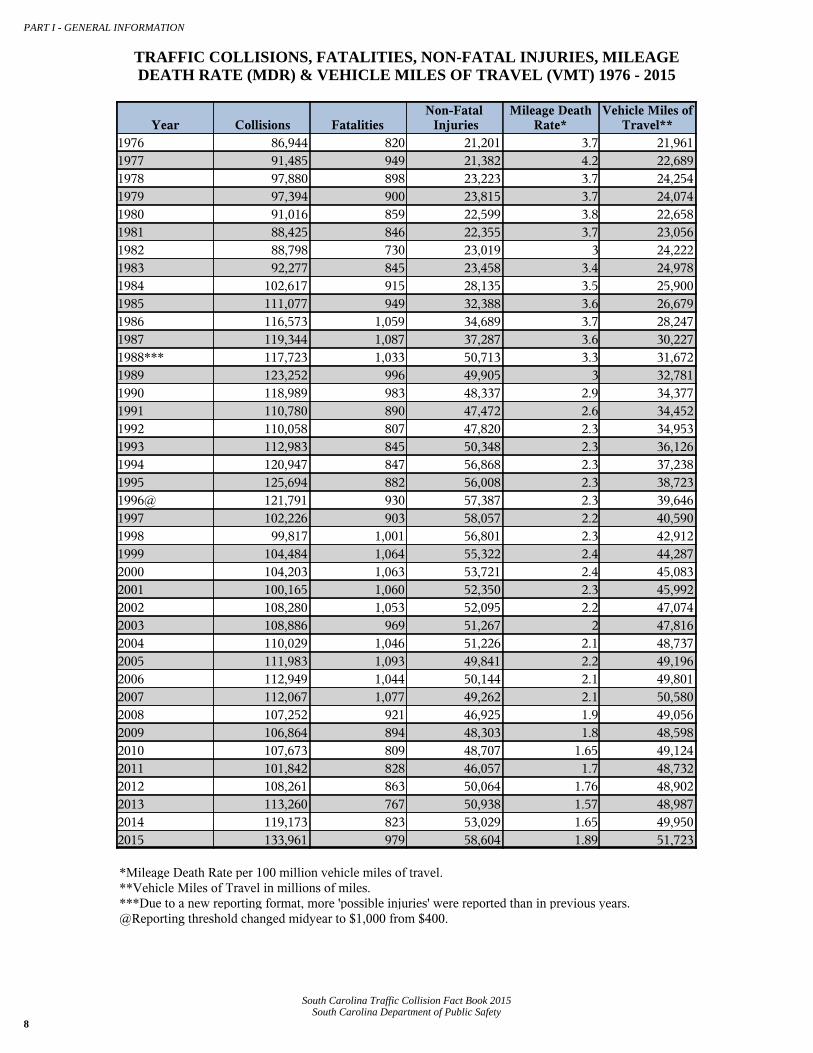
TRAFFIC COLLISIONS, FATALITIES, NON-FATAL INJURIES, MILEAGEDEATH RATE (MDR) & VEHICLE MILES OF TRAVEL (VMT) 1976 - 2015
Year Collisions FatalitiesNon-Fatal
InjuriesMileage Death
Rate*Vehicle Miles of
Travel**1976 86,944 820 21,201 3.7 21,9611977 91,485 949 21,382 4.2 22,6891978 97,880 898 23,223 3.7 24,2541979 97,394 900 23,815 3.7 24,0741980 91,016 859 22,599 3.8 22,6581981 88,425 846 22,355 3.7 23,0561982 88,798 730 23,019 3 24,2221983 92,277 845 23,458 3.4 24,9781984 102,617 915 28,135 3.5 25,9001985 111,077 949 32,388 3.6 26,6791986 116,573 1,059 34,689 3.7 28,2471987 119,344 1,087 37,287 3.6 30,2271988*** 117,723 1,033 50,713 3.3 31,6721989 123,252 996 49,905 3 32,7811990 118,989 983 48,337 2.9 34,3771991 110,780 890 47,472 2.6 34,4521992 110,058 807 47,820 2.3 34,9531993 112,983 845 50,348 2.3 36,1261994 120,947 847 56,868 2.3 37,2381995 125,694 882 56,008 2.3 38,7231996@ 121,791 930 57,387 2.3 39,6461997 102,226 903 58,057 2.2 40,5901998 99,817 1,001 56,801 2.3 42,9121999 104,484 1,064 55,322 2.4 44,2872000 104,203 1,063 53,721 2.4 45,0832001 100,165 1,060 52,350 2.3 45,9922002 108,280 1,053 52,095 2.2 47,0742003 108,886 969 51,267 2 47,8162004 110,029 1,046 51,226 2.1 48,7372005 111,983 1,093 49,841 2.2 49,1962006 112,949 1,044 50,144 2.1 49,8012007 112,067 1,077 49,262 2.1 50,5802008 107,252 921 46,925 1.9 49,0562009 106,864 894 48,303 1.8 48,5982010 107,673 809 48,707 1.65 49,1242011 101,842 828 46,057 1.7 48,7322012 108,261 863 50,064 1.76 48,9022013 113,260 767 50,938 1.57 48,9872014 119,173 823 53,029 1.65 49,9502015 133,961 979 58,604 1.89 51,723
*Mileage Death Rate per 100 million vehicle miles of travel.**Vehicle Miles of Travel in millions of miles.***Due to a new reporting format, more 'possible injuries' were reported than in previous years.@Reporting threshold changed midyear to $1,000 from $400.

0
0.2
0.4
0.6
0.8
1
1.2
1.4
1.6
1.8
2
2.2
2.4
2.6
2.8
3
3.2
3.4
3.6
3.8
4
1991
1992
1993
1994
1995
1996
1997
1998
1999
2000
2001
2002
2003
2004
2005
2006
2007
2008
2009
2010
2011
2012
2013
2014
2015
PART I - GENERAL INFORMATION
MILEAGE DEATH RATE (FATALITIES PER 100 MILLION VEHICLE MILES TRAVELED)SOUTH CAROLINA vs. NATIONAL AVERAGE
25 YEAR TREND 1991-2015
9South Carolina Department of Public Safety
South Carolina Traffic Collision Fact Book 2015
Source for U.S. data: National Highway Traffic Safety Administration (NHTSA)
SC US

PART I - GENERAL INFORMATION
10South Carolina Department of Public Safety
South Carolina Traffic Collision Fact Book 2015
NON-FATAL COLLISIONS BY PRIMARY CONTRIBUTING FACTOR
111,491 125,754
3,647 3,930543 536925 925 1,811 1,905
Collisions
0
20,000
40,000
60,000
80,000
100,000
Driver Roadway Non-Motorist Environmental Vehicle Defect
2014 2015 2014 2015 2014 2015 2014 2015 2014 2015
FATAL COLLISIONS BY PRIMARY CONTRIBUTING FACTOR
636
768
13 11
96 110
1 3 10 19
Collisions
0
100
200
300
400
500
600
700
800
Driver Roadway Non-Motorist Environmental Vehicle Defect
2014 2015 2014 2015 2014 2015 2014 2015 2014 2015

11South Carolina Department of Public Safety
South Carolina Traffic Collision Fact Book 2015
PART I - GENERAL INFORMATION
PRIMARY CONTRIBUTING FACTORS IN SC TRAFFIC COLLISIONS
CONTRIBUTING FACTORFatal
CollisionInjury
CollisionPDO*
CollisionTotal
CollisionPersonsKilled
PersonsInjured
Disregarded Signs/Signals/Etc. 41 2,337 3,291 5,669 44 4,122Distracted/Inattention 13 2,062 6,837 8,912 13 3,067Driving Too Fast for Conditions 197 11,481 28,915 40,593 216 17,376Exceeded Authorized Speed Limit 29 179 216 424 32 256Failed To Yield Right of Way 100 8,356 17,440 25,896 107 14,075Ran Off Road 45 726 1,305 2,076 47 965Fatigued/Asleep 1 229 367 597 1 305Followed Too Closely 2 2,272 7,780 10,054 2 3,316Made an Improper Turn 7 510 2,387 2,904 7 806Medical Related 4 590 255 849 4 742Aggressive Operation of Vehicle 27 397 710 1,134 30 624Over-Correcting/Over-Steering 7 94 219 320 8 125Swerving To Avoid Object 0 128 271 399 0 188Wrong Side/Wrong Way 58 817 1,224 2,099 64 1,611Driver Under Influence 182 2,571 2,752 5,505 197 3,763Vision Obscured (Within Unit) 0 20 168 188 0 27Improper Lane Usage/Change 22 1,456 8,410 9,888 24 2,179On Cell Phone 0 21 51 72 0 28Texting 0 16 44 60 0 18Other Improper Action 16 945 5,246 6,207 16 1,342Unknown 17 615 2,044 2,676 23 863DRIVER SUBTOTALS 768 35,822 89,932 126,522 835 55,798Debris 1 63 349 413 1 81Non-Highway Work 0 0 3 3 0 0Obstruction In Roadway 1 59 189 249 1 85Road Surface Condition (i.e. Wet) 0 41 86 127 0 53Rut, Holes, Bumps 0 18 42 60 0 20Shoulders (None,Low,Soft,High) 0 0 4 4 0 0Traffic Control Device(i.e. Missing) 0 9 6 15 0 14Work Zone (Constr/Maintenance/Util) 1 1 6 8 1 1Worn, Travel-Polished Surface 0 1 0 1 0 1Other Roadway Factor 0 7 33 40 0 11Unknown 0 2 6 8 0 2ROADWAY SUBTOTALS 3 201 724 928 3 268Non-Motorist Inattentive 1 25 0 26 1 27Lying &/Or Illegally In Roadway 60 155 10 225 60 182Non-Motorist Failed To Yield ROW 7 69 2 78 7 70Not Visible (Dark Clothing) 4 25 1 30 4 28Non-Motorist Disregarded Signs/Signals/Etc. 0 10 0 10 0 10Improper Crossing 26 125 8 159 26 135Darting 7 35 2 44 7 36Wrong Side Of Road 0 25 0 25 0 26Other Non-Motorist Factor 1 13 0 14 1 13Non-Motorist Unknown 0 4 0 4 0 4Non-Motorist Under Influence 4 21 0 25 4 24Other Person Under Influence 0 5 1 6 0 6NON-MOTORIST SUBTOTAL 110 512 24 646 110 561
*Property Damage Only Table Continues on Next Page

12South Carolina Department of Public Safety
South Carolina Traffic Collision Fact Book 2015
PART I - GENERAL INFORMATION
CONTRIBUTING FACTORFatal
CollisionInjury
CollisionPDO*
CollisionTotal
CollisionPersonsKilled
PersonsInjured
Animal In Road 10 732 2,697 3,439 10 1,066Glare 0 20 66 86 0 24Obstruction 0 44 142 186 0 62Weather Condition 1 29 130 160 2 37Other Environmental Factor 0 17 47 64 0 22Unknown Environmental Factor 0 2 4 6 0 2ENVIROMENTAL SUBTOTAL 11 844 3,086 3,941 12 1,213Brakes 1 110 237 348 1 202Steering 0 38 87 125 0 54Power Plant 0 12 43 55 0 18Tires/Wheels 10 187 548 745 10 306Lights 3 37 35 75 3 55Signals 0 2 0 2 0 3Windows/Windshield 0 2 5 7 0 3Restraint Systems 0 0 3 3 0 0Truck Coupling 0 8 27 35 0 12Cargo 0 16 225 241 0 20Fuel System 0 3 13 16 0 3Other Vehicle Defect 3 49 150 202 3 62Unknown Vehicle Defect 2 18 50 70 2 26VEHICLE DEFECT SUBTOTAL 19 482 1,423 1,924 19 764TOTALS 911 37,861 95,189 133,961 979 58,604
*Property Damage Only

PART I - GENERAL INFORMATION
13South Carolina Department of Public Safety
South Carolina Traffic Collision Fact Book 2015
NON-FATAL COLLISIONS BY FIRST HARMFUL EVENT
21,411 23,727
93,503
105,576
3,503 3,747
Collision
0
10,000
20,000
30,000
40,000
50,000
60,000
70,000
80,000
90,000
100,000
110,000
Non-Collision Collision: Object Not Fixed Collision: Object Fixed
2014 2015 2014 2015 2014 2015
FATAL COLLISIONS BY FIRST HARMFUL EVENT
279
319
392
534
8558
Collision
0
50
100
150
200
250
300
350
400
450
Non-Collision Collision: Object Not Fixed Collision: Object Fixed
2014 2015 2014 2015 2014 2015

14South Carolina Department of Public Safety
South Carolina Traffic Collision Fact Book 2015
PART I - GENERAL INFORMATION
FIRST HARMFUL EVENT IN SC TRAFFIC COLLISIONS
FIRST HARMFUL EVENT (FHE)Fatal
CollisionInjury
CollisionPDO*
CollisionTotal
CollisionsPersonsKilled
PersonsInjured
Cargo/Equip Loss Or Shift 0 33 134 167 0 40Cross Median/Center Line 5 111 173 289 5 180Downhill Runaway 0 2 9 11 0 4Equipment Failure 0 47 136 183 0 70Fire/Explosion 1 5 7 13 4 6Immersion 1 6 26 33 2 10Jackknife 1 4 32 37 1 7Overturn/Rollover 34 932 862 1,828 35 1,312Separation Of Units 1 9 30 40 1 15Spill (Two Wheel Vehicle) 13 581 71 665 13 633Other Non-Collision 2 112 165 279 2 137Unknown Non-Collision 0 83 177 260 0 117NON-COLLISION SUBTOTAL 58 1,925 1,822 3,805 63 2,531Animal (Deer Only) 5 345 1,815 2,165 5 467Animal (Not Deer) 3 94 353 450 3 132Motor Vehicle (In Transport) 363 19,855 51,100 71,318 398 33,515Motor Vehicle (Stopped) 26 6,266 21,239 27,531 32 9,825Motor Vehicle (Other Roadway) 0 48 76 124 0 99Motor Vehicle (Parked) 6 302 2,088 2,396 6 399Pedalcycle 16 359 20 395 16 371Pedestrian 110 622 19 751 110 694Railway Vehicle 3 7 11 21 4 8Work Zone Maint. Equip. 0 12 22 34 0 13Other Movable Object 2 117 745 864 2 147Unknown Movable Object 0 7 54 61 0 9COLLISION: OBJECT NOT FIXED SUBTOTAL 534 28,034 77,542 106,110 576 45,679Bridge Overhead Structure 0 7 40 47 0 12Bridge Parapet End 0 6 11 17 0 7Bridge Pier Or Abutment 0 9 16 25 0 12Bridge Rail 2 49 104 155 2 67Culvert 19 169 231 419 20 214Curb 10 266 659 935 11 313Ditch 69 2,123 3,948 6,140 71 2,757Embankment 12 553 823 1,388 12 710Equipment 0 10 36 46 0 12Fence 7 248 716 971 7 316Guardrail End 9 113 236 358 11 153Guardrail Face 14 318 855 1,187 14 438HWY Traffic Sign Post 13 230 691 934 14 287Impact Attenuator/Crash Cushion 0 5 23 28 0 5Light Luminaire Support 0 29 56 85 0 34Mailbox 19 290 669 978 19 348Median Barrier 11 336 1,452 1,799 16 438Overhead Sign Support 1 1 6 8 1 1Other (Post,Pole,Support,Etc.) 8 195 533 736 8 253Other (Wall,Bldg,Tunnel,Etc.) 2 137 319 458 2 168Tree 109 2,119 2,908 5,136 114 3,000Utility Pole 8 502 876 1,386 10 612Workzone Maint. Equip. 1 1 9 11 2 2Other 5 173 568 746 6 218Unknown Fixed Object 0 13 40 53 0 17COLLISION: OBJECT FIXED SUBTOTAL 319 7,902 15,825 24,046 340 10,394TOTALS 911 37,861 95,189 133,961 979 58,604
*Property Damage Only

PART I – GENERAL INFORMATION
South Carolina Traffic Collision Fact Book 2015
South Carolina Department of Public Safety
15
PRIMARY CONTRIBUTING FACTOR
The 2015 South Carolina Traffic Collision Fact Book reports on the primary contributing factor (definition on page 133) in a traffic collision. This
information comes directly from the collision report form filled out by the investigating officer. It is important to realize that while the report form has
a field for primary contributing factor; it can also report up to four (4) other contributing factors for each collision. Thus, we rely on the investigating officer’s judgment as to the primary contributing factor for a collision.
Some action (or inaction) by one or more of the drivers was cited as the primary contributing
factor in 126,522 of the 133,961 reported traffic collisions in 2015. This accounted for 94.4%
of all primary contributing factors. Environmental factors accounted for the next largest
category of collision causes with 3,941 or 2.9% of the total. The vast majority of these
(3,941) involved an “Animal in the Roadway,” and accounted for 2.6% of all collisions. The
“Non-Motorist”, “Road” and “Vehicle” categories together accounted for only 2.6% of all
reported traffic collisions in 2015.
For fatal collisions in 2015, some type of driver error was considered the primary contributing
factor in 768 of the 911 collisions, accounting for 84.3% of all collisions in which someone was
killed. The specific causes of fatal collisions were quite different from all collisions. The
leading primary contributing factor of fatal collisions was “Driving Too Fast for Conditions" with
197 collisions (21.6%). A close second was “Driving Under the Influence” with 182 collisions
(20.0%). The next leading factors were “Failed to Yield Right of Way”, “Lying and/or Illegally
in Roadway”, and “Wrong Side/Wrong Way” with 100, 60, and 58 fatal collisions, respectively.
The proportion of "Non-Motorist" causes was much higher in fatal collisions (12.1%) as
compared to property damage only collisions (0.03%).
FIRST HARMFUL EVENT
The first harmful event (FHE) in a traffic collision is defined as the first occurrence of injury or
damage in a collision. In 2015, the FHE in 106,110 of the 133,961 reported traffic collisions
(79.2%) involved some type of collision between a motor vehicle in transport and an object
not fixed. The top two FHE’s, both involving a collision with an object not fixed, were “Collision
with Motor Vehicle in Transport,” 71,318 (67.2% of the collisions with an object not fixed) and
“Collision with Stopped Vehicle,” 27,531 (25.9% of the collisions with an object not fixed). The
third top FHE was “Ditch” in the “Collision with Fixed Object” group, with 6,140 collisions
(4.6% of all collisions). Combined, these three accounted for 78.4% of all reported collisions.
“Collisions with an Object Not Fixed” accounted for a substantially smaller percentage of the
fatal collisions (58.6%) than the property damage only collisions (81.5%). Collisions involving
a “Collision with a Fixed Object” accounted for a substantially greater percentage of the fatal
collisions (35.0%) than for property damage only (16.6%). The leading FHE in fatal collisions
was "Collision with Motor Vehicle in Transport” with 363 (39.8%); the second leading FHE in
fatal collisions was "Pedestrian" with 110 (12.1%).

PART II- COLLISION CHARACTERISTICS
South Carolina Traffic Collision Fact Book 2015
South Carolina Department of Public Safety
16
There are many characteristics associated with traffic collisions. Patterns in
these characteristics can provide insight into the cause of collisions and may
ultimately lead to effective countermeasures for reducing the number of
collisions that occur and minimizing the severity of those that will still occur.
The data provided on the following pages may raise interesting questions for
those interested in highway safety. These questions may in turn lead to
research, which addresses a particular collision characteristic. Here are some
examples of traffic collision characteristics for 2015:
A. Driver
Male drivers between the ages of 20 and 24 continue to be
over represented in fatal collisions. In 2015, male drivers in
this age group represented 3.9% of all licensed drivers and
8.3% of drivers involved in fatal collisions.
Male drivers made up 70.4% and female drivers made up
26.3% of the drivers involved in fatal collisions (3.3% of
drivers’ gender was unknown).
B. Time
More than 62.3% of fatal collisions occurred between the
hours of 3:01 p.m. and 3:00 a.m.
The months of October, July, and August have the most
fatal collisions with 110, 83, and 79 respectively.
More traffic deaths occurred on Monday, Tuesday,
Wednesday, and Thursday than Friday, Saturday, and
Sunday.
The leading Holiday Period for fatalities in 2015 was the
Christmas Holiday with 9 fatal collisions and 10 fatalities.
(Thanksgiving also had 9 fatal collisions with 9 fatalities)
C. Location
More fatal collisions (315 or 34.6%) and deaths (327 or
33.4%) occurred on state secondary routes than on any
other route category.
There were 98 fatal collisions on South Carolina Interstates
resulting in 122 persons killed.
D. Environment
More than 83.5% of all traffic collisions occurred during
clear or cloudy weather conditions.
About 79.0% of all collisions occurred on a dry road surface.
There were 15 persons killed in work zone collisions in 2015.
E. Vehicles
Automobiles made up about 51.8% of all units involved in
traffic collisions during 2015.
There were 1,383 units defined as motor vehicles involved
in fatal traffic collisions. Automobiles, pickup trucks, and
SUV’s made up 76.3% of the motor vehicles involved in fatal
crashes.
Part
II –
Co
llis
ion
Ch
aracte
ris
tics

PART II – COLLISION CHARACTERISTICS – SECTION A
South Carolina Traffic Collision Fact Book 2015
South Carolina Department of Public Safety
17
Numerous decisions are required of drivers while operating a motor vehicle. All too
often, poor judgment, inattention or carelessness on the part of a driver results in a
dangerous driving decision, which leads to a traffic collision. The primary contributing
factor in 94.4% of all reported traffic crashes was driver-related in 2015.
Enumerated on the following pages are the numbers of licensed drivers by age and
gender and the number of drivers involved in collisions by age and gender.
In 2015, about one out of every 8 (12.1%) of all SC licensed male drivers
between the ages of 15 and 24 years of age was involved in a traffic collision.
About one in 9 (10.8%) of the SC female drivers in the same age group were
involved in collisions.
For the entire SC licensed population, approximately one out of every 18 (5.5%)
of SC drivers was involved in a collision during the year.
Male drivers accounted for 70.4% of the drivers in fatal crashes.
Out of state Drivers account for 10.7% of drivers in traffic collisions. North Carolina, Georgia, and Florida drivers made up 58.7% of the out of state drivers.
A. THE DRIVER

18South Carolina Department of Public Safety
South Carolina Traffic Collision Fact Book 2015
PART II - COLLISION CHARACTERISTICS - SECTION A
LICENSED DRIVERS BY AGE AND GENDER*
Age Male % Female % Unknown % Total %14** 16 0.0% 6 0.0% 0 0.0% 22 0.0%15 13,603 0.4% 14,241 0.4% 0 0.0% 27,844 0.7%16 19,358 0.5% 19,663 0.5% 1 0.0% 39,022 1.0%17 22,597 0.6% 22,799 0.6% 2 0.0% 45,398 1.2%18 25,206 0.7% 24,509 0.7% 3 0.0% 49,718 1.3%19 26,227 0.7% 25,746 0.7% 3 0.0% 51,976 1.4%20 27,008 0.7% 26,844 0.7% 1 0.0% 53,853 1.4%21 27,816 0.7% 27,688 0.7% 7 0.0% 55,511 1.5%22 28,511 0.8% 29,026 0.8% 2 0.0% 57,539 1.5%23 29,741 0.8% 31,253 0.8% 3 0.0% 60,997 1.6%24 30,824 0.8% 32,563 0.9% 1 0.0% 63,388 1.7%25-29 156,527 4.2% 167,980 4.5% 10 0.0% 324,517 8.7%30-34 147,585 4.0% 160,672 4.3% 8 0.0% 308,265 8.3%35-39 139,429 3.7% 151,523 4.1% 9 0.0% 290,961 7.8%40-44 139,919 3.8% 149,506 4.0% 20 0.0% 289,445 7.8%45-49 147,160 4.0% 156,252 4.2% 19 0.0% 303,431 8.1%50-54 155,207 4.2% 168,778 4.5% 22 0.0% 324,007 8.7%55-59 151,461 4.1% 168,437 4.5% 28 0.0% 319,926 8.6%60-64 141,171 3.8% 160,918 4.3% 12 0.0% 302,101 8.1%65-69 135,196 3.6% 148,829 4.0% 18 0.0% 284,043 7.6%70-74 97,639 2.6% 104,710 2.8% 21 0.0% 202,370 5.4%75-79 61,220 1.6% 66,796 1.8% 8 0.0% 128,024 3.4%80-84 37,745 1.0% 42,771 1.1% 8 0.0% 80,524 2.2%85 & Over 28,206 0.8% 33,848 0.9% 6 0.0% 62,060 1.7%Other &Unknown
2 0.0% 1 0.0% 1 0.0% 4 0.0%
TOTAL 1,789,374 48.0% 1,935,359 52.0% 213 0.0% 3,724,946 100.0%
*Figures provided by the South Carolina Department of Motor Vehicle - these figures were provided at adifferent time and therefore will not have the same total as what is posted on the DMV web site and page 6.**Moped License Only

19South Carolina Department of Public Safety
South Carolina Traffic Collision Fact Book 2015
PART II - COLLISION CHARACTERISTICS - SECTION A
AGE AND GENDER OF DRIVERS OF MOTOR VEHICLESINVOLVED IN REPORTED SC TRAFFIC COLLISIONS*
DRIVERS IN TOTAL COLLISIONSAGE FEMALE MALE UNKNOWN TOTAL
Under 15 29 40 1 7015 to 19 11,244 12,637 2 23,88320 to 24 16,176 17,842 6 34,02425 to 29 13,612 14,798 5 28,41530 to 34 11,033 12,153 12 23,19835 to 39 9,275 10,273 2 19,55040 to 44 8,505 9,940 5 18,45045 to 49 7,732 9,445 2 17,17950 to 54 7,421 9,563 2 16,98655 to 59 6,607 8,512 1 15,12060 to 64 5,324 7,266 1 12,59165 to 69 4,344 5,789 4 10,13770 to 74 2,884 3,794 2 6,68075 to 79 1,703 2,374 0 4,07780 to 84 1,056 1,419 0 2,47585 & Older 599 839 0 1,438Unknown* 372 1,230 13,108 14,710TOTALS 107,916 127,914 13,153 248,983
DRIVERS IN FATAL COLLISIONSAGE FEMALE MALE UNKNOWN TOTAL
Under 15 0 0 0 015 to 19 32 59 0 9120 to 24 60 116 0 17625 to 29 45 114 0 15930 to 34 34 88 0 12235 to 39 34 93 0 12740 to 44 17 85 0 10245 to 49 26 74 0 10050 to 54 35 89 0 12455 to 59 27 79 0 10660 to 64 17 67 0 8465 to 69 15 53 0 6870 to 74 10 22 0 3275 to 79 9 21 0 3080 to 84 3 13 0 1685 & Older 2 9 0 11Unknown* 0 0 46 46TOTALS 366 982 46 1,394
DRIVERS IN INJURY COLLISIONSAGE FEMALE MALE UNKNOWN TOTAL
Under 15 8 22 0 3015 to 19 3,141 3,247 1 6,38920 to 24 4,589 5,018 2 9,60925 to 29 4,039 4,192 1 8,23230 to 34 3,295 3,384 3 6,68235 to 39 2,621 2,821 0 5,44240 to 44 2,417 2,663 2 5,08245 to 49 2,262 2,624 0 4,88650 to 54 2,217 2,732 0 4,94955 to 59 1,956 2,418 0 4,37460 to 64 1,496 2,003 1 3,50065 to 69 1,241 1,675 2 2,91870 to 74 824 1,023 1 1,84875 to 79 464 659 0 1,12380 to 84 326 394 0 72085 & Older 174 245 0 419Unknown* 83 339 2,667 3,089TOTALS 31,153 35,459 2,680 69,292
DRIVERS IN PDO** COLLISIONSAGE FEMALE MALE UNKNOWN TOTAL
Under 15 21 18 1 4015 to 19 8,071 9,331 1 17,40320 to 24 11,527 12,708 4 24,23925 to 29 9,528 10,492 4 20,02430 to 34 7,704 8,681 9 16,39435 to 39 6,620 7,359 2 13,98140 to 44 6,071 7,192 3 13,26645 to 49 5,444 6,747 2 12,19350 to 54 5,169 6,742 2 11,91355 to 59 4,624 6,015 1 10,64060 to 64 3,811 5,196 0 9,00765 to 69 3,088 4,061 2 7,15170 to 74 2,050 2,749 1 4,80075 to 79 1,230 1,694 0 2,92480 to 84 727 1,012 0 1,73985 & Older 423 585 0 1,008Unknown* 289 891 10,395 11,575TOTALS 76,397 91,473 10,427 178,297
*Includes drivers whose age and/or gender were not recorded on the report, hit and run vehicles for which driver informationwas not available and parked vehicles with no driver.**Property Damage OnlyNOTE: These figures only represent drivers of units defined as a motor vehicle.

PART II - COLLISION CHARACTERISTICS - SECTION A
OUT-OF-STATE DRIVERS INVOLVED IN TRAFFIC COLLISIONS*
20South Carolina Department of Public Safety
South Carolina Traffic Collision Fact Book 2015
present a valid driver's license at the time of the crash.a valid driver's license. There were 18,112 drivers that did not *Figures only represent drivers of any motor vehicle requiring
SOUTH CAROLINA DRIVERS TOTALED 204,136
NC
8,961
33.52%
OTHERS
6,283
23.50%
GA
4,475
16.74%
FL
2,270
8.49%
VA
1,127
4.22%
TN
842
3.15%
NY
833
3.12%
PA
691
2.58%
OH
676
2.53%
TX577
2.16%

PART II - COLLISION CHARACTERISTICS - SECTION A
DRIVERS INVOLVED IN FATAL COLLISIONSBY ROUTE CATEGORY AND LICENSE STATE
21South Carolina Department of Public Safety
South Carolina Traffic Collision Fact Book 2015
Note: There were 49 drivers involved in fatal collisions on county routes in 2015
INTERSTATE - 170 DRIVERS
SC License
82
48.24%
Out-of-State
75
44.12%
No License
13
7.65%
US PRIMARY ROUTES - 413 DRIVERS
SC License
337
81.60%
Out-of-State
60
14.53%
No License163.87%
SC PRIMARY ROUTES - 349 DRIVERS
SC License
284
81.38%
Out-of-State
47
13.47%
No License18
5.16%
SECONDARY ROUTES - 413 DRIVERS
SC License
37390.31%
Out-of-State
23
5.57%
No License17
4.12%

PART II – COLLISION CHARACTERISTICS – SECTION B
South Carolina Traffic Collision Fact Book 2015
South Carolina Department of Public Safety
22
The frequency of traffic collisions is affected by the settings of the clock and
calendar. The concentration of traffic, for example, is heavier at certain times of
the day, days of the week and month. Travel is also affected by holidays and by
special events such as football games. In addition to travel, driver attitudes,
vision and behavior are influenced by time factors, weather, and time of year. On
the following pages, statistics are presented which indicate observable time
variables. Some of the important observations in the 2015 data are as follows:
More traffic deaths occurred on Monday, Tuesday, Wednesday, and Thursday
(505), than on Friday, Saturday, and Sunday (474).
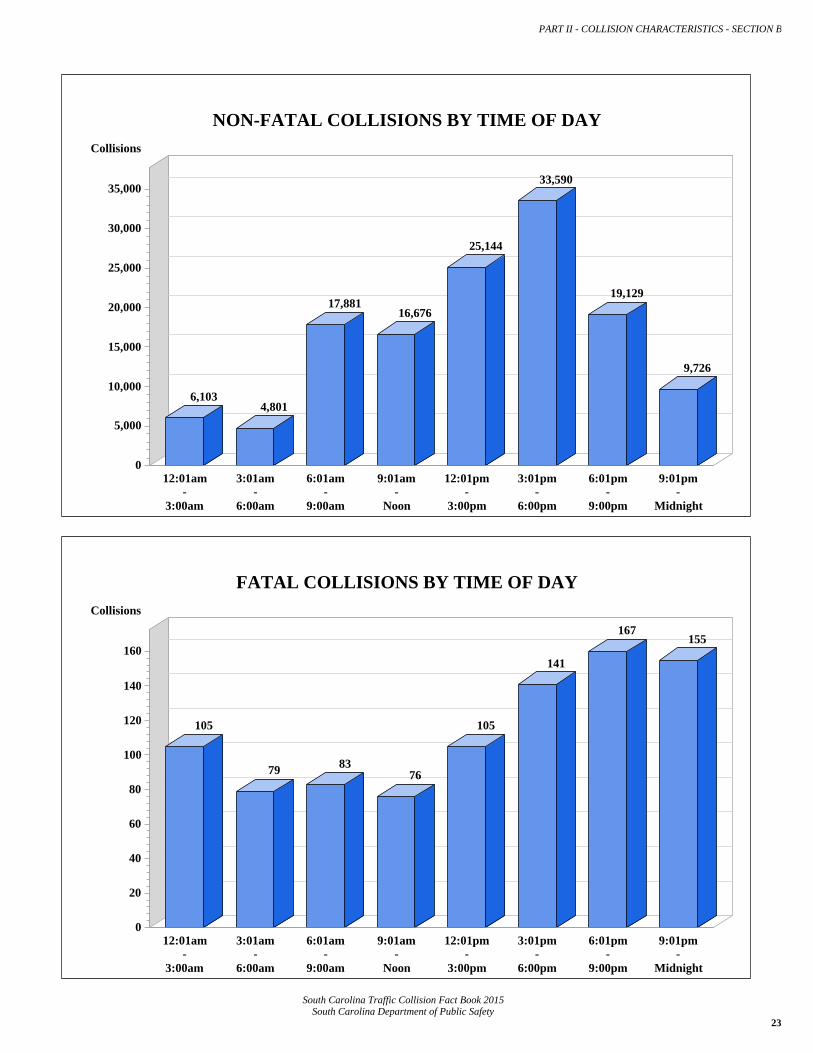
The most frequent time of day for all collision types was 3:01pm -6:00pm.
Fatal collisions occurred more frequently during 6:01pm-9:00pm, accounting
for 18.3% of the total.
More traffic collisions were reported on Friday than any other day of the week
with 22,790 collisions during 2015, accounting for 17.0% of the total. The
fewest traffic collisions were reported on Sundays with 13,355 or 10.0%.
As in past years, more fatal collisions were reported on Saturday (169) in
2015 than any other day. This accounted for about 18.6% of all fatal
collisions and resulted in the deaths of 182 persons. The fewest number of
fatal collisions occurred on Tuesday with 107, resulting in 114 fatalities.
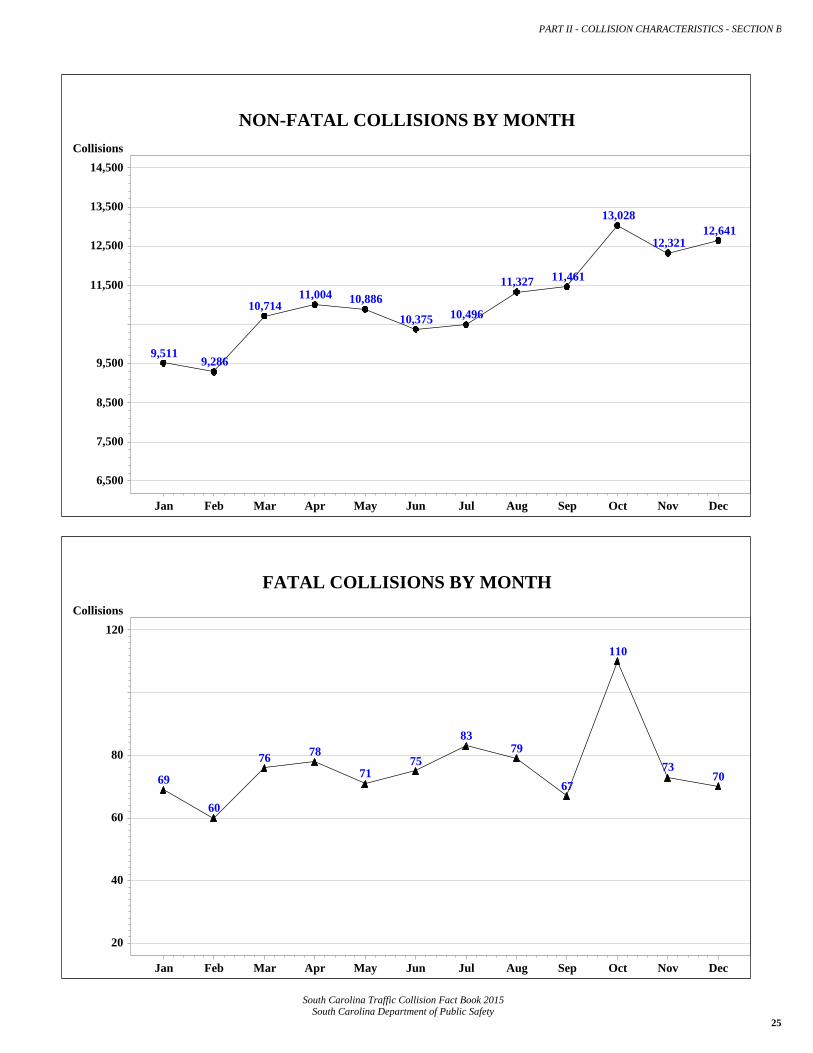
October was the leading month for all collisions in 2015, with 13,138. The
leading month for fatal collisions was also October with 110 collisions and 119
fatalities. February had the fewest fatal collisions with 60 collisions resulting
in 67 fatalities.
B. TIME
PART II - COLLISION CHARACTERISTICS - SECTION B
23South Carolina Department of Public Safety
South Carolina Traffic Collision Fact Book 2015
NON-FATAL COLLISIONS BY TIME OF DAY
6,1034,801
17,88116,676
25,144
33,590
19,129
9,726
Collisions
0
5,000
10,000
15,000
20,000
25,000
30,000
35,000
12:01am-
3:00am
3:01am-
6:00am
6:01am-
9:00am
9:01am-
Noon
12:01pm-
3:00pm
3:01pm-
6:00pm
6:01pm-
9:00pm
9:01pm-
Midnight
FATAL COLLISIONS BY TIME OF DAY
105
79 8376
105
141
167155
Collisions
0
20
40
60
80
100
120
140
160
12:01am-
3:00am
3:01am-
6:00am
6:01am-
9:00am
9:01am-
Noon
12:01pm-
3:00pm
3:01pm-
6:00pm
6:01pm-
9:00pm
9:01pm-
Midnight

PART II - COLLISION CHARACTERISTICS - SECTION B
24South Carolina Department of Public Safety
South Carolina Traffic Collision Fact Book 2015
NON-FATAL COLLISIONS BY DAY OF WEEK
13,232
19,911 19,749 19,890 20,251
22,642
17,375
Collisions
0
2,000
4,000
6,000
8,000
10,000
12,000
14,000
16,000
18,000
20,000
22,000
Sunday Monday Tuesday Wednesday Thursday Friday Saturday
FATAL COLLISIONS BY DAY OF WEEK
123 123
107
122 119
148
169
Collisions
0
20
40
60
80
100
120
140
160
180
Sunday Monday Tuesday Wednesday Thursday Friday Saturday
Collisions
6,500
7,500
8,500
9,500
11,500
12,500
13,500
14,500
Jan Feb Mar Apr May Jun Jul Aug Sep Oct Nov Dec
Collisions
20
40
60
80
120
Jan Feb Mar Apr May Jun Jul Aug Sep Oct Nov Dec
PART II - COLLISION CHARACTERISTICS - SECTION B
25South Carolina Department of Public Safety
South Carolina Traffic Collision Fact Book 2015
NON-FATAL COLLISIONS BY MONTH
9,5119,286
10,71411,004 10,886
10,375 10,496
11,327 11,461
13,028
12,32112,641
FATAL COLLISIONS BY MONTH
69
60
76 78
7175
8379
67
110
7370

26South Carolina Department of Public Safety
South Carolina Traffic Collision Fact Book 2015
PART II - COLLISION CHARACTERISTICS - SECTION B
TRAFFIC COLLISIONS BY TIME OF DAY
TIME OF DAYFatal
CollisionInjury
CollisionPDO*
CollisionTotal
CollisionsPersonsKilled
PersonsInjured
12:01am - 3:00am 105 2,050 4,053 6,208 112 3,1573:01am - 6:00am 79 1,499 3,302 4,880 84 2,0316:01am - 9:00am 83 4,637 13,244 17,964 91 6,6849:01am - Noon 76 4,631 12,045 16,752 81 6,91912:01pm - 3:00pm 105 6,807 18,337 25,249 110 10,5573:01pm - 6:00pm 141 9,053 24,537 33,731 149 14,1966:01pm - 9:00pm 167 5,806 13,323 19,296 183 9,5479:01pm - Midnight 155 3,378 6,348 9,881 169 5,513TOTALS 911 37,861 95,189 133,961 979 58,604
TRAFFIC COLLISIONS BY DAY OF WEEK
DAY OF WEEKFatal
CollisionInjury
CollisionPDO*
CollisionTotal
CollisionsPersonsKilled
PersonsInjured
Sunday 123 4,137 9,095 13,355 136 6,483Monday 123 5,640 14,271 20,034 128 8,609Tuesday 107 5,443 14,306 19,856 114 8,373Wednesday 122 5,533 14,357 20,012 130 8,396Thursday 119 5,648 14,603 20,370 133 8,654Friday 148 6,221 16,421 22,790 156 9,648Saturday 169 5,239 12,136 17,544 182 8,441TOTALS 911 37,861 95,189 133,961 979 58,604
TRAFFIC COLLISIONS BY MONTH
MONTHFatal
CollisionInjury
CollisionPDO*
CollisionTotal
CollisionsPersonsKilled
PersonsInjured
January 69 2,606 6,905 9,580 71 4,064February 60 2,547 6,739 9,346 67 3,994March 76 2,941 7,773 10,790 88 4,643April 78 3,101 7,903 11,082 80 4,774May 71 3,254 7,632 10,957 76 5,032June 75 3,061 7,314 10,450 80 4,730July 83 3,218 7,278 10,579 92 5,054August 79 3,331 7,996 11,406 84 5,108September 67 3,260 8,201 11,528 67 4,961October 110 3,607 9,421 13,138 119 5,606November 73 3,414 8,907 12,394 82 5,237December 70 3,521 9,120 12,711 73 5,401TOTALS 911 37,861 95,189 133,961 979 58,604
*Property Damage Only

27South Carolina Department of Public Safety
South Carolina Traffic Collision Fact Book 2015
PART II - COLLISION CHARACTERISTICS - SECTION B
PERSONS KILLED AND FATAL COLLISIONSFOR SELECTED HOLIDAY PERIODS 2006 - 2015
HolidayHoliday
YearTime
Beginning Dates HoursActual Day of
HolidayPersonsKilled
FatalCollision
MEMORIAL DAY 2006 6 p.m. 05/26/06 - 05/29/06 78 Monday 12 11
MEMORIAL DAY 2007 6 p.m. 05/25/07 - 05/28/07 78 Monday 20 17
MEMORIAL DAY 2008 6 p.m. 05/23/08 - 05/26/08 78 Monday 11 8
MEMORIAL DAY 2009 6 p.m. 05/22/09 - 05/25/09 78 Monday 6 6
MEMORIAL DAY 2010 6 p.m. 05/28/10 - 05/31/10 78 Monday 10 10
MEMORIAL DAY 2011 6 p.m. 05/27/11 - 05/30/11 78 Monday 8 7
MEMORIAL DAY 2012 6 p.m. 05/25/12 - 05/28/12 78 Monday 8 8
MEMORIAL DAY 2013 6 p.m. 05/24/13 - 05/27/13 78 Monday 14 11
MEMORIAL DAY 2014 6 p.m. 05/23/14 - 05/26/14 78 Monday 12 12
MEMORIAL DAY 2015 6 p.m. 05/22/15 - 05/25/15 78 Monday 8 7
FOURTH OF JULY 2006 6 p.m. 06/30/06 - 07/04/06 102 Tuesday 17 16
FOURTH OF JULY 2007 6 p.m. 07/03/07 - 07/04/07 30 Wednesday 4 4
FOURTH OF JULY 2008 6 p.m. 07/03/08 - 07/06/08 78 Friday 9 9
FOURTH OF JULY 2009 6 p.m. 07/02/09 - 07/05/09 78 Saturday 12 11
FOURTH OF JULY 2010 6 p.m. 07/02/10 - 07/05/10 78 Sunday 5 5
FOURTH OF JULY 2011 6 p.m. 07/01/11 - 07/04/11 78 Monday 9 9
FOURTH OF JULY 2012 6 p.m. 07/03/12 - 07/04/12 30 Wednesday 5 5
FOURTH OF JULY 2013 6 p.m. 07/03/13 - 07/07/13 102 Thursday 10 10
FOURTH OF JULY 2014 6 p.m. 07/03/14 - 07/06/14 78 Friday 10 10
FOURTH OF JULY 2015 6 p.m. 07/02/15 - 07/05/15 78 Saturday 7 7
LABOR DAY 2006 6 p.m. 09/01/06 - 09/04/06 78 Monday 15 15
LABOR DAY 2007 6 p.m. 08/31/07 - 09/03/07 78 Monday 8 8
LABOR DAY 2008 6 p.m. 08/29/08 - 09/01/08 78 Monday 15 13
LABOR DAY 2009 6 p.m. 09/04/09 - 09/07/09 78 Monday 9 9
LABOR DAY 2010 6 p.m. 09/03/10 - 09/06/10 78 Monday 11 9
LABOR DAY 2011 6 p.m. 09/02/11 - 09/05/11 78 Monday 8 7
LABOR DAY 2012 6 p.m. 08/31/12 - 09/03/12 78 Monday 2 2
LABOR DAY 2013 6 p.m. 08/30/13 - 09/02/13 78 Monday 13 11
LABOR DAY 2014 6 p.m. 08/29/14 - 09/01/14 78 Monday 15 15
LABOR DAY 2015 6 p.m. 09/04/15 - 09/07/15 78 Monday 8 8

28South Carolina Department of Public Safety
South Carolina Traffic Collision Fact Book 2015
PART II - COLLISION CHARACTERISTICS - SECTION B
PERSONS KILLED AND FATAL COLLISIONSFOR SELECTED HOLIDAY PERIODS 2006 - 2015
HolidayHoliday
YearTime
Beginning Dates HoursActual Day of
HolidayPersonsKilled
FatalCollision
THANKSGIVING 2006 6 p.m. 11/22/06 - 11/26/06 102 Thursday 9 9
THANKSGIVING 2007 6 p.m. 11/21/07 - 11/25/07 102 Thursday 11 10
THANKSGIVING 2008 6 p.m. 11/26/08 - 11/30/08 102 Thursday 15 14
THANKSGIVING 2009 6 p.m. 11/25/09 - 11/29/09 102 Thursday 8 8
THANKSGIVING 2010 6 p.m. 11/24/10 - 11/28/10 102 Thursday 3 3
THANKSGIVING 2011 6 p.m. 11/23/11 - 11/27/11 102 Thursday 11 11
THANKSGIVING 2012 6 p.m. 11/21/12 - 11/25/12 102 Thursday 10 10
THANKSGIVING 2013 6 p.m. 11/27/13 - 12/01/13 102 Thursday 5 5
THANKSGIVING 2014 6 p.m. 11/26/14 - 11/30/14 102 Thursday 8 7
THANKSGIVING 2015 6 p.m. 11/25/15 - 11/29/15 102 Thursday 9 9
CHRISTMAS 2006 6 p.m. 12/22/06 - 12/25/06 78 Monday 5 5
CHRISTMAS 2007 6 p.m. 12/21/07 - 12/25/07 102 Tuesday 9 8
CHRISTMAS 2008 6 p.m. 12/24/08 - 12/28/08 102 Thursday 9 8
CHRISTMAS 2009 6 p.m. 12/24/09 - 12/27/09 78 Friday 6 6
CHRISTMAS 2010 6 p.m. 12/23/10 - 12/26/10 78 Saturday 13 12
CHRISTMAS 2011 6 p.m. 12/23/11 - 12/26/11 78 Sunday 7 5
CHRISTMAS 2012 6 p.m. 12/21/12 - 12/25/12 102 Tuesday 11 11
CHRISTMAS 2013 6 p.m. 12/24/13 - 12/25/13 30 Wednesday 4 3
CHRISTMAS 2014 6 p.m. 12/24/14 - 12/28/14 102 Thursday 13 12
CHRISTMAS 2015 6 p.m. 12/24/15 - 12/27/15 78 Friday 10 9
NEW YEARS 2006 6 p.m. 12/29/06 - 01/01/07 78 Sunday 9 8
NEW YEARS 2007 6 p.m. 12/28/07 - 01/01/08 102 Monday 12 9
NEW YEARS 2008 6 p.m. 12/31/08 - 01/04/09 102 Tuesday 7 6
NEW YEARS 2009 6 p.m. 12/31/09 - 01/03/10 78 Thursday 3 3
NEW YEARS 2010 6 p.m. 12/30/10 - 01/02/11 78 Friday 11 10
NEW YEARS 2011 6 p.m. 12/30/11 - 01/02/12 78 Saturday 7 6
NEW YEARS 2012 6 p.m. 12/28/12 - 01/01/13 102 Sunday 6 6
NEW YEARS 2013 6 p.m. 12/31/13 - 01/01/14 30 Tuesday 8 7
NEW YEARS 2014 6 p.m. 12/31/14 - 01/04/15 102 Wednesday 11 11
NEW YEARS 2015 6 p.m. 12/31/15 - 01/03/16 78 Thursday 7 6

29South Carolina Department of Public Safety
South Carolina Traffic Collision Fact Book 2015
PART II - COLLISION CHARACTERISTICS - SECTION B
TRAFFIC FATALITY CALENDAR
January 2015Sun Mon Tues Wed Thurs Fri Sat
1 ) 4
2 ) 1
3 ) 3
4 ) 1
5 ) 4
6 ) 5
7 ) 1
8 ) 1
9 ) 5
10) 2
11) 1
12) 3
13) 4
14) 0
15) 0
16) 1
17) 3
18) 0
19) 2
20) 2
21) 2
22) 3
23) 2
24) 0
25) 4
26) 1
27) 2
28) 1
29) 0
30) 6
31) 7
March 2015Sun Mon Tues Wed Thurs Fri Sat
1 ) 3
2 ) 3
3 ) 3
4 ) 2
5 ) 2
6 ) 3
7 ) 4
8 ) 3
9 ) 7
10) 2
11) 1
12) 0
13) 0
14) 3
15) 4
16) 7
17) 1
18) 1
19) 12
20) 1
21) 6
22) 2
23) 2
24) 3
25) 4
26) 1
27) 2
28) 4
29) 1
30) 1
31) 0
May 2015Sun Mon Tues Wed Thurs Fri Sat
1 ) 2
2 ) 3
3 ) 2
4 ) 2
5 ) 2
6 ) 2
7 ) 0
8 ) 2
9 ) 5
10) 5
11) 1
12) 2
13) 1
14) 4
15) 3
16) 4
17) 3
18) 3
19) 3
20) 3
21) 3
22) 5
23) 3
24) 1
25) 2
26) 0
27) 2
28) 1
29) 3
30) 3
31) 1
February 2015Sun Mon Tues Wed Thurs Fri Sat
1 ) 4
2 ) 2
3 ) 3
4 ) 4
5 ) 5
6 ) 2
7 ) 4
8 ) 3
9 ) 2
10) 1
11) 5
12) 3
13) 2
14) 5
15) 4
16) 2
17) 0
18) 0
19) 2
20) 0
21) 5
22) 1
23) 2
24) 0
25) 3
26) 1
27) 2
28) 0
April 2015Sun Mon Tues Wed Thurs Fri Sat
1 ) 4
2 ) 1
3 ) 6
4 ) 4
5 ) 2
6 ) 2
7 ) 2
8 ) 0
9 ) 4
10) 5
11) 1
12) 4
13) 2
14) 3
15) 0
16) 3
17) 1
18) 3
19) 1
20) 2
21) 2
22) 4
23) 6
24) 0
25) 4
26) 1
27) 5
28) 5
29) 2
30) 1
June 2015Sun Mon Tues Wed Thurs Fri Sat
1 ) 3
2 ) 1
3 ) 3
4 ) 1
5 ) 1
6 ) 3
7 ) 3
8 ) 1
9 ) 0
10) 6
11) 2
12) 3
13) 3
14) 2
15) 3
16) 2
17) 0
18) 2
19) 2
20) 5
21) 2
22) 1
23) 1
24) 6
25) 2
26) 6
27) 5
28) 2
29) 7
30) 2

30South Carolina Department of Public Safety
South Carolina Traffic Collision Fact Book 2015
PART II - COLLISION CHARACTERISTICS - SECTION B
TRAFFIC FATALITY CALENDAR
July 2015Sun Mon Tues Wed Thurs Fri Sat
1 ) 3
2 ) 3
3 ) 2
4 ) 3
5 ) 2
6 ) 4
7 ) 4
8 ) 1
9 ) 5
10) 2
11) 1
12) 3
13) 3
14) 1
15) 2
16) 3
17) 6
18) 4
19) 5
20) 5
21) 2
22) 1
23) 2
24) 5
25) 4
26) 5
27) 3
28) 0
29) 3
30) 3
31) 2
September 2015Sun Mon Tues Wed Thurs Fri Sat
1 ) 3
2 ) 2
3 ) 3
4 ) 0
5 ) 3
6 ) 3
7 ) 2
8 ) 2
9 ) 0
10) 2
11) 3
12) 6
13) 2
14) 2
15) 3
16) 3
17) 2
18) 1
19) 5
20) 2
21) 4
22) 0
23) 2
24) 6
25) 1
26) 0
27) 0
28) 1
29) 1
30) 3
November 2015Sun Mon Tues Wed Thurs Fri Sat
1 ) 1
2 ) 7
3 ) 0
4 ) 2
5 ) 5
6 ) 6
7 ) 3
8 ) 3
9 ) 1
10) 3
11) 2
12) 3
13) 4
14) 0
15) 3
16) 1
17) 5
18) 3
19) 4
20) 4
21) 5
22) 1
23) 3
24) 2
25) 1
26) 3
27) 1
28) 3
29) 2
30) 1
August 2015Sun Mon Tues Wed Thurs Fri Sat
1 ) 2
2 ) 1
3 ) 4
4 ) 5
5 ) 5
6 ) 3
7 ) 4
8 ) 8
9 ) 2
10) 0
11) 6
12) 0
13) 1
14) 2
15) 4
16) 0
17) 1
18) 1
19) 2
20) 1
21) 2
22) 3
23) 6
24) 0
25) 5
26) 0
27) 1
28) 6
29) 5
30) 3
31) 1
October 2015Sun Mon Tues Wed Thurs Fri Sat
1 ) 2
2 ) 4
3 ) 1
4 ) 2
5 ) 2
6 ) 2
7 ) 7
8 ) 5
9 ) 4
10) 5
11) 13
12) 2
13) 2
14) 1
15) 2
16) 5
17) 5
18) 2
19) 3
20) 3
21) 7
22) 2
23) 6
24) 3
25) 4
26) 2
27) 5
28) 4
29) 4
30) 5
31) 5
December 2015Sun Mon Tues Wed Thurs Fri Sat
1 ) 2
2 ) 2
3 ) 0
4 ) 5
5 ) 2
6 ) 5
7 ) 1
8 ) 0
9 ) 6
10) 1
11) 3
12) 2
13) 3
14) 1
15) 4
16) 2
17) 2
18) 2
19) 4
20) 2
21) 1
22) 2
23) 7
24) 1
25) 5
26) 4
27) 1
28) 1
29) 0
30) 2
31) 0

PART II – COLLISION CHARACTERISTICS – SECTION C
South Carolina Traffic Collision Fact Book 2015
South Carolina Department of Public Safety
31
Almost no area of South Carolina was immune from traffic collisions in 2015. With
the exception of Saluda County, every county experienced the tragedy of at least one
fatal traffic collision during the year. Six of the state’s 46 counties had at least 40
traffic fatalities during 2015 (see page 82 for collisions by county). A variety of
factors influence where traffic collisions, injuries and fatalities occur including the
volume of traffic on a particular highway, weather variations and travel patterns.
Statistics are presented on the following pages, which indicate observable differences
in the occurrence of traffic collisions with relation to various location categories.
Some important observations in the data are as follows.
In 2015, Greenville County had the most total traffic collisions (15,876), the second
most fatal collisions (70), the third most fatalities (73), and the most property
damage only collisions (12,019). Charleston County had the most injury collisions
(4,019) and non-fatal injuries (5,909). Horry County had the most fatal collisions
(76) and the most fatalities (81).
A total of 74,216 collisions were investigated by the South Carolina Highway Patrol.
This represents 55.4% of all traffic collisions in South Carolina for 2015. The
Highway Patrol investigated an even greater proportion of the fatal crashes 81.1%.
In 2015, Secondary and US Primary routes had the most traffic collisions.
Respectively, they had 30.7% and 26.8% of the reported total. SC Primary routes
were next, accounting for 22.2% of the total collisions.
The Secondary routes accounted for the largest percentage (34.6%) of fatal
collisions.
A total of 14,737 collisions occurred on the interstates. This was 11.0% of the total
reported traffic collisions for the year.
C. LOCATION

32South Carolina Department of Public Safety
South Carolina Traffic Collision Fact Book 2015
PART II - COLLISION CHARACTERISTICS - SECTION C
COLLISIONS INVESTIGATED BY AGENCY TYPE
Agency TypeFatal
CollisionInjury
CollisionPDO*
CollisionTotal
CollisionsPersonsKilled
PersonsInjured
South Carolina Highway Patrol 739 21,505 51,972 74,216 800 33,492Sheriff's Department 29 1,270 2,907 4,206 30 1,913City/County Police/Other** 143 15,086 40,310 55,539 149 23,199TOTALS 911 37,861 95,189 133,961 979 58,604
*Property Damage Only
**Includes Federal or Military Police, Public Utility/Service Commisions, Other Police Agencies,
Non-Law Enforcement Agencies and Agencies Not Stated
FATAL COLLISIONS
Agency Type SC Highway PatrolSheriff's DeptCity/County Police/Other**
73981.12%
14315.70%
293.18%
NON-FATAL COLLISIONS
Agency Type SC Highway PatrolSheriff's DeptCity/County Police/Other**
73,47755.23%
55,39641.64%
4,1773.14%

PART II – COLLISION CHARACTERISTICS – SECTION C
South Carolina Traffic Collision Fact Book 2015
South Carolina Department of Public Safety
33
2929
HIGHWAY PATROL TROOPS

PART II - COLLISION CHARACTERISTICS - SECTION C
34South Carolina Department of Public Safety
South Carolina Traffic Collision Fact Book 2015
2015 South Carolina Traffic Collisions per 100,000,000 VMT*
*VMT: Vehicle Miles Traveled
90.00 - 153.99 154.00 - 217.99 218.00 - 281.99282.00 - 345.99 346.00 - 410.00
2015 South Carolina Traffic Fatalities per 100,000,000 VMT*
*VMT: Vehicle Miles Traveled
-0.10 - 0.67 0.68 - 1.45 1.46 - 2.23 2.24 - 3.01 3.02 - 3.80
ABBEVILLE
AIKEN
ALLENDALE
ANDERSON
BAMBERGBARNWELL
BEAUFORT
BERKELEY
CALHOUN
CHARLESTON
CHEROKEE
CHESTERCHESTERFIELD
CLARENDON
COLLETON
DARLINGTON
DILLON
DORCHESTER
EDGEFIELD
FAIRFIELD
FLORENCE
GEORGETOWN
GREENVILLE
GREENWOOD
HAMPTON
HORRY
JASPER
KERSHAW
LANCASTER
LAURENS
LEE
LEXINGTONMC CORMICK
MARION
MARLBORO
NEWBERRY
OCONEE
ORANGEBURG
PICKENS
RICHLANDSALUDA
SPARTANBURG
SUMTER
UNION
WILLIAMSBURG
YORK

35South Carolina Department of Public Safety
South Carolina Traffic Collision Fact Book 2015
PART II - COLLISION CHARACTERISTICS - SECTION C
COLLISIONS BY ROUTE CATEGORY
Route CategoryFatal
CollisionInjury
CollisionPDO*
CollisionTotal
CollisionsPersonsKilled
PersonsInjured
Interstate 98 3,091 11,548 14,737 122 4,624US Primary 238 10,600 25,003 35,841 253 17,172SC Primary 216 8,907 20,678 29,801 229 14,014Secondary 315 12,440 28,433 41,188 327 18,868County 44 2,823 9,527 12,394 48 3,926TOTALS 911 37,861 95,189 133,961 979 58,604
*Property Damage Only
There were 41,188 traffic collisions reported on Secondary routes during 2015. This was the most forall the route category classifications and accounted for 30.7% of all reported collisions. US Primaryroutes were second, accounting for 35,841 of the reported collision total. The fewest reportedcollisions were County routes; a total of 12,394 were reported for these routes.
Secondary routes had the most fatal collisions by a wide margin. The 315 fatal collisions occurring onthe Secondary route system accounted for 34.6% of the 911 fatal collisions reported in 2015. On theUS Primary and SC Primary routes there were 238 and 216 (respectively) fatal collisions reported forthe year. The fewest number of fatal collisions occurred on the County routes with 44 (4.8%).
ROUTE CATEGORY IN NON-FATAL VS. FATAL COLLISIONS
9.3%
4.8%
11.0% 10.8%
22.2%23.7%
30.7%
34.6%
26.8% 26.1%
Percent
0.0%
4.0%
8.0%
12.0%
16.0%
20.0%
24.0%
28.0%
32.0%
36.0%
40.0%
Interstate US Primary SC Primary Secondary County
Non-Fatal Fatal Non-Fatal Fatal Non-FatalFatal Non-Fatal Fatal Non-Fatal Fatal

36South Carolina Department of Public Safety
South Carolina Traffic Collision Fact Book 2015
PART II - COLLISION CHARACTERISTICS - SECTION C
TRAFFIC COLLISIONS ON INTERSTATES
InterstateFatal
CollisionInjury
CollisionPDO*
CollisionTotal
CollisionsPersonsKilled
PersonsInjured
I-20 11 406 1,526 1,943 11 587I-26 34 1,024 3,765 4,823 44 1,589I-77 8 351 1,265 1,624 8 494I-85 16 579 2,396 2,991 20 851I-95 24 324 1,264 1,612 34 546I-126 1 22 72 95 1 36I-185 0 10 47 57 0 14I-385 2 174 579 755 2 237I-520 0 7 21 28 0 8I-526 2 186 560 748 2 252I-585 0 8 53 61 0 10TOTALS 98 3,091 11,548 14,737 122 4,624
INTERSTATE COLLISIONS BY DAY OF WEEK
Day of WeekFatal
CollisionInjury
CollisionPDO*
CollisionTotal
CollisionsPersonsKilled
PersonsInjured
Sunday 15 393 1,301 1,709 16 658Monday 9 490 1,760 2,259 9 691Tuesday 11 432 1,615 2,058 13 608Wednesday 12 408 1,664 2,084 15 572Thursday 12 432 1,705 2,149 19 657Friday 16 509 2,080 2,605 16 741Saturday 23 427 1,423 1,873 34 697TOTALS 98 3,091 11,548 14,737 122 4,624
INTERSTATE COLLISIONS BY MONTH
MonthFatal
CollisionInjury
CollisionPDO*
CollisionTotal
CollisionsPersonsKilled
PersonsInjured
January 6 212 740 958 7 307February 4 235 807 1,046 9 359March 10 256 913 1,179 19 381April 8 240 920 1,168 10 352May 8 239 862 1,109 9 343June 8 233 919 1,160 10 348July 10 255 900 1,165 12 393August 8 278 987 1,273 8 434September 12 259 947 1,218 12 401October 11 304 1,147 1,462 11 451November 7 301 1,252 1,560 9 442December 6 279 1,154 1,439 6 413TOTALS 98 3,091 11,548 14,737 122 4,624
*Property Damage Only

37South Carolina Department of Public Safety
South Carolina Traffic Collision Fact Book 2015
PART II - COLLISION CHARACTERISTICS - SECTION C
TRAFFIC COLLISIONS BY FIRST HARMFUL EVENT LOCATION
First Harmful Event LocationFatal
CollisionInjury
CollisionPDO*
CollisionTotal
CollisionsPersonsKilled
PersonsInjured
Gore 0 32 79 111 0 48Island 2 30 96 128 2 41Median 23 680 2,237 2,940 27 944Roadside 164 4,390 7,988 12,542 178 5,839Roadway 550 29,061 77,761 107,372 594 46,863Shoulder 66 1,358 2,596 4,020 68 1,813Sidewalk 2 73 129 204 2 88Outside Trafficway 103 2,158 4,082 6,343 107 2,853Unknown 1 79 221 301 1 115TOTALS 911 37,861 95,189 133,961 979 58,604
TRAFFIC COLLISIONS BY JUNCTION TYPE
Junction TypeFatal
CollisionInjury
CollisionPDO*
CollisionTotal
CollisionsPersonsKilled
PersonsInjured
Cross-Over 10 552 1,114 1,676 11 889Driveway 66 3,168 8,321 11,555 69 5,025Five/More Points 1 103 268 372 2 170Four-Way Intersection 95 7,287 14,524 21,906 102 12,275Railway Grade Crossing 3 54 127 184 3 75Shared Use Paths Or Trail 0 80 169 249 0 123T-Intersection 85 5,071 11,213 16,369 87 8,259Traffic Circle 0 68 300 368 0 99Y-Intersection 11 571 1,476 2,058 12 890Non-Junction 640 20,793 57,373 78,806 693 30,620Unknown 0 114 304 418 0 179TOTALS 911 37,861 95,189 133,961 979 58,604
*Property Damage Only

PART II –COLLISION CHARACTERISTICS – SECTION D
South Carolina Traffic Collision Fact Book 2015
South Carolina Department of Public Safety
38
The environment in which motorists operate their vehicles can contribute to the occurrence
of traffic crashes. Environment is defined herein as the combination of external or extrinsic
physical conditions that affect and influence the operation of a motor vehicle. These
include road surface, weather, light conditions, traffic control, road character, trafficway,
junction type, and work zone type for each driver.
One or more of the environmental factors can be the primary factor of a collision or may be
a contributing factor in a given crash. Weather, light, and surface conditions are
substantially beyond the control of engineering or law enforcement efforts. Changes in
traffic controls, road character, trafficway, junction type, and work zone type factors can all
be effected by traffic engineering efforts.
As reflected in the statistics on the next two pages, most collisions occur under favorable
environmental conditions: dry roadway (79.0%): clear weather (76.0%); daylight (70.5%);
no traffic control device (56.4%); and straight-level road (82.8%).
The percentages of fatal collisions occurring under the most favorable environmental
conditions are as follows: dry roadway (84.1%); clear weather (81.4%); daylight (43.7%);
no traffic control (68.3%); and straight-level roadway (68.6%).
Environmental factors were the primary contributing factor in only 2.9% of all collisions in
2015. The environment may have been a contributing factor to collisions where it was not
the primary contributing factor. Efforts to improve those environmental factors which can
be controlled (especially traffic control and road character) should help to reduce the
frequency of traffic crashes in South Carolina.
D. ENVIRONMENT

39South Carolina Department of Public Safety
South Carolina Traffic Collision Fact Book 2015
PART II - COLLISION CHARACTERISTICS - SECTION D
ROAD SURFACE CONDITIONS
Road SurfaceFatal
CollisionInjury
CollisionPDO*
CollisionTotal
CollisionsPersonsKilled
PersonsInjured
Dry 766 30,259 74,801 105,826 815 46,876Wet 139 7,397 19,751 27,287 156 11,446Snow 1 24 90 115 2 29Slush 0 24 68 92 0 34Ice 0 65 222 287 0 84Contaminant (Sand, mud, Dirt, oil,Etc.)
0 3 5 8 0 5
Water (Standing) 1 37 112 150 1 57Other 2 31 47 80 3 47Unknown 2 21 93 116 2 26TOTALS 911 37,861 95,189 133,961 979 58,604
WEATHER CONDITIONS
WeatherFatal
CollisionInjury
CollisionPDO*
CollisionTotal
CollisionsPersonsKilled
PersonsInjured
Clear, No Adverse Conditions 742 29,171 71,891 101,804 798 45,142Rain 84 5,519 15,069 20,672 89 8,508Cloudy 66 2,800 7,226 10,092 68 4,399Sleet Or Hail 0 66 207 273 0 87Snow 0 30 133 163 0 44Fog, Smog, Smoke 17 222 475 714 22 353Blowing Sand, Soil, Dirt Or Snow 0 3 4 7 0 4Severe Cross Winds, High Wind 0 5 24 29 0 5Unknown 2 45 160 207 2 62TOTALS 911 37,861 95,189 133,961 979 58,604
LIGHT CONDITIONS
LightFatal
CollisionInjury
CollisionPDO*
CollisionTotal
CollisionsPersonsKilled
PersonsInjured
Daylight 398 25,411 68,653 94,462 430 39,044Dawn 29 672 1,546 2,247 30 942Dusk 31 945 2,289 3,265 33 1,513Dark (Lighting Unspecified) 50 1,614 3,931 5,595 54 2,498Dark (Street Lamp Lit) 82 3,451 7,483 11,016 85 5,480Dark (Street Lamp Not Lit) 31 459 947 1,437 32 749Dark (No Lights) 290 5,309 10,340 15,939 315 8,378TOTALS 911 37,861 95,189 133,961 979 58,604
*Property Damage Only

40South Carolina Department of Public Safety
South Carolina Traffic Collision Fact Book 2015
PART II - COLLISION CHARACTERISTICS - SECTION D
COLLISIONS BY TRAFFIC CONTROL TYPE
Traffic ControlFatal
CollisionInjury
CollisionPDO*
CollisionTotal
CollisionsPersonsKilled
PersonsInjured
Stop And Go Light 58 6,563 15,151 21,772 61 10,715Flashing Traffic Signal 2 143 283 428 2 247RR (X-Bucks, Lights And Gates) 3 42 135 180 4 65RR (X-Bucks And Lights) 0 10 16 26 0 14RR (X-Bucks Only) 1 17 43 61 1 24Officer Or Flagman 1 35 109 145 1 54Oncoming Emergency Vehicle 0 21 44 65 0 32Pavement Markings (Only) 132 4,579 13,334 18,045 140 6,681Stop Sign 73 4,805 9,810 14,688 79 8,246School Zone Sign 0 13 36 49 0 22Yield Sign 3 317 1,258 1,578 5 446Work Zone 3 122 381 506 3 187Other Warning Signs 11 161 276 448 11 231Flashing Beacon 2 18 27 47 2 28None 622 20,932 54,059 75,613 670 31,468Unknown 0 83 227 310 0 144TOTALS 911 37,861 95,189 133,961 979 58,604
TRAFFIC COLLISIONS BY TRAFFICWAY
TrafficwayFatal
CollisionInjury
CollisionPDO*
CollisionTotal
CollisionsPersonsKilled
PersonsInjured
Two-Way, Not Divided 582 21,655 48,733 70,970 618 33,625Two-Way, Divided, UnprotectedMedian
223 11,813 31,039 43,075 232 18,464
Two-Way, Divided, Barrier 98 3,454 11,814 15,366 121 5,164One-Way 6 755 3,039 3,800 6 1,074Other 2 184 564 750 2 277TOTALS 911 37,861 95,189 133,961 979 58,604
TRAFFIC COLLISIONS BY ROAD CHARACTER
Road CharacterFatal
CollisionInjury
CollisionPDO*
CollisionTotal
CollisionsPersonsKilled
PersonsInjured
Straight-Level 625 30,723 79,567 110,915 672 48,054Straight-On Grade 87 3,104 8,211 11,402 97 4,762Straight-Hillcrest 10 550 1,220 1,780 10 844Curve-Level 130 2,361 4,118 6,609 138 3,323Curve-On Grade 53 1,015 1,903 2,971 56 1,463Curve-Hillcrest 6 108 170 284 6 158TOTALS 911 37,861 95,189 133,961 979 58,604
*Property Damage Only

41South Carolina Department of Public Safety
South Carolina Traffic Collision Fact Book 2015
PART II - COLLISION CHARACTERISTICS - SECTION D
TRAFFIC COLLISIONS BY WORK ZONE TYPE
Work Zone TypeFatal
CollisionInjury
CollisionPDO*
CollisionTotal
CollisionsPersonsKilled
PersonsInjured
Shoulder/Median Work 4 190 466 660 5 303Lane Shift/Cross-Over 0 18 85 103 0 26Intermittent/Moving Work 3 41 77 121 3 60Lane Closure 3 83 233 319 7 134Other 0 26 61 87 0 36Unknown 0 6 12 18 0 11TOTALS 10 364 934 1,308 15 570
TRAFFIC COLLISIONS BY WORK ZONE LOCATION
Work Zone LocationFatal
CollisionInjury
CollisionPDO*
CollisionTotal
CollisionsPersonsKilled
PersonsInjured
Before First Signal 0 15 39 54 0 28Advanced Warning Area 1 44 106 151 5 70Transition Area 2 48 110 160 2 72Activity Area 7 245 642 894 8 383Termination Area 0 12 37 49 0 17TOTALS 10 364 934 1,308 15 570
TRAFFIC COLLISIONS IN WORK ZONE
Workers PresentFatal
CollisionInjury
CollisionPDO*
CollisionTotal
CollisionsPersonsKilled
PersonsInjured
Yes 5 180 430 615 5 278No 5 183 501 689 10 290Unknown 0 1 3 4 0 2TOTALS 10 364 934 1,308 15 570
TRAFFIC COLLISIONS BY CROSSWALK
CrosswalkFatal
CollisionInjury
CollisionPDO*
CollisionTotal
CollisionsPersonsKilled
PersonsInjured
Yes 12 933 1,692 2,637 13 1,394No 898 36,686 92,888 130,472 965 56,816Unknown 1 242 609 852 1 394TOTALS 911 37,861 95,189 133,961 979 58,604
*Property Damage Only

PART II – COLLISION CHARACTERISTICS – SECTION E
South Carolina Traffic Collision Fact Book 2015
South Carolina Department of Public Safety
42
The consequences of traffic collisions are affected by the types of ‘units’ that are
involved. A collision between a relatively large unit, such as a truck or train, and a
smaller unit, such as a motorcycle, transmits a substantially greater force to the
smaller vehicle, and hence to its occupants or riders, than a collision between two
vehicles of comparable size. This irrefutable law of physics probably accounts for the
over representation of certain ‘unit types’ in traffic collisions. Some of the key
findings in the 2015 data are as follows:
The most common unit involved in traffic crashes in 2015 was the automobile.
Out of 251,357 units involved in traffic collisions during the year, 130,138 were
automobiles. This represents 51.8% of the total units.
For fatal collisions, a much smaller percentage of units involved were
automobiles. Of the 1,587 units involved in fatal collisions, 535 or 33.7% were
automobiles.
There were 125 pedestrians killed in 2015. This represents 12.5% of all
pedestrians involved in traffic crashes during the year.
There were 136 fatal crashes involving motorcycles resulting in 141 fatalities.
A total of 71 fatal crashes involving truck tractors resulted in 88 deaths in 2015.
E. UNITS

43South Carolina Department of Public Safety
South Carolina Traffic Collision Fact Book 2015
PART II - COLLISION CHARACTERISTICS - SECTION E
MOTOR VEHICLE REGISTRATIONS BY COUNTY*
County 2014 Registrations Percent 2015 Registrations PercentAbbeville 24,437 0.6% 24,814 0.6%Aiken 150,861 3.6% 153,965 3.6%Allendale 6,811 0.2% 6,737 0.2%Anderson 173,641 4.1% 177,484 4.1%Bamberg 11,706 0.3% 11,695 0.3%Barnwell 19,217 0.5% 19,365 0.4%Beaufort 148,117 3.5% 152,628 3.5%Berkeley 164,220 3.9% 170,048 3.9%Calhoun 17,913 0.4% 18,121 0.4%Charleston 311,962 7.4% 323,594 7.5%Cherokee 50,668 1.2% 51,278 1.2%Chester 30,870 0.7% 31,345 0.7%Chesterfield 42,194 1.0% 42,654 1.0%Clarendon 28,425 0.7% 28,848 0.7%Colleton 36,108 0.9% 37,011 0.9%Darlington 57,306 1.4% 57,819 1.3%Dillon 24,095 0.6% 24,333 0.6%Dorchester 121,114 2.9% 124,057 2.9%Edgefield 23,886 0.6% 24,339 0.6%Fairfield 22,126 0.5% 22,354 0.5%Florence 114,564 2.7% 116,017 2.7%Georgetown 58,628 1.4% 59,392 1.4%Greenville 413,392 9.8% 425,200 9.8%Greenwood 59,721 1.4% 60,329 1.4%Hampton 16,296 0.4% 16,501 0.4%Horry 270,248 6.4% 283,153 6.5%Jasper 24,866 0.6% 26,386 0.6%Kershaw 60,951 1.4% 62,400 1.4%Lancaster 73,285 1.7% 76,469 1.8%Laurens 61,386 1.5% 62,338 1.4%Lee 15,200 0.4% 15,399 0.4%Lexington 260,459 6.2% 265,020 6.1%McCormick 9,349 0.2% 9,416 0.2%Marion 26,023 0.6% 26,343 0.6%Marlboro 20,921 0.5% 21,282 0.5%Newberry 36,937 0.9% 37,704 0.9%Oconee 75,292 1.8% 76,401 1.8%Orangeburg 73,047 1.7% 73,634 1.7%Pickens 102,852 2.4% 104,475 2.4%Richland 321,833 7.6% 325,826 7.5%Saluda 19,733 0.5% 20,072 0.5%Spartanburg 259,017 6.1% 265,549 6.1%Sumter 90,319 2.1% 90,965 2.1%Union 25,436 0.6% 25,654 0.6%Williamsburg 29,441 0.7% 29,522 0.7%York 225,374 5.3% 236,510 5.5%Undetermined 19,030 0.4% 21,794 0.5%STATE TOTALS 4,229,277 100% 4,336,240 100%
*Source: South Carolina Department of Motor Vehicles

44South Carolina Department of Public Safety
South Carolina Traffic Collision Fact Book 2015
PART II - COLLISION CHARACTERISTICS - SECTION E
UNIT TYPES INVOLVED IN TRAFFIC COLLISIONS
Involved InUnit Type Fatal Collision Injury Collision PDO* Collision Total Units
Automobile 535 36,198 93,405 130,138Pickup Truck 247 10,564 27,802 38,613Truck Tractor 74 1,074 3,518 4,666Other Truck 32 504 1,698 2,234Full Size Van 21 873 2,332 3,226Mini Van 42 2,654 6,304 9,000SUV 273 14,573 39,274 54,120Motorcycle 147 1,687 497 2,331Other Motorbike 44 683 104 831Pedalcycle 16 420 24 460Animal Drawn Vehicle 0 5 19 24Animal - Ridden 0 5 6 11Pedestrian 129 847 28 1,004Train 4 10 30 44School Bus 3 125 308 436Passenger Bus 2 96 224 322Other 11 281 523 815Unknown (Hit & Run Only) 7 663 2,412 3,082TOTALS 1,587 71,262 178,508 251,357
A motor vehicle traffic collision is defined as one in which: (1) the unstable situation originates on a trafficway or (2) a harmfulevent occurs on a trafficway. Using the above definition, each of the unit types listed above was involved in a collisionwhich involved at least one motor vehicle. Units considered as motor vehicles are Automobile, Pickup Truck, Truck Tractor,Other Truck, Full Size Van, Minivan, SUV, Motorcycle, School Bus, Passenger Bus, and Unknown (Hit and Run Only).Units in the Other category may or may not be a motor vehicle, depending on the means by which they were propelled.For units not considered motor vehicles, the collision included at least one other unit which was a motor vehicle.
VEHICLE USE IN TRAFFIC COLLISIONS
Involved InVehicle Use Fatal Collision Injury Collision PDO* Collision Total Units
Personal 1,296 66,083 166,073 233,452Driver Training 0 31 83 114Construction/Maintenance 35 1,075 3,169 4,279Ambulance 0 67 146 213Military 0 10 36 46Transport Passengers 12 463 998 1,473Transport Property 91 1,370 4,145 5,606Farm Use 4 69 128 201Wrecker Or Tow 1 84 252 337Police 6 379 1,172 1,557Government 2 262 849 1,113Fire Fighting 1 31 97 129Logging Truck 8 97 211 316Other 5 406 1,120 1,531Pedestrian 126 835 29 990TOTALS 1,587 71,262 178,508 251,357
*Property Damage Only

45South Carolina Department of Public Safety
South Carolina Traffic Collision Fact Book 2015
PART II - COLLISION CHARACTERISTICS - SECTION E
UNITS INVOLVED IN TRAFFIC COLLISIONS BYMOST HARMFUL EVENT
Involved InMost Harmful Event (MHE) Fatal Collision Injury Collision PDO* Collision Total Units
Cargo/Equip Loss Or Shift 1 56 462 519Cross Median/Center Line 2 236 459 697Downhill Runaway 0 1 8 9Equipment Failure 0 26 162 188Fire/Explosion 18 56 44 118Immersion 3 17 44 64Jackknife 0 2 33 35Overturn/Rollover 140 2,690 2,118 4,948Run Off Road Left 0 1 3 4Run Off Road Right 0 3 5 8Separation Of Units 2 5 28 35Spill (Two Wheel Vehicle) 34 726 83 843Other Non-Collision 4 526 1,063 1,593Unknown Non-Collision 0 101 240 341NON-COLLISION SUBTOTAL 204 4,446 4,752 9,402Animal (Deer Only) 5 283 1,738 2,026Animal (Not Deer) 2 84 342 428Motor Vehicle (In Transport) 936 48,814 125,276 175,026Motor Vehicle (Stopped) 28 8,561 26,851 35,440Motor Vehicle (Other Roadway) 0 81 145 226Motor Vehicle (Parked) 9 441 2,742 3,192Pedalcycle 16 425 30 471Pedestrian 137 743 20 900Railway Vehicle 3 9 21 33Work Zone Maint. Equip. 0 9 22 31Other Movable Object 9 220 1,097 1,326Unknown Movable Object 0 16 59 75COLLISION: OBJECT NOT FIXED SUBTOTAL 1,145 59,686 158,343 219,174Bridge Overhead Structure 0 8 38 46Bridge Parapet End 0 3 10 13Bridge Pier Or Abutment 1 10 17 28Bridge Rail 0 42 109 151Culvert 8 146 308 462Curb 4 115 408 527Ditch 11 1,340 3,262 4,613Embankment 5 333 601 939Equipment 0 5 34 39Fence 2 168 698 868Guardrail End 6 105 241 352Guardrail Face 10 281 881 1,172HWY Traffic Sign Post 3 72 468 543Impact Attenuator/Crash Cushion 0 9 23 32Light Luminaire Support 1 30 70 101Mailbox 2 69 350 421Median Barrier 3 386 1,586 1,975Overhead Sign Support 1 2 6 9Other (Post,Pole,Support,Etc.) 6 178 555 739Other (Wall,Bldg,Tunnel,Etc.) 4 225 424 653Tree 153 2,765 3,604 6,522Utility Pole 14 651 1,062 1,727Workzone Maint. Equip. 0 0 6 6Other 4 168 591 763Unknown Fixed Object 0 19 61 80COLLISION: OBJECT FIXED SUBTOTAL 238 7,130 15,413 22,781TOTALS 1,587 71,262 178,508 251,357
*Property Damage Only
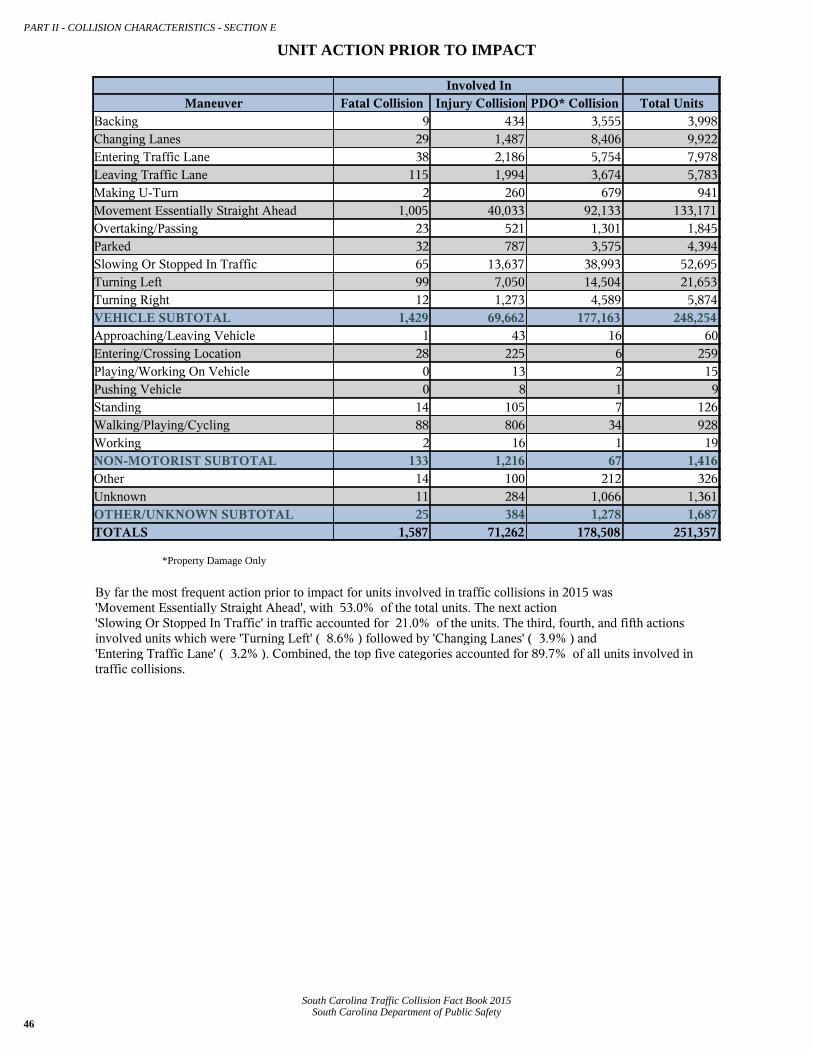
46South Carolina Department of Public Safety
South Carolina Traffic Collision Fact Book 2015
PART II - COLLISION CHARACTERISTICS - SECTION E
UNIT ACTION PRIOR TO IMPACT
Involved InManeuver Fatal Collision Injury Collision PDO* Collision Total Units
Backing 9 434 3,555 3,998Changing Lanes 29 1,487 8,406 9,922Entering Traffic Lane 38 2,186 5,754 7,978Leaving Traffic Lane 115 1,994 3,674 5,783Making U-Turn 2 260 679 941Movement Essentially Straight Ahead 1,005 40,033 92,133 133,171Overtaking/Passing 23 521 1,301 1,845Parked 32 787 3,575 4,394Slowing Or Stopped In Traffic 65 13,637 38,993 52,695Turning Left 99 7,050 14,504 21,653Turning Right 12 1,273 4,589 5,874VEHICLE SUBTOTAL 1,429 69,662 177,163 248,254Approaching/Leaving Vehicle 1 43 16 60Entering/Crossing Location 28 225 6 259Playing/Working On Vehicle 0 13 2 15Pushing Vehicle 0 8 1 9Standing 14 105 7 126Walking/Playing/Cycling 88 806 34 928Working 2 16 1 19NON-MOTORIST SUBTOTAL 133 1,216 67 1,416Other 14 100 212 326Unknown 11 284 1,066 1,361OTHER/UNKNOWN SUBTOTAL 25 384 1,278 1,687TOTALS 1,587 71,262 178,508 251,357
*Property Damage Only
By far the most frequent action prior to impact for units involved in traffic collisions in 2015 was'Movement Essentially Straight Ahead', with 53.0% of the total units. The next action'Slowing Or Stopped In Traffic' in traffic accounted for 21.0% of the units. The third, fourth, and fifth actionsinvolved units which were 'Turning Left' ( 8.6% ) followed by 'Changing Lanes' ( 3.9% ) and'Entering Traffic Lane' ( 3.2% ). Combined, the top five categories accounted for 89.7% of all units involved intraffic collisions.
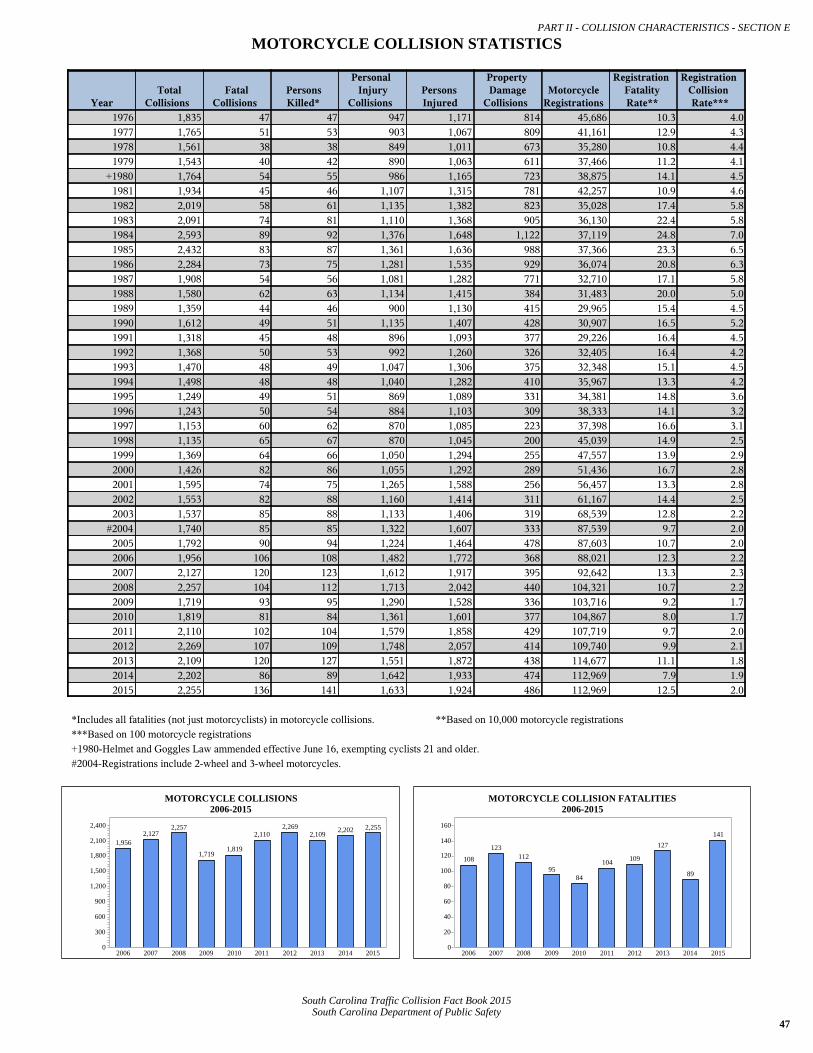
47South Carolina Department of Public Safety
South Carolina Traffic Collision Fact Book 2015
PART II - COLLISION CHARACTERISTICS - SECTION E
MOTORCYCLE COLLISION STATISTICS
YearTotal
CollisionsFatal
CollisionsPersonsKilled*
PersonalInjury
CollisionsPersonsInjured
PropertyDamageCollisions
MotorcycleRegistrations
RegistrationFatalityRate**
RegistrationCollisionRate***
1976 1,835 47 47 947 1,171 814 45,686 10.3 4.01977 1,765 51 53 903 1,067 809 41,161 12.9 4.31978 1,561 38 38 849 1,011 673 35,280 10.8 4.41979 1,543 40 42 890 1,063 611 37,466 11.2 4.1
+1980 1,764 54 55 986 1,165 723 38,875 14.1 4.51981 1,934 45 46 1,107 1,315 781 42,257 10.9 4.61982 2,019 58 61 1,135 1,382 823 35,028 17.4 5.81983 2,091 74 81 1,110 1,368 905 36,130 22.4 5.81984 2,593 89 92 1,376 1,648 1,122 37,119 24.8 7.01985 2,432 83 87 1,361 1,636 988 37,366 23.3 6.51986 2,284 73 75 1,281 1,535 929 36,074 20.8 6.31987 1,908 54 56 1,081 1,282 771 32,710 17.1 5.81988 1,580 62 63 1,134 1,415 384 31,483 20.0 5.01989 1,359 44 46 900 1,130 415 29,965 15.4 4.51990 1,612 49 51 1,135 1,407 428 30,907 16.5 5.21991 1,318 45 48 896 1,093 377 29,226 16.4 4.51992 1,368 50 53 992 1,260 326 32,405 16.4 4.21993 1,470 48 49 1,047 1,306 375 32,348 15.1 4.51994 1,498 48 48 1,040 1,282 410 35,967 13.3 4.21995 1,249 49 51 869 1,089 331 34,381 14.8 3.61996 1,243 50 54 884 1,103 309 38,333 14.1 3.21997 1,153 60 62 870 1,085 223 37,398 16.6 3.11998 1,135 65 67 870 1,045 200 45,039 14.9 2.51999 1,369 64 66 1,050 1,294 255 47,557 13.9 2.92000 1,426 82 86 1,055 1,292 289 51,436 16.7 2.82001 1,595 74 75 1,265 1,588 256 56,457 13.3 2.82002 1,553 82 88 1,160 1,414 311 61,167 14.4 2.52003 1,537 85 88 1,133 1,406 319 68,539 12.8 2.2
#2004 1,740 85 85 1,322 1,607 333 87,539 9.7 2.02005 1,792 90 94 1,224 1,464 478 87,603 10.7 2.02006 1,956 106 108 1,482 1,772 368 88,021 12.3 2.22007 2,127 120 123 1,612 1,917 395 92,642 13.3 2.32008 2,257 104 112 1,713 2,042 440 104,321 10.7 2.22009 1,719 93 95 1,290 1,528 336 103,716 9.2 1.72010 1,819 81 84 1,361 1,601 377 104,867 8.0 1.72011 2,110 102 104 1,579 1,858 429 107,719 9.7 2.02012 2,269 107 109 1,748 2,057 414 109,740 9.9 2.12013 2,109 120 127 1,551 1,872 438 114,677 11.1 1.82014 2,202 86 89 1,642 1,933 474 112,969 7.9 1.92015 2,255 136 141 1,633 1,924 486 112,969 12.5 2.0
*Includes all fatalities (not just motorcyclists) in motorcycle collisions. **Based on 10,000 motorcycle registrations***Based on 100 motorcycle registrations+1980-Helmet and Goggles Law ammended effective June 16, exempting cyclists 21 and older.#2004-Registrations include 2-wheel and 3-wheel motorcycles.
MOTORCYCLE COLLISIONS2006-2015
1,9562,127
2,257
1,7191,819
2,1102,269
2,1092,202 2,255
0
300
600
900
1,200
1,500
1,800
2,100
2,400
2006 2007 2008 2009 2010 2011 2012 2013 2014 2015
MOTORCYCLE COLLISION FATALITIES2006-2015
108
123112
9584
104 109
127
89
141
0
20
40
60
80
100
120
140
160
2006 2007 2008 2009 2010 2011 2012 2013 2014 2015
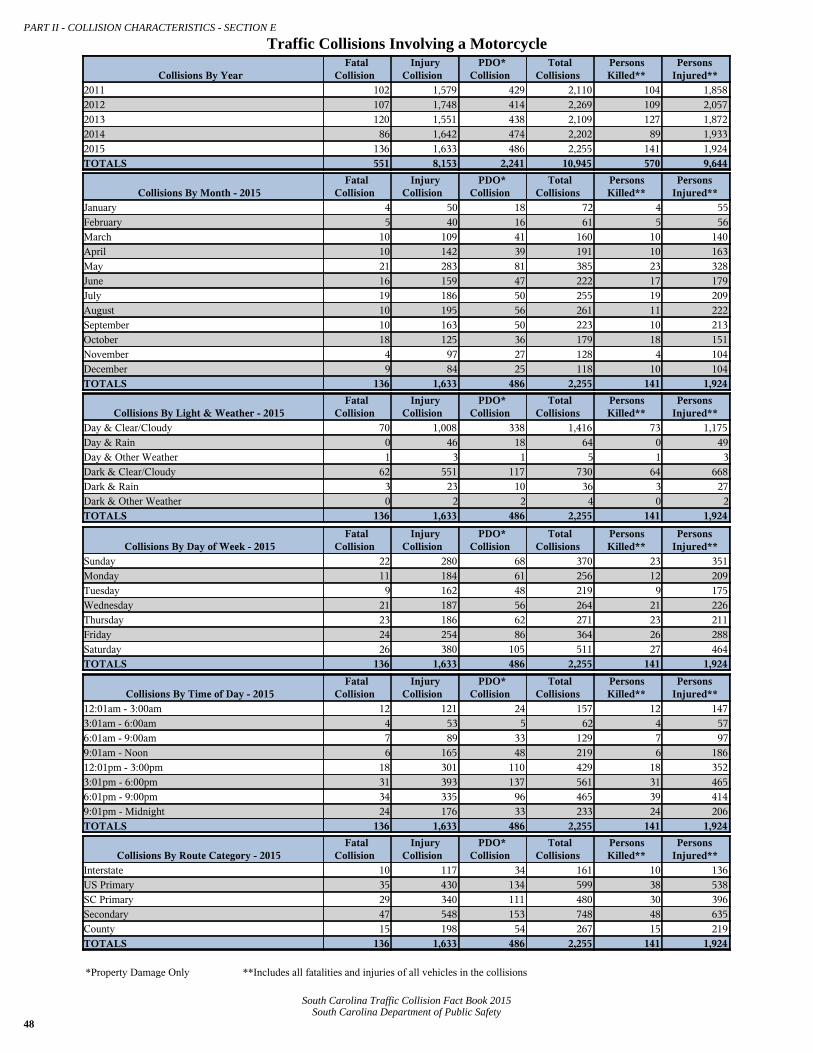
48South Carolina Department of Public Safety
South Carolina Traffic Collision Fact Book 2015
PART II - COLLISION CHARACTERISTICS - SECTION E
Traffic Collisions Involving a Motorcycle
Collisions By YearFatal
CollisionInjury
CollisionPDO*
CollisionTotal
CollisionsPersonsKilled**
PersonsInjured**
2011 102 1,579 429 2,110 104 1,8582012 107 1,748 414 2,269 109 2,0572013 120 1,551 438 2,109 127 1,8722014 86 1,642 474 2,202 89 1,9332015 136 1,633 486 2,255 141 1,924TOTALS 551 8,153 2,241 10,945 570 9,644
Collisions By Month - 2015Fatal
CollisionInjury
CollisionPDO*
CollisionTotal
CollisionsPersonsKilled**
PersonsInjured**
January 4 50 18 72 4 55February 5 40 16 61 5 56March 10 109 41 160 10 140April 10 142 39 191 10 163May 21 283 81 385 23 328June 16 159 47 222 17 179July 19 186 50 255 19 209August 10 195 56 261 11 222September 10 163 50 223 10 213October 18 125 36 179 18 151November 4 97 27 128 4 104December 9 84 25 118 10 104TOTALS 136 1,633 486 2,255 141 1,924
Collisions By Light & Weather - 2015Fatal
CollisionInjury
CollisionPDO*
CollisionTotal
CollisionsPersonsKilled**
PersonsInjured**
Day & Clear/Cloudy 70 1,008 338 1,416 73 1,175Day & Rain 0 46 18 64 0 49Day & Other Weather 1 3 1 5 1 3Dark & Clear/Cloudy 62 551 117 730 64 668Dark & Rain 3 23 10 36 3 27Dark & Other Weather 0 2 2 4 0 2TOTALS 136 1,633 486 2,255 141 1,924
Collisions By Day of Week - 2015Fatal
CollisionInjury
CollisionPDO*
CollisionTotal
CollisionsPersonsKilled**
PersonsInjured**
Sunday 22 280 68 370 23 351Monday 11 184 61 256 12 209Tuesday 9 162 48 219 9 175Wednesday 21 187 56 264 21 226Thursday 23 186 62 271 23 211Friday 24 254 86 364 26 288Saturday 26 380 105 511 27 464TOTALS 136 1,633 486 2,255 141 1,924
Collisions By Time of Day - 2015Fatal
CollisionInjury
CollisionPDO*
CollisionTotal
CollisionsPersonsKilled**
PersonsInjured**
12:01am - 3:00am 12 121 24 157 12 1473:01am - 6:00am 4 53 5 62 4 576:01am - 9:00am 7 89 33 129 7 979:01am - Noon 6 165 48 219 6 18612:01pm - 3:00pm 18 301 110 429 18 3523:01pm - 6:00pm 31 393 137 561 31 4656:01pm - 9:00pm 34 335 96 465 39 4149:01pm - Midnight 24 176 33 233 24 206TOTALS 136 1,633 486 2,255 141 1,924
Collisions By Route Category - 2015Fatal
CollisionInjury
CollisionPDO*
CollisionTotal
CollisionsPersonsKilled**
PersonsInjured**
Interstate 10 117 34 161 10 136US Primary 35 430 134 599 38 538SC Primary 29 340 111 480 30 396Secondary 47 548 153 748 48 635County 15 198 54 267 15 219TOTALS 136 1,633 486 2,255 141 1,924
*Property Damage Only **Includes all fatalities and injuries of all vehicles in the collisions

49South Carolina Department of Public Safety
South Carolina Traffic Collision Fact Book 2015
PART II - COLLISION CHARACTERISTICS - SECTION E
MOTORCYCLISTS INVOLVED IN TRAFFIC COLLISIONS
Gender of Motorcyclist FatalityNon-Fatal
Injury Not InjuredTotal
Occupants PercentFemale 19 243 74 336 13.2%Male 121 1,536 504 2,161 84.6%Unknown 0 7 50 57 2.2%TOTALS 140 1,786 628 2,554 100%
Helmet Usage for Motorcyclist FatalityNon-Fatal
Injury Not InjuredTotal
Occupants PercentUnder 15 0 4 3 7 0.3%15-20 2 47 20 69 2.7%21-24 5 82 23 110 4.3%25-34 9 137 55 201 7.9%35-44 8 118 38 164 6.4%45+ 13 227 84 324 12.7%Unknown 0 2 4 6 0.2%Helmet Used Subtotal 37 617 227 881 34.5%Under 15 0 6 0 6 0.2%15-20 2 41 13 56 2.2%21-24 11 103 26 140 5.5%25-34 26 254 77 357 14.0%35-44 18 217 71 306 12.0%45+ 41 442 110 593 23.2%Unknown 0 9 21 30 1.2%Helmet Not Used Subtotal 98 1,072 318 1,488 58.3%Under 15 0 0 0 0 0.0%15-20 0 8 3 11 0.4%21-24 1 8 3 12 0.5%25-34 1 19 10 30 1.2%35-44 0 20 7 27 1.1%45+ 3 41 18 62 2.4%Unknown 0 1 42 43 1.7%Helmet Usage Unknown Subtotal 5 97 83 185 7.2%TOTALS 140 1,786 628 2,554 100%
Motorcyclist Driver Contributed to Collision?Fatal
CollisionInjury
CollisionPDO*
CollisionTotal
Drivers PercentNo 59 751 245 1,055 45.3%Unknown 0 0 2 2 0.1%Yes 88 936 250 1,274 54.7%TOTALS 147 1,687 497 2,331 100%
Other Unit Type Contributed to Collision?Fatal
CollisionInjury
CollisionPDO*
Collision Total Units PercentNo 38 329 182 549 39.4%Unknown 0 2 3 5 0.4%Yes 53 572 214 839 60.2%TOTALS 91 903 399 1,393 100%
*Property Damage Only

PART II - COLLISION CHARACTERISTICS - SECTION E
MOTORCYCLIST HELMET USAGE BY INJURY SEVERITY
50South Carolina Department of Public Safety
South Carolina Traffic Collision Fact Book 2015
FATAL INJURIES
No
98
70.00%
Yes
37
26.43%
Unknown53.57%
NON-FATAL INJURIES
No
1,072
60.02%
Yes
617
34.55%
Unknown97
5.43%
NOT INJURED
No
318
50.64%
Yes
227
36.15%
Unknown
83
13.22%
ALL RIDERS
No
1,488
58.26%
Yes
881
34.49%
Unknown185
7.24%

51South Carolina Department of Public Safety
South Carolina Traffic Collision Fact Book 2015
PART II - COLLISION CHARACTERISTICS - SECTION E
Traffic Collisions Involving a Other Motorbike
Collisions By YearFatal
CollisionInjury
CollisionPDO*
CollisionTotal
CollisionsPersonsKilled**
PersonsInjured**
2011 23 605 94 722 23 6722012 37 694 80 811 38 7862013 25 685 75 785 25 7542014 31 643 93 767 32 7202015 44 681 104 829 45 757TOTALS 160 3,308 446 3,914 163 3,689
Collisions By Month - 2015Fatal
CollisionInjury
CollisionPDO*
CollisionTotal
CollisionsPersonsKilled**
PersonsInjured**
January 4 35 3 42 4 42February 2 33 6 41 2 34March 6 40 5 51 6 42April 2 59 12 73 2 64May 4 70 15 89 4 74June 5 68 5 78 5 75July 2 73 9 84 2 83August 2 82 11 95 2 95September 5 64 11 80 5 71October 5 54 9 68 5 60November 6 51 11 68 7 60December 1 52 7 60 1 57TOTALS 44 681 104 829 45 757
Collisions By Light & Weather - 2015Fatal
CollisionInjury
CollisionPDO*
CollisionTotal
CollisionsPersonsKilled**
PersonsInjured**
Day & Clear/Cloudy 13 372 64 449 13 405Day & Rain 1 21 5 27 1 23Day & Other Weather 0 2 0 2 0 2Dark & Clear/Cloudy 25 247 27 299 26 281Dark & Rain 5 38 8 51 5 45Dark & Other Weather 0 1 0 1 0 1TOTALS 44 681 104 829 45 757
Collisions By Day of Week - 2015Fatal
CollisionInjury
CollisionPDO*
CollisionTotal
CollisionsPersonsKilled**
PersonsInjured**
Sunday 5 86 8 99 6 94Monday 7 92 14 113 7 108Tuesday 6 98 12 116 6 114Wednesday 8 100 10 118 8 103Thursday 7 95 22 124 7 109Friday 2 96 19 117 2 103Saturday 9 114 19 142 9 126TOTALS 44 681 104 829 45 757
Collisions By Time of Day - 2015Fatal
CollisionInjury
CollisionPDO*
CollisionTotal
CollisionsPersonsKilled**
PersonsInjured**
12:01am - 3:00am 2 47 7 56 2 483:01am - 6:00am 3 22 0 25 4 266:01am - 9:00am 3 40 5 48 3 449:01am - Noon 5 58 12 75 5 6212:01pm - 3:00pm 3 114 18 135 3 1243:01pm - 6:00pm 5 164 29 198 5 1796:01pm - 9:00pm 11 141 22 174 11 1609:01pm - Midnight 12 95 11 118 12 114TOTALS 44 681 104 829 45 757
Collisions By Route Category - 2015Fatal
CollisionInjury
CollisionPDO*
CollisionTotal
CollisionsPersonsKilled**
PersonsInjured**
Interstate 0 1 0 1 0 1US Primary 20 162 24 206 20 184SC Primary 10 131 19 160 10 150Secondary 12 251 36 299 13 277County 2 136 25 163 2 145TOTALS 44 681 104 829 45 757
*Property Damage Only **Includes all fatalities and injuries of all vehicles in the collisions
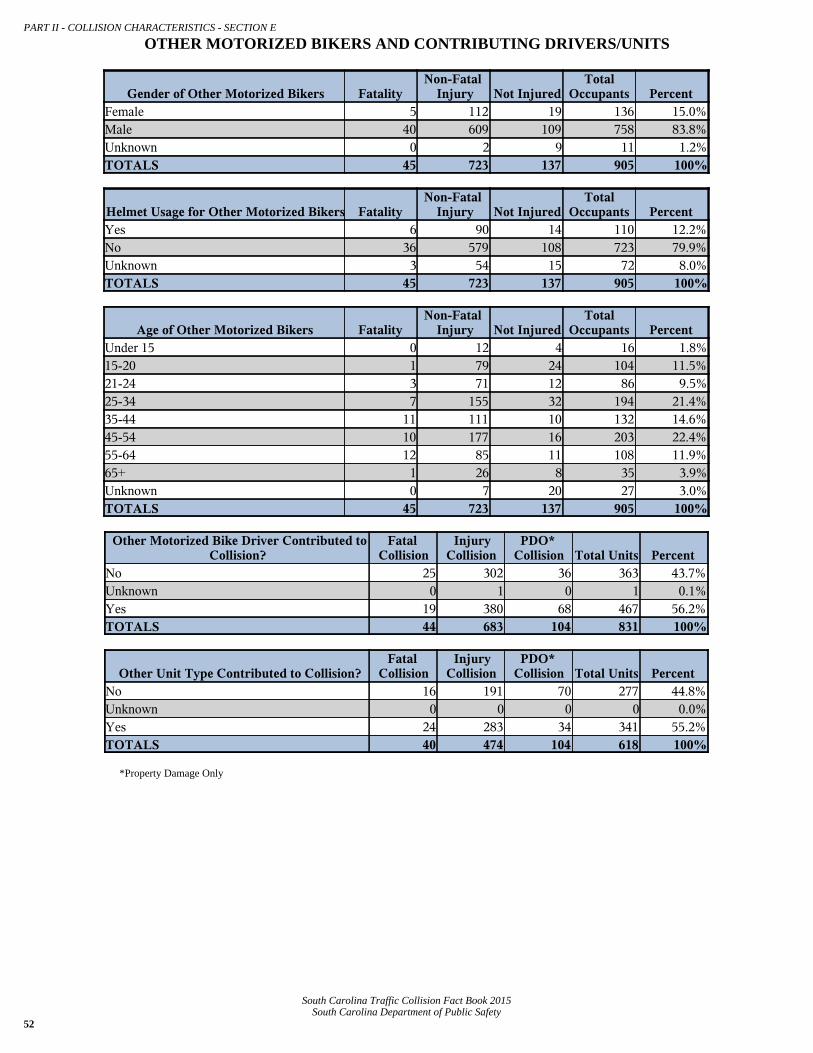
52South Carolina Department of Public Safety
South Carolina Traffic Collision Fact Book 2015
PART II - COLLISION CHARACTERISTICS - SECTION E
OTHER MOTORIZED BIKERS AND CONTRIBUTING DRIVERS/UNITS
Gender of Other Motorized Bikers FatalityNon-Fatal
Injury Not InjuredTotal
Occupants PercentFemale 5 112 19 136 15.0%Male 40 609 109 758 83.8%Unknown 0 2 9 11 1.2%TOTALS 45 723 137 905 100%
Helmet Usage for Other Motorized Bikers FatalityNon-Fatal
Injury Not InjuredTotal
Occupants PercentYes 6 90 14 110 12.2%No 36 579 108 723 79.9%Unknown 3 54 15 72 8.0%TOTALS 45 723 137 905 100%
Age of Other Motorized Bikers FatalityNon-Fatal
Injury Not InjuredTotal
Occupants PercentUnder 15 0 12 4 16 1.8%15-20 1 79 24 104 11.5%21-24 3 71 12 86 9.5%25-34 7 155 32 194 21.4%35-44 11 111 10 132 14.6%45-54 10 177 16 203 22.4%55-64 12 85 11 108 11.9%65+ 1 26 8 35 3.9%Unknown 0 7 20 27 3.0%TOTALS 45 723 137 905 100%
Other Motorized Bike Driver Contributed toCollision?
FatalCollision
InjuryCollision
PDO*Collision Total Units Percent
No 25 302 36 363 43.7%Unknown 0 1 0 1 0.1%Yes 19 380 68 467 56.2%TOTALS 44 683 104 831 100%
Other Unit Type Contributed to Collision?Fatal
CollisionInjury
CollisionPDO*
Collision Total Units PercentNo 16 191 70 277 44.8%Unknown 0 0 0 0 0.0%Yes 24 283 34 341 55.2%TOTALS 40 474 104 618 100%
*Property Damage Only

53South Carolina Department of Public Safety
South Carolina Traffic Collision Fact Book 2015
PART II - COLLISION CHARACTERISTICS - SECTION E
Traffic Collisions Involving a Pedalcycle
Collisions By YearFatal
CollisionInjury
CollisionPDO*
CollisionTotal
CollisionsPersonsKilled**
PersonsInjured**
2011 16 403 29 448 16 4192012 14 493 34 541 14 5142013 15 446 28 489 15 4782014 14 449 31 494 14 4702015 16 417 24 457 16 427TOTALS 75 2,208 146 2,429 75 2,308
Collisions By Month - 2015Fatal
CollisionInjury
CollisionPDO*
CollisionTotal
CollisionsPersonsKilled**
PersonsInjured**
January 1 17 0 18 1 17February 2 9 0 11 2 9March 0 21 1 22 0 21April 5 32 2 39 5 34May 0 44 2 46 0 44June 0 59 3 62 0 61July 0 48 1 49 0 50August 3 51 2 56 3 52September 3 40 3 46 3 40October 1 44 7 52 1 46November 0 28 2 30 0 29December 1 24 1 26 1 24TOTALS 16 417 24 457 16 427
Collisions By Light & Weather - 2015Fatal
CollisionInjury
CollisionPDO*
CollisionTotal
CollisionsPersonsKilled**
PersonsInjured**
Day & Clear/Cloudy 2 285 16 303 2 290Day & Rain 0 15 0 15 0 15Day & Other Weather 0 1 0 1 0 1Dark & Clear/Cloudy 13 103 7 123 13 108Dark & Rain 1 11 1 13 1 11Dark & Other Weather 0 2 0 2 0 2TOTALS 16 417 24 457 16 427
Collisions By Day of Week - 2015Fatal
CollisionInjury
CollisionPDO*
CollisionTotal
CollisionsPersonsKilled**
PersonsInjured**
Sunday 2 41 0 43 2 41Monday 2 77 3 82 2 77Tuesday 3 57 7 67 3 58Wednesday 3 62 3 68 3 64Thursday 3 67 3 73 3 69Friday 2 61 5 68 2 63Saturday 1 52 3 56 1 55TOTALS 16 417 24 457 16 427
Collisions By Time of Day - 2015Fatal
CollisionInjury
CollisionPDO*
CollisionTotal
CollisionsPersonsKilled**
PersonsInjured**
12:01am - 3:00am 1 5 1 7 1 53:01am - 6:00am 1 12 1 14 1 136:01am - 9:00am 3 36 0 39 3 379:01am - Noon 0 59 4 63 0 5912:01pm - 3:00pm 1 72 3 76 1 723:01pm - 6:00pm 0 111 8 119 0 1146:01pm - 9:00pm 5 89 4 98 5 949:01pm - Midnight 5 33 3 41 5 33TOTALS 16 417 24 457 16 427
Collisions By Route Category - 2015Fatal
CollisionInjury
CollisionPDO*
CollisionTotal
CollisionsPersonsKilled**
PersonsInjured**
Interstate 0 0 0 0 0 0US Primary 4 90 0 94 4 90SC Primary 5 64 6 75 5 68Secondary 7 195 14 216 7 200County 0 68 4 72 0 69TOTALS 16 417 24 457 16 427
*Property Damage Only **Includes all fatalities and injuries of all vehicles in the collisions

54South Carolina Department of Public Safety
South Carolina Traffic Collision Fact Book 2015
PART II - COLLISION CHARACTERISTICS - SECTION E
PEDALCYCLISTS AND CONTRIBUTING DRIVERS/UNITS
Gender of Pedalcyclists FatalityNon-Fatal
Injury Not InjuredTotal
Occupants PercentFemale 1 85 2 88 19.0%Male 15 334 24 373 80.6%Unknown 0 1 1 2 0.4%TOTALS 16 420 27 463 100%
Safety Equipment Use for Pedalcyclists FatalityNon-Fatal
Injury Not InjuredTotal
Occupants PercentNone Used 13 306 22 341 73.7%Helmet 1 56 2 59 12.7%Protective Pads 0 3 0 3 0.6%Reflective Clothing 1 9 0 10 2.2%Lighting 0 8 0 8 1.7%Other 0 19 1 20 4.3%Unknown 1 19 2 22 4.8%TOTALS 16 420 27 463 100%
Age of Pedalcyclists FatalityNon-Fatal
Injury Not InjuredTotal
Occupants PercentUnder 10 0 25 0 25 5.4%10-19 1 66 7 74 16.0%20-29 1 97 8 106 22.9%30-39 1 47 1 49 10.6%40-49 5 50 2 57 12.3%50-59 6 71 4 81 17.5%60-69 1 38 3 42 9.1%70-79 1 18 0 19 4.1%80+ 0 3 0 3 0.6%Unknown 0 5 2 7 1.5%TOTALS 16 420 27 463 100%
Pedalcyclists Driver Contributed to Collision?Fatal
CollisionInjury
CollisionPDO*
CollisionTotal
Drivers PercentNo 7 175 9 191 41.5%Unknown 0 1 0 1 0.2%Yes 9 244 15 268 58.3%TOTALS 16 420 24 460 100%
Other Unit Type Contributed to Collision?Fatal
CollisionInjury
CollisionPDO*
Collision Total Units PercentNo 6 237 16 259 56.2%Unknown 0 1 0 1 0.2%Yes 10 181 10 201 43.6%TOTALS 16 419 26 461 100%
*Property Damage Only

55South Carolina Department of Public Safety
South Carolina Traffic Collision Fact Book 2015
PART II - COLLISION CHARACTERISTICS - SECTION E
Traffic Collisions Involving a School Bus
Collisions By YearFatal
CollisionInjury
CollisionPDO*
CollisionTotal
CollisionsPersonsKilled**
PersonsInjured**
2011 0 80 214 294 0 1462012 4 102 260 366 4 2382013 5 139 268 412 7 3292014 1 120 322 443 1 2742015 3 125 304 432 3 257TOTALS 13 566 1,368 1,947 15 1,244
Collisions By Month - 2015Fatal
CollisionInjury
CollisionPDO*
CollisionTotal
CollisionsPersonsKilled**
PersonsInjured**
January 0 13 29 42 0 27February 1 12 29 42 1 26March 0 13 45 58 0 26April 0 8 25 33 0 11May 1 13 32 46 1 27June 0 1 5 6 0 1July 0 1 3 4 0 1August 0 8 20 28 0 10September 0 13 30 43 0 28October 1 24 28 53 1 49November 0 13 30 43 0 37December 0 6 28 34 0 14TOTALS 3 125 304 432 3 257
Collisions By Light & Weather - 2015Fatal
CollisionInjury
CollisionPDO*
CollisionTotal
CollisionsPersonsKilled**
PersonsInjured**
Day & Clear/Cloudy 2 89 241 332 2 175Day & Rain 0 15 27 42 0 38Day & Other Weather 0 0 1 1 0 0Dark & Clear/Cloudy 1 17 27 45 1 40Dark & Rain 0 3 7 10 0 3Dark & Other Weather 0 1 1 2 0 1TOTALS 3 125 304 432 3 257
Collisions By Day of Week - 2015Fatal
CollisionInjury
CollisionPDO*
CollisionTotal
CollisionsPersonsKilled**
PersonsInjured**
Sunday 0 1 2 3 0 1Monday 1 27 47 75 1 66Tuesday 0 16 67 83 0 21Wednesday 1 24 63 88 1 51Thursday 0 27 61 88 0 58Friday 1 30 59 90 1 60Saturday 0 0 5 5 0 0TOTALS 3 125 304 432 3 257
Collisions By Time of Day - 2015Fatal
CollisionInjury
CollisionPDO*
CollisionTotal
CollisionsPersonsKilled**
PersonsInjured**
12:01am - 3:00am 0 0 1 1 0 03:01am - 6:00am 0 1 3 4 0 16:01am - 9:00am 1 57 119 177 1 1289:01am - Noon 0 5 18 23 0 912:01pm - 3:00pm 0 21 38 59 0 443:01pm - 6:00pm 2 38 120 160 2 716:01pm - 9:00pm 0 2 2 4 0 39:01pm - Midnight 0 1 3 4 0 1TOTALS 3 125 304 432 3 257
Collisions By Route Category - 2015Fatal
CollisionInjury
CollisionPDO*
CollisionTotal
CollisionsPersonsKilled**
PersonsInjured**
Interstate 0 3 5 8 0 8US Primary 0 22 42 64 0 41SC Primary 0 30 44 74 0 65Secondary 3 61 153 217 3 127County 0 9 60 69 0 16TOTALS 3 125 304 432 3 257
*Property Damage Only **Includes all fatalities and injuries of all vehicles in the collisions

56South Carolina Department of Public Safety
South Carolina Traffic Collision Fact Book 2015
PART II - COLLISION CHARACTERISTICS - SECTION E
TRAFFIC COLLISIONS INVOLVING SCHOOL BUSES
Collisions by Traffic Control Type - 2015Fatal
CollisionInjury
CollisionPDO*
CollisionTotal
CollisionsPersonsKilled**
PersonsInjured**
Stop And Go Light 0 28 36 64 0 52Flashing Traffic Signal 0 0 2 2 0 0RR (X-Bucks, Lights And Gates) 0 1 3 4 0 1RR (X-Bucks And Lights) 0 1 1 2 0 3RR (X-Bucks Only) 0 3 2 5 0 3Officer Or Flagman 0 0 2 2 0 0Pavement Markings(Only) 1 6 31 38 1 8Stop Sign 0 22 70 92 0 44School Zone Sign 0 0 1 1 0 0Yield Sign 0 1 4 5 0 4Work Zone 0 0 1 1 0 0Other Warning Signs 0 3 6 9 0 9Flashing Beacon 0 1 1 2 0 3None 2 59 144 205 2 130TOTALS 3 125 304 432 3 257
School Bus Driver Contributed to Collision?Fatal
CollisionInjury
CollisionPDO*
CollisionTotal
Drivers PercentNo 2 80 190 272 62.4%Unknown 0 0 0 0 0.0%Yes 1 45 118 164 37.6%TOTALS 3 125 308 436 100%
Other Unit Type Contributed to Collision?Fatal
CollisionInjury
CollisionPDO*
Collision Total Units PercentNo 1 58 120 179 40.5%Unknown 0 0 0 0 0.0%Yes 2 80 181 263 59.5%TOTALS 3 138 301 442 100%
*Property Damage Only **Includes all fatalities and injuries of all vehicles in the collisions

57South Carolina Department of Public Safety
South Carolina Traffic Collision Fact Book 2015
PART II - COLLISION CHARACTERISTICS - SECTION E
Traffic Collisions Involving a Pedestrian
Collisions By YearFatal
CollisionInjury
CollisionPDO*
CollisionTotal
CollisionsPersonsKilled**
PersonsInjured**
2011 112 681 24 817 113 8252012 121 890 26 1,037 125 1,0242013 100 834 28 962 100 9502014 107 795 21 923 110 9162015 126 799 28 953 131 921TOTALS 566 3,999 127 4,692 579 4,636
Collisions By Month - 2015Fatal
CollisionInjury
CollisionPDO*
CollisionTotal
CollisionsPersonsKilled**
PersonsInjured**
January 14 47 3 64 14 58February 9 33 5 47 9 33March 11 62 3 76 16 74April 6 47 2 55 6 57May 6 62 3 71 6 75June 12 58 0 70 12 65July 6 62 3 71 6 73August 9 62 2 73 9 73September 9 77 1 87 9 85October 20 100 1 121 20 111November 13 87 3 103 13 97December 11 102 2 115 11 120TOTALS 126 799 28 953 131 921
Collisions By Light & Weather - 2015Fatal
CollisionInjury
CollisionPDO*
CollisionTotal
CollisionsPersonsKilled**
PersonsInjured**
Day & Clear/Cloudy 14 327 13 354 14 372Day & Rain 1 27 0 28 1 31Day & Other Weather 0 1 0 1 0 1Dark & Clear/Cloudy 95 363 14 472 95 421Dark & Rain 12 70 1 83 12 82Dark & Other Weather 4 11 0 15 9 14TOTALS 126 799 28 953 131 921
Collisions By Day of Week - 2015Fatal
CollisionInjury
CollisionPDO*
CollisionTotal
CollisionsPersonsKilled**
PersonsInjured**
Sunday 11 92 2 105 11 104Monday 12 122 3 137 12 144Tuesday 18 89 1 108 18 96Wednesday 16 126 6 148 16 140Thursday 21 122 6 149 26 151Friday 18 138 3 159 18 163Saturday 30 110 7 147 30 123TOTALS 126 799 28 953 131 921
Collisions By Time of Day - 2015Fatal
CollisionInjury
CollisionPDO*
CollisionTotal
CollisionsPersonsKilled**
PersonsInjured**
12:01am - 3:00am 16 46 2 64 16 483:01am - 6:00am 13 20 2 35 13 296:01am - 9:00am 11 68 4 83 11 789:01am - Noon 7 74 3 84 7 8212:01pm - 3:00pm 2 92 2 96 2 1073:01pm - 6:00pm 7 133 3 143 7 1596:01pm - 9:00pm 41 218 9 268 41 2529:01pm - Midnight 29 148 3 180 34 166TOTALS 126 799 28 953 131 921
Collisions By Route Category - 2015Fatal
CollisionInjury
CollisionPDO*
CollisionTotal
CollisionsPersonsKilled**
PersonsInjured**
Interstate 13 16 5 34 18 24US Primary 45 181 7 233 45 215SC Primary 27 145 7 179 27 172Secondary 40 316 7 363 40 354County 1 141 2 144 1 156TOTALS 126 799 28 953 131 921
*Property Damage Only **Includes all fatalities and injuries of all vehicles in the collisions

58South Carolina Department of Public Safety
South Carolina Traffic Collision Fact Book 2015
PART II - COLLISION CHARACTERISTICS - SECTION E
PEDESTRIANS AND CONTRIBUTING DRIVERS/UNITS
Gender of Pedestrians FatalityNon-Fatal
Injury Not InjuredTotal
Occupants PercentFemale 28 285 6 319 31.8%Male 97 543 35 675 67.2%Unknown 0 3 7 10 1.0%TOTALS 125 831 48 1,004 100%
Age of Pedestrians FatalityNon-Fatal
Injury Not InjuredTotal
Occupants PercentUnder 5 0 15 1 16 1.6%5-9 2 29 0 31 3.1%10-14 2 44 1 47 4.7%15-19 11 95 2 108 10.8%20-24 10 100 5 115 11.5%25-34 18 146 7 171 17.0%35-44 15 103 11 129 12.8%45-54 22 132 8 162 16.1%55-64 27 109 4 140 13.9%65-74 7 39 0 46 4.6%75+ 11 12 0 23 2.3%Unknown 0 7 9 16 1.6%TOTALS 125 831 48 1,004 100%
Pedestrian Action Prior to Impact FatalityNon-Fatal
Injury Not InjuredTotal
Occupants PercentApproaching/Leaving Vehicle 0 26 0 26 2.6%Entering/Crossing Location 25 179 7 211 21.0%Playing/Working On Vehicle 0 10 0 10 1.0%Pushing Vehicle 0 5 0 5 0.5%Standing 13 98 12 123 12.3%Walking/Playing/Cycling 74 482 27 583 58.1%Working 2 15 1 18 1.8%Other 8 8 1 17 1.7%Unknown 3 8 0 11 1.1%TOTALS 125 831 48 1,004 100%
Pedestrian Contributed to Collision?Fatal
CollisionInjury
CollisionPDO*
CollisionTotal
Pedestrians PercentNo 21 365 8 394 39.2%Unknown 3 1 0 4 0.4%Yes 105 481 20 606 60.4%TOTALS 129 847 28 1,004 100%
Other Unit Type Contributed to Collision?Fatal
CollisionInjury
CollisionPDO*
Collision Total Units PercentNo 122 519 26 667 62.6%Unknown 3 2 0 5 0.5%Yes 23 356 15 394 37.0%TOTALS 148 877 41 1,066 100%
*Property Damage Only

59South Carolina Department of Public Safety
South Carolina Traffic Collision Fact Book 2015
PART II - COLLISION CHARACTERISTICS - SECTION E
Traffic Collisions Involving a Train
Collisions By YearFatal
CollisionInjury
CollisionPDO*
CollisionTotal
CollisionsPersonsKilled**
PersonsInjured**
2011 3 9 16 28 4 152012 0 18 30 48 0 292013 2 10 19 31 2 122014 2 14 27 43 2 222015 4 10 29 43 5 12TOTALS 11 61 121 193 13 90
Collisions By Month - 2015Fatal
CollisionInjury
CollisionPDO*
CollisionTotal
CollisionsPersonsKilled**
PersonsInjured**
January 1 2 4 7 1 3February 0 0 4 4 0 0March 0 0 1 1 0 0April 0 2 0 2 0 2May 0 0 2 2 0 0June 1 0 1 2 2 0July 0 2 2 4 0 2August 0 2 5 7 0 2September 1 0 5 6 1 0October 0 0 0 0 0 0November 0 2 1 3 0 3December 1 0 4 5 1 0TOTALS 4 10 29 43 5 12
Collisions By Light & Weather - 2015Fatal
CollisionInjury
CollisionPDO*
CollisionTotal
CollisionsPersonsKilled**
PersonsInjured**
Day & Clear/Cloudy 2 6 18 26 2 8Day & Rain 0 2 1 3 0 2Day & Other Weather 0 0 0 0 0 0Dark & Clear/Cloudy 1 0 8 9 2 0Dark & Rain 1 2 2 5 1 2Dark & Other Weather 0 0 0 0 0 0TOTALS 4 10 29 43 5 12
Collisions By Day of Week - 2015Fatal
CollisionInjury
CollisionPDO*
CollisionTotal
CollisionsPersonsKilled**
PersonsInjured**
Sunday 0 0 1 1 0 0Monday 0 3 5 8 0 4Tuesday 2 0 4 6 3 0Wednesday 1 2 7 10 1 2Thursday 0 2 4 6 0 3Friday 1 1 4 6 1 1Saturday 0 2 4 6 0 2TOTALS 4 10 29 43 5 12
Collisions By Time of Day - 2015Fatal
CollisionInjury
CollisionPDO*
CollisionTotal
CollisionsPersonsKilled**
PersonsInjured**
12:01am - 3:00am 0 0 3 3 0 03:01am - 6:00am 1 0 0 1 1 06:01am - 9:00am 0 2 9 11 0 29:01am - Noon 1 2 5 8 1 312:01pm - 3:00pm 1 2 4 7 1 33:01pm - 6:00pm 0 3 1 4 0 36:01pm - 9:00pm 0 0 4 4 0 09:01pm - Midnight 1 1 3 5 2 1TOTALS 4 10 29 43 5 12
Collisions By Route Category - 2015Fatal
CollisionInjury
CollisionPDO*
CollisionTotal
CollisionsPersonsKilled**
PersonsInjured**
Interstate 0 0 0 0 0 0US Primary 1 1 6 8 1 1SC Primary 0 2 4 6 0 3Secondary 1 3 13 17 1 4County 2 4 6 12 3 4TOTALS 4 10 29 43 5 12
*Property Damage Only **Includes all fatalities and injuries of all vehicles in the collisions
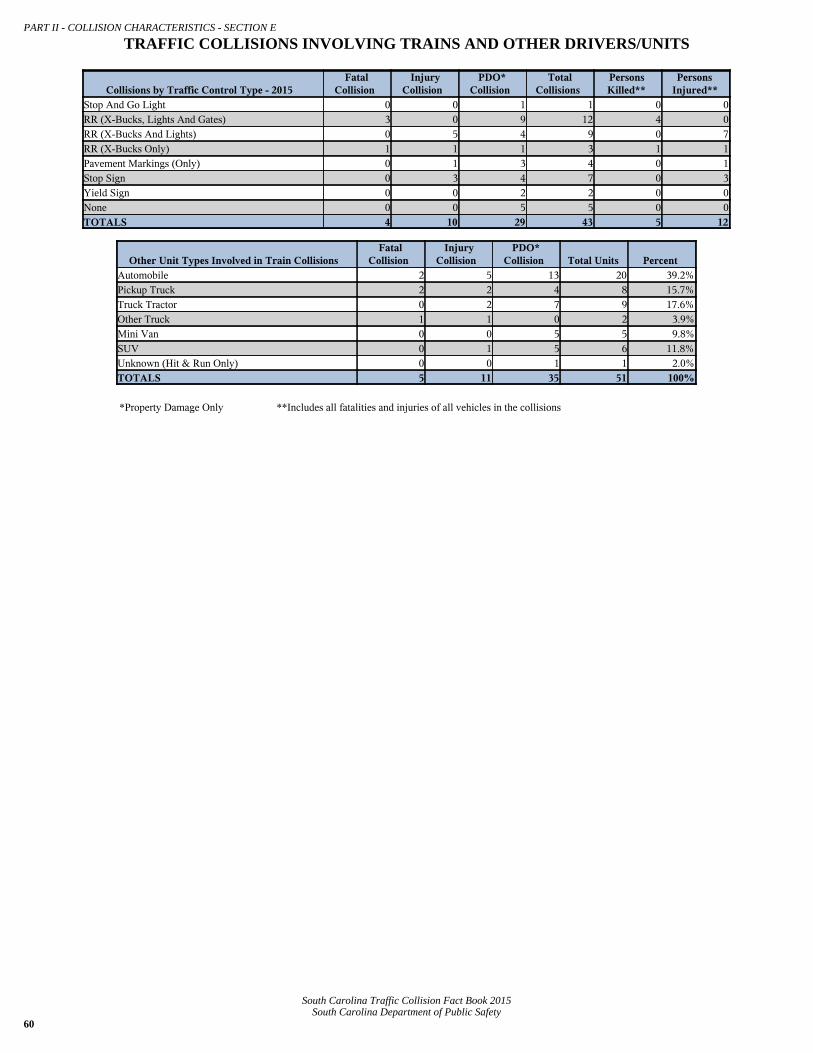
60South Carolina Department of Public Safety
South Carolina Traffic Collision Fact Book 2015
PART II - COLLISION CHARACTERISTICS - SECTION E
TRAFFIC COLLISIONS INVOLVING TRAINS AND OTHER DRIVERS/UNITS
Collisions by Traffic Control Type - 2015Fatal
CollisionInjury
CollisionPDO*
CollisionTotal
CollisionsPersonsKilled**
PersonsInjured**
Stop And Go Light 0 0 1 1 0 0RR (X-Bucks, Lights And Gates) 3 0 9 12 4 0RR (X-Bucks And Lights) 0 5 4 9 0 7RR (X-Bucks Only) 1 1 1 3 1 1Pavement Markings (Only) 0 1 3 4 0 1Stop Sign 0 3 4 7 0 3Yield Sign 0 0 2 2 0 0None 0 0 5 5 0 0TOTALS 4 10 29 43 5 12
Other Unit Types Involved in Train CollisionsFatal
CollisionInjury
CollisionPDO*
Collision Total Units PercentAutomobile 2 5 13 20 39.2%Pickup Truck 2 2 4 8 15.7%Truck Tractor 0 2 7 9 17.6%Other Truck 1 1 0 2 3.9%Mini Van 0 0 5 5 9.8%SUV 0 1 5 6 11.8%Unknown (Hit & Run Only) 0 0 1 1 2.0%TOTALS 5 11 35 51 100%
*Property Damage Only **Includes all fatalities and injuries of all vehicles in the collisions

61South Carolina Department of Public Safety
South Carolina Traffic Collision Fact Book 2015
PART II - COLLISION CHARACTERISTICS - SECTION E
Traffic Collisions Involving a SUV
Collisions By YearFatal
CollisionInjury
CollisionPDO*
CollisionTotal
CollisionsPersonsKilled**
PersonsInjured**
2011 185 8,839 23,391 32,415 204 14,5102012 198 9,935 25,287 35,420 213 16,4402013 174 10,462 27,409 38,045 188 17,3522014 199 11,073 29,606 40,878 221 18,3092015 244 12,722 34,366 47,332 264 20,846TOTALS 1,000 53,031 140,059 194,090 1,090 87,457
Collisions By Month - 2015Fatal
CollisionInjury
CollisionPDO*
CollisionTotal
CollisionsPersonsKilled**
PersonsInjured**
January 17 849 2,464 3,330 18 1,407February 24 858 2,374 3,256 25 1,390March 21 1,007 2,749 3,777 26 1,701April 20 1,049 2,863 3,932 22 1,702May 15 1,036 2,691 3,742 16 1,727June 17 1,028 2,670 3,715 19 1,687July 19 1,068 2,629 3,716 20 1,781August 19 1,081 2,914 4,014 20 1,790September 15 1,110 2,977 4,102 15 1,780October 37 1,210 3,509 4,756 37 1,965November 21 1,183 3,211 4,415 26 1,916December 19 1,243 3,315 4,577 20 2,000TOTALS 244 12,722 34,366 47,332 264 20,846
Collisions By Light & Weather - 2015Fatal
CollisionInjury
CollisionPDO*
CollisionTotal
CollisionsPersonsKilled**
PersonsInjured**
Day & Clear/Cloudy 115 7,772 22,684 30,571 129 12,612Day & Rain 11 1,218 3,656 4,885 11 1,938Day & Other Weather 0 36 140 176 0 48Dark & Clear/Cloudy 106 2,936 6,085 9,127 112 5,001Dark & Rain 12 684 1,621 2,317 12 1,138Dark & Other Weather 0 76 180 256 0 109TOTALS 244 12,722 34,366 47,332 264 20,846
Collisions By Day of Week - 2015Fatal
CollisionInjury
CollisionPDO*
CollisionTotal
CollisionsPersonsKilled**
PersonsInjured**
Sunday 21 1,325 3,042 4,388 25 2,215Monday 35 1,880 5,232 7,147 36 2,986Tuesday 28 1,842 5,176 7,046 29 2,944Wednesday 33 1,900 5,256 7,189 33 3,020Thursday 32 1,924 5,345 7,301 36 3,196Friday 41 2,196 6,092 8,329 45 3,579Saturday 54 1,655 4,223 5,932 60 2,906TOTALS 244 12,722 34,366 47,332 264 20,846
Collisions By Time of Day - 2015Fatal
CollisionInjury
CollisionPDO*
CollisionTotal
CollisionsPersonsKilled**
PersonsInjured**
12:01am - 3:00am 26 503 879 1,408 26 8573:01am - 6:00am 14 336 707 1,057 16 4776:01am - 9:00am 19 1,625 4,853 6,497 21 2,4469:01am - Noon 22 1,588 4,403 6,013 24 2,52312:01pm - 3:00pm 34 2,475 7,098 9,607 34 4,0973:01pm - 6:00pm 48 3,268 9,802 13,118 54 5,3106:01pm - 9:00pm 48 1,964 4,817 6,829 55 3,4089:01pm - Midnight 33 963 1,807 2,803 34 1,728TOTALS 244 12,722 34,366 47,332 264 20,846
Collisions By Route Category - 2015Fatal
CollisionInjury
CollisionPDO*
CollisionTotal
CollisionsPersonsKilled**
PersonsInjured**
Interstate 27 1,038 4,024 5,089 36 1,715US Primary 71 3,896 9,561 13,528 77 6,638SC Primary 63 3,102 7,577 10,742 65 5,156Secondary 80 3,863 9,945 13,888 83 6,124County 3 823 3,259 4,085 3 1,213TOTALS 244 12,722 34,366 47,332 264 20,846
*Property Damage Only **Includes all fatalities and injuries of all vehicles in the collisions

62South Carolina Department of Public Safety
South Carolina Traffic Collision Fact Book 2015
PART II - COLLISION CHARACTERISTICS - SECTION E
DRIVERS IN TRAFFIC COLLISIONS INVOLVING SUV'S
SUV Driver AgeFatal
CollisionInjury
CollisionPDO*
CollisionTotal
Drivers PercentUnder 15 0 3 9 12 0.0%15-19 25 1,463 4,093 5,581 10.3%20-24 28 1,700 4,369 6,097 11.3%25-34 54 3,198 8,257 11,509 21.3%35-44 52 2,557 7,093 9,702 17.9%45-54 48 2,180 5,665 7,893 14.6%55-64 35 1,594 4,482 6,111 11.3%65-74 17 1,068 2,807 3,892 7.2%75+ 5 396 1,000 1,401 2.6%Unknown 9 414 1,499 1,922 3.6%TOTALS 273 14,573 39,274 54,120 100%
SUV Driver GenderFatal
CollisionInjury
CollisionPDO*
CollisionTotal
Drivers PercentFemale 107 8,085 21,353 29,545 54.6%Male 157 6,138 16,616 22,911 42.3%Unknown 9 350 1,305 1,664 3.1%TOTALS 273 14,573 39,274 54,120 100%
SUV Driver Contributed to Collision?Fatal
CollisionInjury
CollisionPDO*
CollisionTotal
Drivers PercentNo 124 7,239 20,462 27,825 51.4%Unknown 1 31 45 77 0.1%Yes 148 7,303 18,767 26,218 48.4%TOTALS 273 14,573 39,274 54,120 100%
Other Unit Type Contributed to Collision?Fatal
CollisionInjury
CollisionPDO*
Collision Total Units PercentNo 104 6,599 14,778 21,481 51.6%Unknown 2 49 52 103 0.2%Yes 101 5,211 14,767 20,079 48.2%TOTALS 207 11,859 29,597 41,663 100%
*Property Damage Only

63South Carolina Department of Public Safety
South Carolina Traffic Collision Fact Book 2015
PART II - COLLISION CHARACTERISTICS - SECTION E
Traffic Collisions Involving a Truck Tractor
Collisions By YearFatal
CollisionInjury
CollisionPDO*
CollisionTotal
CollisionsPersonsKilled**
PersonsInjured**
2011 62 685 2,103 2,850 73 9772012 65 761 2,251 3,077 69 1,1382013 46 811 2,530 3,387 49 1,1292014 41 850 2,909 3,800 47 1,2002015 71 1,034 3,314 4,419 88 1,491TOTALS 285 4,141 13,107 17,533 326 5,935
Collisions By Month - 2015Fatal
CollisionInjury
CollisionPDO*
CollisionTotal
CollisionsPersonsKilled**
PersonsInjured**
January 6 88 234 328 6 110February 2 76 233 311 5 110March 8 82 247 337 17 112April 13 84 282 379 13 125May 3 83 282 368 4 131June 5 85 263 353 5 129July 5 91 288 384 6 138August 6 86 292 384 6 128September 9 68 287 364 9 102October 4 110 333 447 5 144November 6 81 284 371 7 121December 4 100 289 393 5 141TOTALS 71 1,034 3,314 4,419 88 1,491
Collisions By Light & Weather - 2015Fatal
CollisionInjury
CollisionPDO*
CollisionTotal
CollisionsPersonsKilled**
PersonsInjured**
Day & Clear/Cloudy 30 667 2,259 2,956 36 949Day & Rain 7 63 278 348 8 99Day & Other Weather 1 3 12 16 1 6Dark & Clear/Cloudy 24 234 595 853 27 341Dark & Rain 5 62 144 211 7 86Dark & Other Weather 4 5 26 35 9 10TOTALS 71 1,034 3,314 4,419 88 1,491
Collisions By Day of Week - 2015Fatal
CollisionInjury
CollisionPDO*
CollisionTotal
CollisionsPersonsKilled**
PersonsInjured**
Sunday 7 39 134 180 7 64Monday 12 191 574 777 13 258Tuesday 12 205 652 869 14 280Wednesday 17 190 610 817 21 285Thursday 8 188 601 797 13 263Friday 10 157 564 731 11 229Saturday 5 64 179 248 9 112TOTALS 71 1,034 3,314 4,419 88 1,491
Collisions By Time of Day - 2015Fatal
CollisionInjury
CollisionPDO*
CollisionTotal
CollisionsPersonsKilled**
PersonsInjured**
12:01am - 3:00am 3 40 122 165 3 643:01am - 6:00am 4 81 170 255 4 1096:01am - 9:00am 14 206 552 772 15 3059:01am - Noon 8 179 599 786 8 25112:01pm - 3:00pm 10 200 737 947 12 2823:01pm - 6:00pm 9 176 692 877 9 2666:01pm - 9:00pm 12 94 290 396 17 1169:01pm - Midnight 11 58 152 221 20 98TOTALS 71 1,034 3,314 4,419 88 1,491
Collisions By Route Category - 2015Fatal
CollisionInjury
CollisionPDO*
CollisionTotal
CollisionsPersonsKilled**
PersonsInjured**
Interstate 28 385 1,315 1,728 41 567US Primary 18 284 721 1,023 20 433SC Primary 20 219 558 797 22 295Secondary 5 131 553 689 5 177County 0 15 167 182 0 19TOTALS 71 1,034 3,314 4,419 88 1,491
*Property Damage Only **Includes all fatalities and injuries of all vehicles in the collisions

64South Carolina Department of Public Safety
South Carolina Traffic Collision Fact Book 2015
PART II - COLLISION CHARACTERISTICS - SECTION E
TRUCK TRACTOR COLLISIONS AND CONTRIBUTING DRIVERS/UNITS
Vehicle Attachment TypeFatal
CollisionInjury
CollisionPDO*
Collision Total Drivers PercentNone 5 99 587 691 14.8%Mobile Home 0 0 9 9 0.2%Semi-Trailer 57 794 2,400 3,251 69.7%Utility Trailer 0 6 35 41 0.9%Farm Trailer 0 2 3 5 0.1%Trailer With Boat 0 1 0 1 0.0%Camper Trailer 0 0 2 2 0.0%Towed Motor Vehicle 0 1 12 13 0.3%Petroleum Tanker 0 29 55 84 1.8%Lowboy Trailer 0 9 55 64 1.4%Auto Carrier Trailer 0 12 31 43 0.9%Other Tanker 2 26 54 82 1.8%Flat Bed 4 51 158 213 4.6%Twin Trailers 2 6 29 37 0.8%Other 4 38 88 130 2.8%Unknown 0 0 0 0 0.0%TOTALS 74 1,074 3,518 4,666 100%
Truck Tractor Driver Contributed to Collision?Fatal
CollisionInjury
CollisionPDO*
Collision Total Drivers PercentNo 54 547 1,652 2,253 48.3%Unknown 0 1 4 5 0.1%Yes 20 526 1,862 2,408 51.6%TOTALS 74 1,074 3,518 4,666 100%
Other Unit Types By Contributed to CollisionFatal
CollisionInjury
CollisionPDO*
Collision Total UnitsAutomobile No 15 340 978 1,333Automobile Yes 25 290 629 944Automobile Total 40 630 1,607 2,277Pickup Truck No 7 89 274 370Pickup Truck Yes 13 74 227 314Pickup Truck Total 20 163 501 684Other Truck No 3 23 31 57Other Truck Yes 2 16 34 52Other Truck Total 5 39 65 109Full Size Van No 3 15 35 53Full Size Van Yes 0 9 23 32Full Size Van Total 3 24 58 85Mini Van No 2 22 63 87Mini Van Yes 1 14 40 55Mini Van Total 3 36 103 142SUV No 5 112 319 436SUV Yes 3 68 210 281SUV Total 8 180 529 717Motorcycle No 0 3 8 11Motorcycle Yes 2 2 2 6Motorcycle Total 2 5 10 17Pedalcycle No 0 1 0 1Pedalcycle Yes 0 1 0 1Pedalcycle Total 0 2 0 2Pedestrian No 1 5 1 7Pedestrian Yes 2 3 1 6Pedestrian Total 3 8 2 13Other No 0 14 22 36Other Yes 3 7 16 26Other Total 3 21 38 62Unknown (Hit & Run Only) No 0 1 4 5Unknown (Hit & Run Only) Yes 0 5 32 37Unknown (Hit & Run Only) Total 0 6 36 42TOTALS 87 1,114 2,949 4,150*Property Damage Only **Includes all fatalities and injuries of all vehicles in the collisions

65South Carolina Department of Public Safety
South Carolina Traffic Collision Fact Book 2015
PART II - COLLISION CHARACTERISTICS - SECTION E
Traffic Collisions Involving a Full-size Or Mini-Van
Collisions By YearFatal
CollisionInjury
CollisionPDO*
CollisionTotal
CollisionsPersonsKilled**
PersonsInjured**
2011 54 2,754 6,965 9,773 55 4,8372012 49 2,939 6,988 9,976 53 5,1692013 46 2,931 7,440 10,417 49 5,1052014 41 3,084 7,844 10,969 41 5,2322015 60 3,388 8,304 11,752 72 5,820TOTALS 250 15,096 37,541 52,887 270 26,163
Collisions By Month - 2015Fatal
CollisionInjury
CollisionPDO*
CollisionTotal
CollisionsPersonsKilled**
PersonsInjured**
January 4 238 613 855 5 411February 5 220 562 787 7 366March 7 254 737 998 7 460April 2 274 639 915 2 448May 4 277 672 953 4 466June 1 279 668 948 1 506July 6 293 671 970 8 514August 5 284 728 1,017 7 522September 6 293 659 958 6 472October 7 349 793 1,149 7 612November 10 311 762 1,083 15 513December 3 316 800 1,119 3 530TOTALS 60 3,388 8,304 11,752 72 5,820
Collisions By Light & Weather - 2015Fatal
CollisionInjury
CollisionPDO*
CollisionTotal
CollisionsPersonsKilled**
PersonsInjured**
Day & Clear/Cloudy 34 2,265 5,889 8,188 44 3,834Day & Rain 3 316 844 1,163 3 541Day & Other Weather 1 15 27 43 1 22Dark & Clear/Cloudy 17 614 1,215 1,846 19 1,097Dark & Rain 3 165 301 469 3 304Dark & Other Weather 2 13 28 43 2 22TOTALS 60 3,388 8,304 11,752 72 5,820
Collisions By Day of Week - 2015Fatal
CollisionInjury
CollisionPDO*
CollisionTotal
CollisionsPersonsKilled**
PersonsInjured**
Sunday 5 310 619 934 6 580Monday 8 523 1,299 1,830 8 930Tuesday 10 523 1,371 1,904 14 884Wednesday 9 531 1,324 1,864 9 886Thursday 8 520 1,293 1,821 8 832Friday 8 571 1,470 2,049 11 991Saturday 12 410 928 1,350 16 717TOTALS 60 3,388 8,304 11,752 72 5,820
Collisions By Time of Day - 2015Fatal
CollisionInjury
CollisionPDO*
CollisionTotal
CollisionsPersonsKilled**
PersonsInjured**
12:01am - 3:00am 4 97 151 252 4 1633:01am - 6:00am 5 63 122 190 5 976:01am - 9:00am 12 448 1,156 1,616 15 7429:01am - Noon 5 502 1,279 1,786 6 82512:01pm - 3:00pm 11 731 1,915 2,657 13 1,2443:01pm - 6:00pm 9 886 2,376 3,271 13 1,4966:01pm - 9:00pm 10 463 972 1,445 11 8799:01pm - Midnight 4 198 333 535 5 374TOTALS 60 3,388 8,304 11,752 72 5,820
Collisions By Route Category - 2015Fatal
CollisionInjury
CollisionPDO*
CollisionTotal
CollisionsPersonsKilled**
PersonsInjured**
Interstate 14 265 1,046 1,325 20 444US Primary 13 1,092 2,355 3,460 17 2,039SC Primary 21 872 1,853 2,746 22 1,485Secondary 11 973 2,292 3,276 12 1,568County 1 186 758 945 1 284TOTALS 60 3,388 8,304 11,752 72 5,820
*Property Damage Only **Includes all fatalities and injuries of all vehicles in the collisions
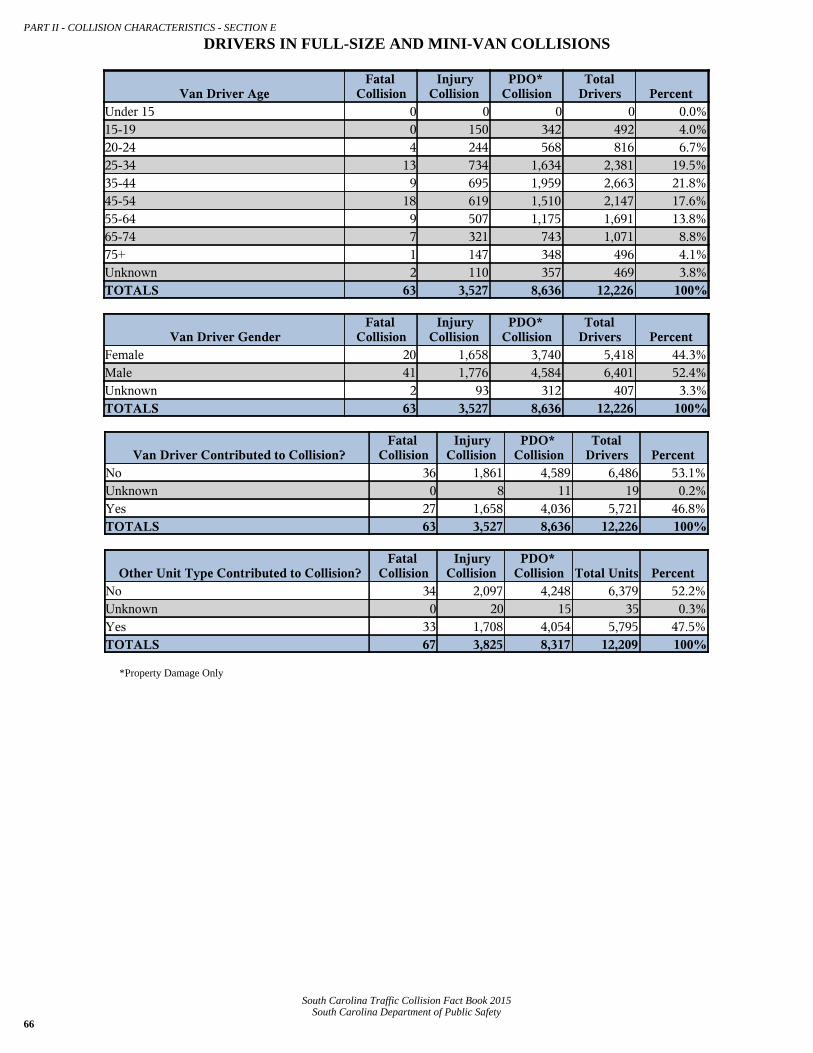
66South Carolina Department of Public Safety
South Carolina Traffic Collision Fact Book 2015
PART II - COLLISION CHARACTERISTICS - SECTION E
DRIVERS IN FULL-SIZE AND MINI-VAN COLLISIONS
Van Driver AgeFatal
CollisionInjury
CollisionPDO*
CollisionTotal
Drivers PercentUnder 15 0 0 0 0 0.0%15-19 0 150 342 492 4.0%20-24 4 244 568 816 6.7%25-34 13 734 1,634 2,381 19.5%35-44 9 695 1,959 2,663 21.8%45-54 18 619 1,510 2,147 17.6%55-64 9 507 1,175 1,691 13.8%65-74 7 321 743 1,071 8.8%75+ 1 147 348 496 4.1%Unknown 2 110 357 469 3.8%TOTALS 63 3,527 8,636 12,226 100%
Van Driver GenderFatal
CollisionInjury
CollisionPDO*
CollisionTotal
Drivers PercentFemale 20 1,658 3,740 5,418 44.3%Male 41 1,776 4,584 6,401 52.4%Unknown 2 93 312 407 3.3%TOTALS 63 3,527 8,636 12,226 100%
Van Driver Contributed to Collision?Fatal
CollisionInjury
CollisionPDO*
CollisionTotal
Drivers PercentNo 36 1,861 4,589 6,486 53.1%Unknown 0 8 11 19 0.2%Yes 27 1,658 4,036 5,721 46.8%TOTALS 63 3,527 8,636 12,226 100%
Other Unit Type Contributed to Collision?Fatal
CollisionInjury
CollisionPDO*
Collision Total Units PercentNo 34 2,097 4,248 6,379 52.2%Unknown 0 20 15 35 0.3%Yes 33 1,708 4,054 5,795 47.5%TOTALS 67 3,825 8,317 12,209 100%
*Property Damage Only

67South Carolina Department of Public Safety
South Carolina Traffic Collision Fact Book 2015
PART II - COLLISION CHARACTERISTICS - SECTION E
Traffic Collisions Involving a Pickup Truck
Collisions By YearFatal
CollisionInjury
CollisionPDO*
CollisionTotal
CollisionsPersonsKilled**
PersonsInjured**
2011 181 7,547 19,817 27,545 196 11,8532012 188 8,067 20,480 28,735 201 12,4872013 174 8,250 21,506 29,930 185 12,7382014 195 8,491 22,661 31,347 212 13,4972015 227 9,663 25,383 35,273 250 15,106TOTALS 965 42,018 109,847 152,830 1,044 65,681
Collisions By Month - 2015Fatal
CollisionInjury
CollisionPDO*
CollisionTotal
CollisionsPersonsKilled**
PersonsInjured**
January 11 701 1,792 2,504 11 1,110February 15 692 1,763 2,470 20 1,126March 21 704 2,000 2,725 25 1,112April 21 758 2,062 2,841 23 1,172May 12 825 2,040 2,877 12 1,291June 22 800 2,014 2,836 26 1,239July 16 841 1,959 2,816 18 1,332August 22 832 2,192 3,046 24 1,306September 19 847 2,242 3,108 19 1,289October 25 910 2,545 3,480 26 1,434November 17 887 2,366 3,270 20 1,407December 26 866 2,408 3,300 26 1,288TOTALS 227 9,663 25,383 35,273 250 15,106
Collisions By Light & Weather - 2015Fatal
CollisionInjury
CollisionPDO*
CollisionTotal
CollisionsPersonsKilled**
PersonsInjured**
Day & Clear/Cloudy 97 5,974 16,571 22,642 113 9,331Day & Rain 13 923 2,638 3,574 13 1,412Day & Other Weather 2 34 99 135 2 52Dark & Clear/Cloudy 97 2,179 4,709 6,985 103 3,451Dark & Rain 12 493 1,232 1,737 13 770Dark & Other Weather 6 60 134 200 6 90TOTALS 227 9,663 25,383 35,273 250 15,106
Collisions By Day of Week - 2015Fatal
CollisionInjury
CollisionPDO*
CollisionTotal
CollisionsPersonsKilled**
PersonsInjured**
Sunday 34 882 1,993 2,909 36 1,420Monday 30 1,475 3,979 5,484 32 2,264Tuesday 32 1,435 3,861 5,328 33 2,223Wednesday 34 1,468 3,910 5,412 40 2,266Thursday 35 1,547 3,967 5,549 38 2,364Friday 34 1,633 4,600 6,267 37 2,571Saturday 28 1,223 3,073 4,324 34 1,998TOTALS 227 9,663 25,383 35,273 250 15,106
Collisions By Time of Day - 2015Fatal
CollisionInjury
CollisionPDO*
CollisionTotal
CollisionsPersonsKilled**
PersonsInjured**
12:01am - 3:00am 18 352 714 1,084 19 5223:01am - 6:00am 17 287 686 990 17 3976:01am - 9:00am 26 1,266 3,740 5,032 30 1,8169:01am - Noon 26 1,275 3,449 4,750 28 1,91012:01pm - 3:00pm 24 1,861 5,060 6,945 24 2,9493:01pm - 6:00pm 44 2,498 6,928 9,470 50 4,0076:01pm - 9:00pm 42 1,437 3,500 4,979 49 2,3659:01pm - Midnight 30 687 1,306 2,023 33 1,140TOTALS 227 9,663 25,383 35,273 250 15,106
Collisions By Route Category - 2015Fatal
CollisionInjury
CollisionPDO*
CollisionTotal
CollisionsPersonsKilled**
PersonsInjured**
Interstate 21 745 2,770 3,536 32 1,124US Primary 70 2,908 6,907 9,885 78 4,787SC Primary 63 2,488 5,995 8,546 66 3,943Secondary 67 2,918 7,452 10,437 68 4,382County 6 604 2,259 2,869 6 870TOTALS 227 9,663 25,383 35,273 250 15,106
*Property Damage Only **Includes all fatalities and injuries of all vehicles in the collisions

68South Carolina Department of Public Safety
South Carolina Traffic Collision Fact Book 2015
PART II - COLLISION CHARACTERISTICS - SECTION E
PICKUP TRUCK DRIVERS, CONTRIBUTING DRIVERS, AND VICTIMS
Pickup Truck Driver AgeFatal
CollisionInjury
CollisionPDO*
Collision Total Drivers PercentUnder 15 0 4 3 7 0.0%15-19 15 910 2,504 3,429 8.9%20-24 20 1,069 2,700 3,789 9.8%25-34 42 1,785 4,836 6,663 17.3%35-44 40 1,618 4,420 6,078 15.7%45-54 45 1,851 4,666 6,562 17.0%55-64 34 1,507 3,902 5,443 14.1%65-74 26 929 2,176 3,131 8.1%75+ 16 386 865 1,267 3.3%Unknown 9 505 1,730 2,244 5.8%TOTALS 247 10,564 27,802 38,613 100%
Pickup Truck Driver GenderFatal
CollisionInjury
CollisionPDO*
Collision Total Drivers PercentFemale 16 1,486 3,263 4,765 12.3%Male 222 8,629 23,018 31,869 82.5%Unknown 9 449 1,521 1,979 5.1%TOTALS 247 10,564 27,802 38,613 100%
Pickup Truck Driver Contributed to Collision?Fatal
CollisionInjury
CollisionPDO*
Collision Total Drivers PercentNo 112 4,831 13,116 18,059 46.8%Unknown 0 25 21 46 0.1%Yes 135 5,708 14,665 20,508 53.1%TOTALS 247 10,564 27,802 38,613 100%
Other Unit Type Contributed to Collision?Fatal
CollisionInjury
CollisionPDO*
Collision Total Units PercentNo 119 5,550 12,423 18,092 56.0%Unknown 0 49 55 104 0.3%Yes 95 3,849 10,145 14,089 43.6%TOTALS 214 9,448 22,623 32,285 100%
Injury Severity ofPickup Truck Bed
Occupants No Injury Possible Injury
Non-Incapacitating
InjuryIncapacitating
Injury Fatal InjuryTotal
OccupantsFemale Under 15 1 2 1 0 0 4Female 15-19 4 2 1 0 0 7Female 20-24 1 0 0 0 0 1Female 25-34 0 1 0 0 0 1Female 35-44 0 0 0 0 0 0Female 45-54 0 0 0 0 0 0Female 55-64 0 0 0 0 0 0Female 65-74 0 0 0 0 0 0Female 75+ 0 0 0 0 0 0Female Unknown 0 0 0 0 0 0
Total 6 5 2 0 0 13Male Under 15 4 3 0 0 0 7Male 15-19 17 1 1 0 0 19Male 20-24 7 1 0 0 0 8Male 25-34 3 2 0 0 0 5Male 35-44 0 1 1 2 0 4Male 45-54 0 0 1 0 0 1Male 55-64 0 1 0 0 0 1Male 65-74 0 0 0 0 1 1Male 75+ 0 0 0 0 0 0Male Unknown 0 0 0 0 0 0
Total 31 9 3 2 1 46TOTALS 37 14 5 2 1 59
*Property Damage Only
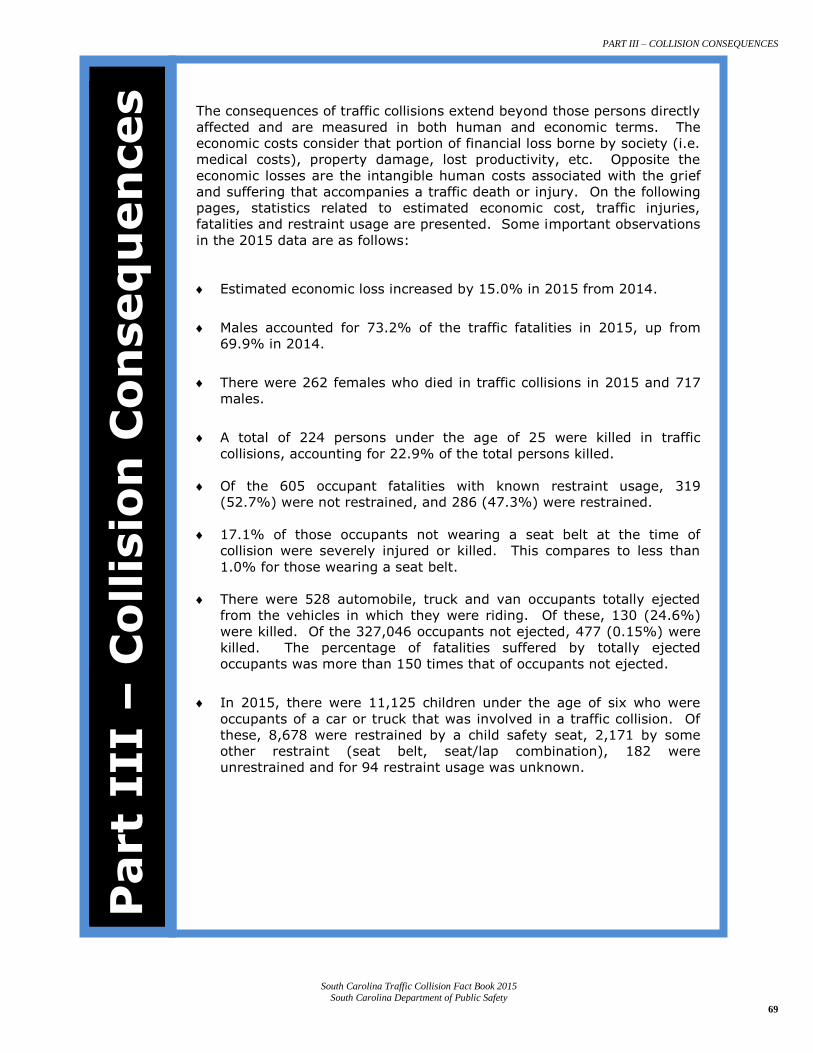
PART III – COLLISION CONSEQUENCES
South Carolina Traffic Collision Fact Book 2015
South Carolina Department of Public Safety
69
……………….
The consequences of traffic collisions extend beyond those persons directly
affected and are measured in both human and economic terms. The
economic costs consider that portion of financial loss borne by society (i.e.
medical costs), property damage, lost productivity, etc. Opposite the
economic losses are the intangible human costs associated with the grief
and suffering that accompanies a traffic death or injury. On the following
pages, statistics related to estimated economic cost, traffic injuries,
fatalities and restraint usage are presented. Some important observations
in the 2015 data are as follows:
Estimated economic loss increased by 15.0% in 2015 from 2014.
Males accounted for 73.2% of the traffic fatalities in 2015, up from
69.9% in 2014. There were 262 females who died in traffic collisions in 2015 and 717
males.
A total of 224 persons under the age of 25 were killed in traffic
collisions, accounting for 22.9% of the total persons killed.
Of the 605 occupant fatalities with known restraint usage, 319
(52.7%) were not restrained, and 286 (47.3%) were restrained.
17.1% of those occupants not wearing a seat belt at the time of
collision were severely injured or killed. This compares to less than
1.0% for those wearing a seat belt.
There were 528 automobile, truck and van occupants totally ejected
from the vehicles in which they were riding. Of these, 130 (24.6%)
were killed. Of the 327,046 occupants not ejected, 477 (0.15%) were
killed. The percentage of fatalities suffered by totally ejected
occupants was more than 150 times that of occupants not ejected.
In 2015, there were 11,125 children under the age of six who were
occupants of a car or truck that was involved in a traffic collision. Of
these, 8,678 were restrained by a child safety seat, 2,171 by some
other restraint (seat belt, seat/lap combination), 182 were
unrestrained and for 94 restraint usage was unknown.
Part
III –
Co
llis
ion
Co
nseq
uen
ces

70South Carolina Department of Public Safety
South Carolina Traffic Collision Fact Book 2015
PART III - COLLISION CONSEQUENCES
TRAFFIC COLLISION VICTIM PROFILE INJURIES* BY GENDER AND AGE
Gender Age No Injury Possible Injury
Non-Incapacitating
InjuryIncapacitating
Injury Fatal Injury Total VictimsFemale Under 4 3,871 629 60 11 2 4,573Female 4-5 1,799 269 35 9 2 2,114Female 6-9 3,486 581 84 18 5 4,174Female 10-14 4,172 739 127 23 4 5,065Female 15-19 15,051 2,534 609 98 23 18,315Female 20-24 16,984 3,242 782 161 40 21,209Female 25-34 24,293 5,011 1,096 224 42 30,666Female 35-44 17,675 3,169 743 181 29 21,797Female 45-54 15,246 3,086 759 150 39 19,280Female 55-64 12,333 2,466 560 134 34 15,527Female 65-74 8,005 1,449 364 70 23 9,911Female 75+ 4,061 715 184 46 19 5,025Female Unknown 690 33 8 3 0 734
Subtotal 127,666 23,923 5,411 1,128 262 158,390Male Under 4 4,073 588 61 9 7 4,738Male 4-5 1,797 253 47 8 4 2,109Male 6-9 3,409 487 83 12 3 3,994Male 10-14 3,909 542 108 32 4 4,595Male 15-19 16,353 1,935 619 164 43 19,114Male 20-24 19,285 2,701 954 265 87 23,292Male 25-34 27,615 4,033 1,394 444 143 33,629Male 35-44 20,010 2,652 918 300 112 23,992Male 45-54 18,330 2,440 901 308 105 22,084Male 55-64 14,794 2,006 704 245 117 17,866Male 65-74 9,087 1,098 362 123 52 10,722Male 75+ 4,530 556 183 49 40 5,358Male Unknown 1,559 109 12 1 0 1,681
Subtotal 144,751 19,400 6,346 1,960 717 173,174Unknown Under 4 11 1 0 0 0 12Unknown 4-5 2 0 0 0 0 2Unknown 6-9 15 2 0 0 0 17Unknown 10-14 9 2 0 0 0 11Unknown 15-19 9 1 0 0 0 10Unknown 20-24 14 1 0 1 0 16Unknown 25-34 20 2 2 0 0 24Unknown 35-44 10 1 0 1 0 12Unknown 45-54 5 0 0 0 0 5Unknown 55-64 6 1 0 0 0 7Unknown 65-74 7 1 0 0 0 8Unknown 75+ 0 0 0 0 0 0Unknown Unknown 12,763 401 17 2 0 13,183
Subtotal 12,871 413 19 4 0 13,307TOTALS 285,288 43,736 11,776 3,092 979 344,871
*See Definitions section for a description of each injury type.

71South Carolina Department of Public Safety
South Carolina Traffic Collision Fact Book 2015
PART III - COLLISION CONSEQUENCES
Injury Severity By Occupant Restraint Usage*
Restraint Usage No InjuryPossibleInjury
Non-Incapacitating
InjuryIncapacitating
Injury Fatal InjuryTotal
VictimsNone Used 2,125 1,175 878 545 319 5,042Shoulder Belt Only 987 203 35 12 4 1,241Lap Belt Only 1,149 269 62 19 4 1,503Shoulder And Lap Belt 247,625 37,121 8,673 1,632 271 295,322Child Safety Seat 10,627 1,452 149 23 7 12,258Other 155 41 6 7 0 209Unknown 16,636 1,458 350 99 38 18,581TOTALS 279,304 41,719 10,153 2,337 643 334,156
Injury Severity by Air Bag Deployment*
Air Bag Deployment No InjuryPossibleInjury
Non-Incapacitating
InjuryIncapacitating
Injury Fatal InjuryTotal
VictimsDeployed Front 12,959 7,054 2,916 794 236 23,959Deployed Side 2,329 1,012 326 69 25 3,761Deployed Both 4,728 3,144 1,351 418 127 9,768Not Deployed 235,488 27,083 4,857 835 163 268,426Not Applicable 19,411 2,941 602 190 65 23,209Deployment Unknown 4,389 485 101 31 27 5,033TOTALS 279,304 41,719 10,153 2,337 643 334,156
*Includes occupants seated inside the passenger compartment of automobiles, trucks, and vans only.

72South Carolina Department of Public Safety
South Carolina Traffic Collision Fact Book 2015
PART III - COLLISION CONSEQUENCES
Injury Severity By Ejection Status*
Ejection Status No InjuryPossibleInjury
Non-Incapacitating
InjuryIncapacitating
Injury Fatal InjuryTotal
VictimsNot Ejected 273,142 41,350 9,966 2,111 477 327,046Partially Ejected 72 29 16 50 34 201Totally Ejected 61 55 121 161 130 528Not Applicable 4,380 104 26 8 1 4,519Unknown 1,649 181 24 7 1 1,862TOTALS 279,304 41,719 10,153 2,337 643 334,156
Injury Severity By Location After Impact*
Location after Impact No InjuryPossibleInjury
Non-Incapacitating
InjuryIncapacitating
Injury Fatal InjuryTotal
VictimsNot Trapped 272,093 40,489 9,231 1,611 293 323,717Extricated (Mech Means 221 409 431 476 285 1,822Freed (Non-Mech Means) 485 526 434 226 55 1,726Not Applicable 4,884 142 47 17 8 5,098Unknown 1,621 153 10 7 2 1,793TOTALS 279,304 41,719 10,153 2,337 643 334,156
Injury Severity By Restraint Usage and Ejection Status*
Restraint Usage andEjection Status No Injury
PossibleInjury
Non-Incapacitating
InjuryIncapacitating
Injury Fatal InjuryTotal
VictimsNot Ejected 1,937 1,118 758 364 171 4,348Partially Ejected 1 9 7 31 28 76Totally Ejected 14 38 104 145 119 420Not Applicable 143 5 4 2 1 155Unknown 30 5 5 3 0 43TOTAL - NORESTRAINT USED
2,125 1,175 878 545 319 5,042
Not Ejected 259,329 38,930 8,876 1,659 276 309,070Partially Ejected 66 18 8 15 5 112Totally Ejected 44 14 13 12 5 88Not Applicable 925 89 21 5 0 1,040Unknown 179 35 7 2 0 223TOTAL - RESTRAINTUSED
260,543 39,086 8,925 1,693 286 310,533
Not Ejected 11,876 1,302 332 88 30 13,628Partially Ejected 5 2 1 4 1 13Totally Ejected 3 3 4 4 6 20Not Applicable 3,312 10 1 1 0 3,324Unknown 1,440 141 12 2 1 1,596TOTAL - UNKNOWNRESTRAINT USAGE
16,636 1,458 350 99 38 18,581
TOTALS 279,304 41,719 10,153 2,337 643 334,156
*Includes occupants seated inside the passenger compartment of automobiles, trucks, and vans only.

73South Carolina Department of Public Safety
South Carolina Traffic Collision Fact Book 2015
PART III - COLLISION CONSEQUENCES
Injury Severity By Transported to Medical Facility and Gender*
Transported to MedicalFacility No Injury
PossibleInjury
Non-Incapacitating
InjuryIncapacitating
Injury Fatal InjuryTotal
VictimsFemale 1,436 17,144 4,460 930 172 24,142Male 1,401 12,926 4,315 1,272 332 20,246Unknown 8 16 4 2 0 30TOTAL -TRANSPORTED
2,845 30,086 8,779 2,204 504 44,418
Female 125,057 6,100 613 67 37 131,874Male 140,908 4,910 729 64 100 146,711Unknown 5,551 123 6 1 0 5,681TOTAL - NOTTRANSPORTED
271,516 11,133 1,348 132 137 284,266
Female 264 163 9 1 0 437Male 415 177 9 0 2 603Unknown 4,264 160 8 0 0 4,432TOTAL -TRANSPORTEDUNKNOWN
4,943 500 26 1 2 5,472
TOTALS 279,304 41,719 10,153 2,337 643 334,156
Injuries Sustained By Children Under Six Years of Age*
Restraint Usage No InjuryPossibleInjury
Non-Incapacitating
InjuryIncapacitating
Injury Fatal InjuryTotal
VictimsNone Used 101 58 17 4 2 182Child Safety Seat 7,548 992 114 19 5 8,678Other 1,816 306 38 7 4 2,171Unknown 77 13 3 0 1 94TOTALS 9,542 1,369 172 30 12 11,125
*Includes occupants seated inside the passenger compartment of automobiles, trucks, and vans only.
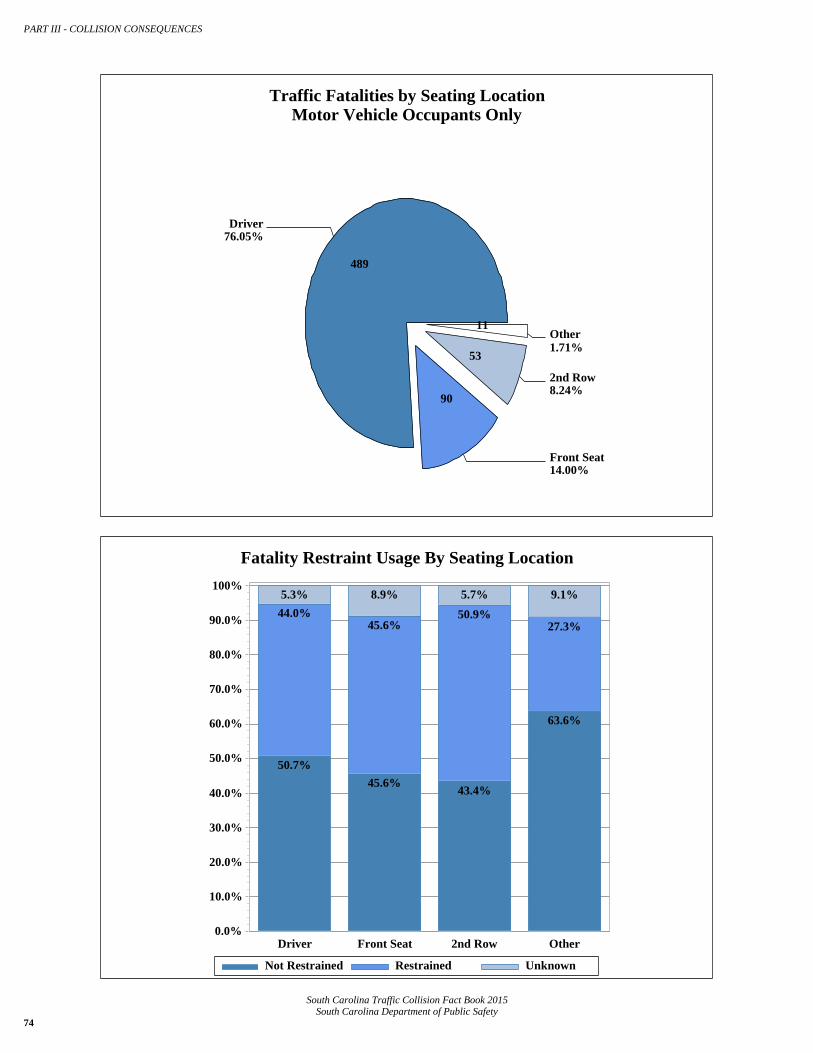
PART III - COLLISION CONSEQUENCES
74South Carolina Department of Public Safety
South Carolina Traffic Collision Fact Book 2015
Traffic Fatalities by Seating LocationMotor Vehicle Occupants Only
Driver
489
76.05%
Front Seat
90
14.00%
2nd Row
53
8.24%
Other11
1.71%
Fatality Restraint Usage By Seating Location
Not Restrained Restrained Unknown
43.4%
50.9%
5.7%
50.7%
44.0%
5.3%
45.6%
45.6%
8.9%
63.6%
27.3%
9.1%
0.0%
10.0%
20.0%
30.0%
40.0%
50.0%
60.0%
70.0%
80.0%
90.0%
100%
Driver Front Seat 2nd Row Other

PART IV – DRIVING UNDER THE INFLUENCE
South Carolina Traffic Collision Fact Book 2015
South Carolina Department of Public Safety
75
Alcohol and/or drug related traffic collisions are responsible for a large portion of reported traffic collisions each year. The percentage of collisions that involve alcohol or drugs increases as the severity of injuries increases. On the following pages collision statistics are presented which are based on contributing factors in the collision, as determined by the investigating officers. Statistics listed in this section ARE NOT comparable to any statistics published prior to this publication.
The data presented in this section come from two different sources for Fatal and Non-fatal collisions:
1) Fatal Collision Data: The National Highway Traffic Safety Administration (NHTSA) uses a method called ‘multiple imputation’ when fatal collisions are lacking blood alcohol concentration (BAC) values on drivers involved in fatal collisions. This method uses various aspects a fatal collision in order to provide estimates of alcohol involvement and BAC levels. NHTSA’s data does not include driving under the influence of drugs.
2) Non-fatal Collision Data: The data presented for non-fatal collisions comes from the information collected from the Uniform Traffic Collision Report Form (TR-310 – shown on pages 130 and 131) filled out by the investigating officer. The South Carolina DUI data includes being under the influence of alcohol and/or drugs.
In South Carolina, it is inferred that you are under the influence when your Blood Alcohol Concentration (BAC) reaches a level of 0.08 (as of July 2003). At this level, you are seven times more likely to have a traffic collision than if your BAC is zero. If your BAC reaches 0.15 percent, your chances of having a traffic collision are 25 times greater. Some of the common effects of alcohol at various BAC levels are as follows:
Blood Alcohol Concentration
Changes in Feelings and Personality
Physical and Mental Impairments
0.01 — 0.06
Relaxation Sense of Well-being Loss of Inhibition Lowered Alertness Joyous
Thought Judgment Coordination Concentration
0.06 — 0.10
Blunted Feelings
Disinhibition Extroversion Impaired Sexual Pleasure
Reflexes Impaired Reasoning
Depth Perception Distance Acuity Peripheral Vision Glare Recovery
0.11 — 0.20
Over-Expression Emotional Swings Angry or Sad Boisterous
Reaction Time Gross Motor Control Staggering Slurred Speech
0.21 — 0.29 Stupor Lose Understanding Impaired Sensations
Severe Motor Impairment Loss of Consciousness Memory Blackout
0.30 — 0.39 Severe Depression Unconsciousness
Death Possible
Bladder Function Breathing
Heart Rate
=> 0.40 Unconsciousness Death
Breathing Heart Rate
DEFINITIONS – FOR THE PURPOSE OF THIS PUBLICATION
DUI – Driving under the influence of alcohol and/or drugs.
DUI .08+ - Driving with a BAC of .08 or more.
ALCOHOL IMPAIRED DRIVING FATALITY– A Fatality that occurs in a motor vehicle
traffic crash that involves at least one driver or a motorcycle rider (operator) with a BAC of .08
or above.
Part
IV
– D
riv
ing
Un
der t
he I
nfl
uen
ce

76South Carolina Department of Public Safety
South Carolina Traffic Collision Fact Book 2015
PART IV - DRIVING UNDER THE INFLUENCE
ESTIMATED NUMBER OF FATALITIES INVOLVING AN ALCOHOLIMPAIRED DRIVER WITH BAC OF .08+*
(2015 Preliminary, Final data were unavailable at the time of publication)
County 2011 2012 2013 2014 2015Abbeville 1 3 3 2 2Aiken 12 8 14 9 9Allendale 0 1 2 1 0Anderson 13 13 13 19 8Bamberg 1 1 1 2 1Barnwell 6 1 0 1 4Beaufort 4 8 7 10 3Berkeley 15 14 13 14 10Calhoun 2 1 2 4 2Charleston 20 24 19 24 15Cherokee 4 2 3 6 5Chester 3 1 6 3 2Chesterfield 2 5 4 2 8Clarendon 3 3 5 3 6Colleton 8 8 3 7 7Darlington 8 7 10 3 10Dillon 4 4 2 6 2Dorchester 6 8 8 5 11Edgefield 6 2 0 2 1Fairfield 4 4 5 7 1Florence 6 8 9 11 9Georgetown 2 7 5 4 4Greenville 21 25 35 22 24Greenwood 6 5 2 4 6Hampton 2 4 2 2 2Horry 18 21 23 27 23Jasper 7 5 3 2 3Kershaw 5 7 12 5 5Lancaster 8 5 2 5 4Laurens 4 7 6 6 5Lee 1 1 3 1 6Lexington 27 28 21 16 22McCormick 0 2 0 4 0Marion 0 4 3 3 4Marlboro 6 1 1 4 2Newberry 1 6 3 2 1Oconee 4 8 1 4 3Orangeburg 10 7 18 10 8Pickens 6 5 5 8 6Richland 17 28 28 18 16Saluda 1 5 1 3 0Spartanburg 13 25 11 19 24Sumter 9 5 10 12 4Union 1 1 0 1 4Williamsburg 2 5 7 3 2York 12 11 11 8 7
*Source - NHTSA. NHTSA uses a multiple imputation method to estimate DUI fatalities. These figures are not comparable to
previous FactBook publications.
NOTE from NHTSA: 'State total may not equal sum of individual county totals due to rounding in the imputation process.' The totals
are NHTSA's imputed totals for the state.

77South Carolina Department of Public Safety
South Carolina Traffic Collision Fact Book 2015
PART IV - DRIVING UNDER THE INFLUENCE
ALCOHOL IMPAIRED (.08+) DRIVING FATALITIESSOUTH CAROLINA AND THE U.S.*
(2015 Preliminary, Final data were unavailable at the time of publication)
Alcohol-Impaired Driving Fatalities (BAC=.08+)
YearTotal Fatalitiesin all Crashes Number
Percent of TotalFatalities
Per 100 MillionVMT
2011 South Carolina 828 309 37% 0.632011 U.S. 32,479 9,865 30% 0.332012 South Carolina 863 348 40% 0.712012 U.S. 33,782 10,336 31% 0.352013 South Carolina 767 340 44% 0.692013 U.S. 32,894 10,076 31% 0.342014 South Carolina 823 331 40% 0.662014 U.S. 32,744 9,943 30% 0.332015 South Carolina 979 301 31% 0.582015 U.S. 35,092 10,265 29% 0.33

78South Carolina Department of Public Safety
South Carolina Traffic Collision Fact Book 2015
PART IV - DRIVING UNDER THE INFLUENCE
SOUTH CAROLINA BAC REPORTING RATES FOR ALL DRIVERS INVOLVED IN FATALCOLLISIONS*
(2015 Preliminary, Final data were unavailable at the time of publication)
Surviving Drivers Killed Drivers Total Drivers
Year
TotalSurvivingDrivers
KnownBAC
ResultsPercentKnown
TotalKilled
Drivers
KnownBAC
ResultsPercentKnown
Total AllDrivers
KnownBAC
ResultsPercentKnown
2012 SC 563 44 7.8% 589 494 83.9% 1,152 538 46.7%2012 US 24,174 7,569 31.3% 21,490 16,097 74.9% 45,664 23,666 51.8%2013 SC 492 30 6.1% 535 429 80.2% 1,027 459 44.7%2013 US 23,860 6,975 29.2% 20,943 15,661 74.8% 44,803 22,636 50.5%2014 SC 560 56 10.0% 531 433 81.5% 1,091 489 44.8%2014 US 23,883 6,781 28.4% 20,788 15,352 73.9% 44,671 22,133 49.5%2015 SC 732 45 6.1% 667 494 74.1% 1,399 539 38.5%2015 US 26,463 7,214 27.3% 22,150 15,421 69.6% 48,613 22,635 46.6%
*Source - NHTSA.
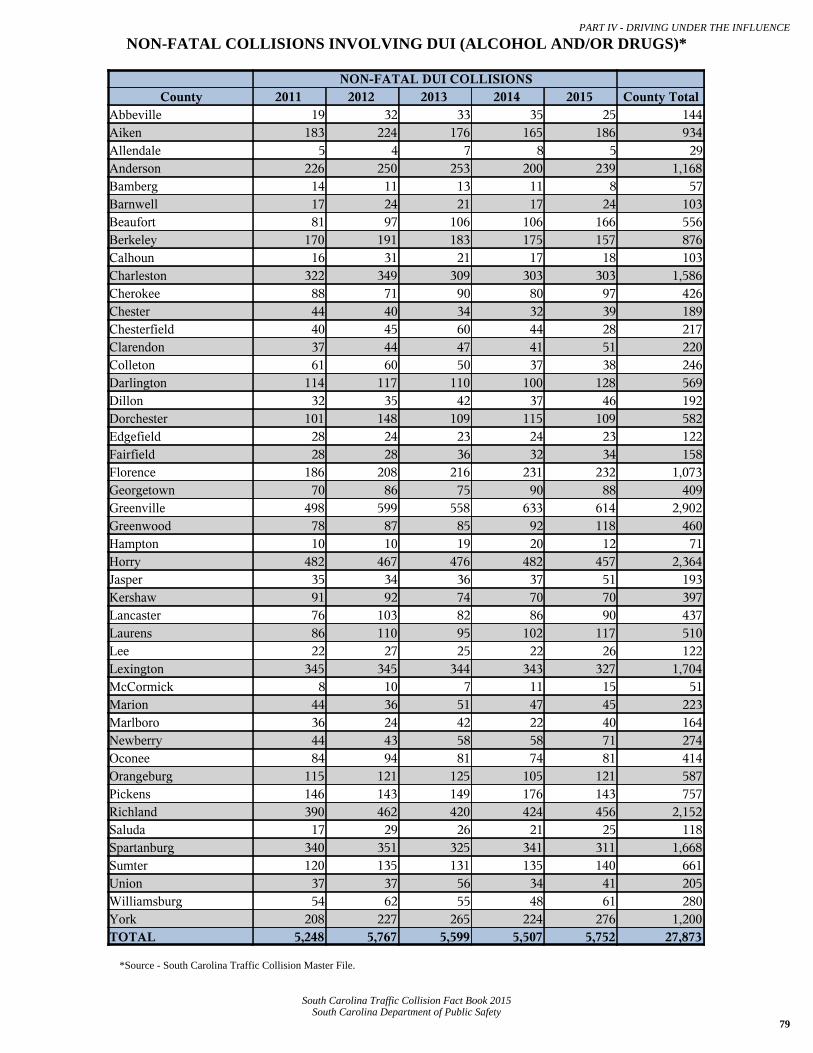
79South Carolina Department of Public Safety
South Carolina Traffic Collision Fact Book 2015
PART IV - DRIVING UNDER THE INFLUENCE
NON-FATAL COLLISIONS INVOLVING DUI (ALCOHOL AND/OR DRUGS)*
NON-FATAL DUI COLLISIONSCounty 2011 2012 2013 2014 2015 County Total
Abbeville 19 32 33 35 25 144Aiken 183 224 176 165 186 934Allendale 5 4 7 8 5 29Anderson 226 250 253 200 239 1,168Bamberg 14 11 13 11 8 57Barnwell 17 24 21 17 24 103Beaufort 81 97 106 106 166 556Berkeley 170 191 183 175 157 876Calhoun 16 31 21 17 18 103Charleston 322 349 309 303 303 1,586Cherokee 88 71 90 80 97 426Chester 44 40 34 32 39 189Chesterfield 40 45 60 44 28 217Clarendon 37 44 47 41 51 220Colleton 61 60 50 37 38 246Darlington 114 117 110 100 128 569Dillon 32 35 42 37 46 192Dorchester 101 148 109 115 109 582Edgefield 28 24 23 24 23 122Fairfield 28 28 36 32 34 158Florence 186 208 216 231 232 1,073Georgetown 70 86 75 90 88 409Greenville 498 599 558 633 614 2,902Greenwood 78 87 85 92 118 460Hampton 10 10 19 20 12 71Horry 482 467 476 482 457 2,364Jasper 35 34 36 37 51 193Kershaw 91 92 74 70 70 397Lancaster 76 103 82 86 90 437Laurens 86 110 95 102 117 510Lee 22 27 25 22 26 122Lexington 345 345 344 343 327 1,704McCormick 8 10 7 11 15 51Marion 44 36 51 47 45 223Marlboro 36 24 42 22 40 164Newberry 44 43 58 58 71 274Oconee 84 94 81 74 81 414Orangeburg 115 121 125 105 121 587Pickens 146 143 149 176 143 757Richland 390 462 420 424 456 2,152Saluda 17 29 26 21 25 118Spartanburg 340 351 325 341 311 1,668Sumter 120 135 131 135 140 661Union 37 37 56 34 41 205Williamsburg 54 62 55 48 61 280York 208 227 265 224 276 1,200TOTAL 5,248 5,767 5,599 5,507 5,752 27,873
*Source - South Carolina Traffic Collision Master File.

PART IV - DRIVING UNDER THE INFLUENCE
80South Carolina Department of Public Safety
South Carolina Traffic Collision Fact Book 2015
*Source - South Carolina Traffic Collision Master File
ROUTE CATEGORY IN NON-FATAL DUI COLLISIONS*
Interstate
400
6.95%
US Primary
1,188
20.65%
SC Primary
1,164
20.24%
Secondary
2,250
39.12%
County
750
13.04%
DAY OF WEEK IN NON-FATAL DUI COLLISIONS*
Sunday
1,107
19.25%
Monday5739.96%
Tuesday
531
9.23%
Wednesday
576
10.01%Thursday
686
11.93%
Friday
865
15.04%
Saturday
1,414
24.58%
MONTH IN NON-FATAL DUI COLLISIONS*
January
468
8.14%
February
443
7.70%
March523 9.09%
April
462
8.03%
May
456
7.93%
June
427
7.42%July
406
7.06%
August
517
8.99%
September
483
8.40%
October5148.94%
November
487
8.47%
December
566
9.84%
TIME OF DAY IN NON-FATAL DUI COLLISIONS*
12:01am - 3:00am
1,194
20.76%
3:01am - 6:00am665
11.56%
6:01am - 9:00am
292
5.08%
9:01am - Noon
229
3.98%
12:01pm - 3:00pm
366
6.36%3:01pm - 6:00pm
701
12.19%
6:01pm - 9:00pm
1,112
19.33%
9:01pm - Midnight
1,193
20.74%

PART V - COUNTIES
South Carolina Traffic Collision Fact Book 2015
South Carolina Department of Public Safety
81
South Carolina is comprised of 46 counties, each with its own unique set
of demographic, geographic, and political characteristics. These and other
factors influence events within a county's borders. Using this information,
planners can tailor specific countermeasures to the unique situation of a
given county. Crime, economic activity, accidents, and the subject of this
book (traffic collisions) are all affected by these characteristics. On the
following pages, a summary of each county’s traffic collision characteristics
is provided. Among other facts, this data shows the following for 2015:
Greenville County had the most traffic collisions with 15,876.
Charleston County was a close second with 15,216. Richland County
was third with 12,842, which was over 2,000 fewer collisions than the
two highest counties.
Horry County had the most fatal collisions with 76 reported during the
year, followed by Greenville with 70 and Charleston with 63. Horry
and Spartanburg counties had the most fatalities, Horry with 81 and
Spartanburg with 75. Greenville followed these two with 73.
Charleston County had the most injury collisions and persons injured,
with 4,019 and 5,909, respectively, in 2015. Greenville County was
next with 3,787 injury crashes and 5,406 injuries. Richland County was
third for injury collisions and injuries with 3,304 injury collisions and
5,169 injuries.
The high number of collisions in Greenville, Charleston, and Richland
Counties is largely a result of large populations and larger amounts of
travel within these counties.
The counties with the highest number of fatalities per 100 million
vehicle miles of travel (VMT) were Allendale, Chesterfield, and
Darlington with 3.728, 3.412, and 3.215 VMT fatality rates. For South
Carolina, the overall VMT fatality rate was 1.893.
Part
V –
Co
un
ties
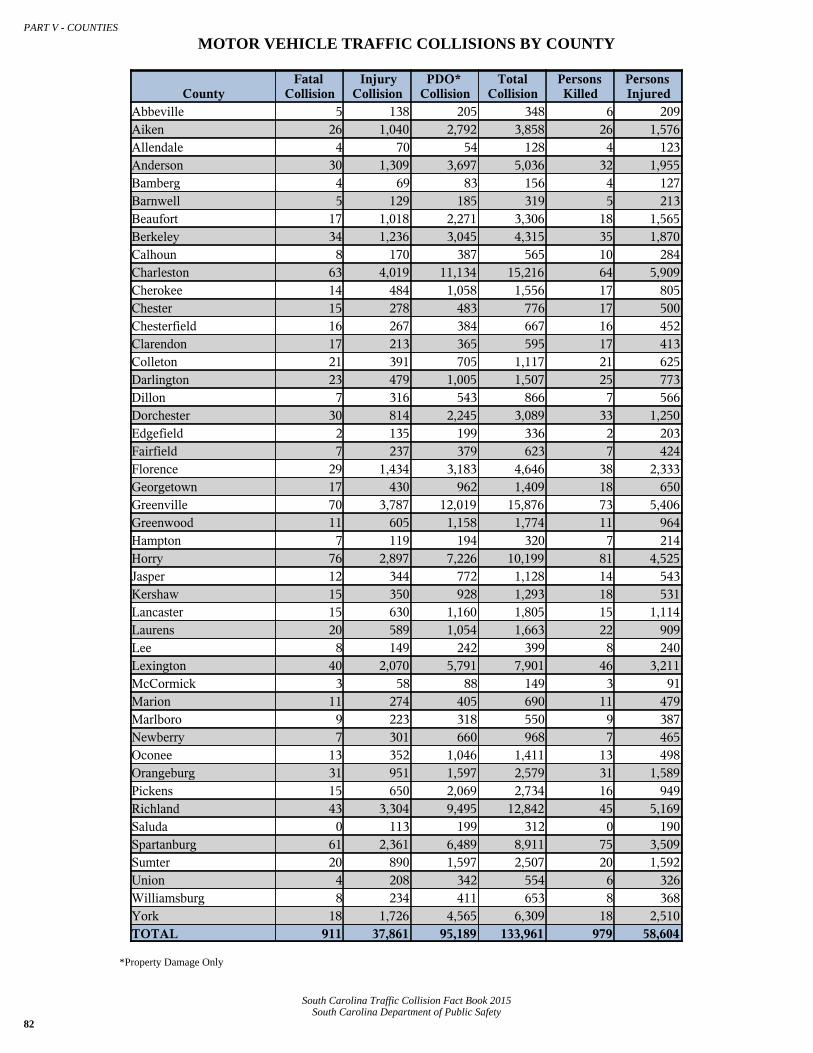
82South Carolina Department of Public Safety
South Carolina Traffic Collision Fact Book 2015
PART V - COUNTIES
MOTOR VEHICLE TRAFFIC COLLISIONS BY COUNTY
CountyFatal
CollisionInjury
CollisionPDO*
CollisionTotal
CollisionPersonsKilled
PersonsInjured
Abbeville 5 138 205 348 6 209Aiken 26 1,040 2,792 3,858 26 1,576Allendale 4 70 54 128 4 123Anderson 30 1,309 3,697 5,036 32 1,955Bamberg 4 69 83 156 4 127Barnwell 5 129 185 319 5 213Beaufort 17 1,018 2,271 3,306 18 1,565Berkeley 34 1,236 3,045 4,315 35 1,870Calhoun 8 170 387 565 10 284Charleston 63 4,019 11,134 15,216 64 5,909Cherokee 14 484 1,058 1,556 17 805Chester 15 278 483 776 17 500Chesterfield 16 267 384 667 16 452Clarendon 17 213 365 595 17 413Colleton 21 391 705 1,117 21 625Darlington 23 479 1,005 1,507 25 773Dillon 7 316 543 866 7 566Dorchester 30 814 2,245 3,089 33 1,250Edgefield 2 135 199 336 2 203Fairfield 7 237 379 623 7 424Florence 29 1,434 3,183 4,646 38 2,333Georgetown 17 430 962 1,409 18 650Greenville 70 3,787 12,019 15,876 73 5,406Greenwood 11 605 1,158 1,774 11 964Hampton 7 119 194 320 7 214Horry 76 2,897 7,226 10,199 81 4,525Jasper 12 344 772 1,128 14 543Kershaw 15 350 928 1,293 18 531Lancaster 15 630 1,160 1,805 15 1,114Laurens 20 589 1,054 1,663 22 909Lee 8 149 242 399 8 240Lexington 40 2,070 5,791 7,901 46 3,211McCormick 3 58 88 149 3 91Marion 11 274 405 690 11 479Marlboro 9 223 318 550 9 387Newberry 7 301 660 968 7 465Oconee 13 352 1,046 1,411 13 498Orangeburg 31 951 1,597 2,579 31 1,589Pickens 15 650 2,069 2,734 16 949Richland 43 3,304 9,495 12,842 45 5,169Saluda 0 113 199 312 0 190Spartanburg 61 2,361 6,489 8,911 75 3,509Sumter 20 890 1,597 2,507 20 1,592Union 4 208 342 554 6 326Williamsburg 8 234 411 653 8 368York 18 1,726 4,565 6,309 18 2,510TOTAL 911 37,861 95,189 133,961 979 58,604
*Property Damage Only

83South Carolina Department of Public Safety
South Carolina Traffic Collision Fact Book 2015
PART V - COUNTIES
VEHICLE MILES OF TRAVEL (VMT)AND VMT DEATH RATE BY COUNTY
County Fatalities VMT Death Rate Annual VMT* Daily VMT*Abbeville 6 2.830 211,994,588.6 580,807.1Aiken 26 1.444 1,800,431,467.0 4,932,689.0Allendale 4 3.728 107,301,042.9 293,975.5Anderson 32 1.491 2,145,732,786.0 5,878,720.0Bamberg 4 2.425 164,921,404.4 451,839.5Barnwell 5 2.303 217,063,099.0 594,693.4Beaufort 18 1.352 1,331,437,887.0 3,647,775.0Berkeley 35 2.161 1,619,420,618.0 4,436,768.8Calhoun 10 1.840 543,384,457.1 1,488,724.5Charleston 64 1.712 3,739,076,041.0 10,244,043.9Cherokee 17 2.071 821,024,246.8 2,249,381.5Chester 17 2.714 626,330,543.6 1,715,974.1Chesterfield 16 3.412 468,991,383.1 1,284,907.9Clarendon 17 2.617 649,667,842.8 1,779,911.9Colleton 21 2.360 889,649,467.7 2,437,395.8Darlington 25 3.215 777,594,080.5 2,130,394.7Dillon 7 1.229 569,354,744.4 1,559,876.0Dorchester 33 2.759 1,196,233,431.0 3,277,351.9Edgefield 2 0.860 232,423,351.7 636,776.3Fairfield 7 1.297 539,705,248.0 1,478,644.5Florence 38 2.355 1,613,653,607.0 4,420,968.8Georgetown 18 2.329 772,869,443.5 2,117,450.5Greenville 73 1.761 4,145,086,215.0 11,356,400.6Greenwood 11 1.930 570,000,330.5 1,561,644.7Hampton 7 2.322 301,493,609.5 826,009.9Horry 81 2.883 2,809,870,549.0 7,698,275.5Jasper 14 1.382 1,013,003,533.0 2,775,352.1Kershaw 18 2.224 809,394,053.9 2,217,518.0Lancaster 15 2.176 689,428,271.0 1,888,844.6Laurens 22 2.348 936,850,143.2 2,566,712.7Lee 8 2.163 369,782,248.3 1,013,102.1Lexington 46 1.503 3,060,090,706.0 8,383,810.2McCormick 3 2.525 118,831,126.5 325,564.7Marion 11 2.617 420,265,399.0 1,151,412.1Marlboro 9 2.783 323,340,145.0 885,863.4Newberry 7 0.927 755,068,158.8 2,068,679.9Oconee 13 1.776 732,091,841.6 2,005,731.1Orangeburg 31 1.908 1,624,432,912.0 4,450,501.1Pickens 16 1.837 871,208,685.5 2,386,873.1Richland 45 1.137 3,957,107,123.0 10,841,389.4Saluda 0 0.000 225,829,623.4 618,711.3Spartanburg 75 2.375 3,158,141,022.0 8,652,441.2Sumter 20 2.072 965,105,730.5 2,644,125.3Union 6 2.383 251,755,101.1 689,740.0Williamsburg 8 2.102 380,520,384.0 1,042,521.6York 18 0.820 2,196,119,059.0 6,016,764.5TOTAL 979 1.893 51,723,076,753.0 141,707,059.6
*Source: SC Department of Transportation

84South Carolina Department of Public Safety
South Carolina Traffic Collision Fact Book 2015
PART V - COUNTIES
ABBEVILLE COUNTY MOTOR VEHICLE TRAFFIC COLLISIONS
FatalCollision
InjuryCollision
PDO*Collision
TotalCollision
PersonsKilled
PersonsInjured
Total Collisions 5 138 205 348 6 209Collisions by Time of Day12:01am - 3:00am 0 14 14 28 0 153:01am - 6:00am 1 5 8 14 1 86:01am - 9:00am 1 19 35 55 1 279:01am - Noon 0 17 26 43 0 2312:01pm - 3:00pm 1 21 37 59 2 413:01pm - 6:00pm 2 29 33 64 2 526:01pm - 9:00pm 0 18 23 41 0 279:01pm - Midnight 0 15 29 44 0 16Collisions Investigated by JurisdictionABBEVILLE COUNTY SHERIFFS OFFICE 0 2 6 8 0 5ABBEVILLE POLICE DEPARTMENT 0 28 38 66 0 49CALHOUN FALLS POLICE DEPARTMENT 0 2 6 8 0 5S.C. HIGHWAY PATROL TROOP 1 0 4 6 10 0 4S.C. HIGHWAY PATROL TROOP 2 5 102 145 252 6 146S.C. HIGHWAY PATROL TROOP 3 0 0 1 1 0 0S.C. HIGHWAY PATROL TROOP 4 0 0 1 1 0 0S.C. HIGHWAY PATROL TROOP 6 0 0 2 2 0 0Collisions by Route CategoryInterstate 0 2 4 6 0 2US Primary 0 5 8 13 0 9SC Primary 3 68 95 166 3 108Secondary 2 53 80 135 3 76County 0 10 18 28 0 14
Statistics 2014 2015Total Collisions Ranking County/State** 41 39Fatal Collisions Ranking County/State** 38 39Injury Collisions Ranking County/State** 42 39Driver Licenses 19,105 19,405Vehicle Registrations 24,437 24,814Economic Loss*** $15,036,500 $17,259,800Population Estimates@ 24,892 24,971MV Population Death Rate@@ 24.1 24
Restraint Usage@@@ No Injury Possible Injury
Non-Incapacitating
InjuryIncapacitating
Injury Fatal InjuryTotal
VictimsRestraint Use by Injuries Sustained by OccupantsNone Used 7 4 8 3 2 24Restrained 427 120 36 10 4 597Child Safety Seat 20 2 1 1 0 24Unknown 40 6 2 0 0 48Injuries Sustained by Children Under Six YearsNone Used 1 0 0 0 0 1Restrained 1 3 0 0 0 4Child Safety Seat 15 2 1 1 0 19Unknown 0 0 0 0 0 0
*Property Damage Only **Ranking of County Compared to Other 45 Counties
***Formula Used to Compute Economic Loss is in Definitions Section @Source - U.S. Census Bureau
@@Motor Vehicle Deaths Per 100,000 Population
@@@Includes Occupants Seated Inside the Passenger Compartment of Automobiles, Vans, and Trucks only

85South Carolina Department of Public Safety
South Carolina Traffic Collision Fact Book 2015
PART V - COUNTIES
AIKEN COUNTY MOTOR VEHICLE TRAFFIC COLLISIONS
FatalCollision
InjuryCollision
PDO*Collision
TotalCollision
PersonsKilled
PersonsInjured
Total Collisions 26 1,040 2,792 3,858 26 1,576Collisions by Time of Day12:01am - 3:00am 2 55 143 200 2 773:01am - 6:00am 2 57 117 176 2 766:01am - 9:00am 4 131 346 481 4 2029:01am - Noon 2 129 368 499 2 18412:01pm - 3:00pm 5 201 560 766 5 3053:01pm - 6:00pm 1 217 715 933 1 3336:01pm - 9:00pm 6 168 395 569 6 2829:01pm - Midnight 4 82 148 234 4 117Collisions Investigated by JurisdictionAIKEN COUNTY SHERIFFS OFFICE 0 5 4 9 0 6AIKEN POLICE DEPARTMENT 4 247 764 1,015 4 391NORTH AUGUSTA POLICE DEPARTMENT 2 150 535 687 2 220BURNETTETOWN POLICE DEPARTMENT 0 10 23 33 0 15JACKSON POLICE DEPARTMENT 0 1 7 8 0 1NEW ELLENTON POLICE DEPARTMENT 1 3 8 12 1 5SALLEY POLICE DEPARTMENT 0 3 3 6 0 4WAGENER POLICE DEPARTMENT 0 1 3 4 0 2WAKENHUT SECURITY 0 0 1 1 0 0USC - AIKEN CAMPUS POLICE DEPARTMENT 0 0 2 2 0 0PERRY POLICE DEPARTMENT 0 0 2 2 0 0LEXINGTON COUNTY SHERIFFS OFFICE 0 0 1 1 0 0S.C. HIGHWAY PATROL TROOP 7 19 620 1,439 2,078 19 932Collisions by Route CategoryInterstate 2 76 274 352 2 108US Primary 8 275 656 939 8 464SC Primary 5 327 877 1,209 5 503Secondary 11 301 789 1,101 11 421County 0 61 196 257 0 80
Statistics 2014 2015Total Collisions Ranking County/State** 11 11Fatal Collisions Ranking County/State** 11 12Injury Collisions Ranking County/State** 11 11Driver Licenses 128,542 130,822Vehicle Registrations 150,861 153,965Economic Loss*** $105,075,200 $115,969,200Population Estimates@ 164,758 166,111MV Population Death Rate@@ 14 15.7
Restraint Usage@@@ No Injury Possible Injury
Non-Incapacitating
InjuryIncapacitating
Injury Fatal InjuryTotal
VictimsRestraint Use by Injuries Sustained by OccupantsNone Used 76 35 39 23 7 180Restrained 6,746 965 279 39 7 8,036Child Safety Seat 272 60 6 0 0 338Unknown 461 23 11 0 2 497Injuries Sustained by Children Under Six YearsNone Used 0 0 0 0 0 0Restrained 50 2 2 0 0 54Child Safety Seat 236 55 5 0 0 296Unknown 2 0 0 0 0 2
*Property Damage Only **Ranking of County Compared to Other 45 Counties
***Formula Used to Compute Economic Loss is in Definitions Section @Source - U.S. Census Bureau
@@Motor Vehicle Deaths Per 100,000 Population
@@@Includes Occupants Seated Inside the Passenger Compartment of Automobiles, Vans, and Trucks only

86South Carolina Department of Public Safety
South Carolina Traffic Collision Fact Book 2015
PART V - COUNTIES
ALLENDALE COUNTY MOTOR VEHICLE TRAFFIC COLLISIONS
FatalCollision
InjuryCollision
PDO*Collision
TotalCollision
PersonsKilled
PersonsInjured
Total Collisions 4 70 54 128 4 123Collisions by Time of Day12:01am - 3:00am 0 6 2 8 0 83:01am - 6:00am 1 5 6 12 1 76:01am - 9:00am 0 3 5 8 0 69:01am - Noon 0 8 9 17 0 1212:01pm - 3:00pm 1 9 9 19 1 193:01pm - 6:00pm 2 14 13 29 2 236:01pm - 9:00pm 0 15 2 17 0 339:01pm - Midnight 0 10 8 18 0 15Collisions Investigated by JurisdictionALLENDALE COUNTY SHERIFFS OFFICE 0 0 2 2 0 0ALLENDALE POLICE DEPARTMENT 0 19 17 36 0 36FAIRFAX POLICE DEPARTMENT 0 10 10 20 0 24S.C. HIGHWAY PATROL TROOP 3 0 2 0 2 0 2S.C. HIGHWAY PATROL TROOP 7 4 39 25 68 4 61Collisions by Route CategoryInterstate 0 0 0 0 0 0US Primary 1 31 16 48 1 52SC Primary 2 8 14 24 2 14Secondary 1 27 24 52 1 50County 0 4 0 4 0 7
Statistics 2014 2015Total Collisions Ranking County/State** 45 46Fatal Collisions Ranking County/State** 42 41Injury Collisions Ranking County/State** 46 44Driver Licenses 5,358 5,286Vehicle Registrations 6,811 6,737Economic Loss*** $8,244,500 $10,416,400Population Estimates@ 9,689 9,420MV Population Death Rate@@ 31 42.5
Restraint Usage@@@ No Injury Possible Injury
Non-Incapacitating
InjuryIncapacitating
Injury Fatal InjuryTotal
VictimsRestraint Use by Injuries Sustained by OccupantsNone Used 11 9 2 3 1 26Restrained 133 73 10 5 1 222Child Safety Seat 11 5 0 0 0 16Unknown 20 10 3 0 1 34Injuries Sustained by Children Under Six YearsNone Used 1 0 0 0 0 1Restrained 2 0 0 0 0 2Child Safety Seat 10 5 0 0 0 15Unknown 0 0 0 0 0 0
*Property Damage Only **Ranking of County Compared to Other 45 Counties
***Formula Used to Compute Economic Loss is in Definitions Section @Source - U.S. Census Bureau
@@Motor Vehicle Deaths Per 100,000 Population
@@@Includes Occupants Seated Inside the Passenger Compartment of Automobiles, Vans, and Trucks only
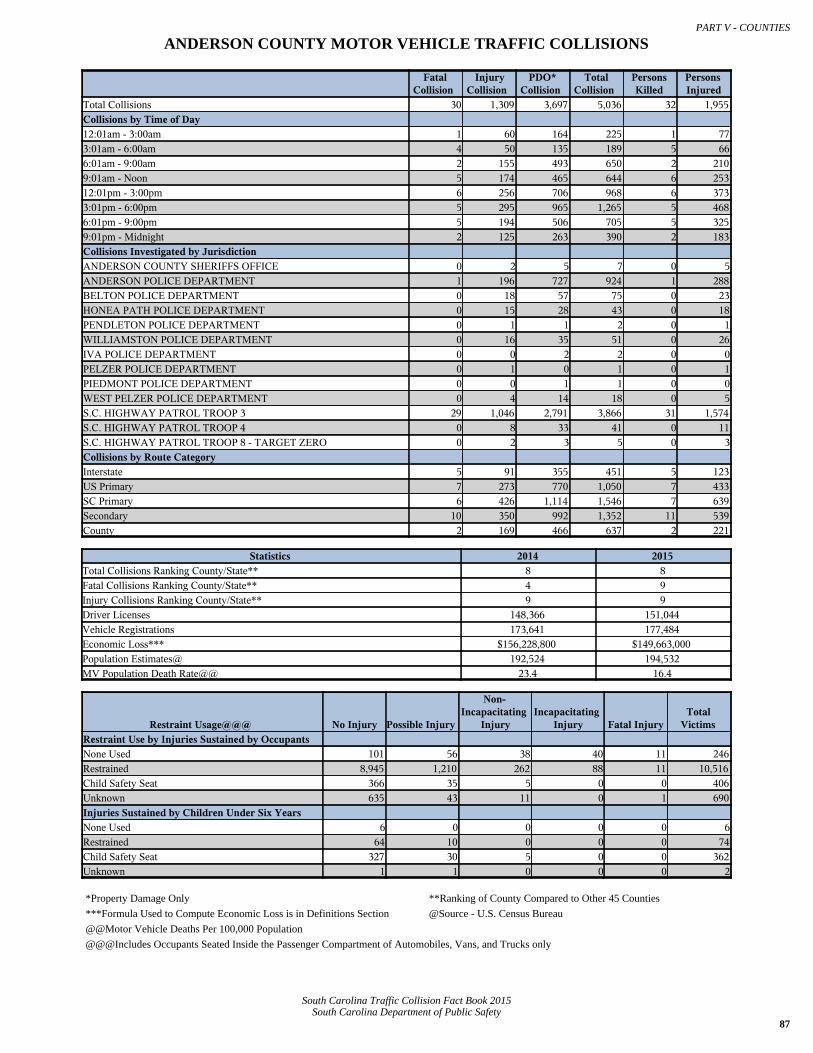
87South Carolina Department of Public Safety
South Carolina Traffic Collision Fact Book 2015
PART V - COUNTIES
ANDERSON COUNTY MOTOR VEHICLE TRAFFIC COLLISIONS
FatalCollision
InjuryCollision
PDO*Collision
TotalCollision
PersonsKilled
PersonsInjured
Total Collisions 30 1,309 3,697 5,036 32 1,955Collisions by Time of Day12:01am - 3:00am 1 60 164 225 1 773:01am - 6:00am 4 50 135 189 5 666:01am - 9:00am 2 155 493 650 2 2109:01am - Noon 5 174 465 644 6 25312:01pm - 3:00pm 6 256 706 968 6 3733:01pm - 6:00pm 5 295 965 1,265 5 4686:01pm - 9:00pm 5 194 506 705 5 3259:01pm - Midnight 2 125 263 390 2 183Collisions Investigated by JurisdictionANDERSON COUNTY SHERIFFS OFFICE 0 2 5 7 0 5ANDERSON POLICE DEPARTMENT 1 196 727 924 1 288BELTON POLICE DEPARTMENT 0 18 57 75 0 23HONEA PATH POLICE DEPARTMENT 0 15 28 43 0 18PENDLETON POLICE DEPARTMENT 0 1 1 2 0 1WILLIAMSTON POLICE DEPARTMENT 0 16 35 51 0 26IVA POLICE DEPARTMENT 0 0 2 2 0 0PELZER POLICE DEPARTMENT 0 1 0 1 0 1PIEDMONT POLICE DEPARTMENT 0 0 1 1 0 0WEST PELZER POLICE DEPARTMENT 0 4 14 18 0 5S.C. HIGHWAY PATROL TROOP 3 29 1,046 2,791 3,866 31 1,574S.C. HIGHWAY PATROL TROOP 4 0 8 33 41 0 11S.C. HIGHWAY PATROL TROOP 8 - TARGET ZERO 0 2 3 5 0 3Collisions by Route CategoryInterstate 5 91 355 451 5 123US Primary 7 273 770 1,050 7 433SC Primary 6 426 1,114 1,546 7 639Secondary 10 350 992 1,352 11 539County 2 169 466 637 2 221
Statistics 2014 2015Total Collisions Ranking County/State** 8 8Fatal Collisions Ranking County/State** 4 9Injury Collisions Ranking County/State** 9 9Driver Licenses 148,366 151,044Vehicle Registrations 173,641 177,484Economic Loss*** $156,228,800 $149,663,000Population Estimates@ 192,524 194,532MV Population Death Rate@@ 23.4 16.4
Restraint Usage@@@ No Injury Possible Injury
Non-Incapacitating
InjuryIncapacitating
Injury Fatal InjuryTotal
VictimsRestraint Use by Injuries Sustained by OccupantsNone Used 101 56 38 40 11 246Restrained 8,945 1,210 262 88 11 10,516Child Safety Seat 366 35 5 0 0 406Unknown 635 43 11 0 1 690Injuries Sustained by Children Under Six YearsNone Used 6 0 0 0 0 6Restrained 64 10 0 0 0 74Child Safety Seat 327 30 5 0 0 362Unknown 1 1 0 0 0 2
*Property Damage Only **Ranking of County Compared to Other 45 Counties
***Formula Used to Compute Economic Loss is in Definitions Section @Source - U.S. Census Bureau
@@Motor Vehicle Deaths Per 100,000 Population
@@@Includes Occupants Seated Inside the Passenger Compartment of Automobiles, Vans, and Trucks only
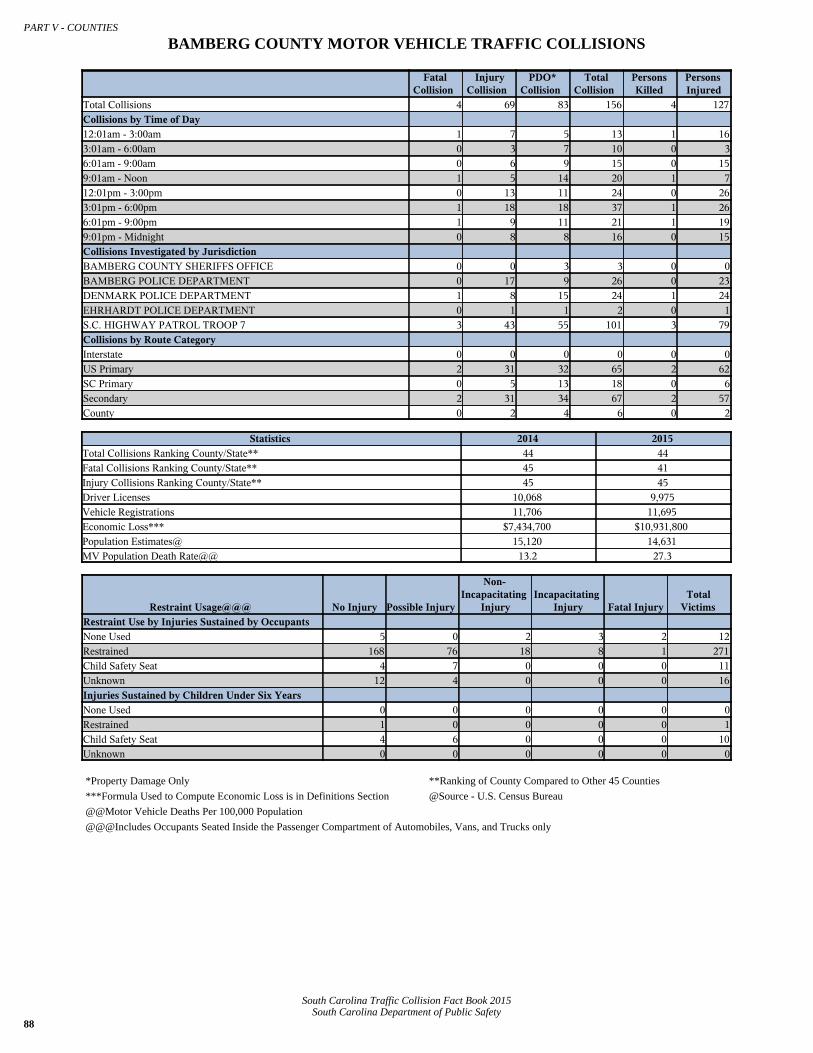
88South Carolina Department of Public Safety
South Carolina Traffic Collision Fact Book 2015
PART V - COUNTIES
BAMBERG COUNTY MOTOR VEHICLE TRAFFIC COLLISIONS
FatalCollision
InjuryCollision
PDO*Collision
TotalCollision
PersonsKilled
PersonsInjured
Total Collisions 4 69 83 156 4 127Collisions by Time of Day12:01am - 3:00am 1 7 5 13 1 163:01am - 6:00am 0 3 7 10 0 36:01am - 9:00am 0 6 9 15 0 159:01am - Noon 1 5 14 20 1 712:01pm - 3:00pm 0 13 11 24 0 263:01pm - 6:00pm 1 18 18 37 1 266:01pm - 9:00pm 1 9 11 21 1 199:01pm - Midnight 0 8 8 16 0 15Collisions Investigated by JurisdictionBAMBERG COUNTY SHERIFFS OFFICE 0 0 3 3 0 0BAMBERG POLICE DEPARTMENT 0 17 9 26 0 23DENMARK POLICE DEPARTMENT 1 8 15 24 1 24EHRHARDT POLICE DEPARTMENT 0 1 1 2 0 1S.C. HIGHWAY PATROL TROOP 7 3 43 55 101 3 79Collisions by Route CategoryInterstate 0 0 0 0 0 0US Primary 2 31 32 65 2 62SC Primary 0 5 13 18 0 6Secondary 2 31 34 67 2 57County 0 2 4 6 0 2
Statistics 2014 2015Total Collisions Ranking County/State** 44 44Fatal Collisions Ranking County/State** 45 41Injury Collisions Ranking County/State** 45 45Driver Licenses 10,068 9,975Vehicle Registrations 11,706 11,695Economic Loss*** $7,434,700 $10,931,800Population Estimates@ 15,120 14,631MV Population Death Rate@@ 13.2 27.3
Restraint Usage@@@ No Injury Possible Injury
Non-Incapacitating
InjuryIncapacitating
Injury Fatal InjuryTotal
VictimsRestraint Use by Injuries Sustained by OccupantsNone Used 5 0 2 3 2 12Restrained 168 76 18 8 1 271Child Safety Seat 4 7 0 0 0 11Unknown 12 4 0 0 0 16Injuries Sustained by Children Under Six YearsNone Used 0 0 0 0 0 0Restrained 1 0 0 0 0 1Child Safety Seat 4 6 0 0 0 10Unknown 0 0 0 0 0 0
*Property Damage Only **Ranking of County Compared to Other 45 Counties
***Formula Used to Compute Economic Loss is in Definitions Section @Source - U.S. Census Bureau
@@Motor Vehicle Deaths Per 100,000 Population
@@@Includes Occupants Seated Inside the Passenger Compartment of Automobiles, Vans, and Trucks only

89South Carolina Department of Public Safety
South Carolina Traffic Collision Fact Book 2015
PART V - COUNTIES
BARNWELL COUNTY MOTOR VEHICLE TRAFFIC COLLISIONS
FatalCollision
InjuryCollision
PDO*Collision
TotalCollision
PersonsKilled
PersonsInjured
Total Collisions 5 129 185 319 5 213Collisions by Time of Day12:01am - 3:00am 2 10 13 25 2 143:01am - 6:00am 1 4 12 17 1 56:01am - 9:00am 0 22 24 46 0 369:01am - Noon 0 17 21 38 0 2612:01pm - 3:00pm 0 19 38 57 0 353:01pm - 6:00pm 1 28 42 71 1 596:01pm - 9:00pm 1 19 21 41 1 259:01pm - Midnight 0 10 14 24 0 13Collisions Investigated by JurisdictionBARNWELL POLICE DEPARTMENT 0 34 49 83 0 53WILLISTON POLICE DEPARTMENT 0 9 24 33 0 16BLACKVILLE POLICE DEPARTMENT 0 10 9 19 0 21S.C. HIGHWAY PATROL TROOP 6 0 0 1 1 0 0S.C. HIGHWAY PATROL TROOP 7 5 76 102 183 5 123Collisions by Route CategoryInterstate 0 0 0 0 0 0US Primary 1 32 38 71 1 60SC Primary 1 49 71 121 1 80Secondary 3 46 63 112 3 68County 0 2 13 15 0 5
Statistics 2014 2015Total Collisions Ranking County/State** 40 42Fatal Collisions Ranking County/State** 34 39Injury Collisions Ranking County/State** 38 41Driver Licenses 15,920 15,815Vehicle Registrations 19,217 19,365Economic Loss*** $19,431,600 $16,538,200Population Estimates@ 21,959 21,706MV Population Death Rate@@ 27.3 23
Restraint Usage@@@ No Injury Possible Injury
Non-Incapacitating
InjuryIncapacitating
Injury Fatal InjuryTotal
VictimsRestraint Use by Injuries Sustained by OccupantsNone Used 9 1 5 5 4 24Restrained 425 122 39 14 0 600Child Safety Seat 32 10 3 0 0 45Unknown 23 8 2 1 0 34Injuries Sustained by Children Under Six YearsNone Used 0 0 1 1 0 2Restrained 7 0 0 0 0 7Child Safety Seat 29 9 3 0 0 41Unknown 0 0 0 0 0 0
*Property Damage Only **Ranking of County Compared to Other 45 Counties
***Formula Used to Compute Economic Loss is in Definitions Section @Source - U.S. Census Bureau
@@Motor Vehicle Deaths Per 100,000 Population
@@@Includes Occupants Seated Inside the Passenger Compartment of Automobiles, Vans, and Trucks only

90South Carolina Department of Public Safety
South Carolina Traffic Collision Fact Book 2015
PART V - COUNTIES
BEAUFORT COUNTY MOTOR VEHICLE TRAFFIC COLLISIONS
FatalCollision
InjuryCollision
PDO*Collision
TotalCollision
PersonsKilled
PersonsInjured
Total Collisions 17 1,018 2,271 3,306 18 1,565Collisions by Time of Day12:01am - 3:00am 2 50 80 132 2 713:01am - 6:00am 0 35 60 95 0 536:01am - 9:00am 0 107 285 392 0 1619:01am - Noon 2 131 353 486 2 20312:01pm - 3:00pm 2 197 438 637 2 3133:01pm - 6:00pm 4 262 625 891 4 3826:01pm - 9:00pm 5 150 286 441 5 2699:01pm - Midnight 2 86 144 232 3 113Collisions Investigated by JurisdictionBEAUFORT COUNTY SHERIFFS OFFICE 0 288 953 1,241 0 406BEAUFORT POLICE DEPARTMENT 1 175 350 526 1 300BLUFFTON POLICE DEPARTMENT 1 128 277 406 1 199PORT ROYAL POLICE DEPARTMENT 1 65 129 195 1 114HILTON HEAD PLANTATION SECURITY 0 4 28 32 0 6S.C. HIGHWAY PATROL TROOP 2 0 0 4 4 0 0S.C. HIGHWAY PATROL TROOP 4 0 0 1 1 0 0S.C. HIGHWAY PATROL TROOP 6 14 357 528 899 15 537S.C. HIGHWAY PATROL TROOP 7 0 1 0 1 0 3STATE TRANSPORT POLICE 6 0 0 1 1 0 0Collisions by Route CategoryInterstate 0 0 4 4 0 0US Primary 6 487 1,143 1,636 6 764SC Primary 6 234 481 721 6 399Secondary 5 202 422 629 6 270County 0 95 221 316 0 132
Statistics 2014 2015Total Collisions Ranking County/State** 12 12Fatal Collisions Ranking County/State** 11 18Injury Collisions Ranking County/State** 12 12Driver Licenses 134,563 138,244Vehicle Registrations 148,117 152,628Economic Loss*** $104,483,700 $103,932,200Population Estimates@ 175,178 179,782MV Population Death Rate@@ 13.1 10
Restraint Usage@@@ No Injury Possible Injury
Non-Incapacitating
InjuryIncapacitating
Injury Fatal InjuryTotal
VictimsRestraint Use by Injuries Sustained by OccupantsNone Used 42 26 25 26 4 123Restrained 6,478 988 222 49 9 7,746Child Safety Seat 293 41 1 0 0 335Unknown 266 46 12 5 0 329Injuries Sustained by Children Under Six YearsNone Used 2 2 1 0 0 5Restrained 45 13 1 0 0 59Child Safety Seat 257 36 1 0 0 294Unknown 2 1 0 0 0 3
*Property Damage Only **Ranking of County Compared to Other 45 Counties
***Formula Used to Compute Economic Loss is in Definitions Section @Source - U.S. Census Bureau
@@Motor Vehicle Deaths Per 100,000 Population
@@@Includes Occupants Seated Inside the Passenger Compartment of Automobiles, Vans, and Trucks only

91South Carolina Department of Public Safety
South Carolina Traffic Collision Fact Book 2015
PART V - COUNTIES
BERKELEY COUNTY MOTOR VEHICLE TRAFFIC COLLISIONS
FatalCollision
InjuryCollision
PDO*Collision
TotalCollision
PersonsKilled
PersonsInjured
Total Collisions 34 1,236 3,045 4,315 35 1,870Collisions by Time of Day12:01am - 3:00am 6 56 138 200 6 733:01am - 6:00am 3 51 122 176 3 796:01am - 9:00am 3 185 501 689 3 2589:01am - Noon 4 125 331 460 4 18412:01pm - 3:00pm 3 203 482 688 3 3193:01pm - 6:00pm 4 302 787 1,093 4 4316:01pm - 9:00pm 4 208 478 690 5 3409:01pm - Midnight 7 106 206 319 7 186Collisions Investigated by JurisdictionBERKELEY COUNTY SHERIFFS OFFICE 0 7 60 67 0 10MONCKS CORNER POLICE DEPARTMENT 0 95 229 324 0 150BONNEAU POLICE DEPARTMENT 0 3 4 7 0 7GOOSE CREEK POLICE DEPARTMENT 5 300 716 1,021 5 450JAMESTOWN POLICE DEPARTMENT 0 0 2 2 0 0ST. STEPHENS POLICE DEPARTMENT 0 11 4 15 0 28HANAHAN POLICE DEPARTMENT 1 42 115 158 1 54CHARLESTON COUNTY SHERIFFS OFFICE 0 4 7 11 0 6CHARLESTON POLICE DEPARTMENT 0 17 44 61 0 28MT PLEASANT POLICE DEPARTMENT 0 0 1 1 0 0NORTH CHARLESTON POLICE DEPARTMENT 0 4 7 11 0 6SUMMERVILLE POLICE DEPARTMENT 0 30 200 230 0 40S.C. HIGHWAY PATROL TROOP 3 0 0 1 1 0 0S.C. HIGHWAY PATROL TROOP 6 28 720 1,631 2,379 29 1,088S.C. HIGHWAY PATROL TROOP 7 0 1 1 2 0 1S.C. HIGHWAY PATROL TROOP 8 - TARGET ZERO 0 1 22 23 0 1STATE TRANSPORT POLICE 6 0 1 1 2 0 1Collisions by Route CategoryInterstate 3 106 314 423 3 147US Primary 10 447 1,092 1,549 10 700SC Primary 1 80 167 248 1 122Secondary 20 529 1,222 1,771 21 807County 0 74 250 324 0 94
Statistics 2014 2015Total Collisions Ranking County/State** 10 10Fatal Collisions Ranking County/State** 6 7Injury Collisions Ranking County/State** 10 10Driver Licenses 148,226 153,611Vehicle Registrations 164,220 170,048Economic Loss*** $144,472,700 $146,863,000Population Estimates@ 198,248 202,776MV Population Death Rate@@ 20.2 17.3
Restraint Usage@@@ No Injury Possible Injury
Non-Incapacitating
InjuryIncapacitating
Injury Fatal InjuryTotal
VictimsRestraint Use by Injuries Sustained by OccupantsNone Used 51 28 34 30 10 153Restrained 8,132 1,086 412 80 7 9,717Child Safety Seat 367 32 7 1 1 408Unknown 425 30 8 1 1 465Injuries Sustained by Children Under Six YearsNone Used 0 2 0 0 0 2Restrained 69 7 2 0 0 78Child Safety Seat 326 29 6 1 1 363Unknown 0 0 0 0 0 0

92South Carolina Department of Public Safety
South Carolina Traffic Collision Fact Book 2015
PART V - COUNTIES
CALHOUN COUNTY MOTOR VEHICLE TRAFFIC COLLISIONS
FatalCollision
InjuryCollision
PDO*Collision
TotalCollision
PersonsKilled
PersonsInjured
Total Collisions 8 170 387 565 10 284Collisions by Time of Day12:01am - 3:00am 2 16 24 42 2 273:01am - 6:00am 1 13 17 31 1 186:01am - 9:00am 0 24 49 73 0 349:01am - Noon 0 17 51 68 0 2712:01pm - 3:00pm 1 33 82 116 3 553:01pm - 6:00pm 1 36 87 124 1 666:01pm - 9:00pm 1 19 49 69 1 339:01pm - Midnight 2 12 28 42 2 24Collisions Investigated by JurisdictionST. MATTHEWS POLICE DEPARTMENT 0 4 23 27 0 4S.C. HIGHWAY PATROL TROOP 1 0 0 2 2 0 0S.C. HIGHWAY PATROL TROOP 2 0 0 1 1 0 0S.C. HIGHWAY PATROL TROOP 7 8 166 361 535 10 280Collisions by Route CategoryInterstate 3 87 250 340 5 142US Primary 4 40 48 92 4 76SC Primary 0 18 31 49 0 30Secondary 1 22 54 77 1 32County 0 3 4 7 0 4
Statistics 2014 2015Total Collisions Ranking County/State** 34 35Fatal Collisions Ranking County/State** 23 32Injury Collisions Ranking County/State** 37 37Driver Licenses 12,069 12,135Vehicle Registrations 17,913 18,121Economic Loss*** $28,747,100 $27,547,400Population Estimates@ 14,862 14,802MV Population Death Rate@@ 80.7 67.6
Restraint Usage@@@ No Injury Possible Injury
Non-Incapacitating
InjuryIncapacitating
Injury Fatal InjuryTotal
VictimsRestraint Use by Injuries Sustained by OccupantsNone Used 11 4 12 3 6 36Restrained 1,085 206 28 6 3 1,328Child Safety Seat 29 10 0 0 0 39Unknown 65 2 1 1 1 70Injuries Sustained by Children Under Six YearsNone Used 0 0 1 0 0 1Restrained 7 2 2 0 0 11Child Safety Seat 27 9 0 0 0 36Unknown 0 0 0 0 0 0
*Property Damage Only **Ranking of County Compared to Other 45 Counties
***Formula Used to Compute Economic Loss is in Definitions Section @Source - U.S. Census Bureau
@@Motor Vehicle Deaths Per 100,000 Population
@@@Includes Occupants Seated Inside the Passenger Compartment of Automobiles, Vans, and Trucks only

93South Carolina Department of Public Safety
South Carolina Traffic Collision Fact Book 2015
PART V - COUNTIES
CHARLESTON COUNTY MOTOR VEHICLE TRAFFIC COLLISIONS
FatalCollision
InjuryCollision
PDO*Collision
TotalCollision
PersonsKilled
PersonsInjured
Total Collisions 63 4,019 11,134 15,216 64 5,909Collisions by Time of Day12:01am - 3:00am 9 229 430 668 9 3413:01am - 6:00am 7 122 223 352 7 1516:01am - 9:00am 7 541 1,625 2,173 7 7359:01am - Noon 4 526 1,515 2,045 4 74412:01pm - 3:00pm 3 742 2,193 2,938 3 1,0713:01pm - 6:00pm 10 947 3,038 3,995 11 1,4226:01pm - 9:00pm 9 593 1,463 2,065 9 9459:01pm - Midnight 14 319 647 980 14 500Collisions Investigated by JurisdictionMONCKS CORNER POLICE DEPARTMENT 0 0 1 1 0 0HANAHAN POLICE DEPARTMENT 0 1 1 2 0 1CHARLESTON COUNTY SHERIFFS OFFICE 23 784 1,498 2,305 24 1,207CHARLESTON POLICE DEPARTMENT 14 1,179 3,919 5,112 14 1,614MT PLEASANT POLICE DEPARTMENT 6 388 1,354 1,748 6 528FOLLY BEACH POLICE DEPARTMENT 0 14 62 76 0 17LINCOLNVILLE POLICE DEPARTMENT 0 1 4 5 0 1ISLE OF PALMS POLICE DEPARTMENT 0 16 49 65 0 23SULLIVANS ISLAND POLICE DEPARTMENT 0 6 19 25 0 7NORTH CHARLESTON POLICE DEPARTMENT 14 1,330 3,242 4,586 14 2,090MEDICAL UNIVERSITY POLICE DEPARTMENT 0 4 11 15 0 5RAVENEL POLICE DEPARTMENT 0 3 0 3 0 4CHARLESTON COUNTY AVIATION AUTHORITY 0 16 50 66 0 19SUMMERVILLE POLICE DEPARTMENT 0 0 6 6 0 0S.C. HIGHWAY PATROL TROOP 2 0 0 1 1 0 0S.C. HIGHWAY PATROL TROOP 5 0 0 2 2 0 0S.C. HIGHWAY PATROL TROOP 6 6 276 898 1,180 6 392S.C. HIGHWAY PATROL TROOP 8 - TARGET ZERO 0 1 17 18 0 1Collisions by Route CategoryInterstate 5 470 1,538 2,013 5 658US Primary 20 1,035 2,519 3,574 21 1,627SC Primary 15 863 2,248 3,126 15 1,261Secondary 21 1,301 3,489 4,811 21 1,872County 2 350 1,340 1,692 2 491
Statistics 2014 2015Total Collisions Ranking County/State** 2 2Fatal Collisions Ranking County/State** 3 3Injury Collisions Ranking County/State** 1 1Driver Licenses 293,499 300,908Vehicle Registrations 311,962 323,594Economic Loss*** $355,729,900 $405,663,400Population Estimates@ 380,280 389,291MV Population Death Rate@@ 12.4 16.4
Restraint Usage@@@ No Injury Possible Injury
Non-Incapacitating
InjuryIncapacitating
Injury Fatal InjuryTotal
VictimsRestraint Use by Injuries Sustained by OccupantsNone Used 344 84 67 24 16 535Restrained 28,792 3,646 811 137 11 33,397Child Safety Seat 1,057 131 13 0 0 1,201Unknown 2,783 310 82 16 4 3,195Injuries Sustained by Children Under Six YearsNone Used 9 7 1 0 0 17Restrained 207 49 5 0 1 262Child Safety Seat 929 116 13 0 0 1,058Unknown 25 2 0 0 0 27

94South Carolina Department of Public Safety
South Carolina Traffic Collision Fact Book 2015
PART V - COUNTIES
CHEROKEE COUNTY MOTOR VEHICLE TRAFFIC COLLISIONS
FatalCollision
InjuryCollision
PDO*Collision
TotalCollision
PersonsKilled
PersonsInjured
Total Collisions 14 484 1,058 1,556 17 805Collisions by Time of Day12:01am - 3:00am 0 18 44 62 0 263:01am - 6:00am 1 20 54 75 1 296:01am - 9:00am 2 56 147 205 2 699:01am - Noon 0 49 120 169 0 8312:01pm - 3:00pm 2 88 197 287 2 1313:01pm - 6:00pm 2 120 250 372 3 2006:01pm - 9:00pm 5 91 153 249 7 1829:01pm - Midnight 2 42 93 137 2 85Collisions Investigated by JurisdictionCHEROKEE COUNTY SHERIFFS OFFICE 0 0 3 3 0 0BLACKBURG POLICE DEPARTMENT 0 13 32 45 0 28GAFFNEY POLICE DEPARTMENT 0 130 224 354 0 226SPARTANBURG COUNTY SHERIFFS OFFICE 0 0 1 1 0 0S.C. HIGHWAY PATROL TROOP 3 0 1 1 2 0 2S.C. HIGHWAY PATROL TROOP 4 14 340 796 1,150 17 549S.C. HIGHWAY PATROL TROOP 5 0 0 1 1 0 0Collisions by Route CategoryInterstate 4 75 320 399 5 129US Primary 4 51 105 160 6 92SC Primary 4 195 295 494 4 317Secondary 1 133 282 416 1 212County 1 30 56 87 1 55
Statistics 2014 2015Total Collisions Ranking County/State** 20 20Fatal Collisions Ranking County/State** 20 26Injury Collisions Ranking County/State** 21 20Driver Licenses 42,107 42,588Vehicle Registrations 50,668 51,278Economic Loss*** $53,998,000 $61,194,800Population Estimates@ 56,314 56,493MV Population Death Rate@@ 26.6 30.1
Restraint Usage@@@ No Injury Possible Injury
Non-Incapacitating
InjuryIncapacitating
Injury Fatal InjuryTotal
VictimsRestraint Use by Injuries Sustained by OccupantsNone Used 13 14 6 11 7 51Restrained 2,618 576 81 24 2 3,301Child Safety Seat 76 27 2 0 0 105Unknown 136 5 1 2 0 144Injuries Sustained by Children Under Six YearsNone Used 3 3 0 0 0 6Restrained 33 9 0 0 0 42Child Safety Seat 65 27 1 0 0 93Unknown 1 0 0 0 0 1
*Property Damage Only **Ranking of County Compared to Other 45 Counties
***Formula Used to Compute Economic Loss is in Definitions Section @Source - U.S. Census Bureau
@@Motor Vehicle Deaths Per 100,000 Population
@@@Includes Occupants Seated Inside the Passenger Compartment of Automobiles, Vans, and Trucks only

95South Carolina Department of Public Safety
South Carolina Traffic Collision Fact Book 2015
PART V - COUNTIES
CHESTER COUNTY MOTOR VEHICLE TRAFFIC COLLISIONS
FatalCollision
InjuryCollision
PDO*Collision
TotalCollision
PersonsKilled
PersonsInjured
Total Collisions 15 278 483 776 17 500Collisions by Time of Day12:01am - 3:00am 2 22 33 57 3 523:01am - 6:00am 0 15 25 40 0 216:01am - 9:00am 1 30 66 97 1 389:01am - Noon 5 29 56 90 6 4212:01pm - 3:00pm 1 46 86 133 1 873:01pm - 6:00pm 3 61 110 174 3 1046:01pm - 9:00pm 1 40 69 110 1 849:01pm - Midnight 2 35 38 75 2 72Collisions Investigated by JurisdictionCHESTER COUNTY SHERIFFS OFFICE 0 2 0 2 0 3CHESTER POLICE DEPARTMENT 2 37 56 95 2 60GREAT FALLS POLICE DEPARTMENT 0 13 17 30 0 29FORT LAWN POLICE DEPARTMENT 0 5 7 12 0 8S.C. HIGHWAY PATROL TROOP 4 13 221 403 637 15 400Collisions by Route CategoryInterstate 1 27 94 122 1 40US Primary 2 45 52 99 3 80SC Primary 7 112 187 306 8 205Secondary 5 92 136 233 5 173County 0 2 14 16 0 2
Statistics 2014 2015Total Collisions Ranking County/State** 30 29Fatal Collisions Ranking County/State** 30 22Injury Collisions Ranking County/State** 30 29Driver Licenses 25,508 25,768Vehicle Registrations 30,870 31,345Economic Loss*** $29,603,300 $46,564,800Population Estimates@ 32,379 32,285MV Population Death Rate@@ 27.8 52.7
Restraint Usage@@@ No Injury Possible Injury
Non-Incapacitating
InjuryIncapacitating
Injury Fatal InjuryTotal
VictimsRestraint Use by Injuries Sustained by OccupantsNone Used 21 13 11 3 7 55Restrained 1,263 308 94 22 7 1,694Child Safety Seat 63 10 1 0 0 74Unknown 89 6 0 0 0 95Injuries Sustained by Children Under Six YearsNone Used 2 5 0 0 0 7Restrained 15 2 1 0 0 18Child Safety Seat 60 9 0 0 0 69Unknown 0 0 0 0 0 0
*Property Damage Only **Ranking of County Compared to Other 45 Counties
***Formula Used to Compute Economic Loss is in Definitions Section @Source - U.S. Census Bureau
@@Motor Vehicle Deaths Per 100,000 Population
@@@Includes Occupants Seated Inside the Passenger Compartment of Automobiles, Vans, and Trucks only

96South Carolina Department of Public Safety
South Carolina Traffic Collision Fact Book 2015
PART V - COUNTIES
CHESTERFIELD COUNTY MOTOR VEHICLE TRAFFIC COLLISIONS
FatalCollision
InjuryCollision
PDO*Collision
TotalCollision
PersonsKilled
PersonsInjured
Total Collisions 16 267 384 667 16 452Collisions by Time of Day12:01am - 3:00am 1 17 30 48 1 223:01am - 6:00am 0 14 27 41 0 186:01am - 9:00am 2 37 47 86 2 579:01am - Noon 1 34 50 85 1 5612:01pm - 3:00pm 0 46 64 110 0 883:01pm - 6:00pm 6 57 82 145 6 1136:01pm - 9:00pm 5 35 49 89 5 619:01pm - Midnight 1 27 35 63 1 37Collisions Investigated by JurisdictionCHESTERFIELD COUNTY SHERIFFS OFFICE 0 0 1 1 0 0CHERAW POLICE DEPARTMENT 0 54 67 121 0 118CHESTERFIELD POLICE DEPARTMENT 0 10 18 28 0 17MCBEE POLICE DEPARTMENT 0 0 1 1 0 0PAGELAND POLICE DEPARTMENT 1 12 40 53 1 16S.C. HIGHWAY PATROL TROOP 1 0 3 4 7 0 3S.C. HIGHWAY PATROL TROOP 4 15 188 252 455 15 298S.C. HIGHWAY PATROL TROOP 5 0 0 1 1 0 0Collisions by Route CategoryInterstate 0 0 0 0 0 0US Primary 3 44 55 102 3 78SC Primary 6 96 135 237 6 172Secondary 6 119 175 300 6 182County 1 8 19 28 1 20
Statistics 2014 2015Total Collisions Ranking County/State** 33 31Fatal Collisions Ranking County/State** 42 21Injury Collisions Ranking County/State** 28 31Driver Licenses 33,210 33,380Vehicle Registrations 42,194 42,654Economic Loss*** $22,237,200 $42,700,400Population Estimates@ 46,124 46,036MV Population Death Rate@@ 6.5 34.8
Restraint Usage@@@ No Injury Possible Injury
Non-Incapacitating
InjuryIncapacitating
Injury Fatal InjuryTotal
VictimsRestraint Use by Injuries Sustained by OccupantsNone Used 20 6 4 15 8 53Restrained 928 295 74 18 3 1,318Child Safety Seat 48 9 3 0 0 60Unknown 45 0 2 4 0 51Injuries Sustained by Children Under Six YearsNone Used 3 0 1 2 0 6Restrained 9 2 1 0 0 12Child Safety Seat 44 9 2 0 0 55Unknown 0 0 0 0 0 0
*Property Damage Only **Ranking of County Compared to Other 45 Counties
***Formula Used to Compute Economic Loss is in Definitions Section @Source - U.S. Census Bureau
@@Motor Vehicle Deaths Per 100,000 Population
@@@Includes Occupants Seated Inside the Passenger Compartment of Automobiles, Vans, and Trucks only

97South Carolina Department of Public Safety
South Carolina Traffic Collision Fact Book 2015
PART V - COUNTIES
CLARENDON COUNTY MOTOR VEHICLE TRAFFIC COLLISIONS
FatalCollision
InjuryCollision
PDO*Collision
TotalCollision
PersonsKilled
PersonsInjured
Total Collisions 17 213 365 595 17 413Collisions by Time of Day12:01am - 3:00am 1 25 23 49 1 633:01am - 6:00am 1 19 20 40 1 306:01am - 9:00am 1 26 57 84 1 379:01am - Noon 1 23 44 68 1 2912:01pm - 3:00pm 3 29 69 101 3 503:01pm - 6:00pm 3 26 62 91 3 526:01pm - 9:00pm 5 43 56 104 5 949:01pm - Midnight 2 22 34 58 2 58Collisions Investigated by JurisdictionCLARENDON COUNTY SHERIFFS OFFICE 0 1 0 1 0 1MANNING POLICE DEPARTMENT 0 21 21 42 0 33SUMMERTON POLICE DEPARTMENT 0 4 3 7 0 4TURBEVILLE POLICE DEPARTMENT 0 1 1 2 0 2S.C. HIGHWAY PATROL TROOP 1 17 185 338 540 17 372S.C. HIGHWAY PATROL TROOP 7 0 1 0 1 0 1STATE TRANSPORT POLICE 5 0 0 2 2 0 0Collisions by Route CategoryInterstate 4 41 118 163 4 71US Primary 2 46 71 119 2 87SC Primary 1 43 71 115 1 80Secondary 10 80 98 188 10 172County 0 3 7 10 0 3
Statistics 2014 2015Total Collisions Ranking County/State** 31 34Fatal Collisions Ranking County/State** 30 18Injury Collisions Ranking County/State** 32 35Driver Licenses 24,712 24,971Vehicle Registrations 28,425 28,848Economic Loss*** $29,594,100 $41,454,600Population Estimates@ 34,082 33,803MV Population Death Rate@@ 29.3 50.3
Restraint Usage@@@ No Injury Possible Injury
Non-Incapacitating
InjuryIncapacitating
Injury Fatal InjuryTotal
VictimsRestraint Use by Injuries Sustained by OccupantsNone Used 13 11 6 9 5 44Restrained 912 309 37 9 5 1,272Child Safety Seat 38 4 0 2 0 44Unknown 47 6 1 1 2 57Injuries Sustained by Children Under Six YearsNone Used 0 0 0 0 0 0Restrained 7 5 0 0 0 12Child Safety Seat 34 4 0 2 0 40Unknown 0 0 0 0 0 0
*Property Damage Only **Ranking of County Compared to Other 45 Counties
***Formula Used to Compute Economic Loss is in Definitions Section @Source - U.S. Census Bureau
@@Motor Vehicle Deaths Per 100,000 Population
@@@Includes Occupants Seated Inside the Passenger Compartment of Automobiles, Vans, and Trucks only

98South Carolina Department of Public Safety
South Carolina Traffic Collision Fact Book 2015
PART V - COUNTIES
COLLETON COUNTY MOTOR VEHICLE TRAFFIC COLLISIONS
FatalCollision
InjuryCollision
PDO*Collision
TotalCollision
PersonsKilled
PersonsInjured
Total Collisions 21 391 705 1,117 21 625Collisions by Time of Day12:01am - 3:00am 3 24 42 69 3 273:01am - 6:00am 6 23 31 60 6 446:01am - 9:00am 1 38 85 124 1 629:01am - Noon 0 52 112 164 0 8012:01pm - 3:00pm 3 61 129 193 3 1043:01pm - 6:00pm 0 87 148 235 0 1496:01pm - 9:00pm 5 69 91 165 5 1069:01pm - Midnight 3 37 67 107 3 53Collisions Investigated by JurisdictionCOLLETON COUNTY SHERIFFS OFFICE 0 3 9 12 0 4WALTERBORO POLICE DEPARTMENT 0 104 183 287 0 186COTTAGEVILLE POLICE DEPARTMENT 0 4 2 6 0 5EDISTO BEACH POLICE DEPARTMENT 0 4 5 9 0 5S.C. HIGHWAY PATROL TROOP 1 0 0 1 1 0 0S.C. HIGHWAY PATROL TROOP 6 21 276 500 797 21 425S.C. HIGHWAY PATROL TROOP 7 0 0 4 4 0 0STATE TRANSPORT POLICE 6 0 0 1 1 0 0Collisions by Route CategoryInterstate 4 47 180 231 4 70US Primary 2 94 141 237 2 160SC Primary 5 122 219 346 5 208Secondary 10 124 148 282 10 183County 0 4 17 21 0 4
Statistics 2014 2015Total Collisions Ranking County/State** 25 26Fatal Collisions Ranking County/State** 17 14Injury Collisions Ranking County/State** 24 23Driver Licenses 30,314 30,757Vehicle Registrations 36,108 37,011Economic Loss*** $50,680,900 $58,818,400Population Estimates@ 37,754 37,740MV Population Death Rate@@ 45 55.6
Restraint Usage@@@ No Injury Possible Injury
Non-Incapacitating
InjuryIncapacitating
Injury Fatal InjuryTotal
VictimsRestraint Use by Injuries Sustained by OccupantsNone Used 25 39 8 16 10 98Restrained 1,910 393 75 19 7 2,404Child Safety Seat 97 18 3 0 0 118Unknown 173 19 1 0 0 193Injuries Sustained by Children Under Six YearsNone Used 5 0 0 0 0 5Restrained 20 2 0 0 0 22Child Safety Seat 89 17 3 0 0 109Unknown 0 2 0 0 0 2
*Property Damage Only **Ranking of County Compared to Other 45 Counties
***Formula Used to Compute Economic Loss is in Definitions Section @Source - U.S. Census Bureau
@@Motor Vehicle Deaths Per 100,000 Population
@@@Includes Occupants Seated Inside the Passenger Compartment of Automobiles, Vans, and Trucks only

99South Carolina Department of Public Safety
South Carolina Traffic Collision Fact Book 2015
PART V - COUNTIES
DARLINGTON COUNTY MOTOR VEHICLE TRAFFIC COLLISIONS
FatalCollision
InjuryCollision
PDO*Collision
TotalCollision
PersonsKilled
PersonsInjured
Total Collisions 23 479 1,005 1,507 25 773Collisions by Time of Day12:01am - 3:00am 1 26 51 78 1 383:01am - 6:00am 0 24 49 73 0 306:01am - 9:00am 2 40 133 175 2 639:01am - Noon 3 54 118 175 3 9312:01pm - 3:00pm 3 89 195 287 3 1313:01pm - 6:00pm 3 112 246 361 3 2026:01pm - 9:00pm 6 82 143 231 8 1369:01pm - Midnight 5 52 70 127 5 80Collisions Investigated by JurisdictionDARLINGTON COUNTY SHERIFFS OFFICE 0 2 1 3 0 2DARLINGTON POLICE DEPARTMENT 0 56 117 173 0 84HARTSVILLE POLICE DEPARTMENT 1 72 178 251 1 118SOCIETY HILL POLICE DEPARTMENT 0 2 7 9 0 2S.C. HIGHWAY PATROL TROOP 5 22 347 701 1,070 24 567STATE TRANSPORT POLICE 5 0 0 1 1 0 0Collisions by Route CategoryInterstate 1 13 65 79 1 21US Primary 4 130 244 378 5 223SC Primary 3 102 215 320 3 181Secondary 15 223 456 694 16 335County 0 11 25 36 0 13
Statistics 2014 2015Total Collisions Ranking County/State** 21 21Fatal Collisions Ranking County/State** 23 13Injury Collisions Ranking County/State** 20 21Driver Licenses 49,838 50,218Vehicle Registrations 57,306 57,819Economic Loss*** $51,680,800 $71,514,200Population Estimates@ 67,697 67,534MV Population Death Rate@@ 19.2 37
Restraint Usage@@@ No Injury Possible Injury
Non-Incapacitating
InjuryIncapacitating
Injury Fatal InjuryTotal
VictimsRestraint Use by Injuries Sustained by OccupantsNone Used 20 16 27 9 9 81Restrained 2,446 496 114 19 5 3,080Child Safety Seat 131 21 2 0 1 155Unknown 201 12 2 1 0 216Injuries Sustained by Children Under Six YearsNone Used 2 1 0 0 0 3Restrained 20 2 0 0 0 22Child Safety Seat 118 19 1 0 1 139Unknown 0 1 0 0 0 1
*Property Damage Only **Ranking of County Compared to Other 45 Counties
***Formula Used to Compute Economic Loss is in Definitions Section @Source - U.S. Census Bureau
@@Motor Vehicle Deaths Per 100,000 Population
@@@Includes Occupants Seated Inside the Passenger Compartment of Automobiles, Vans, and Trucks only

100South Carolina Department of Public Safety
South Carolina Traffic Collision Fact Book 2015
PART V - COUNTIES
DILLON COUNTY MOTOR VEHICLE TRAFFIC COLLISIONS
FatalCollision
InjuryCollision
PDO*Collision
TotalCollision
PersonsKilled
PersonsInjured
Total Collisions 7 316 543 866 7 566Collisions by Time of Day12:01am - 3:00am 0 18 42 60 0 313:01am - 6:00am 0 26 46 72 0 356:01am - 9:00am 1 36 77 114 1 609:01am - Noon 0 33 60 93 0 5712:01pm - 3:00pm 2 62 81 145 2 1163:01pm - 6:00pm 1 61 111 173 1 1096:01pm - 9:00pm 1 54 77 132 1 1199:01pm - Midnight 2 26 49 77 2 39Collisions Investigated by JurisdictionDILLON COUNTY SHERIFFS OFFICE 0 1 0 1 0 1DILLON POLICE DEPARTMENT 0 100 96 196 0 187LAKEVIEW POLICE DEPARTMENT 0 0 2 2 0 0LATTA POLICE DEPARTMENT 0 3 20 23 0 6S.C. HIGHWAY PATROL TROOP 1 0 12 18 30 0 24S.C. HIGHWAY PATROL TROOP 3 0 1 0 1 0 2S.C. HIGHWAY PATROL TROOP 5 7 199 407 613 7 346Collisions by Route CategoryInterstate 3 42 153 198 3 73US Primary 1 54 67 122 1 100SC Primary 0 98 143 241 0 185Secondary 3 116 160 279 3 195County 0 6 20 26 0 13
Statistics 2014 2015Total Collisions Ranking County/State** 28 28Fatal Collisions Ranking County/State** 23 35Injury Collisions Ranking County/State** 29 27Driver Licenses 21,512 21,446Vehicle Registrations 24,095 24,333Economic Loss*** $41,230,000 $32,531,200Population Estimates@ 31,323 31,235MV Population Death Rate@@ 44.7 22.4
Restraint Usage@@@ No Injury Possible Injury
Non-Incapacitating
InjuryIncapacitating
Injury Fatal InjuryTotal
VictimsRestraint Use by Injuries Sustained by OccupantsNone Used 22 15 15 5 2 59Restrained 1,496 403 41 13 3 1,956Child Safety Seat 77 23 0 1 0 101Unknown 91 13 4 0 0 108Injuries Sustained by Children Under Six YearsNone Used 2 1 0 0 0 3Restrained 19 9 0 0 0 28Child Safety Seat 74 22 0 1 0 97Unknown 0 0 0 0 0 0
*Property Damage Only **Ranking of County Compared to Other 45 Counties
***Formula Used to Compute Economic Loss is in Definitions Section @Source - U.S. Census Bureau
@@Motor Vehicle Deaths Per 100,000 Population
@@@Includes Occupants Seated Inside the Passenger Compartment of Automobiles, Vans, and Trucks only

101South Carolina Department of Public Safety
South Carolina Traffic Collision Fact Book 2015
PART V - COUNTIES
DORCHESTER COUNTY MOTOR VEHICLE TRAFFIC COLLISIONS
FatalCollision
InjuryCollision
PDO*Collision
TotalCollision
PersonsKilled
PersonsInjured
Total Collisions 30 814 2,245 3,089 33 1,250Collisions by Time of Day12:01am - 3:00am 6 35 86 127 6 593:01am - 6:00am 3 32 78 113 3 426:01am - 9:00am 4 109 329 442 4 1529:01am - Noon 2 94 287 383 3 12812:01pm - 3:00pm 1 155 424 580 1 2543:01pm - 6:00pm 6 182 571 759 7 2946:01pm - 9:00pm 3 137 323 463 3 2069:01pm - Midnight 5 70 147 222 6 115Collisions Investigated by JurisdictionCHARLESTON COUNTY SHERIFFS OFFICE 1 1 2 4 1 1NORTH CHARLESTON POLICE DEPARTMENT 1 81 161 243 1 129DORCHESTER COUNTY SHERIFFS OFFICE 0 28 66 94 0 40ST.GEORGE POLICE DEPARTMENT 0 11 21 32 0 14SUMMERVILLE POLICE DEPARTMENT 3 236 879 1,118 3 353HARLEYVILLE POLICE DEPARTMENT 0 0 2 2 0 0RIDGEVILLE POLICE DEPARTMENT 0 1 3 4 0 1S.C. HIGHWAY PATROL TROOP 6 25 453 1,099 1,577 28 709S.C. HIGHWAY PATROL TROOP 7 0 1 9 10 0 1S.C. HIGHWAY PATROL TROOP 8 - TARGET ZERO 0 1 2 3 0 1STATE TRANSPORT POLICE 6 0 1 1 2 0 1Collisions by Route CategoryInterstate 6 65 187 258 7 124US Primary 7 171 455 633 8 266SC Primary 5 224 521 750 6 349Secondary 11 292 830 1,133 11 429County 1 62 252 315 1 82
Statistics 2014 2015Total Collisions Ranking County/State** 13 13Fatal Collisions Ranking County/State** 17 9Injury Collisions Ranking County/State** 15 15Driver Licenses 116,680 120,084Vehicle Registrations 121,114 124,057Economic Loss*** $83,893,600 $114,261,400Population Estimates@ 148,499 152,536MV Population Death Rate@@ 10.8 21.6
Restraint Usage@@@ No Injury Possible Injury
Non-Incapacitating
InjuryIncapacitating
Injury Fatal InjuryTotal
VictimsRestraint Use by Injuries Sustained by OccupantsNone Used 44 29 28 19 12 132Restrained 6,178 761 214 34 9 7,196Child Safety Seat 365 43 3 1 0 412Unknown 310 18 0 1 1 330Injuries Sustained by Children Under Six YearsNone Used 5 2 1 0 0 8Restrained 40 3 3 0 0 46Child Safety Seat 320 37 2 1 0 360Unknown 1 0 0 0 1 2
*Property Damage Only **Ranking of County Compared to Other 45 Counties
***Formula Used to Compute Economic Loss is in Definitions Section @Source - U.S. Census Bureau
@@Motor Vehicle Deaths Per 100,000 Population
@@@Includes Occupants Seated Inside the Passenger Compartment of Automobiles, Vans, and Trucks only

102South Carolina Department of Public Safety
South Carolina Traffic Collision Fact Book 2015
PART V - COUNTIES
EDGEFIELD COUNTY MOTOR VEHICLE TRAFFIC COLLISIONS
FatalCollision
InjuryCollision
PDO*Collision
TotalCollision
PersonsKilled
PersonsInjured
Total Collisions 2 135 199 336 2 203Collisions by Time of Day12:01am - 3:00am 0 10 12 22 0 143:01am - 6:00am 0 8 11 19 0 96:01am - 9:00am 1 16 33 50 1 249:01am - Noon 0 18 23 41 0 2412:01pm - 3:00pm 0 19 36 55 0 263:01pm - 6:00pm 0 27 42 69 0 436:01pm - 9:00pm 1 25 27 53 1 489:01pm - Midnight 0 12 15 27 0 15Collisions Investigated by JurisdictionNORTH AUGUSTA POLICE DEPARTMENT 0 1 1 2 0 1EDGEFIELD POLICE DEPARTMENT 0 5 18 23 0 6JOHNSTON POLICE DEPARTMENT 0 7 13 20 0 14S.C. HIGHWAY PATROL TROOP 2 2 121 167 290 2 181S.C. HIGHWAY PATROL TROOP 7 0 1 0 1 0 1Collisions by Route CategoryInterstate 0 0 0 0 0 0US Primary 0 31 40 71 0 45SC Primary 1 39 60 100 1 73Secondary 1 57 88 146 1 76County 0 8 11 19 0 9
Statistics 2014 2015Total Collisions Ranking County/State** 39 40Fatal Collisions Ranking County/State** 42 45Injury Collisions Ranking County/State** 39 40Driver Licenses 18,565 18,812Vehicle Registrations 23,886 24,339Economic Loss*** $12,026,100 $11,204,400Population Estimates@ 26,450 26,503MV Population Death Rate@@ 11.3 7.5
Restraint Usage@@@ No Injury Possible Injury
Non-Incapacitating
InjuryIncapacitating
Injury Fatal InjuryTotal
VictimsRestraint Use by Injuries Sustained by OccupantsNone Used 6 3 5 4 0 18Restrained 438 114 44 6 1 603Child Safety Seat 20 3 2 0 0 25Unknown 39 3 2 0 0 44Injuries Sustained by Children Under Six YearsNone Used 2 0 0 0 0 2Restrained 1 0 0 0 0 1Child Safety Seat 18 3 2 0 0 23Unknown 0 0 0 0 0 0
*Property Damage Only **Ranking of County Compared to Other 45 Counties
***Formula Used to Compute Economic Loss is in Definitions Section @Source - U.S. Census Bureau
@@Motor Vehicle Deaths Per 100,000 Population
@@@Includes Occupants Seated Inside the Passenger Compartment of Automobiles, Vans, and Trucks only

103South Carolina Department of Public Safety
South Carolina Traffic Collision Fact Book 2015
PART V - COUNTIES
FAIRFIELD COUNTY MOTOR VEHICLE TRAFFIC COLLISIONS
FatalCollision
InjuryCollision
PDO*Collision
TotalCollision
PersonsKilled
PersonsInjured
Total Collisions 7 237 379 623 7 424Collisions by Time of Day12:01am - 3:00am 0 14 34 48 0 293:01am - 6:00am 0 21 43 64 0 216:01am - 9:00am 1 32 51 84 1 549:01am - Noon 0 20 44 64 0 3012:01pm - 3:00pm 1 38 55 94 1 583:01pm - 6:00pm 3 34 71 108 3 596:01pm - 9:00pm 1 44 44 89 1 909:01pm - Midnight 1 34 37 72 1 83Collisions Investigated by JurisdictionFAIRFIELD COUNTY SHERIFFS OFFICE 0 0 2 2 0 0WINNSBORO POLICE DEPARTMENT 0 30 28 58 0 63RIDGEWAY POLICE DEPARTMENT 0 1 2 3 0 1S.C. HIGHWAY PATROL TROOP 1 0 1 4 5 0 1S.C. HIGHWAY PATROL TROOP 3 0 1 4 5 0 1S.C. HIGHWAY PATROL TROOP 4 7 202 332 541 7 355S.C. HIGHWAY PATROL TROOP 5 0 2 7 9 0 3Collisions by Route CategoryInterstate 2 28 95 125 2 40US Primary 0 52 68 120 0 81SC Primary 2 76 97 175 2 132Secondary 3 77 94 174 3 166County 0 4 25 29 0 5
Statistics 2014 2015Total Collisions Ranking County/State** 35 33Fatal Collisions Ranking County/State** 34 35Injury Collisions Ranking County/State** 34 32Driver Licenses 17,410 17,438Vehicle Registrations 22,126 22,354Economic Loss*** $24,635,900 $26,120,000Population Estimates@ 23,018 22,880MV Population Death Rate@@ 34.8 30.6
Restraint Usage@@@ No Injury Possible Injury
Non-Incapacitating
InjuryIncapacitating
Injury Fatal InjuryTotal
VictimsRestraint Use by Injuries Sustained by OccupantsNone Used 8 10 6 1 0 25Restrained 838 255 103 11 1 1,208Child Safety Seat 42 10 2 0 0 54Unknown 93 6 2 0 0 101Injuries Sustained by Children Under Six YearsNone Used 0 0 1 0 0 1Restrained 8 0 2 0 0 10Child Safety Seat 36 10 2 0 0 48Unknown 0 0 0 0 0 0
*Property Damage Only **Ranking of County Compared to Other 45 Counties
***Formula Used to Compute Economic Loss is in Definitions Section @Source - U.S. Census Bureau
@@Motor Vehicle Deaths Per 100,000 Population
@@@Includes Occupants Seated Inside the Passenger Compartment of Automobiles, Vans, and Trucks only
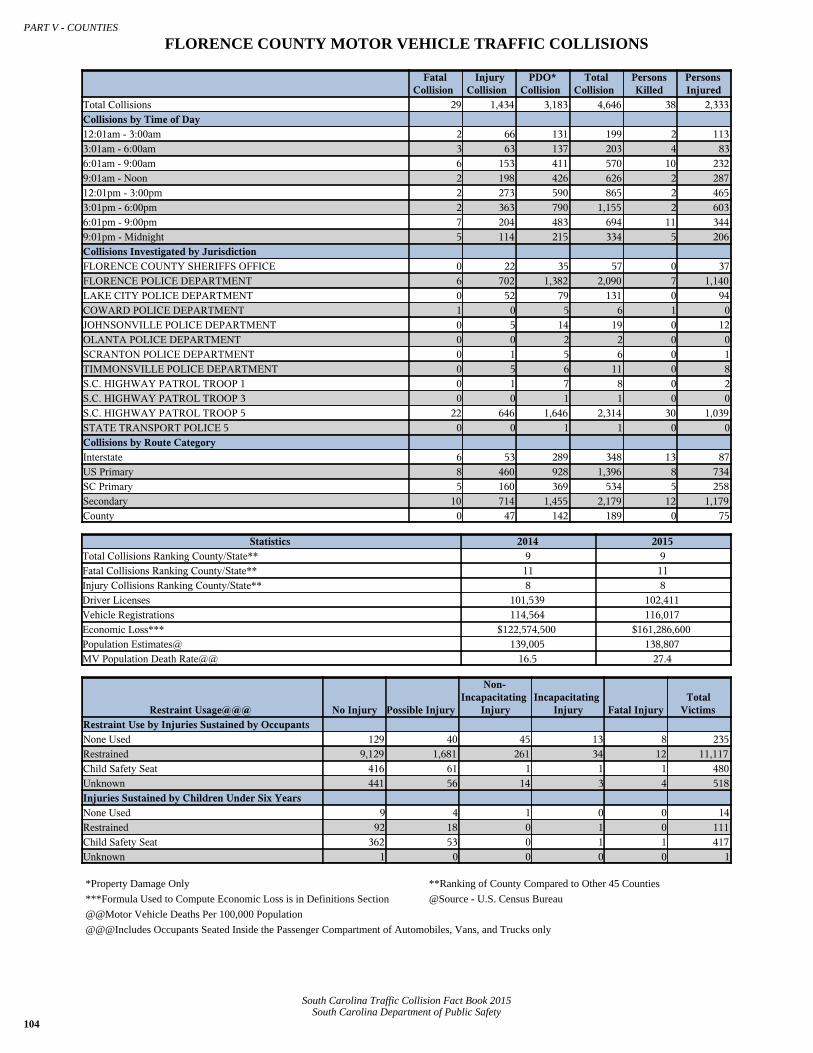
104South Carolina Department of Public Safety
South Carolina Traffic Collision Fact Book 2015
PART V - COUNTIES
FLORENCE COUNTY MOTOR VEHICLE TRAFFIC COLLISIONS
FatalCollision
InjuryCollision
PDO*Collision
TotalCollision
PersonsKilled
PersonsInjured
Total Collisions 29 1,434 3,183 4,646 38 2,333Collisions by Time of Day12:01am - 3:00am 2 66 131 199 2 1133:01am - 6:00am 3 63 137 203 4 836:01am - 9:00am 6 153 411 570 10 2329:01am - Noon 2 198 426 626 2 28712:01pm - 3:00pm 2 273 590 865 2 4653:01pm - 6:00pm 2 363 790 1,155 2 6036:01pm - 9:00pm 7 204 483 694 11 3449:01pm - Midnight 5 114 215 334 5 206Collisions Investigated by JurisdictionFLORENCE COUNTY SHERIFFS OFFICE 0 22 35 57 0 37FLORENCE POLICE DEPARTMENT 6 702 1,382 2,090 7 1,140LAKE CITY POLICE DEPARTMENT 0 52 79 131 0 94COWARD POLICE DEPARTMENT 1 0 5 6 1 0JOHNSONVILLE POLICE DEPARTMENT 0 5 14 19 0 12OLANTA POLICE DEPARTMENT 0 0 2 2 0 0SCRANTON POLICE DEPARTMENT 0 1 5 6 0 1TIMMONSVILLE POLICE DEPARTMENT 0 5 6 11 0 8S.C. HIGHWAY PATROL TROOP 1 0 1 7 8 0 2S.C. HIGHWAY PATROL TROOP 3 0 0 1 1 0 0S.C. HIGHWAY PATROL TROOP 5 22 646 1,646 2,314 30 1,039STATE TRANSPORT POLICE 5 0 0 1 1 0 0Collisions by Route CategoryInterstate 6 53 289 348 13 87US Primary 8 460 928 1,396 8 734SC Primary 5 160 369 534 5 258Secondary 10 714 1,455 2,179 12 1,179County 0 47 142 189 0 75
Statistics 2014 2015Total Collisions Ranking County/State** 9 9Fatal Collisions Ranking County/State** 11 11Injury Collisions Ranking County/State** 8 8Driver Licenses 101,539 102,411Vehicle Registrations 114,564 116,017Economic Loss*** $122,574,500 $161,286,600Population Estimates@ 139,005 138,807MV Population Death Rate@@ 16.5 27.4
Restraint Usage@@@ No Injury Possible Injury
Non-Incapacitating
InjuryIncapacitating
Injury Fatal InjuryTotal
VictimsRestraint Use by Injuries Sustained by OccupantsNone Used 129 40 45 13 8 235Restrained 9,129 1,681 261 34 12 11,117Child Safety Seat 416 61 1 1 1 480Unknown 441 56 14 3 4 518Injuries Sustained by Children Under Six YearsNone Used 9 4 1 0 0 14Restrained 92 18 0 1 0 111Child Safety Seat 362 53 0 1 1 417Unknown 1 0 0 0 0 1
*Property Damage Only **Ranking of County Compared to Other 45 Counties
***Formula Used to Compute Economic Loss is in Definitions Section @Source - U.S. Census Bureau
@@Motor Vehicle Deaths Per 100,000 Population
@@@Includes Occupants Seated Inside the Passenger Compartment of Automobiles, Vans, and Trucks only

105South Carolina Department of Public Safety
South Carolina Traffic Collision Fact Book 2015
PART V - COUNTIES
GEORGETOWN COUNTY MOTOR VEHICLE TRAFFIC COLLISIONS
FatalCollision
InjuryCollision
PDO*Collision
TotalCollision
PersonsKilled
PersonsInjured
Total Collisions 17 430 962 1,409 18 650Collisions by Time of Day12:01am - 3:00am 2 23 40 65 2 323:01am - 6:00am 1 25 49 75 1 296:01am - 9:00am 2 62 114 178 3 969:01am - Noon 3 48 146 197 3 7812:01pm - 3:00pm 3 90 214 307 3 1433:01pm - 6:00pm 0 100 232 332 0 1466:01pm - 9:00pm 3 55 109 167 3 829:01pm - Midnight 3 27 58 88 3 44Collisions Investigated by JurisdictionGEORGETOWN COUNTY SHERIFFS OFFICE 0 1 7 8 0 1ANDREWS POLICE DEPARTMENT 0 25 32 57 0 43GEORGETOWN POLICE DEPARTMENT 1 83 202 286 1 118PAWLEYS ISLAND POLICE DEPARTMENT 0 1 5 6 0 1S.C. HIGHWAY PATROL TROOP 1 0 1 9 10 0 2S.C. HIGHWAY PATROL TROOP 3 0 1 3 4 0 1S.C. HIGHWAY PATROL TROOP 5 16 317 703 1,036 17 481S.C. HIGHWAY PATROL TROOP 7 0 1 0 1 0 3STATE TRANSPORT POLICE 5 0 0 1 1 0 0Collisions by Route CategoryInterstate 0 0 0 0 0 0US Primary 5 245 551 801 5 381SC Primary 3 31 73 107 4 54Secondary 9 136 286 431 9 190County 0 18 52 70 0 25
Statistics 2014 2015Total Collisions Ranking County/State** 22 23Fatal Collisions Ranking County/State** 32 18Injury Collisions Ranking County/State** 22 22Driver Licenses 50,949 51,623Vehicle Registrations 58,628 59,392Economic Loss*** $41,237,200 $59,210,000Population Estimates@ 60,729 61,243MV Population Death Rate@@ 11.5 29.4
Restraint Usage@@@ No Injury Possible Injury
Non-Incapacitating
InjuryIncapacitating
Injury Fatal InjuryTotal
VictimsRestraint Use by Injuries Sustained by OccupantsNone Used 25 17 15 5 4 66Restrained 2,641 388 107 25 7 3,168Child Safety Seat 98 12 2 0 0 112Unknown 179 25 1 1 0 206Injuries Sustained by Children Under Six YearsNone Used 1 0 0 0 0 1Restrained 16 5 0 0 0 21Child Safety Seat 85 10 2 0 0 97Unknown 1 0 0 0 0 1
*Property Damage Only **Ranking of County Compared to Other 45 Counties
***Formula Used to Compute Economic Loss is in Definitions Section @Source - U.S. Census Bureau
@@Motor Vehicle Deaths Per 100,000 Population
@@@Includes Occupants Seated Inside the Passenger Compartment of Automobiles, Vans, and Trucks only

106South Carolina Department of Public Safety
South Carolina Traffic Collision Fact Book 2015
PART V - COUNTIES
GREENVILLE COUNTY MOTOR VEHICLE TRAFFIC COLLISIONS
FatalCollision
InjuryCollision
PDO*Collision
TotalCollision
PersonsKilled
PersonsInjured
Total Collisions 70 3,787 12,019 15,876 73 5,406Collisions by Time of Day12:01am - 3:00am 10 166 417 593 10 2153:01am - 6:00am 4 109 310 423 4 1436:01am - 9:00am 5 468 1,811 2,284 5 6469:01am - Noon 4 479 1,427 1,910 5 67612:01pm - 3:00pm 6 706 2,251 2,963 6 1,0103:01pm - 6:00pm 13 973 3,381 4,367 13 1,4246:01pm - 9:00pm 10 573 1,703 2,286 10 8359:01pm - Midnight 18 313 719 1,050 20 457Collisions Investigated by JurisdictionGREENVILLE COUNTY SHERIFFS OFFICE 2 5 13 20 2 12FOUNTAIN INN POLICE DEPARTMENT 0 41 95 136 0 70GREENVILLE POLICE DEPARTMENT 5 968 3,260 4,233 6 1,357GREER POLICE DEPARTMENT 0 200 531 731 0 262MAULDIN POLICE DEPARTMENT 2 119 430 551 2 152SIMPSONVILLE POLICE DEPARTMENT 0 149 389 538 0 227TRAVELERS REST POLICE DEPARTMENT 1 56 106 163 1 71GREENVILLE TECHINCAL COLLEGE POLICE 0 0 2 2 0 0GREENVILLE HOSPITAL SYSTEMS POLICE DEPARTMENT 0 0 2 2 0 0SPARTANBURG COUNTY SHERIFFS OFFICE 0 0 1 1 0 0GREENVILLE/SPARTANBURG AIRPORT POLICE DEPARTMENT 0 6 6 12 0 16S.C. HIGHWAY PATROL TROOP 1 0 1 4 5 0 3S.C. HIGHWAY PATROL TROOP 2 0 0 2 2 0 0S.C. HIGHWAY PATROL TROOP 3 60 2,240 7,174 9,474 62 3,234S.C. HIGHWAY PATROL TROOP 8 - TARGET ZERO 0 2 3 5 0 2STATE TRANSPORT POLICE 3 0 0 1 1 0 0Collisions by Route CategoryInterstate 2 347 1,543 1,892 2 477US Primary 21 871 2,291 3,183 22 1,325SC Primary 18 826 2,610 3,454 19 1,237Secondary 21 1,404 4,113 5,538 21 1,931County 8 339 1,462 1,809 9 436
Statistics 2014 2015Total Collisions Ranking County/State** 1 1Fatal Collisions Ranking County/State** 1 2Injury Collisions Ranking County/State** 2 2Driver Licenses 367,845 376,928Vehicle Registrations 413,392 425,200Economic Loss*** $355,120,500 $405,664,800Population Estimates@ 481,657 490,661MV Population Death Rate@@ 12.9 14.9
Restraint Usage@@@ No Injury Possible Injury
Non-Incapacitating
InjuryIncapacitating
Injury Fatal InjuryTotal
VictimsRestraint Use by Injuries Sustained by OccupantsNone Used 146 81 63 24 21 335Restrained 30,882 3,412 980 122 19 35,415Child Safety Seat 1,368 127 16 1 2 1,514Unknown 1,513 112 32 5 0 1,662Injuries Sustained by Children Under Six YearsNone Used 3 1 0 0 0 4Restrained 194 22 4 0 1 221Child Safety Seat 1,188 118 12 1 2 1,321Unknown 2 0 0 0 0 2

107South Carolina Department of Public Safety
South Carolina Traffic Collision Fact Book 2015
PART V - COUNTIES
GREENWOOD COUNTY MOTOR VEHICLE TRAFFIC COLLISIONS
FatalCollision
InjuryCollision
PDO*Collision
TotalCollision
PersonsKilled
PersonsInjured
Total Collisions 11 605 1,158 1,774 11 964Collisions by Time of Day12:01am - 3:00am 3 34 63 100 3 473:01am - 6:00am 2 21 48 71 2 346:01am - 9:00am 0 64 135 199 0 919:01am - Noon 0 77 144 221 0 12612:01pm - 3:00pm 0 132 250 382 0 2133:01pm - 6:00pm 2 137 283 422 2 2166:01pm - 9:00pm 2 93 152 247 2 1539:01pm - Midnight 2 47 83 132 2 84Collisions Investigated by JurisdictionGREENWOOD COUNTY SHERIFFS OFFICE 0 0 1 1 0 0GREENWOOD POLICE DEPARTMENT 4 241 515 760 4 385WARE SHOALS POLICE DEPARTMENT 0 10 25 35 0 11NINETY SIX POLICE DEPARTMENT 0 11 19 30 0 14LANDER UNIVERSITY POLICE DEPARTMENT 0 0 1 1 0 0S.C. HIGHWAY PATROL TROOP 2 7 343 595 945 7 554STATE TRANSPORT POLICE 2 0 0 2 2 0 0Collisions by Route CategoryInterstate 0 0 0 0 0 0US Primary 3 183 381 567 3 307SC Primary 1 175 268 444 1 268Secondary 6 218 402 626 6 350County 1 29 107 137 1 39
Statistics 2014 2015Total Collisions Ranking County/State** 17 18Fatal Collisions Ranking County/State** 32 29Injury Collisions Ranking County/State** 19 18Driver Licenses 49,705 50,258Vehicle Registrations 59,721 60,329Economic Loss*** $46,140,700 $59,087,800Population Estimates@ 69,648 69,902MV Population Death Rate@@ 10.1 15.7
Restraint Usage@@@ No Injury Possible Injury
Non-Incapacitating
InjuryIncapacitating
Injury Fatal InjuryTotal
VictimsRestraint Use by Injuries Sustained by OccupantsNone Used 30 31 15 9 7 92Restrained 2,749 609 124 35 2 3,519Child Safety Seat 140 23 1 0 0 164Unknown 441 61 9 2 0 513Injuries Sustained by Children Under Six YearsNone Used 2 0 0 0 0 2Restrained 25 5 0 0 0 30Child Safety Seat 122 20 1 0 0 143Unknown 8 2 1 0 0 11
*Property Damage Only **Ranking of County Compared to Other 45 Counties
***Formula Used to Compute Economic Loss is in Definitions Section @Source - U.S. Census Bureau
@@Motor Vehicle Deaths Per 100,000 Population
@@@Includes Occupants Seated Inside the Passenger Compartment of Automobiles, Vans, and Trucks only
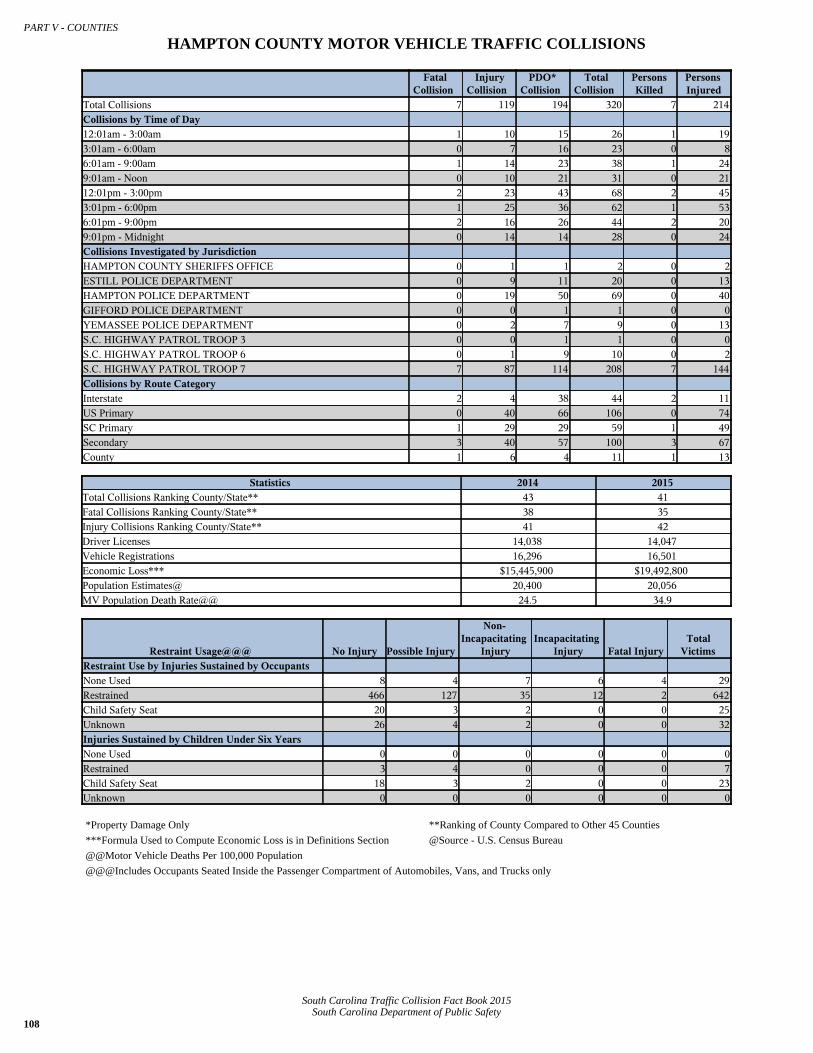
108South Carolina Department of Public Safety
South Carolina Traffic Collision Fact Book 2015
PART V - COUNTIES
HAMPTON COUNTY MOTOR VEHICLE TRAFFIC COLLISIONS
FatalCollision
InjuryCollision
PDO*Collision
TotalCollision
PersonsKilled
PersonsInjured
Total Collisions 7 119 194 320 7 214Collisions by Time of Day12:01am - 3:00am 1 10 15 26 1 193:01am - 6:00am 0 7 16 23 0 86:01am - 9:00am 1 14 23 38 1 249:01am - Noon 0 10 21 31 0 2112:01pm - 3:00pm 2 23 43 68 2 453:01pm - 6:00pm 1 25 36 62 1 536:01pm - 9:00pm 2 16 26 44 2 209:01pm - Midnight 0 14 14 28 0 24Collisions Investigated by JurisdictionHAMPTON COUNTY SHERIFFS OFFICE 0 1 1 2 0 2ESTILL POLICE DEPARTMENT 0 9 11 20 0 13HAMPTON POLICE DEPARTMENT 0 19 50 69 0 40GIFFORD POLICE DEPARTMENT 0 0 1 1 0 0YEMASSEE POLICE DEPARTMENT 0 2 7 9 0 13S.C. HIGHWAY PATROL TROOP 3 0 0 1 1 0 0S.C. HIGHWAY PATROL TROOP 6 0 1 9 10 0 2S.C. HIGHWAY PATROL TROOP 7 7 87 114 208 7 144Collisions by Route CategoryInterstate 2 4 38 44 2 11US Primary 0 40 66 106 0 74SC Primary 1 29 29 59 1 49Secondary 3 40 57 100 3 67County 1 6 4 11 1 13
Statistics 2014 2015Total Collisions Ranking County/State** 43 41Fatal Collisions Ranking County/State** 38 35Injury Collisions Ranking County/State** 41 42Driver Licenses 14,038 14,047Vehicle Registrations 16,296 16,501Economic Loss*** $15,445,900 $19,492,800Population Estimates@ 20,400 20,056MV Population Death Rate@@ 24.5 34.9
Restraint Usage@@@ No Injury Possible Injury
Non-Incapacitating
InjuryIncapacitating
Injury Fatal InjuryTotal
VictimsRestraint Use by Injuries Sustained by OccupantsNone Used 8 4 7 6 4 29Restrained 466 127 35 12 2 642Child Safety Seat 20 3 2 0 0 25Unknown 26 4 2 0 0 32Injuries Sustained by Children Under Six YearsNone Used 0 0 0 0 0 0Restrained 3 4 0 0 0 7Child Safety Seat 18 3 2 0 0 23Unknown 0 0 0 0 0 0
*Property Damage Only **Ranking of County Compared to Other 45 Counties
***Formula Used to Compute Economic Loss is in Definitions Section @Source - U.S. Census Bureau
@@Motor Vehicle Deaths Per 100,000 Population
@@@Includes Occupants Seated Inside the Passenger Compartment of Automobiles, Vans, and Trucks only

109South Carolina Department of Public Safety
South Carolina Traffic Collision Fact Book 2015
PART V - COUNTIES
HORRY COUNTY MOTOR VEHICLE TRAFFIC COLLISIONS
FatalCollision
InjuryCollision
PDO*Collision
TotalCollision
PersonsKilled
PersonsInjured
Total Collisions 76 2,897 7,226 10,199 81 4,525Collisions by Time of Day12:01am - 3:00am 9 173 298 480 9 2633:01am - 6:00am 7 110 220 337 7 1616:01am - 9:00am 5 286 767 1,058 5 4169:01am - Noon 5 368 1,001 1,374 5 58512:01pm - 3:00pm 7 525 1,558 2,090 7 8243:01pm - 6:00pm 18 727 1,846 2,591 18 1,1316:01pm - 9:00pm 16 425 983 1,424 20 6729:01pm - Midnight 9 283 553 845 10 473Collisions Investigated by JurisdictionHORRY COUNTY SHERIFFS OFFICE 1 3 10 14 1 7ATLANTIC BEACH POLICE DEPARTMENT 0 0 1 1 0 0CONWAY POLICE DEPARTMENT 3 229 641 873 3 393AYNOR POLICE DEPARTMENT 0 18 32 50 0 27LORIS POLICE DEPARTMENT 0 21 40 61 0 37MYRTLE BEACH POLICE DEPARTMENT 10 647 1,523 2,180 10 949NORTH MYRTLE BEACH POLICE DEPARTMENT 3 185 493 681 3 265SURFSIDE BEACH POLICE DEPARTMENT 1 32 122 155 1 49USC - COASTAL CAROLINA POLICE DEPARTMENT 0 3 53 56 0 4BRIARCLIFF ACRES POLICE DEPARTMENT 0 1 1 2 0 1S.C. HIGHWAY PATROL TROOP 4 0 0 1 1 0 0S.C. HIGHWAY PATROL TROOP 5 58 1,758 4,309 6,125 63 2,793Collisions by Route CategoryInterstate 0 0 0 0 0 0US Primary 39 1,205 3,045 4,289 43 2,025SC Primary 16 600 1,345 1,961 17 938Secondary 15 660 1,513 2,188 15 966County 6 432 1,323 1,761 6 596
Statistics 2014 2015Total Collisions Ranking County/State** 4 4Fatal Collisions Ranking County/State** 2 1Injury Collisions Ranking County/State** 4 4Driver Licenses 252,075 262,637Vehicle Registrations 270,248 283,153Economic Loss*** $300,351,300 $353,263,800Population Estimates@ 298,795 309,871MV Population Death Rate@@ 19.4 26.1
Restraint Usage@@@ No Injury Possible Injury
Non-Incapacitating
InjuryIncapacitating
Injury Fatal InjuryTotal
VictimsRestraint Use by Injuries Sustained by OccupantsNone Used 162 81 77 36 14 370Restrained 22,404 2,483 895 131 23 25,936Child Safety Seat 966 59 18 4 0 1,047Unknown 1,032 63 17 7 5 1,124Injuries Sustained by Children Under Six YearsNone Used 5 3 1 0 0 9Restrained 177 14 1 0 0 192Child Safety Seat 848 52 18 4 0 922Unknown 7 0 2 0 0 9
*Property Damage Only **Ranking of County Compared to Other 45 Counties
***Formula Used to Compute Economic Loss is in Definitions Section @Source - U.S. Census Bureau
@@Motor Vehicle Deaths Per 100,000 Population
@@@Includes Occupants Seated Inside the Passenger Compartment of Automobiles, Vans, and Trucks only

110South Carolina Department of Public Safety
South Carolina Traffic Collision Fact Book 2015
PART V - COUNTIES
JASPER COUNTY MOTOR VEHICLE TRAFFIC COLLISIONS
FatalCollision
InjuryCollision
PDO*Collision
TotalCollision
PersonsKilled
PersonsInjured
Total Collisions 12 344 772 1,128 14 543Collisions by Time of Day12:01am - 3:00am 1 24 48 73 1 323:01am - 6:00am 0 26 57 83 0 426:01am - 9:00am 3 51 105 159 3 659:01am - Noon 0 36 101 137 0 6212:01pm - 3:00pm 3 51 147 201 3 983:01pm - 6:00pm 3 76 145 224 5 1266:01pm - 9:00pm 2 48 104 154 2 739:01pm - Midnight 0 32 65 97 0 45Collisions Investigated by JurisdictionJASPER COUNTY SHERIFFS OFFICE 0 0 2 2 0 0HARDEEVILLE POLICE DEPARTMENT 2 82 183 267 2 145RIDGELAND POLICE DEPARTMENT 2 52 133 187 4 75S.C. HIGHWAY PATROL TROOP 1 0 0 1 1 0 0S.C. HIGHWAY PATROL TROOP 3 0 0 1 1 0 0S.C. HIGHWAY PATROL TROOP 6 8 210 452 670 8 323Collisions by Route CategoryInterstate 3 76 279 358 5 123US Primary 5 123 210 338 5 201SC Primary 3 66 134 203 3 103Secondary 1 75 129 205 1 111County 0 4 20 24 0 5
Statistics 2014 2015Total Collisions Ranking County/State** 26 25Fatal Collisions Ranking County/State** 19 28Injury Collisions Ranking County/State** 26 26Driver Licenses 17,873 18,707Vehicle Registrations 24,866 26,386Economic Loss*** $44,092,400 $46,836,200Population Estimates@ 26,998 27,889MV Population Death Rate@@ 55.6 50.2
Restraint Usage@@@ No Injury Possible Injury
Non-Incapacitating
InjuryIncapacitating
Injury Fatal InjuryTotal
VictimsRestraint Use by Injuries Sustained by OccupantsNone Used 26 13 12 14 5 70Restrained 1,973 326 94 32 5 2,430Child Safety Seat 78 24 0 1 0 103Unknown 138 10 1 0 1 150Injuries Sustained by Children Under Six YearsNone Used 0 2 3 0 0 5Restrained 28 2 0 0 0 30Child Safety Seat 75 21 0 1 0 97Unknown 1 0 0 0 0 1
*Property Damage Only **Ranking of County Compared to Other 45 Counties
***Formula Used to Compute Economic Loss is in Definitions Section @Source - U.S. Census Bureau
@@Motor Vehicle Deaths Per 100,000 Population
@@@Includes Occupants Seated Inside the Passenger Compartment of Automobiles, Vans, and Trucks only

111South Carolina Department of Public Safety
South Carolina Traffic Collision Fact Book 2015
PART V - COUNTIES
KERSHAW COUNTY MOTOR VEHICLE TRAFFIC COLLISIONS
FatalCollision
InjuryCollision
PDO*Collision
TotalCollision
PersonsKilled
PersonsInjured
Total Collisions 15 350 928 1,293 18 531Collisions by Time of Day12:01am - 3:00am 0 28 34 62 0 513:01am - 6:00am 1 15 42 58 2 206:01am - 9:00am 1 46 133 180 1 669:01am - Noon 2 37 142 181 3 4612:01pm - 3:00pm 3 54 172 229 3 913:01pm - 6:00pm 1 87 213 301 1 1306:01pm - 9:00pm 4 49 125 178 5 809:01pm - Midnight 3 34 67 104 3 47Collisions Investigated by JurisdictionKERSHAW COUNTY SHERIFFS OFFICE 0 1 5 6 0 1CAMDEN POLICE DEPARTMENT 1 90 250 341 1 138BETHUNE POLICE DEPARTMENT 0 0 1 1 0 0ELGIN POLICE DEPARTMENT 0 9 24 33 0 13S.C. HIGHWAY PATROL TROOP 1 14 250 648 912 17 379Collisions by Route CategoryInterstate 1 33 122 156 1 48US Primary 4 140 413 557 4 215SC Primary 3 34 62 99 3 48Secondary 7 130 281 418 10 202County 0 13 50 63 0 18
Statistics 2014 2015Total Collisions Ranking County/State** 23 24Fatal Collisions Ranking County/State** 28 22Injury Collisions Ranking County/State** 23 25Driver Licenses 50,361 51,389Vehicle Registrations 60,951 62,400Economic Loss*** $43,891,500 $52,634,000Population Estimates@ 63,100 63,521MV Population Death Rate@@ 19 28.3
Restraint Usage@@@ No Injury Possible Injury
Non-Incapacitating
InjuryIncapacitating
Injury Fatal InjuryTotal
VictimsRestraint Use by Injuries Sustained by OccupantsNone Used 14 27 5 6 4 56Restrained 2,420 356 62 12 7 2,857Child Safety Seat 123 17 1 0 0 141Unknown 85 10 3 0 0 98Injuries Sustained by Children Under Six YearsNone Used 2 2 0 0 0 4Restrained 27 2 0 0 0 29Child Safety Seat 107 15 1 0 0 123Unknown 0 0 0 0 0 0
*Property Damage Only **Ranking of County Compared to Other 45 Counties
***Formula Used to Compute Economic Loss is in Definitions Section @Source - U.S. Census Bureau
@@Motor Vehicle Deaths Per 100,000 Population
@@@Includes Occupants Seated Inside the Passenger Compartment of Automobiles, Vans, and Trucks only

112South Carolina Department of Public Safety
South Carolina Traffic Collision Fact Book 2015
PART V - COUNTIES
LANCASTER COUNTY MOTOR VEHICLE TRAFFIC COLLISIONS
FatalCollision
InjuryCollision
PDO*Collision
TotalCollision
PersonsKilled
PersonsInjured
Total Collisions 15 630 1,160 1,805 15 1,114Collisions by Time of Day12:01am - 3:00am 0 32 60 92 0 693:01am - 6:00am 0 37 42 79 0 606:01am - 9:00am 4 72 158 234 4 1159:01am - Noon 3 90 158 251 3 13112:01pm - 3:00pm 4 101 223 328 4 1703:01pm - 6:00pm 1 138 274 413 1 2396:01pm - 9:00pm 1 93 159 253 1 1789:01pm - Midnight 2 67 86 155 2 152Collisions Investigated by JurisdictionLANCASTER COUNTY SHERIFFS OFFICE 0 8 12 20 0 13LANCASTER POLICE DEPARTMENT 2 140 220 362 2 256HEATH SPRINGS POLICE DEPARTMENT 0 1 0 1 0 1KERSHAW POLICE DEPARTMENT 0 3 13 16 0 4S.C. HIGHWAY PATROL TROOP 1 1 15 37 53 1 21S.C. HIGHWAY PATROL TROOP 2 0 0 1 1 0 0S.C. HIGHWAY PATROL TROOP 4 12 463 877 1,352 12 819Collisions by Route CategoryInterstate 0 0 0 0 0 0US Primary 2 150 353 505 2 264SC Primary 8 198 318 524 8 345Secondary 5 259 421 685 5 470County 0 23 68 91 0 35
Statistics 2014 2015Total Collisions Ranking County/State** 18 17Fatal Collisions Ranking County/State** 16 22Injury Collisions Ranking County/State** 17 17Driver Licenses 64,404 67,240Vehicle Registrations 73,285 76,469Economic Loss*** $66,614,900 $71,960,000Population Estimates@ 83,232 86,026MV Population Death Rate@@ 20.4 17.4
Restraint Usage@@@ No Injury Possible Injury
Non-Incapacitating
InjuryIncapacitating
Injury Fatal InjuryTotal
VictimsRestraint Use by Injuries Sustained by OccupantsNone Used 27 18 8 12 3 68Restrained 3,110 703 191 72 9 4,085Child Safety Seat 135 27 6 0 0 168Unknown 227 11 20 7 0 265Injuries Sustained by Children Under Six YearsNone Used 0 3 0 0 0 3Restrained 43 8 2 0 1 54Child Safety Seat 119 27 6 0 0 152Unknown 3 1 0 0 0 4
*Property Damage Only **Ranking of County Compared to Other 45 Counties
***Formula Used to Compute Economic Loss is in Definitions Section @Source - U.S. Census Bureau
@@Motor Vehicle Deaths Per 100,000 Population
@@@Includes Occupants Seated Inside the Passenger Compartment of Automobiles, Vans, and Trucks only

113South Carolina Department of Public Safety
South Carolina Traffic Collision Fact Book 2015
PART V - COUNTIES
LAURENS COUNTY MOTOR VEHICLE TRAFFIC COLLISIONS
FatalCollision
InjuryCollision
PDO*Collision
TotalCollision
PersonsKilled
PersonsInjured
Total Collisions 20 589 1,054 1,663 22 909Collisions by Time of Day12:01am - 3:00am 3 47 85 135 3 593:01am - 6:00am 1 28 59 88 2 346:01am - 9:00am 3 77 160 240 3 1269:01am - Noon 2 63 104 169 2 9312:01pm - 3:00pm 2 100 177 279 3 1553:01pm - 6:00pm 3 135 249 387 3 2086:01pm - 9:00pm 5 84 123 212 5 1389:01pm - Midnight 1 55 97 153 1 96Collisions Investigated by JurisdictionFOUNTAIN INN POLICE DEPARTMENT 0 0 3 3 0 0LAURENS COUNTY SHERIFFS OFFICE 0 1 1 2 0 2LAURENS POLICE DEPARTMENT 0 84 186 270 0 123CLINTON POLICE DEPARTMENT 0 56 83 139 0 78S.C. HIGHWAY PATROL TROOP 2 20 446 773 1,239 22 704S.C. HIGHWAY PATROL TROOP 3 0 1 3 4 0 1S.C. HIGHWAY PATROL TROOP 7 0 1 1 2 0 1STATE TRANSPORT POLICE 2 0 0 4 4 0 0Collisions by Route CategoryInterstate 5 62 187 254 5 91US Primary 2 153 246 401 2 260SC Primary 5 154 237 396 7 236Secondary 5 173 291 469 5 258County 3 47 93 143 3 64
Statistics 2014 2015Total Collisions Ranking County/State** 19 19Fatal Collisions Ranking County/State** 11 15Injury Collisions Ranking County/State** 18 19Driver Licenses 50,351 50,990Vehicle Registrations 61,386 62,338Economic Loss*** $69,002,800 $72,183,200Population Estimates@ 66,487 66,545MV Population Death Rate@@ 36.1 33.1
Restraint Usage@@@ No Injury Possible Injury
Non-Incapacitating
InjuryIncapacitating
Injury Fatal InjuryTotal
VictimsRestraint Use by Injuries Sustained by OccupantsNone Used 21 17 26 16 5 85Restrained 2,361 528 190 33 9 3,121Child Safety Seat 119 17 4 0 0 140Unknown 210 9 9 3 2 233Injuries Sustained by Children Under Six YearsNone Used 3 0 0 0 0 3Restrained 14 3 1 0 0 18Child Safety Seat 108 17 3 0 0 128Unknown 0 0 0 0 0 0
*Property Damage Only **Ranking of County Compared to Other 45 Counties
***Formula Used to Compute Economic Loss is in Definitions Section @Source - U.S. Census Bureau
@@Motor Vehicle Deaths Per 100,000 Population
@@@Includes Occupants Seated Inside the Passenger Compartment of Automobiles, Vans, and Trucks only

114South Carolina Department of Public Safety
South Carolina Traffic Collision Fact Book 2015
PART V - COUNTIES
LEE COUNTY MOTOR VEHICLE TRAFFIC COLLISIONS
FatalCollision
InjuryCollision
PDO*Collision
TotalCollision
PersonsKilled
PersonsInjured
Total Collisions 8 149 242 399 8 240Collisions by Time of Day12:01am - 3:00am 2 15 27 44 2 333:01am - 6:00am 1 7 24 32 1 106:01am - 9:00am 0 12 40 52 0 199:01am - Noon 1 17 21 39 1 2212:01pm - 3:00pm 0 19 31 50 0 233:01pm - 6:00pm 1 32 46 79 1 526:01pm - 9:00pm 0 21 23 44 0 389:01pm - Midnight 3 26 30 59 3 43Collisions Investigated by JurisdictionBISHOPVILLE POLICE DEPARTMENT 0 14 16 30 0 28S.C. HIGHWAY PATROL TROOP 1 8 135 225 368 8 212S.C. HIGHWAY PATROL TROOP 5 0 0 1 1 0 0Collisions by Route CategoryInterstate 1 21 59 81 1 27US Primary 2 38 51 91 2 69SC Primary 1 24 47 72 1 39Secondary 4 66 84 154 4 105County 0 0 1 1 0 0
Statistics 2014 2015Total Collisions Ranking County/State** 38 38Fatal Collisions Ranking County/State** 34 32Injury Collisions Ranking County/State** 43 38Driver Licenses 12,358 12,455Vehicle Registrations 15,200 15,399Economic Loss*** $16,014,200 $21,473,800Population Estimates@ 18,362 17,865MV Population Death Rate@@ 32.7 44.8
Restraint Usage@@@ No Injury Possible Injury
Non-Incapacitating
InjuryIncapacitating
Injury Fatal InjuryTotal
VictimsRestraint Use by Injuries Sustained by OccupantsNone Used 11 12 5 0 5 33Restrained 530 158 30 7 3 728Child Safety Seat 18 8 0 0 0 26Unknown 46 5 0 2 0 53Injuries Sustained by Children Under Six YearsNone Used 4 1 0 0 1 6Restrained 5 1 0 0 0 6Child Safety Seat 16 7 0 0 0 23Unknown 0 0 0 0 0 0
*Property Damage Only **Ranking of County Compared to Other 45 Counties
***Formula Used to Compute Economic Loss is in Definitions Section @Source - U.S. Census Bureau
@@Motor Vehicle Deaths Per 100,000 Population
@@@Includes Occupants Seated Inside the Passenger Compartment of Automobiles, Vans, and Trucks only

115South Carolina Department of Public Safety
South Carolina Traffic Collision Fact Book 2015
PART V - COUNTIES
LEXINGTON COUNTY MOTOR VEHICLE TRAFFIC COLLISIONS
FatalCollision
InjuryCollision
PDO*Collision
TotalCollision
PersonsKilled
PersonsInjured
Total Collisions 40 2,070 5,791 7,901 46 3,211Collisions by Time of Day12:01am - 3:00am 8 79 169 256 8 1113:01am - 6:00am 5 104 166 275 5 1506:01am - 9:00am 3 280 884 1,167 3 4019:01am - Noon 2 247 694 943 2 38212:01pm - 3:00pm 0 358 1,157 1,515 0 5563:01pm - 6:00pm 3 517 1,608 2,128 6 8066:01pm - 9:00pm 9 307 828 1,144 11 5199:01pm - Midnight 10 178 285 473 11 286Collisions Investigated by JurisdictionLEXINGTON COUNTY SHERIFFS OFFICE 1 58 127 186 1 83BATESBURG POLICE DEPARTMENT 1 50 73 124 1 80CAYCE POLICE DEPARTMENT 2 127 316 445 2 215LEESVILLE POLICE DEPARTMENT 0 1 0 1 0 2LEXINGTON POLICE DEPARTMENT 0 183 698 881 0 266WEST COLUMBIA POLICE DEPARTMENT 1 128 369 498 1 184CHAPIN POLICE DEPARTMENT 0 9 41 50 0 13IRMO POLICE DEPARTMENT 1 35 113 149 2 48PELION POLICE DEPARTMENT 0 1 7 8 0 3PINE RIDGE POLICE DEPARTMENT 0 5 16 21 0 8SOUTH CONGAREE POLICE DEPARTMENT 0 17 22 39 0 30SPRINGDALE POLICE DEPARTMENT 0 37 85 122 0 57SWANSEA POLICE DEPARTMENT 0 3 9 12 0 5COLUMBIA METROPOLITAN AIRPORT POLICE DEPARTMENT 0 1 0 1 0 1GASTON POLICE DEPARTMENT 1 7 15 23 1 13COLUMBIA POLICE DEPARTMENT 0 47 146 193 0 84S.C. HIGHWAY PATROL TROOP 8 - TARGET ZERO 0 1 5 6 0 1S.C. HIGHWAY PATROL TROOP 1-7 33 1,358 3,741 5,132 38 2,114STATE TRANSPORT POLICE 1 0 2 8 10 0 4Collisions by Route CategoryInterstate 6 304 1,299 1,609 6 495US Primary 11 550 1,550 2,111 14 870SC Primary 6 363 785 1,154 7 557Secondary 14 752 1,813 2,579 16 1,137County 3 101 344 448 3 152
Statistics 2014 2015Total Collisions Ranking County/State** 6 6Fatal Collisions Ranking County/State** 8 6Injury Collisions Ranking County/State** 5 6Driver Licenses 214,558 219,214Vehicle Registrations 260,459 265,020Economic Loss*** $195,584,000 $229,467,600Population Estimates@ 277,439 281,555MV Population Death Rate@@ 13 16.3
Restraint Usage@@@ No Injury Possible Injury
Non-Incapacitating
InjuryIncapacitating
Injury Fatal InjuryTotal
VictimsRestraint Use by Injuries Sustained by OccupantsNone Used 66 70 40 16 19 211Restrained 15,545 2,229 367 76 15 18,232Child Safety Seat 652 122 8 1 0 783Unknown 920 55 12 7 1 995Injuries Sustained by Children Under Six YearsNone Used 4 3 0 1 0 8Restrained 98 18 2 0 0 118Child Safety Seat 557 106 6 1 0 670Unknown 14 0 0 0 0 14

116South Carolina Department of Public Safety
South Carolina Traffic Collision Fact Book 2015
PART V - COUNTIES
MCCORMICK COUNTY MOTOR VEHICLE TRAFFIC COLLISIONS
FatalCollision
InjuryCollision
PDO*Collision
TotalCollision
PersonsKilled
PersonsInjured
Total Collisions 3 58 88 149 3 91Collisions by Time of Day12:01am - 3:00am 0 4 9 13 0 63:01am - 6:00am 0 2 4 6 0 36:01am - 9:00am 1 9 15 25 1 99:01am - Noon 0 7 13 20 0 912:01pm - 3:00pm 2 5 11 18 2 73:01pm - 6:00pm 0 13 18 31 0 246:01pm - 9:00pm 0 8 11 19 0 109:01pm - Midnight 0 10 7 17 0 23Collisions Investigated by JurisdictionMCCORMICK POLICE DEPARTMENT 0 8 17 25 0 10S.C. HIGHWAY PATROL TROOP 2 3 44 59 106 3 72S.C. HIGHWAY PATROL TROOP 3 0 6 12 18 0 9Collisions by Route CategoryInterstate 0 0 0 0 0 0US Primary 0 16 25 41 0 22SC Primary 3 12 23 38 3 21Secondary 0 24 22 46 0 39County 0 6 18 24 0 9
Statistics 2014 2015Total Collisions Ranking County/State** 46 45Fatal Collisions Ranking County/State** 45 44Injury Collisions Ranking County/State** 44 46Driver Licenses 7,184 7,283Vehicle Registrations 9,349 9,416Economic Loss*** $9,087,300 $8,156,800Population Estimates@ 9,829 9,702MV Population Death Rate@@ 40.7 30.9
Restraint Usage@@@ No Injury Possible Injury
Non-Incapacitating
InjuryIncapacitating
Injury Fatal InjuryTotal
VictimsRestraint Use by Injuries Sustained by OccupantsNone Used 3 3 3 1 1 11Restrained 166 59 13 3 1 242Child Safety Seat 0 0 0 0 0 0Unknown 29 3 0 2 0 34Injuries Sustained by Children Under Six YearsNone Used 0 0 1 0 0 1Restrained 0 0 0 0 0 0Child Safety Seat 0 0 0 0 0 0Unknown 0 0 0 0 0 0
*Property Damage Only **Ranking of County Compared to Other 45 Counties
***Formula Used to Compute Economic Loss is in Definitions Section @Source - U.S. Census Bureau
@@Motor Vehicle Deaths Per 100,000 Population
@@@Includes Occupants Seated Inside the Passenger Compartment of Automobiles, Vans, and Trucks only
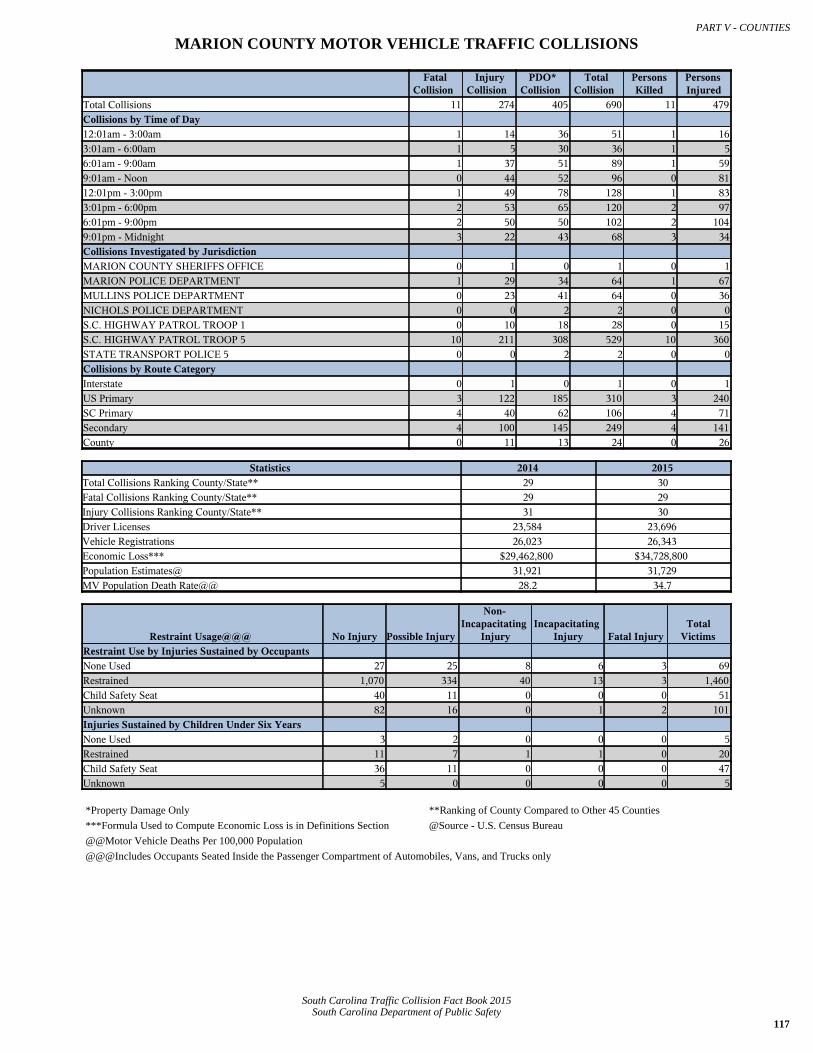
117South Carolina Department of Public Safety
South Carolina Traffic Collision Fact Book 2015
PART V - COUNTIES
MARION COUNTY MOTOR VEHICLE TRAFFIC COLLISIONS
FatalCollision
InjuryCollision
PDO*Collision
TotalCollision
PersonsKilled
PersonsInjured
Total Collisions 11 274 405 690 11 479Collisions by Time of Day12:01am - 3:00am 1 14 36 51 1 163:01am - 6:00am 1 5 30 36 1 56:01am - 9:00am 1 37 51 89 1 599:01am - Noon 0 44 52 96 0 8112:01pm - 3:00pm 1 49 78 128 1 833:01pm - 6:00pm 2 53 65 120 2 976:01pm - 9:00pm 2 50 50 102 2 1049:01pm - Midnight 3 22 43 68 3 34Collisions Investigated by JurisdictionMARION COUNTY SHERIFFS OFFICE 0 1 0 1 0 1MARION POLICE DEPARTMENT 1 29 34 64 1 67MULLINS POLICE DEPARTMENT 0 23 41 64 0 36NICHOLS POLICE DEPARTMENT 0 0 2 2 0 0S.C. HIGHWAY PATROL TROOP 1 0 10 18 28 0 15S.C. HIGHWAY PATROL TROOP 5 10 211 308 529 10 360STATE TRANSPORT POLICE 5 0 0 2 2 0 0Collisions by Route CategoryInterstate 0 1 0 1 0 1US Primary 3 122 185 310 3 240SC Primary 4 40 62 106 4 71Secondary 4 100 145 249 4 141County 0 11 13 24 0 26
Statistics 2014 2015Total Collisions Ranking County/State** 29 30Fatal Collisions Ranking County/State** 29 29Injury Collisions Ranking County/State** 31 30Driver Licenses 23,584 23,696Vehicle Registrations 26,023 26,343Economic Loss*** $29,462,800 $34,728,800Population Estimates@ 31,921 31,729MV Population Death Rate@@ 28.2 34.7
Restraint Usage@@@ No Injury Possible Injury
Non-Incapacitating
InjuryIncapacitating
Injury Fatal InjuryTotal
VictimsRestraint Use by Injuries Sustained by OccupantsNone Used 27 25 8 6 3 69Restrained 1,070 334 40 13 3 1,460Child Safety Seat 40 11 0 0 0 51Unknown 82 16 0 1 2 101Injuries Sustained by Children Under Six YearsNone Used 3 2 0 0 0 5Restrained 11 7 1 1 0 20Child Safety Seat 36 11 0 0 0 47Unknown 5 0 0 0 0 5
*Property Damage Only **Ranking of County Compared to Other 45 Counties
***Formula Used to Compute Economic Loss is in Definitions Section @Source - U.S. Census Bureau
@@Motor Vehicle Deaths Per 100,000 Population
@@@Includes Occupants Seated Inside the Passenger Compartment of Automobiles, Vans, and Trucks only

118South Carolina Department of Public Safety
South Carolina Traffic Collision Fact Book 2015
PART V - COUNTIES
MARLBORO COUNTY MOTOR VEHICLE TRAFFIC COLLISIONS
FatalCollision
InjuryCollision
PDO*Collision
TotalCollision
PersonsKilled
PersonsInjured
Total Collisions 9 223 318 550 9 387Collisions by Time of Day12:01am - 3:00am 1 15 21 37 1 203:01am - 6:00am 2 9 24 35 2 116:01am - 9:00am 0 25 48 73 0 389:01am - Noon 0 24 31 55 0 3712:01pm - 3:00pm 1 46 55 102 1 833:01pm - 6:00pm 3 43 63 109 3 816:01pm - 9:00pm 2 42 47 91 2 799:01pm - Midnight 0 19 29 48 0 38Collisions Investigated by JurisdictionMARLBORO COUNTY SHERIFFS OFFICE 0 1 1 2 0 2BENNETTSVILLE POLICE DEPARTMENT 0 50 62 112 0 86MCCOLL POLICE DEPARTMENT 0 8 10 18 0 16CLIO POLICE DEPARTMENT 0 1 3 4 0 1S.C. HIGHWAY PATROL TROOP 5 9 163 242 414 9 282Collisions by Route CategoryInterstate 0 0 0 0 0 0US Primary 4 36 54 94 4 77SC Primary 3 98 137 238 3 178Secondary 2 86 117 205 2 127County 0 3 10 13 0 5
Statistics 2014 2015Total Collisions Ranking County/State** 37 37Fatal Collisions Ranking County/State** 21 31Injury Collisions Ranking County/State** 35 34Driver Licenses 19,844 19,783Vehicle Registrations 20,921 21,282Economic Loss*** $30,639,800 $27,589,000Population Estimates@ 27,909 27,541MV Population Death Rate@@ 46.6 32.7
Restraint Usage@@@ No Injury Possible Injury
Non-Incapacitating
InjuryIncapacitating
Injury Fatal InjuryTotal
VictimsRestraint Use by Injuries Sustained by OccupantsNone Used 11 6 6 0 4 27Restrained 763 229 97 10 2 1,101Child Safety Seat 38 9 4 0 0 51Unknown 42 6 2 0 0 50Injuries Sustained by Children Under Six YearsNone Used 1 0 0 0 0 1Restrained 2 2 0 0 0 4Child Safety Seat 34 9 4 0 0 47Unknown 0 0 0 0 0 0
*Property Damage Only **Ranking of County Compared to Other 45 Counties
***Formula Used to Compute Economic Loss is in Definitions Section @Source - U.S. Census Bureau
@@Motor Vehicle Deaths Per 100,000 Population
@@@Includes Occupants Seated Inside the Passenger Compartment of Automobiles, Vans, and Trucks only

119South Carolina Department of Public Safety
South Carolina Traffic Collision Fact Book 2015
PART V - COUNTIES
NEWBERRY COUNTY MOTOR VEHICLE TRAFFIC COLLISIONS
FatalCollision
InjuryCollision
PDO*Collision
TotalCollision
PersonsKilled
PersonsInjured
Total Collisions 7 301 660 968 7 465Collisions by Time of Day12:01am - 3:00am 0 18 38 56 0 213:01am - 6:00am 2 13 50 65 2 146:01am - 9:00am 1 35 75 111 1 559:01am - Noon 3 36 94 133 3 5612:01pm - 3:00pm 0 62 117 179 0 1023:01pm - 6:00pm 1 71 152 224 1 1196:01pm - 9:00pm 0 36 86 122 0 549:01pm - Midnight 0 30 48 78 0 44Collisions Investigated by JurisdictionNEWBERRY COUNTY SHERIFFS OFFICE 0 0 1 1 0 0NEWBERRY POLICE DEPARTMENT 1 65 130 196 1 108WHITMIRE POLICE DEPARTMENT 0 6 12 18 0 7PROSPERITY POLICE DEPARTMENT 0 4 6 10 0 4S.C. HIGHWAY PATROL TROOP 1 0 0 1 1 0 0S.C. HIGHWAY PATROL TROOP 2 6 225 506 737 6 345S.C. HIGHWAY PATROL TROOP 4 0 0 2 2 0 0STATE TRANSPORT POLICE 2 0 1 2 3 0 1Collisions by Route CategoryInterstate 0 47 224 271 0 76US Primary 1 45 85 131 1 69SC Primary 2 92 136 230 2 148Secondary 4 111 190 305 4 160County 0 6 25 31 0 12
Statistics 2014 2015Total Collisions Ranking County/State** 27 27Fatal Collisions Ranking County/State** 40 35Injury Collisions Ranking County/State** 26 28Driver Licenses 28,119 28,527Vehicle Registrations 36,937 37,704Economic Loss*** $25,318,500 $31,335,400Population Estimates@ 37,725 37,896MV Population Death Rate@@ 10.6 18.5
Restraint Usage@@@ No Injury Possible Injury
Non-Incapacitating
InjuryIncapacitating
Injury Fatal InjuryTotal
VictimsRestraint Use by Injuries Sustained by OccupantsNone Used 12 5 8 2 3 30Restrained 1,620 271 116 19 2 2,028Child Safety Seat 44 4 2 0 0 50Unknown 62 3 5 3 1 74Injuries Sustained by Children Under Six YearsNone Used 0 0 0 0 0 0Restrained 12 3 0 0 0 15Child Safety Seat 40 4 2 0 0 46Unknown 0 0 0 0 0 0
*Property Damage Only **Ranking of County Compared to Other 45 Counties
***Formula Used to Compute Economic Loss is in Definitions Section @Source - U.S. Census Bureau
@@Motor Vehicle Deaths Per 100,000 Population
@@@Includes Occupants Seated Inside the Passenger Compartment of Automobiles, Vans, and Trucks only

120South Carolina Department of Public Safety
South Carolina Traffic Collision Fact Book 2015
PART V - COUNTIES
OCONEE COUNTY MOTOR VEHICLE TRAFFIC COLLISIONS
FatalCollision
InjuryCollision
PDO*Collision
TotalCollision
PersonsKilled
PersonsInjured
Total Collisions 13 352 1,046 1,411 13 498Collisions by Time of Day12:01am - 3:00am 0 18 47 65 0 253:01am - 6:00am 2 15 31 48 2 186:01am - 9:00am 1 42 135 178 1 589:01am - Noon 2 49 156 207 2 8212:01pm - 3:00pm 3 74 216 293 3 1003:01pm - 6:00pm 2 85 258 345 2 1196:01pm - 9:00pm 2 44 134 180 2 669:01pm - Midnight 1 25 69 95 1 30Collisions Investigated by JurisdictionSENECA POLICE DEPARTMENT 0 40 206 246 0 54WALHALLA POLICE DEPARTMENT 0 14 52 66 0 18WESTMINSTER POLICE DEPARTMENT 0 9 29 38 0 13WEST UNION POLICE DEPARTMENT 0 0 9 9 0 0S.C. HIGHWAY PATROL TROOP 3 13 289 750 1,052 13 413Collisions by Route CategoryInterstate 1 8 38 47 1 16US Primary 0 81 273 354 0 110SC Primary 9 100 314 423 9 161Secondary 3 136 344 483 3 179County 0 27 77 104 0 32
Statistics 2014 2015Total Collisions Ranking County/State** 24 22Fatal Collisions Ranking County/State** 23 27Injury Collisions Ranking County/State** 25 24Driver Licenses 60,531 61,539Vehicle Registrations 75,292 76,401Economic Loss*** $43,468,400 $46,726,800Population Estimates@ 75,221 75,744MV Population Death Rate@@ 17.3 17.2
Restraint Usage@@@ No Injury Possible Injury
Non-Incapacitating
InjuryIncapacitating
Injury Fatal InjuryTotal
VictimsRestraint Use by Injuries Sustained by OccupantsNone Used 22 12 6 9 4 53Restrained 2,504 302 61 31 7 2,905Child Safety Seat 91 8 2 1 0 102Unknown 105 5 1 0 0 111Injuries Sustained by Children Under Six YearsNone Used 1 1 0 0 0 2Restrained 13 3 0 1 0 17Child Safety Seat 84 7 2 0 0 93Unknown 0 0 0 0 0 0
*Property Damage Only **Ranking of County Compared to Other 45 Counties
***Formula Used to Compute Economic Loss is in Definitions Section @Source - U.S. Census Bureau
@@Motor Vehicle Deaths Per 100,000 Population
@@@Includes Occupants Seated Inside the Passenger Compartment of Automobiles, Vans, and Trucks only

121South Carolina Department of Public Safety
South Carolina Traffic Collision Fact Book 2015
PART V - COUNTIES
ORANGEBURG COUNTY MOTOR VEHICLE TRAFFIC COLLISIONS
FatalCollision
InjuryCollision
PDO*Collision
TotalCollision
PersonsKilled
PersonsInjured
Total Collisions 31 951 1,597 2,579 31 1,589Collisions by Time of Day12:01am - 3:00am 3 46 104 153 3 963:01am - 6:00am 5 53 109 167 5 716:01am - 9:00am 0 106 183 289 0 1709:01am - Noon 3 129 205 337 3 20212:01pm - 3:00pm 8 162 313 483 8 2663:01pm - 6:00pm 1 221 324 546 1 3676:01pm - 9:00pm 3 136 234 373 3 2369:01pm - Midnight 8 98 125 231 8 181Collisions Investigated by JurisdictionORANGEBURG COUNTY SHERIFFS OFFICE 0 2 2 4 0 2ORANGEBURG POLICE DEPARTMENT 1 221 281 503 1 365BOWMAN POLICE DEPARTMENT 0 0 1 1 0 0EUTAWVILLE POLICE DEPARTMENT 0 1 2 3 0 1HOLLY HILL POLICE DEPARTMENT 0 6 12 18 0 11NORTH POLICE DEPARTMENT 0 1 2 3 0 1SANTEE POLICE DEPARTMENT 0 6 23 29 0 9SOUTH CAROLINA STATE UNIVERSITY POLICE DEPARTMENT 0 0 1 1 0 0S.C. HIGHWAY PATROL TROOP 2 0 0 3 3 0 0S.C. HIGHWAY PATROL TROOP 6 0 0 1 1 0 0S.C. HIGHWAY PATROL TROOP 7 30 711 1,263 2,004 30 1,196S.C. HIGHWAY PATROL TROOP 8 - TARGET ZERO 0 3 4 7 0 4STATE TRANSPORT POLICE 6 0 0 2 2 0 0Collisions by Route CategoryInterstate 4 103 360 467 4 156US Primary 7 405 547 959 7 690SC Primary 8 144 236 388 8 258Secondary 11 268 398 677 11 444County 1 31 56 88 1 41
Statistics 2014 2015Total Collisions Ranking County/State** 15 15Fatal Collisions Ranking County/State** 9 8Injury Collisions Ranking County/State** 13 13Driver Licenses 63,699 63,767Vehicle Registrations 73,047 73,634Economic Loss*** $97,675,300 $111,191,400Population Estimates@ 89,886 88,869MV Population Death Rate@@ 31.2 34.9
Restraint Usage@@@ No Injury Possible Injury
Non-Incapacitating
InjuryIncapacitating
Injury Fatal InjuryTotal
VictimsRestraint Use by Injuries Sustained by OccupantsNone Used 53 39 10 6 13 121Restrained 4,298 1,171 143 36 10 5,658Child Safety Seat 183 47 2 1 0 233Unknown 363 59 3 4 1 430Injuries Sustained by Children Under Six YearsNone Used 3 3 0 0 0 6Restrained 42 8 4 0 0 54Child Safety Seat 159 39 2 1 0 201Unknown 2 2 0 0 0 4
*Property Damage Only **Ranking of County Compared to Other 45 Counties
***Formula Used to Compute Economic Loss is in Definitions Section @Source - U.S. Census Bureau
@@Motor Vehicle Deaths Per 100,000 Population
@@@Includes Occupants Seated Inside the Passenger Compartment of Automobiles, Vans, and Trucks only

122South Carolina Department of Public Safety
South Carolina Traffic Collision Fact Book 2015
PART V - COUNTIES
PICKENS COUNTY MOTOR VEHICLE TRAFFIC COLLISIONS
FatalCollision
InjuryCollision
PDO*Collision
TotalCollision
PersonsKilled
PersonsInjured
Total Collisions 15 650 2,069 2,734 16 949Collisions by Time of Day12:01am - 3:00am 2 34 82 118 2 403:01am - 6:00am 0 22 50 72 0 256:01am - 9:00am 1 76 246 323 2 1139:01am - Noon 1 71 261 333 1 11012:01pm - 3:00pm 1 120 448 569 1 1723:01pm - 6:00pm 4 169 543 716 4 2476:01pm - 9:00pm 2 105 307 414 2 1639:01pm - Midnight 4 53 132 189 4 79Collisions Investigated by JurisdictionPICKENS COUNTY SHERIFFS OFFICE 0 1 4 5 0 1CENTRAL POLICE DEPARTMENT 0 13 45 58 0 22CLEMSON POLICE DEPARTMENT 0 65 343 408 0 80EASLEY POLICE DEPARTMENT 1 161 569 731 1 238LIBERTY POLICE DEPARTMENT 0 17 41 58 0 22PICKENS POLICE DEPARTMENT 0 29 112 141 0 43CLEMSON UNIVERSITY POLICE DEPARTMENT 0 14 97 111 0 21NORRIS POLICE DEPARTMENT 0 0 1 1 0 0S.C. HIGHWAY PATROL TROOP 1 0 1 0 1 0 1S.C. HIGHWAY PATROL TROOP 3 14 349 857 1,220 15 521Collisions by Route CategoryInterstate 0 0 0 0 0 0US Primary 1 175 636 812 1 271SC Primary 6 191 644 841 7 280Secondary 5 197 506 708 5 281County 3 87 283 373 3 117
Statistics 2014 2015Total Collisions Ranking County/State** 14 14Fatal Collisions Ranking County/State** 21 22Injury Collisions Ranking County/State** 16 16Driver Licenses 89,757 91,596Vehicle Registrations 102,852 104,475Economic Loss*** $62,290,600 $74,584,000Population Estimates@ 120,451 121,493MV Population Death Rate@@ 10.8 13.2
Restraint Usage@@@ No Injury Possible Injury
Non-Incapacitating
InjuryIncapacitating
Injury Fatal InjuryTotal
VictimsRestraint Use by Injuries Sustained by OccupantsNone Used 108 38 16 7 3 172Restrained 4,564 572 130 37 5 5,308Child Safety Seat 147 22 1 1 0 171Unknown 304 29 6 0 0 339Injuries Sustained by Children Under Six YearsNone Used 0 1 0 0 0 1Restrained 19 3 0 1 0 23Child Safety Seat 135 19 1 0 0 155Unknown 0 0 0 0 0 0
*Property Damage Only **Ranking of County Compared to Other 45 Counties
***Formula Used to Compute Economic Loss is in Definitions Section @Source - U.S. Census Bureau
@@Motor Vehicle Deaths Per 100,000 Population
@@@Includes Occupants Seated Inside the Passenger Compartment of Automobiles, Vans, and Trucks only

123South Carolina Department of Public Safety
South Carolina Traffic Collision Fact Book 2015
PART V - COUNTIES
RICHLAND COUNTY MOTOR VEHICLE TRAFFIC COLLISIONS
FatalCollision
InjuryCollision
PDO*Collision
TotalCollision
PersonsKilled
PersonsInjured
Total Collisions 43 3,304 9,495 12,842 45 5,169Collisions by Time of Day12:01am - 3:00am 5 213 342 560 6 3493:01am - 6:00am 4 94 292 390 5 1146:01am - 9:00am 2 434 1,360 1,796 2 6229:01am - Noon 2 371 1,185 1,558 2 56712:01pm - 3:00pm 2 564 1,822 2,388 2 8843:01pm - 6:00pm 9 813 2,496 3,318 9 1,3026:01pm - 9:00pm 9 529 1,378 1,916 9 8719:01pm - Midnight 10 286 620 916 10 460Collisions Investigated by JurisdictionLEXINGTON COUNTY SHERIFFS OFFICE 0 1 7 8 0 2CAYCE POLICE DEPARTMENT 0 0 1 1 0 0IRMO POLICE DEPARTMENT 0 58 104 162 0 73RICHLAND COUNTY SHERIFFS OFFICE 0 9 12 21 0 11COLUMBIA POLICE DEPARTMENT 16 1,318 3,771 5,105 17 2,100EASTOVER POLICE DEPARTMENT 0 1 0 1 0 2FOREST ACRES POLICE DEPARTMENT 0 89 219 308 0 135MIDLANDS CENTER POLICE DEPARTMENT 0 0 1 1 0 0DEPARTMENT OF YOUTH SERVICES 0 1 3 4 0 1MIDLANDS TECHNICAL COLLEGE 0 0 1 1 0 0EMPLOYMENT SECURITH COMMISSION 0 0 1 1 0 0S.C. HIGHWAY PATROL TROOP 1 27 1,818 5,351 7,196 28 2,829S.C. HIGHWAY PATROL TROOP 3 0 4 4 8 0 6S.C. HIGHWAY PATROL TROOP 4 0 0 3 3 0 0S.C. HIGHWAY PATROL TROOP 5 0 0 1 1 0 0S.C. HIGHWAY PATROL TROOP 8 - TARGET ZERO 0 2 5 7 0 5STATE TRANSPORT POLICE 1 0 3 11 14 0 5Collisions by Route CategoryInterstate 6 391 1,500 1,897 6 575US Primary 13 1,010 2,703 3,726 14 1,592SC Primary 9 701 1,651 2,361 10 1,139Secondary 15 1,004 2,671 3,690 15 1,573County 0 198 970 1,168 0 290
Statistics 2014 2015Total Collisions Ranking County/State** 3 3Fatal Collisions Ranking County/State** 5 5Injury Collisions Ranking County/State** 3 3Driver Licenses 278,858 283,671Vehicle Registrations 321,833 325,826Economic Loss*** $290,537,500 $327,244,800Population Estimates@ 401,337 406,842MV Population Death Rate@@ 10 11.1
Restraint Usage@@@ No Injury Possible Injury
Non-Incapacitating
InjuryIncapacitating
Injury Fatal InjuryTotal
VictimsRestraint Use by Injuries Sustained by OccupantsNone Used 150 66 37 28 16 297Restrained 25,548 3,569 702 97 9 29,925Child Safety Seat 983 156 7 2 0 1,148Unknown 1,670 129 26 6 0 1,831Injuries Sustained by Children Under Six YearsNone Used 11 4 1 0 0 16Restrained 228 28 0 2 0 258Child Safety Seat 869 142 6 2 0 1,019Unknown 5 2 0 0 0 7

124South Carolina Department of Public Safety
South Carolina Traffic Collision Fact Book 2015
PART V - COUNTIES
SALUDA COUNTY MOTOR VEHICLE TRAFFIC COLLISIONS
FatalCollision
InjuryCollision
PDO*Collision
TotalCollision
PersonsKilled
PersonsInjured
Total Collisions 0 113 199 312 0 190Collisions by Time of Day12:01am - 3:00am 0 5 14 19 0 93:01am - 6:00am 0 6 15 21 0 96:01am - 9:00am 0 22 25 47 0 319:01am - Noon 0 17 27 44 0 2512:01pm - 3:00pm 0 15 31 46 0 253:01pm - 6:00pm 0 21 38 59 0 436:01pm - 9:00pm 0 17 29 46 0 299:01pm - Midnight 0 10 20 30 0 19Collisions Investigated by JurisdictionBATESBURG POLICE DEPARTMENT 0 3 2 5 0 6SALUDA COUNTY SHERIFFS OFFICE 0 1 0 1 0 1SALUDA POLICE DEPARTMENT 0 17 45 62 0 28S.C. HIGHWAY PATROL TROOP 1 0 0 2 2 0 0S.C. HIGHWAY PATROL TROOP 2 0 92 148 240 0 155S.C. HIGHWAY PATROL TROOP 3 0 0 2 2 0 0Collisions by Route CategoryInterstate 0 0 0 0 0 0US Primary 0 30 69 99 0 50SC Primary 0 35 54 89 0 63Secondary 0 40 63 103 0 63County 0 8 13 21 0 14
Statistics 2014 2015Total Collisions Ranking County/State** 42 43Fatal Collisions Ranking County/State** 34 46Injury Collisions Ranking County/State** 40 43Driver Licenses 13,786 13,983Vehicle Registrations 19,733 20,072Economic Loss*** $16,529,700 $7,824,600Population Estimates@ 20,098 20,171MV Population Death Rate@@ 29.9 0
Restraint Usage@@@ No Injury Possible Injury
Non-Incapacitating
InjuryIncapacitating
Injury Fatal InjuryTotal
VictimsRestraint Use by Injuries Sustained by OccupantsNone Used 11 6 4 1 0 22Restrained 418 115 36 15 0 584Child Safety Seat 19 8 0 0 0 27Unknown 35 1 1 0 0 37Injuries Sustained by Children Under Six YearsNone Used 0 1 0 0 0 1Restrained 5 3 0 0 0 8Child Safety Seat 19 8 0 0 0 27Unknown 0 0 0 0 0 0
*Property Damage Only **Ranking of County Compared to Other 45 Counties
***Formula Used to Compute Economic Loss is in Definitions Section @Source - U.S. Census Bureau
@@Motor Vehicle Deaths Per 100,000 Population
@@@Includes Occupants Seated Inside the Passenger Compartment of Automobiles, Vans, and Trucks only

125South Carolina Department of Public Safety
South Carolina Traffic Collision Fact Book 2015
PART V - COUNTIES
SPARTANBURG COUNTY MOTOR VEHICLE TRAFFIC COLLISIONS
FatalCollision
InjuryCollision
PDO*Collision
TotalCollision
PersonsKilled
PersonsInjured
Total Collisions 61 2,361 6,489 8,911 75 3,509Collisions by Time of Day12:01am - 3:00am 7 107 239 353 10 1753:01am - 6:00am 4 83 220 307 4 1086:01am - 9:00am 5 307 925 1,237 7 4219:01am - Noon 7 272 743 1,022 7 40212:01pm - 3:00pm 8 398 1,266 1,672 9 5843:01pm - 6:00pm 8 604 1,721 2,333 8 9306:01pm - 9:00pm 10 381 939 1,330 10 5789:01pm - Midnight 12 209 436 657 20 311Collisions Investigated by JurisdictionGREENVILLE COUNTY SHERIFFS OFFICE 1 0 0 1 1 0GREER POLICE DEPARTMENT 2 83 165 250 2 117SPARTANBURG COUNTY SHERIFFS OFFICE 0 22 35 57 0 35SPARTANBURG PUBLIC SAFETY DEPARTMENT 3 444 1,414 1,861 3 649WOODRUFF POLICE DEPARTMENT 0 11 41 52 0 22DUNCAN POLICE DEPARTMENT 0 47 165 212 0 74CAMPOBELLO POLICE DEPARTMENT 1 13 17 31 1 21CHESNEE POLICE DEPARTMENT 0 5 13 18 0 8COWPENS POLICE DEPARTMENT 0 10 21 31 0 19INMAN POLICE DEPARTMENT 0 18 60 78 0 25LANDRUM POLICE DEPARTMENT 0 15 38 53 0 22LYMAN POLICE DEPARTMENT 0 49 91 140 0 89PACOLET POLICE DEPARTMENT 0 12 10 22 0 14WELLFORD POLICE DEPARTMENT 0 15 32 47 0 21USC - SPARTANBURG CAMPUS POLICE DEPARTMENT 0 0 1 1 0 0GREENVILLE/SPARTANBURG AIRPORT POLICE DEPARTMENT 0 14 28 42 0 18S.C. HIGHWAY PATROL TROOP 2 0 0 1 1 0 0S.C. HIGHWAY PATROL TROOP 3 54 1,602 4,357 6,013 68 2,372S.C. HIGHWAY PATROL TROOP 8 - TARGET ZERO 0 1 0 1 0 3Collisions by Route CategoryInterstate 14 297 1,019 1,330 25 456US Primary 7 480 1,282 1,769 7 739SC Primary 15 704 1,862 2,581 15 1,069Secondary 15 564 1,488 2,067 15 812County 10 316 838 1,164 13 433
Statistics 2014 2015Total Collisions Ranking County/State** 5 5Fatal Collisions Ranking County/State** 6 4Injury Collisions Ranking County/State** 6 5Driver Licenses 222,796 227,951Vehicle Registrations 259,017 265,549Economic Loss*** $202,990,600 $288,928,600Population Estimates@ 293,449 297,088MV Population Death Rate@@ 13.3 25.2
Restraint Usage@@@ No Injury Possible Injury
Non-Incapacitating
InjuryIncapacitating
Injury Fatal InjuryTotal
VictimsRestraint Use by Injuries Sustained by OccupantsNone Used 101 76 48 27 27 279Restrained 15,636 2,335 435 75 21 18,502Child Safety Seat 641 75 6 1 1 724Unknown 1,629 145 15 7 8 1,804Injuries Sustained by Children Under Six YearsNone Used 7 2 4 0 0 13Restrained 116 26 4 1 1 148Child Safety Seat 573 66 5 1 1 646Unknown 14 1 0 0 0 15

126South Carolina Department of Public Safety
South Carolina Traffic Collision Fact Book 2015
PART V - COUNTIES
SUMTER COUNTY MOTOR VEHICLE TRAFFIC COLLISIONS
FatalCollision
InjuryCollision
PDO*Collision
TotalCollision
PersonsKilled
PersonsInjured
Total Collisions 20 890 1,597 2,507 20 1,592Collisions by Time of Day12:01am - 3:00am 2 65 98 165 2 1193:01am - 6:00am 2 28 48 78 2 506:01am - 9:00am 4 85 210 299 4 1409:01am - Noon 0 113 208 321 0 16912:01pm - 3:00pm 2 148 310 460 2 2523:01pm - 6:00pm 2 186 366 554 2 3356:01pm - 9:00pm 5 157 236 398 5 2969:01pm - Midnight 3 108 121 232 3 231Collisions Investigated by JurisdictionSUMTER COUNTY SHERIFFS DEPARTMENT 0 2 2 4 0 3SUMTER POLICE DEPARTMENT 3 389 762 1,154 3 710S.C. HIGHWAY PATROL TROOP 1 17 498 826 1,341 17 877S.C. HIGHWAY PATROL TROOP 3 0 0 1 1 0 0S.C. HIGHWAY PATROL TROOP 5 0 1 4 5 0 2STATE TRANSPORT POLICE 1 0 0 2 2 0 0Collisions by Route CategoryInterstate 1 17 45 63 1 26US Primary 12 331 629 972 12 594SC Primary 1 127 264 392 1 218Secondary 6 396 592 994 6 720County 0 19 67 86 0 34
Statistics 2014 2015Total Collisions Ranking County/State** 16 16Fatal Collisions Ranking County/State** 15 15Injury Collisions Ranking County/State** 14 14Driver Licenses 77,773 78,795Vehicle Registrations 90,319 90,965Economic Loss*** $99,832,600 $93,084,800Population Estimates@ 107,821 107,382MV Population Death Rate@@ 24.1 18.6
Restraint Usage@@@ No Injury Possible Injury
Non-Incapacitating
InjuryIncapacitating
Injury Fatal InjuryTotal
VictimsRestraint Use by Injuries Sustained by OccupantsNone Used 47 38 23 11 10 129Restrained 4,536 1,187 119 23 6 5,871Child Safety Seat 202 46 4 0 0 252Unknown 243 24 7 3 0 277Injuries Sustained by Children Under Six YearsNone Used 2 4 0 0 0 6Restrained 65 11 1 0 0 77Child Safety Seat 189 41 4 0 0 234Unknown 0 0 0 0 0 0
*Property Damage Only **Ranking of County Compared to Other 45 Counties
***Formula Used to Compute Economic Loss is in Definitions Section @Source - U.S. Census Bureau
@@Motor Vehicle Deaths Per 100,000 Population
@@@Includes Occupants Seated Inside the Passenger Compartment of Automobiles, Vans, and Trucks only

127South Carolina Department of Public Safety
South Carolina Traffic Collision Fact Book 2015
PART V - COUNTIES
UNION COUNTY MOTOR VEHICLE TRAFFIC COLLISIONS
FatalCollision
InjuryCollision
PDO*Collision
TotalCollision
PersonsKilled
PersonsInjured
Total Collisions 4 208 342 554 6 326Collisions by Time of Day12:01am - 3:00am 1 13 19 33 3 253:01am - 6:00am 0 9 24 33 0 116:01am - 9:00am 0 23 44 67 0 379:01am - Noon 1 22 36 59 1 2912:01pm - 3:00pm 1 44 70 115 1 683:01pm - 6:00pm 0 48 75 123 0 786:01pm - 9:00pm 1 33 45 79 1 569:01pm - Midnight 0 16 29 45 0 22Collisions Investigated by JurisdictionUNION COUNTY SHERIFFS OFFICE 0 0 1 1 0 0UNION POLICE DEPARTMENT 0 63 138 201 0 110JONESVILLE POLICE DEPARTMENT 0 1 2 3 0 1S.C. HIGHWAY PATROL TROOP 3 0 0 2 2 0 0S.C. HIGHWAY PATROL TROOP 4 4 144 199 347 6 215Collisions by Route CategoryInterstate 0 0 0 0 0 0US Primary 0 41 74 115 0 67SC Primary 4 77 109 190 6 118Secondary 0 85 136 221 0 136County 0 5 23 28 0 5
Statistics 2014 2015Total Collisions Ranking County/State** 36 36Fatal Collisions Ranking County/State** 40 41Injury Collisions Ranking County/State** 35 36Driver Licenses 21,677 21,829Vehicle Registrations 25,436 25,654Economic Loss*** $19,507,200 $22,302,800Population Estimates@ 27,940 27,775MV Population Death Rate@@ 17.9 21.6
Restraint Usage@@@ No Injury Possible Injury
Non-Incapacitating
InjuryIncapacitating
Injury Fatal InjuryTotal
VictimsRestraint Use by Injuries Sustained by OccupantsNone Used 6 13 3 3 6 31Restrained 766 213 39 13 0 1,031Child Safety Seat 26 9 0 0 0 35Unknown 105 13 3 0 0 121Injuries Sustained by Children Under Six YearsNone Used 0 1 0 0 0 1Restrained 9 2 1 0 0 12Child Safety Seat 22 8 0 0 0 30Unknown 0 0 0 0 0 0
*Property Damage Only **Ranking of County Compared to Other 45 Counties
***Formula Used to Compute Economic Loss is in Definitions Section @Source - U.S. Census Bureau
@@Motor Vehicle Deaths Per 100,000 Population
@@@Includes Occupants Seated Inside the Passenger Compartment of Automobiles, Vans, and Trucks only

128South Carolina Department of Public Safety
South Carolina Traffic Collision Fact Book 2015
PART V - COUNTIES
WILLIAMSBURG COUNTY MOTOR VEHICLE TRAFFIC COLLISIONS
FatalCollision
InjuryCollision
PDO*Collision
TotalCollision
PersonsKilled
PersonsInjured
Total Collisions 8 234 411 653 8 368Collisions by Time of Day12:01am - 3:00am 2 15 31 48 2 183:01am - 6:00am 0 18 34 52 0 226:01am - 9:00am 1 29 50 80 1 389:01am - Noon 2 24 50 76 2 3212:01pm - 3:00pm 0 30 58 88 0 493:01pm - 6:00pm 0 48 75 123 0 876:01pm - 9:00pm 1 36 68 105 1 649:01pm - Midnight 2 34 45 81 2 58Collisions Investigated by JurisdictionWILLIAMSBURG COUNTY SHERIFFS OFFICE 0 0 1 1 0 0HEMINGWAY POLICE DEPARTMENT 0 7 23 30 0 13KINGSTREE POLICE DEPARTMENT 0 19 56 75 0 34GREELEYVILLE POLICE DEPARTMENT 0 0 1 1 0 0S.C. HIGHWAY PATROL TROOP 1 0 0 1 1 0 0S.C. HIGHWAY PATROL TROOP 5 8 208 329 545 8 321Collisions by Route CategoryInterstate 0 0 0 0 0 0US Primary 4 36 91 131 4 60SC Primary 1 76 136 213 1 129Secondary 3 112 175 290 3 167County 0 10 9 19 0 12
Statistics 2014 2015Total Collisions Ranking County/State** 32 32Fatal Collisions Ranking County/State** 23 32Injury Collisions Ranking County/State** 33 33Driver Licenses 23,376 23,260Vehicle Registrations 29,441 29,522Economic Loss*** $30,588,300 $27,772,800Population Estimates@ 32,790 32,573MV Population Death Rate@@ 33.5 24.6
Restraint Usage@@@ No Injury Possible Injury
Non-Incapacitating
InjuryIncapacitating
Injury Fatal InjuryTotal
VictimsRestraint Use by Injuries Sustained by OccupantsNone Used 21 9 14 14 3 61Restrained 778 214 55 19 1 1,067Child Safety Seat 32 9 0 2 0 43Unknown 125 15 1 0 0 141Injuries Sustained by Children Under Six YearsNone Used 0 0 0 0 0 0Restrained 2 4 0 0 0 6Child Safety Seat 30 8 0 2 0 40Unknown 0 0 0 0 0 0
*Property Damage Only **Ranking of County Compared to Other 45 Counties
***Formula Used to Compute Economic Loss is in Definitions Section @Source - U.S. Census Bureau
@@Motor Vehicle Deaths Per 100,000 Population
@@@Includes Occupants Seated Inside the Passenger Compartment of Automobiles, Vans, and Trucks only

129South Carolina Department of Public Safety
South Carolina Traffic Collision Fact Book 2015
PART V - COUNTIES
YORK COUNTY MOTOR VEHICLE TRAFFIC COLLISIONS
FatalCollision
InjuryCollision
PDO*Collision
TotalCollision
PersonsKilled
PersonsInjured
Total Collisions 18 1,726 4,565 6,309 18 2,510Collisions by Time of Day12:01am - 3:00am 1 74 176 251 1 1143:01am - 6:00am 1 43 110 154 1 516:01am - 9:00am 0 209 739 948 0 2969:01am - Noon 1 227 532 760 1 32412:01pm - 3:00pm 6 331 837 1,174 6 4873:01pm - 6:00pm 3 453 1,224 1,680 3 6466:01pm - 9:00pm 4 251 675 930 4 3859:01pm - Midnight 2 138 272 412 2 207Collisions Investigated by JurisdictionYORK COUNTY SHERIFFS OFFICE 0 0 2 2 0 0CLOVER POLICE DEPARTMENT 0 20 56 76 0 29FORT MILL POLICE DEPARTMENT 0 83 256 339 0 121ROCK HILL POLICE DEPARTMENT 2 707 1,830 2,539 2 1,032YORK POLICE DEPARTMENT 2 82 141 225 2 139TEGA CAY POLICE DEPARTMENT 0 11 35 46 0 14WINTHROP COLLEGE POLICE DEPARTMENT 0 1 2 3 0 1RIVERHILLS PLANTATION SECURITY 0 0 1 1 0 0S.C. HIGHWAY PATROL TROOP 4 14 822 2,238 3,074 14 1,174STATE TRANSPORT POLICE 4 0 0 4 4 0 0Collisions by Route CategoryInterstate 3 157 595 755 3 211US Primary 0 260 645 905 0 407SC Primary 8 665 1,719 2,392 8 965Secondary 6 515 1,105 1,626 6 745County 1 129 501 631 1 182
Statistics 2014 2015Total Collisions Ranking County/State** 7 7Fatal Collisions Ranking County/State** 9 17Injury Collisions Ranking County/State** 7 7Driver Licenses 195,417 201,890Vehicle Registrations 225,374 236,510Economic Loss*** $148,351,900 $156,830,600Population Estimates@ 245,051 251,021MV Population Death Rate@@ 10.2 7.2
Restraint Usage@@@ No Injury Possible Injury
Non-Incapacitating
InjuryIncapacitating
Injury Fatal InjuryTotal
VictimsRestraint Use by Injuries Sustained by OccupantsNone Used 39 25 26 21 4 115Restrained 12,653 1,652 459 74 2 14,840Child Safety Seat 640 47 8 1 1 697Unknown 658 28 14 6 0 706Injuries Sustained by Children Under Six YearsNone Used 6 1 0 0 1 8Restrained 81 5 0 0 0 86Child Safety Seat 535 42 7 1 1 586Unknown 0 0 0 0 0 0
*Property Damage Only **Ranking of County Compared to Other 45 Counties
***Formula Used to Compute Economic Loss is in Definitions Section @Source - U.S. Census Bureau
@@Motor Vehicle Deaths Per 100,000 Population
@@@Includes Occupants Seated Inside the Passenger Compartment of Automobiles, Vans, and Trucks only

Traffice Collisions Report Form TR-310 - Front Page
Prop. Dam. 2
Photo:
Y N
Describe What Happned
(Refer to Units by Number)
Unit 2 Dam Unit 3 Dam
$ $
PhoneZip State Zip Phone
Property Owner/Witness
Address Address
State
Unit 1 Dam
$
Investigating Officer's Name Reviewer's Name Internal Agency Code
Property Owner/Witness
Vehicle Make VIN # Vehicle Make VIN #
C.D.L Req: Yes No T/B S Req: Yes No C.D.L Req: Yes No T/B S Req: Yes No
Summons #
Jurisdiction Code Review Date Rank
NOTICE - THE TR-310 IS FOR STATISTICAL REPORTING PURPOSES ONLY AND IS A REFLECTION OF THE OFFICER'S BEST KNOWLEDGE, OPINION, AND BELIEF COVERING
THE COLLISION, BUT NO WARRANT IS MADE AS TO THE FACTUAL ACCURACY THEREOF.
Rank Badge #
Unit 3: N S E WUnit 1: N S E W
Prop. Dam. 1
$ $
Summons # Code Towed by Yes No
Towed by Yes No
Vehicle Make VIN #
Owner's D.L. #
Home Phone
( )
Owner's Full Name
Business Phone
( )
Street
Contributed to Collision City, State, & Zip
Yes No
C.D.L Req: Yes No T/B S Req: Yes No
License Plate #
Code Code Summons # Code
City, State, & Zip
Year Body
State Year
Estimated
Speed
Speed
Limit
Dir of Travel:
# Occ Date of Birth City, State, & Zip
State Driver's License # Class Insurance Company:
Unit 2: N S E W
FR-10 # Driver/Pedestrian/Pedacyclist's Full Name
Unit # Sex Race Street Address
Alc/Drg info (see back): Yes No
Summons # Code
Alc/Drg info (see back): Yes No
Summons # Towed by Yes NoCode
Estimated
Speed
Speed
Limit
Insurance Company:
Owner's D.L. #
Owner's Full Name
StreetBusiness Phone
( )
Contributed to Collision
Yes No
Estimated
Speed
Speed
Limit
State Year License Plate #
Home Phone
( )
State Driver's License # Class
Year Body
Summons #
Unit # Unit #Sex Race
# Occ Date of Birth
Street Address
Alc/Drg info (see back): Yes No
Driver's License # Class Insurance Company:
License Plate # Owner's D.L. #
Body
Year
Yes No
State
Year
State
Owner's Full Name
Street
City, State, & Zip
Home Phone
( )
Business Phone
( )
Contributed to Collision
o
0-Main Line 6-Connection
2-Alternate 7-Business
5-Spur 9-Other
0-Main Line 6-Connection
2-Alternate 7-Business
5-Spur 9-Other
GPS COORDINATES 00 00' 00.00''
DEGREES MINURES SECONDS
Second Intersection (Rt # / Name)
Tow
ard
City, State, & Zip
Sex Race
# Occ Date of Birth
Street Address
City, State, & Zip
Direction
N E
S W
From Ramp Only
Driver/Pedestrian's Full Name
R.R. Id.
Distance Offset
Miles
Feet
# Of N E
S W
4-Secondary
5-County
6-Other
To
FR-10 # Driver/Pedestrian's Full Name FR-10 #
'
'
''
''Longitude
o
In / Near City or Town of:4-Secondary
5-County
6-PP
0-Main Line 6-Connection
2-Alternate 7-Business
5-Spur
Lane #/Dir.
Fro
m
Base Intersection (Rt # / Name)
Miles: Dir.
N E
S W
On
Collision Location (Rt # / Name)1-Interstate
2-US Primary
3-SC Primary
Date Time of
Collision
County
Latitude
1-Interstate
2-US Primary
3-SC Primary
4-Secondary
5-County
6-Other
1-Interstate
2-US Primary
3-SC Primary
N E
S W
N E
S W
1-Entrance
2-Exit
ArrivedSOUTH CAROLINA DPS/OHS & DMV USE ONLY Amended - Attach
Copy of Original
Corrected
# of Units NotifiedSOUTH CAROLINA
TRAFFIC COLLISION REPORT FORM
TR-310 (Rev. 11/2011)
Page #
Of:
130
South Carolina Traffic Collision Fact Book 2015
South Carolina Department of Public Safety

Traffice Collisions Report Form TR-310 - Front Page
Date of Birth
12-Pickup Truck 99-Unk.
50-Inattentive
51-Lying &/or Illegally in Roadway
52-Failure to Yield Right of Way
53-Not Visible (Dark Clothing)
54-Disregarded Signs, Signals, Etc
55-Improper Crossing
56-Darting
57-Wrong Side of Road
58-Other 59-Unk.
66-Under the Influence
67-Other Person Under Influence
60-Animal in Road
61-Glare
62-Obstruction
63-Weather Cond.
68-Other 69-Unk.
70-Brakes
71-Steering
72-Power Plant
73-Tires/Wheel
74-Lights
75-Signals
76-Windows/Shield
77-Restraint System
78-Truck Coupling
79-Cargo
80-Fuel System
89-Unk.88-Other
09-Made and Improper Turn
10-Medical Related
12-Aggressive Operation of Vehicle
13-Over-correcting/Over-Steering
14-Swerving to Avoid Object
15-Wrong Side or Wrong Way
16-Under the Influence
17-Vision Obscured(Within Unit)
18-Improper Lane Usage/Change
19-Cell Phone
20-Texting
28-Other Improper Action 29-Unk.
32-Obstruction in Roadway
33-Road Surface Condition (i.e., Wet)
34-Rut, Holes, Bump
35-Shoulders (None, Low, Soft, High)
36-Traffic Control Device (i.e., Missing)
37-Work Zone (Const./Maint./Utility)
38-Worn, Travel-Polished Surface
48-Other
49-Unk.
30-Debris
31-Non-highway Work
Vehicle Defect
Non-Motorist EnviromentalRoadway
01-Disregarded Signs, Signals, Etc.
02-Distracted/Inattention
03-Driving Too Fast for Conditions
04-Exceeded Authorized Speed Limt
05-Failed to Yield Right of Way
06-Ran off Road
07-Fatigued/Asleep
08-Followed Too Closely
8-Other 9-Unk.
1-Shoulder/Median Work
2-Lane Shift/Crossover 4-Lane Closure
3-Intermittent/Moving Work
1-Yes 2-No Workers Present:
Work Zone Type
02-Flashing Traffic Signal
1-Before 1st Sign
2-Advanced Warning Area
3-Transition Area
4-Activity Area
13-RR (X-bucks)
31-Pavement Markings (only)
41-Stop Sign
42-School zone Sign
22-Oncoming Emergency Vehicle
43-Yeild Sign11-RR (X-bucks, Lights, & Gates)
12-RR (X-bucks & Lights)
5-Termination
Area
1-Yes 2-No
Work Zone Location
44-Work Zone
45-Other Warning Signs
98-None
99-Unk.
2-Wet
3-Snow
4-Slush
5-Ice
6-Contaminate
7-Water (Standing, etc.)
8-Other 9-Unk.
01-Stop and Go Light 21-Officer or Flagman
9-Unk.
8-Severe Crosswinds7-Blowing Sand
Oil, Dirt, or Snow
Weather Condition
1-Clear (no adverse conditions
2-Rain
88-Other
03-Entering traffic lane
04-Leaving traffic lane
05-Making U-turn
09-Slowing or
Stopped in traffic
10-Turning left
11-Turning right
06-Movements Essentially Straight Ahead
2
3
27-Working99-Unk.
22-Entering/Crossing Location
12-Y-Intersection
13-Nonjunction
99-Unk.
2-Dawn
6-Dark (Street Lamp Not Lit)
7-Dark (No lights)
01-Crossover
1-Daylight
02-Driveway
Light Condition
09-Traffic Circle
08-T-Intersection
07-Shared Use Paths or Trail
3-Cloudy
4-Sleet, Hail
5-Snow
Unit:
Manner of Collision (Struck Veh.)
Vehicle Type:
01-Automobile
13-Truck Tractor
14-Other Truck
Vehicle Use Code
01-Personal
INJ:
a
b
SeatSex: Race
a
b
R/SD Name Street Address
b
Zip CodeLAI: TranEject
a
A.B.D
a
b
a
b
b
a
b
a
a
b
a
b
a
b
b
a
a
b
a
b
a
b
a
a
b
a
bb
a
b
a
b
a
b
a
b
b
a
b
Race A - Asian/Pacific Islander W - Caucasion
O - Other
U - Unk.
B - African American H - Hispanic
I - Alaskan Native or American Indian
a) Injury Status
0-Not Injured
1-Possible Injury
a
b
a
1-Switch On
Position
2-Switch Off
3-No Switch
9-Unknown
1-Deployed Front
2-Deployed Side
3-Deployed Both
4-Not Deployed
7-Not Applicable
9-Deployment
Unk 1-Not Trapped
2-Extricated (Mechanical Means)
Air Bag Deployment / Switch Ejection
a)
b)
b)2 or 3 Wheel Motorized Vehicle Only
Location After Impact
Head Injury: 1-Yes 2-No 08 091-Not Ejected
2-Part. Ejected
3-Total Ejected
7-Not
Applicable
9-Unknown
Seating Loc.
01 02 03
04 05 06
07
2-Non-incapacitating
3-Incapacitating
4-Fatal
21-Child
Safety Seat
88-Other
00-None Used
11-Shoulder Belt
12-Lap Belt Only
13-Shoulder & Lap Belt 99-Unk
80-Lap
99-Unk/NA
20-Pedestian
30-Trailing Unit
Restaint/Safety Device
40-Bus or Van (4th row or higher)
50-Other Enclosed Area(nontrailing)
51-Other Unenclosed
Area(nontrailing)
60-Sleeper of Cab
70-Riding on Exterior
2-Police 8-Other 9-Unk.
SEQUENCE OF EVENTS
1-Yes 2-No
b) By:
3-Freed(non-mech)
4-Not Applicable
9-Unknown
a) Transported to Medical Facility
3-Unknown
1-EMS
Pedestrian, Motor/Pedalcycle Only
31-Helmet
41-Protective Pads 61-Lighting
51-Reflective Clothing
3
2
3
1st Hrmfl
1
2
3
1 1 1
Event 1 Event 2 Event 3 Event 4 Most Hrmfl
1
2
3
10-Ran off Road Right
09-Ran off Road Left
08-Overturn/Rollover
11- Separation of Units
12-Spill (Two-Wheeled Veh.)
18-Other Non-collision
19-Unk.
02-Cross Median/Center
03-Downhill Runaway
06-Immersion
05-Fire/Explosion
04-Equipment FailureNon-Collision
07-Jacknife
01-Cargo/Equip Loss or Shift
2
3
2 53-Impact Attenuator/Crash Cushion
60-Tree
61-Utility Pole
27-Pedestrian
28-Railway Veh.
29-Work Zone
Maint. Equip.
38-Other Movable
Object
Collision: Fixed Object
41-Bridge Parapet End
39-Unk. Moveable
Object
34-Motor Veh. (Other Roadway)
25-Motor Veh. (Parked)
26-Pedalcycle
Collision: Not Fixed
20-Animal (Deer Only)
21-Animal (All Other)
22-Motor Veh. (In Transport)
23-Motor Veh. (Stopped)
44-Culvert
45-Curb
46-Ditch 54-Light/Luminaire Support
1
2
3
!st Hrmfl
Collision
00-Not Coll. w/ Motor Veh.
10-Rear End
20-Head On
62-Work Zone Maint. Equipment
68-Other
69-Unk48-Equipment
49-Fence
50-Guardrail End
56-Median Barrier
57-Overhead Sign Support
58-Other (Post, Pole, Support, Etc.)
55-Mail Box
59-Other (Wall, Building, Tunnel, Etc.)51-Guardrail Face
42-Bridge Pier or Abutment
43-Bridge Rail
47-Embankment
40-Bridge Overhead Structure
52-Highway Traffic Signal
15-Full Size Van
16-Mini Van
17-Sport Utility
25-Motorcycle
26-Other Motorbike
30-Rear-to-Rear
41-Angle (↘|↙)
42-Angle (→|←)
43-Angle (↗|↖)
61-School Bus
62-Passenger Bus
98-Other
99-Unk. (Hit and
Run Only
27-Pedalcycle
38-Animal Drawn Veh
39-Animal (Ridden)
41-Pedestian
50-Sideswipe Same Dir.
51-Sideswipe Opposite Dir.
70-Backed Into
99-Unknown
12-Fire Fighting
13-Logging
18-Other
07-Transport Property 41-Pedestrian
1
2
3
51-Train
1
2
08-Farm Use
09-Wrecker or Tow
10-Police
11-Government
1
2
3 03-Construction/Maint.
02-Driver Training
04-Ambulance
05-Military
06-Transport Passengers
07-Overtaking/passing
25-Standing
26-Walking, Playing, Cycling
A3-
D1
D2
D3
Alc Test Results
A1-
A2-
C-Other Tanker
D-Flat Bed
E-Twin Trailers
F-Other
Drug Results
1-Amphetamines
2-Cocaine
7-Camper Trailer
8-Towed Motor Vehicle
9-Petroleum Tanker
A-Lowboy Trailer
1-Straight - Level
2-Straight - On Grade
1-Dry
3
1-None
2-Mobile Home
3-Semi-Trailer
Vehicle Attachment 4-Utility Trailer
5-Military
6-Trailer w/ Boat
Primary
Driver
Junction Type
Contributing Factors
3-Dusk
4-Dark (Lighting Unspecified)
5-Dark (Street Lamp Lit)
03-Five/More Points
04-Four-way Intersection
05-Railway Grade Crossing
2-Blood
3-Urine
4-Serum
8-Other
1
2
3
Underride/Override
Extent of Deformity
1
2
3
9-Unk.
6-None
9-Unk.
Road Character3-Straight - Hillcrest
4-Curve - Level
5-Curve - On Grade
6-Curve - Hillcrest
1st /Most
Deformed Area
1 2 Most Deformed1st Deformed 3
Test Type
3-Given - PendingA1
A2
A3
D1
A1 D1
D2
D3
14-None
5-Refused
92-Rollover 93-Total 94-Under Carriage 98-Other
A2
A3
21-Pedestrian 81-None
3-No1-Yes, Directly 2-Yes, Indirectly
B: X-walk:
4-Severe/Totaled
5-Not Applicable
1-Under-Compartment Intrusion
2-Under-No Intrusion
3-Under-Unknown
4-Over-MV in transport
5-Over-Other Vehicle
0-None/Minor
2-Functional Damage
4-Roadside 1-Y 2-N 9-UA:
D2
D3
1-Breath (Alc Only)
1 2 3
Oth
ers:
Alcohol / Drug Test Given
1-Given - Known Results
2-Given - Unusable
Special Use Only
2 3 4 5 6 7
3-Marijuana
4-Opiates
Action Prior to Impact (Vehicle)
a
b
Trafficway
1st Harmful
Event Loc.
23-Palying/Working on Vehicle
24-Pushing Vehicle
6-Fog, Smog, Smoke
B-Autocarrier Trailer
01-Backing
02-Changing lanes
08-Parked
(Non-motorist)
1 21-Approaching Leaving Vehicle
3-Disabling Damage
1-Two-way, Not Divided
2-Two-way, Divided, Unprotected Median
3-Two-way, Divided, Barrier
4-One-Way 8-Other
5-PCP 8-Other
7-Sidewalk 9-Unk.
8-Outside Trafficway
5-Roadway
6-Shoulder
1-Gore
2-Island
3-Median
School Bus Involved:9-Unk.
Road Surface
Condition
Traffic Control
Type
51-Flashing Beacon
Work Zone:
South Carolina Traffic Collision Fact Book 2015
South Carolina Department of Public Safety
131

South Carolina Traffic Collision Fact Book 2015 South Carolina Department of Public Safety
132
DEFINITIONS
Blood Alcohol Concentration (BAC) - The
percentage of a blood sample that is
alcohol; e.g., a BAC of .10 is a sample of
blood with 1 part alcohol for every 999
parts blood.
Bus - A motor vehicle designed to transport
sixteen (16) or more persons, including the
driver.
Collision - Throughout this publication the terms
collision and traffic collision are equivalent
to the term motor vehicle traffic collision as
defined below.
Driver - An occupant who is in actual physical
control of a transport vehicle, or for an out-
of-control vehicle, an occupant who was in
control until control was lost.
Driver Intention - What the driver intended to do
just prior to the first harmful event and
before executing an evasive maneuver.
Economic Loss -Based on the 2015 National Safety
Council Formula which applies with the
following factors:
Each fatality ...........…..….........$1,542,000
Each incapacitating injury..............$90,000
Each non-incapacitating injury.......$26,000
Each possible injury...................... $21,400
Each no injury.............................$11,400
Each Vehicle in PDO*...................$4,200
*Property Damage Only
Fatal Traffic Collision - Any traffic collision that
results in the death of at least one occupant
or pedestrian as a direct result of injuries
sustained in the collision within 30 days of
the collision date.
First Harmful Event - The first event in a traffic
collision to result in injury or property
damage.
Harmful Event Location - The place, on or off the
roadway, where the first injury or property
damage occurred. This describes the
location of the first harmful event as it
relates to its position within or outside the
trafficway.
Incapacitating Injury - Any injury, other than a
fatal injury, which prevents the injured
person from walking, driving or normally
continuing the activities he was capable of
performing before the injury occurred.
Junction - Either an intersection or the connection
between a driveway access and a roadway
other than a driveway access.
Manner of Collision - The identification in a crash
of how the motor vehicle(s) initially came
together in a traffic collision.
Motor Vehicle - Any motorized (mechanically or
electrically powered) road vehicle not
operated on rails, excluding mopeds,
minibikes and other vehicles not subject to
motor vehicle licensing regulations. These
include: automobiles, trucks, buses, vans and
motorcycles.
Most Harmful Event - The event for an individual
unit involved in a traffic collision that results
in the most severe injury or property damage.
Motor Vehicle Traffic Collision - A transport
collision that involves at least one (1) motor
vehicle in transport, in which the unstabilized
situation originates on a trafficway or at least
one harmful event occurs on a trafficway.
This definition excludes any collision on a
private way.
Non-Incapacitating Injury - Any injury, other than
a fatal injury or incapacitating injury, which
is evident to observers at the scene of the
collision in which the injury occurred.
Nonjunction - Anything that is not an intersection or
the connection between a driveway access
and a roadway other than a driveway access.
Occupant - Any person who is part of a transport
vehicle (automobile, bicycle, etc.)

South Carolina Traffic Collision Fact Book 2015
South Carolina Department of Public Safety
133
DEFINITIONS
Passenger - Any occupant of a vehicle other
than its driver.
PDO - An abbreviation for property damage
only. A PDO collision is one with some
property damage but no injuries or
fatalities.
Pedalcycle - A non-motorized vehicle propelled
by pedaling (bicycle, tricycle, etc.).
Note: The pedalcycle pages include all
types but mostly bicycles.
Pedestrian - Any person who is not an occupant
as defined above. Includes persons on
foot, roller skates, and skateboards.
Possible Injury - Any injury that is reported or
claimed which is not a fatal injury,
incapacitating injury or non-
incapacitating injury.
Primary Contributing Factor - Refers to the
primary reason for the traffic collision.
This is the presumptive factor that
created the collision situation.
Private Way (Private Property) - Any land
other than a trafficway. This includes
parking lots even if they are designed
for public use. Collisions on private
ways are not included in this
publication.
Road - The part of a trafficway which includes
both the roadway and any shoulder
alongside the roadway.
Rural Area - Any area which is not within a
defined urban area.
Traffic Collision - Used in this publication
interchangeably with Motor Vehicle
Traffic Collision.
Traffic Unit (Unit) - Any motorized road
vehicle (includes vehicles that do and do
not qualify as motor vehicles in the
above definition), pedestrians, animal
drawn vehicle and animals with human
riders.
Trafficway - Any land way open to the public
as a matter of right or custom for
moving persons or property from one
place to another.
Truck Tractor - A motorized vehicle consisting
of a single motorized transport device
designed primarily for drawing.
Unit - Used interchangeably with traffic unit
(see definition above).
Urban Area - An area composed of an
incorporated place of at least 5,000
population along with the surrounding
densely settled areas.
Source for most definitions: Manual on
Classifications of Motor Vehicle
Traffic Collisions, Seventh Edition -
ANSI D16.1-2007, published by the
National Safety Council.

South Carolina Traffic Collision Fact Book 2015
South Carolina Department of Public Safety
134
INDEX Agency Type, Collisions Investigated by .................................................................................................... 31 Alcohol/Drugs, DUI, Alcohol Impaired Driving Fatalities, Collisions with a Contributing Factor of ............. 10, 75-79 Fatalities Involving an Alcohol Impaired Driver (BAC=.08+) from NHTSA .......................................... 75 Alcohol Impaired Driving Fatalities SC vs. US .................................................................................76
Top Five State Percentages with a Driver Having a BAC of .08+ ....................................................... 76 Non-Fatal DUI Collisions 2007 – 2011 (State Data) ........................................................................ 78 Non-Fatal DUI Collisions 2011 by Route Category, Day of Week, Month and Time of Day (State Data) .. 79
Bicycles (included with pedalcycles) ..................................................................................................... 52-53 Child Safety Seats, Injuries to Occupants Seated in ............................................................................... 72-73 Counties, Collision Summary of .................................................................................................... 81, 83-128
Collisions by County ................................................................................................................... 81 Fatalities by County, VMT and VMT Death Rate .............................................................................. 82 Economic Loss by ................................................................................................................ 83-128
Crosswalk Collisions ............................................................................................................................... 40 Day of Week, Non-fatal and Fatal Collisions ......................................................................................... 23, 25 Drivers
Age and Gender of Drivers in Collisions ........................................................................................ 18
Licensed Drivers by Age and Gender ............................................................................................ 17 Number Licensed in South Carolina ........................................................................................ 5,6,17 Out-of-State Drivers in South Carolina Collisions ............................................................................ 19 Violations by, in All Collisions ...................................................................................................... 16
Economic Loss from Motor Vehicle Collisions By County .......................................................................................................................... 83-128 Statewide ............................................................................................................................... 5, 6
Fatal Collisions ........................................................................................................................................ 5 Age and Gender of Drivers Involved in ......................................................................................... 18 By County .................................................................................................................... 81, 83-128 Driver BAC Reporting Rates for All Drivers in Fatal Collisions ........................................................... 77 First Harmful Event in ............................................................................................................ 12-14 First Harmful Event Location in .................................................................................................... 35 On Interstates ........................................................................................................................... 36 By Investigating Agency ............................................................................................................. 31 By Jurisdiction .................................................................................................................... 83-128 Motorized Bikes in ................................................................................................................. 50-51 Motorcycles in ...................................................................................................................... 46-49 Pickups in ............................................................................................................................ 66-67 Pedestrians in ...................................................................................................................... 56-57 Pedalcycles in ....................................................................................................................... 52-53 Primary Contributing Factor in ................................................................................................ 10-11 Railway Trains in .................................................................................................................. 58-59 By Route Category ..................................................................................................................... 34 School Buses in .................................................................................................................... 54-55 SUV’s in .............................................................................................................................. 60-61 By Time of Day, Day of Week and Month ................................................................................. 22-25 Truck Tractors in................................................................................................................... 62-63 Vans in ................................................................................................................................ 64-65
Fatalities in Traffic Collisions ................................................................................................... 5, 6, 7, 69, 73 Alcohol Impaired Driving Fatalities from NHTSA, by county 2004 – 2008 ........................................... 76 Alcohol Impaired Driving Fatalities, South Carolina and the US ........................................................ 78 Calendar of .......................................................................................................................... 28-29 By County .................................................................................................................... 81, 83-128 By First Harmful Event .......................................................................................................... 12-13 By First Harmful Event Location ................................................................................................... 35 By Investigating Agency.............................................................................................................. 31 On Selected Holidays ............................................................................................................ 26-27 By Jurisdiction .................................................................................................................... 83-128 Mileage Death Rate by County...................................................................................................... 33 By Occupant Seating Location and Restraint Usage ........................................................................ 73 By Route Category ..................................................................................................................... 34 By Time of Day, Day of Week and Month ...................................................................................... 25 By Top States for Alcohol Impaired Fatalities per 100 Million VMT ..................................................... 77 By Top States for Percentage of Alcohol Impaired Fatalities of Total Fatalities .................................... 76
First Harmful Event - Collision Summary ......................................................................................... 12-13, 14 Holidays - Fatal Collisions and Persons Killed ........................................................................................ 26-27

South Carolina Traffic Collision Fact Book 2015
South Carolina Department of Public Safety
135
INDEX
Injuries in Traffic Collisions .......................................................................................................... 5, 6, 7, 69
By Age and Gender .................................................................................................................... 69 By Junction Type ....................................................................................................................... 35 By Jurisdiction .................................................................................................................... 83-128 By County .................................................................................................................... 81, 83-128 By First Harmful Event ............................................................................................................... 13 By First Harmful Event Location ................................................................................................... 35 By Investigating Agency ............................................................................................................. 31 By Primary Contributing Factor .................................................................................................... 11 By Route Category ..................................................................................................................... 34 By Severity .......................................................................................................................... 69-70 By Time of Day, Day of Week and Month ...................................................................................... 25 By Transported to Medical Facility ................................................................................................ 72 (See Injury Collisions for Injuries Involving Specific Unit Types)
Injury Collisions ...................................................................................................................................... 5 Age and Gender of Driver in ........................................................................................................ 18 By County .................................................................................................................... 81, 83-128 First Harmful Event .................................................................................................................... 13 By Investigating Agency ............................................................................................................. 31 By Jurisdiction .................................................................................................................... 83-128 Motorized Bikes in ................................................................................................................. 50-51 Motorcycles in ...................................................................................................................... 46-44 Pickups in ............................................................................................................................ 66-67 Pedestrians in ...................................................................................................................... 56-57 Pedalcycles in ....................................................................................................................... 52-53 Primary Factor in .................................................................................................................... 9-10 Railway Trains in ................................................................................................................. 58-59 By Route Category ..................................................................................................................... 34 School Buses in .................................................................................................................... 54-55 SUV’s ................................................................................................................................. 60-61 By Time of Day, Day of Week and Month ...................................................................................... 25
Truck Tractors ..................................................................................................................... 62-63 Vans in ................................................................................................................................ 64-65
Interstate Routes, Collisions on .......................................................................................................... 34, 36 Junction Type, All and Fatal Collisions ....................................................................................................... 35 Jurisdiction, Collisions by.(See also Agency Type) ................................................................................ 83-128 Licensed Drivers - Number of by Age and Gender ....................................................................................... 17 Light Conditions, All and Fatal Collisions .................................................................................................... 38 Mileage Death Rate – Alcohol Impaired, South Carolina vs. Unites States ...................................................... 76 Mileage Death Rate – South Carolina vs. United States ................................................................................. 8 Month – Non-fatal and Fatal Collisions ................................................................................................. 24-25 Collisions by ............................................................................................................................. 25
Fatalities by .................................................................................................................... 25, 28-29 Motor Vehicles
Collision Involvement by Unit ..................................................................................................... 43 Definition of ..................................................................................................................... 131-132 Registrations by County ....................................................................................................... 83-128
Other Motorized Bikes Involved in Traffic Collisions ................................................................................ 50-51 Pedalcycles Involved in Traffic Collisions ............................................................................................... 52-53 Pedestrians Involved in Traffic Collisions .............................................................................................. 54-57 Pickup Truck Involved in Traffic Collisions ............................................................................................. 66-67 Primary Contributing Factor, All, Injury and Fatal Collisions ................................................................. 9-10, 14 Restraints, Injuries by Reported Usage ..................................................................................................... 70 Road Character, All and Fatal Collisions ..................................................................................................... 39 Road Surface Conditions, All and Fatal Collisions ........................................................................................ 38 School Buses Involved in Traffic Collisions ............................................................................................ 54-55 Time of Day, Non-fatal and Fatal Collisions ................................................................................................ 22 Traffic Collision Report Form (TR-310) .............................................................................................. 129-130 Traffic Control Type ................................................................................................................................ 39 Trains Involved in Traffic Collisions ...................................................................................................... 58-59 Truck Tractors Involved in Traffic Collisions .......................................................................................... 62-63 Unit Action Prior to Impact, by Vehicles Involved in Collisions ...................................................................... 45 Unit Types Involved in Traffic Collisions .................................................................................................... 43 Vans Involved in Traffic Collisions ........................................................................................................ 64-65 Vehicle Miles of Travel ................................................................................................................. 5, 6, 7, 82 Vehicle Use, by Vehicles Involved in Traffic Collisions .................................................................................. 43 Violations, by Drivers Involved in Traffic Collisions...................................................................................... 16 Weather Conditions, Non-Fatal and Fatal Collisions ..................................................................................... 38 Work Zone Collisions .............................................................................................................................. 40
134

South Carolina Traffic Collision Fact Book 2015
South Carolina Department of Public Safety
136
ACKNOWLEDGEMENTS
The Office of Highway Safety and Justice Programs of the South Carolina Department of Public Safety would like to take the
opportunity to express our sincere appreciation to all persons,
agencies, departments and organizations who have contributed to this
publication.
The vast majority of data used to produce this publication was
tabulated from the Uniform Traffic Collision Report for Investigating
Officers. These reports were submitted by members of the South Carolina Highway Patrol, City Police Departments and various other
Law Enforcement Agencies.
The Office of Highway Safety and Justice Programs gives special
recognition to the above traffic investigative agencies and, in doing so,
cannot forget the support and cooperation of other agencies and organizations.
The Office of Highway Safety and Justice Programs, which tabulated the traffic collision data and other pertinent information for this
publication, could not have done so without the untiring efforts of the
above persons and organizations.