Embed Size (px)
Citation preview

South Beach Diet: A Fresh Twist On a Proven Recipe
Tetrem’s Value Investing Framework
Presented by:
Daniel Bubis, CFA Kerry Stirton Alec MacIsaac, CFA Ben Ellis, CFA

Tetrem – Our Diet is North American Value
Winnipeg
Boston Toronto

Tetrem Value Proposition
• Experience: 100+ years collectively
• Proven track record: – Canadian Value: 9.7% annualized since inception, outperforming the S&P/TSX by 2.6%* – US Value: 10.1% annualized since inception, outperforming the S&P 500 by 2.5%* – Canadian Dividend: 8.4% annualized since inception, outperforming the S&P/TSX by 4.8%*
• Differentiated Value Strategy: – Contrarian approach balances growth and momentum styles – Recent results again outperforming
• Aligned incentives: Employee-owned, invested alongside clients
• Fresh Investments in the Business: People, systems, research *Performance is shown gross of fees, as of August 31, 2016. Inception date is January 1, 1997 for Tetrem Canadian Equity Composite and Tetrem US Equity Composite. Inception date for Tetrem Canadian Dividend Composite is April 30, 2011.

Investment Team – The Right Ingredients
Daniel A. Bubis, CFA President &
Chief Investment Officer
Alec MacIsaac, CFA Portfolio Manager
Financials and Staples
Ben Ellis, CFA Vice President
Consumer, Tech, and
Health Care
Kerry Stirton Partner &
Head of Research
Chris Comrie Energy and Utilities
Jay Hedstrom, CFA Consumer, Financials, and
Industrials
Amar Pandya, CFA Consumer, Industrials, and
Materials
Rex Martin Equity Trader
Jonathan McGraw Bentley Portfolio Analyst

VMER™ – Our Fundamental Cookbook
Valuation
Mean Reversion
Economic Moat
Risk
FUNDAMENTALS
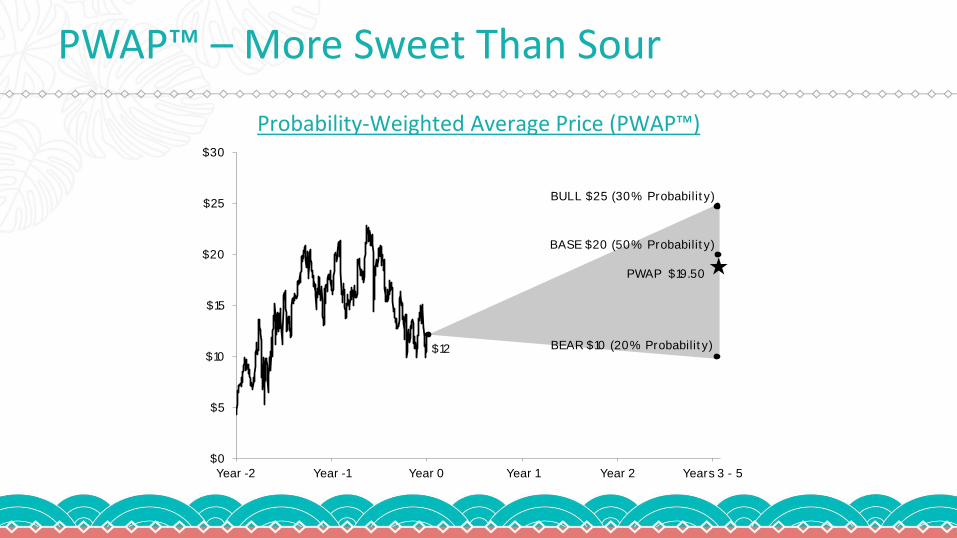
PWAP™ – More Sweet Than Sour
$12
$0
$5
$10
$15
$20
$25
$30
Year -2 Year -1 Year 0 Year 1 Year 2 Years 3 - 5
BULL $25 (30% Probabilit y)
BEAR $10 (20% Probabilit y)
BASE $20 (50% Probabilit y)
PWAP $19.50
Probability-Weighted Average Price (PWAP™)

Value on a Hunger Strike, It Can’t Last Forever
3.3%
-10%
-8%
-6%
-4%
-2%
0%
2%
4%
6%
8%
'88 '91 '94 '97 '00 '03 '06 '09 '12 '15
Annualized Trailing 10-Year Relative Total Return Growth vs Value
Russell 1000 Growth - Russell 1000 Value Avg. -2 StDev. +2 StDev.
Source: Strategas. As of July 31, 2016.

Negative Yields are Hard to Digest
$13,875
Source: Strategas. As of September 7, 2016. Excludes inflation linked and callable debt.

Dividends More Nutritious Than Coupons
60% 68%
0%
10%
20%
30%
40%
50%
60%
70%
'90 '92 '94 '96 '98 '00 '02 '04 '06 '08 '10 '12 '14 '16
% of Stocks with Dividend Yields Greater than the 10-Year Treasury Yield
S&P 500 S&P/TSX
Source: Strategas. As of August 16, 2016.

ReFRESHing The Approach
Changes Made
Value stocks remains the Foundation
Unpacked the VMER™ into clearly defined sub-components
Greater emphasis on economic “moat” and earnings stability
Greater weight to dividend profile
Intensified analysis of fundamentals; extra sensitivity to value traps
More concentration in Highest Conviction Ideas
Portfolio Outcomes
Reduced holdings in US portfolio from 42 to 35
Reduced holdings in Canadian portfolio from 44 to 38
Early signs of lower portfolio volatility with better “alpha”

Value Now Getting its Just Desserts
Source: Empirical Research Partners. As of September 7, 2016.

First Taste - US Results Trending Positively
-12.0%
-10.0%
-8.0%
-6.0%
-4.0%
-2.0%
0.0%
2.0%
4.0%
6.0%
8.0%
Q3 2015 Q4 2015 Q1 2016 Q2 2016 QTD
Qu
arte
rly
Ret
urn
s, P
erce
nt
US Value Strategy S&P 500 Ilustrative Trendline
Tetrem Now Ahead of the S&P 500 Year-to-date*
Source: Tetrem & Bloomberg. *US Portfolio, Preliminary data, subject to change. As of September 6, 2016.

Canadian Banks – Portfolio Superfood
P/FE 5 Year EPS Growth*
Indicated Dividend
Yield
Return on Equity
Tetrem’s Canadian Bank Holdings (average)
11.0 9.7% 4.3% 15.9%
S&P/TSX Index 17.3 2.0% 2.9% 3.2%
Tetrem Advantage +6.3 +7.7% +1.4% +12.7%
Source: Bloomberg. As of July 31, 2016. *5 Year Geometric Growth before Extraordinary Items. Canadian Bank Metrics are based on Tetrem’s holdings and are calculated as a simple average.

Canadian Natural Resources – Recipe for Cash Flow

Choice Properties – Super Ingredients

Air Canada – Digesting The Good News

Google – Searching for a Place to Eat

Macy’s – Losing Weight, Getting Thinner

CI Canadian Investment Fund
Source: Fundata, July 31, 2016

CI Canadian Dividend Fund
Source: Fundata, July 31, 2016

United Canadian Equity Value Pool
Source: Fundata, July 31, 2016

United US Equity Value Pool
Source: Fundata, July 31, 2016. Class E.

Products That Tetrem Manages for CI
Funds Solutions
CI Canadian Investment Canada’s Longest Standing Mutual Fund
Select Canadian Equity Managed
CI Canadian Dividend 30 Dividend Paying Companies
Select U.S. Equity Managed
United Canadian Equity Value Since 1993, Value
Synergy Tactical Asset Allocation
United US Equity Alpha Blue-chip Value
Evolution Private Managed Accounts

Thank You
Commissions, trailing commissions, management fees and expenses may be associated with mutual fund investments. Please read the prospectus before investing. Unless otherwise indicated and except for returns for periods less than one year, the indicated rates of return are the historical annual compounded total returns including changes in security value. All performance data assume reinvestment of all distributions or dividends and do not take into account sales, redemption, distribution or optional charges or income taxes payable by any securityholder that would have reduced returns. Mutual funds are not guaranteed, their values change frequently and past performance may not be repeated. ®CI Investments, the CI Investments design, are registered trademarks of CI Investments Inc. This communication is published by CI as a general source of information and is not intended to provide personal legal, accounting, investment or tax advice. Facts and data provided by CI and other sources are believed to be reliable when posted; however, CI cannot guarantee that they are accurate or complete or that they will be current at all times. This report may contain forward-looking statements about the fund, its future performance, strategies or prospects, and possible future fund action. These statements reflect the portfolio managers’ current beliefs and are based on information currently available to them. Forward-looking statements are not guarantees of future performance. We caution you not to place undue reliance on these statements as a number of factors could cause actual events or results to differ materially from those expressed in any forward-looking statement, including economic, political and market changes and other developments. CI and its affiliates will not be responsible in any manner for direct, indirect, special or consequential damages howsoever caused, arising out of the use of this presentation.