Embed Size (px)
Citation preview
South Ayrshire Town Centre Assessment
Prestwick Town Centre: Shopper and Resident Surveys
November 2014
Cameron Research
67 St Ninians Road
Prestwick KA9 1SL
Tel: 01292 678373
A project supported by the European Union’s
INTERREG IVA Programme managed by the
EU Programmes Body
CR Cameron Research
Strategic Research & Planning
_______________________________________________________________________________
CR Cameron Research: Prestwick Shopper and Resident Report
CONTENTS Page
1. Survey background, objectives and methodology 1
2. Prestwick conclusions: Shopper and Resident 3
3. Overall summary: Prestwick Shopper and Resident 4
4. Prestwick Shopper Summary 6
5. Prestwick Shopper key findings: town centre 8
Shopper profile 8
Overall usage 10
Purchase behaviour 14
Reasons for usage of town centre 15
Attitudes and factors that would encourage usage 18
Usage of different locations for shopping/services 22
Evening usage of town centre 24
6. Prestwick Resident Summary 27
7. Prestwick Resident key findings: town centre 30
Resident profile 30
Overall usage 31
Purchase behaviour 35
Reasons for usage of town centre 36
Attitudes and factors that would encourage usage 38
Evening usage of town centre 44
Appendices (under separate cover)
1. Survey Questionnaire
2. Data Tables
3. Open-Ended Comments
The views and opinions expressed in this report do not necessarily reflect those of
the European Commission or the Special EU Programmes Body.
1
_______________________________________________________________________________
CR Cameron Research: Prestwick Shopper and Resident Report
1.0 SURVEY BACKGROUND, OBJECTIVES AND METHODOLOGY
Background
1.1 South Ayrshire Council, along with Project Partners, has been awarded
funding from the European Regional Development Fund’s INTERREG IVA
Programme for delivery of the Business Improvement Districts (BIDS) Project.
The Project has been funded through Priority 2, Theme 1: Public Sector
Collaboration.
1.2 A Joint Committee of 5 local authorities (Ballymena Borough Council,
Coleraine Borough Council, Larne Borough Council, Sligo County Council and
South Ayrshire Council) has been established with Ballymena Borough Council
acting in role of Lead Partner. A Partnership Agreement has been produced to
provide governance guidelines and an operating framework.
1.3 The purpose of the study is to gauge the views and priority issues of
customers, businesses and residents of the towns. The town centres to be
included are: Ayr, Girvan, Maybole, Prestwick, and Troon. The issues to be
investigated include public space and environment, accessibility and events.
Cameron Research, in partnership with IBP Strategy and Research, were
appointed to conduct a series of surveys to establish the views and priority
issues of customers, businesses and residents of the towns and their
landward villages.
Objectives
1.4 This analysis will inform the development of town centre plans in South
Ayrshire to deliver improvements for businesses, shoppers and residents.
Overall, the purpose is to inform the South Ayrshire Strategy Plan to provide
consumers with a compelling reason to use the shops and services of each
town centre. This work will help to inform the strategy and planning process
and provide a baseline against which future initiatives can be measured.
1.5 Four distinct surveys were conducted in August 2014
• shopper/customer survey: recruited from within each of the 5 town
centres to collect information on their specific shopping trip/services visit,
plus perceptions and attitudes towards the town centre offering
• resident survey: recruited within the settlement boundary of each of the
5 towns and landward villages to expand the information gathered from
the town centre surveys
• commercial operators/business survey: to determine issues and
concerns regarding the area, from the business perspective
• South Ayrshire resident survey: representative population survey within
South Ayrshire to ask specifically about usage of, and attitudes towards,
Ayr town centre.
2
_______________________________________________________________________________
CR Cameron Research: Prestwick Shopper and Resident Report
1.6 For shoppers and residents, questions included demographics, shopping
locations, frequency of visits, shopping patterns, perceptions of safety and
cleanliness, awareness of offer, spend profile, areas for improvement and
alternative shopping locations.
1.7 For businesses, questions includes size and type of business, trading
operations, perceptions of trading circumstances, assessment of town centre
facilities, potential barriers to business and areas for improvement.
1.8 This document presents the key findings for the Prestwick Shoppers and
Residents surveys. The Business surveys and the South Ayrshire Residents
survey are detailed in separate reports.
Methodology
1.9 Shopper Survey: 150 face-to-face interviews were undertaken with shoppers
in Prestwick Town Centre. Shoppers were randomly recruited at two
locations: junction of Main Street/Station Road (Prestwick Cross) and junction
of Main Street/Kyle Street.
1.10 Residents Survey: 127 face-to-face interviews were undertaken with
residents within Prestwick town centre boundary and the landward villages
of Symington and Monkton. A door-to-door interview methodology was
used, based on addresses in the South Ayrshire Edited Electoral Register. A
broad spread of ages and genders was achieved in these interviews and
results were weighted further to ensure that the age and gender profile was
broadly reflective of the South Ayrshire average. This weighting process did
not, however, have any material impact on the overall findings.
1.11 This report provides a summary of key results in graphical form with
associated commentary.
1.12 Detailed appendices are included under separate cover. These include the
survey questionnaire (Appendix 1), detailed data tables (Appendix 2) and a
full listing of “other” responses and responses to open-ended questions
(Appendix 3).
3
_______________________________________________________________________________
CR Cameron Research: Prestwick Shopper and Resident Report
2.0 PRESTWICK CONCLUSIONS: SHOPPER AND RESIDENT
A proportion of shoppers are likely to be visitors to the area, mainly day visitors.
Shoppers and residents are attracted by the variety and good quality of shops and
services available in Prestwick town centre. In particular, the presence of food and
non-food shops and financial/professional services are important.
A key main purpose of shoppers was usage of café/restaurants and these outlets
were highly rated by residents and shoppers and provide an appealing presence in
the town centre. Some residents visit the town centre for a walk or for
browsing/window shopping and the variety of shops/services and the positive feel
and attractive/well-maintained environment of the town centre support this
purpose.
Prestwick town centre provides the main location for use of a variety of shops,
services and cafes/restaurants by shoppers and residents. Ayr Heathfield and Ayr
town centre are important support locations.
An important factor in the assessment and use of Prestwick town centre, by
shoppers and residents, was the high rating received for having a positive feel and
for being attractive and well-maintained. Specific public realm details such as good
street lighting, well-maintained pavements and provision of litter bins add to this
positive assessment. Additionally, residents highly rated the financial/professional
services, retail services, access via public transport and library /public facilities.
Elements which were more poorly rated concerned traffic congestion/system and
availability of parking near to shops. The provision of public toilets and of public
seating also present opportunities for improvement. From the survey feedback,
potential exists to increase usage of the town centre with the provision of more
small/specialised stores and more discount/pound shops and also to review the
current balance of the types of outlet in the town centre.
4
_______________________________________________________________________________
CR Cameron Research: Prestwick Shopper and Resident Report
3.0 OVERALL SUMMARY: PRESTWICK SHOPPER AND RESIDENT
Shopper and resident profile
67% of shoppers were female, which is expected in town centre surveys of this type,
and 53% of residents were female, which is in-line with demographic profile of South
Ayrshire residents. Respondents were from a range of age groups, with 42% of
shoppers and 44% of residents aged 55+.
The occupational status of head of household in both surveys was most likely to be
working. The majority of the shoppers either lived locally or worked in Prestwick
town centre; however, 35% were visitors to the area.
Overall usage
The main purposes for visiting Prestwick town centre were the shops (food and non-
food) and the service sectors (financial/professional services in particular). Residents
are more likely to be using financial/professional services and non-food shopping as
a main purpose for visiting and shoppers are more likely to be using
café/restaurants. However, other purposes for visiting show usage by both samples
of the wide variety of shops and services in Prestwick and, for residents, this includes
use of professional health services (i.e. dentist, opticians), browsing/window
shopping and going for a walk.
Frequency of usage of the town centre in the past year is stable for both shoppers
and residents. Shoppers are more likely than residents to use a car (63% vs. 35%)
and residents are more likely to walk into centre. The majority of shoppers and
residents spend under 2 hours in the town centre.
Purchase behaviour
The main purchase or service types made by shoppers and residents are:
business/financial services, food retail and bar/cafes/restaurants, again reflecting
the variety of outlets in Prestwick. The average total spend by shoppers on the
occasion of their visit was £53.87 and the average total spend for residents on their
most recent visit was £51.56.
The key reason for using Prestwick shops/services was due to its location as the
closest main shopping area; this was the case for shoppers and residents alike.
Other reasons for usage included the positive feel to the town centre, the attractive
and well-maintained environment and the variety and quality of the shops/services.
Residents spontaneously commented on the people/friendliness of the town centre.
“Good feel to it especially the Main Street has all the types of shops I need and like”,
“Really feel Prestwick has retained its quality of shops”, friendly people and good
community spirit”.
5
_______________________________________________________________________________
CR Cameron Research: Prestwick Shopper and Resident Report
Attitudes and factors that would increase usage
Prestwick town centre was commonly rated positively for a range of features by
shoppers and residents. In particular: having a positive feel, a safe/secure
environment and cafes/restaurants. In addition, residents highly rated the
financial/professional services, access via public transport and library/public
halls/council services.
Shoppers and residents rated the town centre less positively for traffic congestion,
traffic system, availability of car parking near to shops and availability of public
toilets; residents also gave a lower rating for availability of pubic seating.
The most popular changes to encourage increased usage of the town centre were:
more small/specialised shops and improved parking: “Use The Broadway as an Arts
Centre like Harbour Arts in Irvine”, “Stop HGVs coming along the Main street”, “Need
a TK Max or Matalan”, “Less charity shops, need more clothes shops”. There were
felt to be too few small/independent stores, too few large/chain stores, too few
discount/pound shops and too many charity shops.
Usage of different locations for shopping/services
The primary location used by residents and shoppers for services and for
cafes/restaurants was Prestwick town centre. There was a difference between the
surveys in the primary location used for food shopping: shoppers were most likely to
mainly use Prestwick town centre (37%) and residents were most likely to use Ayr,
Heathfield (66%). Ayr town centre is a support location for both samples, specifically
for financial and retail services and for cafes/restaurants.
Prestwick being the closest main shopping area is a key reason for usage, particularly
for shoppers and variety of shops/services was also a factor. For residents, the
availability of car parking was a key reason for choice of location for food shopping
(72%) and variety of shops/services for non-food shopping (71%).
Evening usage of town centre
45% of shoppers and 59% of residents visit Prestwick town centre in the evening.
Around 80% of both samples are visiting cafes/restaurants and shoppers are more
likely to visit bars/pubs/nightclubs than residents (84% and 61% respectively).
Most features of the town centre in the evening were rated positively, including
good café/restaurants, good bars/pubs/nightclubs, good street lighting, safe/secure
environment, positive feel, access via public transport and attractive/well-
maintained environment. A small proportion of each survey rated available car
parking as poor/very poor (36% of residents and 20% of shoppers).
6
_______________________________________________________________________________
CR Cameron Research: Prestwick Shopper and Resident Report
4.0 PRESTWICK SHOPPER SUMMARY
Shopper profile
There was a female skew to the shopper profile, with 67% of respondents being
female and 33% male. Shoppers were from a range of age groups, with 42% over the
age of 55. The occupational status of the head of household was mainly working
(65%) and 29% were retired.
The majority of shoppers lived locally or worked in the town centre. However 35%
were visitors to the area. Therefore, not all shoppers and service users surveyed are
necessarily local residents or workers.
Overall usage
The main purpose for visiting the town centre was for food shopping (29%) but other
reasons included use of a café/restaurant (39%) or financial/professional services
(32%). Over one-third of shoppers (37%) visit food shops at least three times a week
and 42% visit non-food shops at least once a week and 30% use
financial/professional services at least once a week.
Frequency of usage of the town centre has been stable in the past year (83% saying
that the frequency of their usage has not changed) and the majority of shoppers
(63%) used a car to travel to the town centre. 62% of shoppers intended to spend
under 2 hours in the town centre on this occasion.
Purchase behaviour
The main purchase made or service used included bar/cafes/restaurants,
business/financial services and food shops, reflecting the variety of outlets available.
60% of shoppers purchased in bars/cafes/restaurants with an average spend of
£12.31; 49% purchased from food shops with an average spend of £14.81. The total
average spend in Prestwick town centre on the occasion of the visit was £53.87.
The main prompted reasons for shopping in Prestwick were the convenience of it
being the closest main shopping area (47%) and quality of cafés/restaurants (21%).
Other reasons given by shoppers included the variety of shops/services (52%), the
quality of shops/services (53%), the positive feel to town centre (29%) and the
attractive/well-maintained town centre (35%). Spontaneous positive comments
included: “Nearest to me and has a good range of diverse types of shops”, “Good feel
to it especially the Main Street has all the types of shops I need and like”, “Really feel
Prestwick has retained it's quality of shops”
7
_______________________________________________________________________________
CR Cameron Research: Prestwick Shopper and Resident Report
Attitudes and factors that would increase usage
Prestwick town centre was rated as very good for: cafes/restaurants (59%), having a
positive feel (50%), a safe/secure environment (28%) and financial/professional
services (28%). It was also positively rated for public realm features such as
maintenance of pavements, street cleaning and provision of litter bins.
Some features were more commonly rated as poor/very poor: traffic congestion
(46%), the traffic system (43%), availability of parking near shops (33%) and provision
of public toilets (48%).
The most popular suggested changes which would encourage increased use of the
town centre were: more small/specialised shops (63%) and improved parking
facilities (49%). When asked about the balance of types of shops, 60% felt there were
too few small/independent stores, 53% too few discount/pounds shops and 32% felt
there were too many charity shops.
The key spontaneous category for improvement to their shopping experience was
better/cheaper parking (63%): “Better car parking with more on-street parking” “Car
parking signs highlighted”, “More parking provided especially beside the main
shops”.
Usage of different locations for shopping/services
The main location used for different types of shopping or services was Prestwick
town centre; Ayr town centre was also used as an other location for café/restaurants
(49%), financial services (40%) and non-food shopping (37%) and Ayr Heathfield for
food shopping (37%). Closeness of main shopping area was the key reason for usage
as a main location, a good variety of shops/service was a factor for shopping and
quality of shops/services was important for café/restaurants.
Evening usage of town centre
45% of shoppers visited the town centre in the evening and, of these, over 80%
visited pub/bar/nightclubs and café/restaurants respectively. Weekly usage is 30%
for pub/bar/nightclubs and 20% for café/restaurants.
Features of the town centre in the evening were generally rated positively. In
particular: very good for good bars/pubs/nightclubs (76%) and good
café/restaurants (75%). A small proportion rated some features as poor/very poor –
available car parking (20%) and access via public transport (12%) - but these were
generally rated as good.
8
_______________________________________________________________________________
CR Cameron Research: Prestwick Shopper and Resident Report
5.0 PRESTWICK SHOPPER KEY FINDINGS: TOWN CENTRE
Shopper profile
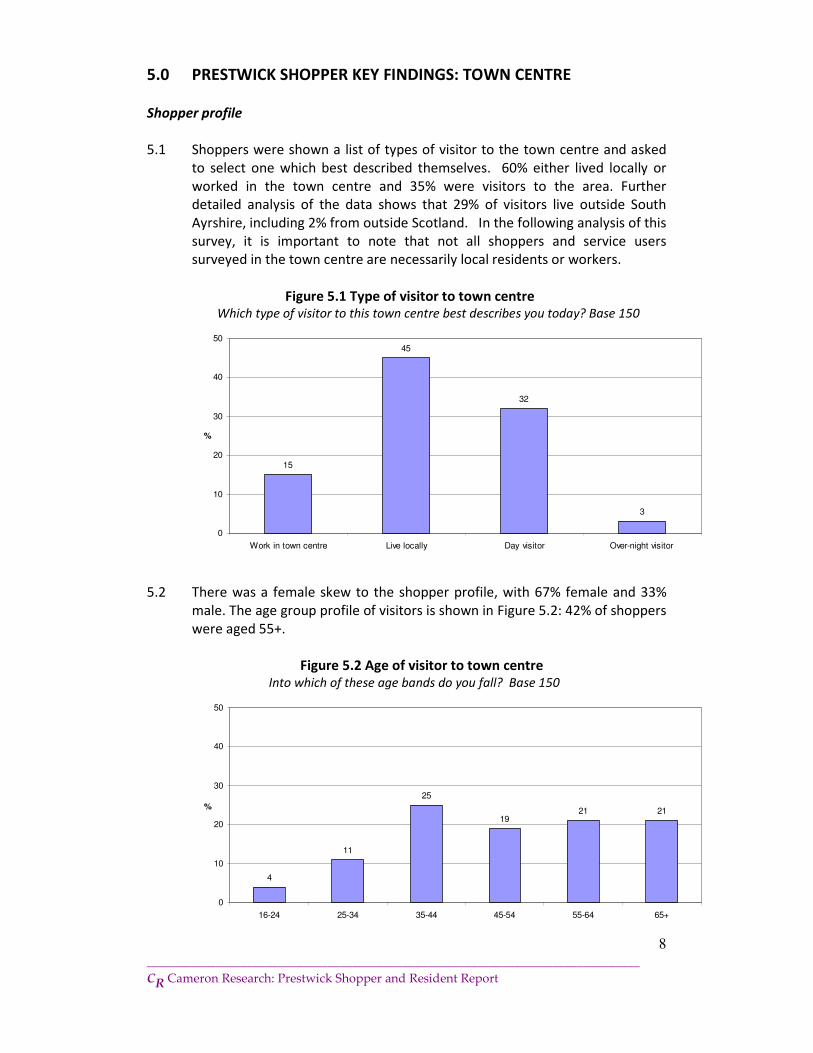
5.1 Shoppers were shown a list of types of visitor to the town centre and asked
to select one which best described themselves. 60% either lived locally or
worked in the town centre and 35% were visitors to the area. Further
detailed analysis of the data shows that 29% of visitors live outside South
Ayrshire, including 2% from outside Scotland. In the following analysis of this
survey, it is important to note that not all shoppers and service users
surveyed in the town centre are necessarily local residents or workers.
Figure 5.1 Type of visitor to town centre Which type of visitor to this town centre best describes you today? Base 150
15
45
32
3
0
10
20
30
40
50
Work in town centre Live locally Day visitor Over-night visitor
%
5.2 There was a female skew to the shopper profile, with 67% female and 33%
male. The age group profile of visitors is shown in Figure 5.2: 42% of shoppers
were aged 55+.
Figure 5.2 Age of visitor to town centre Into which of these age bands do you fall? Base 150
4
11
25
1921 21
0
10
20
30
40
50
16-24 25-34 35-44 45-54 55-64 65+
%
9
_______________________________________________________________________________
CR Cameron Research: Prestwick Shopper and Resident Report
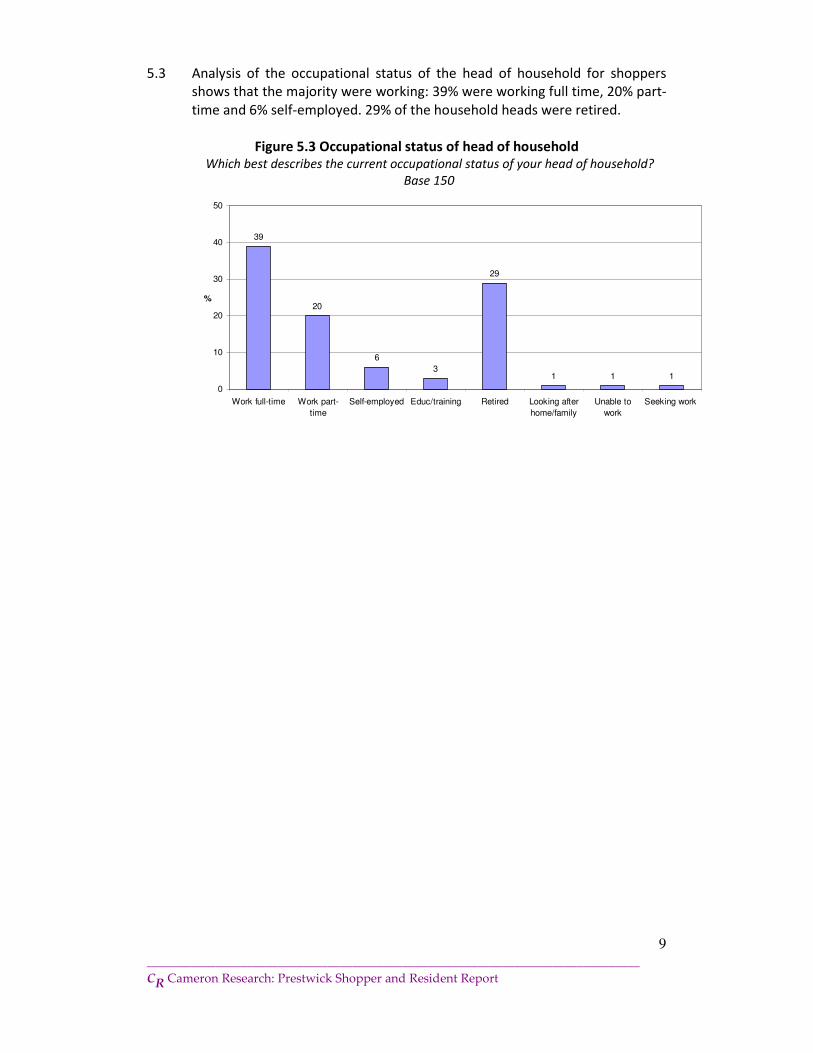
5.3 Analysis of the occupational status of the head of household for shoppers
shows that the majority were working: 39% were working full time, 20% part-
time and 6% self-employed. 29% of the household heads were retired.
Figure 5.3 Occupational status of head of household Which best describes the current occupational status of your head of household?
Base 150
39
20
6
3
29
1 1 1
0
10
20
30
40
50
Work full-time Work part-
time
Self-employed Educ/training Retired Looking after
home/family
Unable to
work
Seeking work
%
10
_______________________________________________________________________________
CR Cameron Research: Prestwick Shopper and Resident Report
Overall usage
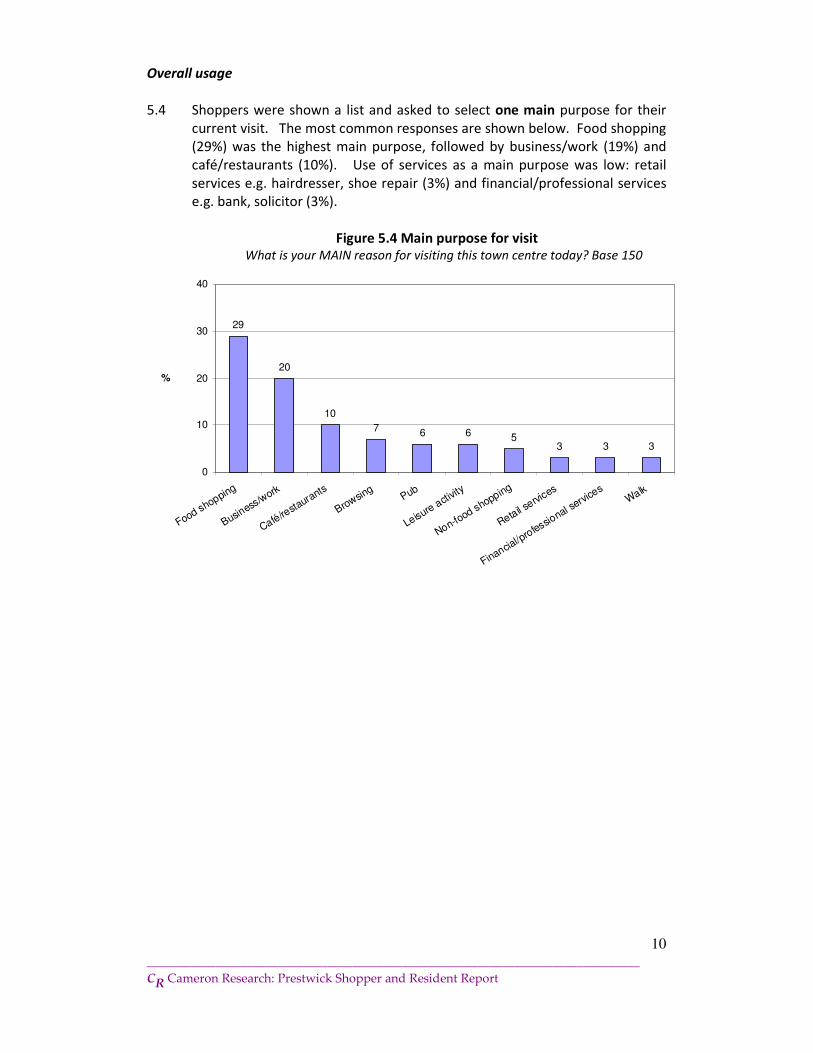
5.4 Shoppers were shown a list and asked to select one main purpose for their
current visit. The most common responses are shown below. Food shopping
(29%) was the highest main purpose, followed by business/work (19%) and
café/restaurants (10%). Use of services as a main purpose was low: retail
services e.g. hairdresser, shoe repair (3%) and financial/professional services
e.g. bank, solicitor (3%).
Figure 5.4 Main purpose for visit
What is your MAIN reason for visiting this town centre today? Base 150
29
20
10
7 6 6 53 3 3
0
10
20
30
40
Food shopping
Business
/work
Café/resta
urants
Browsing
Pub
Leisure activit
y
Non-food shopping
Retail servi
ces
Financial/p
rofessio
nal servi
ces
Walk
%
11
_______________________________________________________________________________
CR Cameron Research: Prestwick Shopper and Resident Report
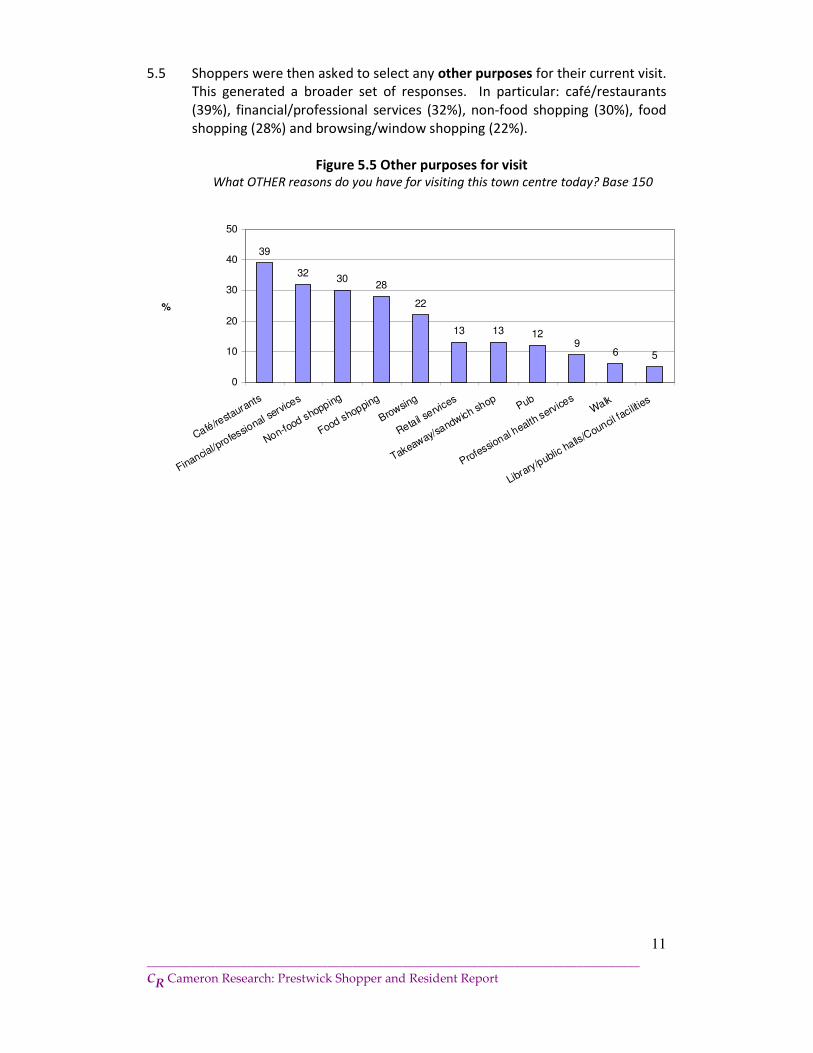
5.5 Shoppers were then asked to select any other purposes for their current visit.
This generated a broader set of responses. In particular: café/restaurants
(39%), financial/professional services (32%), non-food shopping (30%), food
shopping (28%) and browsing/window shopping (22%).
Figure 5.5 Other purposes for visit What OTHER reasons do you have for visiting this town centre today? Base 150
39
3230
28
22
13 13 129
6 5
0
10
20
30
40
50
Café/resta
urants
Financial/p
rofessional s
ervice
s
Non-food shopping
Food shopping
Browsing
Retail servi
ces
Takeaway/sandwich sh
opPub
Professional h
ealth service
sWalk
Library/public halls/C
ouncil faciliti
es
%
12
_______________________________________________________________________________
CR Cameron Research: Prestwick Shopper and Resident Report
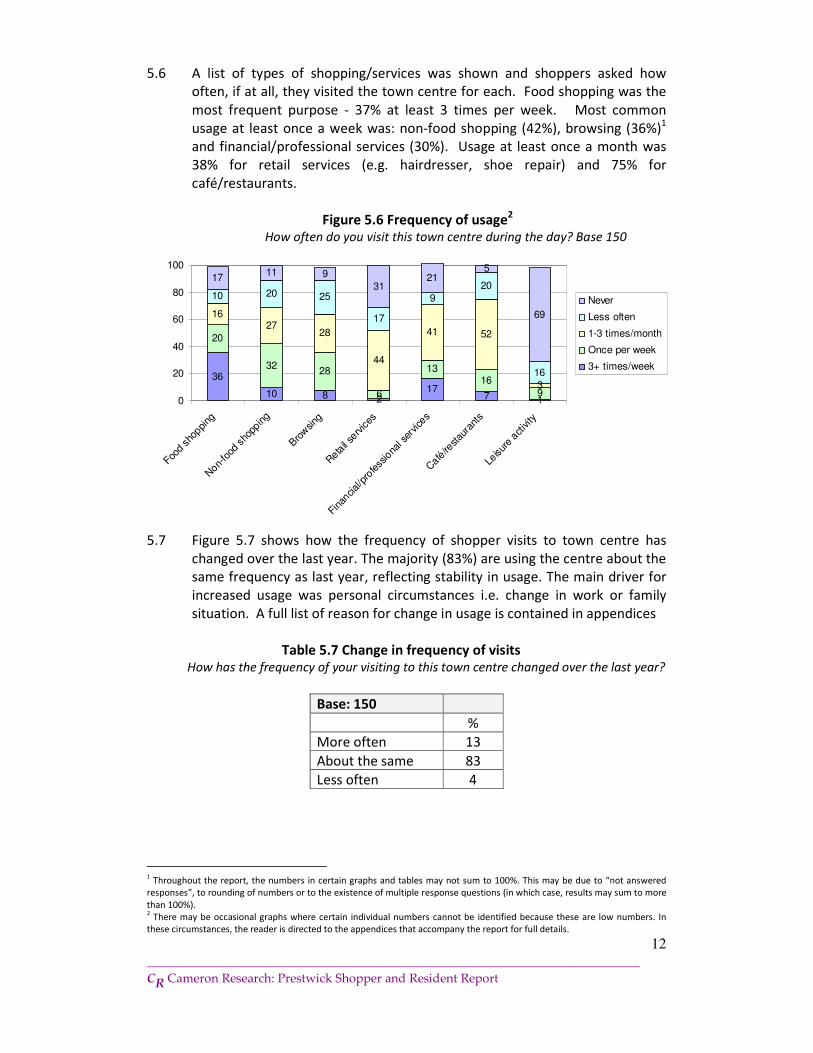
5.6 A list of types of shopping/services was shown and shoppers asked how
often, if at all, they visited the town centre for each. Food shopping was the
most frequent purpose - 37% at least 3 times per week. Most common
usage at least once a week was: non-food shopping (42%), browsing (36%)1
and financial/professional services (30%). Usage at least once a month was
38% for retail services (e.g. hairdresser, shoe repair) and 75% for
café/restaurants.
Figure 5.6 Frequency of usage2
How often do you visit this town centre during the day? Base 150
36
10 8 217
7 1
20
3228
6
1316
9
1627
28
44
41 52
3
10 20 25
17
9
20
16
1711 9
3121
5
69
0
20
40
60
80
100
Food s
hoppi
ng
Non-
food
sho
pping
Bro
wsing
Reta
il se
rvices
Finan
cial/p
rofess
iona
l ser
vice
s
Café
/restau
rant
s
Leisur
e activity
Never
Less often
1-3 times/month
Once per week
3+ times/week
5.7 Figure 5.7 shows how the frequency of shopper visits to town centre has
changed over the last year. The majority (83%) are using the centre about the
same frequency as last year, reflecting stability in usage. The main driver for
increased usage was personal circumstances i.e. change in work or family
situation. A full list of reason for change in usage is contained in appendices
Table 5.7 Change in frequency of visits How has the frequency of your visiting to this town centre changed over the last year?
Base: 150
%
More often 13
About the same 83
Less often 4
1 Throughout the report, the numbers in certain graphs and tables may not sum to 100%. This may be due to “not answered
responses”, to rounding of numbers or to the existence of multiple response questions (in which case, results may sum to more
than 100%). 2 There may be occasional graphs where certain individual numbers cannot be identified because these are low numbers. In
these circumstances, the reader is directed to the appendices that accompany the report for full details.
13
_______________________________________________________________________________
CR Cameron Research: Prestwick Shopper and Resident Report
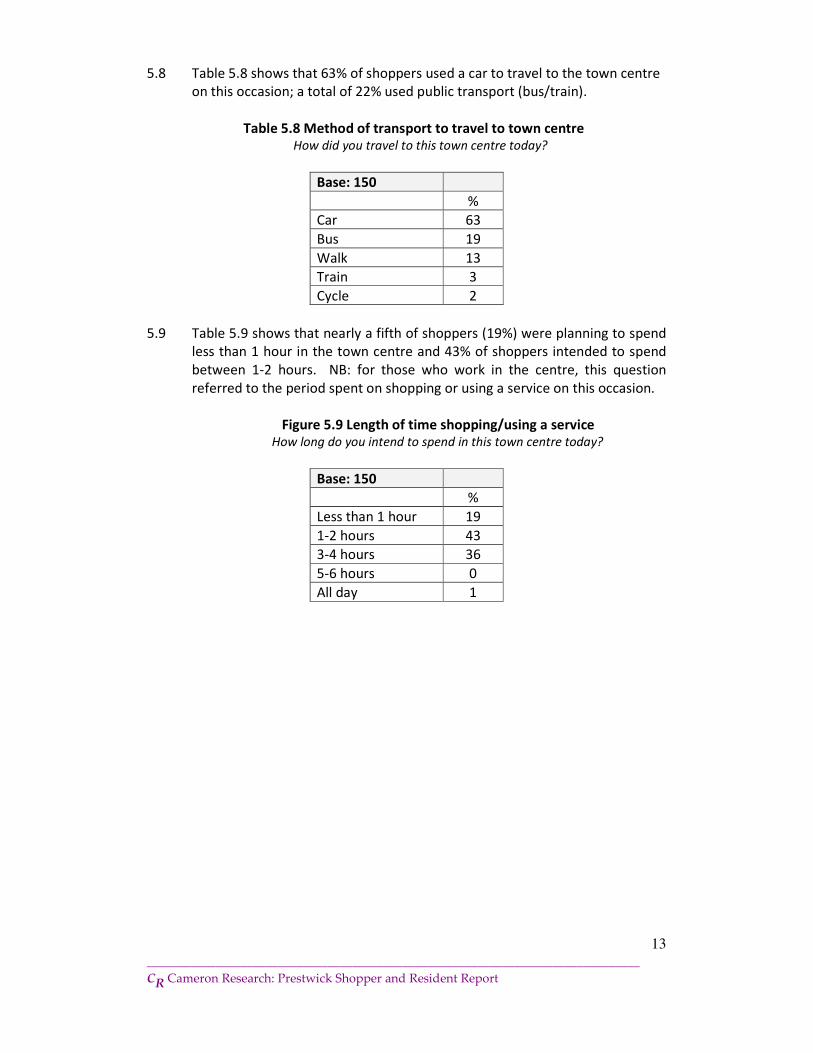
5.8 Table 5.8 shows that 63% of shoppers used a car to travel to the town centre
on this occasion; a total of 22% used public transport (bus/train).
Table 5.8 Method of transport to travel to town centre How did you travel to this town centre today?
Base: 150
%
Car 63
Bus 19
Walk 13
Train 3
Cycle 2
5.9 Table 5.9 shows that nearly a fifth of shoppers (19%) were planning to spend
less than 1 hour in the town centre and 43% of shoppers intended to spend
between 1-2 hours. NB: for those who work in the centre, this question
referred to the period spent on shopping or using a service on this occasion.
Figure 5.9 Length of time shopping/using a service How long do you intend to spend in this town centre today?
Base: 150
%
Less than 1 hour 19
1-2 hours 43
3-4 hours 36
5-6 hours 0
All day 1
14
_______________________________________________________________________________
CR Cameron Research: Prestwick Shopper and Resident Report
Purchase behaviour
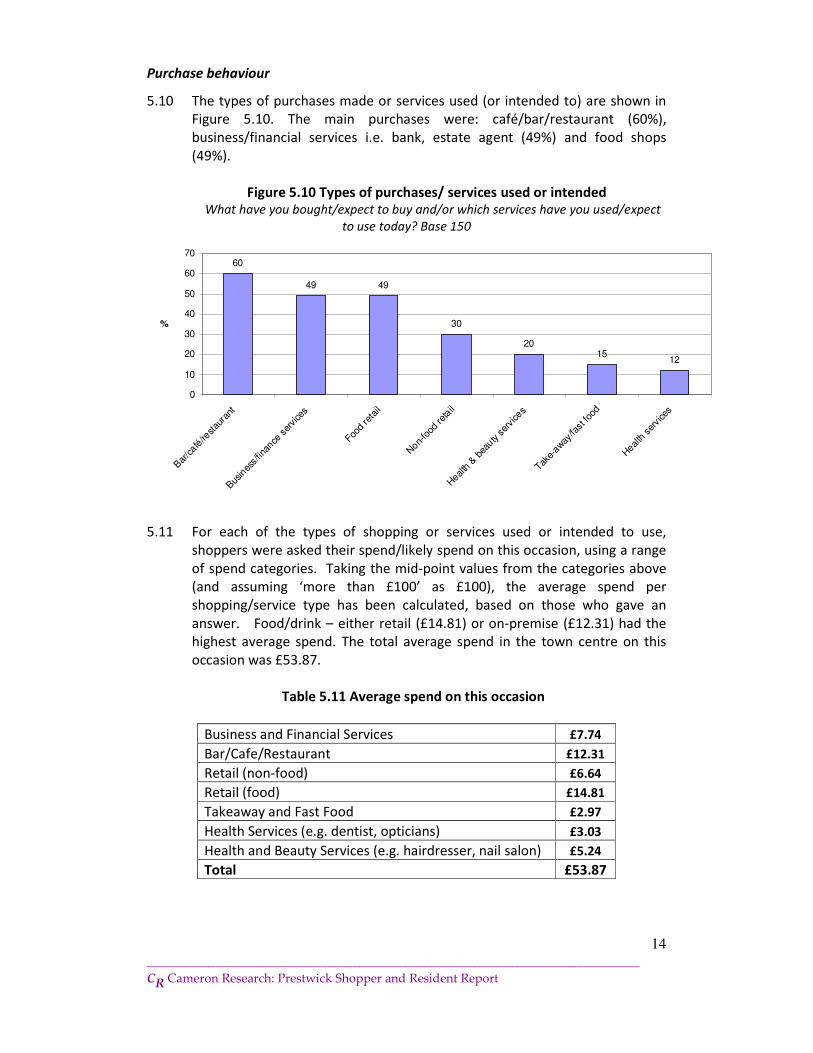
5.10 The types of purchases made or services used (or intended to) are shown in
Figure 5.10. The main purchases were: café/bar/restaurant (60%),
business/financial services i.e. bank, estate agent (49%) and food shops
(49%).
Figure 5.10 Types of purchases/ services used or intended What have you bought/expect to buy and/or which services have you used/expect
to use today? Base 150
60
49 49
30
2015
12
0
10
20
30
40
50
60
70
Bar
/café
/restau
rant
Bus
ines
s/fin
ance
ser
vice
s
Food re
tail
Non-
food
reta
il
Heal
th &
bea
uty ser
vice
s
Take-
away
/fast fo
od
Heal
th ser
vice
s
%
5.11 For each of the types of shopping or services used or intended to use,
shoppers were asked their spend/likely spend on this occasion, using a range
of spend categories. Taking the mid-point values from the categories above
(and assuming ‘more than £100’ as £100), the average spend per
shopping/service type has been calculated, based on those who gave an
answer. Food/drink – either retail (£14.81) or on-premise (£12.31) had the
highest average spend. The total average spend in the town centre on this
occasion was £53.87.
Table 5.11 Average spend on this occasion
Business and Financial Services £7.74
Bar/Cafe/Restaurant £12.31
Retail (non-food) £6.64
Retail (food) £14.81
Takeaway and Fast Food £2.97
Health Services (e.g. dentist, opticians) £3.03
Health and Beauty Services (e.g. hairdresser, nail salon) £5.24
Total £53.87
15
_______________________________________________________________________________
CR Cameron Research: Prestwick Shopper and Resident Report
Reasons for usage of town centre
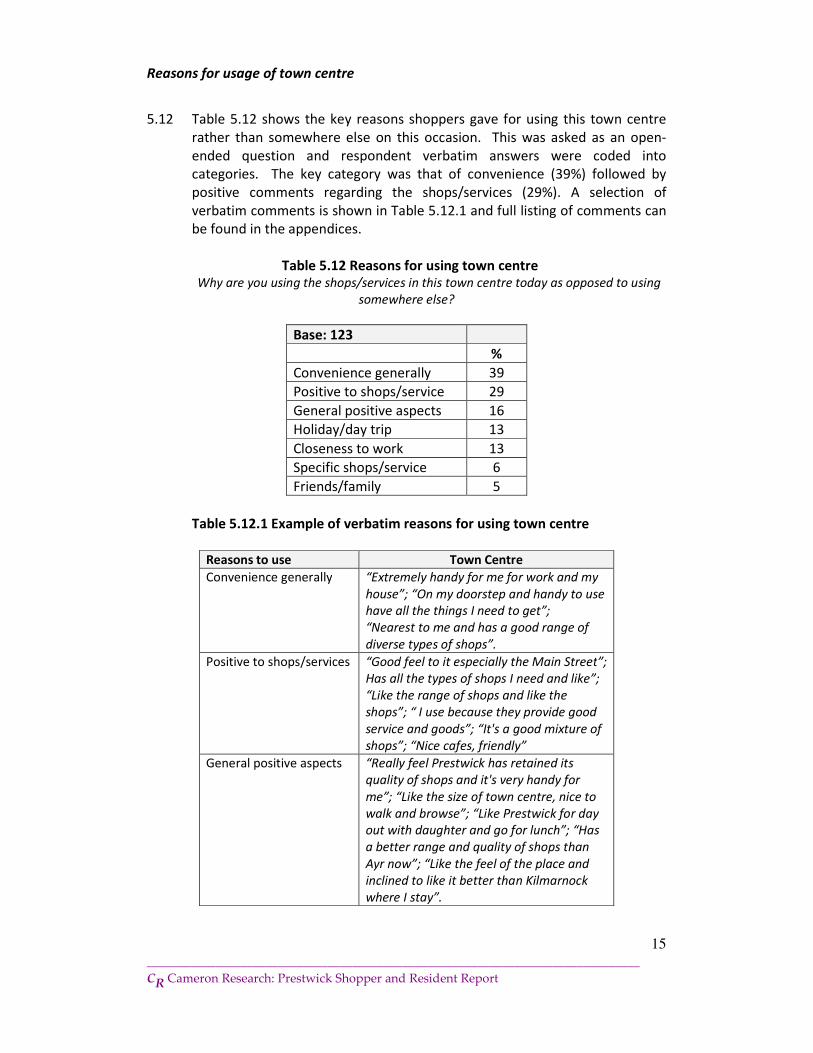
5.12 Table 5.12 shows the key reasons shoppers gave for using this town centre
rather than somewhere else on this occasion. This was asked as an open-
ended question and respondent verbatim answers were coded into
categories. The key category was that of convenience (39%) followed by
positive comments regarding the shops/services (29%). A selection of
verbatim comments is shown in Table 5.12.1 and full listing of comments can
be found in the appendices.
Table 5.12 Reasons for using town centre Why are you using the shops/services in this town centre today as opposed to using
somewhere else?
Base: 123
%
Convenience generally 39
Positive to shops/service 29
General positive aspects 16
Holiday/day trip 13
Closeness to work 13
Specific shops/service 6
Friends/family 5
Table 5.12.1 Example of verbatim reasons for using town centre
Reasons to use Town Centre
Convenience generally “Extremely handy for me for work and my
house”; “On my doorstep and handy to use
have all the things I need to get”;
“Nearest to me and has a good range of
diverse types of shops”.
Positive to shops/services “Good feel to it especially the Main Street”;
Has all the types of shops I need and like”;
“Like the range of shops and like the
shops”; “ I use because they provide good
service and goods”; “It's a good mixture of
shops”; “Nice cafes, friendly”
General positive aspects “Really feel Prestwick has retained its
quality of shops and it's very handy for
me”; “Like the size of town centre, nice to
walk and browse”; “Like Prestwick for day
out with daughter and go for lunch”; “Has
a better range and quality of shops than
Ayr now”; “Like the feel of the place and
inclined to like it better than Kilmarnock
where I stay”.
16
_______________________________________________________________________________
CR Cameron Research: Prestwick Shopper and Resident Report
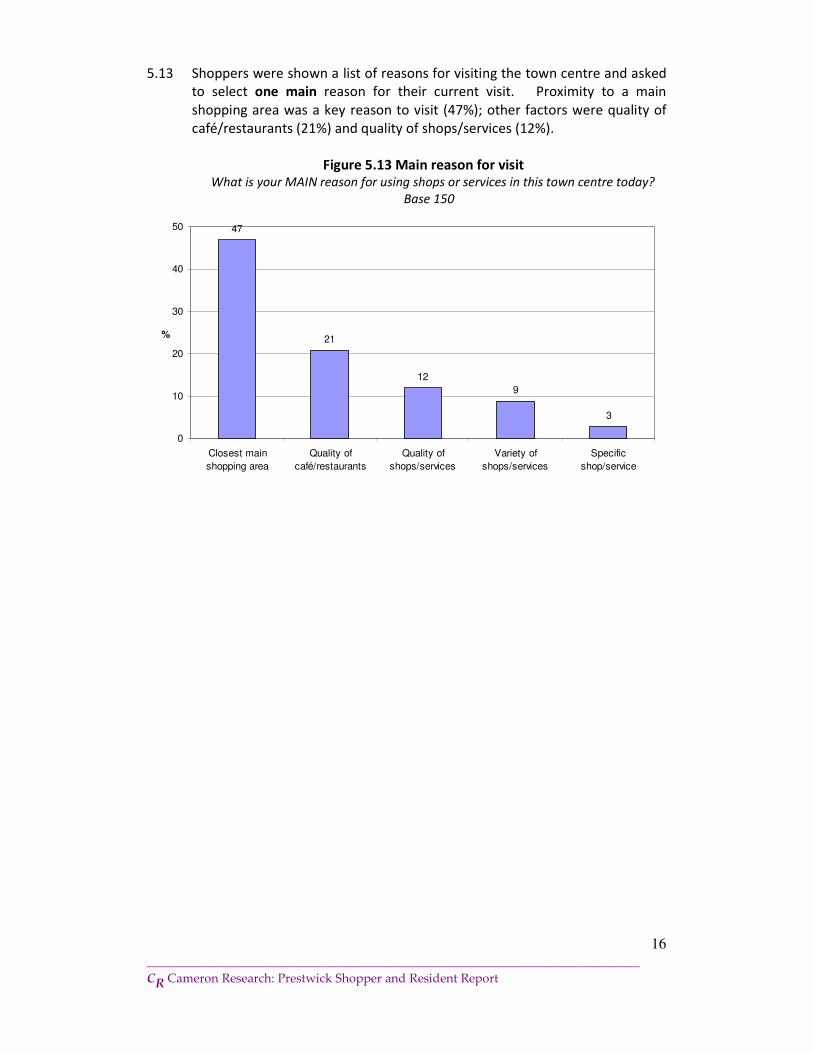
5.13 Shoppers were shown a list of reasons for visiting the town centre and asked
to select one main reason for their current visit. Proximity to a main
shopping area was a key reason to visit (47%); other factors were quality of
café/restaurants (21%) and quality of shops/services (12%).
Figure 5.13 Main reason for visit What is your MAIN reason for using shops or services in this town centre today?
Base 150
47
21
12
9
3
0
10
20
30
40
50
Closest main
shopping area
Quality of
café/restaurants
Quality of
shops/services
Variety of
shops/services
Specific
shop/service
%
17
_______________________________________________________________________________
CR Cameron Research: Prestwick Shopper and Resident Report
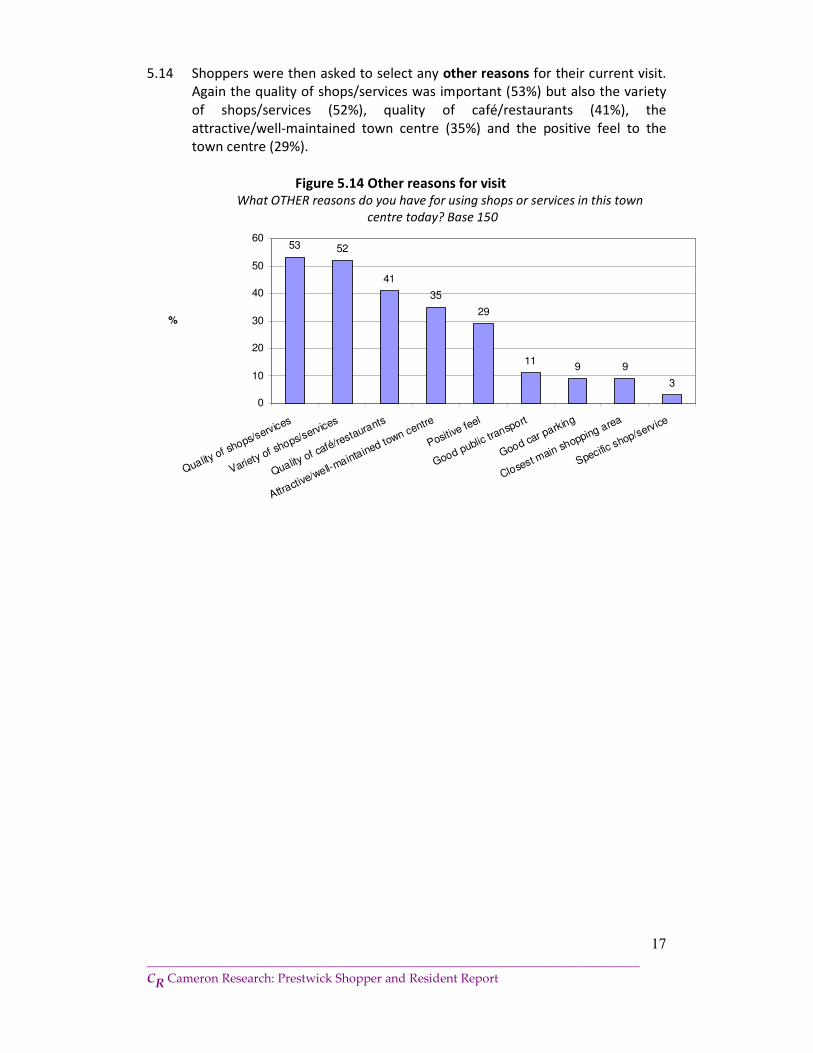
5.14 Shoppers were then asked to select any other reasons for their current visit.
Again the quality of shops/services was important (53%) but also the variety
of shops/services (52%), quality of café/restaurants (41%), the
attractive/well-maintained town centre (35%) and the positive feel to the
town centre (29%).
Figure 5.14 Other reasons for visit What OTHER reasons do you have for using shops or services in this town
centre today? Base 150
53 52
41
35
29
119 9
3
0
10
20
30
40
50
60
Quality of shops/services
Variety of shops/services
Quality of café/restaurants
Attractive/well-m
aintained town centre
Positive feel
Good public transport
Good car parking
Closest main shopping area
Specific shop/service
%
18
_______________________________________________________________________________
CR Cameron Research: Prestwick Shopper and Resident Report
Attitudes and factors that would encourage usage
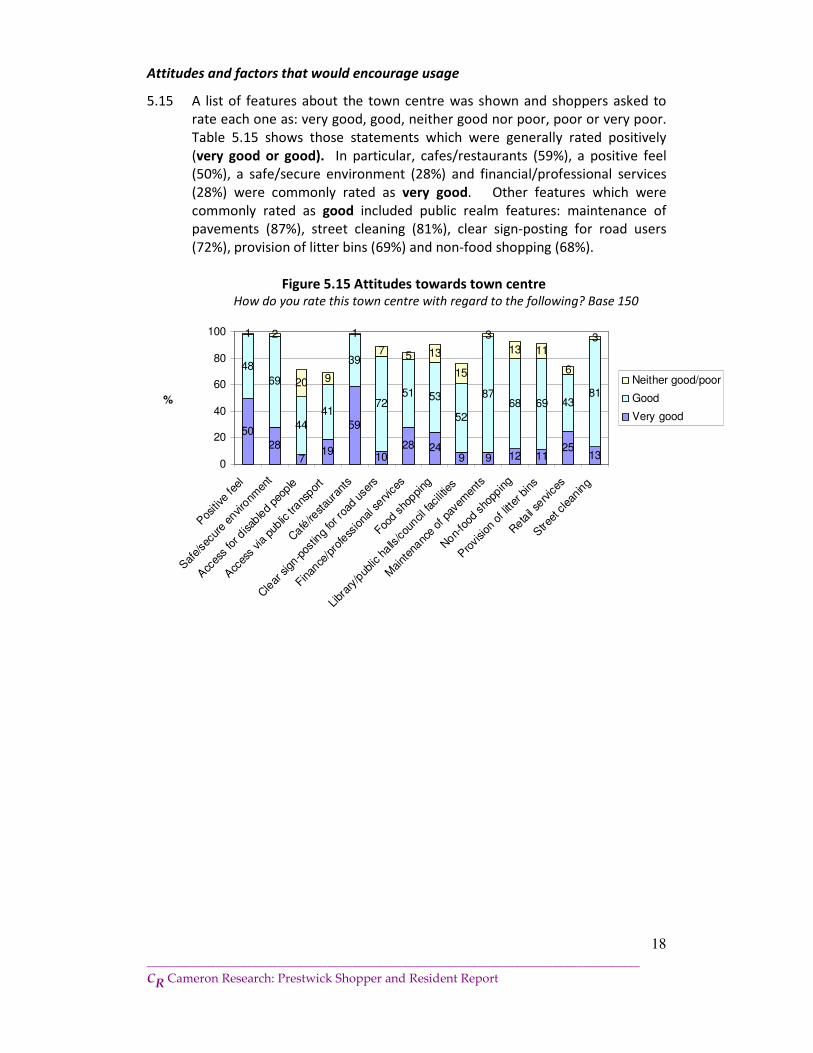
5.15 A list of features about the town centre was shown and shoppers asked to
rate each one as: very good, good, neither good nor poor, poor or very poor.
Table 5.15 shows those statements which were generally rated positively
(very good or good). In particular, cafes/restaurants (59%), a positive feel
(50%), a safe/secure environment (28%) and financial/professional services
(28%) were commonly rated as very good. Other features which were
commonly rated as good included public realm features: maintenance of
pavements (87%), street cleaning (81%), clear sign-posting for road users
(72%), provision of litter bins (69%) and non-food shopping (68%).
Figure 5.15 Attitudes towards town centre How do you rate this town centre with regard to the following? Base 150
50
28
719
59
1028 24
9 9 12 1125
13
48
69
44
41
39
7251 53
52
8768 69 43
81
1 2
20 9
1
7 5 13
15
3
13 11
6
3
0
20
40
60
80
100
Pos
itive
feel
Saf
e/se
cure
envi
ronm
ent
Acc
ess
for d
isab
led
peop
le
Acc
ess
via
public
trans
port
Café
/restau
rant
s
Cle
ar sign-p
ostin
g for r
oad
user
s
Finan
ce/p
rofe
ssiona
l serv
ices
Food s
hoppi
ng
Libr
ary/pub
lic h
alls/cou
ncil fac
ilitie
s
Maint
enanc
e of p
avem
ents
Non-
food
sho
pping
Pro
vision
of l
itter
bins
Reta
il se
rvices
Stre
et clean
ing
%
Neither good/poor
Good
Very good
19
_______________________________________________________________________________
CR Cameron Research: Prestwick Shopper and Resident Report
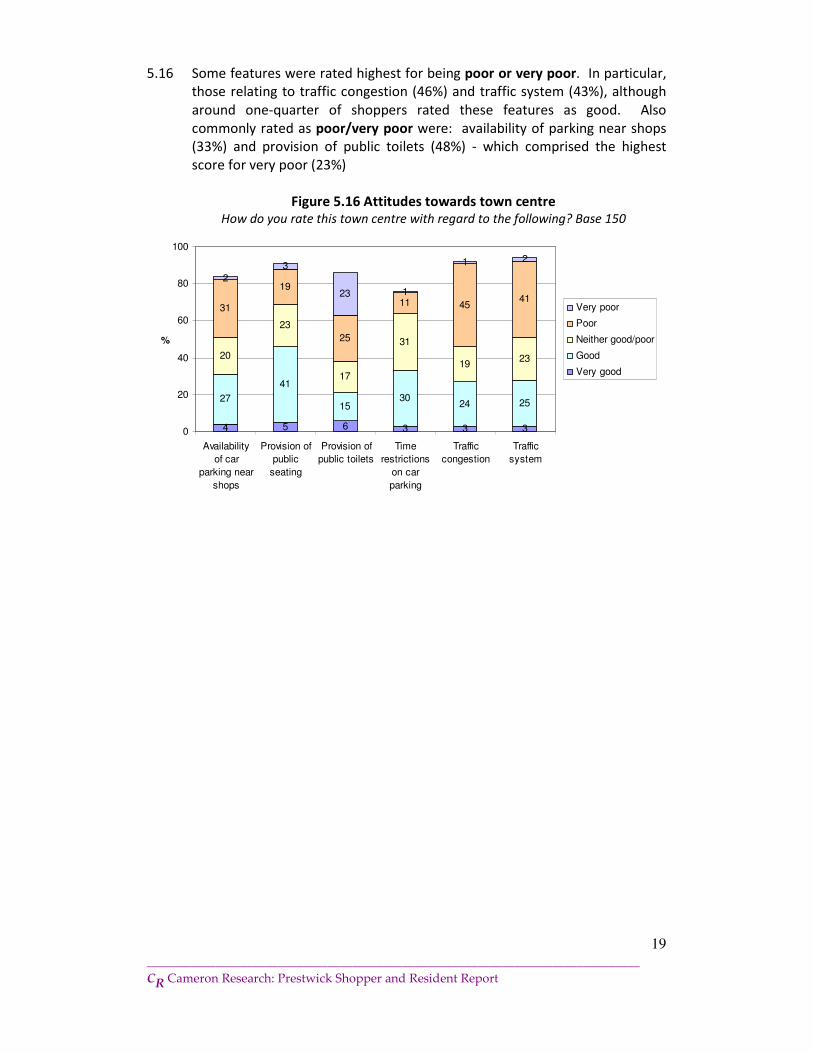
5.16 Some features were rated highest for being poor or very poor. In particular,
those relating to traffic congestion (46%) and traffic system (43%), although
around one-quarter of shoppers rated these features as good. Also
commonly rated as poor/very poor were: availability of parking near shops
(33%) and provision of public toilets (48%) - which comprised the highest
score for very poor (23%)
Figure 5.16 Attitudes towards town centre How do you rate this town centre with regard to the following? Base 150
4 5 6 3 3 3
27
41
1530
24 25
20
23
17
31
1923
31
19
25
11 4541
2
3
23 1
1 2
0
20
40
60
80
100
Availability
of car
parking near
shops
Provision of
public
seating
Provision of
public toilets
Time
restrictions
on car
parking
Traffic
congestion
Traffic
system
%
Very poor
Poor
Neither good/poor
Good
Very good
20
_______________________________________________________________________________
CR Cameron Research: Prestwick Shopper and Resident Report
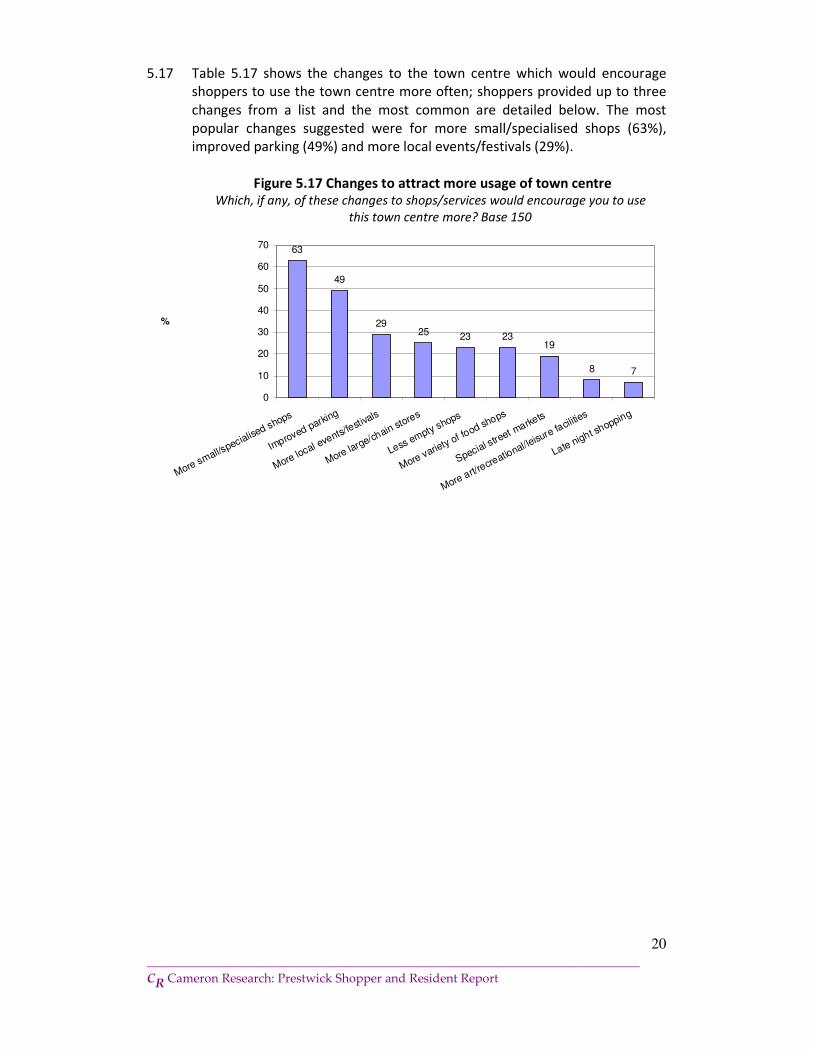
5.17 Table 5.17 shows the changes to the town centre which would encourage
shoppers to use the town centre more often; shoppers provided up to three
changes from a list and the most common are detailed below. The most
popular changes suggested were for more small/specialised shops (63%),
improved parking (49%) and more local events/festivals (29%).
Figure 5.17 Changes to attract more usage of town centre Which, if any, of these changes to shops/services would encourage you to use
this town centre more? Base 150
63
49
2925 23 23
19
8 7
0
10
20
30
40
50
60
70
More small/specialise
d shops
Improved parki
ng
More local events/f
estivals
More large/chain st
ores
Less empty shops
More variety of fo
od shops
Special street m
arkets
More art/recre
ational/leisu
re facili
ties
Late night shopping
%
21
_______________________________________________________________________________
CR Cameron Research: Prestwick Shopper and Resident Report
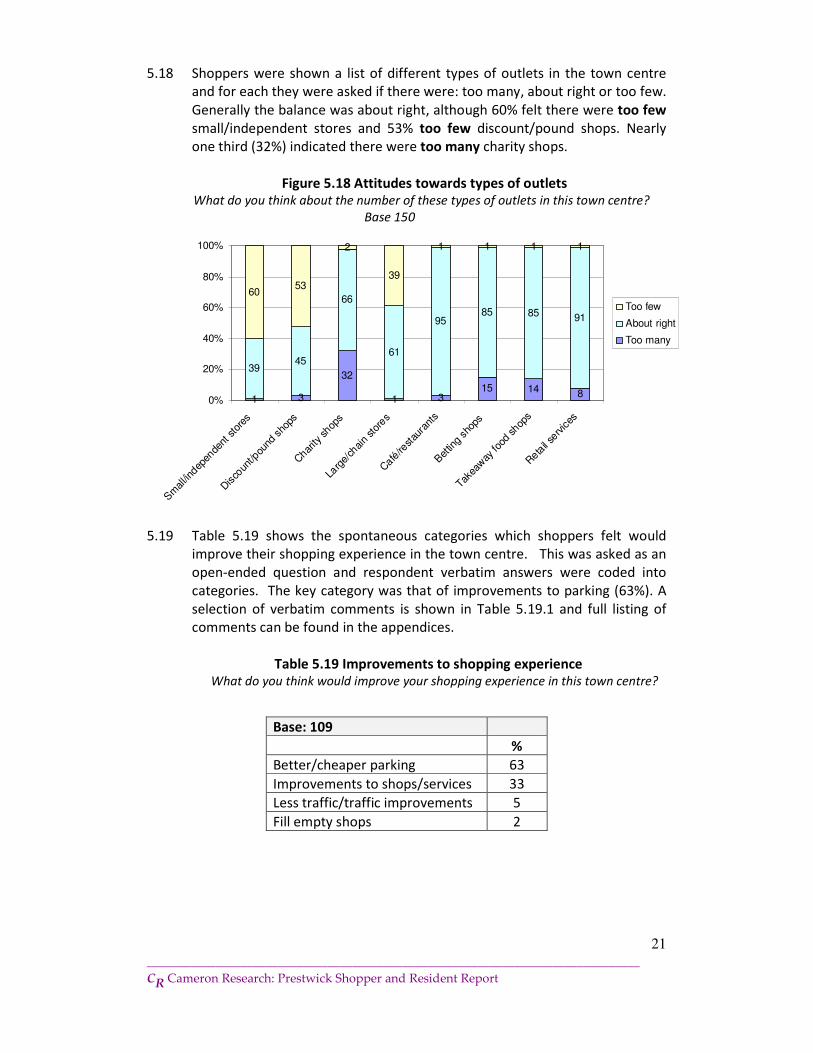
5.18 Shoppers were shown a list of different types of outlets in the town centre
and for each they were asked if there were: too many, about right or too few.
Generally the balance was about right, although 60% felt there were too few
small/independent stores and 53% too few discount/pound shops. Nearly
one third (32%) indicated there were too many charity shops.
Figure 5.18 Attitudes towards types of outlets What do you think about the number of these types of outlets in this town centre?
Base 150
1 3
32
1 315 14 8
3945
66
61
9585 85 91
6053
2
39
1 1 1 1
0%
20%
40%
60%
80%
100%
Sm
all/in
depen
dent
sto
res
Disco
unt/p
ound
sho
ps
Char
ity shop
s
Larg
e/ch
ain
stor
es
Café
/restau
rant
s
Bet
ting s
hops
Takea
way
food
shop
s
Reta
il se
rvices
Too few
About right
Too many
5.19 Table 5.19 shows the spontaneous categories which shoppers felt would
improve their shopping experience in the town centre. This was asked as an
open-ended question and respondent verbatim answers were coded into
categories. The key category was that of improvements to parking (63%). A
selection of verbatim comments is shown in Table 5.19.1 and full listing of
comments can be found in the appendices.
Table 5.19 Improvements to shopping experience What do you think would improve your shopping experience in this town centre?
Base: 109
%
Better/cheaper parking 63
Improvements to shops/services 33
Less traffic/traffic improvements 5
Fill empty shops 2
22
_______________________________________________________________________________
CR Cameron Research: Prestwick Shopper and Resident Report
Table 5.19.1 Example of verbatim reasons for improving town centre
Reasons to use Town Centre
Better/cheaper parking ”Better car parking with more on
street parking”;
“Better to get on street parking, get
it sorted out”;
“Car parking signs highlighted”;
“Give us a better car parking system,
more parking spaces”;
“More parking provided especially
beside the main shops”
Improvements to
shops/services
“A wider range of shops, especially
food shops, maybe a wider spread of
quality shops”;
“Farmers and xmas markets”;
“More brand name shops”;
“More clothing, shoe shops;”
“Large clothes shop”
Usage of different locations for shopping/services
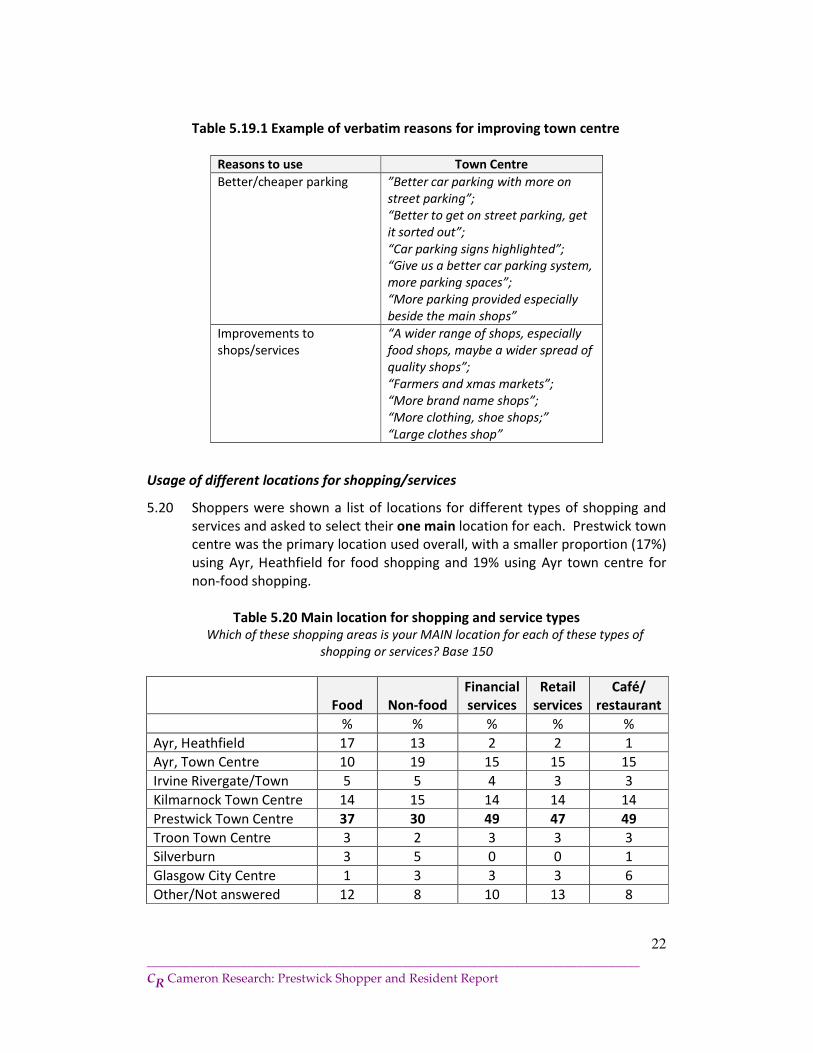
5.20 Shoppers were shown a list of locations for different types of shopping and
services and asked to select their one main location for each. Prestwick town
centre was the primary location used overall, with a smaller proportion (17%)
using Ayr, Heathfield for food shopping and 19% using Ayr town centre for
non-food shopping.
Table 5.20 Main location for shopping and service types Which of these shopping areas is your MAIN location for each of these types of
shopping or services? Base 150
Food Non-food
Financial
services
Retail
services
Café/
restaurant
% % % % %
Ayr, Heathfield 17 13 2 2 1
Ayr, Town Centre 10 19 15 15 15
Irvine Rivergate/Town 5 5 4 3 3
Kilmarnock Town Centre 14 15 14 14 14
Prestwick Town Centre 37 30 49 47 49
Troon Town Centre 3 2 3 3 3
Silverburn 3 5 0 0 1
Glasgow City Centre 1 3 3 3 6
Other/Not answered 12 8 10 13 8
23
_______________________________________________________________________________
CR Cameron Research: Prestwick Shopper and Resident Report
5.21 Shoppers were then asked to select any other locations for shopping and
services. Ayr town centre was a key other location for: café/restaurants
(49%), financial services (40%), non-food shopping (37%) and retail services
(33%). Ayr, Heathfield was the highest other location for food shopping
(37%). Glasgow city centre was used by 24% of respondents for non-food
shopping and Silverburn by 25%.
Table 5.21 Other locations used for shopping and services Which OTHER shopping areas do you use for each of these types of shopping or
services? Base 150
Food Non-food
Financial
services
Retail
services
Café/
restaurant
% % % % %
Ayr, Heathfield 37 26 3 2 2
Ayr, Town Centre 19 37 40 33 49
Irvine Rivergate/Town 7 8 4 4 4
Kilmarnock Town Centre 6 11 4 3 5
Prestwick Town Centre 22 27 23 17 27
Troon Town Centre 6 3 4 5 11
Silverburn 3 25 2 0 9
Glasgow City Centre 8 24 17 9 26
5.22 Shoppers were given a list of reasons why they might mainly use a shopping
or service location and asked to select as many as applied; the most common
responses are shown below. For all types of shopping and services, the
closeness of the location as main shopping area was a key reason for use. For
food and non-food shopping, a variety of shops/services (31% and 38%
respectively). Quality of shops/services and quality of café/restaurants was
also a factor
Table 5.22 Reasons to use main location for shopping and services What are your reasons for using this location for this type of shopping/services?
Food Non-food
Financial
services
Retail
services
Café/
restaurant
% % % % %
Closest main shopping area 82 69 53 49 45
Variety of shops and services 31 38 15 24 16
Quality of shops and services 21 26 19 28 21
Quality of café/restaurant 3 3 4 5 51
Good car parking 20 20 10 9 7
Good public transport 6 5 5 5 5
Attractive/well-maintained 5 3 3 2 5
Positive feel to environment 2 5 5 3 4
24
_______________________________________________________________________________
CR Cameron Research: Prestwick Shopper and Resident Report
Evening usage of town centre
5.23 Of the 150 shoppers interviewed, 45% visited the town centre in the evening
and 54% did not. Those who did not most commonly gave the following
reasons: no need/ don’t go out 65% and prefer to go elsewhere 43%.
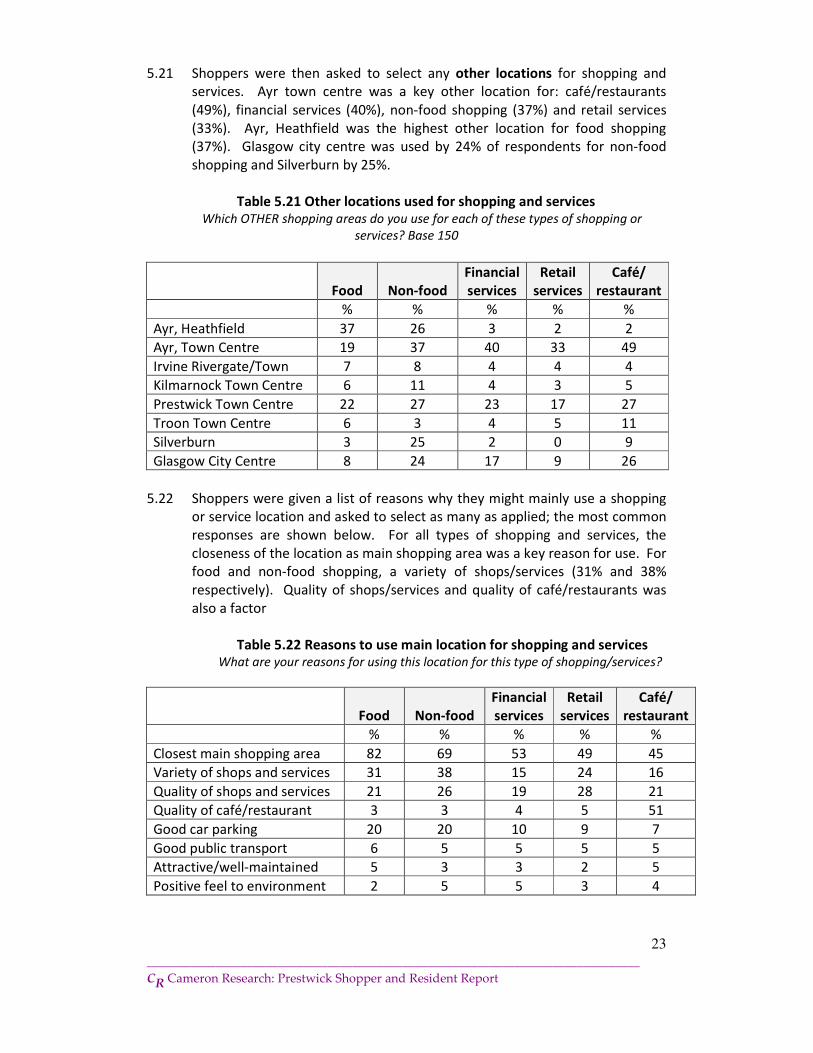
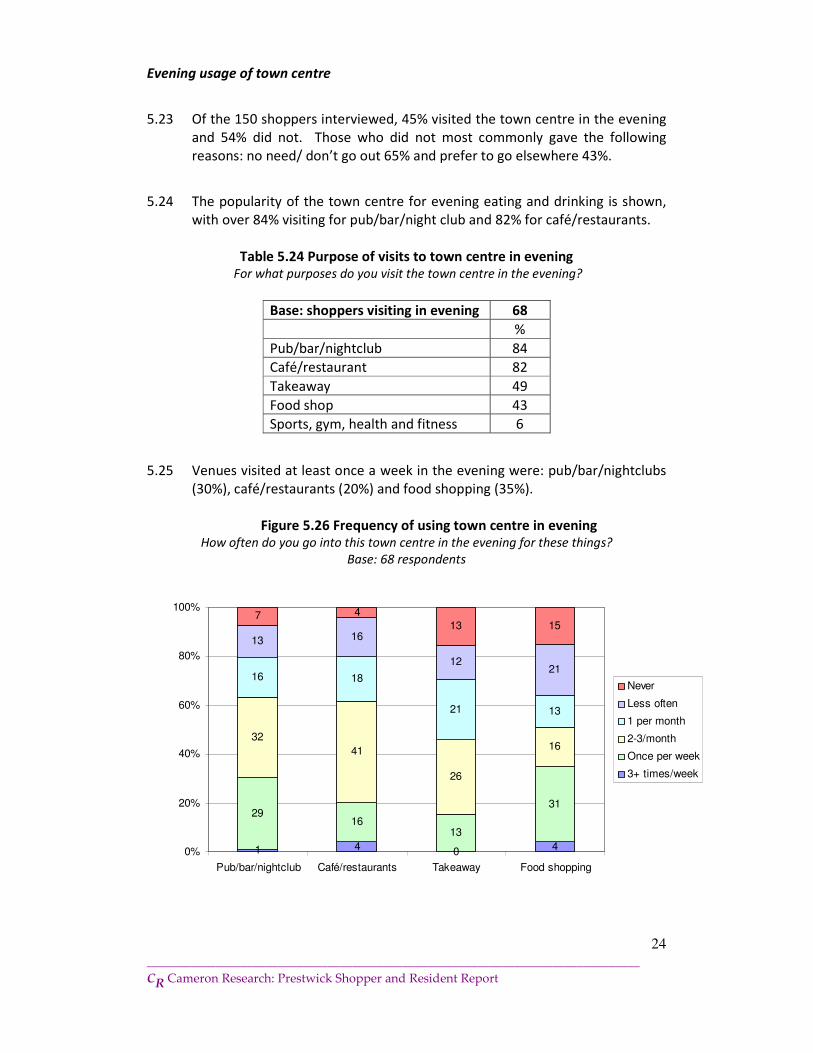
5.24 The popularity of the town centre for evening eating and drinking is shown,
with over 84% visiting for pub/bar/night club and 82% for café/restaurants.
Table 5.24 Purpose of visits to town centre in evening For what purposes do you visit the town centre in the evening?
Base: shoppers visiting in evening 68
%
Pub/bar/nightclub 84
Café/restaurant 82
Takeaway 49
Food shop 43
Sports, gym, health and fitness 6
5.25 Venues visited at least once a week in the evening were: pub/bar/nightclubs
(30%), café/restaurants (20%) and food shopping (35%).
Figure 5.26 Frequency of using town centre in evening How often do you go into this town centre in the evening for these things?
Base: 68 respondents
1 4 0 4
2916
13
31
32
41
26
16
16 18
21 13
13 16
1221
7 4
13 15
0%
20%
40%
60%
80%
100%
Pub/bar/nightclub Café/restaurants Takeaway Food shopping
Never
Less often
1 per month
2-3/month
Once per week
3+ times/week
25
_______________________________________________________________________________
CR Cameron Research: Prestwick Shopper and Resident Report
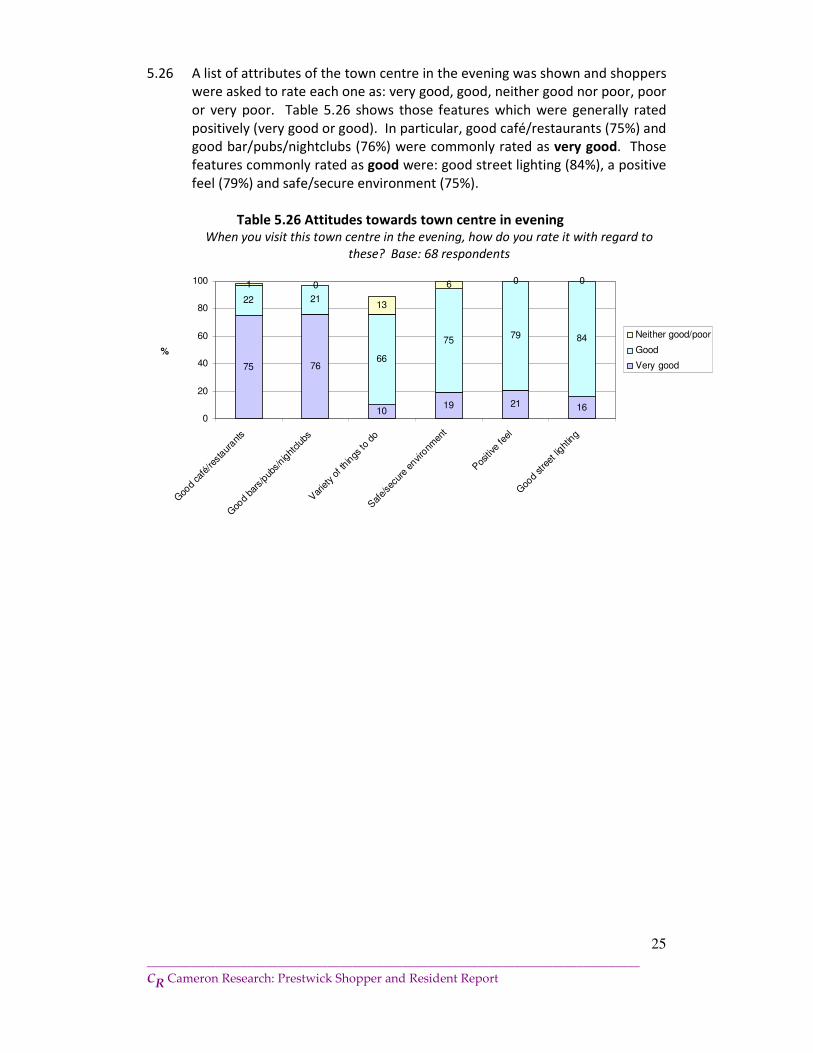
5.26 A list of attributes of the town centre in the evening was shown and shoppers
were asked to rate each one as: very good, good, neither good nor poor, poor
or very poor. Table 5.26 shows those features which were generally rated
positively (very good or good). In particular, good café/restaurants (75%) and
good bar/pubs/nightclubs (76%) were commonly rated as very good. Those
features commonly rated as good were: good street lighting (84%), a positive
feel (79%) and safe/secure environment (75%).
Table 5.26 Attitudes towards town centre in evening When you visit this town centre in the evening, how do you rate it with regard to
these? Base: 68 respondents
75 76
1019 21 16
22 21
66
7579 84
1 0
13
6 0 0
0
20
40
60
80
100
Goo
d ca
fé/re
staur
ants
Goo
d ba
rs/p
ubs/nig
htclub
s
Var
iety
of t
hings
to d
o
Saf
e/se
cure
envi
ronm
ent
Pos
itive
feel
Goo
d stre
et light
ing
%
Neither good/poor
Good
Very good
26
_______________________________________________________________________________
CR Cameron Research: Prestwick Shopper and Resident Report
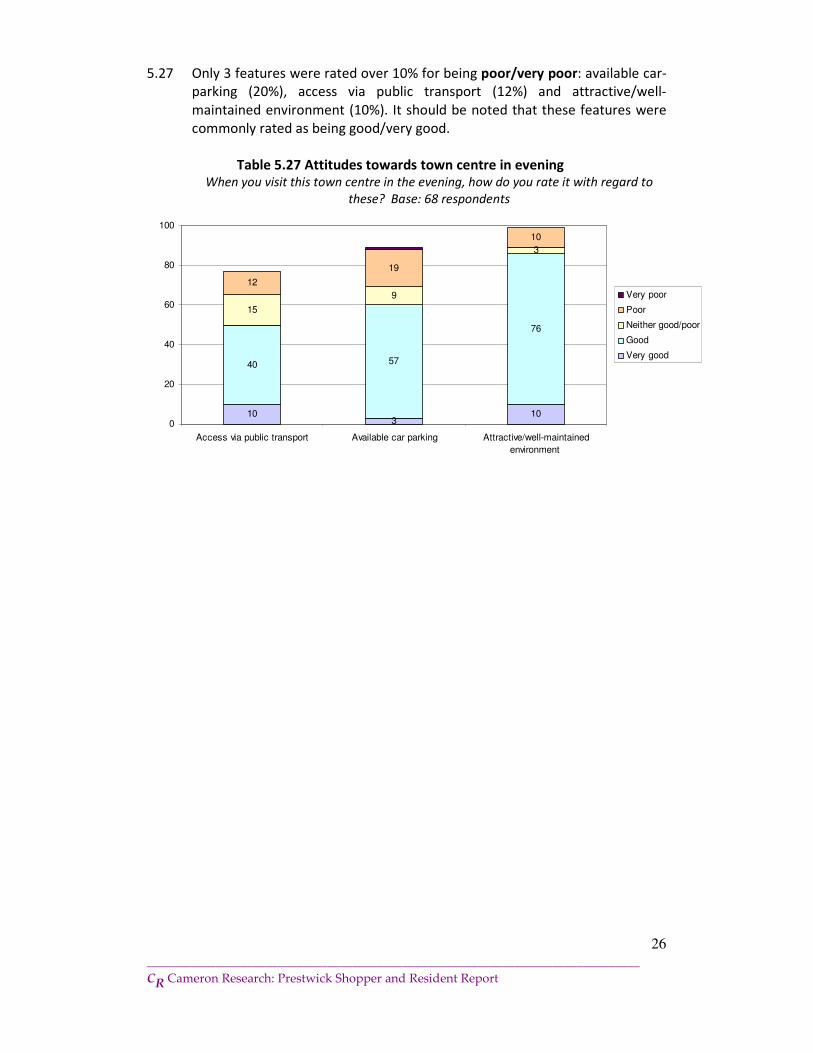
5.27 Only 3 features were rated over 10% for being poor/very poor: available car-
parking (20%), access via public transport (12%) and attractive/well-
maintained environment (10%). It should be noted that these features were
commonly rated as being good/very good.
Table 5.27 Attitudes towards town centre in evening When you visit this town centre in the evening, how do you rate it with regard to
these? Base: 68 respondents
103
10
40 57
76
15
9
3
12
19
10
0
20
40
60
80
100
Access via public transport Available car parking Attractive/well-maintained
environment
Very poor
Poor
Neither good/poor
Good
Very good
27
_______________________________________________________________________________
CR Cameron Research: Prestwick Shopper and Resident Report
6.0 PRESTWICK RESIDENT SUMMARY
Resident profile
53% of respondents were female and 47% were male; this is in-line with the
demographic profile of South Ayrshire. Residents were from a range of age groups,
with 47% aged 55+. The occupational status of the head of household was mainly
working (51%) and 33% were retired.
Overall usage
The key main purposes for visiting Ayr town centre were: use of
financial/professional services (22%) and non-food shopping (19%). Other purposes
most commonly cited included: food shopping (61%), non-food shopping (54%),
professional health services (52%) and financial/professional services (32%).
Residents are making regular visits to the town centre: about one-third of residents
visit at least three times a week for food shopping (35%) and non-food shopping
(33%) and 57% visit the town at least once a week to browse/window shop. The
financial/professional service sector is used at least once a week by 43% of residents.
Frequency of usage of the town centre has been fairly stable in the past year, with
76% of residents claiming no change in usage frequency. Nearly half (43%) of
residents normally walk to the town centre and 35% use a car. The majority (81%)
generally spend under 2 hours in the town centre, 25% less than one hour.
Purchase behaviour
The main purchases made or services used at residents’ last visit to the town centre
were business/financial services (45%), food shops (37%) and bar/café/restaurants
(32%), reflecting the wide variety of outlets available. The total average spend in
Prestwick town centre on residents’ most recent visit was £51.56, with the highest
average spend being on non-food retail (£12.81).
The key main reason for residents visiting Prestwick was the convenience of it being
the closest main shopping area (78%); residents also made positive comments on the
shops/services and on the people/friendliness: “Most of what you need can be got in
Town centre, “Handy for everyday things”, “nice people and I like the feel of it”,
“great community spirit”.
These comments are supported by prompted other reasons for visiting Prestwick:
positive feel (71%), attractive and well-maintained town centre (66%) and the quality
of the shops/services (62%).
28
_______________________________________________________________________________
CR Cameron Research: Prestwick Shopper and Resident Report
Attitudes and factors that would increase usage
The features in Prestwick town centre that were most commonly rated as very good
were: a positive feel (38%) and a safe/secure environment (33%). Also rated as good
were: presence of financial/professional services (90%), cafes/restaurants (82%) and
library/public hall/Council services (82%).
The town centre was rated most commonly as very poor for: provision of public
toilets (57%), availability of public seating (34%) and availability of car parking near
to shops (33%). Also rated as poor/very poor were: traffic congestion (74%) and the
traffic system (61%).
The most popular changes which would encourage increased use of the town centre
were more small/specialised shops (66%) and improved parking facilities (60%).
Residents felt there were too few large/chain stores (44%), small/ independent
stores (36%) and discount/pound shops (35%). Nearly half (47%) felt there were too
many charity shops.
The highest spontaneous category for improving shopping experience was
improvements to shops/services (57%): “Have a Clarks shoe shop”, “Would like a
Pizzeria”, “Use Broadway Centre as an Arts Centre like Harbour Arts in Irvine”, “Stop
HGV coming along the Main street”, “Need a TK Max or Matalan”, “Less charity
shops, need more clothes shops”.
Usage of different locations for shopping/services
The main location used for different types of services was Prestwick town centre: it
was the main location used for financial services 82%, retail services 78% and
café/restaurants 83%. Ayr was the main location for shopping: food shopping at
Heathfield (66%) and non-food shopping at Heathfield and Ayr town centre.
Analysis of the other locations used for shops and services shows that Ayr town
centre is a support location for use of financial and retail services and also for
cafes/restaurants.
Good car parking was a key reason (72%) to select a main location for food shopping
and the variety of shops/service for non-food shopping (71%).
Evening usage of town centre
59% of residents visited the town centre in the evening and, of these, 76% are
visiting café/restaurants and 61% pubs/bars/nightclubs. Usage at least once a week
was 23% for pubs/bars/nightclubs and 22% for café/restaurants.
29
_______________________________________________________________________________
CR Cameron Research: Prestwick Shopper and Resident Report
Most features of the town centre in the evening were rated positively. Those most
commonly rated as very good/good included: good café/restaurants, good
bars/pubs/nightclubs, good street lighting, safe/secure environment, positive feel,
good public transport and attractive/well-maintained town centre. A small
proportion (36%) rated available car parking as poor/very poor.
30
_______________________________________________________________________________
CR Cameron Research: Prestwick Shopper and Resident Report
7.0 PRESTWICK RESIDENT KEY FINDINGS: TOWN CENTRE
Resident profile
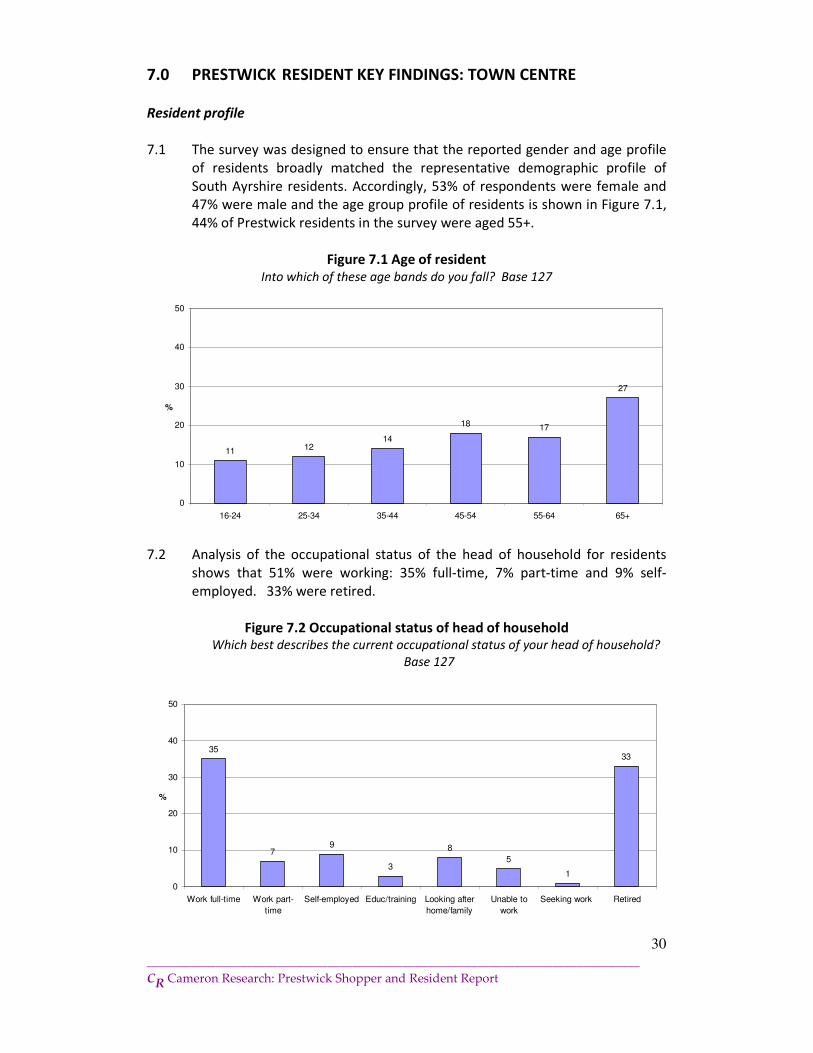
7.1 The survey was designed to ensure that the reported gender and age profile
of residents broadly matched the representative demographic profile of
South Ayrshire residents. Accordingly, 53% of respondents were female and
47% were male and the age group profile of residents is shown in Figure 7.1,
44% of Prestwick residents in the survey were aged 55+.
Figure 7.1 Age of resident
Into which of these age bands do you fall? Base 127
11 1214
18 17
27
0
10
20
30
40
50
16-24 25-34 35-44 45-54 55-64 65+
%
7.2 Analysis of the occupational status of the head of household for residents
shows that 51% were working: 35% full-time, 7% part-time and 9% self-
employed. 33% were retired.
Figure 7.2 Occupational status of head of household Which best describes the current occupational status of your head of household?
Base 127
35
79
3
8
5
1
33
0
10
20
30
40
50
Work full-time Work part-
time
Self-employed Educ/training Looking after
home/family
Unable to
work
Seeking work Retired
%
31
_______________________________________________________________________________
CR Cameron Research: Prestwick Shopper and Resident Report
Overall usage
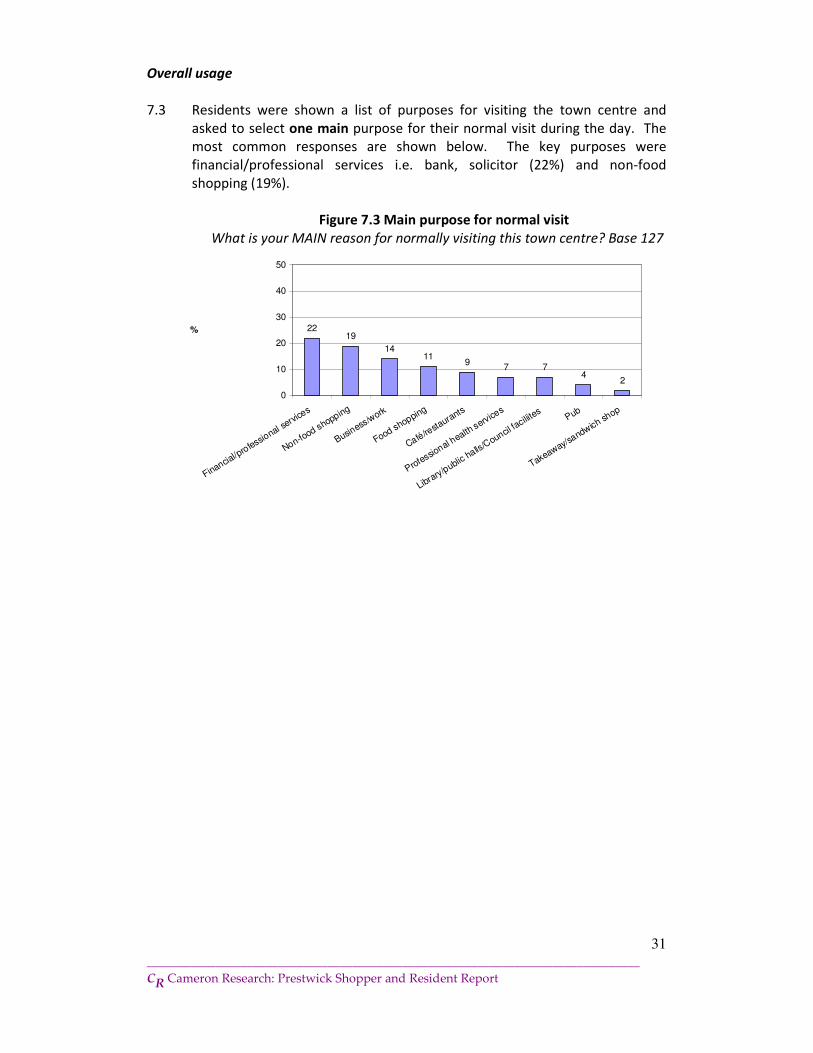
7.3 Residents were shown a list of purposes for visiting the town centre and
asked to select one main purpose for their normal visit during the day. The
most common responses are shown below. The key purposes were
financial/professional services i.e. bank, solicitor (22%) and non-food
shopping (19%).
Figure 7.3 Main purpose for normal visit
What is your MAIN reason for normally visiting this town centre? Base 127
2219
1411
97 7
42
0
10
20
30
40
50
Financial/p
rofessio
nal servi
ces
Non-food shopping
Business
/work
Food shopping
Café/resta
urants
Professional h
ealth service
s
Library/public
halls/C
ouncil fa
ciliites
Pub
Takeaway/sandwich sh
op
%
32
_______________________________________________________________________________
CR Cameron Research: Prestwick Shopper and Resident Report
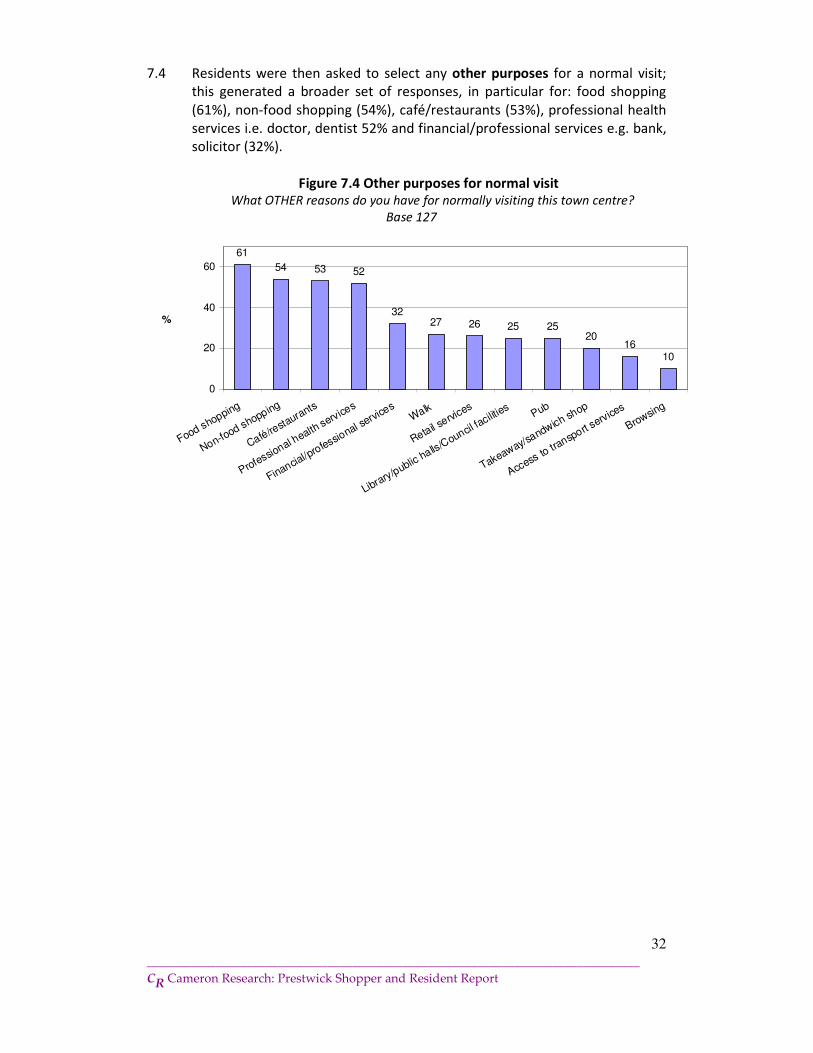
7.4 Residents were then asked to select any other purposes for a normal visit;
this generated a broader set of responses, in particular for: food shopping
(61%), non-food shopping (54%), café/restaurants (53%), professional health
services i.e. doctor, dentist 52% and financial/professional services e.g. bank,
solicitor (32%).
Figure 7.4 Other purposes for normal visit What OTHER reasons do you have for normally visiting this town centre?
Base 127
61
54 53 52
3227 26 25 25
2016
10
0
20
40
60
Food shopping
Non-food shopping
Café/resta
urants
Professional h
ealth service
s
Financial/p
rofessional s
ervice
sWalk
Retail servi
ces
Library/public halls/C
ouncil faciliti
esPub
Takeaway/sandwich sh
op
Access
to tra
nsport s
ervices
Browsing
%
33
_______________________________________________________________________________
CR Cameron Research: Prestwick Shopper and Resident Report
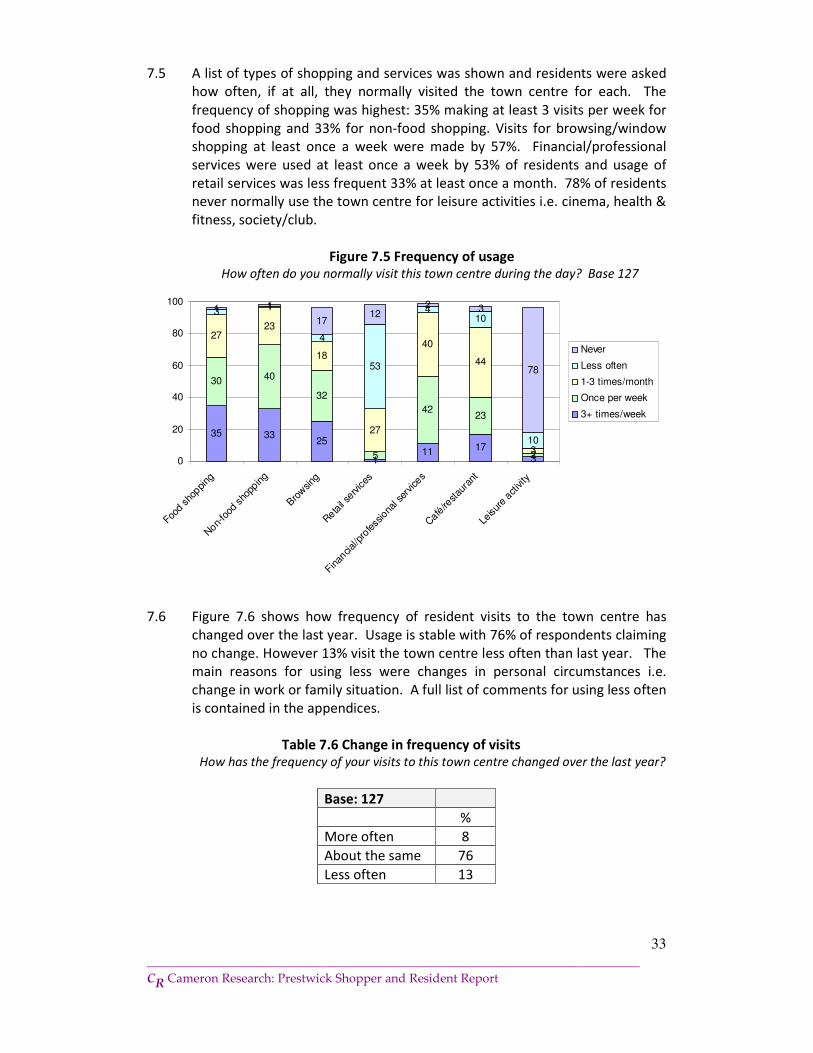
7.5 A list of types of shopping and services was shown and residents were asked
how often, if at all, they normally visited the town centre for each. The
frequency of shopping was highest: 35% making at least 3 visits per week for
food shopping and 33% for non-food shopping. Visits for browsing/window
shopping at least once a week were made by 57%. Financial/professional
services were used at least once a week by 53% of residents and usage of
retail services was less frequent 33% at least once a month. 78% of residents
never normally use the town centre for leisure activities i.e. cinema, health &
fitness, society/club.
Figure 7.5 Frequency of usage How often do you normally visit this town centre during the day? Base 127
35 3325
111 17
3
30 40
32
5
4223
2
2723
18
27
40
44
3
3 1
4
53
410
10
1 1
1712
2 3
78
0
20
40
60
80
100
Food s
hoppi
ng
Non-fo
od s
hopp
ing
Bro
wsing
Retail se
rvices
Finan
cial/p
rofess
iona
l ser
vice
s
Café
/restau
rant
Leisur
e act
ivity
Never
Less often
1-3 times/month
Once per week
3+ times/week
7.6 Figure 7.6 shows how frequency of resident visits to the town centre has
changed over the last year. Usage is stable with 76% of respondents claiming
no change. However 13% visit the town centre less often than last year. The
main reasons for using less were changes in personal circumstances i.e.
change in work or family situation. A full list of comments for using less often
is contained in the appendices.
Table 7.6 Change in frequency of visits How has the frequency of your visits to this town centre changed over the last year?
Base: 127
%
More often 8
About the same 76
Less often 13
34
_______________________________________________________________________________
CR Cameron Research: Prestwick Shopper and Resident Report
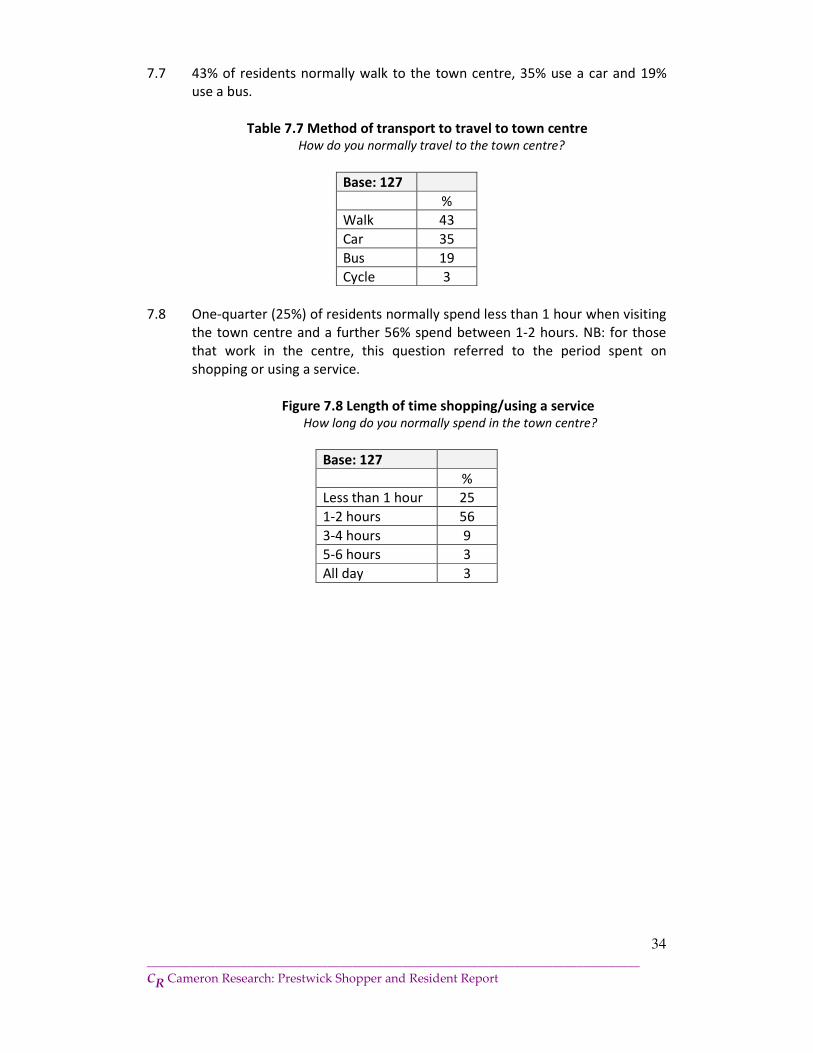
7.7 43% of residents normally walk to the town centre, 35% use a car and 19%
use a bus.
Table 7.7 Method of transport to travel to town centre How do you normally travel to the town centre?
Base: 127
%
Walk 43
Car 35
Bus 19
Cycle 3
7.8 One-quarter (25%) of residents normally spend less than 1 hour when visiting
the town centre and a further 56% spend between 1-2 hours. NB: for those
that work in the centre, this question referred to the period spent on
shopping or using a service.
Figure 7.8 Length of time shopping/using a service How long do you normally spend in the town centre?
Base: 127
%
Less than 1 hour 25
1-2 hours 56
3-4 hours 9
5-6 hours 3
All day 3
35
_______________________________________________________________________________
CR Cameron Research: Prestwick Shopper and Resident Report
Purchase behaviour
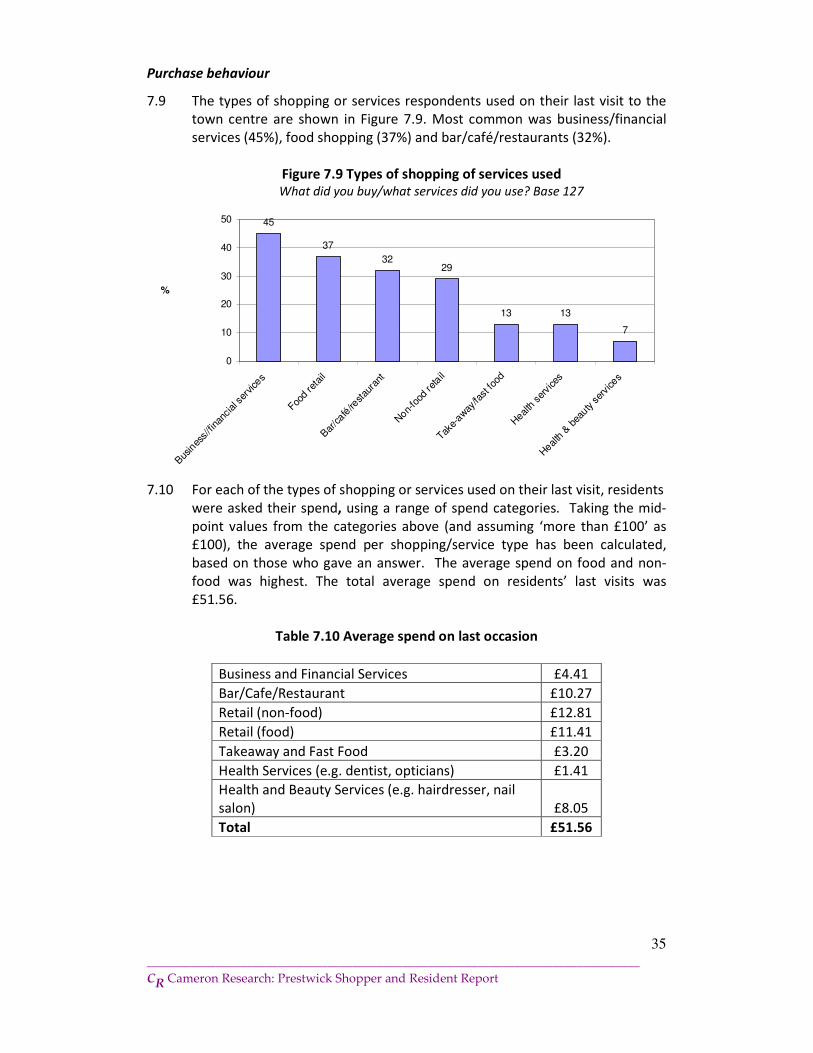
7.9 The types of shopping or services respondents used on their last visit to the
town centre are shown in Figure 7.9. Most common was business/financial
services (45%), food shopping (37%) and bar/café/restaurants (32%).
Figure 7.9 Types of shopping of services used What did you buy/what services did you use? Base 127
45
37
3229
13 13
7
0
10
20
30
40
50
Bus
ines
s//fi
nanc
ial s
ervic
es
Food re
tail
Bar/café
/restau
rant
Non-
food
reta
il
Take-
away
/fast fo
od
Heal
th ser
vice
s
Heal
th &
bea
uty ser
vice
s
%
7.10 For each of the types of shopping or services used on their last visit, residents
were asked their spend, using a range of spend categories. Taking the mid-
point values from the categories above (and assuming ‘more than £100’ as
£100), the average spend per shopping/service type has been calculated,
based on those who gave an answer. The average spend on food and non-
food was highest. The total average spend on residents’ last visits was
£51.56.
Table 7.10 Average spend on last occasion
Business and Financial Services £4.41
Bar/Cafe/Restaurant £10.27
Retail (non-food) £12.81
Retail (food) £11.41
Takeaway and Fast Food £3.20
Health Services (e.g. dentist, opticians) £1.41
Health and Beauty Services (e.g. hairdresser, nail
salon) £8.05
Total £51.56
36
_______________________________________________________________________________
CR Cameron Research: Prestwick Shopper and Resident Report
Reasons for usage of town centre
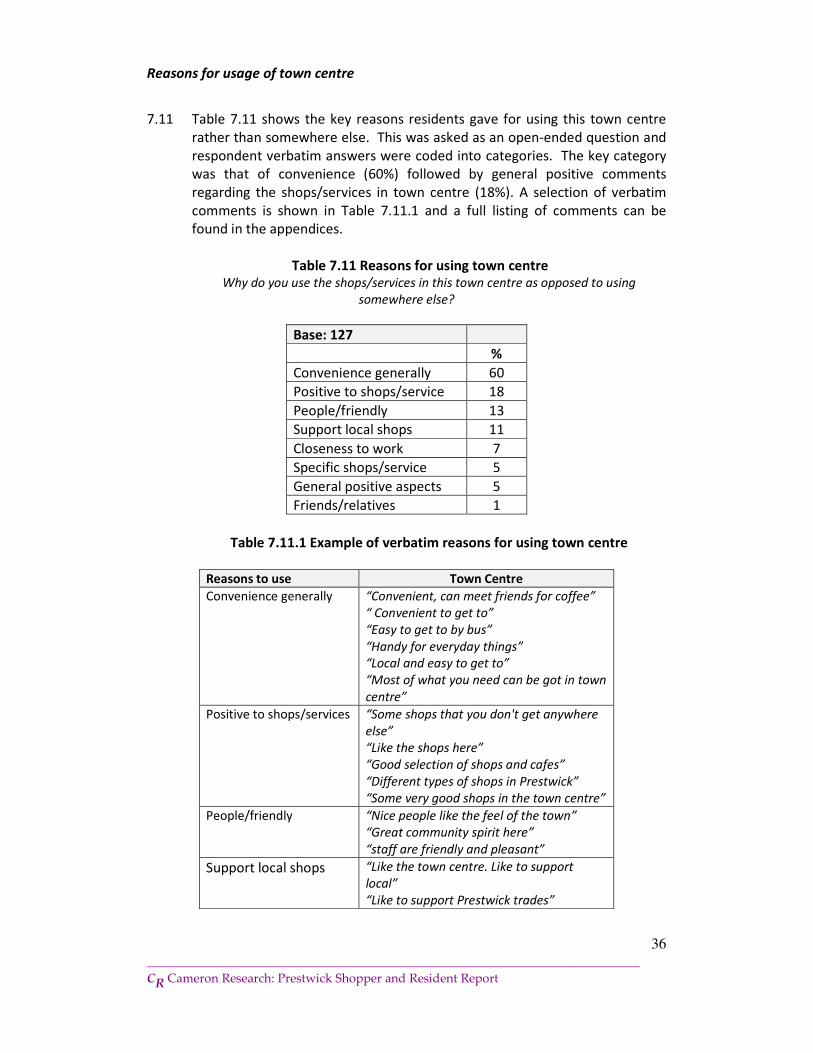
7.11 Table 7.11 shows the key reasons residents gave for using this town centre
rather than somewhere else. This was asked as an open-ended question and
respondent verbatim answers were coded into categories. The key category
was that of convenience (60%) followed by general positive comments
regarding the shops/services in town centre (18%). A selection of verbatim
comments is shown in Table 7.11.1 and a full listing of comments can be
found in the appendices.
Table 7.11 Reasons for using town centre Why do you use the shops/services in this town centre as opposed to using
somewhere else?
Base: 127
%
Convenience generally 60
Positive to shops/service 18
People/friendly 13
Support local shops 11
Closeness to work 7
Specific shops/service 5
General positive aspects 5
Friends/relatives 1
Table 7.11.1 Example of verbatim reasons for using town centre
Reasons to use Town Centre
Convenience generally “Convenient, can meet friends for coffee”
“ Convenient to get to”
“Easy to get to by bus”
“Handy for everyday things”
“Local and easy to get to”
“Most of what you need can be got in town
centre”
Positive to shops/services “Some shops that you don't get anywhere
else”
“Like the shops here”
“Good selection of shops and cafes”
“Different types of shops in Prestwick”
“Some very good shops in the town centre”
People/friendly “Nice people like the feel of the town”
“Great community spirit here”
“staff are friendly and pleasant”
Support local shops “Like the town centre. Like to support
local”
“Like to support Prestwick trades”
37
_______________________________________________________________________________
CR Cameron Research: Prestwick Shopper and Resident Report
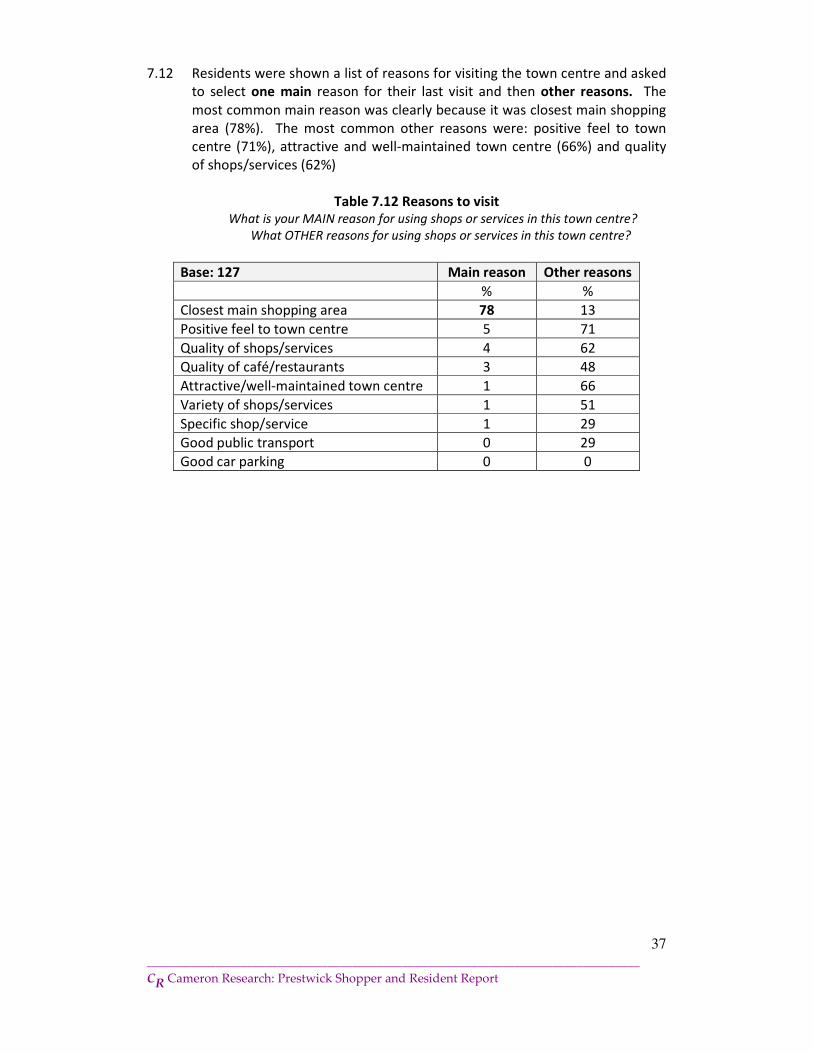
7.12 Residents were shown a list of reasons for visiting the town centre and asked
to select one main reason for their last visit and then other reasons. The
most common main reason was clearly because it was closest main shopping
area (78%). The most common other reasons were: positive feel to town
centre (71%), attractive and well-maintained town centre (66%) and quality
of shops/services (62%)
Table 7.12 Reasons to visit What is your MAIN reason for using shops or services in this town centre?
What OTHER reasons for using shops or services in this town centre?
Base: 127 Main reason Other reasons
% %
Closest main shopping area 78 13
Positive feel to town centre 5 71
Quality of shops/services 4 62
Quality of café/restaurants 3 48
Attractive/well-maintained town centre 1 66
Variety of shops/services 1 51
Specific shop/service 1 29
Good public transport 0 29
Good car parking 0 0
38
_______________________________________________________________________________
CR Cameron Research: Prestwick Shopper and Resident Report
Attitudes and factors that would encourage usage
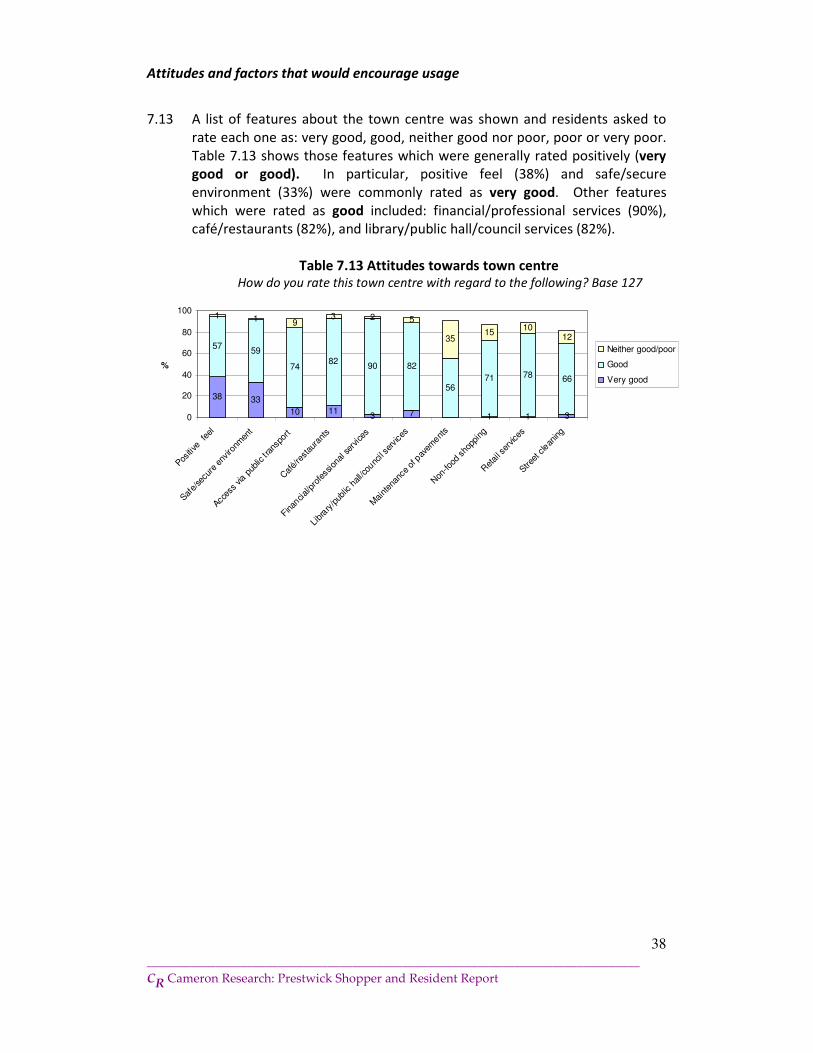
7.13 A list of features about the town centre was shown and residents asked to
rate each one as: very good, good, neither good nor poor, poor or very poor.
Table 7.13 shows those features which were generally rated positively (very
good or good). In particular, positive feel (38%) and safe/secure
environment (33%) were commonly rated as very good. Other features
which were rated as good included: financial/professional services (90%),
café/restaurants (82%), and library/public hall/council services (82%).
Table 7.13 Attitudes towards town centre How do you rate this town centre with regard to the following? Base 127
38 33
10 113 7 1 1 3
5759
7482
90 82
5671 78 66
1 1 93 2 5
3515
1012
0
20
40
60
80
100
Positive
fee
l
Safe/
secu
re e
nviro
nmen
t
Acces
s via
pub
lic t r
ansp
ort
Caf
é/re
stau
rant
s
Finan
cial/p
rofe
ssio
nal s
ervice
s
Libr
ary/p
ublic
hall/c
ounc
il se
rvices
Mai
nten
ance
of p
avem
ents
Non
-food
sho
ppin
g
Ret
ail s
ervic
es
Street
cle
aning
%
Neither good/poor
Good
Very good
39
_______________________________________________________________________________
CR Cameron Research: Prestwick Shopper and Resident Report
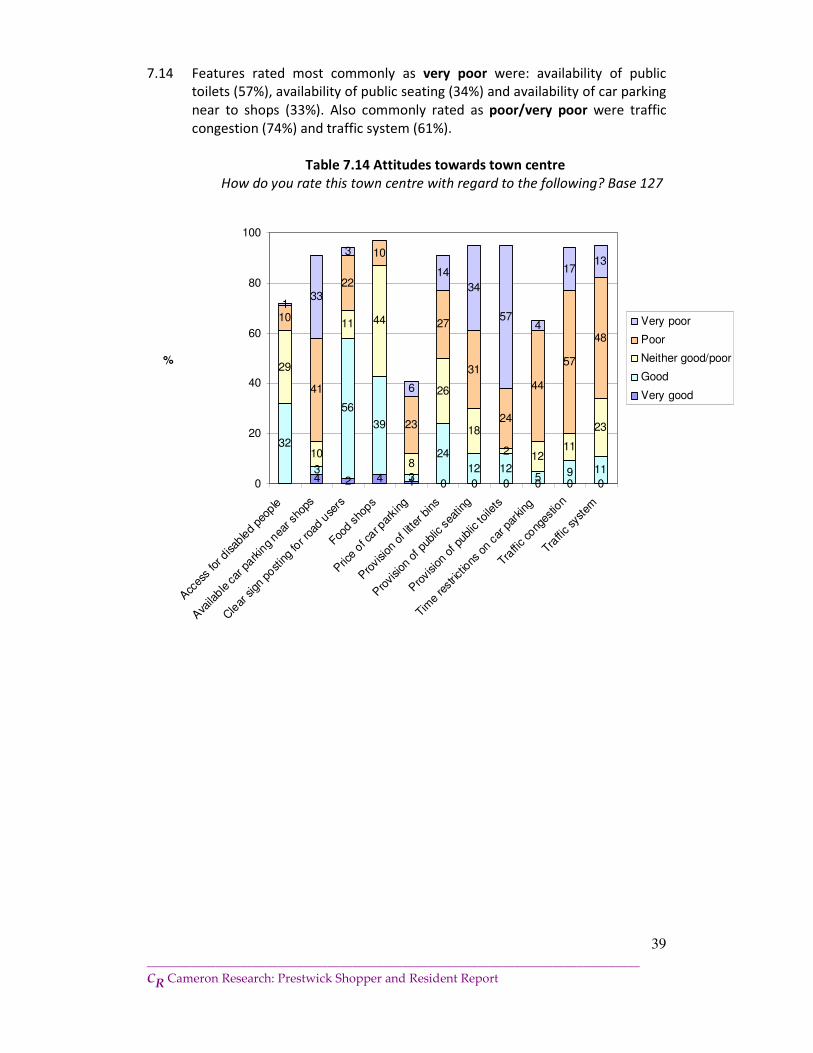
7.14 Features rated most commonly as very poor were: availability of public
toilets (57%), availability of public seating (34%) and availability of car parking
near to shops (33%). Also commonly rated as poor/very poor were traffic
congestion (74%) and traffic system (61%).
Table 7.14 Attitudes towards town centre
How do you rate this town centre with regard to the following? Base 127
4 2 4 1 0 0 0 0 0 0
32
3
56
39
3
24
12 125 9 11
29
10
11 44
8
26
18
2 1211
23
10
41
22
10
23
27
31
24
44
57
48
133
3
6
14
34
574
1713
0
20
40
60
80
100
Acc
ess
for d
isab
led
peop
le
Ava
ilable
car
park
ing nea
r sho
ps
Cle
ar sign p
osting
for r
oad u
sers
Food s
hops
Pric
e of c
ar par
king
Pro
vision
of l
itter
bins
Pro
vision
of p
ublic
sea
ting
Pro
vision
of p
ublic
toile
ts
Time
restric
tions
on c
ar p
arking
Traffic co
nges
tion
Traffic sy
stem
%
Very poor
Poor
Neither good/poor
Good
Very good
40
_______________________________________________________________________________
CR Cameron Research: Prestwick Shopper and Resident Report
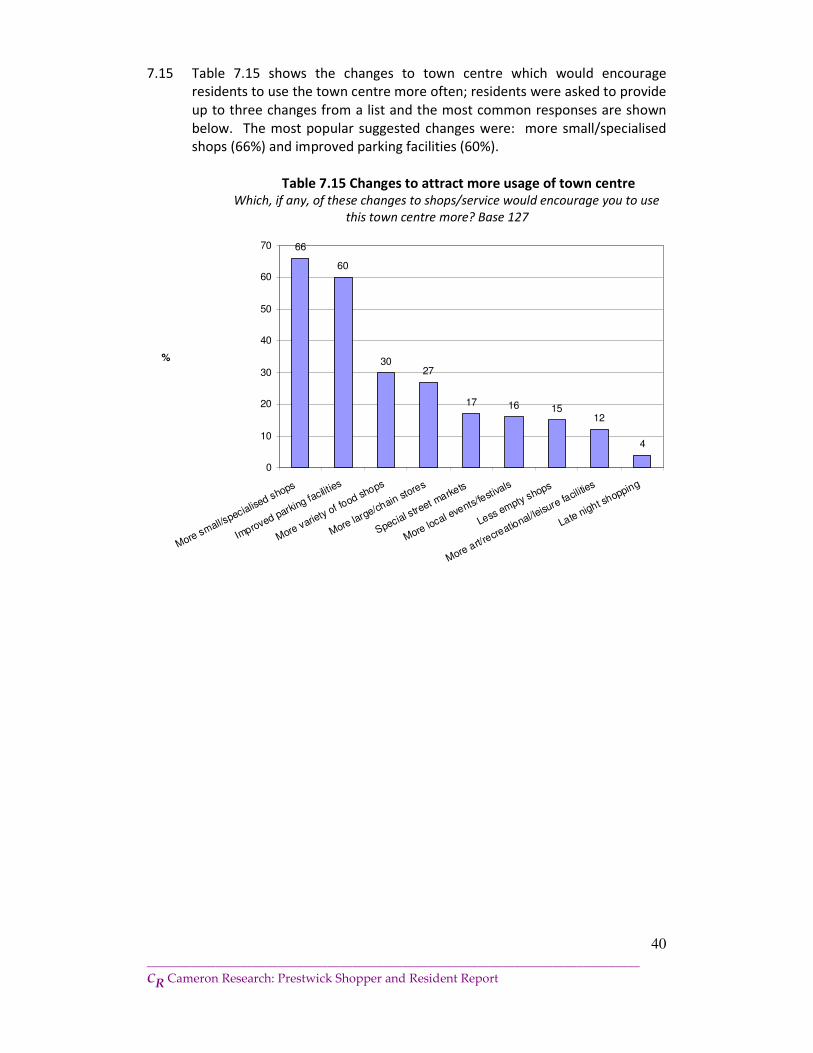
7.15 Table 7.15 shows the changes to town centre which would encourage
residents to use the town centre more often; residents were asked to provide
up to three changes from a list and the most common responses are shown
below. The most popular suggested changes were: more small/specialised
shops (66%) and improved parking facilities (60%).
Table 7.15 Changes to attract more usage of town centre Which, if any, of these changes to shops/service would encourage you to use
this town centre more? Base 127
66
60
3027
17 16 1512
4
0
10
20
30
40
50
60
70
More small/specialise
d shops
Improved parking fa
cilities
More variety of fo
od shops
More large/chain stores
Special street m
arkets
More local eve
nts/festiv
als
Less empty shops
More art/recreatio
nal/leisu
re facili
ties
Late night shopping
%
41
_______________________________________________________________________________
CR Cameron Research: Prestwick Shopper and Resident Report
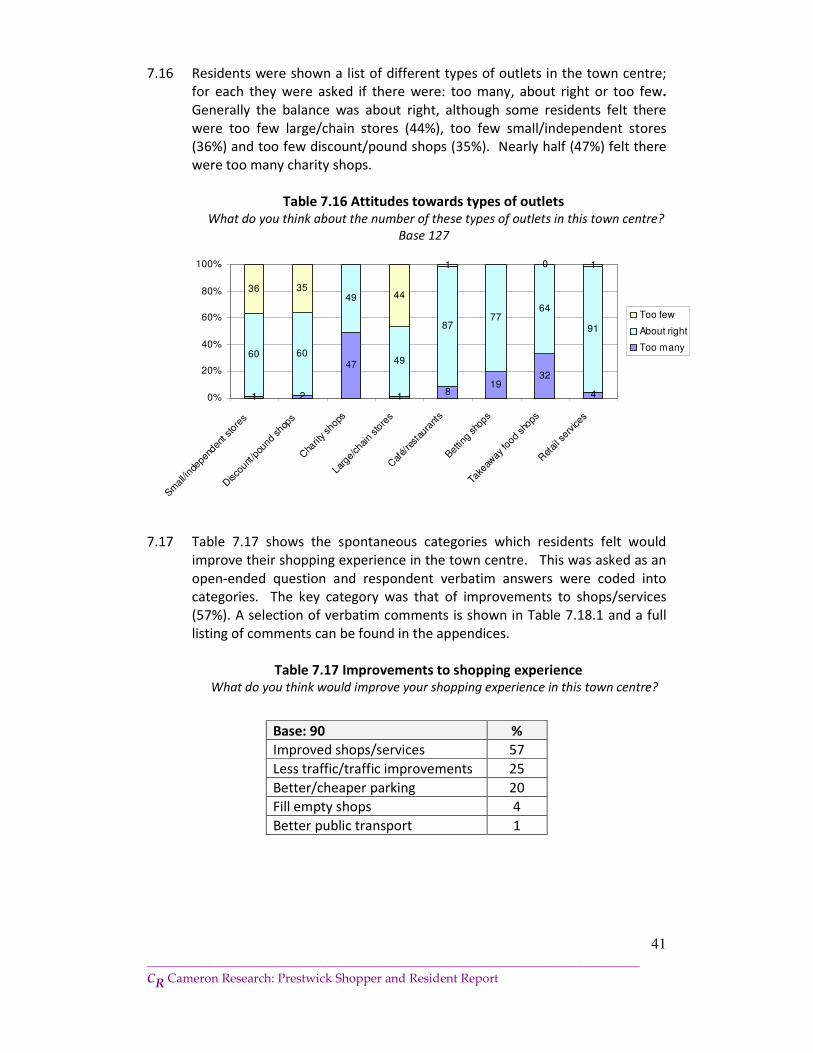
7.16 Residents were shown a list of different types of outlets in the town centre;
for each they were asked if there were: too many, about right or too few.
Generally the balance was about right, although some residents felt there
were too few large/chain stores (44%), too few small/independent stores
(36%) and too few discount/pound shops (35%). Nearly half (47%) felt there
were too many charity shops.
Table 7.16 Attitudes towards types of outlets What do you think about the number of these types of outlets in this town centre?
Base 127
1 2
47
18
1932
4
60 60
49
49
8777
64
91
36 3544
1 0 1
0%
20%
40%
60%
80%
100%
Small/inde
pend
ent s
tore
s
Disc
ount
/pou
nd shop
s
Cha
rity sh
ops
Larg
e/ch
ain
store
s
Caf
é/re
stau
rant
s
Bettin
g sh
ops
Take
away
food
shops
Ret
ail s
ervice
s
Too few
About right
Too many
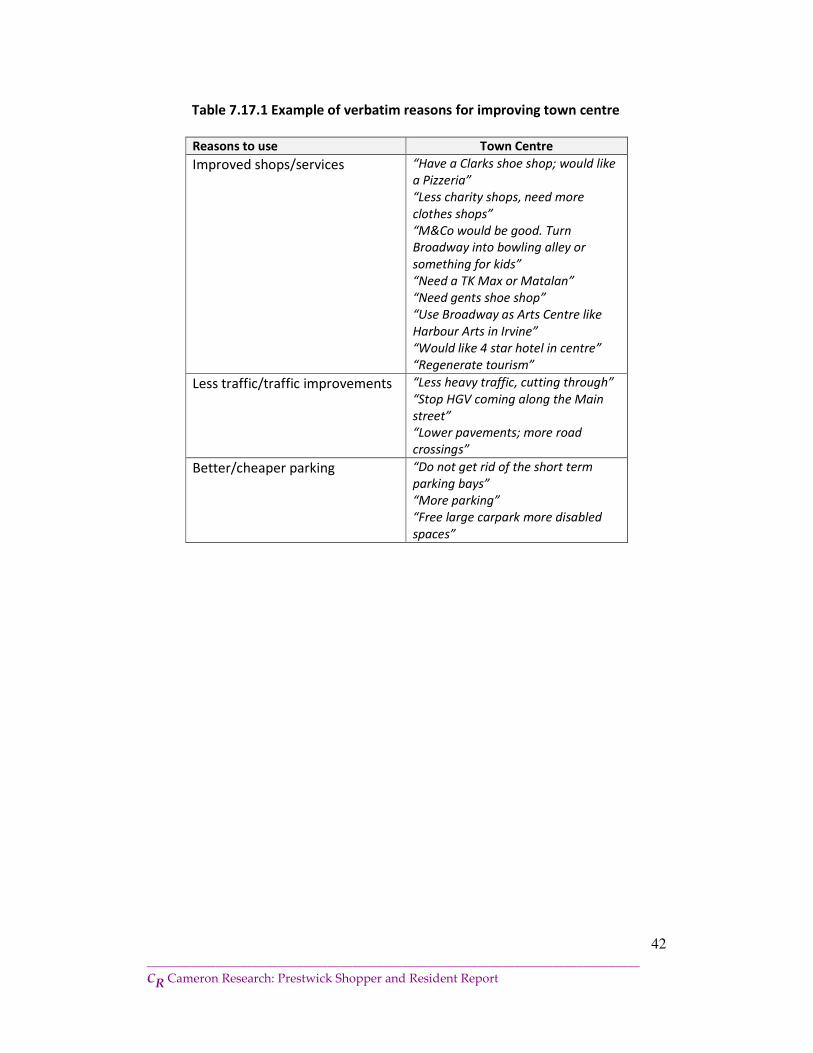
7.17 Table 7.17 shows the spontaneous categories which residents felt would
improve their shopping experience in the town centre. This was asked as an
open-ended question and respondent verbatim answers were coded into
categories. The key category was that of improvements to shops/services
(57%). A selection of verbatim comments is shown in Table 7.18.1 and a full
listing of comments can be found in the appendices.
Table 7.17 Improvements to shopping experience What do you think would improve your shopping experience in this town centre?
Base: 90 %
Improved shops/services 57
Less traffic/traffic improvements 25
Better/cheaper parking 20
Fill empty shops 4
Better public transport 1
42
_______________________________________________________________________________
CR Cameron Research: Prestwick Shopper and Resident Report
Table 7.17.1 Example of verbatim reasons for improving town centre
Reasons to use Town Centre
Improved shops/services “Have a Clarks shoe shop; would like
a Pizzeria”
“Less charity shops, need more
clothes shops”
“M&Co would be good. Turn
Broadway into bowling alley or
something for kids”
“Need a TK Max or Matalan”
“Need gents shoe shop”
“Use Broadway as Arts Centre like
Harbour Arts in Irvine”
“Would like 4 star hotel in centre”
“Regenerate tourism”
Less traffic/traffic improvements “Less heavy traffic, cutting through”
“Stop HGV coming along the Main
street”
“Lower pavements; more road
crossings”
Better/cheaper parking “Do not get rid of the short term
parking bays”
“More parking”
“Free large carpark more disabled
spaces”
43
_______________________________________________________________________________
CR Cameron Research: Prestwick Shopper and Resident Report
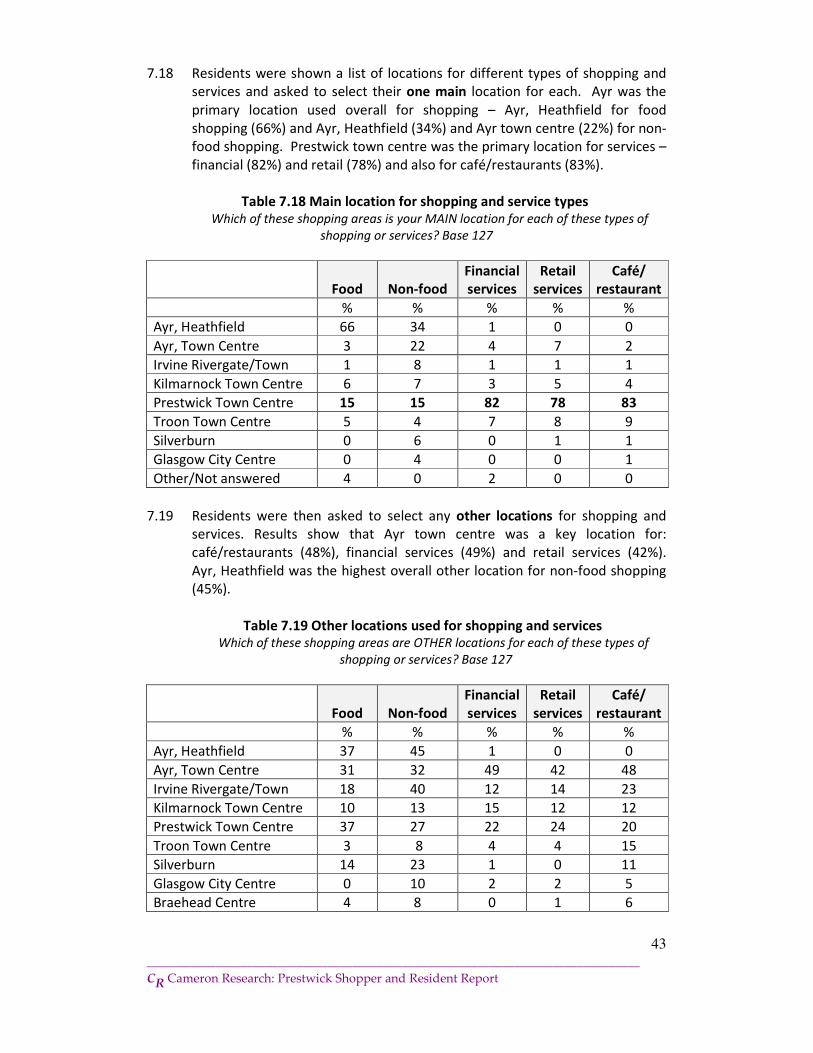
7.18 Residents were shown a list of locations for different types of shopping and
services and asked to select their one main location for each. Ayr was the
primary location used overall for shopping – Ayr, Heathfield for food
shopping (66%) and Ayr, Heathfield (34%) and Ayr town centre (22%) for non-
food shopping. Prestwick town centre was the primary location for services –
financial (82%) and retail (78%) and also for café/restaurants (83%).
Table 7.18 Main location for shopping and service types Which of these shopping areas is your MAIN location for each of these types of
shopping or services? Base 127
Food Non-food
Financial
services
Retail
services
Café/
restaurant
% % % % %
Ayr, Heathfield 66 34 1 0 0
Ayr, Town Centre 3 22 4 7 2
Irvine Rivergate/Town 1 8 1 1 1
Kilmarnock Town Centre 6 7 3 5 4
Prestwick Town Centre 15 15 82 78 83
Troon Town Centre 5 4 7 8 9
Silverburn 0 6 0 1 1
Glasgow City Centre 0 4 0 0 1
Other/Not answered 4 0 2 0 0
7.19 Residents were then asked to select any other locations for shopping and
services. Results show that Ayr town centre was a key location for:
café/restaurants (48%), financial services (49%) and retail services (42%).
Ayr, Heathfield was the highest overall other location for non-food shopping
(45%).
Table 7.19 Other locations used for shopping and services Which of these shopping areas are OTHER locations for each of these types of
shopping or services? Base 127
Food Non-food
Financial
services
Retail
services
Café/
restaurant
% % % % %
Ayr, Heathfield 37 45 1 0 0
Ayr, Town Centre 31 32 49 42 48
Irvine Rivergate/Town 18 40 12 14 23
Kilmarnock Town Centre 10 13 15 12 12
Prestwick Town Centre 37 27 22 24 20
Troon Town Centre 3 8 4 4 15
Silverburn 14 23 1 0 11
Glasgow City Centre 0 10 2 2 5
Braehead Centre 4 8 0 1 6
44
_______________________________________________________________________________
CR Cameron Research: Prestwick Shopper and Resident Report
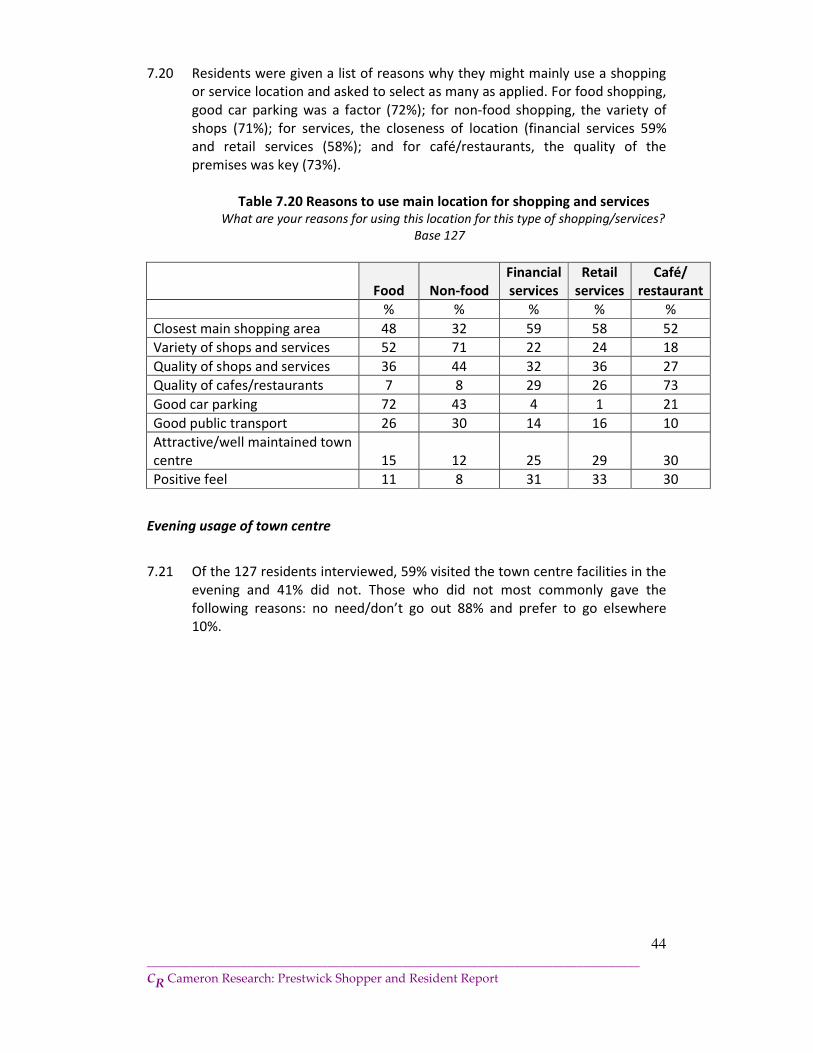
7.20 Residents were given a list of reasons why they might mainly use a shopping
or service location and asked to select as many as applied. For food shopping,
good car parking was a factor (72%); for non-food shopping, the variety of
shops (71%); for services, the closeness of location (financial services 59%
and retail services (58%); and for café/restaurants, the quality of the
premises was key (73%).
Table 7.20 Reasons to use main location for shopping and services What are your reasons for using this location for this type of shopping/services?
Base 127
Food Non-food
Financial
services
Retail
services
Café/
restaurant
% % % % %
Closest main shopping area 48 32 59 58 52
Variety of shops and services 52 71 22 24 18
Quality of shops and services 36 44 32 36 27
Quality of cafes/restaurants 7 8 29 26 73
Good car parking 72 43 4 1 21
Good public transport 26 30 14 16 10
Attractive/well maintained town
centre 15 12 25 29 30
Positive feel 11 8 31 33 30
Evening usage of town centre
7.21 Of the 127 residents interviewed, 59% visited the town centre facilities in the
evening and 41% did not. Those who did not most commonly gave the
following reasons: no need/don’t go out 88% and prefer to go elsewhere
10%.
45
_______________________________________________________________________________
CR Cameron Research: Prestwick Shopper and Resident Report
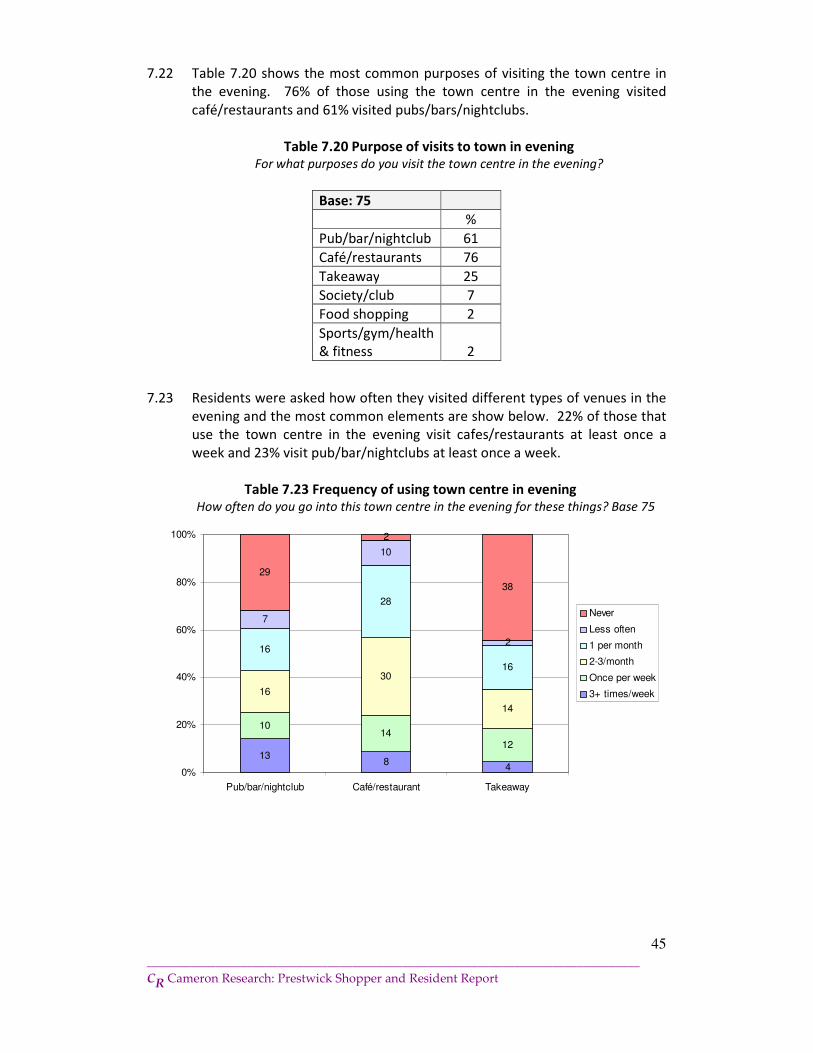
7.22 Table 7.20 shows the most common purposes of visiting the town centre in
the evening. 76% of those using the town centre in the evening visited
café/restaurants and 61% visited pubs/bars/nightclubs.
Table 7.20 Purpose of visits to town in evening For what purposes do you visit the town centre in the evening?
Base: 75
%
Pub/bar/nightclub 61
Café/restaurants 76
Takeaway 25
Society/club 7
Food shopping 2
Sports/gym/health
& fitness 2
7.23 Residents were asked how often they visited different types of venues in the
evening and the most common elements are show below. 22% of those that
use the town centre in the evening visit cafes/restaurants at least once a
week and 23% visit pub/bar/nightclubs at least once a week.
Table 7.23 Frequency of using town centre in evening How often do you go into this town centre in the evening for these things? Base 75
138
4
1014
12
16
30
14
16
28
16
7
10
2
29
2
38
0%
20%
40%
60%
80%
100%
Pub/bar/nightclub Café/restaurant Takeaway
Never
Less often
1 per month
2-3/month
Once per week
3+ times/week
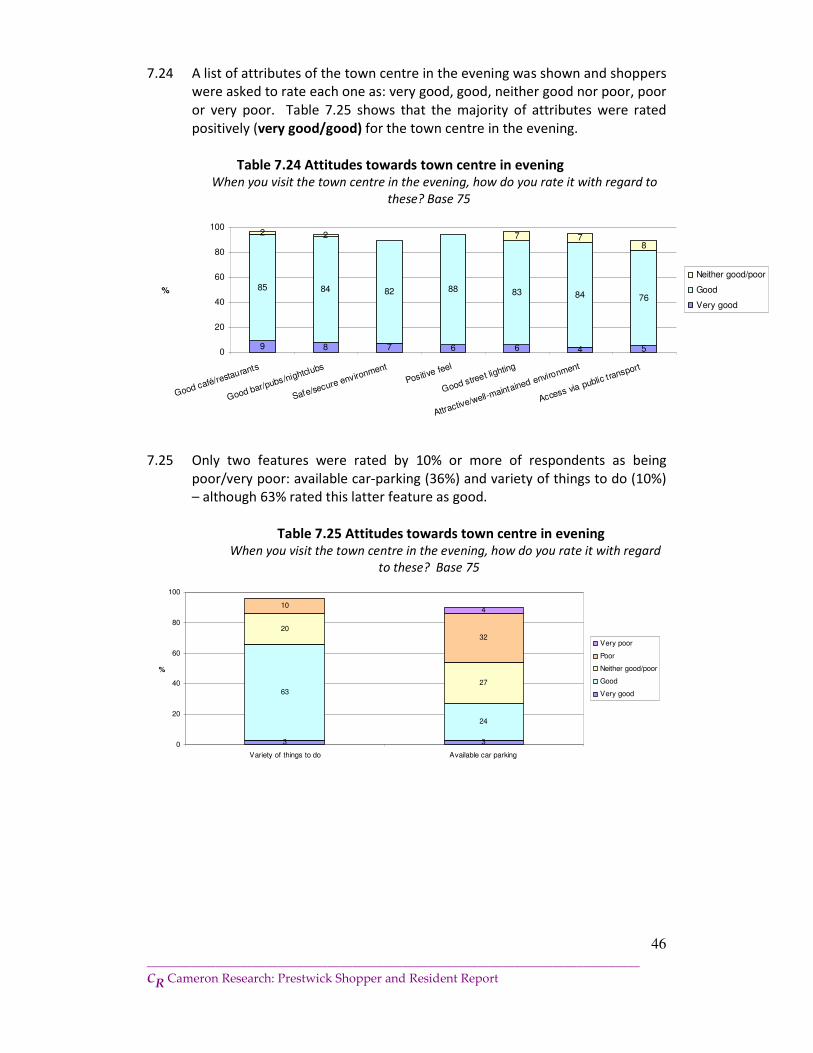
46
_______________________________________________________________________________
CR Cameron Research: Prestwick Shopper and Resident Report
7.24 A list of attributes of the town centre in the evening was shown and shoppers
were asked to rate each one as: very good, good, neither good nor poor, poor
or very poor. Table 7.25 shows that the majority of attributes were rated
positively (very good/good) for the town centre in the evening.
Table 7.24 Attitudes towards town centre in evening When you visit the town centre in the evening, how do you rate it with regard to
these? Base 75
9 8 7 6 6 4 5
85 84 82 88 83 84 76
2 2 7 78
0
20
40
60
80
100
Good café/restaurants
Good bar/pubs/nightclubs
Safe/secure environment
Positive feel
Good street lighting
Attractive/well-maintained environment
Access via public transport
%
Neither good/poor
Good
Very good
7.25 Only two features were rated by 10% or more of respondents as being
poor/very poor: available car-parking (36%) and variety of things to do (10%)
– although 63% rated this latter feature as good.
Table 7.25 Attitudes towards town centre in evening When you visit the town centre in the evening, how do you rate it with regard
to these? Base 75
3 3
63
24
20
27
10
32
4
0
20
40
60
80
100
Variety of things to do Available car parking
%
Very poor
Poor
Neither good/poor
Good
Very good