Embed Size (px)
Citation preview
1
South Africa’s maize exports: A Strategic Export Market Analysis model approach
By
Tinashe Kapuya1 and Wandile Sihlobo2
Abstract
Outside of the Southern African Customs Union (SACU) and certain Southern African
Development Community (SADC) countries, South Africa’s maize exports are generally
irregular and inconsistent. This lack of consistency is primarily attributed to uneven surplus
levels which, in certain years, preclude South Africa’s regular participation in larger import
markets. We therefore apply a Strategic Export Market Analysis (SEMA) model to identify
export markets in which South Africa has a high trade potential with the vision of defining the
basis for a longer term sustainable export market development strategy. We found that South
Africa’s maize exports are growing faster than the world’s annual average growth, and that
these exports are concentrated among a few countries. These two features underline the need to
expand South Africa’s export presence beyond its traditional markets. Identified as high
potential strategic markets is Japan, Mexico, Taiwan, United Arab Emirates, Thailand and
Zimbabwe. Moreover, there is an even higher potential to export to major global maize
importers in Asia (i.e. China, Indonesia, Vietnam, Malaysia), South America (i.e. Venezuela)
and the Middle East (i.e. Iran, Saudi Arabia). To compete in such markets, South Africa has to
reduce its logistics and production costs. Essential is the need to seek preferential market access
in these countries in order to lock the existing export opportunities. To reposition South Africa
within the global context, we recommend the formulation of a maize sector export strategy that
focuses on increasing the competitiveness of maize exports, and market development.
Keywords: growth-share matrix, trade potential, strategic markets
1 International Trade and Investment Manager: The Agricultural Business Chamber. PO Box 76297, Lynnwood
Ridge, 0040. South Africa. Email: [email protected]
2 Economist: Grain SA.PO Box 74087, Lynwood Ridge 0040. South Africa Email:
2
Introduction
Maize is the most important field crop produced in South Africa. It is the staple food for the
majority of the population, particularly the poor (Maize Trust, 2014). The maize industry has a
significant contribution to the economy, both upstream to the input industries and downstream
into milling, animal feed and food processing industries.
The maize area planted vary on yearly basis, depending on weather and market conditions, but
on average approximately 2.5–2.75 million hectares of hybrid maize is planted in South Africa
each year (Maize Trust, 2014). Furthermore, about 350 000–500 000 hectares are planted by
small-scale farmers. According to the Maize Trust (2014) the total crop planted constitutes
approximately 85% GM maize. South Africa leads the continent in technology adoption and
has seen productivity of up to 12 tons/ha in the Northern Cape region in 2007/08 production
year; the highest yield in the African continent (Grain South Africa (GSA, 2014)). In 1998,
South Africa became the first African country to grow biotech crops commercially. By 2010, it
was the world’s ninth largest cultivator of biotech crops, with more than 2.2 million hectares
under cultivation (Pioneer, n.d.).
White maize is mainly for human consumption and yellow maize for animal feed.
Approximately 10 to 12 million tons of maize is produced in South Africa annually. On a ten
year average, maize for human consumption totals about 4.2 million tons, for animal feed about
4 million tons and the starch and glucose manufacturing industries consume about 650 000 tons
of maize annually (GSA, 2014). Feed production in South Africa is estimated at more than 11
million tons per annum, and maize represents about 51% of the total feed produced annually
(Maize Trust, 2014).
On ten year average, South Africa normally produces approximately 1.7 million tons surplus
of maize for the export markets, making it the largest exporter of maize on the continent (GSA,
2014). South Africa’s maize exports have increased by an average annual growth rate of 21%
between 2001 and 2013; which is far higher than the 13% rate of growth of global maize imports
(Author’s calculations based on ITC, 2014). As such, re-assessing the country’s maize export
markets is critical as South Africa seeks to expand its burgeoning surpluses to new markets.
This paper applies a strategic export market analysis (SEMA) model in order to identify high
potential markets for South African maize exports which can be considered to be of strategic
value (i.e. countries in which South Africa can expand its maize exports). To put the analysis
into context, we first explore the structure of South Africa’s maize exports. Against this
background we apply the SEMA model and chronicle the export potential, growth and share
characteristics of selected markets. The paper closes with some conclusions and summary of
key points.
Concept and operationalization of the SEMA model
In order to answer the main question of South Africa’s strategic markets, this paper develops
the concept of a Strategic Export Market Analysis (SEMA) model. In the model, we attempt to
3
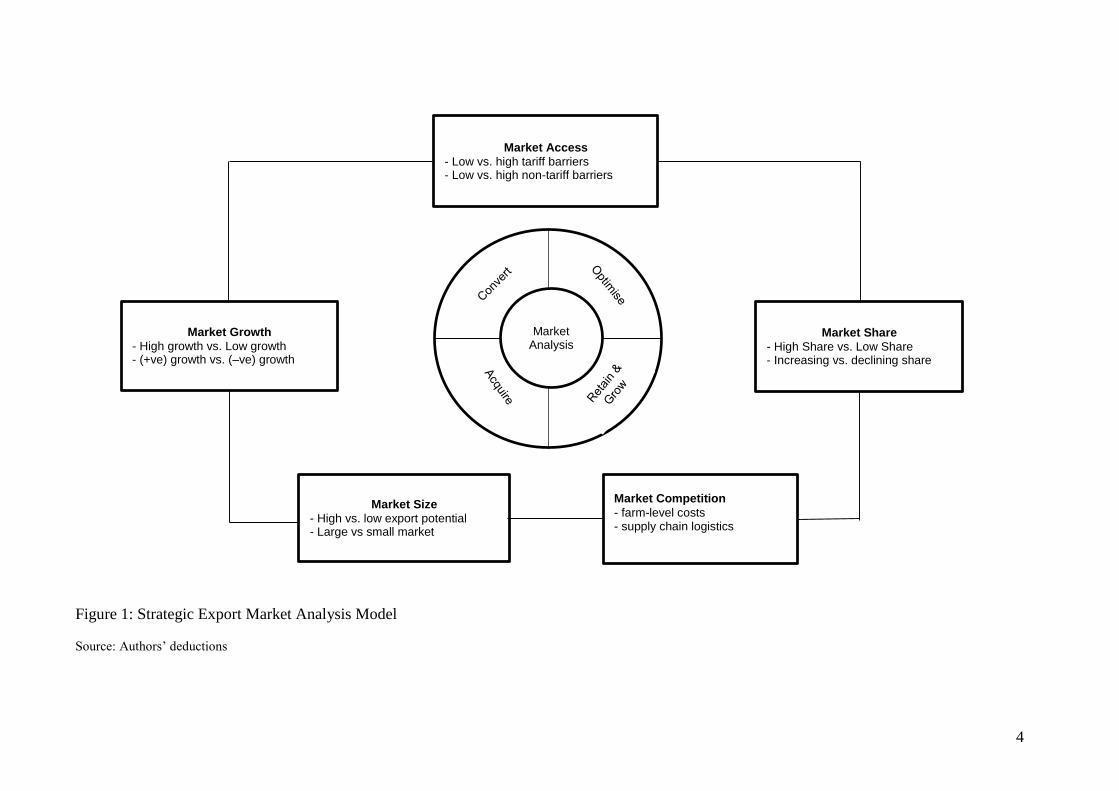
methodically unpack the five critical elements of importance to South Africa’s maize industry
namely, market access, market growth, market share, market competition and market size (see
Figure 1).
Putting the approach pursued in this paper in the South African context, the model deals with
the influence of the trade environment (i.e. barriers to maize exports, competition from major
global exporters, export opportunities, and the rate at which maize exports are growing in global
markets). This makes the approach an outward-looking one. Based on the specific
characteristics of any given market, defined by the five elements outlined, the analysis of that
particular market would lead to four key decisions. The decision rules are to either:
- Acquire the market, where South Africa has no market presence
- Convert the market, where growth, export potential and market share is declining
- Optimize the market, where South Africa is well established
- Retain and grow the market, where South Africa’s export potential is beginning to emerge.
The SEMA model lends itself to a practically informed understanding of the trade environment
in the global markets. An insight of the trade trends and statistics helps establish an
understanding of market opportunities and threats. Emanating from the analysis is the “trade
intelligence” that allows for a more strategic approach to exploiting market potential in
countries where South Africa has a presence, as well as those countries where South Africa has
a weak (or no) presence.
To operationalize the model, the paper will unpack the five key elements through an in-depth
analysis of the following:
- The concentration and structure of South Africa’s maize exports
- A growth-share analysis of South Africa’s maize markets
- Analysis of export potential of South Africa’s major export destinations and also those
larger global destinations where South Africa has little or no presence
- An analysis of South Africa’s competitiveness compared to other major global exporters
- An analysis of tariff and non-tariff barriers in South Africa’s strategic and “potentially
strategic” export destinations
As the analysis seeks to establish attractive markets and countries where South Africa could
attain large gains from trade, policy and private sector strategies (i.e. decisions taken by
politicians and businessmen) will matter for South Africa’s growth in these markets. Market
potential in certain countries may offer opportunities that politicians and businessmen may or
may not take. The export opportunities could ultimately be determined set of institutional
constraints in particular markers that are important but authors may not have considered.
4
Figure 1: Strategic Export Market Analysis Model
Source: Authors’ deductions
Market Access
- Low vs. high tariff barriers - Low vs. high non-tariff barriers
Market Size
- High vs. low export potential - Large vs small market
Market Growth
- High growth vs. Low growth - (+ve) growth vs. (–ve) growth
Market Share
- High Share vs. Low Share - Increasing vs. declining share
Market Competition
- farm-level costs - supply chain logistics
Market Analysis
5
Structure of South Africa’s maize exports
South Africa’s maize exports within the global context
About 90% of global maize traded is yellow maize, with the balance being white maize traded
mostly in Mexico and parts of Southern and Eastern Africa (mainly South Africa, Zimbabwe,
Zambia, Malawi, Uganda, Tanzania and Kenya) (BFAP, 2014). In a more generic context, most
trade analysis literature focuses on maize as a homogenous product, with little attention paid to
its heterogeneity. Even in more focused and region-specific studies, increasing attention is paid
to trade flows, with similar disregard of the product heterogeneity. Part of the reason for this
approach is systemic. That is, trade databases do not offer more nuanced product differentiation,
and as a result, both yellow and white maize statistics conflate into a singular product. This
paper makes use of the International Trade Centre’s (ITC) Harmonized Systems classification,
quoting the product line “HS100590” (i.e. maize (corn) nes (not elsewhere specified)) which
essentially treats maize as a homogenous product.
According to the International Trade Centre (ITC) database (2014), South Africa is, by value,
the 8th largest exporter of maize in the world, after the United States of America (USA), Brazil,
Argentina, Ukraine, France, India and Romania. Global maize exports are concentrated within
the top 4 largest exporters (i.e. USA Brazil, Argentina, and Ukraine) who account for 70% of
total global exports. Meanwhile, 97% of the value of the world’s maize exports comes for the
top 20 exporters (See Table 1).
South Africa can be considered as one of the smaller players in the global maize export market,
contributing a modest 2.2% of total world maize exports (See Table 1). Over the 10 year period
between 2004 and 2013, South Africa’s share of the value of global exports has averaged 1.5%.
Given the relatively small size of South Africa in the global context, the domestic industry has
been a price taker, with production and exports in the big four countries largely determining the
global prices (Mofokeng, 2012). According to Bahta (2004) South Africa’s participation in
global markets has seen some fierce competition from the larger exporters, particularly those
among the top four global players.
With the exception of Argentina, Hungary, France, and USA, all the other countries within the
top 10 largest exporters are growing at a faster pace than South Africa’s exports. Russia, India,
Romania, Ukraine and Brazil, have shown phenomenal growth rates in export revenues between
2001 and 2013, with average annual growth rates of between 30% and 104%. South Africa’s
exports have grown by 21% over the same period, which is above the world average of 13%
(See Table 1).
Table 1: Ranking of the 20 largest maize exporters in the world in 2013
Rank Country Value of exports
(US$ millions)
Share of world
total
(%)
Growth rate of
exports
(2004-2013)
1 United States of America 31 435 20.7% 7.4%
6
2 Brazil 6 506 19.9% 30.3%
3 Argentina 6 251 17.7% 16.6%
4 Ukraine 5 555 12.1% 47.2%
5 France 3 807 5.8% 6.4%
6 India 1 837 3.9% 53.6%
7 Romania 1 229 2.4% 54.7%
8 South Africa 741 2.2% 21.0%
9 Russian Federation 696 1.9% 103.8%
10 Hungary 590 1.8% 18.8%
11 Bulgaria 557 1.6% 39.1%
12 Canada 488 1.5% 29.7%
13 Paraguay 477 1.5% 28.7%
14 Germany 464 0.8% 7.9%
15 Poland 249 0.8% 0.0%
16 Mexico 249 0.6% 48.5%
17 Serbia 203 0.5% 0.0%
18 Thailand 159 0.4% 11.7%
19 Netherlands 135 0.4% 34.1%
20 Austria 124 0.4% 15.0%
Others 120 3.2% -1.8%
Source: International Trade Center (2014)
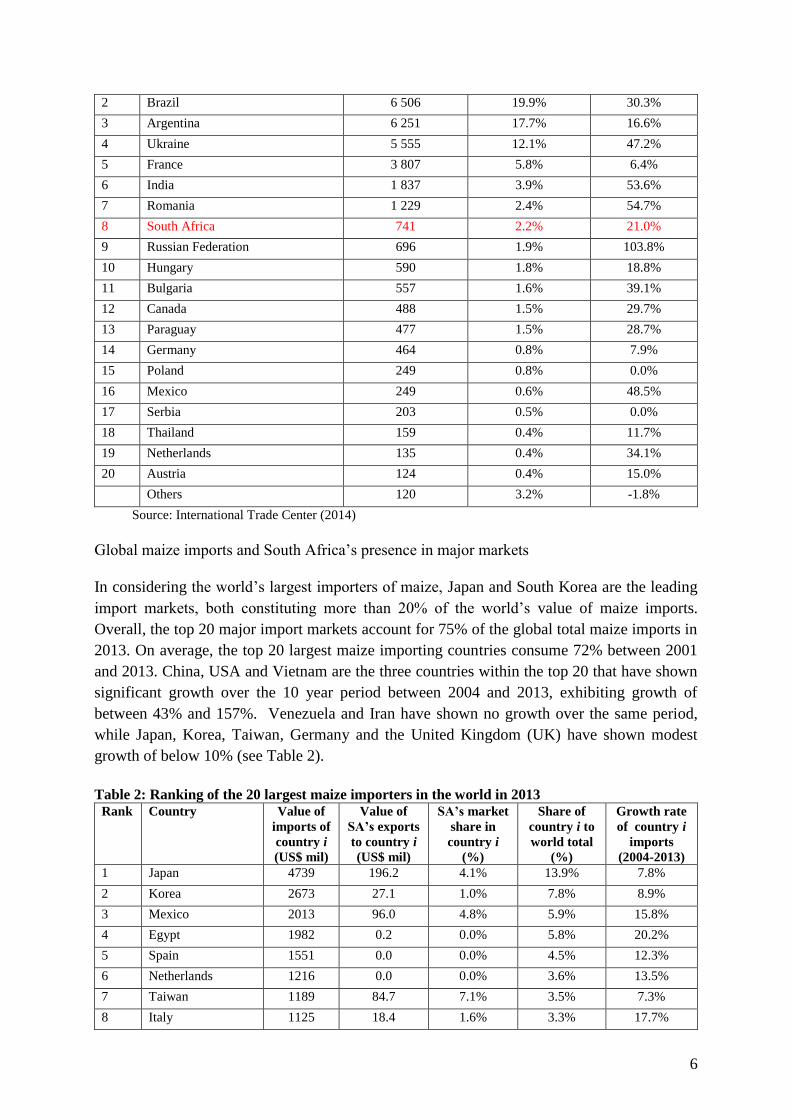
Global maize imports and South Africa’s presence in major markets
In considering the world’s largest importers of maize, Japan and South Korea are the leading
import markets, both constituting more than 20% of the world’s value of maize imports.
Overall, the top 20 major import markets account for 75% of the global total maize imports in
2013. On average, the top 20 largest maize importing countries consume 72% between 2001
and 2013. China, USA and Vietnam are the three countries within the top 20 that have shown
significant growth over the 10 year period between 2004 and 2013, exhibiting growth of
between 43% and 157%. Venezuela and Iran have shown no growth over the same period,
while Japan, Korea, Taiwan, Germany and the United Kingdom (UK) have shown modest
growth of below 10% (see Table 2).
Table 2: Ranking of the 20 largest maize importers in the world in 2013
Rank Country Value of
imports of
country i
(US$ mil)
Value of
SA’s exports
to country i
(US$ mil)
SA’s market
share in
country i
(%)
Share of
country i to
world total
(%)
Growth rate
of country i
imports
(2004-2013)
1 Japan 4739 196.2 4.1% 13.9% 7.8%
2 Korea 2673 27.1 1.0% 7.8% 8.9%
3 Mexico 2013 96.0 4.8% 5.9% 15.8%
4 Egypt 1982 0.2 0.0% 5.8% 20.2%
5 Spain 1551 0.0 0.0% 4.5% 12.3%
6 Netherlands 1216 0.0 0.0% 3.6% 13.5%
7 Taiwan 1189 84.7 7.1% 3.5% 7.3%
8 Italy 1125 18.4 1.6% 3.3% 17.7%
7
9 Colombia 997 0.0 0.0% 2.9% 13.9%
10 Iran 948 0.0 0.0% 2.8% 0.0%
11 USA 938 0.0 0.0% 2.7% 43.0%
12 China 931 0.4 0.0% 2.7% 156.5%
13 Indonesia 914 0.4 0.0% 2.7% 31.0%
14 Algeria 892 0.0 0.0% 2.6% 14.4%
15 Venezuela 784 0.0 0.0% 2.3% 0.0%
16 Viet Nam 606 0.0 0.0% 1.8% 49.2%
17 Germany 590 0.0 0.0% 1.7% 9.3%
18 UK 588 1.0 0.2% 1.7% 5.6%
19 Saudi Arabia 570 0.0 0.0% 1.7% 16.8%
20 Malaysia 513 0.3 0.1% 1.5% 18.6%
Others 838 271 - 24.6% 15.9%
Source: International Trade Center (2014)
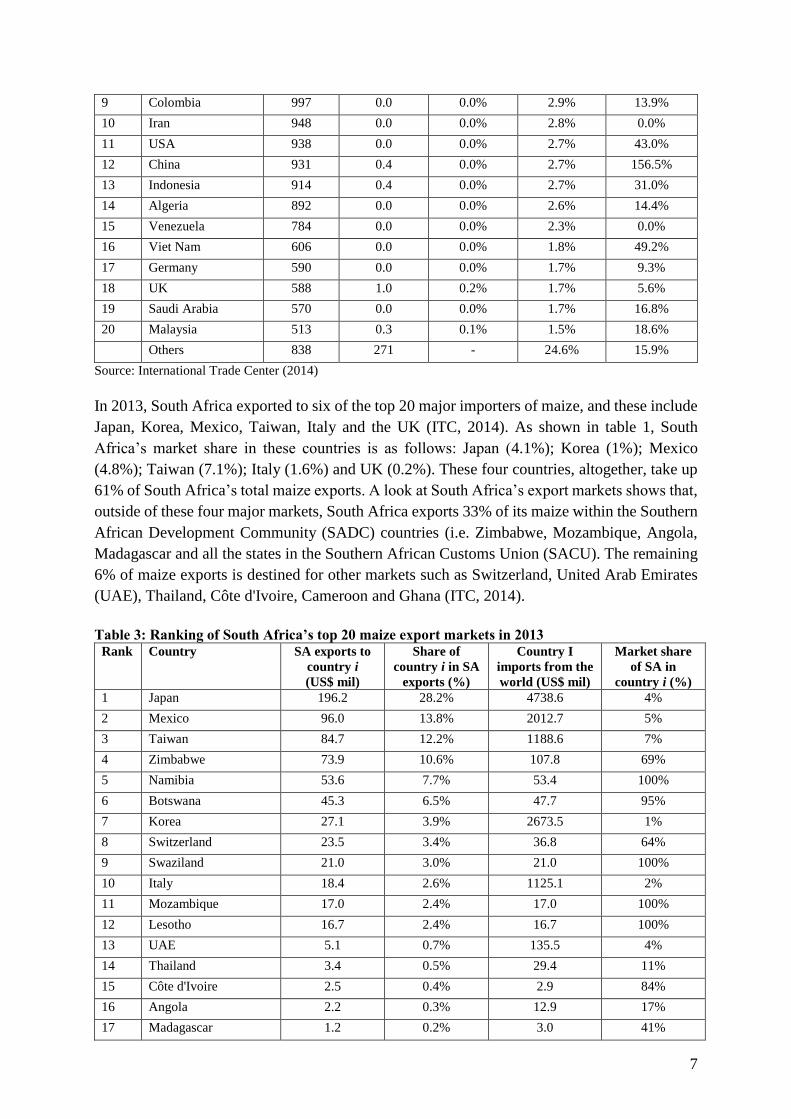
In 2013, South Africa exported to six of the top 20 major importers of maize, and these include
Japan, Korea, Mexico, Taiwan, Italy and the UK (ITC, 2014). As shown in table 1, South
Africa’s market share in these countries is as follows: Japan (4.1%); Korea (1%); Mexico
(4.8%); Taiwan (7.1%); Italy (1.6%) and UK (0.2%). These four countries, altogether, take up
61% of South Africa’s total maize exports. A look at South Africa’s export markets shows that,
outside of these four major markets, South Africa exports 33% of its maize within the Southern
African Development Community (SADC) countries (i.e. Zimbabwe, Mozambique, Angola,
Madagascar and all the states in the Southern African Customs Union (SACU). The remaining
6% of maize exports is destined for other markets such as Switzerland, United Arab Emirates
(UAE), Thailand, Côte d'Ivoire, Cameroon and Ghana (ITC, 2014).
Table 3: Ranking of South Africa’s top 20 maize export markets in 2013
Rank Country SA exports to
country i
(US$ mil)
Share of
country i in SA
exports (%)
Country I
imports from the
world (US$ mil)
Market share
of SA in
country i (%)
1 Japan 196.2 28.2% 4738.6 4%
2 Mexico 96.0 13.8% 2012.7 5%
3 Taiwan 84.7 12.2% 1188.6 7%
4 Zimbabwe 73.9 10.6% 107.8 69%
5 Namibia 53.6 7.7% 53.4 100%
6 Botswana 45.3 6.5% 47.7 95%
7 Korea 27.1 3.9% 2673.5 1%
8 Switzerland 23.5 3.4% 36.8 64%
9 Swaziland 21.0 3.0% 21.0 100%
10 Italy 18.4 2.6% 1125.1 2%
11 Mozambique 17.0 2.4% 17.0 100%
12 Lesotho 16.7 2.4% 16.7 100%
13 UAE 5.1 0.7% 135.5 4%
14 Thailand 3.4 0.5% 29.4 11%
15 Côte d'Ivoire 2.5 0.4% 2.9 84%
16 Angola 2.2 0.3% 12.9 17%
17 Madagascar 1.2 0.2% 3.0 41%
8
18 UK 1.0 0.1% 588.4 0.2%
19 Cameroon 0.8 0.1% 5.0 17%
20 Ghana 0.8 0.1% 1.5 50%
Total 690.2 28% 12817.2 +
Source: International Trade Center (2014)
In total, South Africa has been exporting its maize to 45 different countries over the period 2001
and 2013, with some countries being more consistent importers of South African maize than
others. The SACU and SADC countries feature more prominently each year, while countries
such as Sweden, Kuwait, Mauritania, Turkey, Benin, Seychelles and Thailand, among others,
appear sporadically in particularly years (ITC, 2014). This is also typically the case for larger
export markets such as Korea and Japan.
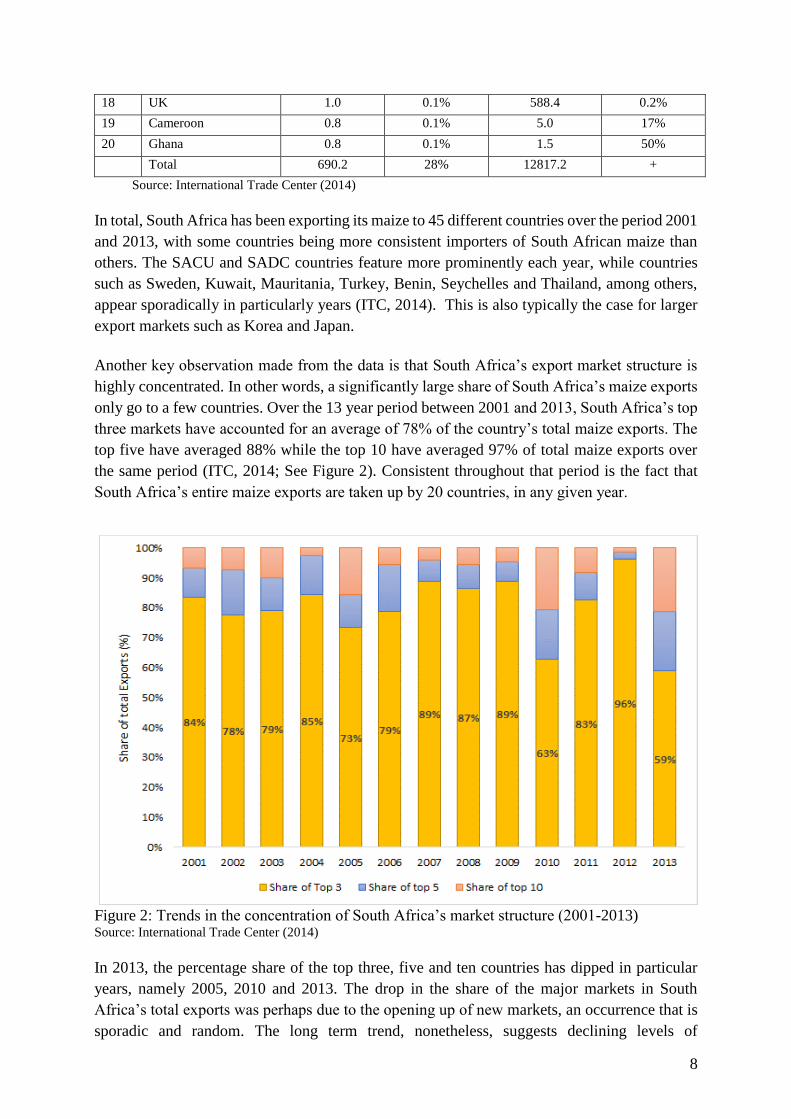
Another key observation made from the data is that South Africa’s export market structure is
highly concentrated. In other words, a significantly large share of South Africa’s maize exports
only go to a few countries. Over the 13 year period between 2001 and 2013, South Africa’s top
three markets have accounted for an average of 78% of the country’s total maize exports. The
top five have averaged 88% while the top 10 have averaged 97% of total maize exports over
the same period (ITC, 2014; See Figure 2). Consistent throughout that period is the fact that
South Africa’s entire maize exports are taken up by 20 countries, in any given year.
Figure 2: Trends in the concentration of South Africa’s market structure (2001-2013) Source: International Trade Center (2014)
In 2013, the percentage share of the top three, five and ten countries has dipped in particular
years, namely 2005, 2010 and 2013. The drop in the share of the major markets in South
Africa’s total exports was perhaps due to the opening up of new markets, an occurrence that is
sporadic and random. The long term trend, nonetheless, suggests declining levels of
9
concentration over time, suggesting that overall, South Africa is exporting its maize to more
countries than it used to.
The export intensity of South African maize exports
Given the high concentration of South Africa’s maize exports, we further seek to explore if
there is a bias against South African maize in its own markets. We determine export bias
through the export intensity index. Per definition, the export intensity index for South African
exports to its markets is calculated by dividing the proportion of exports to country i in exports
to the world by the proportion of country i imports from the world, once country i imports from
South Africa have been excluded. The export intensity index is outlined as follows (Li, 2010):
iw
j
i
ij
ij
MM
M
X
X
x Equation 1
Where ijX represents South Africa’s exports to country i; iX is South Africa’s total exports;
wM is total imports from the world; iM is country i total imports; and jM South Africa’s
total imports. If xij is greater (less) than 1, then South African exports to country i are greater
(less) than the proportion of country i imports to the rest of the world. This can be interpreted
in two ways. Either, country i importers are biased towards trade with South Africa or country
i consumers have a preference for South African maize. If xij = 1, then there is no geographical
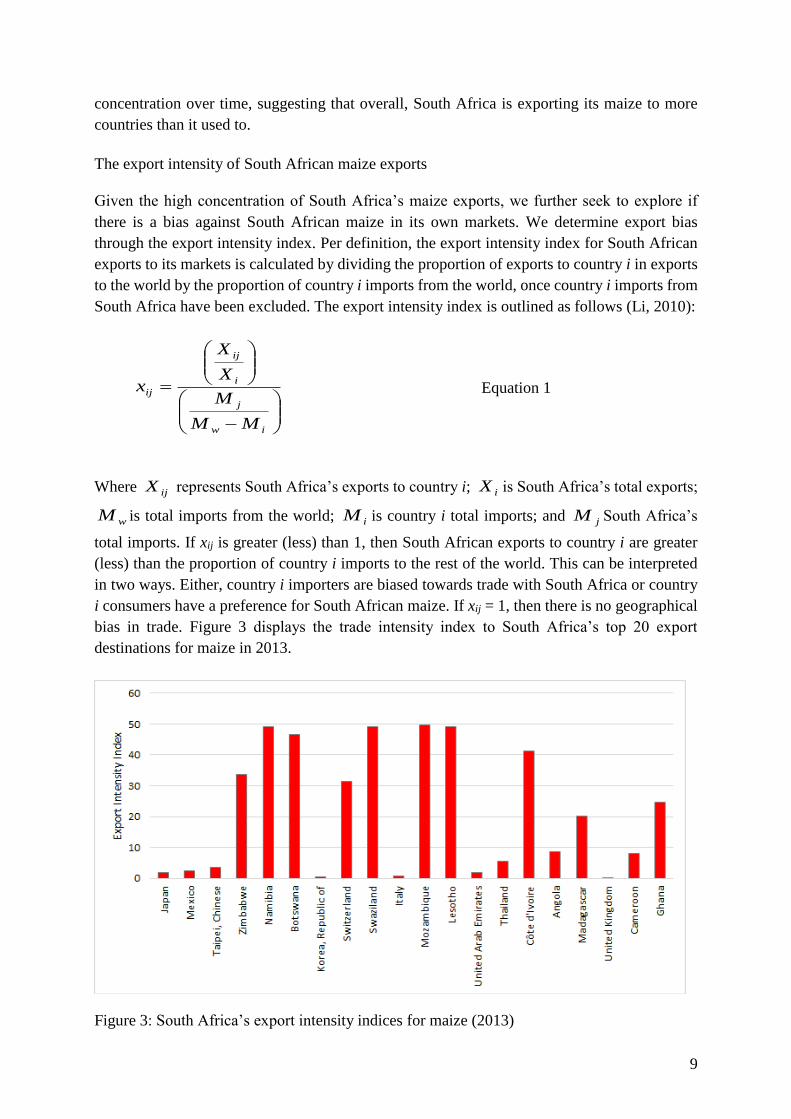
bias in trade. Figure 3 displays the trade intensity index to South Africa’s top 20 export
destinations for maize in 2013.
Figure 3: South Africa’s export intensity indices for maize (2013)
10
Source: International Trade Centre (2014)
The results of the export intensity index calculations reveal that there is a bias for South African
maize in all markets except the United Kingdom (UK), Italy and Korea. Eleven out of the
twenty markets are African countries that are geographically closer to South Africa, and it is
therefore reasonable to conclude that the export bias or preference for South African maize is
also partly influenced by the proximity of South Africa to the markets in the region. This result
underscores the importance of African markets.
The significance of identifying South Africa’s strategic maize export markets
In 2011/12, South Africa exported 2.4 million tonnes on the back of a drought season in the
USA. However, exports declined in the 2012/13 season to 1.8 million tonnes (GSA, 2014). In
2013/14 exports increased to 2 million tonnes owing to increased demand from Zimbabwe3 (the
largest importer of South African white maize that year) this is expected to increase
considerably to 1.9 million tonnes due to a good harvest (GSA, 2014). With South Africa
maintaining high levels of surpluses which are sustained by increasing output, its exports are
threatened by the changing context of global markets. Overall, the form and substance of
changes in global markets is characterised by (though not restricted to) three key factors. Firstly,
the reality of global price volatility as well as unstable exchange rates, which affect South
Africa’s propensity to export at any given point in time (GSA, 2014).
Secondly, the effect of tariff and non-tariff measures (NTMs), particularly the restrictions
related to genetically modified (GM) maize as a global phenomenon that is now becoming a
key obstacle to penetrating key markets, especially in Africa (Kamau & Karin, 2013). Thirdly,
the increasing costs of production that is generally affecting South Africa’s global
competitiveness (BFAP, 2014). The foregoing necessitates a need to continuously re-assess
export markets and identify strategic countries to diversify and expand South Africa’s export
options. Given the foregoing, three critical questions are in order: (1) Which of South Africa’s
maize markets are high growth markets (2) What is South Africa’s market share in these
countries? (3) What is the market potential for South Africa’s maize exports in such countries?
These empirical questions are what guides the analysis of this paper. Moreover, these three
questions fundamentally define markets that are of strategic value (i.e. markets in which maize
demand is high and where South Africa can increase its maize exports). We therefore define
strategic markets as countries with a relatively large demand for maize, in which South Africa
can potentially grow its maize exports.
In identifying countries that align to this definition, we use a growth share matrix (Henderson,
1979). A growth-share matrix is a quadrangular complex that, in this case, identifies and ranks
3 Zimbabwe imported 190 870 tonnes, which is 25% of South Africa’s total maize exports (GSA, 2014)
11
South Africa’s maize markets on the basis of their relative market share and growth rate as
shown in Figure 3.
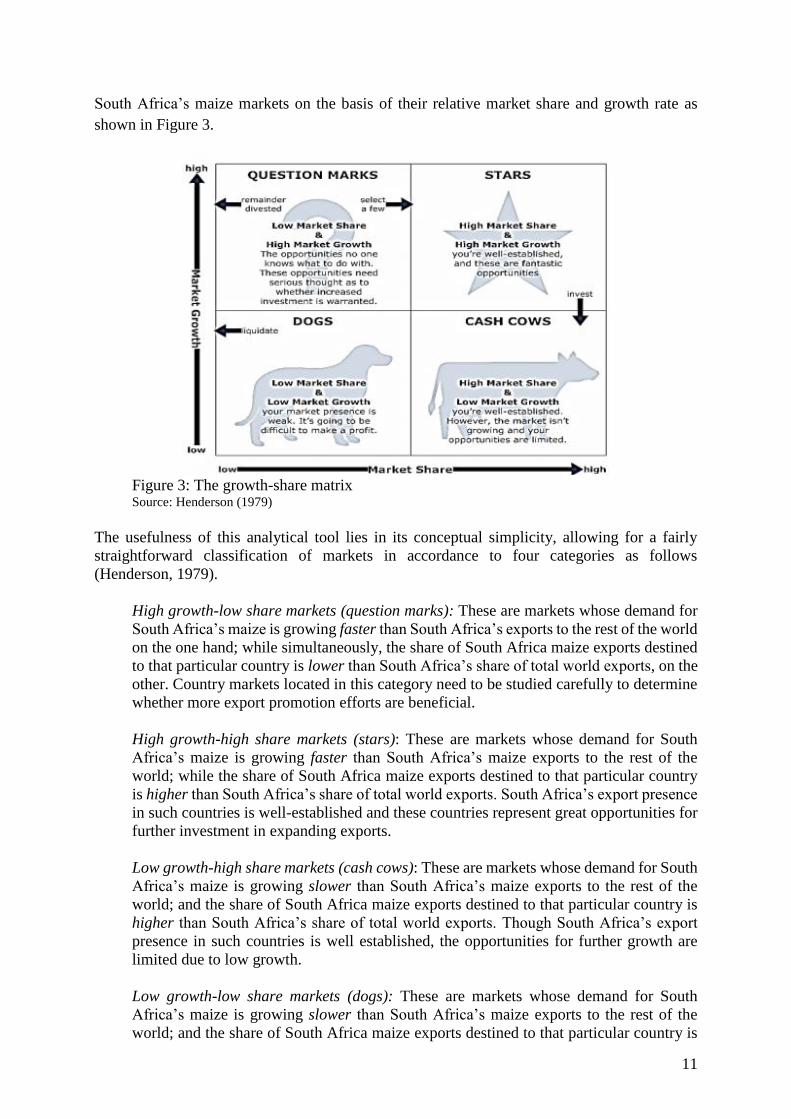
Figure 3: The growth-share matrix Source: Henderson (1979)
The usefulness of this analytical tool lies in its conceptual simplicity, allowing for a fairly
straightforward classification of markets in accordance to four categories as follows
(Henderson, 1979).
High growth-low share markets (question marks): These are markets whose demand for
South Africa’s maize is growing faster than South Africa’s exports to the rest of the world
on the one hand; while simultaneously, the share of South Africa maize exports destined
to that particular country is lower than South Africa’s share of total world exports, on the
other. Country markets located in this category need to be studied carefully to determine
whether more export promotion efforts are beneficial.
High growth-high share markets (stars): These are markets whose demand for South
Africa’s maize is growing faster than South Africa’s maize exports to the rest of the
world; while the share of South Africa maize exports destined to that particular country
is higher than South Africa’s share of total world exports. South Africa’s export presence
in such countries is well-established and these countries represent great opportunities for
further investment in expanding exports.
Low growth-high share markets (cash cows): These are markets whose demand for South
Africa’s maize is growing slower than South Africa’s maize exports to the rest of the
world; and the share of South Africa maize exports destined to that particular country is
higher than South Africa’s share of total world exports. Though South Africa’s export
presence in such countries is well established, the opportunities for further growth are
limited due to low growth.
Low growth-low share markets (dogs): These are markets whose demand for South
Africa’s maize is growing slower than South Africa’s maize exports to the rest of the
world; and the share of South Africa maize exports destined to that particular country is
12
lower than South Africa’s share of total world exports. South Africa’s export presence in
such countries is weak and these markets should be de-prioritised for strategic export
expansion.
Classifying South Africa’s maize export markets using the growth-share criteria
Growth – Share analysis of South Africa’s major markets
In keeping with the aforementioned market categories defined in the export growth-share
matrix, we argue that priority markets are those that exhibit high growth-high share, high
growth-low share, and low growth-high share features. These are markets that are situated in
the stars, question marks and cash cow quadrants of the growth share matrix, respectively.
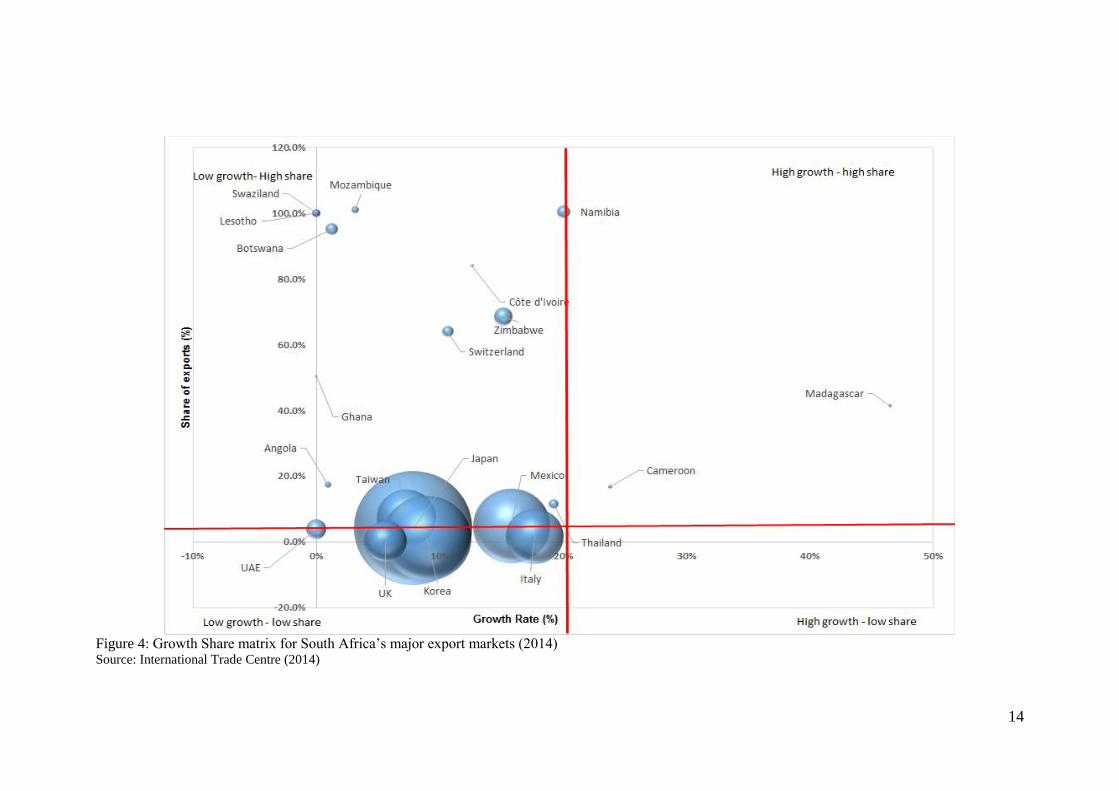
Figure 4 and Figure 5 present the growth share matrix for South Africa’s export markets and
major global maize importers, respectively. The bubble sizes for each country reflects the
overall size of the maize market in each growth share matrix.
For the purposes of the paper, we define high growth markets as those countries whose import
growth of South African maize are above South Africa’s maize exports to the world of 21%.
Similarly, high share countries are those markets whose share in South African maize exports
is above South Africa’s share with the rest of the world – which is 2.2%. Following this criteria,
20 of South Africa’s top export markets were defined as follows:
High growth – high share markets: These include Madagascar and Cameroon, which were
found to be markets opportunities that represent great opportunities for growth. However,
there is a need for some careful consideration on how South Africa increases future maize
exports. Worth noting is that Madagascar and Cameroon are countries which consider
maize as a secondary staple, with cassava, yam, plantains and rice (among others) as the
primary staples (Goufo, 2008).
Low growth – high share markets: These include Japan, Mexico, Taiwan, Zimbabwe,
Namibia, Botswana, Switzerland, Swaziland, Angola, Ghana, Mozambique and Lesotho,
UAE, Thailand, Côte d'Ivoire. These are markets in which South Africa is well-
established but whose capacity for further growth is now limited. This is due to the fact
that, for African markets, South Africa already exports a considerable level of exports to
those countries to the extent of filling at least 41% of their import demand. For non-
African markets, growth is probably restricted by competing imports that are mostly from
the USA, India, Argentina, Pakistan and Brazil (ITC, 2014).
Low growth – low share markets: These include Korea, UK and Italy. South Africa’s
market presence in these countries is weak. These countries, though major global
importers of maize, are not importing significantly from South Africa, but rather import
most of their maize from European countries (i.e. France, Ukraine, Bulgaria, Poland and
Russia), as well as Argentina, Canada and Brazil. Out of South Africa’s top 20 export
destinations, Korea, UK and Italy are non-strategic markets. It should also be noted that
these markets have a ban on GMO maize, which might be a barrier for most of South
Africa’s maize exports (Goufo, 2008).
Among South Africa’s major export markets, there are no high growth – low share
markets. While this specific result is of little empirical value, the broader concern
emerging from the overall growth share analysis done here is the need for South Africa
to expand its reach to new markets. This is necessitated by the fact that, there is little
13
scope for export growth in those markets in which South Africa is well-established. South
Africa would therefore need to further develop new export markets, while preserving its
traditional ones. The general challenge in developing markets is South Africa’s lack of
consistency in maize exports to certain high demand countries outside of SACU and
SADC (ITC, 2014). This lack of consistency is primarily attributed to uneven surplus
levels which, in certain years, preclude South Africa’s regular participation in larger
import markets (GSA, 2014).
14
Figure 4: Growth Share matrix for South Africa’s major export markets (2014) Source: International Trade Centre (2014)
15
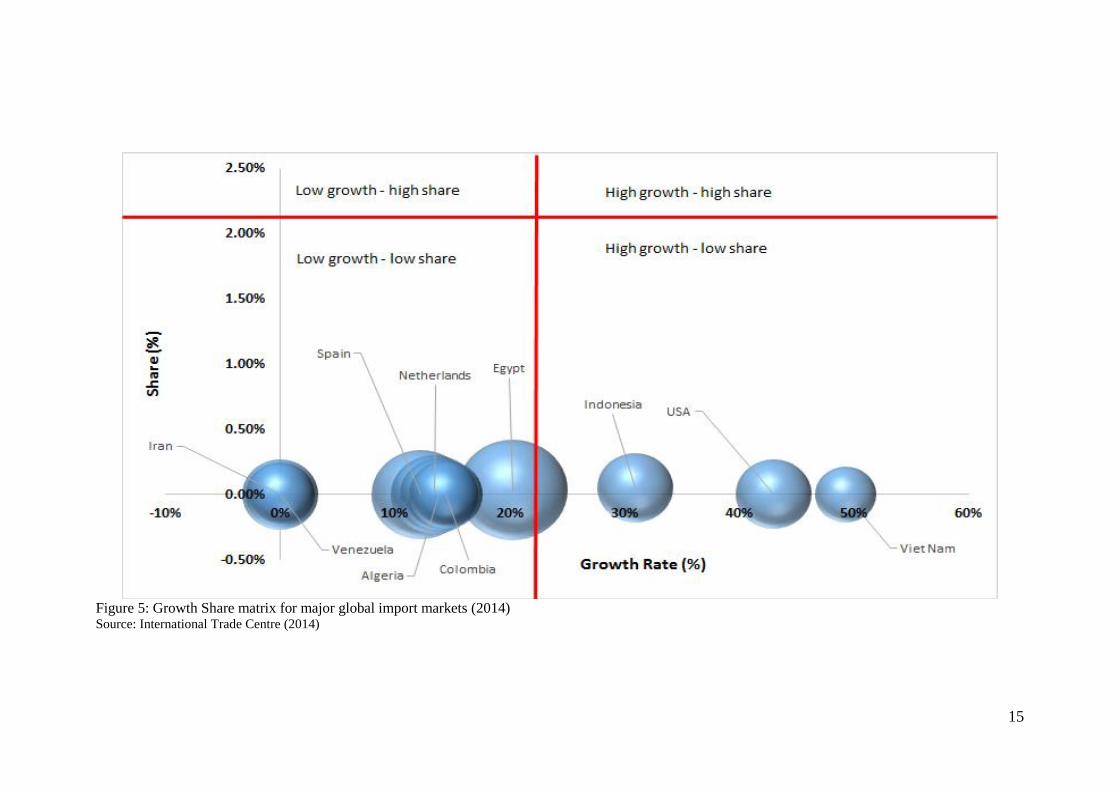
Figure 5: Growth Share matrix for major global import markets (2014) Source: International Trade Centre (2014)
16
Growth – Share analysis of major global import markets
Given that South Africa exports 60% of its total value exports to four of the major global
import markets, we analyse the scope for South Africa to expand its exports to other larger
markets such as Spain, Iran, Venezuela, Algeria, Colombia, Egypt, Vietnam, Indonesia,
USA and Netherlands (ITC, 2014). Important to note is that South Africa’s market presence
in all of the aforementioned countries is generally weak. Apart from Iran, Venezuela,
Colombia, Indonesia and Netherlands; South Africa’s weak presence in major markets is
partly explained by the ban of GMO maize in larger maize importing countries
(Goufo, 2008).
Out of the ten countries outlined in Figure 5, seven are low growth – low share markets (i.e.
Spain, Iran, Venezuela, Algeria, Colombia, Egypt and Netherlands). These are countries
where accessing and growing South Africa’s market presence will be more difficult due to
limited growth potential. Three countries (i.e. Vietnam, Indonesia and USA) are high
growth – low share markets, implying that they are markets which represent great
opportunities for expansion, and South Africa should seriously consider these countries in
the future.
It is interesting to explore where Vietnam, Indonesia and USA source their imports from.
In this regard, three observations were made from the ITC (2014) data, and these are as
follows: Firstly, Indonesia largely imports from India, Brazil, Argentina, USA and
Paraguay. Secondly, Vietnam imports from India, Argentina, Brazil, Pakistan and
Cambodia. Thirdly, USA mostly imports from Canada, Brazil, Argentina, Uruguay and
Paraguay. The countries that feature prominently are Brazil, Argentina, India and the USA,
and they represent South Africa’s strongest competition. Therefore, South Africa would
have to become more competitive than Argentina, Brazil and India if it is to consider
effectively penetrating the Vietnam, Indonesia and USA markets.
South Africa export potential for maize
Given the identified strategic markets for South Africa’s maize exports, we extend the
growth-share analysis through a look at the export potential South Africa has in the
identified countries. To measure the residual opportunity that exists in strategic markets,
we apply the concept of potential supply capacity by measuring the unexploited capacity
for South Africa to export to a strategic market. Put differently, we seek to identify what
South Africa could potentially export to the each of the identified strategic markets,
constrained either by total export supply or import demand. This, per definition, is referred
to as the indicative trade potential (ITP) which can is calculated as follows (Kapuya et al,
2014; Helmers and Pasteels, 2005):
ijjkikijk XXXITP ,min Equation 2
17
Where
J
j
jikik XX1
and
I
i
ijkjk XX1
; and where Xik is the sum of South Africa’s
maize exports to the world; Xjk is the sum of maize imports from the world by a strategic
market and Xij are South Africa’s maize exports to the strategic market. The ITP essentially
serves to show the size of the import market that is yet to be fully explored, and serves as a
guide towards markets that offer substantial trade benefit for South African maize exports.
However, a strong underlying assumption made in calculating the ITP is that the importing
country perfectly absorbs all imports from South Africa, which therefore essentially makes
the ITP value theoretic and indicative (Helmers and Pasteels, 2005). Despite this weakness,
the ITP is, nevertheless, useful in ranking markets.
Another important measure that is used in this analysis is the Relative Indicative Trade
Potential (RITP). The RITP expresses the ITP values in relative terms (i.e. as a percentage
of South African maize exports to the world). The RITP lies between zero and one; with a
value of zero indicating that South African maize exporters strongly depend on the
importing country’s economy; with the opposite being true (Helmers and Pasteels, 2005).
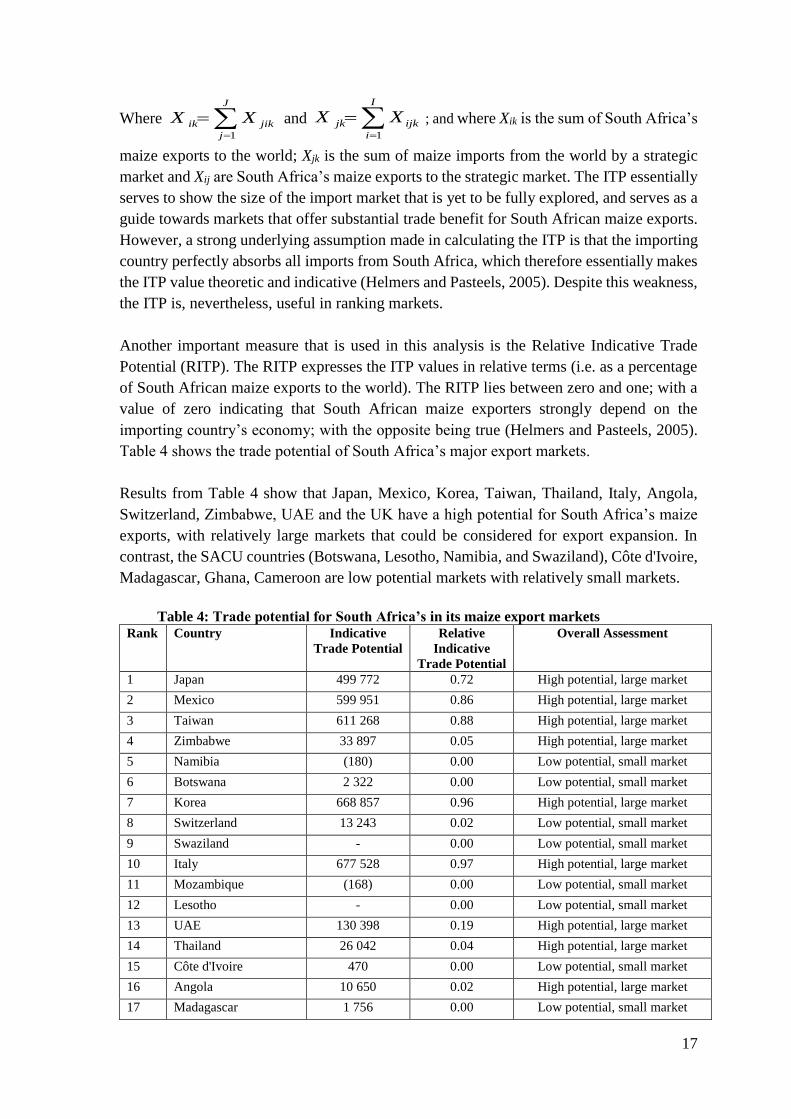
Table 4 shows the trade potential of South Africa’s major export markets.
Results from Table 4 show that Japan, Mexico, Korea, Taiwan, Thailand, Italy, Angola,
Switzerland, Zimbabwe, UAE and the UK have a high potential for South Africa’s maize
exports, with relatively large markets that could be considered for export expansion. In
contrast, the SACU countries (Botswana, Lesotho, Namibia, and Swaziland), Côte d'Ivoire,
Madagascar, Ghana, Cameroon are low potential markets with relatively small markets.
Table 4: Trade potential for South Africa’s in its maize export markets
Rank Country Indicative
Trade Potential
Relative
Indicative
Trade Potential
Overall Assessment
1 Japan 499 772 0.72 High potential, large market
2 Mexico 599 951 0.86 High potential, large market
3 Taiwan 611 268 0.88 High potential, large market
4 Zimbabwe 33 897 0.05 High potential, large market
5 Namibia (180) 0.00 Low potential, small market
6 Botswana 2 322 0.00 Low potential, small market
7 Korea 668 857 0.96 High potential, large market
8 Switzerland 13 243 0.02 Low potential, small market
9 Swaziland - 0.00 Low potential, small market
10 Italy 677 528 0.97 High potential, large market
11 Mozambique (168) 0.00 Low potential, small market
12 Lesotho - 0.00 Low potential, small market
13 UAE 130 398 0.19 High potential, large market
14 Thailand 26 042 0.04 High potential, large market
15 Côte d'Ivoire 470 0.00 Low potential, small market
16 Angola 10 650 0.02 High potential, large market
17 Madagascar 1 756 0.00 Low potential, small market
18
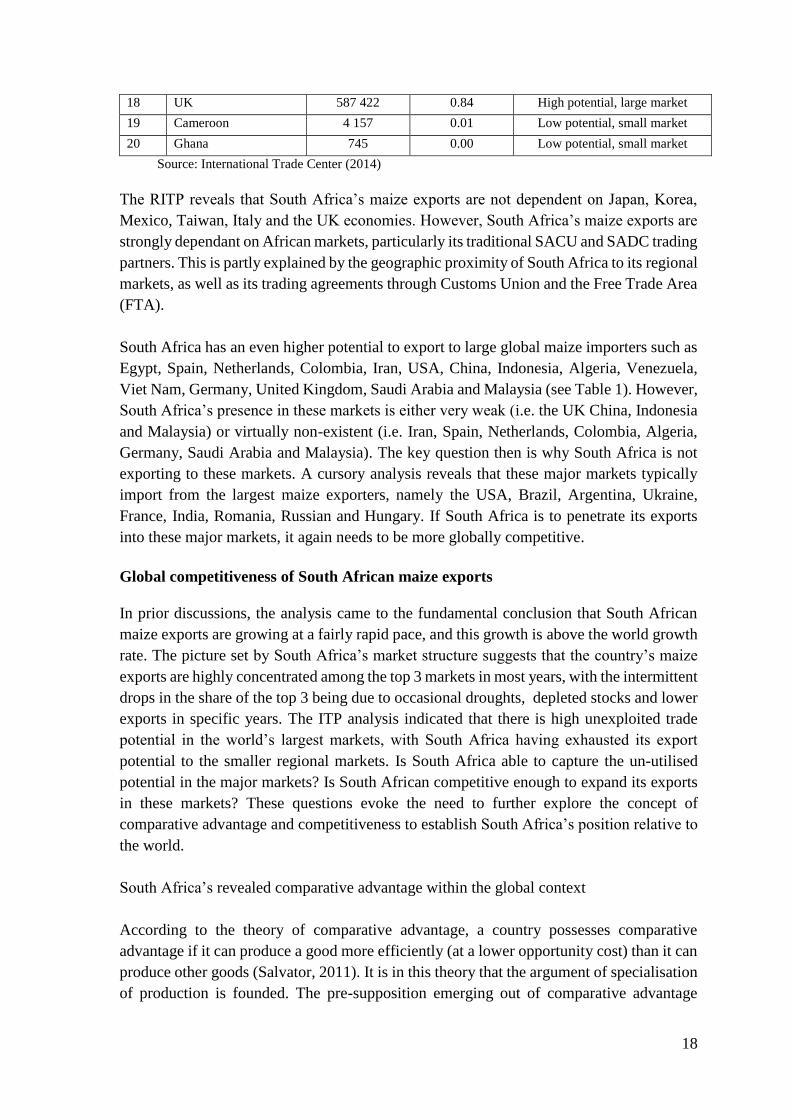
18 UK 587 422 0.84 High potential, large market
19 Cameroon 4 157 0.01 Low potential, small market
20 Ghana 745 0.00 Low potential, small market
Source: International Trade Center (2014)
The RITP reveals that South Africa’s maize exports are not dependent on Japan, Korea,
Mexico, Taiwan, Italy and the UK economies. However, South Africa’s maize exports are
strongly dependant on African markets, particularly its traditional SACU and SADC trading
partners. This is partly explained by the geographic proximity of South Africa to its regional
markets, as well as its trading agreements through Customs Union and the Free Trade Area
(FTA).
South Africa has an even higher potential to export to large global maize importers such as
Egypt, Spain, Netherlands, Colombia, Iran, USA, China, Indonesia, Algeria, Venezuela,
Viet Nam, Germany, United Kingdom, Saudi Arabia and Malaysia (see Table 1). However,
South Africa’s presence in these markets is either very weak (i.e. the UK China, Indonesia
and Malaysia) or virtually non-existent (i.e. Iran, Spain, Netherlands, Colombia, Algeria,
Germany, Saudi Arabia and Malaysia). The key question then is why South Africa is not
exporting to these markets. A cursory analysis reveals that these major markets typically
import from the largest maize exporters, namely the USA, Brazil, Argentina, Ukraine,
France, India, Romania, Russian and Hungary. If South Africa is to penetrate its exports
into these major markets, it again needs to be more globally competitive.
Global competitiveness of South African maize exports
In prior discussions, the analysis came to the fundamental conclusion that South African
maize exports are growing at a fairly rapid pace, and this growth is above the world growth
rate. The picture set by South Africa’s market structure suggests that the country’s maize
exports are highly concentrated among the top 3 markets in most years, with the intermittent
drops in the share of the top 3 being due to occasional droughts, depleted stocks and lower
exports in specific years. The ITP analysis indicated that there is high unexploited trade
potential in the world’s largest markets, with South Africa having exhausted its export
potential to the smaller regional markets. Is South Africa able to capture the un-utilised
potential in the major markets? Is South African competitive enough to expand its exports
in these markets? These questions evoke the need to further explore the concept of
comparative advantage and competitiveness to establish South Africa’s position relative to
the world.
South Africa’s revealed comparative advantage within the global context
According to the theory of comparative advantage, a country possesses comparative
advantage if it can produce a good more efficiently (at a lower opportunity cost) than it can
produce other goods (Salvator, 2011). It is in this theory that the argument of specialisation
of production is founded. The pre-supposition emerging out of comparative advantage
19
theory is that welfare gains can be derived from increased consumption that comes as a
result of the surplus to purchase imports.
Comparative advantage is more of a theoretical notion as it explains the “normative” rather
that the “positive” outcome, which is more amply captured by the concept of
competitiveness. Distortions in global trade necessitate a focus on the latter, although we
shall use comparative advantage theory to methodically build the South African picture
within the global setting. South Africa’s revealed comparative advantage (RCA) in a maize
is shown in Table 5, with the term ‘revealed’, in this case taken to mean that maize’s share
in the South Africa’s export basket is larger than the share of the commodity’s trade in the
world total. Otherwise stated, the RCA measures how significant to South Africa's maize
exports are relative to world trade. Mathematically, RCA’s can be calculated by using the
following formula (Balassa & Noland, 1988):
i k
ik
i
ik
k
j
jk
ik
X
X
X
X
RCA Equation 3
Where ikX represents the maize exports of country i in maize; and jkX is the value of
exports of South Africa;k
jX and i
ikX represents South Africa’s total exports and
country i exports, respectively; andi k
ikX is the total world exports. The results for
this calculation are reported in Table 5, and show the RCA index values for the years from
2001 to 2013 for the top 10 global maize exporters, including South Africa. If the RCA is
greater than one, then South Africa possesses a revealed comparative advantage in maize.
The higher the value, the more efficient South Africa is in the production of maize.
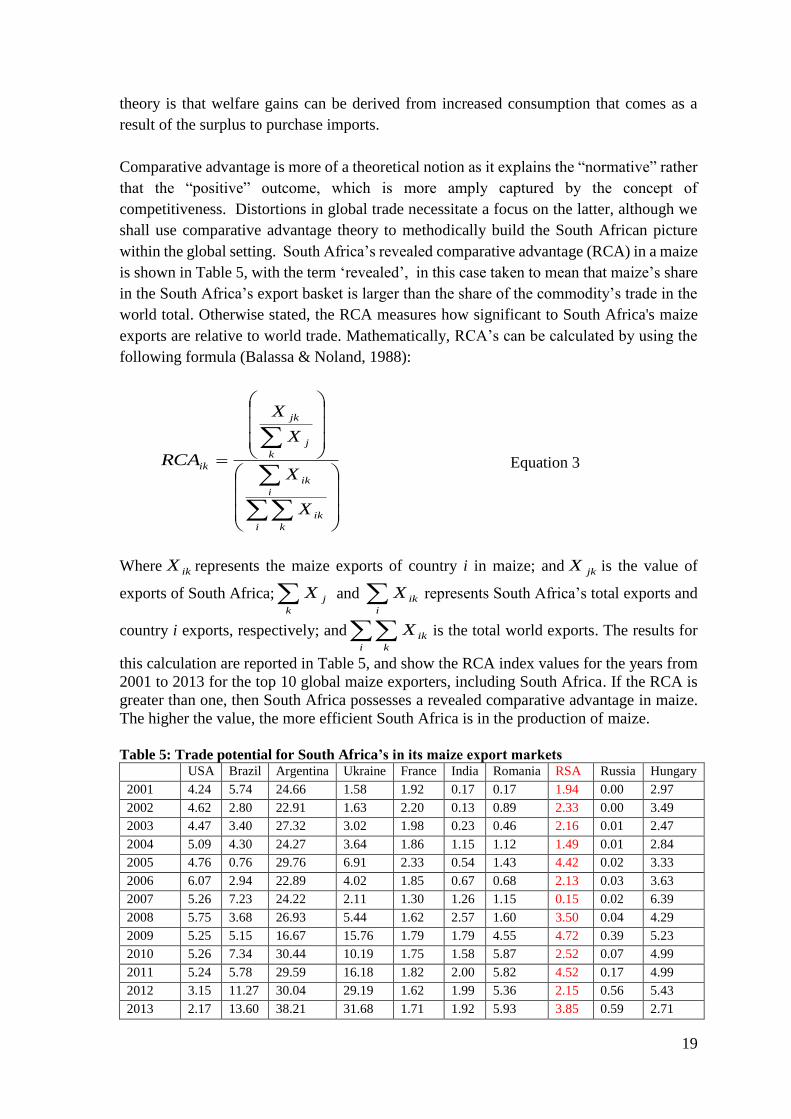
Table 5: Trade potential for South Africa’s in its maize export markets
USA Brazil Argentina Ukraine France India Romania RSA Russia Hungary
2001 4.24 5.74 24.66 1.58 1.92 0.17 0.17 1.94 0.00 2.97
2002 4.62 2.80 22.91 1.63 2.20 0.13 0.89 2.33 0.00 3.49
2003 4.47 3.40 27.32 3.02 1.98 0.23 0.46 2.16 0.01 2.47
2004 5.09 4.30 24.27 3.64 1.86 1.15 1.12 1.49 0.01 2.84
2005 4.76 0.76 29.76 6.91 2.33 0.54 1.43 4.42 0.02 3.33
2006 6.07 2.94 22.89 4.02 1.85 0.67 0.68 2.13 0.03 3.63
2007 5.26 7.23 24.22 2.11 1.30 1.26 1.15 0.15 0.02 6.39
2008 5.75 3.68 26.93 5.44 1.62 2.57 1.60 3.50 0.04 4.29
2009 5.25 5.15 16.67 15.76 1.79 1.79 4.55 4.72 0.39 5.23
2010 5.26 7.34 30.44 10.19 1.75 1.58 5.87 2.52 0.07 4.99
2011 5.24 5.78 29.59 16.18 1.82 2.00 5.82 4.52 0.17 4.99
2012 3.15 11.27 30.04 29.19 1.62 1.99 5.36 2.15 0.56 5.43
2013 2.17 13.60 38.21 31.68 1.71 1.92 5.93 3.85 0.59 2.71
20
Source: International Trade Center (2014)
The results on the table show that South Africa has a comparative advantage in maize, and
the country is at par with some of the largest exporters in the world such as Hungary, France
and India. Argentina, Ukraine and Brazil have very strong comparative advantage in maize,
as well as Romania and USA. Russia does not have a comparative advantage, even though
it is a major global exporter.
Competitiveness of South Africa’s maize sector at farm level
Under scenarios of trade distorting subsidies, such as those in the European Union (EU),
USA, India and Russia, among others, the comparative advantage theory fails to hold; as
reflected by the inconsistency of high export countries that have no comparative advantage
(Bahta, 2004). Competitiveness, in this instance, becomes a more suitable indicator of
determining South Africa’s ability to participate in global markets.
In unpacking the competitiveness of major global maize exporters, we draw from the
Agribenchmark (2014) data which is used by the Bureau for Food and Agricultural Policy
(BFAP). Agribenchmark is a farm level network which compares global agricultural
enterprises in all continents, in specific countries across the world. In this paper, we use the
Agribenchmark data to compare of South African maize production costs against some of
its global competitors namely, USA, Ukraine, Argentina and Brazil, as shown in Figure 6.
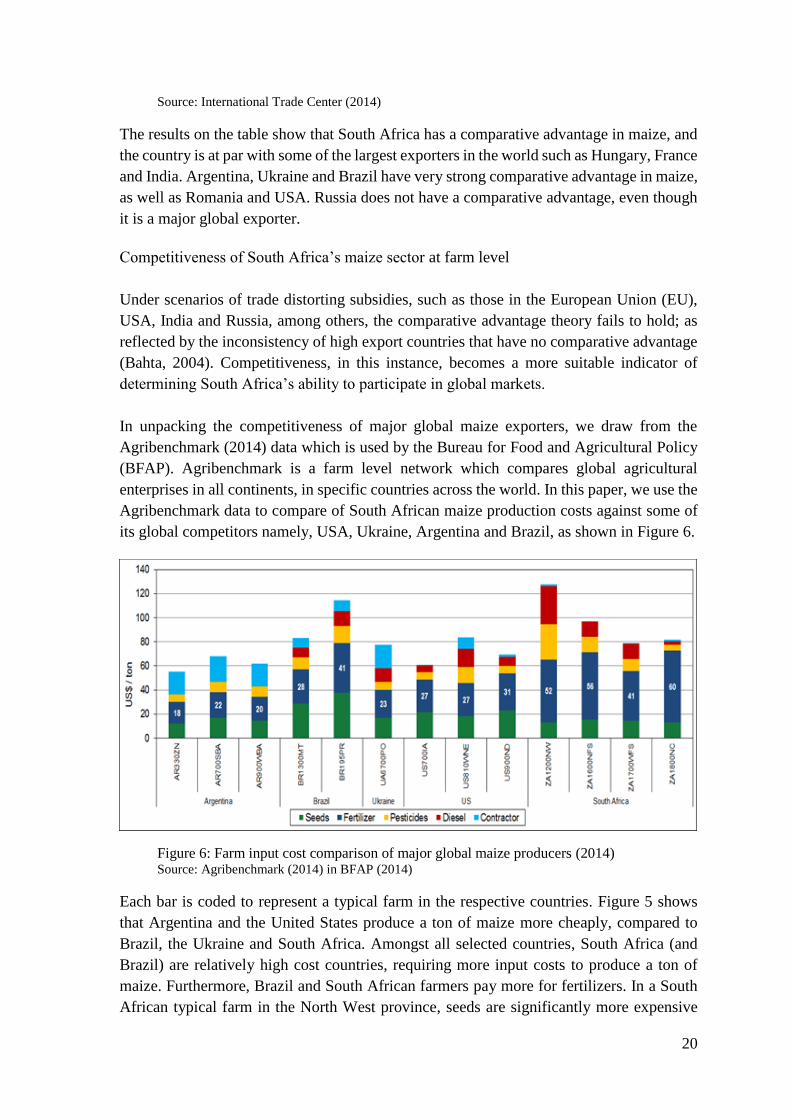
Figure 6: Farm input cost comparison of major global maize producers (2014) Source: Agribenchmark (2014) in BFAP (2014)
Each bar is coded to represent a typical farm in the respective countries. Figure 5 shows
that Argentina and the United States produce a ton of maize more cheaply, compared to
Brazil, the Ukraine and South Africa. Amongst all selected countries, South Africa (and
Brazil) are relatively high cost countries, requiring more input costs to produce a ton of
maize. Furthermore, Brazil and South African farmers pay more for fertilizers. In a South
African typical farm in the North West province, seeds are significantly more expensive
21
compared to all the other countries. Similarly, a South African typical farm in the Northern
Cape incurs higher fertilizer costs than all the other countries. Moreover, diesel was also
found to be more costly in South African farms compared to other countries (US, Argentina,
the Ukraine and Brazil). According to GSA (2014) approximately 75% of South African
fertilizers are imported, and the costs are aggravated by the weak Rand. Likewise with
pesticide, approximately 98% of South African agro-chemicals are imported (GSA, 2014).
Overall, South African (and Brazilian) farmers establish maize at higher costs than the
United States, Argentina and the Ukraine; owing to high fertilizer and pesticides costs
(BFAP, 2014). This makes South Africa less globally competitive than the other world
maize producers.
7.1 Competitiveness of South Africa’s logistics
Logistical Costs
Normatively, deep-sea exports are in the form of (bagged/staked) dry-bulk rather than
containerised freight. As an exception, containerised shipment was witnessed during the
2007/08 food price crisis period4. Although a comparative analysis of logistics costs of dry
bulk is ideal, data constraints across all major exporters and importers made only
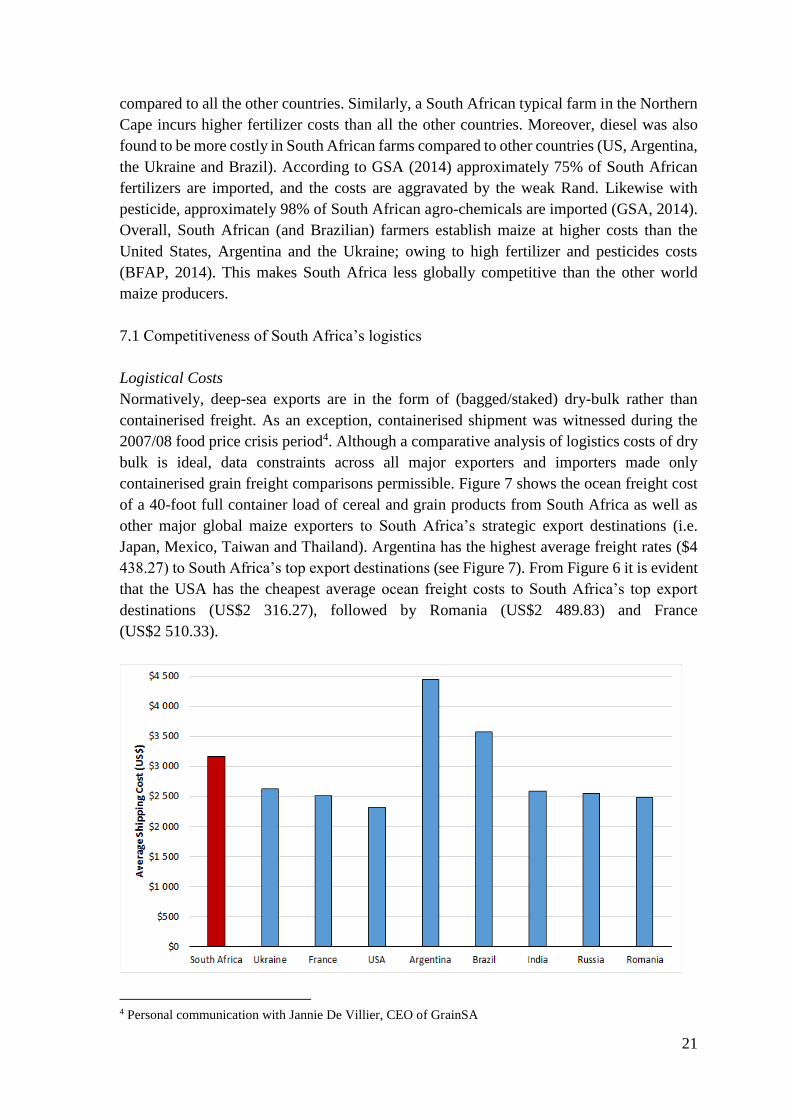
containerised grain freight comparisons permissible. Figure 7 shows the ocean freight cost
of a 40-foot full container load of cereal and grain products from South Africa as well as
other major global maize exporters to South Africa’s strategic export destinations (i.e.
Japan, Mexico, Taiwan and Thailand). Argentina has the highest average freight rates ($4
438.27) to South Africa’s top export destinations (see Figure 7). From Figure 6 it is evident
that the USA has the cheapest average ocean freight costs to South Africa’s top export
destinations (US$2 316.27), followed by Romania (US$2 489.83) and France
(US$2 510.33).
4 Personal communication with Jannie De Villier, CEO of GrainSA
22
Figure 7: Comparison of average cereal and grain shipping costs of competitors to South Africa’s
strategic markets (2014) Source: World Freight Rates (2014)
South Africa has the third highest shipping costs to export cereal and grain (US$3 164.33)
after Argentina ($4 438.27) and Brazil ($3 575.21). According to the TRADE Research
Niche Area (2013), these high prices are probably associated with South Africa’s weak
bargaining power with shipping lines to the respective destinations, due to lower volumes
of exports compared to South Africa’s peer countries. Nonetheless, South Africa’s
international shipping costs to growing maize markets in Asia are competitive in
comparison to Brazil and Argentina. Therefore, overall, the rate of international shipping
costs seem to be restrictive to South Africa’s maize trade competitiveness.
Logistics Efficiency
In assessing South Africa’s logistics efficiency, the paper makes use of the World Bank’s
(2014) Logistics Performance Index (LPI). The LPI overall score reflects perceptions of a
country's logistics based on efficiency of customs clearance process, quality of trade- and
transport-related infrastructure, ease of arranging competitively priced shipments, quality
of logistics services, ability to track and trace consignments, and frequency with which
shipments reach the consignee within the scheduled time (World Bank, 2014). The LPI
indices and rankings are shown in Table A3 (in the appendix) and Table 6, respectively.
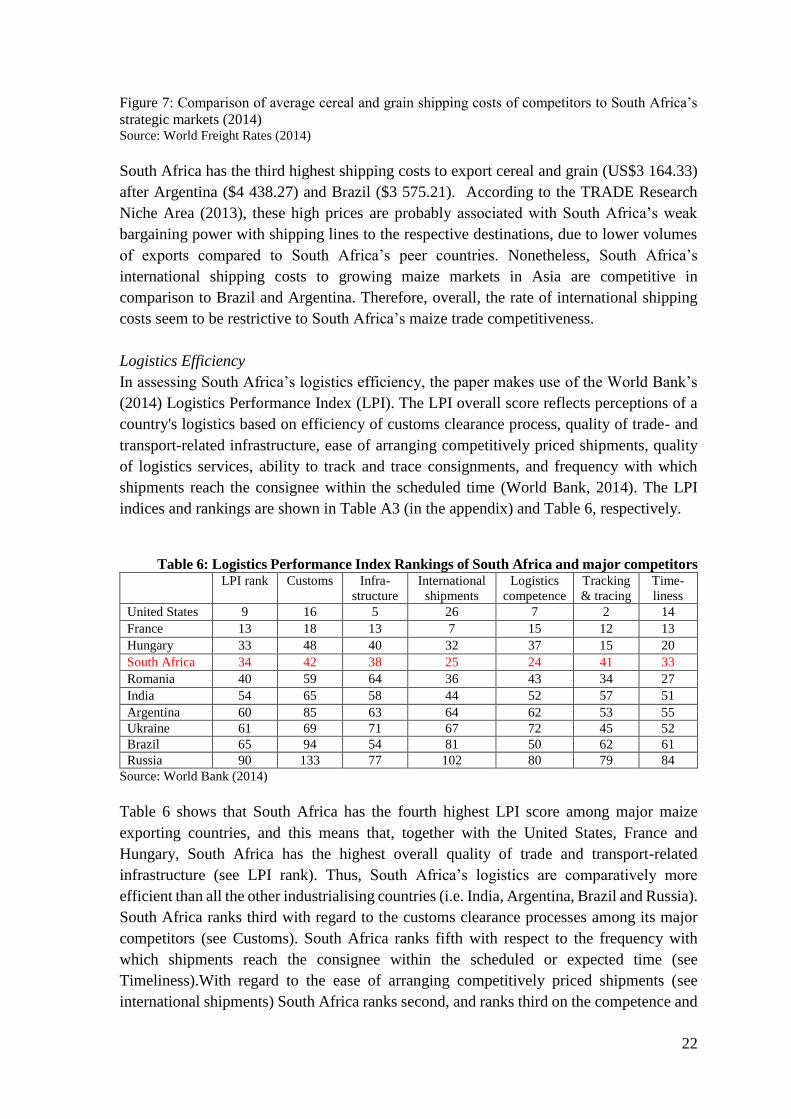
Table 6: Logistics Performance Index Rankings of South Africa and major competitors
LPI rank Customs Infra-
structure
International
shipments
Logistics
competence
Tracking
& tracing
Time-
liness
United States 9 16 5 26 7 2 14
France 13 18 13 7 15 12 13
Hungary 33 48 40 32 37 15 20
South Africa 34 42 38 25 24 41 33
Romania 40 59 64 36 43 34 27
India 54 65 58 44 52 57 51
Argentina 60 85 63 64 62 53 55
Ukraine 61 69 71 67 72 45 52
Brazil 65 94 54 81 50 62 61
Russia 90 133 77 102 80 79 84
Source: World Bank (2014)
Table 6 shows that South Africa has the fourth highest LPI score among major maize
exporting countries, and this means that, together with the United States, France and
Hungary, South Africa has the highest overall quality of trade and transport-related
infrastructure (see LPI rank). Thus, South Africa’s logistics are comparatively more
efficient than all the other industrialising countries (i.e. India, Argentina, Brazil and Russia).
South Africa ranks third with regard to the customs clearance processes among its major
competitors (see Customs). South Africa ranks fifth with respect to the frequency with
which shipments reach the consignee within the scheduled or expected time (see
Timeliness).With regard to the ease of arranging competitively priced shipments (see
international shipments) South Africa ranks second, and ranks third on the competence and
23
quality of logistics services (see logistics competence). Therefore, border logistics do not
present a limiting factor for South Africa’s maize trade competitiveness.
A tariff and non-tariff barrier analysis of South Africa’s strategic and potentially
strategic maize markets
Given South Africa’s comparative advantage and global competitiveness, the paper
attempts to establish the country’s market access in both its own strategic markets (in which
South Africa has a strong market presence) as well as major global markets (where South
Africa has either a weak or no market presence). Moreover, a comparative analysis of South
Africa’s market access against that of its major competitors is also a factor that is important
to understand. Major global producers of maize such as Argentina, Brazil, Ukraine, USA,
India, France, Romania, Russia and Hungary were identified as South Africa’s key
competitors in global markets.
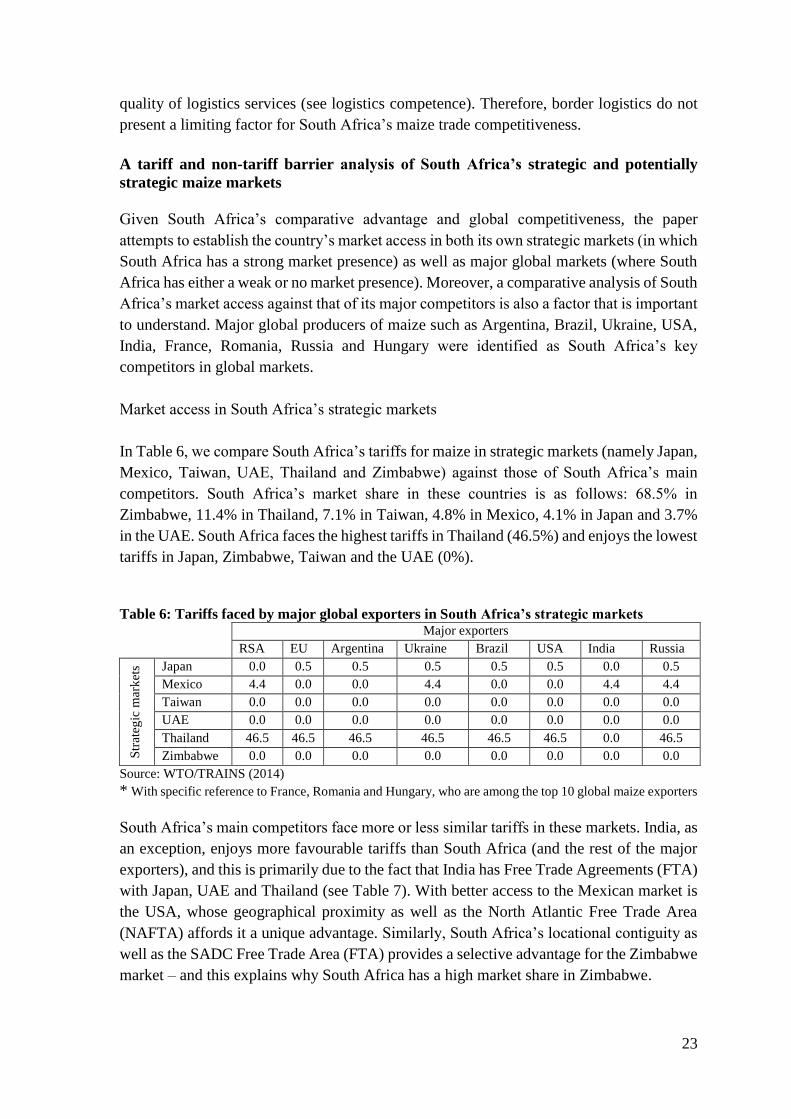
Market access in South Africa’s strategic markets
In Table 6, we compare South Africa’s tariffs for maize in strategic markets (namely Japan,
Mexico, Taiwan, UAE, Thailand and Zimbabwe) against those of South Africa’s main
competitors. South Africa’s market share in these countries is as follows: 68.5% in
Zimbabwe, 11.4% in Thailand, 7.1% in Taiwan, 4.8% in Mexico, 4.1% in Japan and 3.7%
in the UAE. South Africa faces the highest tariffs in Thailand (46.5%) and enjoys the lowest
tariffs in Japan, Zimbabwe, Taiwan and the UAE (0%).
Table 6: Tariffs faced by major global exporters in South Africa’s strategic markets
Major exporters
RSA EU Argentina Ukraine Brazil USA India Russia
Str
ateg
ic m
ark
ets
Japan 0.0 0.5 0.5 0.5 0.5 0.5 0.0 0.5
Mexico 4.4 0.0 0.0 4.4 0.0 0.0 4.4 4.4
Taiwan 0.0 0.0 0.0 0.0 0.0 0.0 0.0 0.0 UAE 0.0 0.0 0.0 0.0 0.0 0.0 0.0 0.0 Thailand 46.5 46.5 46.5 46.5 46.5 46.5 0.0 46.5 Zimbabwe 0.0 0.0 0.0 0.0 0.0 0.0 0.0 0.0
Source: WTO/TRAINS (2014)
* With specific reference to France, Romania and Hungary, who are among the top 10 global maize exporters
South Africa’s main competitors face more or less similar tariffs in these markets. India, as
an exception, enjoys more favourable tariffs than South Africa (and the rest of the major
exporters), and this is primarily due to the fact that India has Free Trade Agreements (FTA)
with Japan, UAE and Thailand (see Table 7). With better access to the Mexican market is
the USA, whose geographical proximity as well as the North Atlantic Free Trade Area
(NAFTA) affords it a unique advantage. Similarly, South Africa’s locational contiguity as
well as the SADC Free Trade Area (FTA) provides a selective advantage for the Zimbabwe
market – and this explains why South Africa has a high market share in Zimbabwe.
24
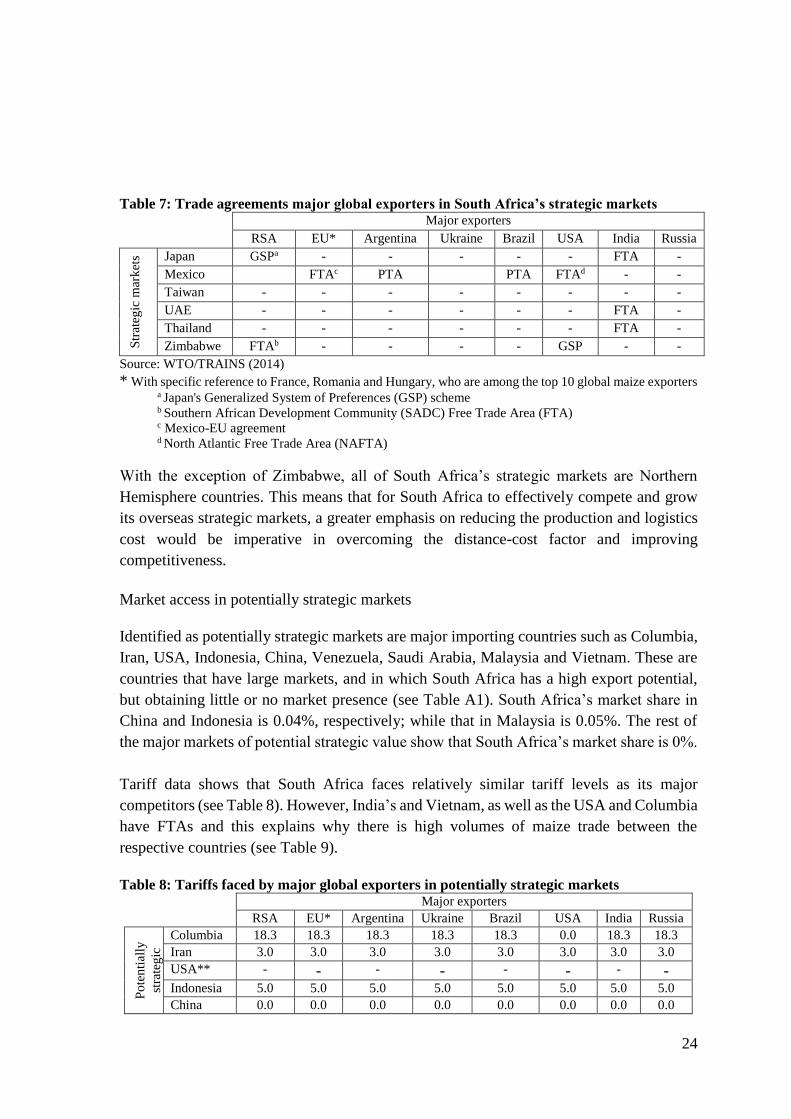
Table 7: Trade agreements major global exporters in South Africa’s strategic markets Major exporters
RSA EU* Argentina Ukraine Brazil USA India Russia
Str
ateg
ic m
ark
ets
Japan GSPa - - - - - FTA -
Mexico FTAc PTA PTA FTAd - -
Taiwan - - - - - - - - UAE - - - - - - FTA -
Thailand - - - - - - FTA -
Zimbabwe FTAb - - - - GSP - - Source: WTO/TRAINS (2014)
* With specific reference to France, Romania and Hungary, who are among the top 10 global maize exporters a Japan's Generalized System of Preferences (GSP) scheme b Southern African Development Community (SADC) Free Trade Area (FTA) c Mexico-EU agreement d North Atlantic Free Trade Area (NAFTA)
With the exception of Zimbabwe, all of South Africa’s strategic markets are Northern
Hemisphere countries. This means that for South Africa to effectively compete and grow
its overseas strategic markets, a greater emphasis on reducing the production and logistics
cost would be imperative in overcoming the distance-cost factor and improving
competitiveness.
Market access in potentially strategic markets
Identified as potentially strategic markets are major importing countries such as Columbia,
Iran, USA, Indonesia, China, Venezuela, Saudi Arabia, Malaysia and Vietnam. These are
countries that have large markets, and in which South Africa has a high export potential,
but obtaining little or no market presence (see Table A1). South Africa’s market share in
China and Indonesia is 0.04%, respectively; while that in Malaysia is 0.05%. The rest of
the major markets of potential strategic value show that South Africa’s market share is 0%.
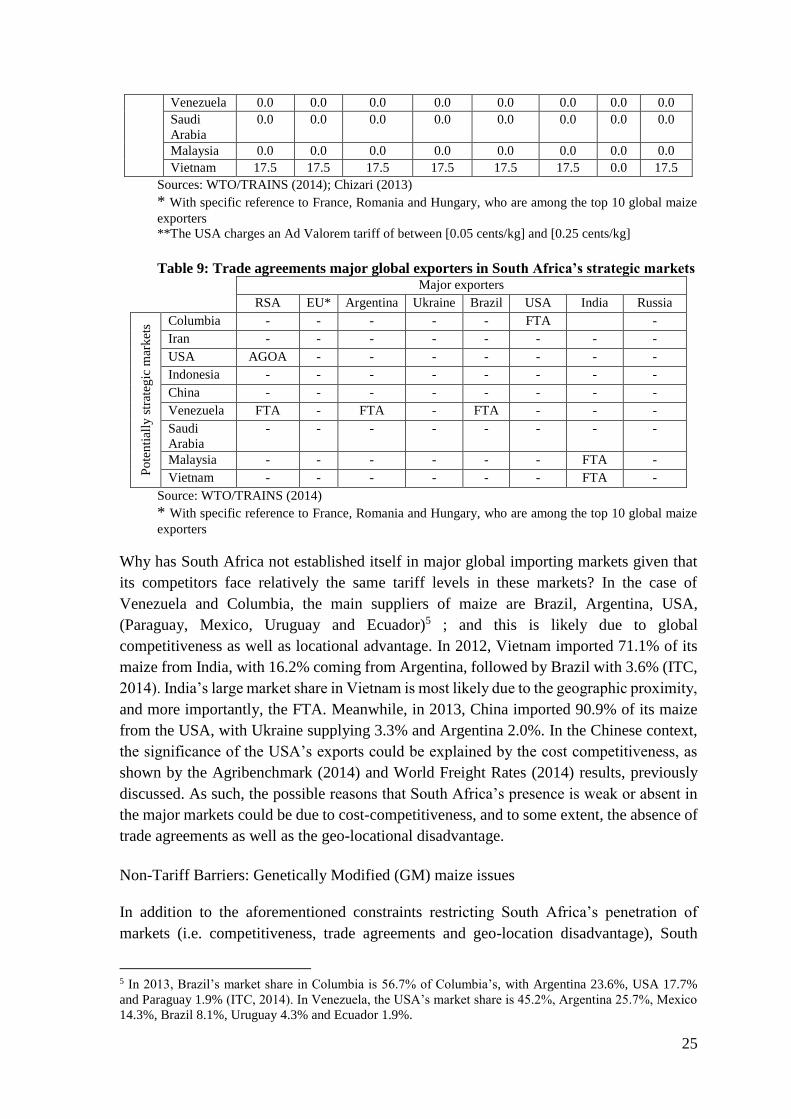
Tariff data shows that South Africa faces relatively similar tariff levels as its major
competitors (see Table 8). However, India’s and Vietnam, as well as the USA and Columbia
have FTAs and this explains why there is high volumes of maize trade between the
respective countries (see Table 9).
Table 8: Tariffs faced by major global exporters in potentially strategic markets Major exporters
RSA EU* Argentina Ukraine Brazil USA India Russia
Po
ten
tial
ly
stra
teg
ic
mar
ket
s
Columbia 18.3 18.3 18.3 18.3 18.3 0.0 18.3 18.3 Iran 3.0 3.0 3.0 3.0 3.0 3.0 3.0 3.0 USA** - - - - - - - - Indonesia 5.0 5.0 5.0 5.0 5.0 5.0 5.0 5.0 China 0.0 0.0 0.0 0.0 0.0 0.0 0.0 0.0
25
Venezuela 0.0 0.0 0.0 0.0 0.0 0.0 0.0 0.0 Saudi
Arabia
0.0 0.0 0.0 0.0 0.0 0.0 0.0 0.0
Malaysia 0.0 0.0 0.0 0.0 0.0 0.0 0.0 0.0 Vietnam 17.5 17.5 17.5 17.5 17.5 17.5 0.0 17.5
Sources: WTO/TRAINS (2014); Chizari (2013)
* With specific reference to France, Romania and Hungary, who are among the top 10 global maize
exporters **The USA charges an Ad Valorem tariff of between [0.05 cents/kg] and [0.25 cents/kg]
Table 9: Trade agreements major global exporters in South Africa’s strategic markets
Major exporters
RSA EU* Argentina Ukraine Brazil USA India Russia
Po
ten
tial
ly s
trat
egic
mar
ket
s
Columbia - - - - - FTA -
Iran - - - - - - - - USA AGOA - - - - - - - Indonesia - - - - - - - -
China - - - - - - - -
Venezuela FTA - FTA - FTA - - - Saudi
Arabia
- - - - - - - -
Malaysia - - - - - - FTA - Vietnam - - - - - - FTA -
Source: WTO/TRAINS (2014)
* With specific reference to France, Romania and Hungary, who are among the top 10 global maize
exporters
Why has South Africa not established itself in major global importing markets given that
its competitors face relatively the same tariff levels in these markets? In the case of
Venezuela and Columbia, the main suppliers of maize are Brazil, Argentina, USA,
(Paraguay, Mexico, Uruguay and Ecuador)5 ; and this is likely due to global
competitiveness as well as locational advantage. In 2012, Vietnam imported 71.1% of its
maize from India, with 16.2% coming from Argentina, followed by Brazil with 3.6% (ITC,
2014). India’s large market share in Vietnam is most likely due to the geographic proximity,
and more importantly, the FTA. Meanwhile, in 2013, China imported 90.9% of its maize
from the USA, with Ukraine supplying 3.3% and Argentina 2.0%. In the Chinese context,
the significance of the USA’s exports could be explained by the cost competitiveness, as
shown by the Agribenchmark (2014) and World Freight Rates (2014) results, previously
discussed. As such, the possible reasons that South Africa’s presence is weak or absent in
the major markets could be due to cost-competitiveness, and to some extent, the absence of
trade agreements as well as the geo-locational disadvantage.
Non-Tariff Barriers: Genetically Modified (GM) maize issues
In addition to the aforementioned constraints restricting South Africa’s penetration of
markets (i.e. competitiveness, trade agreements and geo-location disadvantage), South
5 In 2013, Brazil’s market share in Columbia is 56.7% of Columbia’s, with Argentina 23.6%, USA 17.7%
and Paraguay 1.9% (ITC, 2014). In Venezuela, the USA’s market share is 45.2%, Argentina 25.7%, Mexico
14.3%, Brazil 8.1%, Uruguay 4.3% and Ecuador 1.9%.
26
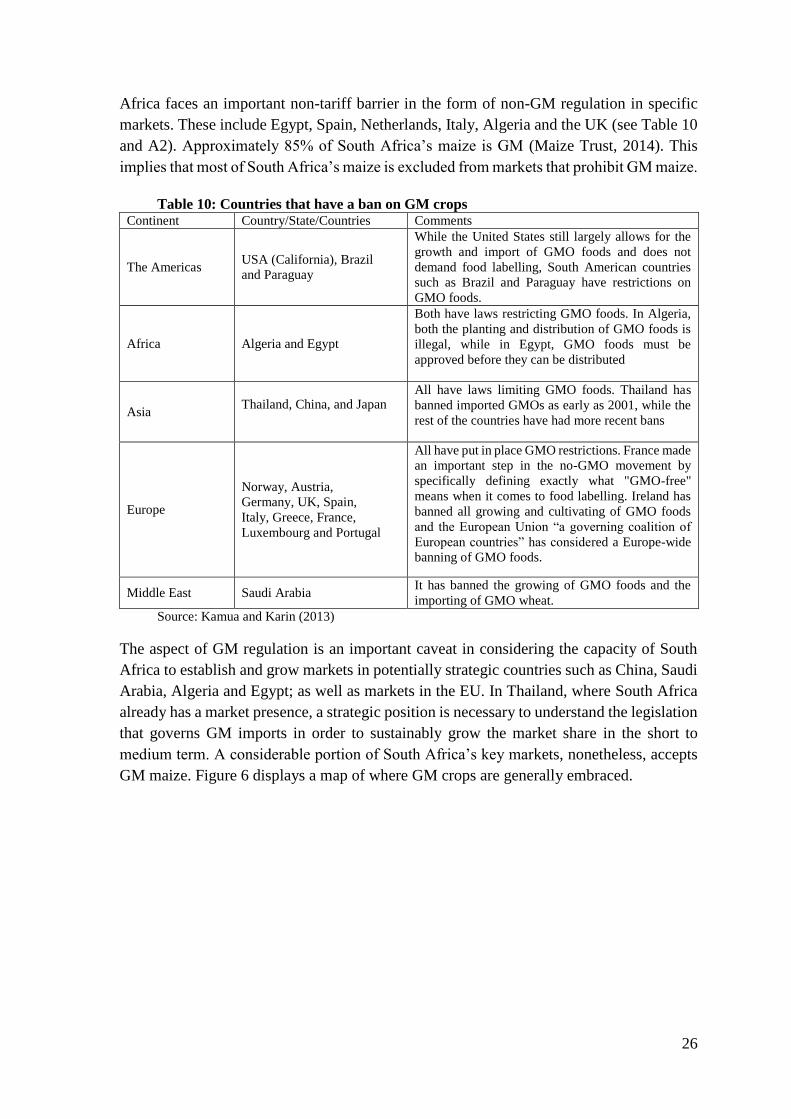
Africa faces an important non-tariff barrier in the form of non-GM regulation in specific
markets. These include Egypt, Spain, Netherlands, Italy, Algeria and the UK (see Table 10
and A2). Approximately 85% of South Africa’s maize is GM (Maize Trust, 2014). This
implies that most of South Africa’s maize is excluded from markets that prohibit GM maize.
Table 10: Countries that have a ban on GM crops Continent Country/State/Countries Comments
The Americas USA (California), Brazil
and Paraguay
While the United States still largely allows for the
growth and import of GMO foods and does not
demand food labelling, South American countries
such as Brazil and Paraguay have restrictions on
GMO foods.
Africa Algeria and Egypt
Both have laws restricting GMO foods. In Algeria,
both the planting and distribution of GMO foods is
illegal, while in Egypt, GMO foods must be
approved before they can be distributed
Asia Thailand, China, and Japan
All have laws limiting GMO foods. Thailand has
banned imported GMOs as early as 2001, while the
rest of the countries have had more recent bans
Europe
Norway, Austria,
Germany, UK, Spain,
Italy, Greece, France,
Luxembourg and Portugal
All have put in place GMO restrictions. France made
an important step in the no-GMO movement by
specifically defining exactly what "GMO-free"
means when it comes to food labelling. Ireland has
banned all growing and cultivating of GMO foods
and the European Union “a governing coalition of
European countries” has considered a Europe-wide
banning of GMO foods.
Middle East Saudi Arabia It has banned the growing of GMO foods and the
importing of GMO wheat.
Source: Kamua and Karin (2013)
The aspect of GM regulation is an important caveat in considering the capacity of South
Africa to establish and grow markets in potentially strategic countries such as China, Saudi
Arabia, Algeria and Egypt; as well as markets in the EU. In Thailand, where South Africa
already has a market presence, a strategic position is necessary to understand the legislation
that governs GM imports in order to sustainably grow the market share in the short to
medium term. A considerable portion of South Africa’s key markets, nonetheless, accepts
GM maize. Figure 6 displays a map of where GM crops are generally embraced.
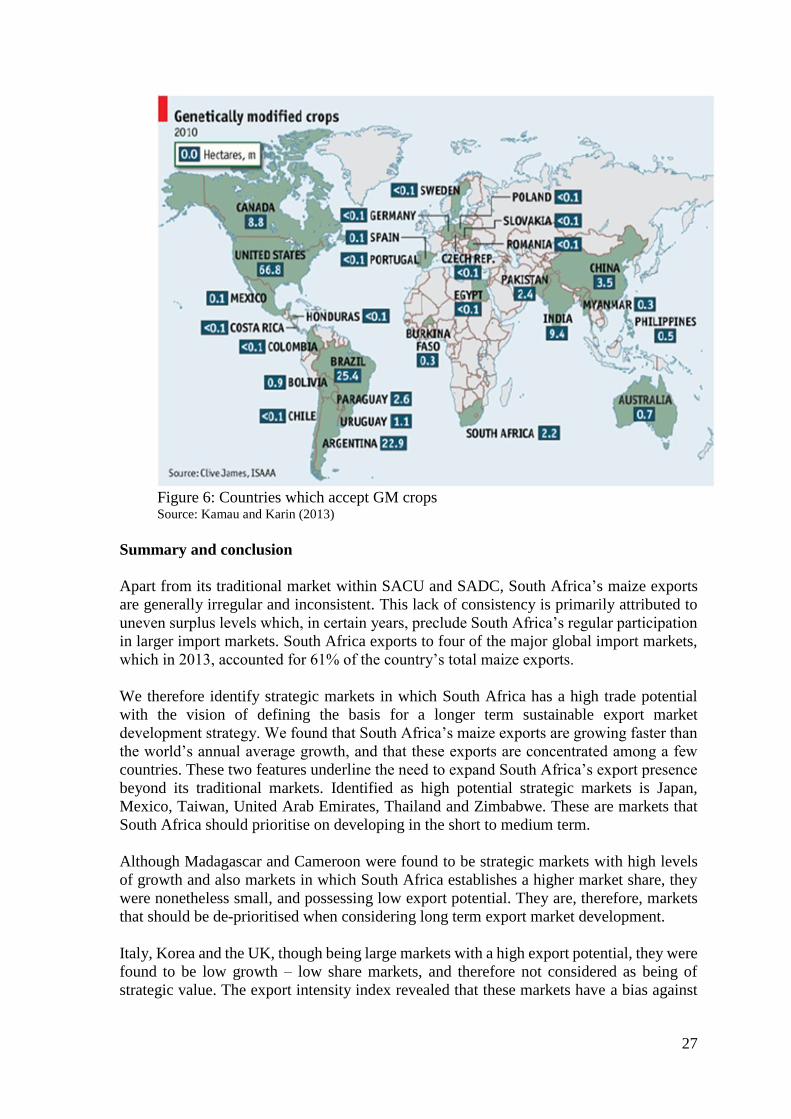
27
Figure 6: Countries which accept GM crops Source: Kamau and Karin (2013)
Summary and conclusion
Apart from its traditional market within SACU and SADC, South Africa’s maize exports
are generally irregular and inconsistent. This lack of consistency is primarily attributed to
uneven surplus levels which, in certain years, preclude South Africa’s regular participation
in larger import markets. South Africa exports to four of the major global import markets,
which in 2013, accounted for 61% of the country’s total maize exports.
We therefore identify strategic markets in which South Africa has a high trade potential
with the vision of defining the basis for a longer term sustainable export market
development strategy. We found that South Africa’s maize exports are growing faster than
the world’s annual average growth, and that these exports are concentrated among a few
countries. These two features underline the need to expand South Africa’s export presence
beyond its traditional markets. Identified as high potential strategic markets is Japan,
Mexico, Taiwan, United Arab Emirates, Thailand and Zimbabwe. These are markets that
South Africa should prioritise on developing in the short to medium term.
Although Madagascar and Cameroon were found to be strategic markets with high levels
of growth and also markets in which South Africa establishes a higher market share, they
were nonetheless small, and possessing low export potential. They are, therefore, markets
that should be de-prioritised when considering long term export market development.
Italy, Korea and the UK, though being large markets with a high export potential, they were
found to be low growth – low share markets, and therefore not considered as being of
strategic value. The export intensity index revealed that these markets have a bias against
28
South African maize exports, with Brazil, Argentina, USA, Romania, and Ukraine being
the main suppliers of maize to these countries.
Among these major global exporters, South Africa was found to be a relatively high cost
producer of maize, with imported fertilisers, pesticides and fuel accounting for a major part
of the costs. This means that South Africa is less competitive, at farm level, when compared
to countries such as Argentina, Ukraine and the USA. Moreover, South African, shipping
costs are fairly expensive, being the third highest after Argentina and Brazil. Nonetheless,
South Africa’s supply chain logistics are among the most efficient compared to its major
competitors.
In terms of market access, South Africa faces relatively similar tariff levels compared to its
global competitors. India enjoys preferential market access in several major markets due to
its FTAs with Mexico, UAE, Thailand, Malaysia and Vietnam. With regards to non-tariff
barriers, South Africa faces restrictions in markets such Thailand, Saudi Arabia and within
the European Union countries (i.e. Italy, UK and Spain).
Given the foregoing, South Africa’s weak presence in major maize importing markets can
be attributed to a general lack of market development initiatives (i.e. export promotion and
bilateral trade agreements), as well as high production and logistical costs. This in essence
means that, for South Africa to establish and/or grow its markets, particularly in large
import markets, the country has to improve its global competitiveness and seek preferential
market access arrangements. We therefore recommend a sectoral maize strategy which
incorporates these elements, with a view of re-positioning South Africa in the global
market.
Acknowledgements
The authors wish to thank Evans Chinembiri, Jannie De Villiers and John Purchase for their
invaluable insights, ideas and comments to the contents of the paper.
29
Bibliography
Agribenchmark, 2014. Cash Crop: Maize, Pretoria: Bureau for Food and Agricultural
Policy.
Bahta, S. T., 2004. The Effect of the South African Trade and Policy Regime on the Beef
and Maize Sub-Sectors, Free State: University of the Free State.
Balassa, B. & Noland, M., 1988. Japan in the World Economy, Washington DC: Institute
for International Economics.
BFAP, 2013. 10th BFAP Baseline Agricultural Outlook, Pretoria: Bureau for Food and
Agricultural Policy.
BFAP, 2014. Agri-Benhmark: Maize, Pretoria: Bureau for Food and Agricultural Policy.
Chizari, A., 2013. Social Welfare Impacts of Imposing an Import Tariff on Maize Market
in Iran Compared to an Export Tax in China and Brazil Using: a Game Theory Approach.
Journal of Agricultural Studies, 1(2), pp. 2166-0379.
Goufo, P., 2008. Rice Production in Cameroon: a Review. Research Journal of
Agriculture and Biological Sciences, 4(6), pp. 745-756.
GSA, 2014. Area Grown, Yeilds and Estimates, Pretoria: Grain South Africa.
GSA, 2014. Fertilizer Report, Pretoria: Grain South Africa.
GSA, 2014. Summergrain Imorts and Export Parity Prices, Pretoria: Grain South Africa.
GSA, 2014. Summergrain Supply and Demand Tables, Pretoria: Grain South Africa.
Helmers, C. and Pasteels, J.M. 2005. Trade Sim (third version), A gravity model for the
calculation of trade potentials for developing and economies in transition. ITC Working
Paper, 1–3. Geneva: International Trade Center.
Henderson, B. D., 1979. Henderson on Corporate Strategy, Boston: ABT Books.
IGC, 2014. Daily Monitor, London: International Grain Council.
ITC, 2014. Trade Map. [Online] Available at:
http://www.trademap.org/SelectionMenu.aspx [Accessed 20 06 2014].
Kamau, M. & Karin, F., 2013. Advances in Kenya's Policy on GMOs and its Effects on
Food Security, Njoro: Egerton University.
Kapuya, T., Chinembiri, E.K. & Kalaba, M.W., 2014. Identifying strategic markets for
South Africa's citrus exports, Agrekon: Agricultural Economics Research, Policy and
Practice in Southern Africa, 53 (1), pp. 124-158.
30
Li, Y., 2010. A New Perspective on China Trade Growth: Application of New Index of
Bilateral Trade Intensity, Honolulu: university of Hawaii.
Maize Trust, 2014. Prospectus on the South African Maize Industry, Pretoria: The Maize
Trust.
Mofokeng, M. J., 2012. Factors Affecting the Hedging Decision of Farmers: The Case of
Maize Farmers in Gauteng Province, Stellenbosch: Faculty of AgriSciences, Stellenbosch
University.
Pioneer, n.d. Africa's Agricultural Opportunities, Greytown: Pioneer and Pannar.
Salvator, 2011. International Economics: Trade and Finance. Tenth Edition ed. Singapore:
John Wiley & Sons.
Trade Research Niche Area. 2013. South Africa’s Agricultural Trade Competitiveness.
Potchefstroom. North West University.
World Bank. 2014. Logistics Performance Index. [Online] Available at:
http://data.worldbank.org/indicator/LP.LPI.OVRL.XQ [Accessed 04 07 2014].
World Freight Rate. 2014. Freight Calculator. [Online]. Available at:
http://worldfreightrate.com/freight [Accessed 04 07 2014].
31
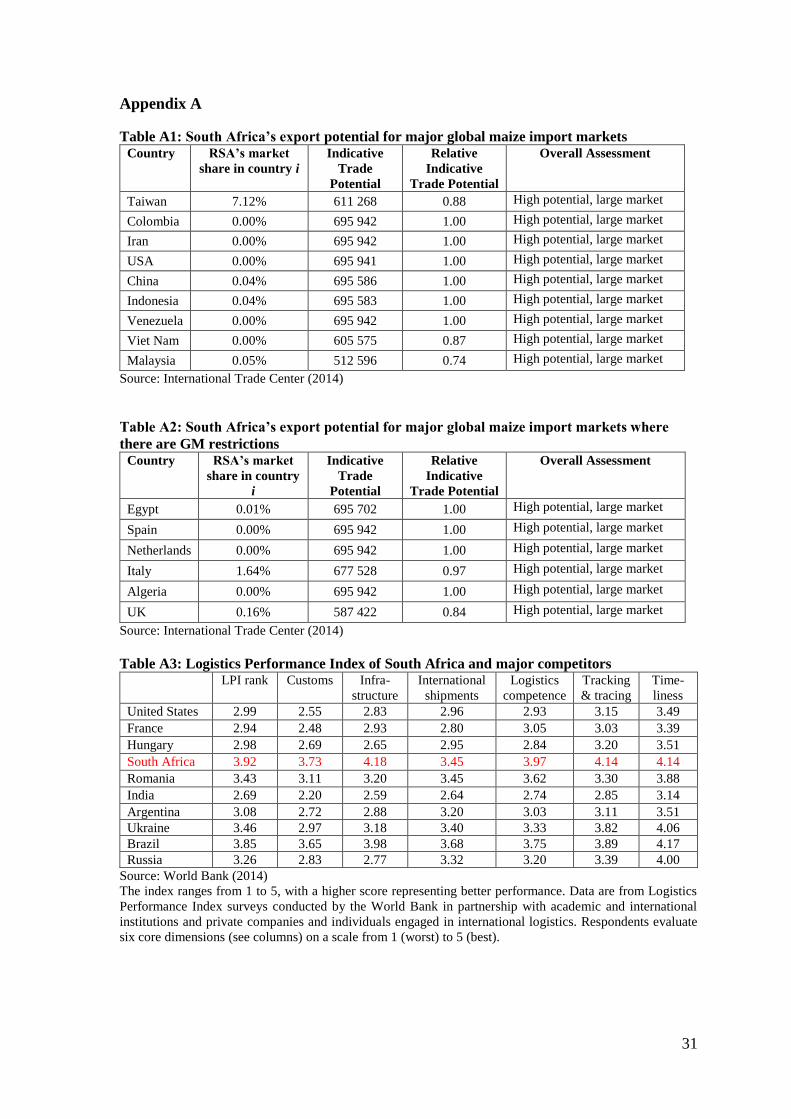
Appendix A
Table A1: South Africa’s export potential for major global maize import markets Country RSA’s market
share in country i
Indicative
Trade
Potential
Relative
Indicative
Trade Potential
Overall Assessment
Taiwan 7.12% 611 268 0.88 High potential, large market
Colombia 0.00% 695 942 1.00 High potential, large market
Iran 0.00% 695 942 1.00 High potential, large market
USA 0.00% 695 941 1.00 High potential, large market
China 0.04% 695 586 1.00 High potential, large market
Indonesia 0.04% 695 583 1.00 High potential, large market
Venezuela 0.00% 695 942 1.00 High potential, large market
Viet Nam 0.00% 605 575 0.87 High potential, large market
Malaysia 0.05% 512 596 0.74 High potential, large market
Source: International Trade Center (2014)
Table A2: South Africa’s export potential for major global maize import markets where
there are GM restrictions Country RSA’s market
share in country
i
Indicative
Trade
Potential
Relative
Indicative
Trade Potential
Overall Assessment
Egypt 0.01% 695 702 1.00 High potential, large market
Spain 0.00% 695 942 1.00 High potential, large market
Netherlands 0.00% 695 942 1.00 High potential, large market
Italy 1.64% 677 528 0.97 High potential, large market
Algeria 0.00% 695 942 1.00 High potential, large market
UK 0.16% 587 422 0.84 High potential, large market
Source: International Trade Center (2014)
Table A3: Logistics Performance Index of South Africa and major competitors LPI rank Customs Infra-
structure
International
shipments
Logistics
competence
Tracking
& tracing
Time-
liness
United States 2.99 2.55 2.83 2.96 2.93 3.15 3.49
France 2.94 2.48 2.93 2.80 3.05 3.03 3.39
Hungary 2.98 2.69 2.65 2.95 2.84 3.20 3.51
South Africa 3.92 3.73 4.18 3.45 3.97 4.14 4.14
Romania 3.43 3.11 3.20 3.45 3.62 3.30 3.88
India 2.69 2.20 2.59 2.64 2.74 2.85 3.14
Argentina 3.08 2.72 2.88 3.20 3.03 3.11 3.51
Ukraine 3.46 2.97 3.18 3.40 3.33 3.82 4.06
Brazil 3.85 3.65 3.98 3.68 3.75 3.89 4.17
Russia 3.26 2.83 2.77 3.32 3.20 3.39 4.00
Source: World Bank (2014)
The index ranges from 1 to 5, with a higher score representing better performance. Data are from Logistics
Performance Index surveys conducted by the World Bank in partnership with academic and international
institutions and private companies and individuals engaged in international logistics. Respondents evaluate
six core dimensions (see columns) on a scale from 1 (worst) to 5 (best).