Embed Size (px)
Citation preview

South Africa’s Intergovernmental Fiscal system
22 June 2007

2
South Africa:Are these really perceptions???
• Federal/Central View: Giving money and power to sub-national governments is like giving whiskey and car keys to teenagers.
• Provincial and Local View: We need more grant monies to demonstrate that “money does not buy anything”.
• Citizens: The magical art of passing money from one government to another and seeing it vanish in thin air.

3
The Legal Framework (1)
• The Constitution, 1996– Establishes three spheres
• National, 9 provinces and 283 municipalities & assigns functions (Schedules 4 &5)
– some functions are concurrent, others are exclusive
– Although spheres are distinctive Constitution prescribes
• cooperative governance S(40 & 41)• sharing of revenue raised nationally
– There is provision for different forms of intervention
• Sections (100 for provinces & 139 for Local Gov)

4
The Legal Framework (2)
• Intergovernmental Fiscal relations Act, 1997– Establishes Budget Council
• Comprising Min of Fin and 9 MECs for Finance
– Also establishes Budget Forum • Which is the BC extended to include organised LG
– The two are used for consultation on • financial & fiscal matters
• legislation &/or policy with financial implications
• matters pertaining to financial mgt & monitoring

5
The Legal Framework (3)• The Financial & Fiscal Commission Act, 1997
– sets out functions of the FFC, which include• acting as a consultative body for, and making recommendations and giving
advice to, organs of state on financial & fiscal matters
• Also assess fiscal impact of changes in powers and functions
• The Public Finance Management Act, 1999– Financial management
– Procedures relating to budgeting, budget formats & financial management & reporting
• The Municipal Finance Management Act, 2003– Sets the legal framework for financial management, budgeting,
expenditure management, procurement, reporting, roles of administrators led by accounting officer vs roles of political office bearers led by mayor

6
The Legal Framework (4)
• The DOR Act– Required by the Constitution– Divides nationally raised revenues
• Municipal Structures Act– Provides for categorisation of municipalities– Broad framework for the assignment of powers and
functions• Municipal Systems Act
– Framework for core processes of planning ….• Intergovernmental Relations Framework Act
– Regulates intergovernmental institutions• Municipal Property Rates Act

7
Key institutions
• Legislatures - national & provincial, Councils
• Cabinet & Excos• Ministers’ Committee on the Budget• Budget Council/Budget Forum• Technical Committees
– national & provincial– intergovernmental

8
Financial & fiscal matters
• Features of SA system– fiscal imbalance & inequity (historical)
• Revenue raising power rest with national gov.• Provinces raise only 4% of total revenue• Local Government about 92%
– bulk of public services delivery by provinces• education, health, welfare & housing
– but there are moves to expand fiscal capacity of provinces
• Provincial Tax Regulations Process Act

9
Division of nationally raised revenueTable E.3 Division of revenue between spheres of government, 2003/04 – 2009/10
2003/04 2004/05 2005/06 2006/07 2007/08 2008/09 2009/10R million Outcome Revised Medium-term estimatesNational departments 148,201 168,046 195,384 213,470 240,881 262,092 286,333 Provinces 122,673 137,836 153,782 177,887 202,765 229,296 254,444
Equitable share 107,538 120,885 135,292 150,753 171,271 193,474 215,784 Conditional grants 15,135 16,951 18,490 27,134 31,494 35,822 38,660
Local government 11,521 13,808 16,682 27,079 34,311 41,843 45,608 Equitable share 6,350 7,678 9,643 18,058 20,676 23,775 29,444 Conditional grants 5,171 6,131 7,038 9,021 13,636 18,069 16,164
Non-interest allocatio 282,396 319,690 365,848 418,436 477,957 533,231 586,386 Percentage increase 13.2% 14.4% 14.4% 14.2% 11.6% 10.0%
State debt cost 46,313 48,851 50,912 52,178 52,916 52,967 50,915 Contingency reserve – – – – 3,000 8,000 13,000 Main budget expendi 328,709 368,541 416,760 470,614 533,873 594,198 650,301
Percentage increase #DIV/0! 12.1% 13.1% 12.9% 13.4% 11.3% 9.4%Percentage shares
National departments 52.5% 52.6% 53.4% 51.0% 50.4% 49.2% 48.8%Provinces 43.4% 43.1% 42.0% 42.5% 42.4% 43.0% 43.4%Local government 4.1% 4.3% 4.6% 6.5% 7.2% 7.8% 7.8%

The Provincial Equitable Share Formula

11
Background
• Joint effort between Treasury & FFC• Has explicit components for social
services which make the bulk of provincial expenditure
• Reviewed annually by Budget Council, and based on FFC’s recommendations
• Formula is redistributive

12
Structure and weights of the provincial formula
Education Health Basic Poverty Economic Activity
Institu-tional
Target shares
Weighting 51.0 26.0 14.0 3.0 1.0 5.0 100.0 Eastern Cape 17.4 15.1 14.2 20.7 8.1 11.1 16.0 Free State 5.8 6.0 6.0 7.1 5.5 11.1 6.2 Gauteng 13.9 17.9 20.0 11.3 33.0 11.1 15.7 Kw aZulu-Natal 22.8 21.8 21.0 23.3 16.5 11.1 21.7 Limpopo 14.9 12.6 11.7 17.0 6.5 11.1 13.7 Mpumalanga 7.6 7.2 7.0 6.7 7.0 11.1 7.5 Northern Cape 1.7 1.8 1.8 2.0 2.4 11.1 2.2 North West 7.7 8.4 8.2 8.0 6.5 11.1 8.1 Western Cape 8.2 9.4 10.2 3.8 14.5 11.1 8.9 Total 100.0 100.0 100.0 100.0 100.0 100.0 100.0

13
Data used in the FormulaEquitable share
component Data used Source Year of data
Total enrolment numbers (1)
National Department of Education: Enrolment figures
2006 enrolment
School-age cohort (6-17 years) (2)
Stats SA 2001 Census
Basic Share (14%) Population per province Stats SAPopulation per province GHS 2005 GHS
Institutional (5%) Independent of dataIncome IES Survey 2000Basic component share Stats SA: 2005 GHS 2005 GHS
Economic activity (1%) Gross geographic product
Stats SA: GGP 2003 GGP
2005 OHS
Poverty (3%)
Education (51%)
Health (26%)
Population with (1)and without medical aid support(4) Stats SA: 2005GHS

14
Conditional grantsTable E.19 Conditional grants to provinces, 2006/07 – 2009/10R million 2006/07 2007/08 2008/09 2009/10Agriculture 401 462 484 530
Agricultural disaster management grant 45 – – – Comprehensive agricultural support programme grant 300 415 435 478 Land care programme grant: poverty relief and infrastructure development
56 47 49 51
Arts and Culture – 180 338 466
Community library services grant – 180 338 466
Education 1,713 1,906 2,201 1,501 Further education and training college sector recapitalisation grant
470 595 795 –
HIV and Aids (life skills education) grant 144 158 168 177 National school nutrition programme grant 1,098 1,153 1,238 1,324

15
Conditional grantsTable E.19 Conditional grants to provinces, 2006/07 – 2009/10R million 2006/07 2007/08 2008/09 2009/10Health 10,207 11,321 12,543 13,726
Comprehensive HIV and Aids grant 1,616 1,946 2,235 2,676 Forensic pathology services grant 562 551 467 422 Health professions training and development grant 1,520 1,596 1,676 1,760 Hospital revitalisation grant 1,527 1,907 2,283 2,582 National tertiary services grant 4,981 5,321 5,882 6,286
Housing 6,404 8,238 9,853 11,531 Integrated housing and human settlement development grant
6,404 8,238 9,853 11,531
National Treasury 4,983 6,164 6,847 7,997 Infrastructure grant to provinces 4,983 6,164 6,847 7,997
Sport and Recreation South Africa 119 194 290 402 Mass sport and recreation participation programme grant
119 194 290 402
Transport 3,241 3,029 3,266 2,507 Gautrain rapid rail link grant 3,241 3,029 3,266 2,507
Total 27,134 31,494 35,822 38,660

16
Provinces and the MTEF• Get baseline allocations
– 3 year allocations• equitable share• conditional grants
• Revisions to baselines made annually– informed by policy changes
• health,education,social development,housing etc– changes in macroeconomic environment – wage agreements/personnel bargaining chamber
• Allocation letters– three years– adjustments to budgets during the year

17
Provinces and the MTEF• Provinces submit their budgets to NT
– credibility checks done– try and influence provinces where there are risks
• Budgets tabled within 2 weeks after tabling of national budget– legislatures– table strategic plans as well
• one year operational plan– hearings which lead to approval of budget
• first year voted for

18
Provinces and the MTEF
• Implementation of budget– budget loaded onto system before expenditure
commences• Reporting
– monitoring during the year• prov. depart. report to provincial treasury monthly• provincial treasuries report to national treasury• State of provincial finances reported on quarterly
– financial statements compiled within 2 months after the end of financial year
– annual reports within 5 months after the end of financial year

19
Overview of LG in SA
• There are 3 categories of municipalities– Category A - Big cities/metropolitan areas– Category B - Local municipalities– Category C – Combinations of Bs
• Powers and functions

20
Service delivery responsibilities of LG“Core/essential” services supporting residents•Water and sanitation•Electricity/Energy•Refuse removal•Firefighting•Stormwater mngt in built-up areas•Cemetries•Cleansing•Local amenities and sport facilities•Municipal parks and recreation•Street lighting•Municipal roads•Traffic and parking
“Developmental” services supporting business•Most of “residential” services •Municipal planning•Building regulations•Trading regulations•Licensing and control of undertakings that sell food and liquor to public•Environmental health•Markets and municipal abattoirs•Local tourism•Municipal public transport•Air pollution•Billboards

21
Categorisation of municipalities• Local Government consist of
– Category A municipality has exclusive municipal executive and legislative authority in its areas (x6)
• densely populated (ave 2.5m people), economic hubs, self reliant, large budgets up to R20b
– Category B municipality shares municipal executive and legislative authority in its area with a category C municipality within whose area it falls (x231)
• Varying population sizes and budgets
– Category C municipality has municipal executive and legislative authority in an area that includes more than one municipality (x46)
• Approx. 5 locals in each district
A
C
B
CBB
BB
BB

22
Division of powers and functions• Allocation of own resources
– Property taxes allocated to categories A and B– User charges i.t.o municipality authorised for
services• Equitable Share and conditional grants (incl
infrastructure)– Aligned to functional division i.r.o water, sanitation,
electricity, refuse removal, municipal roads and environmental health
• Some mismatches remain between services and fiscal division– Category B munies allocated limited functions
receive property rates– Category C munies with substantial functional
responsibilities mainly reliant on grant financing

23
Progress in service delivery• Population of 44,8m (2001 Census)
– Population grew by 10,4% from 1996 to 2001
– Highest population growths in urban areas
– Municipalities responsible to address historical backlogs as well as service delivery needs due to an increasing population
• Access to services– 70% of households had access to electricity in 2001 (58% in ‘96
Census)
– 72% of HHs had access to water in 2001 (70% in ‘96 Census)
– 54% of HHs had access to flush or chemical toilet (50% in ‘96 Census)
– 55% of HHs had access to refuse removal (51% in ‘96 Census)
• Target is to address water backlogs by 2008, electricity by 2010, sanitation by 2013, and remainder by 2013
• Poor households to receive Free Basic Services– Varying progress by municipalities
24
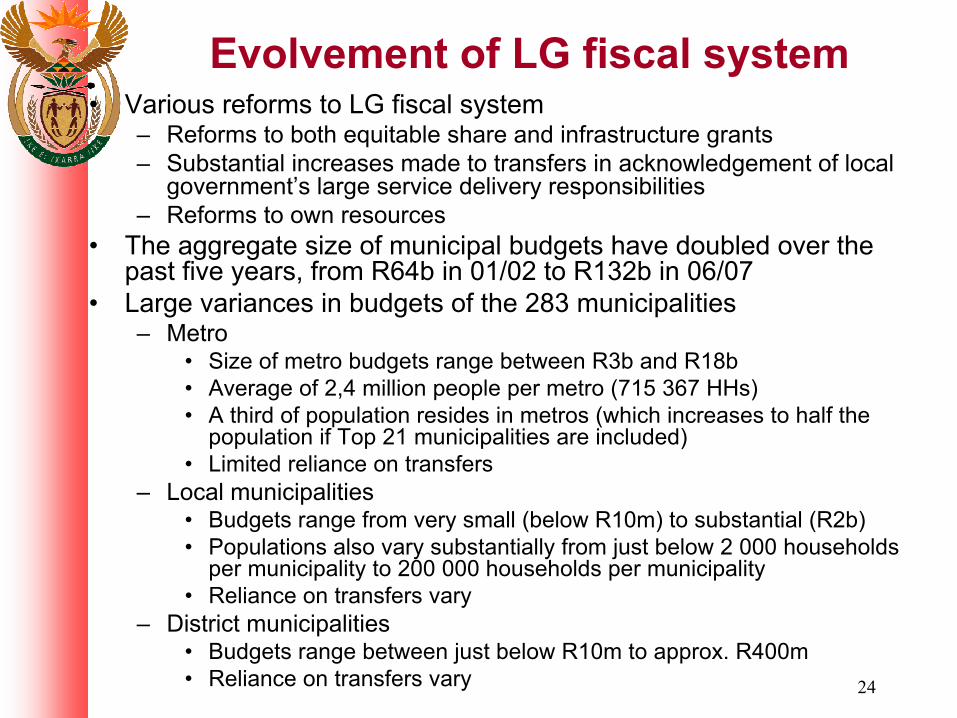
Evolvement of LG fiscal system • Various reforms to LG fiscal system
– Reforms to both equitable share and infrastructure grants– Substantial increases made to transfers in acknowledgement of local
government’s large service delivery responsibilities– Reforms to own resources
• The aggregate size of municipal budgets have doubled over the past five years, from R64b in 01/02 to R132b in 06/07
• Large variances in budgets of the 283 municipalities– Metro
• Size of metro budgets range between R3b and R18b• Average of 2,4 million people per metro (715 367 HHs)• A third of population resides in metros (which increases to half the
population if Top 21 municipalities are included)• Limited reliance on transfers
– Local municipalities• Budgets range from very small (below R10m) to substantial (R2b)• Populations also vary substantially from just below 2 000 households
per municipality to 200 000 households per municipality• Reliance on transfers vary
– District municipalities• Budgets range between just below R10m to approx. R400m• Reliance on transfers vary

25
Trends in transfers to LG
National transfers to local government, 2003/04 – 2009/102003/04 2004/05 2005/06 2006/07 2007/08 2008/09 2009/10
R millionOutcome Revised
estimateMedium-term estimates
Equitable share and related 6,623 7,811 9,808 18,358 21,226 24,375 29,906 Infrastructure 5,715 6,936 8,053 9,265 14,303 19,550 18,266 Capacity building transfers 856 768 654 844 749 400 400 Total 13,194 15,515 18,515 28,466 36,278 44,325 48,572 Growth ratesEquitable share and related 17.9% 25.6% 87.2% 15.6% 14.8% 22.7%Infrastructure 21.4% 16.1% 15.0% 54.4% 36.7% -6.6%Capacity building transfers -10.3% -14.8% 29.1% -11.3% -46.6% 0.0%

26
Transfers vs total mun budgetsTransfers vs total budgets
-
50,000
100,000
150,000
200,000
2002
/03
2003
/04
2004
/05
2005
/06
2006
/07with
out rs
c
Financial year
Rm Total Transfers
Total budget
20%14%18%13%14%% increase in budgets
28%54%37%24%67%% increase transfers
24%30%22%19%18%12%% grants to budget
without RSC2006/072005/062004/052003/042002/03FY
Note: NT LG Budget Database (transfers include rollovers from previous years)

27
Municipal financial mngt and reforms• Municipal budget reforms introduced under the
Municipal Finance Management Act from 1 July 2004, based on following principles– Promoting sound financial governance by clarifying roles and
responsibilities of council and officials– Ensuring a strategic approach to budgeting– Modernisation of financial management– Promoting co-operative and consultative governance– Promoting sustainable local government
• MFMA’s financial and fiscal reforms include– New budget standards and formats (the objective is to achieve
qaulity and credible multi-year budgets)– The establishment of audit committees and internal controls– Improvements to procurement and supply chain management
processes– Performance measurement and reporting– Staff competency levels– Mechanisms to resolve financial problems– Procedures to determine and manage misconduct

28
Future issues / Way forward• LG fiscal framework to be reviewed and updated to account
for– Current financial position and service delivery capabilities of
various categories and types of municipalities– Alignment between functional and fiscal division of powers and
functions between category A and B municipalities– Permanent replacement options for RSC and JSB levies that
were abolished 1 July 2006– Funding of district municipalities– Continued review of the LG equitable share formula– Capital finance and borrowing issues, including role of MIG– Proper alignment between cross-cutting functions required,
including priority setting, resource allocation and implementation of services (housing, public transport, health, libraries, etc)
– Sector reforms impacting on municipal finances (electricity and water)
– When Municipal Fiscal Powers and Functions legislation is enacted
• Setting norms and standards i.r.o. municipal surcharges • Evaluate requests for new municipal taxes
29
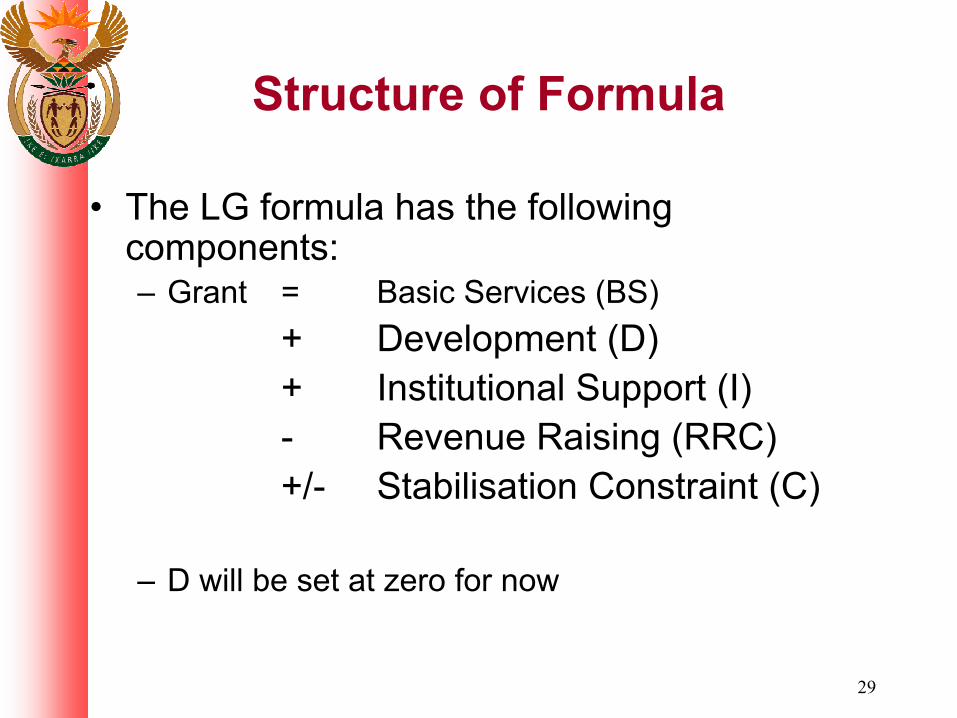
Structure of Formula
• The LG formula has the following components:– Grant = Basic Services (BS)
+ Development (D)+ Institutional Support (I)- Revenue Raising (RRC)+/- Stabilisation Constraint (C)
– D will be set at zero for now

30
Some remaining challenges • IGR system
– Coordination in respect of concurrent functions• Tension between cooperative relations vs legislated
relations – Division of powers and functions may require
minor adjustments – Very wide variations among our municipalities
pose challenges for policy development and resource allocation
– Implementation of certain programmes is slow, often due to inadequate capacity
– Output or performance information is not readily available, thus affecting:
• Policy making, planning and resource allocation• Assessment of progress with policy implementation and
the impact of policies

31
Key priorities under provincial sphere
• Reduce poverty and unemployment
• Skills development• Better national health• Economic priorities:
– Growth– Second economy
• Welfare services +EPWP+ housing
• GET+FET• Strengthening of health
sector• Planning + Public
investment + execution– Roads + other projects– EPWP + BBBEE

32
What is at issue here?• The debate on coordination/cooperative relations is
about:– what the law prescribes and allows
• Legal authority to make decisions• Boundaries and limitations
– what amount of choices are allowed to provinces– what choices do they make– what effect do provincial choices have on attainment of
national objectives/priorities– what tools can national use to influence provincial choices

33
Types of decisions and degree of provincial choice and discretion
• National decides policies and funding mechanism– The nature of decision and funding
mechanism determine degree of provincial choice/discretion
• Statutory expenditure and CG funding leave little choice/discretion for provinces
• ES and non-statutory expenditure leaves lot of room for provincial choices, discretion and risk of deviation from national goals

34
The nature of the problem
• National government makes the ff charges:– Provincial budgets fail to give effect to national
priorities that inform the DOR
– Consequently:• Insistence on CGs
• Calls for broader curtailment of provincial choices and discretion
• Assertions that cooperative governance does not work
• Etc

35
Provincial counterarguments
• National priorities:– Ignore province-specific circumstances– Do not accommodate non-social services
• Policy disagreement– Past funding levels and expenditure trends– Capacity constraints and readiness to
spend– Do not provide for full cost of policies
• Disagreements on appropriate funding level

36
Where can things go wrong?
• Within the sector– Poor policy processes
• Between line departments and treasuries
• Within provincial executives• Between national and provinces
– Vertical division of revenue• Inadequate resources for non-social service• Insufficient funds for a given priority

37
Possible solutions
• Deepening of policy making process– Including coordination between Cabinet and EXCOs
• Protocol for communicating national policies with funding implications for provinces• Formal discussion of policies at PCC and Makgotla preceded by in-depth discussion in
provinces
• Strengthening of budget processes– Costing of policies must be mandatory– Creation of space for bottom up identification of priorities
• Adherence to spirit of cooperative governance • Reviewing the intergovernmental system
– Less provinces– Greater implementation role for national government?– Municipalities


![[Shinobi] Bleach 466](https://img.pdfslide.us/doc/110x75/568c4a721a28ab4916982d2e/shinobi-bleach-466.jpg)