Embed Size (px)
Citation preview
South African telecommunications pricesAn updated international price comparison, with regulatory recommendations
Occasional paper number 3
November 2007

Business Leadership South Africa is an association of South Africa’s
largest corporations and major multinational companies with a
significant presence in South Africa. They are represented on Business
Leadership’s Council and Board at the level of Chief Executive Officer or
Chairman.
It aims to provide catalytic and influencing leadership on economic
and selected broader societal issues of national importance, as well as a
forum for South Africa’s business leaders to exchange ideas on matters
of current interest.
It supports the effective pursuit of key national goals and, specifically,
it endorses the objectives of higher growth, greater employment,
inclusivity, and the reduction of poverty.
It believes these can best be achieved in a democratic society where a
business- and market-friendly environment is nurtured.
A core mission of Business Leadership South Africa is to facilitate an
effective dialogue between the business sector and the government.
St Margaret’s
3 Rockridge Road, Parktown, 2193
P O Box 7006, Johannesburg, 2000
Tel. +27 (11) 356-4650
Fax. +27 (11) 726-4705
e-mail: [email protected]
www.businessleadership.org.za
Genesis Analytics
(James Hodge, Sarah Truen, Brent Cloete, and Gilberto Biacuana)
South African telecommunications pricesAn updated international price comparison, with regulatory recommendations
Occasional paper number 3
November 2007
Published in November 2007 by:
Business Leadership South Africa
St Margaret’s
3 Rockridge Road, Parktown, 2193
P O Box 7006, Johannesburg, 2000
Tel. +27 (11) 356-4650
Fax. +27 (11) 726-4705
e-mail: [email protected]
www.businessleadership.org.za
All rights reserved. The material in this publication may not be copied, stored or
transmitted without the prior permission of the publishers. Short extracts may
be quoted, provided the source is fully acknowledged.
ISBN: 978-0-620-39947-0
Designed and produced by Acumen Publishing Solutions, Johannesburg
Printed by Colorpress, Johannesburg
About Genesis Analytics
Genesis Analytics is a Johannesburg-based economics consulting firm that provides diagnostics,
policy advice, strategic direction, institutional design, regulatory design, and implementation
support to governments, multilateral organisations, business associations and private companies
in South Africa and other developing countries.

Contents
Acronyms and abbreviations 5
Executive summary 7International price comparison 7
Impact of August 2007 tariff change 9
12 steps to lower prices 10
Conclusion 13
Main report 15
Introduction 17
The 2007 price benchmark 19Selecting the comparison group 19
Product group selected 20
Data products 22
Voice products 26
The impact of the August 2007 tariff change 31
12 steps to improve prices 33Policy directives 33
Unbundle Telkom’s local loop 33
Permit VANS operators to self-provide backbone infrastructure 35
Review universal service and access policy 36
Regulatory action 37
Require fair rates structures – no minimum charges, no per minute 37
billing, and a broad range of contract lengths
Interconnection at cost-based prices 38
Facilities leasing at cost-based prices 39
Regulate international bandwidth 40
Regulate mandatory price comparison tools 41
Legislative and other changes 41
Greater independence and accountability 41
Address anti-competitive behaviour 42
Review licence and spectrum fees 43
Increased funding for ICASA 43
Additional Issues 46
Sentech 46
Infraco 46
EASSy 48
Figures
Figure 1: 2mbps international leased line monthly fee 22
Figure 2: Monthly rental on a 2mbps domestic leased line 23
Figure 3: Business ADSL (1mbps) 24
Figure 4: Retail broadband (512kbps) 25
Figure 5: Mobile basket – business (high user) 26
Figure 6: Fixed basket – business user 27
Figure 7: Mobile basket – retail (low user) 28
Figure 8: Fixed basket – residential user 29
Figure 9: Cost of a three-minute international call 30
Figure 10: Historical and projected ICASA funding 44
Figure 11: Telecommunications competitiveness index versus 55
PPP-adjusted GDP per capita – scores above 60
Figure 12: Telecommunications competitiveness index versus 56
PPP-adjusted GDP per capita – scores of 60 and below
Tables
Table 1: International comparison: countries 8
Table 2: Price comparison updated for August 2007 tariff changes 10
Table 3: Summary of progress in respect of the 12 steps 11
Table 4: International comparison: countries 20
Table 5: Summary of price results 31
Table 6: Price comparison updated for August 2007 tariff changes 31
Table 7: Summary of progress in respect of the 12 steps 45
Table 8: 2005 international comparison: countries 52
Table 9: Summary of 2005 benchmark findings 53
Table 10: Exchange rates and PPP adjustment factors 57
Conclusion 51
Appendix 1: The 2005 price benchmarking exercise 52
Appendix 2: Efficiency in state-owned enterprises 54
Appendix 3: 2007 benchmark selection exercise 55
Appendix 4: Exchange rates and PPP factors 57
Endnotes 58
References 60
Acronyms and abbreviations
ADSL Asymmetric digital subscriber line. A technology used to provide broadband
Internet connections over standard phone lines
AsgiSA Accelerated and Shared Growth Initiative for South Africa
COA/CAM Chart of Accounts and Cost Allocation Manual
DOC Department of Communications
EASSy Eastern Africa Submarine Cable System
ECA Electronic Communications Act (2006)
ECNS Electronic communications network service
ECS Electronic communications service
Gbps Gigabytes per second. A gigabyte is one billion bytes
ICASA Independent Communications Authority of South Africa. The South African
telecommunications and broadcasting regulator
IGA Inter-governmental assembly
IRU Indefeasible right of use
ISP Internet service provider
ISPA Internet Service Providers’ Association
Kbps Kilobytes per second. A kilobyte is a thousand bytes of data
Leased lines A private telephone circuit permanently connecting two points, normally provided
on a lease by a local posts, telephone and telegraph provider
LLU Local-loop unbundling
LLUC Local-loop unbundling committee
LRIC Long-run incremental cost
Mbps Megabytes per second. A megabyte is one million bytes
NEPAD New Partnership for Africa’s Development
OECD Organisation for Economic Co-operation and Development
PPP Purchasing power parity. A PPP exchange rate reflects the actual cost of buying a
basket of goods in the country concerned. It is thus a better reflection of domestic
purchasing power than market-determined exchange rates
SAFE South Africa Far East cable. Runs up the east coast of Africa and provides the
principal telecommunications connection between South Africa and Asia
SAT-3 South African Telecommunications Cable No 3. Runs up the west coast of Africa and
provides the principal telecommunications connection between South Africa and
Europe
SBO Symmetric broadband origination
SMS Short message service
SNO Second national operator
SOE State-owned enterprise
SPV Special purpose vehicle
USAASA Universal Services and Access Agency of South Africa, previously known as the
Universal Services Agency
USAF Universal Service and Access Fund

USAL Under-serviced area licence
VANS Value-added network services
WASC West Africa Submarine Cable

South African telecommunications prices
S ERVICE INDUSTRIES PLAy a crucial role in national economic development.
Telecommunications, transportation, financial services, and so forth are not only important in
their own right, but are also important inputs into other industries. Because service outputs feed
into other industries, economies with highly priced and inefficient service sectors will find their
competitiveness in extractive and manufacturing industries affected as well.
In 2005, Business Leadership South Africa commissioned two research reports on the South
African telecommunications market. The first report, entitled Telecommunications prices in South
Africa: an international peer group comparison (Genesis Analytics 2005a), found overwhelming
evidence that South African telecoms prices were well above the level in the country’s international
peer group. The second, Reforming telecommunications in South Africa: twelve proposals for
lowering costs and improving access (Genesis Analytics 2005b), identified 12 key steps that
should be taken to reform the market and improve price outcomes.
Two years have passed since the initial research was undertaken. In that time, the sector has
seen a number of developments – the Department of Telecommunications has held two
price colloquia, the Neotel licence has been issued, and the Independent Communications
Authority of South Africa (ICASA) has issued several discussion documents. However, it is not
clear that these developments have resulted in a substantially more competitive South African
telecommunications market. This report evaluates progress made in terms of lowering the costs of
telecommunications and improving the regulatory environment over the past two years.
International price comparison
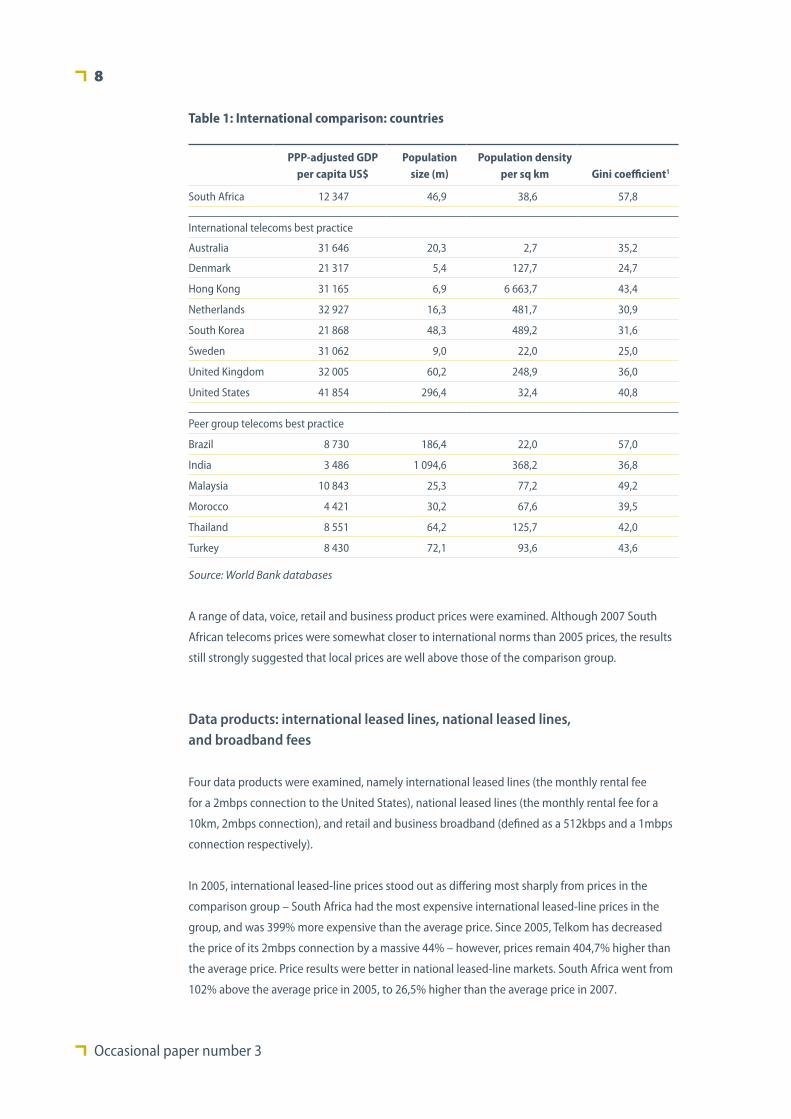
As in 2005, the choice of the international comparison group was undertaken carefully, in order to
select only high-performing telecoms countries and avoid sample bias. South African prices were
compared to prices in 14 countries, six of which can be regarded as a ‘peer group’ of countries at a
similar level of economic development, and eight of which are global high performers in telecoms.
The countries selected are shown in Table 1 on page 8.
Executive summary
Occasional paper number 3
8
PPP-adjusted GDP per capita US$
Population size (m)
Population density per sq km
Gini coefficient1
South Africa 12 347 46,9 38,6 57,8
International telecoms best practice
Australia 31 646 20,3 2,7 35,2
Denmark 21 317 5,4 127,7 24,7
Hong Kong 31 165 6,9 6 663,7 43,4
Netherlands 32 927 16,3 481,7 30,9
South Korea 21 868 48,3 489,2 31,6
Sweden 31 062 9,0 22,0 25,0
United Kingdom 32 005 60,2 248,9 36,0
United States 41 854 296,4 32,4 40,8
Peer group telecoms best practice
Brazil 8 730 186,4 22,0 57,0
India 3 486 1 094,6 368,2 36,8
Malaysia 10 843 25,3 77,2 49,2
Morocco 4 421 30,2 67,6 39,5
Thailand 8 551 64,2 125,7 42,0
Turkey 8 430 72,1 93,6 43,6
Source: World Bank databases
A range of data, voice, retail and business product prices were examined. Although 2007 South
African telecoms prices were somewhat closer to international norms than 2005 prices, the results
still strongly suggested that local prices are well above those of the comparison group.
Data products: international leased lines, national leased lines, and broadband fees
Four data products were examined, namely international leased lines (the monthly rental fee
for a 2mbps connection to the United States), national leased lines (the monthly rental fee for a
10km, 2mbps connection), and retail and business broadband (defined as a 512kbps and a 1mbps
connection respectively).
In 2005, international leased-line prices stood out as differing most sharply from prices in the
comparison group – South Africa had the most expensive international leased-line prices in the
group, and was 399% more expensive than the average price. Since 2005, Telkom has decreased
the price of its 2mbps connection by a massive 44% – however, prices remain 404,7% higher than
the average price. Price results were better in national leased-line markets. South Africa went from
102% above the average price in 2005, to 26,5% higher than the average price in 2007.
Table 1: International comparison: countries
South African telecommunications prices
9
One of the most important inputs into broadband prices is international and local bandwidth.
Given the very high cost of South African international bandwidth, and the fairly high cost of local
bandwidth, it is not surprising that our business broadband is the third-most expensive among
the 15 countries surveyed; and is 127,2% higher than the average price. Likewise, retail broadband
is the most expensive in the 15 countries surveyed; and is 130,5% higher than the average price.
These results are a slight improvement from those in 2005, when the South African prices were
148% and 139% higher respectively than those in the comparison group.
Voice products: mobile and fixed voice bundles, and international voice charges
Four bundles of services were examined, namely, retail mobile customer, business mobile
customer, retail fixed-line customer and business fixed-line customer. The basket methodology
of the Organisation for Economic Co-operation and Development (OECD) was used. International
voice costs were evaluated on the basis of the cost of a three-minute call to the United States
during peak hours.
For the business mobile telephony basket, South Africa is the most expensive of the 15 countries
surveyed, and is 106,9% higher than the average price. For business users in fixed-line telephony,
South Africa is the third-most expensive of the 15 countries surveyed, and is 47,4% higher than the
average price.
Retail telephone costs were much lower – on the retail mobile basket, South Africa is only the
eighth most expensive of the 15 countries surveyed, and is 6,1% lower than the average price. On
the fixed basket for residential users, South Africa is the 6th most expensive of the 15 countries
surveyed, and is 8,0% lower than the average price. On international voice, South Africa is a
substantial 33,5% cheaper than the average price.
In 2005, prices were highest in South Africa for five out of the (then) ten products examined. In
2007, South Africa is the most expensive on only two out of nine products, which represents some
improvement in performance. However, prices remain more expensive than the average on all but
three products, namely retail mobile and fixed baskets, and international voice, and the large price
differential in international leased lines and broadband has not yet been addressed.
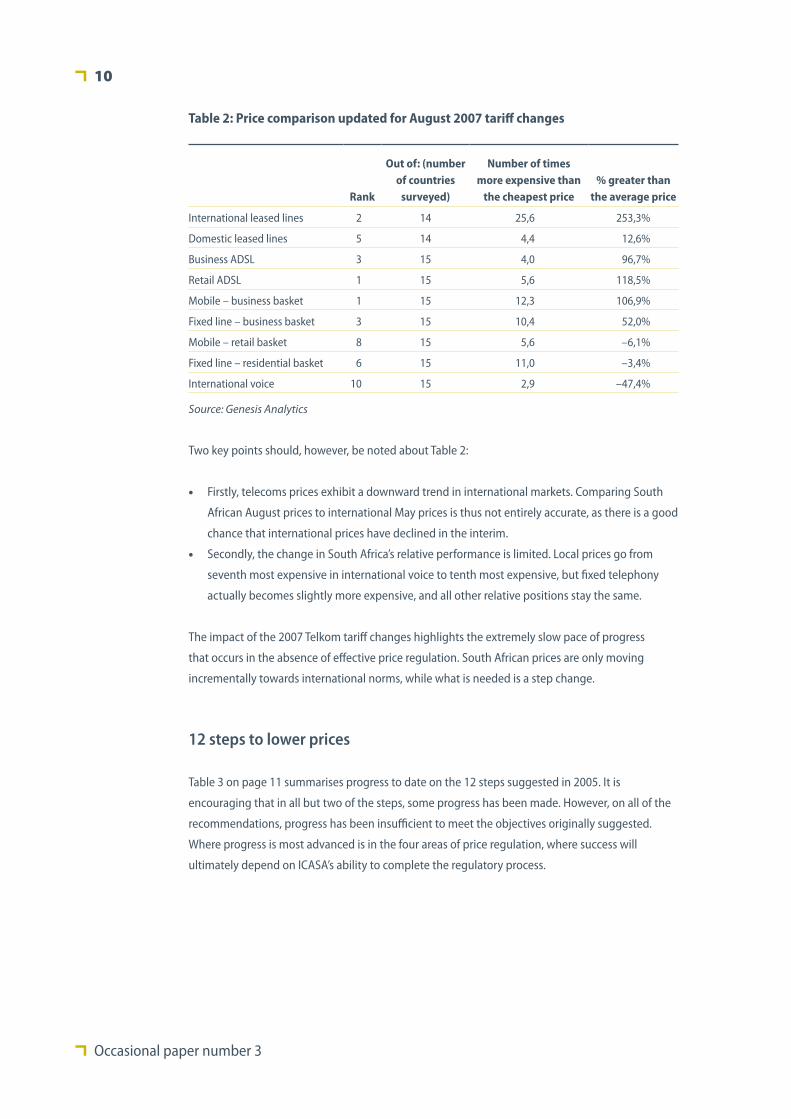
Impact of August 2007 tariff change
The main price comparison conducted in this report was based on data collected in May 2007,
prior to the August 2007 Telkom tariff revision. For completeness, we thus also include Table 2
below, which reflects the Telkom tariff changes.
Occasional paper number 3
10
Table 2: Price comparison updated for August 2007 tariff changes
Rank
Out of: (number of countries
surveyed)
Number of times more expensive than
the cheapest price% greater than
the average price
International leased lines 2 14 25,6 253,3%
Domestic leased lines 5 14 4,4 12,6%
Business ADSL 3 15 4,0 96,7%
Retail ADSL 1 15 5,6 118,5%
Mobile – business basket 1 15 12,3 106,9%
Fixed line – business basket 3 15 10,4 52,0%
Mobile – retail basket 8 15 5,6 –6,1%
Fixed line – residential basket 6 15 11,0 –3,4%
International voice 10 15 2,9 –47,4%
Source: Genesis Analytics
Two key points should, however, be noted about Table 2:
Firstly, telecoms prices exhibit a downward trend in international markets. Comparing South •
African August prices to international May prices is thus not entirely accurate, as there is a good
chance that international prices have declined in the interim.
Secondly, the change in South Africa’s relative performance is limited. Local prices go from •
seventh most expensive in international voice to tenth most expensive, but fixed telephony
actually becomes slightly more expensive, and all other relative positions stay the same.
The impact of the 2007 Telkom tariff changes highlights the extremely slow pace of progress
that occurs in the absence of effective price regulation. South African prices are only moving
incrementally towards international norms, while what is needed is a step change.
12 steps to lower prices
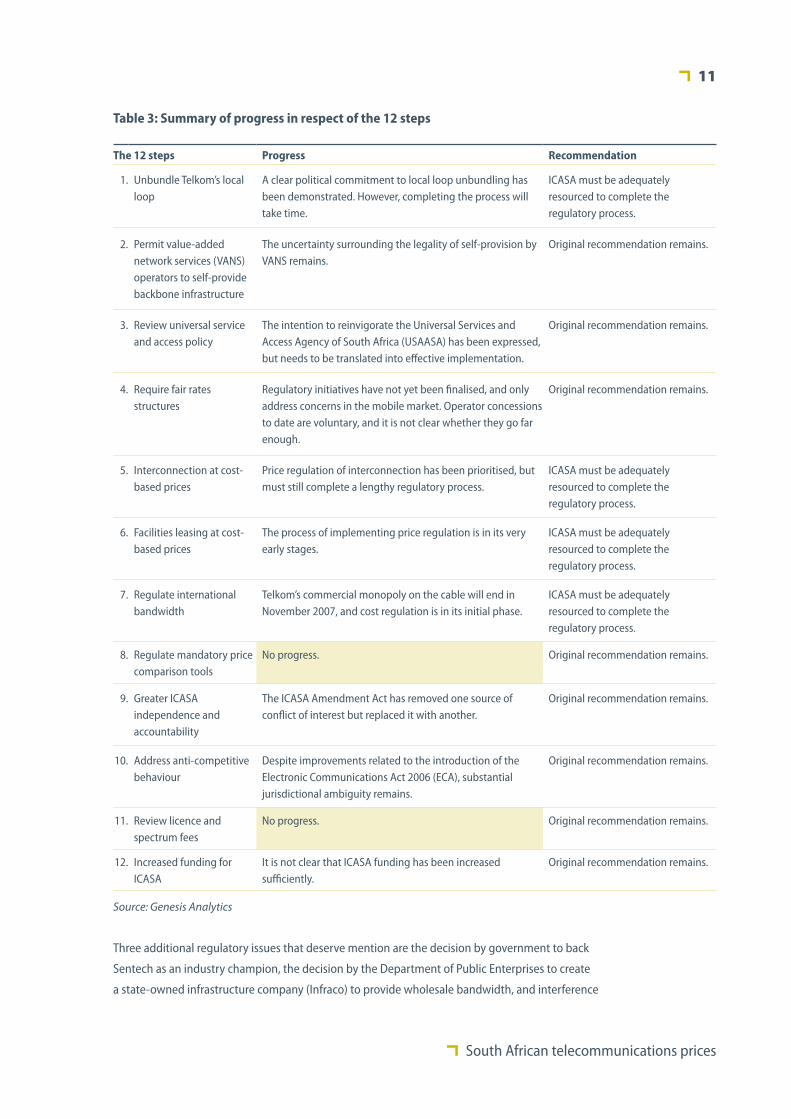
Table 3 on page 11 summarises progress to date on the 12 steps suggested in 2005. It is
encouraging that in all but two of the steps, some progress has been made. However, on all of the
recommendations, progress has been insufficient to meet the objectives originally suggested.
Where progress is most advanced is in the four areas of price regulation, where success will
ultimately depend on ICASA’s ability to complete the regulatory process.
South African telecommunications prices
11
Table 3: Summary of progress in respect of the 12 steps
The 12 steps Progress Recommendation
1.
Unbundle Telkom’s local loop
A clear political commitment to local loop unbundling has been demonstrated. However, completing the process will take time.
ICASA must be adequately resourced to complete the regulatory process.
2.
Permit value-added network services (VANS) operators to self-provide backbone infrastructure
The uncertainty surrounding the legality of self-provision by VANS remains.
Original recommendation remains.
3.
Review universal service and access policy
The intention to reinvigorate the Universal Services and Access Agency of South Africa (USAASA) has been expressed, but needs to be translated into effective implementation.
Original recommendation remains.
4.
Require fair rates structures
Regulatory initiatives have not yet been finalised, and only address concerns in the mobile market. Operator concessions to date are voluntary, and it is not clear whether they go far enough.
Original recommendation remains.
5.
Interconnection at cost-based prices
Price regulation of interconnection has been prioritised, but must still complete a lengthy regulatory process.
ICASA must be adequately resourced to complete the regulatory process.
6.
Facilities leasing at cost-based prices
The process of implementing price regulation is in its very early stages.
ICASA must be adequately resourced to complete the regulatory process.
7.
Regulate international bandwidth
Telkom’s commercial monopoly on the cable will end in November 2007, and cost regulation is in its initial phase.
ICASA must be adequately resourced to complete the regulatory process.
8. Regulate mandatory price comparison tools
No progress. Original recommendation remains.
9.
Greater ICASA independence and accountability
The ICASA Amendment Act has removed one source of conflict of interest but replaced it with another.
Original recommendation remains.
10.
Address anti-competitive behaviour
Despite improvements related to the introduction of the Electronic Communications Act 2006 (ECA), substantial jurisdictional ambiguity remains.
Original recommendation remains.
11. Review licence and spectrum fees
No progress. Original recommendation remains.
12. Increased funding for ICASA
It is not clear that ICASA funding has been increased sufficiently.
Original recommendation remains.
Source: Genesis Analytics
Three additional regulatory issues that deserve mention are the decision by government to back
Sentech as an industry champion, the decision by the Department of Public Enterprises to create
a state-owned infrastructure company (Infraco) to provide wholesale bandwidth, and interference
Occasional paper number 3
12
by the New Partnership for Africa’s Development (NEPAD) in the East Africa Submarine Cable
System (EASSy) programme.
Sentech
Sentech has been identified as a sector champion by government, and it is planned that it should
serve as the ‘core wireless broadband provider’ (Matsepe-Casaburri 2007). However, Sentech is
essentially a wholesale broadcast infrastructure provider: it is thus not apparent why it would
be suited to serve as a champion in the market for providing retail voice and data products. The
company is unfamiliar with both the product and the market involved. Attempts to boost the
provision of wireless broadband would be better served by awarding licences to private operators
and implementing a universal service subsidy.
Infraco
In terms of the Broadband Infraco bill, the fibre-optic networks of Transnet and Eskom will be
transferred into a new company, Infraco Broadband Limited, which will remain wholly owned
by the state. Infraco will, for the first four years of its existence, provide wholesale bandwidth
exclusively to Neotel, selling it on a cost-plus basis.
In the short term, Infraco may provide some price relief, but in the long term, its net effect is much
more uncertain. The extent to which it may result in restrictions on private-sector investments in
undersea cables in order to protect government investment is a serious concern.
EASSy
International bandwidth is critical for the provision of international data and voice connectivity,
and for many applications is best provided via submarine cable networks. Only the west coast of
Africa currently has cable connectivity. Along the east coast of Africa, the process of co-ordinating
such a cable investment has been under way since late 2002,2 in the form of the Eastern Africa
Submarine Cable System project. The cable is a project originated and driven by regional telecoms
operators and the East African business community.
Price competition in international cable bandwidth often depends on the structure of the contract
used by the cable consortium. If only one operator in each country has landing rights (as is the
case with SAT-3, the west coast cable), it will be possible to create many regional monopolies,
associated with very high prices. Concern that this will characterise the EASSy cable structure as
well has prompted NEPAD intervention in the project (with NEPAD initiatives in this field widely
viewed as driven by South African policy-makers).3

South African telecommunications prices
13
In 2006, NEPAD produced a broadband infrastructure protocol which has since been ratified by
12 member states, including South Africa. The protocol introduces substantial changes to the
initial structure of the project, including equal state shareholding via special purpose vehicles, an
intergovernmental regulator controlled by member states, and a uniform tariff to be charged by
all operators. To implement the protocol, signatories will have to harmonise domestic policy and
regulation with the protocol – this will result in a delay in implementing the project.
The way in which the protocol introduces state ownership is also cause for concern. The EASSy
project was initiated by regional telecoms operators, a number of whom are privately owned. To
the extent that the project infringes on the pre-existing commercial interests of the initiating firms,
it can be regarded as a form of expropriation. Such interference with the activities of the private
sector increases the uncertainty of any investment, and decreases the incentive to invest.
An inter-governmental assembly (IGA) will hold a golden share in the cable’s special purpose
vehicle (SPV) structure, and will have authority to, among other things, regulate the rate of return
of operators. In South Africa, the jurisdiction of the IGA and ICASA will overlap as regards price
regulation of international bandwidth.
The NEPAD protocol has drawn criticism from a number of operators involved in the EASSy
project.4 A number of parties have indicated that they are in the process of pursuing alternative
cable investments – as many as four additional east coast projects are currently rumoured to be in
discussion (Southwood 2007). It seems likely that the ultimate outcome of the NEPAD intervention
will simply have been to delay the implementation of the original project, and increase the
perceived regulatory risk faced by investors in such infrastructure.
The NEPAD protocol is a potentially damaging addition to the existing price-regulation process
in international bandwidth. The protocol should be adapted to provide greater discretion to
regional operators and regulators. The principle of compulsory equal equity shares for signatory
states should be abandoned, and ownership of the cable should revert to the originally proposed
voluntary private participation model.
Conclusion
Despite a great deal of activity in the telecommunications market over the past two years, we find
little evidence that the pricing problem has been solved. The pricing results clearly illustrate that:
business use of telephony is far too expensive;•
we continue to have some of the most expensive broadband in the world; and•
Telkom’s ability to charge unjustifiably high prices in international bandwidth markets remains •
unchanged.
The first-best solution to these problems in the medium to long term is the rapid introduction of
competition on infrastructure. The licensing process currently under way is crucial in expanding

Occasional paper number 3
14
the number of operators that may provide infrastructure. However, parallel initiatives in targeting
infrastructure development through state-owned enterprises (SOEs) may undermine the process
of competition and lower prices in the long term. This is especially the case if such initiatives result
in constraints to the licensing of private operators that have demonstrated a willingness to invest
in infrastructure.
In addition, while pockets of dominance remain, prices will not be constrained. Price regulation
becomes an important short-term tool to bring about lower prices. In this regard, small
incremental changes to prices (such as practised through price cap regulation) are not sufficient.
Rather, a step-wise change in prices is required through cost-based price regulation. ICASA faces a
major task in implementing such cost-based pricing, but has been making encouraging progress
towards this end.

Main report


South African telecommunications prices
S ERVICE INDUSTRIES PLAy a crucial role in national economic development.
Telecommunications, transportation, financial services and so forth are not only important
in their own right, but are also important inputs into other industries. Because service outputs
feed into other industries, economies with high-priced and inefficient service sectors will find their
competitiveness in extractive and manufacturing industries affected as well.
Government’s current thinking on growth is encapsulated in the Accelerated and Shared Growth
Initiative for South Africa (ASGISA), which identifies six binding constraints on growth, as follows:
the volatility and current valuation of the rand;•
the high cost, low efficiency, and poor capacity of the national logistics system;•
the shortage of suitably skilled labour;•
barriers to entry, limits to competition and limited new investment opportunities;•
the regulatory environment and the burden on small and medium businesses; and•
deficiencies in state organisation, capacity, and leadership.• 5
The telecoms market displays a number of these binding constraints. Many telecoms sub-markets
are dominated by a very small group of operators, with market entry constrained by the licensing
requirements of a not-untroubled regulator. It is in this context that Business Leadership South
Africa has commissioned this second review of telecommunications prices and regulation in South
Africa.
The current report revisits two research reports commissioned by Business Leadership in
2005, on the South African telecommunications market. The first report, Telecommunications
Prices in South Africa: An International Peer Group Comparison (Genesis Analytics 2005a),
found overwhelming evidence that South African telecoms prices were well above the level
expected in the country’s international peer group. The second piece of research, Reforming
Telecommunications in South Africa: Twelve Proposals for Lowering Costs and Improving Access
(Genesis Analytics 2005b), identified 12 key steps that should be taken to reform the market, and
to improve price outcomes.
Two years have passed since the initial research was undertaken. In that time, the sector has seen a
number of developments – the Department of Telecommunications has held two price colloquia,
Introduction

Occasional paper number 3
18
the Neotel licence has been issued, and ICASA has issued a number of discussion documents.
However, it is not clear that these developments have resulted in a substantially more competitive
South African telecommunications market.
The report proceeds as follows:
Section 2 of the report examines whether South African telecoms prices have become more
competitive, as compared with those of an international peer group. The results are comparable
to the ones in the 2005 research – meaning that we can assess whether or not South Africa’s
international price competitiveness has improved.
Section 3 briefly examines what progress has been made in the market structure and regulation
of telecommunications. The 12 steps identified and recommended in 2005 have not all been
taken. We address which key inhibitors still remain in place in the market, and whether or not the
initiatives currently being undertaken are likely to be helpful or harmful to telecoms development.
South African telecommunications prices
The 2007 price benchmark
A LTHOUGH THE 2007 price comparison is not on exactly the same terms as the 2005
comparison – both the products examined and the group of countries have changed
somewhat – it represents, by and large, an update of the 2005 study. As such, it allows us to
develop an understanding of whether South African telecoms prices have depreciated sufficiently
to ‘catch up’ with international best practice over the period. For reference purposes, the results of
the 2005 price comparison exercise are summarised in Appendix 1.
Selecting the comparison group
One of the most important steps of any international comparison is the process of selecting the
comparison group. If the comparison group contains inefficient telecoms markets, the comparison
will be biased, and South African price performance will look better than it is. Alternatively, if
the comparison countries have functional characteristics which make telecoms operating costs
unusually low, South African price performance will look worse than it is. As in the 2005 exercise,
therefore, a great deal of attention was paid to ensuring that the comparison group was stocked
with high-performing telecoms markets, and that a substantial proportion of the countries
selected had similar functional characteristics to South Africa’s. The methodology involved is
detailed in Appendix 3.
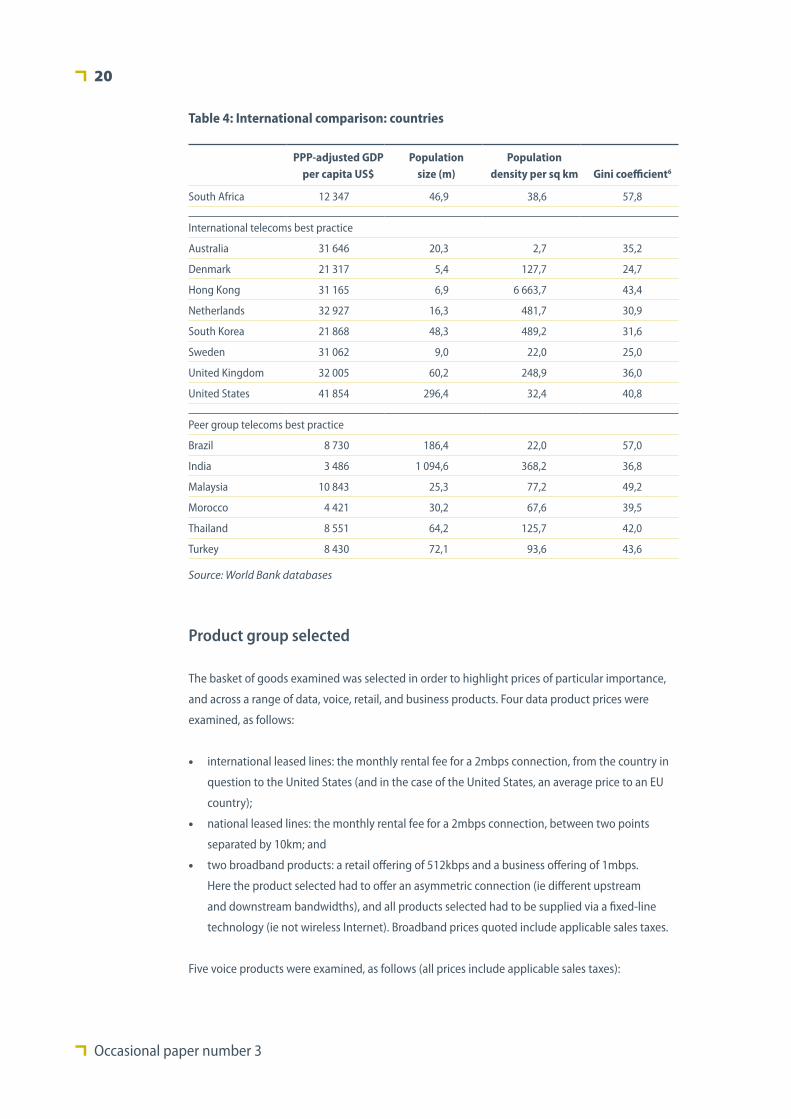
The characteristics of the high-performing telecoms countries selected are shown in Table 4 below.
As can be seen, 14 comparator countries were selected, of which eight are high-income developed
countries, and six are developing countries. Of the comparison group, Brazil and Malaysia have
the greatest similarity to South Africa, in terms of GDP per capita, population density, and income
distribution.
Occasional paper number 3
20
Table 4: International comparison: countries
PPP-adjusted GDP per capita US$
Population size (m)
Population density per sq km
Gini coefficient6
South Africa 12 347 46,9 38,6 57,8
International telecoms best practice
Australia 31 646 20,3 2,7 35,2
Denmark 21 317 5,4 127,7 24,7
Hong Kong 31 165 6,9 6 663,7 43,4
Netherlands 32 927 16,3 481,7 30,9
South Korea 21 868 48,3 489,2 31,6
Sweden 31 062 9,0 22,0 25,0
United Kingdom 32 005 60,2 248,9 36,0
United States 41 854 296,4 32,4 40,8
Peer group telecoms best practice
Brazil 8 730 186,4 22,0 57,0
India 3 486 1 094,6 368,2 36,8
Malaysia 10 843 25,3 77,2 49,2
Morocco 4 421 30,2 67,6 39,5
Thailand 8 551 64,2 125,7 42,0
Turkey 8 430 72,1 93,6 43,6
Source: World Bank databases
Product group selected
The basket of goods examined was selected in order to highlight prices of particular importance,
and across a range of data, voice, retail, and business products. Four data product prices were
examined, as follows:
international leased lines: the monthly rental fee for a 2mbps connection, from the country in •
question to the United States (and in the case of the United States, an average price to an EU
country);
national leased lines: the monthly rental fee for a 2mbps connection, between two points •
separated by 10km; and
two broadband products: a retail offering of 512kbps and a business offering of 1mbps. •
Here the product selected had to offer an asymmetric connection (ie different upstream
and downstream bandwidths), and all products selected had to be supplied via a fixed-line
technology (ie not wireless Internet). Broadband prices quoted include applicable sales taxes.
Five voice products were examined, as follows (all prices include applicable sales taxes):

South African telecommunications prices
21
mobile voice: the total cost of a typical bundle of mobile services, for either a retail or a •
business customer;
fixed voice: the total cost of a typical bundle of fixed telephony services, for either a retail or a •
business customer; and
international voice charges: the cost of a three-minute call to the United States during peak •
hours (and in the case of the United States, an average price to a EU country).
For mobile and fixed-voice charges, 2006 OECD basket methodology was used. These baskets are
designed to mirror usage patterns by a typical business or retail user, and allow the overall cost
of a package, including connection charges, short message service (SMS) fees, and so forth, to be
evaluated. All products were converted into US dollars using the average exchange rate for the
year ended 31 March 2007, as shown in Appendix 4. For interest’s sake, the cost of retail products
adjusted for purchasing power parity (PPP) is also shown. PPP adjustments allow an evaluation of
the relative affordability of the products shown. PPP factors are from the World Bank, and are also
shown in Appendix 4.
Occasional paper number 3
22
Data products
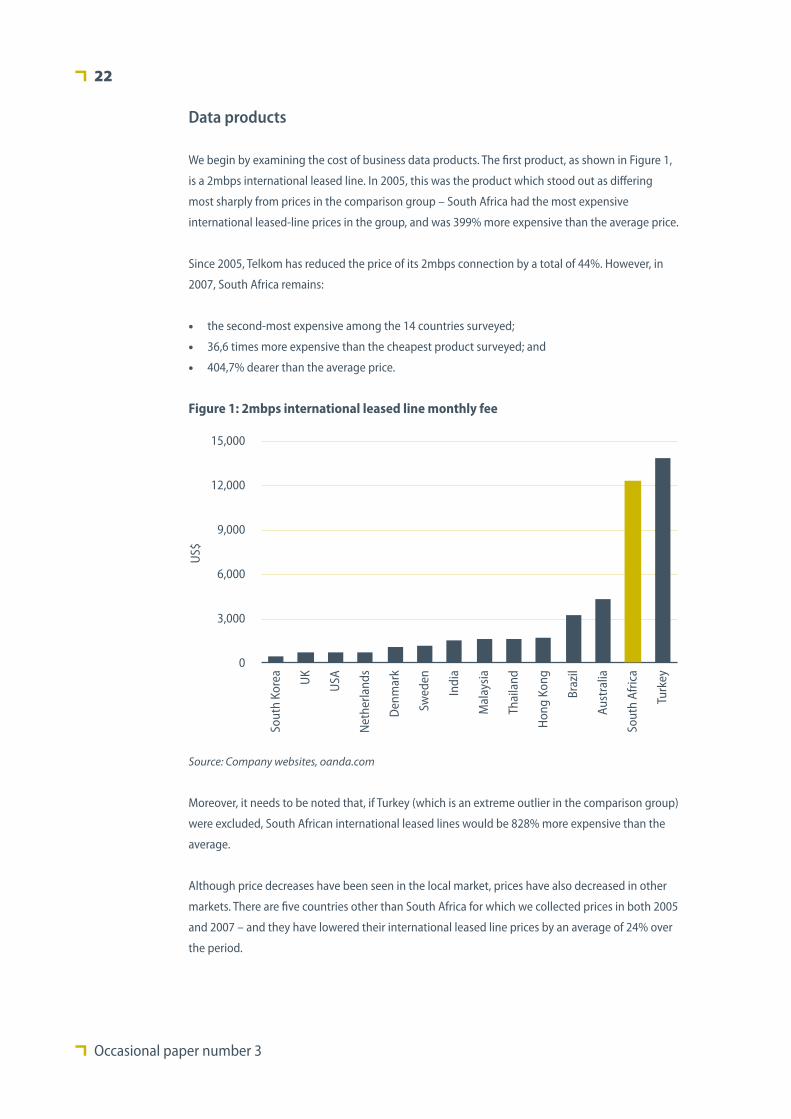
We begin by examining the cost of business data products. The first product, as shown in Figure 1,
is a 2mbps international leased line. In 2005, this was the product which stood out as differing
most sharply from prices in the comparison group – South Africa had the most expensive
international leased-line prices in the group, and was 399% more expensive than the average price.
Since 2005, Telkom has reduced the price of its 2mbps connection by a total of 44%. However, in
2007, South Africa remains:
the second-most expensive among the 14 countries surveyed;•
36,6 times more expensive than the cheapest product surveyed; and•
404,7% dearer than the average price.•
0
3,000
6,000
9,000
12,000
15,000
Sout
h Ko
rea
UK
USA
Net
herla
nds
Den
mar
k
Swed
en
Indi
a
Mal
aysi
a
Thai
land
Hon
g Ko
ng
Braz
il
Aust
ralia
Sout
h Af
rica
Turk
ey
US$
Figure 1: 2mbps international leased line monthly fee
Source: Company websites, oanda.com
Moreover, it needs to be noted that, if Turkey (which is an extreme outlier in the comparison group)
were excluded, South African international leased lines would be 828% more expensive than the
average.
Although price decreases have been seen in the local market, prices have also decreased in other
markets. There are five countries other than South Africa for which we collected prices in both 2005
and 2007 – and they have lowered their international leased line prices by an average of 24% over
the period.
South African telecommunications prices
23
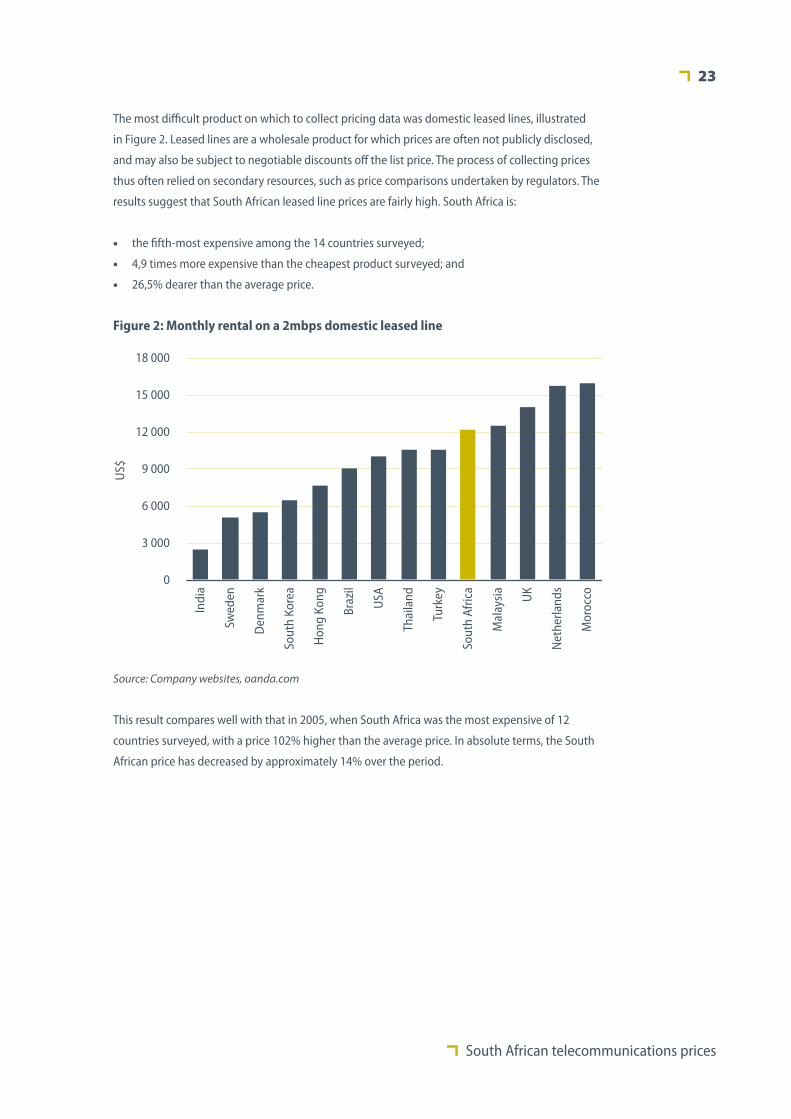
The most difficult product on which to collect pricing data was domestic leased lines, illustrated
in Figure 2. Leased lines are a wholesale product for which prices are often not publicly disclosed,
and may also be subject to negotiable discounts off the list price. The process of collecting prices
thus often relied on secondary resources, such as price comparisons undertaken by regulators. The
results suggest that South African leased line prices are fairly high. South Africa is:
the fifth-most expensive among the 14 countries surveyed;•
4,9 times more expensive than the cheapest product surveyed; and•
26,5% dearer than the average price.•
0
3 000
6 000
9 000
12 000
15 000
18 000
Indi
a
Swed
en
Den
mar
k
Sout
h Ko
rea
Hon
g Ko
ng
Braz
il
USA
Thai
land
Turk
ey
Sout
h Af
rica
Mal
aysi
a
UK
Net
herla
nds
Mor
occo
US$
Figure 2: Monthly rental on a 2mbps domestic leased line
Source: Company websites, oanda.com
This result compares well with that in 2005, when South Africa was the most expensive of 12
countries surveyed, with a price 102% higher than the average price. In absolute terms, the South
African price has decreased by approximately 14% over the period.
Occasional paper number 3
24
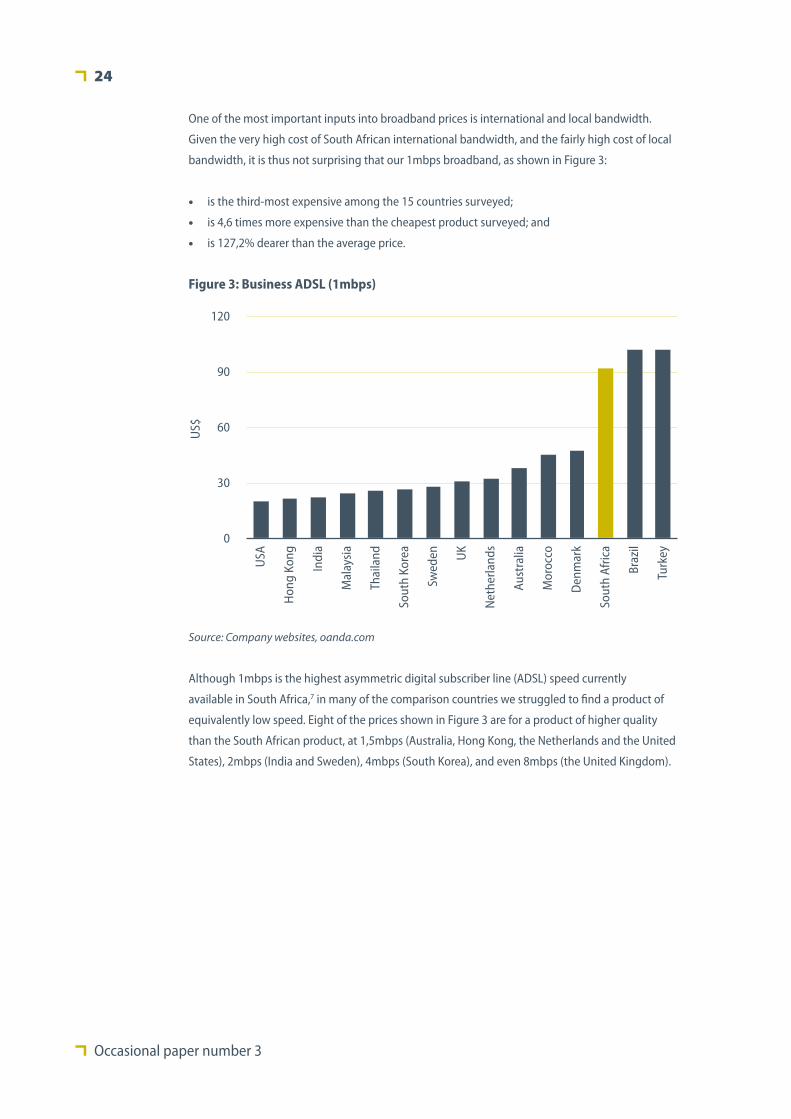
One of the most important inputs into broadband prices is international and local bandwidth.
Given the very high cost of South African international bandwidth, and the fairly high cost of local
bandwidth, it is thus not surprising that our 1mbps broadband, as shown in Figure 3:
is the third-most expensive among the 15 countries surveyed;•
is 4,6 times more expensive than the cheapest product surveyed; and•
is 127,2% dearer than the average price.•
0
30
60
90
120
USA
Hon
g Ko
ng
Indi
a
Mal
aysi
a
Thai
land
Sout
h Ko
rea
Swed
en UK
Net
herla
nds
Aust
ralia
Mor
occo
Den
mar
k
Sout
h Af
rica
Braz
il
Turk
ey
US$
Figure 3: Business ADSL (1mbps)
Source: Company websites, oanda.com
Although 1mbps is the highest asymmetric digital subscriber line (ADSL) speed currently
available in South Africa,7 in many of the comparison countries we struggled to find a product of
equivalently low speed. Eight of the prices shown in Figure 3 are for a product of higher quality
than the South African product, at 1,5mbps (Australia, Hong Kong, the Netherlands and the United
States), 2mbps (India and Sweden), 4mbps (South Korea), and even 8mbps (the United Kingdom).

South African telecommunications prices
25
It was similarly difficult to find a comparison product for what we described as retail broadband,
namely a 512kbps connection. In seven of the 15 comparators, the product surveyed was of
higher quality, namely 600kbps (Brazil), 768kbps (the United States), 1,5mbps (Hong Kong and the
Netherlands), 2mbps (India), 4mbps (South Korea), and 8mbps (the United Kingdom). Despite this,
South African retail broadband:
is the most expensive among the 15 countries surveyed;•
is 5,9 times more expensive than the cheapest product surveyed; and•
is 130,5% dearer than the average price.•
For interest’s sake, we have also included the PPP-adjusted price,8 which gives a better measure of
affordability than the US$ price. As can be seen from Figure 4, South Africa’s price performance is
much worse in PPP terms – the disparity with the average price widens to 252,4%.
0
40
80
120
160
Indi
a
USA
Mal
aysi
a
Swed
en
Hon
g Ko
ng
Thai
land
Net
herla
nds
Sout
h Ko
rea
Aust
ralia UK
Mor
occo
Den
mar
k
Braz
il
Turk
ey
Sout
h Af
rica
US$
Figure 4: Retail broadband (512kbps)
Source: Company websites, oanda.com

Occasional paper number 3
26
0
30
60
90
Hon
g Ko
ng
Indi
a
Thai
land
Mal
aysi
a
Sout
h Ko
rea
Aust
ralia
Den
mar
k
Mor
occo
Swed
en
Net
herla
nds
Braz
il
USA U
K
Turk
ey
Sout
h Af
rica
US$
Figure 5: Mobile basket – business (high user)
Source: Company websites, oanda.com
In 2005, we used speeds of 512kbps for both retail and business ADSL. However, apart from the
change in product specification, the price findings for broadband in 2005 were very similar – it was
the most expensive product in both the retail and the business groups, and 139% and 148% more
expensive than the average price.
Voice products
To examine the cost of domestic telephony, we used a simplified version of 2006 OECD basket
methodology.9 The first basket examined is high-usage mobile telephony, which includes 140 calls
and 55 SMSs a month, which we have used as a proxy for the cost of business mobile users. As
shown in Figure 5, South Africa:
is the most expensive among the 15 countries surveyed;•
is 12,3 times more expensive than the cheapest country surveyed; and•
is 106,9% dearer than the average price.•
A much simpler pricing methodology was used in 2005, which simply compared call rates in peak
times across countries. However, this simpler methodology derived very similar results – in 2005
South Africa was the second-most expensive country in the comparison group, and 107% more
expensive than the average price.
South African telecommunications prices
27
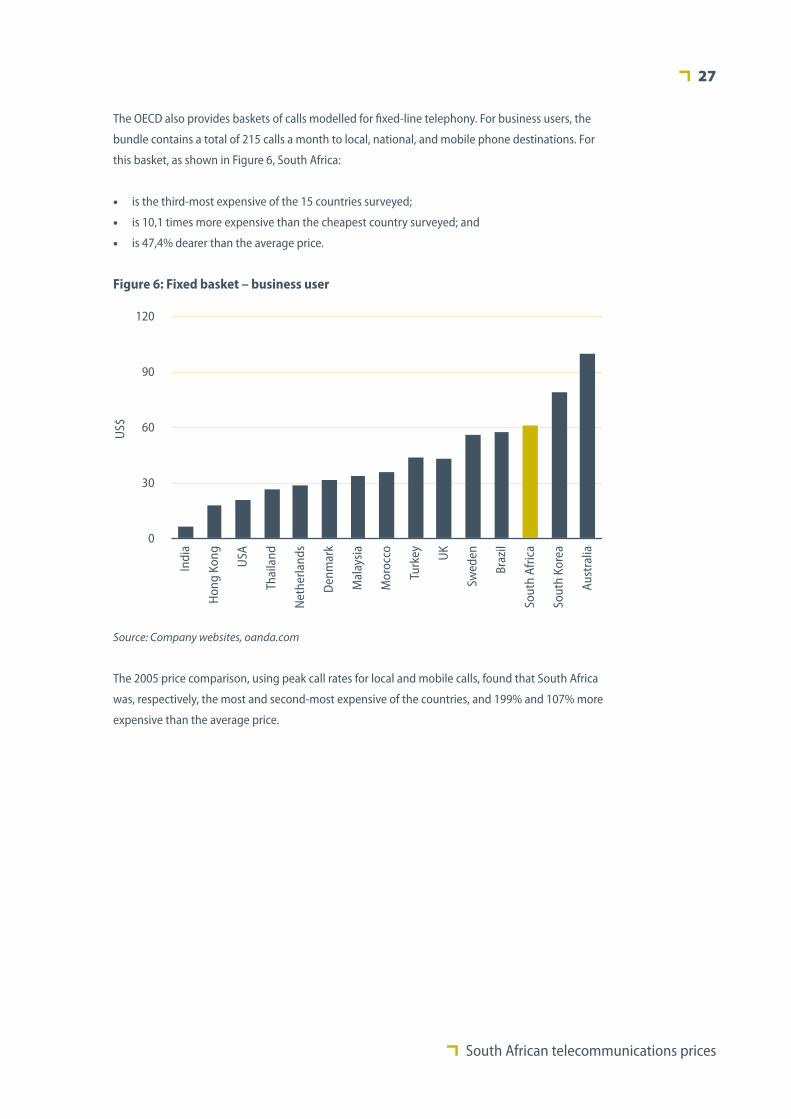
The OECD also provides baskets of calls modelled for fixed-line telephony. For business users, the
bundle contains a total of 215 calls a month to local, national, and mobile phone destinations. For
this basket, as shown in Figure 6, South Africa:
is the third-most expensive of the 15 countries surveyed;•
is 10,1 times more expensive than the cheapest country surveyed; and•
is 47,4% dearer than the average price.•
0
30
60
90
120
Indi
a
Hon
g Ko
ng
USA
Thai
land
Net
herla
nds
Den
mar
k
Mal
aysi
a
Mor
occo
Turk
ey UK
Swed
en
Braz
il
Sout
h Af
rica
Sout
h Ko
rea
Aust
ralia
US$
Figure 6: Fixed basket – business user
Source: Company websites, oanda.com
The 2005 price comparison, using peak call rates for local and mobile calls, found that South Africa
was, respectively, the most and second-most expensive of the countries, and 199% and 107% more
expensive than the average price.
Occasional paper number 3
28
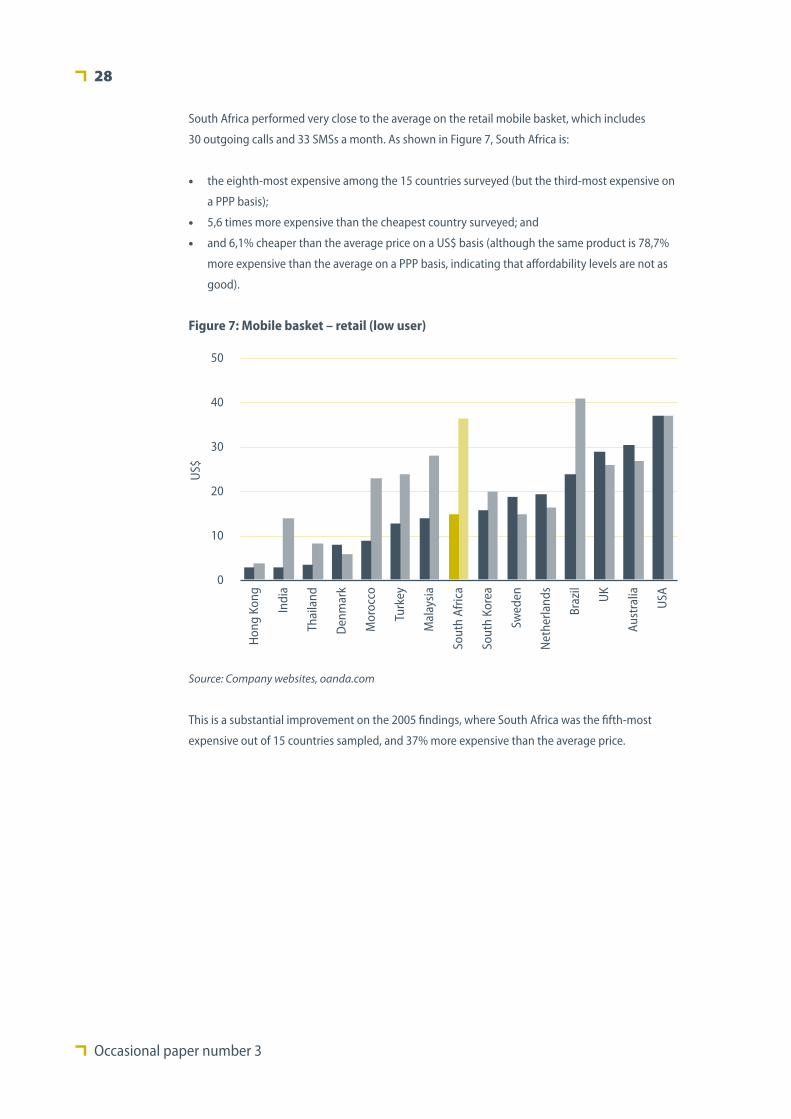
South Africa performed very close to the average on the retail mobile basket, which includes
30 outgoing calls and 33 SMSs a month. As shown in Figure 7, South Africa is:
the eighth-most expensive among the 15 countries surveyed (but the third-most expensive on •
a PPP basis);
5,6 times more expensive than the cheapest country surveyed; and•
and 6,1% cheaper than the average price on a US$ basis (although the same product is 78,7% •
more expensive than the average on a PPP basis, indicating that affordability levels are not as
good).
0
10
20
30
40
50
Hon
g Ko
ng
Indi
a
Thai
land
Den
mar
k
Mor
occo
Turk
ey
Mal
aysi
a
Sout
h Af
rica
Sout
h Ko
rea
Swed
en
Net
herla
nds
Braz
il
UK
Aust
ralia
USA
US$
Figure 7: Mobile basket – retail (low user)
Source: Company websites, oanda.com
This is a substantial improvement on the 2005 findings, where South Africa was the fifth-most
expensive out of 15 countries sampled, and 37% more expensive than the average price.

South African telecommunications prices
29
The fixed basket for residential users includes 48 monthly calls to local, national, and mobile
destinations. For this basket, as shown in Figure 8, South Africa:
is the sixth-most expensive among the 15 countries surveyed (but the third-most expensive on •
a PPP basis);
is 10,5 times more expensive than the cheapest country surveyed; and•
is 8,0% cheaper than the average price (but 62,7% higher than the average on a PPP basis).•
0
20
40
60
80
100
Indi
a
Thai
land
Mal
aysi
a
Hon
g Ko
ng
Den
mar
k
Turk
ey
USA
Net
herla
nds
Braz
il
Sout
h Af
rica
Swed
en
Mor
occo U
K
Aust
ralia
Sout
h Ko
rea
US$
Figure 8: Fixed basket – residential user
Source: Company websites, oanda.com
In the 2005 report, retail local calls were found to be the fourth-most expensive in the comparison
group, and 79% more expensive than the average price. This is a substantial improvement on the
2005 findings.
Occasional paper number 3
30
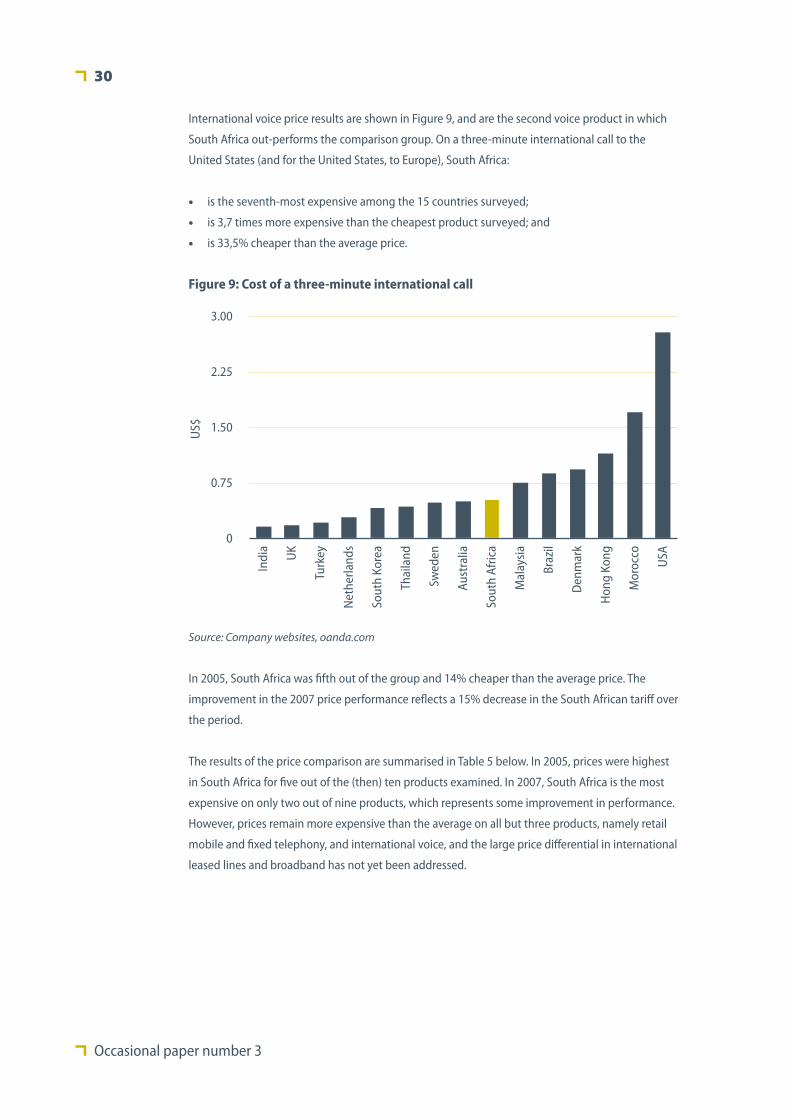
International voice price results are shown in Figure 9, and are the second voice product in which
South Africa out-performs the comparison group. On a three-minute international call to the
United States (and for the United States, to Europe), South Africa:
is the seventh-most expensive among the 15 countries surveyed;•
is 3,7 times more expensive than the cheapest product surveyed; and•
is 33,5% cheaper than the average price.•
0
0.75
1.50
2.25
3.00
Indi
a
UK
Turk
ey
Net
herla
nds
Sout
h Ko
rea
Thai
land
Swed
en
Aust
ralia
Sout
h Af
rica
Mal
aysi
a
Braz
il
Den
mar
k
Hon
g Ko
ng
Mor
occo
USA
US$
Figure 9: Cost of a three-minute international call
Source: Company websites, oanda.com
In 2005, South Africa was fifth out of the group and 14% cheaper than the average price. The
improvement in the 2007 price performance reflects a 15% decrease in the South African tariff over
the period.
The results of the price comparison are summarised in Table 5 below. In 2005, prices were highest
in South Africa for five out of the (then) ten products examined. In 2007, South Africa is the most
expensive on only two out of nine products, which represents some improvement in performance.
However, prices remain more expensive than the average on all but three products, namely retail
mobile and fixed telephony, and international voice, and the large price differential in international
leased lines and broadband has not yet been addressed.

South African telecommunications prices
31
Table 5: Summary of price results
Rank
Out of: (number of countries
surveyed)
Number of times more expensive than
the cheapest price
% greater than the
average price
International leased lines 2 14 36,6 404,7%
Domestic leased lines 5 14 4,9 26,5%
Business ADSL 3 15 4,6 127,2%
Retail ADSL 1 15 5,9 130,5%
Mobile – business basket 1 15 12,3 106,9%
Fixed line – business basket 3 15 10,1 47,4%
Mobile – retail basket 8 15 5,6 –6,1%
Fixed line – residential basket 6 15 10,5 –8,0%
International voice 7 15 3,7 –33,5%
Source: Genesis Analytics
The impact of the August 2007 tariff change
In terms of its licence requirements, Telkom is required to present an annual tariff revision to ICASA
for approval. The 2007 tariff change was implemented on 1 August, and contained several large
tariff decreases, most notably a 30% decrease in the cost of international leased lines. The price
comparison, summarised in Table 5 above, was compiled on data collected prior to the Telkom
tariff revision, in May 2007. For completeness, we thus also include Table 6 below, which reflects
the Telkom tariff changes.
Table 6: Price comparison updated for August 2007 tariff changes
RankOut of: (number
of countries surveyed)
Number of times more expensive than
the cheapest price
% greater than the
average price
International leased lines 2 14 25,6 253,3%
Domestic leased lines 5 14 4,4 12,6%
Business ADSL 3 15 4,0 96,7%
Retail ADSL 1 15 5,6 118,5%
Mobile – business basket 1 15 12,3 106,9%
Fixed line – business basket 3 15 10,4 52,0%
Mobile – retail basket 8 15 5,6 –6,1%
Fixed line – residential basket 6 15 11,0 –3,4%
International voice 10 15 2,9 –47,4%
Source: Genesis Analytics
Occasional paper number 3
32
Two key points should, however, be noted about Table 6:
Firstly, telecoms prices exhibit a downward trend in international markets. Comparing South •
African August prices with international May prices is thus not entirely accurate, as there is a
good chance that international prices have declined in the interim.
Secondly, the change in South Africa’s relative performance is limited. Local prices go from •
seventh-most expensive in international voice to tenth-most expensive, but fixed telephony
actually becomes slightly more expensive, and all other relative positions stay the same.
The impact of the 2007 Telkom tariff changes highlights the extremely slow pace of progress
that occurs in the absence of effective price regulation. South African prices are only moving
incrementally towards international norms, while what is needed is a step change.
South African telecommunications prices
12 steps to improve prices10
T HE 2005 BUSINESS Leadership South Africa report, Reforming Telecommunications in
South Africa: Twelve Proposals for Lowering Costs and Improving Access, identified 12
actions that should be pursued by the Minister of Communications and ICASA in order to reduce
South African telecoms prices. This section provides a brief summary of these recommendations,
grouped into policy directives, regulatory actions, and legislative and other changes (as in the
original report), and evaluates the progress that has been made over the past two years towards
implementing these recommendations.
Policy directives
Unbundle Telkom’s local loop11
2005 recommendation: Local-loop unbundling (LLU) would allow Neotel and the VANS operators
to provide services such as voice and broadband in competition with Telkom, which would help
bring down the price of such services.
Regulatory processes such as LLU are long-term, technically complex initiatives that represent
a real test of the institutional capacity of ICASA. Substantial progress has been made towards
completing the various components of the LLU process, as follows:
Market definition and market power. LLU represents a major intervention in the free operation of
a market, which ICASA can only undertake if competition in that market is proven to be inadequate
in disciplining prices. Section 67 of the Electronic Communications Act 2006 sets out the conditions
under which ICASA can undertake such an intervention. In particular, ICASA is required to define
the market concerned for competition purposes, and determine whether an operator has market
power. On 3 May 2007, ICASA gazetted a discussion document on wholesale telecommunications
markets which began this process. The document defines the local-loop market, and identifies
Telkom as having significant market power in this market.
This document will be debated at public hearings that remain to be scheduled, and stakeholders
are likely to submit lengthy analyses on the various issues. The hearings are a significant part of the
process. For example, MTN, Vodacom and Telkom have lodged detailed criticisms of ICASA’s recent
Occasional paper number 3
34
call-termination review, including challenges on legal and regulatory process as well as on the
economic arguments advanced by ICASA.
ICASA regulatory processes. If ICASA can defend the argument that Telkom has market power in
local loop, the implementation of LLU is one regulatory solution that will be open to it. In fact, the
wholesale telecommunications discussion document already includes a number of suggestions on
the structure of LLU regulation. Three key pro-competitive conditions proposed by ICASA are:
that Telkom must provide access to the local loop ‘upon reasonable request’ and at various •
entry points;
the provision of co-location facilities (including co-location rights in local exchanges) that •
would reduce the cost of making connections to the local loop at various points; and
a requirement to enable the provision of carrier pre-selection,• 12 carrier selection (indirect
access), and wholesale line rental (allowing service providers to present customers with a
single bill including access and call costs).
These requirements will need to be implemented via a number of routes, including Telkom licence
requirements, general market regulations, and so forth. The creation of an enabling regulatory
environment for unbundling is expected to take three to six months (Sunday Times 2007a).
DoC technical processes. The department of communications (DOC) convened an LLU committee
(LLUC) to make suggestions on how unbundling should be carried out. This document will guide
ICASA on the technical implementation of unbundling. The LLUC report tabled the following
recommendations, among others:13
A combination of three unbundling models should be used, based on the relevant socio-•
economic conditions of the area in question (Ensor, McLachlan, and Mawson 2007), namely:
full unbundling (Telkom infrastructure used by various operators);•
line sharing (Telkom only provides voice access); and•
bitstream (wholesale) access.•
Any licensed operator should have access to the local loop to deliver voice and/or data services.•
ICASA should implement carrier pre-selection as soon as possible.•
All necessary co-location of facilities needed to ensure smooth unbundling and easy access for •
new entrants must be allowed.
Customers should be allowed to switch between service providers as soon as possible (Olivier •
2007).
ICASA should regulate the pricing of access to the local loop.•
ICASA should regulate issues such as access to facilities, maintenance, and other issues related •
to the quality of services provided.
ICASA should create capacity to inspect Telkom’s premises physically to gather information •
needed to ensure an effective unbundling process.
South African telecommunications prices
35
The process of technically implementing LLU will require substantial effort on a number of fronts.
The LLUC (2007:177) report suggests that ‘the implementation of LLU should be managed in
much the same ways as a complex IT or outsourcing project and requires discipline, the use of
project management tools and adequate resources to run as a successful initiative’. Because of the
technical complexity of the task, it will by necessity take time: the LLUC (ibid: 180) therefore only
calls for unbundling to be in ‘an advanced stage of implementation by 2010’.
This announcement was met with mixed feelings, as eloquently summarised in the following
opinion expressed in Business Day (2007):
It is hard to decide whether to rejoice that the unbundling of the local loop could begin as early
as next year or to weep that it will take at least four years to complete [emphasis added].
The minister of communications, however, countered the claims that she is effectively extending
Telkom’s monopoly by four years by pointing out that unbundling of the local loop has traditionally
taken far longer than this internationally, and that four years is actually ‘an ambitious target’
(Vecchiatto 2007). In order to ensure that the timeline does not translate into an effective four-year
extension of Telkom’s monopoly, ICASA will need to stipulate intermediate targets and guidelines
in the regulations that govern unbundling.
One of the key elements of successful implementation by ICASA will be the determination of the
price level that the infrastructure provider (that is, Telkom) can charge, which is discussed further in
Facilities leasing at cost-based prices on page 39.
Progress: A clear political commitment to local-loop unbundling has been demonstrated.
However, completing the process will take time, resources, and technical expertise, and its overall
effectiveness will depend on the outcome of the current regulatory process.
Permit VANS operators to self-provide backbone infrastructure14
2005 recommendation: Even though economies of scale would favour Telkom and Neotel
providing the bulk of backbone infrastructure, the ability to self-provide would provide VANS
operators with more bargaining power in price negotiations.
The Minister of Communications issued a number of ministerial determinations on 3 September
2004, one of which was widely interpreted as giving VANS the right to self-provide fixed-line
infrastructure.15 On 31 January 2005, however, the Minister issued another statement, qualifying
the determination as applying to mobile operators only.16 This resulted in confusion concerning
the legality of self-provision by VANS. In a February 2007 media statement, the Internet Service
Providers’ Association highlights the fact that since 2005 they have, on several occasions, tried to
no avail to clarify this issue with the Department of Communications (ISPA 2007).

Occasional paper number 3
36
The Minister made another statement on the issue during her May 2007 budget speech, when she
indicated that she had urged ICASA:
… to urgently consider whether none, or only certain, of the existing VANS licensees can be
authorised to provide services as well as to provide and operate electronic communications
facilities or networks to ensure that such licensees are issued electronic communications
network service licences in addition to other licences specified in the relevant section of the
ECA, if applicable (Matsepe-Casaburri 2007).
Given the confusion that resulted from the Minister’s 2004 and 2005 announcements, there is
uncertainty as to the status of the 2007 announcement. While some VANS operators are optimistic
that self-provision is on the horizon, others have indicated that they will not begin ‘to build
infrastructure aggressively until we have regulatory clarity’ (Financial Mail 2007).
Ultimately, self-provision would be a way of changing the structure of the leased-line market,
and introducing enough competition to make price regulation less of a priority. ICASA’s current
focus seems to be focusing on expediting price regulation, rather than on market structure. In
order to tackle high prices, price regulation is critical in the short to medium term. However,
introducing competition is the key mechanism for reducing prices and improving quality in the
longer term. In this regard, a critical juncture will be ICASA and the Minister’s decision about
how to migrate VANS licences in the old Telecommunications Act to the new ECA framework: will
they be given to electronic communications network service (ECNS) licences, or only electronic
communications service (ECS) licences? It is noted that the ECA stipulates that licence migrations
cannot decrease the existing rights held by a licensee (ie rights have to stay the same or increase).
The legal question of whether VANS do currently have the right to self-provide (by 2005 ministerial
declarations) will therefore likely play a key part in proposals on licence migration.
Progress: The uncertainty surrounding the legality of self-provision by VANS remains. Very little
progress has been made towards finalising this issue, but the key opportunity will be how VANS
licences are converted to the new ECA framework. In the meantime, ICASA has started a process
to enable regulation of the wholesale leased-line market.
Review universal service and access policy
2005 recommendation: A thorough review of universal service and access policy was
recommended, in order to increase the efficiency of the process, improve its sustainability,
increase the cost-effectiveness of the funding mechanism, and improve monitoring systems.
Instead of a separate regulator for universal service objectives, it was recommended that these
functions should be transferred to ICASA.
The Universal Services Agency (USA) is currently in the process of relaunching and rebranding itself
as the Universal Services and Access Agency of SA (USAASA). USAASA is also changing its strategic
approach to focus more closely on its core functions of co-ordinating access activities by various
South African telecommunications prices
37
players, and providing the information and policy support to ensure that the funding available
through the Universal Service and Access Fund (USAF) is spent in a sustainable manner. As part
of the process, an internal stakeholder review was undertaken to gauge the perceptions and
expectations of stakeholders with respect to USAASA. The review also identified opportunities for
collaborations among stakeholders.
In recent times, a number of reviews of both the agency and universal services, and of access
policy in general, have been undertaken. Two examples of these are the ‘Universal Services
Agency impact document’17 prepared for the USAASA by the Turnkey Consortium in 2005,
and ‘Recommendations on how the USA and other stakeholders might assist USALs to ensure
sustainability’18 by Lisa Thornton in 2007. The former was a review of the USA’s mandate, and
provided an assessment of whether it had been achieved, while the latter, as the name suggests,
investigated how the USA and other stakeholders could most effectively ensure that under-
serviced area licences (USALs) are sustainable over time.
USAASA does not currently have access to the bulk of the contributions to the USAF. This has
reduced the effectiveness of the USAASA to date.
Progress: The intention to reinvigorate USAASA and increase the efficiency of the process
of universal service and access is clear. Whether this intention translates into effective
implementation remains to be seen.
Regulatory action
Require fair rates structures – no minimum charges, no per minute billing, and a broad range of contract lengths
2005 recommendation: A number of rate structures in place in 2005 raised call charges in an
artificial manner – for example, minimum call charges, and billing calls in blocks of 30 seconds or
a minute, instead of on a per-second basis. Regulations should instead be drafted to ensure that
rates are structured in line with costs, and specifically requiring Telkom to offer residential users
a rate plan that includes free local calls. Mobile operators should be required to offer a range of
contract terms, and contracts which do not include a ‘free’ cellphone.
Mobile rate structures. ICASA published a discussion document on handset subsidies in 2005,
which resulted in public hearings in 2005, the publication of draft regulations in June 2006, and
a second round of public hearings in April 2007. These regulations, which have yet to be finalised
or implemented, deal partially with the concerns of the 2005 recommendation as regards mobile
contracts. In particular, they require the provision of six-, 12-, 18- and 24-month contract terms,
and separation of service and handset charges.

Occasional paper number 3
38
To some extent, these regulations have been anticipated by market developments. For example,
the entry of Virgin into the South African market has increased the range of contract options
available. The Virgin model is based on lower call and monthly costs, made possible by removing
the ‘free’ cellphone that needs to be subsidised. They also offer various contract lengths, and the
same call rates for contract and pre-paid customers. In response to this, the other mobile operators
now also offer more flexible contracts, although the 24-month contract remains standard, and
billing is still often subject to minimum or block pricing.
Fixed-line rate structures. Telkom has of its own accord introduced per-second billing, applicable
from the first second, aimed at business customers, in its Telkom SupremeCall package. These
packages were originally advertised as being able to cut clients’ phone bills by up to 25%. This
illustrates the cost savings that are available from the implementation of pure per-second billing,
and is of a similar order of magnitude to the 30%–35% cost savings envisaged in the original
‘Twelve steps’ document. The Telkom SupremeCall package, however, requires a minimum monthly
rental of R1 000.19 SupremeCall is thus better viewed as a high-usage business product: the OECD
basket methodology used to evaluate fixed-line prices, mentioned in Voice products above, for
example, priced the cheapest Telkom product for the business bundle at R829 a month, and the
cheapest retail product at R264 a month. Telkom has also recently introduced the range of Closer
packages, which include free minutes and free local calls for residential customers.
Progress: Regulatory initiatives have not yet been finalised, and only address concerns in the
mobile market. Operators have made some concessions, possibly in anticipation of regulation,
but it is not clear whether the new options are fair and competitive, or go far enough.
Interconnection at cost-based prices
2005 recommendation: Despite the existence of regulations enabling ICASA to price
interconnection by major operators at long-run incremental cost (LRIC), in 2005, the regulator
had yet to declare such major-operator status. This step needed to be expedited. Time delays
surrounding the collection of cost data via regulatory accounts should also be minimised.
In terms of section 67(4) of the ECA, ICASA published a discussion document on interconnection
fees (wholesale call termination) in the Government Gazette of 29 January 2007.20 This document
found that there were separate markets for interconnection on each provider’s network. This
meant that all providers had significant market power in interconnection on their network,
as providers cannot offer interconnection on one another’s network. ICASA also found that
competition in these markets is not effective. A number of potential pro-competitive measures
were identified, including cost-based call termination and an obligation to maintain the specialised
separate accounting systems that would accompany it.
The legality of the section 67(4) process as currently implemented has, however, been challenged
by a number of operators on procedural grounds. The contention is that the ECA requires that:

South African telecommunications prices
39
Separate regulations need to be passed to outline the methodology used in enquiry.1.
A roadmap needs to be provided of all markets to be defined.2.
The market definition process needs to be concluded before the discussion of market power 3.
and potential remedies can begin.
To date these steps have all been addressed in the same discussion paper. The completion of
the section 67(4) process with respect to interconnection thus depends on the outcome of any
potential legal challenge.
The Chart of Accounts and Cost Allocation Manual (COA/CAM) relating to the mobile market has
been submitted. The information on which to base cost-based pricing, should the section 67(4)
process be completed, is thus available.
Progress: The fact that interconnection was the first discussion document produced in terms
of section 67(4) of the ECA demonstrates the high priority that ICASA attributes to the issue. It
seems likely that, depending on the outcome of legal challenges, the process is on track to reach
a conclusion in the short to medium term (possibly within a year or two).
Facilities leasing at cost-based prices
2005 recommendation: Access to Telkom infrastructure, for local-loop unbundling or leased
lines, would only improve competition for customers if such access were provided on a cost
basis. Such cost-based facilities-leasing regulation by ICASA should take place before the entry of
Neotel, and quickly enough for VANS operators to take advantage of market opportunities in the
short term.
ICASA’s May 2007 discussion paper on wholesale markets is again of reference as regards cost-
based facilities leasing prices. The discussion document finds that Telkom has significant market
power in the local-loop and leased-line markets, and recommends the introduction of price
regulation in these markets. The suggested price control for the local loop and leased lines21 is
long-run incremental cost (LRIC),22 supplemented by price caps in situations where calculation of
the technically complex LRIC price will be too time-consuming. Once LRIC is available, however, it
is suggested as the preferred form of price control.
As already stated in Unbundle Telkom’s local loop above, market reviews are a consultative
process, and public hearings now need to be convened to provide stakeholders with an
opportunity to have their comments and concerns heard before regulations regarding cost-based
facilities leasing can be passed. It is thus not a foregone conclusion that the suggested measures
will be implemented as is.

Occasional paper number 3
40
Progress: The process of implementing facilities leasing at cost-based prices has been started.
However, the process is expected to take some time, particularly with respect to gathering
costing information, and is not set in stone. It is possible that the process could be concluded in
the short to medium term.
Regulate international bandwidth
2005 recommendation: Two regulatory alternatives were suggested for regulating price on
international bandwidth. The first was to declare SAT-3 an essential facility, which would allow
ICASA to institute cost-based pricing; while the second would be to require Telkom, as the SAT-3
consortium administrator, to sell unused capacity on SAT-3 to Neotel and Sentech.
Section 43(10) of the ECA specifically prohibits the use by telecoms licensees of exclusivity
provisions as regards submarine cables. Accordingly, the Minister of Communications has taken
the policy decision23 that the exclusivity provisions of the SAT-3 consortium will be null and void
in South Africa as at 1 November 2007. This means that Telkom’s contractual monopoly of the
cable will cease on that date. In terms of current international gateway licences, Sentech and
Neotel in particular should be able to start serving this market immediately, as long as capacity is
made available by the consortium administrator (which is coincidentally also Telkom). In order to
ensure that such capacity is released, the minister has also directed ICASA to prescribe, as set out in
Section 43(8)(b) of the ECA, a list of essential facilities, paying particular attention to SAT-3.
International leased lines are specifically addressed in ICASA’s May 2007 discussion document
on wholesale markets. Telkom is found to have significant market power in international leased
lines, and thus they fall under the scope of the cost-based facilities leasing regulations proposed
in Facilities leasing at cost-based prices above. There is some overlap between the regulatory
interventions proposed in the wholesale markets document, and the essential-facilities policy
direction of the minister. Both will ultimately result in price regulation, and an obligation to offer
capacity by Telkom. As one of the grounds for declaring significant market power in terms of
the section 67(5) of the ECA is control of an essential facility, the two regulatory initiatives are
complementary.
Progress: A number of current initiatives address the cost of international leased lines. Although
cost regulation will only be possible in the medium term, as it depends on the same processes as
cost-based facilities leasing, the end of the contract-based commercial monopoly of Telkom on
SAT-3 will take place by November 2007.

South African telecommunications prices
41
Regulate mandatory price comparison tools
2005 recommendation: The complex structure of call-rate packages makes it difficult for
consumers to determine which operator offers the best deal, and thus inhibits price competition.
It was suggested that ICASA offer a price-comparison programme to consumers via its website,
which would allow consumers to determine the likely cost of each package, given the expected
distribution of calls.
Progress: As far as the authors of this report are aware, no progress has been made regarding the
provision of mandatory price comparison tools.
Legislative and other changes
Greater independence and accountability
2005 recommendation: ICASA should be as independent as possible, thus allowing it to act
aggressively in order to bring down telecommunications prices. It should also become more
accountable for developments in the telecommunications sector, for example via appearances
before the parliamentary portfolio committee on communications.
Esselaar, Gillwald, and Stork (2006) point out that the ICASA Amendment Act of 2006 removed
a conflict of interest that was previously structurally enshrined in legislation, namely that the
Minister of Communications (as a representative of the state’s interests as a major shareholder
in Telkom) was able to veto ICASA regulations. However, a new conflict of interest has been
entrenched, in that the power to appoint the ICASA decision-making committee has been
transferred from the president to the Minister of Communications (Esselaar, Gillwald, and Stork
2006).
The ICASA Amendment Act of 2006 addresses internal accountability issues, but this does not
extend to the accountability of the authority as a whole. It does not, for instance, require it to
appear before the parliamentary portfolio committee on communications as suggested in the
‘Twelve steps’ detailed in this section.
Progress: The ICASA Amendment Act has removed one source of conflict of interest but replaced
it with another. Potential problems with respect to conflicts of interest and lack of accountability
thus remain.

Occasional paper number 3
42
Address anti-competitive behaviour
2005 recommendation: The Telecommunications Act was enacted prior to the Competition Act.
As a result, its definitions, scope, jurisdictional aspects of dealing with anti-competitive practices,
and fines are out of line with the Competition Act, creating the opportunity for jurisdictional
disputes and inconsistent treatment across the two regulators (ICASA and the Competition
Commission/Tribunal). Such jurisdictional ambiguity needs to be clarified. A potential solution
would be to allow the competition authorities to prosecute anti-competitive practices in
telecoms, but with support from ICASA (either technical support, or the ability to lodge and
pursue complaints independently).
Jurisdictional ambiguity with respect to competition in telecommunications is only partially
addressed by the ECA. Section 67(9) of the ECA states that ‘subject to the provisions of the [ECA],
the Competition Act applies to competition matters in the electronic communications industry’.
ICASA is furthermore defined as a regulatory authority in terms of the Competition Act. In terms
of sections 67(11) and 67(12), ICASA and the Competition Commission may ask for assistance or
advice from each other on relevant proceedings.
ICASA and the Competition Commission currently have a memorandum of understanding in place,
which was signed in 2002 (Sukazi 2002). The memorandum sets out the treatment of mergers
where approval from either one or both of these institutions is needed. Although it also addresses
the issue of complaints, jurisdiction in this area is not clearly defined and is open to dispute. The
memorandum also makes explicit provision for the sharing of information and resources between
the two institutions.
Esselaar, Gillwald, and Stork (2006) believe that the precedent established by the recent
Competition Commission finding against Telkom, relating to its takeover bid for software services
company Business Connexion, could serve as a springboard for a ‘more interventionist approach’
to the electronic communications industry by the Commission. This view is, however, debatable.
The jurisdiction with respect to mergers is clearly set out in the memorandum of understanding,
and in this case it clearly resided with the Commission. The requirement to establish a complaints
and compliance committee within ICASA in terms of the ICASA Amendment Act indicates that
ICASA is not expected to give up its jurisdiction over competition issues to the Commission. The
Commission is currently investigating a number of telecommunication cases, but its jurisdiction in
this area is still disputed. Telkom is currently disputing the fact that the Commission has the right
to initiate proceedings against it in the high court.
The jurisdictional issues between ICASA and the Competition Commission have thus not been
cleared up. Opportunities for ‘jurisdiction shopping’ remain, given that ICASA is not endowed with
the commission’s ability to issue court orders or fines.
Progress: While jurisdiction in respect of mergers is clearly set out, the same is not true in respect
of complaints. Substantial jurisdictional ambiguity thus remains.
South African telecommunications prices
43
Review licence and spectrum fees
2005 recommendation: Licence and spectrum fees are necessary to recoup the running costs of
the regulator, but raise the costs of operators, feeding higher consumer prices. A review of the
trade-off between prices and government revenue was thus recommended.
The revenues earned by ICASA from licence and spectrum fees are substantial. In the 2006/07
financial year, for example, ICASA fees, together with the post office licensing fee, amounted to
around R1,3 billion,24 and essentially covered all the expenses of the DOC for the year. Once Telkom
dividends and other revenue streams are added in to the departmental budget, the DOC makes a
net annual profit in the region of R1,9 billion a year for the treasury.
Revenues from ICASA fees are projected to rise slightly over the medium term. There does not
seem to be any plan to forego this source of revenue, nor any progress towards an investigation of
whether licence and spectrum fee levels are consistent with wider objectives of affordability.
Progress: No progress seems to have been made towards achieving this goal, and thus the
original recommendation remains pressing.
Increased funding for ICASA
2005 recommendation: Implementing the Electronic Communications Act (then the
Convergence Bill), as well as the twelve steps recommended, would require additional funding for
ICASA.
The 2007 national budget issued by treasury makes explicit reference to the additional burden
placed on ICASA by the need to fulfil the requirements of the ECA. The budget also refers to ‘a need
to promote greater competition in the South African communications market by dealing swiftly
with competition complaints and proactively reviewing the market’.25 Despite this recognition of
the burden on ICASA, however, the projected increase in funding is not particularly substantial.
As can be seen in Figure 10 on page 44, with the exception of the 2004/05 financial year, which
predates the introduction of the ECA, ICASA funding is increasing at a gradual rather than a
step-wise rate.

Occasional paper number 3
44
The issue of capacity at ICASA is, however, driven more by staff turnover rates than by funding at
present. ICASA was hit by a major exodus of staff in 2006, and it needed to advertise many senior
posts. Funding is thus not the only issue that needs to be addressed, as attention must also be
given to retaining and replenishing the pool of skilled employees.
0
75
150
225
300
Audited2003/04
Audited2004/05
Audited2005/06
Estimatedoutcome2006/07
Medium-term
estimate2007/08
Medium-term
estimate2008/09
Medium-term
estimate2009/10
Revenue Rm
0
7.5
15.0
22.5
30.0
y-o-y % change
Revenuey-
o-y
% c
hang
e
Figure 10: Historical and projected ICASA funding
Source: 2007 estimates of National Expenditure. Calculations by Genesis.
Progress: It is not clear that ICASA funding has been increased sufficiently, but staff retention
issues are probably more important at present.
Table 7 on page 45 summarises progress to date on the 12 steps suggested in 2005. It is
encouraging that, in all but two of the steps, some progress has been made. However, on all of
the recommendations, progress has been insufficient to meet the objectives originally suggested.
Where progress is most advanced is in the four areas of price regulation, where success will
ultimately depend on ICASA’s ability to complete the regulatory process.
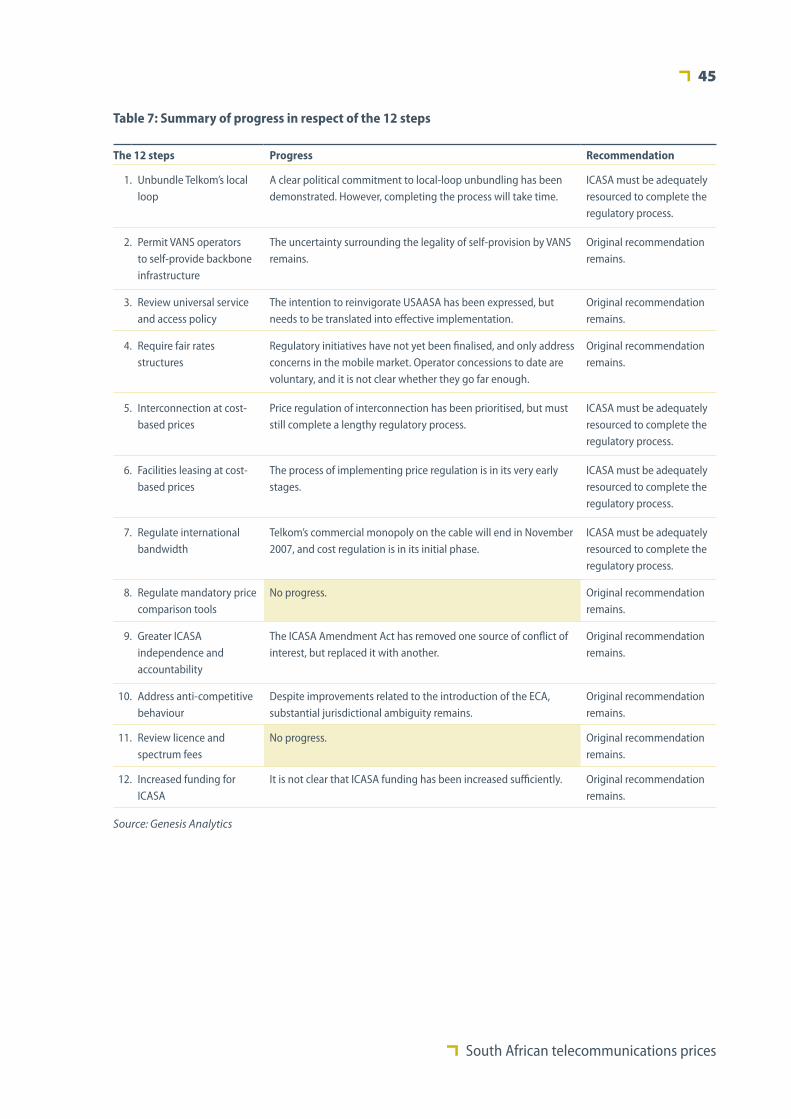
South African telecommunications prices
45
The 12 steps Progress Recommendation
1.
Unbundle Telkom’s local loop
A clear political commitment to local-loop unbundling has been demonstrated. However, completing the process will take time.
ICASA must be adequately resourced to complete the regulatory process.
2.
Permit VANS operators to self-provide backbone infrastructure
The uncertainty surrounding the legality of self-provision by VANS remains.
Original recommendation remains.
3. Review universal service and access policy
The intention to reinvigorate USAASA has been expressed, but needs to be translated into effective implementation.
Original recommendation remains.
4.
Require fair rates structures
Regulatory initiatives have not yet been finalised, and only address concerns in the mobile market. Operator concessions to date are voluntary, and it is not clear whether they go far enough.
Original recommendation remains.
5.
Interconnection at cost-based prices
Price regulation of interconnection has been prioritised, but must still complete a lengthy regulatory process.
ICASA must be adequately resourced to complete the regulatory process.
6.
Facilities leasing at cost-based prices
The process of implementing price regulation is in its very early stages.
ICASA must be adequately resourced to complete the regulatory process.
7.
Regulate international bandwidth
Telkom’s commercial monopoly on the cable will end in November 2007, and cost regulation is in its initial phase.
ICASA must be adequately resourced to complete the regulatory process.
8. Regulate mandatory price comparison tools
No progress. Original recommendation remains.
9.
Greater ICASA independence and accountability
The ICASA Amendment Act has removed one source of conflict of interest, but replaced it with another.
Original recommendation remains.
10. Address anti-competitive behaviour
Despite improvements related to the introduction of the ECA, substantial jurisdictional ambiguity remains.
Original recommendation remains.
11. Review licence and spectrum fees
No progress. Original recommendation remains.
12. Increased funding for ICASA
It is not clear that ICASA funding has been increased sufficiently. Original recommendation remains.
Table 7: Summary of progress in respect of the 12 steps
Source: Genesis Analytics

Occasional paper number 3
46
Additional Issues
Three additional regulatory issues that deserve mention are the decision by government to back
Sentech as an industry champion, the decision by the Department of Public Enterprises to create
a state-owned infrastructure company (Infraco) to provide wholesale bandwidth, and NEPAD
interference in the EASSy cable program.
Sentech
In a recent budget vote speech, the Minister of Communications highlighted the strategic role of
Sentech, in the eyes of the cabinet, to serve as the ‘core wireless broadband provider’ (Matsepe-
Casaburri 2007). The decision to back Sentech as sector champion raises many questions. Sentech
is essentially a wholesale broadcast infrastructure provider: it is thus not apparent why it would
be suited to serve as a champion in the market for providing retail voice and data products. The
company is unfamiliar with both the product and the market involved.
The main concern surrounding Sentech is the fact that a scarce spectrum licence has been awarded
to a company that has not demonstrated the ability to use the licence efficiently in a competitive
setting. Also, this licence was awarded without a competitive bidding process, or a transparent
assessment of the ability or business case of the provider.
While it is thus possible that subsidised provision of broadband services may be the only way to
roll out these services to low-income areas, it is not clear that using Sentech would be the most
effective way of doing so.
Recommendation: Attempts to boost the provision of wireless broadband would be better
served by price regulation in wholesale markets, and the encouragement of competition in retail
markets, than by using Sentech as a sector champion.
Infraco
Both Transnet and Eskom have for years been investing in a fibre-optic network. However,
they have not held the kind of telecommunications licences that would have allowed them to
use this network to compete with Telkom. The second fixed line operator, Neotel, expended
substantial effort trying to purchase these assets from Transnet and Eskom – with the second
national operator (SNO) licence in hand, the fibre-optic network would have provided Neotel with
additional national backbone functionality, which would contribute to a more competitive offering
by the new entrant, particularly on national leased lines.
However, a policy decision has subsequently been made not to privatise these assets. The
Broadband Infraco Bill instead proposes that:
South African telecommunications prices
47
Instead of being sold to Neotel, the fibre-optic networks of Transnet and Eskom will be •
transferred into a new company, Infraco Broadband Limited, which will remain wholly owned
by the state;
Infraco will, for the first four years of its existence, provide wholesale bandwidth exclusively to •
Neotel and will do so on a cost-plus basis (Barradas 2007);
Within this exclusivity period, Infraco will apply for a licence that will make its capacity •
available directly to the market (ibid); and
government then intends to privatise Infraco once competitive conditions in the wholesale •
broadband and international bandwidth markets are more favourable (ibid).
In the words of the bill itself, the state ‘intends expanding the availability of broadband access
to underdeveloped areas and ensuring that the bandwidth requirements for specific projects of
national interest are met’ via the Infraco mechanism. The logic behind the shift from private-sector
provision of bandwidth to public-sector provision is as follows:
Investigations into the high broadband costs in South Africa compared to international
counterparts revealed that connectivity providers, other than Telkom Limited (‘Telkom’), have a
cost structure where up to 80% of costs comprise costs attributable to Tier 1 national backbone
connectivity and Tier 3 international connectivity, both of which are supplied by Telkom. The
logical conclusion was to intervene to address these national backbone and international
connectivity cost structures. This is based on the assumption that if these costs are addressed,
Tier 2 (the Local Metropolitan Area network and last mile) connectivity providers would quickly
pass this onto the market as a result of competitive pressure.
In the short term,26 the implementation of Infraco should allow the state to decrease wholesale
leased-line prices, which should then feed through to decreases in broadband retail prices offered
by Neotel. For example, the department of public enterprises has stated that Infraco wholesale
prices should be around two-thirds lower than Telkom wholesale prices (Sunday Times 2007b).
This is a positive development.
However, the initiative brings with it some risks. The first of these is that there are usually strong
prima facie grounds for believing that publicly owned firms will tend to be less efficient than
privately owned firms. For the interested reader, we have limited this theoretical discussion to
Appendix 2.
Secondly, if Infraco is to spur lower prices, it is crucial that Neotel feed low wholesale prices
through from Infraco to its customers. We understand that, while Infraco will price its offering on
a cost-plus basis to Neotel, this does not guarantee that Neotel will pass through such reasonable
pricing. The initial mechanism to ensure that Neotel would pass on low rates to the market was
the threat of licensing Infraco separately, and selling directly to other service providers. However,
it appears as if that option is not longer viable in terms of the licensing regime of the ECA. While
Infraco may still have access to a credible threat to induce Neotel into passing on lower prices, it is
not apparent what this may be.
Occasional paper number 3
48
Thirdly, Neotel is already taking longer than anticipated to provide effective competition to Telkom.
The further delays introduced by the Infraco initiative have made consumers wait longer for relief
from high prices.
Fourthly, the state investment in infrastructure might re-incentivise government to protect these
investments from competition in order to ensure they remain viable. The recent reports that
government might block new undersea cable operators (for example, EASSy and Seacom) from
landing in South Africa in favour of building two of their own undersea cables seem particularly
worrying. There appears to be some basis for government involvement to ensure an undersea
cable consortium does not settle on creating monopoly access points to the cable. However, even
if government is concerned by this issue, there seems to be no economic justification for protected
government investment. This is especially true when private investment is readily forthcoming.
Blocking operators from landing in South Africa is highly likely to be bad for overall competition
and bad for consumers. The fact that government is considering such harsh measures gives
some weight to the concerns stated above that government investment in Infraco may serve to
undermine the broad policy objectives of the sector.
Recommendation: In the short term, Infraco may provide some price relief, but in the long term,
its net effect is much more uncertain. The extent to which it may undermine private investment in
infrastructure is particularly worrying.
EASSy
International bandwidth, which is critical for the provision of international data and voice
connectivity, can be provided via either satellite or cable links. Only the west coast of Africa has
cable connectivity, via the SAT-3/SAFE system. In many of the countries which access the cable,
including South Africa, only one company has wholesale access to the cable infrastructure.
This monopolistic provision is unsurprisingly associated with very high prices in many of these
countries.
Even monopolistic access to cable is, however, arguably preferable to relying solely on satellite
connections. Satellites typically can’t handle the same volume of data as cable can, so they are
of limited use for high bandwidth applications, like broadband service provision. When used for
telephony, satellite systems introduce a substantial delay and echo to calls. Finally, international
evidence suggests that satellite technology will always tend to be more expensive than cable for
point-to-point applications (again, like broadband Internet connections).
Along the eastern coast of Africa, international telecoms services are dependent on satellite
connectivity, as no cable investment has yet been made. This is a major inhibition to the
development of the telecommunications sector in these countries. Since late 2002,27 the process
of co-ordinating such a cable investment has been under way, in the form of the Eastern Africa
Submarine Cable System (EASSy) project. The cable, which is projected to run from Mthunzini in
KwaZulu-Natal to Port Sudan, is a project originated and driven by regional telecoms operators and
South African telecommunications prices
49
the East African business community. For many of the countries of the east coast, this project may
represent their first access to cable connectivity. For South Africa, the main impact of the project is
its potential to introduce a competitor to the SAT-3 system.
Competition in international cable bandwidth is, however, not necessarily dependent on the
existence of competing networks. Typically, rights to bandwidth on a cable are allocated between
cable consortium members – each consortium member holds an indefeasible right of use (IRU) to a
certain amount of bandwidth, which can then be on-sold to other telecoms companies. The reason
SAT-3 resulted in so many regional monopolies was that only one operator per country joined the
consortium, and thus only one operator per country held IRUs.
The commercial structure of the EASSy project is thus of vital concern when evaluating its likely
impact on competitive conditions. If the same structure used by SAT-3 was adopted, one would
expect to see the creation of a string of monopolistic markets along the east coast (and, of course,
if Telkom controlled access to EASSy in the same way that it has historically controlled access to
SAT-3, the maintenance of the South African monopoly). Conversely, a consortium commitment
to supply excess capacity to licensed operators on request would substantially allay competition
concerns.
NEPAD intervention. The NEPAD protocol process is widely viewed as driven by South African
policy-makers.28 NEPAD was initially invited to be an observer to EASSy steering committee
meetings. However, over the period of negotiations, NEPAD became increasingly active in the
project. In 2006, NEPAD produced a ‘Protocol on policy and regulatory framework for NEPAD
ICT broadband infrastructure for Eastern and Southern Africa’, which has since been ratified by
12 member states, including South Africa.
The protocol introduces substantial changes to the initial structure of the project, including equal
state shareholding via special-purpose vehicles, an inter-governmental regulator controlled
by member states, a uniform tariff to be charged by all operators, and regulation of the rate of
return on investment. In order to implement the protocol fully, the signatories will have to amend
their policy and regulation to harmonise the domestic framework with the requirements of the
protocol. The level of change entailed is in and of itself problematic, as it introduces delay into the
implementation of the project.
The introduction of state ownership envisaged in the protocol is also of concern. Over and above
the efficiency considerations discussed in Appendix 2, the manner in which state ownership has
been introduced is troubling. The EASSy project was initiated by regional telecoms operators, a
number of whom are privately owned. The NEPAD protocol imposes state ownership on the project
in a manner which is now disputed by some of the original project participants. To the extent
that the project infringes on the pre-existing commercial interests of the initiating firms, it can
be regarded as a form of expropriation. Such interference with the activities of the private sector
increases the uncertainty of any investment, and decreases the incentive to invest.
Occasional paper number 3
50
The protocol also allows signatory governments to exercise substantial control over the cable
once it is in operation. An IGA, comprising all signatory governments, will hold a golden share
in the cable’s SPV structure, and will have authority to regulate the rate of return of operators,
ensure operator compliance with the protocol, have oversight on policy and regulatory issues,
and have the right to admit non-telecoms companies to join or invest in the SPV. In South Africa,
the jurisdiction of the IGA and ICASA will overlap as regards price regulation of international
bandwidth, creating further jurisdictional concerns. In addition, it is not clear that the IGA’s
regulatory role will be sufficiently independent from member states to ensure that political
agendas do not influence its actions.
The NEPAD protocol has drawn criticism from a number of operators involved in the EASSy
project.29 A number of parties have indicated that they are in the process of pursuing alternative
cable investments – as many as four additional east coast projects are currently rumoured to be in
discussion (Southwood 2007). It seems likely that the ultimate outcome of the NEPAD intervention
will simply have been to delay the implementation of the original project, and increase the
perceived regulatory risk faced by investors in such infrastructure.
Even if no other projects come on line, however, it is still not clear that the price-regulation
structure envisaged by the protocol is ultimately the best way of handling regulation of the cable.
Ideally, some care should be taken to ensure that the contracts which govern the development
of the cable do not prohibit more than one operator per country, or include other specifically
anti-competitive clauses. Other than this, each country will retain the right to license and regulate
operators in the international bandwidth market, much as South Africa is currently in the process
of examining pricing in wholesale markets via ICASA. The simultaneous regional regulation
envisaged by the protocol may be of use to countries with weak regulatory infrastructures, but
is probably not in the interest of those with a more developed regulator, and has resulted in
damaging delays for the region as a whole.
Recommendation: South Africa already has a process in place to regulate international
bandwidth prices, and the NEPAD protocol is a potentially damaging addition to the existing
regulatory process. The protocol should be adapted to provide greater discretion to regional
operators and regulators. The principle of compulsory equal equity shares for signatory states
should be abandoned, and ownership of the cable should revert to the originally proposed
voluntary private participation model.
South African telecommunications prices
Conclusion
D ESPITE A GREAT deal of activity in the telecommunications market over the past two
years, we find little evidence that the pricing problem has been solved. The pricing results
clearly illustrate that:
business use of telephony in South Africa is far too expensive;•
we continue to have some of the most expensive broadband in the world; and•
Telkom’s ability to charge unjustifiably high prices in international bandwidth markets remains •
unchanged.
The first-best solution to these problems in the medium to long term is the rapid introduction of
competition on infrastructure. The licensing process currently under way is crucial in expanding
the number of operators that may provide infrastructure. However, parallel initiatives in targeting
infrastructure development through SOEs may undermine the process of competition and lower
prices in the long term. This is especially the case if such initiatives result in constraints to the
licensing of private operators that have demonstrated a willingness to invest in infrastructure.
In addition, while pockets of dominance remain, prices will not be constrained and price
regulation becomes an important short-term tool to bring about lower prices. In this regard, small
incremental changes to prices (eg those practised through price cap regulation) are not sufficient.
Rather, a step-wise change in prices is required through cost-based price regulation. ICASA faces a
major task of implementing such cost-based pricing, but has been making encouraging progress
towards this end.
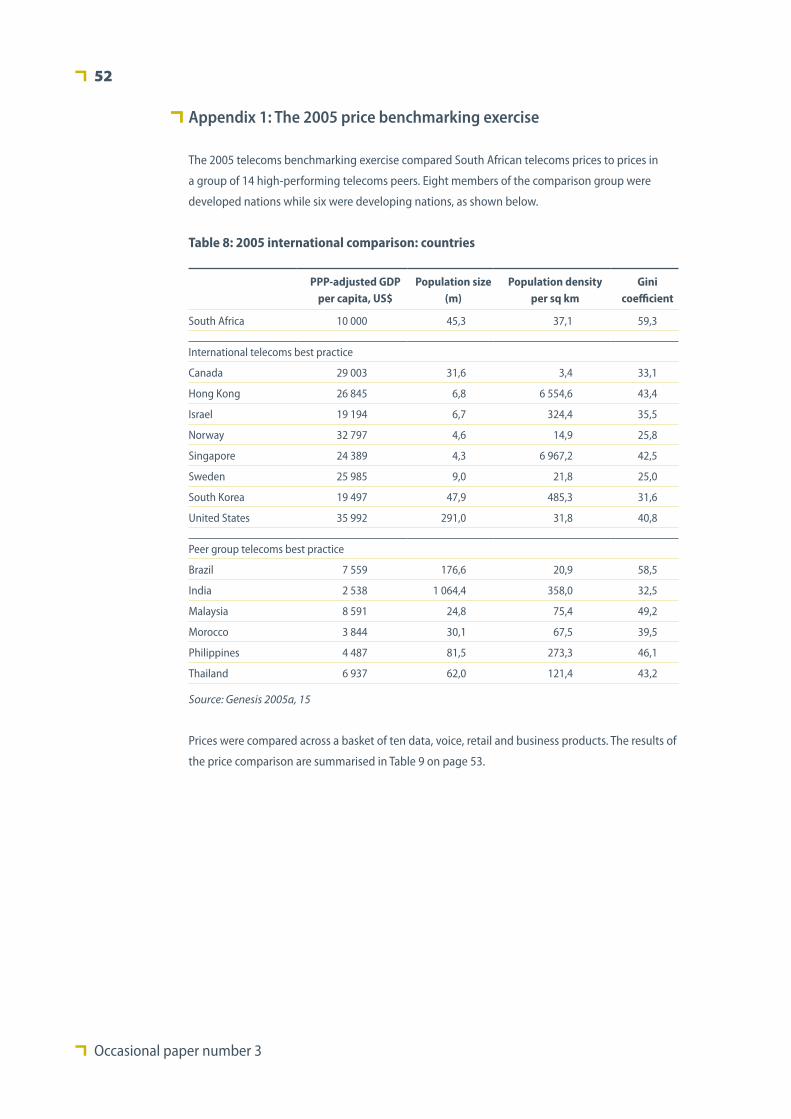
Occasional paper number 3
52
Appendix 1: The 2005 price benchmarking exercise
The 2005 telecoms benchmarking exercise compared South African telecoms prices to prices in
a group of 14 high-performing telecoms peers. Eight members of the comparison group were
developed nations while six were developing nations, as shown below.
PPP-adjusted GDP per capita, US$
Population size (m)
Population density per sq km
Gini coefficient
South Africa 10 000 45,3 37,1 59,3
International telecoms best practice
Canada 29 003 31,6 3,4 33,1
Hong Kong 26 845 6,8 6 554,6 43,4
Israel 19 194 6,7 324,4 35,5
Norway 32 797 4,6 14,9 25,8
Singapore 24 389 4,3 6 967,2 42,5
Sweden 25 985 9,0 21,8 25,0
South Korea 19 497 47,9 485,3 31,6
United States 35 992 291,0 31,8 40,8
Peer group telecoms best practice
Brazil 7 559 176,6 20,9 58,5
India 2 538 1 064,4 358,0 32,5
Malaysia 8 591 24,8 75,4 49,2
Morocco 3 844 30,1 67,5 39,5
Philippines 4 487 81,5 273,3 46,1
Thailand 6 937 62,0 121,4 43,2
Source: Genesis 2005a, 15
Prices were compared across a basket of ten data, voice, retail and business products. The results of
the price comparison are summarised in Table 9 on page 53.
Table 8: 2005 international comparison: countries
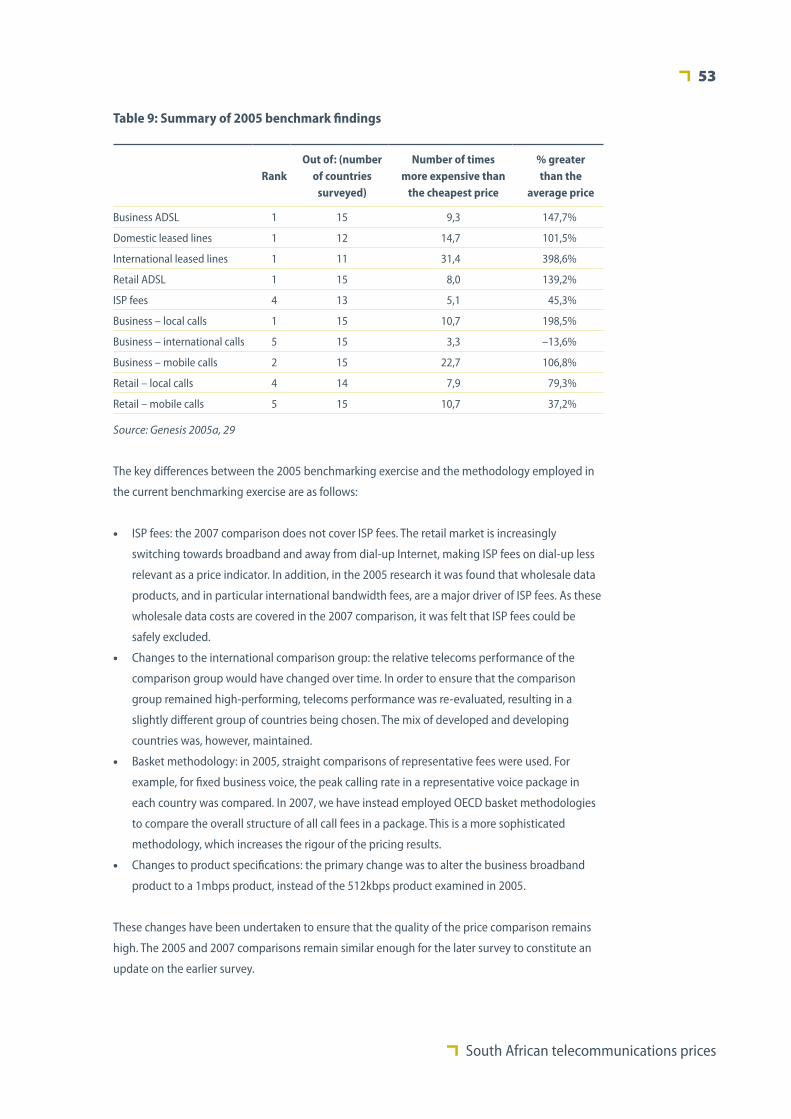
South African telecommunications prices
53
Table 9: Summary of 2005 benchmark findings
RankOut of: (number
of countries surveyed)
Number of times more expensive than
the cheapest price
% greater than the
average price
Business ADSL 1 15 9,3 147,7%
Domestic leased lines 1 12 14,7 101,5%
International leased lines 1 11 31,4 398,6%
Retail ADSL 1 15 8,0 139,2%
ISP fees 4 13 5,1 45,3%
Business – local calls 1 15 10,7 198,5%
Business – international calls 5 15 3,3 –13,6%
Business – mobile calls 2 15 22,7 106,8%
Retail – local calls 4 14 7,9 79,3%
Retail – mobile calls 5 15 10,7 37,2%
Source: Genesis 2005a, 29
The key differences between the 2005 benchmarking exercise and the methodology employed in
the current benchmarking exercise are as follows:
ISP fees: the 2007 comparison does not cover ISP fees. The retail market is increasingly •
switching towards broadband and away from dial-up Internet, making ISP fees on dial-up less
relevant as a price indicator. In addition, in the 2005 research it was found that wholesale data
products, and in particular international bandwidth fees, are a major driver of ISP fees. As these
wholesale data costs are covered in the 2007 comparison, it was felt that ISP fees could be
safely excluded.
Changes to the international comparison group: the relative telecoms performance of the •
comparison group would have changed over time. In order to ensure that the comparison
group remained high-performing, telecoms performance was re-evaluated, resulting in a
slightly different group of countries being chosen. The mix of developed and developing
countries was, however, maintained.
Basket methodology: in 2005, straight comparisons of representative fees were used. For •
example, for fixed business voice, the peak calling rate in a representative voice package in
each country was compared. In 2007, we have instead employed OECD basket methodologies
to compare the overall structure of all call fees in a package. This is a more sophisticated
methodology, which increases the rigour of the pricing results.
Changes to product specifications: the primary change was to alter the business broadband •
product to a 1mbps product, instead of the 512kbps product examined in 2005.
These changes have been undertaken to ensure that the quality of the price comparison remains
high. The 2005 and 2007 comparisons remain similar enough for the later survey to constitute an
update on the earlier survey.

Occasional paper number 3
54
Appendix 2: Efficiency in state-owned enterprises
The issue of whether developmental states should play a larger role in economic growth is of some
importance to the current South African policy debate. The use of SOEs as instruments of economic
and social policy is of particular importance. Although this use probably does extend the economic
power of the state, it also carries substantial costs for economic growth, as the SOE sector is likely
to be systematically less efficient than the private sector.
The difference between efficiency levels in state and private-sector firms arises from a number of
factors, as follows:
Conflicting objectives: while private-sector firms are usually only required to maximise profits, •
SOEs are typically asked to maximise a range of potentially conflicting social and business
objectives. This substantially complicates the SOE manager’s job, and if no guidance is given on
how to reconcile conflicting objectives, effective decision-making may be extremely difficult.
Changing objectives: as political opinions change, the instructions an SOE manager receives •
will often also change. Such changes are frequently disruptive to internal business efficiency.
Double agency problem: many businesses are not managed by their owners. In such •
businesses, the owner must find ways of ensuring that the manager (that is, the agent) acts
in ways that are consistent with the owner’s interests, rather than, for example, the agent’s
preference for an easy life. In publicly owned firms, the agency problem is doubled: the
owner is the taxpayer, whose interests are represented by government, which then appoints
management. Because the relationships between the owner/principal and management/agent
are much more complex and indirect in the SOE environment, there is much more potential for
a breakdown of the owner’s ability to control management.
An implicit state guarantee: the ultimate commercial discipline for private firms is the •
threat of bankruptcy. However, in public firms, managers may believe that the firm has an
implicit guarantee from the state, and would be bailed out by the taxpayer in the case of an
emergency. This reduces efficiency incentives.
In essence, it is very difficult to provide a rigorous incentive structure for managers at SOEs. Faced
with a wide range of conflicting and rapidly changing objectives, and with little likelihood of
being effectively disciplined by either owners or the market, SOEs often choose a path of passive
resistance. At worst, they may choose simply to serve the interests of their employees.
It should also be borne in mind that state investment can ‘crowd out’ private-sector investment.
If the private sector is willing to invest, and the state chooses to invest instead, a potentially
efficient private investment is crowded out by a probably inefficient public investment. Finally,
state investment is unlikely to be competitively neutral. For example, the implicit state guarantee
discussed above can make funding systematically cheaper for the SOE than for a risky private firm,
thus conferring a form of competitive advantage. The SOE may also have an advantage when
bidding for state tenders, or when negotiating with the regulator. This competitive advantage
may further increase the tendency of the SOE to crowd out private operators, despite the high
probability of low efficiency at the SOE.
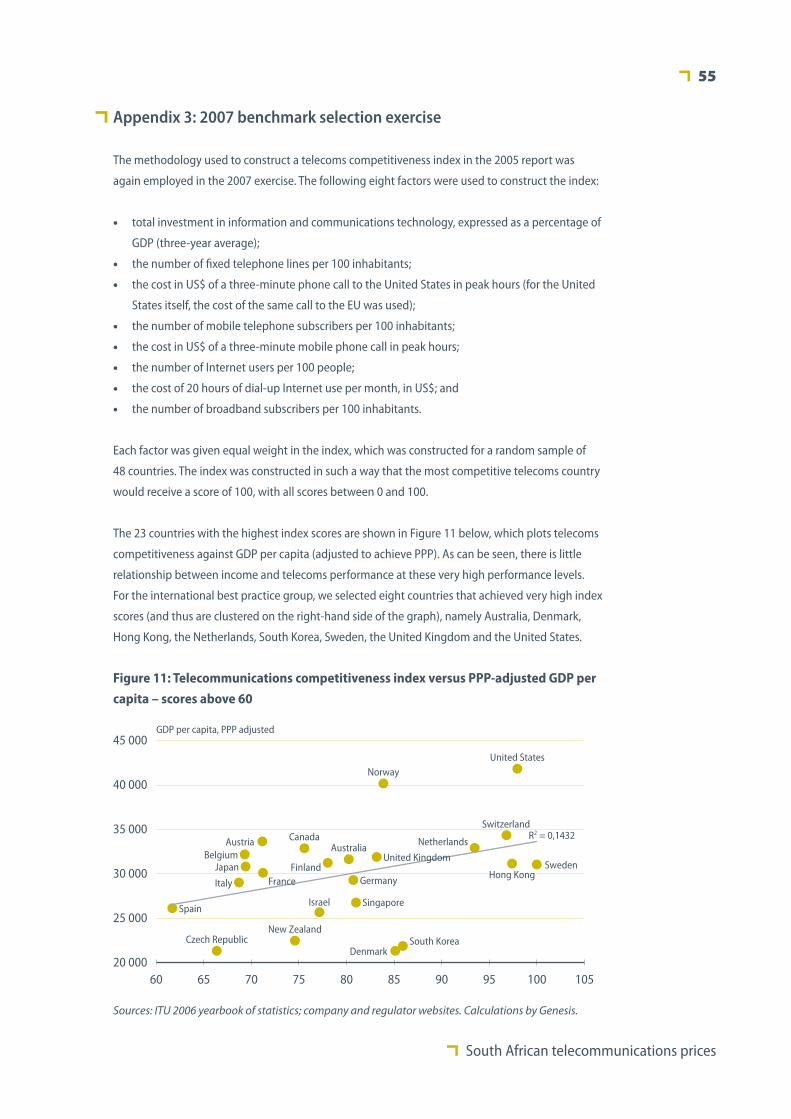
South African telecommunications prices
55
Appendix 3: 2007 benchmark selection exercise
The methodology used to construct a telecoms competitiveness index in the 2005 report was
again employed in the 2007 exercise. The following eight factors were used to construct the index:
total investment in information and communications technology, expressed as a percentage of •
GDP (three-year average);
the number of fixed telephone lines per 100 inhabitants;•
the cost in US$ of a three-minute phone call to the United States in peak hours (for the United •
States itself, the cost of the same call to the EU was used);
the number of mobile telephone subscribers per 100 inhabitants;•
the cost in US$ of a three-minute mobile phone call in peak hours;•
the number of Internet users per 100 people;•
the cost of 20 hours of dial-up Internet use per month, in US$; and•
the number of broadband subscribers per 100 inhabitants.•
Each factor was given equal weight in the index, which was constructed for a random sample of
48 countries. The index was constructed in such a way that the most competitive telecoms country
would receive a score of 100, with all scores between 0 and 100.
The 23 countries with the highest index scores are shown in Figure 11 below, which plots telecoms
competitiveness against GDP per capita (adjusted to achieve PPP). As can be seen, there is little
relationship between income and telecoms performance at these very high performance levels.
For the international best practice group, we selected eight countries that achieved very high index
scores (and thus are clustered on the right-hand side of the graph), namely Australia, Denmark,
Hong Kong, the Netherlands, South Korea, Sweden, the United Kingdom and the United States.
Austria CanadaAustralia
BelgiumJapan
Italy
Spain
Sweden
R2 = 0,1432
Germany
GDP per capita, PPP adjusted
Singapore
South Korea
Finland
Denmark
Israel
Czech RepublicNew Zealand
Norway
Switzerland
Hong Kong
Netherlands
United States
20 000
25 000
30 000
35 000
40 000
45 000
60 65 70 75 80 85 90 95 100 105
France
United Kingdom
Figure 11: Telecommunications competitiveness index versus PPP-adjusted GDP per
capita – scores above 60
Sources: ITU 2006 yearbook of statistics; company and regulator websites. Calculations by Genesis.
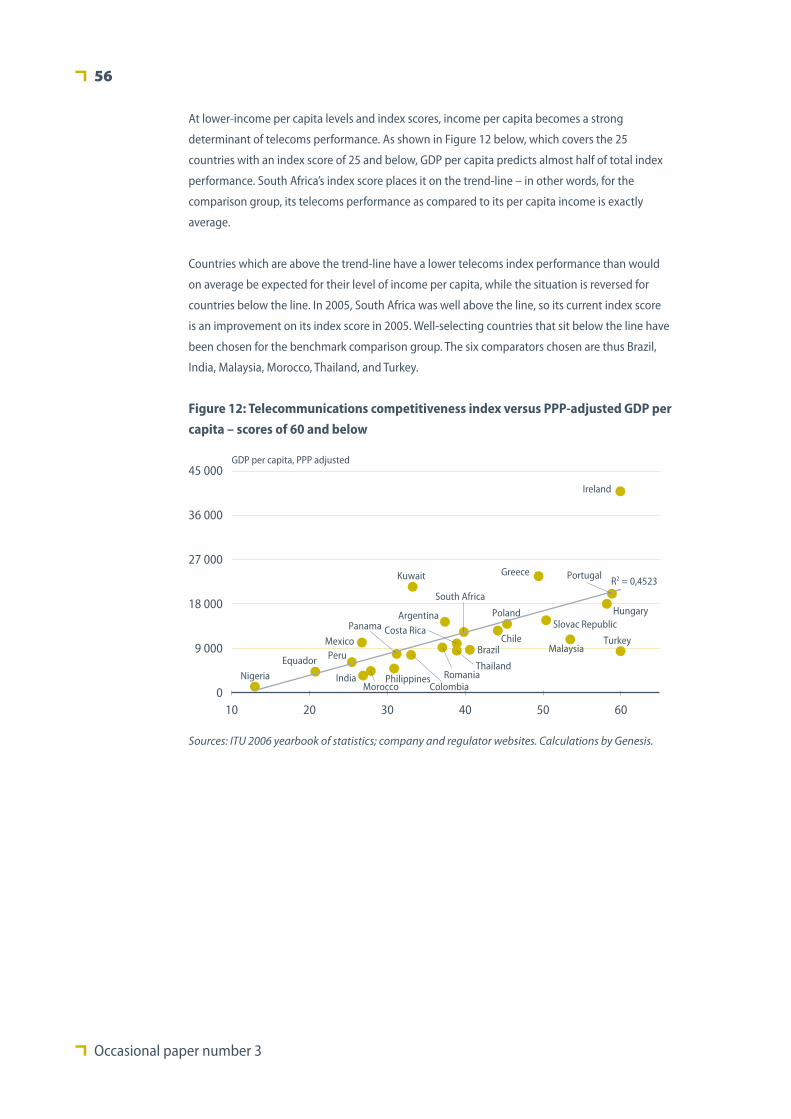
Occasional paper number 3
56
At lower-income per capita levels and index scores, income per capita becomes a strong
determinant of telecoms performance. As shown in Figure 12 below, which covers the 25
countries with an index score of 25 and below, GDP per capita predicts almost half of total index
performance. South Africa’s index score places it on the trend-line – in other words, for the
comparison group, its telecoms performance as compared to its per capita income is exactly
average.
Countries which are above the trend-line have a lower telecoms index performance than would
on average be expected for their level of income per capita, while the situation is reversed for
countries below the line. In 2005, South Africa was well above the line, so its current index score
is an improvement on its index score in 2005. Well-selecting countries that sit below the line have
been chosen for the benchmark comparison group. The six comparators chosen are thus Brazil,
India, Malaysia, Morocco, Thailand, and Turkey.
010 20 30 40 50 60
GDP per capita, PPP adjusted
9 000
18 000
27 000
36 000
45 000
R2 = 0,4523Greece
Ireland
Nigeria
Equador PeruMexico
Panama Costa RicaArgentina
Kuwait
South Africa
Romania
BrazilChile
Slovac Republic
MalaysiaTurkey
Hungary
Portugal
Poland
ThailandIndia
ColombiaPhilippines
Morocco
Figure 12: Telecommunications competitiveness index versus PPP-adjusted GDP per
capita – scores of 60 and below
Sources: ITU 2006 yearbook of statistics; company and regulator websites. Calculations by Genesis.
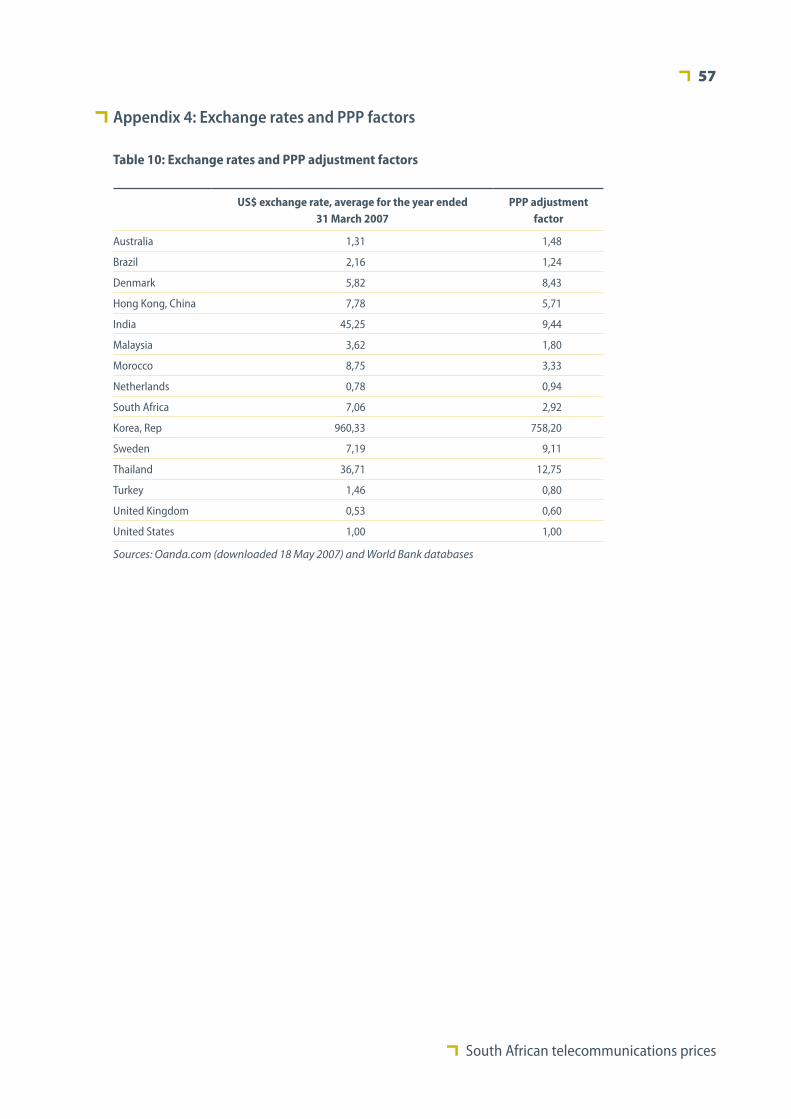
South African telecommunications prices
57
Appendix 4: Exchange rates and PPP factors
Table 10: Exchange rates and PPP adjustment factors
US$ exchange rate, average for the year ended 31 March 2007
PPP adjustment factor
Australia 1,31 1,48
Brazil 2,16 1,24
Denmark 5,82 8,43
Hong Kong, China 7,78 5,71
India 45,25 9,44
Malaysia 3,62 1,80
Morocco 8,75 3,33
Netherlands 0,78 0,94
South Africa 7,06 2,92
Korea, Rep 960,33 758,20
Sweden 7,19 9,11
Thailand 36,71 12,75
Turkey 1,46 0,80
United Kingdom 0,53 0,60
United States 1,00 1,00
Sources: Oanda.com (downloaded 18 May 2007) and World Bank databases
Occasional paper number 3
58
Endnotes
1 The Gini coefficient gives a point estimate of income inequality. The closer the coefficient is to 100, the
more unequally income is distributed in the country concerned.
2 From http://www.eassy.org/aboutus.html, accessed 10 July 2007.
3 See, for example, Gedye 2007.
4 See, for example, Kirui 2007. Sammy Kirui is the chairman of EASSy PMC.
5 Adapted from http://www.info.gov.za/asgisa/asgisa.htm#constraints, accessed 4 July 2007.
6 See endnote 1.
7 Formally, the Telkom BusinessDSL 1024 package has a speed of 1mbps. However, it was introduced on
a speed of 4mbps, during an initial trial period. In the 2007 tariff review, Telkom describes this product
as ‘DSL 4Mbps Access’ – there is thus possibly some uncertainty as to the future speed of this product.
8 As discussed under Selecting the comparison group on page 19, PPP adjustments allow an
evaluation of the relative affordability of the products shown.
9 The basis for the methodology used is laid out in the 2006 Teligen report, ‘Revised OECD price
benchmarking baskets 2006’, which is available from http://www.teligen.com/t_basket.asp. Basket
methodology allows all the components of the cost of telephony to be assessed. Assumptions on
behaviour patterns of the typical consumer are generated, so that the cost of a bundle of calls, SMSs,
and subscription charges can be evaluated.
10 Genesis Analytics has provided research and regulatory recommendations to ICASA on a commercial
basis on a number of occasions, and may bid on such work in future. For example, Genesis was
involved in preparing the discussion document on wholesale telecommunications markets which is
discussed under Unbundle Telkom’s local loop on page 33.
11 The local loop is the physical connection (copper wire) that connects homes and businesses with
the local telephone exchange. The local loop provides the direct link between a telecommunications
provider and its clients.
12 Carrier pre-selection allows customers to choose which service providers they want to use for voice or
data services. The provision of these services is thus not linked to ownership of the local loop.
13 Executive summary of the report available at http://www.engineeringnews.co.za/attachment.php?aa_
id=5236. Full report not available in electronic format at time of writing.
14 Self-provision would allow VANS providers to procure telecommunications infrastructure from any
suppler of such facilities (including themselves).
15 The ministerial determination stated that ‘as of 1 February 2005 value added network services may
also be provided by means of telecommunications facilities other than those provided by Telkom and
the Second National Operator or any of them’. The full text of the ICASA statement can be found at
http://www.Internet.org.za/icasa-media-22112004.html.
16 The statement is available at http://www.doc.gov.za/Media_Icasa_smnt_310105.htm.
17 At http://www.usaasa.org.za/docs/gen/USA%20Impact%20Study%20Report%202005-6.pdf.
18 At http://www.usaasa.org.za/docs/gen/Lisa%20Thornton%20Final%20Report.pdf.
19 http://www.telkom.co.za/athome/services/supremecall/index.html#costs as at 5 June 2007.
20 At http://dave.storm.co.za/files/Gazette_1-29568%2029-1%20ICASA.pdf.
21 Retail minus x regulation is suggested as the preferred form of price regulation for wholesale end-to-
end leased lines, as an exception to the preferred LRIC methodology.
South African telecommunications prices
59
22 Calculated based on the forward-looking economic cost to an efficient provider, and including a
realistic cost of capital. Typically pronounced as ‘lyric’.
23 Contained in Government Gazette 29923, 25 May 2007, at http://www.doc.gov.za/images/Proposed_
Policies_and_Policy_Directions%20ito_the_ECA.pdf.
24 ICASA fee revenues and post-office licence-fee revenues are described as comprising the bulk of the
‘Sales of goods and services produced by department’ line item in the DOC’s departmental receipts.
25 2007 estimates of national expenditure, 519.
26 Infraco still needs to resolve licensing issues before going into operation. If an acceptable means of
expediting licensing is not found, the Infraco process could be substantially delayed, which would
decrease its short-term benefits to the market.
27 From http://www.eassy.org/aboutus.html, accessed 10 July 2007.
28 See, for example, Gedye 2007.
29 See, for example, Kirui 2007.
Occasional paper number 3
60
References
Barradas S. 2007. Infraco – government broadband network operator. Creamer Media’s Engineering News.
18 May. At http://www.engineeringnews.co.za/article.php?a_id=109156.
Business Day. 2007. The last mile. 29 May.
Ensor L, McLachlan T, and Mawson N. 2007. Minister adds four years to Telkom’s monopoly. Business Day.
25 May. At http://www.businessday.co.za/articles/topstories.aspx?ID=BD4A473283.
Esselaar S, Gillwald A, and Stork C. 2006. South African telecommunications sector performance review
2006. LINK Centre public policy research paper 8.
Financial Mail. 2007. Two steps forward. June 1.
Gedye L. 2006. Telkom packages ‘rip off the poor’. Mail & Guardian. 31 July. At http://www.mg.co.za/
personalfinance/articlePage.aspx?articleid=279295&area=/personal_finance/pers_fin_comments/.
– 2007. No easy walk to cable freedom. Mail and Guardian. 23 July.
Genesis Analytics. 2005a. Telecommunications prices in South Africa: an international peer group
comparison. South Africa Foundation occasional paper 1 of 2005.
– 2005b. Reforming telecommunications in South Africa: twelve proposals for lowering costs and
improving access. South Africa Foundation occasional paper 2 of 2005.
Internet Service Providers Association (ISPA). 2007. ISPA reacts angrily to minister’s claims. ISPA press
release. 22 February. At http://www.ispa.org.za/news/press220207.shtml.
Kirui S. 2007. EASSy parties position regarding the NEPAD protocol on broadband infrastructure. EASSy
collective position draft 3(a). 15 March.
Matsepe-Casaburri I. 2007. Minister of Communications, budget vote speech. 24 May. At http://www.pmg.
org.za/briefings/briefings.php?id=342.
Olivier M. 2007. Local loop unbundling should begin early next year – committee chair. Creamer Media’s
Engineering News. 25 May 2007. At http://www.engineeringnews.co.za/article.php?a_id=109845.
Accessed May 2007.
Pressly D. 2007. State company could cut broadband prices sharply. Mail & Guardian. 16 May.
At http://www.mg.co.za/articlepage.aspx?area=/breaking_news/breaking_news__business/
&articleid=308610.
Southwood R. 2007. Outsider east coast fibre project comes in from the cold – Seacom goes public.
Balancing Act 349. April.
Sukazi N. 2002. Icasa chief ushers in new age of openness. Business Report. 8 May. At http://www.busrep.
co.za/index.php?fSectionId=650&fArticleId=117662.
Sunday Times. 2007a. Telkom not the only option in 2008. 25 May. At http://www.sundaytimes.co.za/
News/Article.aspx?id=473785.
– 2007b. Broadband prices to be slashed 65%. 19 August.
Teligen. 2006. Revised OECD price benchmarking baskets 2006. Provisional definitions document. February.
At http://www.teligen.com/t_basket.asp.
Vecchiatto P. 2007. No monopoly extension for Telkom. ITWEB. 25 May. At http://www.itweb.co.za/
sections/telecoms/2007/0705251100.asp?S=IT%20in%20Government&A=ITG&O=FRGN.