Embed Size (px)
Citation preview

South African Peer Bank Analysis - FY20An EY Banking & Capital Markets Benchmark report April 2021

3South African Banks Analysis 3South African Banks Analysis
Looking forward
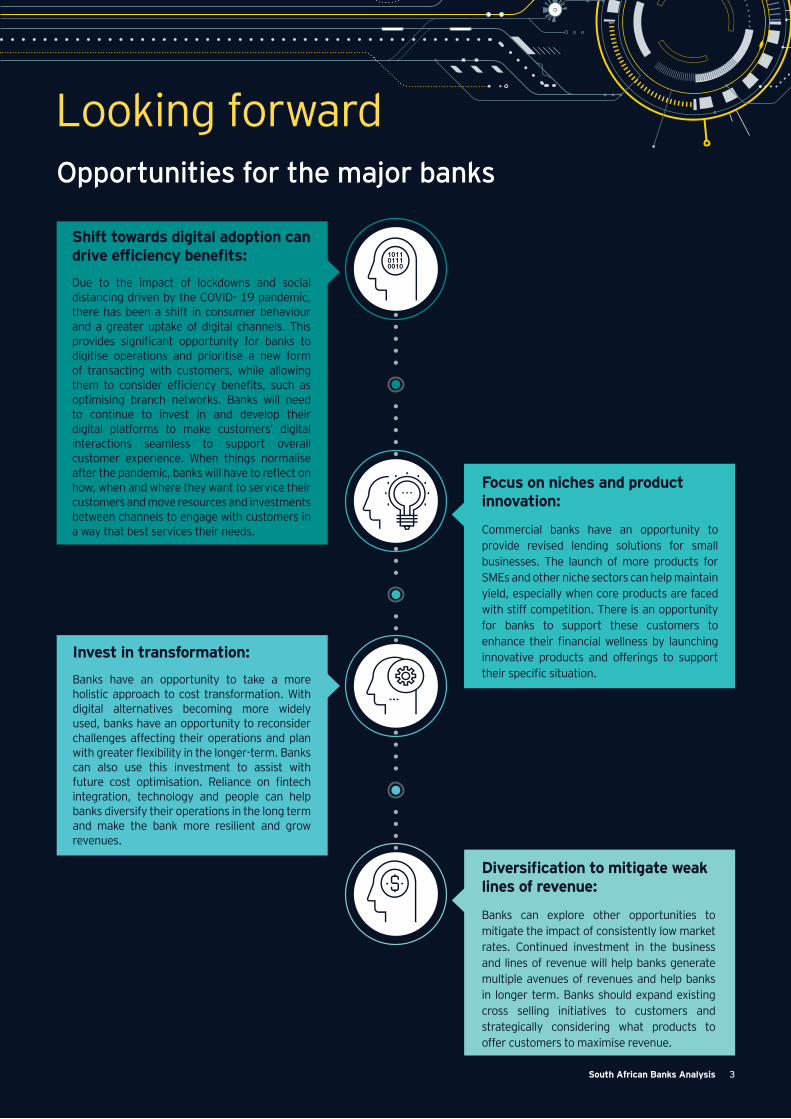
Shift towards digital adoption can drive efficiency benefits:Due to the impact of lockdowns and social distancing driven by the COVID- 19 pandemic, there has been a shift in consumer behaviour and a greater uptake of digital channels. This provides significant opportunity for banks to digitise operations and prioritise a new form of transacting with customers, while allowing them to consider efficiency benefits, such as optimising branch networks. Banks will need to continue to invest in and develop their digital platforms to make customers’ digital interactions seamless to support overall customer experience. When things normalise after the pandemic, banks will have to reflect on how, when and where they want to service their customers and move resources and investments between channels to engage with customers in a way that best services their needs.
Focus on niches and product innovation:
Commercial banks have an opportunity to provide revised lending solutions for small businesses. The launch of more products for SMEs and other niche sectors can help maintain yield, especially when core products are faced with stiff competition. There is an opportunity for banks to support these customers to enhance their financial wellness by launching innovative products and offerings to support their specific situation.
Opportunities for the major banks
Invest in transformation: Banks have an opportunity to take a more holistic approach to cost transformation. With digital alternatives becoming more widely used, banks have an opportunity to reconsider challenges affecting their operations and plan with greater flexibility in the longer-term. Banks can also use this investment to assist with future cost optimisation. Reliance on fintech integration, technology and people can help banks diversify their operations in the long term and make the bank more resilient and grow revenues.
Diversification to mitigate weak lines of revenue:
Banks can explore other opportunities to mitigate the impact of consistently low market rates. Continued investment in the business and lines of revenue will help banks generate multiple avenues of revenues and help banks in longer term. Banks should expand existing cross selling initiatives to customers and strategically considering what products to offer customers to maximise revenue.
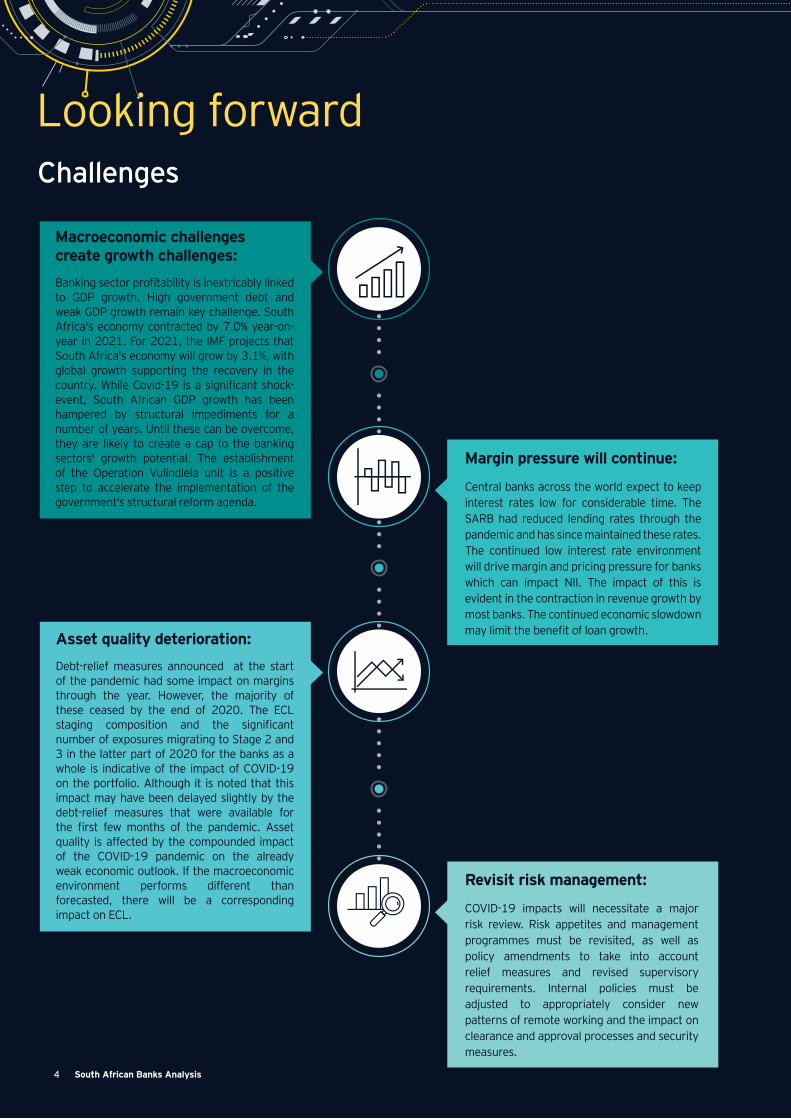
Macroeconomic challenges create growth challenges: Banking sector profitability is inextricably linked to GDP growth. High government debt and weak GDP growth remain key challenge. South Africa's economy contracted by 7.0% year-on-year in 2021. For 2021, the IMF projects that South Africa's economy will grow by 3.1%, with global growth supporting the recovery in the country. While Covid-19 is a significant shock-event, South African GDP growth has been hampered by structural impediments for a number of years. Until these can be overcome, they are likely to create a cap to the banking sectors' growth potential. The establishment of the Operation Vulindlela unit is a positive step to accelerate the implementation of the government's structural reform agenda.
Margin pressure will continue:
Central banks across the world expect to keep interest rates low for considerable time. The SARB had reduced lending rates through the pandemic and has since maintained these rates. The continued low interest rate environment will drive margin and pricing pressure for banks which can impact NII. The impact of this is evident in the contraction in revenue growth by most banks. The continued economic slowdown may limit the benefit of loan growth.Asset quality deterioration:
Debt-relief measures announced at the start of the pandemic had some impact on margins through the year. However, the majority of these ceased by the end of 2020. The ECL staging composition and the significant number of exposures migrating to Stage 2 and 3 in the latter part of 2020 for the banks as a whole is indicative of the impact of COVID-19 on the portfolio. Although it is noted that this impact may have been delayed slightly by the debt-relief measures that were available for the first few months of the pandemic. Asset quality is affected by the compounded impact of the COVID-19 pandemic on the already weak economic outlook. If the macroeconomic environment performs different than forecasted, there will be a corresponding impact on ECL.
Revisit risk management:
COVID-19 impacts will necessitate a major risk review. Risk appetites and management programmes must be revisited, as well as policy amendments to take into account relief measures and revised supervisory requirements. Internal policies must be adjusted to appropriately consider new patterns of remote working and the impact on clearance and approval processes and security measures.
Looking forward Challenges
4 South African Banks Analysis
5South African Banks Analysis
70
80
90
100
110
120
130
2015 2016 2017 2018 2019 2020 2021 2022 2023 2024 2025
Inde
x (2
015=
100)
AverageMining FoodNon-metallic minerals Basic metals & metal products
Transport equipment
Construction
Accommodation & cateringTelecommunications
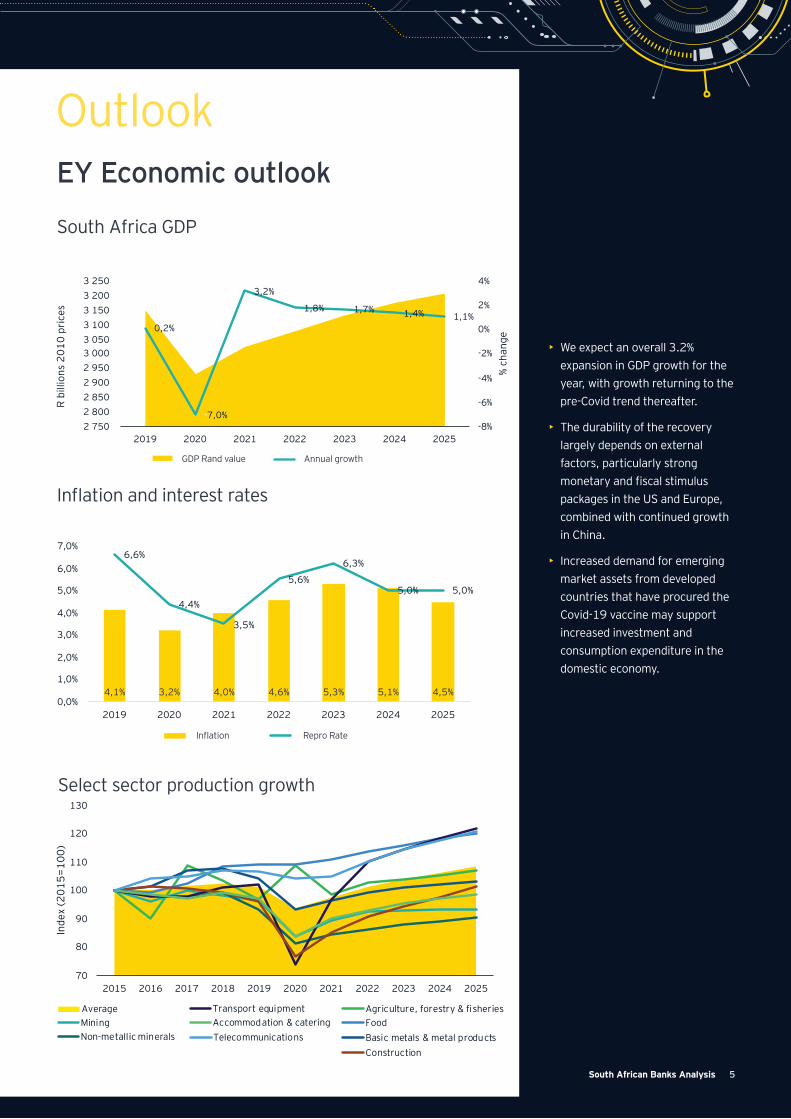
OutlookEY Economic outlook
0,2%
-7,0%
3,2%
1,8% 1,7% 1,4% 1,1%
-8%
-6%
-4%
-2%
0%
2%
4%
2 750 2 800 2 850 2 900 2 950 3 000 3 050 3 100 3 150 3 200 3 250
2019 2020 2021 2022 2023 2024 2025
% ch
ange
R bi
llion
s 20
10 p
rice
s
South Africa GDP
Inflation and interest rates
Select sector production growth
• We expect an overall 3.2% expansion in GDP growth for the year, with growth returning to the pre-Covid trend thereafter.
• The durability of the recovery largely depends on external factors, particularly strong monetary and fiscal stimulus packages in the US and Europe, combined with continued growth in China.
• Increased demand for emerging market assets from developed countries that have procured the Covid-19 vaccine may support increased investment and consumption expenditure in the domestic economy.
4,1% 3,2% 4,0% 4,6% 5,3% 5,1% 4,5%
6,6%
4,4%
3,5%
5,6%
6,3%
5,0% 5,0%
0,0%
1,0%
2,0%
3,0%
4,0%
5,0%
6,0%
7,0%
2019 2020 2021 2022 2023 2024 2025
5South African Banks Analysis
GDP Rand value
Inflation
Annual growth
Repro Rate

6 South African Banks Analysis
3.2% 3.1% 3.4% 4.79%
Continued contraction with expectations of 0.8% growth in FY22
GDP to only recover to 2019 levels by 2024
Increase in GDP growth in FY21 is not likely to maintain
SA recovery is expected to be multi-year and tied to effectiveness of vaccine roll-out
3.3% 3.3%
Repo rate expected to remain same
Repo rate expected to continue increasing in FY22 by 75bps
3.8% 3.9% 4.2% 4.06%
Inflations to increase in FY22 to 4.5%
Inflations to increase in FY22 to 4.2%
Inflation to keep on increasing in FY22 to 4.6%
Forecasted to continue increasing
7.0% 7.25%
Consistent Interest rate is expected to rise in the future (FY22e- 7.5%)
Forecasted to continue increasing
While South African banks’ outlook for GDP improved from 2020 levels, real GDP is expected to recover in 2023
GDP Growth Repo Rate
CPI Inflation Prime Interest Rate
First Rand First Rand
First Rand
Nedbank
Nedbank Nedbank
Standard Bank
Standard Bank Standard Bank
Absa Absa
Absa
FY ’21Outlook
FY ’21Outlook
7South African Banks Analysis
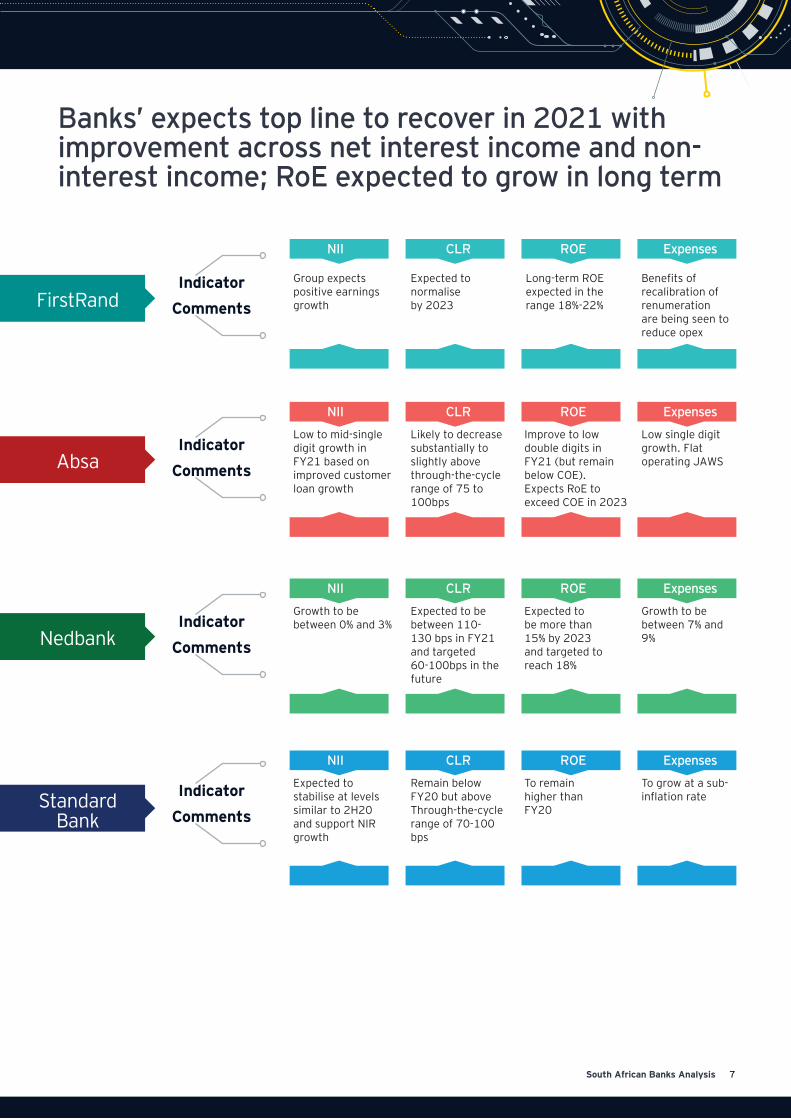
Banks’ expects top line to recover in 2021 with improvement across net interest income and non-interest income; RoE expected to grow in long term
IndicatorComments
IndicatorComments
IndicatorComments
IndicatorComments
NII
NII
NII
NII
ROE
ROE
ROE
ROE
Expenses
Expenses
Expenses
Expenses
CLR
CLR
CLR
CLR
Group expects positive earnings growth
Low to mid-single digit growth in FY21 based on improved customer loan growth
Growth to be between 0% and 3%
Expected to stabilise at levels similar to 2H20 and support NIR growth
Expected to normalise by 2023
Likely to decrease substantially to slightly above through-the-cycle range of 75 to 100bps
Expected to be between 110-130 bps in FY21 and targeted 60-100bps in the future
Remain below FY20 but above Through-the-cycle range of 70-100 bps
Long-term ROE expected in the range 18%-22%
Improve to low double digits in FY21 (but remain below COE). Expects RoE to exceed COE in 2023
Expected to be more than 15% by 2023 and targeted to reach 18%
To remain higher than FY20
Benefits of recalibration of renumeration are being seen to reduce opex
Low single digit growth. Flat operating JAWS
Growth to be between 7% and 9%
To grow at a sub-inflation rate
FirstRand
Absa
Nedbank
Standard Bank
8 South African Banks Analysis
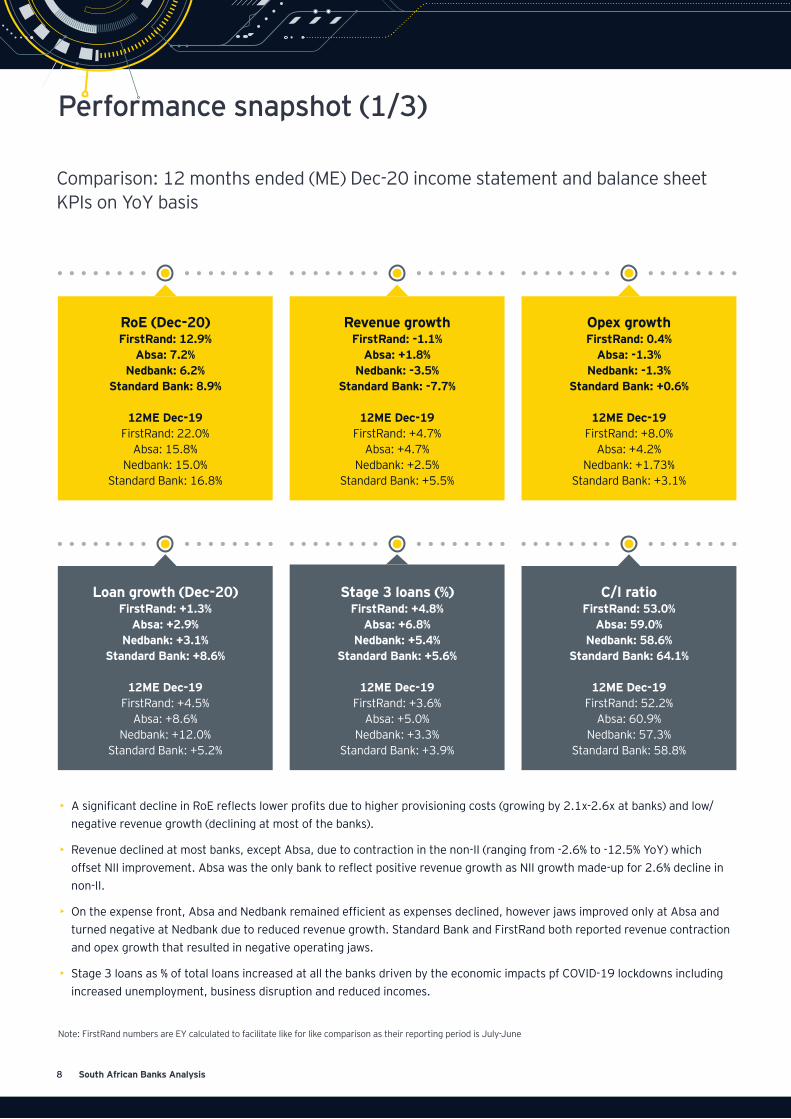
Performance snapshot (1/3)
Comparison: 12 months ended (ME) Dec-20 income statement and balance sheet KPIs on YoY basis
RoE (Dec-20)FirstRand: 12.9%
Absa: 7.2%Nedbank: 6.2%
Standard Bank: 8.9%
12ME Dec-19FirstRand: 22.0%
Absa: 15.8%Nedbank: 15.0%
Standard Bank: 16.8%
Loan growth (Dec-20)FirstRand: +1.3%
Absa: +2.9%Nedbank: +3.1%
Standard Bank: +8.6%
12ME Dec-19FirstRand: +4.5%
Absa: +8.6%Nedbank: +12.0%
Standard Bank: +5.2%
Revenue growthFirstRand: -1.1%
Absa: +1.8%Nedbank: -3.5%
Standard Bank: -7.7%
12ME Dec-19FirstRand: +4.7%
Absa: +4.7%Nedbank: +2.5%
Standard Bank: +5.5%
Stage 3 loans (%)FirstRand: +4.8%
Absa: +6.8%Nedbank: +5.4%
Standard Bank: +5.6%
12ME Dec-19FirstRand: +3.6%
Absa: +5.0%Nedbank: +3.3%
Standard Bank: +3.9%
Opex growthFirstRand: 0.4%
Absa: -1.3%Nedbank: -1.3%
Standard Bank: +0.6%
12ME Dec-19FirstRand: +8.0%
Absa: +4.2%Nedbank: +1.73%
Standard Bank: +3.1%
C/I ratioFirstRand: 53.0%
Absa: 59.0%Nedbank: 58.6%
Standard Bank: 64.1%
12ME Dec-19FirstRand: 52.2%
Absa: 60.9%Nedbank: 57.3%
Standard Bank: 58.8%
• A significant decline in RoE reflects lower profits due to higher provisioning costs (growing by 2.1x-2.6x at banks) and low/negative revenue growth (declining at most of the banks).
• Revenue declined at most banks, except Absa, due to contraction in the non-II (ranging from -2.6% to -12.5% YoY) which offset NII improvement. Absa was the only bank to reflect positive revenue growth as NII growth made-up for 2.6% decline in non-II.
• On the expense front, Absa and Nedbank remained efficient as expenses declined, however jaws improved only at Absa and turned negative at Nedbank due to reduced revenue growth. Standard Bank and FirstRand both reported revenue contraction and opex growth that resulted in negative operating jaws.
• Stage 3 loans as % of total loans increased at all the banks driven by the economic impacts pf COVID-19 lockdowns including increased unemployment, business disruption and reduced incomes.
Note: FirstRand numbers are EY calculated to facilitate like for like comparison as their reporting period is July-June

9South African Banks Analysis
Financial performance snapshot (2/3)
• FirstRand outperforms its competitors in all the financial KPIs when compared against peers.
• RoE has declined across banks with Nedbank posting largest contraction.
• Efficiency ratio deteriorated at all the banks except Absa.
• NIM continues to remain under pressure, declined maximum for Standard Bank.
• Loans to deposit (L/D) ratio declined at all the banks on the back of robust FY20 deposits growth recorded across banks as customers and business built their balance sheet in a time of increased uncertainty. In addition, by year-end significant drawdowns of corporate facilities were paid back.
• NPL deteriorated at all the banks.
• FirstRand remains well capitalized compared to peers. CET1 declined at all the banks but remained stable for FirstRand.
Return on Average Equity (RoAE)
FY19 results
FY19 results
Loan-to-deposit ratio
CIR ratio
NPL ratio (Stage 3 Loans / Gross Loans)
Net interest margin
Common Equity Tier 1 (CET1) ratio
12,7%
7,2%6,2%
8,9%
53,0%59,0% 58,6% 64,1%
81,9%102,3%
91,0% 87,5%4,8%
6,8%
5,4% 5,6%
12,4%
11,2%10,9%
12,1%
5,6%
4,2%3,4% 3,7%
20.7% 15.8% 15.0% 16.8% 52.2% 60.9% 57.3% 58.8% 5.7% 4.5% 3.5% 4.3%
87.5% 114.6% 93.1% 91.8% 3.6% 5.0% 3.3% 3.9% 12.4% 12.1% 11.5% 14.0%
-
Standard Bank
Standard Bank
Standard Bank
Standard Bank
Standard Bank
Standard Bank
Nedbank
Nedbank
Nedbank
Nedbank
Nedbank
Nedbank
Absa
Absa
Absa
Absa
Absa
Absa
FirstRand
FirstRand
FirstRand
FirstRand
FirstRand
FirstRand

10 South African Banks Analysis
Financial performance snapshot (3/3)
• Only Absa in the peer set recorded positive revenue growth driven by strong NII partly offset by reduced non-II.
• Poor non-II weighed at all the banks resulting in revenue contraction at FirstRand, Nedbank and Standard Bank.
• Standard Bank, the largest bank by revenue saw the largest decline in non-interest income driven by poor investment management segment that declined 36% YoY.
• Loans grew at a subdued rate for FirstRand due to its cautious lending approach compared to peers where healthy loan growth was recorded. Loan growth was supported by Covid-19 relief loans, without which credit growth would have been flat or negative during 2020 across banks.
• Covid-19 lockdown has accelerated customer savings and hence deposits grew at all the banks with Standard Bank and Absa recording a double digit growth of 14.0% and 15.2%, respectively.
Revenues (in ZAR billion)
YoY growth (%)
YoY growth (%)
Loans (in ZAR billion)
Net interest income (in ZAR billion)
Deposits (in ZAR billion)
Non interest income (in ZAR billion)
RWAs (in ZAR billion)
Standard Bank
Standard Bank
Standard Bank
Standard Bank
Standard Bank
Standard Bank
Nedbank
Nedbank
Nedbank
Nedbank
Nedbank
Nedbank
Absa
Absa
Absa
Absa
Absa
Absa
FirstRand
FirstRand
FirstRand
FirstRand
FirstRand
FirstRand
1556,9
951,9 953,7
1510,2
105,3
81,6
54,2
123,663,3
48,9
30,1
61,4
1 275,5
973,6 868,1
13 21,2 1 080,7915,1
674,0
12 29,5
42,032,7
24,1
62,2
-1.1% +1.8% -3.5% -7.7% +2.3% +5.1% -0.3% -2.4% -5.9% -2.6% -7.1% -12.5%
+1.3% +2.9% +3.1% +8.6% +8.2% +15.2% +5.5% +14.0% +5.5% +5.2% +7.2% +11.8%

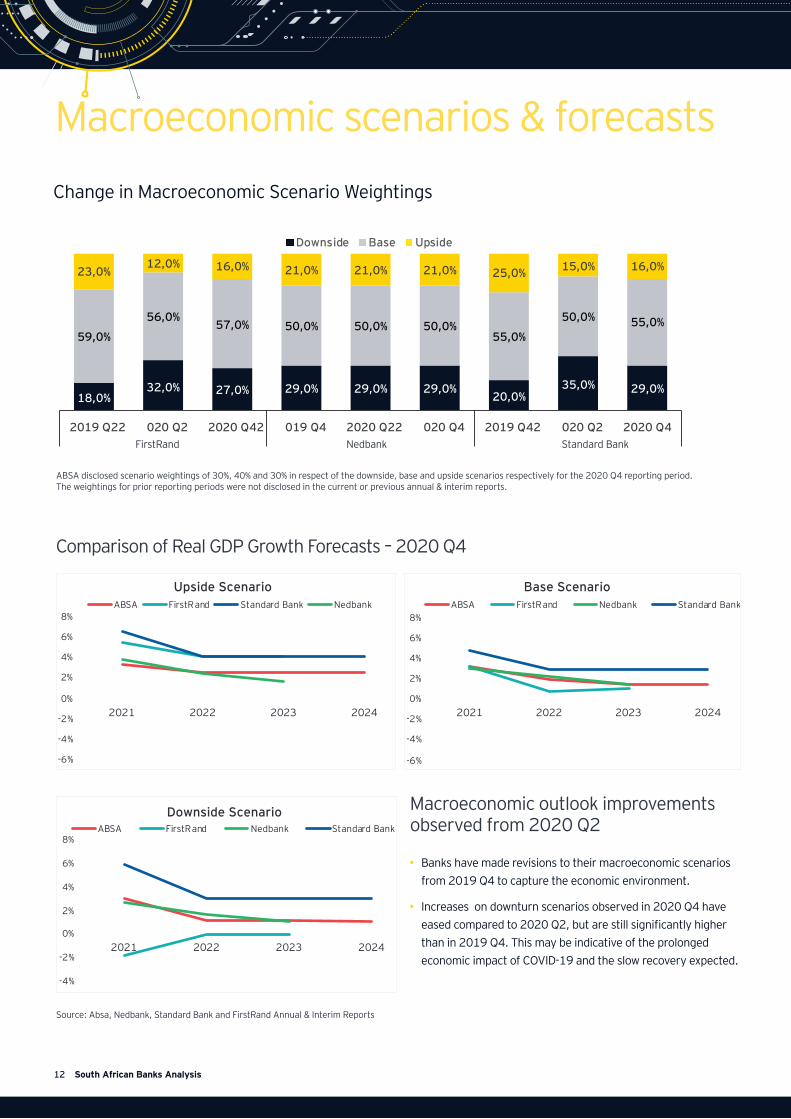
ABSA disclosed scenario weightings of 30%, 40% and 30% in respect of the downside, base and upside scenarios respectively for the 2020 Q4 reporting period. The weightings for prior reporting periods were not disclosed in the current or previous annual & interim reports.
Source: Absa, Nedbank, Standard Bank and FirstRand Annual & Interim Reports
12 South African Banks Analysis
Macroeconomic scenarios & forecastsChange in Macroeconomic Scenario Weightings
18,0%32,0% 27,0% 29,0% 29,0% 29,0%
20,0%35,0% 29,0%
59,0%
56,0%57,0% 50,0% 50,0% 50,0%
55,0%
50,0% 55,0%
23,0%12,0% 16,0% 21,0% 21,0% 21,0% 25,0% 15,0% 16,0%
2019 Q22 020 Q2 2020 Q42 019 Q4 2020 Q22 020 Q4 2019 Q42 020 Q2 2020 Q4
Downside Base Upside
Standard BankNedbankFirstRand
• Banks have made revisions to their macroeconomic scenarios from 2019 Q4 to capture the economic environment.
• Increases on downturn scenarios observed in 2020 Q4 have eased compared to 2020 Q2, but are still significantly higher than in 2019 Q4. This may be indicative of the prolonged economic impact of COVID-19 and the slow recovery expected.
Comparison of Real GDP Growth Forecasts – 2020 Q4
Macroeconomic outlook improvements observed from 2020 Q2
-6%
-4%
-2%
0%
2%
4%
6%
8%
2021 2022 2023 2024
Upside Scenario ABSA FirstRand Standard Bank Nedbank
-6%
-4%
-2%
0%
2%
4%
6%
8%
2021 2022 2023 2024
Base ScenarioABSA FirstRand Nedbank Standard Bank
-4%
-2%
0%
2%
4%
6%
8%
2021 2022 2023 2024
Downside ScenarioABSA FirstRand Nedbank Standard Bank
13South African Banks Analysis
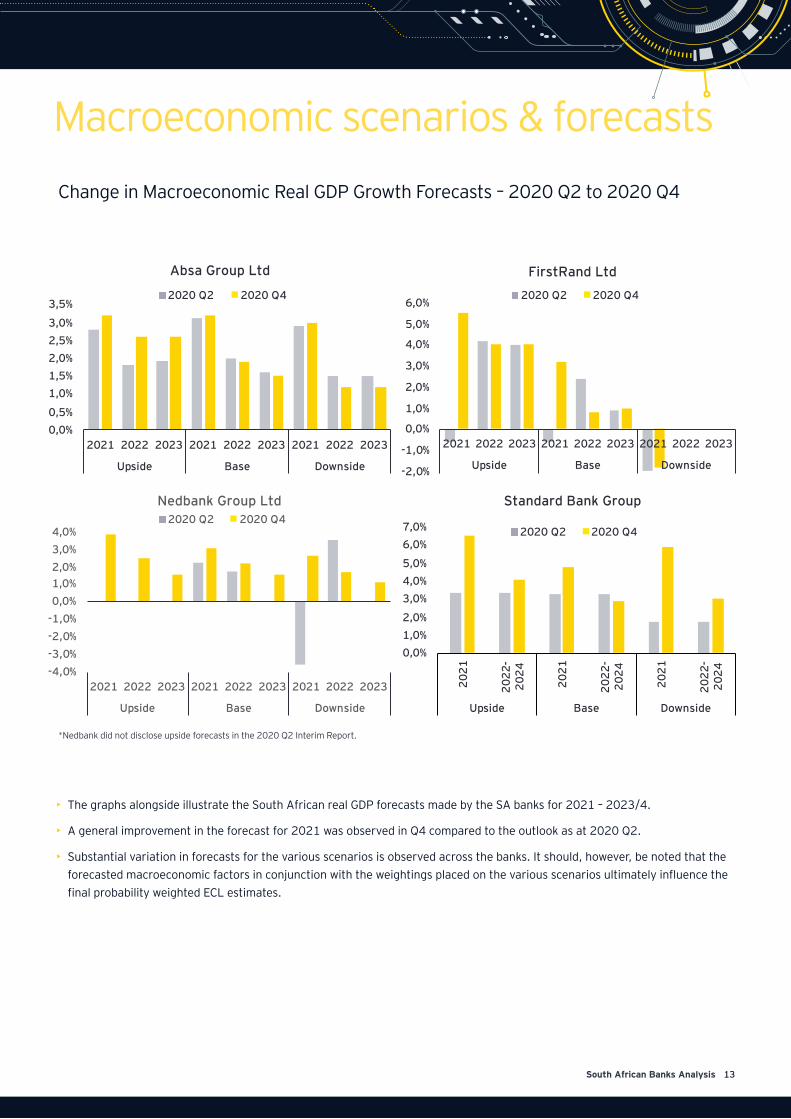
• The graphs alongside illustrate the South African real GDP forecasts made by the SA banks for 2021 – 2023/4.
• A general improvement in the forecast for 2021 was observed in Q4 compared to the outlook as at 2020 Q2.
• Substantial variation in forecasts for the various scenarios is observed across the banks. It should, however, be noted that the forecasted macroeconomic factors in conjunction with the weightings placed on the various scenarios ultimately influence the final probability weighted ECL estimates.
*Nedbank did not disclose upside forecasts in the 2020 Q2 Interim Report.
Macroeconomic scenarios & forecasts Macroeconomic scenarios & forecastsChange in Macroeconomic Real GDP Growth Forecasts – 2020 Q2 to 2020 Q4
0,0%0,5%
1,0%1,5%2,0%2,5%3,0%
3,5%
2021 2022 2023 2021 2022 2023 2021 2022 2023
Upside Base Downside
Absa Group Ltd
2020 Q2 2020 Q4
-2,0%
-1,0%
0,0%
1,0%
2,0%
3,0%
4,0%
5,0%
6,0%
2021 2022 2023 2021 2022 2023 2021 2022 2023
Upside Base Downside
FirstRand Ltd
2020 Q2 2020 Q4
0,0%1,0%2,0%
3,0%4,0%5,0%
6,0%7,0%
2021
2022
-20
24
2021
2022
-20
24
2021
2022
-20
24Upside Base Downside
Standard Bank Group
2020 Q2 2020 Q4
-4,0%-3,0%-2,0%-1,0%0,0%1,0%2,0%3,0%4,0%
2021 2022 2023 2021 2022 2023 2021 2022 2023
Upside Base Downside
Nedbank Group Ltd2020 Q2 2020 Q4
14 South African Banks Analysis
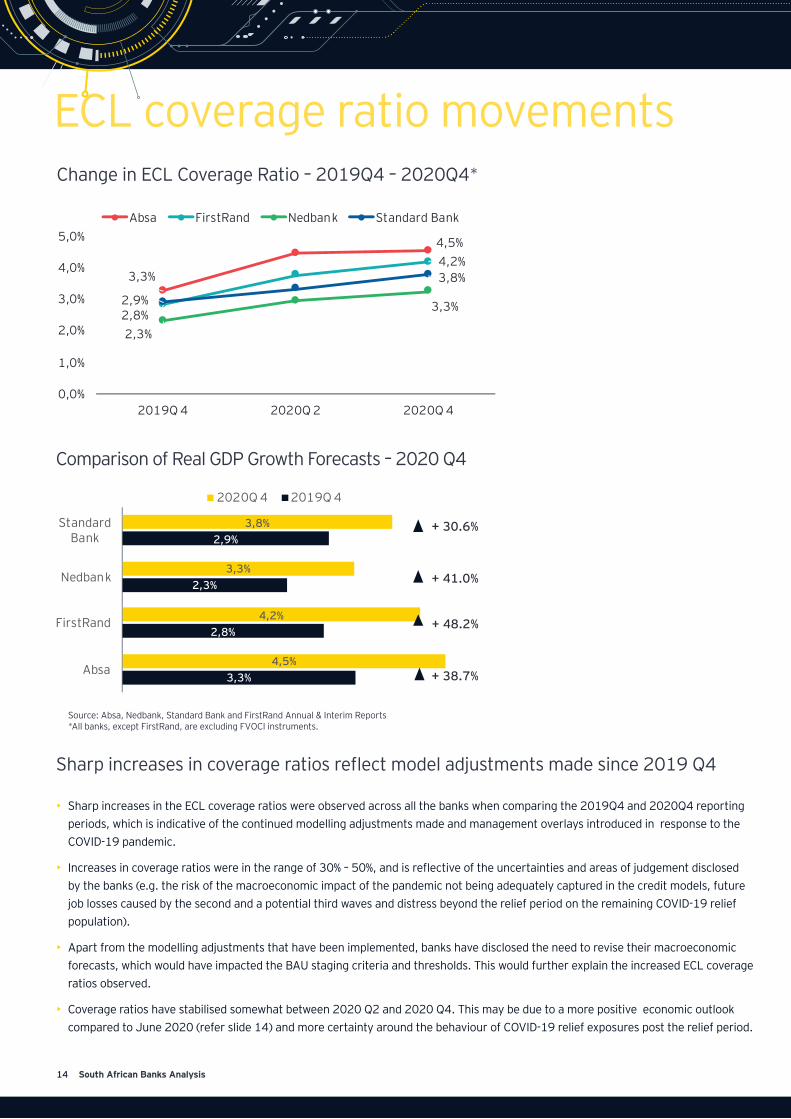
Change in ECL Coverage Ratio – 2019Q4 – 2020Q4*
Sharp increases in coverage ratios reflect model adjustments made since 2019 Q4
• Sharp increases in the ECL coverage ratios were observed across all the banks when comparing the 2019Q4 and 2020Q4 reporting periods, which is indicative of the continued modelling adjustments made and management overlays introduced in response to the COVID-19 pandemic.
• Increases in coverage ratios were in the range of 30% – 50%, and is reflective of the uncertainties and areas of judgement disclosed by the banks (e.g. the risk of the macroeconomic impact of the pandemic not being adequately captured in the credit models, future job losses caused by the second and a potential third waves and distress beyond the relief period on the remaining COVID-19 relief population).
• Apart from the modelling adjustments that have been implemented, banks have disclosed the need to revise their macroeconomic forecasts, which would have impacted the BAU staging criteria and thresholds. This would further explain the increased ECL coverage ratios observed.
• Coverage ratios have stabilised somewhat between 2020 Q2 and 2020 Q4. This may be due to a more positive economic outlook compared to June 2020 (refer slide 14) and more certainty around the behaviour of COVID-19 relief exposures post the relief period.
Source: Absa, Nedbank, Standard Bank and FirstRand Annual & Interim Reports*All banks, except FirstRand, are excluding FVOCI instruments.
3,3%
4,5%
2,8%
4,2%
2,3%
3,3%2,9%
3,8%
0,0%
1,0%
2,0%
3,0%
4,0%
5,0%
2019Q 4 2020Q 2 2020Q 4
Absa FirstRand Nedbank Standard Bank
ECL coverage ratio movements
3,3%
2,8%
2,3%
2,9%
4,5%
4,2%
3,3%
3,8%
Absa
FirstRand
Nedbank
StandardBank
2020Q 4 2019Q 4
+ 30.6%Sh
+ 41.0%Sh
+ 48.2%Sh
+ 38.7%Sh
Comparison of Real GDP Growth Forecasts – 2020 Q4

15South African Banks Analysis
Change in Stage 1 ECL Coverage Ratio – 2019Q4 – 2020Q4*
Change in Stage 2 ECL Coverage Ratio – 2019Q4 – 2020Q4*
Change in Stage 3 ECL Coverage Ratio – 2019Q4 – 2020Q4*
• Continued increases in Stage 1 coverage ratios have been observed from 2019 Q4 to 2020 Q4.
• Most notably, decreases in Stage 3 coverage ratios have largely been observed in the market from 2019 Q4. This may be due to the substantial increase in the Stage 2 and Stage 3 population observed from 2019Q4.
• Continued economic stress may have resulted in “better” customers rolling into Stage 2 and subsequently Stage 3, placing downwards pressure on the overall coverage ratios in these stages.
Source: Absa, Nedbank, Standard Bank and FirstRand Annual & Interim Reports. *All banks, except FirstRand, are excluding Fair Value measurements
ECL coverage ratio movements
0,5%
0,9%0,7%
1,1%
0,5%
0,7%
0,5%
0,6%
0,0%
0,2%
0,4%
0,6%
0,8%
1,0%
1,2%
2019Q 4 2020Q 2 2020Q 4
Absa FirstRand Nedbank Standard Bank
6,4%7,1%
9,8%
11,7%
5,3% 6,6%
8,4%8,4%
0,0%
2,0%4,0%6,0%
8,0%10,0%12,0%14,0%
2019Q 4 2020Q 2 2020Q 4
Absa FirstRand Nedbank Standard Bank
43,7%42,5%44,0%45,7%
38,0%31,5%
48,2%46,1%
0,0%
10,0%
20,0%
30,0%
40,0%
50,0%
60,0%
2019Q 4 2020Q 2 2020Q 4
Absa FirstRand Nedbank Standard Bank
Stage 2 & 3 coverage ratios have been impacted by changes in portfolio distributions
(by Stage)

16 South African Banks Analysis

17South African Banks Analysis
Source: Absa, Nedbank, Standard Bank and FirstRand Annual & Interim Reports
0
1 000
2 000
3 000
4 000
5 000
6 000
Mill
ions
Management OverlaysIFRS 9 ECL Management Overlays – 2020 Q4
Change in Management Overlays – 2020 Q2 to 2020 Q4)
12,8%13,7%
1,1%
12,3%
15,7%
1,0%
0%
2%
4%
6%
8%
10%
12%
14%
16%
18%
% of
Tot
al E
CL
Pro
visi
on
2020 Q2 2020 Q4
• Management overlays and out of model adjustments have remained prevalent in 2020 Q4 due to continued uncertainty. Banks have also faced numerous challenges impacting their ability to redevelop IFRS 9 ECL models (time and resource constraints, distortions of credit risk data by COVID-19 relief, breakdown of historical relationships with key macroeconomic variables).
• Differences in classifications of management adjustments may also have affected disclosures. For example, Standard Bank and FirstRand have disclosed the central overlay raised in respect of the COVID-19 impact, whereas Absa and Nedbank have disclosed both out-of-model adjustments and business unit and central overlays raised.
Management overlays indicative of continued shortcomings in credit risk models
Standard BankNedbankAbsa FirstRand
Standard BankNedbankAbsa

18 South African Banks Analysis
Source: Absa, Nedbank, Standard Bank and FirstRand Annual & Interim Reports
Total COVID-19 Relief granted over the period as at 2020 Q4
Wholesale exposures to high-risk sectors as disclosed by the banks - 2020 Q4
COVID-19
22,45%
16,04%
13,22%11,68%
% of
Tot
al G
LAA
Property 8,4%
Aviation 0,2%
Construction 3,0%
Hospitality 2,0%
Automotive & Transport
0,3% Retail (non-food)
2,0%
Healthcare 0,4% Healthcare
0,4%Oil & Gas 0,5%
SOEs/Municipalities
7,0%
Hospitality 1,1%
Construction 1,5%
Retail (non-food)
3,1%
Manufacturing 4,5% Aviation
1,0% Automotive & Transport
2,0%
Standard BankNedbankAbsa FirstRand
Absa Nedbank
19South African Banks Analysis
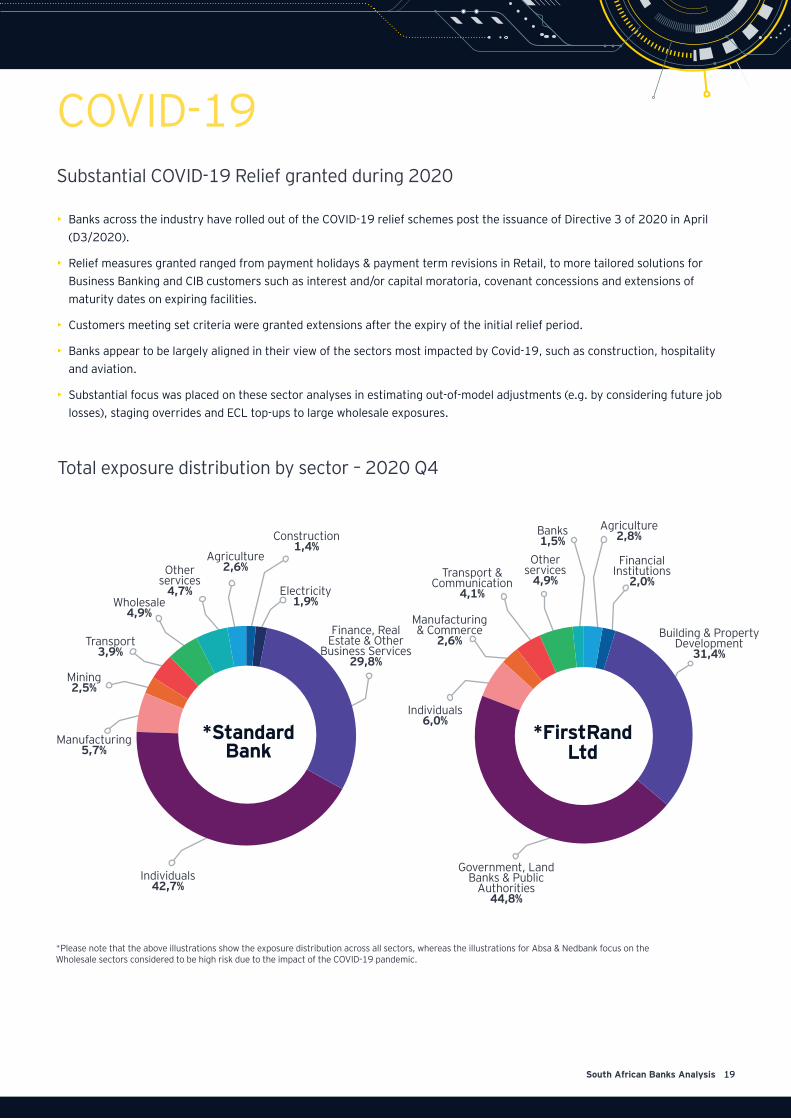
Substantial COVID-19 Relief granted during 2020
• Banks across the industry have rolled out of the COVID-19 relief schemes post the issuance of Directive 3 of 2020 in April (D3/2020).
• Relief measures granted ranged from payment holidays & payment term revisions in Retail, to more tailored solutions for Business Banking and CIB customers such as interest and/or capital moratoria, covenant concessions and extensions of maturity dates on expiring facilities.
• Customers meeting set criteria were granted extensions after the expiry of the initial relief period.
• Banks appear to be largely aligned in their view of the sectors most impacted by Covid-19, such as construction, hospitality and aviation.
• Substantial focus was placed on these sector analyses in estimating out-of-model adjustments (e.g. by considering future job losses), staging overrides and ECL top-ups to large wholesale exposures.
*Please note that the above illustrations show the exposure distribution across all sectors, whereas the illustrations for Absa & Nedbank focus on the Wholesale sectors considered to be high risk due to the impact of the COVID-19 pandemic.
Total exposure distribution by sector – 2020 Q4
Finance, Real Estate & Other
Business Services 29,8%
Electricity 1,9%
Building & Property Development
31,4%
Construction 1,4%
Financial Institutions
2,0%
Agriculture 2,8%Banks
1,5%Agriculture
2,6% Other services
4,9%Transport &
Communication 4,1%
Manufacturing & Commerce
2,6%
Other services
4,7%
Individuals 6,0%
Wholesale 4,9%
Transport 3,9%
Mining 2,5%
Manufacturing 5,7%
Individuals 42,7%
Government, Land Banks & Public
Authorities 44,8%
COVID-19
*Standard Bank
*FirstRand Ltd

20 South African Banks Analysis
Standard BankNedbankAbsaFirstRand
Dec -20 Internal target Change from Dec-19 Surplus compared to requirement
FirstRand 11.0-12.0% 0bps +4.7%
Absa 11.0-12.5% -90bps +3.7%Nedbank 10.0-12.0% -60bps +3.4%Standard Bank 10.0-11.5% -70bps +5.3%
Banks remained well capitalized with CET1 ratio well above the minimum requirement laid by SARB; Standard Bank and FirstRand has enough buffer over CET1 requirement
• CET1 ratio declined at the banks from December 2019 but remained sufficiently above the minimum SARB requirement of 7.5-8.5%. The decrease in CET1 ratio was largely a function of:
• COVID-19 impact on earnings
• Increase in RWAs mainly from credit, counterparty credit and market risk driven by rand depreciation in 1H20
• Nedbank CET1 ratio declined by 60bps to 10.9% and was in the middle of the bank’s internal target (10.0-12.0%).
• Absa’s CET 1 ratio (11,2%) has declined the most by 90bps and remained in the lower range of the bank’s internal target (11,0-12,5%).
• Standard Bank has the highest CET 1 ratio (13,3%) followed by FirstRand (12,4%). This Is above the high end of the banks’s internal targets of (10,0-11,5%) and (11,0-12,0%) respectively.
• We expect that the Prudential Authority is placing a lot of focus on the capital positions of banks since the start of lockdown and continues to monitor the capital ratios closely.
1 081
915
674
1 229
12,4%
11,2% 10,9%
13,3%
8,5%
7,5% 7,5%8,0%
%0,6
%0,8
%0,01
%0,21
%0,41
002
005
008
001 1
004 1
RWA's CET1 ratio SARB's minimum requirement
+6.0% +36.3% +11.4 +13.7%
RWAs (ZAR billion) and CET1 ratio – as of Dec-20
CET1 internal target by banks, and buffer against minimum requirements
Capital
YoY growth (%)

21South African Banks Analysis

Interested in further reading? Have a look at these:
Three ways COVID-19 is changing how banks adapt to digital technology:
Three ways COVID-19 is changing how banks adapt to digital technology (ey.com)
What can banks do to reimagine their operating model:
How banks can reframe a crisis into an operational opportunity (ey.com)
Concluding remarksWhile the COVID-19 pandemic has had a significant impact, it has brought on some key opportunities for banks.
Banks should carefully consider macroeconomic changes and their impact on the banks own provisioning and profit. Predictions of the macroeconomic environment may significantly change ECL if different to what actually transpires.
While margin pressure will continue, banks have an opportunity to consider new streams of growth. The pandemic has served as a catalyst for digital adoption and banks should leverage this to better serve their customers. Such a shift also gives banks an opportunity to transform their businesses and focus on cost optimisation and efficiency.
Transformation is key to the banking environment growing and banks have an opportunity to design new products and streams of revenue to align to customer needs. However, the increasing regulatory requirements and impact on the balance sheet should be borne in mind as part of these transformations.
Over the next year, we expect that the banks should focus on taking a comprehensive approach to:
• Evolving and expanding stress testing and scenario planning exercise in light of the changing outlook and potential unwinding of COVID - 19 specific overlays
• Testing and enhancing cyber-security measures, as part of building more resilient enterprises to enable greater agility
• Prioritizing the sustainability agenda
22 South African Banks Analysis

23South African Banks Analysis
How EY can help?
Gail MoshoeshoeFinancial Services Assurance Partner+27 (0) 83 601 [email protected]
Lorrisha SinghFinancial Services Associate Director+27 (0) 79 435 [email protected]
Heidi StreicherFinancial Services Assurance Quants Partner+27 (0) 82 308 6116 [email protected]
Neil MareeRegulatory Partner+27 (0) 60 976 [email protected]

24 South African Banks Analysis
25South African Banks Analysis
EY Global Banking and Capital Markets Benchmarks analyze the financial performance of South African banks.
About this report
Database and Report: The deck covers 4 South African banks – FirstRand Limited (FirstRand), Absa Group Limited (Absa), Nedbank Group Limited (Nedbank) and Standard Bank Group Limited (Standard Bank). The analysis presented helps identify trends about the financial performance of the banks and compare them against their peers.
Period comparison: We have compared the results for 12 months ended (ME) Dec-20 (Jan’20 - Dec’20), which is FY20 for Absa, Nedbank and Standard Bank and includes 2H20 and 1H21 for FirstRand.
• FirstRand 12ME Dec-20 numbers are derived after deducting the interim 1H20 numbers from full year June 2020 results and then adding them to the interim 1H21. However some parameters for 12ME Dec-20 period are not reported by the bank and we have used EY calculated numbers to drive the analysis.
Short summary of the 12 months ended Dec-20 performance: Higher provisions and struggling revenue continues to weigh on the banks’ profitability; NIM to face challenge in FY21; cost saving remain a key metric to offset the sluggish revenue growth, however costs are expected to grow in FY21
All information is sourced from publicly available banks’ financial statements.
Methodology and notes:
• IFRS numbers are used across banks to facilitate like for like comparison. Thus, normalized numbers have not been used.
• RBB and CIB revenue might not add to the total revenue due to corporate centre segment and other segment which are not comparable across banks. For. e.g. FirstRand’s UK operations are not comparable across peers.
• We have used calculated operating jaws across the report which is calculated as: % rise in revenue - % rise in expenses
• We have used calculated CIR ratio across the report which is calculated as : operating expense / total revenue
• Stage 2 exposure: Gross Stage 2 loans / Gross total loans
• Stage 3 exposure: Gross stage 3 loans / Gross total loans
• Stage 3 ECL coverage: Stage 3 impairments allowance / Stage 3 loans
• 12ME Dec-20 numbers for FirstRand (2H20+1H21) are calculated by subtracting interim Dec-19 (1H20) data from full year Jun-20 data and adding interim Dec-20 (1H21) data
• Wherever data is not reported by the banks, ratios such as credit loss ratio, operating jaws and CIR for FY20 are EY calculated
• There could be a variation in reported operating jaws and CIR ratio at the banks basis the difference in calculation methodology.
• For e.g. at Absa: Calculated C/I and jaws ratio takes into account the IFRS numbers while the reported C/I and jaws considers the adjusted numbers for Barclays separation.
• For e.g. at Standard Bank, reported CIR and jaws only considers banking activities and our calculated CIR and jaws incorporates the insurance and investment management segments in income and expense calculations.

26 South African Banks Analysis26 South African Banks Analysis
Abbreviations• FirstRand: FirstRand limited
• Absa: AbsaGroup limited
• Nedbank: Nedbank Group limited
• Standard Bank: Standard Bank limited
• IB: Investment Banking
• CIB: Corporate and Investment banking
• RBB: Retail and business banking
• PBB: Personal and business banking
• FNB: First National Bank
• RMB: Rand Merchant Bank
• SA: South Africa
• Africa: Africa regions
• Rest of Africa: Africa regions
• Rest of the world: International operations
• NII: Net interest income
• Non-II: Non interest income
• NIM: Net interest margin
• CIR: Cost to income ratio
• ROE: Return on equity
• COE: Cost of equity
• NPL: Non-performing loans
• ECL: Expected credit losses
• VAF: Vehicle and asset finance
• CIB: Internal model approach
• CLR: Credit loss ratio
• bps: basis points
• p.p.: percentage points
• SA: Standardised approach
• FIRB: Foundation internal ratings-based
• AIRB: Advanced internal ratings-based approach
• IRB: Internal rating based approach
• BIA: Basic indicator approach
• IMA: Internal model approach
• AMA: Advanced measurement approach
• RWAs: Risk weighted assets
• AIEA: Average interest-earning assets
• CET1: Common equity tier 1
• 6ME: Six months ended
• 12ME: Twelve months ended

27South African Banks Analysis

EY | Building a better working world
EY exists to build a better working world, helping to create long-term value for clients, people and society and build trust in the capital markets.
Enabled by data and technology, diverse EY teams in over 150 countries provide trust through assurance and help clients grow, transform and operate.
Working across assurance, consulting, law, strategy, tax and transactions, EY teams ask better questions to find new answers for the complex issues facing our world today.
EY refers to the global organisation, and may refer to one or more, of the member firms of Ernst & Young Global Limited, each of which is a separate legal entity. Ernst & Young Global Limited, a UK company limited by guarantee, does not provide services to clients. Information about how EY collects and uses personal data and a description of the rights individuals have under data protection legislation are available via ey.com/privacy. EY member firms do not practice law where prohibited by local laws. For more information about our organisation, please visit ey.com.
© 2021 EYGM Limited.
All Rights Reserved.
Artwork by A. Mokhethi.
ED None
This material has been prepared for general information purposes only and is not intended to be relied upon as accounting, tax, or other professional advice. Please refer to your advisors for specific advice. The information contained herein has been prepared as of the current date, is of a general nature, and is not intended to address the circumstances nor needs of all individuals or entities. No one should act upon such information without obtaining appropriate professional advice. Although we endeavor to provide accurate and timely information at the current date, there can be no guarantee that such information will continue to be accurate in the future.
Ernst & Young Inc. is a South African company and a member firm of the Ernst & Young network of independent member affiliates with Ernst & Young Global Limited (“EYG”), each of which is a separate legal entity. EYG is a UK company limited by guarantee. EYG does not provide services to clients. For more information about our organisation, please visit ey.com
This material has been prepared for general informational purposes only and is not intended to be relied upon as accounting, tax, or other professional advice. Please refer to your advisors for specific advice.
ey.com