Embed Size (px)
Citation preview

MARKET REFORM, CONTESTABILITY
AND DETERMINANTS OF THE
MAIZE BOARD-MILLER MARKETING MARGIN
IN THE
SOUTH AFRICAN MAIZE INDUSTRY .
BY
WILLIAM JAMES FREDERICK VIGNE
Being a thesis submitted in partial fulfilment of
the requirements for the Degree of
MASTER OF SCIENCE IN AGRICULTURE
in the
Department of Agricultural Economics, Faculty of Agriculture
University of Natal, Pietermaritzburg
March 1996

I hereby certify that, unless specifically indicated to the contrary in the text,
this dissertation is the result of my own original work.

11
ACKNOWLEDGEMENTS
I wish to express my sincere thanks and appreciation to the following persons who greatly
assisted me in this research:
* My Heavenly Father, The Almighty, Sovereign and Only True God, upon whose Grace
I am utterly dependent for all things.
* My parents Mr and Mrs IN. Vigne, for their assistance and support in more ways than
one.
* My supervisor, Mr M.A.G. Darroch, Department of Agricultural Economics,
University of Natal, whose high standard of research, encouragement and expert
guidance has been of great assistance.
*
*
My colleagues (staff and students) in the Department of Agricultural Economics,
University of Natal for their support and friendship.
Financial assistance for this research is gratefully acknowledged from the Centre for
Science Development (HSRC, South Africa) via the Agricultural Policy Research Unit
directed by Professor W.L. Nieuwoudt. Opinions expressed and conclusions arrived
at, are those of the author and are not to be attributed to the Centre for Science
Development.

1ll
TABLE OF CONTENTS
ACKNOWLEDGEMENTS ............................................. 11
LIST OF FIGURES. . . . . . . . . . . . . . . . . . . . . . . . . . . . . . . . . . . . . . . . . . . . . . . . . .. VI
LIST OF TABLES . .... .......... ... .... . .. . .......... ......... ..... Vlll
ABSTRACT. . . . . . . . . . . . . . . . . . . . . . . . . . . . . . . . . . . . . . . . . . . . . . . . . . . . . . . .. IX
INTRODUCTION ..................................................... 1
CHAPTER 1
LITERATURE REVIEW ......................................... 4
1.1 OVERVIEW OF THE THEORY OF CONTESTABLE MARKETS
........................................................ 4
1.2 CONCENTRA TION ....................................... 8
1.3 MARKETING MARGINS .............. ..... ............ .. 12
CHAPTER 2
STRUCTURE OF THE SOUTH AFRICAN MAIZE INDUSTRY ........ 19
2.1 ECONOMIC IMPORTANCE ............................... 19
2.2 THE SOUTH AFRICAN MAIZE INDUSTRY, 1931 - 1987 ....... 21
2.3 THE MAIZE MARKETING SCHEME AND INDUSTRY STRUCTURE,
lV
1 MAY 1987 -1 MAY 1995 ................................. 24
2.4 THE "NEW" MAIZE MARKETING SCHEME AND INDUSTRY
STRUCTURE (1 MAY 1995 ONWARDS) ..................... 31
2.5 TRENDS IN MILLER STRUCTURE AND MAIZE MARKETING
MARGINS IN SOUTH AFRICA SINCE 1977178 ............... 36
2.5.1 Miller Structure .................................... 36
2.5.2 Maize Board-Miller Marketing Margins ............... 37
CHAPTER 3
RESEARCH METHODOLOGY .................................. 39
3.1 CONTESTABILITY ANALYSIS ............................ 39
3.2 EMPIRICAL MODEL OF DETERMINANTS OF THE MAIZE
BOARD-MILLER MARGIN .............................. 39
3.2.1 Product Equivalent .................................. 39
3.2.2 Empirical Model .................................... 40
CHAPTER 4
RESULTS ........... ............... ...... ... .................. 46
4.1 TRENDS IN CONTESTABILITY OF MAIZE GRAIN MARKETING
SINCE 1931 .... . ........................................ 46
4.2 MARGIN DECOMPOSITION AND MARKET POWER ........ 50
4.2.1 Correlation Matrix .................................. 50
4.2.2 Regression Models .................................. 53

v
CONCLUSIONS ..................................................... 64
SUMMARy ......................................................... 67
REFERENCES ...................................................... 69
APPENDIX A ....................................................... 81

V1
LIST OF FIGURES
Figure 1 Maize Board-Miller Marketing Margin (Adapted from Tomek and Robinson, 1990)
.................... . . .. . .. .................................. 13
Figure 2 Competitive and Monopoly Solution of Price Spread Model (Source: Faminowand
Laubscher, 1991). ...... . ........................................ 16
Figure 3 Effects of Demand and Marketing Cost Shifts (Source: Faminow and Laubscher,
1991) ................ . ........................................ 17
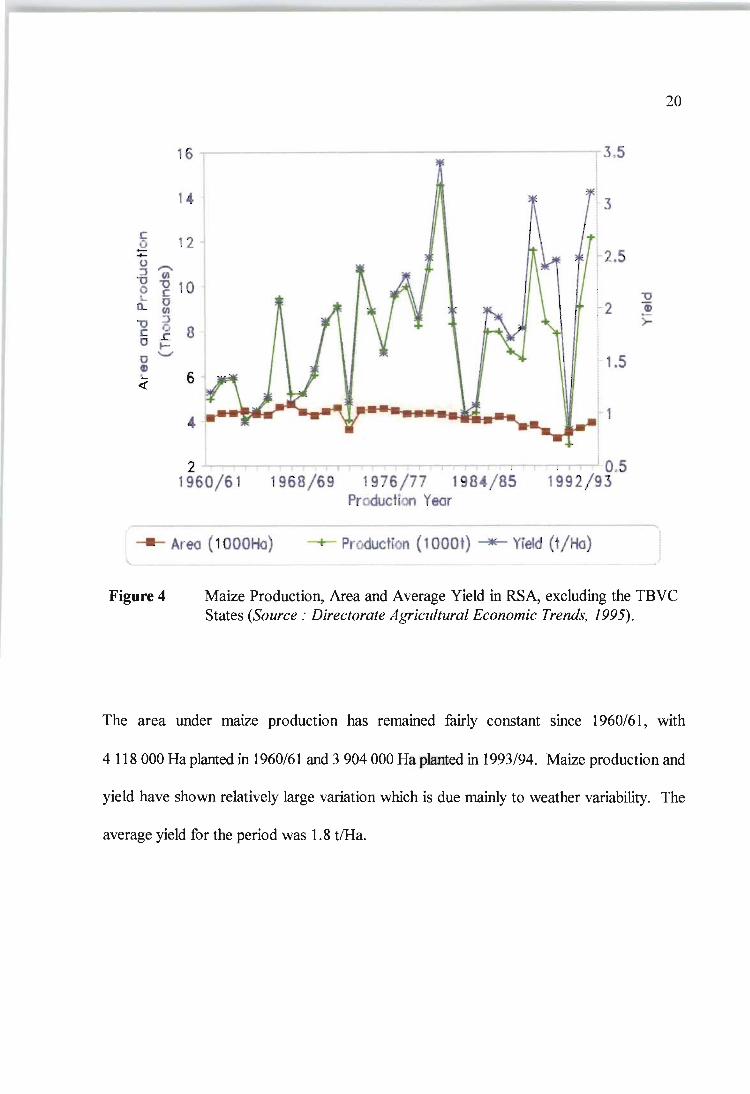
Figure 4 Maize Production, Area and Average Yield in RSA, excluding the TBVC States
(Source: Directorate Agricultural Economic Trends, 1995) ................ 20
Figure 5 Maize Scheme (1987-1995), Production and Distribution Channels for Maize and
Maize Products (Source: Cownie, 1992 and Wright, 1992) ................ 27
Figure 6 Real White Maize Domestic and World Price Trends, 1970171 - 1992/93 (Source:
Abstract of Agricultural Statistics, 1995 and Agricultural Outlook Economic Research
Service, USDA, 1994). . .. . ........................................ 28

V1l
Figure 7 Proposed New Maize Scheme (1 May 1995), Production and Distribution Channels
for Maize and Maize Products (Source: Government Gazette Notice 16172 of 1994,
Regulation 2205 and Swart, 1994). . ...................... . ......... 32
Figure 8 Time Trend of Real Maize Board - Miller Margin (1990 = 100) (Source: Central
Statistical Services, 1994; Directorate Agricultural Economic Trends, 1995) ... 38

Vlll
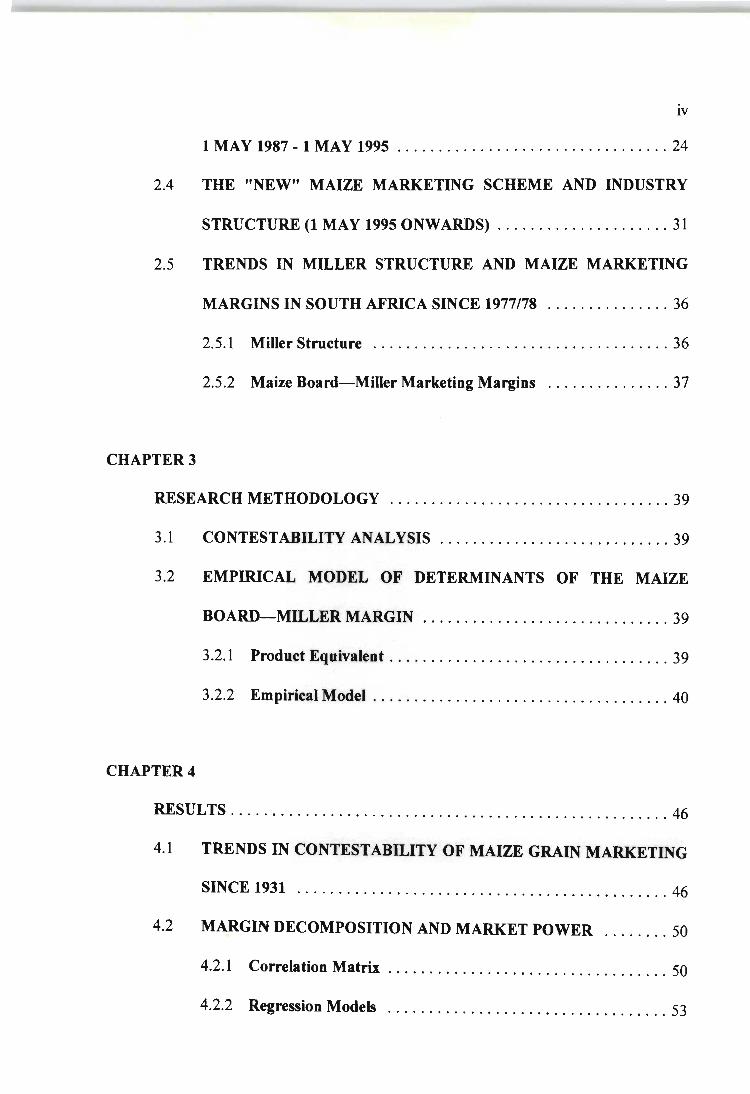
LIST OF TABLES
Table I South African Maize Miller Structure, 1977 - 1993 ..... ............ 37
Table II Correlation Coefficients Between Demand Model Variables .... . . . . . . 51
Table III Correlation Coefficients Between Margin Model Variables ........... 52
Table IV Margin Decomposition from 3 SLS Regression, 1977178 - 1993/94 . . . . . 56
Table V Principal Components Extracted for Demand Model ................ 57
Table VI Principal Components Extracted for Margin Model ................ 58
Table VII Margin Decomposition (free of Multicollinearity) 3SLS Regression, 1977178 -
1993/94 (where bo = -69.3623) ................................ 63

IX
ABSTRACT
The dissertation analyses market reform in the South African Maize Industry at two levels.
Firstly, aspects of the theory of contestable markets are used to analyze maize grain marketing
reform and identify what measures are appropriate to promote contestability (ease of entry and
exit, and potential rather than actual competition as a means of constraining uncompetitive
behaviour). A briefhistory of the South African Maize industry since 1931 shows a highly
regulated grain marketing system which lacked contestability. Recent amendments to the
Maize Marketing Scheme such as abolition of controlled prices for maize products at
retail/merchant (1960) and wholesale/milling (1971) levels; movement away from limited
registration of maize processors (1977); and abolition of the statutory single channel fixed
price pool scheme and storage control allowing "free" trade within the domestic market
(1995), promote market contestability. Contestability can be further enhanced by reduction
of sunk costs through possible on-farm storage and handling facilities (bunker storage, plastic
tunnels, steel and concrete silos) and the leasing of existing silo space (possible excess capacity
and alternative uses) by producers and maize traders. The maintenance of some statutory
powers for the Maize Board (single channel exports, compulsory registration and levy
payments) still limits contestability.
Secondly, the determinants of the Maize Board - Miller (MBM) marketing margin between
1977 - 1993 (period defin~d by data limitations) are identified using Ordinary Least Squares
(OLS), Three Stage Least Squares (3SLS) and Principal Component Analysis. The MBM
margin was positively related to miller market power (proxied by industry conjectural
elasticity), the real miller maize meal selling price, real variable processing costs, and a change

x
in Maize Board maize grain pricing policy after 1987 (export losses reflected in low real net
producer maize price). The estimated conjectural elasticity was low, indicating competitive
conditions, although concentration ratios indicate entrenched, but falling, market power. The
main component of the Maize Board-Miller (MBM) marketing margin for 1977 - 1993 was
variable processing costs. The real consumer price of maize could be reduced via lower real
processing costs of maize meal, possibly with the removal of fixed administered prices of
inputs (like electricity) and moderation of real wage demands in negotiations between trade
unions and millers. Foreign exchange and import controls may, however, raise input costs if
the Rand should continue to weaken. The increased number of "bosmeulens" (small mills not
registered with the Maize Board and using relatively inexpensive technology not having
substantial sunk investment) entering the market means that mill sunk costs may be less of a
deterrent to entry in future. The 1987 Maize Board pricing policy change captured the effect
of input price risk on the MBM margin indicating a significant effect of past maize pricing
policies on this margin. The Maize Milling Industry appears to be competitive (low industry
conjectural elasticity) over the study period, although the oligopoly component still contributes
significantly to the MBM margin. Miller market power may possibly be exerted on other
products (e.g. wheat) as white maize may be seen as a loss leader. This interrelationship
between maize and other grains in processing is an area for future research.

1
INTRODUCTION
Maize is the most important field crop in South Africa comprising 45% of all arable land
(about 3.5 million hectares) and accounting for 40% by value of all field crops (Cownie, 1992
and Financial Mail, 1991). This dissertation analyses market reform in the South African
Maize Industry at two levels. Firstly, regulations affecting maize grain marketing at producer
and Maize Board levels are studied using aspects of contestability theory. Which stresses
potential, rather than actual, competition as a constraining force on anti-competitive behaviour
and the ease with which a firm can exit and enter a market. Secondly, determinants of the
Maize Board-Miller (MBM) marketing margin are identified to assess the extent of miller
market power (if any) in the Industry. Ordinary Least Squares (OLS), Three Stage Least
Squares (3SLS) and Principal Component Analysis empirical techniques are used.
The South African Maize Industry has been characterised by government regulatory control
since the promulgation of the Mielie Act in 1931. The Industry's single channel fixed price
marketing scheme established in 1944 - and administered by the Maize Board - has come under
increasing pressure since 1980 from various interest groups seeking reform : Certain maize
producers (wanting to market their own crop and those selling to livestock producers) calling
for an end to cross-subsidization whereby export losses are being covered by ever increasing
Maize Board levies on domestic production; Feedlotters, poultry producers and maize millers
wanting system deregulation to allow for direct purchasing so as to lower input costs; The
General Agreement on Tariffs and Trade (GATT) moves from quantitative import controls to
tariffication; The Board of Tariffs and Trade calling for the abatement of statutory controls;
and the Kassier and Agricultural Policy Evaluation Committee (AMPEC) reports seeking
2
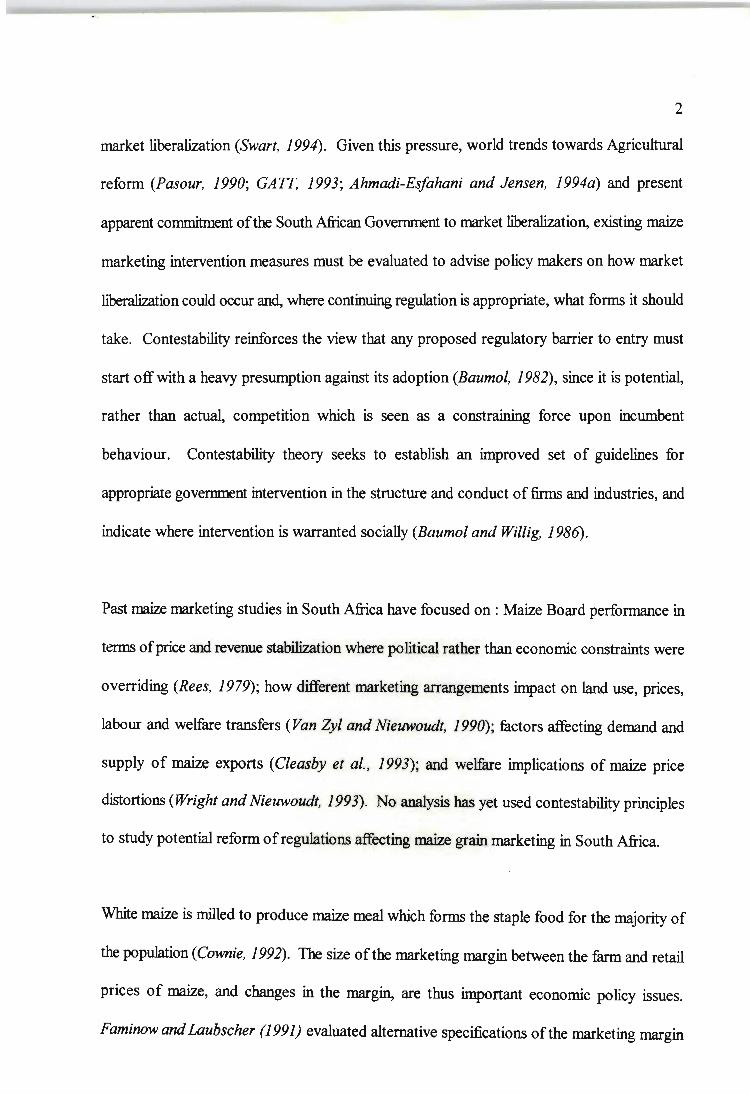
market liberalization (Swart, 1994). Given this pressure, world trends towards Agricultural
reform (Pasour, 1990; GATT, 1993; Ahmadi-Esfahani and Jensen, 1994a) and present
apparent commitment of the South African Government to market hberalization, existing maize
marketing intervention measures must be evaluated to advise policy makers on how market
hberalization could occur and, where continuing regulation is appropriate, what forms it should
take. Contestability reinforces the view that any proposed regulatory barrier to entry must
start off with a heavy presumption against its adoption (Baumol, 1982), since it is potential,
rather than actual, competition which is seen as a constraining force upon incumbent
behaviour. Contestability theory seeks to establish an improved set of guidelines for
appropriate government intervention in the structure and conduct of firms and industries, and
indicate where intervention is warranted socially (Baumol and Willig, 1986).
Past maize marketing studies in South Africa have focused on : Maize Board performance in
terms of price and revenue stabilization where political rather than economic constraints were
overriding (Rees, 1979); how different marketing arrangements impact on land use, prices,
labour and welfare transfers (Van Zyl and Nieuwoudt, 1990); factors affecting demand and
supply of maize exports (Cleasby et al. , 1993); and welfare implications of maize price
distortions (Wright and Nieuwoudt, 1993). No analysis has yet used contestability principles
to study potential reform of regulations affecting maize grain marketing in South Africa.
White maize is milled to produce maize meal which forms the staple food for the majority of
the population (Cownie, 1992). The size of the marketing margin between the farm and retail
prices of maize, and changes in the margin, are thus important economic policy issues.
Faminowand Laubscher (1991) evaluated alternative specifications of the marketing margin
3
for white maize in South Africa for the period 1982 - 1988. Using a relative model based on
Gardner's (1975) work, they found that the margin was positively associated with the real
retail maize meal price, a real production price index, the quantity of white maize marketed,
retail price risk and two dichotomous variables to account for maize price policy change
(1987/88 marketing year) and drought (1983/84 and 1984/5). However, this work did not
consider the size, or causes of: individual components of the margin, nor the possible effect of
miller market power on the margin. The second part of the dissertation therefore analyses
determinants of the Maize Board-Miller (MBM) margin component, and considers their
policy implications.
The chapters that follow outline the economic theory underlying the concept of contestability
and marketing margins, and reviews the development of maize marketing regulations in South
Africa Trends in contestability since 1931, and in miller structure and the MBM margin since
1977 are assessed. Empirical models of the MBM margin detenninants for 1977-1993 are then
estimated using 3SLS and Principal Component Analysis. Chapter 4 presents study results,
while policy implications of the two analyses are discussed in the conclusion.

CHAPTER 1
LITERA TURE REVIEW
1.1 OVERVIEW OF THE THEORY OF CONTESTABLE MARKETS
4
Perfect contestability is seen as a generalization of perfect competition and a more ideal
benchmark for identifying structural impediments to market performance. It is also a guide for
regulators in those areas where intervention is socially warranted by considerations of
economic welfare (Bailey and Baumol, 1984; Spence, 1983 and Baumol and Willig, 1986).
The theory is based on the notion that economic efficiency is best achieved by opening up
markets to potential entrants (Lapsley, 1993) with the critical assumption being ease of entry
and exit (Spence, 1983 and Baumol et al. , 1988). The effectiveness of potential competition
becomes an ever increasing constraining force to incumbent behaviour in an industry as entry
becomes freer and freer. If entry and exit are totally free and there exist no significant barriers
to entry, then a market is perfectly contestable. Willig (1987:618) formally defined a
contestable market as a market "in which competitive pressures from potential entrants
exercise strong constraints on the behaviour of incumbent suppliers". For a market to be
contestable there must be :
a) Freedom of exit (where an agent can leave a market without impediment, and in the
process of departure can recoup any costs incurred in the entry process) which implies
and guarantees freedom of entry (entry is not costless or easy, but the entrant suffers
no disadvantage in tenns of production technique or perceived product quality relative
to the incumbent), that is, potential competition.
b) No significant barriers to entry (factors that enable established firms to earn supra-

5
competitive profits without threat of entry), such as restrictive registration.
c) Industry equilibrium which entails no significant excess profits so as to offer no
profitable opportunities for entry. The industry will thus be disciplined by the threat
of entry and firms will therefore possess standby authority (authority that can be used
quickly when unsatisfactory incumbent performance offers entrants the prospect of
profit).
d) Efficient pricing and allocation of production among incumbent suppliers.
e) Sluggishness or lags in the pricing response of incumbents to entry. Although not
necessary or essential this may facilitate contestability. For example, if incumbents
exlnbit sluggishness in dropping prices in response to entry, then an entrant is able to
earn rents before pricing adjusts to preclude any further entry. Potential entrants can
and do sometimes make binding contracts with their future customers, and if such
contracts can be agreed upon quickly, the fact that entry takes a long time becomes
irrelevant (Willig, 1987; Bailey and Baumol, 1984 and Baumol, 1982).
Fixed costs, if sunk (outlays that cannot be recouped without substantial delay) are seen by
Baumol et al., (1988) as a main obstacle to contestability in that sunk costs deter entry and
diminish the rate at which entry responds to incumbents' profits. It is not the amount of capital
that is crucial but the amount sunk. The smaller the share of investment that is composed of
sunk capital, the more contestable that industry will be (Bailey and Baumol, 1984).
Accessibility to a sunk facility (e.g. grain silo) through leasing arrangements or legislation
(preventing exclusive access) could also contribute to contestability. If the opportunity cost
of such a sunk facility is high (has many alternative uses ie. capital transferable) then
contestability is also enhanced.

6
Bain (1962: 1) stated prior to the development of contestability theory that "most analyses of
how business competition works and what makes it work have given little emphasis to the
force of the potential or threatened competition of possible new competitors, placing a
disproportionate emphasis on competition among firms already established in any industry".
Potential competition from potential entrants, rather than actual competition amongst active
suppliers, effectively constrains incumbent behaviour so that a market which is contestable may
consist of only a monopolist or of a large number of actively competing firms. This makes
antitrust and regulatory attention unnecessary where sufficiently low barriers to entry exist
(Baumol et al., 1983; Baumol and Willig, 1986).
There is much debate on whether potential competition or the mere threat of competition is
indeed a sufficient regu1atory force upon market incumbents. Brock (1983), Shepherd (1984),
Truu (1988) and Fourie (1993) question the application of contestability theory and conclude
that perfect contestability is of little practical value in most cases because its assumptions are
too restrictive - a world in which any firm can enter and leave without loss is far removed from
reality and of limited applicability. In practice, incumbent monopolists have advantages over
new entrants related to factors such as complex technologies, financial power, access to
distnbution channels, and customer allegiance. Furthermore, it is already widely accepted that
avoidance of unnecessary barriers to entry is a sound goal. Baumol et al. (1988), however,
consider the practical relevance of the theory as being its objectives of establishing an improved
set of guidelines for appropriate government intervention and the determination of criteria
distinguishing where intervention (if any) is warranted, in the belief that fostering contestability
will lead to more effective markets. Therefore, policy analysts should determine what
regulatory or other obstacles limit contestability and consider ways to reduce or eliminate

7
them In addition, as vested interest groups respond, so government policy orientation must
be dynamic to account for this.
Contestability theory has been used in the United States to analyze the airline, trucking,
telecommunication, health and railroad industries, but there are very few applications to
agricuhural systems. Brorsen et al. (1985) suggest that the U.S. wheat flour milling and retail
grocery markets approximated contestability as the U.S. wheat milling industry has never
operated above 88% capacity, thus allowing a firm operating at below capacity to easily enter
the market at a higher level of production with little additional cost. In addition retail grocery
firms do not have large sunk costs (specialized buildings not required) so the only loss of exit
would be loss on resale of specialised equipment and advertising costs, implying an operating
environment approaching contestability. South African commercial mills are apparently only
operating at 25% capacity as they operate on a one-shift basis (Financial Mail, 1991).
Ahmadi-Esfahani and Jensen (l994a; 1994b) used contestability theory to evaluate the
Australian wheat processing industry. They identified performance inconsistent with
contestability because of significant sunk costs and barriers to entry which lead to a high
degree of concentration (Three Firm Concentration Ratio = 50%) in the processing and retail
markets. Limited access to retail shelf-space, government regulations on food quality and high
advertising costs were also seen as contnbuting factors. Analysing cost and technical
conditions in the Australian wheat industry, Quiggin and Fisher (1988) found the market for
wheat handling services at country receival points to be non-contestable because of
considerable capital costs (effectively sunk) involved in the permanent handling facilities.
However, bunker storage technology (low capitaVhigh operating cost) may provide the means

8
for relatively costless entry and exit.
The next section reviews aspects of market concentration, which may be the result of
restrictions on competitive behaviour (lack of contestability), or superior economic
performance by larger firms.
1.2 CONCENTRATION
Pearce (J 983: 76) defines concentration as "the state of competitive conditions prevailing in
an industry" and "the extent to which a market's total output is accounted for by the few
largest member firms". Concentration (Cone) is thus seen as a function of size and inequality
as shown in equation (1):
Cone = f ( n , i) (1)
where n = number offirms in an industry, and
i = a measure of size inequality (Waterson, 1984).
In this study n is measured as the number of mills processing white maize (1977/78-1987/88)
and the number of mills processing white maize for human consumption (1988/89-1993/94).
The size inequality variable i is measured as total tonnage processed by a mill for commercial
purposes (including processing for own use and for sales to own account). The relationship
between concentration and inequality is such that given the number of firms, concentration

9
increases with increases in inequality; and given the degree of inequality, concentration
decreases with an increase in the number of firms (Rosenbluth, 1966).
The Structure-Conduct-Performance (SCP) Paradigm is often used to explain the workings
of concentration in a market. In the SCP model, Structure refers to the characteristics that
constitute a market's composition, status and pattern; Conduct refers to the activities, tactics
and dealings of the market; Performance refers to the degree to which a market assimilates a
specific normative standard ego Competitive market, monopoly or Pareto optimality
(Brann, 1992).
Two competing hypotheses explain concentration of economic power:
a) The Monopoly Hypothesis - Entry barriers and related competition restricting
behaviour/strategies (regulations, restrictive licensing etc) facilitate concentration. This
argument is based on the SCP paradigm which argues that the structure of an industry
(concentrated) will determine the conduct of the market participants (collusion) which
leads to performance of players (monopoly pricing) in that industry. In concentrated
markets, consumer prices are thus predicted to be less favourable because of non
competitive behaviour (Darroch, 1992; Leach, 1992a; Berger and Hannan, 1989 and
Reekie, 1984).
b) The Efficiency Hypothesis - Superior low cost firms which have higher profits grow
to dominate their industries (technology development, product development, and
benefits of economies of scale). Here the efficient perfonnance of players in the market
10
(low costs) will lead to conduct (competition) which results in the structure
(concentration) ofthe industry, and is thus the reverse of the SCP paradigm. Prices
will be more favourable to consumers in concentrated markets because of their greater
efficiency (Darroch, 1992; Leach, 1992a; Berger and Hannan, 1989 and Reekie,
1984). The efficiency hypothesis formed much of the basis for the development of
contestability theory (Purcell, 1990).
If the monopoly hypothesis is valid, then policies that dictate the number of firms in an industry
or prevent further concentration are justifiable as a means of fostering competition and
improving the functioning of markets (Gardner, 1979 and Reekie, 1984). However, if evidence
suggests that the efficiency hypothesis applies (causality flows from performance to structure),
a "hands off" approach should be maintained, especially if the market which induced
concentration is also likely to induce deconcentration (Reekie, 1984). Brooks (1992) cited by
Darroch (1992) states that as long as concentration does not lead to abuse such as restrictive
practices and price collusion, it is not necessarily bad. Lubbe (1992) cites Armstrong (1982)
who argues that a positive relationship between the magnitude of concentration and profits
does not necessarily imply competitive misconduct, but could well result from superior
performance by larger firms in the absence of legal barriers to entry. Baumol and Willig
(1986) consider the mere large size of a firm or high concentration ratios as insufficient
grounds upon which to justify government intervention. Bailey (1986) also stresses that it is
impediments to entry and exit, not concentration or scale of operations, which may primarily
be the source of non-welfare optimal prices.
According to Van Zyl and Kirsten (1992) , if the South African food manufacturing industry

11
is highly concentrated, then deregulation and privatization of control Boards, without
dissolving concentration of the industry (and simultaneously deregulating the manufacturing,
distrIbution and retail industries), could raise prices of certain foodstuffs and commodities, and
widen the producer-retail price gap. Fourie (1993: 149), however, cautions that "as important
as economic structure or concentration may be, it is misleading to regard structural
adjustments as an easy and final solution to the problems of economic injustice (and
inefficiency) in a complex economy with formidable development problems".
Many measures of concentration in the maize milling sector in South Africa were computed
for this study, and all showed a similar trend of decreasing concentration since 1977. Only the
more commonly cited Three Firm Concentration Ratio (CR3) estimated by equation (2) has
been employed in the study (Central Statistical Services, 1988; Shepherd, 1979) :
where Sj =
3 CR3 L S;
i = 1
market share of the ith firm.
(2)
The percentage market share is obtained by CR3 x 100% (Central Statistical Services, 1988).
Concentration thus incre~s with inequality and decreases with the number offirms (Leach
1992b). Shepherd (1979:189) concludes that the concentration ratio "remains the best all-
purpose measure of the degree of competition" since "it is unambiguous and has concrete
meaning". Chapter 2 reports trends in maize milling structure and concentration using the
12
CR3. The following section discusses the economic theory of marketing margins and outlines
developments in the modelling of marketing margins to account for oligopoly behaviour.
1.3 MARKETING MARGINS
A marketing margin, assuming purely competitive conditions, is "the price of a collection of
marketing services that is the outcome of the demand for and supply of such services" (Tomek
and Robinson 1990: 1 08). Marketing services include processing, packaging, transportation
and retailing of the product. A marketing margin thus represents the difference between the
price of an equivalent unit of product at two different marketing levels. For this study, the
absolute Maize Board-Miller (MBM) marketing margin equals Miller selling price per ton
of maize milled (P ~ less the Maize Board selling price of an equivalent unit of product (P MB)'
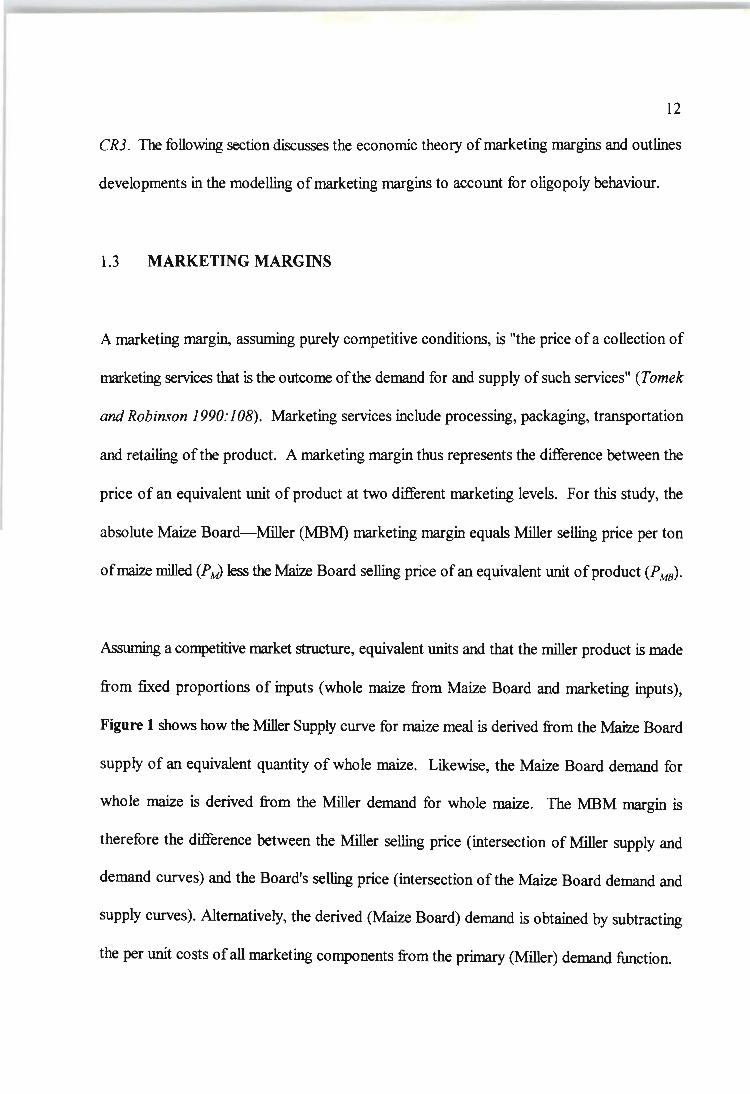
Assuming a competitive market structure, equivalent units and that the miller product is made
from fixed proportions of inputs (whole maize from Maize Board and marketing inputs),
Figure 1 shows how the Miller Supply curve for maize meal is derived from the Maize Board
supply of an equivalent quantity of whole maize. Likewise, the Maize Board demand for
whole maize is derived from the Miller demand for whole maize. The MBM margin is
therefore the difference between the Miller selling price (intersection of Miller supply and
demand curves) and the Board's selling price (intersection of the Maize Board demand and
supply curves). Alternatively, the derived (Maize Board) demand is obtained by subtracting
the per unit costs of all marketing components from the primary (Miller) demand function.

Selling Price
{
Miller
MuS'" M"'" Doud
13
Miller Supply
Maize Board Supply
Miller Demand
Maize Board Demand
o Quantity Equivalent per unit time
Figure 1 Maize Board-Miller Marketing Margin (Adapted from Tomek and Robinson, 1990)
The asswnption of fixed proportions implies that the elasticity of substitution between inputs
is zero. Gardner (1975) provides a mathematical analysis of this situation and for that where
substitution possibilities exist between the various inputs in production. If substitution is
possible, a shift in primary (Miller) demand increases the derived (Maize Board) demand for
both Maize Board maize grain products and marketing services. The relative prices of both
inputs would change depending on their respective supply elasticities. The change in the
margin will, in turn, depend on the degree of substitution between maize grain and other inputs
in the marketing process. Gardner (1975) however, sees an elasticity of substitution tending
to zero as the more realistic limiting case.
Following Gardner (1975); Heien (1977) and Wohlgenant and Mullen (1987) the relative

14
margin PdPM(graphical relations of Figure 1) can be expressed as equation (3) :
PMB = f ( TTP! ; RVCOP ) PM PM
(3)
where PMB = Real Maize Board selling price for a quantity ton equivalent,
= Real Miller selling price for a ton of milled maize,
ITP! = Quantity of whole maize processed by the industry (tons), and
RVCOP = Real variable milling costs per ton of milled maize.
Increases in RVCOP and in farm level output marketed locally are likely to lower the MBM
price ratio by raising PM relative to P MB' When the Maize Board price is measured in the same
units as the Miller price, the absolute price spread or absolute MBM margin can be written as
equation (4) :
MBM = PM - PMB = PM h( TIP! , RV;OP ) M
(4)
since the relative MBM margin is, by definition equal to 1 - P wlP M (Wohlgenant and Mullen,
1987). See Appendix A, page 81 for derivation. In general, the relationship between the
prices will change as output and relative marketing input prices change. This fonnulation
suggests that shifts in miller demand and Maize Board supply can influence the margin via two
possible mechanisms: quantity of output processed (ITP!) and output price (P~. Increases
in output and increases in relative marketing costs will lead to a higher relative margin. Since

15
shifts in roth demand and supply cause changes in output and price, the effects on the margin
depend on the relative shifts and price elasticities of demand and supply (Wohlgenant and
Mullen, 1987).
The actual nature of a marketing margin may be difficult to determine, since most food
products undergo a complex transformation from the farm to the consumer and different
products require different marketing services (Tomek and Robinson 1990). For example, if
the supply curve for marketing services has a positive slope, the price of such services would
rise as demand increases, resuhing in a higher margin with increased production. This may be
unrealistic as economies of scale in providing marketing services could lead to a negatively
shaped supply curve for marketing services, at least over some range (lower margins with
increased production). Marketing margins will change with changes in factor prices, the
quantity and quality of services contained in the final product and the efficiency with which
services are provided.
Fisher (1981) graphically modelled Gardner's (1975) mathematical relationships and illustrated
the effects of a change in the cost of an existing marketing service on the margin under
competitive conditions. He concluded that for most agricultural products, the major
adjustment to a change in marketing charges will be made by farm prices. Faminowand
Laubscher (1991) adapted Fisher's (1981) model to include the case of oligopoly pricing in
the marketing sector. They abstracted from the monopoly position of the Maize Board and
assumed that firms in the marketing sector are able to effectively collude to realise the
monopoly solution (see Figure 2 and Figure 3). In Figure 2 under the competitive case, the
fium-retail marketing margin is determined by the intersection of the demand (DMJ) and supply
16
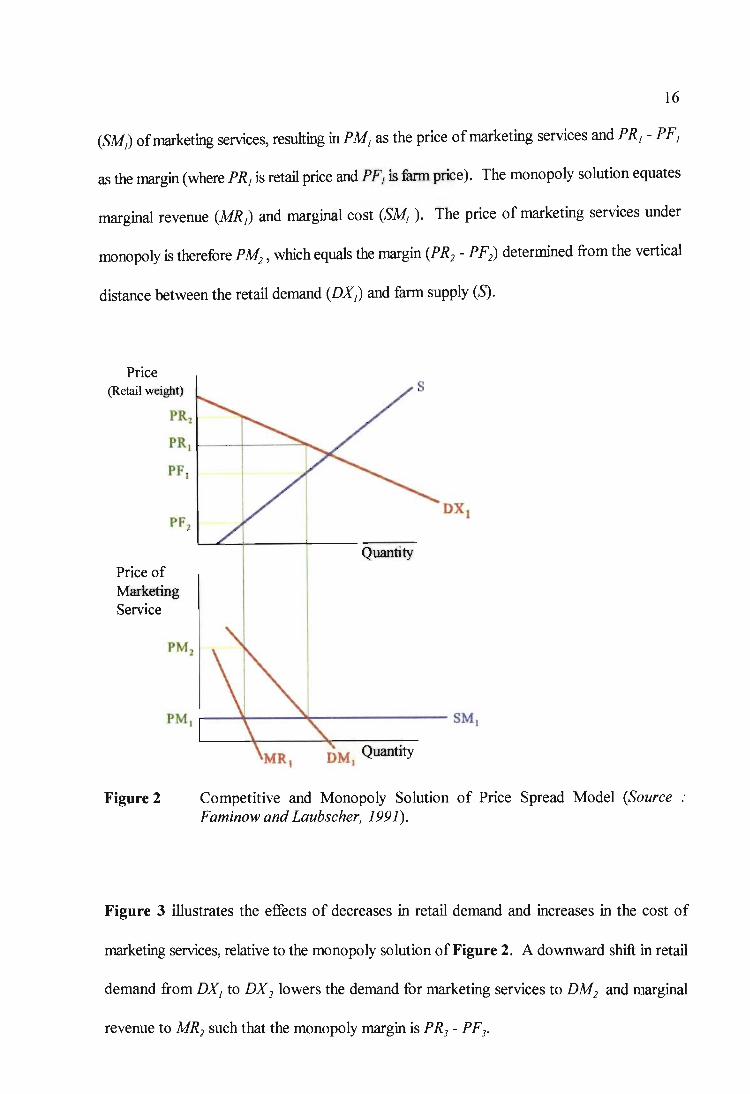
(SMJ of marketing services, resulting in P M1 as the price of marketing services and P R 1 - P F1
as the margin (where PR1 is retail price and PF1 is furm price). The monopoly solution equates
marginal revenue (MR1) and marginal cost (S~). The price of marketing services under
monopoly is therefore PM2, which equals the margin (PR2 - PF2) determined from the vertical
distance between the retail demand (DX1) and farm supply (S).
Price (Retail weight)
Price of Marketing Service
Quantity
Figure 2 Competitive and Monopoly Solution of Price Spread Model (Source Faminow and Laubscher, 1991).
Figure 3 illustrates the effects of decreases in retail demand and increases in the cost of
marketing services, relative to the monopoly solution of Figure 2. A downward shift in retail
demand from DX1 to DX 2 lowers the demand for marketing services to DM2 and marginal
revenue to MR2 such that the monopoly margin is PR3 - PF3•

17
Any increase in marketing service costs beyond SM2 results in a negative farm price.
PM3 is therefore the limit to which the monopolist marketing firms are able to depress the farm
price and extract monopoly profits. If the marketing firms were pricing competitively under
cost (SM2) and demand (DM2) conditions, the price would be PM4 and the margin PR2 - PF2•
PM3 and PM4 therefore represent the prices of two extreme forms of pricing behaviour with
presupposed structural shifts in retail demand and marketing service costs.
Price (Retail weight)
PR2 ~-"""",,-PR3
/--+--""""""PF ..
PF 2 r-t--.I'
PF3 ~~--------------------Quantity
Price of Marketing Service
Figure 3
PM) PMz PM4 ~~~~-------------------SM2
t---\\------:l~~------- SM)
Effects of Demand and Marketing Cost Shifts (Source: Faminow and Laubscher, 1991).
Producers through the power of the Maize Board could conceivably counteract a non-
competitive marketing sector and prevent firms from setting the price of marketing services
at the monopoly level and thereby force down the price of marketing services from PM3

18
towards PM4• The result of a change in Maize Board pricing policy from 1987 onwards
whereby losses on export sales were reflected in a lower real net price to farmers indicates that
this has not occurred. This aspect is considered in more detail in Chapter 2 which analyses
trends in the MBM margin, and in the empirical model specified in Chapter 3.
Azzam et al. , (1989) and Schroeter and Azzam (1991) went beyond the above graphical
analyses by modelling oligopoly behaviour using iterated 38L8. In a perfectly competitive
market the margin would be a function of marginal processing costs (positively related). In
a non competitive market, they estimated the margin to be a function of an additional two
positive terms accounting for potential monopoly and monopsony price distortions which
would exceed marginal processing costs. These distortions reflect the ability (if any) of
marketing firms to exercise some power over price in both the market for the farm product and
the food output market. Chapter 3 shows the derivation of the empirical model and its
application to the MBM margin.
Chapter 2 descnbes developments in the 80uth African Maize Industry since 1931 and outlines
trends in miller structure and the MBM margin since 1977 (period defined by data limitations).

19
CHAPTER 2
STRUCTURE OF THE SOUTH AFRICAN MAIZE INDUSTRY
2.1 ECONOMIC IMPORTANCE
Maize is the most important field crop in South Africa comprising 45% of all arable land
(about 3.5 m hectaresl), annually producing on average 7 million tons, and accounting for 40%
by value of all field crops. Gross value of production was approximately R3 billion or 13%
of total agricultural output and 25% ofGDP in 1990/91. Maize (mainly white maize) is the
staple food for the majority of the population (some 4 million tons per annum) and there are
about 1.1 million workers with 7 million dependents on the approximate 16000 commercial
maize farms. Yellow maize is also the most important intermediate input into the livestock
industry which uses about 3 million tons per annum. When shortages of white maize have
occurred, admixing of yellow and white maize has been practised. South Africa is the major
supplier of maize to Botswana, Lesotho, Swaziland, and Namibia (Directorate Agricultural
Economic Trends, 1995; Cownie, 1992 and Financial Mail, 1991). Figure 4 provides
physical time series information on maize cropped in South Africa.
Mean figures for the production seasons 1989/90 - 1993/94 (Directorate Agricultural Economic Trends, 1995).
r: () :;: 0 ::J , -0 0 L
n.. '"0 r: 0
0 G) I-
«
~------------------------------------~ 3 >5 16 !
14 1
12
"""' (I)
~ 10 1
0 {I)
:J lj .r: ~ --
8
6 ~
4 ,
2 1960/61
: t I :
1968/69 1976/77 1984/85 Production Year
3
2.5
-0
2 ~
! '1.5
1
t 1 !
: I. i 0.5 1992/93
>-
- Area (1000Ha) -+- Production (1 OOOt) """"*- Yield (t/Ha)
20
Figure 4 Maize Production, Area and Average Yield in RSA, excluding the TBVC States (Source: Directorate Agricultural Economic Trends, 1995).
The area under maize production has remained fairly constant since 1960/61, with
4118000 Ha planted in 1960/61 and 3904 000 Ha planted in 1993/94. Maize production and
yield have shown relatively large variation which is due mainly to weather variability. The
average yield for the period was 1.8 tlHa.

21
2.2 THE SOUTH AFRICAN MAIZE INDUSTRY, 1931 - 1987
After promulgation of the Mielie Act in 1931, the Maize Board was established as a statutory
body in 1935 to advise the State on the marketing of maize. The Marketing Act of 1937 (since
amended) gave the Maize Board statutory power as a controlling body over maize marketing,
responsible for buying, selling, storing and delivering the whole South African (SA) maize
crop. In 1944 undersupply of maize due to drought and the Second World War resulted in
traders storing and withholding maize apparently in order to manipulate price
(Mieliestudiegroep, 1993). The Single Channel Fixed Price Marketing Scheme was thus
established with the main objective to stabilize producer maize prices in order to stabilize the
selling prices of white and yellow maize products (Swart, 1994). The Maize Board fixed the
selling and producer prices of maize according to a formula based on mean annual production
costs obtained from producer surveys. Between 1981-1987, the Maize Board fixed selling
price and producer price of maize on an ad-hoc basis which lead to great uncertainty
(Mieliestudiegroep, 1993). Essentially, price formation was open to political manipulation
from producer groups as the government fixed price using the cost of production formula.
Fanners had the incentive to inflate their cost estimates knowing that these were to be used for
price determination These cost estimates are subjective, making it difficult for an outsider to
measure them, as each fiumer fuces differing opportunity costs, has different expectations, risk
aversion and goals. Furthermore, cost estimation is distorted by the inclusion of some rents,
as returns to assets are partially capitalised into the value of those assets, for example land
(Pasour, 1990; Nieuwoudt, 1983). During this period, the Maize Board strictly controlled
market access through the Single Channel Fixed Price Scheme and effectively limited
contestability due to the statutory powers outlined below.
22
Statutory Maize Board powers in terms of the Marketing Act of 1937 (since amended) acted
as legal barriers to entry and impeded contestability at each industry level. The regulations,
punishable by law if contravened (Regulation 45 (42), Government Gazette No.6349 -
16/03/1979), included: Price fixing (prohibiting any person acquiring, selling or disposing of
any maize or maize products at any price other than at a fixed price); Restrictive trading and
permits (prolnbiting any person from selling or purchasing maize except to or through Maize
Board agents in controlled areas (A and B) which accounted for 95% of the total annual crop
(Louw, 1995)); Compulsory levies imposed on maize of any class, grade or quality sold and
payable by maize producers, millers, feed manufacturers, stock feeders, importers and
exporters to finance the General, Reserve and/or Special Funds; and Compulsory registration
(each person dealing in the course of trade with maize bad to register with the Board and
comply with its requirements). These restrictive regulations which acted as legal barriers to
entry are set out more fully below :
a) Price fixing (Regulation 45 (37), Government Gazette No.6349 - 16/03/1979).
Whereby the Board may prolnbit any person from acquiring, selling or disposing of any
quantity of maize or maize products at any price other than or below or above a fixed
pnce.
b) Restrictive Trading (Regulation 45 (38),(39),(41), Government Gazette No. 6349 _
16/03/1979). By which the Board prohibits any producer from selling maize except
to or through its agents and, only for purposes as defined by the Board, and prohibits
the purchase or sale, by any person, of maize or maize products except under the
authority of the Board. (No. R.779, Government Gazette No. 14785 - 01/05/1993).

23
c) Levy (Regulation 45 (23), Government Gazette No. 6349 - 1610311979); (No. R. 792,
Government Gazette No. 14795 - 0410511993). The Board may impose levies upon
maize of any class, grade or quality which is (i) sold to or through the Board, (ii)
imported into or exported from the Republic, and (iii) utilized by the producer thereof
for any purpose other than his own household consumption or farming operations.
Levies are payable by maize producers, seed maize producers (No. R. 791 , Government
Gazette No.14 795 - 0410511993), maize millers (No. R.964, Government Gazette
No.7565 - 01105/1981), feed manufacturers, industrial processors, stock feeders,
importers and exporters; and may be imposed to finance the General (No. R.45 (25),
Government Gazette No. 6349 - 1610311979), Reserve (No. R.45 (26), Government
Gazette No.6349 - 1610311979) and/or Special Funds (No. R.45 (27), Government
Gazette No. 6349 - 1610311979).
d) Special levy (Regulation 45 (23), Government Gazette No. 6349 - 1610311979); (No.
R.792, Government Gazette No. 14795 - 0410511993). Applies mutatis mutandis (with
the necessary changes) to the persons and conditions laid down for the ordinary levy.
e) Compulsory Registration (Regulation 45 (36), Government Gazette No.6349 -
1610311979); (No.R.780, Government Gazette No.14785 - 0110511993). Each
producer or person dealing in the course of trade with maize must be registered with
the Board and comply with the requirements prescribed. Furthermore the Board may
appoint agents as it sees fit, for such functions and on the conditions determined by it
(Regulation 45 (32), Government Gazette No. 6349 - 1610311979).

24
f) Permit (No.R.1975, Government Gazette No.1 0900 - 11/09/1987). The Board can
prohibit any importation into or exportation from the Republic, of maize without a
permit from the Board. The issuing of which is at the discretion of the Board.
Regulations (a) and (b) were relaxed in practise during this period although they were still
statutory law. Some marketing reforms during this period eased some of the constraints on
contestability. For example, abolition of controlled prices for maize products at retail/merchant
(1960) and wholesale/milling (1971) levels and a movement away from limited registration of
maize processors in 1977 which allowed for the emergence of small processors called
"bosmeulens". The prohibition on the erection of grain silos was repealed and the Grain Silo
Connnittee and price control on maize meal were also scrapped (Rees, 1979; Financial Mail,
1991; Cownie, 1992).
2.3 THE MAIZE MARKETING SCHEME AND INDUSTRY STRUCTURE,
1 MAY 1987 -1 MAY 1995
After May 1987, a Fixed Pool Pricing Scheme was adopted, whereby the producer price was
determined from the pooled net export and domestic income accruing to the Maize Board.
The producer price therefore varied inversely with the size of the local crop, although imports
in years oftmdersupply limited the extent of producer price rises (Cleasby et al., 1993). This
scheme was negotiated between NAMPO (National Maize Producers' Organization) and the
Minister of Agricuhure. The Maize Board was given the responsibility to fix domestic market
prices, apparently for the long term benefit of the producer (Kassier, 1992; Mieliestudiegroep,

25
1993; Van Zyl and Nieuwoudt, 1990 and Financial Mail, 1991).
Separate producer prices were quoted for both white and yellow maize according to grade and
quality and producers were paid a premium ofR10-R15/t for early delivery if Board stocks
needed to be boosted (Van Zyl and Nieuwoudt, 1990; Elliott, 1994; Groenewald, 1989 and
Financial Mail, 1991). Figure 5 shows the structure of the industry during this period when
the Maize Board was pivotal to the system, since all grain produced in controlled areas had to
be marketed through the Board or its agents (producer co-operatives).
Deregulation occurred in 1987 when the Board shifted away from price determination at
Cabinet level to a market-based, pool type pricing scheme. ArulUal subsidization of the Maize
Board's handling and storage costs was phased out, and permission granted for free
transactions between farmers and processors/consumers subject to the payment of Maize
Board levies (LAPc. 1993a; LAPC, 1993b; Financial Mail, 1991; Cownie, 1992 and GATT,
1993). These reforms prOlmted contestability within the Industry as the Single Channel Fixed
Price Scheme prevented direct trade in maize grain between producers and users of maize
grain. Removal of subsidies on maize production and debt write-offs to farmers and
cooperatives of R3.4 billion also occurred in the 1992/93 season.
Wright and Nieuwoudt (J 993) used public choice theory to explain how the producer majority
on the Maize Board had influenced maize pricing decisions and benefitted producers at the
expense of consumers. They estimated that in 1990, producer welfare gains were significantly
smaller (R384 million) than consumer welfare losses (R1181 million), causing a net social loss
to society ofR797 million. Since the number of commercial maize producers (about 16000)

26
is much smaller than the number of consumers, the rent per individual farmer is significantly
larger than the cost to the individual conswner (benefits are concentrated and costs dispersed).
The average rent per farmer was some R23000 in 1990, compared to the loss per consumer
of about R26. Income transfers for previous years were even greater, and the aggregate
estimates may understate the distortions as income distrIbutions among farmers and consumers
are highly skewed. These distortions reflect the outcome of constrained contestability within
the industry and explain why producers continue to lobby via NAMPO for a tariff of35% on
the price of all maize imports (Payne and Efrat, 1994).
The producer lobby may not retain its political clout if the new South African government
focuses more on consumer interests in future. The past distribution of access to resources,
inputs and infonnation in the Industry which has dual marketing (formal and informal markets)
and production (capital intensive commercial farmers and subsistence orientated farmers) has
concentrated the benefits of the Single Channel Scheme mainly on commercial farmers.
However, ifsmall-scale, ~gent maize farmers are represented on the Board in future, their
lobbying power may retain some influence for maize farmers on future maize pricing despite
the change in food policy focus.

Figure 5
I n p!lt Supp~r
I Minister of Agriculture I
I Department of Agricultural Economics I
I National Marketing Council I -
rl Ihize Millers I , Wholesaler t4
Maize Board H !alancecll'eed Man uf,clures I ~ Retailer (90%) or
Retailer Direct (1 0\)
Maize Producer --~ ~ Intake, Grading, Storage, Distribution I--H Induatrial P romsoes I and Agents (m ai'lly -
Co-op. ratives)
H Stock f' .. dies I I I
, I , H Intlmational Maruls Impotl$ and Exports I
Scheme I
+ MACRO -ENVIRO NM ENT (Social, Economic, Cultural, Political competitive with many role players suoh as Government ,
Internatlonl Community, etc . )
27
Maize Scheme (1987-1995), Production and Distribution Channels for Maize and Maize Products (Source: Cownie, 1992 and Wright, 1992).

28
Since 1987, the Board's role in price determination increased and it was not allowed to incur
debts to support maize prices. As sole marketer of maize, the Maize Board used price
discrimination to raise producer incomes. Local producer prices were supported ru:t:ificially
by restricting supply to the local market (price inelastic demand) and selling on export markets
(price elastic demand) (Cleasby et al. , 1993). Figure 6 shows that during the 1970's when
world prices were relatively high, export earnings were high and the Maize Board - Producer
(MB-P) margin was negative. As the world price began to fall relative to domestic prices,
"export losses" resulting from price discrimination by the Maize Board grew, so these losses
were covered by an increasing MB-P margin (levy) (Faminow and Laubscher, 1991).
800 T'-----------------------------------------.
700 j !
600 1 ~ 500 i
~ ~oo -I"" "'s::::-=-J:...~~
~ ~~~ - .·· •. · .. ··~ll··· .. ~ 10~ j~ljj}fJl~~Trp~~~~\\~l~-'
-1 00 j ~ ~ " ~ ~ ~ -200 !' , .... , ...., ~'''' , , -300 ~1 ~.~~~-,~, ~~.-.-~,j-.j~~.-.I~_.j_.j~_,_r--~,~~
1970/71 1976/77 1982/83 1988/89 1994/95 Marketrng Yeor
/'-----r ------ Marze Board Prfce -+- Producer Price t _ MB-P Margin ~ Expert Revenue \ ...
~ World Price I '" )
Figure 6 Real White Maize Domestic and World Price Trends, 1970171 - 1992/93 (Source .' Abstract of Agricultural Statistics, 1995 and Agricultural Outlook Economic Research Service, USDA, 1994).

29
Although the real }.{aize Board price has fallen since the mid 1980's, the real producer price
has fallen more rapidly, thus raising the levy (up to Rl85/ton for the 1994/95 season) to cover
real export losses. Dissatisfaction with these developments led to a Supreme Court lawsuit
contested between the Concerned Buyers Group (CBG)2 and the Maize Board, National
Marketing Council and Minister of Agriculture. The CBG refused to pay the Maize Board
levy of Rl85/ton (white maize) for the 1994/95 season because of alleged discriminatory
application of existing legislation - some 500 small mills or "bosmeulens" had entered the
market circumventing official channels and avoiding levy payments without being prosecuted.
The Maize Board in response held back R39,5 million in processor guarantees due to non
payment of the levy. Judgement was handed down on 2 December 1994 in favour of the
Maize Board, National Marketing Council and Minister of Agriculture with the CBG having
to pay all outstanding levies and court costs (Claassen, 1995). The "bosmeulens" (joint
processing capacity about 1.25 Mt whereas total annual white maize consumption is 4 - 5 Mt)
could represent potential competition (standby authority) to the CBG in rural areas. Entry of
these "bosmeulens" reflects both "1atent" contestabi1ity and increased contestability in the sense
that regulations were not being enforced on them.
The Minister of Agriculture established a number of connnittees to investigate maize marketing
in South Africa during 1987 - 1995. The Connnittee of Inquiry into the Marketing Act in 1992
(Kassier Report) recommended the replacement of single channel marketing by market
liberalization and voluntary payment of levies (as enforcement and collection are a major
problem), based on the principles of individual freedom of choice, efficiency, equity,
The Concerned Buyers Group consisted of Tiger Foods Ltd, Premier Food Industries Ltd, Epol (Pty) Ltd, Rainbow Chicken Farms (Pty) Ltd, Godrich Flour Mills (Pty) Ltd, Foodcorp Group (Pty) Ltd, Piet Retief Grain and Malt CC, and Hagers Industries CC.

30
sustainability, food security and comparative advantage. Members of the Agricultural
Marketing Policy Evaluation Committee (AMPEC) in 1994 held that deregulation of
agriculture should be part of integrated liberalization of the total economy - the marketing
scheme should be transparent and free of political interference in line with freedom of
economic association. Large scale dissatisfaction with past restrictive regulations and
mounting market pressure finally saw the 1994 Swart Committee established to arbitrate
between interest groups to fonnulate a new maize marketing scheme for implementation on
1 May 1995, as described overleaf

31
2.4 THE "NEW" MAIZE MARKETING SCHEME AND INDUSTRY
STRUCTURE (1 MAY 1995 ONWARDS)
The Swart Committee proposed a new scheme which captures much of the goals of market
reform as discussed by Cownie (1992), Van Zyl and Nieuwoudt (1990) and LAPC (1993b).
Proposed amendments to the Summer Grain Scheme were gazetted on the 15 December 1994
and finalized in Government Gazette Notice 16363, No. R.552 of19 April 1995 with effect
from 1 May 1995. In short, the Statutory Single Channel Fixed Price Pool Scheme and storage
control are relinquished and producers are allowed "free" trade within the domestic market (as
shown in Figure 7, compare with Figure 5), with a floor price system to support producer
prices in so-called "surplus" years through an agreed formula, whereby producers may sell to
the Maize Board at the floor price for the export pool. Price fixing and restrictive trading are
replaced with free interaction between producers and buyers so that prices are detennined in
the market place. Producers are now responsible for the storage and transport of their maize.
The Maize Board still retains its producer majority composition, statutory powers such as
compulsory levies ani registration and the sole rights to export maize grain from South Africa.

32
Department o( Agricultural Economics
National Marketing Council
Export, int&m,tional Mlfk&l
MIiz.801111
Domestic Market
[un 13puf ~upplitr J 811at1cH FH4 Wllllimn.
Wholesaler to Mai .. Ba •• dProthcl8 • A"iMalProCllcl8
Retailer (90%) or
/MuOtai Proc.saorr Retailer Direct (10%)
Stock Fttdtta
/mpotll
Figure 7 Proposed New Maize Scheme (1 May 1995), Production and Distribution Channels for Maize and Maize Products (Source: Government Gazette Notice 16172 of 1994, Regulation 2205 and Swart, 1994).

33
A Compulsory Producer Levy is still payable to the Maize Board to fund the General Fund
which covers administration, promotional services and the Reserve Fund. For the 1995/96
marketing year the levy totals RIO.51 (R9.22/t + 14% VAT (R1.29) and is composed of:
Board's Administration costs (R6.43); Promotional services (RO.64); Product Development
and maize grain research (RO.08); Foreign visits and entertainment of foreign guests (RO.20);
Image-building programme (RO.20); Operational budget of NAMPO (RO.97); and a
contribution to the Summer Grain Centre by NAMPO (RO.70). A general levy for SAAU
(South African Agricultural Union) ofRO.09 is also payable (Leisegang, 1995).
A Statutory Stabilization (Special) Levy is also to be imposed for a stabilization fund. This
levy is payable on all maize sold commercially and is .not payable on maize delivered to the
export pool (Leisegang, 1995). The fund will support producer prices in so-called "surplus"
production years. The stabilization levy is calculated annually prior to the start of the financial
year taking average annual commercial domestic consumption, railage and harbour costs into
account according to equation (5) :
where Z =
A =
B =
Z = [30%(A + B) * (C + D)]
A (5)
The amount (RIt) of the special levy to be calculated (exclusive of
VAT),
Average annual commercial domestic consumption of maize (RIt)
during the immediately preceding three (3) years,
One (1) million tons,

c =
D =
34
Railage costs (RJt) of maize over a distance of 935 kIn on date of
calculation, and
Harbour costs (RJt) in relation to the export ofma.ize, as agreed upon
between the Board and suppliers of services concerned for each
particular year.
For the 1995/96 marketing year it totals R52.63/t (R46.17/t + 14% VAT (R6.46». The
Board's export pool is funded form the Stabilization Fund and the price support is calculated
according to (6) :
where Y =
c =
D =
E =
Y =C+ D + E (6)
The amount (RJt) to be calculated
Railage costs (RJt) of maize over a distance of 935 kIn on date of
calculation
Harbour costs (RJt) in relation to the export of maize, as agreed upon
between the Board and suppliers of services concerned for each
particular year.
Maize Board costs (Rlt) in connection with handling,
fumigation, storage and financing ofmaize to be exported, as
determined by the Board prior to the commencement of the
financial year concerned.
35
The total amount payable in levies in the 1995/96 marketing year is therefore R63.23/t (R46.17
+ R9.22 + 14% VAT +RO.09). The 1994/95 season dispute over levy payments indicates that
major market participants are opposed to the current regulation.
The Ma.iu Board remains the sole exporter of who Ie maize and will administer an export pool.
In times of domestic undersupply the Board may supply the domestic market with maize from
the export pool sold on a tender or auction basis and will be responsible to pay the special levy.
The price will be free-on-rail and shall after addition of transportation costs from the silo
concerned, not be lower than the estimated landed cost of USA #2 yellow maize on the buyer's
premises plus R20/t, so as to prevent unnecessary imports (Leisegang, 1995). The Maize
Board is thus able to compete directly with importers. Maize or maize products may only be
exported by persons authorized under permit from the Maize Board.
Compulsory registration, submission of returns and record maintenance is still in place. The
Board also retains the right of inspection, seizure and entrance to property, vehicles,
information, books and docwnents relating to maize or maize products. Failure of which may,
on conviction result in a maximum fine of RSOOO or two years imprisonment or both. In
practice, for example with mill registration, if an applicant fulfils the necessary requirements
of the mill being erected on a fixed premises, allows inspection and completes all the necessary
forms, the Board cannot (and has not since 1978) refused registration (De Nysschen, 1994).
The Maize Board will operate an information service concerning marketing conditions. Maize
can be imported by anyone subject to phyto-sanitary conditions laid down by the Minister of
Agriculture and an import tariff determined by the Board of Tariffs and Trade (the tariff is

36
currently zero).
The effects of the "new" scheme on contestability of maize grain marketing are discussed in
Chapter 4. The next section descnbes trends in miller structure and maize marketing margins
since 1971.
2.5 TRENDS IN MILLER STRUCTURE AND MAIZE MARKETING MARGINS
IN SOUTH AFRICA SINCE 1977178
2.5.1 Miller Structure
Table I gives descriptive statistics of maize millers in the South African Milling Industry for
the period 1977 - 1993. 1k Industry is dominated by about five large Millers who in anyone
year will each individually process more that 100 000 tons of maize. The number of small
millers (processing less than 1000 tons per annum) more than doubled between 1989/90 -
1993/94, from 101 to 251. The number of new "bosmeulens" (small mills not registered with
the Maize Board) increased by more than 500 (joint processUtg capacity about 1.25 Mt) in the
1994/95 season, due mainly to their being able to bypass official channels and so avoid paying
the current levy ofR185/t on maize purchases from the Maize Board (Payne et ai .. 1994).
The three largest firms in the industry (three firm concentration ratio - CR3) accounted for
52% of the market in 1977178 and 47% in 1993/94. This compares with the CR3 of50%
found by Ahmadi-Esfahani and Jensen (1994b) in the Australian Wheat Processing industry.
Ahhough there has been a relative decline in the level of concentration over the study period,

37
concentration is still relatively high.
Table I South African Maize Miller Structure, 1977 - 1993
Year Number Number of Registered Millers Processing Different Maize Tonnages of CRJ Ratio
> 1 00000 tons 50000-99999 10000-49999 1000-9999 1-999 Millers tons tons tons tons
1977178 174 7 2 19 75 71 0.52
1978179 155 2 2 4 31 116 0.56
1979/80 167 7 2 17 60 81 0.53
1980/81 170 6 4 14 56 90 0.53
1981182 160 7 2 13 53 85 0.55
1982/83 171 7 3 15 44 102 0.54
1983/84 153 5 4 14 44 86 0.52
1984/85 148 5 1 11 38 93 0.50
1985/86 146 7 3 16 42 78 0.51
1986/87 155 6 3 16 39 91 0.49
1987/88 162 7 3 16 51 85 0.49
1988/89 167 8 2 17 54 86 0.47
1989/90 187 7 2 16 61 101 0.48
1990/91 202 7 2 14 51 128 0.50
1991192 227 6 4 13 55 149 0.50 1992/93 267 3 3 9 47 205 0.49
1993/94 348 6 6 18 67 251 0.47
(Source :Maize Board. 1994).
2.5.2 Maize Board-Miller Marketing Margins
Figu re 8 shows a rising real Maize Board-Miller (MBM) margin in South Africa since 1977.
Between 1977178 and 1986/87 both real Maize Board (P wJ and Miller (P ~ selling prices rose,
but since 1986/87 both PM and PMBbave declined. The margin bas, however, risen overall due
to P MB declining faster than PM' Possible explanations include increased demand for services,
higher real variable costs (such as wages and electricity) per ton of milled maize or costs being
passed on because of market power due to already entrenched market concentration amongst

38
millers. An additional factor could be adoption by the Maize Board of a new pricing policy
in the 1987/88 marketing year, whereby losses on export sales were reflected in a lower net
or blend price for farmers - and hence lower real P ME paid by millers - despite a higher nominal
levy.
900 ---
800 -'
"""' 7 00 .... +-
" ~600 G)
~ 500 CL
l400 -G)
(/) 300 -<
o G)
I:r 200 --) .. ~
! ~ Miller -+- Maize Board : ~ MBM Margin
Figure 8 Time Trend of Real Maize Board - Miller Margin (1990 = 100) (Source : Central Statistical Services, 1994; Directorate Agricultural Economic Trends, 1995).

CHAPTER 3
RESEARCH METHODOLOGY
3.1 CONTESTABILITY ANALYSIS
39
The principles of contestability theory outlined in Chapter 1 will be applied to analyze
regulations affecting the handling and storage of maize grain at the producerlMaize Board
level The intention is to assess trends in contestability at this market level in the Industry since
1931 , given changes in the structure of maize grain marketing described in Chapter 2. The
results of the contestability analysis are given in Chapter 4.
3.2 EMPIRICAL MODEL OF DETERMINANTS OF THE MAIZE
BOARD-MILLER MARGIN
3.2.1 Product Equivalent
Margin analyses relying upon comparisons between prices at successive stages from the farmer
to ultimate consumer must establish comparable physical units, as the product undergoes
tremendous changes in form, composition, processing and packaging before it reaches the
uhimate consumer (Tomek and Robinson 1990). For this study, fixed proportions are assumed
whereby 1 ton of maize meal at miller selling price will be converted using an accepted
conversion factor (80% extraction) to an equivalent tonnage at the producer level (Elliott.
1994). That is, 1.25 ton of raw maize grain is equivalent to 1 ton of maize meal. Price data

40
were collated from a number of sources - .Maize Board (1994), Central Statistical Services
(1994), Directorate Agricultural Economic Trends (1995) and Millers Association (1994).
The data obtained have severely limited the scope of the study as only 17 years of aggregate
mill data for the period 1977-1993 was available on an annual basis. Following Faminow and
Laubscher (1991), price related variables are deflated using the cpr (1990=100).
3.2.2 Empirical Model
Past work by Gardner (1975), Heien (1977), and Wohlgenant and Mullen (1987) on margin
detenninants showed how simultaneous shifts in retail food demand and farm product supply
affected marketing margins using a relative price model. Assuming perfectly competitive
conditions and fixed proportions in production, they fowxi marketing costs, quantity processed
and output prices to be important margin determinants. The Azzam et al., (1989) and
Schroeter and Azzam (1991) margin models of the non-competitive U.S. hog packing industry
outlined in Chapter 1 provided a framework for analysing price spreads by decomposing the
margin into different components. Their principal finding was that the farm - wholesale pork
margin consistently tended toward competitive performance.
They decomposed the margin into cost and market power components by applying iterated
Three Stage Least Squares (3SLS) to quarterly data. Using their approach, the following
demand model for maize meal (equation (7») was estimated as a basis for estimating the effect
(ifany) of miller marketing power on the MBM margin:

41
(7)
where LNQP = natural log of quantity consumed per capita (weighted
sifted meal equivalent) (t),
LNRMP = natural log of real miller white maize meal selling price
(Rlt) ,
LNRPBB = natural log ofreal brown bread flour selling price (RIt),
LNURB = natural log of urbanization proxy variable (% of total
RSA population which is urbanized),
LN!P = natural log of real gross domestic income per capita
(R), and
aJ = Own price elasticity of demand for milled white maize
at miller level.
The variable LNRMP, is expected to be negatively related, and LN!P positively related, to
LNQP ifmaize meal is perceived as a normal good (the reverse holds for LN!P if maize meal
is perceived to be an inferior good by consumers). Although potatoes and rice are observed
to be maize meal substitutes, Sartorius von Bach and Van Zyl (1994) found brown bread to
be the most consistent substitute for maize meal over 1984 - 1990 in South Africa. This
implies that LNRPBB would be positively related to LNQP. A negative relationship between
LNURB and LNQP is anticipated as consumers are expected to switch away from foods which
are t~ consuming to prepare (like maize meal based dishes) with increased urbanization. The
double-log model (Gujarati, 1988) enables direct estimation of the own price elasticity of

42
demand for milled white maize at miller level (a,). This statistic is used in the marketing
margin model to derive an estimate of miller marketing power.
The maize margin model utilizing information on a, was adapted from Azzam et ai., (1989).
Assume that the input (maize grain) is processed into a single homogeneous product (white
maize meal). Each miller uses a production technology such that the production relationship
between input and output is one offixed proportions. Non-farm inputs (C) such as labour and
electricity, useable in variable proportions, are used to convert maize grain into maize meal.
The Industry (maize millers) faces a supply function for the farm product under competitive
conditions :
(8)
and a demand function for its output :
(9)
where PF and PM are the prices of the farm product (maize grain) and processed item (white
maize meal), respectively, and Z, and Z] are the vectors of exogenous variables (Z] equivalent
to LNRPBB, LNURB and LNIP in equation (7» .
An individual processing firm's profit maximization position under the given industry supply

43
and demand conditions would be achieved by processing the quantity which would maximise
equation (10) :
where PM = Price of processed food item.
PF = Price of farm product,
Qi = Quantity processed by /h processing firm, and
CJ = Marginal cost of/' processing firm.
The first order necessary condition for optimal output is equation (11) :
where J.I =
=
=
(OHJiJP~PMIQ, the elasticity of industry demand,
(aJl iJPF)PF IQ, the elasticity of agricultural input supply, and
(~/~i)Qi IQ. the jib firm's conjectural elasticity.
(10)
(11)
The conjectural elasticity is an index of the firm's market power. If the firm is a price taker
under purely competitive conditions, (}1 would equal zero.

44
Equation (11) can be rearranged to give equation (12) as the marketing margin model:
(12)
where M = Farmer - Miller marketing margin.
Assuming that the! finn possesses some market power (that is, (}I> 0) the marketing margin
will exceed marginal costs by two positive terms, -P ".{}Il fJ (positive because fJ is negative) and
P 1}lIE, which are respectively the monopoly/oligopoly and monopsony/oligopsony price
distortions.
The study MBM margin model, adapted from equation (12) is :
(13)
where MBM = Real Miller-Maize Board margin (Rlt),
RMP = Real miller white maize meal selling price (Rlt),
RTVCOP = Real total miller variable cost of production (Rlt),
Dl = Dummy variable for 1987 Maize Board maize grain
price policy change (D 1 = 0 for 1977-1986 and 1 for
1987-1993), and
hI = -(8'0,), as 0, is negative.

45
The Maize Board-Miller margin is a better representation than the Farmer-Miller margin
of the South African maize grain marketing situation, as the Maize Board was officially the
sole buyer of maize from producers (monopsony) and sole seller (monopoly) of maize to
millers over the study period. This was also the rationale for dropping the monopsony term.
since the Maize Board as sole seller could restrict any input oligopsony power by millers. The
dummy variable D 1 was added to show the effect of the Maize Board maize grain pricing
policy change which occurred in May 1987. The coefficient bl should equal-(8/p), that is,
the l' firm's conjectural elasticity divided by the miller level price elasticity of demand for maize
meal. However, given that only aggregate industry data was available, 8 is replaced by 8
(industry conjectural elasticity) and p estimated by QI from equation (7). The industry market
power (8) can be estimated in absolute terms as :
(14)
It is expected that MBM would be positively related to RMP, RTVCOP and D 1. The results
in Chapter 4 show how the above model is used to estimate the detenninants of the MBM
margin.

CHAPTER 4
RESULTS
46
4.1 TRENDS IN CONTESTABILITY OF MAIZE GRAIN MARKETING SINCE
1931
Contestability of maize gram marketing after 1931 was largely restricted through the statutory
powers of the Maize Board acting as legal barriers to entry. The regulations (explained in
Chapter 2) included : Price fixing (prohIbiting any person acquiring, selling or disposing of any
maize or maize products at any price other than at a fixed price); Restrictive trading and
pennits (prohIbiting any person from selling or purchasing maize except to or through Maize
Board agents in controlled areas; Compulsory levies imposed on maize of any class, grade or
quality sold and payable by maize producers, millers, feed manufacturers, stock feeders,
importers and exporters to finance the General, Reserve and/or Special Funds; and Compulsory
registration (each person dealing in the course of trade with maize had to register with the
Board and comply with its requirements).
Marketing reforms prior to the "new" scheme in 1995 eased some of the constraints on
contestability. For example, abolition of controlled prices for maize products at retail/merchant
(1960) and wholesale/milling (1971) levels and a movement away from limited registration of
maize processors in 1977 which allowed for the emergence of small processors called
"bosmeuIens". The prohIbition on the erection of grain silos was repealed; and the Grain Silo
Connnittee and price control on maize meal were also scrapped (Rees, 1979; Financial Mail,
1991; Cownie, 1992). In 1987 the Board shifted away from price determination at Cabinet

47
level to a market-based, pool type pricing scheme. Annual subsidization of the Maize Board's
handling and storage costs was phased out, and pennission granted for free transactions
between farmers and processors/consumers subject to the payment of Maize Board levies
(LAPC, 1993a; LA PC, 1993b; Financial Mail, 1991; Cownie, 1992 and GATT, 1993).
Removal of subsidies on maize production and debt write-offs to farmers and cooperatives of
RJ.4 billion also occurred in the 1992/93 season.
The "new" maize marketing scheme introduced on the 1 May 1995 promoted contestability
in allowing free interaction between producers and buyers on the domestic market. However,
the retention of Maize Board control over maize grain exports, and certain remaining statutory
powers (compulsory levy and registration), still constrain contestability. The producer, under
a freer market will be faced with greater price uncertainty (implying greater financial risk) as
he is now responsible for storage, transport and the marketing of his crop. Sentraalwes Co
operative initiated electronic maize marketing in conjunction with the Agricultural Marketing
Exchange (AMEX) in August 1995 with an auction price ofR793.43/t for Grade 1 white
maize on 16 August 1995. Besides selling direct to the processor or auctioning his crop via
AMEX. the producer may via the South African Futures Exchange (SAFEX) enter into either
(i) forward contracts introduced in July 1995 (SAFEX, 1995) or (ii) manage price risks by
hedging in futures contracts on SAFEX which began on 26 February 1996. A futures market
can provide opportunities to hedge risk and provide useful public information on prevailing
prices (Frank, 1992). The lifting of foreign exchange controls could also open up international
cormnodity exchanges (eg. Chicago Board of Trade) to local traders and infuse liquidity into
SAFEX (Gravelet-Blondin, 1996) .

48
Any restraints on market exit discourage entry and thereby reduce the competitive threat posed
by the availability of potential entrants (Bailey and Baumol, 1984). There are about 220 grain
silos in South Africa owned by the Maize Board's agents, mainly agricultural cooperatives,
with a storage capacity of some 14.5 million tons (Financial Mail, 1991). These storage forms
require substantial, virtually irreversible capital investment - implying considerable sunk cost,
costly exit and limited contestability. The current replacement cost of these silos is estimated
at a conservative R3 billion or about R207/t (Financial Mail, 1991). Alternative technologies,
actually or potentially available, may permit cost reductions. Even if the standard technology
is least-cost, the availability of these alternatives may provide a competitive constraint limiting
the extent to which the cooperatives current monopoly power can be exerted. More on-farm
storage could become a viable option as market forces generate a whole range of different
storage, transporting and handling facilities and arrangements such as bunker storage, plastic
tunnels, steel silos and lease (rental) agreements. For example, it is possible to erect on-farm
steel silos (200Ot capacity) for approximately Rll Olt and concrete silos (33Ot capacity) for
about R167/t (Viljoen and Brink, 1995).
The leasing of existing silos by producers and maize traders will enhance conte stability (reduce
burden of stmk costs) and permit ease of entry and exit by limiting exclusive access. Silo space
is presently being rented for R38/t from the Natal Agricuhural Co-operative (Natal
Agricultw"al Co-operative, 1995). Co-operatives whichbave supplied farmers with production
credit may though use their credit power to coerce producers to store maize at the local silo
despite on-farm storage possibly being cheaper (Agri-Africa, 1995). Many producers are
constructing their own silos on-farm, supporting the perception that the 220 silos owned by
co-operatives are not economically optimally sited. Any excess capacity which is present may

49
in reality be "dead capacity" and not contribute to contestability (reduction of sunk costs).
Maize silos can be used to store other bulk crops ego wheat, sorghum, swrllower, soya and
cassava Such alternative uses raise the opportunity cost and therefore increase contestability
(ease exit from maize).
Technological change (small truck mounted mills) and the ease with which "bosmeulens" have
entered the market reflect either (i) a degree of contestability that existed even under restrictive
regulatory conditions, or (ii) the perception of small mills that these regulations cannot be
enforced. Compulsory payment of levies constrains entry, distorts prices, limits freedom of
economic activity and limits contestability. It is expected that large firms (millers) may
negotiate growing contracts with maize fanners or vertically integrate by purchasing maize
farms so as to internalize the benefits and avoid levy payments. It is difficult to foresee how
the Maize Board intends to police compulsory levy payments in a system which allows "free
trade" and creates the incentive to avoid levy payments. The costs of policing the system may
well exceed the benefits accruing to the Board.
The Maize Board will be the sole exporter of maize grain under the new scheme. Collective
export D!gotiation does not necessarily (and should ideally not) require a monopoly, statutory
or otherwise. It is often best done on a voluntary and/or competitive basis which puts
additional pressure on the negotiating body to be effective so as to facilitate contestability. For
example, South African {\vocado Growers have had much success with voluntary collective
export negotiation under competitive conditions (Groenewald, 1989). The single channel
export scheme may also be challenged under the new South African constitution (freedom of
association and freedom of economic activity). Furthermore, if a futures market is to be

50
established -and investment from multinational maize trading firms (e.g. Cargill) secured in
South Africa, then the single channel export scheme needs to be abolished so that private
concerns can trade and hedge in the international market. Continuing opposition to
compulsory levy payments, particularly by processors, may well cause the collapse of the
present floor price and single channel export scheme which relies on these payments (Gravelet
Blondin, 1996) .
Phyto-sanitary conditions and an import tariff (currently zero) are the only restrictions on the
importation ofmaize into South Africa As long as the tariff set remains in line with the GATT
and does not constitute a significant barrier to entry preventing actual or potential competition,
contestability should not be obstructed. The Maize Board could well use its position as
advisor to the Minister on phyto-sanitary conditions as a mechanism to exert control over
maize imports. In October 1995, phyto-sanitary requirements were reviewed for a shipment
of maize from the USA for the bacterial disease caused by Erwinia stewardi. Pencits were
granted for the importation of the maize subject to strict control over port of import, transport
and milling of the uncertified maize (B/ignaut, 1995).
4.2 MARGIN DECOMPOSITION AND MARKET POWER
4.2.1 Correlation Matrix
The corre1ation matrix in Table II shows that LNQP (log of sifted meal equivalent consumed
per capita) is negatively correlated at the 10% level of significance, with LNRMP (log of real

51
miller white maize selling price) - when the real price of maize meal increases, less maize meal
will be conswned. The correlation betweenLNQP and LNRPBB (log ofreal brown bread flour
selling price) is highly positive (1% level of significance), as expected, since maize meal
consumption is likely to increase as the price of brown bread (substitute) increases. The high
negative correlation (1 % level of significance) of LNQP with LNURB (log of percentage of
total RSA population which is urbanised) reflects consumers switching to more time saving
foods, such as bread, as urbanization increases (Nieuwoudt, 1994). The income variable,
LNIP, is positively correlated (20% level of significance) with LNQP, but one would expect
a negative correlation if maize na1 is an inferior good. EIliott (1991), however, found maize
meal to be a normal good for the black segment of the population who consume an estimated
94% of all maize meal produced in South Africa. MuhicoIIinearity may be present as LNRP BB
and LNURB are highly negatively correlated.
Table II Correlation Coefficients Between Demand Model Variables
LNQP LNRMP LNRPBB LNURB LNIP
LNQP 1.0000 -0.3179· 0.8384··· -0.9091··· 0.156'r'
LNRMP -0.3179· 1.0000 0.1206/11 0.0689··· -0.13 90""'
LNRPBB 0.8384··· 0.1206/11 1.0000 -0.8802··· 0.040QIII
LNURB -0.9091··· 0.0689··· -0.8802··· 1.0000 -0.0855/11
LNIP 0.156~ -0. 139Q111 0.0400'" -0.0855/11 1.0000
where ••• , •• , • and ns represent respectively the 1 %, 5% and 10010 levels of significance and
no statistical significance.
In Table III, the expected positive relationship between MBM (real Maize Board-Miller
marketing margin) and RMP (real miller white maize meal selling price) is shown, although
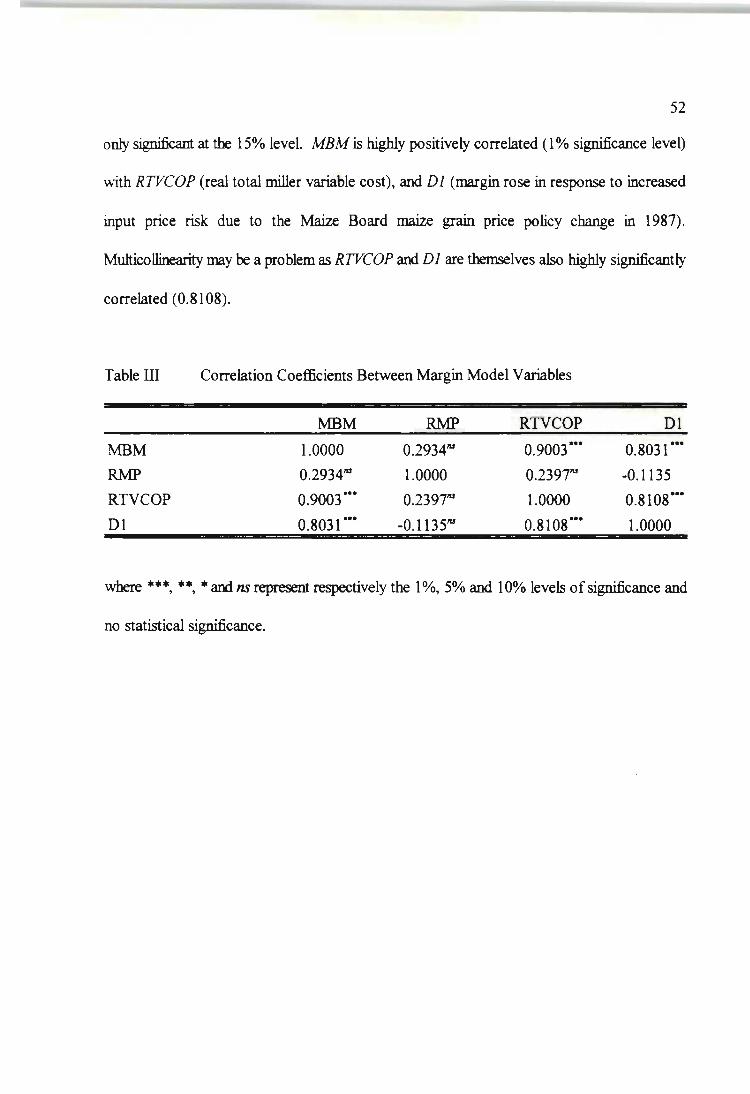
52
only significant at the 15% level. MBM is highly positively correlated (1 % significance level)
with RTVCOP (real total miller variable cost), and DI (margin rose in response to increased
input price risk due to the Maize Board maize grain price policy change in 1987).
Muhicollinearity may be a problem as RTVCOP and DI are themselves also highly significantly
correlated (0.8108).
Table III Correlation Coefficients Between Margin Model Variables
MBM RMP RTVCOP D1
MBM 1.0000 0.2934'" 0.9003'" 0.8031"·
RMP 0.2934'" 1.0000 0.2397'" -0.1135
RTVCOP 0.9003··· 0.2397'" 1.0000 0.810So ••
D1 0.8031··· -0.1135'" 0.8108"· 1.0000
where ••• , •• , • and ns represent respectively the 1 %, 5% and 10% levels of significance and
no statistical significance.
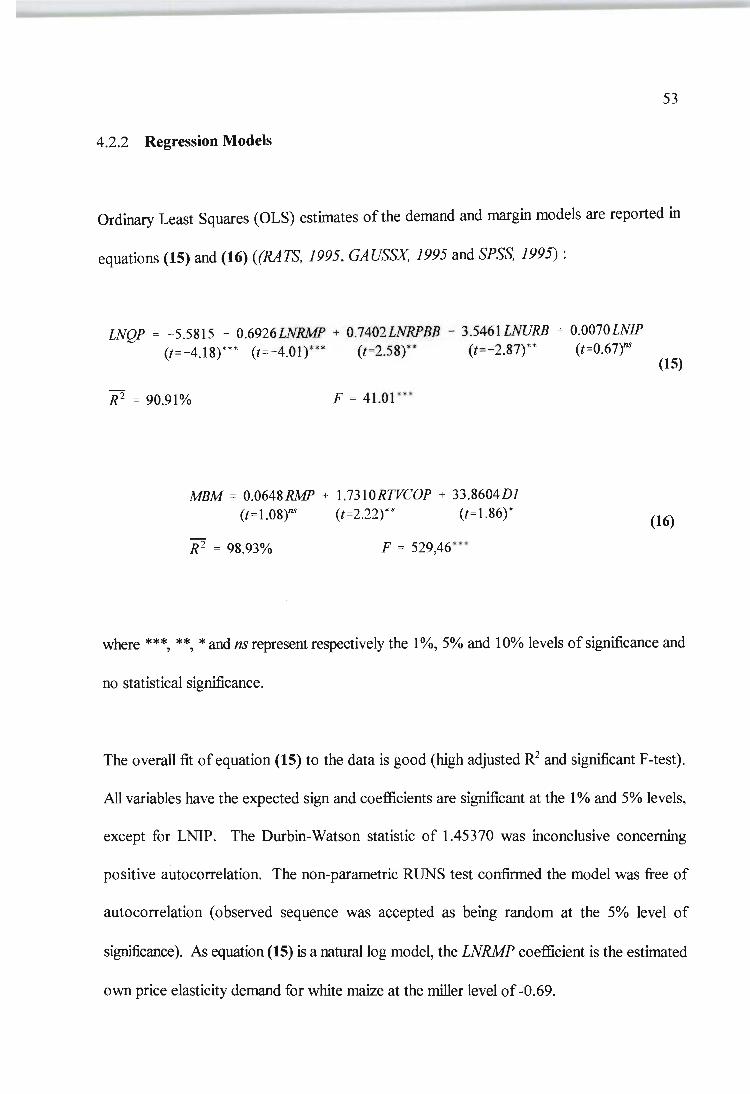
53
4.2.2 Regression Models
Ordinary Least Squares (OLS) estimates of the demand and margin models are reported in
equations (15) and (16) «(RATS, 1995, GAUSSX 1995 and SPSS, 1995) :
LNQP = -5.5815 - 0.6926LNRMP + 0.7402LNRPBB - 3.5461LNURB + 0.0070LNIP (1=-4.18)*** (1=-4.01)*** (1=2.58)** (1=-2.87)** (t=0.67)ns
(15)
R2 = 90.91% F = 41.01 ***
MBM = 0.0648RMP + 1.7310RTVCOP + 33.8604DJ (t=1.08r (t=2.22)* * (t=1.86)* (16)
R2 = 98.93% F = 529,46 ***
where ***, **, * and ns represent respectively the 1 %, 5% and 10% levels of significance and
no statistical significance.
The overall fit of equation (15) to the data is good (high adjusted R2 and significant F-test).
All variables have the expected sign and coefficients are significant at the 1 % and 5% levels,
except for LNIP. The Durbin-Watson statistic of 1.45370 was inconclusive concerning
positive autocorrelation. The non-parametric RUNS test confirmed the model was free of
autocorrelation (observed sequence was accepted as being random at the 5% level of
significance). As equation (15) is a natural log model, the LNRMP coefficient is the estimated
own price elasticity demand for white maize at the miller level of -0.69.

54
In equation (16) the variables have the expected signs and the regression was fitted through
the origin because theory predicts that marginal cost is linearly homogenous in factor prices
(Schroeter and Azzam ,1991). Ifcosts were the sole component of the margin, then when
costs of processing are zero, the margin would be zero. This assumption was validated by re-
running the regression with a constant term which had a non-significant coefficient. No
autocorrelation was detected using the RUNS test. Multicollinearity may, however, be present
due to the high adjusted R2 and small t value on RMP, although RTVCOP and D1 coefficient
estimates are significant at the 5% and 10% levels. Multicollinearity is a sample phenomenon
and has no unique method of detection or remedy (Gujarati, 1988).
Following Azzam et a/., (1989) and Schroeter and Azzam (1991) , a 3SLS model, where the
endogenous variables (RMP, LNRMP, LNQP and MBM) are jointly determined, was estimated
for the demand (equation (17») and margin (equation (18») models (RATS, 1995 and GAUSSX,
1995) :
LNQP = -6.6866 - O.3982LNRMP + 0.4524LNRPBB - 4.7284LNURB + O.OI13LNIP (t=-4.39)"" (t= - 1.67)'" (t= 1.53 )/IS (t=-3 .73)*·· (t=1.l2)/IS
(18)
R2 = 88.54% F = 2. 14/1S
MBM = O.0732RMP + 1.6264RTVCOP + 35.5172DI (t=1.l5YU (t =1.99)* (/=1.96)*
(18)
R2 = 81.63% F = 1777.8···

55
The system model estimates an own price elasticity of demand for milled maize at the miller
level of -0.3982 which is plausible, although anticipated to be higher, as the elasticity is
expected to increase with an increase in the number of substitutes (eg. brown bread, potatoes
and rice). Elliott and Van Zyl (1991) used bar code scanning data to estimate price elasticity
of demand for maize meal in urban regions (consumer level) at -0.69. Van Zyl (1986) and Van
Zyl and Nieuwoudt (1990) estimated the own price elasticity of demand of white whole maize
at the Maize Board level to be -0.149, and -0.14 (relatively inelastic).
A variable accounting for output price risk in the industry similar to that used by Brorsen et
al. , (1985) am F aminow and Laubscher (J 991) had a statistically insignificant coefficient and
was therefore dropped from the analysis. Input price risk effects are probably captured by D1
accounting for the 1987 Maize Board pricing policy change (see above).
The estimated conjectural elasticity (0.029) lies within the range found by Azzam et al., (J 989)
of 0.0564 to -0.0004 in the US hog industry. The conjectural elasticity estimate appears to
support the millers' claim that the industry is highly competitive despite high miller
concentration as nasured by the CRJ of 47% in 1993/94, ahhough the CR3 has trended
downwards since 1977178 (see section 2.5).
The margin was decomposed into its different components in equation (18) as shown in Table
IV. Estimated values (obta!ned byp1acing actual data for RMP, RTVCOP and D1 in equation
(18» are similar to the actual recorded figures. The cost and policy change components are
important determinants as expected, while the oligopoly component, despite low market
power, contnbutes m:>re than the policy change. The low market power measure may reflect
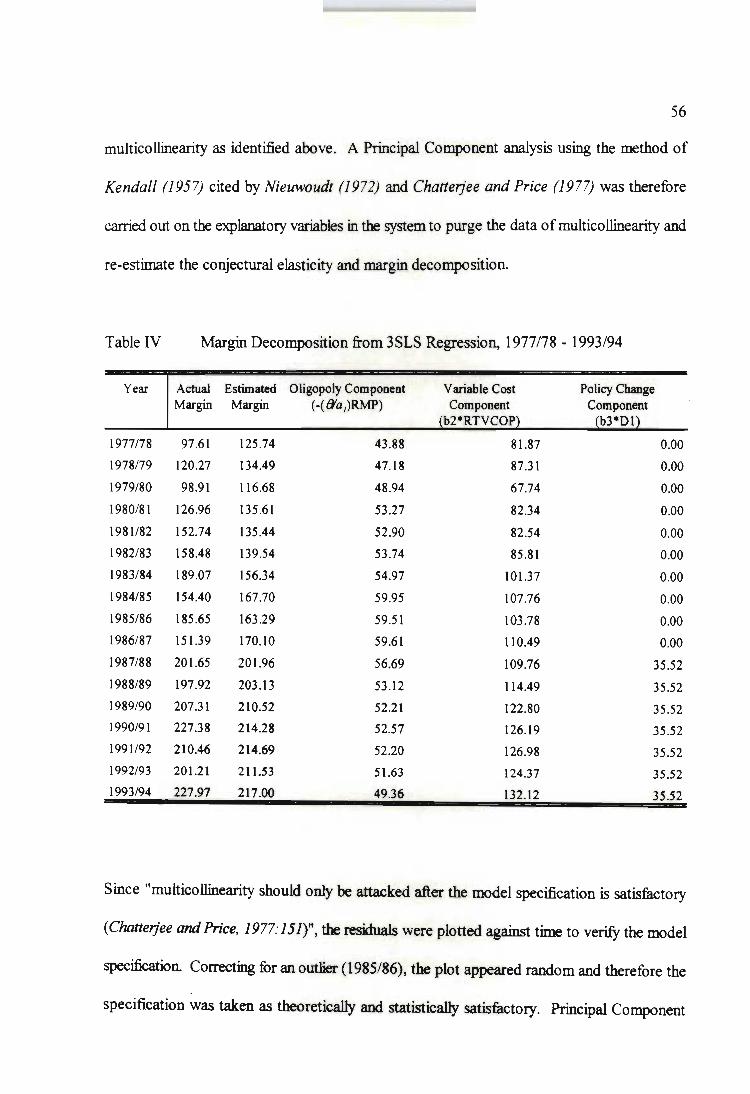
56
multicollinearity as identified above. A Principal Component analysis using the method of
Kendall (1957) cited by Nieuwoudt (1 972) and Chatterjee and Price (1977) was therefore
carried out on the explanatory variables in the system to purge the data of multicollinearity and
re-estimate the conjectural elasticity and margin decomposition.
Table IV Margin Decomposition from 3SLS Regression, 1977178 - 1993/94
Year Actual Estimated Oligopoly Component Variable Cost Margin Margin (-( 8'a I)RMP) Component
b2*RTVCOP
1977178 97.61 125.74 43 .88 81.87 0.00
1978179 120.27 134.49 47.1 8 87.31 0.00
1979/80 98.91 116.68 48.94 67.74 0.00
1980/81 126.96 135.61 53.27 82.34 0.00
1981 /82 152.74 135.44 52.90 82.54 0.00
1982/83 158.48 139.54 53.74 85.81 0.00
1983/84 189.07 156.34 54.97 101.37 0.00
1984/85 154.40 167.70 59.95 107.76 0.00
1985/86 185.65 163.29 59.51 103.78 0.00
1986/87 151.39 170.10 59.61 110.49 0.00
1987/88 201.65 201.96 56.69 109.76 35.52
1988/89 197.92 203.13 53.12 114.49 35.52 1989/90 207.31 210.52 52.21 122.80 35.52 1990/91 227.38 214.28 52.57 126.19 35.52 1991/92 210.46 214.69 52.20 126.98 35.52 1992/93 201.21 211.S3 51.63 124.37 35.52 1993/94 227.97 217.00 49.36 132.12 35.52
Since "multicollinearity should only be attacked after the model specification is satisfactory
(Chatterjee and Price, 1977:151)", the residuals were plotted against time to verify the model
specification. Correcting for an outlier (1985/86), the plot appeared random and therefore the
specification was taken as theoretically and statistically satisfactory. Principal Component

57
Analysis is justified since "the basis of any analysis of multicollinearity is found in the structure
of the correlations among the explanatory variables. Since correlations are unaffected by
shifting or scaling the data, it is both sufficient and convenient to deal with standardized
variables (Chatterjee and Price, 1977: 160)".
Four principal components for the demand model (PCD's) and three principal components for
the margin model (PCR's) were extracted using GENSTAT (1995) as shown in Table V and
Table VI.
Table V Principal Components Extracted for Demand Model
ZLNRMP
ZLNRPBB
ZLNURB
ZLNIP
Variable
Latent Root (Eigenvalue)
Percentage Variation
Princi}2al Component
PCDI PCD2 PCD3
0.16248 -0.87627 0.41251
0.59890 0.17070 0.42666
-0.58412 -0.33679 -0.15518
0.52318 -0.29930 -0.78976
2.384 1.129 0.393
59.59 28.22 9.83
PCD4
-0.18865
0.65585
0.72200
0.11392
0.094
2.36
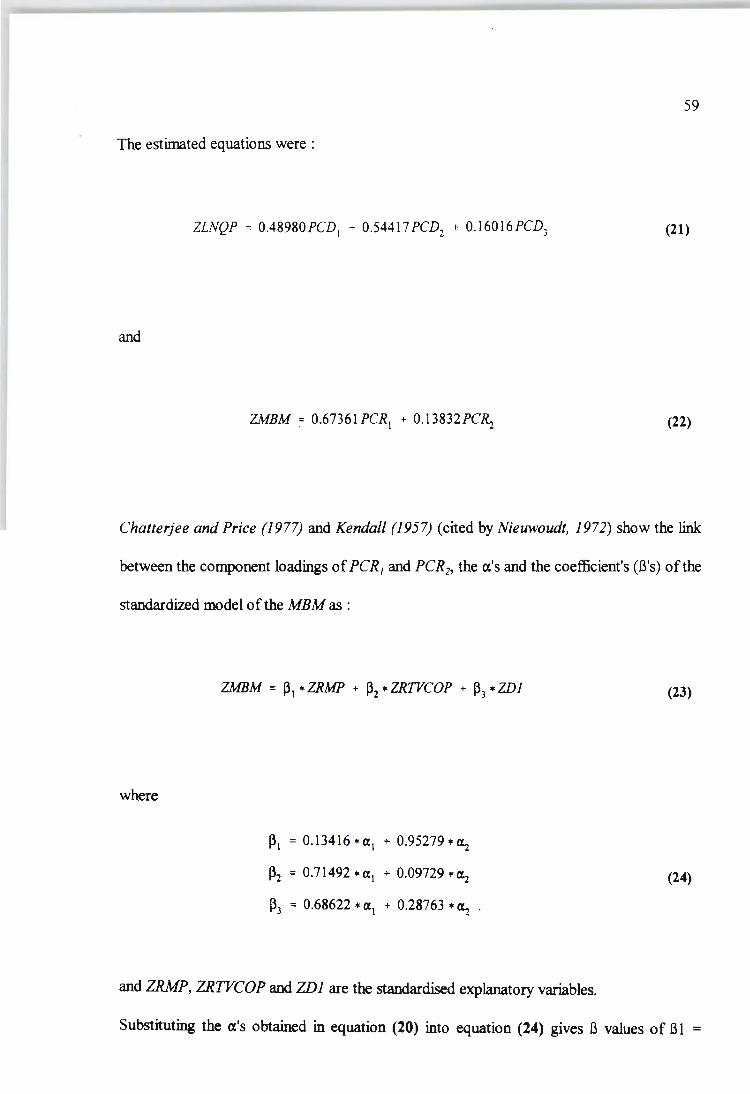
59
The estimated equations were :
ZLNQP = 0.48980PCDI + 0.54417PCD2 + 0.16016PCD) (21)
and
2MBM ~ 0.67361 PCRI + 0.13832PC~ (22)
Chatterjee and Price (1977) and Kendall (1957) (cited by Nieuwoudt, 1972) show the link
between the component loadings of PCR, and PCR], the a's and the coefficient's (B's) of the
standardized model of the MBM as :
where
~l = 0.13416 • (Xl + 0.95279.~
~2 = 0.71492. (Xl + 0.09729. ~
~3 = 0.68622. (Xl + 0.28763 • ~ .
and ZRMP, ZRTVCOP and ZDl are the standardised explanatory variables.
(23)
(24)
Substituting the a's obtained in equation (20) into equation (24) gives B values of B 1 =

60
0.22216, 32 = 0.49503 and 83 = 0.42246. Similarly, standardized demand model parameter
estimates can be obtained from the p estimates. The t values and significance levels for the
standardized parameter estimates are found by dividing the coefficients by their standard
errors.
The standard errors are obtained from equation (25) :
2 Var (Pi) = L (PCLoadingi * Var <Xi
i= 1
where the variance of the (Xi'S is given by :
where Ai =
(Xi =
n =
k =
2 1- E Ai <X~
i=1 Var (<Xi) = ----
(n - k - 1) Ai
Latent root or Eigenvalue,
Coefficients of equation (20),
Sample size, and
Number of PC's retained.
(2S)
(26)
The resuhant t values for the standardized coefficients are equivalent to those for the variables
in original scale since the correlations of the variables are unaffected by scaling (Chatterjee and

61
Price, 1977). Furthermore, the B's can be transformed back into their original scale (b's) by
multiplying by (Sy/Sx), the standard deviation of the dependent variable divided by the
standard deviation of the explanatory variable. The regression estimates in original scale are
thus bl = 0.15817. b] = 1.74096 and bj = 35.24640 for the margin model and al = -0.69436,
a] = 0.75869, a3 = -3.56436, and a4 = -0.10758 for the demand model.
The demand and margin models in original scale (free of multicollinearity) are thus :
LNQP = -0.06 - 0.69436LNRMP + 0.75869LNRPBB - 3.56436LNURB - 0.10758LNIP (t=-4.04)*" (t=7.35)*" (t=-11.58)*** (t=-0.32YU
(27)
MBM = -69.3623 + 0.15817 RMP + 1.74096RTVCOP + 35.2464Dl (t=2.29)* * (t=8.85)* * * (t= 7 .00)* * * •
(28)
Compared to equations (17) and (18) which are in the same units, the t values have improved
substantially so that all coefficients are now highly significant (except LN!P) with the correct
signs and the demand elasticity has increased to -0.69436. Under the assumption of fixed
proportions, the elasticity of demand for the resource is expected to be similar to that of the
final product (Friedman, 1976). Thus the estimate confirms the use of this assumption and is
consistent with Elliott and Van Zyl's (1991) estimated demand elasticity of -0.69. The market
power term, using this estimated elasticity, is 0.10983, higher than 0.029 but still low, showing
competitive behaviour in the industry. This seems contrary to the concentration ratio level
(although the ratio trends down), but may be explained by the possible existence of excess
62
only a sing1e-shift and shut down at night (Financial Mail, 1991). Cost economies could also
be realised if the larger millers expand output when plants are not operated at full capacity
(Azzam et al. , 1989). The constant term appearing in the margin model is calculated to correct
for the normalization process in determining the principal component loadings of GENSTAT
(1995) and does not affect the underlying theoretical assumption of fixed proportions.
The decomposition of the margin (free of multicollinearity) in Table vn shows that there is a
slight improvement in the predictive power of the model when compared to Table IV as the
estimated values more closely approximate the actual values.
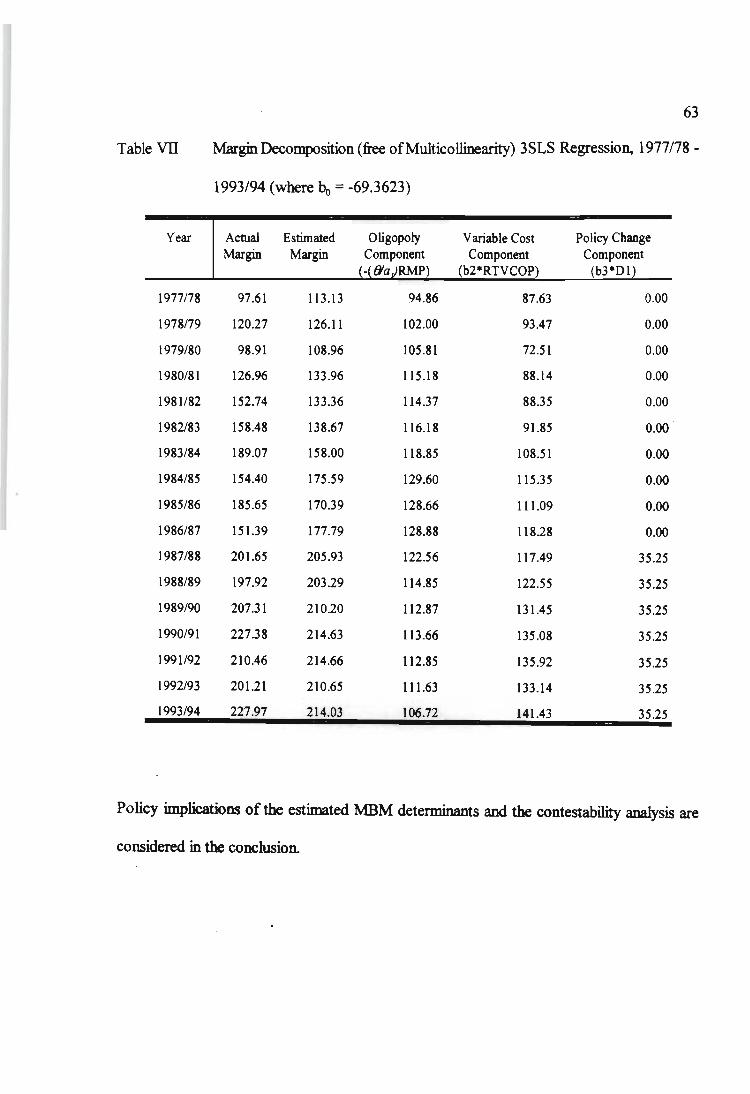
63
Table VII Margin Decomposition (free of Multicollinearity) 3SLS Regression, 1977178 -
1993/94 (where bo = -69.3623)
Year Actual Estimated Variable Cost Policy Change Margin Margin Component Component
(b2-RTVCOP) (b3-Dl)
1977178 97.61 113.1 3 94.86 87.63 0.00
1978179 120.27 126.11 102.00 93.47 0.00
1979/80 98.91 108.96 105.81 72.51 0.00
1980/81 126.96 133.96 115.18 88.14 0.00
1981182 152.74 133.36 114.37 88.35 0.00
1982/83 158.48 138.67 116.18 91.85 0.00
1983/84 189.07 158.00 118.85 108.51 0.00
1984/85 154.40 175.59 129.60 115.35 0.00
1985/86 185.65 170.39 128.66 111.09 0.00
1986/87 151.39 117.79 128.88 118.28 0.00
1987/88 201 .65 205.93 122.56 117.49 35.25
1988/89 197.92 203.29 114.85 122.55 35.25
1989/90 207.31 210.20 112.87 131.45 35.25
1990/91 227.38 214.63 113.66 135.08 35.25
1991192 210.46 214.66 112.85 135.92 35.25
1992/93 201.21 210.65 111.63 133.14 35.25
1993/94 227.97 214.03 106.72 141.43 35.25
Policy implications of the estimated MBM determinants and the contestability analysis are
considered in the conclusion.

64
CONCLUSIONS
The structure of the South African Maize Industry reflects a complex interaction of political,
ecooomic aM historical forces since the Industry was first subject to government intervention
in 1931. Past studies identify numerous Industry interest groups (producers, consumers,
millers, wholesalers, retailers and the Maize Board) and the need for maize market reform.
Between 1931 and 1987 the South African Maize Industry lacked contestability in grain
marketing due to the Single Channel Fixed Price Marketing Scheme and restrictive regulations
including price fixing, restrictive trading, compulsory levies and compulsory registration.
Changes which promoted con testability include the abolition of controlled pricing at
retaiJ/merchant (1960) and wholesa1e/m j))ing (1971) levels and movement away from limited
registration of maize processors (1977). The increase in small market participants
(" bosmeuJens") sm the 1987 reforms when the Board shifted away from price determination
.on a cost-plus basis to a market-based and pool type pricing scheme, reflects increased
contestability.
The "N:ew" Maize Marketing Scheme which rmves away from the Single Channel Fixed Price
Scheme to free trade within the domestic market, increases grain marketing contestability, but
retention of Maize Board control over maize grain exports constrains contestability. The
reduction of sunk costs through rmre on-fimn storage and handling filcilities such as bunker
storage, plastic tunnels, steel and concrete silos, and the leasing of existing silos (possible
excess capacity and ahemative uses) by producers and maize traders could substantially
enhance contestability. The rem>val of remaining restrictive legislation in the domestic market
(compulsory levy payments, registration and return submissions), filcilitating access to "sunk -
65
cost" facilities, and allowing for freer trade in maize exports could well be the most
appropriate way for policy makers to finther enhance contestability (increase ease of entry and
exit) in maize grain marketing. While this section of the dissertation focused on maize grain
handling and storage, further research is needed to analyze contestability in maize processing
and maize meal marketing.
Study results for the estimated determinants of the Maize Board-Miller (MBM) marketing
margin are limited by the small sample size (17 years for 1977 - 1993) and lack offirm specific
data. Future research could possibly source firm specific data through a survey of ·
mi1lersIprocessors in the industry. The maize mj))ing industry is characterized by entrenched,
but declining concentration (CR3 ration fell from 0.52 for 1977178 to 0,47 for 1993/94
season), and firm specific data are needed to provide more in depth conclusions from empirical
work. However, the estimated models show that the MBM margin was positively related to
RMP (real miller white maize meal selling prr.e), RTVCOP (real total miller variable cost), and
Dl (dummy variable for 1987 Maize Board maize grain price policy change whereby export
losses were reflected in lower real net producer prices).
The main co~neot of the MBM marketing margin for 1977 - 1993 was variable processing
costs. A decrease in the real consumer price of maize could possibly be achieved by reducing
the real processing costs of maize ~ particularly with the removal of fixed administered
prr.es ofinputs (like electricity) and moderation ofreal wage (43% of total variable costs for
1993/94) demands in negotiations between trade unions and millers. Foreign exchange and
import controls may, however, still result in the costs of imported inputs remaining relatively
high if the Ram sbJuId weaken further. Maize market hberalization and the resuhant increase

66
in the number of" bosmeuJens" entering the market shows that mill sunk costs may become less
relevant in preventing entry and constraining contestability as the "bosmeulens" are able to
compete with larger millers without incurring as substantial sunk costs.
The 1987 Maize Board maize grain pricing policy change captured the effect of input price risk
on the MBM margin by increasing the margin. Potential changes in pricing policy thus
represented an additional source of risk for maize millers to contend with. This source of risk
will be replaced by market price risk under the "new" scheme. Millers, producers and retailers
will make rmre use of forward contracts am consider trading in newly established white maize
futures contracts to manage this risk. The "oligopoly" component of the MBM margin makes
a smaller contnbution than the variable cost component. The low industry conjectural
elasticity of 0.109 estimated from this component indicates a competitive Maize Milling
Industry over the study period. The cost economies obtained by increasing mill throughput
may have outweighed the incentives fur oligopolistic output restrictions. Miller market power
may possibly be exerted on other products (e.g. wheat) with white maize seen as a loss leader.
That is, millers may exercise market power and make profits on wheat but use maize meal to
increa.se turnover aDd liquidity, where the maize market is more competitive. This
interrelationship between maize and other grains in miller processing decisions is an area for
future research. It remains to be seen whether recent rmves to eliminate price setting of maize
grain by the Maize Board could lower real maize prices and lower the real MBM margin, as
well as opening up new substitution possibilities for mill services. Future research could also
focus on the role which the futures market will play in managing maize price risk and how this
will affect the MBM margin.

67
SUMMARY
Market reform in the South African Maize Industry bas important implications for the South
African Economy as maize is the most important field crop and forms the staple food for the
majority of South Africa's people. The present structure of the Maize Industry reflects a
complex interaction of politica4 economic and historical forces.
Market reform is considered at two levels in the South African Maize Industry : Firstly, the
theory of contestable markets is used to assess regulations concerning maize grain storage and
handling at the producerlMaize Board level Secondly, the determinants of the Maize
Board-Miller marketing margin are identified to assess the impact (if any) of miller market
power on the margin.
The theory of contestable markets (where competitive pressures from potential entrants
exercise strong constraints on the behaviour of incumbent suppliers) is reviewed. The history
of the Maize Marketing Schemes and Industry structure since the promulgation of the 1931
Mielie. Act until April 1995 shows increased contestahility (increased ease of entry and exit
through the reduction of restrictive legislation). Trends in maize miller structure and the Maize
Board-Miller (MBM) margin for the period 1977178 - 1993/94 show relatively high but
declining concentration and a rising MBM margin.
The "New" Maize Marketing Scheme operating from 1 May 1995 fosters contestability by
increased "free" trade within the domestic market, but also restrains contestability by retaining
Maize Board control over maize grain exports. The reduction of sunk costs through possible

68
on-farm storage and handling facilities such as bunker storage, plastic tunnels, steel and
concrete silos, and the leasing of existing silos (possible excess capacity and alternative uses)
by producers and maize traders could substantially enhance contestability. The removal of
remaining restrictive legislation in the domestic market (compulsory levy payments, registration
and return submissions), facilitating access to sunk facilities and allowing for freer trade in
maize grain exports could well be the most appropriate way for policy makers to further
enhance contestability (increase ease of entry and exit) in maize grain marketing.
The MBM margin determinants are estimated by Ordinary Least Squares (OLS) and Three
Stage Least Squares (3SLS) regression analyses. Principal Component Analysis was also used
to purge the data ofmuhicollinearity effects. The MBM margin was positively related to miller
market power (proxied by industry conjectural elasticity), the real miller maize price, real
variable processing costs, and a change in Maize Board pricing policy after 1987 (input price
risk). Reduction of the MBM margin could be achieved by reducing variable costs, particularly
wages and electricity. The estimated conjectural elasticity of 0.109 was low (1.0 would reflect
perfect oligopoly), indicating competitive mi11ing conditions, although concentration ratios
indicate entrenched (but declining) market power. The full effects of the more h"beralized
maize marketing structure are still to be seen.

69
REFERENCES
AGRI-AFRICA. (1995). Mechanisation : Store it in a Sausage. Effective Farming,
Vo1.10(5):310.
AHMADI-ESFAHANI, F. and JENSEN, P. (1994a). Contestability, Sunk Costs and
Deregulation of the Australian Airline Industry: Implications for Agriculture. Contributed
Paper at 38th Annual Conference of the Australian Agricultural Economics Society, Victoria
University, Wellington, Australia.
AHMADI-ESFAHANI, F. and JENSEN, P. (l994b). Structural Constraints Influencing the
Performance of the Australian Wheat Processing Industry. Australian Agribusiness Review,
Vo1.2(1):77-88.
AZZAM, A., PAGOULATOS, E. and SCHROETER, J. (1989). Price Spreads and Market
Power in Food Processing Industries. NEC-165 Working Paper, Number 8.
BAILEY, E.E. (1986). Price and Productivity Change Following Deregulation: The US
Experience. The Economic Journal, Vo1.96: 1-17.
BAILEY, E.E.and BAUMOL, W.J. (1984). Deregulation and the Theory of Contestable
Markets. Yale Journal of Regulation, VoU: 111-13 7.

70
BAIN, J.S. (1962). Ba"iers to New Competition : Their Character and Consequences in
Manufacturing Industries. Harvard University Press, Cambridge, London, UK
BAUMOL, W.J. (1982). Contestable Markets: An Uprising in the Theory of Industry
Structure. American Economic Review, Vo1.72 (1):1-14.
BAUMOL, W.J. and WILLIG, R.D. (1986). Conte stability : Developments since the book.
Oxford Economic Papers, Vol.38:9-35.
BAUMOL, W.J., PANZAR, J.e. and WILLIG, R.D. (1983). Contestable Markets: An
Uprising in the Theory of Industry Structure : Reply. American Economic Review,
Vol.73 (3):491-496.
BAUMOL, W.J., PANZAR, J.e. and WILLIG, R.D. (1988). Contestable Markets and The
Theory of Industry Structure. Harcourt Bruce Jovanovich, Inc., New York.
BERGE~ A.N. and HANNAN, T.R. (1989). The Price-Concentration Relationship in
Banking. The Review of Economics and Statistics, Vol.:291-299.
BLIGNAUT, C.S. (1995). Phyto-sanitary Requirements for Maize Imports. MielieslMaize,
November 1995:51.
BRANN, G.R. (1992). Market Concentration: A South African Perspective. M. Comm.
Thesis, University of Nata! Pietermaritzburg.

71
BROCK, W.A. (1983). Contestable Markets and The Theory of Industry Structure: A
Review Article. Journal of Political Economy, Vo1.91 (2):1055-1066.
BRORSEN, B.W., CHAVAS, J.P., GRANT, W.R. and SCHNAKE, L.D. (1985).
Marketing Margins and Price Uncertainty : The Case of the U.S. Wheat Market. American
Journal of Agricultural Economics, Vo1.67:521-528.
CENTRAL STATISTICAL SERVICE (1988). Census of Manufacturing. Central
Statistical Service, Pretoria.
CENTRAL STATISTICAL SERVICE (1994). Personal Correspondence. Central
Statistical Service, Pretoria.
CHAITERJEE, S. and PRICE, B. (1977). Regression Analysis By Example. John WLley
and Sons, New York.
CLAASSEN, C. (1995). HooggeregshofSpreek Mielieraad Vry. MielieslMaize, January
1995:6.
CLEASBY, R.C.G., DARROCH, M.A.G., & ORTMANN, G.F. (1993). Factors Affecting
the Demand and Supply of South African Yellow Maize Exports. Agrekon, Vo1.32(1):1-5.
72
COWNIE, P.J. (1992). The Maize Industry - Quo Vadis. Paper delivered during AFMA
forum '92 at Pilanesberg Conference Centre, Sun City, Bophuthatswana. Maize Board.
Pretoria.
DARROCH, M.A.G. (1992). Concentration "in the Agricultural Sector. Agrelcon,
Vol.31 (4):332-333.
DE NYSSCHEN, P. (1994). Personal Communication. Maize Board, Pretoria.
DIRECTORATE AGRICULTURAL ECONOMIC TRENDS. (1995). Abstract of
Agricultural Statistics, Government Printer, Pretoria.
ELLIOTT, M. (1991). Comment: Pricing Policy in the Maize Industry: Effects of Price
Sensitivity, Interdependence and Relative Shifts in Income. Agrelcon, VoL30 (3):146-147. "
ELLIOTT, M. (1994). Personal Communication. Maize Board, Pretoria.
ELLIOTT, M. and VAN ZYL, J. (1991). Scanner Data Analysis With Specific Reference
To The South African Carbohydrate Market. Agrelcon, Vo1.30 (2):74-81.
FAMINOW, M.D. and LAUBSCHER, J.M. (1991). Empirical Testing of Ahernative Price
Spread Models in The South African Maize Market. Agricultural Economics, Vo1.6:49-66.

73
FINANCIAL MAIL (1991). The Maize Industry: A Special Report. Financial Mail,
Vo1.122 (5) November:57-76.
FISHER, B.S. (1981). The Impact of Changing Marketing Margins on Farm Prices.
American Journal of Agricultural Economics, Vol.63:261-263.
FOURIE, F.C.v.N. (1993). Economic Concentration: A Survey and Evaluation of Policy
Options. South African Journal of Economics, Vol.61 (3): 134-152.
FRANK, D. (1992). Agricultural Commodity Futures Markets In South Africa. Agrelcon,
Vol.31 (4):313-320.
FRIEDMAN, M. (1976). Price Theory. Aldine Publishing Company, Chicago, U.S.A.
GARDNER, B.L (1975). The Farm-Retail Price Spread in a Competitive Food Industry.
American Journal of Agricultural Economics, Vo1.57:339-409.
GARDNER, B.L. (1979). Economic Analysis of the Regulation of Agriculture. American
Journal of Agricultural Economics, Vo1.61(2):732-740.
GATT: SOUTH AFRICA'S OFFER ON AGRICULTURAL PRODUCTS. (1993).
Government Printer, Pretoria.
GAUSSX (1995). GAUSSX. Version 3.2. Econotron Software, Montreal. Quebec.

74
GENSTAT (1995). Genstat 5. Release 3.1. Lawes Agricultural Trust, Rothamsted
Experimental Station.
GRA VELET-BLONDIN, R. (1996). Personal Communication. The South African Futures
Exchange (SAFEX). Johannesburg.
GOVERNMENT GAZETTE NOTICES. (Various Years). Department of Agriculture,
Pretoria.
GROENEWALD, J.A. (1989). Review of the Report of the Committee of Enquiry into
Ahernative Marketing Arrangements for Maize. Development Southern Africa, Vo1.6 (4):467-
488.
GUJARATI, D.N. (1988). Basic Econometrics. 2nd Edition, McGraw Hill, New York.
HElEN, D. (1977). Price Determination Process for Agricultural Sector Models. American
Journal of Agricultural Economics, Vo1.59:126-132.
KASSlER, W.E. (1992). Report of the Committee of Inquiry into the Marketing Act.
Government printer, Pretoria.
LAND AND AGRICULTURE POLICY CENTRE (LAPe). (1993a). Policy Paper 2 :
Agricultural Marketing and Pricing in a Democratic South Africa, Pretoria.

75
LAND AND AGRICULTURE POLICY CENTRE (LAPC). (1993b). Options for Land
Reform and Rural Restructuring in South Africa. (Revised Version, October), Pretoria.
LAPSLEY, I. (1993). The Accounting and Organizational Consequences of Privatization and
Regulation. Financial Accountability and Management, VoL9 (2):69-73.
LEACH, D.F. (1992a). Concentration and Profits in South Africa: Monopoly or Efficiency?
South African Journal of Economics, VoL60 (2):143-157.
LEACH, D.F. (1992b). Absolute vs. Relative Concentration in Manufacturing Industry,
1972-1985. South African Journal of Economics, VoL60 (4):386-399.
LEISEGANG, F.P. (1995). Personal Communication. Maize Board, Pretoria.
LOUW, P. (1995). Personal Communication. Maize Board, Pretoria.
LUB~E, W.F. (1992). The Red Meat Marketing Scheme.' An Evaluation in a Dynamic
Environment Ph.D Thesis, University of Pretoria
MAIZE BOARD (1994). Data Collection. Maize Board. Pretoria
MIELIESTUDIEGROEP. (1993). Graanbemarkingstelsels in Hongarye, Argentinie,
Kanada, Nieu-seeland en Australie. Maize Board, Pretoria

76
MILLERS ASSOCIATION (1994). Data Collection. Millers Association. Johannesburg.
NATAL AGRICULTURAL CO-OPERATIVE. (1995). Personal Communication. Natal
Agricultural Co-operative, Dundee.
NIEUWOUDT, W.L. (1972). A Principal Component Analysis of Inputs in a Production
Function. Journal of Agricultural Economics, Vo1.23:277-283.
NIEUWOUDT, W.L. (1983). Chapter 1, Agriculture: In J. MATTHEWS (ed). South
Africa in the World Economy. McGraw Hill, New York.
NIEUWOUDT, W.L. (1994). The Demand for Food in South Africa and Future Projections,
2000 and 2010. Department of Agricultural Economics, University of Natal,
Pietermaritzburg, Unpublished Paper.
PASOUR, E.C. (1990). Agriculture and the State: Market processes and Bureaucracy.
Holmes and Meier. New York.
PAYNE, T. and EFRAT, Z (1994). Fanners bid to prop up maize price. Sunday Times,
Business Times, 12/02/94.
PAYNE, T., WIXLEY, J. and REINECKE, P. (1994). Food & Commodities Confidential
of Southern Africa, November.

77
PEARCE, D. W. (1983). Concentration. In Pearce, D. W. (Ed). The Dictionary of Modern
Economics. MacMillian Press Ltd, London.
PURCELL, W.D. (1990). Economics of Consolidation in the Beef Sector : Research
Challenges. American Journal of Agricultural Economics, Vo1.72(5):1210-121S.
QUIGGIN, J. and FISHER, B.S. (1988). Market and Institutional Structures in the Grain
Handling Industry : An Application of Contestability Theory. In FISHER., B.S. and
QUIGGIN, J. (Eds). The Australian Grain Storage, Handling and Transport Industries: An
Economic Analysis, Research Report 13, Department of Agricultural Economics, University
of Sydney, Australia.
RATS (1995). Regression Analysis of Time Series Data. Version 2.2. V AR Econometrics,
Doan Associates.
REEKIE, W.D. (1984). The Structure-Conduct-Performance Paradigm In a South African
Setting. South African Journal of Economics, Vo1.52 (2):146-155.
REES, D.J. (1979). Regulation of South African Agriculture - Performance of Agricultural
Marketing Boards. Unpublished Phd. Thesis, University of Cape Town, South Africa.
ROSENBLUTH, G. (1966). Measures of Concentration : In Business Concentration and
Price Policy: A Conference. National Bureau of Economic Research. Princeton University
Press, U.S.A

78
SAFEX (1995). The South African Futures Exchange. Quarterly Bulletin, Edition 2.
SARTORIUS VON BACH, H. and V AN ZYL, J. (1994). Elasticities of Substitution
Between Carbohydrates in South Africa. Agrekon, Vol.33 (1):15-18.
SCHROETER, J. and AZZAM, A. (1991). Marketing Margins, Market Power and Price
Uncertainty. American Journal of Agricultural Economics, Vo1.73:990-999.
SHEPHERD, W.G. (1979). The Economics of Industrial Organisation. Prentice Hall Inc.,
U.S.A.
SHEPHERD, W.G. (1984). Contestability vs. Competition. American Economic Review,
Vo1.74 (4):572-587.
SPENCE, M. (1983). Contestable Markets and The Theory of Industry Structure: A Review
Article. Journal of Economic Literature, VolJCXI:981-990.
SPSS (1995). Statistical Package for Social Sciences. Release 4.0, for Sun 4 (Unix). SPSS
Incorporated.
SW ART, P.J.A. (1994) .. Konsep Mieliebemarkingstelsel vir 1995/96. Government Printer,
Pretoria.

79
TOMEK, W.G. and ROBINSON, K.L. (1990). Agricultw-al Product Prices. Third edition.
Cornell University Press, Ithaca.
TRUU, M.L. (1988). Economics of Privatization. The South African Journal of Economics,
Vo1.56 (4):251-269.
VAN ZYL, J. (1986). A Statistical Analysis of the Demand for Maize in South Africa.
Agrekon, Vo1.25 (3):45-51.
VAN ZYL, J. and KIRSTEN, J. (1992). Food Security in South Africa. Agrekon,
Vol.31 (4): 170-184.
VAN ZYL, J. and NIEUWOUDT, W.L. (1990). Maize Marketing in the Future.
Department of Agricultural Economics, University of Natal, Pietermaritzburg, Unpublished
Paper.
VILJOEN, J. and BRINK, F. (1995). Graanopberging op die PIaas. MielieslMaize ,
September 1995:21-25.
WATERSON, M. (1984). Economic Theory of the Industry. Cambridge University Press,
London, U.K.

80
WILLIG, R.D. (1987). Contestable Markets. In EATWELL, 1., MIL GATE , M. and
NEWMAN, P. (Eds). The New Palgrave, a dictionary of economics, VoU (A-D):618-622,
MacMillian Press Ltd, London.
WOHLGENANT, M.K. and MULLEN, J .D. (1987). Modelling of Farm-Retail Price
Spread for Beef Western Journal of Agricultural Economics, Vol.12 (2): 119-125.
WRIGHT, P.D. (1992). A Study in Political Economy : The South African Maize and Dairy
Industries. Unpublished M.Sc. Agric thesis, University of Nata!, Pietermaritzburg.
WRIGHT, P.D. and NIEUWOUDT, W.L. (1993). Price Distortions in the South African
Maize Economy: A Comparative Political Analysis. Agrekon, Vo1.32 (2):51-59.

-
APPENDIX A
-( M - PM) R ViCOP --- = g(Q; P )
PM M
M - - = 1
PM
.. Relative Price Spread = 1 - Relative Maize Board Price
.. Rewritten as the Absolute Maize Board Miller Margin :
M = PM h(Q ; R~OP) M
PM' RVCOP - M = f(P MQ ; P )
M
- M = f (PMQ ; RVCOP)
:. The Empirical Specification is :
81