Embed Size (px)
Citation preview

2
Early
Childhood
Development
(ECD)
Income
Generation
Food
Security
Capacity
Building
SOUTH AFRICAN GOVERNMENT
FUNDING TO NON-PROFIT
ORGANISATIONS:
2016
“ What is the investment value? ”
1 | P a g e
South African government funding to non-profit
organisations: what is the investment value?
A research conducted by the National Development Agency - Jessica Fortuin
Research Fellowship Programme
Ms Lehlogonolo Ratlabyana (JFF Research Fellow) Mr Lucky Mkhonza (JFF Research Fellow)
Bongani Magongo (Executive-Research & Development)
©National Development Agency, February 2016
Research and Development Directorate Research and Policy Unit
National Development Agency 26 Wellington Road
Parktown Johannesburg
2193
Disclaimer
The findings, interpretations, views and conclusions expressed in this report do not necessarily represent NDA policies. The NDA does not
guarantee the accuracy of the data included in this report and accepts no consequence of its use. The NDA encourages wide dissemination
of its work and will normally grant permission to reproduce portions of the work. The NDA is not liable for any views expressed or
misprinted in the report.

2 | P a g e
Executive Summary
Introduction
The main challenge that has been associated with the civil society organisations
(CSO) sector in South Africa over the years has been the lack of financial security,
despite the funding that the government is spending on CSOs, the politics of funding
continues to dominate the CSO sector in South Africa.
Most of the national and provincial government departments on their budgets have
the allocations for the Non-profit institutions so as to try and support the CSOs in
carrying their mandates as per the provision made by the NPO Act of 1997.
However, what remains remarkably unclear is how much money government spends
on CSOs. Since funding is still regarded as a major obstacle that CSOs in South
Africa face. As Sibanda (2009) puts it, when looking at government funding the
sector is visible to be lacking access to financial support and to an extent general
support as well as public contributions.
NPO legislative frameworks One of the major actions that the government of
South African as taken in creating an enabling, an enabling environment for the
South African Civil Society Organisations was the enactment of the NPO Act No. 71
of 1997. Chapter 2 of the NPO Act asserts that it is the State’s responsibility to non-
profit organisations that “within the limits prescribed by law, every organ of state
must determine and co-ordinate the implementation of its policies and measures in a
manner designed to promote, support and enhance the capacity of non-profit
organisations to perform their functions”. In addition the state promulgated the
National Development Act in 1998. The Act states that the primary mandate of the
National Development Agency is providing grant funding to CSOs for purposes of
implementing projects and programmes that meet developmental needs of poor
communities and strengthening of institutional capacities CSOs that provide direct
services to poor communities.

3 | P a g e
Rationale
The rationale for conducting the research was to test the hypothesis that government
departments are allocating funding for not for profit organisations in their annual
planning. While there are no current and reliable statistics on value of funding to the
CSO sector, most organizations according to the Coalition on Civil Society Resource
Mobilisation (2012) rely on a combination of diminishing international funding,
corporate social investment, donations from individuals and a degree of income-
generation, often via government contracts. The completion of this research assist
in determining the value of how much government budget and spends on funding the
CSOs.
This Research aimed to gather information on the value of government allocation
and expenditure to fund work implemented by the CSOs sector between 2012/13
and 2013/14.
Methodology
A method of data collection used in this study was a review of secondary data from
national and provincial departments' annual reports which were published on the
departments' websites. The study covered two financial years, 2012/13 - 2013/14,
the periods selected were based on convenience and assuming that all government
departments will have complete data in their annual reports.
The approach used in this study was reviewing appropriation statement on all
national and provincial departments in the financial information of the 2012/13 -
2013/14 annual audited reports. Data was collected from the "appropriation per
economic classification" table of the financial statement. Financial data on "final
appropriation" and "actual expenditure" variables on transfers and subsidies for
"non-profit institutions" was captured in a spreadsheet for the two financial years.
The difference between the final appropriation and actual expenditure was also
calculated to assess expenditure levels against this economic classification line for
all departments.

4 | P a g e
Results of the study
The study found that of 40 national departments, 24 had allocated funding for not for
profit organisations. The NPOs funding allocation by national departments vary
significantly, for example, in 2013/14 the Department of Telecommunications
allocated about R399 thousand for NPOs whilst the Department of Science and
Technology allocated about R533.5million. The departments of health, social
development, sports and recreation as well as arts and culture combined they
allocated about R600.2 million in 2013/14 and about R507.9 million the previous
financial year. Interestingly, the department of public works increased its allocation
for NPOs from R282.7 million in 2012/13 to R438.3 in 2013/14, whilst departments
such as basic education, agriculture and forestry, and rural development have
increased their funding levels between the two financial years but are funding at a
very low base compared to the other departments. The department of Science and
Technology, for the two years contributed about one third of the total national NPOs
allocation, however on both years the departments has spent far below their
allocation. In 2013/14, the department spent about R84.7 million of the total
allocation of about R533.5 million, whilst in the previous year it had budgeted about
R718.8 million and only spent about R63.3 million. The study has found that the
combined national departments budget allocation for NPOs R1.8 billion in 2013/14
and R1.7 billion in 2012/13. The expenditure was R1.4 billion in 2013/14 and in
2012/13 the expenditure was about R1 billion.
The study found that there were 113 provincial departments combined in the 9 (nine)
provinces excluding the provincial legislatures. Of these, only 58 provincial
departments had budgeted and reported on NPOs expenditure during the periods we
reviewed. The total allocation for NPOs from different provincial departments
reviewed was reported to be about R20.1 billion in the 2012/13 financial year, the
allocation declined to R14.1billion in 2013/14. Interestingly, a province such as
Gauteng, with only a few departments reviewed for this study topped the list with
about R2, 94 billion allocations, followed by Eastern Cape with about R2.65billion.
Northern Cape and Mpumalanga had the least NPOs allocation of about R776.3
million and R835.2 million respectively in 2013/14.

5 | P a g e
Conclusion
Though the results of this study does not paint the full picture of governments’
contribution to the support of the CSOs, but what it does is to show that a number of
government departments do play a role in creating an enabling environment for
CSOs. From table 13 it can be concluded that all the provinces are playing a role in
supporting CSOs as per the requisite of the NPO Act No. 71 of 1997.
From the data collected and analysed for this report, we can make the following
broad conclusions: ;
The results of this study, looking at only two financial years, has found that the
government has allocated over R37.7 billion to NPOs over that period. This figure we
know is an under estimation of the total value due the methodology used in the
study, but is accurate figure for all the departments that were reviewed in this study.
The study has also found that the departments funding NPOs at significant levels,
such as health, social development, public works, rural development, and agriculture
are responsible for developing communities in their various portfolios.
Existing literature on funding of NGOs suggest that the level of funding from various
sources is significant as compared to government funding. However, one can say
that from this study results, government remain the major funder of NPOs. The study
has found that in 2012/13 government allocated over R20 billion to NPOs and in
2013/14, the funding was over R15 billion.
The government funding to NPOs seem to be embedded in a government planning,
policy and processes. In the majority of these departments, the expenditure is over
90% against the budget suggesting that the allocated money is disbursed to NPOs
funded by the departments. This may suggest that the planning, budgeting and
implementation process at this level is functional and efficient. The money allocated
to NPOs does go to the intended recipients.
The under expenditure, as much as it can be defined as not significant in
proportional terms to the budget, but in real money terms it is significant, especially if
the NPO sector perceive that the state is not putting much resources to it.
6 | P a g e
Table of Contents Executive Summary 2
Acronyms ................................................................................................................................ 7
1. Introduction ......................................................................................................................... 8
1.1 Defining CSOs ............................................................................................................... 9
2. Background ......................................................................................................................... 9
3. Challenges facing the NPO Sector ................................................................................... 11
4. Legislative and policy Frameworks ................................................................................... 16
4.1. NPO Act No. 71 of 1997 ............................................................................................. 17
4.2. NDA Act No. 108 of 1988 ........................................................................................... 17
4.3. Policy on Non-Profit Organisations ............................................................................ 18
5. Funders for Civil Society Organisations in South Africa ................................................... 18
6. State-NGO Partnership .................................................................................................... 20
7. Rationale for the study ...................................................................................................... 21
8. Aims and Objectives ......................................................................................................... 22
9. Study Methodology ........................................................................................................... 23
9.1. Data collection ............................................................................................................ 23
9.2. Method of Inquiry ........................................................................................................ 23
9.3. Description ................................................................................................................. 23
9.4. Study Population and eligibility criteria ....................................................................... 24
9.5. Data analysis .............................................................................................................. 24
9.6. Limitations .................................................................................................................. 24
10. Results of the study ........................................................................................................ 25
10.1 National Departments Results ................................................................................... 25
10.2 Provincial Departments Results ................................................................................ 29
10.3. Summary of government allocation to NPOs ........................................................... 38
10.4. Annual reports reviewed ........................................................................................... 41
11. Discussion of results and recommendations ................................................................. 43
12. References ...................................................................................................................... 47
Appendix 1: National Departments Annual Reports Reviewed ............................................. 50
Appendix 2: List of provincial government departments ....................................................... 52
Appendix 3: National NPO Budget allocation and expenditure data sheet ........................... 58
Appendix 4: Provincial Departments NPO Budget allocation and expenditure data sheet . 59
7 | P a g e
Acronyms
CBO Community Based Organisation
COGTA Cooperative Governance and Traditional Affairs
CSI Corporate Social Investment
CSOs Civil society Organisations
FBO Faith Based Organisation
GEAR Growth, Employment, and Redistribution
JFF Jessica Fortuin Fellowship
JSE Johannesburg Stock Exchange
KZN KwaZulu-Natal
NDA National development Agency
NGO Non-Governmental Organisation
NPO Non-Profit Organisation
RDP Reconstruction and Development Programme
UNDP United Nations Development Programme
WHO World Health Organisation

8 | P a g e
1. Introduction
Fighting developmental challenges in South Africa does not lie exclusively in the
hands of government. It is also the responsibility of the Civil Society Organizations
(CSOs) and other social and development partners. Government needs to support
the CSOs (NPO Act, 1997) since the government has the responsibility of setting the
development agenda and mobilising of resources for funding national development.
Civil Society Organizations on the other hand, have the benefit of proximity with the
people on the ground thus they have better understanding of the needs of the people
on the ground. However, the main challenge that has been associated with the CSO
sector in South Africa over the years has been the lack of financial security, despite
the funding from government and other development partners are spending on
funding on CSOs, the politics of funding continues to dominate the CSO sector in
South Africa.
Most of the national and provincial government departments on their budgets have
the allocations for the Non-profit institutions so as to try and support the CSOs in
carrying their mandates as per the provision made by the NPO Act of 1997.
However, what remains remarkably unclear is how much money government spends
on CSOs. The global economic crisis over the past years has also contributed to
NGOs funding challenges, as donations, especially from individual and private
donors, have diminished substantially (Stuart, 2013; Savage, YEAR; Inyathelo, 2014;
Coalition on Civil Society Resource Mobilisation, 2012).
In spite of the critical role the South African Civil Society Organisations are playing in
development programmes what remains puzzling however it is the amount of money
the CSOs are receiving from the government. The continued turmoil from the CSO
sector regarding the governments’ lack of support to the CSOs has been enough to
convince one there are no financial allocations to the CSOs from the government.
With this paper we know that there is money from various government departments
allocated for supporting CSOs in carrying out their mandates, however what remains
a unknown, as public knowledge, is the total amount that the government allocates
to the CSOs. This excludes the monies from tier agencies of government such as the
National Development Agency as well as the National Lotteries.

9 | P a g e
1.1 Defining CSOs
The term CSOs is used in this study to mean a wide range of civil society actors
such NGOs, FBOs, NPOs and CBOs. The term CSOs and NPOs will be used
interchangeably hereafter. This study adopted the following definition from the World
Health Organisation (2012);
CSOs are defined as the non-state, not for-profit, voluntary organizations formed by
people within the social sphere of civil society. These organizations draw from
community, neighbourhood, social and other connections. CSOs have become an
increasingly common channel through which people seek to exercise citizenship and
contribute to social and economic change. They cover a variety of organizational
interests and forms, ranging from formal organizations registered with authorities to
informal social movements coming together around a common cause.
2. Background
One of the major shifts for the South African civil society organisations has been the
change in funding practices (Youth Development Network, 2005). The pre-dawn of
democracy in South Africa arguably came along with major changes for the CSOs in
terms of funding methods, during this period we have seen a number of international
donor agencies channelling their funds directly to government as opposed to directly
funding CSOs as it was previously done. As a result we have seen a number of
donors restrict their work to bilateral agreements with the government hence the
South African government is now disbursing these funds to CSOs. Even with that,
you still read on articles about the lack of funding support from the government that
the South African Civil Society Organisations are facing. As Stuart (2013) points that
Government’s lack of support for NGOs is further evidenced by the fact that many
NGOs do not receive government funding because the lack of transparent or
standardised criteria for the financing of social services has led to major
discrepancies in the allocation of funds to NGOs.
Funding for not for profit organisations in South Africa is unpredictable. No one
knows how much are NPOs are funded from who and when. This makes it very
difficult for NPOs to plan and execute plans in accordance to their strategies and

10 | P a g e
intentions. The sources of funding for the sector are also fragmented and funders do
not know if they are the only one funding the organisation. In a publication by
Alexander O'Riordthean in 2013, on the South African Civil Society Information
Service, he stated that “there is far from overwhelming attention paid to the need for
greater funding to local NGOs. It is, thus, unfair to only criticise donors for their
allocations when local NGOs in the governance sector have done so little to lobby for
their own institutional needs".
Funding for NPOs in South Africa comes from various sources. In 2011, it was
reported that international donors, mainly from western governments and
multilaterals reported $1.2 billion in disbursements to South African NPOs. In
scanning the major bilateral development funders, in 2008, the top 12 foreign
governments providing development assistance showed they had committed about
US$585 million to the South African government to fund development work through
the sector. Foundations are a significant funders for NPOs, in 2008, the major
foundations operating in South Africa funded NPOs for over R1.8billion. A significant
proportion of the funding came from international foundations. In the same year over
R150million funding for the NPOs came from local foundations. Some of the
international foundations they fund international NGOs to fund local projects and
programmes whilst others may fund through local civil society structures. These
funding models contribute to the fragmentation of funding regimes for the NPOs
sector.
The private sector uses their corporate social investment units to fund civil society
sector. Trialoge reported in 2012 that the private sector funded civil society
organisations for R8 billion through corporate social investment schemes. A review
of the listed companies in the JSE showed that about R1.9 billion was spent on
social and development projects. These companies use their corporate social
investment units to fund local developmental programme. These programmes are
implemented through civil society organisations. However, there are tens of billions
that are spent by the private sector in South Africa to fund projects and programmes
of this sector. The funding from the sector is controlled and distributed by the
company’s corporate social investment departments. However, there is no clear
structure in the civil society sector set up to link private funding to local NGOs.
11 | P a g e
The government funding to NPOs has never been quantified, however, the national
and provincial spheres of government allocate funding for NPOs in their annual plans
and budget allocations. The budget allocation to NPOs is classified as transfers and
subsidies. The local government sphere, also fund NPOs to implement social and
developmental programmes within municipalities. There are clear indications from
the budget allocations from government departments that the government invest
resources to support programmes implemented by NPOs in communities.
The National Lotteries in 2012 reported to have been funding the sector for over R2
billion a year since 2012/13 financial year. The highest funding goes to charities
which are civil society organisations working on a range of social and development
activities in local communalities. However, the national lotteries also fund specific
organisations working in the areas of arts, culture, national heritage, sports and
recreation as core funding areas.
The National Development Agency is the only state entity responsible to provide
support to the civil society sector in South Africa. There is an expectation from the
NPOs sector that the National Development Agency will support it through grant
funding and building capacities of organisations working in the sector. The NDA has
reported to have disbursed grants of over R1.5 billion since its inception in 2001/02.
The NDA has also remained one of the public sector sources for civil society funding.
There is indication that the NPOs sector has different sources of funding. The
question then is who coordinate funding to the NPOs sector? How much funding is
allocated to fund NPOs from all the funding sources? How do NPOs access funding
from these sources. The research is only looking at quantifying government funding
to NPOs. This may spark debate on how to properly coordinate and account for
public funds allocated to NPOs for development purposes.
3. Challenges facing the NPO Sector
Civil society organisations are faced with a number of challenges and arguably the
main challenge being lack of sustainable funding, however, this sector also is lacking
in managerial and organisational capacities to effectively manage the organisations.

12 | P a g e
More and more the sector has been complaining about the lack of financial support,
particularly from government. As Sibanda (2009) puts it, when looking at
government funding the sector is visible to be lacking access to financial support and
to an extent general support as well as public contributions. The sector is also seen
to be lacking contact with relevant and potential funding sources, and these NPOs
also operate in spaces without sufficient office space, equipment and supplies. In
addition, some of the NPOs can not retain staff because of low salaries and benefits
resulting in high turnover of skilled staff Experience in fundraising seems to also be a
concern for most NPOs. Furthermore, there are issues of delays and red tape
involved in the distribution of funding to NPOs especially by government
departments (Youth Development Network, 2005).
The National Development Agency (NDA) and National Lottery were established
primarily to be the solution to the NGO sector funding, however, the CSOs continues
to voice out their dissatisfaction at the operations and lack of support from these
institutions. These institutions have been receiving their fair share of criticisms from
the CSO sector. The National Lottery has been reprimanded for not adequately
distributing funds that have been allocated for civil society organisations. NGOs are
seen to be facing great difficulty when applying for funds and complain that there is
no transparency and these institutions allocate a large percentage of money to their
administrative expenditure. On the other hand, the NDA is also accused for not
distributing funds allocated for civil society, corruption and mismanagement of funds
(Youth Development Network, 2005).
The changing political environment has influenced variation of government funding to
NPOs. Grants funding has evolved from from simple non formal agreements to a
more formalised service level agreement contracts with specific deliverables and
timelines. Even though government allocates large percentage of funding to NPOs,
this has the potential of creating dependency on government as their single or major
funding source which in turn create a negative effect on organisations should funding
be limited or not forthcoming from government.. Furthermore, Non-Profit
organisations have to operate in a business-like fashion due to contractual
obligations linked to government funding and they have to look for opportunities
beyond traditional non-profit activities in order to maintain government funding
(Singh & Mofokeng, 2014)

13 | P a g e
Financial sustainability remains a major concern for NPOs, current and potential
funders and the communities these NPOs serve. Sustainability means the capacity
of NPOs to be able to manage financial possibilities, to be able to compete with other
NPOs, building relationships and partnerships, showing value and accountability to
funders and overall increasing participation of leadership in society (Harding, 2014).
It is apparent that lack of funding for the CSOs remains one of the biggest
challenges, and government has faced scathing criticism regarding the lack of
support to the CSOs.
It is important to start by providing a narrative context of NPOs operation and funding
challenges in order to locate the role that they can play in positively contributing
towards the state efforts on poverty, inequalities and unemployment. The NPO
sector is a major player in national development, in fact, developed countries uses
this sector to influence their foreign policies in other countries, especially the third
world. The South African NPO context is uneven, operating in unlevelled ground and
that stages of development of organisations belonging to the sectors has a wide
variance margin. This climate attracts a skewed levels of skills, resources, influence
and ability to grow to many organisations. Organisations with better skills attract
better resources and will have better influence to the public and government.
Organisations with better influence have also an added advantage that they are most
likely to be sustainable, innovative and attract skilled people. The organisations that
are struggling, newly formed and most likely operating in remote areas, remain
marginalised and disenfranchised. This is due to lack of competitive edge with other
organisations in the sector. Many struggling and newly formed civil society
organisations do not graduate from its infancy stages to toddler stages because the
environment for survival in the sector is very narrow and monopolised by the well-
established and developed organisations. This environment has a potential of
stagnating the sector with unintended consequences of stifling development in
remote rural areas where there is limited economic activities.
The sector, in real terms, has been growing over the years. The number of NPOs
that get registered with the NPO Directorate of the Department of Social
Development is increasing every year. However, the number of non compliant NPOs
is also very high, over 60% of the total registered NPOs. This should be a first
indication that the sector require intervention to ensure that NPOs who get

14 | P a g e
registered, first do so for a good course, second, that the support they require to
adhere to compliance is provided and third, that there are systems and processes in
place to enforce compliance.
Understanding the predicament faced by the civil society sector, one has to look at a
systematic approach that can be implemented by both the state and the sector in a
symbiotic way. Coexistence of the civil society sector and the state organs is
fundamental in fighting poverty, unemployment and inequalities. However, they both
needs to acknowledge the current barriers and normalise the relationships towards
building trust and eventually they will have a common goal. We have to acknowledge
that the civil society sector is fragment and needs a re-built internally and externally
for it to present a coherent approach towards development. The current NPOs
structures are weak or non existence except for the very few who may see
themselves occupying the void created by fragmentation and disenfranchisement of
the sector. The danger with this, the few NPOs that are vocal, they may present
themselves as representing the interests and ideologies of the sector.
There are a number of fundamentals that needs to put in place and supported by the
state to re-ignite the abilities and capabilities of the sector in becoming partners in
development. The NPO sector needs to be re-organised to respond to current
developmental challenges facing the state. This may be a tall order to call given the
fragmentation and inequalities that exist in the sector. However, there a number of
NPOs that are working hard to the true meaning of the expectations of the state. The
only requirement needed is for state entities such as the National Development
Agency and National Lotteries Commission to create the platform for the sector to
rescue itself from the current state of affair in the sector. This requires a mind shift
from these state agencies.
There is a body of literature that suggest these entities are pre-occupied about their
own internal challenges and only look up to the sector when they need validation of
their actions. The state entities created to support the sector, must first realise they
have a responsibility to fulfil to the sector. This require these entities to first build
bridges between themselves and the NPO sector with the aim of re-establishing trust
and defining a common developmental agenda with the sector. This is critical step to
be taken before any programmes, activities and funding modalities can be defined.

15 | P a g e
The sector requires the state organs created to provide a conducive environment to
provide a conducive environment for it to define its contribution, so defining the
NPOs agenda is critical and will remove any suspicion about the sector intentions.
The agenda of the sector must be guided by pillars within which they can organise
themselves around and formulate programmes. There are three critical and useful
pillars that the sector can organise themselves around. These are service delivery,
lobby and advocacy and research.
To revitalise the sector back to a coherent civil society movement, a number of
actions need to be taken by the sector itself and supported by its social partners. The
sector need to acknowledge that fragmentation based on scramble for resources
makes the sector weak in South Africa. The sector needs to first agree on a common
purpose and re-established national, provincial and regional structures to pursue
their goal. These structures are paramount in creating an environment for the sector
to gain its trust and confidence from its partners. Many national and regional
structures for civil society have mushroomed in the past few years. These structures
have only focus themselves on mobilising resources as opposed to formulating a
common agenda and influencing its partners to support the agenda. Those with skills
and access to resources have focused on their survival and sustainability.
The CSOs sector has taken the private approach towards development and funding,
their resource mobilising is focusing on responding to tenders where they are
expected to perform functions on behalf of the state or partner, with no interest of
developing communities. This approach cannot be addressed through a fragmented
sector. Both government and the private sector, through its corporate social
investment programmes (CSI) have contributed in the fragmentation and scramble
for resources. Organisations contracted through the government or CSI programmes
are forced to operate with a focus to the contractual agreements and deliverables
rather than responding to community felt needs. This has even made the community
to lose trust on the sector as champions of community development discourse.
Equitable funding in the sector is the main challenge. This is caused by a number of
things within the sector and the environment where the sector operate. It is very
difficult for funders, including the state, to fund in an equitable manner a sector that
is not organised, with no accountability mechanisms and no guarantees for delivery.
16 | P a g e
This then introduces selective funding by funders. Organisations with history of skills,
accountability and quality service will always have a large share of the available
funds for the sector. However, these organisations with these pre-requisite are few
and usually operate in metropolitan areas. They would, if they require more capacity,
contract the less advantaged and smaller organisations in remote areas to
implement their plans. This creates a dependency syndrome in organisations will
limited access to funding which prohibits them to build their own internal capacity to
attract funding.
Most foreign AID funders prefer to fund organisations that they are familiar with and
have processes and systems that can deliver and report against its funding. For new
and emerging organisations have a difficulty is breaking through this type of funding.
However, if the sector was organised and have self-regulatory mechanisms it would
be easier for such funding to come through the sector and the sector would equitably
distribute funding in a manner that would allow organisations in remote areas to
access funding.
In the absence of the National Development Agency playing its conduit funding role
for state and international donors, the National Treasury has taken over this role
whilst it does not have any mechanisms for equitably distribute funding to the sector.
It is the duty of the National Development Agency, as prescribed in the act to
coordinate and provide this instrument to ensure that foreign AID and government
funding to the sector is equitable and systematically distributed to the sector for
development programmes. The sector has to lobby and advocate that donor funding
in centrally coordinated and equitable distributed across all sectors of development.
4. Legislative and policy Frameworks
The state has put in place a number of key legislative provisions relating to the rights
of CSOs in South Africa. The CSOs have long been complaining about the lack of
support from government and how that is infringing the legislated provisions that bind
the government in supporting the CSOs, as we note that Government has enacted a
number of Acts so as to create an enabling environment for the CSOs. Without going
into details we note the following Acts;

17 | P a g e
4.1. NPO Act No. 71 of 1997
One of the major actions that the government of South African as taken in creating
an enabling, an enabling environment for the South African Civil Society
Organisations was the enactment of the NPO Act No. 71 of 1997.
Chapter 2 of the NPO Act asserts that it is the State’s responsibility to non-profit
organisations that “within the limits prescribed by law, every organ of state must
determine and co-ordinate the implementation of its policies and measures in a
manner designed to promote, support and enhance the capacity of non-profit
organisations to perform their functions”. According to the Act, the minister has a role
of establishing in the national department a directorate that will be responsible for
facilitating processes of developing and implementing policy. The act is also
responsible for determining and implementing programs to support NPOs in their
efforts to register and maintain the standard of governance within NPOs. The Act
also works to ensure that there is liaison with other organs of the state as well as
interest parties to facilitate the implementation of multi-sectoral and multi-disciplinary
programs (Non-Profit Organisations Act, 1997).
4.2. NDA Act No. 108 of 1988
Understanding the limitation of the NPO Act, the state created the National
Development Agency through the National Development Act, No.108 of 1988. The
NDA mandate requires the NDA, as its primary objective: to contribute towards the
eradication of poverty and its causes by granting funds to civil society organisations
for the purposes of-
(a) carrying out projects or programmes aimed at meeting development needs
of poor communities; and
(b) strengthening the institutional capacity of other civil society organisations
involved in direct service provision to poor communities.
The NDA Act requires the Agency to implement programmes that respond, amongst
others, the following areas of CSOs support:

18 | P a g e
act as a key conduit for funding from the Government of the Republic, foreign
governments and other national and international donors for development
work to be carried out by civil society organisations;
contribute towards building the capacity of civil society organisations to enable
them to carry out development work effectively;
grant money from its funds in accordance with such criteria and procedures
as the NDA determines, with due regard to the NDA’s primary object referred
to in section to any civil society organisation for any project or programme that
organisation
4.3. Policy on Non-Profit Organisations
The registration of Non-profit Organisations in South Africa is administered by the
Department of Social Development under the Non-Profit Organisations Directorate
that was established in terms of the Non-Profit Organisations Act 71 of 1997.
Amongst other things the Directorate ensures compliance and provide capacity
building to NPOs. For NPOs to qualify for funding from government, they first need
to be registered as NPOs with the Department of Social Development. The
Department has norms and standards that CSOs seeking NPO registration need to
comply with but some CSOs are not successful in their registration due to non
compliance.
The Department of Social Development has developed a policy on NPO funding
process flow and decision making chain and its objectives is to realise the mandate
of the Department to ensure that government acquires all partners in the space of
service delivery. This is important especially because public and private donors
require accountability for the programmes they fund. The need for accountability
puts pressure on government to ensure that it evaluates the costs and benefits of its
activities and to account to society as to how it spends and allocates resources,
more especially to tax payers (Chief Directorate Specialist Social Services, 2013).
5. Funders for Civil Society Organisations in South Africa
Funding of civil society organisations took a turn after the 1994 elections whereby
donors started shifting their focus from civil society opting out for creating bilateral

19 | P a g e
agreements with the new government (Kihato, 2001). The bilateral and multilateral
aid has since then been considered as one of the principal sources of funding for
CSOs. These can come from either the foreign offices of the developed countries or
from the multilateral organizations set up by different countries such as the United
Nations, the World Bank, the Asian Development Bank (Funds for NGOs, 2009).
These organizations have been created to extend international support for alleviating
poverty and reducing the socio-economic gap between the developed and the
developing countries, and South African CSOs has been one of the beneficiaries
from these international organizations (Funds for NGOs, 2009).
The South African CSOs are arguably experiencing funding challenges, as
donations, particularly from the bilateral and multilateral organizations as well as
private donors, have diminished considerably. The global recession has also seen
Corporate Social Investment (CSI) budgets reduced. As a result of reduced private
and corporate donor funding, plenty CSOs have sought more funding from
government for survival, ultimately creating increased competition among NGOs for
government funds (Stuart, 2013). Since donors started directing funding away from
civil society a large portion of funding was now channelled through government,
making government amongst the major funders for civil society organisations.
Government has then outlined priorities for development assistance and on the one
side bilateral donor organisations also formulate their own policies for development
aid in South Africa (Youth Development Network, 2005).
Despite the continual display of displeasure from the CSO sector about the difficulty
the CSOs are facing in accessing government funding support, a number of research
studies on the contrary have shown that the government remains amongst the major
sources of funding for the South African CSOs.
Statistics South Africa (2011) has noted that the majority of the income of South
African CSOs is derived from three core sources:
• Local donations;
• Government subsidies; and
• Membership subscriptions.
20 | P a g e
Government subsidies are the second largest provider of income for South African
CSOs. A number of central and provincial governments make grants to CSOs
directly. Statistics South Africa (2011) further notes that even local government also
makes a number of grants to CSOs, funded from both their own sources and from
central government. In spite of this, this has not stopped CSOs from complaining
about the lack of financial support from the government.
6. State-NGO Partnership
Research has shown that Government subsidies are one of largest provider of
income for South African CSOs. A number of scholars have raised some questions
and discomforts regarding the government being the major funder of the CSOs. The
biggest question will be, will the CSOs carry on their advocacy role against the
government when the government is their major funder? If the CSOs lean more
towards the government surely the mission of having an active citizenry in South
Africa will suffer a huge blow. As most of the time CSOs gets tied to where the
money comes from, which reasonable affects the effectiveness and neutrality of
NGOs. As normally, CSOs can oppose the government, by acting as watchdogs
and holding it accountable. This can either be done directly through lobbying, or
indirectly by supporting groups that are adversely affected by government policy
(Thomas, 1992; UNDP, 2001). This can be seen as “mediation”. The biggest
question now will be the compromise of the autonomy of CSO if the government is
their major funder. Will they continue to lobby against government if government is
the ‘hand that feeds’ them?
A challenge that may arise in the government being amongst the major funders of
the CSOs it is that it will be questionable whether, under such monetary dependency
CSOs can continue to enjoy relative neutrality. This can be due to the expectation
that CSOs should be accountable to, and should mirror, funding agencies in their
operations. When the government is a major funder of the CSOs Stuart (2013)
purports that, CSOs will as you might expect develop a very close relationship with
the state, and may, at times, even be difficult to distinguish from the state. Normally
CSOs become more like the bodies from which they obtain funding, than the
societies they intend to represent (Stuart, 2013). This notion speaks to concerns

21 | P a g e
“that relying on government funding would detract from creating the active citizenry
needed to utilise post-apartheid, democratic tools of social change, and that it is
possible that diminishing funding has eroded the advocacy function of the NPO
sector (Stuart, 2013).
7. Rationale for the study
The positive role that the South African CSOs played in the demise of apartheid as
well as the role that these CSOs continued to play during the period of transition into
democracy is well documented by various scholars. As the Coalition on Civil Society
Resource Mobilisation (2012) highlighted that the CSOs greatly contributed towards
the dismantling of apartheid legislation and influenced the drafting of the new
democratic constitution. The CSOs continued to have a firm relationship with the
government as they were active partners in drafting the Reconstruction and
Development Programme (RDP), the release of the Growth, Employment and
Redistribution (GEAR) plan in 1996 however formally marked a shift in the social
contract between government and civil society (Coalition on Civil Society Resource
Mobilisation, 2012).
There has since then arguably been tension between CSOs partnering with
government, and consequently CSOs have been experiencing a number of
sustainability challenges over the years. During the years of apartheid the sector
was kindly funded by the international donor community, with democracy however
much of the international funding has been channeled through the state apparatus
(Coalition on Civil Society Resource Mobilisation, 2012), with foreign donor funding
being redirected as bilateral aid towards government, previously well-funded CSOs
found themselves in financial difficulty. Savage (year) echoed that the funding for
civil society began to dry up as international donors swung their support from very
viable CSOs to government-led programs.
As international funding was channeled through government, CSOs increasingly
relied on funding flows through government. Stuart (2013) noted that due to reduced
private and corporate donor funding, many NGOs have sought more funding from
government to keep surviving, which ultimately is creating an increased competition

22 | P a g e
among CSOs for government funds. As a result, there has been an outcry from the
CSOs that many NPOs have difficulty accessing government funding support
(Stuart, 2013). Stuart (2013) further highlighted that the government makes it so
difficult for NGOs to qualify for funding from government itself.
Despite these concerns, NPOs have continued to lobby for an enabling environment,
including government support and funding to be made available to the sector. A
broad process was undertaken to negotiate new policies and mechanisms for
funding, such as the creation of the National Development Agency (NDA) (Coalition
on Civil Society Resource Mobilisation, 2012)
The rationale for conducting this research is to (i) ascertain if National and Provincial
departments are budgeting for not for profit organisations; (ii) how much are they
budgeting and spending in a financial year; (iii) quantify the value of funding by
national and provincial departments in a financial year. The assumption is that the
information is ready available to the public as all government institutions are required
by the National Treasury Strategy planning and Annual reporting framework to
publish their annual reports in their website every year.
8. Aims and Objectives
This Research therefore aimed to gather information from government departments
(national and provincial) as to how much money do government departments budget
and spends to support CSOs in a financial year.
The research had in addition the following objectives;
To use the findings to advocate for a coordinated policy on CSOs funding
by Government departments
To identify funding gaps for not for profit organisations by all sphres of
government.
To identify areas that requires additional research to understand the
funding model of government, especially the quality of services provided
by the sector.

23 | P a g e
9. Study Methodology
9.1. Data collection
A method of data collection used in this study was a review of secondary data from
national and provincial departments' annual reports which were published on the
departments' websites. The study covered two financial years, 2012/13 - 2013/14,
the periods selected were based on convenience and assurance of availability of
complete data.
The approach used in this study was reviewing appropriation statement on all
national and provincial departments in the financial information of the 2012/13 -
2013/14 annual audited reports. Data was collected from the "appropriation per
economic classification" table of the financial statement. Financial data on "final
appropriation" and "actual expenditure" variables on transfers and subsidies for
"non-profit institutions" was captured in a spreadsheet for the two financial years.
The difference between the final appropriation and actual expenditure was also
calculated to assess expenditure levels against this economic classification line for
all departments.
9.2. Method of Inquiry
This is a quantitative study since it is concerned about the sum amount of monies
appropriated for CSOs, including the sum amount of cash spent on CSOs, and the
amount of monies that was either under or over spent by the individual government
departments for the financial years of 2012/13 and 2013/14.
9.3. Description
This study was descriptive because the information of the sum of monies
appropriated for CSOs for the financial years of 2012/13 and 2013/14 was collected
without changing the environment or manipulating the data, and the data was
collected using existing records (financial statements from annual reports of each of
the government departments). As Bickman and Rog (1998) indicated that
Descriptive studies are typically the best methods for collecting information that will
describe the world as it exists. This study reviewed the government expenditure and
24 | P a g e
financial allocations for NPOs as is from the government departments’ annual
reports. More importantly, Bickman and Rog (1998) imply that descriptive studies
can answer questions such as “what is”, and this research looks to answer the
question of what is the amount of South African government funding to non-profit
organisations.
9.4. Study Population and eligibility criteria
The study subjects for this study were all national and provincial government
department in South Africa as listed in the government online website. An eligibility
criterion for this study was that the government departments are either at a national
or provincial sphere of the South African government. All the government
departments that had posted their annual reports on their websites during the time of
data collection were used as the subjects of the study on condition that they had
posted the 2012/13 and or the 2013/14 annual report. The local government sphere
and public entities were excluded from the study population based on the different
classification in the budget appropriation in these public institutions.
9.5. Data analysis
The data was captured on a tool created on Excel Spreadsheet and analysed using
excel to assess allocation trends and expenditure trends over the two year period.
The data was also used to compare levels of allocations and expenditure levels
between departments at national and provincial levels. The results are presented in
tables and figures under the findings.
9.6. Limitations
The limitations of the study are that, most departments, especially provincial
departments had not posted their annual reports thus affecting the accuracy of
government funding to NPOs.
The study was not intended to address issues relating to quality of work provided by
NPOs through the funding by government, thus the study is not reporting on
effectiveness of the funding.
The study did not analyse the types and sectors of NPOs funded by government
departments, although some of the annual reports list the organisations funded and
which sector are these organisations operating.

25 | P a g e
10. Results of the study
The study searched through the government online website for all national and
provincial departments annual reports for 2013/14, the financial statement of the
annual report also provide government allocation and expenditure for the previous
year - 2012/13. There are 40 national government departments, excluding
government agencies listed in the website. Of the 40 departments, 33 (83%) had
published their 2013/14 annual reports, of the 33 who had published their reports;
24(73%) had budgeted for NPO allocation. The total allocation to NPOs funding
budget from the 24 departments reviewed totalled about R1.89 billion in 2013/14,
with an expenditure of about R1.4 billion, whilst the budget for 2012/13 was about
R1.7 billion with an expenditure of about R1 billion. Over the two finacial years the
National Departments had budgeted about R3.29 billion for NPOs funding and spend
about R2.4 billion of the budget.
The study also reviewed annual reports for the same year for all published reports in
all 9 provincial departments. The government online website has listed all
departments in each province; there are a total of 108 provincial departments
excluding the provincial legislatures. Out of 113 provincial departments listed, only
90(80%) had their reports for 2013/14 published or found through other search
engines. Of the 90 provincial annual reports reviewed, 60 (67%) has allocated NPO
funding in at least one of the financial years we reviewed. At provincial sphere, the
total budget allocated by all departments in the year 2013/14 was about R15.9 billion
and the expenditure in the same year was about R14 billion. In the previous year,
2012/13, the provinces had a total budget of about R20 billion with and expenditure
of about R17 billion. This findings from all the reports that were reviewed indicate
that government departments in two spheres over the period of the two financial
years we reviewed had budgeted about R37.6 billion for NPOs funding and spend
about R33.5 billion.
10.1 National Departments Results
At national sphere of government, the study reviewed twenty four (24) national
governments annual reports that reported budgeting for NPOs funding in the fiancial
years 2012/13 to 2013/14, these departments are shown in Table 1 below. Of the 24
national departments listed in the table, in 2012/13 there were 21 departments who

26 | P a g e
budgeted for NPO funding and in 2013/14 there were 20 departments that had
budgeted for NPOs. Some had budgeted in the previous year and not budgeted in
the following, whilst some departments budgeted in the following but had not
budgeted in the previous. However, they were very few departments that showed
such paten.
Table 1: National Departments NPOs budget allocation and expenditure 2012/13 - 2013-14
2013/14 2012/13
Final Appropriation
Actual Expenditure
Difference Final Appropriation
Actual Expenditure
Difference
Health R 211 058 000 R 209 654 000 -R 1 404 000 R 201 255 000 R 196 213 000 -R 5 042 000
Basic Education R 15 050 000 R 15 050 000 R 0 R 6 050 000 R 6 050 000 R 0
Social Dev R 104 007 000 R 89 884 000 -R 14 123 000 R 71 678 000 R 71 553 000 -R 125 000
Agric & Forestry R 20 318 000 R 19 092 000 -R 1 226 000 R 13 351 000 R 13 351 000 R 0
Public Works R 438 281 000 R 448 679 000 R 10 398 000 R 282 724 000 R 292 627 000 R 9 903 000
Sports & Recreation R 174 656 000 R 174 656 000 R 0 R 222 174 000 R 221 272 000 -R 902 000
Housing R 0 R 0 R 0 R 400 000 R 400 000 R 0
Defence R 7 701 000 R 7 701 000 R 0 R 8 401 000 R 8 401 000 R 0
COGTA R 17 117 000 R 13 888 000 -R 3 229 000 R 5 903 000 R 3 693 000 -R 2 210 000
Environmental R 1 517 000 R 1 517 000 R 0 R 6 888 000 R 6 887 000 -R 1 000
Tourism R 26 000 000 R 26 000 000 R 0 R 26 585 000 R 26 060 000 -R 525 000
Labour R 127 702 000 R 127 702 000 R 0 R 88 711 000 R 88 030 000 -R 681 000
Water R 1 410 000 R 1 108 100 -R 301 900 R 674 000 R 490 000 -R 184 000
Trade R 27 885 000 R 27 885 000 R 0 R 23 900 000 R 23 900 000 R 0
Presidency R 0 R 0 R 0 R 110 000 R 110 000 R 0
Science & Techn R 533 502 000 R 84 701 000 -R 448 801 000 R 718 814 000 R 63 305 000 -R 655 509 000
Police R 1 000 000 R 1 000 000 R 0 R 0 R 0 R 0
Rural Dev R 6 433 000 R 6 433 000 R 0 R 5 061 000 R 5 061 000 R 0
Arts & Culture R 110 512 000 R 102 252 000 -R 8 260 000 R 12 873 000 R 12 873 000 R 0
Economic Dev R 7 701 000 R 7 701 000 R 0 R 8 401 000 R 8 401 000 R 0
Energy R 60 000 000 R 60 000 000 R 0 R 0 R 0 R 0
Telecommunications R 399 000 R 399 000 R 0 R 0 R 0 R 0
National Treasury R 0 R 0 R 0 R 85 000 R 0 -R 85 000
Transport R 0 R 0 R 0 R 17 827 000 R 17 827 000 R 0
Totals R 1 892 249 000 R 1 425 302 100 -R 466 946 900 R 1 703 953 000 R 1 048 677 000 -R 655 276 000
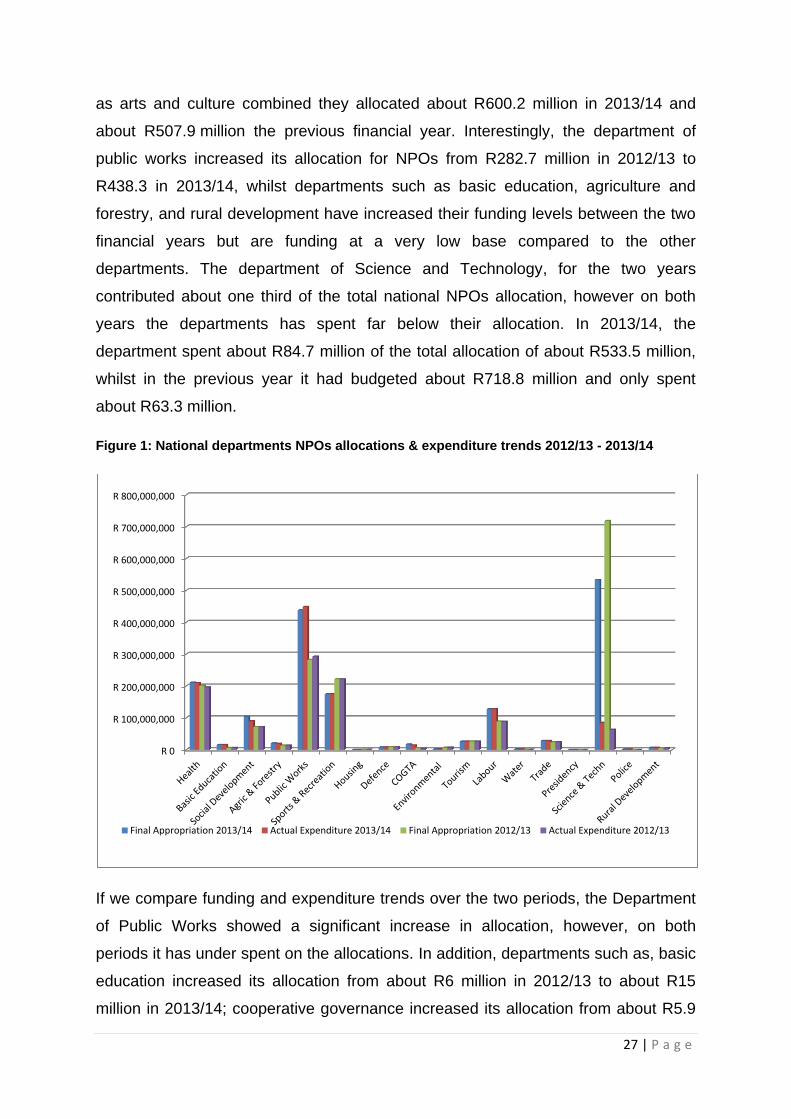
The NPOs funding allocation by national departments vary significantly, for example,
in 2013/14 the Department of Telecommunications allocated about R399 thousand
for NPOs whilst the Department of Science and Technology allocated about R533.5
million. The departments of health, social development, sports and recreation as well
27 | P a g e
as arts and culture combined they allocated about R600.2 million in 2013/14 and
about R507.9 million the previous financial year. Interestingly, the department of
public works increased its allocation for NPOs from R282.7 million in 2012/13 to
R438.3 in 2013/14, whilst departments such as basic education, agriculture and
forestry, and rural development have increased their funding levels between the two
financial years but are funding at a very low base compared to the other
departments. The department of Science and Technology, for the two years
contributed about one third of the total national NPOs allocation, however on both
years the departments has spent far below their allocation. In 2013/14, the
department spent about R84.7 million of the total allocation of about R533.5 million,
whilst in the previous year it had budgeted about R718.8 million and only spent
about R63.3 million.
Figure 1: National departments NPOs allocations & expenditure trends 2012/13 - 2013/14
If we compare funding and expenditure trends over the two periods, the Department
of Public Works showed a significant increase in allocation, however, on both
periods it has under spent on the allocations. In addition, departments such as, basic
education increased its allocation from about R6 million in 2012/13 to about R15
million in 2013/14; cooperative governance increased its allocation from about R5.9
R 0
R 100,000,000
R 200,000,000
R 300,000,000
R 400,000,000
R 500,000,000
R 600,000,000
R 700,000,000
R 800,000,000
Final Appropriation 2013/14 Actual Expenditure 2013/14 Final Appropriation 2012/13 Actual Expenditure 2012/13

28 | P a g e
million to about R17,1 million in the following year; and water and sanitation
increased its allocation from R674 thousand to about R1.1 million, The Presidency
and the Department of Housing had allocated funding to NPO in 2012/13, however,
both departments had not allocated any funding to NPOs in the 2013/14 financial
year.
The Departments of Sports and Recreation showed a significant decline in allocation
between the two periods, whilst the Department of Social Development has
increased its allocations over the period but has under spent its allocations on both
periods. In 2012/13, of the 21 departments with NPOs allocation 10 departments
spent all its allocations without under or over expenditure; whilst in 2013/14, of the
20 departments budgeted for NPO funder the number of departments reporting
under expenditure decreased to seven(7) departments.
Figure2: Total National Departments Allocations and Expenditure 2012/13 - 2013/14
Overall, the national departments are allocating a significant budget to NPOs
understanding that the constitutional mandate of these departments is policymaking
and oversight not implementation. In 2012/13, the 21 departments combined
allocated over R1.7 billion and they spent over R1 billion resulting in over under
R 0
R 100,000,000
R 200,000,000
R 300,000,000
R 400,000,000
R 500,000,000
R 600,000,000
R 700,000,000
R 800,000,000
Final Appropriation 2013/14 Final Appropriation 2012/13

29 | P a g e
expenditure of about R655.3 million. In 2013/14, the total allocation for the
departments was about R1.89 billion, with an expenditure of R1.43 billion. The under
expenditure for 2013/14 was about R466.9 million, whilst in 2012/13 the under
expenditure was higher at about R655.2 million. On both years, the high under
expenditure has been contributed by the Department of Science and Technology. In
both financial years, only one departments - the Department of Public Works - had
over expenditure in their NPOs allocation. One can note that the under expenditure
for all national departments dropped by 14% between the two year period. Although
the figures show a decline in the under expenditure, however the value of under
expenditure is still very high at about R466.9million for 2013/14 financial year.
10.2 Provincial Departments Results Table 2: Number of Provincial Departments with NPO Funding Budget 2012/13-2013/14
Province Number of Provincial Departments with NPOs Budget 2012/13 and 2013/14
No of AR located 2013/14
No. of Departments
2013/14 % 2012/13 % Number % Number
Gauteng 5 36% 5 36% 7 50% 14
Mpumalanga 3 23% 5 38% 11 85% 13
KwaZulu Natal 7 47% 9 60% 11 73% 15
Limpopo 5 50% 6 60% 8 80% 10
Eastern Cape 5 42% 6 50% 9 75% 12
Northern Cape 7 58% 8 67% 12 100% 12
Western Cape 10 77% 10 77% 12 92% 13
North West 7 58% 7 58% 10 83% 12
Free State 5 45% 6 55% 9 82% 11
Total 54 48% 62 55% 89 79% 112
The study reviewed all annual reports posted by provincial departments in their
websites, where we could not find the report we also used search engines to locate
these reports. Of the total reports we found, 54 provincial departments had NPO
budget allocation and expenditure for 2013/14 and 62 departments had budgeted for
NPO funding in 2012/13. Of the departments that had budgeted for NPOs in a
province, some had budgets for only one financial year, others we could not locate
the 2013/14 annual report but only found the 2012/13 annual report. This is why we
do not have the same number numbers of provincial departments with NPO budget
for both years in the same province on Table 1 above. The study also noted that it
was even more difficult to locate provincial reports from their websites; a majority of
30 | P a g e
these reports were retrieved through other search engines to achieve the level of
response that the study has managed to produce. The list of all the provincial
departments that were reviewed in the study is in Appendix 2 of the report.
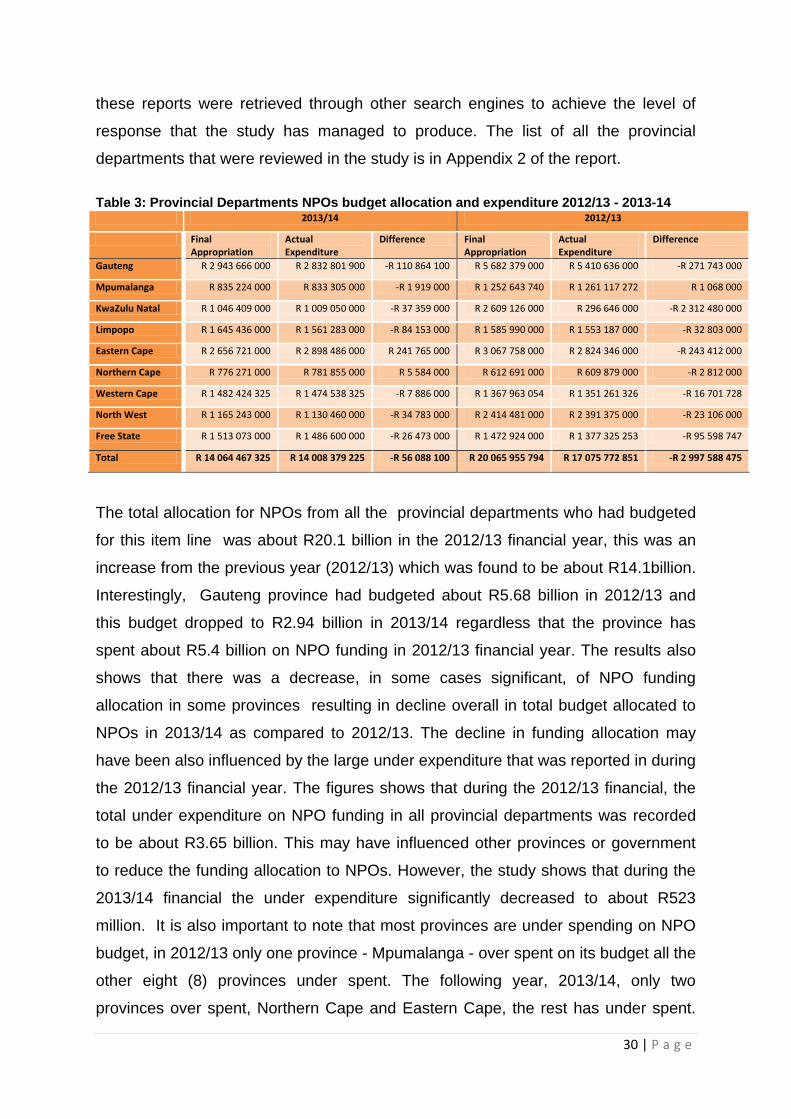
Table 3: Provincial Departments NPOs budget allocation and expenditure 2012/13 - 2013-14 2013/14 2012/13
Final Appropriation
Actual Expenditure
Difference Final Appropriation
Actual Expenditure
Difference
Gauteng R 2 943 666 000 R 2 832 801 900 -R 110 864 100 R 5 682 379 000 R 5 410 636 000 -R 271 743 000
Mpumalanga R 835 224 000 R 833 305 000 -R 1 919 000 R 1 252 643 740 R 1 261 117 272 R 1 068 000
KwaZulu Natal R 1 046 409 000 R 1 009 050 000 -R 37 359 000 R 2 609 126 000 R 296 646 000 -R 2 312 480 000
Limpopo R 1 645 436 000 R 1 561 283 000 -R 84 153 000 R 1 585 990 000 R 1 553 187 000 -R 32 803 000
Eastern Cape R 2 656 721 000 R 2 898 486 000 R 241 765 000 R 3 067 758 000 R 2 824 346 000 -R 243 412 000
Northern Cape R 776 271 000 R 781 855 000 R 5 584 000 R 612 691 000 R 609 879 000 -R 2 812 000
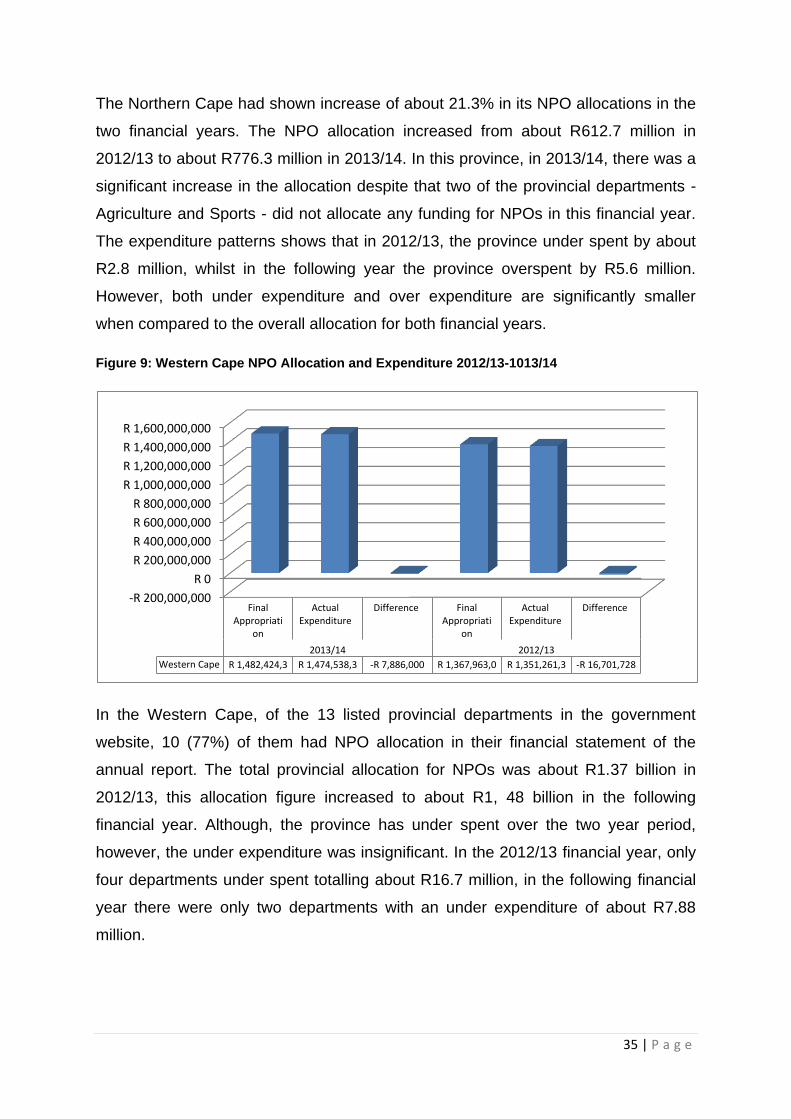
Western Cape R 1 482 424 325 R 1 474 538 325 -R 7 886 000 R 1 367 963 054 R 1 351 261 326 -R 16 701 728
North West R 1 165 243 000 R 1 130 460 000 -R 34 783 000 R 2 414 481 000 R 2 391 375 000 -R 23 106 000
Free State R 1 513 073 000 R 1 486 600 000 -R 26 473 000 R 1 472 924 000 R 1 377 325 253 -R 95 598 747
Total R 14 064 467 325 R 14 008 379 225 -R 56 088 100 R 20 065 955 794 R 17 075 772 851 -R 2 997 588 475
The total allocation for NPOs from all the provincial departments who had budgeted
for this item line was about R20.1 billion in the 2012/13 financial year, this was an
increase from the previous year (2012/13) which was found to be about R14.1billion.
Interestingly, Gauteng province had budgeted about R5.68 billion in 2012/13 and
this budget dropped to R2.94 billion in 2013/14 regardless that the province has
spent about R5.4 billion on NPO funding in 2012/13 financial year. The results also
shows that there was a decrease, in some cases significant, of NPO funding
allocation in some provinces resulting in decline overall in total budget allocated to
NPOs in 2013/14 as compared to 2012/13. The decline in funding allocation may
have been also influenced by the large under expenditure that was reported in during
the 2012/13 financial year. The figures shows that during the 2012/13 financial, the
total under expenditure on NPO funding in all provincial departments was recorded
to be about R3.65 billion. This may have influenced other provinces or government
to reduce the funding allocation to NPOs. However, the study shows that during the
2013/14 financial the under expenditure significantly decreased to about R523
million. It is also important to note that most provinces are under spending on NPO
budget, in 2012/13 only one province - Mpumalanga - over spent on its budget all the
other eight (8) provinces under spent. The following year, 2013/14, only two
provinces over spent, Northern Cape and Eastern Cape, the rest has under spent.

31 | P a g e
The total provincial under expenditure during the period we reviewd is estimated at
just over R4 billion. This is a significant amount of money understanding the plight
and the call by NPOs to see government increasing funding to them.
Figure 3: Gauteng NPO Allocation and Expenditure 2012/13-1013/14
In Gauteng, the results show a dramatic decrease in NPO funding from about R5.68
billion in 2012/13 to about R2.94 billion in 2013/14. This decrease in caused by the
fact that we could not find the annual reports for Departments of Social Development
and Health. The two departments contribute about half of the province departments
NPOs allocation. In 2011/12 the two departments contributed about R3.8 billion and
in 2012/13 they contributed about R2.8 billion. These contributions by these two are
significant in the total allocation by the province. It is clear therefore that the missing
information is the main contributor to the decrease we are showing in this report
-R 1,000,000,000
R 0
R 1,000,000,000
R 2,000,000,000
R 3,000,000,000
R 4,000,000,000
R 5,000,000,000
R 6,000,000,000
Final Appropria
tion
Actual Expenditu
re
Difference Final Appropria
tion
Actual Expenditu
re
Difference
2013/14 2012/13
Totals R 2,943,666 R 2,832,801 -R 110,864, R 5,682,379 R 5,410,636 -R 271,743,
32 | P a g e
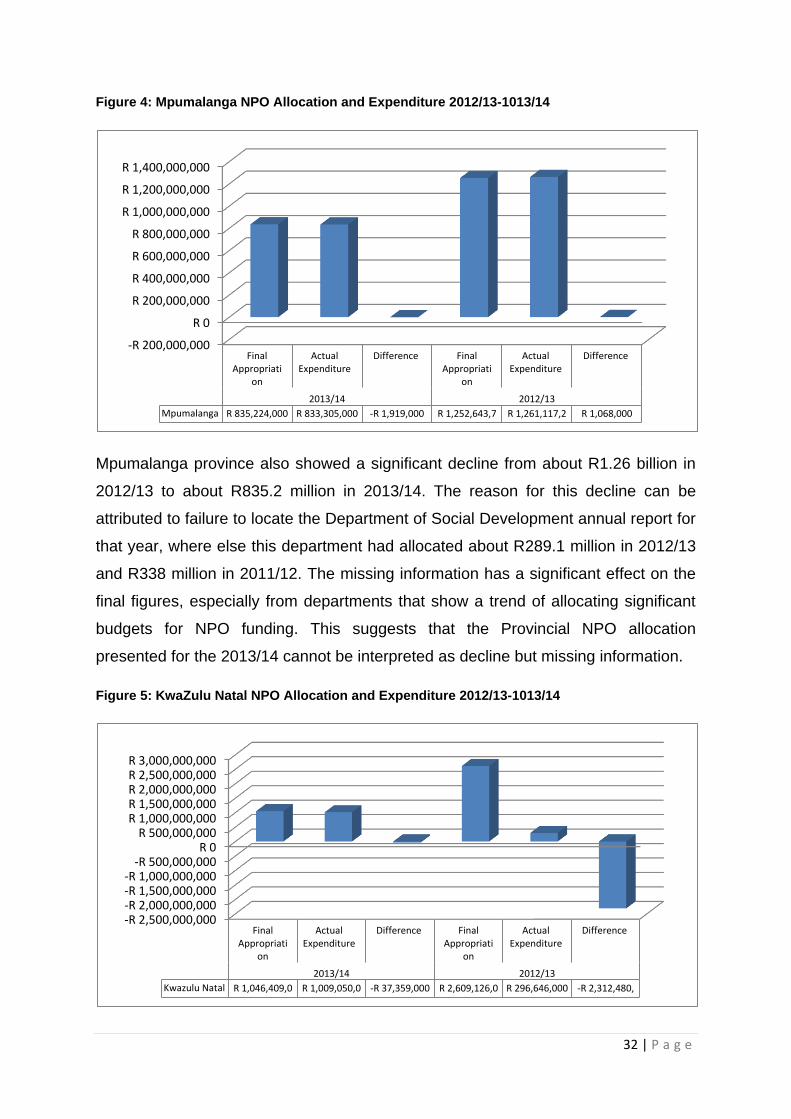
Figure 4: Mpumalanga NPO Allocation and Expenditure 2012/13-1013/14
Mpumalanga province also showed a significant decline from about R1.26 billion in
2012/13 to about R835.2 million in 2013/14. The reason for this decline can be
attributed to failure to locate the Department of Social Development annual report for
that year, where else this department had allocated about R289.1 million in 2012/13
and R338 million in 2011/12. The missing information has a significant effect on the
final figures, especially from departments that show a trend of allocating significant
budgets for NPO funding. This suggests that the Provincial NPO allocation
presented for the 2013/14 cannot be interpreted as decline but missing information.
Figure 5: KwaZulu Natal NPO Allocation and Expenditure 2012/13-1013/14
-R 200,000,000
R 0
R 200,000,000
R 400,000,000
R 600,000,000
R 800,000,000
R 1,000,000,000
R 1,200,000,000
R 1,400,000,000
Final Appropriati
on
Actual Expenditure
Difference Final Appropriati
on
Actual Expenditure
Difference
2013/14 2012/13
Mpumalanga R 835,224,000 R 833,305,000 -R 1,919,000 R 1,252,643,7 R 1,261,117,2 R 1,068,000
-R 2,500,000,000 -R 2,000,000,000 -R 1,500,000,000 -R 1,000,000,000
-R 500,000,000 R 0
R 500,000,000 R 1,000,000,000 R 1,500,000,000 R 2,000,000,000 R 2,500,000,000 R 3,000,000,000
Final Appropriati
on
Actual Expenditure
Difference Final Appropriati
on
Actual Expenditure
Difference
2013/14 2012/13
Kwazulu Natal R 1,046,409,0 R 1,009,050,0 -R 37,359,000 R 2,609,126,0 R 296,646,000 -R 2,312,480,

33 | P a g e
The study could only locate 9 annual reports from the 15 departments in the
province. The total allocation for NPOs for 2013/14 was recorded as about R1 billion
showing a decrease from the R2.6 billion allocated the previous financial year. When
analysing the data, we found out that the cause of this decrease was due to
incomplete data. We could not locate the 2013/14 annual report for the department
of education. The 2012/13 annual report indicated that the Department of Education
in KZN had allocated R2.1 billion which was about 80% of the total allocation for
2012/13. The absence of the information from department of education for 2013/14
has significantly affected the final figures of the province, thus it may look as if the
province had decreased its allocation for NPO funding in 2013/14.
Figure 6: Limpopo NPO Allocation and Expenditure 2012/13-1013/14
In Limpopo, of the ten (10) departments listed in the website, five of the departments
had allocated NPO Funding allocation in the financial statement of the 2013/14
annual report. Two of the Departments, COGTA and Economic Development had no
allocation for NPOs in 2013/14. The total provincial allocation for NPOs in Limpopo
increased slightly from about R1.58 billion in 2012/13 to about R1.64 billion in
2013/14. However, on both financial years the province had under expenditures on
the allocations. In 2012/13 the under expenditure was about R32.8 million, and in the
following financial year it was more than doubled to about R84.1 million.
-R 200,000,000
R 0
R 200,000,000
R 400,000,000
R 600,000,000
R 800,000,000
R 1,000,000,000
R 1,200,000,000
R 1,400,000,000
R 1,600,000,000
R 1,800,000,000
Final Appropria
tion
Actual Expenditu
re
Difference Final Appropria
tion
Actual Expenditu
re
Difference
2013/14 2012/13
Limpopo R 1,645,436 R 1,561,283 -R 84,153,0 R 1,585,990 R 1,553,187 -R 32,803,0
34 | P a g e
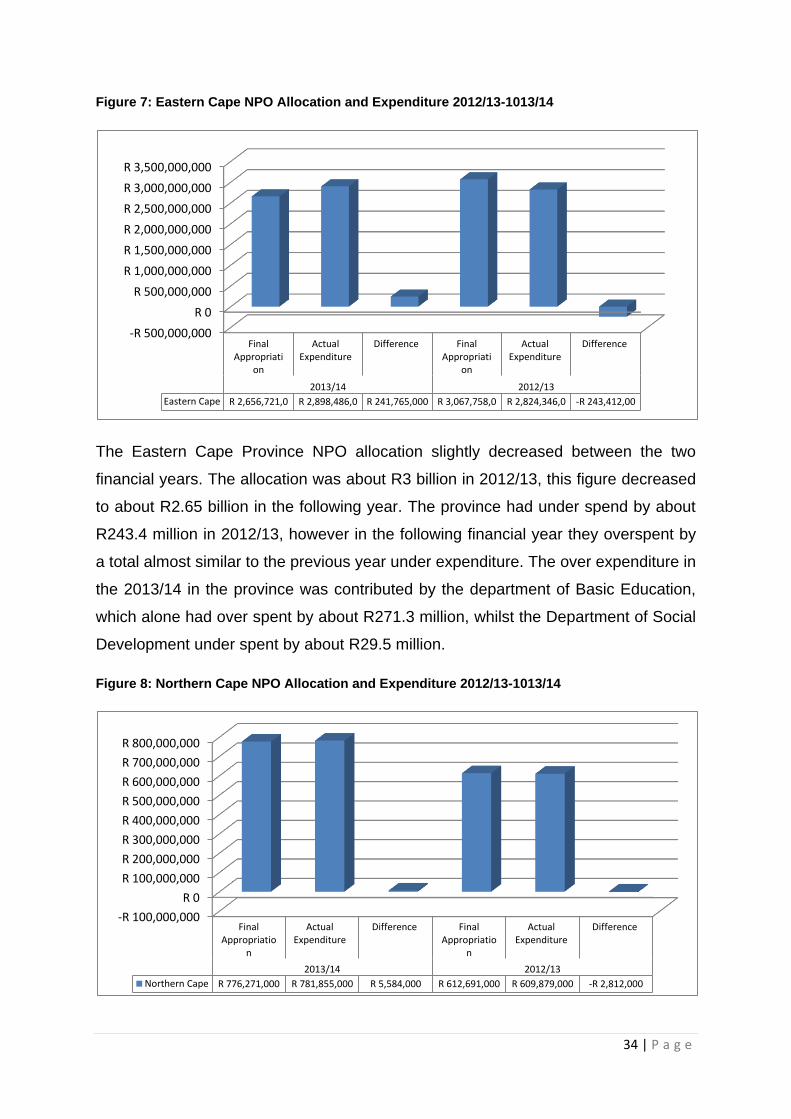
Figure 7: Eastern Cape NPO Allocation and Expenditure 2012/13-1013/14
The Eastern Cape Province NPO allocation slightly decreased between the two
financial years. The allocation was about R3 billion in 2012/13, this figure decreased
to about R2.65 billion in the following year. The province had under spend by about
R243.4 million in 2012/13, however in the following financial year they overspent by
a total almost similar to the previous year under expenditure. The over expenditure in
the 2013/14 in the province was contributed by the department of Basic Education,
which alone had over spent by about R271.3 million, whilst the Department of Social
Development under spent by about R29.5 million.
Figure 8: Northern Cape NPO Allocation and Expenditure 2012/13-1013/14
-R 500,000,000
R 0
R 500,000,000
R 1,000,000,000
R 1,500,000,000
R 2,000,000,000
R 2,500,000,000
R 3,000,000,000
R 3,500,000,000
Final Appropriati
on
Actual Expenditure
Difference Final Appropriati
on
Actual Expenditure
Difference
2013/14 2012/13
Eastern Cape R 2,656,721,0 R 2,898,486,0 R 241,765,000 R 3,067,758,0 R 2,824,346,0 -R 243,412,00
-R 100,000,000
R 0
R 100,000,000
R 200,000,000
R 300,000,000
R 400,000,000
R 500,000,000
R 600,000,000
R 700,000,000
R 800,000,000
Final Appropriatio
n
Actual Expenditure
Difference Final Appropriatio
n
Actual Expenditure
Difference
2013/14 2012/13
Northern Cape R 776,271,000 R 781,855,000 R 5,584,000 R 612,691,000 R 609,879,000 -R 2,812,000
35 | P a g e
The Northern Cape had shown increase of about 21.3% in its NPO allocations in the
two financial years. The NPO allocation increased from about R612.7 million in
2012/13 to about R776.3 million in 2013/14. In this province, in 2013/14, there was a
significant increase in the allocation despite that two of the provincial departments -
Agriculture and Sports - did not allocate any funding for NPOs in this financial year.
The expenditure patterns shows that in 2012/13, the province under spent by about
R2.8 million, whilst in the following year the province overspent by R5.6 million.
However, both under expenditure and over expenditure are significantly smaller
when compared to the overall allocation for both financial years.
Figure 9: Western Cape NPO Allocation and Expenditure 2012/13-1013/14
In the Western Cape, of the 13 listed provincial departments in the government
website, 10 (77%) of them had NPO allocation in their financial statement of the
annual report. The total provincial allocation for NPOs was about R1.37 billion in
2012/13, this allocation figure increased to about R1, 48 billion in the following
financial year. Although, the province has under spent over the two year period,
however, the under expenditure was insignificant. In the 2012/13 financial year, only
four departments under spent totalling about R16.7 million, in the following financial
year there were only two departments with an under expenditure of about R7.88
million.
-R 200,000,000
R 0
R 200,000,000
R 400,000,000
R 600,000,000
R 800,000,000
R 1,000,000,000
R 1,200,000,000
R 1,400,000,000
R 1,600,000,000
Final Appropriati
on
Actual Expenditure
Difference Final Appropriati
on
Actual Expenditure
Difference
2013/14 2012/13
Western Cape R 1,482,424,3 R 1,474,538,3 -R 7,886,000 R 1,367,963,0 R 1,351,261,3 -R 16,701,728

36 | P a g e
Figure 10: North West NPO Allocation and Expenditure 2012/13-1013/14
The total departments' allocation for NPOs for 2012/13 was about R2.39 billion. In
the following financial year the reported allocation decreased to about R1.165 billion.
The decrease in the total funding of NPOs in the province was due to the
Department of Health drastic reduction in NPO funding in 2013/14. The Provincial
Department of Health had allocated R127 604 000 for NPO funding in 2012/13, this
figure went down to R1 549 000 in 2013/14. Interestingly, this department had an
over expenditure of about R33 000 in 2012/13 which may have indicated that the
department may need to increase its funding levels for NPOs in the following year,
but instead the allocation was drastically cut to just over R1.5 million. To understand
such cuts the study would have applied a different method of inquiry, which would
have allowed the researchers to have follow indepth discussions with provincial
managers to source a better understanding form the department of health decision to
cut NPO budget in this province.
-R 500,000,000
R 0
R 500,000,000
R 1,000,000,000
R 1,500,000,000
R 2,000,000,000
R 2,500,000,000
Final Appropriatio
n
Actual Expenditure
Difference Final Appropriatio
n
Actual Expenditure
Difference
2013/14 2012/13
North West R 1,165,243,0 R 1,130,460,0 -R 34,783,000 R 2,414,481,0 R 2,391,375,0 -R 23,106,000

37 | P a g e
Figure 11: Free State NPO Allocation and Expenditure 2012/13-1013/14
The Free State NPO allocation came from 5 departments out of the total of the
eleven departments. The total reported NPO allocation for 2012/13 was about R1.47
billion, this allocation slightly increased to about R1.51 billion in the following
financial year. The Free State Province reported under expenditure in both of the
financial years. In 2012/13, the under expenditure was reported to be about R95.59
million, this figure decreased in the following financial to about R26.47 million.
The figures from provincial budget allocation to NPOs across all 9 provinces
understanding that they are incomplete due to some provincial departments not
posting their annual reports in their website, shows that government allocation to
NPOs is significant. The fact that the research results are showing an allocation of
over R20.1 billion in the financial year of 2012/13, and the allocation was over R14
billion in the following financial year suggests a willingness from the government to
invest in funding NPOs in South Africa.
Interpretation of the variation in the funding period in this report cannot be interpreted
as "decrease" in funding by provincial departments, but it is caused by missing
information based on the research methodology the study used for data collection.
However, the provincial results are a true reflection of the level of government
funding for NPOs at provincial level from all provincial departments we have
reviewed. It is also to important to note at this point that, the true allocation and
expenditure value is higher than what is reported given the fact that not all the
-R 200,000,000 R 0
R 200,000,000 R 400,000,000 R 600,000,000 R 800,000,000
R 1,000,000,000 R 1,200,000,000 R 1,400,000,000 R 1,600,000,000
Final Appropriatio
n
Actual Expenditure
Difference Final Appropriatio
n
Actual Expenditure
Difference
2013/14 2012/13
Free State R 1,513,073,0 R 1,486,600,0 -R 26,473,000 R 1,472,924,0 R 1,377,325,2 -R 95,598,747
Free State

38 | P a g e
provincial departments that have shown a trend of budgeting significantly for NPOs
we could not locate their annual reports for the years we reviewed. Despite of this
study limitation, the results also proves that government is in fact, in its
developmental policies, view NPOs as its development partner that needs resources
to fulfil the national developmental mandates as per the requirements of the NPO
act. It also confirms that the state and government, in its plan of developing a
capable state, understand that the NPO sector in critical partner that does not only
plays a passive role but an active role in improving the living conditions of poor
communities in South Africa.
10.3. Summary of government allocation to NPOs
These two spheres of government fund NPOs independently of each other as
defined in Chapter 5 and Chapter 6 of the republic of South Africa constitution. This
means National and Provincial government departments invest resources to different
NPOs operating in different sectors of the government agenda. The study has also
shown that a number of national and provincial departments allocate budget to
NPOs through their budgeting processes. This study is however, not concerned
about the processes used, efficiencies and accountabilities required to fund NPOs by
both spheres of government but to quantify the amount of money that these spheres
of government budget and spent on NPOs.
Table 3: National and Provincial Departments NPOs budget allocation and expenditure 2012/13
- 2013-14
2013/14 2012/13
Final Appropriation
Actual Expenditure
Difference Final Appropriation
Actual Expenditure
Difference
National R 1 892 249 000 R 1 425 302 100 -R 466 946 900 R 1 703 953 000 R 1 048 677 000 -R 655 276 000
Gauteng R 2 943 666 000 R 2 832 801 900 -R 110 864 100 R 5 682 379 000 R 5 410 636 000 -R 271 743 000
Mpumalanga R 835 224 000 R 833 305 000 -R 1 919 000 R 1 252 643 740 R 1 261 117 272 R 1 068 000
KwaZulu Natal R 1 046 409 000 R 1 009 050 000 -R 37 359 000 R 2 609 126 000 R 296 646 000 -R 2 312 480 000
Limpopo R 1 645 436 000 R 1 561 283 000 -R 84 153 000 R 1 585 990 000 R 1 553 187 000 -R 32 803 000
Eastern Cape R 2 656 721 000 R 2 898 486 000 R 241 765 000 R 3 067 758 000 R 2 824 346 000 -R 243 412 000
Northern Cape R 776 271 000 R 781 855 000 R 5 584 000 R 612 691 000 R 609 879 000 -R 2 812 000
Western Cape R 1 482 424 325 R 1 474 538 325 -R 7 886 000 R 1 367 963 054 R 1 351 261 326 -R 16 701 728
North West R 1 165 243 000 R 1 130 460 000 -R 34 783 000 R 2 414 481 000 R 2 391 375 000 -R 23 106 000
Free State R 1 513 073 000 R 1 486 600 000 -R 26 473 000 R 1 472 924 000 R 1 377 325 253 -R 95 598 747
Total R 15 956 716 325 R 15 433 681 325 -R 523 035 000 R 21 769 908 794 R 18 124 449 851 -R 3 652 864 475
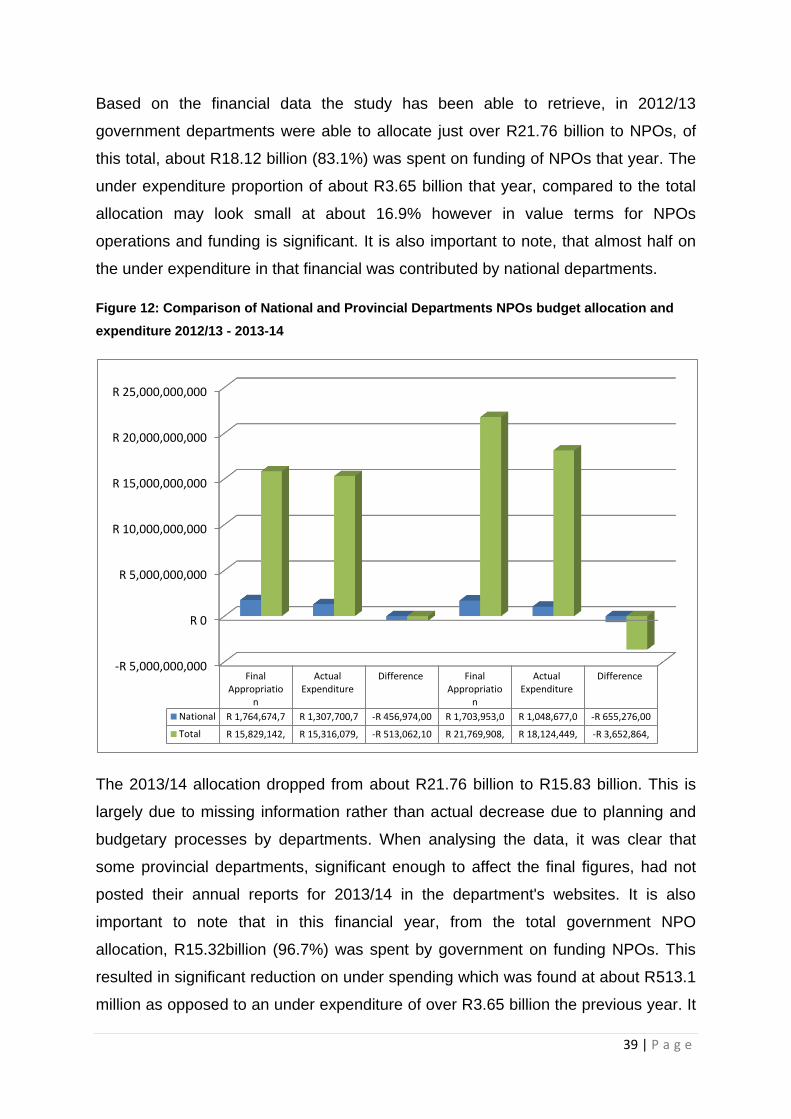
39 | P a g e
Based on the financial data the study has been able to retrieve, in 2012/13
government departments were able to allocate just over R21.76 billion to NPOs, of
this total, about R18.12 billion (83.1%) was spent on funding of NPOs that year. The
under expenditure proportion of about R3.65 billion that year, compared to the total
allocation may look small at about 16.9% however in value terms for NPOs
operations and funding is significant. It is also important to note, that almost half on
the under expenditure in that financial was contributed by national departments.
Figure 12: Comparison of National and Provincial Departments NPOs budget allocation and
expenditure 2012/13 - 2013-14
The 2013/14 allocation dropped from about R21.76 billion to R15.83 billion. This is
largely due to missing information rather than actual decrease due to planning and
budgetary processes by departments. When analysing the data, it was clear that
some provincial departments, significant enough to affect the final figures, had not
posted their annual reports for 2013/14 in the department's websites. It is also
important to note that in this financial year, from the total government NPO
allocation, R15.32billion (96.7%) was spent by government on funding NPOs. This
resulted in significant reduction on under spending which was found at about R513.1
million as opposed to an under expenditure of over R3.65 billion the previous year. It
-R 5,000,000,000
R 0
R 5,000,000,000
R 10,000,000,000
R 15,000,000,000
R 20,000,000,000
R 25,000,000,000
Final Appropriatio
n
Actual Expenditure
Difference Final Appropriatio
n
Actual Expenditure
Difference
National R 1,764,674,7 R 1,307,700,7 -R 456,974,00 R 1,703,953,0 R 1,048,677,0 -R 655,276,00
Total R 15,829,142, R 15,316,079, -R 513,062,10 R 21,769,908, R 18,124,449, -R 3,652,864,

40 | P a g e
is also important to note that the under expenditure has been largely contributed by
national departments who under spent by about R456.9 million in the financial year
of 2013/14.
Figure 13: Comparison of National and Provincial Departments NPOs funding levels and
expenditure levels
The governments’ NPOs funding levels seem to be equitable distributed across
national and provincial departments, except for Gauteng and Eastern Cape which
shown a higher than average range of funding whilst Northern Cape and
Mpumalanga NPO funding allocation is lower given the size and population of these
provinces. However, this shortage scenario can be explained by the lack of complete
information from the source used to extract the data. Interestingly one can observe
that national departments has visible under spending on NPO funding, this may be
as a result that national departments, by their nature of constitutional mandate, are
not an implementing arm of the state. It can also be noted that the department at
national sphere that has largely contributed to the under spending is the Science and
-R 3,000,000,000
-R 2,000,000,000
-R 1,000,000,000
R 0
R 1,000,000,000
R 2,000,000,000
R 3,000,000,000
R 4,000,000,000
R 5,000,000,000
R 6,000,000,000
National Gauteng Mpumalanga
Kwazulu Natal
Limpopo Eastern Cape
Northern Cape
Western Cape
North West
Free State
2013/14 Final Appropriation R 1,892,249 R 2,943,666 R 835,224,0 R 1,046,409 R 1,645,436 R 2,656,721 R 776,271,0 R 1,482,424 R 1,165,243 R 1,513,073
2013/14 Actual Expenditure R 1,425,302 R 2,832,801 R 833,305,0 R 1,009,050 R 1,561,283 R 2,898,486 R 781,855,0 R 1,474,538 R 1,130,460 R 1,486,600
2013/14 Difference -R 466,946, -R 110,864, -R 1,919,00 -R 37,359,0 -R 84,153,0 R 241,765,0 R 5,584,000 -R 7,886,00 -R 34,783,0 -R 26,473,0
2012/13 Final Appropriation R 1,703,953 R 5,682,379 R 1,252,643 R 2,609,126 R 1,585,990 R 3,067,758 R 612,691,0 R 1,367,963 R 2,414,481 R 1,472,924
2012/13 Actual Expenditure R 1,048,677 R 5,410,636 R 1,261,117 R 296,646,0 R 1,553,187 R 2,824,346 R 609,879,0 R 1,351,261 R 2,391,375 R 1,377,325
2012/13 Difference -R 655,276, -R 271,743, R 1,068,000 -R 2,312,48 -R 32,803,0 -R 243,412, -R 2,812,00 -R 16,701,7 -R 23,106,0 -R 95,598,7

41 | P a g e
Technology who may not have enough and sophisticated NPOs to fund in support of
the department mandate, which is largely research and innovation.
When it comes to appropriating some budgets for CSOs, a number of Government
departments across all 9 provinces have significant budgets and expenditure on
CSOs. The amount of monies contributed by departments varies from department to
department, which all explains the reason behind why some provinces had more
monies appropriated for CSOs than other Provinces (as shown by figure 13 above).
What can be deduced from the above figures and tables is that a significant number
of government departments do appropriate and spend a portion of their budgets on
NPOs.
Though the results of this study does provide the accurate NPO funding value by all
government departments in both spheres who have budgeted for NPOs in the two
years we have reviewed, but what it does is to show that there is a significant value
that government departments invest in funding NPOs in South Africa. It is also clear
that the two spheres of government are using NPOs to fulfil their respective
mandates thus adding value in improving access to public services by using NPOs
which have a better access to communities. There is no doubt that the state does
fulfil its legislated mandate as defined in the NPO Act No. 71 of 1997, of
encouraging and supporting non-profit organisations in their contribution to meeting
the diverse needs of the population of the Republic by: i) creating an environment in
which non-profit organisations can flourish; ii) creating an environment within which
the public may have access to information concerning registered non-profit
organisations; and iii) promoting a spirit of co-operation and shared responsibility
within government, donors and amongst other interested persons in their dealings
with non-profit organisations.
10.4. Annual reports reviewed
The figures which are showing governments’ financial contribution in support of the
work done by the NPOs in South Africa are accurate in relation to all the
departments that we reviewed their annual reports for 2013/14 financial year,
however the accurate total value of budget allocation by the National and Provincial
Departments could not be established using this study methodology. This is so due
to the reasons that some departments’ annual reports were not available on their

42 | P a g e
websites or using other search engine. This means that there is missing information
that could not be collected due to this limitation of the study as some departments
had not uploaded their reports in their website or have any other methods that would
allow other search engines to locate the reports at the time of data collection.
Appendix 1 shows all the departments which have uploaded their annual reports, as
well as those who did not conform, appendix 1 further reveals the national
departments which have allocated and those that did not allocate funding for NPOs
during the financial years of 2012/13 and 2013/14.
Out of a total number of 40 national departments that were subjects of this research,
approximately 33 of them have uploaded their 2013/14 annual reports on their
respective websites. This tells us that approximately 83% of the national
departments that were studied have uploaded their annual reports on their
respective websites, consequently 17% of the national government departments’
annual reports were not found on the websites of the departments as shown in
appendix1 of this report. Of the total (40) national government departments, 24
(60%) had budgeted for NPO funding, if we compare this figure to the number (33) of
departments reports that were reviewed the proportion of national government
departments budgeting for NPOs is reasonably high at 73%. What these results
suggest to us that the figures of NPO funding from the national government
departments would have been even higher than they are.
In a total of 113 Provincial departments that were subjects of the study,
approximately 90 of them were found to have uploaded their annual reports of the
2013/14 financial year. This means approximately 80% of the provincial
departments’ annual reports of 2013/14 financial year were found through the search
engine on the individual departments’ website. Annual reports that were not found
and therefore not analysed were approximately 20% of the provincial departments.
Despite the vast amounts of financials which are contributed by government
departments in creating an enabling environment for NPOs, the amounts could have
been more had all the departments uploaded their respective annual reports on their
website.

43 | P a g e
11. Discussion of results and recommendations
This is the first study undertaken by the National Development Agency to quantify
the value of commitment and investment by government to not for profit
organisations in South Africa. The NDA as an Agency of government tasked with
working with the civil society sector, has a responsibility of ensuring that the sector
has access to information that can advance efficiency and effectiveness of the
sector. As a state Agency, it has also a responsibility to assist the state in its efforts
of supporting the CSO sector. The sector and some social and development
commentators have raised an issue on government failure to fund NGOs in the
country. This study attempts to respond and provide factual information that can be
shared with the sector and government on the issue of NGOs funding in South
Africa.
There is a perception amongst the NPO sector and NPO funding lobby groups that
since the democratic government took over, it has gradually neglected the NPO
sector and thus funding by government has diminished. There is a number of
publications by researchers and organisations advocating for NPOs in South Africa
that has published papers and documents supporting the view that government is no
longer funding NPOs. The NDA has had a number of consultation with the sector,
and the sector has raised the same issue that government is no more funding NPOs
thus they are unable to survive and operate. The results of this study, looking at only
two financial years, has found that the government has allocated over R37.7 billion
to NPOs over that period. This figure we know is an under estimation of the total
value due the methodology used in the study, but is accurate figure for all the
departments that were reviewed in this study. The study has also found that the
departments funding NPOs at significant levels, such as health, social development,
public works, rural development, and agriculture are responsible for developing
communities in their various portfolios. This suggests that the funding of NPOs by
government is targeted, purposeful and systematic. One can argue and say funding
of NPOs by government has a purpose of ensuring that government programmes for
developing communities are implemented at community level and NPOs are the
ideal vehicle to perform this function.

44 | P a g e
There is also a debate and perception that the main source of funding for NGOs is
the private sector and donors. However, one can argue that it is difficult to establsih
the major source of funding for the sector. Existing literature on funding of NGOs
suggest that the level of funding from various sources is significant as compared to
government. The literature indicates that indicated that, in 2011, it was reported that
international donors, mainly from western governments and multilaterals reported
$1.2 billion in disbursements to South Africa. In 2008, the top 12 foreign
governments providing development assistance showed they had committed about
US$585 million to the South African government to fund development work through
the sector. Major foundations operating in South Africa funded civil society for over
R1.8billion in 2008, in the same year over R150million funding for the sector came
from local foundations. The Trialogue, a publication for CSIs report, in 2012 reported
that the private sector funded civil society organisations for R8 billion through
corporate social investment schemes. Whilst in 2009 the listed companies in the JSE
showed that about R1.9 billion was spent on social and development projects.
These figures suggest that NGOs does get funding from other sources and value is a
significant contribution to funding of NPOs. However, one can say that from this
study results, government remain the major funder of NPOs. The study has found
that in 2012/13 government allocated over R20 billion to NPOs and in 2013/14, the
funding was over R15 billion.
The government funding to NPOs seem to be embedded in a government planning
and policy and processes. The budgeting templates for both national and provincial
departments has an item for NPO Funding. This suggests that there is an
expectation from all departments to consider funding NPOs. Those departments,
who in their plans, have a role for NPOs budget for them. At the point of
implementation, the expenditure column requires departments to report on how
much they have spent against the budgeted amount. In the majority of these
departments, the expenditure is over 90% against the budget suggesting that the
allocated money is disbursed to NPOs funded by the departments. In this study, at
national level, only one department had an over expenditure, whilst the majority had
spent all the allocated money with few (7) of these departments showing under
expenditure and the large share (96%) of that under expenditure was contributed by
only one department. Interestingly at provincial sphere, the total under expenditure

45 | P a g e
was insignificant, out of the R15.95 billion budgeted, only a small fraction (0.004%)
of R56 million was recorded as under expenditure. This may suggest that the
planning, budgeting and implementation process at this level is functional and
efficient. The money allocated to NPOs does go to the intended recipients.
The under expenditure, as much as it can be defined as not significant in
proportional terms to the budget, but in real money terms it is significant, especially if
the NPO sector perceive that the state is not putting much resources to it.
Table 3: Proportion (%) of actual expenditure and under expenditure on NPO funding 2012/13-
2013/14
2013/14 2012/13
Final Appropriation
Actual Expenditure
Difference Final Appropriation
Actual Expenditure
Difference
National & Provincial R 15 956 716 325 R 15 433 681 325 R 523 035 000 R 21 769 908 794 R 18 124 449 851 R 3 652 864 475
Percentage 96.72% 3.28% 83.25% 16.78%
National R 1 892 249 000 R 1 425 302 100 R 466 946 900 R 1 703 953 000 R 1 048 677 000 R 655 276 000
Percentage 75.32% 24.68% 61.54% 38.46%
Provincial R 14 064 467 325 R 14 008 379 225 R 56 088 100 R 20 065 955 794 R 17 075 772 851 R 2 997 588 475
Percentage 99.60% 0.40% 85.10% 14.94%
The under expenditure at both national and provincial spheres was very high or
significant both in proportional terms and actual value in the 2012/13 financial year.
However, in the 2013/14 period on both spheres of government under expenditure
significantly dropped. The reasons for the decrease in under expenditure cannot be
answered by this study as it did not take that line of enquiry. Second, we only look at
only two time periods which does not provide reliable periods to start to observe
trends. In the absence of such reliable information, we can however say there may
have been some interventions by departments to reduce the under expenditure
given the size of the sample of departments in this study.
The study was not set up to test any process issues in as far as funding of NPOs,
however, the data collection method used relied on the availability of posted
departments annual reports in the websites. This method was selected on the basis
of government frameworks and policies. The National Treasury Framework for
Strategic Plans and Annual Performance plans, states in section 4, under documents
of the planning, budgeting and reporting cycle in part that: "All planning and reporting
46 | P a g e
documents are expected to be published on departmental or institutional websites, in
addition to formal tabling in the relevant legislature." The expectation was therefore
all departments comply with this government requirement. The study has found that
many departments, in fact a significant number of the departments are not complying
with this requirement. The important issue is access to the information, which may
limit the NPOs sector to know which department budget for NPOs and they may
want to link with that department for their own funding.
The results and the discussions presented suggest that we offer recommendations
to some of the issues raised by this study.
There are perceptions from many sectors that government is not funding the NPOs
sector. The study has confirmed that government is making significant investment on
NPOs in South Africa. The department needs to have a process and programmes
that informs NPOs on their funding levels and process for NPOs funding by
government. This must be communicated using all communications channels
including the Imbizos and community meetings.
The departments need to ensure that they comply with national frameworks and
policies on making information available to the public. The fact that departments are
not loading their annual reports on their websites makes it difficult for the public to
access information. It is important for government to share information that may
assist the public in knowing what the government is doing.
Further studies using different methodologies need to be undertaken to provide a
complete picture on how government is supporting the NPO sector. A study that will
use both qualitative and quantitative method would better answer the questions of
how?, why? and for what? This study did not answer those questions which are very
important for justification of the results. The study must also look at longer periods to
ensure that it can establish trends that can be used to make inferences of the
results. The researchers would therefore need to do a follow-up study on the issue of
government funding to NPOs so as to provide an accurate picture of this study area.

47 | P a g e
12. References
1. Bickman, L. And Rog, D, J. (1998). Handbook of Applied Social Research
Methods. SAGE Publications. Accessed at:
https://books.google.co.za/books/about/Handbook_of_Applied_Social_Resear
ch_Meth.html?id=2A8w6KHJGIIC
2. Bottomley A and Guénéheux D (2014). Accountability for Civil Society by Civil
Society: A Guide to Self-Regulation Initiatives. CIVICUS, World Alliance for Citizen
Participation, Johannesburg, South Africa.
3. Chief Directorate Specialist Social Services. (2013). Policy on Non-Profit
Organisations Funding Process Flow and Decision Making Chain. Department
of Social Development North West Provincial Government.
4. Coalition on Civil Society Resource Mobilisation (2012). Critical Perspectives
on Sustainability of the South African Civil Society Sector. Charities Aid
Foundation Southern Africa.
5. Coalition on Civil Society Resource Mobilisation, (2012). Critical Perspectives
Sustainability of the on South African Civil Society Sector, Auckland Park.
Jacana Media (Pty) Ltd.
6. Co-operative for Research & Education. (2013). Funding Constraints &
Challenges faced by Civil Society in South Africa. National Development
Agency, Johannesburg.
7. Department of Social Development, (2013). National plan of action towards
the implementation of the nonprofit organisations summit resolutions: Toward
the three year plan: 2013-2015. Department of Social development, Pretoria
.
8. Dobie K & Camerer M (2013). Self-Mastery and Leading: GIZ Coaching
Strengthens South African Civil Society in the Fight Against Corruption.
Deutsche Gesellschaft für Internationale Zusammenarbeit (GIZ) GmbH,
Eschborn, Germany
9. Funds for NGOs, (2009). Accessed at https://www.fundsforngos.org/
10. Giske C. Lillehammer, (2003) State-NGO relationships in transitional
democracies: The case of CPA-ONG-a government centre for the
advancement of NGOs in Benin. United Nations Development Programme –
Oslo Governance Centre

48 | P a g e
11. Good Governance Learning Network (2008 ). Local democracy in action: A
civil society perspective on local governance in South Africa. Good
Governance Learning Network, Cape Town
12. Government of South Africa (1998). National Development Agency act 108 of
1998. Pretoria, South Africa.
13. Greater Good SA (2012). NPO Job Losses and Service Cuts Report.
http://greatercapital.co.za/wp-content/uploads/2014/03/Findings-of-the-Non-
Profit-Funding-Services-and-Jobs-Survey-Final.pdf (accessed 04 September
2015).
14. Hendrickse, R. F. (2008). Governance and Financial Sustainability of NGOs in
South Africa. Thesis (Phd). University of the Western Cape.
15. Inyathelo: The South African Institute for Advancement (2014). The civil
society landscape
16. Mathekga, R (udated). The role of civil society in South African's peer review
mechanism: A critical reflection. Centre for public participation, IDAS
17. McKinley, D, T. (YEAR). Building Strategic Coalitions in Civil Society. South
African Civil Society Information Service. Johannesburg.
18. National Development Agency (2008). Review of the State of Civil Society
Organisations in South Africa. National Development Agency, Johannesburg
19. National Development Agency Act 108 of 1998,
http://www.saflii.org/za/legis/num_act/ndaa1998268.pdf (accessed 04
September 2015)
20. Non-Profit Organisation Act No 71 of 1997.(1997). Government Printing:
Pretoria.
21. Non-profit Organisations Act 71 of 1997.
http://www.dsd.gov.za/npo/dmdocuments/NPO%20Act.pdf (accessed 04
September 2015)
22. O'Riordan A, (2013). Funding Civil Society in South Africa: Where Does the
Money Go?. The South African Civil Society Information Service,
Johannesburg.
23. Savage, M. (Not Dated) Toward a Porous Membrane: Civil Society and the
State of South Africa.
49 | P a g e
24. Sebugwawo, M. (2014). South African Civil Society and the implementation of
the National Development Plan (NDP). http://www.afesis.org.za/local-
economic-development/local-economic-development-articles/47-south-
african-civil-society-and-the-implementation-of-the-national-development-
plan-ndp.html
25. Sibanda, J. (2009). How Funding Affects Service Delivery among Non-Profit
Organisations. Research Report. University of Witwatersrand, Johannesburg.
26. Statistics South Africa, (2011). Statistics of the non-profit sector for South
Africa. Published by Statistics South Africa, Pretoria.
27. Stuart, L. (2013). The South African Nonprofit Sector: Struggling to Survive,
Needing to Thrive. Accessed at:
http://www.consultancyafrica.com/index.php?option=com_content&view=articl
e&id=1258:the-south-african-non-profit-sector-struggling-to-survive-needing-
to-thrive-&catid=57:africa-watch-discussion-papers&Itemid=263
28. The Newage (2012), NGOs in crisis over lack of funding and staff losses.
http://www.thenewage.co.za/57820-1016-53 (accessed 04 September 2015)
29. WORLD HEALTH ORGANIZATION,(2002). Understanding Civil Society
Issues for WHO. can be accessed at:
http://www.who.int/civilsociety/documents/en/understanding_en.pdf
30. Youth Development Network. (2005). The Status of Funding for Development
in South Africa. Youth Development Network, Johannesburg.

50 | P a g e
Appendix 1: National Departments Annual Reports Reviewed
National Departments 2013/14 annual report Found 2013/14 Funding 2012/13 Funding
1. Agriculture, Forestry and Fisheries Report available Appropriated Appropriated
2. Arts and Culture Report available Appropriated Appropriated
3. Basic Education Report available Appropriated Appropriated
4. Civilian Secretariat for Police - - -
5. Communications Report available - -
6. Cooperative Governance Report available appropriated Appropriated
7. Correctional Services Report available No appropriation No appropriation
8. Defence Report available Appropriated Appropriated
9. Economic Development Report available Appropriated No appropriation
10. Energy Report available Appropriated No appropriation
11. Environmental Affairs Report available No appropriation No appropriation
12. Health Report available Appropriated Appropriated
13. Higher Education and Training -
14. Home Affairs Report available No appropriation No appropriation
15. Housing Report available No appropriation Appropriated
16. Human Settlements Report available No appropriation No appropriation
17. International Relations and Cooperation Report available No appropriation No appropriation
18. Justice and Constitutional Development Report available No appropriation No appropriation
19. Labour Report available Appropriated Appropriated
20. Military Veterans Report available No appropriation No appropriation
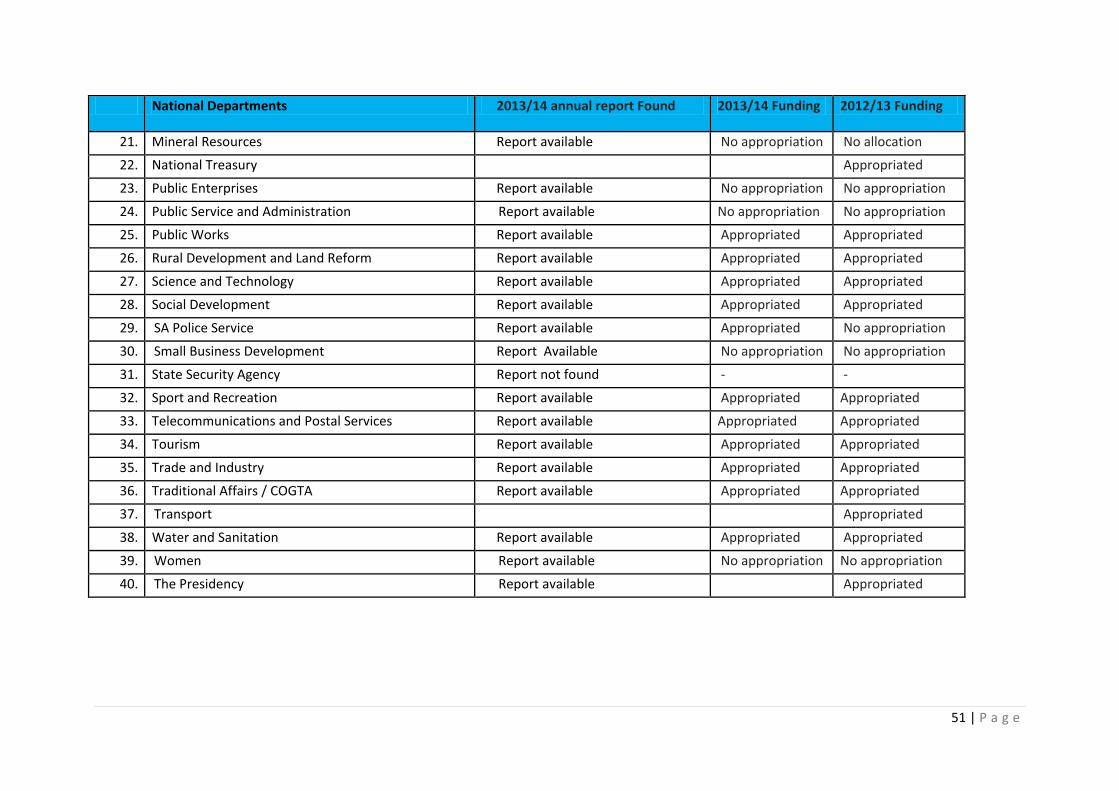
51 | P a g e
National Departments 2013/14 annual report Found 2013/14 Funding 2012/13 Funding
21. Mineral Resources Report available No appropriation No allocation
22. National Treasury Appropriated
23. Public Enterprises Report available No appropriation No appropriation
24. Public Service and Administration Report available No appropriation No appropriation
25. Public Works Report available Appropriated Appropriated
26. Rural Development and Land Reform Report available Appropriated Appropriated
27. Science and Technology Report available Appropriated Appropriated
28. Social Development Report available Appropriated Appropriated
29. SA Police Service Report available Appropriated No appropriation
30. Small Business Development Report Available No appropriation No appropriation
31. State Security Agency Report not found - -
32. Sport and Recreation Report available Appropriated Appropriated
33. Telecommunications and Postal Services Report available Appropriated Appropriated
34. Tourism Report available Appropriated Appropriated
35. Trade and Industry Report available Appropriated Appropriated
36. Traditional Affairs / COGTA Report available Appropriated Appropriated
37. Transport Appropriated
38. Water and Sanitation Report available Appropriated Appropriated
39. Women Report available No appropriation No appropriation
40. The Presidency Report available Appropriated

52 | P a g e
Appendix 2: List of provincial government departments
Provincial Departments 2013/14 annual report Found 2013/14 Funding 2012/13 Funding
1 Eastern Cape
2 Department of Economic Development, Environmental Affairs and Tourism
Report available Appropriated Appropriated
3 Department of Education Report available Appropriated Appropriated
4 Department of Health Report not accessible No appropriation No appropriation
5 Department of Human Settlements No report
6 Department of Local Government and Traditional Affairs No report
7 Department of Provincial Planning and Treasury Report available No appropriation No appropriation
8 Department of Roads and Public Works Report available No appropriation Appropriated
9 Department of Rural Development and Agrarian Reform Report available Appropriated Appropriated
10 Department of Safety and Liaison Report available
11 Department of Social Development and Special Programmes Report available Appropriated Appropriated
12 Department of Sport, Recreation, Arts and Culture Report available Appropriated Appropriated
13 Department of Transport No report No appropriation No appropriation
Free State
14 Department of the Premier Report available No appropriation No appropriation
15 Department of Agriculture and Rural Development Report available
16 Department of Cooperative Governance and Traditional Affairs Report available Appropriated Appropriated
17 Department of Economic Development, Tourism and Environmental Affairs Report available

53 | P a g e
Provincial Departments 2013/14 annual report Found 2013/14 Funding 2012/13 Funding
18 Department of Education Report available Appropriated Appropriated
19 Department of Health Report available Appropriated Appropriated
20 Department of Human Settlements Report available No appropriation No appropriation
21 Department of Police, Roads and Transport Report available No appropriation No appropriation
22 Department of Public Works Report available No appropriation No appropriation
23 Department of Social Development Report available Appropriated Appropriated
24 Department of Sports, Arts, Culture and Recreation Report available Appropriated Appropriated
Department of Treasury Report available
Gauteng
25 Department of Agriculture and Rural Development Report available Appropriated Appropriated
26 Department of Community Safety No report 27 Department of Economic Development Report available No appropriation No appropriation
28 Department of Education Report available Appropriated Appropriated
29 Department of Finance Report available No appropriation No appropriation
30 Department of Health No report
Appropriated
31 Department of Human Settlements No report 32 Department of Infrastructure Development Report available No appropriation No appropriation
33 Department of Roads and Transport No report 34 Department of Social Development No report
Appropriated
35 Department of Sport, Arts, Culture and Recreation Report available Appropriated Appropriated
36 Gauteng Provincial Treasury No report 37 Gauteng Provincial Legislature No report Office of the Premier Report available Appropriated Appropriated
KwaZulu-Natal
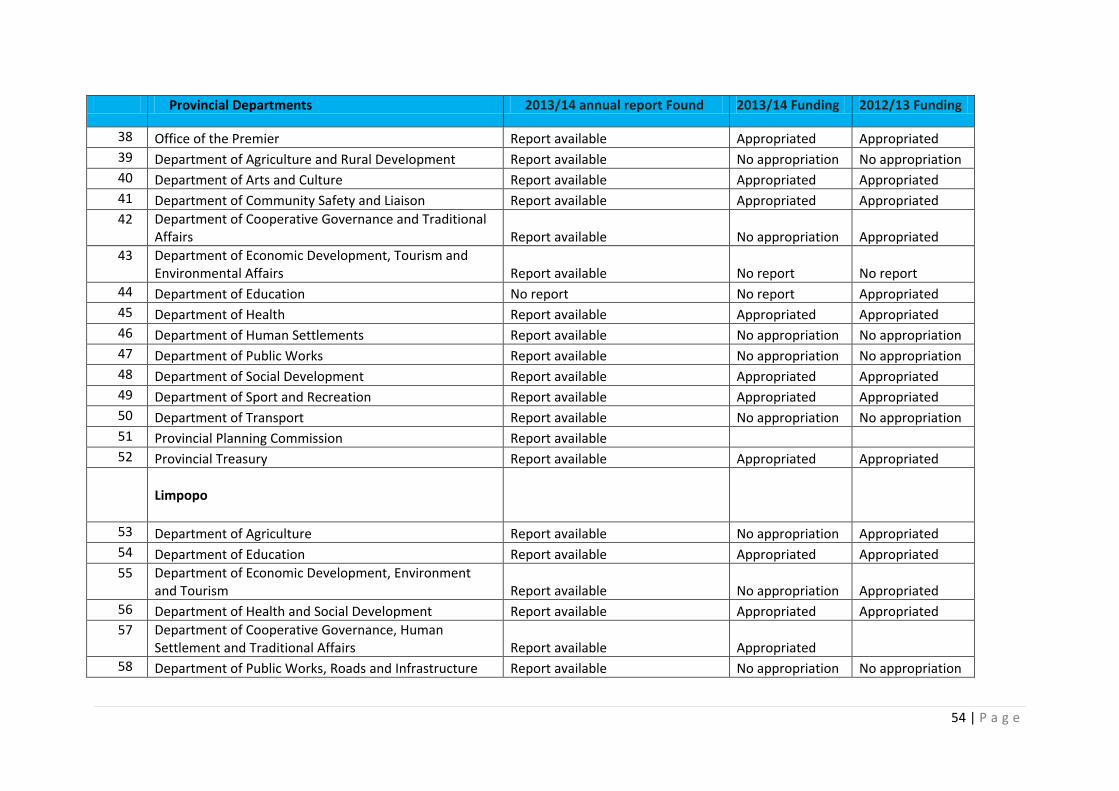
54 | P a g e
Provincial Departments 2013/14 annual report Found 2013/14 Funding 2012/13 Funding
38 Office of the Premier Report available Appropriated Appropriated
39 Department of Agriculture and Rural Development Report available No appropriation No appropriation
40 Department of Arts and Culture Report available Appropriated Appropriated
41 Department of Community Safety and Liaison Report available Appropriated Appropriated
42 Department of Cooperative Governance and Traditional Affairs Report available No appropriation Appropriated
43 Department of Economic Development, Tourism and Environmental Affairs Report available No report No report
44 Department of Education No report No report Appropriated
45 Department of Health Report available Appropriated Appropriated
46 Department of Human Settlements Report available No appropriation No appropriation
47 Department of Public Works Report available No appropriation No appropriation
48 Department of Social Development Report available Appropriated Appropriated
49 Department of Sport and Recreation Report available Appropriated Appropriated
50 Department of Transport Report available No appropriation No appropriation
51 Provincial Planning Commission Report available 52 Provincial Treasury Report available Appropriated Appropriated
Limpopo
53 Department of Agriculture Report available No appropriation Appropriated
54 Department of Education Report available Appropriated Appropriated
55 Department of Economic Development, Environment and Tourism Report available No appropriation Appropriated
56 Department of Health and Social Development Report available Appropriated Appropriated
57 Department of Cooperative Governance, Human Settlement and Traditional Affairs Report available Appropriated
58 Department of Public Works, Roads and Infrastructure Report available No appropriation No appropriation
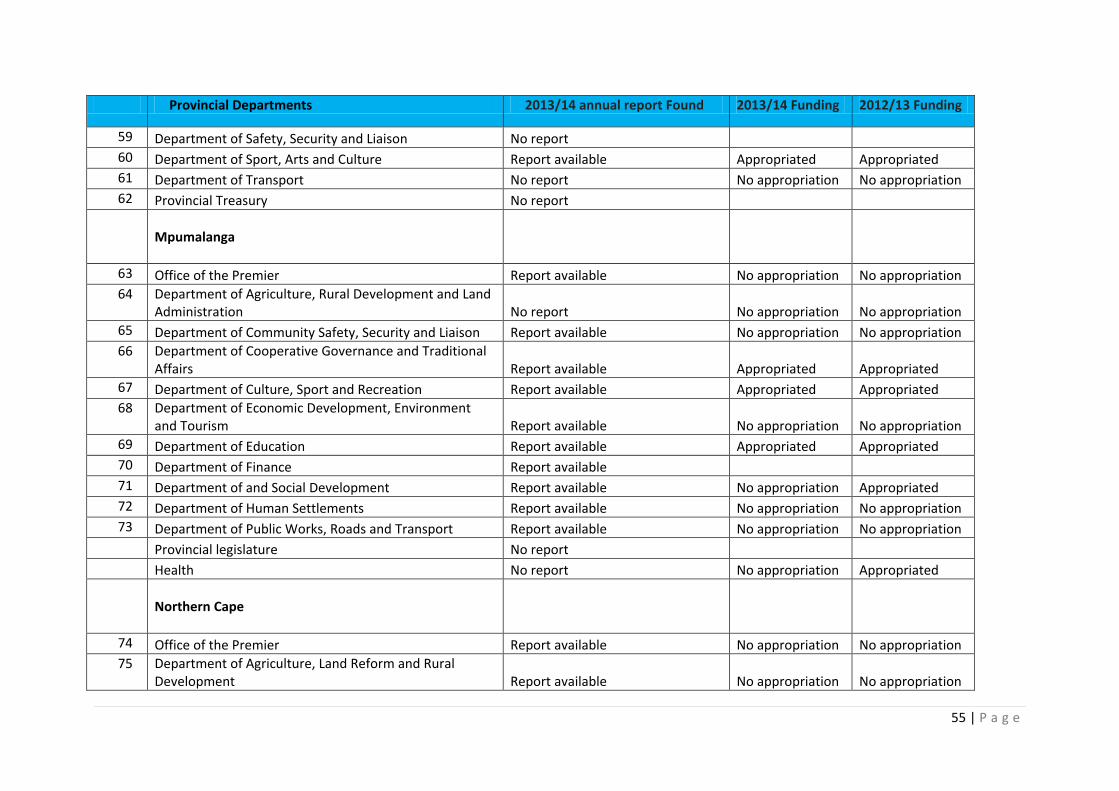
55 | P a g e
Provincial Departments 2013/14 annual report Found 2013/14 Funding 2012/13 Funding
59 Department of Safety, Security and Liaison No report 60 Department of Sport, Arts and Culture Report available Appropriated Appropriated
61 Department of Transport No report No appropriation No appropriation
62 Provincial Treasury No report
Mpumalanga
63 Office of the Premier Report available No appropriation No appropriation
64 Department of Agriculture, Rural Development and Land Administration No report No appropriation No appropriation
65 Department of Community Safety, Security and Liaison Report available No appropriation No appropriation
66 Department of Cooperative Governance and Traditional Affairs Report available Appropriated Appropriated
67 Department of Culture, Sport and Recreation Report available Appropriated Appropriated
68 Department of Economic Development, Environment and Tourism Report available No appropriation No appropriation
69 Department of Education Report available Appropriated Appropriated
70 Department of Finance Report available 71 Department of and Social Development Report available No appropriation Appropriated
72 Department of Human Settlements Report available No appropriation No appropriation
73 Department of Public Works, Roads and Transport Report available No appropriation No appropriation
Provincial legislature No report Health No report No appropriation Appropriated
Northern Cape
74 Office of the Premier Report available No appropriation No appropriation
75 Department of Agriculture, Land Reform and Rural Development Report available No appropriation No appropriation

56 | P a g e
Provincial Departments 2013/14 annual report Found 2013/14 Funding 2012/13 Funding
76 Department of Cooperative Governance, Human Settlement and Traditional Affairs Report available Appropriated Appropriated
77 Department of Education Report available Appropriated Appropriated
78 Department of Environment and Nature Conservation Report available No appropriation No appropriation
79 Department of Finance, Economic Affairs and Tourism Report available No appropriation No appropriation
80 Department of Health Report available Appropriated Appropriated
81 Department of Roads and Public Works Report available No appropriation No appropriation
82 Department of Social Development Report available Appropriated appropriated
83 Department of Sport, Arts & Culture Report available Appropriated Appropriated
84 Department of Transport, Safety and Liaison Report available Appropriated Appropriated
85 Provincial Legislature Report available Appropriated Appropriated
North West
86 Office of the Premier Report available Appropriated Appropriated
87 Department of Community Safety and Transport Management Report available Appropriated Appropriated
88 Department of Culture, Arts and Traditional Affairs Report available Appropriated Appropriated
89 Department of Education and Sport Development Report available Appropriated Appropriated
90 Department of Finance, Economy and Enterprise Development Report available No appropriation No appropriation
91 Department of Health Report available Appropriated Appropriated
92 Department of Local Government and Human Settlements Report available Appropriated Appropriated
93 Department of Public Works and Roads Report available No appropriation No appropriation
94 Department of Rural, Environment and Agricultural Development No report
95 Department of Social Development Report available Appropriated Appropriated
96 Department of Tourism No report

57 | P a g e
Provincial Departments 2013/14 annual report Found 2013/14 Funding 2012/13 Funding
97 Provincial Legislature Report available No appropriation No appropriation
Western Cape
98 Department of Agriculture Report available Appropriated Appropriated
99 Department of Community Safety Report available Appropriated No allocation
100 Department of Cultural Affairs and Sport Report available Appropriated Appropriated
101 Department of Economic Development and Tourism Report available Appropriated Appropriated
102 Department of Education Report available Appropriated Appropriated
103 Department of Environmental Affairs and Development Planning Report available Appropriated Appropriated
104 Department of Health Report available Appropriated Appropriated
105 Department of Human Settlements Report available No appropriation No appropriation
106 Department of Local Government Report inaccessible Allocated
107 Department of Social Development Report available Appropriated Appropriated
108 Department of Transport and Public Works Report available Appropriated Appropriated
109 Department of the Premier Report available Appropriated Appropriated
110 Provincial Treasury Report available
No appropriation
No appropriation

58 | P a g e
Appendix 3: National NPO Budget allocation and expenditure data sheet
2013/14 2012/13
National Departments Final Appropriation Actual Expenditure Difference Final Appropriation Actual Expenditure Difference
Health R 211 058 000 R 209 654 000 -R 1 404 000 R 201 255 000 R 196 213 000 -R 5 042 000
Basic Education R 15 050 000 R 15 050 000 R 0 R 6 050 000 R 6 050 000 R 0
Social Development R 104 007 000 R 89 884 000 -R 14 123 000 R 71 678 000 R 71 553 000 -R 125 000
Agric & Forestry R 20 318 000 R 19 092 000 -R 1 226 000 R 13 351 000 R 13 351 000 R 0
Public Works R 438 281 000 R 448 679 000 R 10 398 000 R 282 724 000 R 292 627 000 R 9 903 000
Sports & Recreation R 174 656 000 R 174 656 000 R 0 R 222 174 000 R 221 272 000 -R 902 000
Housing R 0 R 0 R 0 R 400 000 R 400 000 R 0
Defence R 7 701 000 R 7 701 000 R 0 R 8 401 000 R 8 401 000 R 0
COGTA R 17 117 000 R 13 888 000 -R 3 229 000 R 5 903 000 R 3 693 000 -R 2 210 000
Environmental R 1 517 000 R 1 517 000 R 0 R 6 888 000 R 6 887 000 -R 1 000
Tourism R 26 000 000 R 26 000 000 R 0 R 26 585 000 R 26 060 000 -R 525 000
Labour R 127 702 000 R 127 702 000 R 0 R 88 711 000 R 88 030 000 -R 681 000
Water R 1 410 000 R 1 108 100 -R 301 900 R 674 000 R 490 000 -R 184 000
Trade R 27 885 000 R 27 885 000 R 0 R 23 900 000 R 23 900 000 R 0
Presidency R 0 R 0 R 0 R 110 000 R 110 000 R 0
Science & Technology R 533 502 000 R 84 701 000 -R 448 801 000 R 718 814 000 R 63 305 000 -R 655 509 000
Police R 1 000 000 R 1 000 000 R 0 R 0 R 0 R 0
Rural Development R 6 433 000 R 6 433 000 R 0 R 5 061 000 R 5 061 000 R 0
Arts & Culture R 110 512 000 R 102 252 000 -R 8 260 000 R 12 873 000 R 12 873 000 R 0
Economic Development R 7 701 000 R 7 701 000 R 0 R 8 401 000 R 8 401 000 0
Energy R 60 000 000 R 60 000 000 R 0 R 0 R 0 0
Telecommunications & Postal Services R 399 000 R 399 000 0
National Treasury 0 0 0 R 85 000 R 0
Transport 0 0 0 R 17 827 000 R 17 827 000
Totals R 1 892 249 000 R 1 425 302 100 -R 466 946 900 R 1 703 953 000 R 1 048 677 000 -R 655 276 000

59 | P a g e
Appendix 4: Provincial Departments NPO Budget allocation and expenditure data sheet
Mpumalanga 2013/14 2012/13
Departments Final Appropriation Actual Expenditure Difference Final Appropriation Actual Expenditure Difference
Education R 814 554 000 R 813 280 000 -R 1 274 000 R 942 837 000 R 951 327 000 R 8 490 000
Social Development R 0 R 289 122 000 R 290 190 000 R 1 068 000
Culture, Sport & Recreation R 7 700 000 R 7 080 000 -R 620 000 R 10 500 000 R 9 570 000 -R 930 000
COGTA R 12 970 000 R 12 945 000 -R 25 000 R 10 030 000 R 9 880 000 -R 150 000
Health R 154 740 R 150 272 -4468
Totals R 835 224 000 R 833 305 000 -R 1 919 000 R 1 252 643 740 R 1 261 117 272 R 8 473 532
Gauteng 2013/14 2012/13
Departments Final Appropriation Actual Expenditure Difference Final Appropriation Actual Expenditure Difference
Education R 2 874 341 000 R 2 763 853 000 -R 110 488 000 R 2 859 243 000 R 2 686 863 000 -R 172 380 000
Health R 0 R 916 785 000 R 817 505 000 -R 99 280 000
Social Development R 0 R 1 886 561 000 R 1 886 561 000 R 0
Sports, Arts, Culture and Recreation R 31 006 000 R 30 629 000 -R 377 000 R 19 790 000 R 19 648 000 -R 142 000
Office of the Premier R 37 710 000 R 37 710 000 R 0 R 0 R 0 R 0
Agriculture and Rural Development R 609 000 R 609 900 R 900 R 60 000 R 59 000 -R 1 000
Office of the Premier R 37 710 000 R 37 710 000 R 0
Totals R 2 943 666 000 R 2 832 801 900 -R 110 864 100 R 5 682 379 000 R 5 410 636 000 -R 271 743 000
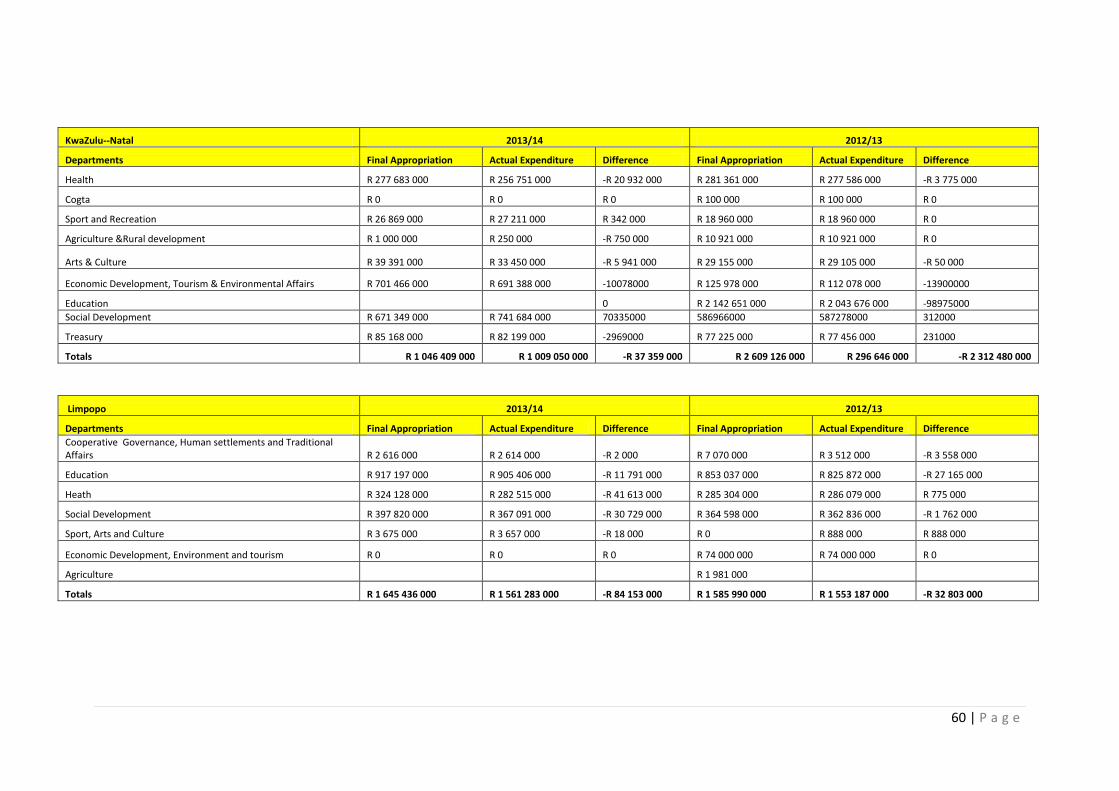
60 | P a g e
KwaZulu--Natal 2013/14 2012/13
Departments Final Appropriation Actual Expenditure Difference Final Appropriation Actual Expenditure Difference
Health R 277 683 000 R 256 751 000 -R 20 932 000 R 281 361 000 R 277 586 000 -R 3 775 000
Cogta R 0 R 0 R 0 R 100 000 R 100 000 R 0
Sport and Recreation R 26 869 000 R 27 211 000 R 342 000 R 18 960 000 R 18 960 000 R 0
Agriculture &Rural development R 1 000 000 R 250 000 -R 750 000 R 10 921 000 R 10 921 000 R 0
Arts & Culture R 39 391 000 R 33 450 000 -R 5 941 000 R 29 155 000 R 29 105 000 -R 50 000
Economic Development, Tourism & Environmental Affairs R 701 466 000 R 691 388 000 -10078000 R 125 978 000 R 112 078 000 -13900000
Education 0 R 2 142 651 000 R 2 043 676 000 -98975000
Social Development R 671 349 000 R 741 684 000 70335000 586966000 587278000 312000
Treasury R 85 168 000 R 82 199 000 -2969000 R 77 225 000 R 77 456 000 231000
Totals R 1 046 409 000 R 1 009 050 000 -R 37 359 000 R 2 609 126 000 R 296 646 000 -R 2 312 480 000
Limpopo 2013/14 2012/13
Departments Final Appropriation Actual Expenditure Difference Final Appropriation Actual Expenditure Difference
Cooperative Governance, Human settlements and Traditional Affairs R 2 616 000 R 2 614 000 -R 2 000 R 7 070 000 R 3 512 000 -R 3 558 000
Education R 917 197 000 R 905 406 000 -R 11 791 000 R 853 037 000 R 825 872 000 -R 27 165 000
Heath R 324 128 000 R 282 515 000 -R 41 613 000 R 285 304 000 R 286 079 000 R 775 000
Social Development R 397 820 000 R 367 091 000 -R 30 729 000 R 364 598 000 R 362 836 000 -R 1 762 000
Sport, Arts and Culture R 3 675 000 R 3 657 000 -R 18 000 R 0 R 888 000 R 888 000
Economic Development, Environment and tourism R 0 R 0 R 0 R 74 000 000 R 74 000 000 R 0
Agriculture R 1 981 000
Totals R 1 645 436 000 R 1 561 283 000 -R 84 153 000 R 1 585 990 000 R 1 553 187 000 -R 32 803 000

61 | P a g e
Eastern Cape 2013/14 2012/13
Departments Final Appropriation Actual Expenditure Difference Final Appropriation Actual Expenditure Difference
Education R 2 106 246 000 R 2 377 584 000 R 271 338 000 R 2 599 940 000 R 2 361 604 000 R 238 336 000
Economic Development, Environmental Affairs and Tourism R 1 000 000 R 1 000 000 R 0 R 144 000 R 144 000 R 0
Rural Development and Agrarian Reform R 31 282 000 R 31 282 000 R 0 R 31 806 000 R 31 806 000 R 0
Social Development and special Programmes R 484 810 000 R 455 237 000 -R 29 573 000 R 409 895 000 R 404 821 000 -R 5 074 000
Sports, Recreation, Arts and Culture R 33 383 000 R 33 383 000 R 0 R 25 853 000 R 25 851 000 -R 2 000
Roads and Public Works R 0 R 0 R 0 R 120 000 R 120 000 R 0
Totals R 2 656 721 000 R 2 898 486 000 R 241 765 000 R 3 067 758 000 R 2 824 346 000 -R 243 412 000
Northern Cape 2013/14 2012/13
Departments Final Appropriation Actual Expenditure Difference Final Appropriation Actual Expenditure Difference
Provincial Legislature R 221 890 000 R 221 890 000 R 0 R 21 073 000 R 21 073 000 R 0
Agriculture, Land Reform & Development R 0 R 3 649 000 R 1 826 000 -R 1 823 000
Cooperative Governance, Human Settlements & Traditional Affairs R 500 000 R 57 000 -R 443 000 R 500 000 R 500 000 R 0
Education R 324 807 000 R 330 892 000 R 6 085 000 R 402 498 000 R 402 498 000 R 0
Social Development R 183 150 000 R 183 088 000 -R 62 000 R 130 322 000 R 130 222 000 -R 100 000
Health R 41 573 000 R 41 626 000 R 53 000 R 48 517 000 R 48 517 000 R 0
Sports R 2 368 000 R 2 319 000 -R 49 000 R 3 487 000 R 2 598 000 -R 889 000
Transport R 1 983 000 R 1 983 000 R 0 R 2 645 000 R 2 645 000 R 0
Totals R 776 271 000 R 781 855 000 R 5 584 000 R 612 691 000 R 609 879 000 -R 2 812 000

62 | P a g e
Free State 2013/14 2012/13
Departments Final Appropriation Actual Expenditure Difference Final Appropriation Actual Expenditure Difference
Provincial Legislature R 0 R 241 000 R 241 000 R 0
Cooperative Governance & Traditional Affairs R 2 089 000 R 1 845 000 -R 244 000 R 286 000 R 286 000 R 0
Health R 80 343 000 R 70 001 000 -R 10 342 000 R 70 738 000 R 53 253 -R 70 684 747
Education R 1 037 034 000 R 1 022 657 000 -R 14 377 000 R 1 054 081 000 R 1 039 291 000 -R 14 790 000
Social Development R 364 329 000 R 362 848 000 -R 1 481 000 R 343 916 000 R 333 793 000 -R 10 123 000
Sports, Arts, Culture & Recreation R 29 278 000 R 29 249 000 -R 29 000 R 3 662 000 R 3 661 000 -R 1 000
Totals R 1 513 073 000 R 1 486 600 000 -R 26 473 000 R 1 472 924 000 R 1 377 325 253 -R 95 598 747
Western Cape 2013/14 2012/13
Departments Final Appropriation Actual Expenditure Difference Final Appropriation Actual Expenditure Difference
Agriculture R 38 977 000 R 38 977 000 R 0 R 1 387 000 R 1 387 000 R 0
Community Safety R 2 467 000 R 2 467 000 R 0 R 0
Cultural Affairs & Sport R 53 134 000 R 53 134 000 R 0 R 34 497 000 R 34 497 000 R 0
Economic Development R 85 588 000 R 85 588 000 R 0 R 73 260 000 R 72 280 000 -R 980 000
Education R 1 604 325 R 1 604 325 R 0 R 1 605 054 R 1 603 326 -R 1 728
Environmental Affairs & Development Planning R 500 000 R 500 000 R 0 R 500 000 R 500 000 R 0
Health R 416 570 000 R 408 767 000 -R 7 803 000 R 362 427 000 R 348 080 000 -R 14 347 000
Public Works & Transport R 1 000 000 R 1 000 000 R 0 R 500 000 R 500 000 R 0
Social Development R 869 677 000 R 869 594 000 -R 83 000 R 765 751 000 R 764 378 000 -R 1 373 000
Local Government R 926 000 R 926 000
Office of the Premier R 12 907 000 R 12 907 000 R 127 110 000 R 127 110 000
Totals R 1 482 424 325 R 1 474 538 325 -R 7 886 000 R 1 367 963 054 R 1 351 261 326 -R 16 701 728
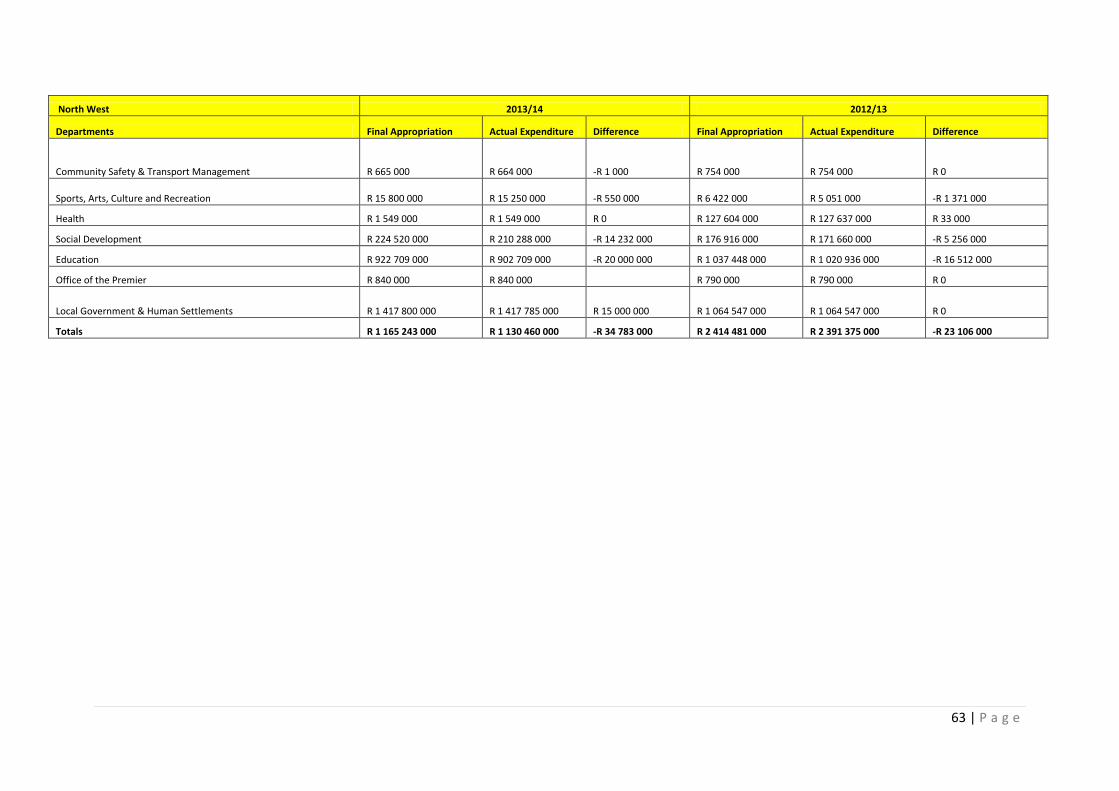
63 | P a g e
North West 2013/14 2012/13
Departments Final Appropriation Actual Expenditure Difference Final Appropriation Actual Expenditure Difference
Community Safety & Transport Management R 665 000 R 664 000 -R 1 000 R 754 000 R 754 000 R 0
Sports, Arts, Culture and Recreation R 15 800 000 R 15 250 000 -R 550 000 R 6 422 000 R 5 051 000 -R 1 371 000
Health R 1 549 000 R 1 549 000 R 0 R 127 604 000 R 127 637 000 R 33 000
Social Development R 224 520 000 R 210 288 000 -R 14 232 000 R 176 916 000 R 171 660 000 -R 5 256 000
Education R 922 709 000 R 902 709 000 -R 20 000 000 R 1 037 448 000 R 1 020 936 000 -R 16 512 000
Office of the Premier R 840 000 R 840 000 R 790 000 R 790 000 R 0
Local Government & Human Settlements R 1 417 800 000 R 1 417 785 000 R 15 000 000 R 1 064 547 000 R 1 064 547 000 R 0
Totals R 1 165 243 000 R 1 130 460 000 -R 34 783 000 R 2 414 481 000 R 2 391 375 000 -R 23 106 000

64 | P a g e

1
LIMPOPO Albatross Centre - Suite 8 19 Market Street Polokwane 0700 Tel: 015 291 2492 Reception Ext (2201) Fax: 015 295 7586 Email: [email protected]
KWAZULU NATAL Suite 1201 Nedbank Centre 303 Smith Street Durban Club Place DURBAN 4001 Tel: 031 305 5542 Fax: 031 305 5140 Email: [email protected]
GAUTENG 10th Floor, Braamfontein Centre 23 Jorissen Street Braamfontein Tel: 011 339 6410 Fax: 011 339 6410 Email: [email protected]
WESTERN CAPE The Chambers Building 2nd Floor 50 Keerom Street Cape Town 8001 Tel: 021 422 5175 Fax: 021 422 5180 EXT: 2002 Email: [email protected]
NORTH WEST Old Mutual Building 127 Providence Street Mmabatho 2735 PO Box 6118 Mmabatho 2735 Tel: 018 392 6892 Fax: 018 392 5432 Email: [email protected]
EASTERN CAPE Vincedon Office Park 08 Donald Road Vincent East London 5201 Tel: 043 721 1226/7 Fax: 043 721 2096 Email: [email protected]
FREE STATE Allied House 3
rd Floor
Cnr Charlotte Maxeke & Westburger Bloemfontein 9300 Postnet Suite 131 Private Bag X 01 Brandhof 9324 Tel: 051 430 2024 Fax: 051 430 3376 Email: [email protected]
MPUMALANGA Ground floor Biwater Building Office 103 16 Branders Street Nelspruit 1200 Tel: 013 755 1478 / 013 755 3777 Fax: 013 753 2244 Email: [email protected]
NORTHERN CAPE 13 Dalham Road Kimberley 8301 PO BOX 390 Kimberley 8300 Tel: 053 831 4828/9 053 831 4831 053 832 3365 Fax: 053 831 4824 Email: [email protected]
2
NATIONAL HEAD OFFICE
26 Wellington Road Parktown
Johannesburg 2193
P.O. Box 31959 Braamfontein
2017
Tel: (011) 018 5500 Web: www.nda.org.za
Email: [email protected]
Layout & Design: Nthabiseng Kraai Knowledge Management Unit