Embed Size (px)
Citation preview

South Africa’s freight transport involvement options in Sub-Saharan Africa:
Declining infrastructure and regulatory constraints
ANNEKE DE BOD
THESIS PRESENTED IN PARTIAL FULFILMENT OF THE
REQUIREMENT FOR THE DEGREE OF
MASTER OF LOGISTICS MANAGEMENT AT
STELLENBOSCH UNIVERSITY
December 2008

Declaration By submitting this thesis electronically, I declare that the entirety of the work contained therein is my own, original work, that I am the owner of the copyright thereof (unless to the extent explicitly otherwise stated) and that I have not previously in its entirety or in part submitted it for obtaining any qualification. Date: 18 December 2008
Copyright © 2008 Stellenbosch University
All rights reserved

ABSTRACT
Although global changes like political security, depletion of natural resources,
energy supply and global warming are affecting all continents; Africa struggle
the most to cope with these changes. This is due to the many historical
impediments that Africa still has to overcome. Examples of these impediments
are the negative effects caused by civil wars, poverty, poor infrastructure and
a lack of skills.
Providing reliable, effective and efficient infrastructure underpins all attempts
to facilitate trade, grow the economy and reduce poverty in Sub-Saharan
Africa (SSA). SSA transportation related infrastructure is limited and generally
in a poor condition. This poor state of transport infrastructure impedes SSA's
development. However, it is not only the state of the infrastructure that
challenges Africa - complicated customs and administrative procedures and
inefficiencies when goods are handled at terminals and transferred from one
transport mode to another also impede its potential for economic growth.
In spite of these limitations, the SSA economy has been growing. As many as
28 countries (out of 48) in SSA recorded improvements in growth in 2006 and
2007. This growth was underpinned by improvement in macro-economic
management in many countries, and a strong global demand for key African
export commodities (sustaining high export prices, especially for crude oil,
metals and minerals). Greater flows of capital to Africa, debt relief and
increasing trade with the developing Asia have also helped increase resources
and lift growth across SSA. The strong economic growth in the region also
reflects the institutional improvements, structural reforms, and more rigorous
economic policies that have started to bear fruit in many countries.
Many countries in SSA with export potential are landlocked. Transport
corridors through other countries to the sea are vital for these countries. Yet

cross-border corridor transport in most of SSA is costly, slow, and unreliable.
Some of the transport problems are caused by political conflicts and security
risks and others by the weaknesses of transport systems. These problems
undermine the fact that the limited infrastructure has the potential to carry
more volumes. Most of the infrastructure is poorly maintained and operate
below design capacity.
Investing in the rehabilitation (and in some cases the upgrade) and
establishment of infrastructure will help SSA freight traffic flows. However,
unless reinforced with appropriate reforms of policies and institutions,
investments in infrastructure may not facilitate trade (and hence economic
growth). Institutional development goals are important to create an appropriate
context for development.
The proportionality of regulations negatively impacts economic freedom in
SSA. It is argued that economic reforms translate into legislation that can be
attractive or repellent for both domestic and foreign direct investment.
Although policy and regulatory reforms are occurring in most SSA countries,
these are slow to act against the high level of systemic inefficiency.
A key finding of this research paper is that freight transport infrastructure
development in SSA and in Africa is complex and fragmented. The public and
private sectors are required to address the many barriers to the movement of
freight in a comprehensive and collaborative manner. This process will enable
domestic and foreign investors to take full advantage of opportunities to
increase trade flow and create jobs on a broad base, which is essential for
continued poverty reduction.
South Africa is in a good position to contribute to the freight transport
infrastructure solution in SSA but need to carefully consider the regulatory and
policy framework of the SSA infrastructure before any initiatives are
formalised.
-5-
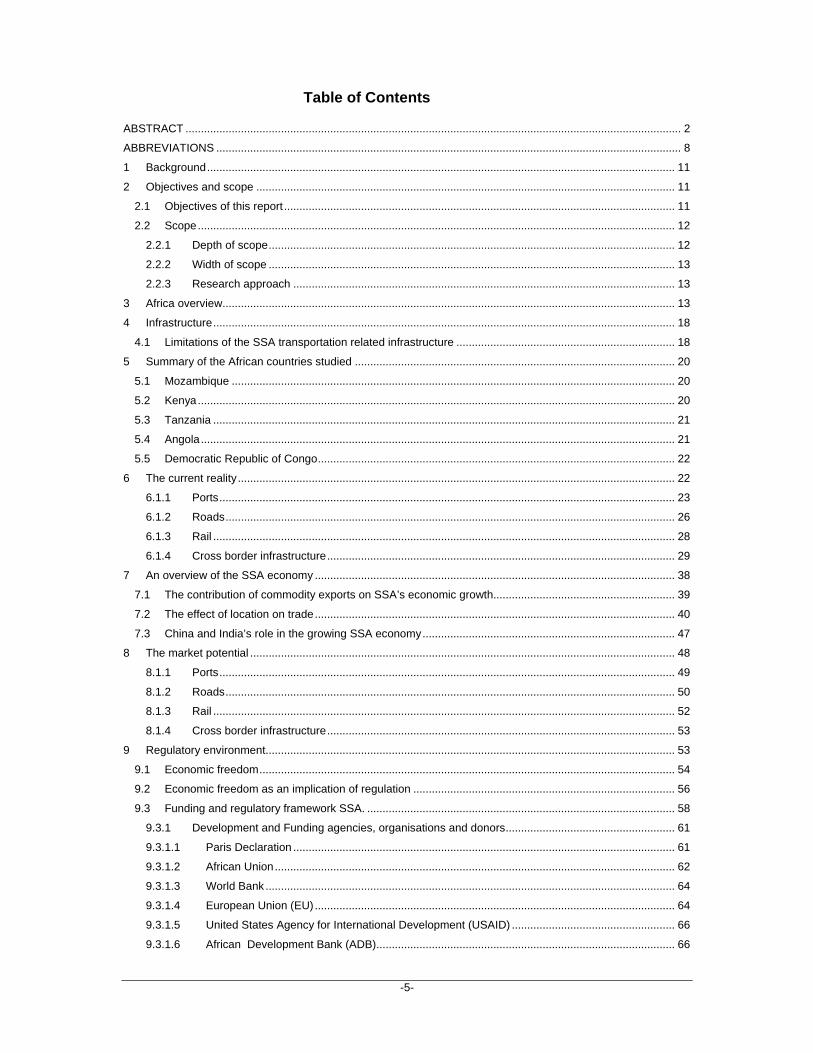
Table of Contents
ABSTRACT ................................................................................................................................................................. 2
ABBREVIATIONS ....................................................................................................................................................... 8
1 Background ........................................................................................................................................................ 11
2 Objectives and scope ........................................................................................................................................ 11
2.1 Objectives of this report ............................................................................................................................... 11
2.2 Scope ........................................................................................................................................................... 12
2.2.1 Depth of scope .................................................................................................................................... 12
2.2.2 Width of scope .................................................................................................................................... 13
2.2.3 Research approach ............................................................................................................................ 13
3 Africa overview ................................................................................................................................................... 13
4 Infrastructure ...................................................................................................................................................... 18
4.1 Limitations of the SSA transportation related infrastructure ....................................................................... 18
5 Summary of the African countries studied ........................................................................................................ 20
5.1 Mozambique ................................................................................................................................................ 20
5.2 Kenya ........................................................................................................................................................... 20
5.3 Tanzania ...................................................................................................................................................... 21
5.4 Angola .......................................................................................................................................................... 21
5.5 Democratic Republic of Congo .................................................................................................................... 22
6 The current reality .............................................................................................................................................. 22
6.1.1 Ports .................................................................................................................................................... 23
6.1.2 Roads .................................................................................................................................................. 26
6.1.3 Rail ...................................................................................................................................................... 28
6.1.4 Cross border infrastructure ................................................................................................................. 29
7 An overview of the SSA economy ..................................................................................................................... 38
7.1 The contribution of commodity exports on SSA’s economic growth........................................................... 39
7.2 The effect of location on trade ..................................................................................................................... 40
7.3 China and India’s role in the growing SSA economy .................................................................................. 47
8 The market potential .......................................................................................................................................... 48
8.1.1 Ports .................................................................................................................................................... 49
8.1.2 Roads .................................................................................................................................................. 50
8.1.3 Rail ...................................................................................................................................................... 52
8.1.4 Cross border infrastructure ................................................................................................................. 53
9 Regulatory environment..................................................................................................................................... 53
9.1 Economic freedom ....................................................................................................................................... 54
9.2 Economic freedom as an implication of regulation ..................................................................................... 56
9.3 Funding and regulatory framework SSA. .................................................................................................... 58
9.3.1 Development and Funding agencies, organisations and donors ....................................................... 61
9.3.1.1 Paris Declaration ............................................................................................................................ 61
9.3.1.2 African Union .................................................................................................................................. 62
9.3.1.3 World Bank ..................................................................................................................................... 64
9.3.1.4 European Union (EU) ..................................................................................................................... 64
9.3.1.5 United States Agency for International Development (USAID) ..................................................... 66
9.3.1.6 African Development Bank (ADB) ................................................................................................. 66

-6-
9.3.1.7 Summary: Development and Funding agencies, organisations and donors ................................ 67
9.3.2 Initiatives ............................................................................................................................................. 69
9.3.2.1 NEPAD ........................................................................................................................................... 69
9.3.2.2 Sub Saharan Transport Policy Program (SSATP) ......................................................................... 71
9.3.2.3 Infrastructure Consortium for Africa (ICA) ..................................................................................... 72
9.3.2.4 World Bank - African Action Plan (AAP) ........................................................................................ 73
9.3.2.5 OECD-DAC (Organisation for Economic Co-operation and Development – Development
Assistance Committee) ...................................................................................................................................... 75
9.3.3 Regional Economic Communities (REC) ........................................................................................... 76
9.3.3.1 Southern African Development Community (SADC) ..................................................................... 77
9.3.3.2 Common Market for Eastern and Southern Africa (COMESA) ..................................................... 83
9.3.3.3 East African Community (EAC) ...................................................................................................... 85
9.3.4 Beginning of REC cooperation and integration .................................................................................. 86
9.3.4.1 COMESA-EAC-SADC task force ................................................................................................... 87
9.3.5 Private and Publc Participation (PPP) ............................................................................................... 88
9.3.6 Summary of the funding and regulatory framework within SSA ........................................................ 90
10 Concessions ................................................................................................................................................ 97
11 Role of SA Government ............................................................................................................................... 99
12 Ideal solution design .................................................................................................................................. 104
12.1 The role of the South African Freight Transport Industry in the solution design .................................. 105
12.2 Opportunities for viable investments in SSA for companies in the South African Freight Transport
Industry 106
13 Case study: Transnet involvement options in SSA ................................................................................... 107
13.1 Matching of potential opportunities in SSA and Transnet’s core competencies .................................. 111
13.1.1 Transnet’s core competencies.......................................................................................................... 111
13.1.2 Transnet’s strengths meeting the SSA opportunities ....................................................................... 112
13.2 Transnet’s participation ......................................................................................................................... 113
13.2.1 Nacala Port ....................................................................................................................................... 115
13.2.2 Lobito Port ......................................................................................................................................... 115
13.3 Activities at the Namibia Ports .............................................................................................................. 116
14 Conclusion ................................................................................................................................................. 118
15 References ................................................................................................................................................. 127
Addendum A ............................................................................................................................................................ 135
LIST OF FIGURES
Figure 1: The gap between selected MDGs and progress ...................................................................................... 14
Figure 2: Macro-economic model ............................................................................................................................ 15
Figure 3: SDIs and corridors in SSA ......................................................................................................................... 30
Figure 4: Annual change in real GDP per capita ...................................................................................................... 39
Figure 5: Transport and insurance costs as a percentage of trade value ............................................................... 41
Figure 6: Mineral map of the world ........................................................................................................................... 42
Figure 7: Current and potential road density ............................................................................................................ 51

-7-
Figure 8: Current and potential density vs. road transport Quality Index ................................................................. 51
Figure 9: Current and potential rail volumes............................................................................................................ 53
Figure 10: Economic freedom – World average vs. regions, 1995 to 2008 ............................................................. 56
Figure 11: Ten Economic Freedoms in SSA ........................................................................................................... 57
Source: 2008 Index of Economic Freedom Figure 12: Distribution of Economic Freedoms in SSA....................... 58
Figure 13: Outline of the major SSA funding and development framework ............................................................ 59
Figure 14: Country membership for different RECs ................................................................................................. 76
Figure 15: Transport Infrastructure in the Eastern and Southern region as identified by the Task Force. ............. 88
Figure 16: Harris’ density curve .............................................................................................................................. 100
Figure 17: Harris’ density curve applied to South Africa and a combination of other railways in the report ......... 101
Figure 18: Harris’ density curve with GFB separately indicated ............................................................................ 101
Figure 19: Harris’ density curve for countries in report only ................................................................................... 102
Figure 20: Southern Africa railway network ............................................................................................................ 110
Figure 21: Railway network of Southern Africa ...................................................................................................... 114
LIST OF TABLES
Table 1: Positional movements for SSA countries compared to overall competitiveness for 128 countries ........ 16
Table 2: Global Competitiveness index 2007: Africa ................................................................................................ 17
Table 3: Summary of issues at major SSA ports ...................................................................................................... 23
Table 4: SSA road network summary ....................................................................................................................... 27
Table 5: SSA rail network summary ......................................................................................................................... 29
Table 6: Summary of major corridors in SSA ........................................................................................................... 31
Table 7: Information on SSA major waterway .......................................................................................................... 36
Table 8: World primary commodity prices (percentage change) ............................................................................. 40
Table 9: Commodity export information .................................................................................................................... 43
Table 10: Commodity import information .................................................................................................................. 45
Table 11: India’s trade with Africa ............................................................................................................................. 48
Table 12: Capacity and utilisation of major ports in SSA (excluding South African ports) ..................................... 49
Table 13: Estimated road volumes per country ........................................................................................................ 50
Table 14: Estimated rail volumes per country per country ....................................................................................... 52
Table 15: Different role players in SSA and their objectives .................................................................................... 96
Table 16: Transnet strengths vs. SSA opportunities .............................................................................................. 113

-8-
ABBREVIATIONS
AAP African Action Plan
ACP Cotonou Agreement between the European Union and African,
Caribbean and Pacific States
ADB African Development Bank
AGOA African Growth and Opportunity Act
ATIA African Trade Insurance Agency
AU African Union
BOT Build, operate, and transfer project
CAS Country Assistance Strategy
COMESA Common Market for Eastern and Southern Africa
DAC Development Assistance Committee
DBFO Design, build, finance, and operate project
DoT Department of Transport
DRC Democratic Republic of Congo
EIB European Investment Bank
DSI Data Sharing Institutions
EAC East African Community
EC European Commission
EARC East African Railways Corporation
ECA Economic Commission for Africa
EEZ Exclusive Economic Zone
EPZ Export Processing Zone
EIB European Investment Bank
ERS Economic Recovery Strategy for Wealth and Employment
Creation 2003-2007
EU European Union
-9-
GDP Gross Domestic Product
GSP Generalised System of Preferences
HIV/AIDS Human Immunodeficiency Virus/Acquired Immune Deficiency
Syndrome
IBRD International Bank for Reconstruction and Development
ICT Information Communications and Technology
ICSID International Centre for Settlement of Investment Disputes
IFI International financial institution
IR Indian Railways
IDA International Development Association
IDF Institutional Development Fund
IFAD International Fund for Agriculture Development
IFC International Finance Corporation
IMF International Monetary Fund
IP-ERS Investment Programme for the Economic Recovery Strategy
KPA Kenya Ports Authority
KRB Kenya Roads Board
KRC Kenya Railways Corporation
JNP Jawaharlal Nehru Port
KEPSA Kenya Private Sector Alliance
Km Kilometers
MDGs Millennium Development Goals
MIGA Multilateral Investment Guarantee Agency
MSA Moving South Africa
NFLS National Freight Logistics Strategy
NEPAD New Partnership for African Development

-10-
ODA Official Development Assistance
OECD Organization for Economic Co-operation and Development
OPIC Overseas Private Investment Corporation
PPI Public-private infrastructure
PPP Public-private partnership
PRSP Poverty Reduction Strategy Paper
REC Regional Economic Community
SADC Southern Africa Development Community
SDI Spatial Development Initiative
SIDA Swedish International Development Agency
SSA Sub-Saharan Africa
SSATP Sub-Saharan Africa Transport Policy Program
TATF Technical Assistance Trust Funds (IFC)
TAZARA Tanzania-Zambia Railway Authority
UN United Nations
UNDP United Nations Development Programme
UNCLOS United Nations Convention on the Law of the Sea
UNCTAD United Nations Conference on Trade and Development
UNDP United Nations Development Programme
UNECA United Nations Economic Commission for Africa
USAID United States Agency for International Development
VAT Value Added Tax
WBI World Bank Institute
WDR World Development Report
WSP Water and Sanitation Program
WTO World Trade Organisation

-11-
1 Background
Many South African Transport and Logistic companies view Africa as a
potential growth market and are embarking on a process to unlock the growth
potential within the region. Cross-border and international business initiatives
are a risky and difficult step for any company, even more so when entering the
most complex, fragmented and undeveloped region in the world.
Infrastructure in Sub-Saharan Africa is not only underdeveloped but is also
destroyed through political unrests, backlogs in maintenance and inefficiencies
in operations (African Union, 2005, p1). The regulatory environment and
policies in Africa are often hamstrung by bribery, corruption, fragmentation and
poor skills.
Any company intending to do business in Africa has to take applicable
regulation and / or deregulation in the transport industry, industry
developments, as well as the state of logistics infrastructure in Africa into
consideration. It is against this background that South African companies
need to thoroughly understand the policy and regulatory environment for
freight transport in the continent and existing bilateral and multilateral
initiatives in this arena, before embarking on the development of its Africa
strategy.
This research project could be input for initiatives for South African companies’
considereing entering ventures in Sub-Saharan Africa. This report sets out the
consolidated findings of policies and regulations on the African continent.
2 Objectives and scope
2.1 Objectives of this report
The objective of this report is to provide insight into the Sub-Saharan Africa
(SSA) regulatory environment in the context of freight transport infrastructure.
The report aims to elucidate the following:
� The current freight infrastructure situation

-12-
� Market potential
� The regulatory environment
� Possible opportunities
� A proposed strategy to exploit the opportunities.
The report benefited from in-depth reviews and suggestions provided by
experts from various research institutions on the continent, as well as from
independent subject matter experts.
2.2 Scope
The scope of this document focuses on the regulations and policies affecting
the transport sector in Sub-Saharan Africa. Also included in the scope are all
aspects of transport infrastructure (both land and water); and key stakeholders
and their roles.
The scope is confined to road, rail and port freight logistics solutions. Air
freight does not form part of this study.
2.2.1 Depth of scope
This report focuses on the transport regulatory environment, key stakeholders
in the transport sector and the physical transport infrastructure.
� The regulatory environment addresses the different role players active
in funding and development of Sub-Saharan Africa in general, but
more specifically in terms of infrastructure development in the region.
The goals and actions of these organisations are highlighted - as well
as inter – organisational alignment
� Key stakeholders include Governments (local and foreign),
development organisations, regional economic communities,
parastatals, private companies and; international donors and
agencies
� The focus for the physical infrastructure is limited to land (rail, road
and terminals) and water (ports and inland waterways). This includes
a review of the current situation and the market potential.

-13-
2.2.2 Width of scope
The main focus of the report is on Democratic Republic of Congo, Kenya,
Tanzania, Mozambique and Angola. Development corridors affecting these
countries are also considered.
The focus on these specific countries is based on their overland connection to
the SSA freight logistics network, contribution to trans-frontier corridor
developments, and ability to influence growth and policy making in SSA.
The regulatory environment and infrastructure of landlocked countries with
major links to the freight logistics network in SSA (Botswana, Namibia,
Zambia, Zimbabwe and Malawi) is also discussed. A short review of Uganda
is also included due to its infrastructure links with Kenya and Tanzania. West,
North African and North Eastern African countries and Indian Ocean islands
(Madagascar, Seychelles, Mauritius and Comoros) are not included in the
scope of this report.
2.2.3 Research approach
The research approach in this report is qualitative as well as quantitative. A
framework for the assesment of infrastructure and the regulatory environment
is developed and applied for each of the countries in Sub-Saharan Africa,
defined as the scope width. Once the assesment is done infrastructure
opportunities in especially overland transport, defined as the biggest obstacle
in this regard, are modelled in terms of density and potential density. The
results of the model and qualitative survey are then presented to a panel of
experts in a focus group to generate a possible case study for South Africa’s
largest commercialised freight transport infrastructure owner, i.e. Transnet.
3 Africa overview
Currently overwhelming changes like political security, depletion of natural
resources, energy supply and global warming are increasingly occurring in the
world. While the industrialised and emerging economies are able to contain
the multiple external and internal shocks generated by these changes to some

-14-
extent, Africa struggles the most to cope. These impacts keep Africa in a
poverty stricken situation.
During the last two decades the number of the poor in Africa has doubled from
150 million to 300 million, more than forty percent of the region’s population.
About one third of the region’s population lives in countries affected by - or
emerging from - conflict. Moreover, HIV/AIDS continues to threaten African
lives and livelihoods. Africa is the only region that remains behind on most of
the Millennium Development Goals (MDG) as set by donors and partner
countries. On current trends Africa will fall far short of meeting the 2015 MDG
targets as depicted in Figure 1 (World Bank, African Region, September 2005)
-10.0%
-8.0%
-6.0%
-4.0%
-2.0%
0.0%
2.0%
Povertyheadcount($PPP/day)
% of childrenwithout primary
education Child mortality
People withoutaccess to
piped water
People withoutaccess toimprovedsanitation
Annual r
ate
of c
hange
Change needed Actual change needed
Source: World Bank, September 2005
Figure 1: The gap between selected MDGs and progress
For decades, African countries were spending billions of US dollars each year
repaying debts to donor countries and international financial institutions.
These large debts became a serious impediment to poverty reduction and
economic development. Countries began taking on new loans to repay old
ones. Some countries spent more each year to service debt payments than on
health and education combined.
-15-
Faced with the challenges of globalisation and ever-deepening poverty,
African Governments have decided to (World Bank, African Region,
September 2005):
� Do their utmost to secure peace and stability on the continent
� Strengthen capacities for governance and the rule of law
� Fight corruption
� Accelerate economic and political integration
� Make the required investments
� Pursue sustained growth and speedy development of the African
common market.
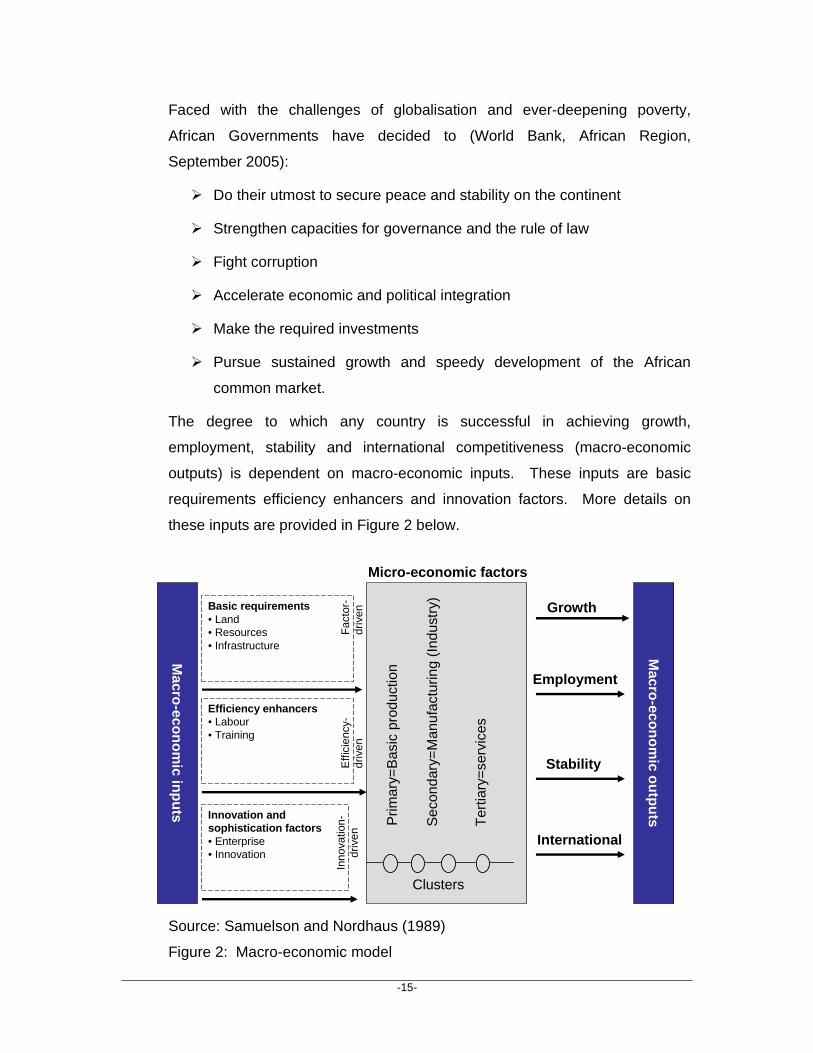
The degree to which any country is successful in achieving growth,
employment, stability and international competitiveness (macro-economic
outputs) is dependent on macro-economic inputs. These inputs are basic
requirements efficiency enhancers and innovation factors. More details on
these inputs are provided in Figure 2 below.
Source: Samuelson and Nordhaus (1989)
Figure 2: Macro-economic model
Macro-econom
ic inputs
Macro-econom
ic outputs
Micro-economic factors
Basic requirements• Land• Resources• Infrastructure
Innovation and sophistication factors• Enterprise• Innovation
Efficiency enhancers• Labour• Training
Fac
tor-
driv
enE
ffici
ency
-dr
iven
Inno
vatio
n-dr
iven
Clusters
Prim
ary=
Bas
ic p
rodu
ctio
n
Sec
onda
ry=
Man
ufac
turin
g (I
ndus
try)
Ter
tiary
=se
rvic
es
Growth
Employment
International
Stability

-16-
Although Africa has land, resources are undeveloped, labour is untrained, and
enterprise management and Government are in disarray. The sub-continent’s
score as measured in the World Competitiveness Report has dropped, as
shown in Table 1. (World Competitiveness Report, World Economic Forum,
2007)
Table 1: Positional movements for SSA countries compared to overall
competitiveness for 128 countries
Country
(Ranking)
Position in
2005
Position in 2007 Movement
Angola Not measured 128 -
Botswana 72 83 -11
Kenya 93 97 -4
Mozambique 112 124 -12
Namibia 79 88 -9
South Africa 40 46 -6
Tanzania 105 108 -3
Uganda 103 116 -13
Zambia Not measured 117 -
Zimbabwe 110 121 -11
Source: World Competitiveness Report, World Economic Forum, 2007
The scores for the macro-economic inputs are depicted in Table 2 below.

-17-
Table 2: Global Competitiveness index 2007: Africa
Country
(Ranking)
Overall
ranking
Basic
requirements
Efficiency
enhancers
Innovation
factors
Angola 128* 128* 126* 126*
Botswana 83 82 80 98
Kenya 97 109 83 59
Mozambique 124* 122* 124* 118
Namibia 88 72 93 88
South Africa 46 57 45 29
Tanzania 108 115 96 77
Uganda 116 121* 100 83
Zambia 117 116 109 127*
Zimbabwe 121* 125* 108 94
* In the lowest 10 percent in the world
Source: World Competitiveness Report, World Economic Forum, 2007
Poor performance in macro-economic inputs leads to access problems for the
primary economies, low beneficiation in manufacturing and an under
developed services sector. Except for South Africa, Botswana and Namibia
more or less all inputs for all SSA countries ranks in the lowest quartile in the
world.
The commitment from the Governments to reverse Africa’s current
marginalisation in the world economy and to enable their countries to harness
and efficiently exploit their resources also means that efforts must be pooled
together in order to attain the agreed objectives. Although this is the intent,
this has been a significant failure so far.
Previously, most SSA countries’ economies were not growing previously due
to commodity price swings and other shocks (wars and natural disasters), as
well as institutional weakness. Although African countries are currently
experiencing economic growth, it may not be sustainable over the longer term.
Factors that are likely to hinder growth from 2008 forward include a lack of

-18-
diversification of production and exports and subsequent instability and
vulnerability to shocks, and the increasing spread of the HIV/AIDS pandemic,
which undermines labour supply and labour productivity. In addition, inefficient
public infrastructure and unreliable energy supply at national levels as well as
poor integration of transportation and energy networks at regional levels will
continue to undermine productivity and international competitiveness.
Moreover, increasing oil prices are a major concern for African countries,
which need to continue to control inflation, promote fiscal stability, improve
current account positions, and increase growth (UNECA, 2007).
4 Infrastructure
Many of the SSA’s countries have a history of major ineffective infrastructure
development which is caused by socio-economic problems.
SSA reflects the colonial legacy, which resulted in the construction of roads
and railways from the interior to the coast, for the extraction and export of raw
materials. Not only does this infrastructure remain in the wrong place today, it
was designed to service industries where countries now face declining terms
of trade. But more than the colonial legacy is to blame for the continent’s
inadequate transport infrastructure. Investment in transport infrastructure since
independence has been inadequate. Civil unrests and political differences
between countries (and in many countries) resulted in the destruction or
closure of much transport infrastructure that fulfilled a vital role in linking rural
areas with cities and ports. Conflict is a major obstacle to development in SSA
(UN Policy brief, 2007).
Crime is another contributor to ineffective infrastructure development. Poverty
has driven people to steal items such as railway sleepers and road boards to
help with their survival.
4.1 Limitations of the SSA transportation related i nfrastructure
SSA has a generally inadequate road and rail network, its transport services
operate at a low level of efficiency, many routes are subject to official and
unofficial roadblocks, and there are slow and cumbersome border-crossing

-19-
procedures. Transport costs have been recorded as the highest in the world,
and many of the factors are attributable to unnecessary delays and corruption
(Economic Commission for Africa, 2004)
The road network is not only poorly developed but also badly maintained. Very
little of the network has been updated to accommodate larger vehicles, which
can cause major damage on unsuitable surfaces. Inefficiency is equally
manifested in the lack of vehicle maintenance, shoddy routine maintenance
and poor operating practices.
An Organisation for Economic Co-operation and Development (OECD) report
has revealed that SSA lacks transport infrastructure which is crucial to poverty
reduction. Despite its importance transport has been low on the
developmental agenda of SSA countries. The World Bank estimates that
African countries will need to spend the equivalent of 4 percent of gross
domestic product (GDP) every year for the coming decade just on roads.
The quality of the infrastructure has certainly impeded SSA’s ability to
compete in the global market. The share of SSA in global trade was 3.1
percent in 2007 compared to Asia’s 26 percent (World Bank report, 2007).
International corridor transport in most of SSA countries is costly, slow, and
unreliable. Some of the problems are caused by political conflicts and security
risks and others by the weaknesses of transport systems. Another major
problem in Africa is the poor quality of the national transportation networks
that must be transversed in the movement of exports (often raw materials) to
ports. The overall trading situation of Africa is unlikely to improve with many
other parts of the world moving towards large integrated trading blocks (e.g.
the European Union, the North American Free Trade Area and Mercosur).
Africa's move towards an Africa Union is taking place at a slow pace but
reflects a response to this situation (Button, 2002).
The remainder of the report focuses on Sub-Saharan Africa (SSA) – and in
particular a number of countries in this region.

-20-
5 Summary of the African countries studied
A brief summary of the countries studied is provided below.
5.1 Mozambique
Despite regional conflict, devastating floods, and fluctuating world prices for
key commodities, Mozambique has registered remarkable achievements over
the past decade in growth, stabilisation, and reform. Irrespective of the
achievements, Mozambique remains one of the poorest countries in the world;
with more than half of its population living in extreme poverty.
Mozambique has more than 18 international donors participating in its
development, but funding alone will not improve the climate for doing business
in Mozambique. There are other constraints other than funding that deter
growth. Addressing these constraints implies a broad but essential agenda
that can only be accomplished with full endorsement at high political levels, as
well as effective inter-Governmental coordination, public–private partnership,
and targeted donor-funded technical assistance.
Mozambique’s key challenges are:
� In the business-enabling environment, to stimulate domestic and
foreign investment in labour-intensive sectors of the economy,
� In the transportation infrastructure and in border clearance procedures,
to reduce the high transaction costs that currently render Mozambican
products uncompetitive in global markets,
� In Mozambique’s trade and investment policies, trade institutions,
technical and analytic skill levels, and policy coordination processes, to
address impediments to exports in a coordinated and comprehensive
fashion.
5.2 Kenya
Kenya is one of the leading economies in Eastern and Southern Africa.
Kenya’s strategic geographic location along the Indian Ocean, with the
commercial Port at Mombassa is a key transit point for internationally traded
goods. With a growing demand for Kenya's export products, Kenya also gives

-21-
investors access to the East African Community (EAC) and Common Market
for Eastern and Southern Africa (COMESA) markets. Kenya is also a member
of the African, Caribbean and Pacific States (ACP), which gives it preferential
access to the EU market, among others.
The great strengths and advantages of Kenya as a location for investment are
offset by serious difficulties. The main concern is the state of the country’s
infrastructure. Limited investment in transport infrastructure and the current
political instability is a big concern.
5.3 Tanzania
Tanzania, in an effort to improve its economic performance, is pursuing
economic integration through several bilateral and regional trade protocols
and through its membership of SADC and EAC. Further more, the long term
development goal of Tanzania is to raise the standard of living and or quality
of life of its people through the enhancement of both the productive and non-
productive sectors of the economy. The Government of Tanzania realises that
in order to reduce poverty and ensure sustainable economic growth and
development, the transport sector has to play a critical and crucial role.
The conflict in Kenya is creating a major opportunity for Tanzania – specifically
to enhance and direct transport through the port of Dar-es-Salaam. Dar-es-
Salaam Port handles more than three quarters of Tanzania’s trade, averaging
about 40 million tonnes a year, and is the largest industrial centre and
business capital in Tanzania. It has rail and road links to Burundi, Rwanda,
Zambia, Malawi, Zimbabwe and parts of the DRC. It also serves as a major
logistics gateway to these countries due to their landlocked nature.
5.4 Angola
Now that peace has been achieved in Angola, and a fully functioning
Parliament is operating, Angola has a radiant future ahead, for the economy
and for the country. Angola has a fast-growing economy but most of the
country's infrastructure is still damaged or undeveloped from the 22 year-long
civil war. Remnants of the conflict such as widespread presence of land

-22-
mines are still present in the countryside. This has a direct influence on the
rate and speed of development and rehabilitation of the infrastructure in the
country.
5.5 Democratic Republic of Congo
The DRC offers many opportunities for foreign investors as the country is
conveniently and centrally located in the continent. It has immense and
countless natural resources. The DRC confirmed in July 2006 with the Poverty
Reduction Strategy Paper (PRSP) its willingness to invest in transport
infrastructures rehabilitation to sustain growth while at the same time
protecting the environment. The Democratic Republic of Congo currently
faces a defining period in its history (after the peace agreement in 2003 and
the historic election in 2006). It has its best chance to escape a cycle of
conflict and suffering and to realise its full potential.
The collapse of the transport system in DRC is a result of the deterioration of
both physical infrastructure and the poor performance of technical institutions
in charge of its management and maintenance. None of the technical
institutions function at the levels required to adequately manage the transport
system, and in particular to ensure its maintenance. It has suffered a lack of
financial resources for ten consecutive years, which has resulted in outdated
technical knowledge and management tools, lack of equipment, and a drain of
qualified and experienced staff. Institutional strengthening is vital for the long
term sustainability of any newly rehabilitated infrastructure in DRC and for
associated activities such as environmental protection.
6 The current reality
Despite the efforts of SSA Governments to improve transport infrastructure,
problems remain: missing transport links, insufficient competition, high
transport costs, few harmonised rules and procedures, inadequate safety and
security at national and regional levels, little cross-border investment and
private sector participation, and failure to ratify and implement conventions
and regional policies adopted at sectoral meetings (UNECA - Governance and
Public Administration, Transport, 2007).

-23-
The African Economic Outlook notes that geography, demography and lack of
resources are all major impediments to transport development in Africa.
Fifteen of the continent’s 53 countries are landlocked and population densities
in the interior are very low, making infrastructure investments and
maintenance very expensive.
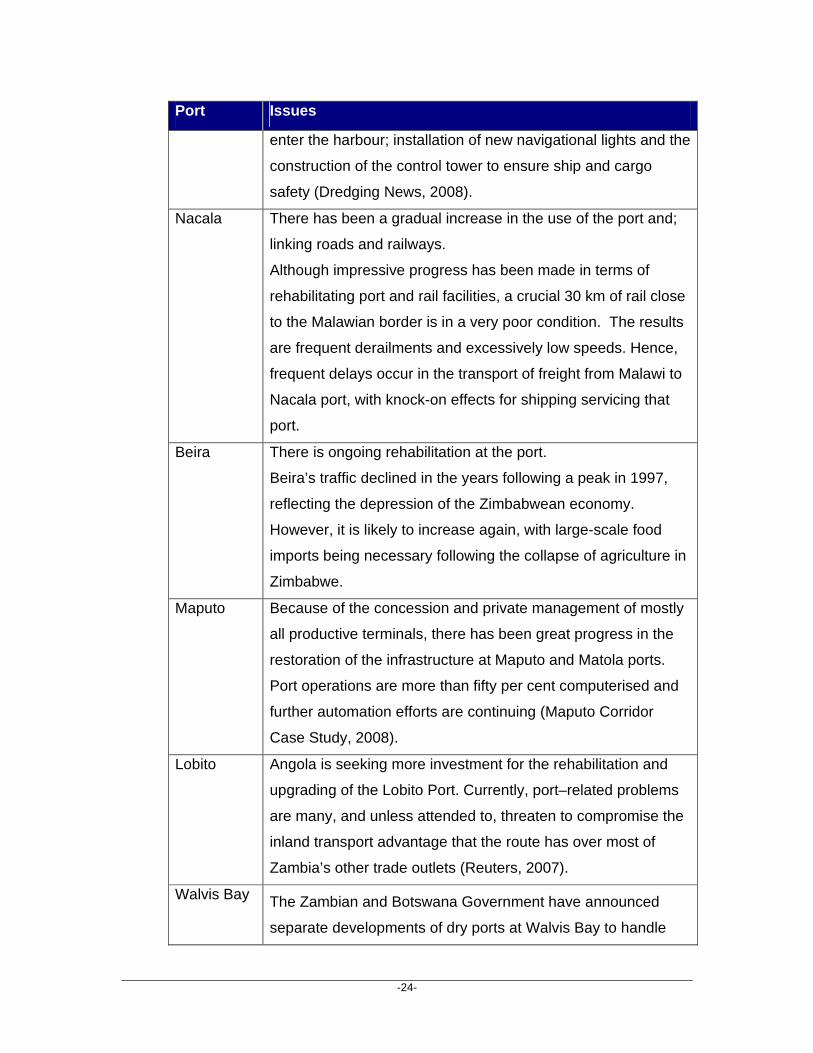
6.1.1 Ports
Excluding South African ports, SSA has nine major ports offering it access to
both the Indian and Atlantic routes. Information on these ports is provided
below.
Table 3: Summary of issues at major SSA ports
Port Issues
Mombasa Mombasa remains the best and most important deep-water
port in East Africa, despite deteriorating equipment / poor
infrastructure, problems with inefficiency and corruption,
congestion, corruption, archaic and time consuming
regulations.
Kenya is investing in a second container terminal (it is
anticipated the terminal can be up and running by 2008), Other
project activities include: dredging the port and privatising the
existing container terminal.
Dar-es-
Salaam
Local news media report that operations at the port of Dar-es-
Salaam have "not improved" despite a US$40.5 million
modernisation programme. Port congestion remains a problem.
Furthermore, according to the World Bank study, Port of Dar-
es-Salaam: Leasing the Container Terminal; the terminal is
under performing despite a World Bank-supported programme
to improve port operations. The World Bank led a US$2.8
million commercialisation of the container terminal and funded
the port’s modernisation programme.
Recent improvements at the port include dredging of the
harbour; expansion of the port mouth to allow larger ships to
-24-
Port Issues
enter the harbour; installation of new navigational lights and the
construction of the control tower to ensure ship and cargo
safety (Dredging News, 2008).
Nacala There has been a gradual increase in the use of the port and;
linking roads and railways.
Although impressive progress has been made in terms of
rehabilitating port and rail facilities, a crucial 30 km of rail close
to the Malawian border is in a very poor condition. The results
are frequent derailments and excessively low speeds. Hence,
frequent delays occur in the transport of freight from Malawi to
Nacala port, with knock-on effects for shipping servicing that
port.
Beira There is ongoing rehabilitation at the port.
Beira’s traffic declined in the years following a peak in 1997,
reflecting the depression of the Zimbabwean economy.
However, it is likely to increase again, with large-scale food
imports being necessary following the collapse of agriculture in
Zimbabwe.
Maputo Because of the concession and private management of mostly
all productive terminals, there has been great progress in the
restoration of the infrastructure at Maputo and Matola ports.
Port operations are more than fifty per cent computerised and
further automation efforts are continuing (Maputo Corridor
Case Study, 2008).
Lobito Angola is seeking more investment for the rehabilitation and
upgrading of the Lobito Port. Currently, port–related problems
are many, and unless attended to, threaten to compromise the
inland transport advantage that the route has over most of
Zambia’s other trade outlets (Reuters, 2007).
Walvis Bay The Zambian and Botswana Government have announced
separate developments of dry ports at Walvis Bay to handle

-25-
Port Issues
their freight on site.
Namport plans to invest $70m in increasing the handling
capacity of Walvis Bay on the back of a recent increase in
demand from mining companies. New cargo handling
equipment is required, new berths are to be developed and the
water depth of the harbour is to be increased to allow larger
vessels to dock at the port. (Africa Research Bulletin, 2007)
Namibia expects to borrow nearly $200 million from
international lenders to expand its Walvis Bay port and plans to
build a major railroad from the facility to boost trade with
neighbouring countries, officials have said. The Namibian Port
Authority (Namport) will spend $189 million to expand the port
to handle more imports mainly destined for Zambia and DRC
(Reuters, 2007).
Mtwara The port development was accompanied by railway
construction from Mtwara and Nachingwea. With the failure of
the groundnut scheme, the railway line fell into disuse and is
now non-operational . The port however, continues to function
but is under utilised. The present under utilisation of the port is
essentially due to low economic performance of the hinterland
of Mtwara coupled with poor access to that hinterland.
The Government of Tanzania has identified a number of
projects which would directly or indirectly increase the
throughput of Mtwara port. Included in the list are the following:
� The Ligaga Iron Ore Project
� The Mchuchuma Coal Project
� The Songosongo and Mnazi Bay Gas Projects
� The Agriculture, Livestock, Fisheries and Forestry
Projects
� The Mtwara-Mbamba Bay Road

-26-
Port Issues
� The railway lines linking Mtwara port to iron and coal
deposits of Liganga and Mchuma
� The Telecommunication Project.
Matadi The port is starting to take off, after losing up to 40 percent of
its berthing capacity. Some of the new initiatives that are
geared towards the development of traffic are:
� Restoration works of four quays to address congestion
problems
� Creation of a supplementary access road for trucks to
the port of Matadi ( DRC Government seeking funds for
this).
Source:Compiled by Author
6.1.2 Roads
Road transport is the primary mode of transport in Africa. The state,
management and functioning of road infrastructure is therefore critical to the
success of Africa’s regional integration efforts.
Most road reforms in SSA have been pressured by declining Government
budgets and deteriorating road conditions. These reforms have largely been
encouraged by the World Bank’s Road Maintenance Initiative (RMI) whose
main aim is to create autonomous road agencies and dedicated road funds as
a means of improving overall road management. Some progress has been
made in this respect as well as in involving the private sector in the
management of the road sector. At the institutional level, Roads Boards have
been established in a number of countries, with visible private sector
participation. A number of countries are in the process of replacing their
national roads authorities with fully autonomous “Road Agencies”
(Simuyemba, 2007).
Information on the road networks for selected countries in SSA is depicted in
Table 4 below.

-27-
Table 4: SSA road network summary
Country Road network
(km)
Roads in good or
fair condition
(percent)
2000–05*
Ratio of paved to
total roads
(percent)
2000–05*
Angola 51,429
Information not
available 10.4
Botswana 24,455
Information not
available 36.5
DRC 153,497 23.2 1.8
Kenya 63,265 67.2 14.1
Lesotho Information not
available 71.5
Information not
available
Malawi 15,451
Information not
available 45
Mozambique Information not
available 63.5
Information not
available
Namibia 42,237
Information not
available 12.8
South Africa 364,131
Information not
available 17.3
Swaziland 3,594
Information not
available
Information not
available
Tanzania 78,891 55 8.6

-28-
Country Road network
(km)
Roads in good or
fair condition
(percent)
2000–05*
Ratio of paved to
total roads
(percent)
2000–05*
Uganda 70,746 58.6 23
Zambia 91,440
Information not
available 22
Zimbabwe 97,267
Information not
available 19
Source: Africa Development Indicators 2007
* Data are for most recent year available during the period specified.
6.1.3 Rail
Most railways in Africa have been progressively losing traffic to roads over the
past two decades. From a dominant mode of transport in the seventies,
railway transport performance started to decline in the eighties and this trend
has continued into the twenty first century.
By the late nineties, railway efficiency had dropped, profitability deteriorated,
service standards declined and customers shifted from rail to road. Today,
most railways are seeking to bring back efficient service and profitability
through a combination of restructuring, commercialisation and concessioning.
Because the condition and performance of most rail systems have significantly
deteriorated, it will take a while before the results of these reforms begin to
come to fruition (Simuyemba, 2007).
Information on the rail networks for selected countries in SSA is depicted
below.

-29-
Table 5: SSA rail network summary
Country Rail network
(km)
Average cost to ship 20 ft
container from port to final
destination ($)**
Import 2006 Export 2006
Angola 2,761 2,325 1,850
Botswana 888 2,595 2,328
DRC 3,641 3,308 3,120
Kenya 1,917 2,325 1,980
Lesotho
Information not
available 1,210 1,188
Malawi 710 2,500 1,623
Mozambique 3,070 1,185 1,155
Namibia
Information not
available 1,550 1,539
South Africa 20,047 1,195 1,087
Swaziland 301
Information not
available
Information not
available
Tanzania 2,600 917 822
Uganda 259 2,945 1,050
Zambia 1,273 2,840 2,098
Zimbabwe
Information not
available 2,420 1,879
Source:Compiled by Author
** This includes both road and rail transport
6.1.4 Cross border infrastructure
Certain infrastructure items are not isolated to one country. Cross border
infrastructure refers to infrastructure items that involve more than one country
and includes development corridors and lakes. Details on these are provided
below.

-30-
6.1.4.1 Transport / Development corridors
The general principle of development corridors is to view the major transport
routes from the maritime ports to the hinterlands that they serve, not merely as
transport, but economic corridors with activities related to agriculture, industry,
commerce, communications tourism and other industries. Thus, corridors
serve as growth points, not just for large industries, but also for emerging
small scale industries.
Source: COMESA-EAC-SADC Task Force; November 2007
Figure 3: SDIs and corridors in SSA
General information on the major corridors is provided below.

-31-
Table 6: Summary of major corridors in SSA
Major corridors Countries
served
Issues
Mombasa Corridor
(Northern Corridor)
Burundi, DRC,
Rwanda,
Uganda and
Kenya
Road transport accounts for more
than 70 percent of the total transit
traffic flow within the Northern
Corridor.
About two thirds of the road network is
paved, although the condition is
generally poor due to inadequate
resources for rehabilitation and
maintenance. Overloaded freight
vehicles and poor enforcement of axle
load regulations further deteriorate the
road network and reduce road life
spans (TTCA, 2004).
Disruptions in the aftermath of the
elections are causing congestions at
the Mombasa port.
Until recently there were claims that at
least 500 containers bound for
Uganda were being held up in Kenya
due to the violence.
Dar-es-Salaam
TAZARA Corridor
Zambia and
Tanzania
Developed as a transportation route
for copper from Zambia, but cargo
transportation volume is gradually
decreasing. The reason are:
� Low operational capacity of ports
� Low operational capacity of
railways.
Dar-es-Salaam
Central Corridor
DRC,
Tanzania,
The 'Central Corridor', the road
network linking the countries will be

-32-
Major corridors Countries
served
Issues
Rwanda,
Burundi, and
Uganda
upgraded and completed by 2010.
Mtwara Corridor Malawi,
Mozambique
Tanzania and
Zambia.
The corridor runs from the port of
Mtwara in the east to Mbamba Bay in
the west on Lake Malawi Some of the
infrastructure projects identified as
necessary for the corridor include:
� Development of ports (Mtwara,
Manda, Mbamba Bay, Lindi and
Kilwa)
� Development of airports (Mtwara,
Songea, Njombe and other air
ports)
� Construction of unity bridge and
Ferry crossing to Mozambique)
� Mtwara – Mbamba Bay road,
� Mtwara – Songea – Manda
Railway
� Manda – Mchuchuma - Mlimba
Railway.
Nacala Corridor Malawi and
Mozambique
The corridor was damaged and closed
during the civil war. After the war, the
EU funded its rehabilitation over most
of its length, as far as Cuamba.
However, the Cuamba –Entre Lagos
connection to the border remains in a
very poor condition, with average
speeds of no more than 15 km/h.
This has been a severe constraint on
train operation in the corridor. The

-33-
Major corridors Countries
served
Issues
southern leg of the Malawi network
was further affected when in 1997, the
Shire River washed away much of an
embankment, 77 km north of the
border. As a result, there has been no
traffic of any kind south of this point
for nearly 10 years.
Despite progress in railway
rehabilitation in the 1990s, cargo
transportation volume is average.
Operational capacity of ports and
railways remain a problem (Nacala
corridor website).
Beira Corridor Mozambique,
Zimbabwe and
Zambia
The flow of traffic has been hindered
by the crisis in Zimbabwe. In addition,
due to the rehabilitation of the lines
there are currently no connections
between Harare and Beira or Harare
and Maputo (Beira Corridor website).
Maputo Corridor South Africa
and
Mozambique
A lack of sufficient facilities on the
Mozambican side has prevented
growth in the movement of coal, sugar
and other commodities as well as
passengers. Also, the pipeline for the
movement of goods is not seamless
(MDCL website).
Trans-Kalahari
Corridor
Namibia,
Gaborone and
Gauteng
There is a road link over 1,800 km,
supported by 640 km rail line.
The main development initiatives for
the corridor are the trilateral
cooperation program and the multi -

-34-
Major corridors Countries
served
Issues
modal transport concept.
The main focus of the Walvis Bay
Corridor
Group, is to increase cargo volumes
along the corridors via the Port of
Walvis Bay. Hence, the second port
expansion plans (Walvis Bay Corridor
Group, 2007).
Trans Caprivi
Corridor
Namibia,
Zambia and
DRC
The transport and trade bottleneck
was removed with the completion of
the Katima Mulilo Bridge crossing the
Zambezi River between Namibia and
Zambia in May 2004. The roads from
Namibia (specifically the port of
Walvis Bay) were rehabilitated and
linked up with the national road
network in Zambia. Both
improvements increased cross border
trade between Namibia and Zambia
by a factor of 5 (Walvis Bay Corridor
Group, 2004).
Benguela /Lobito
Corridor
Angola and
the rest of the
SADC
countries
For a long time, due to the political
situation / civil war in Angola the
corridor was not functioning.
Railways were also destroyed during
this period (Reuters, 2007).
Source:Compiled by Author
-35-
6.1.4.2 Inland waterways
Africa's inland waterways have long been mooted as part of the solution to the
continent's transport woes. While road and rail networks require constant
maintenance and upgrading, navigable rivers and lakes need far less
investment and infrastructure. Yet relatively little effort has been put into
making the most of this natural resource, mainly because it is only of great use
when integrated with road and rail transport links. Various forms of cargo and
particularly containerised cargo can often be most easily moved from one
point to another by using a variety of forms of transport. Governments are
finally recognising the value of inland waterways (Ford, 2007).
The Governments of Zambia, Malawi and Mozambique have signed a
memorandum of understanding to promote shipping on the Zambezi - Shire
water system. Comesa and the European Development Fund have agreed to
fund a full feasibility study of the project and a comprehensive hydrographical
study of the state of the river. It is believed that dredging in selected areas
would be sufficient to provide a waterway deep enough to serve medium sized
ocean going vessels. Results from a pre-feasibility study funded by the UK
Government have already proved positive (Ford, 2007).
Details on selected inland waterways are summarised in the table below.

-36-
Table 7: Information on SSA major waterway
Water
source
Countries served Settlements Leng
th
(km)
Width
(km)
Depth –
Average /
Maximum
(m)
Shore
length
(km)
Lake
Tanganyika
Burundi,
Democratic
Republic of the
Congo (DRC),
Tanzania and
Zambia
Kigoma - railhead for the railway from Dar-
es-Salaam.
673 72 570/1410 1828
Kalemie - railhead for the D.R. Congo rail
network
Mpulungu - proposed railhead for Zambia
Lake
Victoria
Tanzania, Uganda
and Kenya
Bukoba, Tanzania 337 250 40/83 3,440
Mwanza, Tanzania
Kisumu, Kenya
Kampala, Uganda
Entebbe, Uganda
Lake
Malawi
Malawi Likoma and Chizumulu islands 580 75 292/706 Information
not
available Mozambique
Tanzania

-37-
Source: Wikipedia, 2008
River Shire Tanzania, Malawi
and Mozambique.
Information not available 402 Information
not
available
Information
not
available
Information
not
available
River
Congo
DRC, Central
African Republic,
Congo, Angola
Zambia, Tanzania
Kisangani Mbandaka, (Kinshasa, Brazzaville,
Matadi, Boma and Muanda.
4,700 Information
not
available
Information
not
available
Information
not
available

-38-
7 An overview of the SSA economy
SSA’s economic growth rate appears to be at a turning point, albeit from a low
economic base. Recent economic growth is encouraging.
SSA economies continue to sustain the growth momentum of previous years,
recording an overall real GDP growth rate of 5.2 percent in 2006 compared to
5.4 percent in 2005 and 4.7 percent in 2004. As many as 28 countries
recorded improvements in growth in 2006, relative to 2005. Only Zimbabwe
recorded a negative growth rate in 2006. Africa’s growth performance in 2006,
as in previous years, was underpinned by improvement in macro economic
management in many countries, and strong global demand for key African
export commodities, sustaining high export prices, especially for crude oil,
metals and minerals (UNECA , 2007).
SSA has seen its strongest growth and lowest inflation in more than three
decades. These are influenced by internal and external factors. Internally,
domestic investment and productivity have risen and many SSA countries
have worked to stabilise their economies and to see reforms through.
Externally, strong global demand for commodities, greater flows of capital to
Africa, and debt relief has helped increase resources and lift growth across
SSA.
The strong growth in the region reflects the institutional improvements,
structural reforms, and more rigorous economic policies that have started to
bear fruit in many countries. The per capita income is increasing in tandem
with other developing countries (Figure 4).

-39-
Figure 4: Annual change in real GDP per capita
7.1 The contribution of commodity exports on SSA’s economic growth
Heavy dependence on primary commodities remains a common feature of
production, exports and growth in SSA. This exposes the sub-region to
external shocks and makes economic diversification a top priority for growth
policies on the continent (UNECA, 2007).
Global demand for oil and minerals has grown fast due to global growth,
especially driven by China’s high economic growth rate.
Between 2002 and 2005, the UNCTAD price index for non-fuel commodities
rose by 45 percent with minerals, ores and metals prices increasing by almost
100 percent and crude oil by 114 percent. The prices of metals, minerals and
oil have remained high.

-40-
Table 8: World primary commodity prices (percentage change)
2000 2001 2002 2003 2004 2005 2002 -2005
All commodities (excluding crude petroleum) 1.7 -3.6 0.8 8.1 19.4 12.1 44.8 Crude petroleum 55.6 -13.3 2.0 15.8 30.7 41.3 113.9 Food and tropical beverages -0.1 0.4 0.4 2.3 13.2 8.8 26.0 Coffee -25.1 -29.0 4.7 8.7 19.8 43.8 87.2 Cocoa -22.1 22.7 63.3 -1.3 -11.8 -0.7 -13.5 Tea 6.8 -20.2 -9.5 8.4 2.1 9.1 20.8 Sugar 30.4 5.6 -20.3 2.9 1.1 37.9 43.6 Rice -18.2 -15.3 11.0 4.1 23.1 17.1 50.1 Agricultural raw materials 3.1 -3.9 -2.4 19.8 9.9 7.1 41.0 Hides and skins 11.2 5.5 -2.9 -16.8 -1.7 -2.1 -19.9 Cotton 11.5 -19.0 -3.6 37.2 -3.3 -11.6 17.2 Rubber 7.9 -14.1 33.1 41.7 20.3 15.2 96.3 Tropical logs 3.7 6.4 -10.5 20.1 19.2 0.3 43.6 Mineral ores and metals 12.4 -10.8 -2.7 12.4 40.7 26.2 99.6 Aluminum 13.8 -6.8 -6.5 6.0 19.8 10.6 40.6 Copper 15.3 -13.0 -1.2 14.1 61.0 28.4 135.9 Gold 0.1 -2.9 14.4 17.3 12.6 8.7 43.5
Source: UNCTAD
7.2 The effect of location on trade
Africa has 15 landlocked countries (with 10 in SSA), whose distance to the
sea range from 220 km for Swaziland to 1,735 km for Chad.
The ability of landlocked countries to trade relies on the existence of efficient
and easily accessible transit corridors. In addition to own infrastructure,
landlocked economies need good roads and railways in neighbouring
countries.
Econometric evidence suggests that being landlocked constitutes a
geographical disadvantage with relevant effects on transport costs and trade
flows. Compared to a coastal country, the cost of shipment of goods for similar
distances is always greater for the landlocked country, as Figure 5 depicts.

-41-
0 5 10 15 20 25 30 35
SSA least developed landlocked
SSA landlocked
SSA coastal countries
All landlocked developing
All developing countries
OECD countries
IMPORT EXPORT
Source: Santiso, OECD Development Centre, 2006
Figure 5: Transport and insurance costs as a percentage of trade value
The generally low density and poor quality of infrastructure on the sub-region
tends to aggravate these disadvantages further. Poor average quality of
infrastructure even in countries with direct access to the sea, places an even
large burden on the competitiveness of landlocked countries.
The World Mineral Map shows a world map of the availability of minerals in
various parts of the world. World minerals marked on the mineral map of the
world, are uranium, silver, oil, lead and zinc, iron, diamond, bauxite, coal,
copper and gold. Mineral reserves are important for the economy of every
country as the products of the mineral mining industry are used as inputs for
consumer goods and services (World Minerals, 2007).
In the case of SSA, most commodities are located far from the coastal areas,
as depicted in the Mineral Map below.

-42-
Source: http://www.mapsofworld.com/world-mineral-map.htm
Figure 6: Mineral map of the world
The table below summarises export trading information for landlocked SSA
countries.

-43-
Table 9: Commodity export information
Country Exports – commodities
(percent)
Exports - partners
(percent)
Botswana Diamonds, copper, nickel,
soda ash, meat, textiles
European Free Trade
Association (EFTA) 87
percent, Southern African
Customs Union (SACU) 7
percent, Zimbabwe 4
percent (2006)
Burundi Coffee, tea, sugar, cotton,
hides
Switzerland 33.7 percent,
UK 12.2 percent, Pakistan
8.5 percent, Rwanda 5.3
percent, Egypt 4.2 percent
(2006)
Central
African
Republic
Diamonds, timber, cotton,
coffee, tobacco
Belgium 30.7 percent,
Spain 10.7 percent,
Indonesia 8 percent,
France 7.8 percent, China
6.9 percent, Democratic
Republic of the Congo 6
percent, Turkey 5 percent,
Italy 4.7 percent (2006)
DRC Diamonds, copper, crude oil,
coffee, cobalt
Belgium 29.4 percent,
China 21.1 percent, Brazil
12.3 percent, Chile 7.8
percent, Finland 7.2
percent, US 4.9 percent
(2006)

-44-
S
Source:Wikipedia, 2008
Lesotho Manufactures 75 percent
(clothing, footwear, road
vehicles), wool and mohair,
food and live animals (2000)
US 81.9 percent, Belgium
15 percent, Canada 1.9
percent (2006)
Malawi Tobacco 53 percent, tea,
sugar, cotton, coffee, peanuts,
wood products, apparel
South Africa 12.6 percent,
Germany 9.7 percent,
Egypt 9.6 percent, US 9.5
percent, Zimbabwe 8.5
percent, Russia 5.4
percent, Netherlands 4.4
percent (2006)
Swaziland Soft drink concentrates, sugar,
wood pulp, cotton yarn,
refrigerators, citrus and canned
fruit
South Africa 59.7 percent,
EU 8.8 percent, US 8.8
percent, Mozambique 6.2
percent (2006)
Uganda Coffee, fish and fish products,
tea, cotton, flowers,
horticultural products; gold
Belgium 9.9 percent,
Netherlands 9.4 percent,
France 7.9 percent,
Germany 7.7 percent,
Rwanda 5.6 percent,
Sudan 4.8 percent (2006)
Zambia Phosphates 62 percent Switzerland 38.4 percent,
South Africa 21.6 percent,
China 10.3 percent, UK 7.6
percent, Tanzania 6.4
percent (2006)
Zimbabwe Platinum, cotton, tobacco,
gold, ferroalloys,
textiles/clothing
Sudan 24.9 percent,
Republic of the Congo 17.7
percent, Burkina Faso 15.8
percent, US 10.5 percent
(2006)

-45-
Table 10 summarises import trading information for landlocked SSA countries.
Table 10: Commodity import information
Country Imports - commodities (
percent)
Imports - partners ( percent)
Botswana Foodstuffs, machinery,
electrical goods, transport
equipment, textiles, fuel and
petroleum products, wood
and paper products, metal
and metal products
Southern African Customs
Union (SACU) 74 percent,
EFTA 17 percent, Zimbabwe 4
percent (2006)
Burundi Capital goods, petroleum
products, food
Saudi Arabia 12.6 percent,
Kenya 8.2 percent, Japan 7.8
percent, Russia 4.7 percent,
UK 4.6 percent, France 4.4
percent, China 4.4 percent
(2006)
Central
African
Republic
Food, textiles, petroleum
products, machinery,
electrical equipment, motor
vehicles, chemicals,
pharmaceuticals
France 15.4 percent,
Netherlands 15.1 percent, US
9.2 percent, Cameroon 8.9
percent (2006)
DRC Foodstuffs, mining and other
machinery, transport
equipment, fuels
South Africa 19.2 percent,
Belgium 11.8 percent, France
9.3 percent, Zambia 7.5
percent, Kenya 7.4 percent,
Cote d'Ivoire 4.8 percent
(2006)

-46-
Country Imports - commodities (
percent)
Imports - partners ( percent)
Lesotho Food; building materials,
vehicles, machinery,
medicines, petroleum
products
Hong Kong 33.4 percent,
China 31.2 percent, Germany
7.7 percent, India 7.3 percent
(2006)
Malawi Food, petroleum products,
semi-manufactures,
consumer goods,
transportation equipment
South Africa 34.6 percent,
India 8.1 percent, Zambia 7.8
percent, US 6.4 percent,
Tanzania 5.8 percent,
Germany 4.6 percent, China
4.3 percent (2006)
Swaziland Motor vehicles, machinery,
transport equipment,
foodstuffs, petroleum
products, chemicals
US 29.4 percent, Netherlands
18.9 percent, Trinidad and
Tobago 14.9 percent, Japan
5.1 percent, China 4.9 percent
(2006)
Uganda Capital equipment, vehicles,
petroleum, medical supplies;
cereals
Kenya 34.1 percent, UAE 8.5
percent, China 7.1 percent,
India 5.6 percent, South Africa
5.4 percent, Japan 4.2 percent
(2006)
Zambia Fuel for fishing fleet,
foodstuffs
South Africa 47.3 percent,
UAE 10.4 percent, Zimbabwe
5.7 percent, Norway 4 percent
(2006)
Zimbabwe Machinery and transport
equipment, other
manufactures, chemicals,
fuels
South Africa 40.8 percent,
Zambia 29.6 percent, US 4.9
percent (2006)

-47-
7.3 China and India’s role in the growing SSA econo my
China and India are major economic hubs in developing Asia. Growth in
developing Asia was high in 2006, driven by China (10.2 percent) and India
(7.7 percent), which are the engines of manufacturing within the region.
Recently there has been an explosion of trade flows between Africa, China
and India. As a result, African exports to China of mainly raw materials have
increased tenfold since 1995 and by more than 50 percent in the first half of
2006 alone. China’s main focus is on developing relationships with Africa
(Economic Report on Africa, 2007).
It is important to note that the growth of Africa’s exports is narrowly correlated
with the growth of its major commodity exports – oil, industrial as well as
precious metals, tropical woods, and cotton - to China and India. Africa is
linked to the Asian drivers’ demand for primary commodities via two channels,
namely raw material prices (which are increasingly governed by China’s net
import demand) and through the growing trade dependency of Africa on China
and India. Africa’s income terms of trade may well have benefited from Asia’s
emergence as a net rise in the demand for raw commodities has translated
into higher export unit prices, and as urban consumers gain from cheaper
consumer goods and investors benefit from cheaper capital goods (Goldstein
et al, 2006).
The value of trade between China and Africa increased by an average 24
percent between 1995 and 2007, with total trade (imports and exports) of
approximately US$ 74 billion in 2007 (Fundira, Africa-China trading
relationship, 2008).
� Imports into China from Africa increased by 27 percent over the review
period while Chinese exports to Africa rose by a lesser 23 percent. This
resulted in a small trade deficit for China with Africa for 2007 (US$ 1.1
billion)
� Angola (19 percent) and South Africa (19 percent) were among the
biggest African trading partners for China, accounting for 38 percent of
all African trade with China in 2007. The China- Africa trade increased by

-48-
25 percent between 1995 and 2007, in line with the overall increase in
the value of China trade with Africa for the review period.
During 2006, Indian imports from Africa totalled US$12.6 billion while exports
to Africa were US$9.5 billion (The African trading relationship with India,
2007). There has been a very significant increase in both imports and exports
since 2003, as Table 11 depicts.
Table 11: India’s trade with Africa
Year Imports from Africa
(US$ billion)
Exports to Africa
(US$ billion) 1999 6.0 2.0 2000 3.0 2.2 2001 2.5 2.5 2002 3.0 3.0 2003 3.0 3.5 2004 3.0 4.5 2005 4.5 7.0 2006 13.0 9.5
Source: http://www.tralac.org/pdf/20070717_The AfricanTrading Relationship
with india.pdf
The increase in trade with the east requires efficient access to the Indian
Ocean. Similarly, landlocked countries, in Central Africa (SSA), trading with
western economies need more access to the Atlantic Ocean.
Generally SSA exports face trade barriers, such as high tariffs and taxes that
make it difficult for the products to compete in important markets globally.
8 The market potential
As the economy in SSA grows, so do the trade flows. This section pays
attention to capacities (current and potential capacities) of all considered
transport modes.

-49-
8.1.1 Ports
Ports traditionally form gateways to their countries. The political situation in
some countries and the poor conditions and operating efficiency of most ports
resulted in reduced traffic at ports, in spite of the port’s national or international
significance. This implies that most ports operated below their design capacity.
Port volumes are as recorded below for 2007.
Table 12: Capacity and utilisation of major ports in SSA (excluding South African ports)
Port Capacity
(tons/annum)
Utilisation
(tons/annum)
Mombasa
250,000TEUs 600,000 TEUs
(2007)
Dar-es-Salaam 10.1 million 7.6 million (2005/06)
Nacala 1 million 30 000 (2005)
Beira 3 million 1.4 million (2004)
Maputo 20 million (Ultimate) 6.6 million (2006)
Lobito 3 million 1.4 million (2006)
Walvis Bay
Information not
available
2.5 million (2005)
Mtwara 400 000 tons 149 769 (2005/06)
Matadi
Information not
available
1.7 million tons
(2006)
Sources:
Mombasa - KPA website Dar-es-Salaam - Tanzania ports website Nacala - Port of Nacala website Beria - Port of Beira website Maputo – Mpumalang province freight transport data bank and MCLI presentation Lobito – UK Reuters, 2007 Walvis Bay - Namport website Mtwara - Tanzania ports website Matadi - Otal/DRC website

-50-
8.1.2 Roads
Current road flows for SSA (recorded in 2007) are set out below. The volumes
represent the total flow of both imports and exports on the roads.
Table 13: Estimated road volumes per country
Country Road volumes (excluding
metropolitan)
(Million tons/ annum)
Angola 50.4
Botswana 18.8
DRC 14.1
Kenya 59.3
Lesotho 4.3
Malawi 5.9
Mozambique 13.4
Namibia 10.8
South Africa 553.0
Swaziland 3.6
Tanzania 34.7
Uganda Information not available
Zambia 30.1

-51-
Comparison of the current and potential road volumes for SSA countries is graphically represented below.
-
2.0
4.0
6.0
8.0
10.0
12.0
14.0
16.0
RSA
Kenya
Zambi
a
Leso
tho
Angola
Tanza
nia DRC
Swazila
nd
Botsw
ana
Namibi
a
Zimbab
we
Mala
wi
Moz
ambi
que
Mill
ion
tonk
m/ R
oute
km
Potential Density Current Density
Figure 7: Current and potential road density
.
-
2.0
4.0
6.0
8.0
10.0
12.0
14.0
16.0
RSA
Kenya
Zambi
a
Leso
tho
Angola
Tanza
nia DRC
Swazila
nd
Botsw
ana
Namibi
a
Zimbab
we
Mala
wi
Moz
ambiq
ue
Mill
ion
tonk
m/ R
oute
km
-
10.0
20.0
30.0
40.0
50.0
60.0
70.0
80.0
90.0
100.0
Potential Density Current Density Road Transport Quality Index
Figure 8: Current and potential density vs. road transport Quality Index
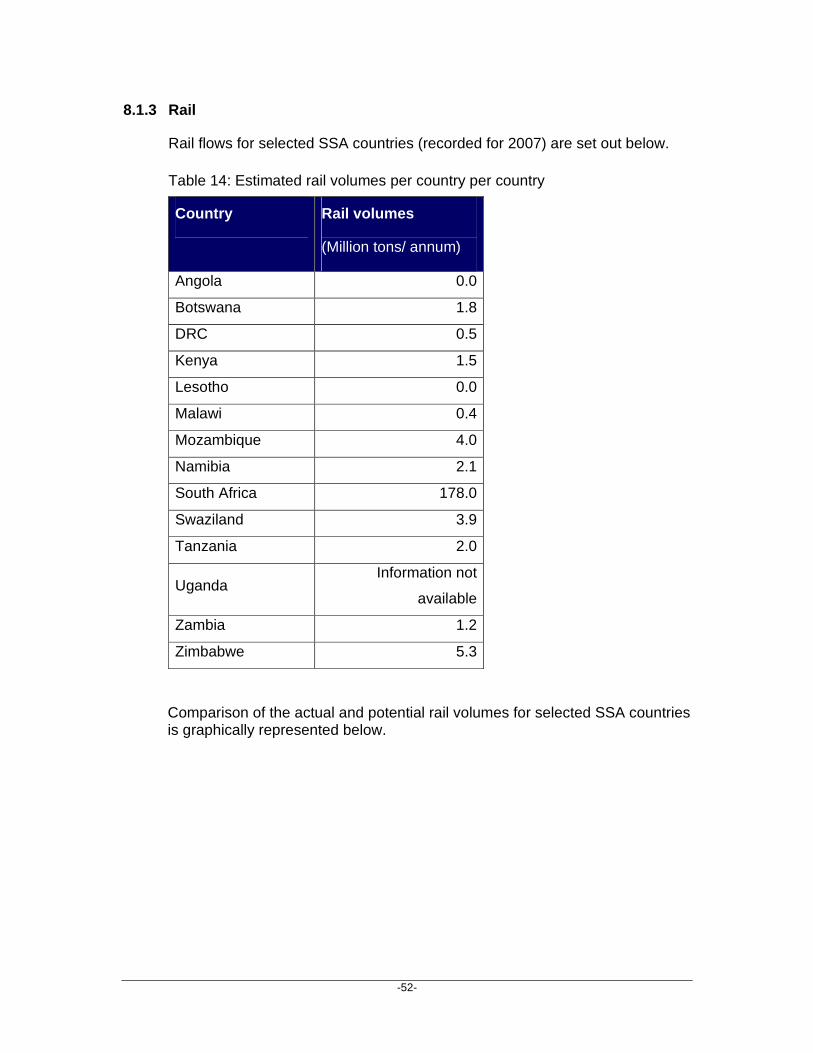
-52-
8.1.3 Rail
Rail flows for selected SSA countries (recorded for 2007) are set out below.
Table 14: Estimated rail volumes per country per country
Country Rail volumes
(Million tons/ annum)
Angola 0.0
Botswana 1.8
DRC 0.5
Kenya 1.5
Lesotho 0.0
Malawi 0.4
Mozambique 4.0
Namibia 2.1
South Africa 178.0
Swaziland 3.9
Tanzania 2.0
Uganda Information not
available
Zambia 1.2
Zimbabwe 5.3
Comparison of the actual and potential rail volumes for selected SSA countries is graphically represented below.

-53-
-
5.0
10.0
15.0
20.0
25.0
30.0
Kenya
Angola
Tanza
nia
Zambia DRC
Moz
ambiq
ue
Zimbab
we
Namib
ia
Botsw
ana
Swazila
nd
Mala
wi
Leso
tho
Mill
ion
Ton
s
Potential Rail Actual Rail
Figure 9: Current and potential rail volumes
8.1.4 Cross border infrastructure
Cross border infrastructure is critical in promoting regional integration, trade
and investment because it opens up areas of main economic activities, such
as mining, tourism, agriculture and manufacturing, in addition to serving
landlocked countries.
8.1.4.1 Transport and development corridors
No volumes are available for transport and development corridors.
8.1.4.2 Inland waterways
No volumes are available for inland waterways.
9 Regulatory environment
This section elucidates the due process of regulation surrounding the transport
sector in SSA. It entails all relevant legislative aspects (laws / regulations,
policies, agencies or organisations that have the responsibility over the

-54-
legislation (policies and regulations) for the transport (specifically freight)
sector.
9.1 Economic freedom
It can be argued that economic reforms translate into legislation that can be
attractive or repellent for both domestic and foreign direct investment.
According to the Heritage Foundation team, economic freedom can be defined
as that part of freedom that is concerned with the material autonomy of the
individual in relation to the state and other organised groups. Individuals are
economically free when fully in control of their labour and property. This
freedom is related to political freedom.
The 2008 Index of Economic Freedom covers 162 countries across 10 specific
factors of economic freedom. The Index of Economic Freedom is an average
of 10 individual freedoms, each of which is vital to the development of
personal and national prosperity. Some of the freedoms measure the extent of
an economy’s openness to investment or trade; some assess the liberty of
individuals to use their labour or finances without restraint.
The 10 Economic Freedoms are (2008 Index of Economic Freedom, p40-41):
� Business freedom
o The ability to create, operate, and close an enterprise quickly
and easily (burdensome, redundant regulatory rules are the most
harmful barriers to business freedom)
� Trade freedom
o A composite measure of the absence of tariff and non-tariff
barriers that affect imports and exports of goods and services
� Fiscal freedom
o A measure of the burden of Government from the revenue side.
It includes both the tax burden in terms of the top tax rate on
income (individual and corporate separately) and the overall
amount of tax revenue as a portion of gross domestic product
(GDP)
� Government size

-55-
o As defined to include all Government expenditures, including
consumption and transfers. Ideally, the state will provide only
true public goods, with an absolute minimum of expenditure
� Monetary freedom
o Combines a measure of price stability with an assessment of
price controls (Both inflation and price controls distort market
activity. Price stability without micro-economic intervention is the
ideal state for the free market)
� Investment freedom
o An assessment of the free flow of capital, especially foreign
capital
� Financial freedom
o A measure of banking security as well as independence from
Government control. (State ownership of banks and other
financial institutions such as insurer and capital markets is an
inefficient burden, and political favoritism has no place in a free
capital market)
� Property rights
o An assessment of the ability of individuals to accumulate private
property, secured by clear laws that are fully enforced by the
state
� Freedom from corruption
o Based on quantitative data that assess the perception of
corruption in the business environment, including levels of
Governmental legal, judicial, and administrative corruption
� Labor freedom
o A composite measure of the ability of workers and businesses to
interact without restriction by the state.
Taken together, these 10 freedoms offer an empirical depiction of a country’s
degree of economic freedom. According to the Heritage Foundation team a
systematic analysis of the 10 freedoms has demonstrated that economic
freedom is the key to creating an environment that allows a virtuous cycle of

-56-
entrepreneurship, innovation, and sustained economic growth and
development to flourish.
High economic freedom scores approaching 100 represent higher levels of
freedom. The higher the score on a factor, the lower the level of Government
interference in the economy. Thus economies with higher levels of economic
freedom enjoy higher living standards.
9.2 Economic freedom as an implication of regulatio n
SSA’s overall level of economic freedom is weaker than any other world region
and has stagnated over the years. Nevertheless, there are some success
stories – these usually involve countries with greater freedom and high GDP
per capita.
45.0
50.0
55.0
60.0
65.0
70.0
1995 1996 1997 1998 1999 2000 2001 2002 2003 2004 2005 2006 2007 2008
Eco
nom
ic fr
eedo
m s
core
s
SSA AmericasWorld Europe Asia Middle East/North Africa
Source: Economic index 2008
Figure 10: Economic freedom – World average vs. regions, 1995 to 2008
The dip in the score for SSA in 2005 is largely caused by Zimbabwe, the third
largest of countries measured in the world that deteriorated rapidly; where
Government interference in the economy, poor economic management and
total lack of monetary freedom is causing a systemic collapse of the country.

-57-
The negative effect of repressed economies can be illustrated by comparing
the economic freedom score of Ghana and South Korea. Both these countries
had a GDP per capita of US$400 per person in 1960. Ghana’s current GDP
per capita is US$2500 per annum compared to US$25000 of South Korea.
South Korea ranks 41 in the global economic freedom score compared to
Ghana’s rank of 94. Most analysts indicate that the level of development,
education and resources were the same for both countries in 1960 and that
the difference is mostly attributable to economic freedom discrepancies.
Figure 11 below depicts the ten economic freedoms specifically in SSA
compared to the global average.
58.8
33.9
28
64
50.6
46.3
43.3
72.4
75.4
72.3
0 20 40 60 80 100
Business Freedom
Trade Freedom
Fiscal Freedom
Government Size
Monetary Freedom
Investment Freedom
Financial Freedom
Property Rights
Freedom from Corruption
Labor Freedom
Sub-Saharan Africa Global average
Source: Economic index 2008
Figure 11: Ten Economic Freedoms in SSA
When considering investments into this region which has already been
identified as having the worst economic repressive regimes in the world, the
ten sub-items of this index should also be taken into account. Two of the most
critical items that are often highlighted, i.e. corruption and property rights.
These are not only the lowest for SSA but the gap between these items and
global average is also the biggest.

-58-
Unlike regions that have a diverse range of free-market economies, in SSA
there are only distinctions among less free economies. A majority of nations
are ranked “mostly unfree,” with “moderately free” economies outnumbered by
“repressed” economies.
Nine of the 20 countries ranked “repressed” around the world are located in
SSA.
9
25
5
1 00
5
10
15
20
25
30
0-49.9Repressed
50-59.9 60-69.9 70-79.9 80-100 Free
Nu
mb
er
of c
ou
ntr
ies
Source: 2008 Index of Economic Freedom Figure 12: Distribution of Economic
Freedoms in SSA
The degree of economic freedom informs an assessment of the success of
regulation. The donors have got this as the top priority. These parties want to
address regulation because they understand that the management of
regulation will influence economic freedom. In the light of this drive to improve
economic freedom, regulation now needs to be discussed.
9.3 Funding and regulatory framework SSA.
This is one of the key benificiaries of global aid and development inititaives.
Various countries, organisations and agencies contribute to the development
of SSA, making the funding and regulatory environment a very complex and
confusing environment. This also leads to regional integration and alignment
challenges.

-59-
Although there is a plethora of funding and development agencies and
organisations involved in SSA, there are those whose contribution,
participation and presence is quite noticeable. Figure 13 below provides a
broad outline of the major funding and development frameworks operating in
SSA in the development of infrastructure:
Figure 13: Outline of the major SSA funding and development framework
The development and funding organisations coordinate efforts through the
establishment of different organisations, or the implementation of specific
initiatives to address the transport (infrastructure) needs in the SSA countries.
In parallel, Regional Economic Communities (RECs) are developing master
plans, joint initiatives, task forces and groups to address country specific and
regional transport (infrastructure) needs.
The World Bank states clearly that the World Bank Group alone cannot
address SSA’s needs. Partnerships at country, regional and global levels are
needed. Global development alignment and focus was initiated in September
2000 at the United Nations (UN) Millennium Summit. World leaders agreed to
a set of time bound (2015) and measurable goals and targets for combating
United NationsG8 – GleneaglesParis Declararion
OECDWorld Bank
African UnionEuropean Union (EU)
African Development BankEuropean Investment Bank
USAID
Donors (EC, Denmark, France, Ireland, Norway, Sweden, UK)
MDGsNEPAD
(STAP, MLTSF,NEPAD-IPPF)
Africa Action Plan (AAP)ICA
PPIAF
SSATP
COMESA-EAC-SADC Task Force
RECs Transport Master plansetc.
EACCOMESA
SADC
Development and funding agencies, organisations and donors Initiatives
REC
AU
African countries

-60-
poverty, hunger, disease, illiteracy, environmental degradation and
discrimination against women. The goals were termed the Millennium
Development Goals (MDGs). The MDGs provide a framework for the entire
United Nations system to work coherently together towards a common end.
The following MDGs where identified (United Nations Department of Public
Information, 2002):
� Goal 1: Eradicate extreme poverty and hunger
� Goal 2: Achieve universal primary education
� Goal 3: Promote gender equality and empower women
� Goal 4: Reduce child mortality
� Goal 5: Improve maternal health
� Goal 6: Combat HIV/AIDS, malaria and other diseases
� Goal 7: Ensure environmental sustainability
� Goal 8: Develop a global partnership for development.
Infrastructure and the development of infrastructure play a vital role in the
achievement of these goals.
The challenges for the global community, in both the developed and
developing world, are to mobilising financial support and political will, re-
engaging Governments, re-orienting development priorities and policies,
building capacity and reaching out to partners in civil society and the private
sector. UN agencies, the OECD Development Assistance Committee, World
Bank and the International Monetary Fund, are working together to support
Millennium Development Goals (MDGs) for every developing country. These
actions paved the way for new and integrated initiatives to address the
challenges facing SSA (but also Africa as a whole). The Global funding and
development organisations and communities designed different “initiatives” to
address these challenges and to support the RECs. Through these principles
of coordination and integration the SSA RECs are also moving towards
establishing “initiatives” to address infrastructural challenges (UN Department
of Public Information, October 2002)

-61-
In order to understand the different role players, their objectives and actions
towards infrastructure in SSA, a brief explanation of the important
organisations follows.
9.3.1 Development and Funding agencies, organisatio ns and donors
There are several participatory structures established at local, regional,
continental and international level to encourage sustainable economic growth,
infrastructure development and poverty alleviation (through income
generation, employment and decent jobs).
Development led by SSA communities is regarded as the answer to
disadvantaged regions. This “bottom-up” approach ensures that local
communities become participants in their own development rather than the
objects of development. A partnership between national and international
stakeholders led to the establishment of the Paris Declaration.
Although development initiatives were in place before the Paris Declaration
(as early as 2001), the main foundation was set by the Paris Declaration.
9.3.1.1 Paris Declaration
Ministers and other high-level officials of about 90 developed and developing
countries, and heads/officials of 27 aid agencies, endorsed the Paris
Declaration on Aid Effectiveness in March 2005. The Partnership
commitments were organised around five key principles:
� Ownership
� Alignment
� Harmonisation
� Managing for results
� Mutual accountability
The Paris Declaration takes its place as one of the milestones in the global
effort to increase how effectively development resources are used — a chain
of commitments and efforts rooted in the 1990s, and extending from the

-62-
Millennium Summit (2000), which set out the Millennium Development Goals;
the Monterrey Conference (2002); the Rome High-Level Forum on
Harmonisation (2003); and the Marrakech Roundtable on Managing for
Results (2004) (World Bank, Paris Declaration Endorsed, March 2005, p1).
The Paris Declaration lays down a practical, action orientated roadmap to
improve the quality of aid and its impact on development. As a result, the G8
and key multilateral agencies, namely the World Bank, African Development
Bank, European Commission and the European Investment Bank established
the Infrastructure Consortium for Africa (ICA) in 2005 in order to increase
focus on attention to Africa’s infrastructure needs. More information on ICA is
set out in Par 9.3.2.3. For a list of participating organisations and countries
refer to Addendum A.
9.3.1.2 African Union
The African Union (AU) is an inter-Governmental organisation consisting of 53
African states. The AU was established in 2001, as a successor to the
amalgamated African Economic Community (AEC) and the Organisation of
African Unity (OAU). The purpose of the union is to help secure Africa's
democracy, human rights, and a sustainable economy, especially by bringing
an end to intra-African conflict and creating an effective common market.
The AU vision is based on the common vision of a united and strong Africa
and on the need to build a partnership between Governments and all
segments of civil society, in particular women, youth and the private sector, in
order to strengthen solidarity and cohesion amongst the people of Africa.
Hence the objectives of the AU are to:
� Achieve greater unity and solidarity between the African countries and
the people of Africa
� Defend the sovereignty, territorial integrity and independence of its
Member States
� Accelerate the political and socio-economic integration of the continent
� Promote and defend African common positions on issues of interest to
the continent and its people

-63-
� Encourage international cooperation, taking due account of the Charter
of the United Nations and the Universal Declaration of Human Rights
� Promote peace, security, and stability on the continent
� Promote democratic principles and institutions, popular participation
and good governance
� Promote and protect human rights in accordance with the African
Charter on Human and People’s Rights and other relevant human
rights instruments
� Establish the necessary conditions which enable the continent to play
its rightful role in the global economy and in international negotiations
� Promote sustainable development at the economic, social and cultural
levels as well as the integration of African economies
� Promote co-operation in all fields of human activity to raise the living
standards of African peoples
� Coordinate and harmonize the policies between the existing and future
RECs for the gradual attainment of the objectives of the Union
� Advance the development of the continent by promoting research in all
fields, in particular in science and technology
� Work with relevant international partners in the eradication of
preventable diseases and the promotion of good health on the
continent.
9.3.1.2.1 New Partnership for Africa’s Development (NEPAD)
NEPAD was established as a vision and strategic framework for Africa’s
renewal. The NEPAD strategic framework document arises from a mandate
given to the five initiating Heads of State (Algeria, Egypt, Nigeria, Senegal,
and South Africa) by the Organisation of African Unity (OAU) to develop an
integrated socio-economic development framework for Africa. The 37th
Summit of the OAU in July 2001 formally adopted the strategic framework
document, with the objective of developing values and monitoring their
implementation within the framework of the AU.

-64-
NEPAD is designed to address the current challenges facing the African
continent. Issues such as the escalating poverty levels, underdevelopment
and the continued marginalisation of Africa needed a new radical intervention,
spearheaded by African leaders, to develop a new vision that would guarantee
Africa’s renewal (NEPAD in Brief, 2005). More information on NEPAD is later
set out in Par 9.3.2.1. The AU and NEPAD play a very important role in the
integrated approach to infrastructure development in Africa.
9.3.1.3 World Bank
The World Bank Group has a major role to play in facilitating the international
response to the call for expanded assistance to Africa by working in
partnership with other development partners to help every African country to
reach as many of the Millennium Goals as possible by 2015. The World Bank
developed an Africa Action Plan (AAP) in April 2005 to show how the Bank
Group will work in partnership with others to help every African country to
achieve the MDGs. These actions are also aligned with the Paris declaration
of 2005. More detail on AAP is set out in Par 9.3.2.4.
9.3.1.4 European Union (EU)
The EU is the largest donor in Africa. Its Official Development Assistance
(ODA) accounts for 51 percent of the total ODA allocated to Africa. The EU
developed a comprehensive integrated and long term framework for its
relations with the African Continent in 2005. The previous relationship with
Africa was based on fragmented policy formulation and implementation.
The EU’s priorities are to make aid effective and to coordinate donor activities.
The EU’s principle objective is to promote the achievement of the UN MDGs in
Africa. The EU views Africa as one entity, thus it supports and initiates
programs that facilitate interconnectivity at continental level to promote
regional integration. The EU-Africa Partnership was established for this
purpose. The EU-Africa relationships are governed by equality, partnership
and ownership, with the EU also playing a political and commercial partner
role.

-65-
The Partnership for Infrastructure encompasses investments in trans-
boundary and regional infrastructure and their regulatory frameworks in the
widest sense: transport networks (roads, railways, inland waterways, ports and
airports), water and energy infrastructure and connections as well as ground-
based and space-based electronic communications infrastructure and
services. The Partnership for Infrastructure is based on a number of central
principles:
� The Partnership’s success depends on coherence complemented with
the action taken at country and regional level and its long-term
sustainability. Such sustainability is secured through the development
of national operators and service providers as well as regional entities.
� The Partnership will ensure African ownership through close
engagement with the African continental and regional institutions – the
AU and the RECs – in accelerating the AU-NEPAD Action Plan on
Infrastructure. Effective support for this Plan by the partnership
demands a substantive increase in funding levels and the deployment
of flexible methods of financing. Initially the EU will set up a task force
that combines European Commission (EC) and European Investment
Bank (EIB) resources and expertise open to Member States and their
development financial institutions. This enables an early start up of the
Partnership and provides flexibility for designing an appropriate
institutional structure that seeks efficient implementation and successful
outcomes. The EU task force will facilitate coordination and mobilisation
of the substantial funds necessary to interconnect Africa; and through
participation in other international initiatives enhance its effectiveness.
In the framework of this Partnership, specific action should include
identifying and address missing links and harmonising transport policies
through support of the Sub-Saharan Transport Programme (SSATP).
(Commission of the European Communities, Brussels, 12.10.2005,
COM(2005) 489 final, EU Strategy for Africa: Towards a Euro-African
pact to accelerate Africa’s development {SEC(2005)1255}.

-66-
9.3.1.5 United States Agency for International Deve lopment (USAID)
USAID is directed to helping African Governments, institutions, and African
based organisations in 47 African countries to incorporate good governance
principles and innovative approaches to health, education, economic growth,
agriculture, and environment programs. In SSA, the United States’ main
interests are: increasing trade and strengthening economic ties with the
region, mitigating the region’s HIV/AIDS crisis and recurrent food insecurity,
and strengthening democracy to reduce the risk of conflict in the region.
The U.S. also plays a leading role in discussion and coordination within such
international bodies as the United Nations and the Development Assistance
Committee (DAC) of the Organisation for Economic Cooperation and
Development (OECD), the World Bank, and regional multinational lending
bodies.
9.3.1.6 African Development Bank (ADB)
The African Development Bank (ADB) is Africa’s premier development finance
institution and is dedicated to combating poverty and improving living
conditions across the continent. The Bank’s mission is to promote economic
and social development through loans, equity investments and technical
assistance.
The ADB strongly supports attainment of the MDGs. This paved the way for
the development of a Bank strategy (2004-2007) that focuses specifically on
poverty, agriculture and rural development, human capital and education,
health, infrastructure development and regional integration.
The ADB objectives are aligned with the NEPAD initiatives. The ADB
believes that greater regional cooperation in infrastructure will reduce costs;
facilitate market integration; and help promote investment, particularly by the
private sector. The regional member countries are Algeria, Angola, Benin ,
Botswana, Burkina Faso, Burundi, Cameroon, Cape-Verde, Central African
Republic,Chad, Comoros, Congo, Côte d'Ivoire, Djibouti, Democratic Republic
of Congo, Egypt, Equatorial Guinea, Eritrea, Ethiopia, Gabon, Gambia,
Ghana, Guinea, Guinea Bissau, Kenya, Lesotho, Liberia, Libya, Madagascar,

-67-
Malawi, Mali, Mauritania, Mauritius, Morocco, Mozambique, Namibia, Niger,
Nigeria, Rwanda, Sao Tome and Principe, Senegal, Seychelles, Sierra Leone,
Somalia, South Africa, Sudan, Swaziland ,Tanzania, Togo, Tunisia, Uganda ,
Zambia, Zimbabwe. There is a rising realisation among Regional Member
Countries that progressive integration holds great potential for minimising the
costs of market fragmentation and thus, is a precondition for integrating
African economies into the global economy.
The Bank has a long history of financing regional / multi-national projects and
national investments, which increase the complementarities of Regional
Member Countries economies. The lessons learned from these projects
identify the need for selectivity in the choice of areas of future interventions.
Since multi-national projects tend to be large, costly and involve high sunk
costs, the Bank pursues co-financing arrangements with other development
partners and the beneficiary Regional Member Countries. The Bank is
selective, concentrating on demonstration and high- impact projects that
facilitate cooperation and integration confidence among participating
countries. This approach call for greater emphasis on programs and projects
in power interconnections, upgrading transport and telecommunications
projects. The Bank’s focus is for better linkages between Regional Member
Countries and improved market access, in particular for land-locked countries
where these are economically sound and represent important components of
regional integration programs.
Key strategic partnerships are with the World Bank, the International Monetary
Fund (IMF), International Fund for Agriculture Development (IFAD), United
nations Development programme (UNDP), and the European Union and
active bilateral agencies and regional economic communities. (Strategic Plan
2003-2007, African Development Group, November 2002).
9.3.1.7 Summary: Development and Funding agencies, organisations and
donors
Bi-lateral and multi-lateral donors are playing a pivotal role in assisting
countries in SSA with the development of infrastructure; undertaking actions in
the power sector, focusing on reforms to improve performance, regional

-68-
transmission networks, and expansion of access in rural and peri-urban areas;
in transport, focusing on rehabilitation of road networks and reform programs
to establish independent financing and management mechanisms; and in
water supply and sanitation, focusing on service expansion to meet the water
MDG.
With just a fraction of the population of Asia, Sub-Saharan Africa receives
more absolute foreign aid, both multilateral and bilateral, than any other
region. The main objective for donors is to reduce poverty in middle income
and creditworthy poorer countries by promoting sustainable development
through loans, guarantees, risk management products, and analytical and
advisory services.
Major active donors in SSA include: the World Bank Group, European
Commission, African Development Bank, Overseas Private Investment
Corporation (OPIC) Sweden, Denmark, Norway, Ireland, United Kingdom,
France, Islamic Development Bank, and United Nations Economic
Commission for Africa (UNECA), and the European Union.
Aid levels to SSA have increased. For SSA to achieve the 7 percent GDP
growth rates needed to halve income poverty, SSA’s infrastructure investment
needs will amount to around $20 billion per year, twice as much as the region
has historically been investing. Throughout the 1990s, infrastructure was
largely overlooked in the allocation of official development assistance in favour
of the social sectors. It is only recently, with the September 2005 UN
Millennium plus 5 Summit and the report of the Commission for Africa, that
infrastructure again became a top priority on the international development
agenda. The World Bank estimates that African countries will need to spend
the equivalent of 4 percent of GDP every year for the coming decade, just on
the rehabilitation and development of roads to ensure sustainable economic
growth (Boardman,2006).
The objectives and the approach followed by donors are important
consideration in assessing transportation solutions in Africa. A point often
missed is that transport infrastructure is crucial for poverty reduction. Studies
have shown that transport accounts for nearly 6 percent of global GDP. It is

-69-
therefore important that up-front planning should maximise the benefits from
infrastructure projects while minimising their environmental and social costs
(Boardman, 2006).
9.3.2 Initiatives
Various initiatives / vehicles have been created and developed by the different
funding and development organisations in order to address the challenges
facing SSA in general but also specifically for infrastructure development. A
few of these initiatives are discussed below in some more detail.
9.3.2.1 NEPAD
NEPAD is designed to address the current challenges facing the African
continent with the primary objectives of:
� Eradicating poverty
� Placing African countries, both individually and collectively, on a path of
sustainable growth and development
� Halting the marginalisation of Africa in the globalisation process and
enhance its full and beneficial integration into the global economy
� Accelerating the empowerment of women.
The NEPAD principles are:
� Good governance as a basic requirement for peace, security and
sustainable political and socio-economic development
� African ownership and leadership, as well as broad and deep
participation by all sectors of society
� Anchoring the development of Africa on its resources and
resourcefulness of its people
� Partnership between and amongst African peoples
� Acceleration of regional and continental integration
� Building the competitiveness of African countries and the continent

-70-
� Forging a new international partnership that changes the unequal
relationship between Africa and the developed world
� Ensuring that all Partnerships with NEPAD are linked to the Millennium
Development Goals and other agreed development goals and targets.
The NEPAD priority is the promotion of regional integration in the continent to
overcome the lack of economies of scale. NEPAD’s approach is built around
regional integration, good governance and public-private partnerships. A two-
pronged approach for the development of infrastructure:
� Short Term Action Plan (STAP) to kick start the process (developed
by African development Bank, in consultation with the Regional
Economic Communities (RECs) and Specialised Infrastructure
Development agencies and development partners)
� Medium to long term strategic framework (MLTSF) to complement
the STAP and guide the systematic development of infrastructure in the
continent. It will provide a strategic framework that will serve as the
basis for defining, implementing and monitoring infrastructure
development on the continent. Study is expected to be ready for
reporting in 2008.
The Africa Infrastructure Country Diagnostic (AICD) Study initiated by
NEPAD is sampling national level data across infrastructure sectors in 24
African countries, to generate a quantitative assessment of the state of
Africa’s infrastructure and creating a baseline to assess progress and address
future needs. Study is expected to finish reporting in 2008.
The AICD and the MLTSF study essentially complement each other, insofar as
the AICD focuses on the infrastructure situation within countries, while the
MLTSF focuses on cross-border infrastructure needed to promote regional
integration.
The NEPAD Infrastructure Project Preparation Facili ty (NEPAD-IPPF)
NEPAD-IPPF was established in 2003 with funding from the Canadian
Government. In May 2005, the IPPF was transformed into a multi-donor
facility.

-71-
The mandate of the NEPAD Infrastructure Project Preparation Facility is to
assist African countries, Regional Economic Communities (REC's) and related
institutions to prepare high quality and viable regional infrastructure projects
and programs, develop consensus and broker partnerships for their
implementation with the long-term goal of reducing Africa's economic
marginalisation by ensuring sustainable regional economic development and
integration through cooperation among African countries, donors and the
private sector.
Other objectives of the NEPAD-IPPF are to support the creation of an
enabling environment for private sector participation in infrastructure, and
support to targeted capacity building initiatives in infrastructure development in
order to enhance the sustainability of existing and planned regional
infrastructure developed in the continent. The NEPAD-IPPF promotes and
facilitates the preparation of regional infrastructure projects and programs
approved within the context of the NEPAD Infrastructure Program.
The Multilateral Investment Guarantee Agency (MIGA) , a member of the
World Bank Group, is assisting the NEPAD (New Partnership for Africa’s
Development) Secretariat in developing an online project management and
reporting system to improve the coordination of regional projects in Africa,
particularly in the infrastructure sector. The proposed approach involves the
enhancement of an existing prototype database into a more robust
information-sharing mechanism, which will be hosted and maintained by the
Development Bank of Southern Africa (DBSA). MIGA consultants will also
assist the Secretariat and the NEPAD unit of the African Development Bank
(ADB) in collecting and organising existing information on regional projects.
With the objective of pursuing a coherent and strategic framework for
monitoring the development of transport infrastructure, NEPAD emphasises
the formulation of sub-regional strategies and an Africa regional strategy.
9.3.2.2 Sub Saharan Transport Policy Program (SSATP )
SSATP was launched by a joint initiative of the World Bank and the United
Nations Economic Commission for Africa (UNECA) in 1987. The purpose of
-72-
the organisation was to improve transport sector performance by promoting
policy reforms and institutional changes. The management of the programme
is with the World Bank. The principles and goals of SSATP are aligned with
AU/NEPAD. Regional Economic Communities (RECs) play an integral part in
sharing the ownership of the SSATP.
SSATP is an international partnership of 35 Sub-Saharan Africa countries and
the Regional Economic Communities of Sub-Saharan Africa. It is funded by
11 donor agencies – European Commission, Sweden, Denmark, Ireland,
United Kingdom, France, African Development Bank, United Nations
Economic Commission for Africa (UNECA) and the World Bank. South
Africa’s absence in this organisation is a major concern.
SSATP facilitates policy development and related capacity building in the
transport sector of SSA. The SSATP is on its second development plan
(2008-2011 Development Plan) and the focus is on the promotion of sound
transport policies and strategies and to emphasise the strengthening of
country and REC ownership and partnering with donor operations.
Most of the infrastructure initiatives for Africa recognise the critical role of
SSATP in ensuring that investment in transport are made within sensible
policy frameworks and strategies to improve access and reduce transport cost
in the region. ( World Bank, Sub-Saharan Transport policy Program (SSATP),
Second Development Plan 2008-2011, October 2007)
9.3.2.3 Infrastructure Consortium for Africa (ICA)
Aligned with NEPAD’s initiatives the G8 and key multi-lateral agencies, like the
World Bank, African Development Bank, European Commission and the
European Investment Bank, the Infrastructure Consortium for Africa (ICA) was
established in 2005 to increase focus on and attention to Africa’s infrastructure
needs.
The membership of the Consortium from the African side is led by the African
Development Bank while AU Commission, NEPAD Secretariat and Regional

-73-
Economic Communities participate as observers in the meetings of the
Consortium.
The Consortium addresses national and regional constraints to infrastructure
development through the sharing of information, project development and
good practice. The ICA is not a financing agency but it acts as a platform to
catalyse donor and private sector financing of infrastructure projects and
programs in Africa.
The ICA estimated that the total resources available for transport (excluding
South Africa) have increased from $1.9 billion in 2004 to $2.2 billion in 2006.
Most of these investments are for road. Three multilateral agencies provide
the bulk of this financing. (European Commission, International Development
Association and African Development Bank). Regional and cross border
activities have increased. Japan’s support in transport infrastructure is also
increasing. Private financing has been limited and linked to port and railway
concessions. (World Bank, Accelerating Development Outcomes in Africa
progress and change in the Africa Action Plan, April 2007, DC2007-0008).
9.3.2.4 World Bank - African Action Plan (AAP)
The AAP aims to help countries develop financing options to attract additional
private and public resources and support accelerated progress towards results
(Increase aid and trade in Africa).
Four pillars exist:
� Accelerate economic growth (MDG achievement)
� Building capable states
� Strengthen outcome based strategies and focus on results
� Strengthening development partnership for Africa.
The AAP’s infrastructure (transport) focus is to address the expansion and
upgrading of road networks and to enforce regional integration.
Many new bilateral donors and private foundations are primarily interested in
sector specific initiatives as education, infrastructure etc. The World Bank’s
-74-
aim is to use its power and human resources to assist Governments in
matching viable country plans and strategies with appropriate funding.
The report on Accelerated Development Outcomes in Africa – Progress and
change in the Africa Action Plan, April 2007 indicates that there is definite
evidence of governance improvements in Africa. It also states that there are
definite progress on MDGs due to sustained efforts by Governments and
development partners. SSA and South Asia are however not expected to
achieve all the MDGs for 2015.
Progress on the four pillars:
� Accelerate economic growth (MDG achievement)
o Progress has been best here. Good progress in establishing the
preconditions for an export push, in regional integration (for
example custom clearance).
� Building capable states
o Compared to the average for all developing countries about a
third of African countries have made more rapid strides in
decreasing corruption, improving accountability and boosting
Government effectiveness since 2000.
� Strengthen outcome based strategies and focus on results
o Most African countries (66 percent thereof, and specifically
Mozambique and Tanzania) undertook major efforts to clarify
their development goals and targets, based on a medium-to-long
term vision and to link these to public actions.
� Strengthening development partnership for Africa
o Progress by developing partners at policy level, Organisation for
Economic Co-operation and Development – Development
Assistance Committee (OECD-DAC) has been encouraging.
The World Bank is planning to focus on the institutional framework for urban
and rural transport in six countries in 2008 and to launch initiatives to support

-75-
three major regional transit corridors. Twenty percent of investments are
focused on rural transport.
One of the main components of the AAP is regional integration and the AAP
will continue to emphasise regional initiatives in investment and policy reform.
9.3.2.5 OECD-DAC (Organisation for Economic Co-oper ation and Development
– Development Assistance Committee)
Development challenges such as poverty, climate change, education and
health makes it imperative for donors and partners countries to work together.
Donors need to give their aid more predictably and efficiently.
There is definitely more of a joint enterprise for development, built around the
objectives set in the Millennium Declaration (Development Co-operation report
Volume 9, 2007). Most, but not all, DAC members have announced medium-
term commitments to increase ODA, at least to 2010, and there is a common
commitment to double ODA to Africa from 2004 to 2010.
Another significant indicator of donors’ intentions is their decision to contribute
to three key multilateral replenishments: the International Development
Association (IDA), the African Development Fund (AfDF) and the Global Fund
to fight AIDS, Tuberculosis and Malaria (GFATM). These decisions were taken
towards the end of 2007, and all involve three-year funding commitments.
The OECD’s Development Assistance Committee (DAC) is the key forum in
which the major bilateral donors work together to co-ordinate development co-
operation and to increase the effectiveness of their efforts to support
sustainable development. The DAC is one of the main committees of the
OECD, and has 23 members. The DAC, however, has three features which
distinguish it from other committees within the OECD Secretariat. First, it
meets more frequently than other OECD committees (about 15 times a year)
and the Chair is based at OECD headquarters in Paris. Second, the DAC has
the power to make binding recommendations in matters within its competence,
to countries on the Committee as well as to the Council (e.g. DAC
Recommendation on Untying ODA to the Least Developed Countries, 2001).

-76-
Third, the Chair issues an annual report on the efforts and policies of DAC
members. This report is the key annual reference document for statistics and
analyses on the latest trends in international aid.
The DAC holds an annual High Level Meeting and the participants are
ministers or heads of aid agencies. Once a year, a Senior Level Meeting is
also convened at the OECD to review the Committee’s work on current policy
issues. Ordinary DAC meetings are attended by Paris-based delegates of
DAC members and by officials from member capitals)
9.3.3 Regional Economic Communities (REC)
There are essentially 3 key RECs in SSA:
� The Southern African Development Community (SADC)
� Common Market for Eastern and Southern Africa (COMESA)
� The East African Community (EAC).
Figure 14 below shows membership countries for the RECs.
SADC Angola, Botswana, Lesotho, Mozambique, Namibia, South Africa,
DRC, Madagascar, Malawi, Mauritius, Swaziland, Zambia, Zimbabwe.
Tanzania
Burundi, Comoros , Djibouti , Egypt, Eritrea, Ethiopia, Libya, Rwanda, Seychelles, Sudan,
COMESA
Kenya, Uganda
EAC
Figure 14: Country membership for different RECs
The representation of certain countries in more than one of the RECs is an
interesting phenomenon and duplication and possible conflict could arise.
-77-
RECs under the African Union’s guidance are moving more towards
coordinating activities and programs.
9.3.3.1 Southern African Development Community (SAD C)
The Southern African Development Community (SADC) has been in existence
since 1980. It was formed as a loose alliance of nine majority-ruled States in
Southern Africa known as the Southern African Development Coordination
Conference (SADCC), with the main aim of coordinating development projects
in order to lessen economic dependence on the then apartheid South Africa.
In 1992 the organisation transformed from a Coordinating Conference into a
Development Community (SADC). The Member States are Angola, Botswana,
the Democratic Republic of Congo, Lesotho, Madagascar, Malawi, Mauritius,
Mozambique, Namibia, South Africa, Swaziland, United Republic of Tanzania,
Zambia and Zimbabwe.
The objectives of SADC are to:
� Achieve development and economic growth, alleviate poverty, enhance
the standard and quality of life of the people of Southern Africa and
support the socially disadvantaged through regional integration
� Evolve common political values, systems and institutions
� Promote and defend peace and security
� Promote self-sustaining development on the basis of collective self-
reliance, and the interdependence of Member States
� Achieve complementarity between national and regional strategies and
programs
� Promote and maximise productive employment and utilisation of
resources of the Region
� Achieve sustainable utilisation of natural resources and effective
protection of the environment

-78-
� Strengthen and consolidate the long-standing historical, social and
cultural affinities and links among the people of the Region.
SADC developed a Protocol on Transport, Communications and Meteorology
with the following underlying principles:
� Developing a Regional Transport Master Plan to meet the trade and
developmental requirements of the region, based on regional
consensus
� Packaging of infrastructure development projects identified by the
Master Plan to be market to the private sector through, among others,
Private and Public Participation (PPP) options
� Implementing corridor infrastructure development to ensure high
standard of road, rail and inland waterways linkages interconnecting
SADC Member States
� Undertaking transport and trade facilitation along with corridors to
ensure smooth passage of trucks and people with minimal delays at
border posts, through application of the one stop border post concept
and standardisation of customs procedures and documents
� Development of harmonised road transport multilateral agreements in
respect of licensing, road user charges, vehicle dimensions,
overloading enforcement, third party, control rules of fair competition
and bond guarantee schemes.
Transport is a key sector as it facilitates the deepening of regional integration
in SADC. The transport sector entails road transport, rail transport, ports,
maritime and inland waterways, as well as air transport. The main areas of
intervention in the transport sector include harmonisation of policies,
infrastructure development, capacity building; and transport and trade
facilitation.

-79-
The desired integrated transport objectives are based on the ability of Member
States to promote economically viable integrated transport service provision in
the region. This will be:
� Characterised by high performance standards and consistent levels of
efficiency and reliability of all individual component parts of the
transport chain
� On the basis of complementarity and co-operation between modes,
modal choice optimisation, seaport hinterland optimisation and with due
regard to modal advantages
� Bearing in mind the need to preserve the region's transportation
infrastructure
� By encouraging the development of multimodal service provision
� Compatible with responsible environmental management.
All the above will support the development of major regional development
corridors and facilitate travel between their territories.
Integrated Transport Policy
At the signing of the SADC protocol, Member States agreed to develop a
harmonised integrated transport policy, which includes:
� The establishment of infrastructure, logistical systems and institutional
frameworks
� The establishment of appropriate legal and financial frameworks
� The execution of research and technology transfer
� The development of effective communication networks.
All the inclusions mentioned above are to support intra- and inter- modal
synergy and optimal utilisation of modes.

-80-
When implementing the transport policy, Member States are to apply the
following principles:
� The right of freedom of transit for persons and goods
� The right of land-locked Member States to unimpeded access to and
from the sea
� The right of coastal Member States to unimpeded access to and from
land-locked Member States
� Equality of treatment of the nationals and passenger service providers
of Member States with regard to the provision, access and use of
infrastructure and immigration and clearance procedures
� The right of individual Member States to negotiate access and freedom
of transit rights consistent with the principles of this Protocol, while
recognising that individual needs of Member States may require
specific bilateral arrangements
� All modes of transport are allowed the necessary economic space to
operate in a self sustaining free market environment.
Most importantly, Member States shall have the right to take all measures
necessary to ensure that the application of the above principles does not
infringe their legitimate interests.
Supporting infrastructure
The SADC objective is to ensure broad based investment to develop,
preserve, and improve viable strategic transport infrastructure within an
investor-friendly environment generating adequate returns. For this reason, all
Member States are to:
� Co-operate in providing, operating and maintaining transport
infrastructure which supports the provision of integrated transport
services, considering that infrastructure should progressively be self
sustaining with funding based on a user pay principle.

-81-
� Create and maintain regulatory frameworks, investment regimes and
incentives which may facilitate the provision of such infrastructure by
the private and/or public sector.
� Promote the effective management of existing and future infrastructure
by both public and private sector and encourage:
o The provision of integrated multi-user ship-to-shore and shore-
based trans-shipment facilities
o Joint ventures by multinational groupings to develop commercial
facilities dedicated to the handling of regional trade
o The development of strategically located and commercially
viable dry ports where appropriate
o The provision of integrated passenger transfer facilities
o The improvement and integration of frontier facilities, including
the provision of common user facilities at frontiers
o The provision of receiving, off-loading, storage and final
distribution facilities at destination
o The integration of infrastructure development along identified
regional development corridors.
Supporting logistical systems
In order to eliminate or reduce hindrances and impediments to the movement
of persons, goods and services, Member States are to co-operate in
incrementally promoting the development of logistical systems by public and
private sector bodies to support effective inter modal transport operations
characterised by:
� Inter modal synergy
� Intra modal co-operation, especially between established service
providers and small, medium and micro enterprises
� Optimal use of unitised loading units such as freight containers and
pallets to transport cargoes.

-82-
The logistical systems referred to above, are to enhance the efficiency of
specific regional development corridors in:
� The transshipment of cargoes
� The transfer of persons between modes
� The processing of cargoes and persons at transshipment points,
frontiers and destination points
� The planning and operation of transport equipment and infrastructure.
Based on the above, Member States in particular focus on:
� The harmonisation of domestic legislation, including provisions dealing
with statutory liability of service providers;
� The development of simplified and harmonised documentation which
supports the movement of cargoes along the length of the logistical
chain, including the use of a harmonised nomenclature
� The implementation of state-of-the-art rapid communication, information
and data processing and exchange facilities to support corridor
operations and supplying real-time logistical and other information to
corridor users
� The encouraging of containerisation, including the balancing of supply
and demand
� The improvement of rail transit times
� The enhancement of performance of rail and freight container
information tracking systems
� The limitation of dwell times in ports and dry ports
� The implementation of measures to enhance the security of cargoes
and protect the life and property of passengers
� The development and implementation of quality controls including
safety standards applicable to all modal transport operators.

-83-
Member States are to encourage the adoption of simplified measures falling
outside the sectors addressed in this Protocol which may also contribute
towards the integrated transport objectives. Such measures may include:
� Clearance and pre-clearance procedures at borders, ports and dry
ports for goods and pre-clearance of freight containers
� Financial requirements for import, export and transit movement of
goods and road vehicles
� Clearance procedures for SADC nationals, including immigration and
public health measures.
Member States shall promote the necessary liaison between their various
ministries and departments to execute the provisions of the transport protocol.
Members are responsible for implementing the provisions of this protocol.
Progress and planned strategies on infrastructure initiatives are:
� Liberalise regional transport markets by 2008
� Harmonise transport rules, standards and policies by 2008
� Recovery of all costs for maintenance of infrastructure by 2008 and full
infrastructure investment costs by 2013
� Removal of avoidable hindrances and impediments to the cross border
movement of persons, goods and services by 2015.
9.3.3.2 Common Market for Eastern and Southern Afri ca (COMESA)
COMESA replaced the former Preferential Trade Area (PTA) in December
1994. COMESA’s aspiration is to become a fully integrated internationally
competitive regional economic community; a community within which there is
economic prosperity demonstrated by high living standards of its people
coupled with political and social stability; and a community within which goods,
services, capital and labour move freely across national geographical borders.

-84-
COMESA’s member states are: Burundi, Comoros, D.R.Congo, Djibouti,
Egypt, Eritrea, Ethiopia, Kenya, Libya, Madagascar, Malawi, Mauritius,
Rwanda, Seychelles, Sudan, Swaziland, Uganda, Zambia and Zimbabwe.
COMESA’s strategy for infrastructure development is three pronged:
� Policy and regulatory harmonisation
� Facilitation
o COMESA has adopted and implemented trade and transit
facilitation instruments with the main objective of reducing
transport costs.
� Development of physical regional infrastructure.
The infrastructure strategy is being done in collaboration with other RECs, AU
(and through NEPAD), African Development Bank, United Nations Economic
Commission for Africa (UNECA) and the donor community.
COMESA’s goals for the next four years are:
o Goal 1: COMESA Customs Union is in place in 2008
o Goal 2: Negotiating Capacities in Multilateral Trade are strengthened
o Goal 3: Capacities to develop and adopt harmonised standards and
enhance sanitary and phytosanitary standards
o Goal 4: Capacity to produce and analyse statistical data at national
statistical bureaux are enhanced
o Goal 5: Regional policies and programs implemented by regional
organisations are harmonised (SADC, IGAD, EAC, and IOC)
o Goal 6: Macro economic convergence is attained
o Goal 7: Costs of Transportation are reduced through Trade and Transit
Transport Facilitation instruments
o Goal 8: Gender equality and equity is mainstreamed at all levels of
regional integration and cooperation

-85-
o Goal 9: Institutional capacities to respond to emerging global and
regional issues are strengthened.
COMESA is currently developing a Transport and Communications
Infrastructure master plan. The master plan includes the priorities of country
strategies which have a regional implication and will catalogue the region’s
main transport routes. It will cover all modes of transport (road, rail, air and
water). In addition the master plan will examine future plans such as
concessioning of the railways, funding of the infrastructure such as fuel levies
and road user charges and the communications needs of the region. The
master plan also identifies transport and communications corridors which are a
priority for the integration and economic development of the region.
(COMESA, 2007). COMESA believes that the solution for rail transportation in
Africa is regional integration. COMESA countries have also realised the
importance of strengthening Africa-Asian relations in order to facilitate
development programs and activities.
9.3.3.3 East African Community (EAC)
The East African Community (EAC) was established in July 2000 by Kenya,
Uganda and Tanzania. Rwanda and Burundi became full members in July
2007.
The EAC’s aim is to address Infrastructure Development and Supportive
Services by establishing:
� Roads
o Harmonising traffic laws, including regulations and highway
codes, adoption of common definition of classes of roads and
route numbering system, vehicle dimensions, axle-load limits,
and road transit charges and provision of laws concerning
licensing, equipment, marking and registration numbers for trade
transport within the community
o Completion of rehabilitation/construction of prioritised regional
roads

-86-
o Ratification of road transport Agreement
o Road Safety improvement.
� Railways
o Undertake a feasibility Study on Tanga-Arusha-Musoma-
Portbell/Jinja Railway line
o Undertake a study on status of Railway networks
o Establish a Joint Railway Secretariat
o Carry through an ongoing railways concession process
(Expected completion July 2007- not confirmed)
o Develop an EAC Railways Master Plan (Expected completion
December 2007 - not confirmed).
� Inland waterways
o Ratification of Inland waterways Transport Agreement
o Establishment of common maritime transport policy for EAC
with focus on Lake Victoria
o Strengthen the Dar-es-Salaam Maritime Institute to serve as a
regional training institute (EAC Development Strategy 2006-
2010).
Southern African Development Community (SADC), Common Market for
Eastern and Southern Africa (COMESA) and the East African Community
(EAC) has agreed to jointly implement transport programs and instruments to
ensure harmonised regulations and seamless service across the three sub-
regions (Makumbe, 2007).
9.3.4 Beginning of REC cooperation and integration
The Regional Economic Communities (RECs) of COMESA, SADC and EAC
have long recognised the importance of improving trade facilitation (amongst
other issues) in the context of deepening regional integration and in reducing

-87-
the costs of cross-border transactions and so improving economic livelihoods.
All RECs have supported infrastructural development programs.
COMESA, SADC and EAC are moving into coordinating more activities and
programs between the RECs and member countries specifically through the
establishment of the COMESA-EAC-SADC task force.
9.3.4.1 COMESA-EAC-SADC task force
COMESA-EAC-SADC task force focuses on developing a joint multimodal
transport program along one or more corridors which would have both
hardware and software components. The advantages of such a program are
(COMESA-EAC-SADC Task Force, 2007):
� Providing a focus for co-operation for COMESA, EAC and SADC in
terms of being a vehicle through which the RECs could develop and
pilot or implement common systems
� Being a mechanism through which trade could be mainstreamed into
economic policy at a regional level
� Creating an apex through which co-ordination on existing initiatives,
required actions and their appropriate sequencing could take place
� Being a vehicle through with a regional Aid for Trade mechanism could
be put into operation
� Linking a number of Enhanced Integrated Framework Action Matrices
� Being a mechanism through which donor coordination could be
improved, in line with the Paris Declaration on Aid Effectiveness
� Speeding up the implementation of the NEPAD STAP and MLTSF.
The task force believes that targeted and well considered investment in
upgrading and operational improvements of the sub-region’s corridor transport
infrastructure could bring costs down and optimise expenditure and
investment. Figure 15 below, summarises the transport infrastructure issues in
the Eastern and Southern region as identified by the task force.

-88-
The task force proposed a pilot project to focus on the North-South and Dar-
es-Salaam Corridors to ensure that trade facilitation instruments are fully
developed and rolled out along these corridors and to sequence infrastructure
improvements with regulatory improvements and improved trade facilitation. If
the pilot delivers the planned outcome it can be replicated in other corridors.
Source: COMESA-EAC-SADC Task Force; November 2007
Figure 15: Transport Infrastructure in the Eastern and Southern region as identified by the Task Force.
9.3.5 Private and Publc Participation (PPP)
Governments are looking to public-private partnerships (PPPs) to radically
improve infrastructure networks in their countries and enhance service delivery
to the people. The hope is that this development finance model — where the
state shares risk and responsibility with private firms but ultimately retains

-89-
control of assets — will improve services, while avoiding some of the pitfalls of
privatisation: unemployment, higher prices and corruption.
In theory, PPPs may have the potential to solve SSA’s profound infrastructure
and service backlogs, but the process is complex, and Governments should
not expect PPP's to be a ‘magic bullet’.
PPPs potentially bring the efficiency of business to public service delivery and
avoid the politically contentious aspects of full privatisation. PPPs allow
Governments to retain ownership while contracting the private sector to
perform a specific function such as building, maintaining and operating
infrastructure like roads and ports, or providing basic services like water and
electricity. Both sides stand to benefit from the contractual agreement.
Government earns revenue by leasing state-owned assets or alternatively
pays the private sector for improved infrastructure and better service delivery.
Often the private sector can do the job more efficiently, which can lower prices
and improve rollout. The private operator gets reimbursed either by
Government or consumers for doing its work, at a profit.
Some of the negatives of PPP’s are:
� The private sector is not always more efficient and the service provision
is often more expensive to the consumer
� Big Government contracts are complex and demanding and prone to
abuse by unscrupulous individuals, firms or politicians, unless
controlled by disciplined, highly transparent procedures.
The PPPs that have been most successful in Africa have been characterised
by thorough planning, good communication, strong commitment from parties
and effective monitoring, regulation and enforcement by Government. PPP's
are complex, demanding and time-consuming but under the right conditions,
and in the right sectors, they can offer significant benefits to Governments, the
private sector and consumers. PPPs have been generally more successful in
sectors such as ports, telecommunications, and transport and eco-tourism
projects than power and water. But with the correct regulatory framework and
strong political commitment, they do offer value for money to Governments

-90-
and good opportunities for investors. A recurring theme is that for PPPs to be
successful, Governments need to undertake thorough feasibility studies that
address the issues of affordability, value for money and risk transfer.
Most of the successful PPP projects [in Africa] are the result of very strong
political commitment. That has been the underlying factor of success of all
these projects, especially in countries where there has been an absence of
regulatory and legal frameworks to govern these projects. The private sector
has needed some guarantee or commitment from a senior political body to
ensure that they are going to get a good return on their investment. Examples
of PPPs in Africa that have benefited from having a political champion include
the N4 toll road, which was promoted by the then Mpumalanga premier,
Mathews Phosa; water and electricity provision in Gabon; the concession for
Maputo port and the container terminals at Dar-es-Salaam port.
“Governments should not slow down in their efforts to utilise various forms of
private sector participation in the development of infrastructure and the
improvement of service delivery just because they don't know all the answers.
Instead they should seek to learn from their mistakes and share their lessons
learnt with the intention of improving on their performance. This is the only way
that Governments who are really constrained in terms of their fiscus, will be
able to effectively and innovatively continue to provide service to the public.”
(Farlam Peter, p66)
9.3.6 Summary of the funding and regulatory framewo rk within SSA
For the first time in decades the AU/NEPAD and regional organisations
(RECs) have provided Africa with political and economic roadmaps and a
vision for the future. Global development and donor organisations support
these actions and objectives as set out by AU/NEPAD and aligned actions to
enforce. Africa’s development is now at the top of the international political
agenda and there is a broad international consensus on the basic action that
needs to be taken. There is now a unique window of opportunity to give Africa
a decisive push towards sustainable development.

-91-
Table15 below summarises details on the different role players in SSA and their objectives.
Role
player
Goal /objective Alignment/
Strategy
General comments
Dev
elop
men
t an
d fu
ndin
g ag
enci
es,
orga
nisa
tions
an
d
dono
rs
United
Nations
Focus on MDGs: Poverty, education,
gender equality, child mortality, HIV/AIDS,
environmental sustainability and global
partnerships for development.
Global vision and
focus
� The MDGs created the beginning of an
integrated approach to Africa
� Challenges: mobilising financial support,
political will, re-engaging Governments, re-
orientating development priorities and
policies; and private sector involvement.
Paris
declaration
� Aims to improve quality of aid and
impact on development
� Focuses on ownership, alignment,
harmonisation, management of results
and mutual accountability.
Global alignment.
All major role
players and
countries support
the declaration

-92-
African
Union
Focus on: unity and solidarity, political and
socio- economic integration, international
cooperation, peace, security, stability,
human rights, development, education and
coordination of policies between RECs
NEPAD programme
to achieve goals
Integration of the different RECs to one
African unity
World Bank Facilitate the assistance to African
countries globally
� MDGs alignment
� Paris declaration
� AU/NEPAD
alignment
� African action
Plan to ensure
implementation
Facilitating role
European
Union
� Aims to make aid effective and
coordinate donor activity
� Focus on equality, partnership and
ownership.
� MDGs alignment
� AU/NEPAD
alignment
� View Africa as one entity and focus
program accordingly
� Focus regional integration

-93-
Dev
elop
men
t and
fund
ing
agen
cies
, org
anis
atio
ns a
nd d
onor
s
USAID Focus on increased trade with Africa,
HIV/AID, food/poverty and strengthening
the democracy
� MDGs alignment
� AU/NEPAD
alignment
� OECD-DAC
alignment
� World Bank
� Multinational
lending agencies
ADB � Dedicated to combat poverty and
improving living conditions
� Focus on poverty, agriculture, rural
development, human capital, education,
health infrastructure development and
regional integration
� MDGs alignment
� AU/NEPAD
alignment
� ICA alignment
� Support and focus on regional and
economic integration
� More emphasis on stronger project
implementation

-94-
Initi
ativ
es
NEPAD � Monitor implementation within the
African union framework
� Focus on regional integration, good
governance and PPP
� MDGs alignment
� Paris declaration
� AU
� ADB
� EU
Priority is the regional integration to overcome
the lack of economies of scale
SSATP Facilitate policy development and capacity
building in transport sector in SSA
� Initiated by World
Bank and
UNECA
� MDGs alignment
� Paris declaration
� AU/NEPAD
alignment
� REC alignment
� RECs share ownership
� Absence of South Africa a concern
AAP Assist African countries to attract additional
private and public resources and support
for: accelerated economic growth, building
of capable states, achieve and focus on
� MDGs alignment
� Paris declaration
� AU/NEPAD
alignment
� Main focus regional integration and
investment and policy reforms
� Strong road focus
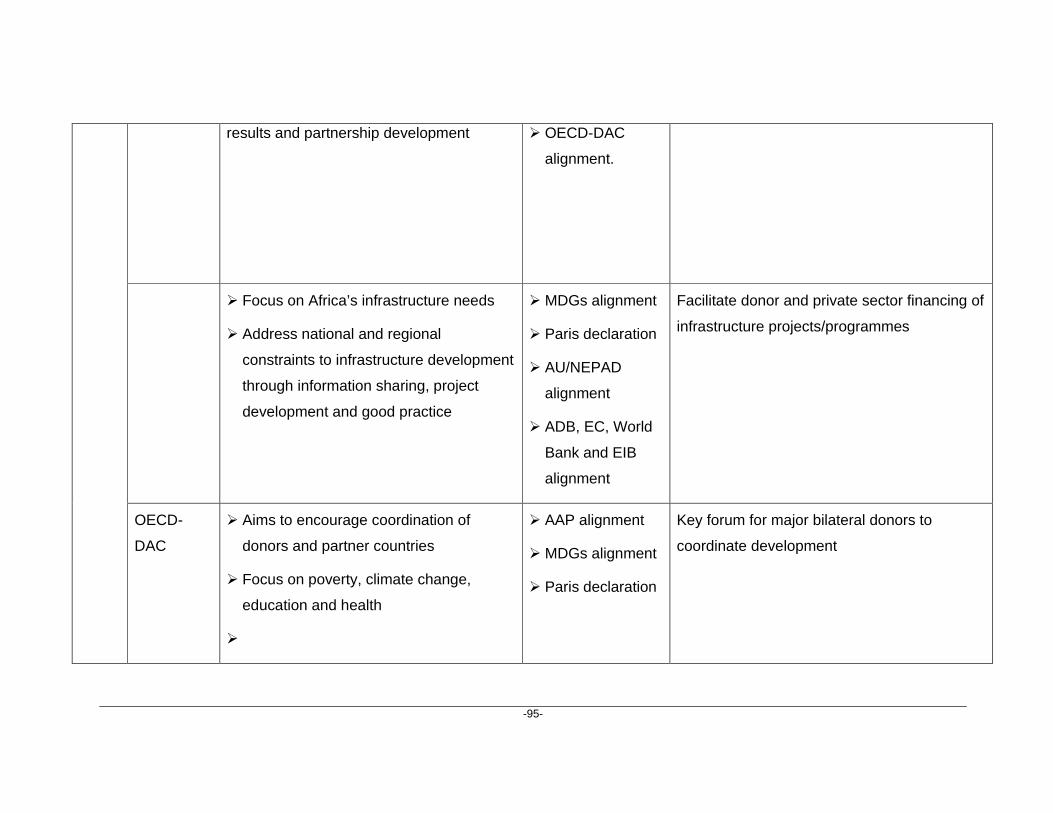
-95-
results and partnership development � OECD-DAC
alignment.
� Focus on Africa’s infrastructure needs
� Address national and regional
constraints to infrastructure development
through information sharing, project
development and good practice
� MDGs alignment
� Paris declaration
� AU/NEPAD
alignment
� ADB, EC, World
Bank and EIB
alignment
Facilitate donor and private sector financing of
infrastructure projects/programmes
OECD-
DAC
� Aims to encourage coordination of
donors and partner countries
� Focus on poverty, climate change,
education and health
�
� AAP alignment
� MDGs alignment
� Paris declaration
Key forum for major bilateral donors to
coordinate development

-96-
Table 15: Different role players in SSA and their objectives
Reg
iona
l eco
nom
ic C
omm
uniti
es
SADC Develop economic growth, reduce the
distort, ensure quality of life for people and
regional integration
� MDGs alignment
� AU/NEPAD
alignment
Committed to the COMESA-EAC-SADC Task
Force to deepen regional integration
COMESA � Believes answer to railway transportation
in Africa is regional integration
� Currently developing a transport master
plan
� Focus for infrastructure development is
on policy and regulatory harmonisation,
facilitation and development of physical
and regional infrastructure
� MDGs alignment
� AU/NEPAD
alignment
� ADB, UNECA,
EU alignment
� Committed to the COMESA-EAC-SADC
Task Force to deepen regional integration
� Strongest statement of all RECs re regional
integration an merger into one entity = AU
EAC Regional integration a major focus starting
the process with inclusion of Rwanda and
Burundi
� MDGs alignment
� AU/NEPAD
alignment
Committed to the COMESA-EAC-SADC Task
Force to deepen regional integration

-97-
It is evident from the above that there is global agreement and understanding
for the need of infrastructure integration specifically transport integration in
Africa. Most of the organisations and agencies are focussing on regional
integration as they recognise that it is important to harmonise, rationalise and
avoid duplication of key aspects. Most regulations and policies discussed in
this section are intended to spur economic growth. Some organisations,
however are still too focussed on specific regional integration and do not view
Africa as one entity. The future success of Africa will be the ability to
coordinate actions and programs to address infrastructure developments as a
holistic Africa. The World Bank and African Unity’s role is very important to
coordinate and ensure achievement of this.
10 Concessions
Since the early 1990s, SSA Governments have been privatising State owned
and operated infrastructure. The decision was spurred by the need to respond
to international donors’ pressures and recognition of the fact that the
Governments do not have necessary fiscal resources to support infrastructure
operations alone. Various forms of public-private partnerships have been
tried in airports, seaports and railways, more rarely for roads (Pozzo di Borgo
et al, 2006).
A number of countries in the region have conducted studies to determine
options for privatisation taking into account their own needs. Furthermore
investors’ perception of high risk renders full privatisation impractical, so most
private participation in transport infrastructure has taken the form of leases or
concessions (Mlenga, 2003).
Two models have generally been recommended as workable in the region:
� The Vertically Integrated Concession (VIC) where the Government
continues to own the infrastructure and simply leases it to the private
investor to operate. A prime example of this is Transgabonais Concession
(Gabon, 1999)

-98-
� The Joint Venture Concession (JVC) where the Government and the
private investor jointly own shares in the company and run the entity
together. An example is the Camrail concession (Cameroon, 1999).
Fixed infrastructure traditionally requires large scale investment that private
investors more than often fail to deliver on their own. The upgrading and
extension of networks have continued to be largely funded by multilateral and
bilateral loans on concessional terms.
An important facilitator in some cases has been the insurance instruments
developed by institutions such as the U.S. Overseas Private Investment
Corporation (OPIC) and the Multilateral Investment Guarantee Agency (MIGA)
and by the World Bank’s Partial Risk Guarantee offerings over the past 15
years (Goldstein and Kauffmann, 2006).
Not all concessions in Sub-Sahara Africa are profitable. Key reasons why
most concessions are failing are (World Bank, Report No. 32659, 2005):
� Some concessions are seen as a way of getting rid of capital burdens
instead of as a way of getting a credible party to offer better service to
an already working infrastructure item
� Involved parties not finding the right balance in the design of a
concession bid between Government interests and incentives to private
operators to venture into a difficult business
� Concessioning of railways or ports that are :
o Likely to incur losses because they are hugely overstaffed,
require major investment in fixed assets and equipment to attain
a satisfactory operating condition
o Inadequately compensated for uneconomic services.
� Wars and natural disasters have also led to the cancellation of several
railway concessions.

-99-
Two working rail concession examples are the Beitbridge Railway (BBR)
concession and the Cameroon concession (Camrail).
Camrail is an important concession, not least because it is the only one of
those concessioned prior to 2000 that has not faced major disruptions, either
from war, natural causes or by termination. Its financial performance, whilst
positive, has by no means achieved the margins that were anticipated in the
financial projections at concessioning and, given the substantial investment
program it has undertaken, its financial sustainability must be due in large part
to the low-cost financing terms for loans from the development agencies and
banks (Bullock, 2005).
11 Role of SA Government
South Africa’s (SA) share of railways is 35 percent in Africa and 42 percent in
SSA. South Africa is also dominant in the number of electrical locomotives
and wagons used in the continent. The amount of rail freight tonnes moved
also occurs mostly in the South African system, with about 71 percent of the
African total and 91 percent of Sub-Saharan traffic (Radebe J, Minister of
Transport, SA, 2005).
Although South Africa is dominating the transport infrastructure in Africa the
transport cost of doing business in Southern Africa are generally higher than
elsewhere in the world. The major cause of this problem is density. According
to research work by Robert G. Harris (Economies of Traffic Density in the Rail
Freight Industry, The Bell Journal of Economics, 1977) a direct correlation
between cost and density exists which leaves poorer countries with smaller
freight loads at an obvious disadvantage (Figure 16).

-100-
Source: Economies of Traffic Density in the Rail Freight Industry, The Bell
Journal of Economics, 1977)
Figure 16: Harris’ density curve
After many years Harris’ work is still proved valid and the regression curve that
he identified shows the correlation between density on the x axis and cost on
the y axis. If the curve is applied to Southern African railways an interesting
picture emerges (Figure 17).

-101-
Excluding South Africa
* Size portrays total potential tons in market
Figure 17: Harris’ density curve applied to South Africa and a combination of other railways in the report
South Africa’s envious position in this analysis is obvious, although if the two
export lines are excluded from the analysis, less positive results (Figure 18)
are evident.
Excluding South Africa
* Size portrays total potential tons in market
Excluding South Africa Density = 0.5
Excluding South Africa Potential Density = 2.6
Export Lines Density = 46.3
General Freight Business Density = 2.0
General Freight Business Potential Density = 7.1
Figure 18: Harris’ density curve with GFB separately indicated

-102-
The major advantage that could be gained for Africa would be to densify rail
systems and Figure 19 indicates that an obvious potential do exist.
AngolaDRCKenyaTanzaniaZambia
Figure 19: Harris’ density curve for countries in report only
This could result in advantages for other African countries as they could gain
better access to markets at lower costs. Advantages for South Africa would
be an extension of the domestic system, more density on own lines and
compliance with overarching economic communities objectives in terms of the
MDGs.
In order to do this South Africa should be more actively involved to ensure that
they play a role in the reform and integration of the transport system in Africa.
South African Transport can assist Sub-Saharan Africa and Africa in various
areas i.e. transport human resource development and training, operations
procedures, technological development and assistance and in the safety
regulatory environment, etc. This overarching approach is obviously in the
ambit of Government and Government support for initiatives and active
involvement of the agencies of foreign affairs, trade and industry ministries will
be helpful and productive. As African countries, donors, funding organisations
with the increasing involvement of private investors are focusing on

-103-
concessioning and public-private ownership of infrastructure networks the
concessions are always, initially, awarded by the respective issuing
Governments. South Africa’s Government support will therefore always be
useful in these processes.
For the next decade the international focus will be on developing an integrated
transport network in Africa – more specifically Sub-Saharan Africa and
Governments play a major role in this. The SA Government therefore - more
specifically the Transport Ministry with other Africa Transport Ministries - have
a vital role to play to ensure that South Africa is involved in the solution design
of the African Infrastructure system.
Any company, however, that wishes to get involved in SSA in the form of
tendering for concessions or projects does not need the SA Governments’
permission or involvement in a statutory role in order to comply with local
(South African) regulations. This will only be necessary, for instance, if a
concession is granted that will cause open access to South Africa’s system
from a neighbouring country, in which case South Africa’s rail safety and
economic regulations will be applicable.
Any company therefore needs to acknowledge that:
� Although statutory requirements do not exist, it could be useful to
ensure good relations, cooperation and coordination with Government
� Ownership of the overarching transport strategy in South Africa is with
the Department of Transport (DoT), but the degree to which an active
role should be played is not certain. The National Freight Logistics
Strategy (NFLS) is not always shared and agreed on (in fact some
transport institutions/companies have shown a preference for Moving
South Africa (MSA)). The NFLS and MSA do not include strategies on
cross border issues. This means that consultation with the DoT is only
necessary to the same level as consultation on domestic transport
strategy is concerned.

-104-
If a positive business case for more involvement is proven, other international
infrastructure role players will take up the challenge and this could hold some
risk for the South African Freight Transport Industry and South Africa as a
whole (i.e. existing South African freight traffic could be re-directed via these
new networks and corridors (excluding SA) and negatively influence the
economic situation in South Africa). From this perspective, the South African
Government has a strategic role to play – it needs to expand its involvement in
funding development organisations. The Government and the South African
Freight Transport Industry should work together as a strategic alliance to
expand its role in SSA transport and logistics.
Information obtained from the respondents interviewed in this research project
highlights the following practical considerations:
� Local Government consulate and ambassadorial offices often prefer to
be informed about negotiations. However, in the past, support has been
proved to be scant and often counter-productive. These offices are not
commercial, but rather politically orientated
� Normal South African foreign investment regulations (such as the
notification to the Registrar of companies) are obligatory if foreign
shareholding is taken up - and the Reserve Bank when capital is
removed from South Africa
� The Department of Finance should be notified when Government is the
shareholder, as is the case for example withTransnet
� Consideration should be given to regulatory mismatches between
Anglophonic, Francophonic and ex Portuguese colonies in terms of
legal frameworks, i.e. Roman-Dutch law and Latin law.
12 Ideal solution design
The South African Freight Transport Industry by it self cannot address the
region’s interrelated strategic challenges. However, once it understands a
potential solution to the region’s infrastructure and logistics challenges, it can
-105-
influence the overarching solution design and also actively participate in
specific projects.
12.1 The role of the South African Freight Transpor t Industry in the solution
design
The proposed solution to infrastructure problems might be a grand design that
the South African Freight Transport Industry cannot own - but can influence.
Any South African Freight Transport Company considering involvement in
SSA should in its approach take the following into account:
� Regional and international trade are central to economic growth and
development
� Transport is at the heart of regional and market integration
� Efficient infrastructure network attracts foreign direct investments and
technology as well as generates new investments in other sectors
� African countries, individually, are too small to generate economies of
scale found in larger markets
� Weak infrastructure linkages negate Africa to low level of
competitiveness in the global market
� Regional infrastructure leads to larger markets capable of attracting
more private sector investments.
Facilitating increased trade between SSA countries and the rest of the world is
essential for SSA’s future economic well-being, and it is an objective that
deserves serious attention from Governments, sub-regional organisations, the
African Union and NEPAD. In improving the continent’s ability to trade,
Governments and sub-regional organisations need to address other persistent
constraints, most particularly the poor state of the continent’s transport
infrastructure and the laborious customs and payments procedures prevailing
in many countries. These factors result in the very high costs of overland

-106-
transport for exports and imports, particularly for Africa’s 15 landlocked
countries. These hindrances severely constrain SSA’s trade growth, and have
become a major disincentive to the kinds of private investment that are
essential to keep the regional economies on the path of closer integration into
the world economy.
Most trade facilitation initiatives undertaken so far in Africa have not shown
much success. Generally, this has been attributed to factors such as non-
compliance with the agreements, poor programme implementation, lack of
coordination among and between countries, lack of cooperation among
relevant agencies within countries, inadequate skilled labour and, most
importantly, the absence of a multi-sectoral approach to trade facilitation.
Africa is still faced with very high transaction costs resulting from the
blockages and delays prevalent in many countries. This is sometimes
aggravated by the difficulty of meeting increasingly stringent international
trade standards.
South Africa is in a good position to contribute to the solution for all these
problems.
12.2 Opportunities for viable investments in SSA fo r companies in the South
African Freight Transport Industry
All SSA regions are currently looking at more efficient provision of
infrastructure:
� Improved telecommunications, surface transport, and energy
infrastructure
� Improvement includes far more than just the construction of physical
networks such as roads, bridges, railways and microwave towers
� Physical links are critical, but so are the policies, laws, regulations,
standards, and agreements that underpin them, providing the basis for
their maintenance and efficient use.

-107-
The strategy of any South African Freight Tansport company interested in
investing in SSA should seek to contribute (through the South African
Department of Transport and the South African Government) to improving
infrastructure efficiency through policy, legal and regulatory reform with the
ultimate aim of enhancing prospects for economic growth in the region.
UN and NEPAD are encouraging PPP (public-private partnerships)
participation to help SSA countries to harmonise their policies and practices in
support of regional cooperation.
There are various opportunities in SSA for many South African Freight
transport players / companies to extend their business and footprint in the
SSA market. What is however evident from the research is how African
Governments are keen to relieve themselves of heavy expenditure on
railways, which historically represented a drain on national budgets.
NEPAD‘s hope is that the private sector can contribute to build infrastructure,
plug the funding gap and reverse the flow of public money towards railway
operations. NEPAD has prioritised providing institutional support for the
concessioning of railways. As Transnet is the largest railroad and heavy
hauler in Southern Africa (80% of Africa’s total) and connects the South
African ports (also managed by Transnet) with the rest of South Africa and
already connects with networks in SSA, Transnet is a excellent pratical
example to illustrate possible involvement in the transport industry in SSA and
are therefore used as a case study in this study.
13 Case study: Transnet involvement options in SSA
A process to develop a transport Master Plan in Africa has recently
commenced. This process is an initiative of the Bureau of the Conference of
African Transport ministers that met in April 2007 in Algiers and signed a

-108-
Memorandum of Understanding with the International Union of Railways (UIC).
This agreement is within the framework of the continental integrated transport
Master Plan of the African Union. The proposed design features South Africa
as a pivotal point even though many of the new corridors that are considered
to circumvent the country Transnet can collaborate with multilateral and
bilateral agencies and organisations; and RECs to formulate regional transport
policies. Transnet’s relative advantages are:
� Its knowledge and experience of infrastructure-related issues
� Its insight into regional regulations and transport related factors
� Its capacity to pool information and to mount projects on the basis of
regional studies
� Its capacity to insert a corridor project in a broad country policy
framework
� Its influence on adjustment policies through its technical assistance
operations.
A possible Africa strategy for Transnet is set out below.
� Firstly, to actively get involved in the developments of the ports of
Nacala and Lobito, and in so doing establish an important presence in a
potentially significant East-West Sub-Saharan African transport
corridor. The rationale for the strategy is:
o To circumvent the cross-border policy issues
o To actively participate in the exports of commodities from
landlocked central Africa
o To influence the development of these potentially super ports
that could take away economic activity from South African ports.
� Secondly, expanding Transnet’s rail capability northwards into Africa. A
key element of this strategy is the requirement to create a more
southerly East-West corridor linking the ports of Walvis Bay and
Maputo. The rationale for this strategy is:

-109-
o To architect and control inland rail network design
o To exploit market opportunities in central Africa where roads are
under developed and over used. Railway corridors can therefore
be densified to become economically viable
� Thirdly, to develop a long-term plan to integrate the two East-West
corridors with the North-South corridor. This approach is anchored in
the establishment of international port nodes (i.e. Lobito, Nacala, Walvis
Bay and Maputo) and inland African rail nodes (Bulawayo, Livingston,
Kabwe and Kapiri Mposhi).
Key assumptions for the effectiveness of these strategies are as follows:
� Firstly, to improve Transnet’s internal operational effectiveness and
efficiency in order to be leveraged to countries external to South
Africa
� Secondly, Transnet should participate and influence the African
Transport Master Plan initiative.
It is also important for Transnet to influence the alignment of the various
RECs in Africa and to bring this in line with donor objectives.

-110-
Source: Relogs regional logistics
Figure 20: Southern Africa railway network
The recommended next steps in the development of a strategy are as follows:
� Conduct a pre-feasibility study for Transnet’s participation in the
development of the ports of Nacala and Lobito
� Assessment of missing links in the rail network system to support the
above strategy (e.g. Walvis Bay, Nacala to Lobito)
� Identify specific regulatory issues as they relate to the proposed plan.
A logical point of departure for Transnet is to leverage its core competencies
into new opportunities in the region. These include port developments, corridor
network design and bulk long haul. The key entry strategy is possibly the
development of physical infrastructure in the ports of Lobito and Nacala, the
network design between the ports and the physical transportation through this
corridor.

-111-
13.1 Matching of potential opportunities in SSA and Transnet’s core
competencies
Development assistance is necessary if Africa is going to overcome extreme
poverty. However, this alone will not solve the problem. Africa must have a
combination of targeted and well-structured development assistance, excellent
investment, sound trade policy and strong leadership to put poor countries on
the path to sustainable growth. Business in SSA needs healthy, educated
workers, banking and finance systems that work, legal systems to enforce
contracts and infrastructure. All this takes money and expertise, which
Transnet can provide.
SSA economies are growing, albeit from a low base. This growth is primarily
fuelled by the export of raw materials to the developed and developing world.
The growth is impeded by the lack of infrastructure which creates an
opportunity for Transnet.
13.1.1 Transnet’s core competencies
The company is recognised as a dominant player in the southern African
transport infrastructure. Its activities are not restricted to southern Africa but
extend beyond its borders into Africa and the rest of the world.
Transnet Limited consists of eight main divisions, a number of subsidiaries,
and their related businesses:
� Transnet National Ports Authority (NPA)
o The custodian of the country’s primary trading hubs, managing
the most vital conduits of the country’s imports and exports.
Eight of the country’s major seaports are controlled and
managed by the NPA namely; Richards Bay, Durban, Saldanha,
Cape Town, Port Elizabeth, east London, Mossel Bay and
Ngqura (Coega) in the Eastern Cape.

-112-
� Transnet Port Terminals
o Handles cargoes from six largest ports in South Africa but
implements logistics management solutions for its container,
bulk, break-bulk (multi-purpose) and car terminal operations.
� Transnet Rail Engineering
o Comprises of eight product-focused business units which provide
services, ranging from refurbishment, conversion and upgrades,
to the manufacturing of rail related rolling stock.
� Transnet Pipelines
o The custodian of the country’s strategic pipeline assets, is
currently servicing two key industries (fuel and gas) by
transporting petroleum and gas products over varying distances.
� Transnet Freight Rail
o The largest division of Transnet. TFR bases its core competency
on the transportation of freight, containers and mainline
passengers on rail.
Transnet handles 495 million tons (mt) of freight per year:
� Transnet Freight Rail (TFR): 181 mt
� Transnet Port Terminals (TPT): 103 mt
� Transnet National Ports Authority (TNPA): 211 mt.
Note: The stated volumes include conversion factors of 11.3mt per containers
and 1.5 tons per vehicle.
13.1.2 Transnet’s strengths meeting the SSA opportu nities
The table below maps Transnet’s strengths against opportunities that are
open to investors in SSA.

-113-
Table 16: Transnet strengths vs. SSA opportunities
Opportunity Transnet’s strength
Rehabilitation of roads, rail
networks, and ports (including
container terminals)
Transnet has:
� Very efficient dry bulk ports i.e. Saldanha and
Richards Bay
� The best rail network in Africa and the best bulk
long haul rail lines in the world
Operational capabilities Transnet has the know-how through current and
completed projects
Development of transport
infrastructure
They have the operational know-how through
current and completed projects
Investment in transport
infrastructure
Transnet has the know-how on structuring financing
for infrastructure
Maintenance and preservation of
infrastructure
Transnet has developed methods on how to
prioritise maintenance in order to maximise volume
throughput
Network design Transnet has extensive experience in corridor
development
Market development Transnet has experience in opportunity
identification and integrated solutions development
Source: Compiled by author
13.2 Transnet’s participation
The rationale for a Transnet’s proposed SSA strategy is as follows:
• The strategic role played by ports in each country’s transport
network (in many cases, a single port handles the majority if not all
of the country’s international exports/imports)

-114-
• The importance of the hard currency business generated by port
operations
• The perceived profitability of ports
• The volume growth of ports in SSA (unlike railway activities before
privatisation)
• The relatively limited needs of ports for significant infrastructure
investments.
The key entry strategy for Transnet is to participate in the rehabilitation of the
ports of Lobito and Nacala. When considering the two ports Transnet must be
mindful of the activities at the Namibian ports which in some instances have
the SADC support.
Source: Relogs regional logistics
Figure 21: Railway network of Southern Africa
Commonly
known as Lobito
port
-115-
The Nacala port (Mozambique) and Lobito port (Angola) present investment /
participation opportunities for Transnet.
13.2.1 Nacala Port
The port of Nacala boasts the deepest (60m) bay in Africa, with a width of
800m. The port is situated in a suitable position in relation to commodity
(crude oil and raw materials) main routes; and has export and import capacity.
Nacala Port is located in a zone of intense maritime traffic. The port’s natural
conditions and geographic position are not only beneficial to the hinterland.
The port is also suitably located along the market and commercial routes,
acting as a “Turn Bridge” and support point to the traffic that can use it.
The port rehabilitation will be a socio-economic project. The influence of the
port on the regions it serves and the inverse are important factors to consider.
Nacala Port is currently promoted more for the export of agricultural goods.
Given the export from and imports to the areas served (i.e. northern
Mozambique, Malawi and Zambia), the port also has the potential for
exporting mining products; and container terminals for exports and imports
(Nacala Port business case, 2005).
13.2.2 Lobito Port
Lobito port is one of Angola’s main ports, and one of the best natural harbours
on the west African coast with a wide and deep entrance channel from the
Atlantic Ocean. Previously, the Benguela railway was closed to regional transit
cargo due to security issues in Angola. Ports were neglected and sometimes
attacked during the civil war that devastated Angola's economy. Before
closure, Lobito was the main terminal on the Atlantic Ocean for the railways
and was one of its key hubs. The port of Lobito was built to serve Angola, the
DRC, Zambia and Botswana (Reuters, August 2007).
Angola is seeking more investment for the rehabilitation and upgrading of the
Lobito Port Transport System. As a start, the key railway linking Angola to
neighbouring landlocked countries is being reconstructed. It is hoped that the
Benguela Railway will increase its capacity to roughly 3 million tones per

-116-
annum. It is expected that Zambia will direct at least 20 percent of its export /
import trade with Western Europe and America to this route if it operates
efficiently. Currently, port–related problems are many, and unless attended to,
threaten to compromise the inland transport advantage that the route has over
most of Zambia’s other trade outlets (Reuters, August 2007).
13.3 Activities at the Namibia Ports
The Walvis Bay Corridor, built to improve transport links between South Africa
and the Namibian port of Walvis Bay, has recently attracted significant
publicity. The Governments of Botswana and Zambia have started looking at
Walvis Bay as an alternative exit for their exports.
When designing the solution, Transnet should take the activities at Walvis Bay
into consideration.
a. Demand from Botswana
The Governments of Botswana and Namibia have agreed outline plans to
construct a new 1,600 km railway from the Morepule coal mine in eastern
Botswana to the Aranos coal mine (also in Botswana) and on to a new port at
Shearwater Bay, south of Luderitz in Namibia. Estimated construction costs for
the new port are around US$1bn.
The new railway would certainly provide an outlet for coal from both countries
but would provide Botswana with an alternative to South African ports and
should also encourage trade within the Southern African Development
Community (SADC) (Africa Research Bulletin, No.17338, 2007).
b. Demand from Zambia
Traders in Zambia have traditionally looked either to Dar-es-Salaam
(Tanzania) or the South African ports to act as conduits for the goods bound
for export and sources of imports from overseas.
Zambia is currently considering Walvis Bay as an alternative. The completion
of the Katima Mulilo Bridge over the Zambezi River in Zambia’s Southern
Province earlier in 2007 has put the most important link in the Trans Caprivi

-117-
Road Corridor (TCRC) in place. As a result, journey times from much of
Zambia to Namibia have been reduced.
The Zambian Government has now announced that it is to develop a dry port
at Walvis Bay to handle Zambian freight on site (Africa Research Bulletin,
No.17338, 2007).
c. Other activities (Africa Research Bulletin, No.17338, 2007).
The port’s operator, Namport, has set up the Walvis Bay Corridor Group
(WBCG) to promote Walvis Bay as a transit port for the wider Southern African
region. Rail and road links with Angola, South Africa and Botswana are being
improved and new capacity is being added to both container and bulk storage
and handling facilities at the Namibian port. The Southern African
Development Community (SADC) has also thrown its support behind the
process, in the spirit of encouraging regional integration and reducing the level
of economic and infrastructural reliance on South Africa.
Namport plans to invest US$70m in increasing the handling capacity of Walvis
Bay on the back of a recent increase in demand from mining companies. New
cargo handling equipment is required, new berths are to be developed and the
water depth of the harbour is to be increased to allow larger vessels to dock at
the port.
The EU funded a feasibility study into the Walvis Bay Corridor project and has
agreed to provide €25m to help develop the project. Much of the money will be
used to construct a dry port at Gobabis on the Trans-Kalahari Highway. Road
haulers can transport containers from South Africa via road to Gobabis, where
it will be transferred to rail. Along with the Trans - Kunene and Trans - Caprivi
highways, the scheme should help to bring Namibia into the heart of the
evolving SADC transport network.

-118-
All these activities provide further evidence of the growing importance of the
Namibian port within Southern Africa.
It is recommended that Transnet explore this opportunity. However, it is
cautioned that this be done against the background of a grand design with the
participation of all important role players.
As part of the solution design Transnet should:
� Build on an existing demand base
o Respond to existing local and international demand
� Mobilse support through extensive consultation
o Transnet should collaborate with all key stakeholders (including
public and private sector), on a national and regional basis,
throughout the process.
14 Conclusion
The aim of this document and study is to provide insight in to the freight
transport involvement options in SSA, specifically highligting the regulatory
framework and the status and development approaches and initiatives to the
transport infrastructure in SSA. For any South African company investing in
SSA and specifcally for Transnet it is important to realise that the SSA
strategy need to include a two-fold but interrelated approach of:
� Identifying opportunities for own economic benefit and to
� Participate in the development of African transport to alleviate growing
pressure on South Africa’s logistic system.

-119-
This recommendation is based on the fact that Africa’s infrastructure is
depleted, economic growth impeded and impact of the negative regulatory
environment and challenges.
In terms of the countries studied the following should be considered and
responding to this situation Transnet should therefore focus on specofc
actions and recommendations as highligted :
:
For Angola to fully take advantage of its rich national resources - gold,
diamonds, extensive forests, Atlantic fisheries, and large oil deposits - Angola
will need to continue reforming Government policies and to reduce corruption.
The Government has made sufficient progress on reforms recommended by
the IMF, such as promoting greater transparency in Government spending,
and continues to be without a formal monitoring agreement with the institution.
Angola has come to depend overwhelmingly on oil for its export earnings, with
the United States of America being the main market for Angola’s oil. Until
recently, Angola has had few trade ties with other Southern African countries.
However, now that there has been a change in the political climate,
opportunities for trade with other countries in the region have opened up and
should be exploited. The Angolan Government has started initiatives to revive
infrastructure. The Government will focus on the Benguela Railway, which
links the Port of Lobito with Democratic Congo and the rest of Southern
Africa's Cape Gauge network. The main transport infrastructure is the port
(Lobito), the Benguela Railway line and the roads to the DRC and Zambia.
The need for regional integration is strongly supported by the Angolan
Government.
The Angolan Government plans to offer rail services to the private sector
under concession contracts in the medium term but first need to rehabilitate
the networks. Various opportunities exist in the country and with China
-120-
already involved, South Africa should ensure that they play an active,
participative role in the development of the Angolan and the regional
transport initiatives.
Transnet - with its expertise in rail and port development and operations -
should actively seek to participate in the development of the Lobito port and
the Benguela railway line.
Botswana’s impressive performance is one of the success stories of
development in Sub-Saharan Africa. It has won international recognition for its
high rates of growth, prudent economic management, political stability and an
efficient welfare system. Despite this progress, Botswana still faces significant
economic and social challenges, including poverty, unemployment, the
HIV/AIDS pandemic, and the need to develop the private sector further. The
political turmoil in neighbouring Zimbabwe is also an ongoing concern for the
region.
Botswana is however committed to developing the transport infrastructure in
the country specifically from a regional integrative perspective and this is
supported by its strategic location/position as the gateway to the SADC region.
The Democratic Republic of Congo offers many opportunities for foreign
investors. The country is conveniently located in the continent. The countless
natural resources form its foundation and the Government has committed itself
to encourage new local and foreign investment to stimulate the economy and
to uplift the social environment.
The collapse of the transport system in DRC is a result of the deterioration of
both physical infrastructure and the poor performance of technical institutions
in charge of its management and maintenance. None of the technical

-121-
institutions functions at the levels required to adequately manage the transport
system, and in particular to ensure its maintenance. This is mostly due to a
lack of financial resources for ten consecutive years, which has resulted in
outdated technical knowledge and management tools, lack of equipment, and
drain of qualified and experienced staff. Institutional strengthening is therefore
vital for the long term sustainability of any newly rehabilitated infrastructure in
DRC.
The Democratic Republic of Congo faces a defining period in its history
(following a peace agreement in 2003 and historic elections in 2006) this is
the best chance DRC has had for decades to escape a cycle of conflict and
suffering and realise its potential.
During the official visit by South African President Thabo Mbeki to the
Democratic Republic of Congo (DRC) on 21 August 2007, three important
cooperation agreements between the two countries were signed, in the areas
of transport, health and defence. The DRC and South Africa committed
themselves to working together on the reconstruction and development of the
DRC. In support of this agreement Transnet could consider involvement in the
DRC in terms of technical assistance/support, human resource and skills
development and safety and regulatory assistance.
Until the elections in 2007, Kenya had managed to maintain political stability
in the country. This spurred interest in international investors, donors and
agencies. Keeping in mind that economic growth is closely linked to efficient
transport systems, the Government of Kenya was (and still is) committed to
relaxing its laws, reforming it policies in order to attract investment into its
transport infrastructure development programmes.
Kenya has been progressively liberalising its trade regime since the mid-
1980s. Kenya’s access to international markets is comparable to the regional
(SSA) average and slightly better than for the average low income country.

-122-
Kenya’s weakness is the quality of transport, as the country’s railway and port
systems, for example, suffer from decreased investment and inadequate
maintenance. There is also wide disparity between the skill sets desired by
the growth sectors and those supplied in the market. The Government of
Kenya recognises that getting the institutional and regulatory frameworks in
order is not enough, privatisation is also paramount.
Transnet must carefully consider its participation in Kenya. If Transnet is going
to participate in the Port of Mombasa, it must be mindful of all the transport
modes and infrastructure facilities affecting port operation.
The current recommendation for Transnet is to wait for macro-economic and
political stability; and infrastructure rehabilitation. Once these are in place
Transnet can consider participation in freight rail and container terminals (both
at inland ports and the port of Mombasa). Since Mombasa is congested it may
be worth Transnet’s while to investigate investment at the minor ports on the
Indian Ocean.
Malawi’s civil administration is committed to the principles of good
governance, transparency and accountability. Malawi’s written constitution
guarantees protection of investments, irrespective of ownership. The transport
infrastructure challenges remain key concerns for foreign investors and freight
transport companies. Although the regulatory environment is encouraging for
foreign companies, Transnet should be mindful of the transport infrastructure
limitations (including high transit costs) when considering projects that require
transit through Malawi.
A decade ago, the Government of Mozambique embarked on a series of
macroeconomic reforms designed to stabilise the economy. These steps,
combined with donor assistance and with political stability since the multi-party
elections in 1994, have led to dramatic improvements in the country's growth
rate.

-123-
In spite of these gains, Mozambique remains dependent upon foreign
assistance for much of its annual budget, and the majority of the population
remains below the poverty line. Agriculture continues to dominate the
country’s economy and employ the vast majority of the work force. Hence, a
substantial trade imbalance persists, even though the opening of large
projects like Mozal aluminum smelter has increased export earnings.
Many challenges still remain in achieving the desired level of socioeconomic
development, but there is no question that Mozambique is a shining example
of post-conflict success. Its 18 main bilateral and multilateral donors recently
gave the country a major vote of confidence by pledging US$583mn in aid for
2007. Corruption remains a major problem. Nevertheless, donors have
sufficient faith in the Government’s ability to manage aid funds adequately that
Mozambique is one of a small number of nations where aid is paid directly into
the general budget. It is too early to expect Mozambique to progress out of
the least developed country category, but if current trends continue, and given
its rich resource endowment and openness to foreign investment, a significant
regional economic powerhouse is certainly in the making. Currrent activities
are focusing on the development of the Nacala corridor, mainly the
rehabilitation of roads and rail. Port developments are taking place at a slower
pace. Transnet should therefore consider to :
� Target multilateral and bilateral agencies to support Transnet’s
strong business case for the Nacala port development
o The port of Nacala has great potential as the deepest port in
Southern Africa (albeit smaller than Saldanha). The port is
strategically positioned in the Indian Ocean route. The port
can accommodate ships of all sizes
o Once the port has been rehabilitated and upgraded, it can be
linked to the East African market by development of a new
rail line to link the Dar es Salaam corridor to the Nacala
corridor.
-124-
Due to historic ties and the South Africa Customs Union, the Namibian
economy is still largely influenced and dependent on the South African
economy. It is as a result closely linked to South Africa in terms of trade and
investment. Namibia as member of SADC and COMESA is very focussed on
regional integration and the establishment of Walvis Bay Port as a hub for the
region has direct implication for the South African economy and transport
system. Therefore South Africa will have no choice but to be closely involved
in any developments and initiatives in Namibia. All these activities provide
further evidence of the growing importance of the Namibian port within
Southern Africa. When designing the solution, Transnet should take the
activities at Walvis Bay into consideration.
The long term development goal of Tanzania is to raise the standard of living
and/or quality of life of the people through the enhancement of both the
productive and non-productive sectors of the economy. To achieve this, the
transport sector will need to play a critical and crucial role. The conflict in
Kenya is creating a huge opportunity for Tanzania – specifically Dar-es-
Salaam to enhance and direct transport through the port. Dar-es-Salaam Port
handles more than three quarters of Tanzania’s trade, averaging about 40
million tonnes a year, and is the largest industrial centre and business capital
in Tanzania. It has rail and road links to Burundi, Rwanda, Zambia, Malawi,
Zimbabwe and parts of the DRC. It also serves as a major logistics gateway to
these countries because they are landlocked. As the port of Mombasa is
battling with a severe congestion crisis, most shipments are being diverted to
Dar es Salaam. This could see the position of the Dar es Salaam port
changing drastically in the Eastern and Southern African markets. There are
even predictions that it could overtake Mombasa as the main container port in
East Africa. Dar es Salaam port has also been hailed as one of Tanzania’s
biggest success stories of privatisation.

-125-
Uganda has a reasonably well developed infrastructure comprising of a
network of road, rail, and airports. The country is fairly adequately connected
to its neighbours as well as the COMESA member states by rail, road and air.
The Ugandan economy has been one of the fastest growing economies in the
world, with an average of 6.4 percent for the last 8 years. This reflects an
increase in the potential market for communication and infrastructure-related
projects; Uganda also has a fully liberalised foreign exchange regime with no
restrictions on the movement of capital. 100 percent ownership of projects by
foreign investors is allowed. Uganda is committed to the principles of good
governance, transparency and accountability; and guarantees protection of
investments, irrespective of ownership. The transport infrastructure
challenges remain key concerns for foreign investors and freight transport
companies. Participating in the Ugandan business opens the EAC and
COMESA markets for most investors. This implies an increase in demand for
most freight forwarders. The recommendation is for Transnet to note any
opportunities for investment or transit in Uganda.
As Zambia’s geographical position is in the heart of Southern Africa and is
sharing borders with eight countries – Democratic Republic of Congo, Angola,
Namibia, Botswana, Zimbabwe, Mozambique, Malawi and Tanzania –
Zambia’s focus is on positioning itself as a transit country. An important
element of the adoption and implementation of a transit strategy is the
development of the concept of trade and transport corridors. The most
important corridors used at the moment are Copper belt-Lusaka-
Johannesburg/Durban via Chirundu and Livingstone; and Lusaka/Copperbelt-
Kapiri Mposhi-Dar-es-Salam. New potential corridors that could be explored
are South Africa / Zimbabwe-Lusaka-Lubumbashi-Angola; Lusaka-Sesheke /
Katima Mulilo-Walvis Bay Namibia; linking the TAZARA railways with the
inland port of Mpulungu at Lake Tanganyika; Lusaka-Chipata-Lilongwe
Malawi-Beira/Nacala Mozambique. Although the regulatory environment is
encouraging for foreign companies, Transnet should be mindful of the

-126-
transport infrastructure limitations (including high transit costs) when
considering projects that require transit through Zambia.
Zimbabwe’s recent political and economic problems have turned off the tap of
foreign investment and Zimbabwe has enormous challenges facing the
economy. Hardships have manifested themselves in rising inflation, erosion of
real incomes, critical foreign exchange shortages, decline in savings and
investment, capacity underutilisation, company closures and high
unemployment, with rising incidences of corruption in both private and public
sectors. Zimbabwe is however strategically located as a transit point for
transportation within the region and through its membership with SADC and
COMESA supports the drive for regional integration in the transport industry.
Although the political and regulatory environments are discouraging for foreign
companies, Transnet should be mindful of the advantages a “working
Zimbabwe” can offer. Zimbabwe has an extensive rail and road transport
network linking it to principal ports in Mozambique and South Africa and to all
neighbouring countries.
It is important for Transnet and the South African Government or any other
South African Transport or Logistics Industry player to understand that the
proposed solution to the infrastructure problems in SSA can only influence and
not owned by the South African Freight Transport Industry.

-127-
15 References
Africa Research Bulletin Communications and Transport, No.17338, 2007,
Blackwell Publishing
Africa Research Bulletin Communications and Transport, No.17490, 2007,
Blackwell Publishing
African Union. Available at: http://www.africa-union.org/root/au/index/index.htm
(2008. March)
Arvis Jean-François, Monica Alina Mustra, John Panzer . The World Bank &
Lauri Ojala & Tapio Naula Turku School of Economics, 2007, Connecting to
Compete Trade Logistics in the Global Economy: The Logistics Performance
Index and Its Indicators by The International Bank for Reconstruction and
Development , The World Bank, 1818 H Street NW, Washington
Button Kenneth, Effective Infrastructure Policies to Foster Integrated Economic
Development, Third African Development Forum, Addis Ababa, March 2002,
School of Public Policy, George Mason University, Fairfax, USA
COMESA, State of Integration COMESA, Report of the Secretary General to the
12th COMESA Summit, Kenya, May 2007. Available at: http://www.comesa.
int/publications/Multi-language_content.2007-06-08.5926/en (2008, February)
COMESA-EAC-SADC Task Force, November 2007, Deepening Regional
Integration: Developing and Upgrading of Transport Systems and Infrastructure
on the North-South and Dar-es-Salaam Corridors. Available at:
http://www.rtfp.org/#documents8 (2008, March)

-128-
Commission of the European Communities, EU Strategy for Africa: Towards a
Euro-African pact to accelerate Africa’s development. Brussels, 12.10.2005,
COM(2005) 489 final, Available at: EU Strategy for Africa: Towards a Euro-
African pact to accelerate Africa’s development {SEC(2005)1255} (2008, March)
Chen, X et al, China and India: What’s in it for Africa? OECD Development
Centre, May 2006, ISBN 92-64-02441-7
Dredging News Online, February 2008: Congestion still an issue at Dar-es-
Salaam. Available at: http://www.sandandgravel.com/news/article.asp?v1=10698
(2008, March)
East African Community: EAC Development Strategy 2006-2010. Available at:
http://www.chr.up.ac.za/undp/subregional/docs/eac3.pdf (2008, February)
Economic Commission for Africa, ATPC Briefing No 1, African Trade Policy
Centre, Trade Facilitation, June 2004 Available at: http://www.uneca.org
/ATPC/Briefing_papers/1.pdf (2008, February)
Farlam Peter, Working Together, Assessing Public-Private Partnerships in Africa,
The South African, Institute of International Affairs, February 2005, ISBN: 1-
919969-17-9) Available at: http://www.oecd.org/dataoecd/44/4/34867724.pdf
(2008, March)
Ford N, African Business Aug/Sep 2007, East African waterways offer cheap and
easy transport. Available at: http://findarticles.com/p/articles/miqa 5327/is200708
/ai n21294299 (2008 April)
Fundira T, 2008, The Africa-China trading relationship. Available at:
http://www.tralac.org/pdf/20080205_Africa-Chinaupdate2008.pdf (2008, March)
Goldstein A and Kauffmann C, African Development Bank and the OECD
Development Centre, Policy Insights No. 21, 2006, Is More Money Enough to

-129-
Fix Africa’s Transport Infrastructure? Available at: www.oecd.org/dev/
publications / africanoutlook May 2006 (2008, February)
Index of Economic Freedom 2008, The Heritage Foundation, Available at:
http://www.heritage.org/Index/ (2008, March)
Infrastructure and Services (I&S) - The Official SADC Trade, Industry and
Investment Review 2007/2008 Available at: http://www.oecd.org/ ff/?404
;http://www. oecd. org:80/ dev/insights (2008 April)
Kenya Ports Authority, 2008, The highest cargo handled at the port in 2007.
Available at: http://www.kpa.co.ke/ contentAll.asp?pcat=&cat=pressrelease&
sid=281 (2008, March)
Manning Richard, Development Co-operation report 2007-Volume 9, No 1-ISBN
978-92-64-04147-9, OECD Journal on Development, Published by Éditions
OCDE, 2008
Mlenga M, 2003, The Southern African Railways Experience: An Operations and
Policy overview. Southern African Railways Association (Sara), Presented at the
Asia Pacific Rail 2003 Conference and Exhibition. Available at: http://www.
Sararail. org/site/pdf/Thepercent20Southernpercent20 Africanpercent20 Railways
percent20 Experience.pdf, (2008, April)
Mombasa port, 2007, Available at : http://www.globalsecurity.org/ military/ facility/
mombassa. Htm (2008, March)
Maputo Corridor Case Study: Success of the Maputo Corridor – a true
transportation corridor creating an enabling environment for further investment
and growth. Available at: http://www.mcli.co.za/MCLIpercent20Maputopercent20
Corridorpercent20Casepercent20Studypercent206percent20Junepercent 202007
.pdf (2008, March)

-130-
Makumbe R, 2007, The SADC Regional Strategy to Intermodal Transportation
and Logistics In Southern Africa, Presentation at the 5th Intermodal Africa South
Africa Exhibition and Conference, Durban, South Africa, 30 March 2007.
Available at: http://www.temsb.com/assets/durban07/RemmyMakumbeNotes.pdf
(2008, March)
Nacala Development Corridor, The Business Case for the Nacala Development
Corridor, Available at: http://www.nacalacorridor.com (2008, March)
Namibia ports. Available at: http://www.namport.com/content/show.php?m=4
(2008, March)
NEPAD in Brief, 2005. Available at:http://www.nepad.org/2005/files/inbrief.php
(2008, April)
Pozzo di Borgo P et al, June 2006, World Bank, Review of Selected Railway
Concessions in Sub-Saharan Africa Available at: http://www4.worldbank.org
/afr/ssatp/Resources/WorldBank-WorkingPapers/ESW-RailwayConcessions.pdf
(2008, March)
Radebe J, The State of Transport in Africa, Address by Jeff Radebe, Minister of
Transport, SA at the International Transport Convention 2005. Available at:
http://www.transport.gov.za/comm-centre/sp/2005/sp0516.htm (2008, March)
Reuters, INTERVIEW-Angola seeks investment in Lobito port, August 22, 2007.
Available at:(http://uk.reuters.com/article/oilRpt/idUKL2217232520070822) (2008,
April)
Richard Bullock, World Bank Group, September 2005, Results of Railway
Privatization in Africa. Available at: www.worldbank.org (2008, April)
Samuelson P.A. and Nordhaus, W.D. 1989. Economics, McGraw-Hill Book
Company, New York

-131-
Santiso J, An introduction to the OECD Development Centre, Presentation,
OECD Development Centre, Brussels, 12 September 2006. Available at:
www.oecd.org/dataoecd/15/34/37424335.ppt (2008, April)
Simuyemba S, Economic Research Papers, No. 64, 2007, African Development
Bank: Linking Africa through Regional Infrastructure, The African Development
Bank, Côte d’Ivoire. Available at: http://www.afdb.org/pls/portal/docs/PAGE/
ADB_ADMIN_PG/DOCUMENTS/ECONOMICSANDRESEARCH/ERP-64.PDF
(2008, February)
Transit Transport Coordination Authority (TTCA) of the Northern Corridor,
Investment opportunities in the Northern Corridor with emphasis in Transport
Infrastructure A paper prepared by the TTCA Secretariat, at the Comesa
Business Summit Kampala, Uganda, June 2004. Available at:
http://www.oecd.org/dataoecd/22/36/34879173.pdf (2008, March)
The African trading relationship with India, 2007, Available at
(http://www.tralac.org/pdf/20070717_TheAfricanTradingRelationshipwithindia.pdf)
(2008, April)
Transport news, February 2008, Available at: http://www.otal.com/drc/(2008,
April)
Tanzania Ports Authority. Available at: http://www.tanzaniaports.com. (2008,
April/May)
United Nations Conference on Trade and Development (UNCTAD). Available at:
http://www.unctad.org/Templates/Page.asp?intItemID=1584&lang=1(2008,
February)
Uneca, Economic Report on Africa 2007, Recent Economic Trends and
Prospects for 2007: Accelerating Africa’s Development through Diversification.

-132-
Available at: http://www.uneca.org/eca_resources/ Publications/ books/ era2007/
chap1. pdf (2008, March)
Uneca, Transport , Governance and Public Administration, 2007, Available at:
http://www.uneca.org/eca_programmes/development_policy_management/transp
ort.htm (2008, March/April)
United Nations Department of Public Information – October 2002, Implementing
the Millennium Development Goals. Available at: http://www.un.org/millennium
goals (2008, March)
United Nations University, Policy Brief, number 5, 2007, The Significance of
Transport Costs in Africa. Available at: http://www.unu.edu/publications/briefs
/policy-briefs/2007/pb05-07.pdf (2008, March)
Van der Merwe J. , 2008. Personal interview, 6 March 2008
Walvis Bay Corridor Group, The Walvis Bay Corridor – a case study for transport
transit facilitation, UNCTAD Expert Meeting on Transport Transit Arrangements in
Geneva, November 2004. Available at: http://r0.unctad.org/ttl/ppt-2004-11-
24/wbcg%20F%20Gschwender.pdf (2008, March)
Wikipedia. Available at: http://en.wikipedia.org/wiki/Main_Page (2008, March)
World Bank, Sub Saharan Transport Policy Program, October 2007, Second
Development Plan 2008-2011: Fostering Sound Policies and Strategies for the
Provision of Reliable, Safe, Efficient, and Affordable Transport. Available at:
http://web.worldbank.org/WBSITE/EXTERNAL/COUNTRIES/AFRICAEXT/EXTAF
RREGTOPTRA/EXTAFRSUBSAHTRA/0,,contentMDK:21559663~pagePK:64168
445~piPK:64168309~theSitePK:1513930,00.html (2008, March)
World Bank, Sustainable Infrastructure Action Plan. Available at: :http://www.
worldbank.com/transport/learning/presentations/Ports/hartmann1_WB percent20
-133-
Transport percent20Forum percent202005 percent20Ports.ppt#279,9,Congestion
(2008, March)
World Bank, March 2005, Joint forum toward enhanced aid effectiveness:
harmonisation alignment, results - Paris Declaration Endorsed. Available at:
http://www1.worldbank.org/harmonization/Paris/NEWSLETTER322.pdf (2008,
March /April)
The World Bank, Report No.: 32659, June 22, 2005, Project Performance
Assessment Report Tanzania Port Modernization II Project, (Credit 2095-Ta) And
Railway Restructuring Project (Credit 2267-Ta), Available at: www. worldbank.org
(2008,March/April), (http://lnweb18.worldbank.org/oed/oeddoclib.nsf/ DocUNID
ViewForJavaSearch/ADD913E8925BABA58525706F006E9C60/$file/ppar
32659.pdf)
World Bank, September, 2005, Meeting the challenge of Africa’s development: A
World Bank Group Action Pan, Africa Region. Available at: www.worldbank.org
(2008, March)
World Bank, Accelerating Development Outcomes in Africa progress and change
in the Africa Action Plan, April 2007, DC2007-0008) Available at:
www.worldbank.org (2008, April)
World Bank, Doing Business Project World Bank Group, Doing Business 2008 ,
A Project Benchmarking the Regulatory Cost of Doing Business in 178
Economies. Available at: www.worldbank.org (2008, April)
World Economic Forum, World Competitiveness Report, Available at:
http://www.weforum.org/en/initiatives/gcp/Global%20Competitiveness %20Report/
PastReports/index.htm (2008, February)
-134-
World Mineral Map, Available at: http://www.mapsofworld.com/world-mineral-
map.htm (2008, April)

-135-
Addendum A
International Organisations adhering to the Paris D eclaration are :
African Development Bank, Arab Bank for Economic Development in Africa,
Asian Development Bank, Commonwealth Secretariat, Consultative Group to
Assist the Poorest, Council of Europe Development Bank (CEB), Economic
Commission For Africa (ECA), Education For All Fast Track Initiative,
European Bank for Reconstruction and Development, European Investment
Bank, Global Fund to Fight Aids, Tuberculosis and Malaria, G24, Inter-
American Development Bank, International Fund For Agricultural Development
(IFAD), International Monetary Fund, International Organization of the
Francophonie, Islamic Development Bank, Millennium Campaign, New
Partnership for Africa’s Development, Nordic Development Fund,
Organisation for Economic Co-operation and Development (OECD),
Organisation of Eastern Caribbean States (OECS), OPEC Fund For
International Development, Pacific Islands Forum Secretariat, United Nations
Development Group (UNDG) and the World Bank
Participating countries
Albania, Malawi, Australia, Malaysia, Austria, Mali, Bangladesh, Mauritania,
Belgium, Mexico, Benin, Mongolia, Bolivia, Morocco, Botswana, Mozambique,
Brazil, Nepal, Burkina Faso, Netherlands, Burundi, New Zealand, Cambodia,
Nicaragua, Cameroon, Niger, Canada, Norway, China, Pakistan, Congo D.R.,
Papua New Guinea, Czech Republic, Philippines, Denmark, Poland,
Dominican Republic, Portugal, Egypt, Romania, Ethiopia, Russian
Federation, European Commission, Rwanda, Fiji, Saudi Arabia, Finland,
Senegal, France, Serbia And Montenegro, Gambia, The Slovak Republic,
Germany, Solomon Islands, Ghana, South Africa, Greece ,Spain, Guatemala,
Sri Lanka, Guinea, Sweden, Honduras, Switzerland, Iceland, Tajikistan,
Indonesia, Tanzania, Ireland, Thailand, Italy, Timor-Leste, Jamaica, Tunisia,
Japan, Turkey, Jordan, Uganda, Kenya, United Kingdom, Korea, United

-136-
States of America, Kuwait, Vanuatu, Kyrgyz Republic, Vietnam, Lao PDR,
Yemen, Luxembourg, Zambia and Madagascar.