Embed Size (px)
Citation preview

South Africa’s “Reality Check” >1 million Xpert tests
Professor Wendy Stevens
Department of Molecular Medicine and Haematology,
University of the Witwatersrand and
Head of National Priority Programs, NHLS
On behalf of the GeneXpert Team

Content
South Africa’s burden of TB
Xpert program
– National plan,
– Results, positivity, Rif concordance to DST/LPA
– Impact studies
– EPTB, paediatrics
Challenges
– Verification and EQA
– Module Failures and calibration
– Training
– Ct values – surveillance? Monitoring?
TB and TB-HIV burden 2011 • ~500,000 new cases and 25,000 deaths
due to TB.
• TB incidence continues to rise (~incidence
993 per 100,000)
• Fuelled by HIV epidemic (largest burden of
HIV-infected individuals worldwide (5.6
million in 2011).
• >65% of new TB cases coinfected with HIV
• TB leading cause of death among HIV
infected
• High risk populations
– Mining populations 4000/100,000
– Correctional Services 4500/100,0000
• Increasingly smear negative (8-
10%positivity prior Xpert), diagnosis made
to late to avoid mortality late to avert
mortality (Lawn. JID 2011, Corbett, 2003, Holmes,
JAIDS 2006
Urgent interventions are needed, one of which
has been the need for rapid diagnosis of MTB
technology.
TB
TB-HIV
WHO Global Tuberculosis Report 2012. Geneva, World Health Organization, 2012 www.who.int/tb /publications/global_report/en/. Accessed on 29 October 2012

Where are now?
Courtesy NPP, NHLS
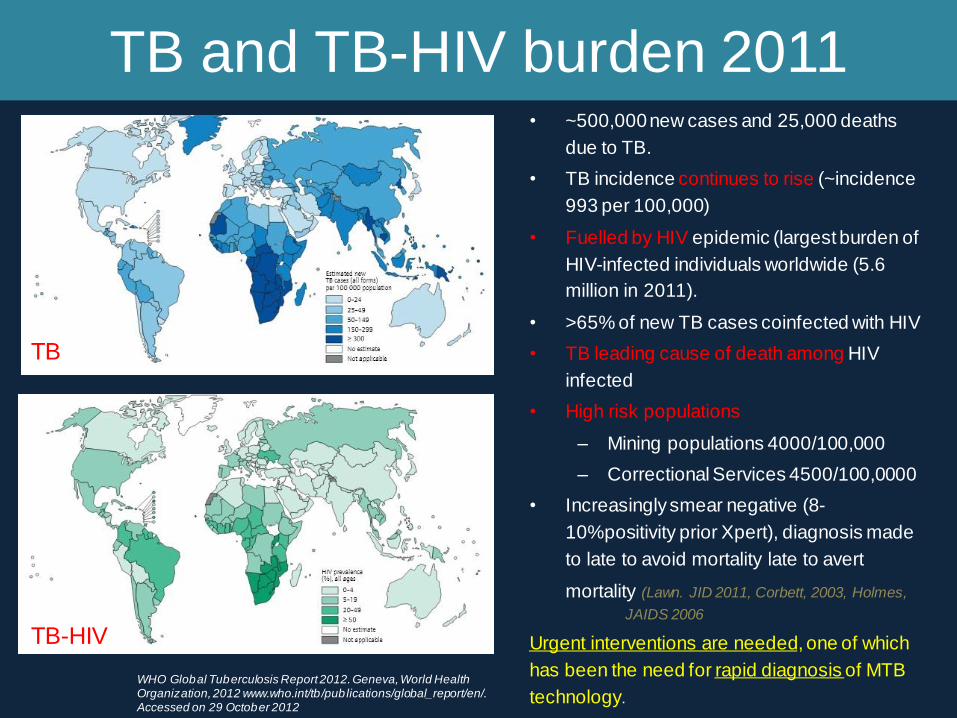
Interfacing any new molecular technology
e.g. GeneXpert: DISRUPTIVE TECHNOLOGY
1.Interface with other molecular tests and conventional microbiology
2.Interface with Clinical Diagnostic and Treatment Guidelines for TB and HIV
3.Interface with Laboratory Information Systems/Instrument performance monitoring
4.Interface with Quality Management Systems: EQA, verification
5.Interface with Training programs and health systems strengthening activities
6.Interface with actionable result reporting: requisition/order entry, reflex testing/not, LIS
rules, instrument performance management rules, result distribution for more rapid action,
7.Interfacing data collection at lab with clinical data systems: provincial and national levels
8.Interfacing with financial modelling, costing and forecasting, procurement strategy
9.Interfacing with donors and managing expectations
10.Interface with specimens other than sputum and pulmonary TB (Extrapulmonary,
pediatric)
SA Experience Health systems strengthening needed at all levels to support the roll-out
Address these issues upfront now that we know what they are
Positive Aspect: You will find the weaknesses in your Current TB Programs at both a laboratory and clinical level
W. Stevens, 2012, IUTLD, Malaysia

•WHO’s Strong Recommendation in December 2010
“The new automated DNA test for TB should be used as the initial diagnostic test in
individuals suspected of MDR-TB or HIV/TB” (i.e.Most TB suspects in SA)
•In March 2011, South Africa developed and initiated a National Plan for phased
implementation of the technology, as a replacement for microscopy as the initial diagnostic
screen for TB suspects
•Using existing microscopy centres facilitated rapid implementation (244 centres)
•Significant support from CDC, Global fund, BMGF, UNITAID, amongst others
•Performed over 1,180 669 tests to date (March 2013), across all 9 provinces
•Significant increase in case detection in suspects (8 to16%) in first year, second year: 14%
•Significant increase in detection of drug resistance (7%)
•Expanded access to correctional services inmates and miners
•Several SA research studies emerging confirm the increase in laboratory detection, reduced
time to diagnosis and treatment initiation and a possible reduction in empiric treatment
Background to South Africa’s GeneXpert’s Program
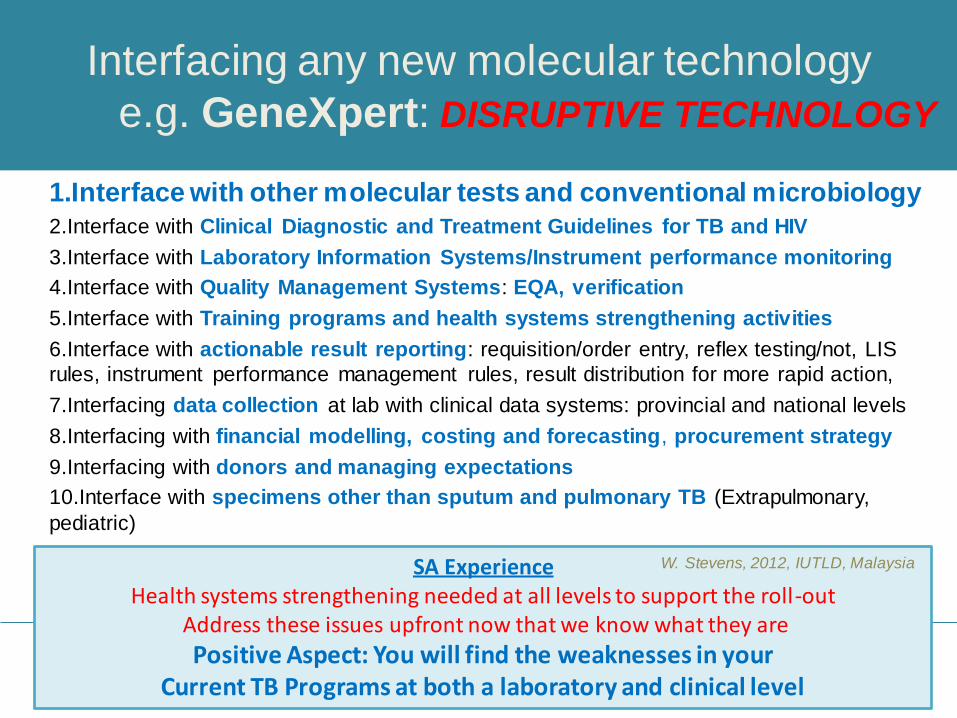
Monthly monitoring
•Data analysis
•Utilization
•Errors
Meetings
•Bi-weekly meetings with team and supplier
•Monthly NHLS EXCo
•Quarterly NDoH
•Model review
Commence testing at
sites
•Manage assay version change(Dec2011)
•Manage stock-out in August
•Remote calibration
•Remote connectivity
Initiate sites: 95 to date
125 planned
•LIS installation
•Instrument installation
•Verify instruments
•On-site training /test witness
•Parallel clinic training
Require R&D
•Training material
•SOP
•Verification program
•Instrument interface
•Paediatrics
•EPTB •POC
•Smear negative
Funders engage
•Phase II Instruments
•kit orders
•Forecasting
•Supplier negotiation
•Clinical algorithm
•Impact study planned
Formed advisory
team (NPP)
•Pilot I (March 2011)
•Phased plan developed
•Algorithm
•NTCM model
Discuss with
partners
•Funders
•Supplier
•Laboratory •Clinical
•Economists
NDoH/
NHLS engage
WHO Dec 2010
South Africa’s implementation process:
January 2011: one National Plan
Coordinate efforts, define
priorities
Develop implementation plan, documents
Prepare sites
Build capacity for training (lab
+clinic), support resources
Support data collection and
impact evaluation
USG technical approach for Xpert roll-out only published 28 August
2012

Phased implementation of GeneXpert in SA
One National Plan
• Three phases of implementation in microscopy centres
• Phase I: Pilot in high burden districts in 9 provinces
• Phase II: Completion of high burden districts
a. Full capacitation of Phase I labs
b. Full capacitation of high burden districts
• Phase III: XTEND Study (Aurum: BMGF funded, RCT)
a. Intervention arm
b. Control arm.
c/d. Completion of all sites
• Full financial commitment attained for the National Program originally
described, treasury support for test till 2016
• Now Program to be expanded for mines and correctional services with aspects
of both surveillance, screening and case finding and Xpert to be used as front-
line

Phased implementation Progress Where are we now?
• Phases 1-3b completed; Phases 3c 85%; Phase 3d 53%
• 142 testing centres established (~76% coverage)
• 203 instruments: GX4 : 65; GX16-8: 1: GX16 : 135; GX48: 1: GX80-48: 1
• Additional 39 instruments (37 facilities) to be placed in Q2
• Will increase coverage to 90%
• Placement of 7 infinities (Steve Biko, CHB, Leratong, Tshepong, Pelonomi,
Greenpoint, PE): 6 month production time
• Train-the-Trainer courses conducted
• 100 centres actively reporting on the Remote Connectivity website
• Remote calibration active from November 2012

142 testing centres
203 analysers
*20 clinic placements
Gx4: 65
Gx16-8: 1
Gx16: 135
GX48:1
GX80-48: 1
Current GeneXpert Placements

Planned Total Rollout
for the GeneXpert, with
NDOH Health facilities
GeneXpert sites : green NDoH clinic sites: red

Test Volume Comparisons
JAN FEB MAR APR MAY JUN JUL AUG SEP OCT NOV DEC
2011 3495 12641 16412 17901 19303 25112 27176 32448 32482 23489
2012 32243 38043 44609 37706 49717 52970 51317 59537 63771 84907 93732 60490
2013 91915 10559
0
10000
20000
30000
40000
50000
60000
70000
80000
90000
100000
To
tal
No
. o
f T
est
s
GeneXpert Testing Volumes 2011-2013

GeneXpert Summary 01 March 2011 - 31 March 2013
Provincial GeneXpert MTB Results Per Province Province MTB Detected MTB Not Detected Test Unsuccessful Total % MTB Detected
Eastern Cape 27881 147474 4765
180,120
15.48
Free State 17835 117802 524
136,161
13.10
Gauteng 18963 124431 4002
147,396
12.87
Kwa-Zulu Natal 48148 247615 11332
307,095
15.68
Limpopo 9137 76899 2125
88,161
10.36
Mpumalanga 8084 42664 2636
53,384
15.14
North West 11132 60475 3431
75,038
14.84
Northern Cape 9272 50960 2516
62,748
14.78
Western Cape 21340 107996 1230
130,566
16.34
Total 171,792 976,316 32,561
1,180,669
14.55
% Total 14.55 82.69 2.76 100
1,180,669 assays to date nationally
14.6% MTB positive cumulative
Results demonstrating a downward trend

Rif Resistance in MTB positive samples
Stable RIF resistance rates, geographical variation
Provincial GeneXpert RIF Results (MTB Detected)
Province Inconclusive Resistant Sensitive No Rif Result Total % RIF
Resistant
Eastern Cape 409 1967 25234 271
27,881
7.05
Free State 262 1064 16476 33
17,835
5.97
Gauteng 241 1254 17389 79
18,963
6.61
Kwa-Zulu Natal 747 4037 42894 470
48,148
8.38
Limpopo 134 640 8245 118
9,137
7.00
Mpumalanga 116 795 7084 89
8,084
9.83
North West 150 860 10075 47
11,132
7.73
Northern Cape 130 566 8414 162
9,272
6.10
Western Cape 254 1083 20000 3
21,340
5.07
Total 2,443 12,266 155,811 1,272
171,792
7.14
% Total 1.42 7.14 90.70 0.74 100

% RIF Concordance by LPA or DST n=9549 (March 2011-March 2013)
Concordance for Rif Resistance now reaching 90%: Beyong questioning accuracy
• Algorithm adherence concerns: ~ 20-30% • Although small numbers E. Cape now deferring to LPA. • Western Cape is our role model: 87% adherence to algorithm, Rif Concordance 96-100%
• (only difference: two sputums collected upfront: 1 Xpert, reflex testing done by lab) • KZN and W Cape: greatest number of confirmations: INH positivity: KZN (87.4% INH
resistance); W.Cape: (82%)
GXP Data ending 1 Jan 2013 (DST & LPA up to 25 March 2013)
GeneXpert Confirmation & Rif Concordance Province
Rif Resistant
Cases
DST LPA
Confirmed
Rif Concordance
Pre-analytical/No
result
Confirmed Rif Concordance Inderterminate
# % # % # % # %
Eastern Cape 1459 22 1.5% 4 18.2% 0 86 5.9% 81 94.2% 0
Free State 838 22 2.6% 8 36.4% 0 149 17.8% 111 74.5% 22
Gauteng 1108 27 2.4% 20 74.1% 0 136 12.3% 129 94.9% 0
Kwazulu-Natal 3181 377 11.9% 368 97.6% 0 380 11.9% 325 85.5% 15
Limpopo 478 15 3.1% 13 86.7% 0 36 7.5% 25 69.4% 0
Mpumalanga 649 87 13.4% 86 98.9% 0 154 23.7% 134 87.0% 2
North West 523 16 3.1% 15 93.8% 0 54 10.3% 47 87.0% 4
Northern Cape 447 19 4.3% 12 0.0% 0 50 11.2% 44 0.0% 0
Western Cape 866 4 0.5% 1 0.0% 0 757 87.4% 730 96.4% 3
National 9 549 589 6.2% 527 89.5% 0 1 802 18.9% 1 626 90.2% 46
Prepared by the NHLS CDW Team
Probabilistic matching: No unique identifier for patients in SA

Summary of country activities:
ongoing and new
• Publications
• Early impact studies:
– Time to diagnosis
– Time to treatment
• New impact studies
• Cost model
• Algorithm
• Paediatrics and EPTB

Summary of country activities:
ongoing and new
• Publications
• Early impact studies:
– Time to diagnosis
– Time to treatment
• New impact studies
• Cost model
• Algorithm
• Paediatrics and EPTB

Summary of
country activities:
ongoing and new
• Publications
• Early impact studies:
– Time to diagnosis
– Time to treatment
• New impact studies
• Cost model
• Algorithm
• Paediatrics and EPTB

New impact studies
– XTEND: Aurum/BMGF funded/NHLS: cluster randomized trial Xpert testing
sites with/out Xpert to review cost-effectiveness and impact.
– X-Phactor: Xpert MTB/RIF for people attending HIV care: interventional
cohort study to guide rational implementation.
– EXIT-RIF: UNC, NC/RTC/WITS/NIH funded/NHLS: Observation study: Rif
resistant patients identified arm 1 by culture, arm 2 by Xpert
MSF: Implementing Xpert MTB/RIF in Zimbabwe (S. Van Den Broucke, IAS 2012):
•Xpert doubled detection rate;
•Increased the no. of lab confirmed TB cases- less empiric diagnosis of TB;
•Triples/quadruples the number of MDR –TB diagnosed
RTC in central Karoo region (T,van den Handel: personal communication):
•Xpert increased case detection
•Pre-Xpert: 22% cases treated were smear negative, culture negative vs 1% post
Xpert .
•Pre-Xpert 21% patients initiated in 5 days, post expert 95% initiated in 5 days.

Summary of country
activities:
ongoing and new
• Publications
• Early impact studies:
– Time to diagnosis
– Time to treatment
• Cost model
• Algorithm
• Paediatrics and EPTB

Summary of
country activities:
ongoing and new
• Publications
• Early impact studies:
– Time to diagnosis
– Time to treatment
• Cost model
• New impact studies
• Algorithm
• Paediatrics and EPTB
A model is just that………Flexibility needed and
constant re-evaluation

Indirect Laboratory Savings and
Unexpected costs
Unanticipated and under-estimated costs
• Underestimated training requirements at clinical level on algorithm
• Under-estimated awareness campaign costs
• Change in requisition forms, reporting structures
• R&D costs for paediatric and extra-pulmonary samples, monitoring studies
• Data collection changes: NHLS CDW; clinical Etr.net
• Cost of phased implementation: 2 parallel systems
• Module failure: 150 modules replaced in the field.
• Stock shortage, Assay version change management
Anticipated Savings
Staff time: fewer and less skilled: realize as program matures?
Remote calibration project
EQA product and management system
Remote connectivity for instrument performance = audit indicators
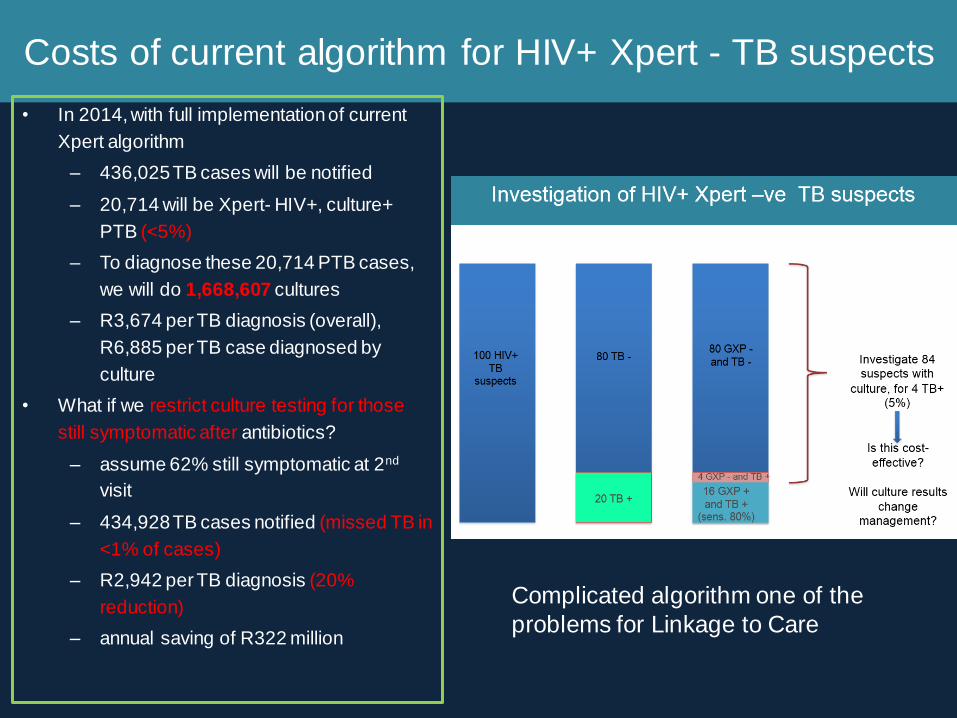
Costs of current algorithm for HIV+ Xpert - TB suspects
• In 2014, with full implementation of current
Xpert algorithm
– 436,025 TB cases will be notified
– 20,714 will be Xpert- HIV+, culture+
PTB (<5%)
– To diagnose these 20,714 PTB cases,
we will do 1,668,607 cultures
– R3,674 per TB diagnosis (overall),
R6,885 per TB case diagnosed by
culture
• What if we restrict culture testing for those
still symptomatic after antibiotics?
– assume 62% still symptomatic at 2nd
visit
– 434,928 TB cases notified (missed TB in
<1% of cases)
– R2,942 per TB diagnosis (20%
reduction)
– annual saving of R322 million
K. Bistline and W. Stevens
Complicated algorithm one of the
problems for Linkage to Care

Significant algorithm simplification required
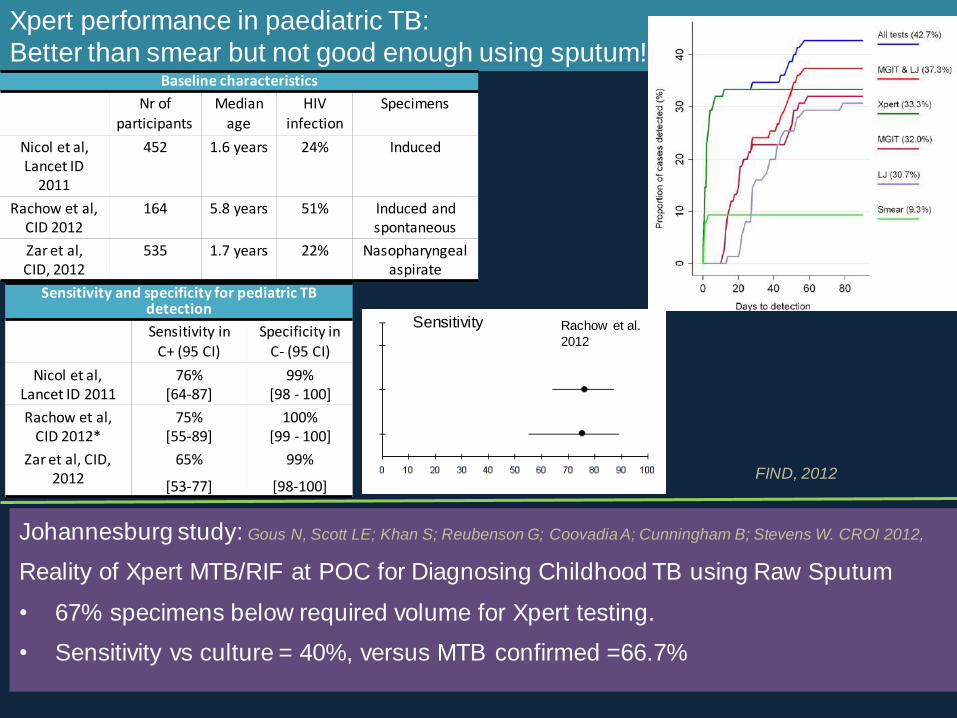
Xpert performance in paediatric TB:
Better than smear but not good enough using sputum!
Johannesburg study: Gous N, Scott LE; Khan S; Reubenson G; Coovadia A; Cunningham B; Stevens W. CROI 2012,
Reality of Xpert MTB/RIF at POC for Diagnosing Childhood TB using Raw Sputum
• 67% specimens below required volume for Xpert testing.
• Sensitivity vs culture = 40%, versus MTB confirmed =66.7%
Rachow et al.
2012
Baseline characteristics
Nr of
participants
Median
age
HIV
infection
Specimens
Nicol et al, Lancet ID
2011
452 1.6 years 24% Induced
Rachow et al, CID 2012
164 5.8 years 51% Induced and spontaneous
Zar et al, CID, 2012
535 1.7 years 22% Nasopharyngeal aspirate
Sensitivity and specificity for pediatric TB detection
Sensitivity in C+ (95 CI)
Specificity in C- (95 CI)
Nicol et al, Lancet ID 2011
76% [64-87]
99% [98 - 100]
Rachow et al, CID 2012*
75% [55-89]
100% [99 - 100]
Zar et al, CID, 2012
65%
[53-77]
99%
[98-100]
Sensitivity
FIND, 2012

Additional EPTB specimens other than FNA: Xpert Validation,
preliminary results (Aug – Jan2013): (Elizabeth Prentice, Lesley Scott, Gloria Nkuna, Natalie Beylis, Wendy Stevens)
Contamination:
NALC-NaOH
decontaminate
Residual Xpert tested:
>0.5ml
N=6112 routine EPTB
specimens received ~6 months
Blood agar plate check
for contamination
No contamination
Inoculate MGIT
(~0.5ml)
Exclusions: Numbers received in total <10 (0.6%) Not enough residual for Xpert – needs to
exceed 0.5 ml after routine processing (30%) • Most common specimens excluded:
• CSF (37%), • Pleural fluid (14%) • Other aspirates (9%)
•Blood (1%)

EPTB
Xpert testing Accuracy of the Xpert MTB/RIF assay for
diagnosis of HIV-associated peripheral
lymph node Tuberculosis (in press). Van Rie A, Page-Shipp L, Mellet K, Scott L, Mkhwanazi M, Stevens
W, Sanne I, Menezes CN.
• 152 adults referred for FNA
• Detection: 20%(n=30) smear +,
45%(n=69) culture +, 49%(n=76) Xpert +.
Miscellaneous (sample types <5)
1%
Miscellaneous (sample types <30)
2%
Blood 1%
Tissue
2%
Ascitic fluid
2%
Pus
4%
Fluid 5%
Aspirate
9%
Pleural fluid
10%
FNA 27%
Cerebrospinal
fluid 37%
EPTB specimen types received in a high throughput central laboratory,
n=6112 received in 6 months (April 2012-Jan 2013
• Sensitivity (culture reference)
– Xpert 94.2% (85-98)
– Did not differ by smear status or CD4 count
• Median time to diagnosis: lymph node TB
– 5 days microscopy
– 31 days culture DST
• Median time to treatment initiation
– 1 day using Xpert
• Median time for Rif resistance diagnosis
– 1 day using Xpert
– 47 days using culture/MTBDRplus

Findings
• Overall sensitivity of Xpert compared to
MGIT=55.9% (CI 48.8; 62.8)
• Absolute number: 159 new cases (18%
of total referrals)
• Cost-effective?
MGIT and
Xpert pos itive, 113, 13%
MGIT pos , Xpert
Negative; 89; 10%
MGIT negative Xpert pos itive;
46; 6% MGIT negative
, Xpert negative; 524;
61%
MGIT
contaminated,
Xpert negative; 70;
8%
MGIT contaminated,
Xpert pos itive; 19; 2%
MGIT and Xpert positivity
3 5 6 13
21 25
39
68
3 6 3
20 14
32 28
96
1 1 0 7 7 11 15
28
0
20
40
60
80
100
120
MGIT and Xpert positivity per specimen type
Xpert positive (incl culture contaminated) Culture pos Cul contam
3 6 3 20 14
32 28
96
3 4 6
12 20
22 32
60
0
20
40
60
80
100
120
140
160
180
Xpert positivty of MGIT
Cul pos Xpert pos
38%
53% 41%
59%
38%
67% 40% 50%

Ensuring on-going quality testing • Verification
– Once off or upon instrument placement,
maintenance / module swap-out
– Prove the instrument is “fit-for-purpose”
– Every module tested
• EQA
– Proficiency testing of the laboratory staff
– Assurance of instrument performance
– 3 x per annum/per instrument, cost?
• Continuous monitoring through remote
connectivity
Verification already performed for NHLS implemented instruments 2011-2012
GX4s GX16s GX48 Total
54 96 2 152
soon to be upgraded to Gx80 1 1
#Modules 216 1536 128 1880
Verification
using DCS
Gous N, Scott L, Prieur R, Kana B, Stevens W, 3rd SA TB Conference, June 2012, South Africa

Manufacture of bulk culture: single cell suspension
Inactivation in Xpert SR buffer (2 hrs), confirmation by MGIT
Quantitfy using flow cytometry: small particle counting (1um)
Calculate bacterial events/ul
Spot onto Whatman paper cards
Send to sites for Gx testing
How do you do verification and EQA with this modular format? No available EQA at time of initiation?
Novel approach using Dried Culture Spots
Scott LE, et al. Dried Culture Spots for Xpert MTB/RIF External Quality Assessment: Results of phase 1 pilot study from
South Africa. J Clin Microbiol. 2011 Dec;49(12):4356-60
Expanded to: Kenya, Malawi,
Mozambique, Zimbabwe and with AIDS
Clinical Trials Group (ACTG) to Brazil,
Peru and USA.

Global interest in DCS product
0
0,5
1
1,5
2
2,5
3
3,5
4
0 200 400 600 800 1000 1200 1400
SD o
f P
rob
e A
Number of modules verified
DCS variabiity per batch
average SD for probe A (2.73) across all modules tested
• # modules verified using DCS to date= 1261
• Average SD for probe A Ct = 2.7 • Total number errors = 24 (1.9%)

A multi-centre feasibility study to assess five EQA
panels for Xpert in South Africa
Collaborative project, NHLS, GLI, FIND, CDC, 2012/2013

Results under review by collaborators
Panel Vircell CDC MMQCI GLI DCS
Qualitative analysis (n=11)
Correct result 0 1 0 1 1
Instrument error related to volume 1 1 0 0 0
Cold chain and special packaging
required
1 1 0 1 1
Extra consumables required 1 1 0 0 0
Questionnaire (n=10)
Received in good condition 1 1 1 1 1
SOP clarity 0 1 0 1 1
Easy to open 1 0 1 1 0
Easy to handle 0 0 1 1 1
Easy to rehydrate and dissolves fully 1 1 1* 1* 1
Easy to transfer to Xpert cartridge 1 1 0 1 1
Quantitative analysis
Increased probe Ct SD above pool 1 0 1 0 1
PCR inhibition 1 1 1 1 1
Subtotal 9 9 6 9 9
Scoring System: up for modifications and suggestions
0,0
1,0
2,0
3,0
MTB detected, RIF sensitive (SD across probes and panels)
Vircell
CDC
MMQCI
GLI
DCS
0,01,02,03,04,05,06,0
MTB detected, RIF resistant,
across probes and panels
Vircell
CDC
CDC
MMQCI
GLI
DCS
Interest in Ct variability for
ensuring Rif call rates

Summary
• MMQCI panel, which was the only panel that required cold storage which
contributed to a lower score.
• All panels where received in good condition and therefore good for shipping
across distances, and all showed compatibility with the Xpert testing
process.
• No panel caused any PCR inhibition.
• Matrix requirement (liquid or dry) did not appear to be a distinguishing
criterion as had reduced scores on: insufficient volumes; need for extra
consumables; ability to transfer to the Xpert cartridge.
• Minimal variation in probe Ct may be more attractive for monitoring RIF call
rates using differences in probe drop out or probe delayed hybridisation.
• Factors such as SOP clarity, label bar-code scanning, and use of the web
based program highlight the need for any EQA program to be accompanied
by training and ongoing improvements.
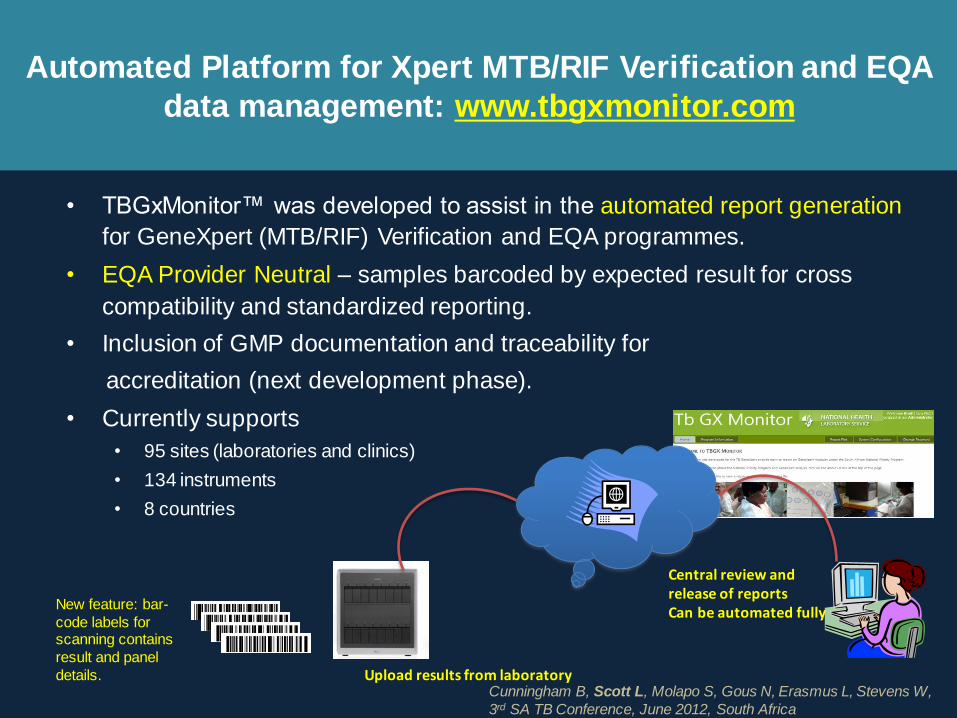
Automated Platform for Xpert MTB/RIF Verification and EQA
data management: www.tbgxmonitor.com
• TBGxMonitor™ was developed to assist in the automated report generation
for GeneXpert (MTB/RIF) Verification and EQA programmes.
• EQA Provider Neutral – samples barcoded by expected result for cross
compatibility and standardized reporting.
• Inclusion of GMP documentation and traceability for
accreditation (next development phase).
• Currently supports
• 95 sites (laboratories and clinics)
• 134 instruments
• 8 countries
Upload results from laboratory
Central review and release of reports Can be automated fully
New feature: bar-
code labels for scanning contains
result and panel
details. Cunningham B, Scott L, Molapo S, Gous N, Erasmus L, Stevens W,
3rd SA TB Conference, June 2012, South Africa
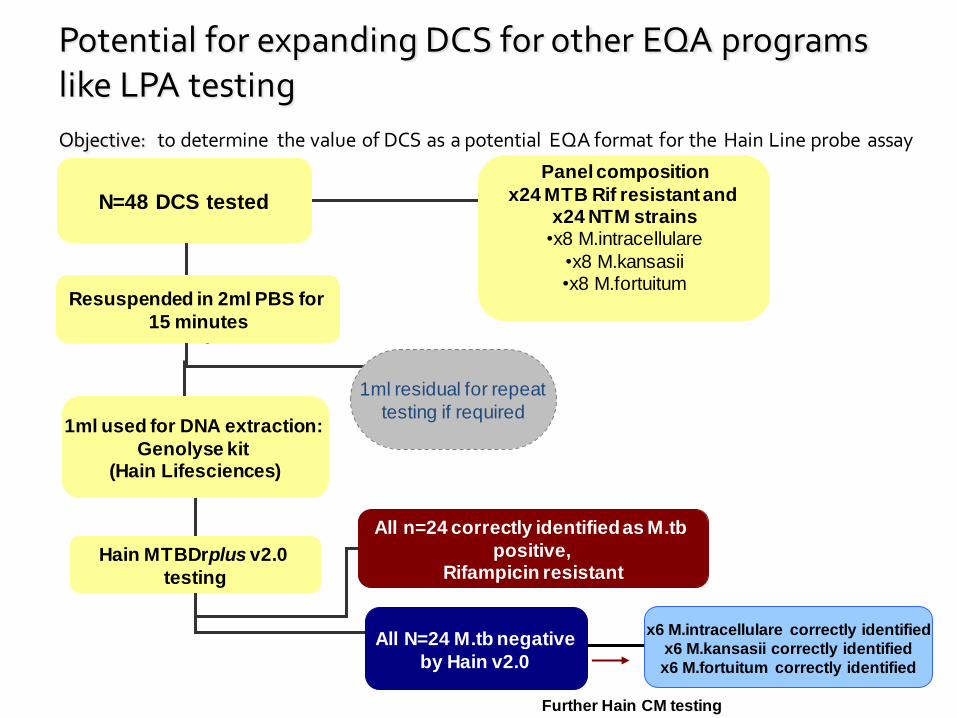
Potential for expanding DCS for other EQA programs like LPA testing
Objective: to determine the value of DCS as a potential EQA format for the Hain Line probe assay
N=48 DCS tested
Resuspended in 2ml PBS for
15 minutes
Panel composition
x24 MTB Rif resistant and x24 NTM strains
•x8 M.intracellulare
•x8 M.kansasii •x8 M.fortuitum
1ml used for DNA extraction:
Genolyse kit (Hain Lifesciences)
Hain MTBDrplus v2.0
testing
All n=24 correctly identified as M.tb
positive, Rifampicin resistant
1ml residual for repeat
testing if required
All N=24 M.tb negative
by Hain v2.0
x6 M.intracellulare correctly identified
x6 M.kansasii correctly identified
x6 M.fortuitum correctly identified
Further Hain CM testing

Cepheid/NHLS Remote Connectivity project
• Operational
dashboard for
real-time
monitoring of
results, errors,
resistance and
positivity rates
• Pre-configured
on all newly
installed
GeneXperts
User Workshop held 5-9th November to improve usability
and facilitate design changes, Johannesburg

How can the dashboard tool be used for
improved program management
• Common features between NHLS
LIS and Cepheid monitoring tool.
• Validation against NHLS LIS
showed 1% bias due to duplicate removal and repeat on error testing
not extracted by LIS.

Reduction in TB detection over time:
visualize semi-quantitative values.
-
5,00
10,00
15,00
20,00
25,00
3 4 5 6 7 8 9 10 11 12 1 2 3 4 5 6 7 8 9 10 11 12 1 2 3
2011 2012 2013
National GeneXpert MTB positivity
LIS
Cepheid
remote
monitoring
“Community bacterial load?” Can Xpert be used for surveillance (probe frequency, Ct) Scott LE, et al. CROI 2012, Seattle.

NPP data analysis to date: What can we learn from n=33 858 MTBC positive Xpert Ct values?
0
500
100
01
50
02
00
0
Fre
que
ncy
0 10 20 30 40PROBE_E_CT_VALUE
Courtesy Scott, Stevens 2012
Probe E
0
500
100
01
50
02
00
0
Fre
que
ncy
0 10 20 30 40PROBE_D_CT_VALUE
Probe D
0
500
100
01
50
02
00
0
Fre
que
ncy
0 10 20 30 40PROBE_B_CT_VALUE
Probe B
0
500
100
01
50
02
00
0
Fre
que
ncy
0 10 20 30 40PROBE_A_CT_VALUE
Probe A
0
500
100
01
50
02
00
0
Fre
que
ncy
0 10 20 30 40PROBE_C_CT_VALUE
Probe C
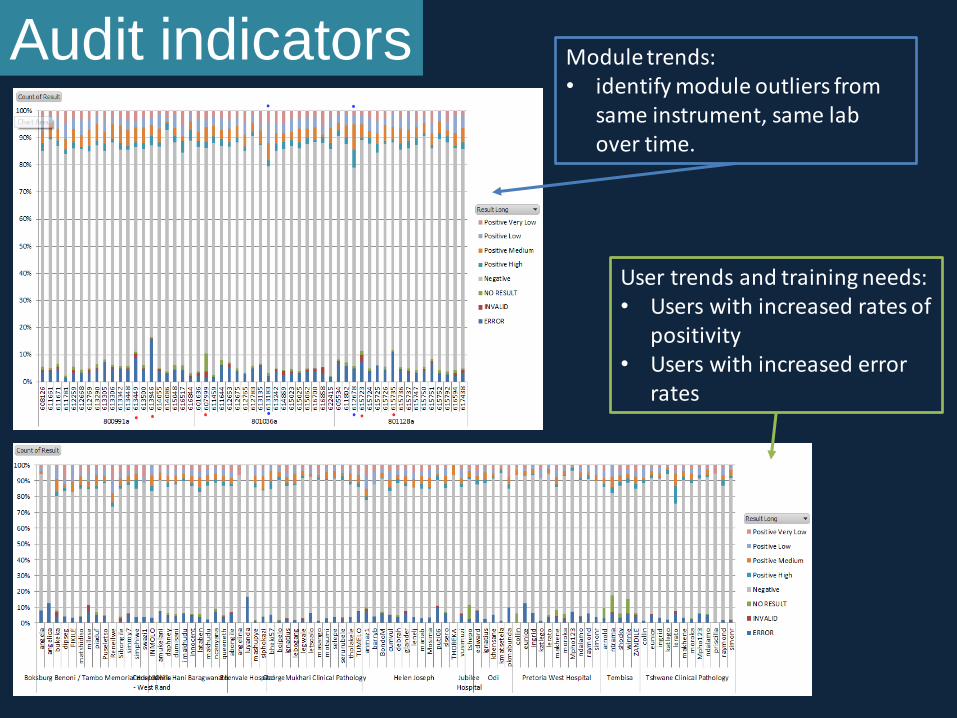
Audit indicators Module trends: • identify module outliers from
same instrument, same lab over time.
User trends and training needs: • Users with increased rates of
positivity • Users with increased error
rates

Workflow analysis and throughput vs capacity
• Testing times/day/week
– Identifies 8h, 12h, 24hr workflow
– Actual testing vs capacity
G3 to G4
change over

Training needs and managing staff turnover
Higher
error rates
at first
testing
High staff
turnover and
staff task shifting

Module failure Cepheid remote monitoring tool.
• # tests analysed =348 645
• # modules = 1 335
– Max number results/module = 1 424
– Median number results/module = 197
– Max number errors/module = 137
– Number of errors/day/module = 7
– Problem modules = 101
(>7% error rate)
0%
20%
40%
60%
80%
100%
120%
0 200 400 600 800 1000 1200 1400 1600
Erro
r R
ate
Number of tests
# Tests vs # Errors
Higher the test
number = lower module failure
Problem
modules
0-100; 21; 14%
100-200; 41; 27%
200-300; 51; 34%
300-400; 12; 8%
400-500; 11; 7%
500-700; 14; 10%
0-100
100-200
200-300
300-400
400-500
500-700
# days
Time and number
of module failure
Total No. of Modules 1888
No of Modules Replaced 150
% Replaced within 2 Yrs. (n=150) 7.94
% Replaced within 1 Yr. (n=125) 6.62
Ẋ Time to Failure 278
Median Time to Failure 219
Max 699
Min 2
NHLS LIS

Overcoming hurdles to rollout Calibration:
Too expensive and impractical?
NHLS collaboration with Cepheid
• Calibration cartridges as opposed to swap-out module.
• Run cartridge as a normal Xpert assay (21minutes)
• Software calibration is performed once the calibration file has been
verified by Cepheid
• Calibration key = barcode to be scanned in the calibration software
to activate the calibration.
• Phase 1 (June 2012) and 2 (August 2012) study completed
• Expected product launch December 2012
• Original annual costs: R7,148,940 ($831 272) (quoted costs +
travel costs for current instrument load)
• 80% reduction in costs anticipated?
User runs calibration software & loads the calibration cartridges
Cepheid analyzes data
Activation code is provided to user to update calibration
Certificate issued
Customer Service notified for follow-up
Data sent by internet or by CD
Courtesy FIND 201
5 cartridges

Remote calibration
of GX modules
• Two Gx 16 modules
were tested using DCS
verification material
before and after remote
calibration.
– n=6 modules failed (4 x
Valve drive failures, 1 x
Ambient Temperature
failure) before 6 months.

Pre-post calibration
Ct value analysis
• Probe A evaluated:
– Ct decrease after calibration
– Less variability in Ct after calibration
– Not statistically significant (p=0.175)
• 2000 tests or 1 year may not be the optimal indicator for
calibration but rather change in SD of Ct value/module
• Concern: the use of Ct for patient monitoring?
0
5
10
15
20
25
30
35
Ct
valu
e
Module name
Pre and post calibration Ct for probe A: Instrument 1
Pre cal
Post cal
0
5
10
15
20
25
30
Ct
valu
e
Module name
Pre and post calibration Ct for probe A: Instrument 2
Pre cal
Post cal
Pre calibration post calibration
Instrument 1 (n=13) Average Ct 18.5 17.9
SD 4.4 1.6
Instrument 2 (n=11) Average Ct 19.3 17.4
SD 2.2 1.5

Cost-effectiveness doesn’t equal
affordability or uptake: linkage to care!
(Clouse, K et al, SAMJ 2012)
• Feasibility and impact of Gx at POC (~2hr test result).
– Concerns: Expanding Xpert to POC could result in important patient
benefits but requires substantial strengthening of primary care facilities
and investment in human resources (a minimum of two full-time staff
required to supervise sputum collection, process sputum, perform
assays, document and communicate results for an average of 15 TB
suspects daily). Some patients did not receive same day treatment due
to specimen preparation times.

Current Challenges
• Global shortages of cartridges • Situation resolving with deliveries of backorders currently underway
– Remains a concern as other countries come on- line • Phased implementation: Incomplete access to testing: two algorithms
in place (smear & GXP)
– Equity issues: rollout of instrumentation brought forward
– Confusion at lab and clinical level • Non-adherence to algorithm / confusion regarding test requests
– No confirmatory testing for Rif resistant (from 20-40%)
– Multiple tests requested on one form
– Simplification required
• Paediatric Testing, Extra-pulmonary samples
• Level of placement (sub-district labs v clinics)
– NTCM (XICM): 46% more expensive per year at full-scale, largely because of
economies of scale. Schnippel K, Meyer-Rath G, Long L, Macleod W, Sanne I, Stevens W.S, & Rosen S.
(2012). Scaling up Xpert MTB/RIF technology: the costs of laboratory- vs. clinic-based roll-out in South Africa. Tropical
medicine & international health: TM & IH, June 2012
– GXP in clinic: required 2.5 staff members to get 15 patients from test to
treatment same day. Clouse K, Page-Shipp L, Dansey H, Moatlhodi B, Scott L, Bassett J, Stevens WS, Sanne I, van
Rie A. Implementation of Xpert MTB/RIF for routine point-of-care diagnosis of tuberculosis at the primary care level. Accepted to
PLOS Medicine, March 2012

Solutions and Action needed… • Confidence in technology capabilities and limitations
• Development of a clinical algorithm: requires urgent review
• Training of both laboratory and clinical staff massive ramping up required
• Slowed down by a temporary global shortage of cartridges: stable stock
supply
• Appropriate instrument placement: flexibility needed
• All instruments interfaced in real-time to central data monitoring system (LIS
for results,
• Rolling out of remote connect system for instrument performance and
continuous quality monitoring
• Finalization of EQA plan
• Remote calibration performance reviewed
• Need for electricity, sensitive to huge temperature fluctuations
• HEALTH SYSTEM STRENGTHENING NEEDED: FIRST STEP IN
CONTINUUM OF CARE

Xpert MTB/RIF field testing for NDoH campaign
and using DCS to verify mobile Gx units.

World TB day: 10 X GX16 in mobile vehicles
Acknowledgements • Honorable Minister of Health: Dr Motsoaledi
• NHLS National Priority Program staff : Dr Leigh Berrie, Mr Sebaka Molapo
• NDoH: Drs Mametje, Pillay, Mvusi, Barron. Mabope, Nshuti
• Centre for Tuberculosis: Drs N. Ismail. L.Erasmus
• CDC for funding and support
• HERO team, G. Meyer –Rath, K. Bistline, Prof S.Rosen, Dr Billl Macleod
• Right to care: Prof Ian Sanne
• MM&H: Prof Scott, N. Gous, B. Cunningham, Dr E.Prentice
• Centre for TB excellence: Dr Bavesh Khana
• NHLS TB Expert working group: Dr A Whitelaw, Prof M.Nichol
• USAID, South Africa
• FIND: new work on EQA, R&D projects: Heidi Albert, Dr Boehme
• Aurum Institute: Prof G Churchyard, XTEND study and staff
• Bill and Melinda Gates foundation
• Cepheid for new collaboration: regarding remote calibrations and connectivity
• Arnoud and Alex de Nooy: supported my projects over a 15 year period