Embed Size (px)
Citation preview

8/11/2019 South Africa Environmental Performance Review - Highlights
http://slidepdf.com/reader/full/south-africa-environmental-performance-review-highlights 1/16
South AfricaHIGHLIGHTS
2013

8/11/2019 South Africa Environmental Performance Review - Highlights
http://slidepdf.com/reader/full/south-africa-environmental-performance-review-highlights 2/16
What are EPRs?The OECD conducts in-depth assessments of the
environmental policies and programmes of selected
OECD and key partner countries. These Environmental
Performance Reviews (EPRs) identify good practice and make
recommendations to strengthen the reviewed countries’
environmental management and instruments they use
to promote green growth. They result from a peer review
process in which countries periodically review each other on
an equal basis.
The EPRs are based on evidence and facts derived fromsound national and international data. The EPR programme
emphasises the use of economic analysis. Since work began
in 1992, over 70 EPRs of OECD member and partner countries
have been conducted.
WHAT IS SOUTH AFRICA’S REPORT ABOUT?
South Africa is a Key Partner for the OECD, meaning it
has the opportunity to participate in the work of the
Organisation, and to benefit from in-depth, high qualityanalysis of its economic, social and environmental
performance based on international best practices. These
highlights summarise the first OECD review of South Africa’s
environmental performance – the result of a constructive
and mutually beneficial policy dialogue between South
Africa and the OECD Working Party on Environmental
Performance. The full report presents 36 recommendations;
these highlights summarise the main findings, with a special
emphasis on:
lGreen growth
l
Environmental governancelBiodiversity
lMining
“Green growth should be at the
heart of South Africa’s economic
strategy and its efforts to overcomeits environmental challenges.”
Angel Gurría, OECD Secretary-General
8/11/2019 South Africa Environmental Performance Review - Highlights
http://slidepdf.com/reader/full/south-africa-environmental-performance-review-highlights 3/16
3
HI GHL I GHT S
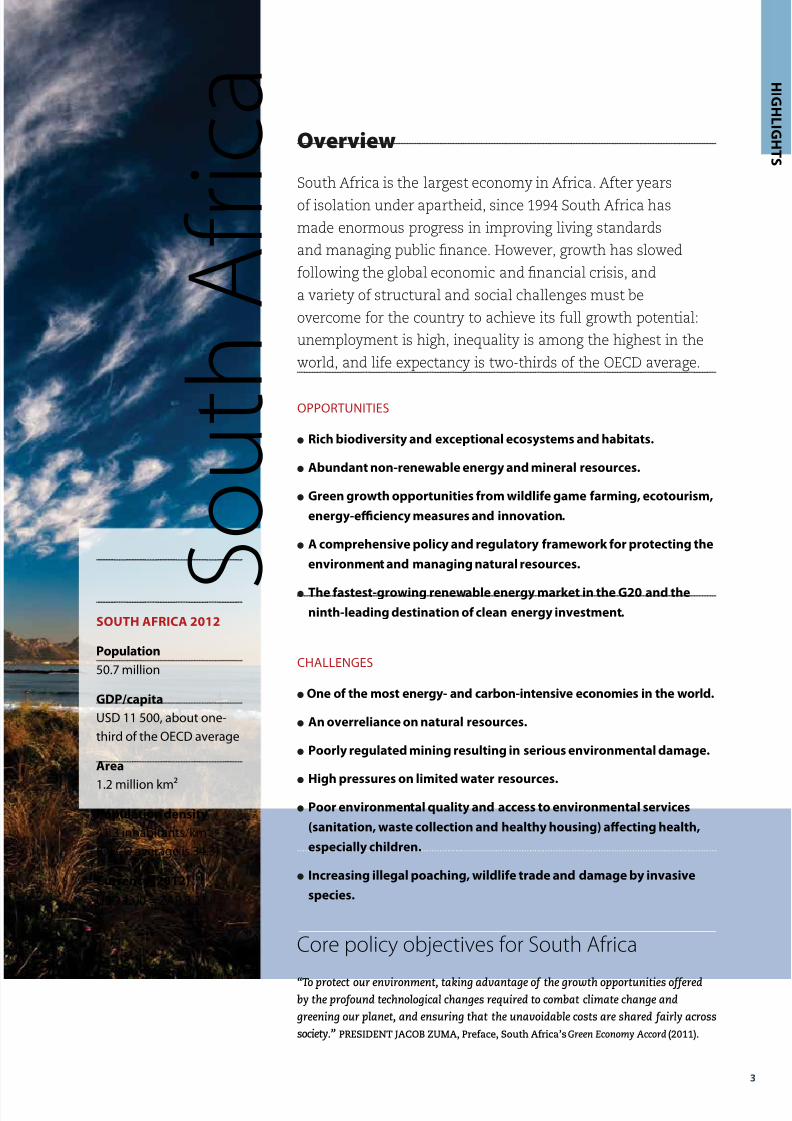
Core policy objectives for South Africa
“To protect our environment, taking advantage of the growth opportunities offeredby the profound technological changes required to combat climate change and
greening our planet, and ensuring that the unavoidable costs are shared fairly across
society.” PRESIDENT JACOB ZUMA, Preface, South Africa’s Green Economy Accord (2011).
S o u t h
A f r i c a
Overview
South Africa is the largest economy in Africa. After years
of isolation under apartheid, since 1994 South Africa has
made enormous progress in improving living standards
and managing public finance. However, growth has slowed
following the global economic and financial crisis, and
a variety of structural and social challenges must be
overcome for the country to achieve its full growth potential:
unemployment is high, inequality is among the highest in the
world, and life expectancy is two-thirds of the OECD average.
OPPORTUNITIES
lRich biodiversity and exceptional ecosystems and habitats.
lAbundant non-renewable energy and mineral resources.
lGreen growth opportunities from wildlife game farming, ecotourism,
energy-efficiency measures and innovation.
lA comprehensive policy and regulatory framework for protecting the
environment and managing natural resources.
lThe fastest-growing renewable energy market in the G20 and the
ninth-leading destination of clean energy investment.
CHALLENGES
lOne of the most energy- and carbon-intensive economies in the world.
lAn overreliance on natural resources.
lPoorly regulated mining resulting in serious environmental damage.
l
High pressures on limited water resources.
lPoor environmental quality and access to environmental services
(sanitation, waste collection and healthy housing) affecting health,
especially children.
lIncreasing illegal poaching, wildlife trade and damage by invasive
species.
SOUTH AFRICA 2012
Population
50.7 million
GDP/capita
USD 11 500, about one-
third of the OECD average
Area
1.2 million km²
Population density
41.3 inhabitants/km²
(OECD average is 34.3)
Currency (2012)
USD 1.00 = ZAR 8.21

8/11/2019 South Africa Environmental Performance Review - Highlights
http://slidepdf.com/reader/full/south-africa-environmental-performance-review-highlights 4/16
4
Green growth indicators are a standard feature of all Environmental Performance Reviews. They are based on the
OECD’s green growth indicators: (1) the environmental and resource productivity of the economy; (2) the natural
asset base; and (3) the environmental dimension of quality of life. These have been assessed for South Africa using
national and international data.
ENVIRONMENTAL AND RESOURCE PRODUCTIVITY
OF THE ECONOMY
lSouth Africa is one of the world’s top 20 emitters of
greenhouse gases (GHGs). These emissions have tracked
economic growth (Figures 1 and 2).s
lGreenhouse gas emissions per capita are high compared to
China or Brazil, but below the OECD average.
lThe energy sector is the largest, and growing, source of CO2
emissions, reflecting the coal-dominant structure of energy
(74%) and electricity supply (94%) and the under-pricing of
this fossil fuel.
lDespite high potential, the share of renewable energy
(mostly from biomass and waste) in energy supply was
only 11% during the 2000s. Renewables account for only
1% of total electricity generation.
lAt about 300 kg per person per year, municipal waste
generation is still well below the level of most OECD
countries. Landfilling continues to be the predominant
type of waste treatment, accounting for over 90% of the
total. More than 80% of municipalities have initiated
recycling, but lack of capacity and funding mean these
programmes are often not maintained. In 2010, only
4.5% of waste collected from households was recycled,
compared with the OECD average of 24%.
Green growth indicators | South Africa
OECD : SOUTH AFRICA ENVIRONMENTAL PERFORMANCE REVIEW
0
50
100
150
200
1990 1992 1994 1996 1998 2000 2002 2004 2006 2008 2010
Tracking economic growth
2 Total primary energy supplyCO from energy useGDP
1990=100
0
20
40
60
80
100
120
140
160
1995 1997 1999 2001 2003 2005 2007 2009
Coal/coal products Oil
Natural gas Nuclear
Renewables
Mtoe Energy supply by source
0.0
0.2
0.4
0.6
0.8
1.0
1.2
1.4
F r a n
c e
S p a i n
U n i t e
d
K i n g
d o m
I t a l y
J a p a
n
G e r m
a n y
T u r k e y
U S A
C a n a
d a
P o l a
n d
A u s t r a l i a
I n d i a
B r a z i l
S o u t h
A f r i c
a
C h i n
a
R u s s i a
t/1 000 USD (2005 prices and PPP)
OECD
Figure 2: GHG emissions per unit of GDP, 2010
Figure 1: GHG emissions and energy mix
8/11/2019 South Africa Environmental Performance Review - Highlights
http://slidepdf.com/reader/full/south-africa-environmental-performance-review-highlights 5/16
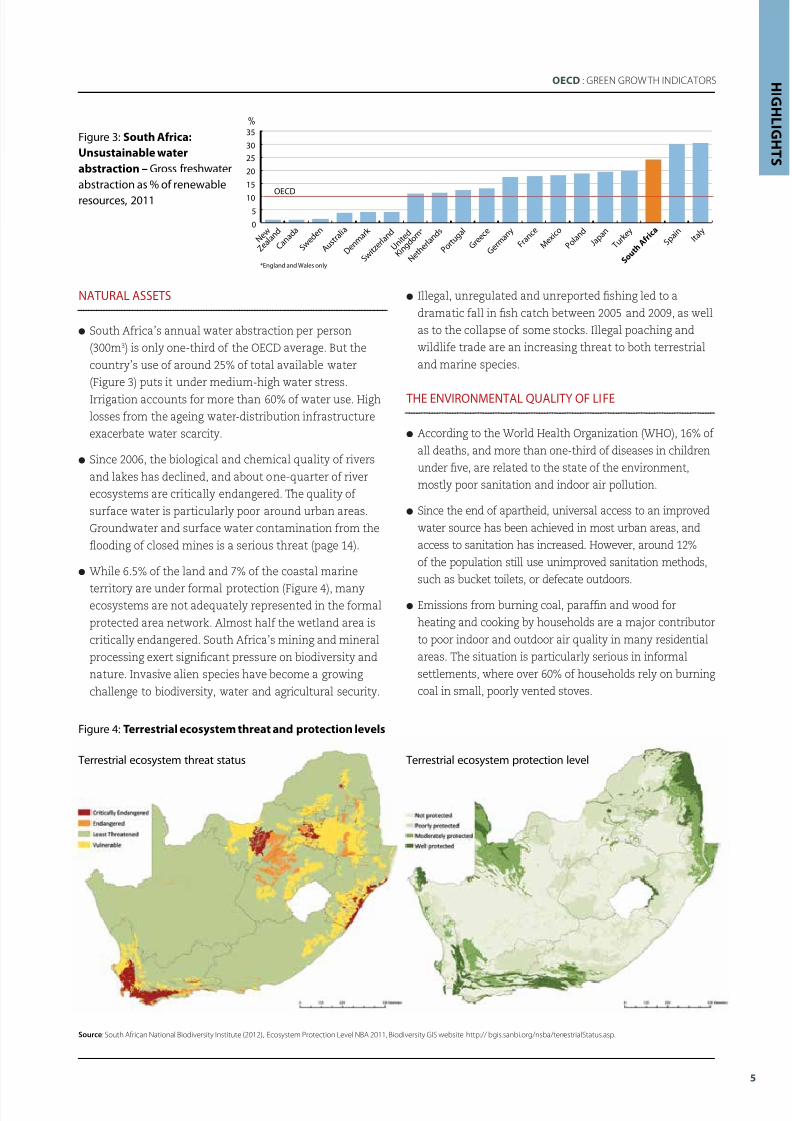
NATURAL ASSETS
lSouth Africa’s annual water abstraction per person
(300m3) is only one-third of the OECD average. But the
country’s use of around 25% of total available water
(Figure 3) puts it under medium-high water stress.
Irrigation accounts for more than 60% of water use. High
losses from the ageing water-distribution infrastructure
exacerbate water scarcity.
lSince 2006, the biological and chemical quality of rivers
and lakes has declined, and about one-quarter of river
ecosystems are critically endangered. The quality of
surface water is particularly poor around urban areas.
Groundwater and surface water contamination from the
flooding of closed mines is a serious threat (page 14).
lWhile 6.5% of the land and 7% of the coastal marine
territory are under formal protection (Figure 4), manyecosystems are not adequately represented in the formal
protected area network. Almost half the wetland area is
critically endangered. South Africa’s mining and mineral
processing exert significant pressure on biodiversity and
nature. Invasive alien species have become a growing
challenge to biodiversity, water and agricultural security.
lIllegal, unregulated and unreported fishing led to a
dramatic fall in fish catch between 2005 and 2009, as well
as to the collapse of some stocks. Illegal poaching and
wildlife trade are an increasing threat to both terrestrial
and marine species.
THE ENVIRONMENTAL QUALITY OF LIFE
lAccording to the World Health Organization (WHO), 16% of
all deaths, and more than one-third of diseases in children
under five, are related to the state of the environment,
mostly poor sanitation and indoor air pollution.
lSince the end of apartheid, universal access to an improved
water source has been achieved in most urban areas, and
access to sanitation has increased. However, around 12%
of the population still use unimproved sanitation methods,
such as bucket toilets, or defecate outdoors.
lEmissions from burning coal, paraffin and wood for
heating and cooking by households are a major contributor
to poor indoor and outdoor air quality in many residential
areas. The situation is particularly serious in informal
settlements, where over 60% of households rely on burning
coal in small, poorly vented stoves.
5
OECD : GREEN GROW TH INDICATORS
Source: South African National Biodiversity Institute (2012), Ecosystem Protection Level NBA 2011, Biodiversity GIS website http:// bgis.sanbi.org/nsba/terrestrialStatus.asp.
Figure 4: Terrestrial ecosystem threat and protection levels
0
5
10
15
20
25
30
35
*England and Wales only
N e w
Z e a l a
n d
C a n a
d a
S w e d
e n
A u s t r
a l i a
D e n m
a r k
S w i t z
e r l a n
d
U n i t e
d
K i n g d
o m *
N e t h
e r l a n
d s
P o r t u
g a l
G r e e
c e
G e r m
a n y
F r a n
c e
M e x i c o
P o l a n
d J a
p a n
T u r k e y
S o u t h
A f r i c
a
S p a i n I t a
l y
%
OECD
Figure 3: South Africa:
Unsustainable water
abstraction – Gross freshwaterabstraction as % of renewable
resources, 2011
HI GHL I GHT S
Terrestrial ecosystem protection levelTerrestrial ecosystem threat status

8/11/2019 South Africa Environmental Performance Review - Highlights
http://slidepdf.com/reader/full/south-africa-environmental-performance-review-highlights 6/16
6
The New Growth Path, the government’s 2010-20 economic strategy, provides a vision for a more inclusive and
greener economy. One of its five priorities is to produce environment-growth-employment synergies by expanding
the production of technologies for solar, wind and biofuels. In 2011, South Africa launched a Green Economy Accord
to promote partnerships with the private sector and others to green the economy.
INVESTING TO PROMOTE GREEN GROWTH
Transition to a low-carbon, resource-efficient and equitable
economy will require substantial investments in energy,
transport, and environmental infrastructure (water,
sanitation, waste management). However, weaknesses
in planning, implementation and monitoring capacity
have slowed down implementation, especially at local
level, and discouraged private sector investment. Limited
implementation of increasing-block tariffs (water tariffs
that increase with consumption), generous rebates and
discounts, and low collection rates mean that revenue
from service charges is too low to cover operational and
maintenance costs, let alone investment. The government
provides free basic levels of electricity, water and waste
services to poor households. However, this policy is not well-
targeted and can benefits relatively better-off householdsin several municipalities. It may also create expectations
about free entitlement to services that ultimately should be
paid for by users.
In 2012, the government launched a massive infrastructure
programme focused on energy, transport and water. The
Integrated Resource Plan caps GHG emissions from the
electricity sector and envisages that nearly half of new
power generation to 2030 will come from renewable sources.
In 2012, after some implementation delays, South Africa
became the fastest growing renewable energy market in the
G20. Further improving transport infrastructure would help
reduce congestion, air pollution and GHG emissions, as well
as improve the mobility of communities dispersed under
apartheid. The National Treasury allocated ZAR 800 million
between 2012 and 2015 for South Africa’s Green Fund, to
finance high-quality, high-impact green economy projects
and capacity-building activities that would leverage private
investment. However, there is a need to scale-up private
finance for environment-related investment.
GREEN JOBS
The New Growth Path classifies the green economy as
one of 10 jobs drivers; it aims to create 5 million jobs by
2020, 300 000 of them in the “green industry”. Sectors with
employment potential, including for low-skilled workers, are
infrastructure development, natural resource management,
energy efficiency, and emissions and pollution mitigation.
While there is a risk that the net impact on job creationmay prove over-optimistic, this should not detract from
pursuing the transition to a greener economy.
GREEN TAX REFORM
South Africa applies a wide range of taxes on energy
products, vehicles, air travel and waste. Revenue from
“green taxes” (e.g. on electricity and cars) has increased
to about 2.1% of GDP in 2011, close to the OECD average.
Higher green taxes could contribute to a more pro-growth,
pro-poor tax structure, but should be accompanied by
compensatory social benefits for the many low-income
households.
Policies for green growth
OECD : SOUTH AFRICA ENVIRONMENTAL PERFORMANCE REVIEW
WHAT’S DRIVING GREEN GROWTH POLICIES IN SOUTH
AFRICA?
lThe global economic crisis prompted South Africa to
reappraise its carbon and resource-intensive growth model.
lHigh unemployment, especially among young people (51%
in the fourth quarter of 2012): the green economy is seen as a
job driver.
lVoluntary GHG mitigation commitment to bring emissions
42% below business as usual by 2025.

8/11/2019 South Africa Environmental Performance Review - Highlights
http://slidepdf.com/reader/full/south-africa-environmental-performance-review-highlights 7/16
0
100
200
300
400
T u r k e y I t a l y
U n i t e d K i n g d o m
G e r m a n y
F r a n c e
J a p a n
S p a i n
K o r e a
P o l a n d C h i l e
A u s t r a l i a
S o u t h
A f r i c a
C a n a d a
U n i t e d S t a t e s
Petrol Diesel
EUR/tonne CO2
lStreamline financing and incentive mechanisms to
increase investment and private sector finance in the
green economy.
lEnhance municipalities’ administrative capacity for
infrastructure and service delivery.
lReform the pricing of water, sanitation and waste
collection to progressively cover these services’ costs;
gradually phase out the free allowances for electricity,
water and waste services, while providing social transfers
to poor households.
lImprove transport infrastructure and the integration of
transport and urban planning policies.
lExtend and improve the use of green taxes; use the
revenue to reduce impacts on the poor and/or fund
infrastructure and other high-priority areas.
lApply a uniform, simple tax on the carbon content of
fuels across all sectors to achieve GHG emission targets.
lContinue to reduce explicit and implicit subsidies for
electricity and coal consumption.
Next steps | towards green growth
Despite a substantial increase, transport fuel taxes imply
much lower carbon prices than in most OECD member
countries (Figure 5). Transport fuel prices are also lower
than in other emerging economies and even some poorer
African countries. In 2009, South Africa introduced a levy
on all electricity from non-renewable sources to discourage
fossil fuel use and encourage electricity savings. The levy has,
however, been overshadowed by increasing electricity prices.
Its rate is equivalent to a relatively low carbon price (about
ZAR 35 per tonne of CO2). Current proposals for a carbon
tax also set the rate too low and contain an array of reliefmeasures for energy-intensive and trade-exposed sectors.
These would weaken incentives to reduce GHG emissions,
while increasing administrative burdens on both the
government and operators.
SUBSIDY REFORM
Several of South Africa’s fiscal and energy policies generate
subsidies with potentially negative environmental impacts.
A long period of low coal and electricity prices has driven one
of the world’s most energy and carbon-intensive economies.
Preferential access for Eskom (the sole energy utility) to
domestic coal implies large subsidies - equivalent to 2.5% of
GDP. Some energy-intensive industries pay well below the
average electricity price.
In response to a series of power outages, electricity prices
began to increase sharply from 2008, and are set to grow
further to cover generation and investment costs by 2018.
This price increase has helped reduce the implicit subsidies
to fossil fuel consumption to 0.3% of GDP in 2011, compared
to 1.4% of GDP in Mexico and 2.5% of GDP in India. Phasing
out fossil fuel consumption subsidies altogether would helpimprove energy efficiency and could reduce South Africa’s
GHG emissions by 3% by 2050 compared with business as
usual (excluding land use, land-use change and forestry).
7
Figure 5: South Africa’s low carbon price on road fuels
HI GHL I GHT S

8/11/2019 South Africa Environmental Performance Review - Highlights
http://slidepdf.com/reader/full/south-africa-environmental-performance-review-highlights 8/16
8
PREVENTING BIOPIRACY: Thanks to
profitable European markets, a marginalised
community in Suid Bokkeveld district
in the Cape Floristic Region of Northern
Cape Province has been benefitting fromthe sale of a certified organic rooibos tea.
Since its formation in 2001, the Heiveld
Co-operative and its members have been
certified organic; since 2003, they have also
been certified “fair trade” by the Fairtrade
Labelling Organization. The plant has been
the focus of two attempts by international
businesses to claim rooibos-related benefits
without reference to internationally-agreed
guidelines on access to, and benefit-sharing
for, genetic resources. Protests, petitions and
lawsuits led the firm to surrender the nameto the public domain.
BIODIVERSITY STE WARDSHIP BY
THE WINE INDUSTRY: Nearly 95% of the
country’s wine is produced in the Cape
Floral Kingdom (CFK), the richest – and
also the smallest – plant kingdom on the
planet. Despite being recognised both as
a global biodiversity hotspot and a WorldHeritage site, the CFK has come under
increasing pressure from agriculture,
urban development and invasive alien
species. In 2004, just 4% of the CFK’s
unique renosterveld plant community and
vegetation type remained, and much of
its lowland fynbos ecosystems was underthreat. In response, the wine industry
developed a conservation partnership
with NGOs to set aside at least 10% of
their farmland for long-term conservation
to minimise the loss of threatened
biodiversity and encourage sustainable
land management practices on wine
farms. The success of the Biodiversity and
Wine Initiative has meant that today more
hectares are protected for conservation than
are currently under grape production in the
Cape’s winelands. Other provinces are alsoapplying the many valuable lessons learned.
Case studies
BIODIVERSITY OFFSETS AND
MINING: Namaqualand (Northern Cape)is developing “restoration packs” that can
be used to promote biodiversity and offset
what is lost in development projects. The
packs contain locally-appropriate seeds, soil
ameliorants and equipment for planting
to stabilise the tailings of diamond mines.
Anglo Coal has agreed to rehabilitate two
offsite wetlands (Dunns farm and Thubalihle
wetlands) that
cover an area of46 ha in the Upper
Olifants river catchment
in Mpumalanga Province.
This is the first wetland offsite
mitigation scheme in South
Africa and was a pre-condition
for granting mining authorisation.
OECD : SOUTH AFRICA ENVIRONMENTAL PERFORMANCE REVIEW
Namaqualand
Suid Bokkeveld
Cape Floral Kingdom
8/11/2019 South Africa Environmental Performance Review - Highlights
http://slidepdf.com/reader/full/south-africa-environmental-performance-review-highlights 9/16
9
OECD : CASE STUDIES
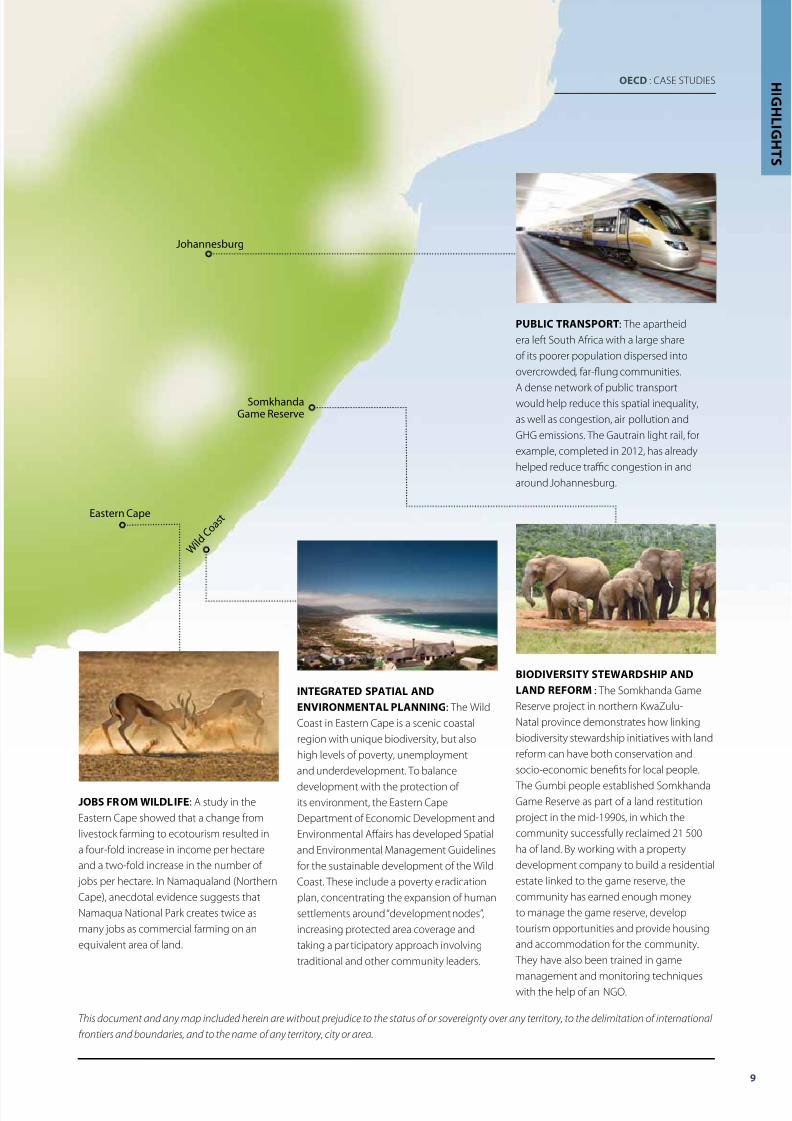
INTEGRATED SPATIAL AND
ENVIRONMENTAL PLANNING: The Wild
Coast in Eastern Cape is a scenic coastal
region with unique biodiversity, but also
high levels of poverty, unemployment
and underdevelopment. To balance
development with the protection ofits environment, the Eastern Cape
Department of Economic Development and
Environmental Affairs has developed Spatial
and Environmental Management Guidelines
for the sustainable development of the Wild
Coast. These include a poverty eradication
plan, concentrating the expansion of human
settlements around “development nodes”,
increasing protected area coverage and
taking a par ticipatory approach involving
traditional and other community leaders.
BIODIVERSITY STEWARDSHIP AND
LAND REFORM : The Somkhanda Game
Reserve project in northern KwaZulu-
Natal province demonstrates how linking
biodiversity stewardship initiatives with land
reform can have both conservation and
socio-economic benefits for local people.
The Gumbi people established SomkhandaGame Reserve as part of a land restitution
project in the mid-1990s, in which the
community successfully reclaimed 21 500
ha of land. By working with a property
development company to build a residential
estate linked to the game reserve, the
community has earned enough money
to manage the game reserve, develop
tourism opportunities and provide housing
and accommodation for the community.
They have also been trained in game
management and monitoring techniqueswith the help of an NGO.
This document and any map included herein are without prejudice to the status of or sovereignty over any territory, to the delimitation of international
frontiers and boundaries, and to the name of any territory, city or area.
PUBLIC TRANSPORT: The apartheid
era left South Africa with a large share
of its poorer population dispersed into
overcrowded, far-flung communities.
A dense network of public transportwould help reduce this spatial inequality,
as well as congestion, air pollution and
GHG emissions. The Gautrain light rail, for
example, completed in 2012, has already
helped reduce traffic congestion in and
around Johannesburg.
JOBS FR OM WILDLIFE: A study in the
Eastern Cape showed that a change from
livestock farming to ecotourism resulted in
a four-fold increase in income per hectare
and a two-fold increase in the number of
jobs per hectare. In Namaqualand (Northern
Cape), anecdotal evidence suggests that
Namaqua National Park creates twice as
many jobs as commercial farming on an
equivalent area of land.
Johannesburg
Eastern Cape
SomkhandaGame Reserve
W i l d
C o a
s t
HI GHL I GHT S

8/11/2019 South Africa Environmental Performance Review - Highlights
http://slidepdf.com/reader/full/south-africa-environmental-performance-review-highlights 10/16
10
One of the most significant institutional changes in South Africa since the end of apartheid has been its ambitious
decentralisation programme, giving greater authority and autonomy to local government. The Constitution
designates the environment as an area of joint national and provincial responsibility. Thus multiple levels of
government agencies both produce and enforce regulations. This brings challenges, especially in land use and water
resource management, where the relationship between different levels of government is most difficult, and there are
substantial gaps in implementation, capacity, funding and management.
OPPORTUNITIES
Targeted local action. Decentralised governance enables
lower levels of government to tailor their interventions tobalance local benefits and costs.
Mainstreaming the environment . An innovative system of
intergovernmental co-ordination at national level based on
performance agreements has already helped mainstream
environmental considerations into the policies, measures
and programmes of other government departments.
Strengthened enforcement powers. Enforcement of a new
generation of environmental policies has been significantly
strengthened by the creation of an Environmental
Management Inspectorate (see next page) working in
specialised units.
Integrated water management. South Africa has adopted amodern, integrated approach to water resources management.
The devolution of water supply and sanitation services has
provided municipalities with the management and regulatory
powers that, in principle, should increase the efficiency and
effectiveness of water service delivery.
Environmental assessment . Cabinet has recently approved a
requirement to assess the environmental impact of all regulations
(proposed and existing). Previously, strategic environmental
assessment (SEA) of policies, plans and programmes was only
voluntary, and not applied to national policies.
In-depth | governing the environment
OECD : SOUTH AFRICA ENVIRONMENTAL PERFORMANCE REVIEW
RESPONSIBLE BUSINESS
The private sector has taken initiatives
to promote environmentally and socially
responsible behaviour. All companies
listed on the Johannesburg Stock
Exchange (JSE) must present annual
statutory financial and sustainability
information in an “integrated report”. The
JSE’s Socially Responsible Investment
Index assesses a company’s performance
against four criteria: governance, society,
environment and economy. High
environmental impact companies – like
mining – need a high score to meet the
requirements of the Index methodology.
In 2011, of the top 100 companies listed
on the JSE, 78 disclosed their carbon
footprint, half had clear carbon reduction
targets, and half had their emissions
verified. Almost all companies had asenior-level climate change committee
to steer progress, with energy efficiency
being a major driver.

8/11/2019 South Africa Environmental Performance Review - Highlights
http://slidepdf.com/reader/full/south-africa-environmental-performance-review-highlights 11/16
lClarify responsibilities between the Department of
Environmental Affairs (DEA) and key sectoral departments
(mining, transport and energy) to ensure coherent policies and
the achievement of the government’s environment-related
objectives.
l
Assess the environmental impacts of proposed national
plans and policies, especially for energy, transport and
mining; streamline and strengthen procedures for assessing
environmental impacts at the project level.
lComprehensively review the financing of the environment
sector to ensure that responsibilities and financial means are
aligned.
lUndertake comprehensive, co-ordinated capacity building
of provincial and local governments; strengthen the performance
assessment system for government bodies at all levels.
l
Further expand environmental monitoring networks, and
develop a compliance and enforcement strategy that targets
installations that pose the greatest risk.
lAdopt legislation to better integrate development, spatial
planning and land-use management and take account of the
views of traditional rural communities.
lEstablish water agencies to manage water catchment areas,
and to better integrate water resources management, the
provision of water services and land use, involving all stakeholders.
Next steps | environmental governance
CHALLENGES
Policy gaps. Decentralisation is far from complete. Policy
gaps are holding back the ambitious environmental roleforeseen for municipalities. There is fragmentation and
unclear division of responsibilities between different levels
of government. Finding ways to co-ordinate these different
levels is a key challenge.
Capacity gaps. The National Environmental Management
Act (NEMA) requires provincial authorities to help
municipalities incorporate environmental considerations into
planning. However, all provinces have capacity constraints
and need guidance on fundamental tasks, such as land-use
management in rural areas. Lengthy processes and staff
shortages in provincial environmental offices have led to a
large backlog of environmental impact assessments (EIAs)
and the failure to prevent illegal activities from going ahead.
Legislation gaps. Mining is currently exempt from some of
the key provisions of the NEMA.
Funding gaps. Provincial and local governments need
adequate funding to match their growing environmental
responsibilities.
Management gaps. There is a mis-match between
water resources management – a national responsibility
implemented through regional offices – and the provision of
water services, which is a municipal responsibility.
11
DO SOUTH AFRICA’S GREEN SCORPIONS NEED MORE STING?
In 2007, the creation of the Environmental
Management Inspectorate was an
important step in strengthening the
environmental compliance assurance
system. Since then the number of
environmental management inspectors
(EMIs, or the “Green Scorpions”) has
nearly doubled (Figure 6). The Green
Scorpions conduct compliance
monitoring and enforcement, often
supported by the South African Police.
However, provincial environmental
inspectors are sometimes unwilling to
enforce unauthorised activities in rural
communities where such activities
support vital economic interestsaffecting the local population. Also gaps
and frequent changes to the legislation,
as well as a lack of skills and experience
among prosecutors and judges,
mean that prosecution authorities are
frequently unsuccessful in securing
convictions for environmental crimes.0
500
1 000
1 500
2008 2009 2010 2011 2012
Number
National parks Provincial environmental departments Total
Figure 6: Number of environmental management inspectors
OECD : GOVERNING THE ENVIRONMENT
Source: DEA (2010 and 2011a).
HI GHL I GHT S

8/11/2019 South Africa Environmental Performance Review - Highlights
http://slidepdf.com/reader/full/south-africa-environmental-performance-review-highlights 12/16
12
The post-apartheid period has seen a radical shift in biodiversity policy, from fencing areas and strict species
conservation to a focus on ecosystem services, social justice and socio-economic development. The social
dimensions of biodiversity policy – most notably job creation, poverty alleviation and reversing past injustices
through local community access, participation and benefit-sharing – are well-pronounced in South Africa
compared to many OECD countries.
OPPORTUNITIES
Rich biodiversity. South Africa is one of the world’s 17
megabiodiverse nations, hosting 10% of all known bird, fish
and plant species, and over 6% of all mammal and reptilespecies; many are found nowhere else. South Africa is also
host to some exceptional ecosystems and habitats.
Good protection system. Protected areas have grown by
10% since 2004; in 2011 they accounted for 6.5% of the
total territory. Biodiversity stewardship programmes enable
protected area expansion at a fraction of the cost of traditional
land-acquisition approaches. These programmes support land
owners to conserve important habitats using instruments
such as tax deductions and other financial incentives.
High quality data. South Africa has mapped and assessed
its biodiversity extensively, leading to high quality scientific
information to aid conservation action and policy.
Pioneering biodiversity laws and policies. These are
more advanced than in many OECD countries. The 2004
National Environmental Management: Biodiversity Act
(NEMBA) provides for the protection of the diversity of
species and ecosystems, sustainable use of indigenous
biological resources, and the fair and equitable sharing
of benefits. Actions are guided by the 2005 National
Biodiversity Strategy and Action Plan, which establishesin law measurable objectives and targets, and assigns
responsibility for their achievement.
Livelihood and green growth opportunities. Sustainable
harvesting of South Africa’s biodiversity creates real
economic opportunities for local people. For example, the
domestic trade in medicinal plants has an estimated annual
value of ZAR 2.9 billion and employs at least 133 000 people,
many of them rural women. Commercial, subsistence and
recreational fisheries are also important economic activities.
In 2008, the total economic value of South Africa’s ecosystem
services was thought to be around ZAR 73 billion, or 3%
of GDP. Nature-based tourism is one of the country’s most
significant and dynamic industries. Game ranching, including
hunting, is estimated to generate ZAR 7.7 billion a year and
provide 100 000 jobs. Conservation-related industries have
higher economic potential than activities such as livestock
farming, especially on marginal land.
In-depth | biodiversity and ecosystem services
OECD : SOUTH AFRICA ENVIRONMENTAL PERFORMANCE REVIEW

8/11/2019 South Africa Environmental Performance Review - Highlights
http://slidepdf.com/reader/full/south-africa-environmental-performance-review-highlights 13/16
lComprehensively assess the economic benefits of the
conservation and sustainable use of biodiversity and
ecosystems.
l
Fund and implement the National Protected Areas
Expansion Strategy, using a combination of land
purchase and stewardship agreements, while recognising
local community rights.
lExpand biodiversity stewardship and other PES
schemes, and support local people to develop
competitive biodiversity-related services and products,
including for eco-tourism.
lImprove the integration of biodiversity into sectoral
policies; reform fiscal incentives with a perverse impact
on biodiversity (e.g. municipal property taxes, tax breaks
for agricultural activities); integrate biodiversity offsets into
licensing and permitting procedures.
lStrengthen regulations for bioprospecting to ensure
fair and equitable benefit sharing.
lCombat poaching through a co-ordinated approach
addressing both supply and demand.
Next steps | sustaining biodiversity
CHALLENGES
Economic pressures from agriculture, manufacturing,
mining and mineral processing, urban development,forestry and fisheries are threatening biodiversity, as are
external pressures from invasive alien species, illegal
international wildlife trade and climate change. South
Africa has lost around 20% of its natural habitat, most of
it in the last century. Today one in five inland mammal
and freshwater fish species, and one in seven frog and bird
species, are threatened. Ecosystem services amounting to at
least ZAR 6.5 billion are lost each year as a result of invasive
alien plants.
Weak enforcement. Enforcement efforts – increased
arrests, more stringent sanctions – have not kept pace with
dramatically increased levels of poaching. Rhinos are a key
target, as well as abalone, elephant and plant species such
as rare succulents and cycads.
Poor protection of freshwater and coastal ecosystems.
Despite increasing pressures on freshwater ecosystems,
nearly half are not protected at all. Nearly 60% of river
ecosystem types are threatened. Coastal and marine
ecosystems are also overlooked by the current system and
should be protected urgently.
Untapped community benefits. Emerging schemes, such
as Payment for Ecosystem Services (PES), could provide
significant livelihood opportunities to local communities.
Many community-based tourism efforts are poorly
capitalised, widely dispersed, poorly marketed and not
sufficiently unique to attract interest.
Weak and underfunded local institutions lack the staff
and finances to implement biodiversity targets. Biodiversity
policies are poorly integrated into other key sectors,
especially mining, energy generation, transport and coastal
management.
13
THE RHINO CHALLENGE
South Africa hosts about 93% of all white rhino and 35%
of all black rhino. It has the world’s most successful rhinoconservation record, with its comprehensive approach
increasing rhino numbers from about 12 000 in 2004 to
over 20 000 in 2009. However, despite more arrests, rhino
poaching has increased since around 2008, driven by illegal
international trade in rhino horn. The poaching involves highly
organised international crime syndicates working with poor
local counterparts. The serious situation prompted South Africa
to initiate a National Strategy for the Safety and Security of
Rhinoceros Populations in 2010, and to conclude co-operation
agreements with China and Vietnam, the main destination
countries for rhino horn.
HI GHL I GHT S

8/11/2019 South Africa Environmental Performance Review - Highlights
http://slidepdf.com/reader/full/south-africa-environmental-performance-review-highlights 14/16

8/11/2019 South Africa Environmental Performance Review - Highlights
http://slidepdf.com/reader/full/south-africa-environmental-performance-review-highlights 15/16
Useful resources
PUBLICATIONS
OECD Environmental Performance Reviews: South Africa 2013
OECD Publishing.
doi: 10.1787/9789264202887-en
Towards Green Growth
OECD Publishing.
doi: 10.1787/9789264111318-en
www.oecd.org/greengrowth/towardsgreengrowth.htm
Green Economy Accord (Republic of South Africa, 2011)www.economic.gov.za/communications/publications/
green-economy-accord
WEB
EPR programme:
www.oecd.org/env/country-reviews/southafrica2013.htm
Environmental data and indicators:
www.oecd.org/env/indicators
MORE INFORMATION
Sources:
All figures, tables and boxes are from the OECD publication,OECD Environmental Performance Reviews: South Africa 2013
Photos are courtesy of iStockphoto.com, Fotolia.com or Dreamstime.com

8/11/2019 South Africa Environmental Performance Review - Highlights
http://slidepdf.com/reader/full/south-africa-environmental-performance-review-highlights 16/16