Embed Size (px)
Citation preview
SOURCES OF RIVERINE LITTER:THE RIVER TAFF, SOUTH WALES, UK
A. T. WILLIAMS 1 and S. L. SIMMONS21 Faculty of Applied Sciences, Bath Spa University, Newton Park, Bath, UK;2 Dewplan Ltd.,
Beechwood Hall, Kingsmead Road, High Wycombe, Bucks, UK
(Received 3 December 1996; accepted 26 May 1998)
Abstract. Riverine litter occupies a spatial and temporal position in any systematic analysis of riversystems and is a problem that is increasing in scale. Quantifiable source factors of litter in the riverTaff, South Wales, UK, system were found to be mainly two – sewage inputs through combinedsewer overflows (CSO) and fly tipping. The greatest inputs of sewage derived solids were introducedto the river by malfunctioning CSO, the most numerous single component being sanitary towels.Whilst sewage-derived material constituted approximately 23% of all items on the river Taff, largequantities of waste, especially plastic sheeting, originated from fly tipping sites.
Keywords: fly tipping, riverine litter, sewage, sources
1. Introduction
The aesthetic quality of many river banks around the world is all too often marredby the presence of unsightly litter. Such aesthetic pollutants have been shown tosignificantly affect public perception of rivers as well as its potential for biofoulingof the water body (House and Sangster, 1989). Public awareness has meant that itis increasingly on the pollution control list of, for example in the UK, the Environ-mental Protection Agency (EPA), formally the National Rivers Authority (NRA).Once a litter problems exists, not only will the public view the area less positively,but the adagewaste attracts more wastemay also follow. The implications ofriverine litter are not just limited to aesthetic degradation. Bankside litter is likelyto constitute a significant threat to wildlife due to the possibility of entanglementand is also potentially hazardous to man if riverine areas are used recreationally.
Increasing awareness regarding aesthetic pollutants such as litter, has been re-flected in proposals for a revised water quality classification scheme (Williams andBrooker, 1985). In the 1970’s, River Quality Objectives (RQOs) were introduced asan informal means of setting goals for local water quality. They provided a frame-work on which to base discharge consents and have acted as a platform for rivermanagement. In recent years. considerable investments (£30 billion in the UK)channelled towards water quality improvements have resulted in the need to reviewRQOs so they can reflect new higher standards. In this context the Department ofEnvironment (DoE) and Welsh Office proposed the introduction of Statutory Water
Water, Air, and Soil Pollution112: 197–216, 1999.© 1999Kluwer Academic Publishers. Printed in the Netherlands.
198 A. T. WILLIAMS AND S. L. SIMMONS
Quality Objectives (SWQOs) to reflect new requirements and assessment methods.SWQOs will enable the Secretary of State to serve notice to the EPA regardingquality classes for river stretches.
In addition to SWQOs, there are General Quality Assessments (GQAs), set upas a response to aesthetic pollutants unlike the RQOs and SWQOs. For rivers,it is intended that GQAs will not only involve standard chemical and biologicalmeasures, but also nutrient and aesthetic classifications and the different aspects ofGQAs have been termed ‘windows’. The aesthetic classification will reflect generalwater quality and deals for the first time with litter despoliation. The inclusionof aesthetic classification for rivers in the new River Quality Surveys has under-lined the need for innovative research in the realm of aesthetic pollutants such aslitter, both for rivers (Williams, 1986; Williams and Simmons, 1997a), estuaries(Williams and Simmons, 1995, 1997b), beaches (Williamset al., 1993a,b; Sim-mons and Williams, 1993) and offshore (Simmonset al., 1993). There are manypotential sources of riverine litter; from bankside tipping, industrial discharges,discarded recreational material (fishing tackle etc.), boat discharges, urban/ruralrunoff, treatment work effluent and diffuse inputs as a result of sewage inputsfrom Combined Sewer Overflows (CSO) and untreated discharges. Localised pointsource input from bridges (cans, bottles, papers, etc.) near public houses can beidentified but inputs from wind blown materials are minor in the Taff context. Mostsources are difficult to pin-point, and even harder to control. Further difficultiesin tackling the problem arise due to the mobile nature of litter. Once depositedwithin a catchment, litter may be rapidly transported away from its point of originand become distributed throughout the catchment, thus increasing the scope of theproblem. Details of litter movement pattern with respect to hydraulic parametersin the Taff system can be found in Williams and Simmons (1997a). Due to thedynamic nature of the litter system, no single method is capable of assessing theextent of the problem, or providing an understanding of the complex processesinvolved.
2. Location and Site Details
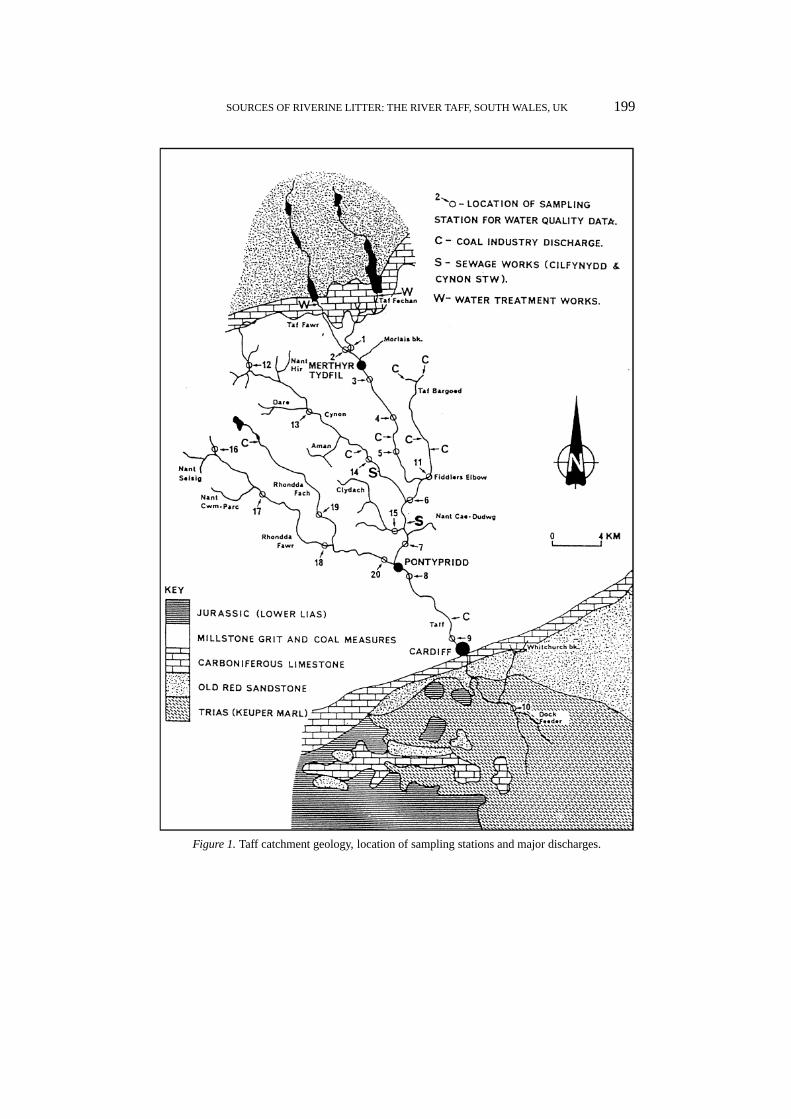
The River Taff in the UK was selected for study as it probably represents a worstcase scenario for Riverine litter. It rises in the Brecon Beacons and flows 57 km toenter the Severn Estuary at Cardiff. Four major tributaries covering some 56% ofthe catchment join the river during its course through the South Wales coal field.These are the Taff Bargoed, Cynon, Nant Clydach and Rhondda (Figure 1). It drops11 m in every kilometre, and rainfall ranges from 950 mm at Cardiff to 2400 mm inthe Brecon Beacons. Heavy linear urban strip development and regulation resultingfrom flood protection works means that much bank channelisation has occurred.The high rainfall in South Wales (>2000 mm) exacerbates the flow fluctuationproblems inherent in the combined nature of the sewage system in which both
SOURCES OF RIVERINE LITTER: THE RIVER TAFF, SOUTH WALES, UK 199
Figure 1.Taff catchment geology, location of sampling stations and major discharges.
200 A. T. WILLIAMS AND S. L. SIMMONS
surface water and sewage are transported together for appropriate treatment anddisposal.
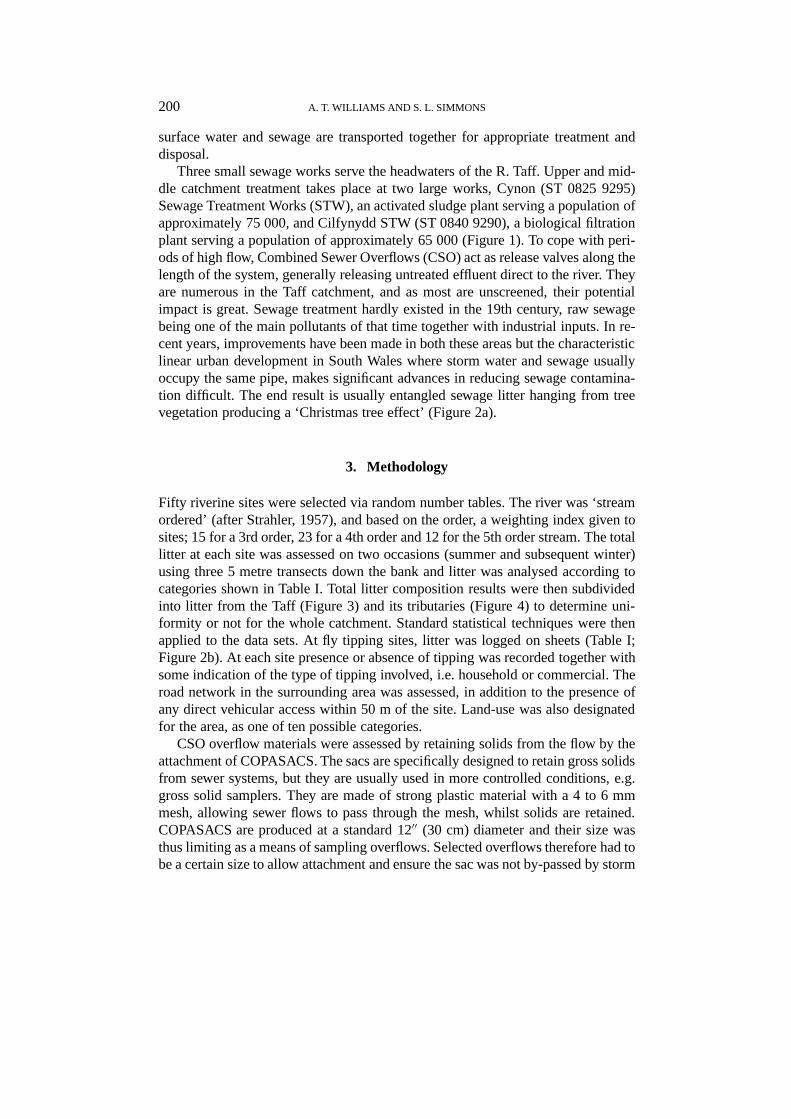
Three small sewage works serve the headwaters of the R. Taff. Upper and mid-dle catchment treatment takes place at two large works, Cynon (ST 0825 9295)Sewage Treatment Works (STW), an activated sludge plant serving a population ofapproximately 75 000, and Cilfynydd STW (ST 0840 9290), a biological filtrationplant serving a population of approximately 65 000 (Figure 1). To cope with peri-ods of high flow, Combined Sewer Overflows (CSO) act as release valves along thelength of the system, generally releasing untreated effluent direct to the river. Theyare numerous in the Taff catchment, and as most are unscreened, their potentialimpact is great. Sewage treatment hardly existed in the 19th century, raw sewagebeing one of the main pollutants of that time together with industrial inputs. In re-cent years, improvements have been made in both these areas but the characteristiclinear urban development in South Wales where storm water and sewage usuallyoccupy the same pipe, makes significant advances in reducing sewage contamina-tion difficult. The end result is usually entangled sewage litter hanging from treevegetation producing a ‘Christmas tree effect’ (Figure 2a).
3. Methodology
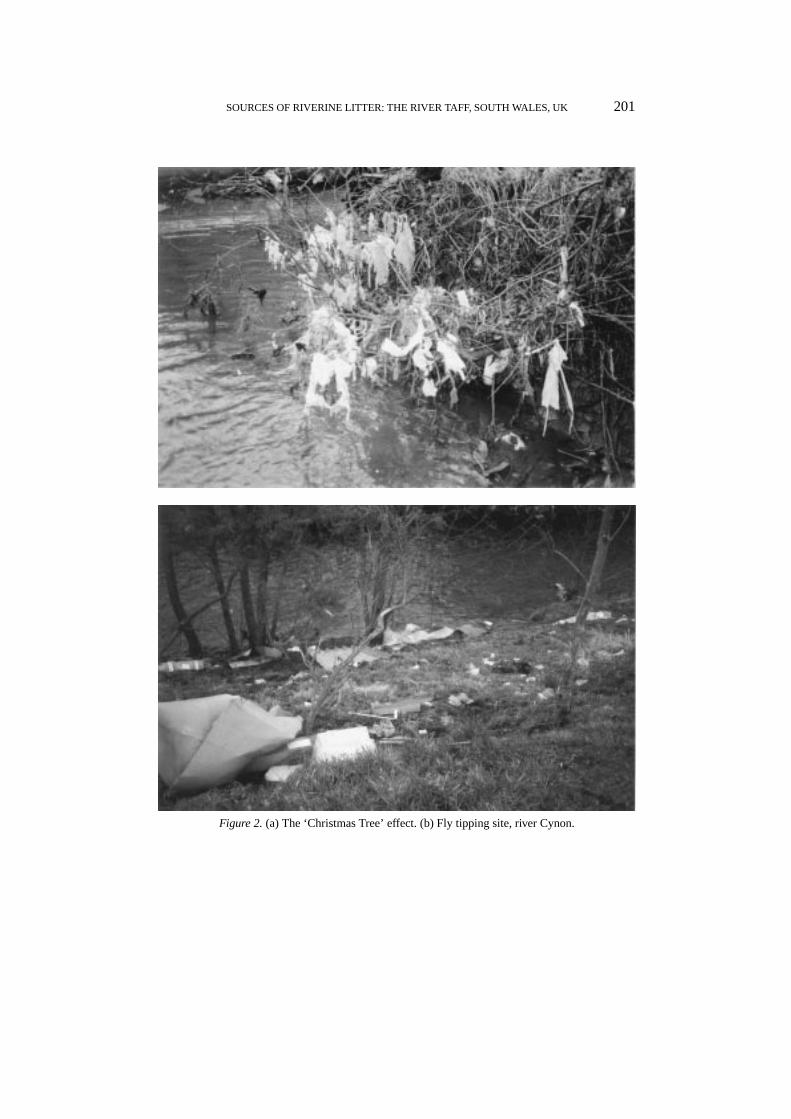
Fifty riverine sites were selected via random number tables. The river was ‘streamordered’ (after Strahler, 1957), and based on the order, a weighting index given tosites; 15 for a 3rd order, 23 for a 4th order and 12 for the 5th order stream. The totallitter at each site was assessed on two occasions (summer and subsequent winter)using three 5 metre transects down the bank and litter was analysed according tocategories shown in Table I. Total litter composition results were then subdividedinto litter from the Taff (Figure 3) and its tributaries (Figure 4) to determine uni-formity or not for the whole catchment. Standard statistical techniques were thenapplied to the data sets. At fly tipping sites, litter was logged on sheets (Table I;Figure 2b). At each site presence or absence of tipping was recorded together withsome indication of the type of tipping involved, i.e. household or commercial. Theroad network in the surrounding area was assessed, in addition to the presence ofany direct vehicular access within 50 m of the site. Land-use was also designatedfor the area, as one of ten possible categories.
CSO overflow materials were assessed by retaining solids from the flow by theattachment of COPASACS. The sacs are specifically designed to retain gross solidsfrom sewer systems, but they are usually used in more controlled conditions, e.g.gross solid samplers. They are made of strong plastic material with a 4 to 6 mmmesh, allowing sewer flows to pass through the mesh, whilst solids are retained.COPASACS are produced at a standard 12′′ (30 cm) diameter and their size wasthus limiting as a means of sampling overflows. Selected overflows therefore had tobe a certain size to allow attachment and ensure the sac was not by-passed by storm
SOURCES OF RIVERINE LITTER: THE RIVER TAFF, SOUTH WALES, UK 201
Figure 2.(a) The ‘Christmas Tree’ effect. (b) Fly tipping site, river Cynon.
202 A. T. WILLIAMS AND S. L. SIMMONS
TABLE I
Litter identification key
Family Genus No. Species
Sewage Feminine 1 Sanitary towels
derived Hygiene 2 Panty liners
3 Tampon/applic.
General 4 Toilet paper
5 Cotton buds
6 Other/unidentified
Housing Combustible 7 Fencing
materials 8 Hardboard/wood
9 Other/unidentified
Non-combustible 10 Brick/rubble
11 Floor cover
12 Other/unidentified
Household Brown goods 13 Furniture
(large) 14 Mattress/foam
White goods 15 Other/unidentified
Househould Metal 16 Cans/tins
(small) 17 Container drums
/commercial 17 Sheeting
/industrial 19 Other/unidentified
Plastic 20 Polystyrene
21 Sheeting <30 cm
22 Sheeting 30–60 cm
23 Sheeting >60 cm
24 Plastic bags
25 Sweet papers
26 Bottles
Glass 27 Bottles
28 Other/unidentified
Transport Motor vehicles 29 Carts/parts
associated 30 Motorbikes/parts
31 Other/unidentified
General 32 Signs/cones
General Packaging 33 Cardboard
Miscellaneous 34 Cloth/shoes
35 Rope/fishing line
36 Other/unidentified
SOURCES OF RIVERINE LITTER: THE RIVER TAFF, SOUTH WALES, UK 203
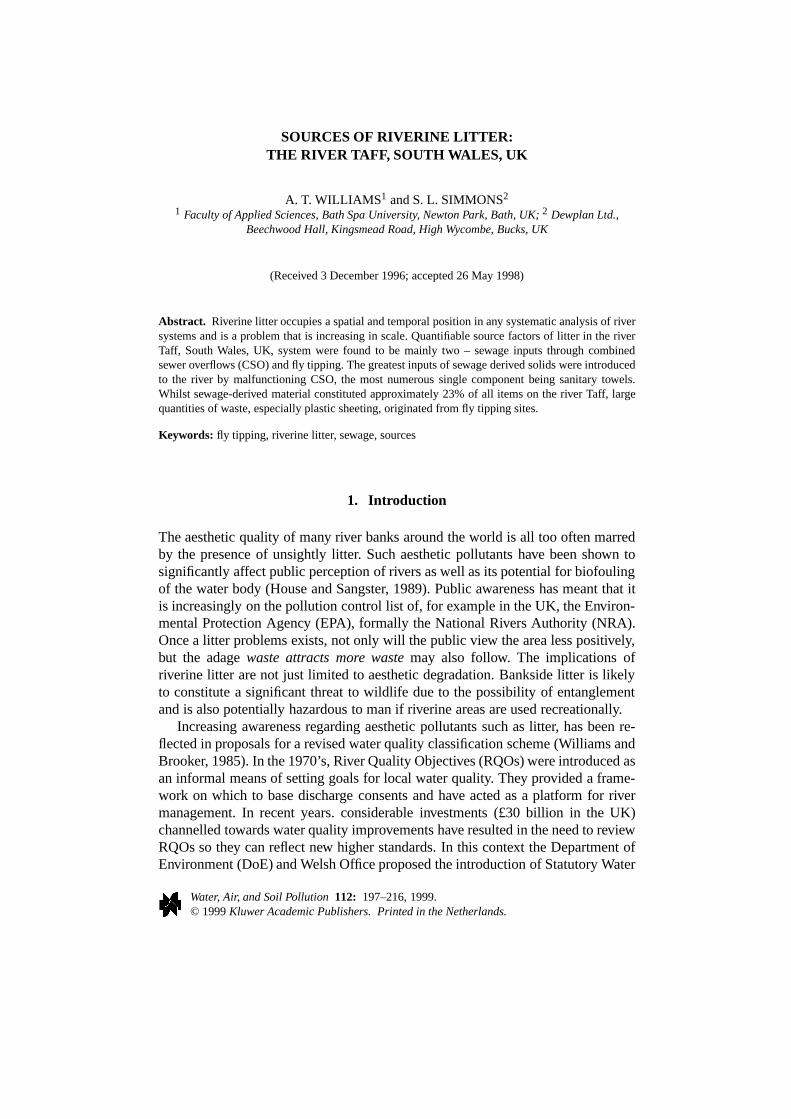
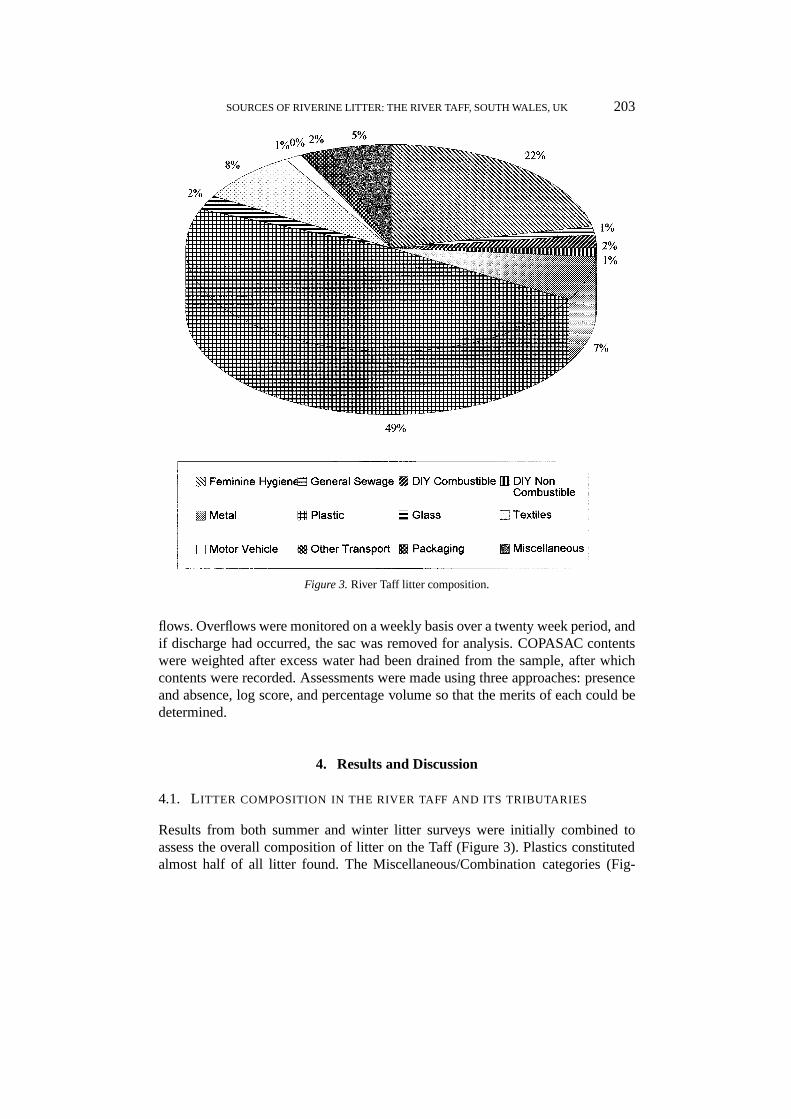
Figure 3.River Taff litter composition.
flows. Overflows were monitored on a weekly basis over a twenty week period, andif discharge had occurred, the sac was removed for analysis. COPASAC contentswere weighted after excess water had been drained from the sample, after whichcontents were recorded. Assessments were made using three approaches: presenceand absence, log score, and percentage volume so that the merits of each could bedetermined.
4. Results and Discussion
4.1. LITTER COMPOSITION IN THE RIVER TAFF AND ITS TRIBUTARIES
Results from both summer and winter litter surveys were initially combined toassess the overall composition of litter on the Taff (Figure 3). Plastics constitutedalmost half of all litter found. The Miscellaneous/Combination categories (Fig-
204 A. T. WILLIAMS AND S. L. SIMMONS
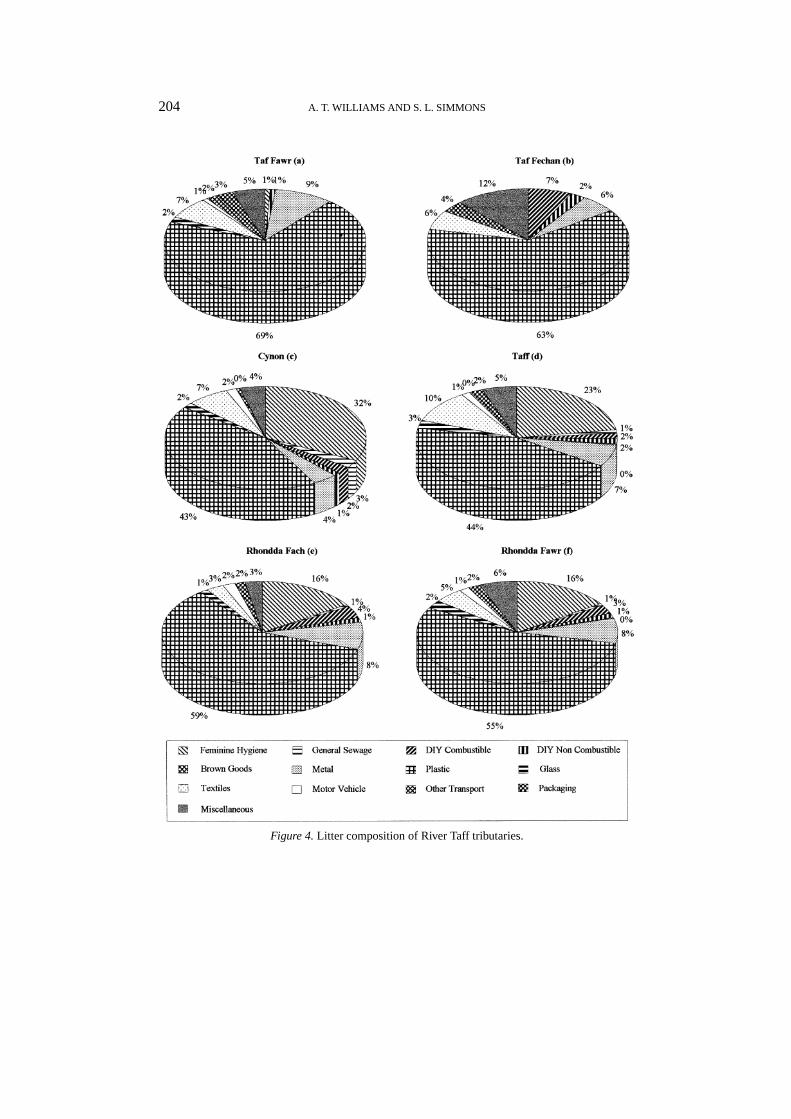
Figure 4.Litter composition of River Taff tributaries.
SOURCES OF RIVERINE LITTER: THE RIVER TAFF, SOUTH WALES, UK 205
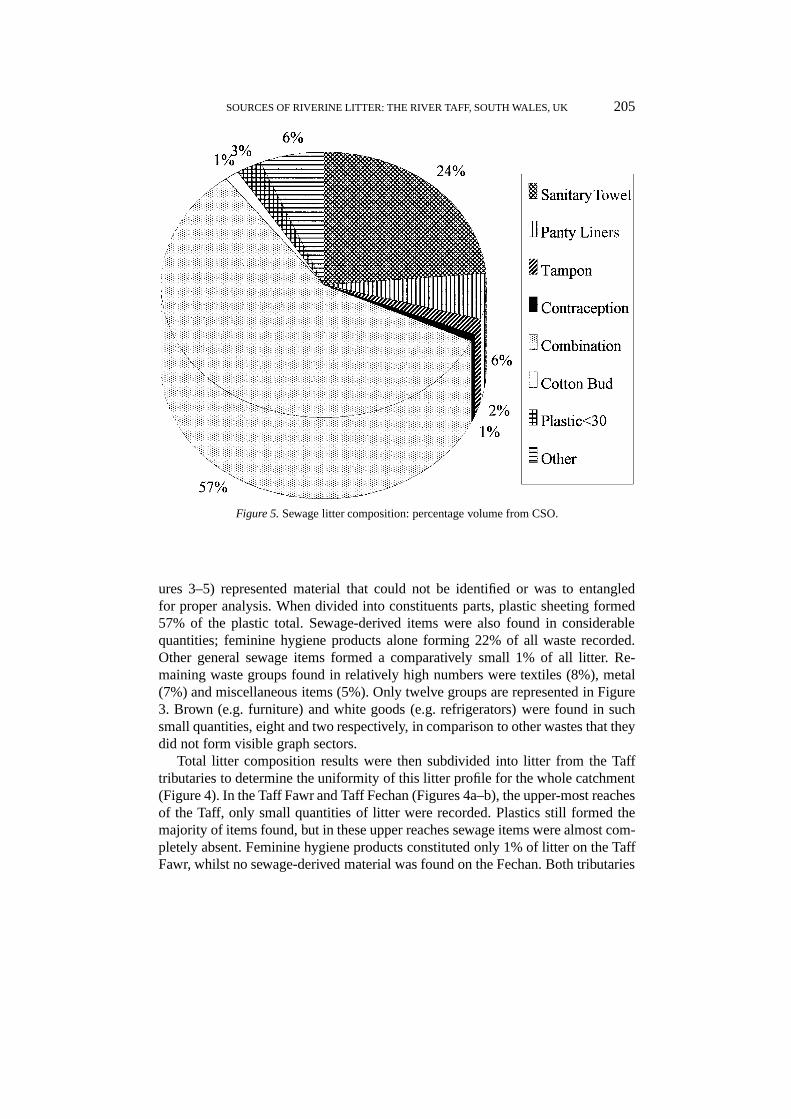
Figure 5.Sewage litter composition: percentage volume from CSO.
ures 3–5) represented material that could not be identified or was to entangledfor proper analysis. When divided into constituents parts, plastic sheeting formed57% of the plastic total. Sewage-derived items were also found in considerablequantities; feminine hygiene products alone forming 22% of all waste recorded.Other general sewage items formed a comparatively small 1% of all litter. Re-maining waste groups found in relatively high numbers were textiles (8%), metal(7%) and miscellaneous items (5%). Only twelve groups are represented in Figure3. Brown (e.g. furniture) and white goods (e.g. refrigerators) were found in suchsmall quantities, eight and two respectively, in comparison to other wastes that theydid not form visible graph sectors.
Total litter composition results were then subdivided into litter from the Tafftributaries to determine the uniformity of this litter profile for the whole catchment(Figure 4). In the Taff Fawr and Taff Fechan (Figures 4a–b), the upper-most reachesof the Taff, only small quantities of litter were recorded. Plastics still formed themajority of items found, but in these upper reaches sewage items were almost com-pletely absent. Feminine hygiene products constituted only 1% of litter on the TaffFawr, whilst no sewage-derived material was found on the Fechan. Both tributaries
206 A. T. WILLIAMS AND S. L. SIMMONS
are situated above the first major conurbation and as such would not be expectedto exhibit sewage pollution to any serious level.
The Rhondda Fach and Rhondda Fawr (Figures 4e–f) are tributaries with con-siderable urbanisation along their lengths. They demonstrated almost identical com-position and showed a much closer likeness to the Taff overall litter profile than itsheadwater streams. Contrastingly, the River Cynon (Figure 4c), also a fairly ur-banised tributary, showed a very different profile. For example, plastic componentsformed only 43% of total litter. This was however counteracted by a rise in sewage-derived material. Within the Cynon, feminine hygiene products alone constituted32% of all litter, with an additional 3% for general sewage items. A plot was alsogenerated for the River Taff from its formation at Merthyr Tydfil to its seawardboundary (Figure 4d) and results did not appear to differ significantly from theoverall catchment profile.
Results do not appear to agree directly with Davies and Boden’s (1991) workon the River Taff tributaries, in which the Rhondda valley was highlighted as themost sewage polluted area. The EPA has recently placed considerable emphasis onaddressing malfunctioning CSO problems within the Welsh Region. Reductions insewage-derived material in the Rhondda valley between the two periods (1991 and1996) could therefore be reflecting the effectiveness of these measures.
4.2. SEASONAL LITTER VARIATIONS
The complete data set was then subdivided into summer and winter assessmentsto investigate possible seasonal variation in litter composition. In addition, pairedt-tests were carried out for the fourteen litter subgroups between summer and win-ter to determine if differences were significant at the P <= 0.05 level. Total itemnumbers found were less in the winter (4.058) than summer (4.629), an average of584 per 100 metre of bank, but this overall trend was not statistically significant.This figure may not be a true representation as the upper-most source streams (1stand 2nd order) which are more pristine were not included in the survey. However,significant differences (at the 0.05 level) were present within seven of the fourteensub-groups tested. Five of the seven groups showed significant decreases (at the0.01 level) from summer to winter; Do it Yourself (DIY) consumables, plastic,glass, motor vehicle, and packaging. Whilst results did not indicate the reasonsfor this trend, decreases in these items during the winter may be due to the moredynamic conditions (higher flows) at this time. The two other groups with signif-icant seasonal differences, textiles and miscellaneous items, were more abundantduring winter assessments. Unidentifiable litter items, often fragments of largerobjects, were recorded under ‘miscellaneous’. It is therefore possible that suchitems increased in winter due to increased litter fragmentation. Increased textilenumbers during the winter is however more difficult to explain and will be con-sidered in future multivariate analyses. Surprisingly, sewage items did not increasein the winter assessment, even though inputs were likely to be at their highest due
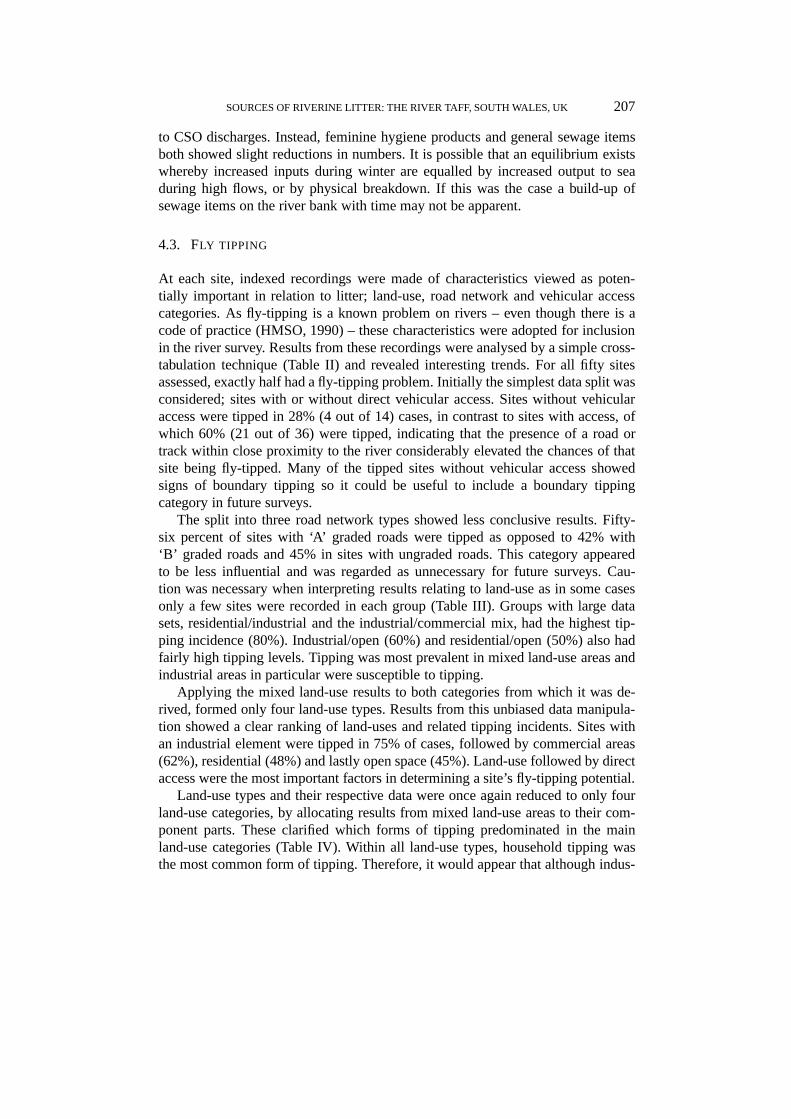
SOURCES OF RIVERINE LITTER: THE RIVER TAFF, SOUTH WALES, UK 207
to CSO discharges. Instead, feminine hygiene products and general sewage itemsboth showed slight reductions in numbers. It is possible that an equilibrium existswhereby increased inputs during winter are equalled by increased output to seaduring high flows, or by physical breakdown. If this was the case a build-up ofsewage items on the river bank with time may not be apparent.
4.3. FLY TIPPING
At each site, indexed recordings were made of characteristics viewed as poten-tially important in relation to litter; land-use, road network and vehicular accesscategories. As fly-tipping is a known problem on rivers – even though there is acode of practice (HMSO, 1990) – these characteristics were adopted for inclusionin the river survey. Results from these recordings were analysed by a simple cross-tabulation technique (Table II) and revealed interesting trends. For all fifty sitesassessed, exactly half had a fly-tipping problem. Initially the simplest data split wasconsidered; sites with or without direct vehicular access. Sites without vehicularaccess were tipped in 28% (4 out of 14) cases, in contrast to sites with access, ofwhich 60% (21 out of 36) were tipped, indicating that the presence of a road ortrack within close proximity to the river considerably elevated the chances of thatsite being fly-tipped. Many of the tipped sites without vehicular access showedsigns of boundary tipping so it could be useful to include a boundary tippingcategory in future surveys.
The split into three road network types showed less conclusive results. Fifty-six percent of sites with ‘A’ graded roads were tipped as opposed to 42% with‘B’ graded roads and 45% in sites with ungraded roads. This category appearedto be less influential and was regarded as unnecessary for future surveys. Cau-tion was necessary when interpreting results relating to land-use as in some casesonly a few sites were recorded in each group (Table III). Groups with large datasets, residential/industrial and the industrial/commercial mix, had the highest tip-ping incidence (80%). Industrial/open (60%) and residential/open (50%) also hadfairly high tipping levels. Tipping was most prevalent in mixed land-use areas andindustrial areas in particular were susceptible to tipping.
Applying the mixed land-use results to both categories from which it was de-rived, formed only four land-use types. Results from this unbiased data manipula-tion showed a clear ranking of land-uses and related tipping incidents. Sites withan industrial element were tipped in 75% of cases, followed by commercial areas(62%), residential (48%) and lastly open space (45%). Land-use followed by directaccess were the most important factors in determining a site’s fly-tipping potential.
Land-use types and their respective data were once again reduced to only fourland-use categories, by allocating results from mixed land-use areas to their com-ponent parts. These clarified which forms of tipping predominated in the mainland-use categories (Table IV). Within all land-use types, household tipping wasthe most common form of tipping. Therefore, it would appear that although indus-
208 A. T. WILLIAMS AND S. L. SIMMONS
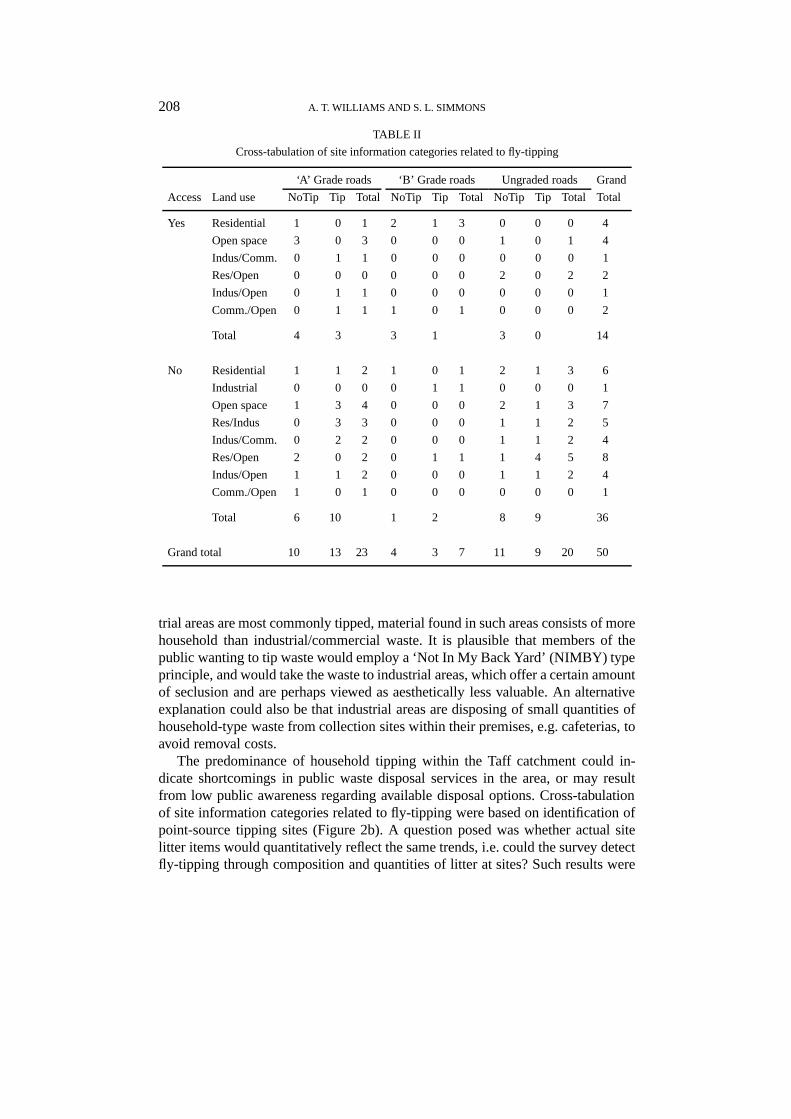
TABLE II
Cross-tabulation of site information categories related to fly-tipping
‘A’ Grade roads ‘B’ Grade roads Ungraded roads Grand
Access Land use NoTip Tip Total NoTip Tip Total NoTip Tip Total Total
Yes Residential 1 0 1 2 1 3 0 0 0 4
Open space 3 0 3 0 0 0 1 0 1 4
Indus/Comm. 0 1 1 0 0 0 0 0 0 1
Res/Open 0 0 0 0 0 0 2 0 2 2
Indus/Open 0 1 1 0 0 0 0 0 0 1
Comm./Open 0 1 1 1 0 1 0 0 0 2
Total 4 3 3 1 3 0 14
No Residential 1 1 2 1 0 1 2 1 3 6
Industrial 0 0 0 0 1 1 0 0 0 1
Open space 1 3 4 0 0 0 2 1 3 7
Res/Indus 0 3 3 0 0 0 1 1 2 5
Indus/Comm. 0 2 2 0 0 0 1 1 2 4
Res/Open 2 0 2 0 1 1 1 4 5 8
Indus/Open 1 1 2 0 0 0 1 1 2 4
Comm./Open 1 0 1 0 0 0 0 0 0 1
Total 6 10 1 2 8 9 36
Grand total 10 13 23 4 3 7 11 9 20 50
trial areas are most commonly tipped, material found in such areas consists of morehousehold than industrial/commercial waste. It is plausible that members of thepublic wanting to tip waste would employ a ‘Not In My Back Yard’ (NIMBY) typeprinciple, and would take the waste to industrial areas, which offer a certain amountof seclusion and are perhaps viewed as aesthetically less valuable. An alternativeexplanation could also be that industrial areas are disposing of small quantities ofhousehold-type waste from collection sites within their premises, e.g. cafeterias, toavoid removal costs.
The predominance of household tipping within the Taff catchment could in-dicate shortcomings in public waste disposal services in the area, or may resultfrom low public awareness regarding available disposal options. Cross-tabulationof site information categories related to fly-tipping were based on identification ofpoint-source tipping sites (Figure 2b). A question posed was whether actual sitelitter items would quantitatively reflect the same trends, i.e. could the survey detectfly-tipping through composition and quantities of litter at sites? Such results were
SOURCES OF RIVERINE LITTER: THE RIVER TAFF, SOUTH WALES, UK 209
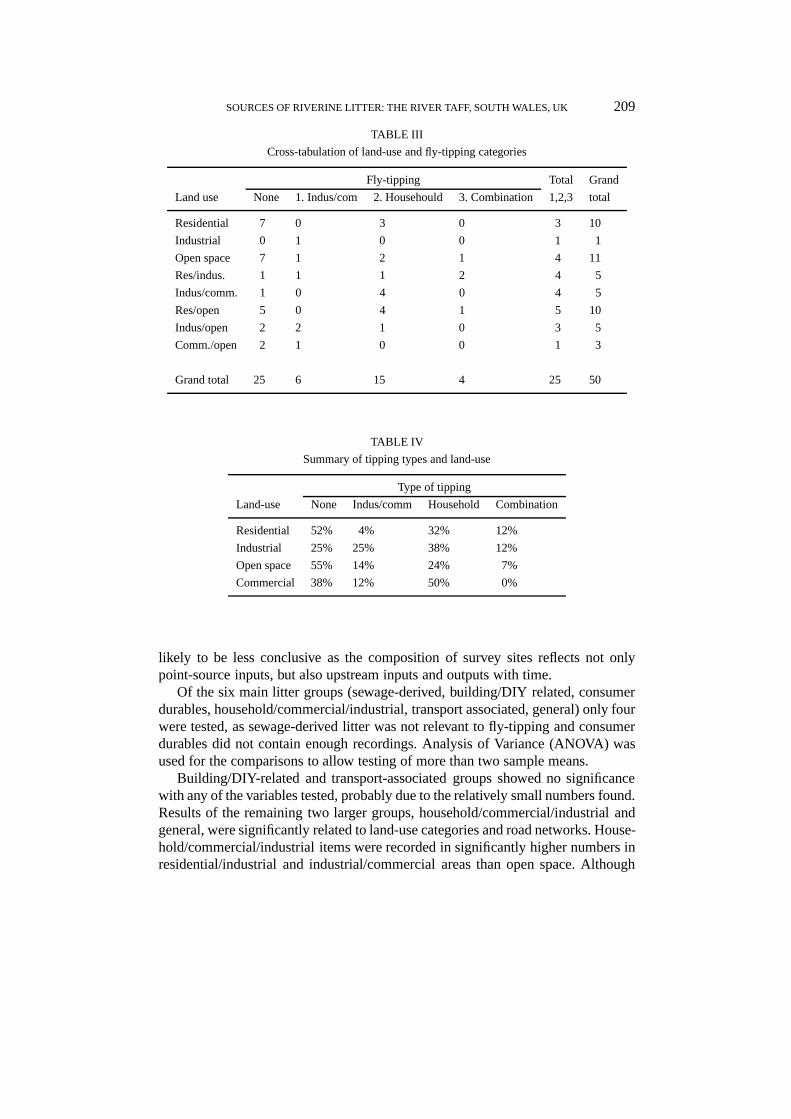
TABLE III
Cross-tabulation of land-use and fly-tipping categories
Fly-tipping Total Grand
Land use None 1. Indus/com 2. Househould 3. Combination 1,2,3 total
Residential 7 0 3 0 3 10
Industrial 0 1 0 0 1 1
Open space 7 1 2 1 4 11
Res/indus. 1 1 1 2 4 5
Indus/comm. 1 0 4 0 4 5
Res/open 5 0 4 1 5 10
Indus/open 2 2 1 0 3 5
Comm./open 2 1 0 0 1 3
Grand total 25 6 15 4 25 50
TABLE IV
Summary of tipping types and land-use
Type of tipping
Land-use None Indus/comm Household Combination
Residential 52% 4% 32% 12%
Industrial 25% 25% 38% 12%
Open space 55% 14% 24% 7%
Commercial 38% 12% 50% 0%
likely to be less conclusive as the composition of survey sites reflects not onlypoint-source inputs, but also upstream inputs and outputs with time.
Of the six main litter groups (sewage-derived, building/DIY related, consumerdurables, household/commercial/industrial, transport associated, general) only fourwere tested, as sewage-derived litter was not relevant to fly-tipping and consumerdurables did not contain enough recordings. Analysis of Variance (ANOVA) wasused for the comparisons to allow testing of more than two sample means.
Building/DIY-related and transport-associated groups showed no significancewith any of the variables tested, probably due to the relatively small numbers found.Results of the remaining two larger groups, household/commercial/industrial andgeneral, were significantly related to land-use categories and road networks. House-hold/commercial/industrial items were recorded in significantly higher numbers inresidential/industrial and industrial/commercial areas than open space. Although
210 A. T. WILLIAMS AND S. L. SIMMONS
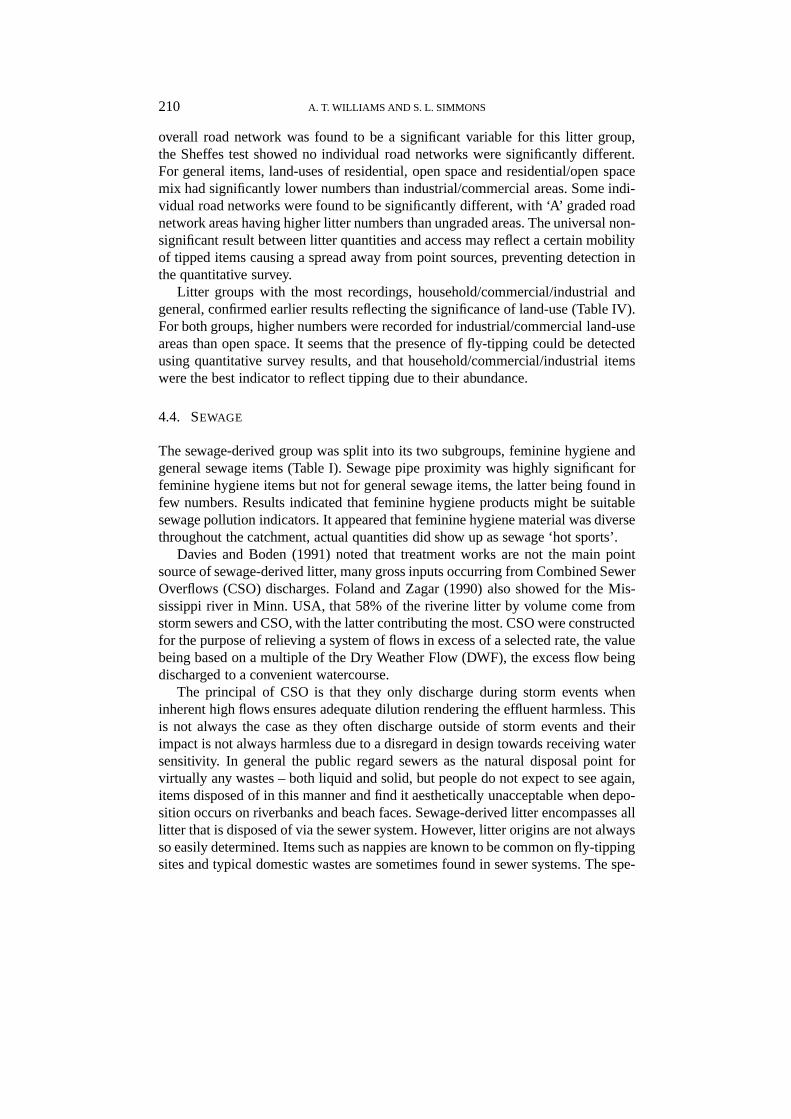
overall road network was found to be a significant variable for this litter group,the Sheffes test showed no individual road networks were significantly different.For general items, land-uses of residential, open space and residential/open spacemix had significantly lower numbers than industrial/commercial areas. Some indi-vidual road networks were found to be significantly different, with ‘A’ graded roadnetwork areas having higher litter numbers than ungraded areas. The universal non-significant result between litter quantities and access may reflect a certain mobilityof tipped items causing a spread away from point sources, preventing detection inthe quantitative survey.
Litter groups with the most recordings, household/commercial/industrial andgeneral, confirmed earlier results reflecting the significance of land-use (Table IV).For both groups, higher numbers were recorded for industrial/commercial land-useareas than open space. It seems that the presence of fly-tipping could be detectedusing quantitative survey results, and that household/commercial/industrial itemswere the best indicator to reflect tipping due to their abundance.
4.4. SEWAGE
The sewage-derived group was split into its two subgroups, feminine hygiene andgeneral sewage items (Table I). Sewage pipe proximity was highly significant forfeminine hygiene items but not for general sewage items, the latter being found infew numbers. Results indicated that feminine hygiene products might be suitablesewage pollution indicators. It appeared that feminine hygiene material was diversethroughout the catchment, actual quantities did show up as sewage ‘hot sports’.
Davies and Boden (1991) noted that treatment works are not the main pointsource of sewage-derived litter, many gross inputs occurring from Combined SewerOverflows (CSO) discharges. Foland and Zagar (1990) also showed for the Mis-sissippi river in Minn. USA, that 58% of the riverine litter by volume come fromstorm sewers and CSO, with the latter contributing the most. CSO were constructedfor the purpose of relieving a system of flows in excess of a selected rate, the valuebeing based on a multiple of the Dry Weather Flow (DWF), the excess flow beingdischarged to a convenient watercourse.
The principal of CSO is that they only discharge during storm events wheninherent high flows ensures adequate dilution rendering the effluent harmless. Thisis not always the case as they often discharge outside of storm events and theirimpact is not always harmless due to a disregard in design towards receiving watersensitivity. In general the public regard sewers as the natural disposal point forvirtually any wastes – both liquid and solid, but people do not expect to see again,items disposed of in this manner and find it aesthetically unacceptable when depo-sition occurs on riverbanks and beach faces. Sewage-derived litter encompasses alllitter that is disposed of via the sewer system. However, litter origins are not alwaysso easily determined. Items such as nappies are known to be common on fly-tippingsites and typical domestic wastes are sometimes found in sewer systems. The spe-
SOURCES OF RIVERINE LITTER: THE RIVER TAFF, SOUTH WALES, UK 211
cific sewage litter components that cause offence are as yet underdetermined, and isa research area currently being tackled by the EPA (Welsh Region) in collaborationwith the WRc.
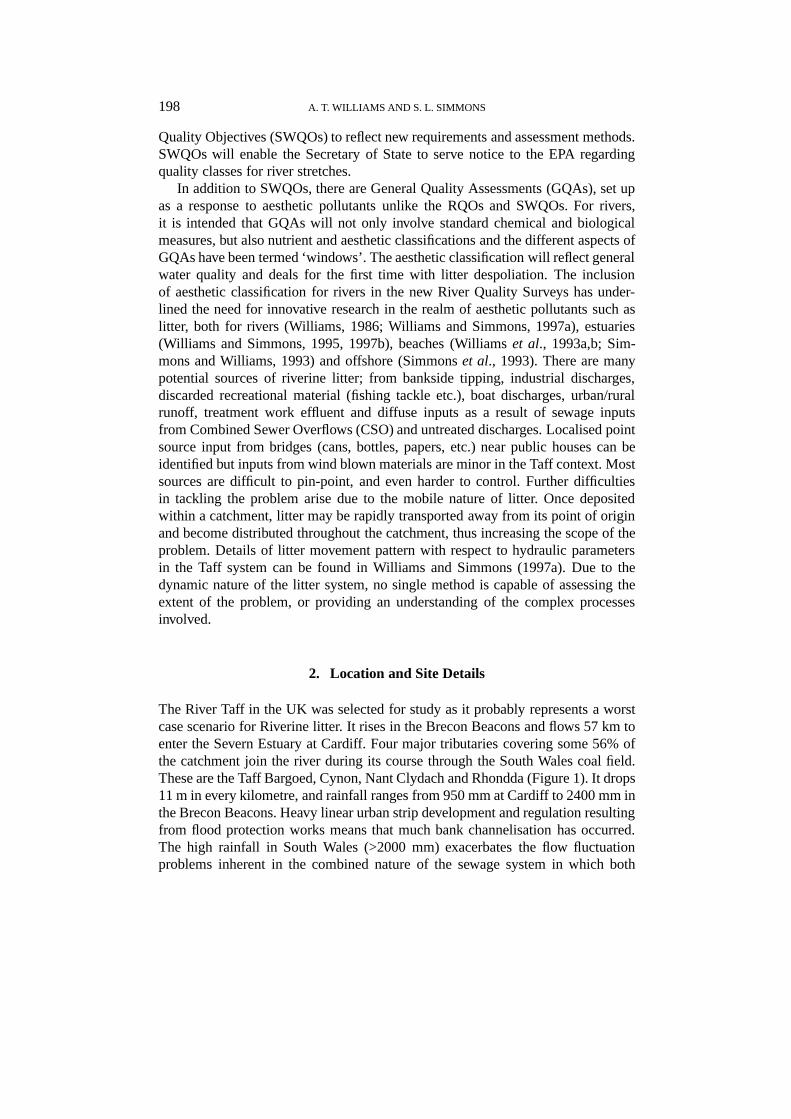
The most easily interpreted representation CSO material derived from CO-PASAC analysis was volume, with the highest proportion of waste being a combi-nation of toilet paper, faecal matter, cotton material and food. These materials froman aesthetic viewpoint, would have limited impact due to their ease of dispersionand breakdown. But they could have the maximum ecological and possible waterquality impacts. Contrastingly, the next two largest groups, sanitary towels (24%)and panty liners (6%) are likely to cause greater aesthetic degradation due to theirpersistence (Figure 5).
In all cases, the dominance of sanitary towels as the most numerous CSO dis-charge component, highlights the need to tackle this particular litter pollutant (Fig-ure 5). To date no practical fool-proof method is available to remove such products.As the vast majority of sanitary towels enter water courses via CSO, removal ofthese inputs would seem to be the solution. Unfortunately, CSO form an integralpart of Combined Sewer systems, and their presence is likely to be necessary for theforeseeable future. A rationalisation of storm overflows may improve the situation.Certain advances could be made by repairing malfunctioning CSO and upgradingcrude ‘hole in the wall’ overflows with ones capable of retaining ‘first flush’ pol-lutants. However, inputs could only be minimised, not completely removed. Theonly means of complete removal is to prevent disposal via the sewer system. Thetrend in 1992 was for 72% of all towels and 96% of all tampons to be disposedby this route, a dramatic change in customer habits would need to be encouraged(Howarth,pers comm). This is happening now with groups such as the WomensEnvironmental Network (WEN) advocating ‘bag it and bin it’ campaigns.
4.5. DATA SET ANALYSES
Copntroversy exists regarding litter data analyses (Simmons and Williams, 1997).Principal Component Analysis (PCA), a powerful pattern recognition tool was ap-plied to the data set. This procedure successfully identified factors that accountedfor the major variations within the data set, with Factor one accounting for thegreatest variation within the data set, followed by Factor two and then Factor threeetc. Analysis of the entire data set provided three main factors which accounted for57.4% of the overall variance within the data set. A varimax rotation was carriedout to simplify interpretation, as rotations help to produce the most meaningfuldata representations to allow interpretation.
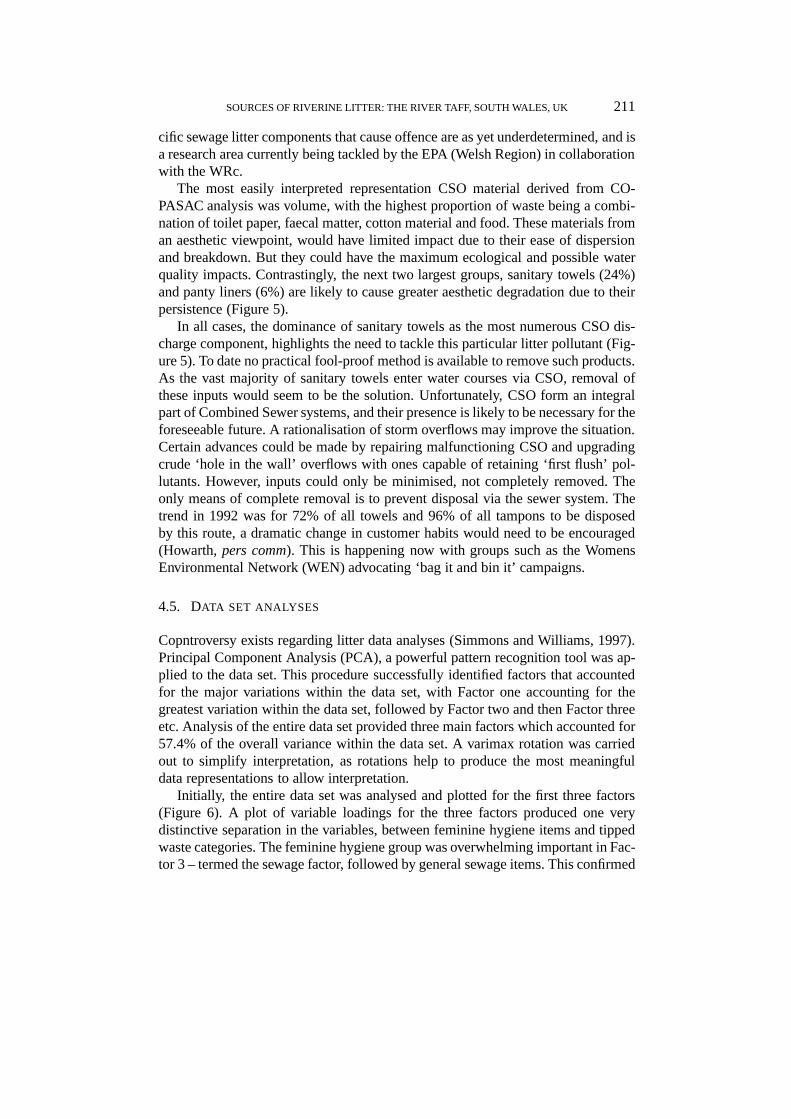
Initially, the entire data set was analysed and plotted for the first three factors(Figure 6). A plot of variable loadings for the three factors produced one verydistinctive separation in the variables, between feminine hygiene items and tippedwaste categories. The feminine hygiene group was overwhelming important in Fac-tor 3 – termed the sewage factor, followed by general sewage items. This confirmed
212 A. T. WILLIAMS AND S. L. SIMMONS
Figure 6.Principal component analysis for litter groups (Summer and Winter).
earlier suggestions regarding the suitability of feminine hygiene items as sewagecontamination indicators. Despite forming the most obvious grouping, Factor 3 wasthe least important factor in determining overall variation in the data set. Factors 1and 2, both seemed to relate to tipping wastes, but when examined closely, couldbe further split into two separate groupings. Those items most important in Factor1, tended to be groups ordinarily related to household tipping, i.e. plastic, textiles,brown and white goods, whereas those items important in determining Factor 2could potentially be industrial/commercial in origin, i.e. motor vehicles, metal, etc.These factors were therefore both considered to be fly-tipping factors, but with
SOURCES OF RIVERINE LITTER: THE RIVER TAFF, SOUTH WALES, UK 213
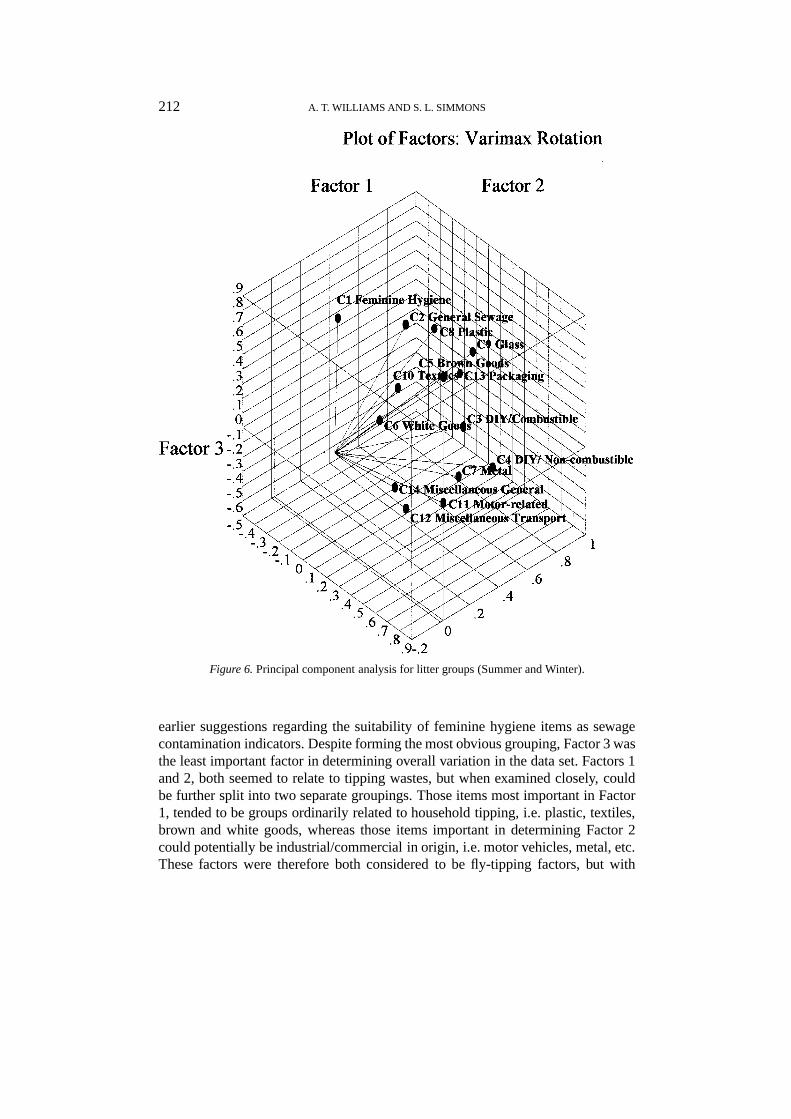
Figure 7.PCA of sites (Summer and Winter results).
Factor 1 possibly relating more to household tipping, and Factor 2 relating to othertipping forms. Thus Factors 1 and 2 were labelled more tentatively due to the morediffuse groups formed.
Overall results indicated that variation in site litter items can be identified through3 factors; one definite sewage factor (3), and two tipping factors, interpreted as
214 A. T. WILLIAMS AND S. L. SIMMONS
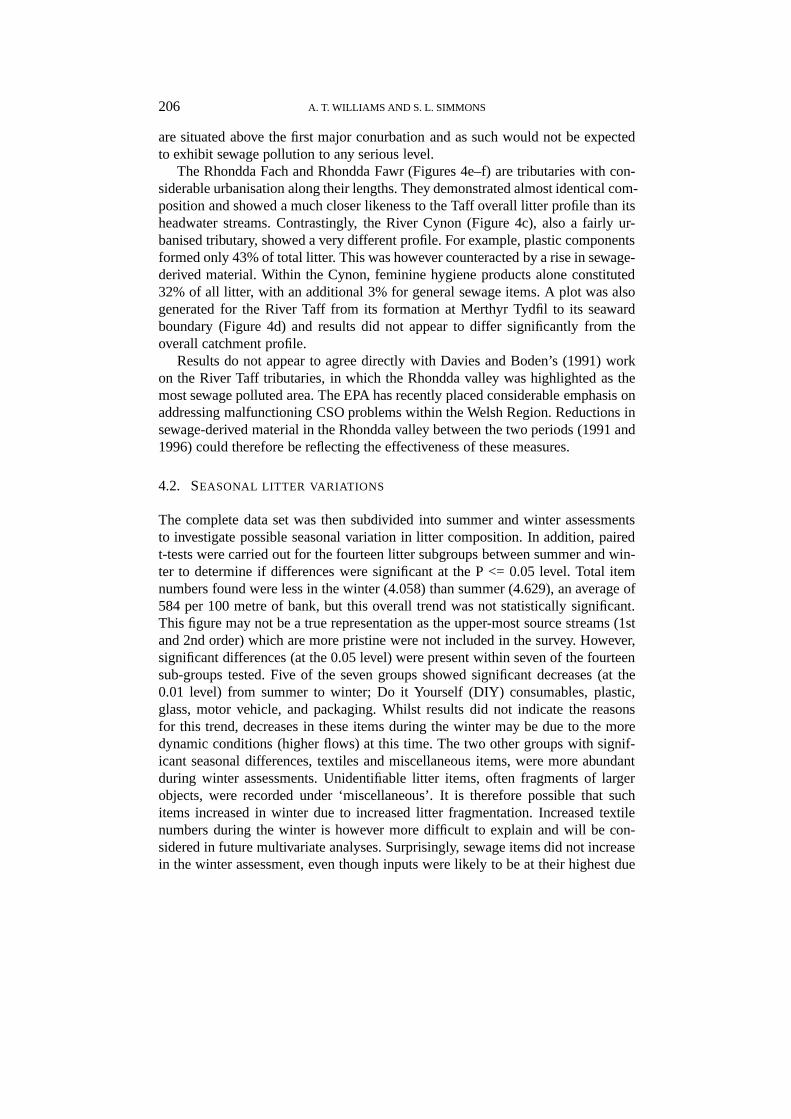
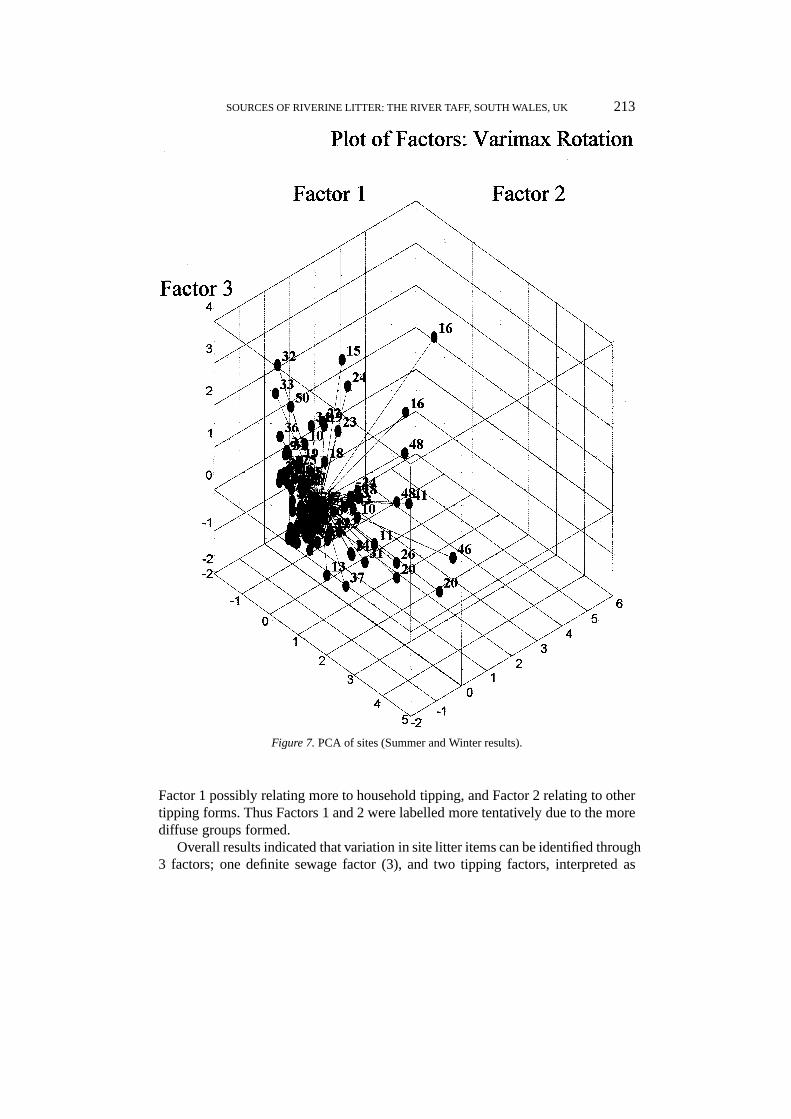
Figure 8.Schematic model showing processes and interactions governing riverine litter.
household (1) and industrial/commercial tipping (2). Site data was plotted in re-lation to the three factors for the overall data set (Figure 7). A certain amount ofconsistency was demonstrated by sites that were heavily influenced by the threefactors. Sites 16, 20 and 48, for example, were plotted in very similar positionsfor both summer and winter surveys indicating a certain amount of uniformityin the quantities and composition of litter found at these sites on both occasions
SOURCES OF RIVERINE LITTER: THE RIVER TAFF, SOUTH WALES, UK 215
(Figure 7). The plots indicated that sites 15, 32, and 33 were important in relationto Factor 3, the sewage factor. When cross-referenced with site information, allthese sites were recorded as having large quantities of sewage-derived material andactually contained sewage pipes within them, confirming the appropriate namingof this factor. A predominance of sites numbered between thirty and forty wereshown as being important in relation to sewage (Figure 7). Interestingly these weresites on the River Cynon, the tributary highlighted earlier as having the highestsewage composition within the catchment, and confirmed the importance of CSOdischarges. The situation regarding the two fly-tipping factors was, however, a littlemore complicated with a possible seasonal change in the importance of differ-ent types of fly-tipping. Figure 8 draws together the various strands of this workindicating the various processes at work in the riverine litter model.
5. Conclusions
1. Fly tipping and sewage inputs have been pinpointed as major litter (point-source)contributors in riverine litter with the major input in the river Taff catchment com-ing from the former source. A warning should be made regarding fly tipping results.Caution is the key word when categorising tipping types. If doubt existed regardingorigins, select a combination category. In taking steps towards reducing tippingwithin the catchment, an understanding of disposal problems is crucial and this isstrongly recommended as an area for future investigation.
2. Tipping sites emerge where vehicular access or over the boundary tipping ispossible. Much of the ordinary household waste/furniture could have been takenaway from homes free of charge by local authorities. A question that could beasked is ‘Is the public aware of this? This is clearly a social problem and beyondthe scope of this paper.
3. Sewage litter comes from CSO. With increasing EC legislation this problemmust be tackled on a systematic catchment basis and will probably take 20–30 yrbefore the bulk of the problem is solved (Lowe, Welsh Water plc,pers. comm).
4. PCA proved itself to be a useful tool for determining underlying trends in theTaff catchment data set. Its application is limited to data sets with only few zerorecordings and therefore it cannot be used for analysis of catchments with low litterrecordings.
References
Davies, G. L. and Boden, D. C.: 1991, A Litter Assessment of Two Major Tributaries of the Taff, theCynon and the Rhondda,EPA-Welsh Region, Report No. EAE/91/1, 30 pp.
Foland, D. A. and Zagar, M. E.: 1990,Floatable Litter Entering Waterways, Minnesota Local RoadResearch, EPA.
216 A. T. WILLIAMS AND S. L. SIMMONS
HMSO: 1990, The Code of Practice on Litter and Refuse. Issues under Section 89 of theEnvironmental Protection Act, 17 pp.
House, M. A. and Sangster, E. K.: 1991, Public Perception of River Corridor Management,J. Inst.of Water and Env. Manage.5(3), 312.
Simmons, S. L., Fricker, A. and Williams, A. T.: 1993, ‘Offshore Marine Litter in Swansea Bay,Wales, UK’, in O. T. Magoon, W. S. Wilson, H. Converse and L. T. Toben (eds.),Coastal Zone’93, American Society of Civil Eng. New York, pp. 2283–2296.
Simmons, S. L. and Williams, A. T.: 1993, ‘Persistent Marine Debris Along the Glamorgan HeritageCoast, UK: A Management Problem’, in H. Sterr, J. Hofstide and P. Plag (eds.),InterdisciplinaryDiscussions of Coastal Research and Coastal Management Issues and Problems, Peter Lang,Frankfurt, pp. 240–250.
Simmons, S. L. and Williams, A. T.: 1997, ‘Qualitative versus Quantitative Litter Data Analysis’, inE. Ozham (ed.),MedCoast ’97, MedCoast Secretariat, Middle East Technical University, Ankara,Turkey, pp. 397–406.
Strahler, A. N.: 1957, Quantitative Analysis of Watershed Geomorphology,Amer. Geophys. Union38, 913.
Williams, A. T.: 1986, Landscape Aesthetics of the River Wye,Landscape Research11(2), 25.Williams, A. T. Simmons, S. L.: 1995, The degradation of plastic litter in rivers: implications for
beaches,Journal of Coastal Conservation2(1), 63.Williams, A. T. and Simmons, S. L.: 1997a, Movement Patterns of Riverine Litter,Water, Air and
Soil Pollution98, 119.Williams, A. T. and Simmons, S. L.: 1997b, Estuarine litter at the river/beach interface in the Bristol
Channel, U.K.,Journal of Coastal Research13(4), 1159.Williams, A. T., Leatherman, S. P. and Simmons, S. L.: 1993a, ‘Beach Aesthetics: the SouthWest
Peninsula, U.K.’, in H. Sterr, J. Hofstide and P. Plag (eds.),Interdisciplinary Discussions ofCoastal Research and Coastal Management Issues and Problems, Peter Lang, Frankfurt, pp.251–262.
Williams, A. T., Simmons, S. L. and Fricker, A.: 1993b, Offshore Sinks of Litter: A New Problem,Mar. Poll. Bull. 26(7), 404.
Williams, D. H. and Brooker, M. P.: 1985, Recent Improvements in the Water Quality of the RiverTaff, S. Wales,J. Inst. Water Poll. Control., 21.