Embed Size (px)
Citation preview
Sources of information about labor migration from Ukraine
• census (the last – 2001)
• systematic state inspections of villages
• administrative data of State Employment Service
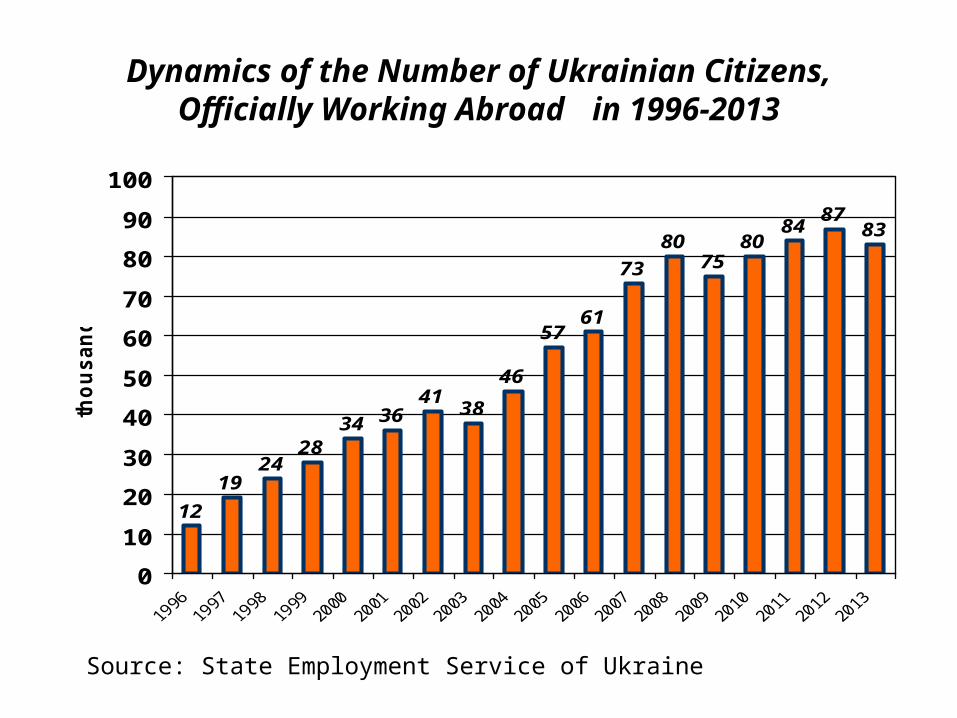
Dynamics of the Number of Ukrainian Citizens, Officially Working Abroad in 1996-2013
12
1924
2834 36
4138
46
5761
73
8075
8084
8783
0
10
20
30
40
50
60
70
80
90
100
tho
us
an
d
Source: State Employment Service of Ukraine
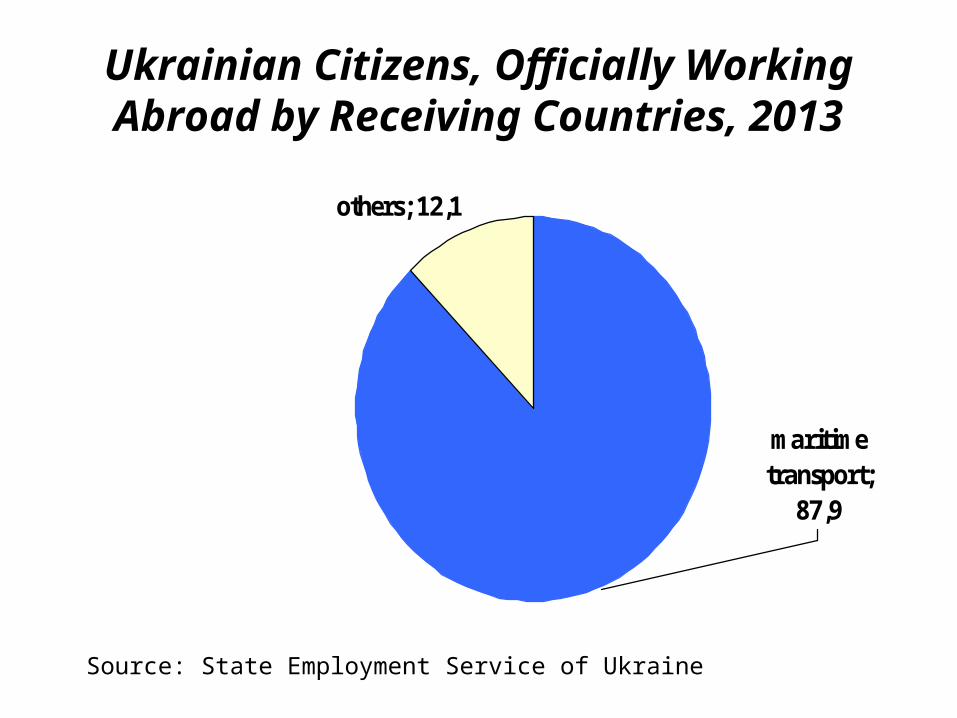
Ukrainian Citizens, Officially Working Abroad by Receiving Countries, 2013
others; 12,1
maritime transport;
87,9
Source: State Employment Service of Ukraine
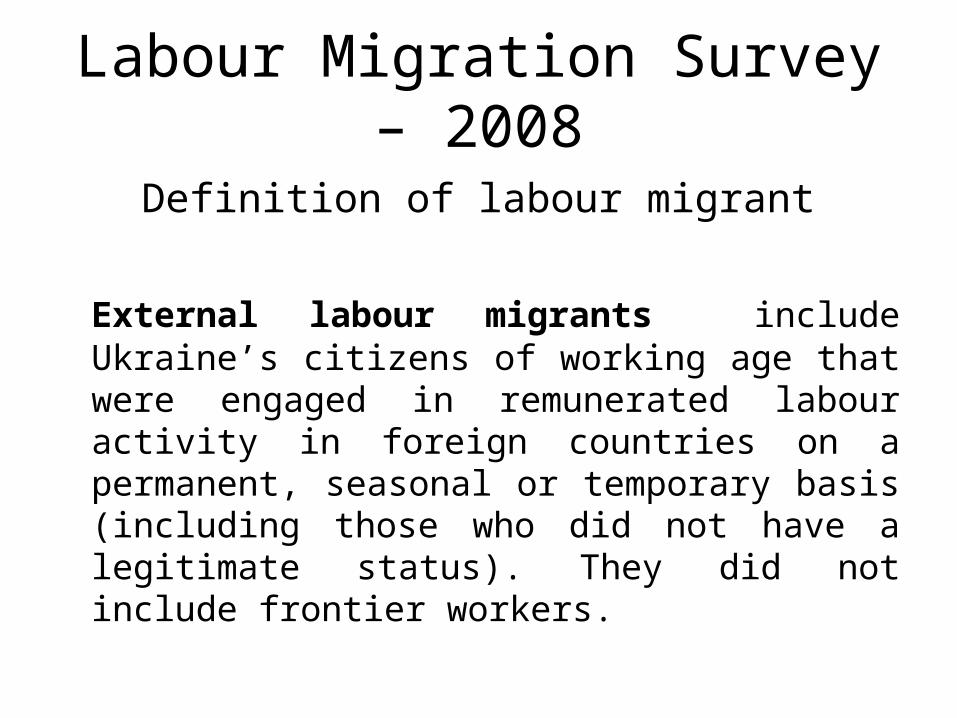
Labour Migration Survey – 2008
Definition of labour migrant
External labour migrants include Ukraine’s citizens of working age that were engaged in remunerated labour activity in foreign countries on a permanent, seasonal or temporary basis (including those who did not have a legitimate status). They did not include frontier workers.
Labour Migration Survey – 2008
The purpose of the survey is to assess the scale, popularity, geographic direction of external labour migrations, socio-demographic category of migrants, their occupation, frequency and length of their trips etc.
The period of survey encompassed the last three and a half years: starting 1 January 2005 till 1 June 2008.
The subject of survey were persons of working age (women aged 15−54 and men aged 15−59) that permanently reside within the household.
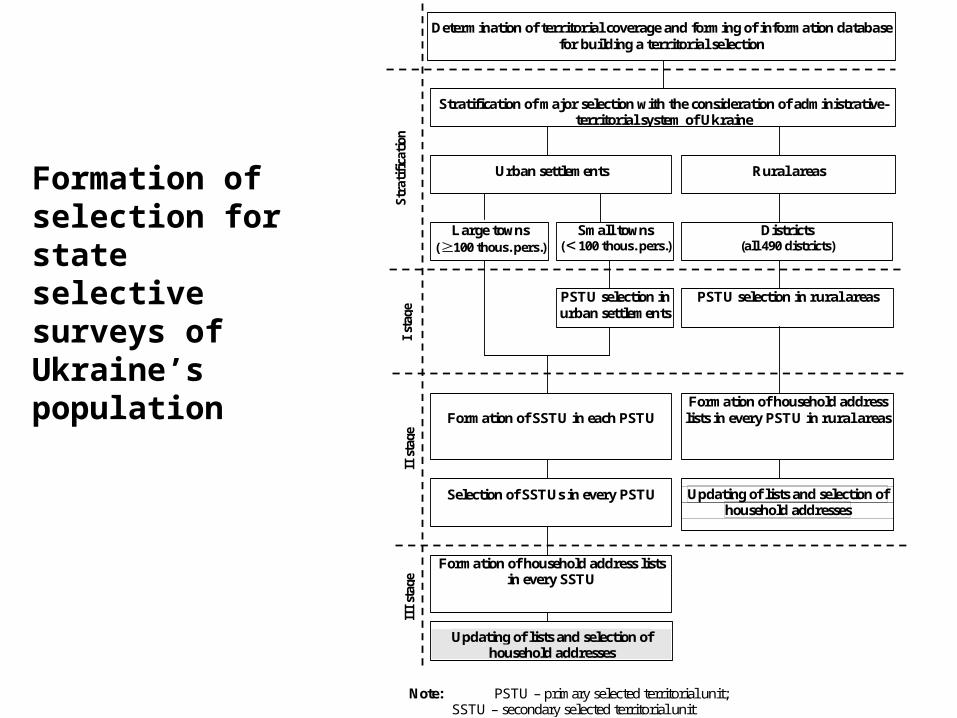
Formation of selection for stateselective surveys of Ukraine’s population
Note: PSTU – primary selected territorial unit; SSTU – secondary selected territorial unit
Determination of territorial coverage and forming of information database for building a territorial selection
Stratification of major selection with the consideration of administrative-territorial system of Ukraine
Urban settlements Rural areas
Large towns (100 thous. pers.)
Small towns (100 thous. pers.)
Districts (all 490 districts)
PSTU selection in urban settlements
Formation of SSTU in each PSTU
Selection of SSTUs in every PSTU
Formation of household address lists in every SSTU
Formation of household address lists in every PSTU in rural areas
Updating of lists and selection of household addresses
IІ
sta
ge
IІ
І st
age
I
stag
e
S
trat
ific
atio
n
PSTU selection in rural areas
Updating of lists and selection of household addresses
Labour Migration Survey – 2012
The purpose of the survey is to assess the scale, scope and geographic coverage of Ukrainian citizens’ migration for employment purposes, the socio-demographic composition of migrant workers, including their educational attainment, areas of training before departure abroad, their economic activities, working conditions, frequency and duration of their migration cycles, among others.
The period of survey encompassed the last two and a half years: starting 1 January 2010 till 17 June 2012.
The subject of survey were persons aged 15–70 permanently residing in their households.
Labour Migration Survey – 2012
Definition of labour migrant
Migrant workers are persons, who during the reference period (1 January 2010–17 June 2012) worked abroad or searched for a job abroad. They are also persons who within the reference period had a job abroad but have already returned to Ukraine and also those who were abroad during the survey due to the job performance or search abroad.
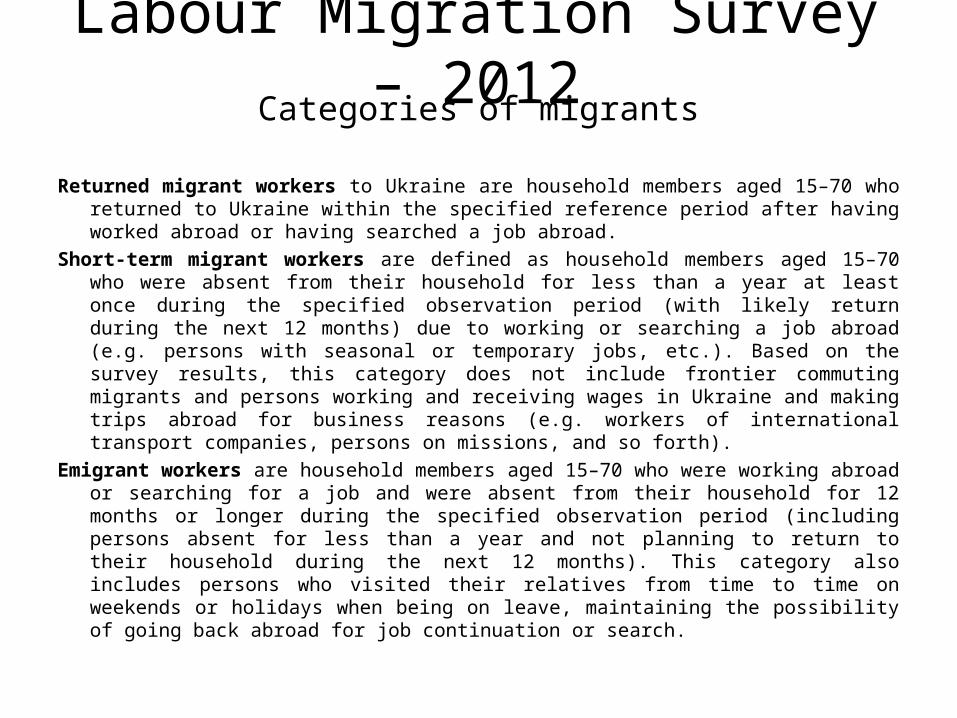
Labour Migration Survey – 2012Categories of migrants
Returned migrant workers to Ukraine are household members aged 15–70 who returned to Ukraine within the specified reference period after having worked abroad or having searched a job abroad.
Short-term migrant workers are defined as household members aged 15–70 who were absent from their household for less than a year at least once during the specified observation period (with likely return during the next 12 months) due to working or searching a job abroad (e.g. persons with seasonal or temporary jobs, etc.). Based on the survey results, this category does not include frontier commuting migrants and persons working and receiving wages in Ukraine and making trips abroad for business reasons (e.g. workers of international transport companies, persons on missions, and so forth).
Emigrant workers are household members aged 15–70 who were working abroad or searching for a job and were absent from their household for 12 months or longer during the specified observation period (including persons absent for less than a year and not planning to return to their household during the next 12 months). This category also includes persons who visited their relatives from time to time on weekends or holidays when being on leave, maintaining the possibility of going back abroad for job continuation or search.
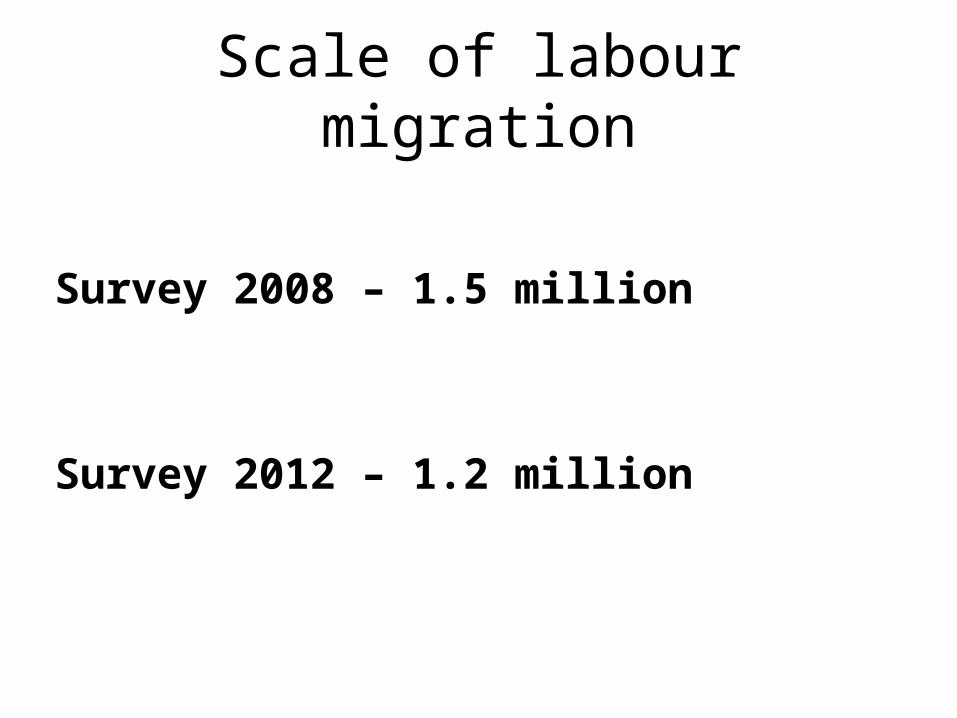
Scale of labour migration
Survey 2008 – 1.5 million
Survey 2012 – 1.2 million
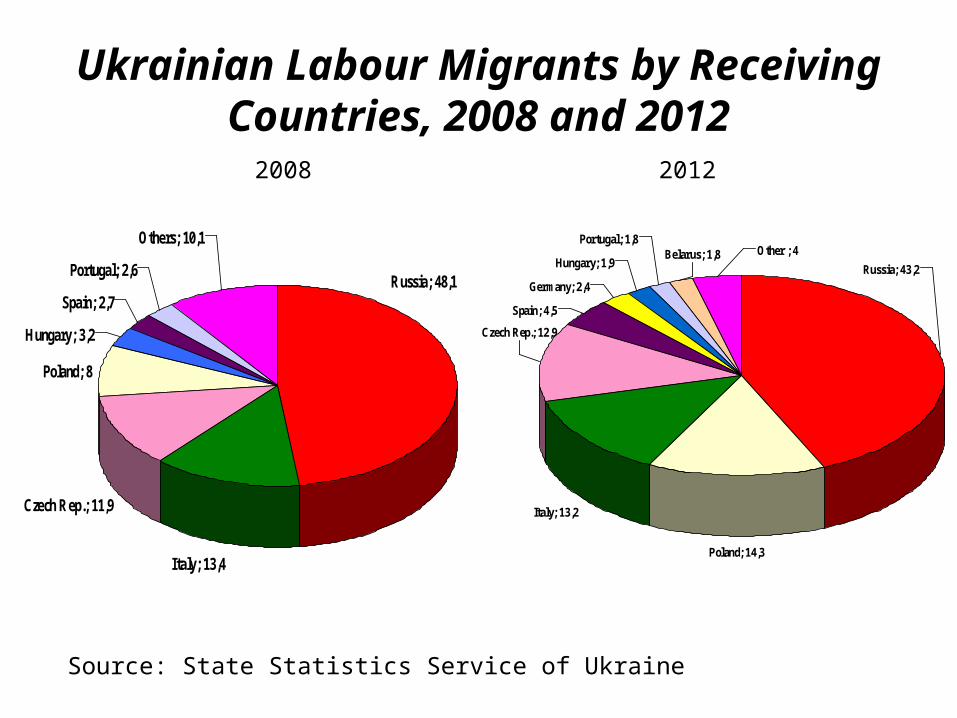
Ukrainian Labour Migrants by Receiving Countries, 2008 and 2012
Poland; 14,3
Italy; 13,2
Spain; 4,5
Germany; 2,4
Hungary; 1,9
Portugal; 1,8Other ; 4
Czech Rep.; 12,9
Russia; 43,2Belarus; 1,8
Source: State Statistics Service of Ukraine
2008 2012
Italy; 13,4
Czech Rep.; 11,9
Poland; 8
Hungary; 3,2
Spain; 2,7
Portugal; 2,6
Others; 10,1
Russia; 48,1
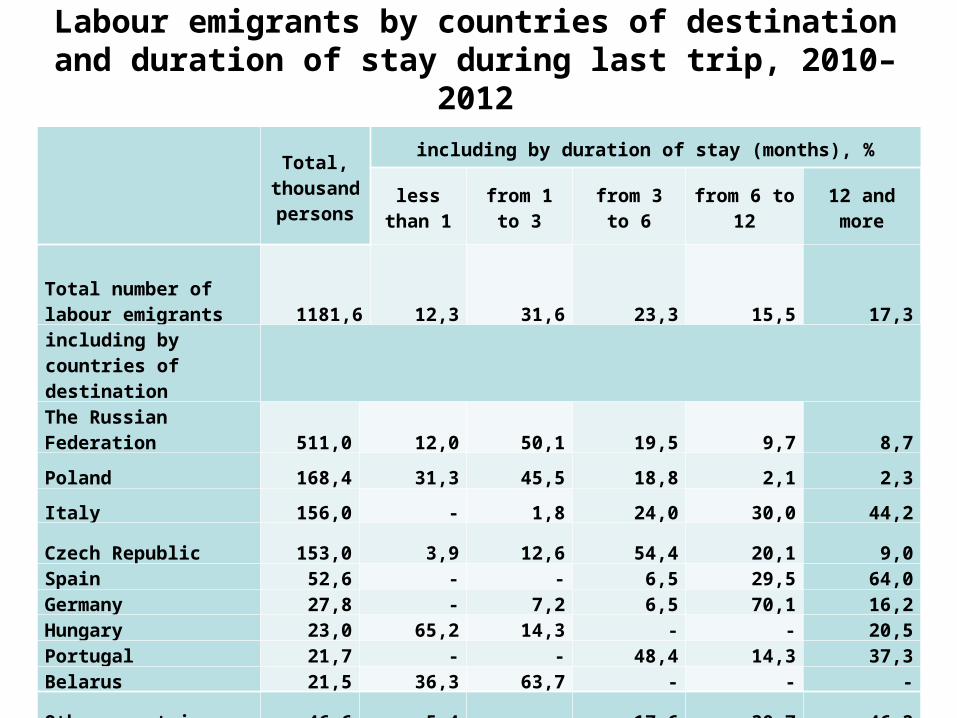
Total,
thousand persons
including by duration of stay (months), %
less than 1
from 1 to 3
from 3 to 6from 6 to
1212 and more
Total number of labour emigrants 1181,6 12,3 31,6 23,3 15,5 17,3including by countries of destination
The Russian Federation 511,0 12,0 50,1 19,5 9,7 8,7
Poland 168,4 31,3 45,5 18,8 2,1 2,3
Italy 156,0 - 1,8 24,0 30,0 44,2
Czech Republic 153,0 3,9 12,6 54,4 20,1 9,0Spain 52,6 - - 6,5 29,5 64,0Germany 27,8 - 7,2 6,5 70,1 16,2Hungary 23,0 65,2 14,3 - - 20,5Portugal 21,7 - - 48,4 14,3 37,3Belarus 21,5 36,3 63,7 - - -
Other countries 46,6 5,4 - 17,6 30,7 46,3
Labour emigrants by countries of destination and duration of stay during last trip, 2010–2012
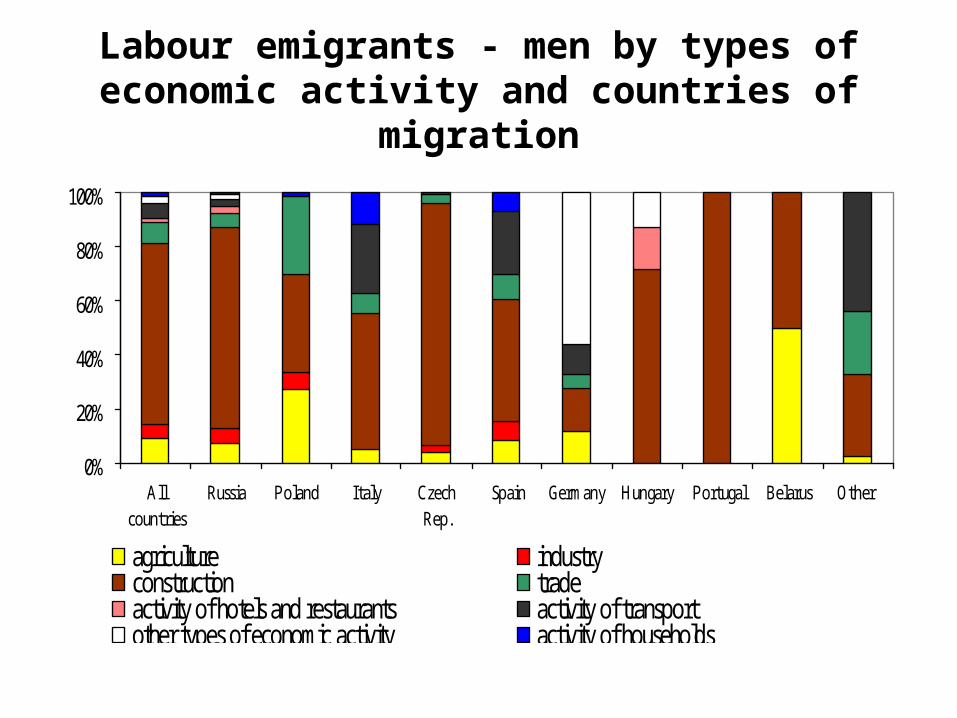
Labour emigrants - men by types of economic activity and countries of migration
0%
20%
40%
60%
80%
100%
Allcountries
Russia Poland Italy CzechRep.
Spain Germany Hungary Portugal Belarus Other
agriculture industryconstruction tradeactivity of hotels and restaurants activity of transportother types of economic activity activity of households
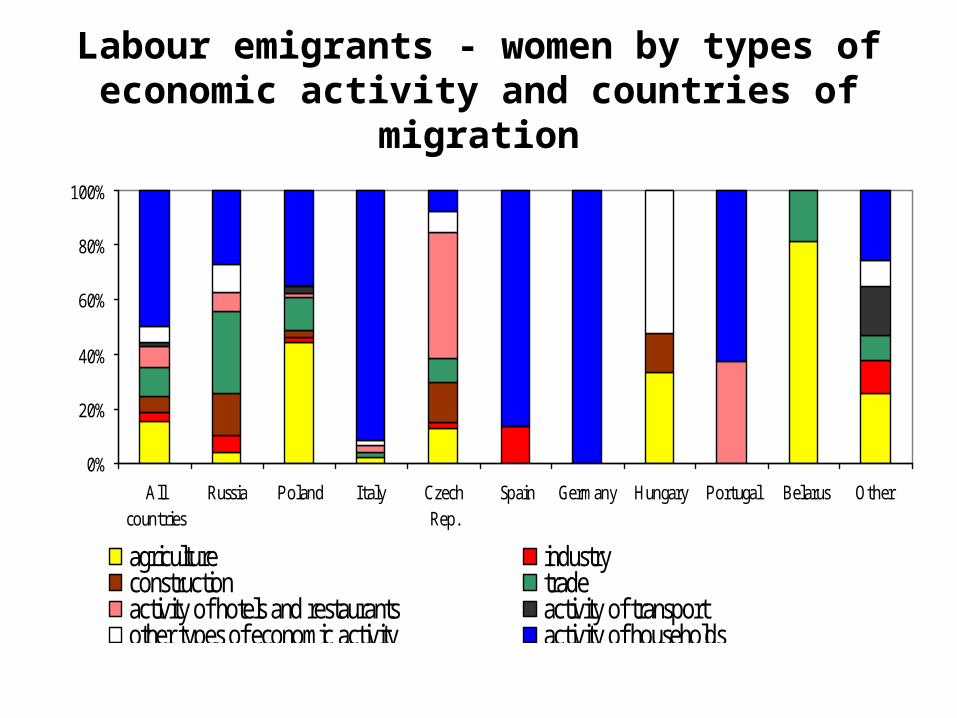
Labour emigrants - women by types of economic activity and countries of migration
0%
20%
40%
60%
80%
100%
Allcountries
Russia Poland Italy CzechRep.
Spain Germany Hungary Portugal Belarus Other
agriculture industryconstruction tradeactivity of hotels and restaurants activity of transportother types of economic activity activity of households