Embed Size (px)
Citation preview
SOURCES AND EFFECTS OF MINING-RELATED AND NATURAL
ACID ROCK DRAINAGE QUANTIFIED USING TRACER
DILUTION, COAL CREEK WATERSHED, GUNNISON COUNTY,
COLORADO
by
Brianna Shanklin
B.S., Auburn University, 2004
A thesis submitted to the
Faculty of the Graduate School of the
University of Colorado in partial fulfillment
of the requirements for the degree of
Master of Science
Department of Civil, Environmental, and Architectural Engineering
2006
ii
This thesis entitled: Sources and Effects of Mining-Related and Natural Acid Rock Drainage
Quantified Using Tracer Dilution, Coal Creek Watershed, Gunnison County, Colorado
written by Brianna Shanklin has been approved for the Department of Civil, Environmental, and
Architectural Engineering
___________________________________________ Joseph N. Ryan, Chair
____________________________________________ Joann Silverstein
____________________________________________ Natalie Mladenov
Date ___________
The final copy of this thesis has been examined by the signatories, and we find that
both the content and the form meet acceptable presentation standards of scholarly
work in the above mentioned discipline.

iii
ABSTRACT
Shanklin, Brianna L. (M.S., Department of Civil Engineering)
Sources and Effects of Mining-Related and Natural Acid Drainage Quantified Using Tracer Dilution, Coal Creek Watershed, Gunnison County, Colorado Thesis directed by Professor Joseph N. Ryan
Metal-laden, acidic drainage from the Standard Mine and the naturally
occurring iron fen and gossan in the Coal Creek watershed in Gunnison County,
Colorado have been implicated as major contaminant sources contributing to the
degradation of Coal Creek. The abandoned Keystone Mine is also located in the
watershed. Drainage from the Keystone Mine has been treated at the Mount Emmons
treatment facility since 1981. Site specific analysis quantifying the impact of
implicated as well as unidentified metal sources on Coal Creek had not been
previously conducted. A spatially detailed investigation of contaminant sources was
performed to assist the Environmental Protection Agency and a Crested Butte
community group, the Coal Creek Watershed Coalition, in development of remedial
plans. Low flow conditions are typically considered most toxic to aquatic life as
contaminant concentrations are greatest as a result of minimal dilution.
A lithium chloride tracer test and synoptic sampling of Coal Creek allowed for
the quantification of both surface and hyporheic flow and provided spatially detailed
concentration and metal loading profiles for aluminum, arsenic, barium, cadmium,
chromium, copper, iron, lead, manganese, nickel, and zinc along a 9.4 km stretch of
Coal Creek. The gossan was identified as the largest metal contributor. It was a
major source of aluminum, cadmium, iron, manganese, and zinc to Coal Creek. Elk
Creek (containing Standard Mine drainage) was identified as a major source of

iv
cadmium and zinc. An unnamed tributary 1.1 km downstream of Coal Creek was
identified as a major source of chromium, iron, and nickel.
The Mt. Emmons Treatment Plant added calcium to Coal Creek at
concentrations seven times greater than background. Large diel fluctuations in
calcium concentration and hardness coinciding with times of discharge release and
discontinuation are expected. These fluctuations result in daily changes in hardness-
based aquatic life standards set by the Colorado Department of Public Health and
Environment. Metal speciation is also affected by the hardness fluctuations.
Partitioning between the dissolved and colloidal phases was investigated for
aluminum, arsenic, lead, and zinc.

v
ACKNOWLEDGEMENTS
This research was made possible by funding and sponsorship from the
University of Colorado Outreach Program and the EPA. Many thanks are extended to
Jessica Brown and Carol Beard at the EPA for their organizational support with the
metal analyses, Suzanne Anderson at the Institute for Arctic and Alpine Research for
her assistance with the ion chromatograph analyses, and the lab personnel at the
University of Colorado’s Laboratory for Environmental and Geological Sciences. I
would like to express my gratitude to my thesis committee members; Natalie
Mladenov, Joseph Ryan, and Joann Silverstein for their advice and time spent
reviewing the following manuscript. I would especially like to thank Joe Ryan for his
expert advice and dedication to teaching. Thank you to my field team, Susan Bautts,
Christie Chatterly, Lynne Diaz, and Tim Dittrich, for their assistance in the field and
the lab and for providing welcomed comic relief. Last but not least, I would like to
thank David Wallace for his unending love and encouragement as well as my family
and friends for all of the laughs, good times, and support. You have made the last
two years a truly unforgettable pleasure.

vi
TABLE OF CONTENTS
CHAPTER 1 INTRODUCTION 1 CHAPTER 2 BACKGROUND 4 2.1 Field site 4 2.2 Abandoned mines and natural metal deposits in the Coal Creek
watershed 5 2.3 Tracer dilution method 10 2.4 Synoptic sampling method 12 CHAPTER 3 MATERIALS AND METHODS 15 3.1 Injection procedure 15 3.2 Synoptic sampling procedure 19 3.3 Sample processing and preservation 22 3.4 Analytical methods 24 3.5 Flow rate calculations 27 3.6 Metal-loading calculations 31 3.7 Water quality standards and hardness 31 CHAPTER 4 RESULTS 34 4.1 Coal Creek pH 35 4.2 Coal Creek total organic carbon concentration 35 4.3 Calcium and magnesium concentration and hardness 37 4.4 Sodium chloride pulse tracer test 40 4.5 Injection tracer concentration 41 4.6 Lithium and chloride concentration 43 4.7 Flow rate calculations 44 4.8 Flow rates based on lithium and chloride dilution 47 4.9 General metal behavior 50 4.9a Iron concentrations and loading rates 54
4.9b Manganese concentrations and loading rates 57 4.9c Aluminum concentrations and loading rates 60 4.9d Zinc concentrations and loading rates 63
4.9e Copper concentrations and loading rates 65 4.9f Cadmium concentrations and loading rates 67 4.9g Lead concentrations and loading rates 70
4.9h Nickel concentrations and loading rates 72 4.9i Chromium concentrations and loading rates 72 4.9j Arsenic concentrations and loading rates 75 4.9k Barium concentrations and loading rates 77 4.10 Electron microprobe images and elemental spectra 79
vii
CHAPTER 5 DISCUSSION 90 5.1 Suitability of lithium and chloride as tracers 90 5.2 Steady-state conditions 92 5.3 Hardness 94 5.4 Aquatic life and drinking water supply standard exceedances 97 5.5 Stream flow 102 5.6 Sources of metals and arsenic in the Coal Creek watershed 104 5.6a Iron sources 106 5.6b Manganese sources 108 5.6c Aluminum sources 109 5.6d Zinc sources 110 5.6e Copper sources 110 5.6f Cadmium sources 110 5.6g Lead sources 111 5.6h Nickel sources 111 5.6i Chromium sources 111 5.6j Arsenic sources 111 5.6k Barium sources 112 5.7 Implications of metal concentrations and metal loadings for
remediation 113 5.8 A review of colloids and metal association 116 5.9 Metal distribution between the dissolved and colloidal phase 118 5.10 Hardness and metal partitioning 124 CHAPTER 6 CONCLUSIONS 126 REFERENCES 129
viii
FIGURES
1. Location of the Coal Creek watershed 2 2. Map of the Coal Creek watershed including major tributaries, mines, and
special features 6 3. Aerial view of Coal Creek near the Keystone Mine at the base of Mt. 9
Emmons 4. Coal Creek synoptic sample sites including instream sites (blue) and
tributaries (pink) 14 5. Lithium chloride is added to the injection solution 17 6. Illustration of tributary drainage transported down culvert paralleling 21
County Highway 12 7. Coal Creek and tributary pH 36 8. Coal Creek and tributary total organic carbon 38 9. Coal Creek and tributary total calcium and magnesium concentration and
hardness as mg L-1 CaCO3 39 10. Conductivity plateau at CC-0.867 following the addition of the 42
NaCl pulse tracer 11. Coal Creek and tributary total lithium concentration and flow rate
calculated using lithium concentration dilution 48
12. Coal Creek and tributary dissolved chloride concentration and flow rate calculated using chloride concentration dilution 49
13. Coal Creek and tributary iron concentrations and loading rates 56 14. Coal Creek and tributary manganese concentrations and loading rates 58 15. Coal Creek and tributary aluminum concentrations and loading rates 61 16. Coal Creek and tributary zinc concentrations and rates 64 17. Coal Creek and tributary copper concentrations and loading rates 66

ix
18. Coal Creek and tributary cadmium concentrations and loading rates 68 19. Coal Creek and tributary lead concentrations and loading rates 71 20. Coal Creek and tributary nickel concentrations and nickel loading rates 73 21. Coal Creek and tributary chromium concentrations and loading rates 74 22. Coal Creek and tributary arsenic concentrations and loading rates 76 23. Coal Creek and tributary barium concentrations and loading rates 78 24. Electron microprobe images showing portions of colloids filtered from CC-0.282 and CC-9.442 84
25. Electron microprobe images showing portions of colloids filtered from the drinking water reservoir return flow 85
26. Electron microprobe images showing portions of colloids filtered from
UT-6.696 86 27. Elemental spectra for representative particles at CC-0.128 and the 87
drinking water reservoir return channel
28. Elemental spectra for representative particles at the drinking water reservoir return (upper spectrum) and CC-9.442 (lower spectrum) 88 29. The loading rates for calcium, aluminum, cadmium, copper, iron, manganese,
and zinc are graphed for the 4-8 km section of the study reach 101 30. The colloidal fraction (fcolloid) of aluminum, arsenic, lead, and zinc in Coal
Creek 121
x
TABLES 1. Sequence of events for September 2005 Coal Creek tracer-injection study 18 2. Minimum detection limits reported for target analytes measured using
ICP-AES, ICP-MS, and IC analysis 28 3. Equations used to calculate flow rates and mass loading rates 30 4. Time of the conductivity peak in response to the pulse NaCl
tracer at five sample sites 41 5. Injection solution lithium and chloride concentrations 43 6. Description of Coal Creek sample sites, tributaries, and diversions 51 7. Blank sample dissolved and total iron concentrations resulting from
ICP-AES analyses and nickel and chromium concentrations resulting from ICP-AES and ICP-MS analyses 55
8. Tributary loading rates expressed as a percentage of the cumulative tributary loading rate 81
9. Summary of scanning electron microprobe findings for mineralogical
composition of colloids collected on 0.45-µm filters 89 10. Comparison of chloride concentrations measured using ion chromatography
at the upstream (background) sample site, CC-0.000, and the most downstream sample site, CC-9.442 95
11. Coal Creek sample sites where the chronic and acute aquatic life toxicity
standards and the drinking water supply standard were exceeded 98 12. Aluminum, copper, iron, manganese, and zinc concentrations in the Mt.
Emmons Treatment Plant effluent channel during synoptic sampling on September 5 (after discharge from the plant ceased) and during discharge on September 6 100
13. Comparison of metal concentrations at CC-5.372, just upstream of the
drinking water intake, and at the drinking water reservoir return flow tributary 107
14. Major, minor, and trace metal sources in the Coal Creek watershed 114 15. Intrinsic surface complexation constants for lead and zinc as reported by
Dzombak and Morel (1990) 123
1
CHAPTER 1
INTRODUCTION
Over 600 km of stream reach are affected by metal-rich, acidic drainage from
abandoned mining sites in Colorado (Wentz, 1974). Acid mine drainage (AMD)
occurs when pyrite minerals (iron sulfide, FeS2) are leached and then oxidized.
Acidic water with high iron and sulfate concentrations are the products of pyrite
oxidation. AMD from abandoned mines as well as metal-laden drainage from a
natural iron deposit are suspected to degrade water quality in the Coal Creek
watershed, due west of Crested Butte, Colorado (Figure 1). The watershed has a 100-
year mining legacy, with excavation and milling operations beginning in 1874 and
continuing until 1974 (EPA, 2005a). The major mines in the district were the
Standard Mine, the Keystone Mine, and the Forest Queen Mine. The Standard Mine
was added to the National Priority List (“Superfund”) in September, 2005. Drainage
emanating from underground mining shafts at the Standard Mine flows into an
unlined, nonengineered holding pond that overflows into Elk Creek. Elk Creek then
enters Coal Creek which serves as the only drinking water supply for the Town of
Crested Butte’s 1500 residents. Risk of catastrophic failure of this holding pond and
influx of a large quantity of metal-laden water into Crested Butte’s drinking water
supply is the major threat posed by the Standard Mine site. Remedial activities are
slated to begin at the Standard Mine in the summer of 2006.

2
Somerset Mt. Crested Butte
Crested Butte
Almont
Gunnison Ohio
Pitkin
Lake Irwin
Kebler Pass Coal Creek
Taylor Park Reservoir
Blue Mesa Reservoir
Gunnison River
East River
Hwy 135
Taylor River
Hwy 50
Coal Creek Watershed Boundary
Creek or River
Major Highway
Town
Mine Site
N
Figure 1. The Coal Creek watershed is located due west of the Town of Crested Butte in northern Gunnison County, Colorado.
Drainage from the Keystone Mine is treated at the Mount Emmons Treatment
Plant and then released into Coal Creek just downstream of Crested Butte’s drinking
water intake. Ownership and managerial responsibility of this treatment plant was
reaquired by U.S. Energy Corporation in February, 2006. Despite strong opposition
from several concerned citizens, U.S. Energy has announced plans to resume mining
operations on Mount Emmons to exploit a “world-class” molybdenum deposit
underneath the mountain (U.S. Energy, 2006).
A naturally occurring iron-rich surface deposit, or iron gossan, also drains into
Coal Creek. Drainage from the gossan is suspected of having a low pH and adding
toxic aluminum, iron, manganese, and zinc concentrations to the watershed. A low-

3
pH wetland, or iron fen, is located below the gossan and may also negatively impact
Coal Creek water quality.
The Coal Creek Watershed Coalition (CCWC), a community group based in
Crested Butte, is working to restore aquatic life habitat and protect other water uses in
Coal Creek (CCWC, 2006). Recreation is the dominant monetary contributor to the
local economy, having replaced mining in the late 1900’s. The CCWC hopes that
well-directed remedial action in the Coal Creek watershed will create a sustainable
fish population and promote fishing in Coal Creek. The University of Colorado
Outreach Program is partnering with the Coal Creek Watershed Coalition in an effort
to identify the most toxic metal sources in the watershed.
This tracer injection and synoptic sampling study allows calculation of metal
loading rates along Coal Creek. Metal loads pinpoint locations of greatest metal
influx to Coal Creek (Kimball, 1997). Spatially-detailed characterization of Coal
Creek metal loads is required for proper remedial action.
The objectives of this study were to (1) quantify and locate sources of metal
input to Coal Creek, (2) investigate specific metal contributions to Coal Creek from
the Standard Mine (Elk Creek) and the iron gossan, (3) assess relationships and
interactions between metal partitioning between the dissolved and colloidal phases,
sediment elemental composition, and water column metal removal processes.

4
CHAPTER 2
BACKGROUND
2.1 Field site The Coal Creek watershed (Figures 1 and 2) drains an area of approximately
65 km2 and is located in Ruby-Anthracite Range of northern Gunnison County,
Colorado. Coal Creek is the primary stream in the watershed. Coal Creek originates
at Lake Irwin in the northwestern portion of the watershed. The downstream reach of
Coal Creek flows through the Town of Crested Butte on the eastern edge of the
watershed before ultimately entering the Slate River, which flows south into the East
River, and then into the Gunnison River.
Elevations in the watershed range from 2,900 m in Crested Butte to 4,300 m
along peaks of the Ruby Range. Vegetation includes aspen, fir, and spruce forests
along with treeless alpine tundra vegetation at higher elevations. Slope and aspect
greatly influence microclimates. North-facing slopes receive more snowfall and have
higher soil moisture contents. This greater moisture content supports more dense
vegetation, especially coniferous forest. South-facing slopes tend to be drier and
vegetated by sagebrush and grasses (Soule, 1976). Mean annual rainfall for the
watershed is 60 cm (WRCC, 2006). The majority of precipitation falls as snow with
average annual snowfall of 500 cm in Crested Butte and 1270 cm at the top of Kebler
Pass. Stream flow is dominated by snow melt. Mean annual flow is 1.46 x 10⁷ m3
with an average daily flow of 0.46 m3 s-1in Coal Creek just downstream of the Elk
Creek confluence. Average daily flow at this location for the month of September is
0.058 m3 s-1 (USGS, 2006).

5
Glacial erosion during the Pleistocene epoch shaped the Coal Creek valley.
Laccoliths, or dome-shaped igneous intrusions, other resistant sedimentary rock, or
crystalline or volcanic rocks characterize the higher mountains. The valley bottom
is underlain by sand and gravel deposited by glacial ice or meltwater (Streufert,
1999).
2.2 Abandoned mines and natural metal deposits in the Coal Creek watershed
The watershed is rich in mineral resources. Hard rock mining began in this
area, also known as the Ruby Mining District, in 1874 when the watershed belonged
to the Ute Indian Reservation and continued until 1974 (EPA, 2005a). Vein deposits
are contained in north-northeast-trending faults, dikes, and small stocks on the eastern
faces of the Ruby Range. These veins are rich in copper, gold, lead, molybdenum,
ruby silver, and zinc (Streufert, 1999). The three largest mines were the Standard
Mine, the Keystone Mine, and the Forest Queen Mine, all of which lie on the
southern face of Scarp Ridge, and all of which are now inactive (EPA, 2005b). The
watershed is now used primarily for recreation, including hiking, biking, fishing, and
camping.
Coal Creek serves as the drinking water supply for the Town of Crested Butte.
The drinking water intake diverts water from Coal Creek at a rate of 0.079 m3 s-1.
Two irrigation diversions reroute flow from Coal Creek to Smith Ranch (Spann-
Nettick ditch) and Town Ranch (Halazon ditch), respectively. Both diversions are
located immediately west of Crested Butte. Overflow from the drinking water supply

6
reservoir is returned to Coal Creek 60 m downstream of the Spann-Nettick diversion
and 15 m upstream of the Halazon diversion (Adams, 2006).
The Standard Mine was added to the U.S. Environmental Protection Agency
(U.S.EPA) National Priority List in September, 2005. The mine sits on 4 ha of land
approximately 16 km northwest of Crested Butte. Standard Metals Corporation owns
the patented mining claims. The surrounding land is owned by the U.S. Forest
Service. The mine site contains many open adits and shafts, an old mill, and railroad
tracks that run 5 m above ground on rotting wooden poles. Popular hiking trails
parallel the site and no access restrictions are in place. On-site wastes include
Coal Creek
Elk Creek
Standard Mine Keystone MineLake Irwin
Slate River
Splain’s Gulch
Wildcat Creek
Scarp Ridge
Iron Gossan
Mt. Emmons
Eva
ns B
asin
Crested ButteForest Queen Mine
Figure 2. The Coal Creek watershed including major tributaries, mines, and special features.
N
7
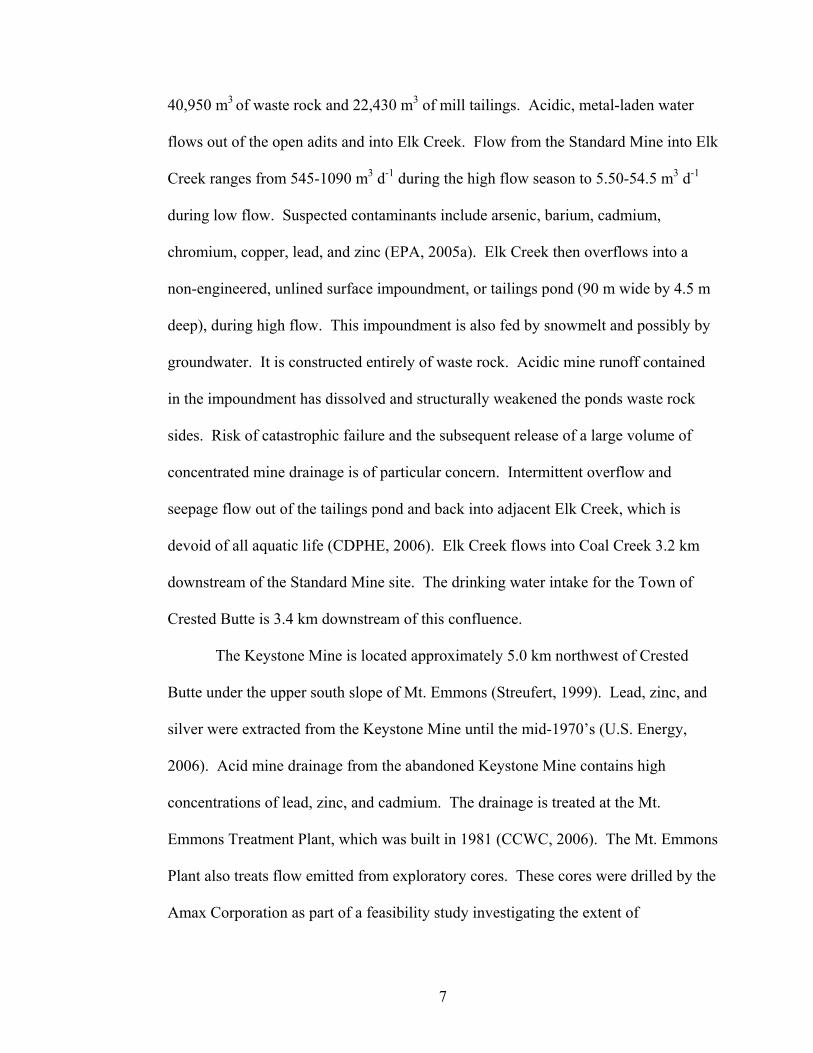
40,950 m3 of waste rock and 22,430 m3 of mill tailings. Acidic, metal-laden water
flows out of the open adits and into Elk Creek. Flow from the Standard Mine into Elk
Creek ranges from 545-1090 m3 d-1 during the high flow season to 5.50-54.5 m3 d-1
during low flow. Suspected contaminants include arsenic, barium, cadmium,
chromium, copper, lead, and zinc (EPA, 2005a). Elk Creek then overflows into a
non-engineered, unlined surface impoundment, or tailings pond (90 m wide by 4.5 m
deep), during high flow. This impoundment is also fed by snowmelt and possibly by
groundwater. It is constructed entirely of waste rock. Acidic mine runoff contained
in the impoundment has dissolved and structurally weakened the ponds waste rock
sides. Risk of catastrophic failure and the subsequent release of a large volume of
concentrated mine drainage is of particular concern. Intermittent overflow and
seepage flow out of the tailings pond and back into adjacent Elk Creek, which is
devoid of all aquatic life (CDPHE, 2006). Elk Creek flows into Coal Creek 3.2 km
downstream of the Standard Mine site. The drinking water intake for the Town of
Crested Butte is 3.4 km downstream of this confluence.
The Keystone Mine is located approximately 5.0 km northwest of Crested
Butte under the upper south slope of Mt. Emmons (Streufert, 1999). Lead, zinc, and
silver were extracted from the Keystone Mine until the mid-1970’s (U.S. Energy,
2006). Acid mine drainage from the abandoned Keystone Mine contains high
concentrations of lead, zinc, and cadmium. The drainage is treated at the Mt.
Emmons Treatment Plant, which was built in 1981 (CCWC, 2006). The Mt. Emmons
Plant also treats flow emitted from exploratory cores. These cores were drilled by the
Amax Corporation as part of a feasibility study investigating the extent of

8
molybdenum and diamond deposits. The plant cost $14 million to build and the
yearly operational costs are $1 million (U.S. Energy, 2006).
On February 28, 2006, U.S. Energy Corporation and Crested Corporation
reacquired the Mt. Emmons property. With the acquisition also came the
responsibility of running the Mt. Emmons Treatment Plant. This 2,185 ha property
contains a “world-class” molybdenum deposit. Reserves are estimated at 140 million
tonnes of 0.44 percent molybdenum disulfide (MoS2) (Streufert, 1999). The owners
are actively pursuing development and mining given the highly favorable pricing
environment for molybdic oxide. They are also considering the use of the Mt.
Emmons Treatment Plant in future milling operations (U.S. Energy, 2006).
The commodity extracted at the Forest Queen Mine was silver. A mill was
located on-site (Hornbaker, 1984). One adit at this inactive mine drains into Coal
Creek just below the old Irwin town site southeast of Lake Irwin. Ongoing studies
aim to determine how this drainage impacts Coal Creek (CCWC, 2006).
An iron gossan is located just southwest of the Keystone Mine at an elevation
of 2,911 m (Figure 3). Its surface area is approximately 1.2 ha. A gossan is formed
when a series of springs flow over highly mineralized and fractured bedrock rich in
pyrite (FeS2) (CCCOSC, 2006). This process forms peat terraces composed of
limonite, or natural aggregate of hydrous ferric oxides lacking crystallization (Kelly,
1958). Pyrite oxidation produces acidic byproducts that lower pH. Pyritic gossans
are characterized by a very dusky red to dark reddish brown or moderate brown color
(Kelly, 1958). This gossan is one of eight in Colorado. An iron bog, or fen, is
present downslope of the gossan. This iron bog is a peat wetland with high nutrient
9
Coal Creek
gossan
Mt. Emmons treatment plant
UT-3.294
UT-3.455
UT-3.661
Keystone Mine
N
Iron fe
n
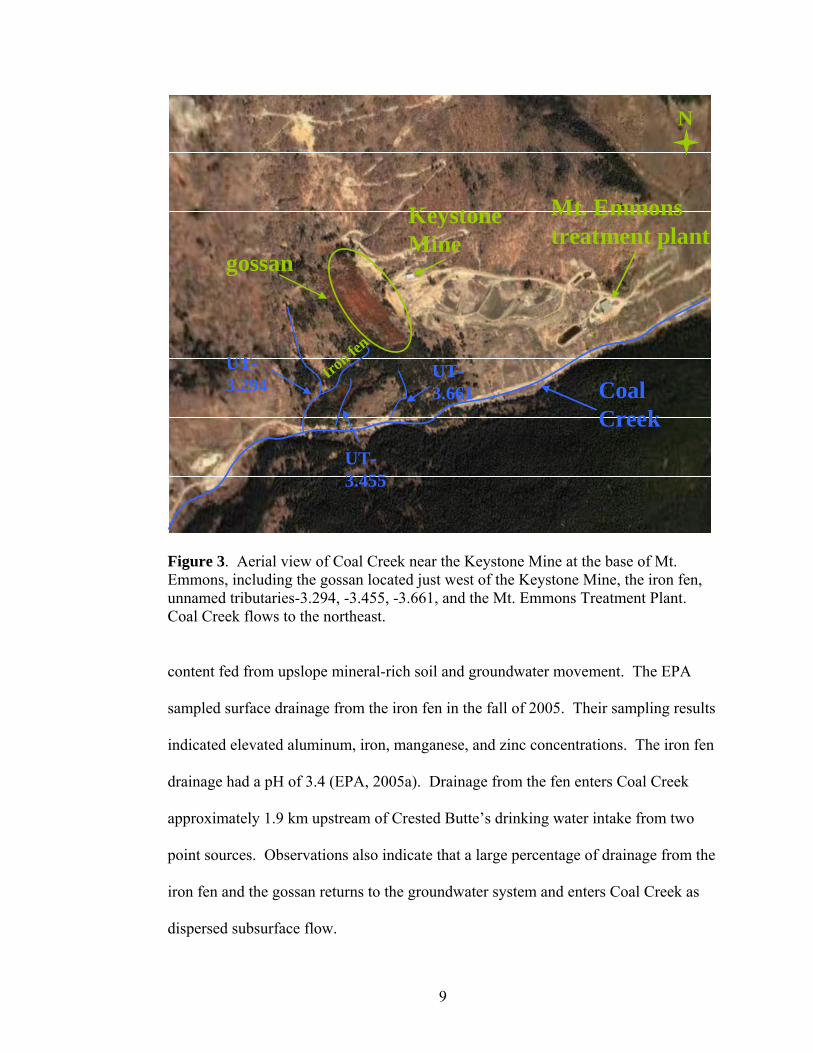
Figure 3. Aerial view of Coal Creek near the Keystone Mine at the base of Mt. Emmons, including the gossan located just west of the Keystone Mine, the iron fen, unnamed tributaries-3.294, -3.455, -3.661, and the Mt. Emmons Treatment Plant. Coal Creek flows to the northeast.
content fed from upslope mineral-rich soil and groundwater movement. The EPA
sampled surface drainage from the iron fen in the fall of 2005. Their sampling results
indicated elevated aluminum, iron, manganese, and zinc concentrations. The iron fen
drainage had a pH of 3.4 (EPA, 2005a). Drainage from the fen enters Coal Creek
approximately 1.9 km upstream of Crested Butte’s drinking water intake from two
point sources. Observations also indicate that a large percentage of drainage from the
iron fen and the gossan returns to the groundwater system and enters Coal Creek as
dispersed subsurface flow.
10
The fen supports a unique vegetative community including a round-leaved
sundew, Drosera rotundifolia. This small, carnivorous plant has not been found
anywhere else in the Central or Southern Rocky Mountains in spite of extensive
searches in similar acidic fens. The U.S. Forest Service is concerned that
molybdenum mining on Mt. Emmons may alter or exterminate the sundew
population. Another concern is the alteration of groundwater flow by mining
operations, which may remove water from springs that feed the fen (USFS, 1981).
2.3 Tracer dilution method
The tracer dilution method allows quantification of discharge by monitoring
dilution of a tracer as it moves downstream. A specific concentration of tracer is
injected at a constant rate to achieve steady-state conditions. This provides a known
mass of tracer added to the stream. Tracer concentration is measured upstream and
downstream of the injection site. Discharge is quantified based on the dilution of the
tracer as it moves downstream from the injection site (Kimball, 1997). The tracer
dilution method accounts for flow through the hyporheic zone, or the layer of cobbles
and streambed sediment that rapidly exchanges water with the stream. Flow through
the hyporheic zone is normally substantial for high-gradient, shallow mountain
streams such as Coal Creek. Traditional current meter flow measurements for
mountain streams are typically underestimates because flow through the hyporheic
zone is not captured (Bencala and others, 1990).
The tracer dilution method also accounts for dispersed groundwater inputs as
well as seeps or springs discharging over a large area. These nonpoint sources affect
11
quantification of flow because they contribute to the dilution of the tracer; however,
the portion of flow attributable to point versus nonpoint sources cannot be
distinguished.
The tracer-injection method requires the tracer to be inert and transported
downstream in a conservative fashion, unaffected by biogeochemical reactions. The
injection must continue until all parts of the stream including the hyporheic zone and
all surface storage zones become saturated with tracer. Under these saturation
conditions, the instream tracer concentration is said to be at the plateau concentration
(Bencala and others, 1990). Lithium chloride (LiCl) was the tracer used for this
study. Lithium is reported to act conservatively in streams with low pH (Paschke and
others, 2005). The background lithium concentration of natural waters is normally
significantly low. This allows for detection of a pronounced peak in lithium
concentration upon tracer arrival. Chloride is commonly known as the “universal
tracer” and is expected to behave conservatively in most aquatic environments
(Bencala and others, 1987). All downstream reductions in tracer concentration are
assumed to be a result of dilution from tributary and groundwater inflow (Kimball
and others, 2002). When a surface tributary is present between two sample locations,
calculated inflow discharge is assigned solely to the tributary despite the possibility of
groundwater inputs. When no visible tributary is present, instream discharge
increases are assumed to be a result of ground-water inflow. Again, the tracer
dilution method is unable to distinguish between tributary and groundwater inflow if
both occur between two synoptic sample sites. The method only accounts for the
total inflow between two sample sites.
12
This low flow tracer dilution experiment was performed along 9.4 km of Coal
Creek in September 2005. Low flow studies are useful in developing base-flow
metal-loading profiles. The highest metal concentrations which are most toxic to
aquatic life commonly occur during the low flow season when only a small volume of
water is available to dilute pollutants (Paschke and others, 2005). Low flow tracer
dilution studies aid in identifying sources contributing to these toxic metal
concentrations.
2.4 Synoptic sampling method
Synoptic sampling is the spatially detailed sampling of stream sites and all
tributary inflows that provides a one-time description of stream and tributary
chemistry. It gives a “snapshot” of stream chemistry and flow that allows
quantification of instream loads (Kimball, 1997). The “snapshot” is not
instantaneous, but represents the sampling period of several hours. A sample site
spacing of hundreds of meters is recommended for practical analysis of stream
chemistry (Bencala and others, 1990). Forty-seven instream sites and thirteen
tributary sites were assigned for this study (Figure 4). Synoptic sample sites were
intended to bracket all tributary inflows. This allows for understanding and
quantifying the impacts of many individual sources on the watershed as a whole. A
global positioning receiver (Garmin GPS 12) global positioning receiver was used to
space the instream sites at intervals of about 200 m and to record all sampling
locations. The GPS route was marked along County Highway 12, not directly along
the stream. Site coordinates are therefore slightly offset to the north of Coal Creek.

13
The sample site spacing provided spatially detailed concentration profiles to examine
metal inputs. This sampling regime is more intensive and expensive than simply
measuring water-quality parameters at an outlet downstream of acid mine drainage.
However, it quantifies impacts from individual sources to provide information
necessary for restoration decisions (Kimball and others, 2001).
14
Elk Creek
Figure 4. Coal Creek synoptic sample sites including instream sites (blue) and tributaries (pink). The Standard Mine, Keystone Mine, iron gossan, and drinking water reservoir are also shown.
14
15
CHAPTER 3
MATERIALS AND METHODS
3.1 Injection procedure
Prior to injection of the lithium chloride tracer, a sodium chloride (NaCl)
pulse tracer test was conducted to determine stream velocity. The purpose of the test
was to estimate the time required for the tracer to reach the downstream end of the
study reach. The NaCl solution was made by mixing 22.7 kg of NaCl and 151 L of
stream water in a 210 L polyethylene barrel. At 12:28 on September, 3 2005, the
entire barrel containing the NaCl solution instantaneously added to Coal Creek at the
injection site. Downstream transport of the tracer was documented using a
conductivity meter (Orion, model 105) at five sample sites located within the first
1.3 km of the study reach. The background conductivity was measured at each of
these sites. The conductivity was then monitored until it peaked and began to decline.
Stream velocity was calculated by dividing the distance traveled by the time required
for the conductivity to peak at each monitoring site. It was determined that a 43 h
injection was required for the LiCl tracer to reach the downstream end of the study
reach.
The LiCl tracer solution was prepared by pumping stream water into a 405 L
polyethylene tank and adding approximately 34 kg of LiCl (FMC Industrial
Chemicals, LiCl anhydrous technical grade, CAS no. 7447-41-8). A downstream Li
concentration 100 times greater than the upstream (background) Li concentration was
desired. Calculations showed that 34 kg of LiCl added to the 405 L barrel would
16
produce the desired instream spike in Li concentration. The solution was mixed with
a paddle and recirculated with a pump (Fluid Metering Instruments (FMI) PM6014
pump and FMI Q410-2 pump head) for 90 min until completely dissolved (Figure 5).
The injectate was sampled every 4 h for the duration of the injection. The average
lithium concentration of the injection solution was later measured at 1.17 × 10⁷ µg L-1
while the average chloride concentration was 7.59 × 10⁷ µg L-1. The injection
solution lithium concentration ranged from 1.13 × 10⁷ to 1.24 × 10⁷ µg L-1 while the
chloride concentration ranged from 2.33 × 10⁷ to 9.64 × 10⁷ µg L-1. The average
background lithium concentration was 3.53 µg L-1. The average background chloride
concentration was 2.38 mg L-1.
The stock tracer solution was replenished twice during the injection period
(Table 1). On the September 4 at 09:10, 150 L of the original tracer solution
remained. A new batch was prepared by pumping 208 L of stream water into a 210 L
polyethylene barrel. A second barrel was used for mixing the new solution to avoid
interrupting the injection process. Lithium chloride was added to the 210 L
polyethylene barrel until the specific conductance of the second stock tracer solution
matched the specific conductance of the original tracer solution. The specific
conductance of the original solution was measured as 107.0 mS cm-1 with a specific
conductance meter (Orion, model 105) calibrated with a 1413 μS cm-1 standard. A
total of 16 kg of LiCl was added to the second stock tracer solution. The final
specific conductance of the second stock tracer solution was 109.5 mS cm-1. The
newly mixed tracer solution was pumped into the original 405 L tank at 09:40 on
September 4. The specific conductance of the replenished tank was 107.5 mS cm-1.
17
Figure 5. Lithium chloride is added to the injection solution and stirred with a paddle for 90 minutes until the salt is completely dissolved.
On September 4 at 17:45, 220 L of tracer solution remained in the injection tank and
the specific conductance was measured at 110.5 mS cm-1. A third stock tracer
solution was prepared by pumping 208 L of stream water into the 210 L polyethylene
barrel and adding 17 kg of LiCl so that the specific conductance reached
109.7 mS cm-1. This third batch of tracer solution was then pumped into the 405 L
tank and lasted for the duration of the injection.
18
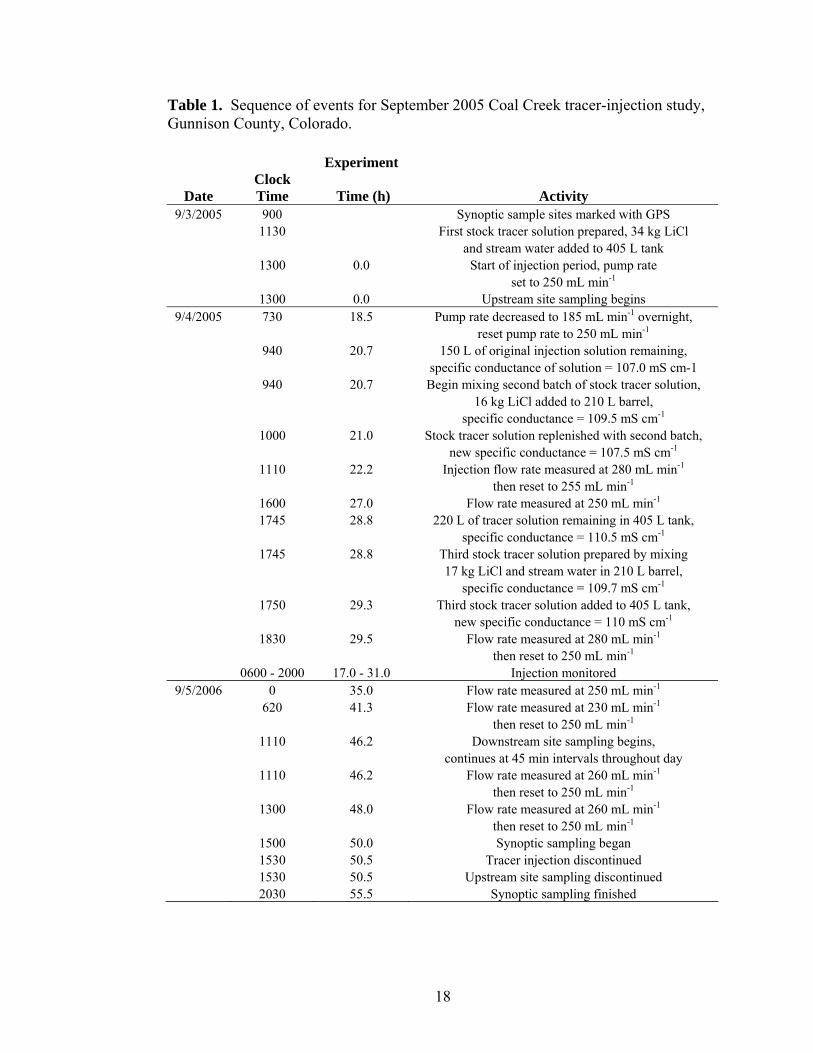
Table 1. Sequence of events for September 2005 Coal Creek tracer-injection study, Gunnison County, Colorado.
Experiment
Date Clock Time Time (h) Activity
9/3/2005 900 Synoptic sample sites marked with GPS 1130 First stock tracer solution prepared, 34 kg LiCl and stream water added to 405 L tank 1300 0.0 Start of injection period, pump rate set to 250 mL min-1 1300 0.0 Upstream site sampling begins
9/4/2005 730 18.5 Pump rate decreased to 185 mL min-1 overnight, reset pump rate to 250 mL min-1 940 20.7 150 L of original injection solution remaining, specific conductance of solution = 107.0 mS cm-1 940 20.7 Begin mixing second batch of stock tracer solution, 16 kg LiCl added to 210 L barrel, specific conductance = 109.5 mS cm-1 1000 21.0 Stock tracer solution replenished with second batch, new specific conductance = 107.5 mS cm-1 1110 22.2 Injection flow rate measured at 280 mL min-1 then reset to 255 mL min-1 1600 27.0 Flow rate measured at 250 mL min-1 1745 28.8 220 L of tracer solution remaining in 405 L tank, specific conductance = 110.5 mS cm-1 1745 28.8 Third stock tracer solution prepared by mixing 17 kg LiCl and stream water in 210 L barrel, specific conductance = 109.7 mS cm-1 1750 29.3 Third stock tracer solution added to 405 L tank, new specific conductance = 110 mS cm-1 1830 29.5 Flow rate measured at 280 mL min-1 then reset to 250 mL min-1 0600 - 2000 17.0 - 31.0 Injection monitored
9/5/2006 0 35.0 Flow rate measured at 250 mL min-1 620 41.3 Flow rate measured at 230 mL min-1 then reset to 250 mL min-1 1110 46.2 Downstream site sampling begins, continues at 45 min intervals throughout day 1110 46.2 Flow rate measured at 260 mL min-1 then reset to 250 mL min-1 1300 48.0 Flow rate measured at 260 mL min-1 then reset to 250 mL min-1 1500 50.0 Synoptic sampling began 1530 50.5 Tracer injection discontinued 1530 50.5 Upstream site sampling discontinued 2030 55.5 Synoptic sampling finished
19
The tracer solution was injected into Coal Creek using a pump (FMI PM6014
pump and FMI Q410-2 pump head) and flow rate controller (FMI V200 stroke rate
controller). Tubing (Fisherbrand silicon tubing, 9.5 mm diameter, 3.0 mm wall) was
used to transfer the tracer solution from the 405 L mixing tank through the metering
pump and into the creek at the injection site. The LiCl tracer was injected over a
period of 50.5 h. A constant injection rate of 250 mL min-1 was desired to ensure
steady-state conditions. The actual measured injection rate varied from
185-280 mL min-1 (Table 1).
An upstream site (designated “0.000”) was sampled every 4 h for the duration
of the injection to provide background lithium and chloride concentrations. The
upstream site was located 50 m upstream of the injection site (designated “0.051”).
The most downstream site (“9.442”) was located 9.4 km downstream of the injection
site in the Town of Crested Butte. Samples were collected every 45 min at the
downstream site on the day of synoptic sampling to identify the leading edge of the
tracer plume.
3.2 Synoptic sampling procedure
Synoptic sampling began 50 h after the start of the injection. The sampling
event lasted approximately 5.5 h. Instream sample sites are designated with the
letters “CC-” followed by a number representing the distance in km from the most
upstream sample site, CC-0.000. All tributary names besides Splain’s Gulch, Elk
Creek, the Mt. Emmons Treatment Plant effluent channel, and the drinking water
return reservoir begin with the designation “UT-” to indicate their status as unnamed
20
or unidentified tributaries. Three unnamed tributaries were not identified during GPS
sample location assignment but were found during the synoptic sampling event.
These tributaries were designated UT-6.606, UT-6.696, and UT-6.801.
Synoptic sampling was conducted by a six member team. One individual
remained at the injection site taking upstream and injection samples at regular time
intervals and monitoring the injection pump so as to maintain a steady injection rate.
A second individual sat at the downstream end of the study reach, CC-9.442, taking
samples every 45 minutes from 11:00 to 19:50 on the day of synoptic sampling. The
downstream site was monitored for the entire day to allow for development of a
breakthrough curve. Ideally, a rising tracer concentration followed by a plateau of the
tracer concentration over time would indicate the time of tracer arrival at CC-9.442.
The four remaining team members conducted synoptic sampling of Coal Creek from
15:00 to 19:50. Sampling began on the upstream section of the study reach. Team
members successively proceeded, or “leap frogged”, towards the downstream end of
the study reach until samples were obtained at each synoptic site.
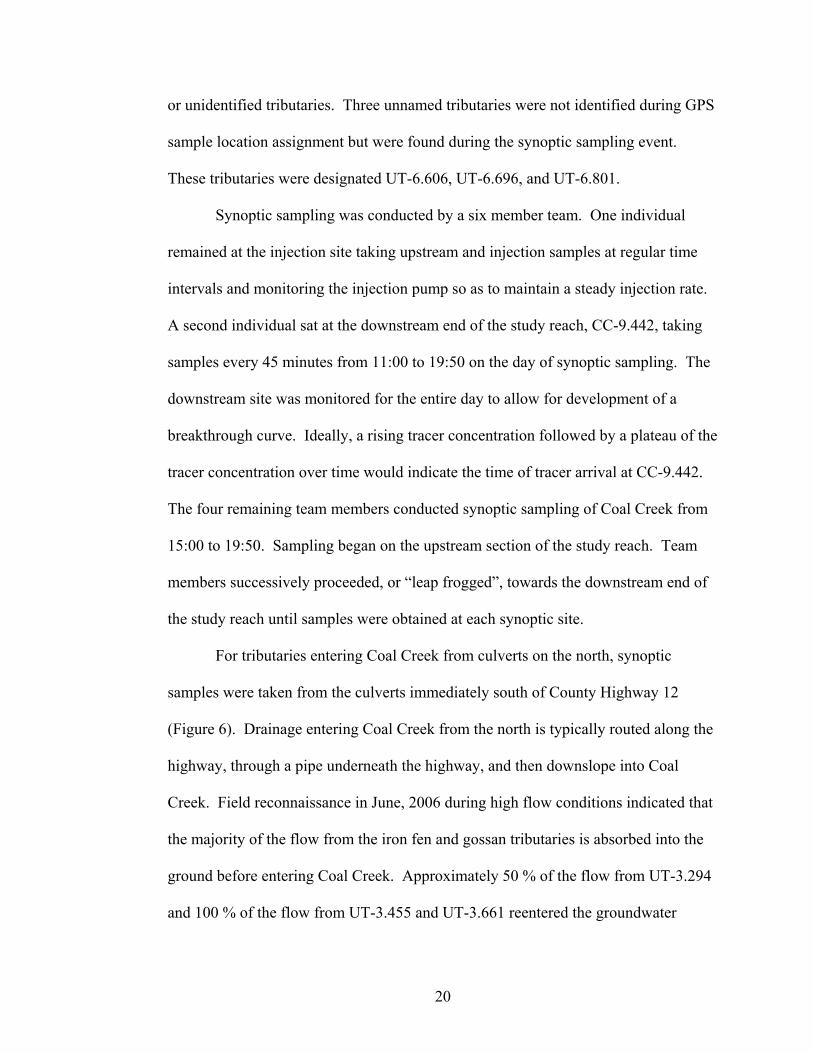
For tributaries entering Coal Creek from culverts on the north, synoptic
samples were taken from the culverts immediately south of County Highway 12
(Figure 6). Drainage entering Coal Creek from the north is typically routed along the
highway, through a pipe underneath the highway, and then downslope into Coal
Creek. Field reconnaissance in June, 2006 during high flow conditions indicated that
the majority of the flow from the iron fen and gossan tributaries is absorbed into the
ground before entering Coal Creek. Approximately 50 % of the flow from UT-3.294
and 100 % of the flow from UT-3.455 and UT-3.661 reentered the groundwater
21
Drainage collected on the north side of County Highway 12 and transported underneath the road via a pipe.
Pipe delivers drainage to south side of County Highway 12 where it partially enters Coal Creek assurface flow and partially as dispersed groundwaterflow. Samples were taken directly from pipe on south side of the highway.
Coal Creek
Sample Site
Figure 6. Illustration of tributary drainage transported down culvert paralleling County Highway 12, through pipe underneath the road, and into Coal Creek. A portion of the flow enters Coal Creek as a surface point source while a portion enters Coal Creek as dispersed subsurface flow.
system before entering Coal Creek (Figure 6). During low flow conditions, it is likely
that even a larger percentage of the flow would be absorbed before entering Coal
Creek.
At each sample site, stream water samples were collected in 1 L (Nalgene
1 L high density polyethylene wide mount sample bottle) and a 60 mL (Nalgene 60
mL wide mouth amber glass bottle) bottles. Samples were kept on ice in coolers for
field preservation. Duplicate samples were collected at nine sites for quality
assurance.

22
3.3 Sample processing and preservation
Three hundred mL of the 1 L sample was filtered through nylon membranes
(Fisherbrand, 0.45 µm, 47 mm diameter) using filtration vessels (Nalgene 500 mL
filter holder with receiver, Cat. No. 300-4050, and O-Rings, Cat. No. 71-0300-0004)
upon arrival at the field laboratory. The EPA performed lithium and metal analyses
and specified the use of 0.45 µm size filters. The EPA and others have historically
used this size filter because of its field-portability, simplicity, and the low-cost of this
technique (EPA, 2006; Morrison and Benoit, 2001). The historical use of the 0.45
micron size filters also allows for comparison to previous studies. One disadvantage
of this size filter is that the pore size is operationally defined and causes unambiguous
separation of particle size classes. Many colloids in natural waters pass through 0.45
micron filters (Morrison and Benoit, 2001; Pham and Garnier, 1998). On the opposite
end of the spectrum, membrane clogging can occur during filtration, reducing the
effective pore size and causing the retention of an increasing mass of colloids.
Filtration vessels were rinsed three times with high-purity water (Millipore
Milli-Q, > 18 Mohm resistivity) following each filtration. The membrane filters were
handled with tweezers. Lab personnel wore gloves at all times during the filtration.
A vacuum pump (Gast 0523-101Q-G582DX) with attached tubing (Fisherbrand
peristaltic tubing, 6.4 mm diameter, 2.4 mm wall) was used to apply suction to the
filtration vessels and increase the filtration rate. Another 300 mL of the 1 L sample
was not filtered. The filtered sample composed the dissolved portion and provided
dissolved constituent concentrations. The unfiltered sample provided total
23
concentrations. The colloidal concentration was indirectly determined as the
difference between the total and dissolved concentrations.
Both the total and dissolved samples were acidified to pH < 2 with trace
metal-grade nitric acid (Fisher Chemical). One mL of nitric acid was added to each
250 mL filtered and unfiltered sample using a pipette (Fisherbrand 100-1000 µL
Finnipipette, U16138, and Fisherbrand Redi-Tip General Purpose 101-1000 µL
pipette tips, 21-197-8F). Each 300 mL sample was further divided into a 250 mL
sample and a 30 mL sample (Nalgene 250 mL and 30 mL high density polyethylene
wide mouth sample bottle). The 250 mL sample was sent to the EPA laboratory for
inorganic constituent analysis. The 30 mL sample along with any additional
remaining sample was kept as backup at the University of Colorado at Boulder. The
60 mL samples in glass amber bottles remained unfiltered to provide total organic
carbon (TOC) concentrations. TOC samples were preserved by reducing pH to less
than 2 by pipetting 0.5 mL of phosphoric acid (Fisher Chemical) into the glass amber
bottle.
The 250 mL total and dissolved samples were prepared, labeled, and
documented in accordance with the EPA Superfund Analytical Services/Contract
Laboratory Program for multi-media, multi-concentration inorganic analysis,
ILMO5.3 (EPA, 2006). These total and dissolved samples were shipped overnight on
ice to an EPA contract laboratory for analysis.
24
3.4 Analytical Methods
Sample pH was measured in the field lab within 24 h of collection (Thermo
Orion 250A+ meter, 9157BN electrode). The pH meter was calibrated using pH 4
and 7 standards at room temperature.
TOC concentrations were measured using a TOC analyzer (Sievers, 800
Series autosampler and DataPro software) 30 days after sample collection. The
instrument converts organic carbon in the sample to carbon dioxide (CO2) by
oxidizing organic carbon. A gas-permeable membrane selectively allows only the
CO2 to pass through for measurement. The quantity of CO2 produced through
oxidation is directly proportional to the amount of carbonaceous material in the
sample. The analyzer uses a conductometric TOC measurement technique. This
technique uses conductivity meters that are not susceptible to drift or fluctuation.
Calibration is only required once annually so no calibration was performed prior to
these runs. Vials (Fisherbrand 15 mL glass amber vials) were labeled, filled with
sample, and then loaded into the TOC autosampler. Two sample vials of high-purity
water were run first to flush the system of any trace organic carbon. A vial of high-
purity water was also run last sample to wash the analyzer tubing of any residual
organic carbon.
Total and dissolved metal concentrations were measured by inductively
coupled plasma-atomic emission spectrometry (ICP-AES) and inductively coupled
plasma-mass spectrometry (ICP-MS). A total of twenty-three inorganic constituents
were measured and included aluminum, antimony, arsenic, barium, beryllium,
cadmium, calcium, chromium, cobalt, copper, iron, lead, lithium, magnesium,

25
manganese, nickel, potassium, selenium, silver, sodium, thallium, vanadium, and
zinc. ICP-MS analysis was performed for constituents measured below ICP-AES
detection limits. The ICP-AES and ICP-MS analyses were carried out by an EPA
contract laboratory, Liberty Analytical Corporation (Cary, NC). Additional ICP-AES
(ARL 3410+ and AIM 1250 sampler) analyses were performed to measure the lithium
concentrations of the injectate samples at the Laboratory for Environmental and
Geological Studies (LEGS), Department of Geological Sciences, University of
Colorado at Boulder, by Fredrick Luiszer. These additional analyses were performed
to ensure the accuracy of the measured injectate lithium concentrations.
EPA contract labs must use a computer-controlled ICP-AES with background
correction, a radio frequency generator, and a supply of argon gas of welding grade or
better. The EPA performs a digestion on samples analyzed with ICP-AES. The
digestion consists of adding 50-100 mL of well-mixed sample, 2 mL nitric acid, and
10 mL hydrochloric acid to a heating vessel. The vessel is heated at 92-95 ºC for 2 h
or until sample volume is reduced by half. The sample is cooled and filtered to
remove insoluble material. The sample volume is adjusted to back to predigestion
volume with reagent water. Sample vessels are then filled and placed in the sampling
carousel.
EPA contract labs must use an ICP-MS capable of scanning 5-250 atomic
mass units (amu) with a minimum resolution of 1 amu peak width at 5% peak height,
a conventional or extended range detector, high purity (99.99%) argon gas, a variable
speed peristaltic pump, and a mass-flow controller on the nebulizer gas supply. The
EPA also performs a digestion on samples analyzed with ICP-MS. The digestion

26
consists of adding 50-100 mL of well-mixed sample, 2 mL of nitric acid, and 1 mL of
hydrochloric acid to a 250 mL heating vessel. The heating vessel is covered and
heated at 92-95 ºC until sample volume is reduced by half. The sample remains
covered for 30 min after heating to prevent further evaporation. It is then completely
cooled and filtered to remove insoluble material. Sample volume is adjusted back to
the predigestion volume with reagent water (EPA, 2006). Following digestion,
samples are ready for ICP-MS analysis.
Dissolved chloride ion concentrations were analyzed using an ion
chromatograph (IC; Dionex model ICS-2000) at the Institute for Arctic and Alpine
Research (INSTAAR) at the University of Colorado at Boulder under the supervision
of Suzanne Anderson. An additional filtration was performed (Onguard II Na
Cartridges, Dionex PN062948) prior to IC runs to remove trace metals. Only
dissolved chloride concentrations were measured because particulates present in
unfiltered samples damage IC columns. It was assumed that approximately 100 % of
total chloride would be in the dissolved form. Four standards designated as Level 1,
Level 2, Level 3, and Level 4 were used. The standard concentrations were as
follows. Level 4 contained 0.2 mg L-1 Cl, 0.05 mg L-1 SO4, and 0.005 mg L-1 NO3.
Level 3 contained 2.0 mg L-1 Cl, 0.5 mg L-1 SO4, and 0.05 mg L-1 NO3. Level 2
contained 20.0 mg L-1 Cl, 5.0 mg L-1 SO4, and 0.5 mg L-1 NO3. Level 1 contained
200.0 mg L-1 Cl, 50.0 mg L-1 SO4, and 5.0 mg L-1 NO3.
Results were corrected for machine drift using a linear regression technique
based on calibration standards analyzed at the beginning and end of each run. Blanks
composed of high-purity water were run intermittently throughout each run to flush
27
the IC. The IC detects different ions based on the different rates at which they
migrate through the IC column. These rates depend on the extent of interaction with
ion exchange sites on the column. Ions are identified based on their retention time in
the column. They are quantified by integrating sample chromatograph peak areas and
comparing them to peak areas produced by the standards. The nitric acid used to
preserve the samples created large nitrate peaks on the chromatographs. The nitrate
peak blocked detection of elements with similar retention times such as bromide.
However, chloride detection was not impaired as chloride peaks considerably later
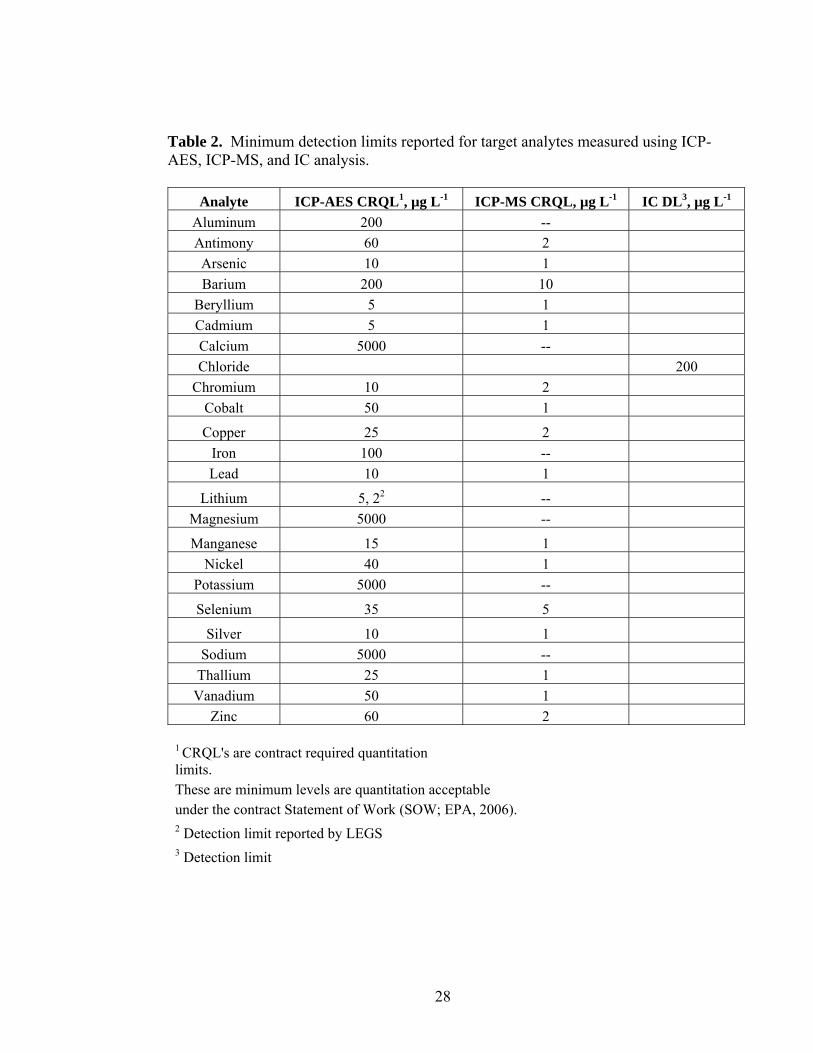
than nitrate. Detection limits for ICP-AES, ICP-MS, and IC analyses are listed in
Table 2.
Six suspended sediment samples were analyzed for relative elemental
composition using an electron microprobe (JEOL JXA-8600) at LEGS, Department
of Geological Sciences, University of Colorado at Boulder, by John Drexler. The
microprobe is equipped with 4 wavelength-dispersive spectrometers and 1 energy-
dispersive spectrometer. Analytical sensitivity ranges from 50-500 mg L-1. Samples
were prepared as a flat mounts and secured with epoxy. They were then coated with
a thin carbon layer using a carbon evaporator. Digital x-ray mapping images and
elemental spectra (Geller dPic hardware) were obtained.
3.5 Flow rate calculations
The tracer dilution method assumes conservation of mass (Table 3, Equations
1 and 2) between upstream and downstream sample locations. Conservation of mass
28
Table 2. Minimum detection limits reported for target analytes measured using ICP-AES, ICP-MS, and IC analysis.
Analyte ICP-AES CRQL1, µg L-1 ICP-MS CRQL, µg L-1 IC DL3, µg L-1 Aluminum 200 -- Antimony 60 2 Arsenic 10 1 Barium 200 10
Beryllium 5 1 Cadmium 5 1 Calcium 5000 -- Chloride 200
Chromium 10 2 Cobalt 50 1
Copper 25 2 Iron 100 -- Lead 10 1
Lithium 5, 22 -- Magnesium 5000 --
Manganese 15 1 Nickel 40 1
Potassium 5000 --
Selenium 35 5
Silver 10 1 Sodium 5000 --
Thallium 25 1 Vanadium 50 1
Zinc 60 2 1 CRQL's are contract required quantitation limits. These are minimum levels are quantitation acceptable under the contract Statement of Work (SOW; EPA, 2006). 2 Detection limit reported by LEGS 3 Detection limit

29
requires that flow or mass at a downstream sample location is equal to flow or mass at
an upstream sample location plus the flow or mass entering the stream at the injection
site (Kimball and others, 2002). Steady-state conditions dependent upon a constant
injection tracer concentration and a constant tracer injection rate are assumed. Refer
to Table 3 for all equations used for flow rate determination.
All inflow between two sites bracketing a visible tributary was assumed to be
due to tributary inflow. This might not be the case in reality, because the tracer
dilution method quantifies flow from point sources as well as flow from distributed
groundwater input or springs or seeps discharging over a large area. However, the
fraction of flow input attributable to dispersed sources cannot be quantified using
tracer dilution. Tributary flow rates were calculated as the difference between flow at
the sample location upstream of the tributary and flow at the sample location
downstream of the tributary.
The quantity QIest in Table 3, Equation 6 was estimated. Flow downstream of
tributaries containing background tracer concentrations greater than instream
concentrations had to be estimated because tracer dilution equations break down
under these conditions and no direct flow meter measurements were taken. QIest was
estimated by field personnel as a percentage of instream flow just upstream of the
tributary confluence with Coal Creek.

30
Table 3. Equations used to calculate flow rates and mass loading rates (Kimball and others, 2002) for Coal Creek tracer dilution study.
Calculated Variable Equation Variable Definition
Mass balance downstream
MB, mass loading rate from injection site 1) downstream of injection site
CA, tracer concentration
2) upstream of injection site
CB, tracer concentration downstream of injection site Cinj, injectate tracer concentration
QA, flow rate 3) upstream of injection site QB, flow rate downstream of injection site Qinj, injection flow rate
Flow rate at first site 4) All variables defined above
downstream of injection
site with uniform
background concentration Flow rate at subsequent 5) CC, tracer concentration
downstream sites with
at downstream site uniform background CI, tracer concentration
concentration and upstream of inflow site surface inflow contribution QC, flow rate at downstream site
Flow rate at sites 6) CIN, tracer concentration downstream of inflow of inflow with nonuniform
with tracer concentration background concentration above background CD, tracer concentration
tracer concentration downstream of inflow of concentration CIN QIest, visually estimated inflow rate
C C I e s t I ND
D
Q C Q CQC+
=
B IC B
C I
C CQ QC C
−=
−
in j AB in j
B A
C CQ QC C
−=
−
B A injQ Q Q= +
B B BM Q C=
B A A inj injM Q C Q C= +
31
3.6 Metal-loading calculations
Stream flow and metal concentration at each synoptic sample site were
multiplied to obtain a metal-loading rate (kg d-1) for each site. These metal-loading
rates produce a metal-loading profile for the length of the study reach. The load at
the downstream end of a stream reach is equal to the load at the upstream end plus
load contributions from all sources between the ends of the reach. The load is used to
identify metal sources within the watershed. Increases in the metal load between sites
indicate a metal source. Metal load decreases indicate a net loss of dissolved metal
resulting from precipitation, sorption, or chemical reactions. The downstream load
minus the upstream load between two sites is defined as the net load change. The
cumulative load is the sum of the positive load changes for the entire study reach.
The cumulative load is held constant for a negative load change between sites.
The cumulative load approximates the minimum possible metal load contributed to
the stream (Kimball and others, 2002). The percent tributary load (%) is defined as
tributary load (%) .
iloadtrib loads
=∑
(1)
where loadi (kg d-1) is the loading rate at a specific tributary and the sum of the
tributary loads is the cumulative total of all tributary inputs (kg d-1).
3.7 Water quality standards and hardness
All surface waters in the State of Colorado must meet physical and chemical
water quality requirements set by the Colorado Department of Public Health and
Environment (CDPHE). Coal Creek is classified as a Class 1 – Cold Water Aquatic
Life stream (because the summer water temperature does not often exceed 20 ºC) and
32
as a Domestic Water Supply (Coal Creek supplies Crested Butte’s drinking water)
(CDPHE, 2005). As such, Coal Creek must meet all requirements put forth by the
CDPHE for these stream types. The CDPHE gives a chronic and an acute toxicity
limit for metals. The chronic standard is defined as the concentration limit that
protects 95% of the genera from the chronic toxic effects of metals. Acute toxicity is
defined as the concentration limit that protects 95% of the genera from the lethal
affects of metals. Standard exceedances should not occur more than once every three
years on average (CDPHE, 2005).
Many of the CDPHE metal standards are based on hardness measured as
mg L-1 CaCO3. Hardness was calculated as the sum of the total calcium and
magnesium ion concentrations such that
Hardness = 50.05 ([Ca] + [Mg]) (2)
where [Ca] and [Mg] are the total concentrations of the calcium and magnesium ion
in meq L-1. Calcium and magnesium concentrations were measured at each synoptic
sample site and allowed for hardness calculations at each site. A hardness profile for
the entire length of the stream was developed. The standard and acute toxicity limits
calculated as a function of hardness were compared to measured metal concentrations
along Coal Creek for cadmium, chromium(III), copper, lead, manganese, nickel, and
zinc. Parameters that are not hardness-based including pH and acute and chronic
toxicity standards for aluminum, arsenic, chromium(VI), and iron were also
compared to measured values.
The Mt. Emmons Treatment Plant adds lime during the treatment process to
raise the pH of Keystone Mine drainage to between 10 and 10.5 (Perusek, personal
33
communication, July 15, 2005). Cadmium and manganese require this pH increase
for precipitation and removal. It is hypothesized that calcium addition entering Coal
Creek via the treatment plant effluent raises Coal Creek hardness downstream. Any
increase in hardness will consequently increase the CDPHE hardness-based aquatic
life standards. Competition between calcium and metals for binding sites on colloids
is expected to increase the concentration of metals available in the dissolved phase.
34
CHAPTER 4
RESULTS
The following chapter presents pH, total organic carbon (TOC), calcium and
magnesium concentrations, hardness, metal concentrations, metal loading, and
mineralogical data resulting from multiple laboratory analyses of samples collected
during synoptic sampling of Coal Creek on September 5, 2005. The results represent
stream chemistry at the time of the synoptic sampling. Low flow conditions existed
in Coal Creek. Weather conditions were mostly sunny with a temperature of
approximately 21 ○C. A light rain fell for approximately 30 minutes during synoptic
sampling. This rain event was not heavy enough to significantly influence flow or
runoff.
On the graphs presented in this chapter, instream sample sites (CC-) and
unnamed tributaries (UT-) are designated by distance (km) from the upstream site
(CC-0.000). UT-3.294 and UT-3.455 are unnamed tributaries that drain the iron fen.
UT-3.661 contains drainage directly from the gossan (Figure 3). Crested Butte’s
drinking water intake is at 5.390 km followed immediately by the Mt. Emmons
Treatment Plant effluent release channel at 5.405 km. Splain’s Gulch is at 1.080 km
and Elk Creek is at 1.490 km. The Spann Nettick ditch located at 8.029 km diverts
flow out of Coal Creek between CC-7.895 and CC-8.085. Overflow from the
drinking water reservoir is returned to Coal Creek through at 8.090 km. The Halazon
diversion is located immediately downstream of the drinking water return flow at
8.105 km.

35
A large wetland exists between CC-2.072 and CC-2.734. Smaller wetlands
occurred between CC-3.165 and CC-3.455, between the two iron fen drainages. Site
CC-2.588 is located in the wetland reach of Coal Creek and the sample was
mistakenly taken from a side channel that did not contain the majority of the flow.
Tracer concentration for CC-2.588 was unavailable. This absent data produces a
discontinuity in flow and metal loading graphs at CC-2.588.
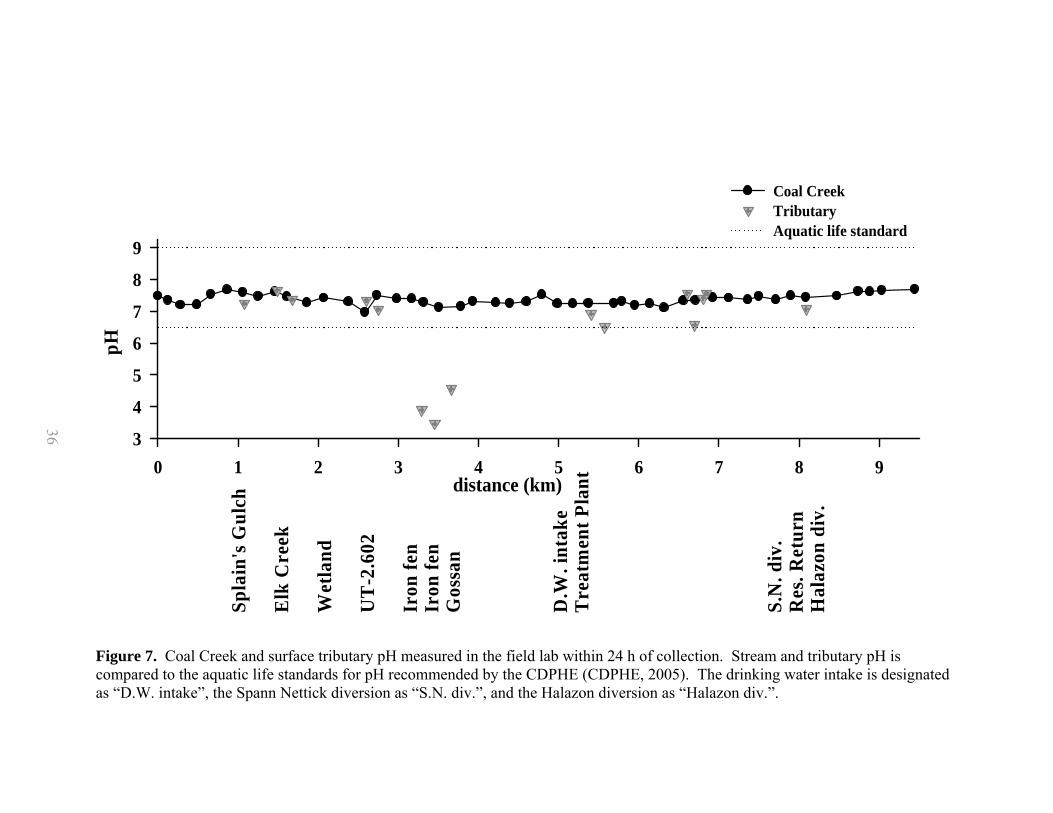
4.1 Coal Creek pH
The pH in Coal Creek varied from a minimum of 6.97 at CC-2.734 to a
maximum of 7.69 at CC-9.442 (Figure 7), a range of only 0.72 pH units. The pH of
Coal Creek at the Crested Butte drinking water intake (CB D.W. Intake) is 7.24. The
Colorado Department of Public Health and Environment (CDPHE) set a pH window
of 6.5-9.0 as the standard for cold water aquatic life. The acceptable pH range for a
domestic drinking water supply is 5.0-9.0 (CDPHE, 2005). Cold water aquatic life
and domestic drinking water supply criteria for stream pH were met at all sample
locations in Coal Creek. The pH of unnamed tributaries-3.294, -3.455, and -3.661
fell below the minimum pH standard. Unnamed tributaries-5.577 and -6.696 came
within 0.1 pH units of the minimum aquatic life standard.
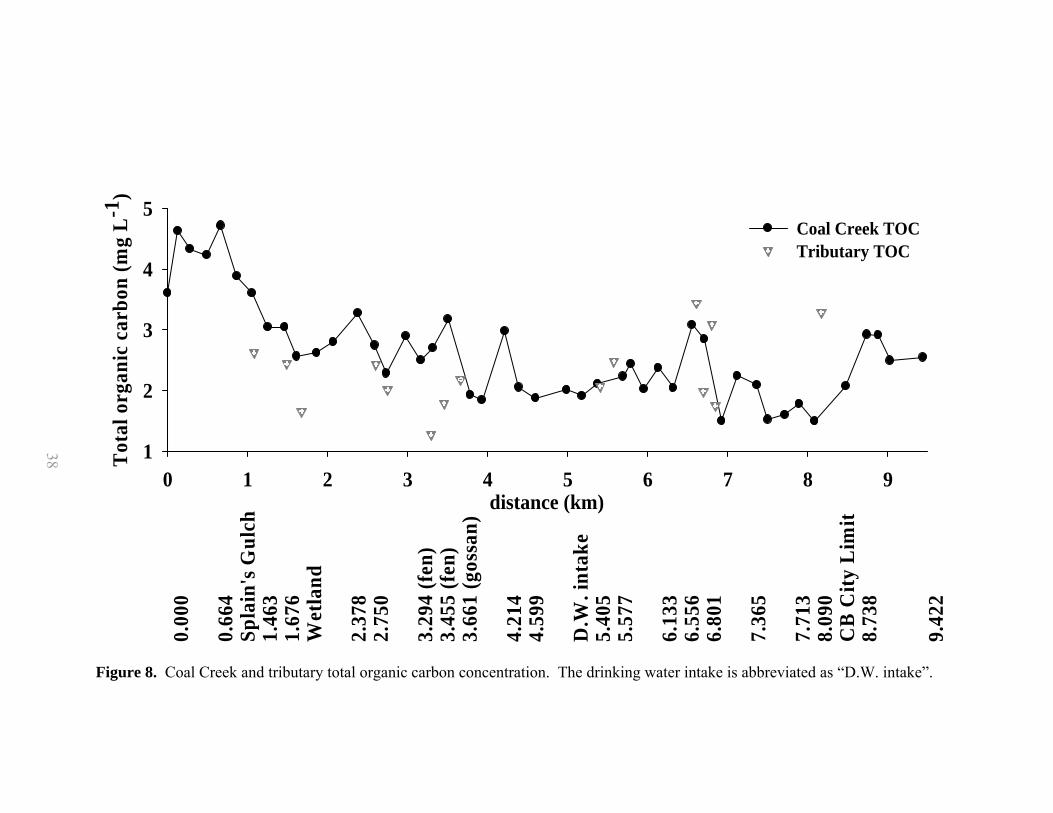
4.2 Coal Creek total organic carbon
Total organic carbon concentrations were measured because TOC can
influence biogeochemical processes, chemical interactions, and transport. Coal Creek
total organic carbon concentrations ranged from a minimum of 1.5 mg L-1 a
36
distance (km)0 1 2 3 4 5 6 7 8 9
pH
3
4
5
6
7
8
9
Coal CreekTributaryAquatic life standard
Spla
in's
Gul
ch
Elk
Cre
ek
Wet
land
UT
-2.6
02
Iron
fen
Iron
fen
Gos
san
D.W
. int
ake
Tre
atm
ent P
lant
S.N
. div
.R
es. R
etur
nH
alaz
on d
iv.
Figure 7. Coal Creek and surface tributary pH measured in the field lab within 24 h of collection. Stream and tributary pH is compared to the aquatic life standards for pH recommended by the CDPHE (CDPHE, 2005). The drinking water intake is designated as “D.W. intake”, the Spann Nettick diversion as “S.N. div.”, and the Halazon diversion as “Halazon div.”.
36
37
CC-6.923 to a maximum of 4.7 mg L-1at CC-0.664 (Figure 8). TOC concentrations
show a general decrease within this range from the upstream end of the study reach to
CC-6.923. Higher TOC concentrations in the upstream reach may be attributable to
lower flow and carbon inputs from the wetland. UT-3.294 contains 1.3 mg L-1 TOC
and was the tributary with the lowest TOC concentration. UT-6.606 contains the
highest tributary TOC concentration with 3.4 mg L-1.
4.3 Calcium and magnesium concentration and hardness
Total calcium and magnesium concentrations were used to calculate hardness
in mg L-1 as CaCO3 (Figure 9). Approximately 93 % of the calcium and 94 % of the
magnesium was available in the dissolved form. Magnesium concentration remained
constant along the entire study reach as concentration varied only from 2.1 mg L-1 at
CC-2.378 to 4.3 mg L-1 at CC-3.881. The only tributary contributing a magnesium
concentration greater than the instream maximum was UT-3.661 with a magnesium
concentration of 14.0 mg L-1.
Calcium concentrations varied significantly from a minimum of 12.5 mg L-1 at
CC-1.463 to a maximum of 154 mg L-1 at CC-6.556 (Figure 9). Calcium
concentrations remain steady near an average of 17.8 mg L-1 from CC-0.000 to
CC-5.372. Downstream of CC-5.372 and the Mt. Emmons Treatment Plant effluent,
calcium concentrations increase until the maximum occurs at CC-6.556. A gradual
decline in calcium concentration is observed following the peak at CC-6.556. Steeper
concentration decreases were detected between CC-6.707 and CC-6.923 as calcium
38
distance (km)0 1 2 3 4 5 6 7 8 9
Tot
al o
rgan
ic c
arbo
n (m
g L
-1)
1
2
3
4
5Coal Creek TOCTributary TOC
0.00
0
0.66
4Sp
lain
's G
ulch
1.46
31.
676
Wet
land
2.37
82.
750
3.29
4 (f
en)
3.45
5 (f
en)
3.66
1 (g
ossa
n)
4.21
44.
599
D.W
. int
ake
5.40
55.
577
6.13
36.
556
6.80
1
7.36
5
7.71
38.
090
CB
City
Lim
it8.
738
9.42
2
Figure 8. Coal Creek and tributary total organic carbon concentration. The drinking water intake is abbreviated as “D.W. intake”.
38

39
0 1 2 3 4 5 6 7 8 9
Har
dnes
s (m
g L
-1 a
s CaC
O3)
0
100
200
300
400
500
Coal CreekTributary
0 1 2 3 4 5 6 7 8 9
Con
cent
ratio
n (m
g L
-1)
020406080
100120140160 Coal Creek
TributaryTributary total CaTributary total Mg
Spla
in's
Gul
ch
Elk
Cre
ek
Wet
land
UT
-2.6
02
Fen
Gos
san
Tre
atm
ent P
lant
S.N
. Div
ersi
onR
es. R
etur
nH
alaz
on D
iv.
Figure 9. Coal Creek and tributary total calcium and magnesium concentration and hardness as mg L-1 CaCO3. The Spann Nettick diversion is designated as “S.N. div.” and the Halazon diversion as “Halazon div.”.
39
40
concentration drops from 148 - 120 mg L-1 and between CC-8.085 and CC-8.474 as
concentration drops from 104 - 52.2 mg L-1. The treatment plant effluent has a
calcium concentration of 167 mg L-1.
Hardness ranges from a minimum of 43.2 mg L-1 as CaCO3 at CC-1.463 to a
maximum of 400 mg L-1 as CaCO3 at CC-6.556 (Figure 9). Hardness remained stable
near an average of 57.1 mg L-1 as CaCO3 between CC-0.000 and CC-5.372.
Downstream of CC-5.372 and the Mt. Emmons Treatment Plant effluent release,
hardness steadily increases until the instream maximum occurs at CC-6.556.
Hardness gradually decreases downstream of CC-6.556. Mt. Emmons Treatment
Plant effluent had a hardness of 521 mg L-1 as CaCO3.
4.4 Sodium chloride pulse tracer test
Arrival of the sodium chloride tracer at five sample sites was
documented using a conductivity meter. The stream velocity was calculated as the
distance traveled by the tracer from the injection point at a study reach distance of
0.051 km to the monitor site divided by the time between the pulse injection (12:28)
and the time that conductivity peaked at the monitor site (Table 4). The calculated
velocities showed a decreasing trend with downstream distance. The average velocity
was 0.22 km h-1. Based on this average velocity in this upstream reach of the study
reach, an injection time of 43 h was required for the LiCl tracer to reach the most
downstream sample site at 9.442 km. Background conductivity was approximately
100 μS cm-1 at all monitor sites. The peak conductivity steadily decreased with
41
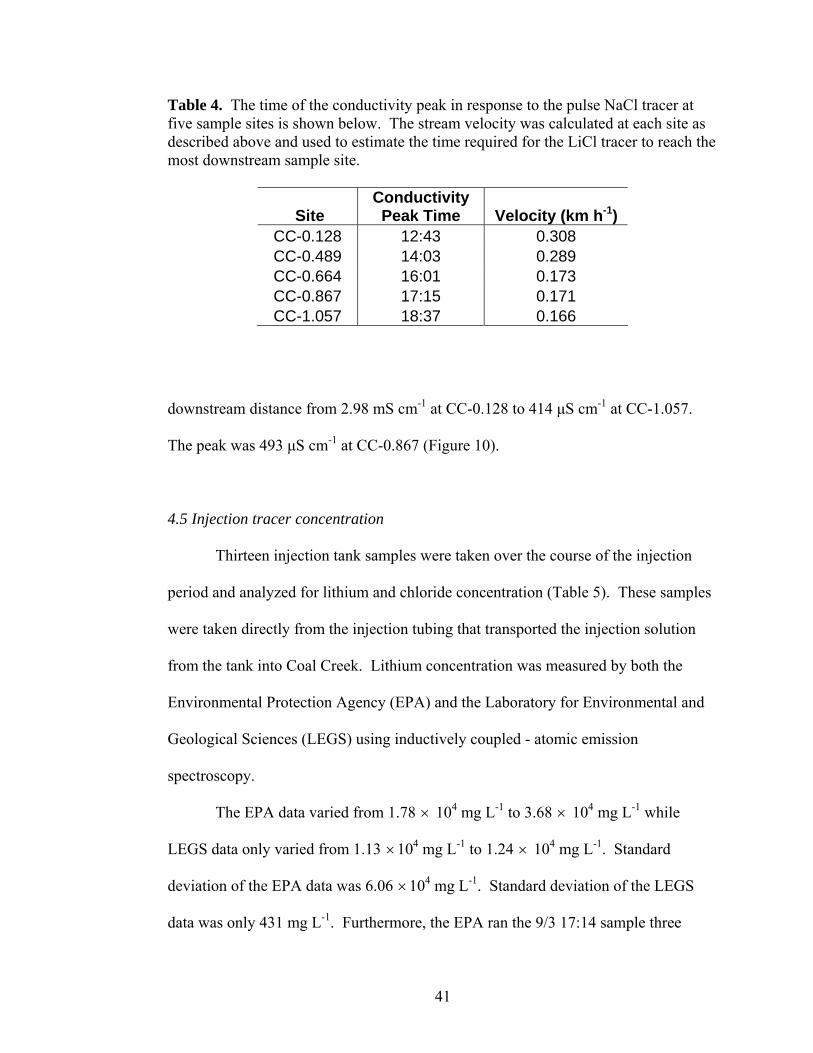
Table 4. The time of the conductivity peak in response to the pulse NaCl tracer at five sample sites is shown below. The stream velocity was calculated at each site as described above and used to estimate the time required for the LiCl tracer to reach the most downstream sample site.
Site Conductivity Peak Time Velocity (km h-1)
CC-0.128 12:43 0.308 CC-0.489 14:03 0.289 CC-0.664 16:01 0.173 CC-0.867 17:15 0.171 CC-1.057 18:37 0.166
downstream distance from 2.98 mS cm-1 at CC-0.128 to 414 μS cm-1 at CC-1.057.
The peak was 493 μS cm-1 at CC-0.867 (Figure 10).
4.5 Injection tracer concentration
Thirteen injection tank samples were taken over the course of the injection
period and analyzed for lithium and chloride concentration (Table 5). These samples
were taken directly from the injection tubing that transported the injection solution
from the tank into Coal Creek. Lithium concentration was measured by both the
Environmental Protection Agency (EPA) and the Laboratory for Environmental and
Geological Sciences (LEGS) using inductively coupled - atomic emission
spectroscopy.
The EPA data varied from 1.78 × 10⁴ mg L-1 to 3.68 × 10⁴ mg L-1 while
LEGS data only varied from 1.13 ×10⁴ mg L-1 to 1.24 × 10⁴ mg L-1. Standard
deviation of the EPA data was 6.06 ×10⁴ mg L-1. Standard deviation of the LEGS
data was only 431 mg L-1. Furthermore, the EPA ran the 9/3 17:14 sample three
42
100
150
200
250
300
350
400
450
500
15:21 15:50 16:19 16:48 17:16
Time (h)
Con
duct
ivity
(uS
cm-1)
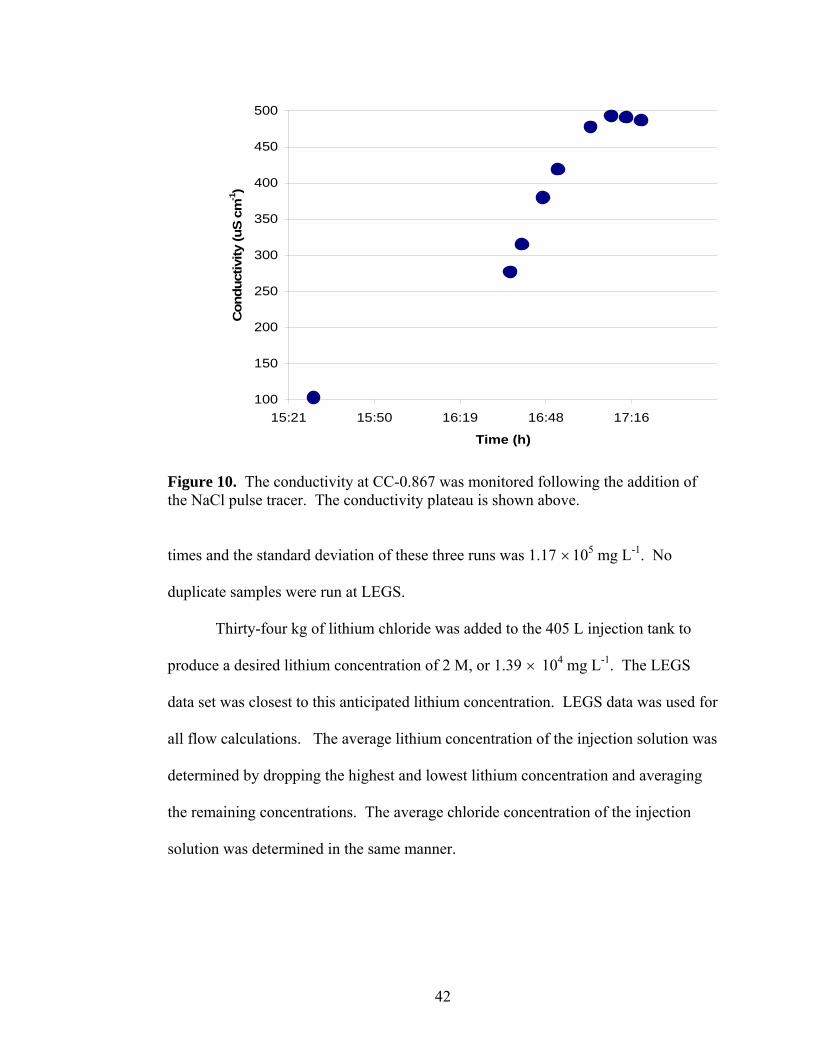
Figure 10. The conductivity at CC-0.867 was monitored following the addition of the NaCl pulse tracer. The conductivity plateau is shown above.
times and the standard deviation of these three runs was 1.17 ×10⁵ mg L-1. No
duplicate samples were run at LEGS.
Thirty-four kg of lithium chloride was added to the 405 L injection tank to
produce a desired lithium concentration of 2 M, or 1.39 × 10⁴ mg L-1. The LEGS
data set was closest to this anticipated lithium concentration. LEGS data was used for
all flow calculations. The average lithium concentration of the injection solution was
determined by dropping the highest and lowest lithium concentration and averaging
the remaining concentrations. The average chloride concentration of the injection
solution was determined in the same manner.

43
The injection solution was replenished twice. The lithium concentration in the
LEGS data set clearly responds to addition of the newly mixed injection solution at
18:00 on September 4 (Table 5). The fresh injection solution raises the lithium
concentration by 750 mg L-1 on average.
4.6 Lithium and chloride concentration
The average lithium concentration at CC-0.000 was 3.53 µg L-1. The lithium
concentration at CC-0.128 measured during the synoptic sampling was 6,060 µg L-1.
A 1700-fold increase in total lithium concentration between CC-0.000 and CC-0.128
resulted from the injection of the LiCl tracer between these two sites (Figure 11).
Table 5. Injection solution lithium and chloride concentrations over the injection period. Lithium concentrations were measured using ICP-AES analysis at the Laboratory for Environmental and Geological Studies (LEGS) and by the Environmental Protection Agency (EPA). Chloride concentrations were measured using IC analysis at the Institute for Arctic and Alpine Research.
Sample Name Li (mg L-1); LEGS Li (mg L-1); EPA Cl (mg L-1) CC-Inj 9/3 13:07 11,300 25,300 67,000 CC-Inj 9/3 15:07 11,500 19,400 74,900 CC-Inj 9/3 17:14 11,400 27,100 73,200 CC-Inj 9/3 17:14 36,800 CC-Inj 9/3 17:14 13,500 CC-Inj 9/3 19:15 11,300 19,400 74,900 CC-Inj 9/4 02:00 11,300 19,900 23,300 CC-Inj 9/4 09:52 11,400 19,200 66,300 CC-Inj 9/4 14:00 11,900 23,800 96,400 CC-Inj 9/4 18:00 12,400 23,800 90,300 CC-Inj 9/5 00:00 12,200 19,800 68,300 CC-Inj 9/5 06:20 12,000 33,700 80,800 CC-Inj 9/5 11:05 12,100 17,800 80,900 CC-Inj 9/5 13:05 12,300 25,600 78,300 CC-Inj 9/5 15:05 12,200 24,800 79,800
44
Tributary lithium concentration varied from 0.95 µg L-1 at UT-1.676 to 128 µg L-1 at
UT-3.661. The lithium concentration at UT-3.661 is 36 times higher than the
background lithium concentration measured at CC-0.000. The treatment plant
effluent had a lithium concentration of 35.8 µg L-1, which is ten times more than
background. All other tributaries contain no more than three times the background
lithium concentration.
The dissolved chloride concentration increased by a factor of 13.5 between
CC-0.000 and CC-0.128 resulting from the injection of the LiCl tracer between these
two sites (Figure 12). The average dissolved chloride concentration at CC-0.000 was
2.38 mg L-1, and chloride concentration increased to 32.0 mg L-1 at CC-0.128.
4.7 Flow rate calculations
Several estimates and assumptions were made to calculate Coal Creek flow
rate. Flow rates at three diversions along the study reach are controlled and
monitored. Flow diverted from Coal Creek at the Crested Butte drinking water intake
(5.390 km) was estimated as 79.3 L s-1 (personal communication, Adams, May 26,
2006). Flow estimates for the two irrigation diversions were 28.3 L s-1 for the Spann
Nettick ditch and 14.2 L s-1 for the Halazon/ Town Ranch ditch (personal
communication, Adams, May 26, 2006). These three diversions were accounted for
in flow rate calculations by subtracting diversion flow from the flow rate calculated
using tracer dilution at sites downstream of each diversion.
Overflow from Crested Butte’s drinking water reservoir is returned to Coal
Creek between CC-8.085 and CC-8.474 at a rate of 60.0 L s-1. This rate was

45
calculated by subtracting average daily drinking water usage for September
(1.67 × 10⁶ L d-1) from the volume of flow diverted from Coal Creek to the drinking
water reservoir (6.85 × 10⁶ L d-1) (personal communication, Adams, May 26, 2006).
The synoptic sites were assigned so that only one tributary was located
between two instream synoptic sample sites. Tracer dilution equations account only
for one tributary between two samples sites. Tributaries UT-6.606, UT-6.696, and
UT-6.801 were not detected during site assignment, but were found later during
synoptic sampling. Both UT-6.606 and UT-6.696 entered Coal Creek between
CC-6.556 and CC-6.707, and UT-6.801 and UT-6.844 entered Coal Creek between
CC-6.707 and CC-6.923. For each of these tributaries, the flow rate was estimated as
a percentage of the total inflow between the sites bracketing the tributaries. These
estimates were based on visual assessments made by field personnel. Both UT-6.606
and UT-6.696 were assigned half of the total inflow between sites CC-6.556 and
CC-6.707. UT-6.801 comprised 90 % of the total inflow between CC-6.707 and
CC-6.923, while UT-6.844 made up the remaining 10 %.
As previously stated, the lithium concentration in UT-3.661 was several times
greater than background lithium concentration. Observed flow at UT-3.661 was
described as only a “trickle.” When the standard tracer dilution equation (Table 3,
Equation 4) was applied at UT-3.661, the calculated flow for this tributary was
2,400 L s-1. This extremely high flow rate resulted because the lithium concentration
of UT-3.661 was only 8 µg L-1 less than the lithium concentration at CC-3.783. The
standard tracer dilution equation breaks down when the instream tracer concentration
is not at least twice as great as the tributary tracer concentration. To avoid assigning

46
UT-3.661 an unrealistically high, flow for UT-3.661 was estimated as 1% of Coal
Creek flow (Table 3, Equation 6).
When calculating flow based on chloride dilution, an additional modification
was used to account for flow from the Mt. Emmons Treatment Plant effluent channel
at 5.405 km. The chloride concentration in this tributary was about 1.1 times greater
than the upstream chloride concentration. The standard tracer dilution equation,
Table 3 Equation 4, is not valid if tributary tracer concentration is greater than
instream tracer concentration. An alternative equation, Table 3 Equation 6, was used
to account for flow from the treatment plant. Equation 6 is dependent upon a field
estimate of tributary flow as a fraction of Coal Creek flow. Field personnel estimated
flow from the treatment plant channel as 5% of Coal Creek flow. The treatment plant
was not discharging at the time of sampling, but a low flow was visible. Flow is
attributable to either natural drainage or residual treatment plant effluent flow.
For chloride flow calculations, the chloride concentration increased from
upstream of UT-5.577 to downstream of UT-5.577. When Table 3 Equation 4 was
applied, the flow rate decreased from upstream of UT-5.577 to downstream of
UT-5.577. This equation gave increasing flow rates as the tracer concentration
decreased, or was diluted. When the tracer concentration increased, this equation
produced decreasing flow rates. Tributary flow rate was calculated by subtracting the
flow rate upstream of the tributary from the flow rate downstream of the tributary.
This calculation gave a negative flow rate at UT-5.577 since the downstream flow
rate was greater than the upstream flow rate. A negative flow rate at UT-5.577 is

47
physically impossible. UT-5.577 was assigned a minimal flow of 1.00 L s-1 to enable
calculation of a meaningful loading rate at UT-5.577.
4.8 Flow rates based on lithium and chloride dilution
Flow rates calculated based on lithium dilution increased from upstream to
downstream sites in response to decreases in lithium concentration in Coal Creek
(Figure 11). The flow rates were calculated with Equations 4, 5, and 6 from Table 3.
The flow rate increased from 7.9 L s-1 at CC-0.128 to 2,300 L s-1 at CC-9.442. The
maximum calculated flow rate of 2,540 L s-1 occurs at CC-9.442. The flow rate
increases with distance downstream of the injection site at all locations except
between CC-6.923 and CC-7.121 and between CC-9.030 and CC-9.442. These are
the sites where lithium concentrations slightly increased. Tributary flows varied from
a minimum of 2.15 L s-1 at UT-3.661 to a maximum of 406 L s-1 at UT-6.801.
Flow rates calculated based on chloride dilution steadily increased from 10.4
to 122 L s-1 between CC-0.000 and CC-5.180 (Figure 12). Four flow rate decreases
were observed between CC-3.783 and CC-5.372. Locations where flow rate slightly
decreases are locations where chloride concentration slightly increased with
downstream distance. The maximum flow rate of 122 L s-1 occurs at CC-5.180. The
flow rate decreased from 111 to 45.0 L s-1 between CC-5.372 and CC-5.693.
Between CC-5.372 and CC-5.693, the Crested Butte drinking water intake diverts
79.3 L s-1 and the Mt. Emmons Treatment Plant effluent channel contributed
1.60 L s-1 (sample was taken after the plant discontinued effluent release for the day).
Flow increased from 45.0 L s-1 at CC-5.693 to 85.2 L s-1 at CC-6.923. Slight up and

48
distance (km)0 1 2 3 4 5 6 7 8 9
Flow
rat
e (L
s-1)
0500
1000150020002500 0 1 2 3 4 5 6 7 8 9
Tot
al L
i con
c. ( μ
g L
-1)
1
10
100
1000
10000Coal CreekTributary
Spla
in's
Gul
chE
lk C
reek
Wet
land
UT
-2.6
02
Fen
Gos
san
D.W
. int
ake
Tre
atm
ent P
lant
S.N
. Div
.R
es. R
etur
nH
alaz
on D
iv.
CB
City
Lim
it
Figure 11. Coal Creek and tributary total lithium concentration and flow rate calculated using lithium concentration dilution. The drinking water intake is designated as “D.W. intake”, the Spann Nettick diversion as “S.N. div.”, and the Halazon diversion as “Halazon div.”.
48
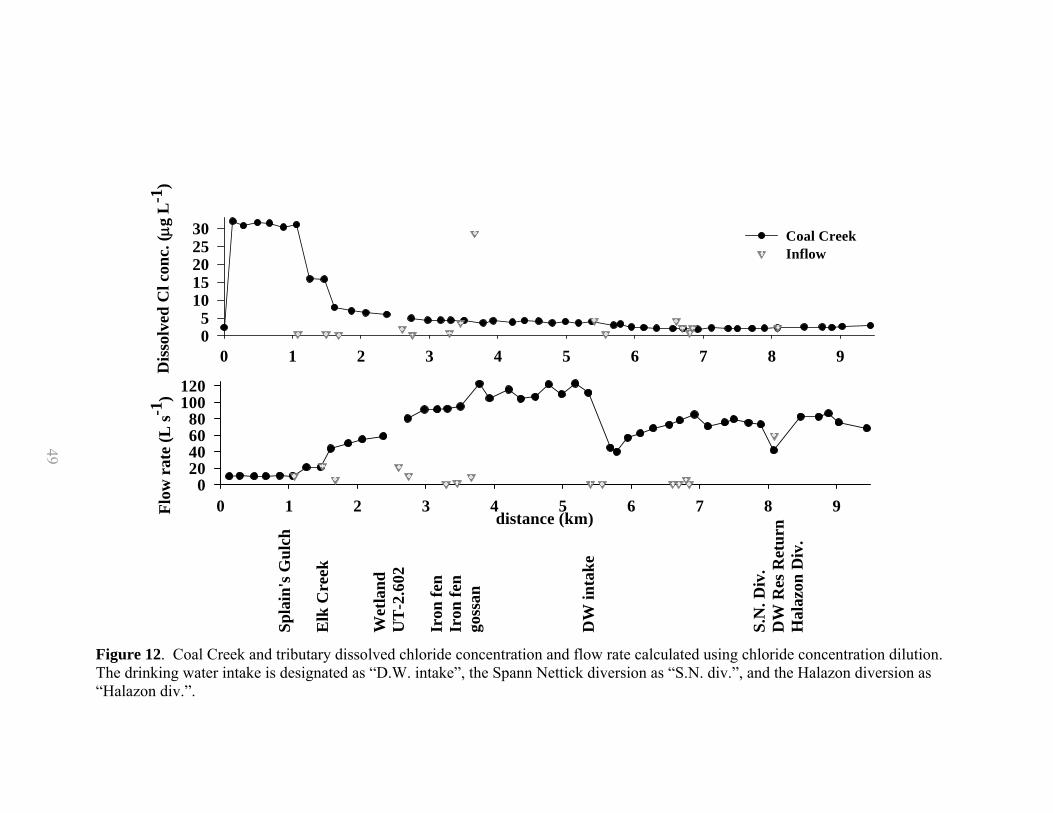
49
Figure 12. Coal Creek and tributary dissolved chloride concentration and flow rate calculated using chloride concentration dilution. The drinking water intake is designated as “D.W. intake”, the Spann Nettick diversion as “S.N. div.”, and the Halazon diversion as “Halazon div.”.
distance (km)0 1 2 3 4 5 6 7 8 9Fl
ow r
ate
(L s-1
)
020406080
100120
Spla
in's
Gul
ch
Elk
Cre
ek
Wet
land
UT
-2.6
02
Iron
fen
Iron
fen
goss
an
DW
inta
ke
S.N
. Div
.D
W R
es R
etur
nH
alaz
on D
iv.
0 1 2 3 4 5 6 7 8 9
Dis
solv
ed C
l con
c. ( μ
g L
-1)
05
1015202530 Coal Creek
Inflow
49

50
down flow fluctuations were measured between CC-6.923 and CC-7.895. The
Halazon ditch diversion reroutes flow from Coal Creek between CC-8.085 and
CC-8.474 and flow from the drinking water reservoir is returned to Coal Creek at
8.090 km between these two sites. There is a 40.8 L s-1 net flow rate increase
between CC-8.085 and CC-8.474. Flow decreases slightly from CC-8.474 to
CC-9.442 in response to slightly increasing chloride concentration. Site distances
descriptions, and final flow rates as calculated using chloride-dilution are shown in
Table 6.
The flow rates obtained using chloride dilution calculations appear to more
accurately describe actual flows in Coal Creek. Just prior to the tracer study, the Coal
Creek flow rate was estimated as a maximum of 142 L s-1 (personal communication,
Adams, May 26, 2006). The maximum flow rate of 2,500 L s-1 based on lithium
dilution is unreasonable. The flow rates calculated using chloride dilution were much
closer to estimated flows. Flow rates based on chloride dilution were used to
calculate metal loading rates because they appear to more accurately reflect actual
Coal Creek flow.
4.9 General metal behavior
Concentrations and loading rates for iron, manganese, aluminum, zinc,
copper, cadmium, lead, nickel, chromium, arsenic, and barium will be presented in
the following sections. Total and dissolved concentrations were measured for each of
these metals and metalloids. All metal toxicity standards apply to dissolved metal
concentrations unless otherwise stated.

51
Table 6. All Coal Creek sample sites, tributaries, and diversions are described. Site name reflects distance (km) from the upstream sample site. Flow rates are based on chloride dilution (L s-1) are shown. “CC” is an abbreviation for Coal Creek and “UT” is an abbreviation for unnamed tributary.
Site Name Site Description/Details Instream Tributary Flow Rate Flow Rate
(L s-1) (L s-1) CC-0.000 upstream site, background sampling CC-0.051 injection site CC-0.128 10.365 CC-0.282 elevation 2967 m 10.838 CC-0.489 10.510 CC-0.664 10.558 CC-0.867 10.983 CC-1.057 10.729 SPG-1.080 Splain's Gulch 10.587 CC-1.255 21.317 CC-1.463 elevation 2927 m 21.400 EC-1.490 Elk Creek; Standard Mine drainage 22.462 CC-1.613 43.862 UT-1.676 6.603 CC-1.862 downstream of beaver dam 50.465 CC-2.072 wetland area 55.070 CC-2.378 wetland area 59.045 CC-2.588 wetland area, sampling error1 UT-2.602 21.324 CC-2.734 80.369 UT-2.750 10.911 CC-2.978 elevation 2895 m 91.280 CC-3.165 wetland area 91.467 UT-3.294 iron fen drainage, primary 0.678 CC-3.314 iron fen seeps 92.145 UT-3.455 iron fen seeps 2.745 CC-3.506 iron fen seeps 94.890 UT-3.661 drainage mostly from iron gossan 9.489 CC-3.783 122.223 CC-3.931 downslope from iron fen 104.911

52
CC-4.214 downslope from iron fen 115.394 CC-4.388 upstream of jeep trail 104.209 CC-4.599 106.625 CC-4.794 elevation 2851 m 121.758 CC-4.985 110.005 CC-5.180 122.736 CC-3.72 111.435 5.390 Crested Butte drinking water intake 79.287 5.405 Mt. Emmons Treatment Plant 1.607 CC-5.693 upstream of Wildcat Trail bridge 44.959 UT-5.577 1.000 CC-5.790 39.914 CC-5.951 56.832 CC-6.133 elevation 2809 m 62.420 CC-6.319 68.757 CC-6.556 72.642 UT-6.606 1.453 UT-6.696 1.453 CC-6.707 78.138 UT-6.801 6.379 UT-6.844 0.709 CC-6.923 85.225 CC-7.121 elevation 2782 m 71.059 CC-7.365 75.595 CC-7.499 79.556 CC-7.713 75.034 CC-7.895 elevation 2767 m 73.152 8.029 Spann Nettick (Smith Ranch) div. 28.317 CC-8.085 41.801 8.090 Crested Butte drinking water res. return 60.010 8.105 Halazon (Town Ranch) div. 14.158 CC-8.474 Just upstream of Crested Butte 82.601 CC-8.738 corner of First St., Sorpis Ave., 82.376 CC-8.881 corner of Elk Ave., Second St. 86.498 CC-9.030 upstream of bridge, Maroon St. 75.545 CC-9.442 adjacent to bridge on Butte Ave. 68.663 1 sample taken from side pool and only a very low tracer concentration was detected
53
Copper concentrations in Coal Creek remain around the EPA Contract Required
Quantitation Limit (CRQL) of 2 µg L-1 along the stream reach (Figure 17). The
dissolved concentration is slightly greater than the total concentration at several sites.
This discrepancy is likely a result of accuracy weaknesses associated with ICP-MS
measurements at or near the detection limit, not the result of an unknown analytical
error or interference. For this reason, the dissolved loading rate for copper is
graphed. Iron was measured only using ICP-AES. The ICP-AES iron CRQL is one
of the highest for a metal analyte at 100 µg L-1. While several sample sites had
concentrations in excess of 100 µg L-1, other sample sites had iron concentration at or
lower than the CRQL.
Coal Creek total and dissolved concentrations are very similar for manganese,
arsenic, and barium, suggesting that these constituents are primarily available in the
dissolved form.
Dissolved metal concentrations were greater than total metal concentrations
for iron, nickel, and chromium at several sites as reported by the EPA contract
laboratory. The dissolved metal concentration should never be greater than the total
metal concentration. An analytical error is suspected, but we have not confirmed the
cause of this discrepancy. All metal concentrations were measured using both
inductively coupled plasma-atomic emission spectroscopy and inductively coupled
plasma-mass spectroscopy and this error occurred using both analytical techniques.
Only total loading rates are graphed for these metals to exclude error associated with
a possible positive interference.
54
Inspection of the metals analyses for blanks (high-purity water) lends some insight.
The EPA measured high concentrations of dissolved iron, nickel, and chromium in
the blanks, but total concentrations were either not detected or considerably lower
than dissolved concentrations (Table 7). These results could suggest a positive
interference with dissolved measurements. A positive (or negative) spectral,
physical, or chemical interference can cause concentration measurements to be
greater than or less than the true concentration. A positive spectral interference
occurs when overlap from the spectral line of one element creates a false high
concentration measurement for a different element. Physical interferences occur
when nebulization and transport processes change the viscosity and surface tension of
the sample matrix. Chemical interferences include compound formation, ionization
effects, and solute vaporization (EPA, 2006). Another explanation for this
discrepancy may be a “memory effect.” This occurs when a sample with a high metal
concentration is analyzed and the sample chamber is not rinsed adequately prior to
running the following sample.
The cause of the dissolved/total discrepancy was undetermined. All of the
metal analyses were conducted at the EPA’s contract laboratory, and establishing
direct contact with laboratory personnel was not possible.
4.9a Iron concentrations and loading rates Coal Creek iron concentrations
ranged from undetectable at several sites to a maximum of 483 µg L-1 total iron at
CC-3.165 (Figure 13). Coal Creek total iron concentration never exceeds the chronic
toxicity standard for aquatic life of 1,000 µg L-1 total recoverable iron. No acute
aquatic life standard exists for iron. The 30-day dissolved iron standard for a

55
Table 7. Dissolved and total iron concentrations resulting from ICP-AES analyses and dissolved and total nickel and chromium concentrations resulting from ICP-AES and ICP-MS analyses for blank samples. BDL is an abbreviation for “below detection limit”. ICP-AES is inductively coupled plasma-atomic emission spectrometry and ICP-MS is inductively coupled plasma-mass spectrometry.
ICP-AES Dis ICP-AES Tot
Iron, µg L-1 Iron, µg L-1 Mean 361 BDL Standard Deviation 202 N/A ICP-MS Dis ICP-MS Tot ICP-AES Dis ICP-AES Tot
Ni, µg L-1 Ni, µg L-1 Ni, µg L-1 Ni, µg L-1 Mean 52.0 3.07 56.1 3.85
Standard Deviation 30.6 2.97 32.9 3.37 ICP-MS Dis ICP-MS Tot ICP-AES Dis ICP-AES Tot
Cr, µg L-1 Cr, µg L-1 Cr, µg L-1 Cr, µg L-1 Mean 70.5 4.51 41.3 5.47
Standard Deviation 41.0 4.49 35.3 4.92
drinking water supply is 300 µg L-1 (CDPHE, 2005). Analytical results for dissolved
iron show that this standard is exceeded at sites CC-0.282, CC-0.489, CC-2.588,
CC-3.165, CC-3.314, CC-3.931, CC-4.214, and CC-6.133. Instream dissolved iron
concentrations are higher than instream total iron concentrations at several sites. This
is also the case for UT-1.676, UT-2.602, UT-3.294, and UT-3.455 and treatment plant
effluent channel. Total iron concentration is significantly higher than dissolved iron
concentration at UT-2.750, UT-3.455, UT-3.661, UT-6.696, and the drinking water
reservoir return, indicating a significant colloidal fraction. The greatest difference
occurs at UT-6.696. UT-6.696 contains 1,960 µg L-1 total iron and 608 µg L-1
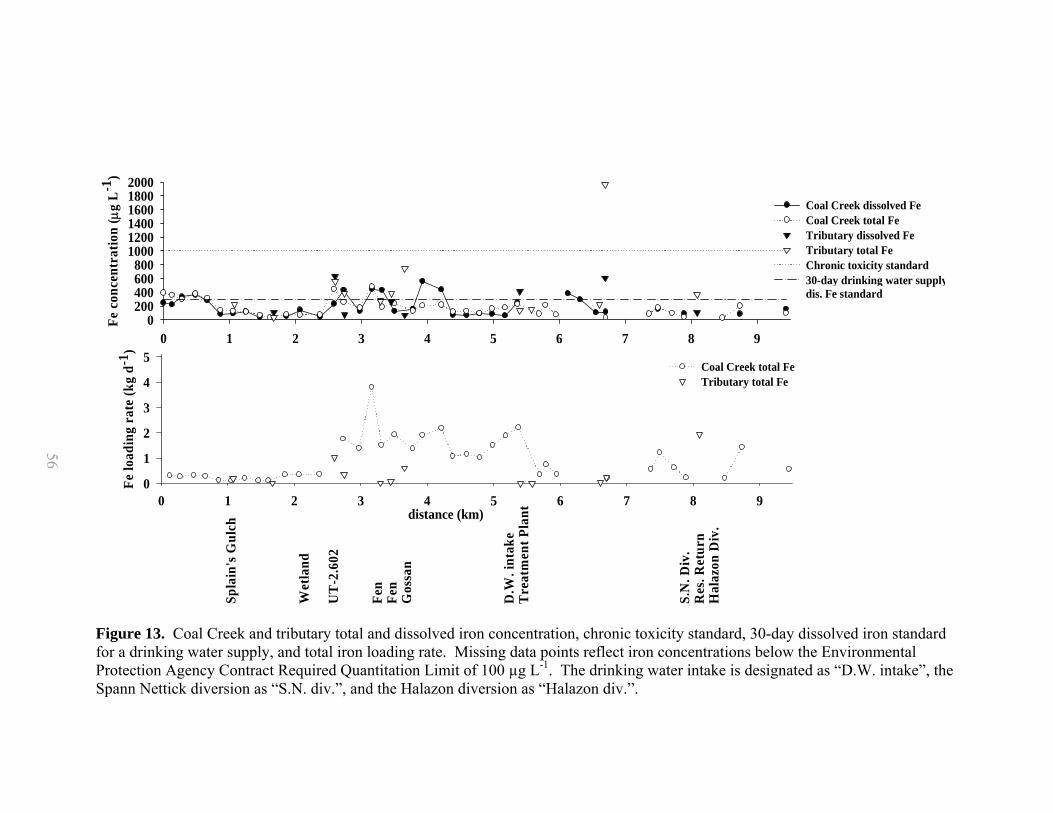
56
0 1 2 3 4 5 6 7 8 9
Fe c
once
ntra
tion
( μg
L-1
)
0200400600800
100012001400160018002000
Coal Creek dissolved FeCoal Creek total FeTributary dissolved FeTributary total FeChronic toxicity standard30-day drinking water supplydis. Fe standard
distance (km)0 1 2 3 4 5 6 7 8 9
Fe lo
adin
g ra
te (k
g d-1
)
0
1
2
3
4
5Coal Creek total FeTributary total Fe
Spla
in's
Gul
ch
Wet
land
UT
-2.6
02
Fen
Fen
Gos
san
D.W
. int
ake
Tre
atm
ent P
lant
S.N
. Div
.R
es. R
etur
nH
alaz
on D
iv.
Figure 13. Coal Creek and tributary total and dissolved iron concentration, chronic toxicity standard, 30-day dissolved iron standard for a drinking water supply, and total iron loading rate. Missing data points reflect iron concentrations below the Environmental Protection Agency Contract Required Quantitation Limit of 100 µg L-1. The drinking water intake is designated as “D.W. intake”, the Spann Nettick diversion as “S.N. div.”, and the Halazon diversion as “Halazon div.”.
56
57
dissolved iron.
The total iron loading rate remains constant from CC-0.128 to CC-2.378 near
an average of 0.25 kg d-1. The maximum instream iron loading rate of 3.81 kg d-1
occurred at CC-3.165, just upstream of iron fen drainage (Figure 13). From
CC-6.133 to CC-7.121, iron was undetectable at all sites except CC-6.707, which had
a very low iron concentration. The loading rate is zero over this reach due to the
undetectable iron concentrations.
The drinking water reservoir return flow at 8.090 km contributes the highest
tributary loading rate of 1.92 kg d-1. It comprises 42 % of the tributary total iron
loading rate (Table 8). UT-2.602 contributes 1.04 kg d-1 and 23 % of the tributary
iron loading rate. UT-3.661, the tributary which drains the gossan (Figure 3),
contributes only 0.61 kg d-1 and 13 % of the iron loading rate (Table 8).
4.9b Manganese concentration and manganese loading rate The maximum
total manganese concentration of 101 µg L-1 was measured at CC-2.378, directly in
the center of the wetland reach (Figure 14). CC-2.588 and CC-2.734, on the
downstream end of the wetland reach, also have high total manganese concentrations
of 88.9 and 79.9 µg L-1, respectively. Tributaries upstream of CC-2.378 do not
contain high manganese concentrations. Tributary inputs do not contribute to the
high manganese concentrations from CC-2.378 to CC-2.734. The source of
manganese is either groundwater or wetland input.
A small rise in manganese concentration occurred downstream of the Mt. Emmons
Treatment Plant at 5.405 km. Concentration increased from 29.9 µg L-1 total
manganese at CC-5.372 to 43.9 µg L-1 at CC-6.319. Concentrations decrease
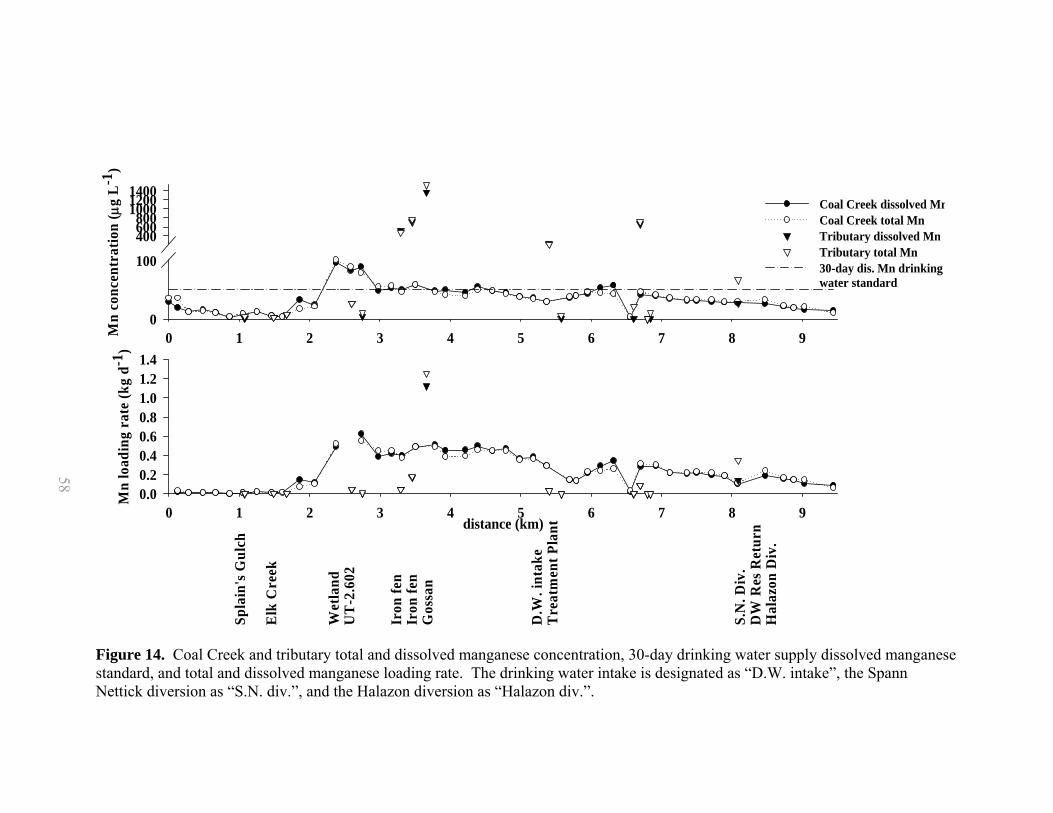
58
Spla
in's
Gul
ch
Elk
Cre
ek
Wet
land
UT
-2.6
02
Iron
fen
Iron
fen
Gos
san
D.W
. int
ake
Tre
atm
ent P
lant
S.N
. Div
.D
W R
es R
etur
nH
alaz
on D
iv.
0 1 2 3 4 5 6 7 8 9Mn
conc
entr
atio
n ( μ
g L
-1)
0
100
400600800100012001400Coal Creek dissolved MnCoal Creek total MnTributary dissolved MnTributary total Mn30-day dis. Mn drinkingwater standard
distance (km)0 1 2 3 4 5 6 7 8 9
Mn
load
ing
rate
(kg
d-1)
0.00.20.40.60.81.01.21.4
Figure 14. Coal Creek and tributary total and dissolved manganese concentration, 30-day drinking water supply dissolved manganese standard, and total and dissolved manganese loading rate. The drinking water intake is designated as “D.W. intake”, the Spann Nettick diversion as “S.N. div.”, and the Halazon diversion as “Halazon div.”.
58
59
slightly with downstream distance. Manganese concentrations do not fully decrease
to background concentrations along the study reach. Manganese concentrations in
Coal Creek are well below the chronic and acute toxicity standards at all sites. For
this reason, these standards are not included on the graph. The 30-day dissolved
manganese standard for a drinking water supply is 50 µg L-1. This standard is
exceeded at CC-2.378 to CC-2.734, CC-3.165 to CC-3.506, CC-4.388, CC-6.133, and
CC-6.319. A sharp decrease in manganese concentration occurred at CC-6.556,
approximately 1.1 km downstream of the treatment plant. Most manganese is present
in the dissolved form.
Of the tributaries, UT-3.661 contained the largest manganese concentration
with 1,370 µg L-1 dissolved manganese and 1,530 µg L-1 total manganese. UT-6.696
also had high manganese concentrations with 669 µg L-1 dissolved manganese and
712 µg L-1 total manganese. Tributary total and dissolved manganese concentrations
are similar for all tributaries except UT-3.661.
The Coal Creek manganese loading rates closely resembled Coal Creek
manganese concentrations (Figure 14). The maximum loading rate of 0.62 kg d-1
dissolved manganese occurred at CC-2.734. The loading rate remained elevated near
an average of 0.46 kg d-1 from CC-2.378 – CC-5.180. The loading rate decreased
downstream of CC-5.372 in response to the drinking water flow diversion. A sharp
loading rate decrease occurred at CC-6.556 in response to the low manganese
concentration at that site.
The largest tributary dissolved manganese loading rate of 1.12 kg d-1 comes
from UT-3.661 and comprises 67 % of the manganese loading in Coal Creek.
60
Though UT-3.294, UT-3.455, the treatment plant channel, and UT-6.696 have high
manganese concentrations, flow from these tributaries is too low to produce a
significant loading rate. The drinking water return channel is the only other tributary
with a loading rate above the instream loading rate. It contributes 0.35 kg d-1 total
manganese and 17 % of the cumulative tributary manganese loading rate (Table 8).
4.9c Aluminum concentrations and loading rates Aluminum concentration is
below the chronic toxicity standard of 87 µg L-1 total recoverable aluminum for sites
CC-0.000 to CC-5.372 (Figure 15). Sites CC-1.255 to CC-3.314 contained no
measurable aluminum. A small rise in aluminum concentration was observed
between CC-5.693 and CC-7.499. CC-6.319 had the highest dissolved aluminum
concentration with 221 µg L-1. CC-6.556 had the highest total aluminum
concentration with 294 µg L-1. The CDPHE specifies that the chronic total
recoverable aluminum criterion will not apply when pH is greater than or equal to 7.0
and when hardness is greater than or equal to 50 mg L-1 as CaCO3. This is the case
for all Coal Creek sites with aluminum concentrations above 87 µg L-1. Aluminum
concentrations above 87 µg L-1 are not in violation of aquatic life standards in Coal
Creek. In this instance, aluminum is regulated based on the 750 µg L-1 total
recoverable aluminum criterion (CDPHE, 2005). This acute aluminum toxicity
standard is not exceeded at any instream site.
UT-3.294, UT-3.455, UT-3.661, and the treatment plant channel have total
and dissolved aluminum concentrations greater than 750 µg L-1. UT-3.661 has the
highest dissolved and total aluminum concentrations of 5,750 µg L-1 and 6,610 µg L-1,
respectively. UT-3.294, UT-3.455, and UT-3.661 drain the iron fen, with UT-3.661
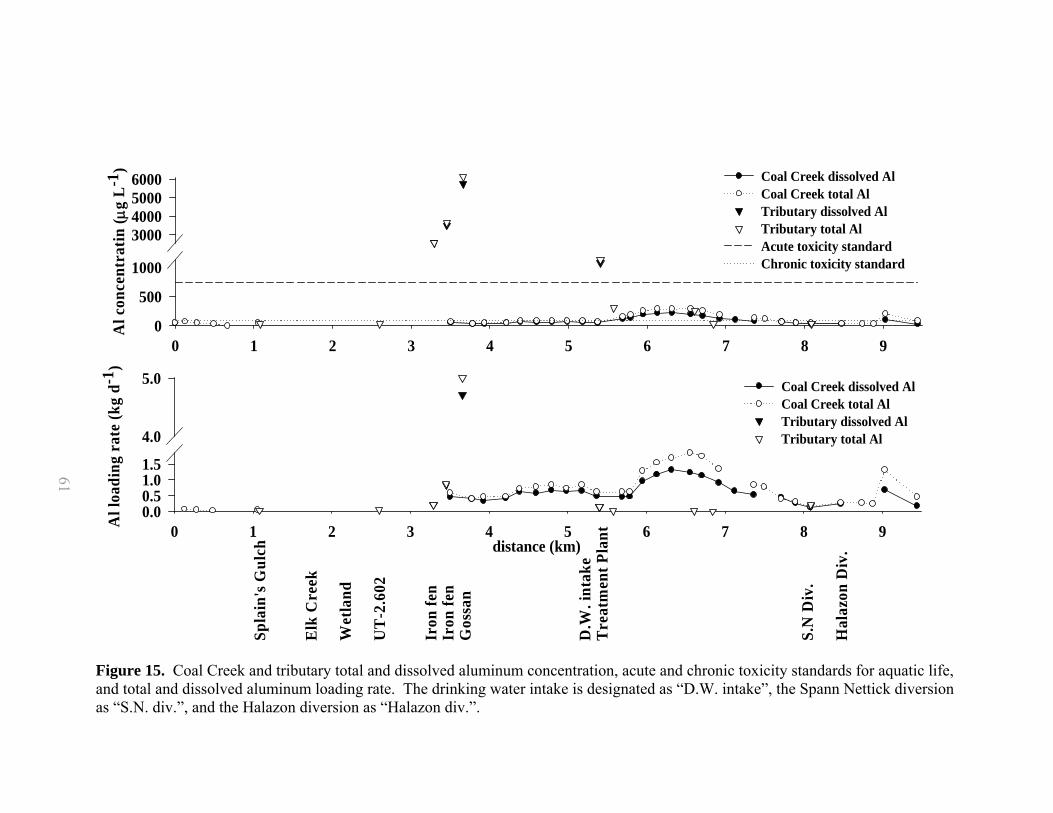
61
0 1 2 3 4 5 6 7 8 9
Al c
once
ntra
tin ( μ
g L
-1)
0
500
1000
3000400050006000 Coal Creek dissolved Al
Coal Creek total AlTributary dissolved AlTributary total AlAcute toxicity standardChronic toxicity standard
distance (km)0 1 2 3 4 5 6 7 8 9A
l loa
ding
rat
e (k
g d-1
)
0.00.51.01.5
4.0
5.0 Coal Creek dissolved AlCoal Creek total AlTributary dissolved AlTributary total Al
Spla
in's
Gul
ch
Elk
Cre
ek
Wet
land
UT
-2.6
02
Iron
fen
Iron
fen
Gos
san
D.W
. int
ake
Tre
atm
ent P
lant
S.N
Div
.
Hal
azon
Div
.
Figure 15. Coal Creek and tributary total and dissolved aluminum concentration, acute and chronic toxicity standards for aquatic life, and total and dissolved aluminum loading rate. The drinking water intake is designated as “D.W. intake”, the Spann Nettick diversion as “S.N. div.”, and the Halazon diversion as “Halazon div.”.
61
62
containing drainage directly from the gossan. The Mt. Emmons Treatment Plant
effluent channel contains 1,080 µg L-1 dissolved aluminum and 1,130 µg L-1 total
aluminum. During synoptic sampling, the treatment plant discontinued the daily
effluent release. A second sample was taken from the Mt. Emmons Treatment Plant
effluent channel on September 6, 2005 at 10:49 when effluent was being released.
This sample was taken to detect any differences in constituents when effluent was
being released and when it was not. This sample is not graphed in Figure 11 because
it was not collected during the synoptic sampling. On September 6, this tributary
contained 728 µg L-1 dissolved aluminum and 1,020 µg L-1 total aluminum.
The aluminum loading rate peaks at the same locations as the aluminum
concentration (Figure 15). The dissolved loading rate reaches a maximum of
1.31 kg d-1 at CC-6.319. The total loading rate reaches a maximum of 1.85 kg d-1 at
CC-6.556, approximately 1.1 km downstream of the treatment plant. A smaller spike
of 1.30 kg d-1 total aluminum occurs at CC-9.030, within the Crested Butte city limit
upstream of the bridge on Maroon Street. UT-3.661 contributes the greatest
aluminum loading rate of the tributaries with 5.01 kg d-1 total aluminum. This is
76 % of the tributary total aluminum loading rate. UT-3.455 contributes 0.86 kg d-1
total aluminum, which is 13 % of the total aluminum loading rate. Though UT-3.294
and the treatment plant channel contained high aluminum concentrations, the loading
rate is not substantial because of the low flow rates at these sites. UT-3.294
contributed 3.3 % of the total aluminum loading rate and the treatment plant effluent
added only 2.3% (Table 8).
63
4.9d Zinc concentrations and loading rates The maximum instream zinc
concentration occurs at CC-6.319 (Figure 16). CC-6.319 total and dissolved zinc
concentrations are 187 µg L-1 and 199 µg L-1, respectively. Acute toxicity standards
are exceeded at CC-1.613 to CC-2.072, CC-3.506, and CC-4.388 to CC-5.372. Coal
Creek zinc concentrations exceed CDPHE chronic toxicity standards at sites
CC-1.613 to CC-2.378 (just downstream of Elk Creek), CC-3.506 (downstream of
iron fen drainage), and CC-4.388 to CC-5.372 (just downstream of the iron gossan
drainage). Though there are high instream zinc concentrations from CC-5.693 to
CC-8.085 (immediately downstream of the Mt. Emmons effluent channel at
5.405 km), toxicity standards were not exceeded during the sampling event. The Mt.
Emmons Treatment Plant released effluent throughout the day, causing a large influx
of calcium to Coal Creek. The increased calcium concentration produced an increase
in hardness downstream of the effluent channel (hardness = 50.05 ([Ca] + [Mg])).
Because zinc toxicity standards are hardness-based, values for the toxicity standards
increased downstream of the treatment plant effluent channel.
Several tributaries exceeded the chronic and acute toxicity standards. These
include Elk Creek, UT-3.294, UT-3.455, UT-3.661, and the treatment plant effluent
channel. The concentration of zinc is highest in UT-3.661. UT-3.294, UT-3.455, and
UT-3.661 contain drainage from the iron fen. These three tributaries contribute the
highest zinc concentrations to Coal Creek.
Total and dissolved zinc concentrations have very similar values along the
entire study reach. At ten instream sites and four tributaries, dissolved zinc
concentrations were slightly greater than total zinc concentrations.
64
0 1 2 3 4 5 6 7 8 9
Zn C
once
ntra
tion
( μg
L-1
)
0100200300400
1500
2000
2500 Coal Creek dissolved ZnCoal Creek total ZnTributary dissolved ZnTributary total ZnAcute toxicity standardChronic toxicity standard
distance (km)0 1 2 3 4 5 6 7 8 9
Zn lo
adin
g ra
te
(kg
d-1)
0.0
0.5
1.0
1.5
2.0
Spla
in's
Gul
ch
Elk
Cre
ek
Wet
land
Iron
fen
Iron
fen
Gos
san
D.W
. int
ake
Tre
atm
ent P
lant
S.N
. Div
.H
alaz
on D
iv.
Figure 16. Coal Creek and tributary total and dissolved zinc concentration, chronic and acute toxicity standards, and total and dissolved zinc loading rate. The drinking water intake is designated as “D.W. intake”, the Spann Nettick diversion as “S.N. div.”, and the Halazon diversion as “Halazon div.”.
64

65
A spike in the total zinc loading rate from 0.0041 to 0.49 kg d-1 is observed
directly downstream of the Elk Creek confluence. Elk Creek contributed a zinc
loading rate of 0.51 kg d-1. This rate comprised 16 % of zinc contributions to Coal
Creek (Table 8). UT-3.661, entering Coal Creek between CC-3.506 and CC-3.783,
contributes the largest dissolved zinc loading rate of 1.99 kg d-1 and 49 % of zinc
contributions. Zinc influx from UT-3.661 produced a spike in Coal Creek zinc
loading rate from 0.77 kg d-1 at CC-3.506 to 1.31 kg d-1 at CC-4.388. The maximum
instream zinc load in Coal Creek was 1.42 kg d-1 at CC-4.794, midway between the
iron fen drainages and the drinking water intake. The zinc loading rate abruptly
decreased between CC-5.372 and CC-5.693 in response to loss of flow to the drinking
water diversion. The Spann Nettick diversion produced a similar, but less
pronounced, zinc loading rate decrease between CC-7.895 and CC-8.085. A loading
rate is not graphed at point CC-2.588 because a sampling error occurred and a flow
rate at this site could not be determined. The zinc concentration at CC-2.588 is less
than that of the surrounding sites. This supports the suspicion that the sample at
CC-2.588 was taken from a side pool and not in the path of greatest flow.
4.9e Copper concentration and copper loading rate Copper concentration
showed a small increasing trend from the upstream to the downstream end of the
study reach (Figure 17). The maximum total copper concentration of 3.65 µg L-1 was
measured at CC-9.030, within the Crested Butte city limit just upstream of the bridge
on Maroon Street. No instream sites exceeded the chronic toxicity standard for
aquatic life. The acute toxicity standard is much greater than instream concentrations
66
0 1 2 3 4 5 6 7 8 9
Cu
Con
cent
ratio
n ( μ
g L
-1)
012345678
Coal Creek dissolved CuCoal Creek total CuTributary dissolved CuTributar total CuChronic toxicity standard
distance (km)0 1 2 3 4 5 6 7 8 9
Cu
load
ing
rate
(k
g d-1
)
0.00
0.01
0.02
0.03
0.00
0
0.48
9
Spla
in's
Gul
chE
lk C
reek
1.67
6
Wet
land
2.60
22.
978
3.45
5 (f
en)
3.66
1 (g
ossa
n)4.
214
4.59
9
D.W
. int
ake
5.79
0
6.60
66.
801
7.12
1
S.N
. Div
.8.
090
Hal
azon
Div
.8.
738
9.44
2
Figure 17. Coal Creek and tributary total and dissolved copper concentration, chronic aquatic life toxicity standard, and total and dissolved copper loading rate. The drinking water intake is designated as “D.W. intake”, the Spann Nettick diversion as “S.N. div.”, and the Halazon diversion as “Halazon div.”.
66
67
and is not shown in Figure 17. The highest tributary total copper concentrations were
measured at UT-3.661 (gossan drainage) and the treatment plant effluent channel.
The copper loading rate also showed a small increasing trend from the
upstream to the downstream end of the study reach (Figure 17). The maximum total
copper loading rate of 0.024 kg d-1 occurred at CC-9.030. The loading rate decrease
as a result of the drinking water and Spann Nettick diversions. All tributary loading
rates are less than adjacent instream loading rates except at UT-2.602 and the
drinking water reservoir return channel. UT-2.602 contributed 20 % of total tributary
inputs and the drinking water reservoir return flow contributed 30 % (Table 8).
4.9f Cadmium concentrations and loading rates Cadmium concentrations
remained stable near an average of 0.46 µg L-1 from CC-1.463 0.4 km downstream of
Splain’s Gulch to CC-5.372 (Figure 18) Immediately upstream of the Mt. Emmons
Treatment Plant effluent channel. Cadmium was not detected in samples from
CC-0.000 to CC-1.255 or in Splain’s Gulch. CC-6.319 contained the maximum
instream dissolved cadmium concentration of 1.6 µg L-1. A small rise in cadmium
concentration was observed between CC-5.693 and CC-8.085. The average
concentration between these sites was 1.09 µg L-1. Effluent from the Mt. Emmons
Treatment Plant channel is the likely source of this slight rise in cadmium
concentration. Downstream of the drinking water reservoir return at 8.090 km,
cadmium is diluted to concentrations close to those of CC-1.463 to CC-5.372.
The chronic toxicity standard for aquatic life for cadmium is exceeded at CC-1.613 to
CC-2.378, CC-2.734, CC-2.978, CC-3.314 to CC-5.693, CC-5.951, CC-6.133,
68
2 3 4 5 6 7 8 9Cd
conc
entr
atio
n ( μ
g L
-1)
01234567
Acute toxicity standardChronic toxicity standardAcute (trout) toxicity standardCoal Creek dissolved CdCoal Creek total CdTributary dissolved CdTributary total Cd
distance (km)2 3 4 5 6 7 8 9C
d lo
adin
g ra
te (k
g d-1
)
0.000
0.002
0.004
0.006
0.008 Coal Creek dissolved CdCoal Creek total CdTributary dissolved CdTributary total Cd
Elk
Cre
ek1.
613
Wet
land
2.73
42.
978
3.29
4 (f
en)
3.45
5 (f
en)
3.66
1 (g
ossa
n)
4.21
44.
599
D.W
. int
ake
5.40
5
5.95
1
6.69
6
7.12
17.
499
S.N
. Div
.8.
090
Hal
azon
Div
.
8.73
8
9.44
2
Figure 18. Coal Creek and tributary total and dissolved cadmium concentration, chronic, acute, and acute (trout) toxicity standards, and total and dissolved cadmium loading rate. The drinking water intake is designated as “D.W. intake”, the Spann Nettick diversion as “S.N. div.”, and the Halazon diversion as “Halazon div.”.
68

69
CC-6.707 to CC-7.121, and CC-7.713 to CC-8.085. The cadmium toxicity standards
are hardness-based; therefore, these standards increased significantly downstream of
the Mt. Emmons Treatment Plant due to the high calcium content of the effluent. If
the chronic toxicity standard upstream of the treatment plant were extended to
downstream sites to represent times when effluent is not released, it is possible that
several more sites between CC-5.693 and CC-8.085 would exceed the chronic
standard. The acute and trout acute standards are not exceeded at any instream sites.
The 1-day total recoverable cadmium standard for a drinking water
supply is 5 µg L-1. This standard is not shown because all instream sites are well
below this concentration.
UT-3.294, UT-3.455, and UT-3.661, the iron fen drainages, contributed the
highest cadmium concentrations. Instream concentration does not increase
downstream of the iron fen drainages. Elk Creek and the Mt. Emmons Treatment
Plant channel also contributed concentrations above instream levels.
The maximum dissolved cadmium loading rate of 9.50 x 10⁻³ kg d-1 occurred
at CC-6.319. The loading rate increased from CC-1.463, upstream of Elk Creek, to
CC-6.319. The drinking water supply diversion caused a drop in total loading rate, as
did the Spann Nettick diversion.
UT-3.661 and Elk Creek contribute the greatest tributary cadmium loading
rate (Figure 18). The total cadmium loading rate is 4.92 × 10⁻³ kg d-1 at UT-3.661
and 4.08 × 10⁻³ kg d-1 at Elk Creek. UT-3.661 contributed 39 % of the total tributary
cadmium loading rate while Elk Creek added 32 %. UT-3.455 added 12 % of the
total cadmium loading rate while the drinking water return added 11 %. Though the

70
total cadmium loading rate from the treatment plant channel is only 3.26 × 10⁻⁴ kg d-1
and 2.6 % of the cumulative tributary loading rate, the instream loading rate is
greatest downstream of the treatment plant (Table 8).
4.9g Lead concentrations and loading rates Lead concentrations are low in
Coal Creek. The average total lead concentration from the upstream background site
to CC-3.506 was 0.23 µg L-1, with the exception of site CC-1.862, which had a total
lead concentration of 1.13 µg L-1 (Figure 19). The maximum instream lead
concentration occurs at CC-3.931 and is 1.50 µg L-1 total lead. The chronic and acute
toxicity standards for dissolved lead were not exceeded at any Coal Creek sites. The
1-day dissolved lead drinking water supply standard of 50 µg L-1 was also not
exceeded at any site. The acute toxicity and drinking water standards are much
greater than instream concentrations and are not shown in Figure 19. Total and
dissolved lead concentrations were not detected at all but six sites between CC-3.783
and CC-9.030. Total and dissolved lead concentrations are similar, indicating that
most lead exists in the dissolved form and that the colloidal fraction is small.
Splain’s Gulch was the tributary with the highest total lead concentration.
UT-3.455, UT-3.661, UT-6.844, and UT-6.606 also contained significant total lead
concentrations.
CC-3.931 has the greatest total lead loading rate of 0.014 kg d-1. CC-6.844
and CC-6.707 also had total lead loading rates greater than the average loading rate of
1.1 × 10⁻³ kg d-1. The drinking water return at 8.090 km contains the largest tributary
total lead loading rate, 50 % of the cumulative tributary loading rate. Splain’s Gulch
adds 22 % of the tributary total lead loading rate and UT-3.661 adds 10 % (Table 8).
71
0 1 2 3 4 5 6 7 8 9
Pb c
once
ntra
tion
( μg
L-1
)
0.0
0.5
1.0
1.5
2.0Coal Creek dissolved PbCoal Creek total PbChronic toxicity standardTributary dissolved PbTributary total Pb
distance (km)0 1 2 3 4 5 6 7 8 9
Pb lo
adin
g ra
te
(kg
d-1)
0.0000.0020.0040.0060.0080.0100.0120.0140.016 Coal Creek dissolved Pb
Coal Creek total PbTributary dissolved PbTributary total Pb
Spla
in's
Gul
ch
Elk
Cre
ek
Wet
land
Fen
Fen
Gos
san
Tre
atm
ent P
lant
Res
. Ret
urn
Figure 19. Coal Creek and tributary total and dissolved lead concentration, chronic toxicity standard for aquatic life, and total and dissolved lead loading rate. Missing data points are sites with lead concentrations less than the Contract Required Quantitation Limit. The drinking water intake is designated as “D.W. intake”, the Spann Nettick diversion as “S.N. div.”, and the Halazon diversion as “Halazon div.”.
71

72
4.9h Nickel concentration and nickel loading rate The total nickel
concentration exceeded the chronic aquatic life toxicity standard for dissolved nickel
only at CC-3.165 (Figure 20). The acute toxicity standard is not exceeded at any
instream locations and is therefore not shown. The total nickel concentration
fluctuates along the length of the study reach. Higher concentrations are measured at
CC-1.255, CC-5.790, and CC-9.030.
The four tributaries with the greatest total nickel concentrations are Splain’s
Gulch, UT-2.602, UT-2.750, and UT-3.661 (gossan drainage). The elevated nickel
concentrations at CC-1.255 and CC-3.165 may result from high nickel input from
Splain’s Gulch, UT-2.602 and UT-2.750.
The maximum total nickel loading rate of 0.38 kg d-1 occurred at CC-3.165
(Figure 20). Elevated loading rates are located from CC-3.931 to CC-4.214,
CC-4.985 to CC-5.372, and CC-9.030. The loading rate at CC-5.372 is 0.19 kg d-1
and the loading rate at CC-9.030 is 0.19 kg d-1. The highest tributary loading rate of
0.12 kg d-1 comes from UT-2.602 and is 45 % of cumulative tributary loading rate.
UT-3.661 contributes 18 % of the tributary loading rate with 0.048 kg d-1 (Table 8).
4.9i Chromium concentration and chromium loading rate Dissolved
chromium concentrations in Coal Creek fluctuated substantially (Figure 21). The
highest total chromium concentrations were measured at CC-0.664, CC-3.165,
CC-5.790, and CC-9.030. If the majority of chromium is in the dissolved state and all
of the chromium is in the +VI oxidation state, the total chromium concentrations
show that the chronic and acute toxicity standards for dissolved chromium(VI) are
exceeded at numerous sampling sites. The 1-day drinking water supply standard for
73
0 1 2 3 4 5 6 7 8 9
Ni c
once
ntra
tion
( μg
L-1
)
0
20
40
60
80
Coal Creek dissolved NiCoal Creek total NiTributary dissolved NiTributary total NiChronic toxicity standard
distance (km)0 1 2 3 4 5 6 7 8 9
Ni l
oadi
ng r
ate
(kg
d-1)
0.0
0.1
0.2
0.3Coal Creek dissolved NiCoal Creek total NiTributary dissolved NiTributary total Ni
0.00
0
0.48
9
Spla
in's
Gul
chE
lk C
reek
1.67
6
Wet
land
2.60
22.
978
3.29
4 (f
en)
3.45
5 (f
en)
3.66
1 (g
ossa
n)3.
931
4.59
9
D.W
. int
ake
5.57
7
6.13
36.
319
6.84
46.
923
7.71
3S.
N. D
iv.
8.09
0H
alaz
on D
iv.
8.73
8
9.03
09.
442
Figure 20. Coal Creek and tributary total and dissolved nickel concentration, chronic toxicity standard for aquatic life, and total nickel loading rate. The drinking water intake is designated as “D.W. intake”, the Spann Nettick diversion as “S.N. div.”, and the Halazon diversion as “Halazon div.”.
73
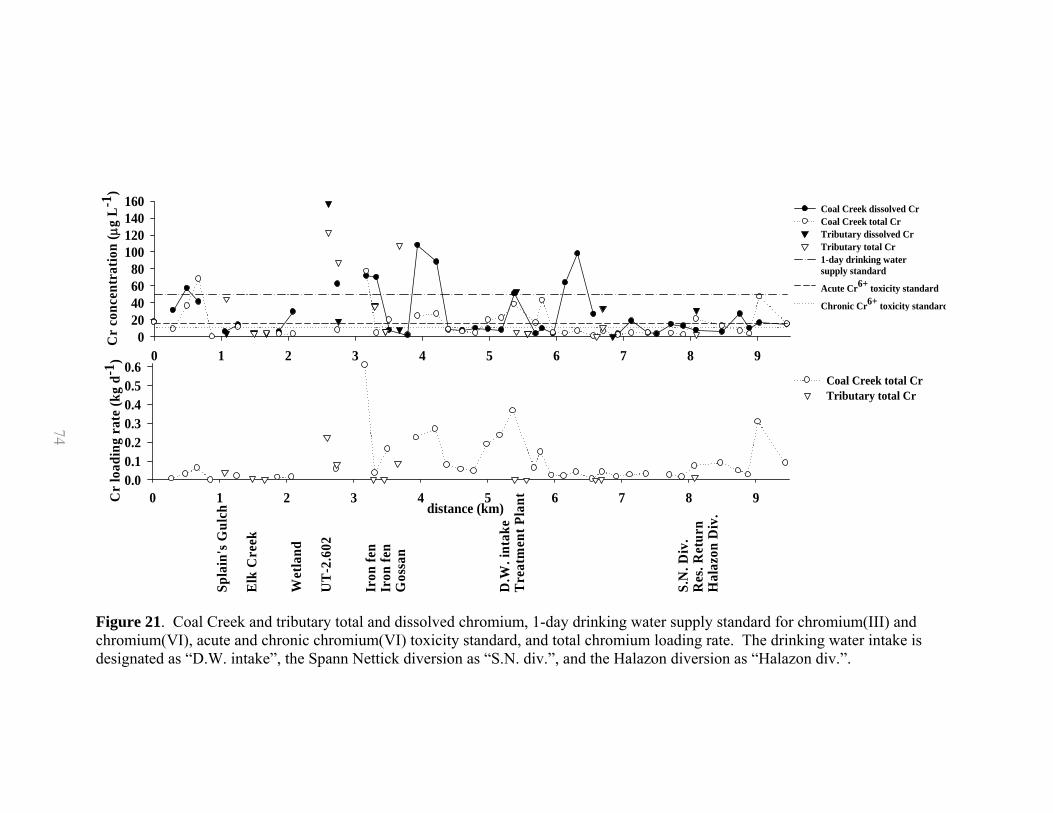
74
Spla
in's
Gul
ch
Elk
Cre
ek
Wet
land
UT
-2.6
02
Iron
fen
Iron
fen
Gos
san
D.W
. int
ake
Tre
atm
ent P
lant
S.N
. Div
.R
es. R
etur
nH
alaz
on D
iv.
0 1 2 3 4 5 6 7 8 9
Cr
conc
entr
atio
n ( μ
g L
-1)
020406080
100120140160 Coal Creek dissolved Cr
Coal Creek total CrTributary dissolved CrTributary total Cr1-day drinking water supply standard
Acute Cr6+ toxicity standard
Chronic Cr6+ toxicity standard
distance (km)0 1 2 3 4 5 6 7 8 9C
r lo
adin
g ra
te (k
g d-1
)
0.00.10.20.30.40.50.6
Coal Creek total CrTributary total Cr
Figure 21. Coal Creek and tributary total and dissolved chromium, 1-day drinking water supply standard for chromium(III) and chromium(VI), acute and chronic chromium(VI) toxicity standard, and total chromium loading rate. The drinking water intake is designated as “D.W. intake”, the Spann Nettick diversion as “S.N. div.”, and the Halazon diversion as “Halazon div.”.
74
75
hexavalent total chromium is exceeded at CC-0.664, 0.6 km downstream from the
injection, and CC-3.165, immediately upstream of the iron fen. The highest tributary
total chromium concentration of 123 µg L-1 was measured at UT-2.602. UT-2.750,
UT-3.294, UT-3.661, and Splain’s Gulch also contained relatively high total
chromium concentrations.
The total chromium loading rate was less than 0.10 kg d-1 over most of the
tracer test reach, but spikes in loading rates were observed (Figure 21). The highest
loading rates occurred at CC-3.165, CC-5.372, and CC-9.030. The maximum
instream loading rate at CC-3.165 was just downstream of the larger tributary loads at
UT-2.602 and UT-2.750, though these tributary loads are not as large as the load at
CC-3.165. The other spikes in instream loading rate are unrelated to tributary input.
These increases in chromium loading rate may have been a result of groundwater
inputs.
UT-2.602 had the largest tributary total chromium loading rate, 48 % of the
total tributary chromium loading rate (Table 8). UT-3.661 contributed 19 % and
UT-2.750 contributes 18 %.
4.9j Arsenic concentrations and loading rates Arsenic concentrations
decreased from upstream to downstream. The maximum arsenic concentrations of
15.9 µg L-1 dissolved arsenic and 21.4 µg L-1 total arsenic occurred at CC-0.128
(Figure 22). The colloidal fraction is greatest at CC-0.128. It is 5.9 µg L-1.
The arsenic aquatic life standards are not hardness-dependent. The acute
standard is 340 µg L-1 and the chronic standard is 150 µg L-1 (CDPHE, 2005).
Instream and tributary concentrations are well below the standards at all sample sites.
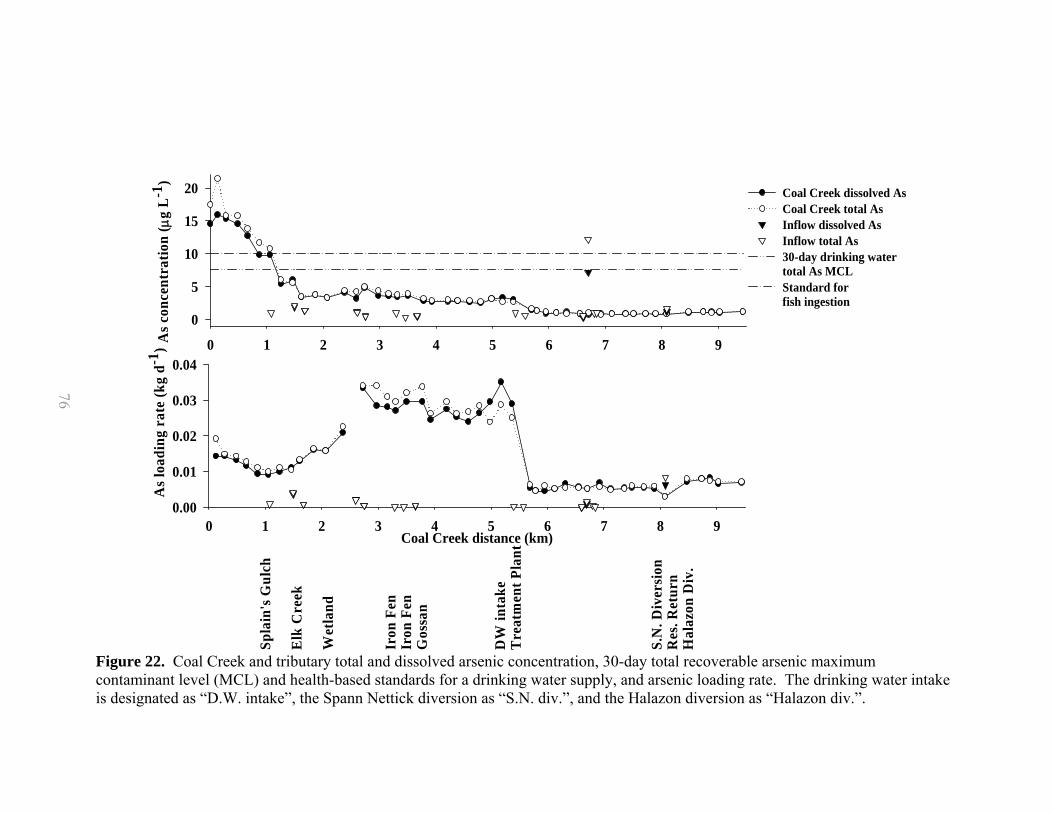
76
0 1 2 3 4 5 6 7 8 9As c
once
ntra
tion
( μg
L-1
)
0
5
10
15
20 Coal Creek dissolved AsCoal Creek total AsInflow dissolved AsInflow total As30-day drinking water total As MCLStandard for fish ingestion
Coal Creek distance (km)0 1 2 3 4 5 6 7 8 9
As l
oadi
ng r
ate
(kg
d-1)
0.00
0.01
0.02
0.03
0.04
Spla
in's
Gul
ch
Elk
Cre
ek
Wet
land
Iron
Fen
Iron
Fen
Gos
san
DW
inta
keT
reat
men
t Pla
nt
S.N
. Div
ersi
onR
es. R
etur
nH
alaz
on D
iv.
Figure 22. Coal Creek and tributary total and dissolved arsenic concentration, 30-day total recoverable arsenic maximum contaminant level (MCL) and health-based standards for a drinking water supply, and arsenic loading rate. The drinking water intake is designated as “D.W. intake”, the Spann Nettick diversion as “S.N. div.”, and the Halazon diversion as “Halazon div.”.
76
77
The 30-day total recoverable arsenic standard for a drinking water supply is 10 µg
L-1. This standard is a maximum contaminant level established under the federal Safe
Drinking Water Act (CDPHE, 2005). The maximum contaminant level was exceeded
only over the first 1.1 km of the tracer test reach. The standard for fish ingestion is
7.5 µg L-1. This standard was exceeded over the initial 1.2 km of the study reach.
Tributary arsenic concentrations are below instream concentrations except for at
UT-6.696 and the drinking water reservoir return.
The maximum arsenic loading rate of 0.035 kg d-1 dissolved arsenic occurs at
CC-5.180, 0.210 km upstream of the drinking water intake (Figure 22). Three
distinct segments of the loading rate curve were apparent. The loading rate averaged
0.013 kg d-1 dissolved arsenic over the first 2.378 km of the tracer test reach. The
loading rate spiked in response to increased flow rates beginning at CC-2.734. The
average arsenic loading rates from CC-2.734 to CC-5.372 were 0.028 kg d-1 dissolved
arsenic. Following CC-5.372, the loading rate decreased in response to the drinking
water flow diversion and decreasing arsenic concentration. The average loading rate
from CC-5.693 to CC-9.442 is 0.0058 kg d-1 dissolved arsenic.
Tributary loading rates were lower than instream loading rates except at the
drinking water reservoir return channel which contributed 42 % of the tributary total
arsenic loading rate (Table 8). Elk Creek added 21 % and UT-2.602 added 10 %.
4.9k Barium concentrations and loading rates Coal Creek barium
concentration averaged 34.7 µg L-1 dissolved barium and 37.8 µg L-1 total barium
from over the first 1.463 km of the tracer test reach (Figure 23). A concentration drop
occurred at CC-1.613 due to dilution from Elk Creek. The barium concentration
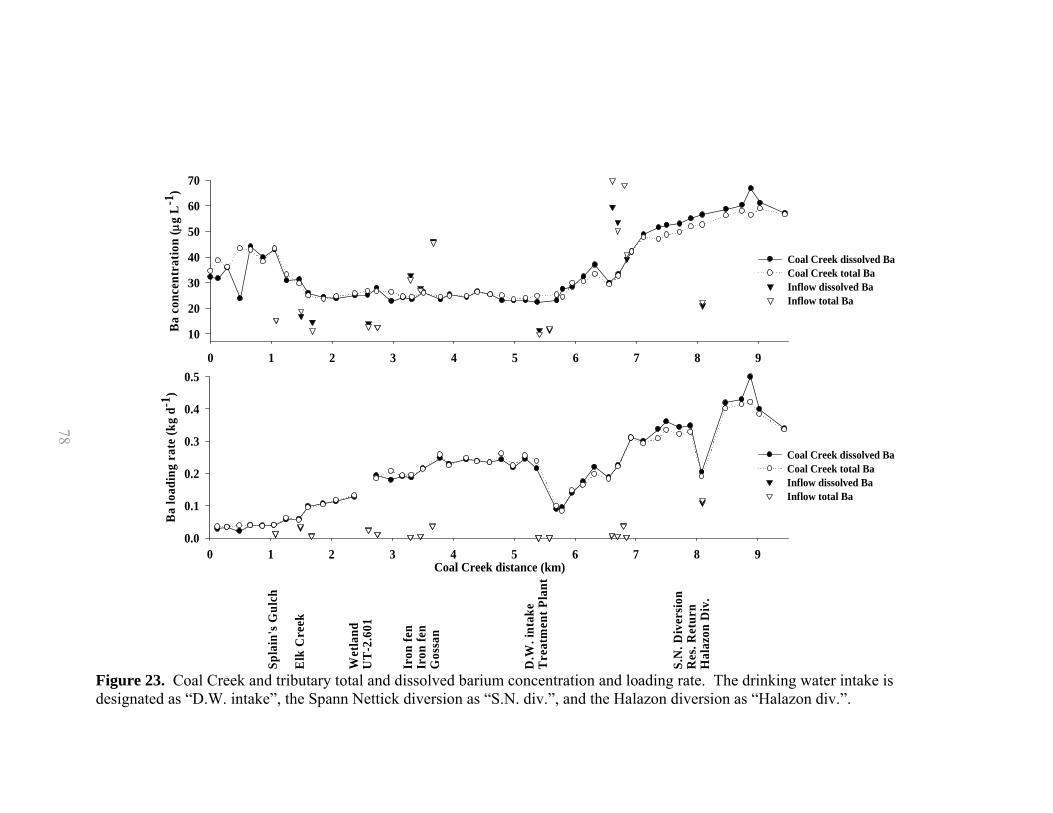
78
0 1 2 3 4 5 6 7 8 9
Ba
conc
entr
atio
n ( μ
g L
-1)
10
20
30
40
50
60
70
Coal Creek dissolved BaCoal Creek total BaInflow dissolved BaInflow total Ba
Coal Creek distance (km)0 1 2 3 4 5 6 7 8 9
Ba
load
ing
rate
(kg
d-1)
0.0
0.1
0.2
0.3
0.4
0.5
Coal Creek dissolved BaCoal Creek total BaInflow dissolved BaInflow total Ba
Spla
in's
Gul
ch
Elk
Cre
ek
Wet
land
UT
-2.6
01
Iron
fen
Iron
fen
Gos
san
D.W
. int
ake
Tre
atm
ent P
lant
S.N
. Div
ersi
onR
es. R
etur
nH
alaz
on D
iv.
Figure 23. Coal Creek and tributary total and dissolved barium concentration and loading rate. The drinking water intake is designated as “D.W. intake”, the Spann Nettick diversion as “S.N. div.”, and the Halazon diversion as “Halazon div.”.
78
79
averaged 24.4 µg L-1 dissolved barium and 25.1 µg L-1 total barium between
CC-1.613 and CC-5.693. Barium concentration increased downstream of CC-5.790
until the total concentration peaked at 58.9 µg L-1 at CC-44. No aquatic life standards
for barium are in effect. The 1-day drinking water standard is 1000 µg L-1 total
recoverable barium while the 30-day drinking water standard is 490 µg L-1 (CDPHE,
2005). Instream and tributary concentrations were below these standards at all sites.
The four closely grouped tributaries from 6.606 to 6.844 km downstream of
the injection, UT-6.606, UT-6.696, UT-6.801, and UT-6.844, had some of the highest
barium concentrations. The maximum instream concentration occurred
approximately 2.156 km downstream of these tributaries.
The barium loading rate showed a generally increasing trend, except where
the loading rate dropped in response to the drinking water and Spann Nettick
diversions (Figure 23). The maximum total barium loading rate of 0.42 kg d-1
occurred at CC-8.881.
All tributary loading rates were less than instream loading rates. The drinking
water return channel contributed 37 % of the cumulative tributary barium loading rate
(Table 8). UT-3.661 and UT-6.801 added 12 % each.
4.10 Electron microprobe images and elemental spectra
Scanning electron microscopy (SEM) was used to assess morphology and
elemental composition at four instream and two tributary synoptic sample sites;
CC-0.128, CC-0.282, CC-6.556, CC-9.442, UT-6.696, and the drinking water return.
Five hundred mL of sample water was filtered through 0.45-µm nylon mesh filters in

80
order to trap colloidal material. Though others are wary of using arbitrary filter mesh
sizes to define dissolved constituents, historically, 0.45-µm filters have been used to
separate dissolved constituents from particulates ( Morrison and Benoit, 2001; Pham
and Garnier, 1998; Danielsson, 1982; Kennedy and others, 1974; Ryan and
Gschwend, 1990). Furthermore, the EPA required 0.45-µm filtration for the
inductively-coupled plasma (ICP) analyses. Morphology of the samples alone does
not adequately distinguish a mineral. However, the elemental composition (mol%) of
a mineral coupled with morphological characteristics can be used to identify
mineralogy (Mudroch and others, 1977).
Electron microprobe images for CC-0.128, CC-9.442, the drinking water
reservoir return channel at 8.090 km, and UT-6.696 are presented in Figures 24 to 26.
The figures show some of the minerals present at each of these sites. An unidentified
clay mineral, iron and manganese oxyhydroxides, and microcline were found at
CC-0.128 (Figure 24). The oxyhydroxides are filamentous. Albite, clay, iron
oxyhydroxide, microcline, plagioclase, and quartz were some of the minerals present
at CC-9.442 (Figure 24). Manganese oxyhydroxide was present in the drinking water
reservoir return flow (Figure 25). The iron oxyhydroxide at UT-6.696 appeared to be
bacterially controlled as indicated by the filamentous morphology (Figure 26).
Particle sizes can be determined by comparing individual particles with the scale
shown at the bottom of each micrograph. The filter pores are visible in these images
and it is quite clear that most of the pores are larger than 0.45 microns.
The relative abundance of various elements was determined following the
guidelines set forth by Mudroch and others (1977) for several minerals using electron
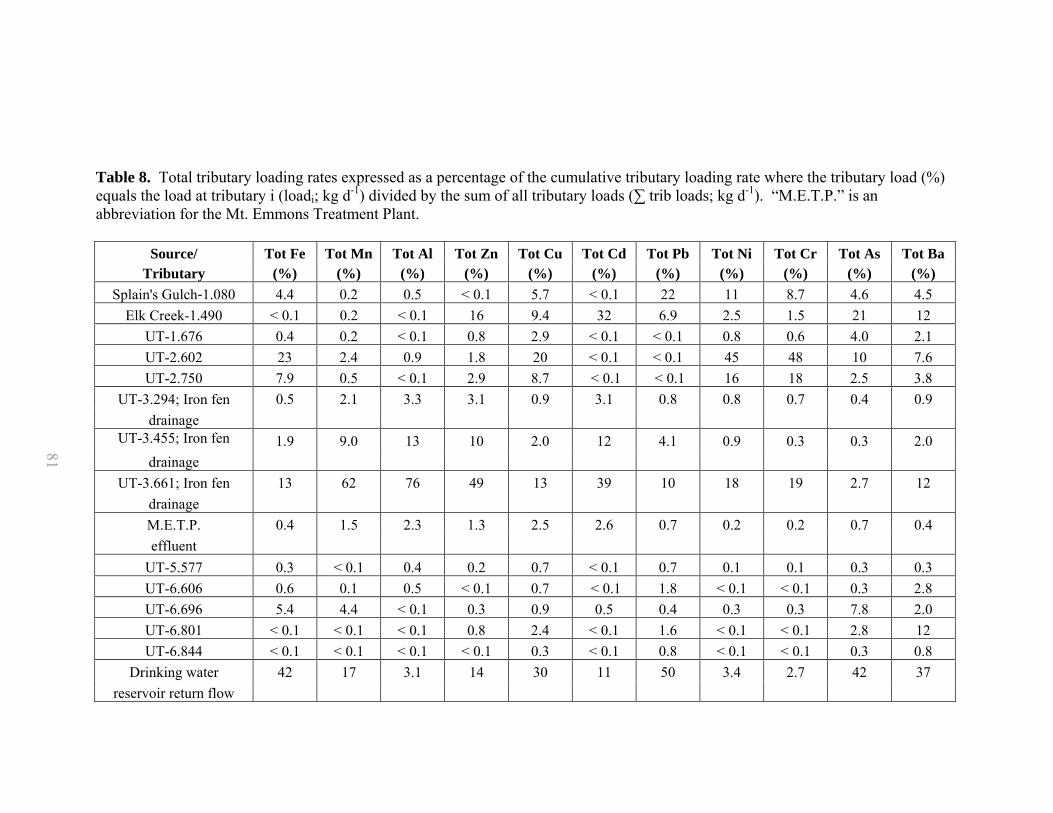
81
Table 8. Total tributary loading rates expressed as a percentage of the cumulative tributary loading rate where the tributary load (%) equals the load at tributary i (loadi; kg d-1) divided by the sum of all tributary loads (∑ trib loads; kg d-1). “M.E.T.P.” is an abbreviation for the Mt. Emmons Treatment Plant.
Source/ Tot Fe Tot Mn Tot Al Tot Zn Tot Cu Tot Cd Tot Pb Tot Ni Tot Cr Tot As Tot Ba Tributary (%) (%) (%) (%) (%) (%) (%) (%) (%) (%) (%)
Splain's Gulch-1.080 4.4 0.2 0.5 < 0.1 5.7 < 0.1 22 11 8.7 4.6 4.5 Elk Creek-1.490 < 0.1 0.2 < 0.1 16 9.4 32 6.9 2.5 1.5 21 12
UT-1.676 0.4 0.2 < 0.1 0.8 2.9 < 0.1 < 0.1 0.8 0.6 4.0 2.1 UT-2.602 23 2.4 0.9 1.8 20 < 0.1 < 0.1 45 48 10 7.6 UT-2.750 7.9 0.5 < 0.1 2.9 8.7 < 0.1 < 0.1 16 18 2.5 3.8
UT-3.294; Iron fen 0.5 2.1 3.3 3.1 0.9 3.1 0.8 0.8 0.7 0.4 0.9 drainage
UT-3.455; Iron fen 1.9 9.0 13 10 2.0 12 4.1 0.9 0.3 0.3 2.0 drainage
UT-3.661; Iron fen 13 62 76 49 13 39 10 18 19 2.7 12 drainage M.E.T.P. 0.4 1.5 2.3 1.3 2.5 2.6 0.7 0.2 0.2 0.7 0.4 effluent
UT-5.577 0.3 < 0.1 0.4 0.2 0.7 < 0.1 0.7 0.1 0.1 0.3 0.3 UT-6.606 0.6 0.1 0.5 < 0.1 0.7 < 0.1 1.8 < 0.1 < 0.1 0.3 2.8 UT-6.696 5.4 4.4 < 0.1 0.3 0.9 0.5 0.4 0.3 0.3 7.8 2.0 UT-6.801 < 0.1 < 0.1 < 0.1 0.8 2.4 < 0.1 1.6 < 0.1 < 0.1 2.8 12 UT-6.844 < 0.1 < 0.1 < 0.1 < 0.1 0.3 < 0.1 0.8 < 0.1 < 0.1 0.3 0.8
Drinking water 42 17 3.1 14 30 11 50 3.4 2.7 42 37 reservoir return flow
81
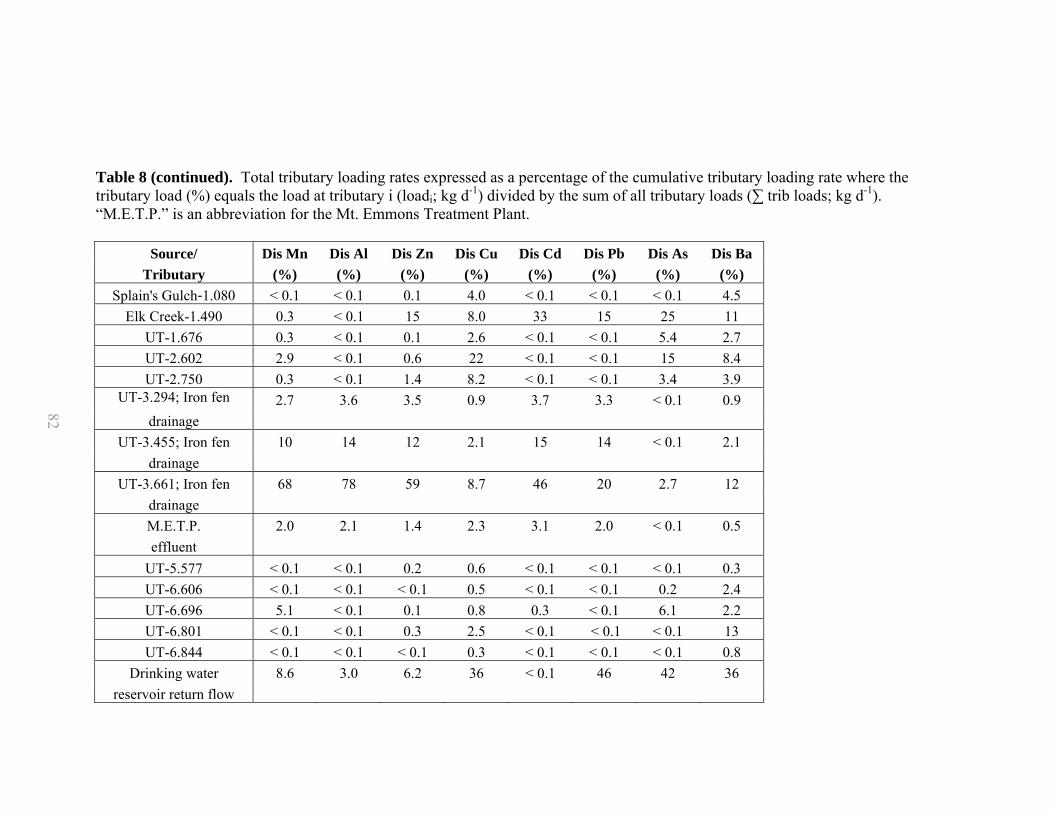
82
Table 8 (continued). Total tributary loading rates expressed as a percentage of the cumulative tributary loading rate where the tributary load (%) equals the load at tributary i (loadi; kg d-1) divided by the sum of all tributary loads (∑ trib loads; kg d-1). “M.E.T.P.” is an abbreviation for the Mt. Emmons Treatment Plant.
Source/ Dis Mn Dis Al Dis Zn Dis Cu Dis Cd Dis Pb Dis As Dis Ba Tributary (%) (%) (%) (%) (%) (%) (%) (%)
Splain's Gulch-1.080 < 0.1 < 0.1 0.1 4.0 < 0.1 < 0.1 < 0.1 4.5 Elk Creek-1.490 0.3 < 0.1 15 8.0 33 15 25 11
UT-1.676 0.3 < 0.1 0.1 2.6 < 0.1 < 0.1 5.4 2.7 UT-2.602 2.9 < 0.1 0.6 22 < 0.1 < 0.1 15 8.4 UT-2.750 0.3 < 0.1 1.4 8.2 < 0.1 < 0.1 3.4 3.9
UT-3.294; Iron fen 2.7 3.6 3.5 0.9 3.7 3.3 < 0.1 0.9 drainage
UT-3.455; Iron fen 10 14 12 2.1 15 14 < 0.1 2.1 drainage
UT-3.661; Iron fen 68 78 59 8.7 46 20 2.7 12 drainage M.E.T.P. 2.0 2.1 1.4 2.3 3.1 2.0 < 0.1 0.5 effluent
UT-5.577 < 0.1 < 0.1 0.2 0.6 < 0.1 < 0.1 < 0.1 0.3 UT-6.606 < 0.1 < 0.1 < 0.1 0.5 < 0.1 < 0.1 0.2 2.4 UT-6.696 5.1 < 0.1 0.1 0.8 0.3 < 0.1 6.1 2.2 UT-6.801 < 0.1 < 0.1 0.3 2.5 < 0.1 < 0.1 < 0.1 13 UT-6.844 < 0.1 < 0.1 < 0.1 0.3 < 0.1 < 0.1 < 0.1 0.8
Drinking water 8.6 3.0 6.2 36 < 0.1 46 42 36 reservoir return flow
82
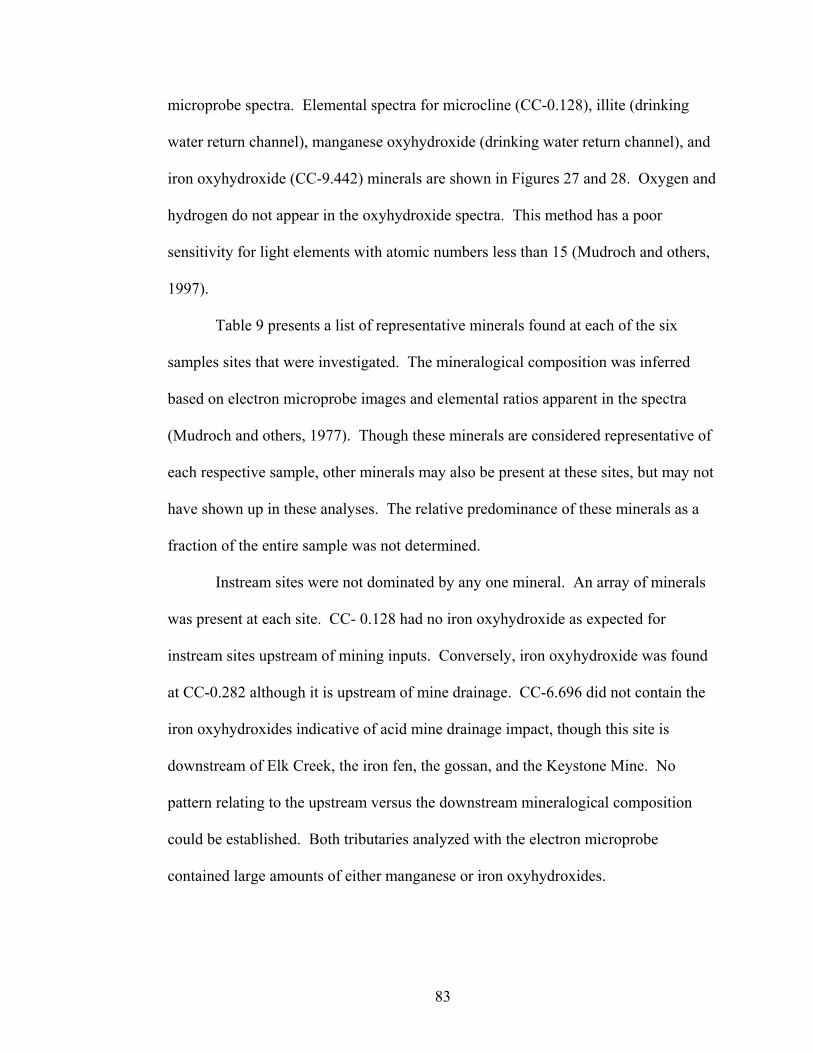
83
microprobe spectra. Elemental spectra for microcline (CC-0.128), illite (drinking
water return channel), manganese oxyhydroxide (drinking water return channel), and
iron oxyhydroxide (CC-9.442) minerals are shown in Figures 27 and 28. Oxygen and
hydrogen do not appear in the oxyhydroxide spectra. This method has a poor
sensitivity for light elements with atomic numbers less than 15 (Mudroch and others,
1997).
Table 9 presents a list of representative minerals found at each of the six
samples sites that were investigated. The mineralogical composition was inferred
based on electron microprobe images and elemental ratios apparent in the spectra
(Mudroch and others, 1977). Though these minerals are considered representative of
each respective sample, other minerals may also be present at these sites, but may not
have shown up in these analyses. The relative predominance of these minerals as a
fraction of the entire sample was not determined.
Instream sites were not dominated by any one mineral. An array of minerals
was present at each site. CC- 0.128 had no iron oxyhydroxide as expected for
instream sites upstream of mining inputs. Conversely, iron oxyhydroxide was found
at CC-0.282 although it is upstream of mine drainage. CC-6.696 did not contain the
iron oxyhydroxides indicative of acid mine drainage impact, though this site is
downstream of Elk Creek, the iron fen, the gossan, and the Keystone Mine. No
pattern relating to the upstream versus the downstream mineralogical composition
could be established. Both tributaries analyzed with the electron microprobe
contained large amounts of either manganese or iron oxyhydroxides.
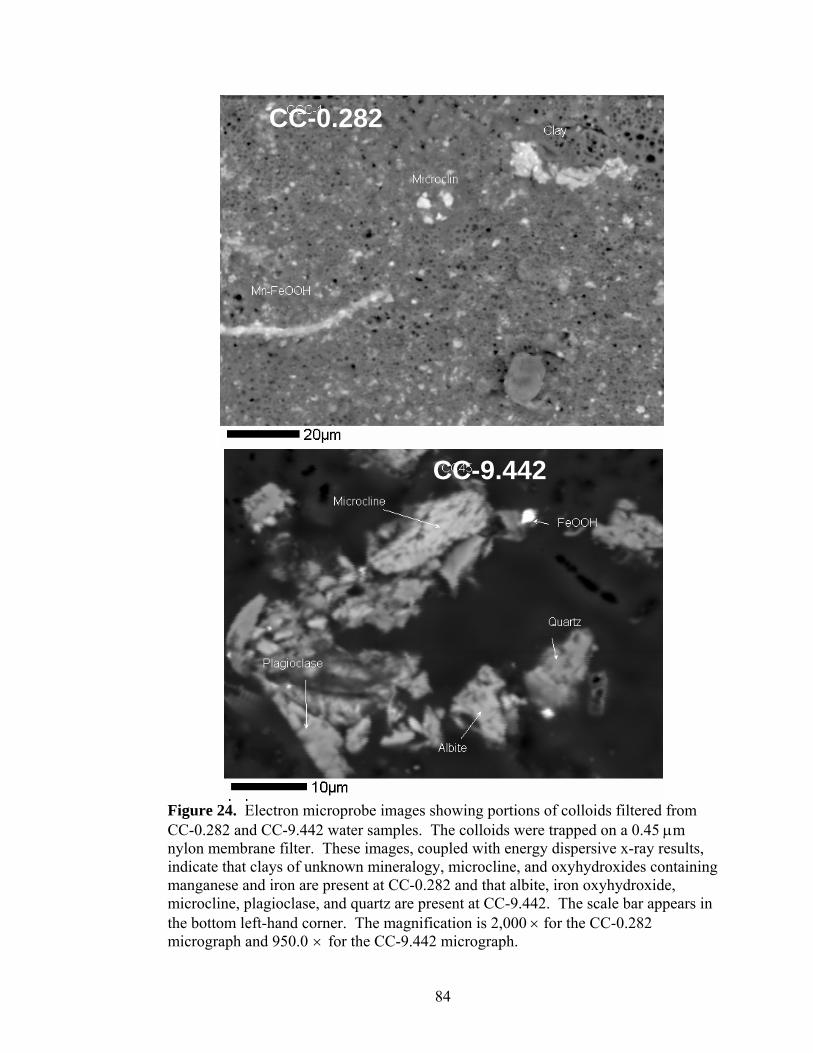
84
Figure 24. Electron microprobe images showing portions of colloids filtered from CC-0.282 and CC-9.442 water samples. The colloids were trapped on a 0.45 μm nylon membrane filter. These images, coupled with energy dispersive x-ray results, indicate that clays of unknown mineralogy, microcline, and oxyhydroxides containing manganese and iron are present at CC-0.282 and that albite, iron oxyhydroxide, microcline, plagioclase, and quartz are present at CC-9.442. The scale bar appears in the bottom left-hand corner. The magnification is 2,000 × for the CC-0.282 micrograph and 950.0 × for the CC-9.442 micrograph.
CC-0.282
CC-45 CC-9.442

85
Figure 25. Electron microprobe images showing portions of colloids filtered from the drinking water reservoir return flow. The minerals identified in these images include clays of unknown mineralogy, manganese oxyhydroxide, microcline, and quartz. The scale appears in the bottom left-hand corner. The magnification is 575.0 × in the top micrograph and 733.3 × in the bottom micrograph.
Drinking water return tributary-8.090 km
UT-8.090 Drinking water return tributary-8.090 km
86
Figure 26. Electron microprobe images showing portions of colloids filtered from the UT-6.696 water sample. The mineral identified in this image is iron oxyhydroxide. The scale appears in the bottom left-hand corner. The magnification is 1,100 × .
UT-6.696 UT-6.696
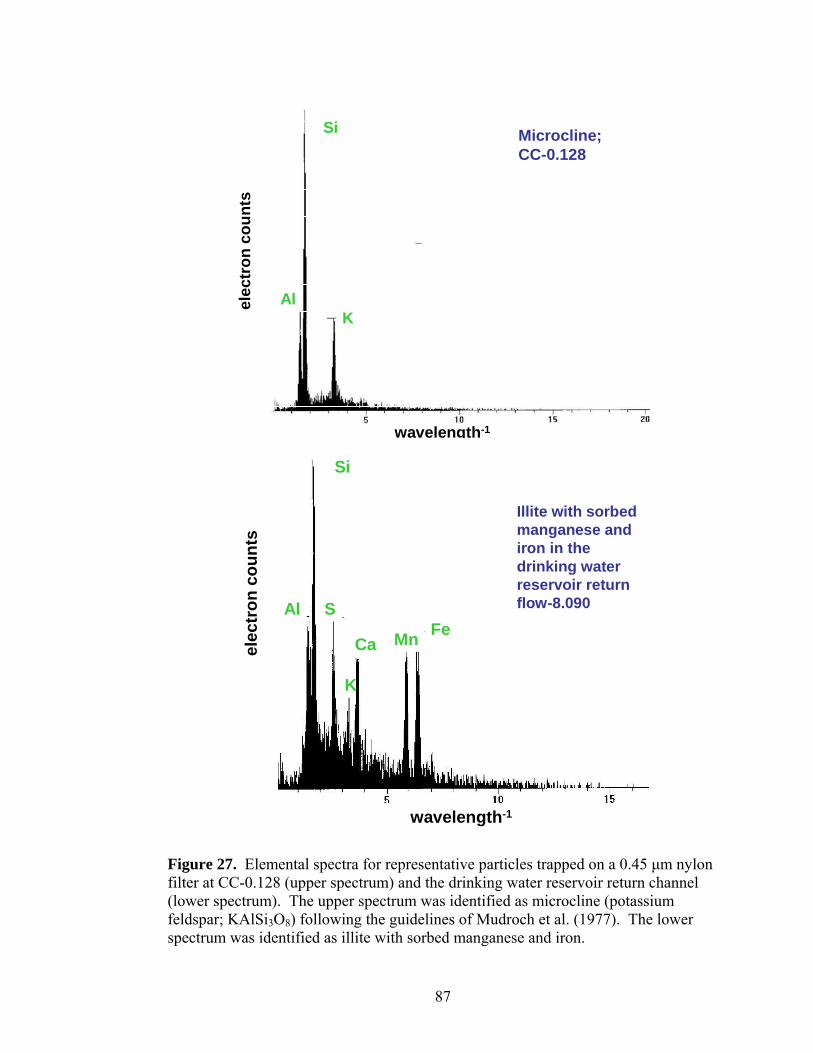
87
Si
KAl
Microcline; CC-0.128
aelec
tron
cou
nts
wavelength-1
Fe
Si
Mn
Al
Ca
K
S
Illite with sorbedmanganese and iron in the drinking water reservoir return flow-8.090
wavelength-1
elec
tron
cou
nts
Figure 27. Elemental spectra for representative particles trapped on a 0.45 μm nylon filter at CC-0.128 (upper spectrum) and the drinking water reservoir return channel (lower spectrum). The upper spectrum was identified as microcline (potassium feldspar; KAlSi3O8) following the guidelines of Mudroch et al. (1977). The lower spectrum was identified as illite with sorbed manganese and iron.

88
Fe
Iron Oxyhydroxide; CC-9.442
elec
tron
cou
nts
wavelength-1
Manganese Oxyhydroxide; drinking water reservoir return flow-8.090
Mn
elec
tron
cou
nts
wavelength-1
Figure 28. Elemental spectra for representative particles trapped on a 0.45 μm nylon filter at CC-9.442 (upper spectrum) and the drinking water reservoir return (lower spectrum). The upper spectrum is an iron oxyhydroxide. The lower spectrum is a manganese oxyhydroxide of unknown composition. These colloids were designated as “MnOOH” in the electron microprobe images, but it is not known that MnOOH is the actual composition of the manganese-rich colloids.

89
Table 9. Summary of scanning electron microprobe findings for mineralogical composition of colloids collected on 0.45-µm filters; mineralogy was inferred based on particle morphology and elemental spectra.
Sample Site Minerals Identified CC-0.128 Microcline, Pyroxene CC-0.282 Albite, Calcite, Iron Oxyhydroxide, Iron-Manganese Oxyhydroxide,
Magnesium Silicate, Microcline, Plagioclase CC-6.556 Albite, Microcline, Pyroxene, Quartz CC-9.442 Albite, Calcite, Iron Oxyhydroxide, Microcline, Plagioclase, Quartz
Drinking water reservoir return
Manganese Oxyhydroxide, Albite, Clay, Iron Oxyhydroxide, Microcline, Pryoxene, Sphene, Quartz
UT-6.696 Iron Oxyhydroxide, Calcite, Pyroxene, Quartz
90
CHAPTER 5
DISCUSSION
5.1 Suitability of lithium and chloride as tracers
An appropriate tracer must have several characteristics to qualify it for use in
a tracer injection study. The tracer must be (1) conservative, or nonreactive and not
prone to sorb to solid material, (2) insensitive to variations in pH and metal chemistry
that occur naturally within the study reach, (3) at concentrations several times greater
than background concentrations, (4) cost-effective, and (5) it must not pose a risk to
human health or aquatic life (Kimball, personal communication, August, 2005;
Bencala and others, 1986, Bencala and others, 1990).
Flow rates calculated using lithium dilution were gross overestimates with
values as excessively high as 2,500 L s-1 (Figure 11). This flow rate is approximately
80 times greater than the flow rate estimated by Glazer (personal communication,
September 1, 2005) just prior to the tracer study and inconsistent with historical flow
records as well as with the substantial volume of flow diverted from Coal Creek. We
must therefore conclude that lithium did not behave conservatively in Coal Creek.
Lithium dilution data was not useful in correctly estimating Coal Creek flows.
Though lithium chloride was an effective tracer in Lefthand Creek (Wood and others,
2004), previous tracer studies in the Redwell Basin, a watershed adjacent to the Coal
Creek watershed, show that lithium does not behave conservatively at pH greater than
6 (Kimball, personal communication, November, 16, 2005). Even a moderately

91
sorptive tracer may not be suitable for use in a shallow, slow-moving mountain
stream like Coal Creek.
Shallow streams allow more contact between sorbing solutes in the water
column and the streambed (Bencala, 1990). With an average pH of 7.38, moderate
TOC concentrations, and shallow depths, it is likely that lithium did bind to organic
matter in the water column and the hyporheic zone. The preponderance of a large
wetland between CC-2.072 and CC-2.734 and smaller wetland areas interspersed
between CC-3.165 and CC-3.455 perhaps had an even greater effect on lithium
sorption than the shallow stream depth. The flow rate doubles from CC-2.072 at the
upstream end of the wetland to CC-2.734 at the downstream end (Figure 11).
Significant transient storage means a longer solute residence time through the wetland
reaches. Longer residence times in zones with an abundance of sediment surfaces
(wetlands) provide greater opportunity for reactions otherwise limited by availability
of reactive surfaces or kinetic restraints (Broshears and others, 1993). The tracer
dilution equation breaks down when processes other than dilution affect a decrease in
tracer concentration.
Lithium was originally thought to be a suitable tracer because background
lithium concentrations were quite low in natural waters (Kimball and others, 2002).
A lithium salt tracer injection easily raises stream lithium concentration by at least an
order of magnitude in streams with low background lithium concentrations. This
fulfills the requirement that instream tracer concentration be substantially higher than
inflow tracer concentration. The difference between instream and inflow tracer

92
concentration must be greater than the analytical uncertainty associated with the
concentration data (Bencala, 1987).
Lithium chloride is among the more expensive tracers, however, the cost was
not inhibitory as only 67 kg was required to raise concentrations to adequate levels
during low flow. Furthermore, aquatic ecosystems are not negatively impacted by the
introduction of lithium chloride at the concentrations used for this study.
Previous studies show that chloride behaves conservatively as only physical
processes such as dilution, dispersion, and transient storage influence the attenuation
of chloride concentration. Biogeochemical reactions have minimal impact on
chloride attenuation (Bencala, 1985; Bencala and others, 1986; Bencala and others,
1987; Bencala and others, 1990). Chloride is commonly referred to as the “universal
tracer” because of its conservative behavior; however, it is also more likely to be
present in moderate concentrations in natural waters (Bencala, 1990). Atmospheric
deposition and weathering are sources of chloride in natural systems (Kimball and
others, 2002).
5.2 Steady-state conditions
The tracer dilution method is dependent upon a steady-state instream tracer
concentration. Because the tracer injection flow rate fluctuated slightly and a tracer
arrival curve at the most downstream site, CC-9.442, was not available, we cannot
prove that the system was at steady-state. However, velocity estimates and available
chloride concentration data for CC-9.442 support the arrival of the tracer at CC-9.442
and the establishment of steady-state instream conditions.

93
The average velocity along the first 1.3 km of the study reach was
0.221 km h-1 (Table 4 and Figure 10). If this velocity remained steady for the length
of the study reach, then a LiCl injection period of 43 h would be required for the
tracer to reach CC-9.442. This was a conservative estimate because the velocity was
observed to increase as flow rate increased with downstream distance (with the
exception of flow through the wetlands). The tracer was injected for 50.5 h, 7.5 h
longer than required, to ensure that the tracer reached the CC-9.442 at the
downstream end of the study reach.
Velocity estimates were also made based on the distance traveled by the
calcium-laden effluent entering Coal Creek from the Mt. Emmons Treatment Plant.
The treatment plant discontinued daily discharge at 16:00. Calcium concentrations
are maximum at CC-6.319, CC-6.556, and CC-6.707, indicating the location of the
trailing edge of the effluent “plug” in Coal Creek (Figure 9). These sites were
sampled at 18:30, 17:50, and 18:12, respectively. Stream velocity between the
treatment plant and these sites was calculated as the distance between the treatment
plant and the site divided by the sample time minus 16:00. The average velocity
along this reach was 0.528 km h-1. This velocity is greater than that calculated for the
first 1.3 km of the study reach, indicating that the observation that stream velocity
increases with downstream distance was valid.
In Coal Creek, the background chloride concentration is 2.4 mg L-1 (Figure
12). This background chloride concentration limited the analytical resolution of Coal
Creek concentration data. The instream chloride concentration dropped to within
1 mg L-1 of the background chloride concentration by CC-5.693 and to within
94
0.5 mg L-1 of background concentrations at the most downstream site, CC-9.442
(Table 10). Several tributaries also contained chloride concentrations similar to
instream chloride concentrations. The coefficient of variance (CV; %) for chloride
concentrations resulting from ion chromatograph (IC) analysis as defined by the
equation
2( )
1
i avgx xCV
N
−=
−
∑ (3)
where xi is the chloride concentration of each sample in the data set, xavg is the mean
chloride concentration of the data set, and N is the number of data points was
calculated for ten sets of duplicate IC measurements. The average CV was 5.25 %.
Because the instream chloride concentration was within 5.25 % of the background
concentration at several sites downstream of CC-5.951, analytical uncertainty is
expected to influence calculated flow rates at some sites in this reach. However,
Table 10 shows that the average chloride concentration at CC-9.442 stabilized at
400 mg L-1 greater than the background chloride concentration. This margin of
difference is greater than any differences caused by variance and shows that the
chloride tracer reached the downstream end of the study reach.
5.3 Hardness
Hardness behaves similarly to calcium and reflects the dependence of
hardness on calcium concentration. The sharp spike in calcium concentration
downstream of the Mt. Emmons Treatment Plant effluent produces a similar sharp
spike in hardness. The Mt. Emmons Treatment Plant adds lime during the treatment
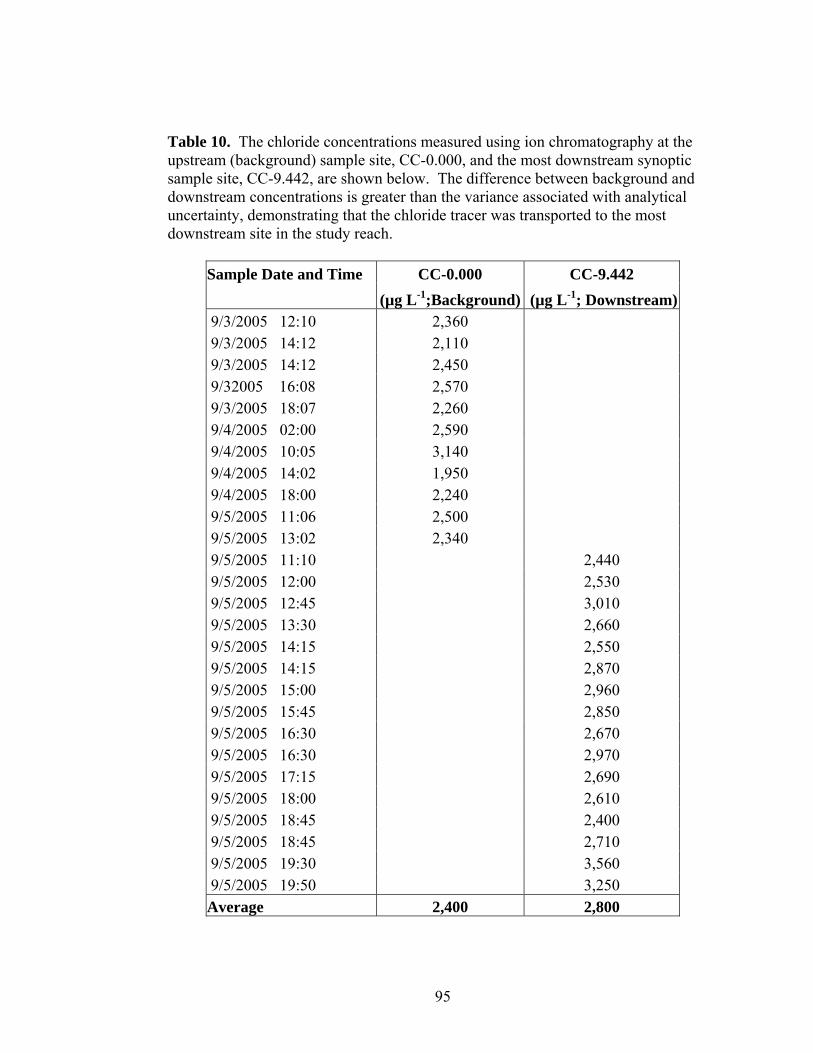
95
Table 10. The chloride concentrations measured using ion chromatography at the upstream (background) sample site, CC-0.000, and the most downstream synoptic sample site, CC-9.442, are shown below. The difference between background and downstream concentrations is greater than the variance associated with analytical uncertainty, demonstrating that the chloride tracer was transported to the most downstream site in the study reach.
Sample Date and Time CC-0.000 CC-9.442 (µg L-1;Background) (µg L-1; Downstream) 9/3/2005 12:10 2,360 9/3/2005 14:12 2,110 9/3/2005 14:12 2,450 9/32005 16:08 2,570 9/3/2005 18:07 2,260 9/4/2005 02:00 2,590 9/4/2005 10:05 3,140 9/4/2005 14:02 1,950 9/4/2005 18:00 2,240 9/5/2005 11:06 2,500 9/5/2005 13:02 2,340 9/5/2005 11:10 2,440 9/5/2005 12:00 2,530 9/5/2005 12:45 3,010 9/5/2005 13:30 2,660 9/5/2005 14:15 2,550 9/5/2005 14:15 2,870 9/5/2005 15:00 2,960 9/5/2005 15:45 2,850 9/5/2005 16:30 2,670 9/5/2005 16:30 2,970 9/5/2005 17:15 2,690 9/5/2005 18:00 2,610 9/5/2005 18:45 2,400 9/5/2005 18:45 2,710 9/5/2005 19:30 3,560 9/5/2005 19:50 3,250 Average 2,400 2,800
96
process to achieve a pH above 10 (Perusek, personal communication, July 15, 2005).
The pH is increased to precipitate and remove cadmium and manganese in the plant’s
flotation process. The calcium used during the treatment process enters Coal Creek
when the effluent is released.
The sites with high calcium and hardness concentrations graphically depict the
downstream movement of the treatment plant effluent “plug” (Figure 9). The
treatment plant discontinues effluent release by 16:00 each day. The release is not
steady; it varies from 0.00 to 78.9 L s-1 over each day (Perusek, personal
communication, July 15, 2005). All synoptic samples from CC-5.693 – CC-9.442
were taken between 17:42 and 19:45 on September 5, 2005. Calcium and hardness
concentrations peak at CC-6.556, approximately 1.2 km downstream of the treatment
plant-5.405. This lag distance between the treatment plant and the peak represents
the distance traveled by the effluent “plug” between 16:00, when the treatment plant
discontinued discharge of the effluent, and 17:50, when CC-6.556 was sampled. The
sharp drop in calcium concentration and hardness between CC-6.707 and CC-6.923
may represent a change in the treatment plant effluent discharge rate, but detailed
records of the effluent discharge rate were not available. The decline in calcium
concentration and hardness between CC-8.085 and CC-8.474 is a result of dilution
from the drinking water reservoir return flow.
Large diel fluctuations in calcium concentration and hardness in Coal Creek
are expected. When the treatment plant is discharging effluent, downstream calcium
concentration will be approximately 12 times greater than upstream calcium
concentration at low flow conditions. Consequently, hardness and hardness-based
97
aquatic life toxicity standards will also show diel fluctuations. Hardness-based acute
and chronic toxicity standards are not to be exceeded more than once every three
years on average and should be computed using the lowest daily calcium and
magnesium concentrations (CDPHE, 2005). When hardness drops, toxic metal
uptake by aquatic organisms increases because less calcium and magnesium is
present to compete with the toxic metals for binding sites on gills and in the digestive
tract. For comparison purposes, hardness-based standards upstream of Mt. Emmons
discharge can be extrapolated to sites downstream to represent conditions when
elevated calcium is not present in Coal Creek.
5.4 Aquatic life and drinking water supply standard exceedances
Metal concentrations in Coal Creek exceeded CDPHE acute and chronic
standards for aquatic life and drinking water supply standards at several sample sites
along the study reach (Table 11). Cadmium, chromium, nickel, and zinc exceeded
the chronic toxicity standard. Cadmium, chromium, and zinc exceeded the acute
toxicity standard. Arsenic exceeded the drinking water supply and fish ingestion
standard for along the initial 1.2 km of the study reach. Chromium, iron, and
manganese also exceeded the drinking water standard at several sample sites.
As described in section 5.3, the calcium input from the Mt. Emmons
Treatment Plant produced instream increases in the hardness-based aquatic life
standards when the plant was discharging. When the plant discontinues discharge,
the calcium concentrations in Coal Creek are expected to decrease, producing
subsequent decreases in the hardness-based aquatic life standards. Some metals with
98
Table 11. Coal Creek sample sites where the chronic and acute aquatic life toxicity standards and the drinking water supply standard were exceeded.
Chronic Standard Acute Standard Drinking Water
Supply Metal Exceeded Exceeded Standard Exceeded
Aluminum None None -- Arsenic None None CC-0.000 - CC-1.057 Barium -- -- None
Cadmium CC-1.613-2.378, CC-5.951 - CC-7.1211 None CC-2.734-2.978 CC-3.314-5.693, CC-5.951-6.133, CC-6.707-7.121, , CC-7.713-8.085 CC-5.790, CC-6.319-6.556, CC-7.365-7.499, CC-8.474-9.442
Chromium CC-0.000, CC-0.000, CC-0.664, CC-3.165 CC-0.489-0.664, CC-0.489-0.664, CC-1.255, CC-1.255, CC-3.165, CC-3.506, CC-3.165, CC-3.506, CC-3.931-4.214, CC-3.931-4.214, CC-4.985-5.790, CC-4.985-5.790, CC-8.085-8.474, CC-8.085, CC-9.030 CC-9.030-9.442
Copper None None None Iron -- None CC-0.282-0.489,
CC-2.588, CC-3.165-3.314 CC-3.931-4.214, CC-6.133
Lead None None None Manganese None None CC-2.378-2.734,
CC-3.165-3.506, CC-4.388, CC-6.133-6.319
Nickel CC-3.165 None None Zinc CC-1.613-2.378, CC-1.613-2.072, None
CC-3.506, CC-3.506, CC-4.388-5.372, CC-4.388-5.372 CC-5.693-8.085 CC-5.693-8.085
1 Bold indicates sites where diel decreases in calcium concentrations corresponding to times when the treatment plant is not discharging could decrease aquatic life standards enough to cause exceedances. -- Standard does not exist

99
concentrations below aquatic life standards when the plant is discharging are likely to
exceed standards when the plant is not discharging. To predict when this occurred,
the hardness-based standards upstream of the treatment plant were assumed to extend
downstream. The metal concentrations added to Coal Creek when the plant was
discharging and when it was not were also considered. Bold sample sites in Table 11
designate that aquatic life standards were not exceeded during treatment plant
discharge, but are predicted to be exceeded when the plant is not discharging.
Because the treatment plant was not discharging at the time of synoptic
sampling on September 5, the site was sampled a second time on the morning of
September 6, 2005, when effluent was being released. Flow during the synoptic
sampling was only 1.61 L s-1. The exact flow rate on September 6 is unknown.
Metals in the synoptic sample taken on September 5 are attributable to residual
treatment plant flow.
Relatively high concentrations of aluminum, cadmium, copper, iron,
manganese, and zinc were present in the Mt. Emmons Treatment Plant effluent
channel-5.405 on one or both of the sample days (Table 12). Aluminum, cadmium,
copper, manganese, and zinc had lower concentrations on September 6, presumably
as a result of dilution from the treatment plant effluent. Total aluminum
concentration was 10 % lower and dissolved aluminum was 33 % lower on
September 6. Total cadmium, copper, manganese, and zinc concentrations decreased
by 62 %, 21 %, 63 %, and 79 %, respectively. The iron concentration increased from
undetectable concentrations on September 5 to 136 µg L-1 total iron on September 6.
Aluminum, cadmium, copper, and zinc inputs raised Coal Creek loading rates for
100
these metals downstream of the treatment plant-5.405, despite a decrease in flow due
to the drinking water intake diversion (Figure 29). The spatial distribution of the
elevated instream calcium and aluminum, cadmium, copper, and zinc concentrations
corresponds to the transport of treatment plant effluent along Coal Creek. For
example, aluminum peaks approximately 1 km downstream of the treatment plant,
with elevated aluminum concentrations 0.25 – 2.1 km downstream (Figure 15 and
29).
Table 12. Total and dissolved aluminum, copper, iron, manganese, and zinc concentrations in the Mt. Emmons Treatment Plant effluent channel-5.405 during synoptic sampling on September 5 (after discharge from the plant ceased) and during discharge on September 6. BDL is an abbreviation for “below detection limit”.
treatment plant-
5.405, treatment plant-
5.405, change after discharge during discharge (%) Al, µg L-1
Total 1130 1020 10 Dissolved 1080 728 33 Cd, µg L-1
Total 3.4 1.3 62 Dissolved 3.4 1.5 56 Cu, µg L-1
Total 8.6 6.8 21 Dissolved 8 7.2 10 Fe, µg L-1
Total BDL 136 Dissolved BDL --
Mn, µg L-1 Total 318 117 63
Dissolved -- 120 Zn, µg L-1
Total 562 120 79 Dissolved 567 93.2 84
-- Valid concentration not obtained
101
distance (km)4 5 6 7 8
load
ing
rate
(kg
d-1)
0.001
0.01
0.1
1
100
1000CalciumAluminumCadmiumCopperIronManganeseZinc
4.21
4
4.59
9
4.98
5
5.37
2D
W in
take
5.40
55.
577
5.95
1
6.31
9
6.55
66.
606
6.69
66.
844
7.12
1
7.49
9
7.89
5
Figure 29. The loading rates for calcium along with aluminum, cadmium, copper, iron, manganese, and zinc are graphed for the 4-8 km section of the study reach to illustrate the impact of the Mt. Emmons Treatment Plant-5.405 on Coal Creek metal loading rates. “DW intake” is an abbreviation for the drinking water intake.
101

102
5.5 Stream Flow
The U.S. Geological Survey maintained a stream gauge on Coal Creek just
downstream of the Elk Creek confluence from 1941 to 1946. The location of the
gauge was equivalent to the location of CC-1.862 used in this study. The USGS
measured an average September flow rate of 58.2 L s-1 and an average September 5
flow rate of 66.8 L s-1 during those years. The flow rate at CC-1.862 calculated using
the chloride dilution data was 50.5 L s-1 on September 5, 2005. Possible climactic
changes since the 1940s, the relatively short time span over which USGS measured
flow rate, and the time gap between USGS data and the data pertaining to this study
do not allow for a direct comparison. However, USGS flows are within 17 L s-1 of
the flow rates calculated using chloride dilution. This establishes confidence that
tracer dilution flow rates are reasonable and representative of true flow, at least for
the upstream end of the study reach through CC-1.862.
Also, diversion flow rates were known, with the greatest flow of 79 L s-1
removed by the drinking water intake at 5.405 km. The Coal Creek flow rate was
only 1.4 times greater than drinking water diversion flow rate as calculated using
chloride dilution, but 8.9 times greater when calculated using lithium dilution
(Figures 11 and 12). Visually estimated flows were much closer to the chloride-
calculated flow rates.
Without stream gauge measurements for the day of the tracer study, exact
hyporheic flow cannot be determined. Previous studies indicate that up to 25 % of
stream discharge may occur as underflow through the hyporheic zone in mountainous
gravel-bed streams (Zellweger and others, 1989). Previous studies also show that the

103
area of the hyporheic zone may increase by a factor of 2 through wetland reaches like
those in Coal Creek (Wong, personal communication, July 12, 2006).
Three diversions of flow from Coal Creek and one flow return affected the
flow rate during low flow conditions. The Crested Butte drinking water intake is the
most upstream flow diversion. The large flow reduction between CC-5.372 and
CC-5.693 illustrates the significant impact the drinking water intake effects on Coal
Creek (Figure 12). The intake removed 79 L s-1, 71 % of the Coal Creek flow rate
just upstream of the intake. The Spann Nettick agricultural diversion between
CC-7.895 and CC-8.085 removed 28 L s-1 from Coal Creek. The drinking water
return flow reenters Coal Creek at fluctuating rates between CC-8.085 and CC-8.474
and offset flow losses to the Halazon agricultural diversion during the tracer test.
There was a net flow increase between CC-8.085 and CC-8.474. Tracer dilution
equations do not account for flow losses to diversions. Manual adjustments as
described in section 4.7 were required in order to account for these losses. The tracer
dilution equation (Table 3, Equation 5) is a mass balance equation which assumes a
decrease in instream tracer concentration resulting from surface or dispersed
groundwater inflows. Because no decrease in tracer concentration results when flow
is removed from a stream, this equation cannot be used in reverse to calculate
diversion flow rates.
The accuracy of this estimated flow rate of the drinking water reservoir return
was supported with a secondary flow rate calculation for the drinking water reservoir.
Because the Mt. Emmons treatment plant created a spike in downstream calcium
concentrations, it was found that calcium could be viewed as a conservative tracer at

104
the two sites bracketing the drinking water reservoir. When the standard tracer
dilution equation was applied using calcium as the tracer, a flow rate of 61.52 L s-1
was obtained. This is only a 2.5 percent difference from the estimated flow rate,
confirming that the flow rate used to calculate metal loading rates for the drinking
water reservoir return was an accurate estimate. Precise measurements of flow at this
site are recommended in order to obtain exact loading rates.
5.6 Sources of metals and arsenic in the Coal Creek watershed
All of the sampled tributaries as well as dispersed groundwater flow may
serve as contributors of toxic metal concentrations and loading rates to Coal Creek.
The following discussion will address the sources of each of the ten metals and
arsenic analyzed for this study.
Tributaries entering Coal Creek from culverts paralleling County Highway 12
on the north side were sampled directly out of the pipes immediately south of the
highway (Figure 6). A more appropriate sampling location would have been
immediately upstream from the tributaries entry point into Coal Creek. Some error
may be associated with differences in metal concentrations just south of the highway
and just upstream of Coal Creek.
The following metal sources are only representative of the sources of metals
under low flow conditions. It is expected that high flow conditions will effectively
dilute metal concentrations. This dilution will result in fewer aquatic life and
drinking water standard exceedances. However, we must also consider that higher
flows will increase flow rates from mine adits as well as the iron fen and the gossan.
105
Such an increase may negate dilution effects as the effective metal concentration
would remain the same as the metal inputs increased along with overall flow rates. In
this instance, the metal loading rates would also greatly increase compared to low
flow loading rates.
Elk Creek was suspected of contributing elevated arsenic, barium, cadmium,
chromium, copper, lead, and zinc loading rates to Coal Creek (EPA, 2005b). The
iron fen was also suspected of contributing elevated metal concentrations to Coal
Creek, particularly for aluminum, iron, manganese, and zinc (EPA, 2005b). Drainage
from the iron fen enters Coal Creek from the north through UT-3.294, UT-3.455, and
UT-3.661. Though UT-3.294 contains the majority of the iron fen drainage, it also
received flow input from uncontaminated drainage from the north. UT-3.661 drains
directly from the gossan area where barren limonite, or a natural aggregate of hydrous
ferric oxide, is exposed at the ground surface.
Flow from the fen tributaries travels approximately 40 m downhill to Coal
Creek. Field reconnaissance in June, 2006, during high flow conditions showed that
the majority of the flow from these culverts is absorbed into the ground before
entering Coal Creek. Approximately 50 % of the flow from UT-3.294 and 100 % of
the flow from UT-3.455 and UT-3.661 reentered the groundwater system before
entering Coal Creek. During low flow conditions, it is likely that even a larger
percentage of the flow would be absorbed before entering Coal Creek. This may
allow for removal of some contaminants through transport through the subsurface.
When assessing the impact of loading rates from the drinking water reservoir return
flow, it was important to determine whether metal concentrations in this tributary
106
were similar to Coal Creek metal concentrations just upstream of the drinking water
intake at CC-5.372. The coefficient of variation (Equation 3) between metal
concentrations at these two sites was calculated and found to be significantly different
in the drinking water return flow as compared to that of Coal Creek at CC-5.372
(Table 13). The average coefficient of variation of all eleven metals was 42.6 %.
This high degree of variation makes it necessary to treat the drinking water return
flow as having its own chemical signature separate from that of Coal Creek at
CC-5.372. This flow must be exposed to additional manganese and iron sources as
the concentrations of these metals are higher in the drinking water return flow. The
other metals are either diluted or attenuated out of solution as concentrations are
lower in the drinking water return flow. It is also important to note that the flow rate
used in all metal loading calculations for the drinking water reservoir return was
estimated as the difference between the estimated rate of diversion at the drinking
water intake and the average monthly drinking water usage rate (Adams, personal
communication, May 26, 2006). Error associated with these estimates may affect
calculated loading rates from the drinking water reservoir return flow. Future
monitoring of metal concentrations and flow rates at this site are recommended to
confirm any metal sources arising from this tributary.
5.6a Iron sources The iron loading rate increases by a factor of 4.6 at the
downstream of end of UT-2.602. UT-2.602 contributed 23 % of the cumulative
tributary iron loading rate. The majority of aquatic life concentration exceedances for
iron occurred within 2.0 km downstream of UT-2.602 (Table 11). Clearly, UT-2.602
107
Table 13. The metal concentrations at CC-5.372, just upstream of the drinking water intake, and at the drinking water reservoir return flow tributary are compared. BDL is an abbreviation for “below detection limit” and N/A means a valid metal concentration was not available.
Drinking water reservoir CC-5.372 metal return flow metal Coefficient of concentration (µg L-1) concentration (µg L-1) variance (%)
Aluminum Dissolved 50.4 35.5 24.5
Total 63 40 31.6 Arsenic
Dissolved 3 1.2 60.6 Total 2.6 1.6 33.7
Barium Dissolved 22.4 21.1 4.2
Total 24.8 22.5 6.9 Cadmium
Dissolved 0.51 BDL -- Total 0.58 0.27 51.6
Chromium Dissolved N/A N/A
Total 38.3 2.4 124.7 Copper
Dissolved 1.8 3.2 39.6 Total 2.2 2.5 9.0
Iron Dissolved N/A N/A
Total 229 371 33.5 Lead
Dissolved BDL 0.2 -- Total BDL 0.78 --
Manganese Dissolved 30 27.4 6.4
Total 29.9 67.3 54.4 Nickel
Dissolved N/A N/A Total 19.8 1.7 119.1
Zinc Dissolved 114 40.1 67.8
Total 126 103 14.2 Average CV 42.6 -- The coefficient of variance could not be calculated because one or more data points was missing.

108
was a source of increased downstream iron loading rate, however, the Coal Creek
iron loading rate downstream of the tributary was greater than the loading rate input
by the tributary. Additional iron inputs may come from iron liberation downstream of
the wetlands, a lack of surfaces for iron sorption, or groundwater iron input. The
greatest iron loading rate of 42 % of the cumulative tributary input occurred at the
drinking water return tributary. However, the instream loading rate did not increase
immediately downstream. It did spike 0.6 km downstream of the drinking water
return flow, yet it is unclear whether this is related to inputs from the drinking water
reservoir or from an unidentified source.
Though the dissolved iron data were inconclusive (section 4.9), diel variations
of the dissolved iron concentrations may be occurring. Previous studies have found
that dissolved iron concentrations are greatest at midday as a result of the
photoreduction of dissolved ferric iron and iron oxyhydroxides (McKnight and
others, 1992; Tate and others, 1995). Photoreduction of these species produces an
increase in the dissolved ferrous iron concentrations with increasing solar radiation.
Despite possible diel fluctuations in dissolved iron concentration, it is
hypothesized that almost all of the iron in Coal Creek is in the colloidal phase. In
natural waters, iron precipitates to form iron hydroxide around pH 6.5. Coal Creek
pH average 7.3, indicating that iron is predominantly available in the colloidal phase.
5.6b Manganese sources UT-3.661 contributed 62 % of the cumulative
tributary manganese loading rate and 1.25 kg d-1. The Coal Creek metal loading rate
remains elevated and constant for more than 1.0 km downstream of this tributary
despite increasing flows and no other significant manganese sources. This may
109
signify the existence of dispersed groundwater manganese inputs in this reach. The
two highest manganese loading rates occurred in the wetland reach, indicating that
significant manganese inputs enter Coal Creek in this reach, perhaps through
dispersed groundwater flow.
5.6c Aluminum sources UT-3.661, containing drainage from the gossan, also
contributed the highest cumulative tributary aluminum loading rate of 76 % at
5.01 kg d-1. Because the iron fen tributary contributions do not substantially increase
aluminum loading in Coal Creek, we surmise that the metals are attenuated in the soil
and groundwater between the County Highway 12 and Coal Creek. Aluminum
concentrations never exceeded aquatic life standards (Table 10). Recall that a large
percentage of the drainage from the iron fen tributaries reentered the groundwater
system before entering Coal Creek. Flow rates increase downstream of the iron fen,
indicating that iron fen drainage does enter Coal Creek as dispersed groundwater
flow. However, tributary samples were taken from culverts immediately south of
Highway 12 and may not be representative water entering the stream. Transport
through the soil allows opportunity for metal removal through sorption. Aluminum is
readily adsorbed by oxides, clay minerals, and organic matter in the soils. Travel
through the soil and groundwater system provides adequate time and opportunity for
these metals to sorb to soil material and be effectively removed from the water
column before entering Coal Creek.
Though the loading rate for aluminum from the Mt. Emmons Treatment Plant
is minimal because only residual effluent flowed from the site during sampling (Table
8), the aluminum loading rate increases downstream of the site and mimics the shape

110
of the treatment plant effluent “plug”. The loading rate increases with downstream of
the plant following the same pattern, though less pronounced, as the calcium
concentration increases (Figure 27). This indicates that the treatment plant may
qualify as a minor or trace aluminum source when discharging.
5.6d Zinc sources UT-3.661 had the greatest zinc loading rates of 1.84 kg d-1
and 49 % of the cumulative tributary loading rate (Table 8). The Coal Creek zinc
loading rates showed only small increases downstream of the iron fen. Aquatic life
standards were exceeded downstream of UT-3.661.
Zinc contributed the greatest loading rate of 0.61 kg d-1of all metals input by
Elk Creek. Elk Creek input 16 % of the cumulative tributary zinc loading rate. Coal
Creek zinc loading increased by a factor of 120 downstream of Elk Creek. Zinc
concentrations exceeded the chronic toxicity standard downstream of Elk Creek.
5.6e Copper sources UT-2.602 added 20 % of the tributary cumulative total
copper loading rate (Table 8) and produced downstream increases in the Coal Creek
copper loading rate. UT-3.661 added 13 % of the cumulative tributary copper
loading rate and also affected downstream increases in the Coal Creek copper loading
rate. The drinking water reservoir return flow-8.090 added 30 % of the cumulative
copper loading rate. The copper concentration of the return flow was about the same
as that of Coal Creek (Table 12). The loading rate is the highest of all tributaries
because of the larger flow entering Coal Creek from the reservoir.
5.6f Cadmium sources Both Elk Creek and UT-3.661 (gossan drainage)
contributed high cadmium loading rates to Coal Creek. Elk Creek added 32 % of the
cumulative tributary total cadmium loading rate while UT-3.661 added 39 %.
111
Aquatic life standards were exceeded downstream of both Elk Creek and UT-3.661
(Table 10). UT-3.455 (iron fen drainage) contributed 12 % of the cumulative
tributary loading rate.
5.6g Lead sources The drinking water reservoir return flow contributed 50 %
of the cumulative lead loading rate. The lead concentration of the return flow was
approximately 3 times greater than typical instream lead concentrations. Splain’s
Gulch contributed 22 % of the cumulative tributary total iron loading rate. Splain’s
Gulch also had the highest iron concentration of any of the tributaries. Minor iron
sources were UT-3.661 and Elk Creek.
5.6h Nickel sources UT-2.602 contributed the highest cumulative tributary
nickel loading rate of 45 %. UT-2.750 and UT-3.661 (gossan drainage) contributed
significant cumulative tributary loading rates of 16 and 18 %, respectively. The
instream loading rate spikes just downstream of UT-2.602 and UT-2.750 and
concentrations exceed the chronic toxicity standard for aquatic life (Table 10).
Splain’s Gulch contributed 11 % of the cumulative tributary loading rate (Table 8).
5.6i Chromium sources The sources of chromium are very similar to the
sources of nickel. Similarly to nickel, UT-2.602 contributed the highest cumulative
tributary chromium loading rate of 48 %. UT-3.661, UT-2.750, and Splain’s Gulch
contributed loading rates of 19 %, 18 %, and 8.7 %, respectively. Water quality
standards are exceeded downstream of Splain’s Gulch, UT-2.602 and UT-2.750, and
the gossan drainage.
5.6j Arsenic sources Arsenic concentrations and loading rates differ from the
pattern of the other metals. The above mentioned metals tend to show increasing

112
concentrations and loading rates with downstream distance. Arsenic concentrations
decreased from the upstream to downstream reaches of Coal Creek, but the loading
rate increased up to the drinking water intake. This indicated that additional arsenic
sources enter Coal Creek. The increasing arsenic loading rate was not a result of
arsenic input from any of the sampled tributaries. It is possible that arsenic is
released from wetlands or groundwater during low flow. Downstream of the intake,
the loading rate decreases as a result of decreasing arsenic concentration and higher
flow rates. Of the identified tributaries, Elk Creek contributed 21 % of the
cumulative tributary loading rate. Though concentrations were no higher than
instream concentrations, the drinking water reservoir return flow contributed 42 % of
the cumulative tributary loading rate. UT-2.750 and UT-2.696 added 10 % and 7.8 %
of the loading rate, respectively.
5.6k Barium sources Barium input from UT-6.606, UT-6.696, UT-6.801, and
UT-6.844 most likely increases barium concentrations downstream of these
tributaries, however the flow from these sites was so low that loading rates were not
substantial. Of these four tributaries, UT-6.801 added the highest percentage of the
cumulative tributary loading rate with 12 %.
Increases in barium concentration and loading rates upstream of the iron fen
cannot be attributed to any of the sampled inflows. Instream barium concentration is
greater than the concentration of tributary input in this reach. Similarly to arsenic,
barium must enter Coal Creek through dispersed groundwater flow or an unidentified
tributary upstream of the study reach.

113
5.7 Implications of metal concentrations and metal loadings for remediation
The major metal sources for ten metals and arsenic under low flow conditions
have been identified (Table 14). The gossan drainage, UT-3.661, was a major source
of aluminum, cadmium, iron, manganese, and zinc in Coal Creek. UT-2.602 was a
major source of chromium, iron, and nickel. Elk Creek was a major source of
cadmium and zinc as well as a trace source of arsenic, barium, copper, and lead.
Remedial activities at the Standard Mine site including dewatering of the
surface impoundment, channelization of surface flow, and removal of mining debris
will begin in the summer of 2006 (EPA, 2005b). Repository construction and
removal of waste rock piles and tailings will take place in 2007. If the remediation is
a success, Coal Creek cadmium and zinc concentrations and loading rates
downstream of the Elk Creek confluence should significantly decrease and water
quality standards should not be exceeded. The clean-up should also remove any trace
amounts of arsenic, barium, copper, or lead entering Coal Creek through Elk Creek.
The Coal Creek wetland immediately downstream of the Elk Creek
confluence may be effectively removing metals from solution. The methods
employed in this study may underestimate the actual metal loading rates entering
Coal Creek if metals are quickly attenuated by plant, sediments, or microbes in the
wetland (Hernandez, 1995). It is likely that wetland sediments contain toxic metal
concentrations. Wetland remediation or dredging should be considered in addition to
the remedial activities planned for the Standard Mine.
Drainage from the iron fen and gossan creates the greatest number of water
quality criteria exceedances and concentration and metal loading rate increases. Coal

114
Table 14. Major, minor, and trace metal sources in the Coal Creek watershed. The major sources were defined as any source that caused water quality standards to be exceeded and/or contributed a cumulative tributary metal loading rate greater than or equal to 33 %. Minor sources were those that added 12-32 % of the cumulative tributary metal loading rate. Trace sources were those that added 5-11 %. Groundwater is abbreviated as “gw” and the drinking water reservoir return flow is designated as “DW res. Return”. For arsenic and barium, input from an unidentified upstream tributary or dispersed groundwater flow overshadowed contributions from any of the other tributaries. The tributaries with the highest cumulative loading rates were considered trace sources.
Metal Major sources Minor sources Trace sources Aluminum UT-3.661 (gossan)
Arsenic Unidentified upstream Elk Creek tributary/ gw DW res return UT-2.750 UT-6.696
Barium Unidentified upstream Elk Creek tributary/ gw DW res return UT-2.750 UT-6.801
Cadmium UT-3.661 (gossan) UT-3.455 (fen) DW res. Return Elk Creek
Chromium UT-2.602 UT-3.661 (gossan) Splain's Gulch UT-3.294
Copper UT-2.602 Elk Creek DW res. return UT-2.750 wetland/ gw Splain's Gulch
Iron UT-2.602 wetland/ gw UT-2.750 UT-3.661 (gossan) UT-6.696 DW res. return
Lead DW res. return Splain's Gulch UT-3.661 (gossan) Elk Creek
Manganese wetland/ gw DW res. return UT-3.455 (fen) UT-3.661 (gossan)
Nickel UT-2.602 UT-3.661 (gossan) Splain's Gulch UT-3.294
Zinc UT-3.661 (gossan) DW res. return UT-3.445 (fen) Elk Creek

115
Creek is impaired more severely by drainage from the fen and gossan than by
drainage from Elk Creek and the Standard Mine. Because the fen and gossan are
natural deposits (Figure 3) that support a diverse array of vegetation and wildlife
including the endangered Drosera rotundifolia, clean-up efforts may prove
controversial.
UT-2.602 was not identified as a major metal source prior to this study. This
tributary drains a portion of Evans Basin, which is located on the north side of Coal
Creek between Elk Creek and the Keystone Mine (Figure 2). Flow at UT-2.602 was
only 21.3 L s-1 during the tracer test. The high metal loading rates at this site are
predominantly a result of high metal concentrations. The source of these metals is
unclear and future reconnaissance and research of this site is recommended.
Return flow to Coal Creek from the drinking water reservoir contained
unexpectedly high percentages of the cumulative tributary loading rate for arsenic,
barium, copper, iron, lead, manganese, and zinc. Metal concentrations at this site
were generally not the highest tributary concentration; however, the flow rate as
calculated as the difference between the average drinking water intake rate and the
drinking water usage rate (60.01 L s-1) was the greatest of all the tributaries (Adams,
personal communication, May 26, 2006).
Also, iron and manganese inputs enter the water somewhere between the
intake-5.405 and the return-8.090 while the other metals are diluted along this route
(Table 13). It is recommended that the source of the additional iron and manganese
be located.
116
5.8 A review of colloids and metal association
Colloids are critical components in streams affected by acid mine drainage
(AMD) because their extensive surface areas strongly influence metal partitioning.
Colloids dictate the mobility and bioavailability of metals in the environment. The
fate of metals in AMD-affected streams is dependent upon interactions with colloid
surfaces through adsorption, complexation, nucleation or dissolution, and surface-
controlled redox chemistry as well as stream chemistry (Zanker and others, 2002;
Zanker and others, 2003; Sullivan and Drever, 2001; Macalady and others, 1990;
Macalady and others, 1991; Schemel and others, 2000; McKnight and others, 1992).
Iron oxyhydroxides are the dominant mineral in mine drainage, while
aluminosilicates and aluminosilicates with iron oxyhydroxysulfates may also be
present in smaller quantities. These colloids dominate because of the oxidation of
iron(II) and the subsequent hydrolysis of Fe3+ and Al3+ in acid mine drainage
solutions. As mine drainage is diluted by stream waters, a greater quantity of
aluminosilicates with associated iron and sulfur, manganese oxyhydroxides, and
quartz minerals comprise the colloidal fraction.
In Coal Creek, a diverse array of colloidal minerals were present (Figures 24
to 28; Table 9). No pattern related to the presence of iron oxyhydroxides upstream
and downstream of mine drainage could be established. Both tributaries analyzed
with the electron microprobe, though not mine drainage sites, were predominantly
composed of iron oxyhydroxides or manganese oxyhydroxides. Colloidal analyses
showed that while one or two minerals may be dominant in tributaries, the
mineralogy becomes more diverse upon entry to Coal Creek.
117
Iron colloids alone are not toxic, but their large surface area allows sorption of
other metals which may be toxic. They may also be detrimental to aquatic life by
filling permeable openings in the streambed that are normally habitat for benthic
invertebrates (Clements, 1994). Upon entry to neutral bulk waters downstream of
mines, such as Coal Creek, trace metals such as aluminum, arsenic, iron, lead, and
copper that were adsorbed to the colloids in more acidic reaches may be immobilized
due to colloid coagulation and natural attenuation (Galan and others, 2003; Zanker
and others, 2003; Sullivan and Drever, 2001; Schemel and others, 2000; McKnight
and others, 1992; Kimball and others, 1995). The chemical bonding of solutes to
surface atoms and the electrostatic interactions between metals and charged surfaces
are the main controls on adsorption. The extent of metal sorption into the colloidal
phase can also be dependent upon pH, ionic strength, hardness, dissolved organic
carbon concentration, and biological activity. For instance, the solubility of Al(OH3)
is strongly pH dependent. Aluminum is predicted to attenuate above a pH of 5,
coating the streambed with white precipitate. Such white precipitate was observed in
drainage from the gossan tributary to Coal Creek.
Colloids have a net negative charge in most natural waters as a result of
organic coatings. However, in streams affected by acid mine drainage, a plethora of
fresh iron oxyhydroxide surfaces are likely to be present. Dissolved organic carbon
(DOC) concentrations are also expected to be low, resulting in the possibility of
positively-charged colloidal surfaces. The capacity of a colloid to sorb metals may
be enhanced by modification of iron oxyhydroxide surfaces through sorption or
coprecipitation of anions. For example, cadmium sorption has been enhanced by

118
incorporation of silica on iron oxyhydroxide surfaces. Also, the sorption of DOC
may increase copper and aluminum oxide sorption onto iron oxyhydroxides
(Macalady and others 1991; McKnight and others, 1992).
5.9 Metal distribution between the dissolved and colloidal phase
For this study, water samples were filtered through 0.45 μm membranes
because of the field-portability, simplicity, and low-cost of this technique (EPA
convention). This conventional filtration method offers several distinct advantages in
that it removes suspended sediment and large organic matter than would settle during
transport and storage, it removes bacteria and microorganisms that could cause
biological transformations within the sample matrix, and it is the most widely used
filtration method which allows for easy comparison of results from different studies
(Morrison and Benoit, 2001; Danielsson, 1982). However, this method has also been
widely criticized. The filter size is operationally defined and may cause separation of
various particle size classes. Also, filtration artifacts such as contamination, colloid
and solute adsorption onto the membrane, and coagulation and clogging on the
membrane filter can produce significant errors in trace metal measurements. Where
iron is normally associated with the large-size colloidal fraction (>0.45 µm),
cadmium, manganese, and zinc are generally found in several different colloidal size
classes (Pham and Garnier, 1998; Kennedy and others, 1974). With respect to trace
metals found in various size classes, filtration through an arbitrarily chosen mesh size
such as 0.45 µm would allow some colloids to pass while others are retained. This
can significantly skew measurements of the particulate and colloidal fraction.

119
The observed distribution coefficient (Kdobs, L kg-1) describes metal
distribution between the dissolved and colloidal phase. Because precipitation and
adsorption are considered to be the most important processes affecting interphase
interactions, it is important to consider Kdobs when assessing the partitioning of metals
between the colloidal and dissolved phase. Kdobs is an imperical metric that is
dependent upon a diverse array of parameters which influence chemical and physical
attenuation (EPA, 1999). Kdobs is described by the equation
Kdobs
s
w
CC
= (4)
where Cs (mg kg-1) is the colloidal, Cw (mg L-1) is the dissolved metal concentration,
Cdiss is the dissolved (filtered) metal concentration and Ctot is the total (unfiltered)
metal concentration . Colloidal mass was not measured, so an alternative
computation was used to describe partitioning. The colloidal fraction (fcolloid) was
calculated using the equation
total dissolvedcolloid
total
C CfC−
= (5)
The colloidal fraction was calculated as an average over the length of the study reach
for the eleven metals included in the study (Figure 30). The standard error is
significant because the colloidal fraction varied significantly from site to site. Only
aluminum, arsenic, lead, and zinc had positive fcolloid values. Dissolved
concentrations exceeded total concentrations on average for the other seven metals. It
is expected that a large percentage of the colloids passed through the 0.45 micron
filters. This expectation was supported by the electron microprobe images (Figures
120
24 to 26) that show pore sizes in excess of 0.45 microns. This would produce
dissolved concentrations very close to total concentrations. Analytical error
associated with the closeness of total and dissolved concentrations resulted in
negative values (physically impossible) for the colloidal fraction for the remaining
seven metals. Other possible reasons for the discrepancy between total and dissolved
colloidal concentrations have been previously discussed in section 4.9.
Lead dominates the colloidal fraction with an fcolloid value of 0.83 (Figure 30).
Aluminum has an fcolloid value of 0.36, demonstrating the second highest capacity to
bind with minerals that make up the colloidal phase. Arsenic, and then zinc, are also
present in the colloidal phase to a lesser degree than both lead and aluminum.
Though dissolved iron concentrations were unavailable, it is expected that iron is
predominantly available in the colloidal phase and that its fcolloid value is higher than
that of lead.
The speciation behavior of these metals is dependent on pH. The neutral pH
of Coal Creek supports metal sorption to colloidal material (Smith and others, 1990).
Substantial colloidal fractions were anticipated. The fcolloid value for zinc and arsenic
were low at approximately 0.1. Recent studies show that zinc is initially sorbed more
strongly to organic matter and then to hydrous iron oxides (Kimball and others,
2002). This means that a significant portion of sorbed zinc may be contained in
organic biofilms coating the stream bottom or in iron hydroxides or oxyhydroxides
that settle from the water column. These zinc removal pathways may explain the low
occurrence of zinc in the colloidal phase.
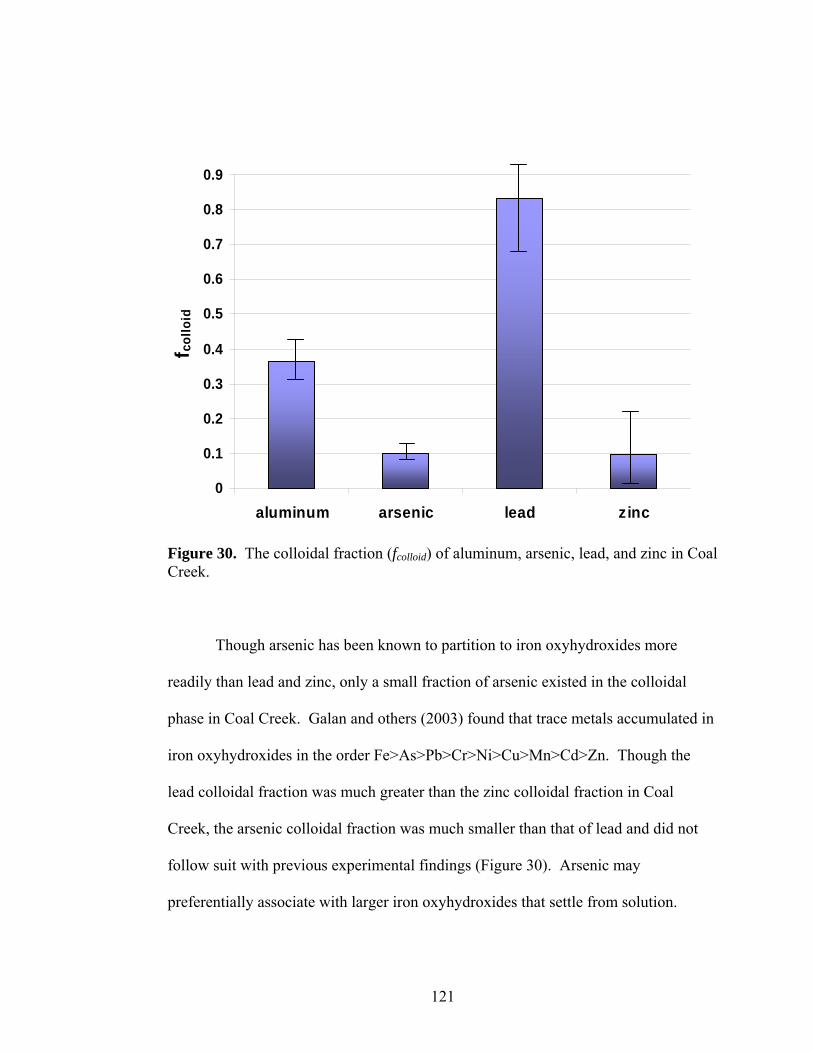
121
Though arsenic has been known to partition to iron oxyhydroxides more
readily than lead and zinc, only a small fraction of arsenic existed in the colloidal
phase in Coal Creek. Galan and others (2003) found that trace metals accumulated in
iron oxyhydroxides in the order Fe>As>Pb>Cr>Ni>Cu>Mn>Cd>Zn. Though the
lead colloidal fraction was much greater than the zinc colloidal fraction in Coal
Creek, the arsenic colloidal fraction was much smaller than that of lead and did not
follow suit with previous experimental findings (Figure 30). Arsenic may
preferentially associate with larger iron oxyhydroxides that settle from solution.
Figure 30. The colloidal fraction (fcolloid) of aluminum, arsenic, lead, and zinc in Coal Creek.
0
0.1
0.2
0.3
0.4
0.5
0.6
0.7
0.8
0.9
aluminum arsenic lead zinc
f col
loid
122
Previous studies on streams affected by acid mine drainage report colloid
aluminum fractions as high as 0.9 (Wood and others, 2004). Thermodynamic
predictions indicate that colloidal aluminum concentrations should be high at neutral
pH in any system where aluminum exists in equilibrium with gibbsite or any other
aluminosilicate. The smaller than expected colloidal aluminum fraction in Coal
Creek may be a result of aluminosilicate colloids passing through the 0.45 µm
membrane filter. Other environmental factors such as complexation by dissolved
phase natural organic ligands may be responsible for the significant dissolved
aluminum concentrations (Kimball and others, 1995).
The high colloidal lead fraction correlates well with expected partitioning
behavior for this metal. Lead is expected to dominate the colloidal phase because it
readily adsorbs to colloids (Abd-Elfattah and Wada, 1981; Brown and Hem, 1984;
EPA, 1999; Macalady and others, 1990; Dzombak and Morel, 1990; Wood and
others, 2004; Bautts, 2006). One study found that lead absorbs to minerals in the
following order: iron oxides < halloysite < imogolite, allophane < humus, kaolinite <
montmorillonite (Abd-Elfattah and Wada, 1981). Iron oxyhydroxides were one of the
major chemical components found in the selected samples analyzed for colloidal
elemental composition (Figures 24, 26, 27, and 28). The presence of iron oxide
minerals in Coal Creek would support lead adsorption into the colloidal phase,
particularly at neutral pH.
The partitioning behavior of lead and zinc was compared to published surface
complexation constants, Kint, for these metals (Table 15; Dzombak and Morel, 1990).
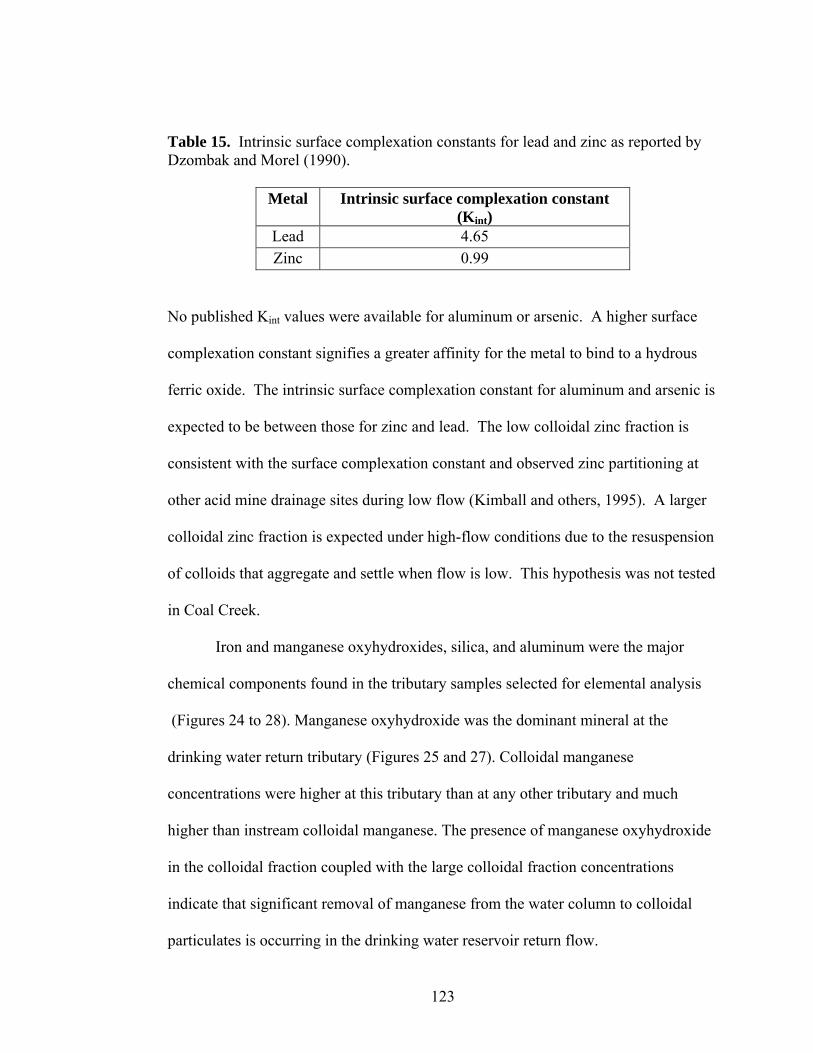
123
Table 15. Intrinsic surface complexation constants for lead and zinc as reported by Dzombak and Morel (1990).
Metal Intrinsic surface complexation constant (Kint)
Lead 4.65 Zinc 0.99
No published Kint values were available for aluminum or arsenic. A higher surface
complexation constant signifies a greater affinity for the metal to bind to a hydrous
ferric oxide. The intrinsic surface complexation constant for aluminum and arsenic is
expected to be between those for zinc and lead. The low colloidal zinc fraction is
consistent with the surface complexation constant and observed zinc partitioning at
other acid mine drainage sites during low flow (Kimball and others, 1995). A larger
colloidal zinc fraction is expected under high-flow conditions due to the resuspension
of colloids that aggregate and settle when flow is low. This hypothesis was not tested
in Coal Creek.
Iron and manganese oxyhydroxides, silica, and aluminum were the major
chemical components found in the tributary samples selected for elemental analysis
(Figures 24 to 28). Manganese oxyhydroxide was the dominant mineral at the
drinking water return tributary (Figures 25 and 27). Colloidal manganese
concentrations were higher at this tributary than at any other tributary and much
higher than instream colloidal manganese. The presence of manganese oxyhydroxide
in the colloidal fraction coupled with the large colloidal fraction concentrations
indicate that significant removal of manganese from the water column to colloidal
particulates is occurring in the drinking water reservoir return flow.
124
This same phenomenon occurred with respect to iron at UT-6.696. The
colloidal iron concentration at UT-6.696 is greater than at any other instream or
tributary site. The total iron concentration at UT-6.696 is approximately 6 times
higher than instream average. However, UT-6.696 only contributes 5.4 % of the total
tributary iron load. Flow at UT-6.696 was small and partially accounts for the small
iron load despite the high iron concentration. Iron precipitation from the dissolved
phase to ferric oxyhydroxide complexes most certainly accounts for further removal
of iron from solution.
5.10 Hardness and metal partitioning
Downstream of treatment plant effluent channel, Coal Creek hardness peaks at
a concentration seven times higher than upstream hardness as a result of calcium
input (Figure 8). Hardness, measured as the sum of calcium and magnesium
concentration (Equation 2), competes with other divalent cations (metals) for binding
sites on iron hydroxide complexes and organic matter (Macalady and others, 1990;
Nelson and others, 1986; Allen and others, 1993;Wood and others, 2004; Bautts,
2006). Metal concentrations in the colloidal phase are expected to decrease in
response to increased competition with calcium downstream of the treatment plant.
Weaker-binding metals such as zinc and cadmium are expected to be more affected
than stronger-binding metals like lead. For instance, adsorption of cadmium to iron
oxyhydroxides may be greatly reduced may the presence of zinc and calcium,
resulting in enhanced mobility and bioavailability of cadmium. Both zinc and
calcium have greater affinities than cadmium for binding with iron oxyhydroxides.

125
This hypothesis could not be tested with the data available for this study due to large
standard deviation associated with the colloidal fraction upstream and downstream of
the treatment plant.
126
CHAPTER 6
CONCLUSIONS
The purpose of this research was to use tracer dilution and synoptic sampling
to identify sources of metals in Coal Creek. The impact of acid mine drainage from
the Standard Mine (Elk Creek) and the iron fen and gossan on the Coal Creek
watershed was investigated. Concentrations and metal loading rates for ten metals
and arsenic were reported for a 9.4 km stretch of Coal Creek (Figures 13 to 23) and
the major, minor, and trace sources of each of these metals were identified. Metal
concentrations, loading rates, and metal sources are characteristic of low flow
conditions. Low flow conditions are typically the most toxic and dangerous to
aquatic life as less water is available for dilution. Colloidal material was analyzed at
select sites to provide a general assessment of the mineralogical composition of Coal
Creek and its tributaries. Relationships between the dissolved and colloidal phase
metal fractions were compared to established partitioning behavior for aluminum,
arsenic, lead, and zinc.
Cadmium, chromium, and zinc exceed chronic and acute aquatic life toxicity
standards at several locations along the study reach (Table 11). Drinking water
supply standards were exceeded by arsenic, iron, and manganese (Table 11), though
these exceedances were not at the location of the drinking water intake.
The Mt. Emmons Treatment Plant contributed large calcium concentrations to
Coal Creek when discharging. The influx of calcium caused hardness-based aquatic
life toxicity standards to increase downstream of the plant during the time of synoptic

127
sampling. Large diel fluctuation in the calcium concentrations and hardness-based
aquatic life toxicity standards downstream of the treatment plant are expected.
Cadmium and zinc are expected to exceed aquatic life standards at additional
locations downstream of the treatment plant when it is not discharging (Table 10).
The gossan was found to be the major threat to Coal Creek water quality
(Table 13). The gossan contributed elevated aluminum, cadmium, iron, manganese,
and zinc concentrations and loading rates. UT-2.602 was the second greatest threat to
water quality. This tributary was not previously suspected of adding metals to Coal
Creek, however, it contributed elevated levels of chromium, iron, and nickel to the
stream. It is recommended that potential metal sources emanating from this tributary
be further investigated. Elk Creek was found to be a major contributor of cadmium
and zinc to Coal Creek, producing aquatic life standard exceedances and elevated
loading rates for these two metals. An unidentified upstream surface tributary or
dispersed groundwater flow added arsenic and barium to Coal Creek.
The colloidal fraction was examined for aluminum, arsenic, lead, and zinc
(Figure 28). Lead dominated the colloidal phase followed by aluminum. Arsenic and
zinc had significantly smaller colloidal fractions. A diverse array of colloidal
minerals were present in Coal Creek, including the iron oxyhydroxides and
aluminosilicates characteristic of acid rock drainage solutions. However, these
minerals did not dominate the colloidal fraction and their presence or absence in
colloid samples could not be related to their location upstream or downstream of acid
rock drainage sources.

128
Increases in hardness were produced downstream of the Mt. Emmons
treatment plant as a result of high calcium concentrations in the treatment plant
effluent. The source of this calcium is lime used during the treatment process to raise
pH and precipitate metals. This increase in calcium concentration caused hardness-
based aquatic life standards to increase. Colloidal metal fractions are expected to
decrease downstream of the plant as a result of increased competition with calcium
cations. A higher fraction of these metals would consequently be available in the
dissolved phase, where they pose a threat to aquatic life and ecosystem health.
However, no correlations between the colloidal fraction and the increase in hardness
could be established with available data to investigate this hypothesis.
129
REFERENCES
Abd-Elfattah, A. and Wada, K., 1981. Adsorption of lead, copper, zinc, cobalt, and cadmium by soils that differ in cation exchange material. Journal of Soil Science 32:71-283.
Adams, L.C., 2006. Crested Butte Utilities Director. May 26, 2006. Allen, H.E., Perdue, E.M., and Brown, D.S., 1993. Metals in Groundwater:
Adsorption to Heterogeneous Surfaces. Lewis Publishers, Boca Raton, Florida. pp. 1-36.
Bautts, S.M., 2006. An investigation of metal concentrations in waste rock piles,
stream water, benthic macroinvertebrates, and stream bed sediments to assess long-term impacts of intermittent precipitation events in the Lefthand Creek watershed, northwestern Boulder County, CO. M.S. Thesis, University of Colorado, Boulder, Colorado. pp. 150.
Bencala, K.E., 1985. Performance of sodium as a transport tracer - experimental and
simulation analysis. Selected papers in the hydrologic sciences, U.S. Geological Survey water supply paper 2270. pp. 83-89.
Bencala, K.E., McKnight, D.M., Zellweger, G.W., and Goad, J., 1986. The stability
of rhodamine WT dye in trial studies of solute transport in an acidic and metal-rich stream. Selected papers in the hydrologic sciences, U.S. Geological Survey water supply paper 2310. pp. 87-95.
Bencala, K.E., McKnight, D.M., and Zellweger, G. W., 1987. Evaluation of natural
tracers in an acidic and metal-rich stream. Water Resources Research 23(5): 827-836.
Bencala, K.E, McKnight, D.M., and Zellweger, G.W., 1990. Characterization of transport in an acidic and metal-rich mountain stream based on a lithium tracer injection and simulations of transient storage. Water Resources Research 26(5): 989-1000.
Broshears, R.E., Bencala, K.E., Kimball, B.A., and McKnight, D.M., 1993. Tracer-
dilution experiments and solute transport simulations for a mountains stream, St. Kevin Gulch, Colorado. U.S. Geological Survey, Water-Resources Investigations Report 92-4081. pp. 18.
Brown, D.W., and Hem, J.D., 1984. Development of a model to predict the
adsorption of lead from solution on a natural streambed sediment. U.S. Geological Survey Water-Supply Paper 2187. pp. 35.
130
CCCOSC, 2006. Clear Creek County Open Space Commission. The Geneva Creek iron fen, Clear Creek Open Space Commission. Retrieved June 1, 2006 from http://www.co.clearcreek.co.us/OSWebsite/GenevaCreek.htm.
CCWC, 2006. Crested Butte, A National Historic District, Coal Creek Watershed
Coalition, Coal Creek Watershed Coalition. Retrieved May 26, 2006, from http://www.crestedbutte.govoffice2.com/index.asp?cType =B_B ASIC&SEC=%7BE820970E-625C-4CAA-ADF1-F95CB758956C%7D.
CDPHE, 2005. Regulation no. 31: the basic standards and methodologies for surface
water, 5 CCR 1002-31. Colorado Department of Public Health and Environment Water Quality Control Commission, Denver, Colorado.
CDPHE, 2006. List of Superfund sites in Colorado: Standard Mine. 2006, Colorado
Department of Public Health and Environment, Hazardous Materials and Waste Management Division. Retrieved April 9, 2006 from http://www.cdphe.state.co.us/hm/rpstandard.htm.
Clements, W.H., 1994. Benthic invertebrate community responses to heavy metals in
the Upper Arkansas River Basin, Colorado. Journal of the North American Benthological Society 13: 30-44.
Danielsson, L.G., 1982. On the use of filters for distinguishing between dissolved
and particulate fractions in natural waters. Water Research 16:179-182. Dzombak, D.A., and Morel, F.M.M., 1990. Surface Complexation Modeling:
Hydrous Ferric Oxide. John Wiley & Sons, New York, New York. pp. 392. EPA, 1999. Understanding variation in partition coefficient, Kd, values. U.S.
Environmental Protection Agency Report No. 402-R-99-004A. pp. 609. EPA, 2005a. Hazard ranking system documentation record: standard mine,
CO0002378230, U.S. Environmental Protection Agency. Retrieved April 16, 2006 from http://www.epa.gov/region8/superfund/co/standard/.
EPA, 2005b. National priorities list: standard mine, Gunnison national forest,
Colorado,. Retrieved April 16, 2006 from: http://www.epa.gov/superfund/sites/npl/nar1740.htm.
EPA, 2006. Multi-media, multi-concentration inorganic analyses ILM05.3,
Retrieved May 18, 2006 from: http://epa.gov/superfund/programs/clp/ilm5.htm.
131
Galan, E., Gomez-Ariza, J.L., Gonzalex, J.C., Fernandez-Caliani, Morales, E., and Giraldez, I. Heavy metal partitioning in river sediments severely polluted by acid mine drainage in the Iberian Pyrite Belt. Applied Geochemistry 18: 409-421.
Glazer, S., 2005. High Country Citizens Alliance, Water Director. September 1,
2005. Hernandez, K.S., 1995. Acid mine drainage in the Rockford Tunnel wetland, Idaho
Springs, Colorado: metal speciation and distribution. M.S. Thesis, University of Colorado, Boulder. pp. 153.
Hornbaker, A. L., 1984. Metal mining activity map of Colorado and directory, 1984.
Map Series 24, Colorado Geological Survey, Department of Natural Resources, Denver, Colorado.
Kelly, W.C., 1958. Topical study of lead-zinc gossans. Bulletin 46, New Mexico
Bureau of Mines and Mineral Resources, Socorro, New Mexico. pp. 80. Kennedy, V.C., Zellweger, G.W., and Jones, B.F., 1974. Filter pore size effects on
the analysis of Al, Fe, Mn, and Ti water. Water Resources Research 10: 785-790.
Kimball, B.A., 2005. U.S. Geological Survey. November 16, 2005. Kimball, B.A., 2005. Methods for mass-loading analysis. U.S. Geological Survey. August, 2005. Kimball, B.A., 1997. Use of tracer injections and synoptic sampling to measure
metal loading from acid mine drainage. U.S. Geological Survey Fact Sheet-245-96, U.S. Department of the Interior, West Valley City, Utah.
Kimball, B.A., Callender, E., and Axtmann, E.V., 1995. Effects of colloids on metal
transport in a river receiving acid mine drainage, upper Arkansas River, Colorado, U.S.A. Applied Geochemistry 10: 285-306.
Kimball, B.A., Runkel, R.L., and Gerner, L.J., 2001. Quantification of mine-drainage
inflows to Little Cottonwood Creek, Utah, using a tracer-injection and synoptic-sampling study. Environmental Geology 40: 1390-1404.
Kimball, B.A., Runkel, R.L., Walton-Day, K., and Bencala, K.E., 2002. Assessment
of metal loads in watersheds affected by acid mine drainage by using tracer injection and synoptic sampling: Cement Creek, Colorado, USA. Applied Geochemistry 17: 1183 – 1207.

132
Macalady, D.L, Smith, K.S., and Ranville, J.F., 1990. Acid mine drainage: streambed sorption of copper, cadmium, and zinc. Colorado Water Resources Research Institute Completion Report No. 154. pp. 16.
Macalady, D.L., Ranville, J.F., Smith, K.S., and Daniel, S.R., 1991. Adsorption of
copper, cadmium, and zinc on suspended sediments in a stream contaminated by acid mine drainage: the effect of seasonal changes in dissolved organic carbon. Colorado Water Resources Research Institute Completion Report No. 159, Colorado State University, Fort Collins, Colorado. pp. 14.
McKnight, D.M., Bencala, K.E., Zellweger, G.W., Aiken, G.R., Feder, G.L., and
Thorn, K.A., 1992. Sorption of dissolved organic carbon by hydrous aluminum and iron oxides occurring at the confluence of Deer Creek with the Snake River, Summit County, Colorado. Environmental Science & Technology 26: 1338-1396.
Morrison, M.A., and Benoit, G., 2001. Filtration artifacts caused by overloading
membrane filters. Environmental Science & Technology 35 (18): 3774-3779. Mudroch, A., Zeman, A.J., and Sandilands, R., 1977. Identification of mineral
particles in fine grained lacustrine sediments with transmission electron microscope and x-ray energy dispersive spectroscopy. Journal of Sedimentary Petrology 47: 244 – 250.
Mudroch, A., Azcue, J.M., and Mudroch, P., 1997. Physico-Chemical Analysis of
Aquatic Sediments. Lewis Publishers, Boca Raton, Florida. Paschke, S., Kimball, B., and Runkel, R., 2005. Quantification and simulation of
metal loading to the upper Animas River, Eureka to Silverton, San Juan County, Colorado, September 1997 and August 1998. Scientific Investigations Report 2005-5054, U.S. Geological Survey, Reston, Virginia, pp. 4-8.
Perusek, J., 2005. Mount Emmons Treatment Plant Operator. July 15, 2005. Pham, M.K., and Garnier, J.M., 1998. Distribution of trace elements associated with
dissolved compounds (0.45 µm – 1nm) in freshwater using coupled (frontal cascade) ultrafiltrations and chromatographic separations. Environmental Science & Technology 32 (4): 440-449.
Schemel, L.E., Kimball, B.A., and Bencala, K.E., 2000. Colloid formation and metal
transport through two mixing zones affected by acid mine drainage near Silverton, Colorado. Applied Geochemistry 15: 1003-1018.
133
Smith, K.S., Macalady, D.L., and Briggs, P.H., 1990. Partitioning of metals between water and flocculated bed material in a stream contaminated by acid mine drainage near Leadville, Colorado. Colorado Water Resources Research Institute Completion Report No. 154. pp. 101-109.
Soule, J.M., 1976. Geologic hazards in the Crested Butte-Gunnison area, Gunnison County, Colorado. Publication No. GS-VDSD 34-45, Colorado Geological Survey, Department of Natural Resources, Denver, Colorado, pp 4-6.
Streufert, R.K., 1999. Geology and mineral resources of Gunnison County, Colorado.
Resource Series 37, Colorado Geological Survey, Department of Natural Resources, Denver, Colorado. pp. 76.
Sullivan, A.B., and Drever, J.I., 2001. Geochemistry of suspended particles in a
mine-affected mountain stream. Applied Geochemistry 16: 1663-1676. Tate, C.M., Broshears, R.E., and McKnight, D.M., 1995. Phosphate dynamics in an
acidic mountain stream: interactions involving algal uptake, sorption by iron oxide, and photoreduction. Limnology and Oceanography 40(5): 938-946.
U.S. Energy, 2006. History of Mt. Emmons molybdenum project known as the “luck
jack project,” U.S. Energy Corporation. Retrieved May 17, 2006 from http://www.usnrg.com/MolybdenumProjects.php.
USFS, 1981. Mount Emmons mining project environmental impact statement,
Gunnison County, Colorado. U.S. Forest Service, Department of Agriculture, Report 02-04-81-03, Gunnison Colorado
USGS, 2006. USGS 09111000 Coal Creek near Crested Butte, Colorado, U.S.
Geological Survey. Retrieved May 31, 2006 from http://waterdata.usgs.gov/co/nwis/inventory/?site_no=09111000.
Wentz, D.A., 1974. Effect of mine drainage on the quality of streams in Colorado,
1971-1972. Colorado Water Resources Research Institute, Circular No. 21. Wong, J., 2006. M.S. Candidate-Effects of drought on metal-loading of Peru Creek
watershed, Summit County, Colorado. July 12, 2006. Wood, A.R, Cholas, R., Harrington, L., Isenhart, L., Turner, N., and Ryan, J.N., 2004.
Characterization and prioritization of mining-related metal sources in the streams and streambed sediments of the Lefthand Creek watershed, northwestern Boulder County, Colorado, 2002-2003, Report no. 04-01. University of Colorado, Boulder, Colorado.

134
WRCC, 2006. Crested Butte, Colorado. Monthly Climate Summary, Period of Record 6/1/1909 – 12/31/2005. Western Regional Climate Center. Retrieved May 29, 2006 from http://www.wrcc.dri.edu/cgi-bin/climMAIN.pl?cocres.
Zanker, H., Moll, H., Wolfgang, R., Brendler, V., Hennig, C., Reich, T., Kluge, A.,
and Huttig, G., 2002. The colloid chemistry of acid rock drainage solution from an abandoned Zn-Pb-Ag mine. Applied Geochemistry 17: 633-648.
Zanker, H., Richter, W., and Huttig, G. Scavenging and immobilization of trace
contaminants by colloids in the waters of abandoned ore mines. Colloids and Surfaces A: Physicochemical and Engineering Aspects 217: 21-31.
Zellweger, G. W., Avanzino, R.J., and Bencala, K.E., 1989. Comparison of tracer dilution and current-meter discharge measurements in a small gravel-bed stream, Little Lost Man Creek, California. U.S. Geological Survey Water-Resources Investigations Report 89-4150.

![Chapter 296-19A Chapter 296-19A WAC VOCATIONAL …lawfilesext.leg.wa.gov/law/WACArchive/2012/WAC-296... · 296-19A-010 Vocational Rehabilitation [Ch. 296-19A WAC—p. 2] (11/15/11)](https://img.pdfslide.us/doc/110x75/6013de7783e2d5485a5626ed/chapter-296-19a-chapter-296-19a-wac-vocational-296-19a-010-vocational-rehabilitation.jpg)