Embed Size (px)
Citation preview
1
Sources and Budgets for CO and O3 in the Northeastern Pacific during the spring of 2001 Results from the PHOBEA-II Experiment Lyatt Jaegleacute1 Dan Jaffe2 Heather U Price2 3 Peter Weiss-Penzias2 Paul I Palmer4 Mat J Evans4 Daniel J Jacob4 and Isabelle Bey5 1Department of Atmospheric Sciences BOX 351640 University of Washington Seattle Washington 98195 USA E-mail jaegleatmoswashingtonedu Phone (206) 685-2679 2Interdisciplinary Arts and Sciences University of Washington Bothell Bothell Washington 98011 USA E-mails djaffeuwashingtonedu hpriceuwashingtonedu pweissbothellwashingtonedu 3Also at Department of Chemistry University of Washington Seattle Washington 98195 USA 4Division of Engineering and Applied Sciences and Department of Earth and Planetary Sciences Harvard University Cambridge Massachusetts 02138 USA E-mails pipsolharvardedu mjesolharvardedu djjsolharvardedu 5Swiss Federal Institute of Technology (EPFL) DGR-LPAS CH-1015 Lausanne Switzerland E-mail isabellebeyepflch Short title NE PACIFIC CO AND O3 BUDGETS Keywords Long-range transport carbon monoxide ozone Pacific Index terms Troposphere composition and chemistry (0322) Troposphere constituent transport and chemistry (0368)
Submitted to the Journal of Geophysical Research Atmospheres TRACE-P special issue October 2002
2
Abstract Ground and airborne measurements of CO ozone and aerosols were obtained in the
northeastern Pacific troposphere during March 9-May 31 2001 as part of the PHOBEA-II project
(Photochemical Ozone Budget of the Eastern North Pacific Atmosphere) We use these
observations together with the GEOS-CHEM global 3-D model of tropospheric chemistry to
examine the origin of CO and ozone in the NE Pacific troposphere The GEOS-CHEM model
successfully reproduces the observed CO levels their temporal variability and vertical gradients
implying a good understanding of the sources transport and chemistry of CO in the NE Pacific
For ozone the model reproduces the airborne profiles well but systematically underestimates
mean surface observations by 11 ppbv We find a pervasive influence of Asian as well as
European anthropogenic sources on the levels of CO in the NE Pacific troposphere In the 0-6
km column over our surface site Asian and European emissions account for 33 (43 ppbv) and
16 (25 ppbv) of CO respectively Because of the shorter lifetime of ozone relative to CO
Asian and European emissions are responsible for smaller fractions of the 0-6 km ozone column
12 and 5 respectively based on direct transport of ozone produced in the lower troposphere
over these regions The full influence of Asian emissions (including secondary ozone production
by export of its precursors) approaches 16 of ozone The budget of odd-oxygen in the NE
Pacific below 6 km is characterized by net loss photochemical loss and deposition are partly
counterbalanced by westerly advection and photochemical production The model successfully
reproduces three cases of rapid intercontinental transport events observed during the spring 2001
campaign one at the surface and two in the free troposphere While all three events were
characterized by large CO enhancements (by 20-40 ppbv) only one case showed significant
ozone enhancement (by 20 ppbv) induced by long-range transport of Asian pollution at high
latitudes together with a stratospheric ozone contribution
3
1 Introduction
Ozone and carbon monoxide play key roles in the troposphere Tropospheric ozone
controls the oxidizing power of the atmosphere At the surface it is a major pollutant harmful to
human health and vegetation In the middle and upper troposphere ozone is an important
greenhouse gas Ozone is transported to the troposphere from the stratosphere and is also
produced in the troposphere by the oxidation of CO and nonmethane hydrocarbons (NMHC) in
the presence of nitrogen oxides (NOx=NO+NO2) and hydrogen oxides (HOx=HO+HO2) [eg
WMO 1999]
Carbon monoxide provides the primary OH sink in much of the troposphere In addition
CO is a useful tracer of anthropogenic activities The major sources of CO are fossil fuel
combustion biomass burning biofuel burning oxidation of atmospheric CH4 and of NMHCs
[Logan et al 1981] The lifetime of CO is in the range of weeks to months while ozone has a
shorter lifetime ranging from days to weeks depending upon the environment
Observations from the late 19th and early 20th century combined with models suggest that
northern hemisphere tropospheric ozone concentrations have increased by 25-50 since
preindustrial times due to increasing anthropogenic NOx CO and NMHC emissions from fossil
fuel combustion and biomass burning [Prather and Ehhalt 2001 and references therein] East
Asia in particular is a region experiencing rising emissions due to rapid economic growth over
the last few decades [Akimoto and Narita 1994 Elliott et al 1997 van Aardenne et al 1999
Streets and Waldhoff 2000] As a result ozone in the boundary layer and lower troposphere of
East Asia has been increasing by about 2 per year [Logan 1994 Lee et al 1998] Continued
increases in NOx and NMHC emissions especially in developing regions of the world may
4
cause tropospheric O3 to increase more dramatically through the 21st century [Prather and
Ehhalt 2001]
Observations have shown that Asian emissions of gases and aerosols can be transported to
North America in 6-8 days under certain meteorological conditions [Andreae et al 1988 Kritz
et al 1990 Parrish et al 1992 Jaffe et al 1999 2001 2002 Husar et al 2001 McKendry et
al 2001 Kotchenruther et al 2001a Price et al 2002 Thulasiraman et al 2002] Enhanced
mixing ratios of CO Peroxyacetyl nitrate (PAN) NMHCs industrial and mineral aerosols
radon and sulfate have been identified in these airmasses coming from East Asia However not
all of these airmasses with clear anthropogenic signatures are characterized by ozone
enhancements [Jaffe et al 2002] suggesting loss of ozone during transport over oceans or
reduced photochemical production over emission areas Identification of ozone enhancements
due to transport of Asian emissions is further complicated by the possible mixing of
anthropogenic emissions with stratospheric ozone [Carmichael et al 1998]
Based on chemical transport model (CTM) calculations current emissions from Europe
and Asia contribute on average 4-7 ppbv O3 at the surface in North America [Berntsen et al
1999 Jacob et al 1999 Yienger et al 2000 Wild and Akimoto 2001 Fiore et al 2002] A
future doubling of Asian emissions might increase surface ozone by another 4 ppbv over
Western North America [Bernsten et al 1999] Such an increase would offset the benefits from
domestic reductions in anthropogenic emissions in the US [Jacob et al 1999] However these
estimates remain highly uncertain and current understanding of intercontinental transport of
Asian effluents and their effects on the global troposphere are limited by the lack of observations
constraining the CTM calculations of Asian sources transport and chemical transformation
5
During the spring of 2001 the TRACE-P (Transport and Chemical Evolution over the
Pacific) [Jacob et al this issue] and ACE-Asia (Aerosol Characterization Experiment-Asia)
[Huebert et al 2002] experiments were both operating in the western North Pacific region
where they sampled the gas and aerosol composition of the Asian outflow Simultaneously we
made ground and airborne observations in the northeastern Pacific as part of the PHOBEA-II
project (Photochemical Ozone Budget of the Eastern North Pacific Atmosphere) The main goal
of PHOBEA project is to understand the impact of upstream anthropogenic emissions on the NE
Pacific troposphere [Jaffe et al 2001 Kotchenruther et al 2001a] During these three
missions several CTMs [Kiley et al this issue] were used for flight planning to optimize the
value of observations in constraining and evaluating CTM simulations of Asian sources outflow
and chemical evolution [Jacob et al this issue]
In this paper we utilize the PHOBEA-II ground and airborne observations in the
Northeastern Pacific during the spring of 2001 along with the GEOS-CHEM global model of
tropospheric chemistry [Bey et al 2001a] to understand the sources of atmospheric CO and O3
in the northeastern (NE) Pacific Price et al [2002 this issue] give a detailed description of the
results from the airborne component of PHOBEA-II In parallel papers in this issue the GEOS-
CHEM model is used to interpret the TRACE-P observations in the western Pacific [Liu et al
this issue Palmer et al this issue Bey et al this issue] Our focus in this paper is to evaluate
the current effects of Asian and European outflow in the NE Pacific In particular we wish to
address the following questions How well can global models reproduce the observed mixing
ratios and variability of CO and O3 in the NE Pacific What are the sources and budgets for CO
and O3 in the NE Pacific Can global model simulations quantitatively capture intercontinental
transport events arriving in the NE Pacific
6
2 Observations and Model
The PHOBEA-II mission combined surface observations at the Cheeka Peak Observatory
(CPO 483ucircN 1246ucircW 480 m) on the western tip of Washington State and airborne profiles to
6 km altitude in the area immediately off the coast from CPO During the first phase of the
PHOBEA experiment we used this site for observations during March-April 1997 and March-
April 1998 [Jaffe et al 2001] and conducted airborne measurements off the coast in the spring
of 1999 [Kotchenruther et al 2001a]
21 Ground-based observations
For this work we began ground-based measurements of CO O3 PM10 and PM25 at CPO
on March 9 2001 The experimental methods for CO and O3 are identical to those given in Jaffe
et al [2001] Briefly CO was measured by a commercial gas filter correlation infra-red
instrument (Advanced Pollution Instruments model 300) modified for higher sensitivity [Jaffe et
al 1998] Calibration occurred once per day with a working standard referenced to a NIST
standard reference material An instrument zero is performed every 20 minutes by routing the
airstream through a heated catalyst that oxidizes CO to CO2 Ozone was measured using a
standard UV absorption instrument (Dasibi AH1008) with temperature and pressure
compensation Calibration of the ozone instrument was performed using a standard O3
calibrator immediately prior to the campaign and zero checks were performed daily
22 Vertical profiles
For the vertical profiles we used a twin-engine Beechcraft Duchess aircraft with a ceiling
of 6 km altitude Profiles were conducted on 12 days between March 29 and May 6 2001 The
Duchess aircraft can carry the pilot plus one passenger and approximately 240 kg of
instrumentation The plane was equipped to make in-situ measurements of O3 by UV absorption
7
(2B Technologies) and aerosol scatter at 3 wavelengths (700 550 450 nm TSI model 3563)
and collected whole air samples in stainless steel canisters for measurements of CO (by gas
chromatography with a reduction gas analyzer detector) and NMHCs (by gas chromatography
with flame ionization detector) The new lightweight O3 instrument [Bognar and Birks 2000]
was extensively tested against a standard UV instrument as well as against an ECC ozonesonde
[Snow et al 2002] The lighter O3 instrument yielded accurate measurements when compared
with the other two methods but it had lower precision Price et al [2002 this issue] give more
details on the instrumentation calibration procedures and flight patterns for the Duchess vertical
profiles
23 GEOS-CHEM model
Global simulations of O3-NOx-NMHC chemistry are conducted with the GEOS-CHEM
global 3-D model of tropospheric chemistry [Bey et al 2001a] driven by GEOS DAO (Data
Assimilation Office) assimilated meteorological data [Schubert et al 1993] The simulations
presented here use GEOS-CHEM version 432 (httpwwwasharvardeduchemistrytropgeos)
and two years (2000-2001) of GEOS assimilated meteorological observations with a horizontal
resolution of 2deg latitude by 25deg longitude and 46 vertical layers Meteorological inputs are
available with a 3- to 6-hour time resolution depending on the variable The simulations are
initialized on February 1 2001 after a one-year spin-up with a 4deg x 5deg horizontal resolution to
speed up the calculations
The tropospheric O3 simulation includes a complete description of O3-NOx-NMHC
chemistry (24 tracers and 120 species) [ Bey et al 2001a] Recent updates to the GEOS-CHEM
model are described in Palmer et al [this issue] and include in particular a treatment of the
heterogeneous and photochemical effects of aerosols [Martin et al 2002a] Fossil fuel and
8
biofuel emission inventories are from Duncan et al [2002a] and Yevich et al [2002] and are
scaled to the year 1998 We use the seasonally varying climatological biomass burning
emissions of Duncan et al [2002b] Analysis of satellite observations show that Asian biomass
burning emissions during spring 2001 were close to average [Heald et al this issue] justifying
the use of a climatological average For CO our anthropogenic emissions for Asia (10degS-60degN
60deg-150degE) are 257 Tg yr-1 (fossil fuel 160 Tg yr-1 biofuel 97 Tg yr-1) with an additional 119
Tg yr-1 from biomass burning
The GEOS-CHEM tropospheric chemistry model has been extensively evaluated and used
to study ozone and its precursors over different regions of the globe [eg Bey et al 2001ab Liu
et al 2002 Fiore et al 2002 Palmer et al 2001 Li et al 2002ab Martin et al 2002b] In
particular the GEOS-CHEM model reproduces well the observed latitudinal and vertical
composition of the Asian chemical outflow over the western Pacific as well as its episodic
export [Bey et al 2001b Liu et al 2002 Liu et al this issue Palmer et al this issue]
To investigate the origin of CO and ozone in the model we conducted two sensitivity
simulations based on the full chemistry ozone simulation (1) a tagged CO simulation resolving
source regions using archived monthly averaged OH concentrations (2) a tagged ozone run
using archived daily rates of odd oxygen (Ox = O3 + NO2 + 2timesNO3 + HNO3 + PAN + HNO4 +
3timesN2O5) production rates and loss frequencies For the tagged CO simulation [Bey et al 2001b
Li et al 2002a] we focus on four anthropogenic tracers North American FF CO Asian FF
CO Asian BB CO and European FF CO (specific geographical regions are defined in
Table 1) Each of the FF tracers combines contributions from fossil fuel and biofuel sources
while the Asian BB tracer refers to biomass burning sources For all the results presented here
the Asian CO tracer will refer to the sum of FF and BB Asian CO tracers Loss of CO by
9
reaction with OH and production of CO by oxidation of methane and NMHCs are calculated
using monthly averaged OH concentrations from the full chemistry simulation The tagged
ozone simulation [Li et al 2002a Liu et al 2002] transports eight Ox tracers from different
regions Results will be presented for ozone originating in the stratosphere upper troposphere
(400 hPa-tropopause) middle troposphere (700-400 hPa) and lower troposphere (700 hPa-
surface) The lower troposphere is further subdivided into three separate continental tracers
(Asian European and North American see Table 1 for geographical regions) and one tracer over
the Pacific Ocean We will refer to the tagged Ox tracers as tagged ozone tracers as ozone
generally represents more than 95 of Ox
The tagged ozone simulation gives information on the direct export of ozone produced in
the lower troposphere over the continent of origin tagged Asian ozone represents the ozone
produced from ozone precursors (natural and anthropogenic) within the lower troposphere above
Asia Evaluating secondary production of ozone resulting from free tropospheric transport of
ozone precursors from Asian is less straightforward Our approach is to conduct a simulation
with Asian anthropogenic sources turned off The difference (delta O3 = standard simulation
simulation without Asian sources) should reflect the combined effects of direct transport and
secondary production One caveat is that the non-linearity of ozone production results in an
overestimate of ozone production from natural sources close to the continent of origin and thus
an underestimate of Asian contribution We will thus estimate a lower limit of the contribution
from exported precursors by comparing delta O3 to the tagged Asian ozone tracer
3 Use of global model forecasting to identify flight days
Vertical profiles were made on 12 days between March 29 and May 6 2001 Consistent
with the goals of the PHOBEA experiment we targeted days when long-range transport from
10
sources on the Eurasian continent seemed likely We also sought to sample clean marine
airmasses However we endeavored to avoid days affected by recent emissions from the west
coast of North America A number of tools were used to identify the flight days This includes
the GEOS-CHEM forecast results [Bey et al this issue] driven by meteorological GEOS-3
forecasts from NASA Goddard (httppolargsfcnasagovoperationsterraphp) We also used
local meteorological data results from the University of Washingtons high resolution MM5
simulations satellite infrared and visible imagery the TOMS aerosol index and forecast
trajectories using NOAAs Hybrid Single-Particle Lagrangian Integrated Trajectory (HYSPLIT)
model [Draxler and Hess 1997]
As an example of the use of the model forecasts Figure 1 shows the GEOS-CHEM CO
forecast for April 13 2001 at 6 GMT This 3-day look-ahead forecast was initialized 0 GMT
on April 10 On April 13 an airmass with a high mixing ratio of CO from Asia was predicted to
be near the coast of Washington state We conducted a vertical profile on April 14 2001
between 1 and 2 GMT and indeed found significantly enhanced CO aerosols and NMHCs at 4-6
km altitude [Price et al this issue] In fact the CO and NMHC mixing ratios and the aerosol
scattering coefficient in this airmass were the largest we observed during the spring of 2001
This airmass appears to have started as a large dust storm that originated in central Asia in early
April and left the Asian continent on April 8 after picking up substantial amounts of
anthropogenic emissions as it crossed East Asia The dust storm was detected by the TOMS
satellite Aerosol Index (AI) product and the SeaWIFS sensors as it moved across the Pacific
[Price et al this issue Thulasiraman et al 2002 Huebert et al 2002]
We need to assess whether our sampling strategy resulted in a dataset representative of all
types of airmasses and chemical conditions characteristic of springtime NE Pacific troposphere
11
We thus compare CO column densities up to 6 km above CPO both for the observations and the
GEOS-CHEM model to minimize effects from times when the model identifies an incorrect
altitude for a pollution layer (Figure 2) Here and in the rest of this paper we exclusively use the
GEOS-CHEM post-mission model results driven by assimilated meteorology For the days
when measurements were made the average 0-6 km CO column was 1531018 moleculescm2
from the data and 1461018 moleculescm2 from the GEOS-CHEM model showing good
agreement The modeled column for the March 29-May 5 period is 1451018 moleculescm2
The similarity of the modeled column for all dates and the column for just the flight days
indicates that the flight days are a good representation of the entire time period at least for CO
Figure 2 also illustrates the effects of certain flight day decisions For example the flights
conducted on April 1 5 and 8 were targeted to test the ability of the model to reproduce
variations in transport and the resulting effects on atmospheric composition On these dates the
model forecasts indicated alternating influences going from high CO to aged marine air with
lower CO and back to high CO This pattern was confirmed by the observations
4 Comparison of model and observations
Carbon monoxide Figure 3 shows the hourly-averaged observed CO mixing ratios at the
CPO ground-site along with the hourly GEOS-CHEM modeled values between March 9 and
May 31 2001 The model generally captures the observed levels the slow decline of CO
throughout April and May (resulting from increasing levels of OH radical) as well as the timing
and magnitude of periods with enhanced and low concentrations The events with high levels of
CO (gt200 ppbv) correspond to extended periods of easterly winds bringing air recently
influenced by North American emissions (March 20 April 15 May 20 May 31) These
12
conditions generally occur when a surface high pressure system moves inland over the Pacific
Northwest resulting in low-level off-shore flow Two notable exceptions to the good agreement
are April 4 (model overpredicts observations by 40 ppbv) and May 13-16 (model underpredicts
observations by 50 ppbv) which are characterized the poor performance of the coarse 2degtimes25deg
resolution wind fields in capturing sharp gradients in meteorological conditions near CPO
Overall there is excellent agreement between modeled CO (148plusmn19 ppbv) and observed
CO (151plusmn17 ppbv) for the time period of observations (Figure 5a) The correlation coefficient
indicates that the model captures 53 of the day-to-day variability in CO The spring 2001 CO
observations are similar to 1997 observations (159 ppbv) but much lower than the observations
in 1998 (177 ppbv) at CPO Jaffe et al [1999] attribute the higher values in 1998 to unusually
high biomass burning emissions in Indonesia and Siberia
Figure 4 shows a comparison of observed and modeled CO mixing ratios as seen in the
vertical profiles One difficulty in this comparison is the short timescale (~1 hour) and small
spatial extent of the Duchess flights relative to the longer timescale on which wind fields are
updated (6 hours) and the coarse horizontal resolution of the model Given the variability in
hourly CO levels (Figures 2 and 3) a small displacement in time might lead to large
discrepancies between modeled and observed profiles To overcome this difficulty we plot the
profile sampled at the time and location of the observations and four other profiles displaced in
time by plusmn6 hours and plusmn12 hours For most of the flights there is little variability in the modeled
profiles reflecting the spatial uniformity of the modeled CO fields However in a few cases
such as March 31 April 5 and May 6 there are larger differences The first two days correspond
to periods of easterly low levels winds bringing increasing amounts of North American CO to
13
the region while the May 6 case shows the arrival of an Asian CO plume (further discussion on
the May 6 observations is in section 7)
For the vertical profiles the mean measured CO mixing ratio was 139plusmn20 ppbv compared
to a mean modeled value for the ensemble of flights of 136plusmn16 ppbv showing very good
agreement (Figure 5b) The elevated correlation coefficient (r2 = 054) reflects the models
ability in capturing observed variability The 2001 airborne profiles of CO show no statistically
significant difference relative to the 1999 observations [Price et al this issue]
The excellent agreement between model and observations for CO implies that the GEOS-
CHEM model is accurately simulating the emission sources transport and CO chemistry In
contrast comparisons between CO observations obtained in the Eastern Pacific during TRACE-P
and chemical transport models show a significant negative bias of the models [Kiley et al this
issue] All the models in the intercomparison used the detailed CO fossil fuel and biofuel
emission inventory developed by Streets et al [this issue] for Asia in 2000 (212 Tg yr-1) which
is 20 lower than our emission inventory (257 Tg yr-1) An inverse modeling analysis [Palmer
et al this issue] suggests that an increase in anthropogenic emissions over China close to the
levels used in our study largely eliminates the model bias Streets et al [this issue] attribute the
underpredition of Chinese emissions in their study to an under-reporting of domestic coal use in
central China
Ozone Figure 6 shows a comparison of measured O3 at CPO along with the modeled
values and Figure 7 shows a similar comparison for the vertical profiles At the ground the
model systematically underestimates the observations by 11 ppbv (observations 47plusmn5 ppbv
model 36plusmn4 ppbv) while aloft the model reproduces the observed mean well (observations
45plusmn9 ppbv model 46plusmn7 ppbv) (Figure 5c and 5d) The weak correlation coefficient between
14
model and observations (r2lt02) reflects the small variability of observed ozone and the
overestimate of North American influence on ozone (section 6) Comparison of the GEOS-
CHEM model to ozonesonde observations at Trinidad Head California during spring 2001 (not
shown) also reveals a systematic underestimate but with a smaller bias of 2-5 ppbv In addition
the model systematically underpredicts observed ozone levels in the western Pacific during
TRACE-P by 10 ppbv [MJ Evans personal communication] Reasons for this bias could
include problems with the Asian NOx emissions or an overestimate of stratospheric ozone
columns (which would decrease photolysis rates) [MJ Evans personal communication]
The springtime observations of ozone obtained at CPO in 2001 are very similar to mean
observations from the 1997 and 1998 (1997 43 ppbv 1998 45 ppbv) While the airborne ozone
profiles in 2001 are on average 11 ppbv lower than the profiles obtained in 1999 [Kotchenruther
et al 2001a] Price et al [this issue] attribute the greater levels of ozone in 1999 to enhanced
stratosphere-troposphere exchange andor biomass burning
5 Pathways for long-range transport of CO and ozone to the North Eastern Pacific
The distribution of average (0-6 km) CO and ozone mixing ratios for the North American
Asian and European tagged tracers are shown in Figure 8 along with their respective horizontal
fluxes The concentrations and fluxes are averaged over the two and a half month time period of
the 2001 PHOBEA-II campaign Figure 9 shows the vertical distribution of concentrations and
westerly fluxes of these tracers for a latitudinal cross-section at 125degW along the west coast of
North America
15
North American influence
Over the Eastern United States frontal lifting of North American boundary layer air
towards the Atlantic is the dominant export pathway of pollution [Stohl and Trikl 1999 Stohl
2001 Cooper et al 2002 Li et al 2002a] A small fraction of North American pollution can
also be exported to the Pacific through three pathways (1) episodic easterly low level flow north
of 40degN (discussed in section 4) (2) northeasterly flow on the southern branch of the Pacific
high south of 30degN and (3) circumpolar circulation reaching the Pacific These pathways result
in 10-20 ppbv CO over the NE Pacific (Figure 8a) Westerly circumpolar transport through
pathway (3) extends throughout the free troposphere resulting in 1-2sdot10-10 moles CO s-1 cm-2
between 2 and 10 km while easterly transport via (1) and (2) occurs in the lower troposphere
south of 30degN and north of 40degN (Figure 9a)
Springtime ozone production in North America is restricted to low latitudes in the South-
East United States With its shorter lifetime due to photochemistry and surface deposition North
American ozone is exported less efficiently relative to CO contributing only 2-4 ppbv of ozone
over the northern Pacific (Figure 8d) The largest influence is found off Baja California with up
to 20 ppbv coming from anthropogenic American emissions (via pathway 2) The vertical
distribution of North American ozone fluxes at 125degW (Figure 9d) shows that westerly transport
of North American ozone results in a 05-1sdot10-10 moles O3 s-1 cm-2 flux between 2 and 12 km
(pathway 3) while stronger easterly fluxes (up to 25sdot10-10 moles O3 s-1 cm-2) occurs in the lower
troposphere for latitudes south of 30degN (pathway 2) fueled by large rates of ozone production
Some of the ozone and CO transported through pathway (2) can influence the composition of the
Northern Tropics [Staudt et al 2001]
16
Asian Influence
Liu et al [this issue] and Carmichael et al [this issue] show that the major processes
driving export of Asian anthropogenic pollution to the Pacific during spring 2001 are frontal
lifting in warm conveyor belts ahead of cold fronts and boundary layer transport behind the cold
fronts In addition convection over South East Asia is important for driving the export of
biomass burning emissions south of 30ordmN Once over the Pacific rapid westerly winds
throughout the troposphere can transport Asian anthropogenic and biomass burning effluents
across the Pacific [Jaffe et al 1999 Yienger et al 2000]
Asian sources account for 40-50 ppbv of CO in the NE Pacific troposphere (Figure 8b)
roughly one third of the total CO (Table 1) consistent with previous analyses [Berntsen et al
1999 Yienger et al 2000 Staudt et al 2000] Most of this Asian CO originates from fossil fuel
combustion with only 5-10 ppbv coming from biomass burning emissions based on our
climatological biomass burning emission inventory Asian sources affect a large region of the
NE Pacific from the surface to 12 km altitude between 30 and 60degN (Figure 9b) This Asian
influence shows a maximum at 4-10 km where warm conveyor belts deposit most of the
transported CO [Yienger et al 2000 Stohl 2001 Liu et al this issue] At these altitudes the
westerly fluxes reaches 10-15sdot10-10 moles CO s-1 cm-2 (Figure 9b) but substantial fluxes (gt5sdot10-
10 moles CO s-1 cm-2) are also reaching lower altitudes illustrating the importance of boundary
layer transport of Asian CO across the Pacific
Direct transport of surface ozone produced over Asia results in 4-6 ppbv of ozone in the
NE Pacific roughly 10 of total ozone (Figure 8e) Figure 9e shows a maximum Asian ozone
17
contribution of 6-8 ppbv between 2 and 10 km altitude induced by faster westerly transport and
a longer lifetime for ozone
The Asian tagged ozone represents transport of ozone produced within the Asian lower
troposphere but does not account for secondary ozone production via export of NOx and PAN
from Asia The difference between our standard full chemistry simulation and a simulation
without Asian anthropogenic sources simulation (delta O3) is a lower estimate of the combined
direct transport and secondary ozone production from Asia (see section 23) By comparing
Figure 10a and Figure 8e we find that the influence of secondary ozone production increases
ozone by 2-4 ppbv on average in the NE Pacific for the 0-6 km column and is particularly
significant in the areas influenced by the subsidence in the Pacific High pressure system At the
surface there is only a 10-20 increase in ozone reflecting the minor role of secondary
production at low altitudes (compare Figure 10b to Figure 9e) However in the upper
troposphere over the eastern Pacific secondary production results in a doubling of the Asian
impact on ozone between 10 and 30degN At these low latitudes convection is the dominant
export pathway from Asia [Liu et al this issue] and thus rapid lifting of Asian NOx followed by
efficient ozone production during transport becomes a significant source of ozone
European influence
Export of European pollution is generally confined to the lower troposphere below 3 km
altitude [Staudt et al 2001] as a result of the high latitudes of emissions and the relative
infrequency of cyclogenesis to efficiently vent the boundary layer [Stohl 2001] The main
pathway for export of European pollution is northward to the Arctic [eg Raatz 1989]
However under the influence of the Siberian anticyclone a fraction of European emissions is
transported towards Asia [Newell and Evans 2001 Bey et al 2001b] where it accounts for 30-
18
50 ppbv CO and 4-6 ppbv of ozone (Figures 8c and 8f) After reaching the East coast of Asia
the pollution can then be exported to the Pacific in post-frontal boundary layer outflow where it
mixes with Asian pollution [Liu et al this issue] and is carried in the storm track across the
Pacific mostly remaining at low altitudes and high latitudes (Figures 9c and 9f) This type of
low-level transport is not efficient for ozone which has a short lifetime in the lower troposphere
however European CO can reach the United States Overall the European influence results in
20-30 ppbv CO and 2-4 ppbv ozone in the NE Pacific (Figures 8c and 8f)
6 Origin of CO and ozone at CPO
Springtime CO concentrations at the CPO ground site are dominated by anthropogenic
sources from Asia (43 ppbv) with significant contributions from North American (25 ppbv) and
European (25 ppbv) sources (Figure 3 Table 1) The Asian contribution is mostly from fossil
fuel and biofuel sources and only a small amount comes from biomass burning (7 ppbv) Most
of the remaining CO comes from oxidation of methane and biogenic NMHCs At the surface
77 of the variability in the modeled CO is controlled by the variability in the North American
source Variability in Asian and European source contributions explain an additional 20 of the
variability Enhancements in Asian and European contributions often coincide (Figure 3)
reflecting their mixing in post-frontal boundary layer outflow over the East Asian coast With
increasing altitude the relative contributions from European and North American sources
decrease while the Asian contribution increases (Figure 4)
In contrast to CO the Asian and European contributions to ozone levels are much smaller
(Figures 6 and 7) At CPO based on our tagged-ozone simulation we find that 42 ppbv (11)
originate from production in the Asian lower troposphere (with an additional 15 ppbv coming
19
from secondary production) while 22 ppbv (6) come from Europe and 7 ppbv (18) from
North America as summarized in Table 2 The remaining contributions are mostly from
chemical production over the Pacific middle and upper troposphere and stratosphere The
North American contribution explains 27 of the modeled ozone variability while the Asian
and European contributions together explain another 25 of ozone variability However the
model appears to overestimate the North American influence on ozone at CPO increases in total
ozone associated with the many high North American O3 events in Figure 6 (coinciding with CO
enhancements in Figure 3) are not present in the observations Measurements at CPO during
spring 1997 and 1998 [Jaffe et al 1999] often showed high concentrations of NOx PAN and CO
associated with ozone titration during easterly flow from the nearby SeattleVancouverPortland
urban areas With its 2degx25deg horizontal resolution the model dilutes NOx emissions from
nearby regions resulting in ozone production in the model This overestimate of North American
production explains the poor correlation coefficient between model and observations (section 4)
How representative of the NE Pacific are measurements made at the ground and above
CPO To answer this question we compare modeled tropospheric columns (up to 6 km) averaged
over the NE Pacific (defined as 165-125ordmW 35-65ordmN) to the columns at CPO (Tables 1 and 2)
For CO the columns are almost identical (166sdot1017 moleculescm2 in the NE Pacific and
168sdot1017 moleculescm2 above CPO) reflecting the fact that the 0-6 km column near CPO is
indeed representative of the NE Pacific The only difference comes from a slightly larger
influence of North American contribution at the surface For tagged-ozone the North American
influence dominates even more at CPO relative to the average NE Pacific columns (Table 2) but
is likely to be due to the models overestimate of North American influence noted above
20
Table 3 presents the terms contributing to the modeled Ox budget in the NE Pacific during
PHOBEA-II We have subdivided the budget into three altitude regions below 3 km altitude
there is a net loss of Ox between 3 and 6 km altitude the Ox budget is nearly balanced between 6
and 12 km altitude there is a net production of Ox In the lower part of the troposphere (lt 2 km)
the Ox sources are controlled by advection from the west descent from higher altitudes and
photochemical production These sources are more than balanced by sinks in the form of
advection out of the region through the East North and South deposition and photochemical
loss Subsidence in the Pacific High pressure system appears as an important mechanism for
supplying Ox to the NE Pacific lower troposphere In the middle and upper troposphere the
dominant Ox source is westerly advection which increases with increasing altitude Below 6 km
there is net photochemical loss of ozone in NE Pacific region consistent with the photochemical
box model analysis of Kotchenruther et al [2001b]
7 Case studies of trans-Pacific transport of pollutants
The episodic nature of trans-Pacific transport [eg Jaffe et al 1999 Yienger et al 2000
Hess et al 2000] can be clearly seen at CPO in Figures 3 and 6 as well as in Figure 11 which
shows the time-height dependence of Asian and European contributions to CO above CPO
Strong long-range transport episodes with Asian COgt 60 ppbv occur on twelve separate times
(see Figure 11) and are seen much more frequently in the middle and upper troposphere
compared to the lower troposphere where only one such episode is predicted by the model on
March 11 2001 This lower tropospheric long-range transport episode resulted in an increase in
CO observed at CPO lending confidence to the model calculations (arrow on Figure 3) Two
other Asian long-range transport episodes with smaller CO enhancements can also be noted in
21
the observations and the model on Figures 3 and 11 April 6-8 and April 28-29 2001 Jaffe et al
[2002] identified three episodes of long-range transport in the spring 2001 PHOBEA-II aircraft
profiles for March 29 April 14 and May 6 Significant gas and aerosol layers were observed on
all three flights and back trajectories suggest Asian industrial sources sometimes accompanied by
mineral dust The GEOS-CHEM model misses the March 29 event However the model does
capture the April 14 and May 6 cases (Figures 4 and 7) and attributes the CO enhancements to
transport of Asian pollution consistent with the interpretation of Jaffe et al [2002] We now
focus on a case-by-case analysis of these three long-range transport events which were observed
in the NE Pacific and captured by the model March 11 April 14 and May 6 2001
71 March 11 2001
This event is unique in two respects the large contribution from Asian sources exceeding
60 ppbv at the ground and the vertical extent of the enhancements which occurred throughout
the troposphere reaching a maximum of 115 ppbv Asian CO at 6 km altitude (Figure 11)
Figure 2 shows a 30 increase in modeled column CO below 6 km altitude NOAA HYSPLIT
back trajectory calculations (not shown) indicate low-level transport from Asia with a transit
time of 7 days at the surface and a more rapid transit in the middle troposphere confirming the
GEOS-CHEM results The observations exhibited enhanced CO for a 24-hour time period (~30
ppbv enhancement relative to mean spring levels) but no enhancements in ozone or aerosols
The model captures the timing of this event remarkably well but somewhat underestimates the
increase in CO (Figure 3) The model also predicts an increase in Asian ozone to 8 ppbv (Figure
6) These are the largest levels of Asian ozone calculated at CPO for spring 2001 but the
22
resulting small increase (~5 ppbv) in ozone on top of the background levels is difficult to identify
in the total modeled ozone levels consistent with lack of enhancement in the O3 observations
This long-range transport event has its origin in an intrusion of cold mid-latitude air deep
into the South China Sea in early March 2001 This cold-surge was associated with a surface
cold front extending to northern Japan Using the GEOS-CHEM model Liu et al [this issue]
find that lifting of pollution ahead of the cold front over South China lead to the highest eastward
flux of CO in the lower free troposphere over the western Pacific in spring 2001
Figure 12 presenting average mixing ratios of Asian CO between 0 and 6 km as well as
horizontal fluxes and sea level pressure maps illustrates the sequence of events between March 4
and March 11 2001 The low pressure system at 42degN 150degE forced Asian pollution outflow
over the Pacific to the northeast with maximum horizontal fluxes between 25deg and 40degN on
March 4 Over the next few days the cyclone traveled on a northeast trajectory in the Pacific
storm track By March 8 the Asian CO was located in the lower troposphere behind the cold
front as well as ahead of the cold front in the warm conveyor belt where it ascended to the
middle troposphere with a southerly flow On March 7 and 9 the TRACE-P DC-8 aircraft flew
out of Hong Kong across the cold front Lifting of Asian CO ahead of the cold front between 4
and 8 km altitude was apparent in both observations and in model simulations [Liu et al this
issue Carmichael et al this issue] Strong subsidence capped the high levels of CO observed in
the boundary-layer outflow behind the cold front
Strong wind speeds throughout the troposphere allowed rapid transport of this Asian
pollution across the Pacific The upper tropospheric leading edge of the Asian CO tracer reached
the North American coast on March 10 at 12 GMT (Figure 11) It was followed one day later by
the lower tropospheric CO channeled between the low pressure system over the Gulf of Alaska
23
and the Pacific high (Figure 12) By that time some of the upper tropospheric Asian CO started
subsiding on the east side of the Pacific anticyclone off the Oregon and California coasts
72 April 14 2001
The April 14 case was discussed by Price et al [this issue] and Jaffe et al [2002] and
appears to have started as a large dust storm induced by a low-pressure system passing over the
Gobi desert on April 6 2001 [Gong et al 2002] Over the next few days the system intensified
and moved towards northeast Asia passing over areas with high anthropogenic emissions It
then rapidly crossed the Pacific and on April 13 the leading edge of the pollution plume reached
the Washington and Oregon coasts between 2 and 6 km altitude (Figures 1 and 11)
On April 14 the observed CO was significantly enhanced between 4 and 6 km altitude
reaching 173 ppbv but ozone showed little to no enhancement (Figure 7) The GEOS-CHEM
model predicts a somewhat smaller CO enhancement displaced to lower altitudes (3-5 km)
resulting from Asian CO and attributes the lower tropospheric maximum to a combination of
Asian and European influence (Figures 3 and 4) In fact European influence on CO was the
highest calculated at CPO for spring 2001 (40 ppbv) however the simultaneous decrease in
Asian contribution resulted in no overall increase in total modeled CO levels consistent with
observations This European CO plume traveled below the Asian plume and was initially
exported over the Pacific behind the low pressure system ahead of the one which caused the dust
storm By April 13 the Asian plume which is traveling at higher altitudes has caught up with
the European plume and both are arriving over North America at the same time
73 May 6 2001
On May 6 the GEOS-CHEM model captures the observed CO and ozone enhancements
between 1 and 3 km altitude (Figure 4 and 7) The CO enhancement is attributed to Asian
24
sources For ozone the model assigns the increase to a combination of a strong Asian
component and a stratospheric contribution
During the last days of April the Siberian anticyclone extended to the East over the Sea of
Okhotsk where it remained stationary for the first few days of May (Figure 13) As a cyclone
approached this blocking high from the west on May 1 the strong pressure gradients between the
two systems forced a northward surge of Asian pollution towards the Arctic The Asian
pollution traveled at low levels on the western and northern sides of the anticyclone It then
came under the influence of a developing surface low pressure system over Alaska and was
rapidly transported along a northwesterly trajectory to the NE Pacific The stratospheric
intrusion was associated with the upper-level cut-off low and mixed in with the Asian pollution
prior to its arrival over CPO We confirmed the stratospheric origin of the air by examining
TOMS total ozone satellite images and by identifying dry air in water vapor GOES-West IR
imagery and in the nearby Quillayute sounding
Because the Asian anticyclone was the dominant pressure system guiding the export of
Asian pollution most of the transport initially remained at low levels The northerly route
(compared to the March 11 case) precluded strong photochemical loss of ozone thus explaining
the large 12-15 ppbv Asian ozone above CPO (Figure 7)
8 Conclusions
During the PHOBEA-II project continuous observations of CO ozone and aerosols were
obtained between March 9 and May 31 2001 at the Cheeka Peak Observatory (483degN
1246degW 480 m) a coastal site in Washington state These observations were complemented by
twelve vertical profiles (0-6 km) conducted above CPO with a twin-engine Beechcraft Duchess
25
aircraft The PHOBEA-II project was conducted at the same time as the TRACE-P and ACE-
Asia field missions which sampled the western north Pacific troposphere The GEOS-CHEM
chemical transport model forecasts were successfully used not only to probe a number of trans-
Pacific pollution transport episodes in the NE Pacific but also to gather a representative dataset
throughout the spring
The GEOS-CHEM model provides an excellent simulation of CO observations both at the
ground and aloft reproducing average levels and day-to-day variability The models ability in
capturing CO observations implies a good understanding of CO sources (in particular Asian
sources) loss and transport mechanisms
For ozone the model yields a good simulation of the aircraft profiles but systematically
underestimates the ground-based observations by 11 ppbv The poor correlation between
observed and modeled ozone reflects the model overestimate of nearby North American
influence on ozone because of the models coarse horizontal resolution
With GEOS-CHEM simulations tagging CO and ozone according to source regions we
examined the impact of Asian and European sources on the composition of the NE Pacific
troposphere We find that 33 of CO in the 0-6 km near CPO comes from Asian sources and
16 from European sources while North American sources account for 13 At the surface
North American CO sources become more important (17) and account for 77 of the
variability in CPO observations In the 0-6 km column near CPO direct transport of ozone
produced over Asia and Europe respectively account for 12 and 5 of ozone We estimate
that the full contribution from Asian emissions to O3 in the 0-6 km column (including secondary
production of ozone from export of Asian PAN and NOx to the free troposphere) is at least 16
26
Based on back trajectories combined with observed layers of enhanced gases and aerosols
Jaffe et al [2002] identified three episodes of long-range transport of air pollutants and dust from
Asia The GEOS-CHEM model captures two of these episodes and confirms the Asian origin of
these airmasses Using the tagged CO simulation we identified an additional strong long-range
transport event in the surface observations and linked it to strong post-frontal boundary layer
outflow observed in the western Pacific during TRACE-P [Liu et al this issue Carmichael et
al this issue] In all three cases reproduced by the model both observations and model show
clear enhancements in CO However only in one of these cases is ozone enhanced This
enhancement is captured by the model and is attributed to a combination of transport of Asian
ozone at high latitudes and ozone of stratospheric origin In the other two cases the modeled
contribution from Asian ozone increases to 8-10 ppbv but the total levels of ozone are not
significantly enhanced rendering detection of Asian influence on ozone difficult Thus while
detection of ozone enhancements and attribution to Asian long-range transport is a difficult task
on the basis of observations alone combining observations with a global model driven by
assimilated meteorological observations allows a more quantitative understanding of the current
impact of Asian emissions in the NE Pacific troposphere
Acknowledgments This work was supported by funding from the National Science Foundation
(ATM-0089929) to UW-Bothell Harvard acknowledges support from the NASA Atmospheric
Chemistry Modeling and Analysis Program Lyatt Jaegleacute was supported in part by National
Science Foundation ADVANCE Cooperative Agreement No SBE-0123552 We would like to
thank the pilots at Northway Aviation (Everett WA) for their assistance during the PHOBEA-II
experiment
27
References
Akimoto H and H Narita Distribution of SO2 NOx and CO2 Emissions from Fuel Combustion
and Industrial Activities in Asia with 1ox1o Resolution Atmos Environ 28 213-225 1994
Andreae M O H Berresheim T W Andreae M A Kritz T S Bates and J T Merrill
Vertical distribution of dimethylsulfide sulfur dioxide aerosol ions and radon over the
northeast Pacific Ocean J Atmos Chem 6 149-173 1988
Berntsen TK S Karlsdottir and DA Jaffe Influence of Asian emissions on the composition
of air reaching the North Western United States Geophys Res Lett 26 2171-2174 1999
Bey I DJ Jacob RM Yantosca JA Logan BD Field A M Fiore Q Li HY Liu LJ
Mickley and MG Schultz Global modeling of tropospheric chemistry with assimilated
meteorology Model description and evaluation J Geophys Res 106 23073-23096 2001a
Bey I DJ Jacob JA Logan and RM Yantosca Asian chemical outflow to the Pacific
Origins pathways and budgets J Geophys Res 106 23097-23114 2001b
Bey I et al J Geophys Res this issue 2002
Bognar J A and J W Birks Miniaturized ultraviolet ozonesonde for atmospheric
measurements Analyt Chem 68 3059-3062 1996
Carmichael GR I Uno MJ Phadnis Y Zhang and Y Sunwoo Tropospheric ozone
production and transport in the springtime in east Asia J Geophys Res 103 10649-10671
1998
Carmichael GR and 20 others Regional-Scale Chemical Transport Modeling in Support of
Intensive Field Experiments Overview and Analysis of the TRACE-P Observations J
Geophys Res this issue 2002
28
Cooper OR JL Moody DD Parrish M Trainier TB Ryerson JS Holloway G Hubler
FC Fehsenfeld and MJ Evans Trace gas composition of midlatitude cyclones over the
western North Pacific a conceptual model J Geophys Res 107 1010292001JD000901
2002
Draxler RR and GD Hess Description of the Hysplit_4 modeling system NOAA Technical
Memo ERL ARL-224 1997
Duncan BN JA Logan I Bey RV Martin DJ Jacob and RM Yantosca Model study of
the variability and trends of carbon monoxide (1988-1997) 1 Model formulation evaluation
and sensitivity submitted to J Geophys Res 2002a
Duncan BN RV Martin AC Staudt RM Yevich and JA Logan Interannual and seasonal
variability of biomass burning emissions constrained by remote-sensed observations submitted
to J Geophys Res 2002b
Elliott S DR Blake RA Duce CA Lai I McCreary LA McNair FS Rowland AG
Russell GE Streit and RP Turco Motorization of China implies changes in Pacific air
chemistry and primary production Geophys Res Lett 24 2671-2674 1997
Fiore AM et al Background ozone over the United States in summer Origin trend and
contributions to pollution episodes J Geophys Res 107 (D15) 1010292001JD000982
2002
Fuelberg HE CM Kiley JR Hannan DJ Westberg MA Avery and RE Newell
Atmospheric transport during the Transport and Chemical Evolution Experiment over the
Pacific (TRACE-P) experiment J Geophys Res this issue 2002
29
Gong SL XY Zhang TL Zhao IG McKendry DA Jaffe and NM Lu Characterization
of soil dust aerosol in China and its transportdistribution during 2001 ACE-Asia 2 Model
simulation and validation J Geophys Res in press 2002
Heald CL et al Biomass burning emission inventory with daily resolution application to
aircraft observations of Asian outflow J Geophys Res this issue 2002
Hess P G S Flocke J-F Lamarque MC Barth and S Madronich Episodic modeling of the
chemical structure of the troposphere as revealed during the spring MLOPEX 2 intensive J
Geophys Res 105 26809-26840 2000
Huebert B T Bates P Russell J Seinfeld M Wang M Uematsu and YJ Kim An overview
of ACE-Asia Strategies for quantifying the relationships between Asian aerosols and their
climatic impacts submitted to J Geophys Res 2002
Husar RB et al The Asian dust events of April 1998 J Geophys Res 106 18317-18333
2001
Jacob DJ JA Logan and PP Murti Effect of rising Asian emissions on surface ozone in the
United States Geophys Res Lett 26 2175-2178 1999
Jacob DJ JH Crawford MM Kleb VE Connors RJ Bendura JL Raper et al The
Transport and Chemical Evolution over the Pacific (TRACE-P) mission Design execution
and overview of results J Geophys Res this issue 2002
Jaffe DA T Anderson D Covert R Kotchenruther B Trost J Danielson W Simpson T
Berntsen S Karlsdottir D Blake J Harris G Carmichael and I Uno Transport of Asian air
pollution to North America Geophys Res Lett 26 711-714 1999
Jaffe DA T Anderson D Covert B Trost J Danielson W Simpson D Blake and J Harris
Observations of ozone and related species in the northeast Pacific during the PHOBEA
30
campaigns 1 Ground-based observations at Cheeka Peak J Geophys Res 106 7449-7461
2001
Jaffe D I McKendry T Anderson and H Price Six new episodes of trans-Pacific transport of
air pollutants Atmos Environ in press 2002
Kiley CM HE Fuelberg D Allen GR Carmichael DJ Jacob C Mari PI Palmer B
Pierce K Pickering Y Tang O Wild TD Fairlie JA Logan and DG Streets An
intercomparison and validation of aircraft-derived and simulated CO from seven chemical
transport models during the TRACE-P experiment J Geophys Res this issue 2002
Kotchenruther RA DA Jaffe HJ Beine TL Anderson JW Bottenheim JM Harris DR
Blake and R Schmitt Observations of ozone and related species in the northeast Pacific
during the PHOBEA campaigns 2 Airborne observations J Geophys Res 106 7463-7483
2001a
Kotchenruther R DA Jaffe and L Jaegleacute Ozone photochemistry and the role of PAN in the
springtime northeastern Pacific troposphere Results from the PHOBEA campaign J Geophys
Res 106 28731-28743 2001b
Kritz MA JC LeRoulley and EF Danielsen The China Clipper Fast advective transport of
radon-rich air form the Asian boundary layer to the upper troposphere near California Tellus
42B 46-61 1990
Lee S-H H Akimoto H Nakane S Kurnosenko and Y Kinjo Lower tropospheric ozone
trend observed in 1989-1997 at Okinawa Japan Geophys Res Lett 25 1637-1640 1998
Li Q et al Transatlantic transport of pollution and its effects on surface ozone in Europe and
North America J Geophys Res 1010292001JD001422 2002a
31
Li Q DJ Jacob TD Fairlie H Liu RM Yantosca and RV Martin Stratospheric versus
pollution influences on ozone at Bermuda Reconciling past analyses J Geophys Res in
press 2002b
Liu H DJ Jacob LY Chan SJ Oltmans I Bey RM Yantosca JM Harris BN Duncan
and RV Martin Sources of tropospheric ozone along the Asian Pacific Rim An analysis of
ozonesonde observations J Geophys Res in press 2002
Liu H DJ Jacob I Bey RM Yantosca BN Duncan and GW Sachse Transport pathways
for Asian combustion outflow over the Pacific Interannual and seasonal variations J
Geophys Res this issue 2002
Logan JA MJ Prather FC Wofsy and MB McElroy Tropospheric Chemistry A Global
Perspective J Geophys Res 86 7210-7254 1981
Logan JA Trends in the vertical distribution of ozone an analysis of ozone sonde data J
Geophys Res 99 25553-25585 1994
Martin RV DJ Jacob JA Logan I Bey RM Yantosca AC Staudt Q Li AM Fiore
BN Duncan H Liu P Ginoux and V Thouret Interpretation of TOMS observations of
tropical tropospheric ozone with a global model and in-situ observations J Geophys Res
107(D18) 4351 1010292001JD001480 2002
Martin RV DJ Jacob RM Yantosca M Chin and P Ginoux Global and Regional
Decreases in Tropospheric Oxidants from Photochemical Effects of Aerosols J Geophys
Res submitted 2002
Mauzerall D L D Narita H Akimoto L Horowitz S Walters D A Hauglustaine and G
Brasseur Seasonal characteristics of tropospheric ozone production and mixing ratios over
32
East Asia A global three-dimensional chemical transport model analysis J Geophys Res
105 17895-17910 2000
McKendry I G J P Hacker R Stull Long-range transport of Asian dust to the Lower Fraser
Valley British Columbia Canada J Geophys Res 106 18361-18370 2001
Newell RE and MJ Evans Seasonal changes in pollutant transport to the North Pacific the
relative importance of Asian and European sources Geophys Res Lett 27 2509-2512 2000
Palmer P I D J Jacob K Chance R V Martin R J D Spurr T P Kurosu I Bey R
Yantosca A Fiore and Q Li Air mass factor formulation for spectroscopic measurements
from satellites application to formaldehyde retrievals from GOME J Geophys Res 106
14539-14550 2001
Palmer PI Inverting for Asian emissions of CO using aircraft observations during TRACE-P
J Geophys Res this issue 2002
Parrish D D C J Hahn E J Williams R B Norton F C Fehsenfeld H B Singh J
DShetter B W Gandrud and B A Ridley Indications of photochemical histories of Pacific
air masses from measurements of atmospheric trace species at Pt Arena California J
Geophys Res 97 15883-15901 1992
Prather MJ and D Ehhalt Chapter 4 Atmospheric Chemistry and Greenhouse Gases in
Climate Change 2001 The Science of Climate Change Intergovernmental Panel on Climate
Change Cambridge University Press 2001
Price HU DA Jaffe PV Doskey I McKendry and TL Anderson Vertical profiles of
ozone aerosols CO and NMHCs in the Northeast Pacific during the TRACE-P and ACE-Asia
experiments J Geophys Res this issue 2002
33
Raatz WE An anticyclonic point of view on low-level tropospheric long-range transport
Atmos Env 23 2501-2504 1989
Schubert SD RB Rood and J Pfaendtner An assimilated data set for earth science
applications Bull Am Meteorol Soc 74 2331-2342 1993
Snow JA JB Dennison DA Jaffe HU Price JK Vaughan B Lamb Aircraft
measurements of air quality in Puget Sound Summer 2001 submitted to Atmos Env 2002
Staudt A C D J Jacob J A Logan D Bachiochi T N Krishnamurti and G W Sachse
Continental sources transoceanic transport and interhemispheric exchange of carbon
monoxide over the Pacific J Geophys Res 106 32571-32590 2001
Stohl A and T Trickl A textbook example of long-range transport Simultaneous observations
of ozone maxima of stratospheric and North American origin in the free troposphere over
Europe J Geophys Res 104 30445-30472 1999
Stohl A A 1-year lagrangian climatology of airstreams in the Northern Hemisphere troposphere
and lowermost stratosphere J Geophys Res 106 7263-7279 2001
Streets DG and ST Waldhoff Present and future emissions of air pollutants in China SO2
NOx and CO Atmos Environ 34 363-374 2000
Streets DG TC Bond GR Carmichael SD Fernandes Q Fu D He Z Klimont SM
Nelson NY Tsai MQ Wang J-H Woo and KF Yarber An inventory of gaseous and
primary aerosol emissions in Asia in the year 2000 J Geophys Res this issue 2002
Thulasiraman S N T ONeill A Royer B N Holben D L Westphal and L J B McArthur
Sunphotometric observations of the 2001 Asian dust storm over Canada and the US Geophys
Res Lett 1010292001GL014188 2002
34
van Aardenne JA GR Carmichael H Levy D Streets and L Hordijk Anthropogenic NOx
emissions in Asia in the period 1990-2020 Atmos Environ 33 633-646 1999
Wild O and H Akimoto Intercontinental transport of ozone and its precursors in a three-
dimensional global CTM J Geophys Res 106 27729-27744 2001
WMO Scientific Assessment of ozone depletion 1998 World Meteorological organization
Geneva Switzerland 1999
Yevich R and JA Logan An assessment of biofuel use and burning in agricultural waster in
the developing world Global Biogeochem Cycles submitted 2002
Yienger JJ M Galanter TA Holloway MJ Phadnis SK Guttikunda CR Carmichael
WJ Moxim and H Levy II The episodic nature of air pollution transport from Asia to North
America J Geophys Res 105 26931-26945 2000
35
Figure captions
Figure 1 April 10 2001 (0 GMT) GEOS-CHEM model forecast for April 13 2001 at 6 GMT Total CO concentrations predicted at 600 hPa The location of our measurement area at and above the Cheeka Peak Observatory (CPO 483ucircN 1246ucircW) is indicated with an arrow Figure 2 Timeseries of column CO concentrations at CPO (below 6 km altitude) between March 9 and May 31 2001 The grey circles represent the observations on the twelve flight days where surface levels of CO are taken from the ground-based observations The solid black line shows the hourly GEOS-CHEM column Also shown are the individual anthropogenic contributions from Asia (black line and triangles) North America (grey line) and Europe (dashed line) from the tagged CO simulation Note the factor of two difference in scale for the total CO columns (left axis) and individual tagged components (right axis) Figure 3 Top panel March 9-May 31 2001 comparison between hourly model (black line) and observations (grey line with circles) at CPO for CO The GEOS-CHEM model is sampled at the location and altitude of CPO Bottom panel Timeseries of individual modeled contributions from Asian (solid line with triangles) North American (grey line) and European (dashed line) source regions at Cheeka Peak The arrow indicates the March 11 long-range transport event discussed in section 7 Figure 4 Profiles of CO observed during the 12 flights of the Duchess aircraft between March 29 and May 6 2001 The observations (grey circles connected by grey lines) are compared to results from the GEOS-CHEM model (black lines) sampled at the location of the observations within 24 hours of each flight Individual contributions from Asian North American and European source regions are also shown The grey square symbols indicate simultaneous observations of CO at the ground Figure 5 Scatter plot of daily averaged observed concentrations and modeled concentrations of CO and O3 for the CPO ground site (panels a and c) and aircraft profiles (panels b and d) during spring 2001 The mean mixing ratios (plusmnstandard deviations) of the measured and modeled values are indicated in each panel as well as the mean ratio between model and observations and the correlation coefficient (r2) A line with a 11 slope is indicated with a dashed line Figure 6 Top panel March 9-May 31 2001 comparison between hourly model (black line) and observations (grey line with circles) at CPO for ozone Bottom panel Timeseries of individual modeled contributions from Asian North American and European source regions at Cheeka Peak from the tagged-Ox simulation Figure 7 Ozone profiles during the 12 flights of the Duchess aircraft between March 29 and May 6 2001 The observations (grey circles connected by grey lines) are compared to results from the GEOS-CHEM model (black lines) sampled at the location of the observations within 24 hours of each flight The grey square symbols indicate simultaneous observations of CO at the ground Individual contributions from Asian North American European and stratospheric source regions from the tagged-Ox simulation are also shown Note that the individual contributions have been scaled by a factor of two for clarity
36
Figure 8 Modeled mean concentrations (0-6 km altitude) of North American Asian and European anthropogenic CO and ozone for March 9-May 31 2001 The arrows represent the tracer horizontal mass fluxes between 0 and 6 km altitude Figure 9 March 9-May 31 2001 vertical cross section at 125 Wdeg of tagged CO and ozone fluxes (shaded contours in ppbv) from North American Asian and European anthropogenic sources The dashed contour lines (in units of 10-10 moles s-1 cm-2) represent horizontal fluxes of the tracers Positive values are for westerly fluxes while negative fluxes (hatched areas) represent easterly fluxes Figure 10 March 9-May 31 2001 mean concentrations (0-6 km altitude) and vertical cross section at 125 Wdeg of Delta O3 (=standard simulation-simulation without Asian emissions) Figure 11 Time height cross section of Asian and European contributions to CO (in ppbv) at CPO The vertical lines show the timing and vertical extent of PHOBEA-II flights Figure 12 Top panels Daily Asian CO mixing ratios (in ppbv colored contours) averaged between 0 and 6 km for March 4 March 8 and March 11 2001 The arrows show averaged horizontal fluxes Bottom panels Sea level pressure for March 4 March 8 and March 11 2001 Figure 13 Top panels Daily Asian CO mixing ratios (in ppbv colored contours) at 25 km (740 hPa) for May 1 3 and 5 2001 The arrows show averaged horizontal fluxes Bottom panels Sea level pressure for May 1 3 and 5 2001
37
Table 1 Source contributions to CO over the Northeastern Pacific from the tagged CO simulationa
Source Regionsb Northeastern Pacific
0-6 km columns 35-60ucircN 165ucircW-
125ucircW
Cheeka Peak Observatory
0-6 km columns 383ucircN 1248ucircW
Cheeka Peak Observatory
383ucircN 1248ucircW 480 m
Fuel combustionc North America 18a (107) 22 a ( 129) 25 e ( 17) Europe 27 (161) 27 ( 158) 25 ( 17) Asia 46 (274) 45 ( 268) 36 ( 25) Others 02 ( 14) 02 ( 14) 2 ( 2) Biomass burning Asia 11 ( 67) 10 ( 59) 69 ( 48) Others 13 ( 81) 13 ( 78) 91 ( 62) Atmospheric Productiond 49 (296) 49 (294) 41 (28) Total 166 (100) 168 (100) 145 (100)
aValues are mean tropospheric columns (in 1017 moleculescm2) below 6 km altitude for March 9-May 31 2001 from the tagged-CO simulation Percentages are indicated in parenthesis
bSource regions are defined as follows North America (24-88ucircN1425-475ucircW) Europe (36-88ucircN 175ucircW-65ucircE) Asia (-125-88ucircN 65-153ucircE)
cFuel combustion includes fossil fuel and biofuel combustion dAtmospheric Production includes CO production from the oxidation of methane isoprene
monoterpenes acetone and methanol eIn this last column values are in mixing ratios (in ppbv) for the tagged-CO simulation sampled at the
location of CPO for March 9-May 31 2001 (Figure 3)
Table 2 Chemical contributions to odd-oxygen (Ox) over the Northeastern Pacific from the tagged Ox simulation
Source Regionsa
Northeastern Pacific 0-6 km column
35-60ucircN 165ucircW-125ucircW
Cheeka Peak Observatory
0-6 km column 383ucircN1248ucircW
Cheeka Peak Observatory Mixing ratios
383ucircN1248ucircW480 m Lower troposphere North America 37b (65) 52b (90) 70c (18) Europe 29 (51) 28 (48) 22 (6) Asia 73 (128) 69 (121) 42 (11) Pacific 66 (116) 67 (116) 66 (17) Others 47 (8) 42 (76) 26 (7) Middle troposphere 138 (241) 135 (235) 63 (16) Upper troposphere 82 (144) 79 (139) 41 (11) Stratosphere 10 (175) 10 (175) 55 (14) Total 572 (100) 572 (100) 385 (100)
aSource regions are defined as lower troposphere (700 hPa-surface) middle troposphere (700-400 hPa) and upper troposphere (400 hPa-tropopause) Subdivisions within the lower troposphere follow the same continental geographic regions which are defined in Table 1
bValues are mean tropospheric columns (in 1016 moleculescm2) below 6 km altitude for March 9-May 31 2001 from the tagged-Ox simulation Percentages are indicated in parenthesis
cIn this last column values are in mixing ratios (in ppbv) for the tagged-Ox simulation sampled at the location of CPO for March 9-May 31 2001 (Figure 6)
38
Table 3 Ox budget over the Northeastern Pacifica Budget 0-3 km 3-6 km 6-12 km Chemistry Production 172 142 103 Loss -202 -207 -077 Advection West 541 198 453 East -446 -165 -381 North -117 -246 -334 South -119 -104 -405 Vertical transport Top 184 254 328 Bottom 00 -184 -254 Deposition Wet -049 -012 -002 Dry -067 00 00 Net -103 -028 071
aResults are from the full chemistry simulation Values are in Gmolesday for March 9-May 31 2001 averaged over the NE Pacific (35-60ucircN 165ucircW-125ucircW) Positive values correspond to net sources for that region
39
Figure 1 April 10 2001 (0 GMT) GEOS-CHEM model forecast for April 13 2001 at 6 GMT Total CO concentrations predicted at 600 hPa The location of our measurement area at and above the Cheeka Peak Observatory (CPO 483ucircN 1246ucircW) is indicated with an arrow
40
Figure 2 Timeseries of column CO concentrations at CPO (below 6 km altitude) between March 9 and May 31 2001 The grey circles represent the observations on the twelve flight days where surface levels of CO are taken from the ground-based observations The solid black line shows the hourly GEOS-CHEM column Also shown are the individual anthropogenic contributions from Asia (black line and triangles) North America (grey line) and Europe (dashed line) from the tagged CO simulation Note the factor of two difference in scale for the total CO columns (left axis) and individual tagged components (right axis)
41
Figure 3 Top panel March 9-May 31 2001 comparison between hourly model (black line) and observations (grey line with circles) at CPO for CO The GEOS-CHEM model is sampled at the location and altitude of CPO Bottom panel Timeseries of individual modeled contributions from Asian (solid line with triangles) North American (grey line) and European (dashed line) source regions at Cheeka Peak The arrow indicates the March 11 long-range transport event discussed in section 7
42
Figure 4 Profiles of CO observed during the 12 flights of the Duchess aircraft between March 29 and May 6 2001 The observations (grey circles connected by grey lines) are compared to results from the GEOS-CHEM model (black lines) sampled at the location of the observations within 24 hours of each flight Individual contributions from Asian North American and European source regions are also shown The grey square symbols indicate simultaneous observations of CO at the ground
43
Figure 5 Scatter plot of daily averaged observed concentrations and modeled concentrations of CO and O3 for the CPO ground site (panels a and c) and aircraft profiles (panels b and d) during spring 2001 The mean mixing ratios (plusmnstandard deviations) of the measured and modeled values are indicated in each panel as well as the mean ratio between model and observations and the correlation coefficient (r2) A line with a 11 slope is indicated with a dashed line
44
Figure 6 Top panel March 9-May 31 2001 comparison between hourly model (black line) and observations (grey line with circles) at CPO for ozone Bottom panel Timeseries of individual modeled contributions from Asian North American and European source regions at Cheeka Peak from the tagged-Ox simulation
45
Figure 7 Ozone profiles during the 12 flights of the Duchess aircraft between March 29 and May 6 2001 The observations (grey circles connected by grey lines) are compared to results from the GEOS-CHEM model (black lines) sampled at the location of the observations within 24 hours of each flight The grey square symbols indicate simultaneous observations of CO at the ground Individual contributions from Asian North American European and stratospheric source regions from the tagged-Ox simulation are also shown Note that the individual contributions have been scaled by a factor of two for clarity
46
Figure 8 Modeled mean concentrations (0-6 km altitude) of North American Asian and European anthropogenic CO and ozone for March 9-May 31 2001 The arrows represent the tracer horizontal mass fluxes between 0 and 6 km altitude
47
Figure 9 March 9-May 31 2001 vertical cross section at 125 Wdeg of tagged CO and ozone fluxes (shaded contours in ppbv) from North American Asian and European anthropogenic sources The dashed contour lines (in units of 10-10 moles s-1 cm-2) represent horizontal fluxes of the tracers Positive values are for westerly fluxes while negative fluxes (hatched areas) represent easterly fluxes
48
Figure 10 March 9-May 31 2001 mean concentrations (0-6 km altitude) and vertical cross section at 125 Wdeg of Delta O3 (=standard simulation-simulation without Asian emissions)
49
Figure 11 Time height cross section of Asian and European contributions to CO (in ppbv) at CPO The vertical lines show the timing and vertical extent of PHOBEA-II flights The arrows indicate the three long-range transport events discussed in section 7 (March 11 April 14 and May 6 2001)
50
Figure 12 Top panels Daily Asian CO mixing ratios (in ppbv colored contours) averaged between 0 and 6 km for March 4 March 8 and March 11 2001 The arrows show averaged horizontal fluxes Bottom panels Sea level pressure for March 4 March 8 and March 11 2001
51
Figure 13 Top panels Daily Asian CO mixing ratios (in ppbv colored contours) at 25 km (740 hPa) for May 1 3 and 5 2001 The arrows show averaged horizontal fluxes Bottom panels Sea level pressure for May 1 3 and 5 2001
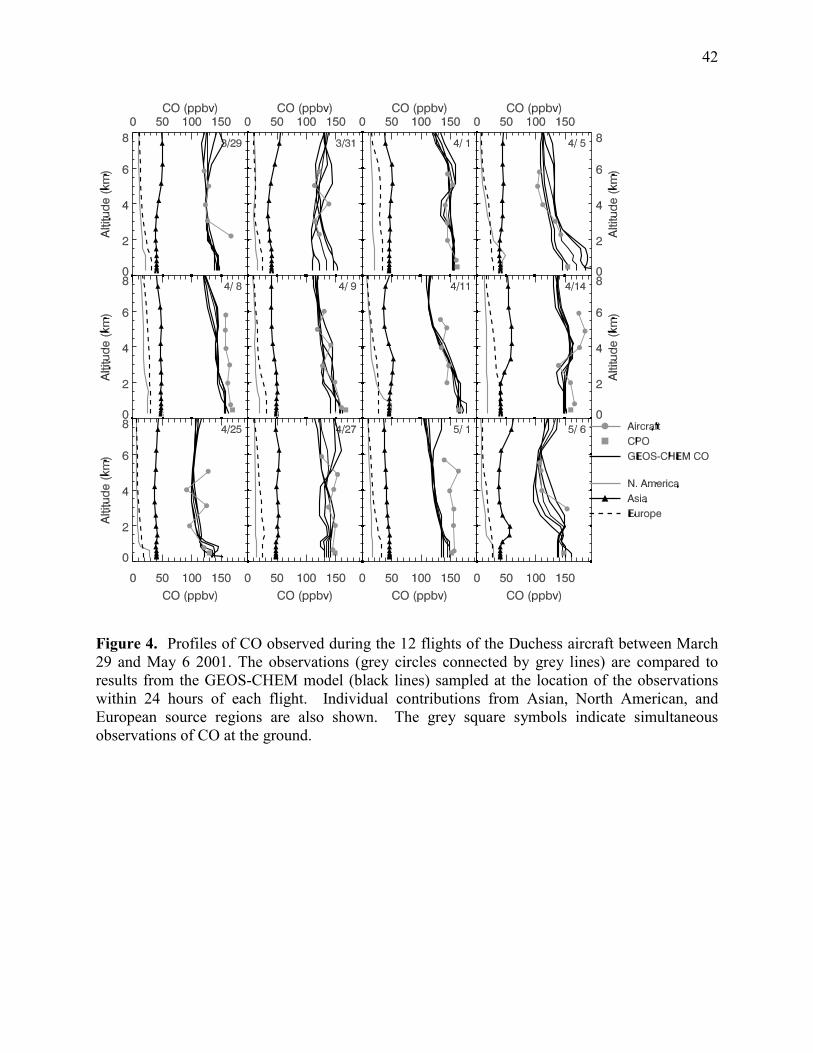

51
Figure 13 Top panels Daily Asian CO mixing ratios (in ppbv colored contours) at 25 km (740 hPa) for May 1 3 and 5 2001 The arrows show averaged horizontal fluxes Bottom panels Sea level pressure for May 1 3 and 5 2001