Embed Size (px)
Citation preview
Report Number:
2014
Source of Time and Cost Over-runs in Roadworks Projects – Pilot Study
SRI LANKA
Pub
lic D
iscl
osur
e A
utho
rized
Pub
lic D
iscl
osur
e A
utho
rized
Pub
lic D
iscl
osur
e A
utho
rized
Pub
lic D
iscl
osur
e A
utho
rized
i
Standard Disclaimer
This volume is a product of the staff of the International Bank for Reconstruction and Development
(IBRD) / The World Bank. The findings, interpretations, and conclusions expressed in this paper do
not necessarily reflect the views of the Executive Directors of The World Bank or the Governments
they represent. The World Bank does not guarantee the accuracy of the data included in this work.
The boundaries, colors, denominations, and other information shown on any map in this work do
not imply any judgment on the part of The World Bank concerning the legal status of any territory
or the endorsement or acceptance of such boundaries.
Copyright Statement
The material in this publication is copyrighted. Copying and / or transmitting portions or all of this
work without permission may be a violation of applicable law. The International Bank for
Reconstruction and Development (IBRD) / The World Bank encourages dissemination of its work
and will normally grant permission to reproduce portions of the work promptly.
Copyright © 2015 The World Bank 1818 H Street, NW Washington, DC 20433
ii
ACKNOWLEDGEMENTS
This report was written by Professor Mohan Kumaraswamy (Consultant) under the task managed by Haider Raza, Senior Procurement Specialist. All those who provided assistance from the World Bank, RDA, PRP, their consultants, contractors and DAB members etc. are gratefully acknowledged for sharing their information and knowledge. Since impossible to provide a complete picture of each contribution in such a pilot study report, it is hoped that the summarized observations presented herein are a reasonable representation and useful consolidation of the collective experiences gathered from the targeted project samples. Particular thanks are due to Senior Procurement Specialist Haider Raza for his guidance, support and advice in the data collection and also kindly improving the format and presentation of this report.
About Professor Mohan Kumaraswamy
Professor Mohan Kumaraswamy is now an Honorary Professor of The University of Hong Kong, having taught and researched there from 1992 to 2013. His B.Eng. (Civil) is from Peradeniya, Sri Lanka. He later obtained an MSc in Construction Management, a PhD on ‘evaluating the management of construction projects’ and more recently, a DSc from Loughborough University, UK. His DSc was based on ‘Construction Industry Development’. He worked on designs, construction and construction management in Sri Lanka and Nigeria, was a Construction Manager and then a Director of the pioneering construction project management company in Sri Lanka. He led many innovative projects and internationally funded consultancies before leaving for Hong Kong. He is presently carrying out a study for the World Bank in Colombo. While based in Hong Kong, he also led many inter-University research projects and won international awards for publications, as well as University Outstanding Research Student Supervisor Award in 2010. He has also been a Visiting Professor at the National University of Singapore and more recently at Curtin University, Australia, and an External Examiner at many overseas Universities. Mohan has also been active in professional bodies, including the Institution of Engineers Sri Lanka, the Chartered Institute of Building (CIOB), where he was the Sri Lanka representative until 1992, and a Vice Chairman of CIOB Hong Kong in 1996-97 and the Hong Kong Institution of Engineers, where he was Chairman of the Civil Division in 1997-98. He has also served in committees of industry development bodies such as the Hong Kong Construction Industry Council. He is the Founding Director of the ‘Centre for Infrastructure & Construction Industry Development’ (CICID) based at the University of Hong Kong. He is also a Joint Co-ordinator of the international Task Force TG72 on Public Private Partnerships of the CIB - International Council for Research and Innovation in Building and Construction. He is on the editorial boards of many international journals and is Editor-in-Chief of the journal of ‘Built Environment Project and Asset Management’ (BEPAM).
iii
ACRONYMS
ADB – Asian Development Bank
BOQ – Bill of Quantities
DAB – Dispute Adjudication Board
EOT - Extension of Time GOSL – Government of Sri Lanka
ICTAD - Institute for Construction Training and Development
IDA – International Development Association
JICA – Japan International Cooperation Agency
LKR – Sri Lanka Rupees
MPC - Ministry Procurement Committee
PRP – Provincial Roads Project
RDA – Road Development Authority
RSAP - Road Sector Assistance Project
SAC – Statement at Completion
VAT – Value Added Tax
WB – World Bank
WB.SBD.PW - World Bank Standard Bidding Documents for Procurement of Works
WB.SBD.PSW - World Bank Standard Bidding Documents for Procurement of Small Works
iii
TABLE OF CONTENTS
EXECUTIVE SUMMARY ................................................................................................................................................ 1
1 BACKDROP, AIM, SCOPE AND METHODOLOGY .................................................................................................. 5
1.1 BACKDROP ......................................................................................................................................................... 5
1.2 AIM .................................................................................................................................................................... 5
1.3 SCOPE ................................................................................................................................................................ 5
1.3.1 Base-line for ‘Over-runs’ ............................................................................................................................... 5
1.3.2 Data Sources ................................................................................................................................................. 6
1.3.3 Limitations .................................................................................................................................................... 6
1.4 METHODOLOGY ................................................................................................................................................ 6
1.4.1 Strategy ......................................................................................................................................................... 6
1.4.2 Methods Summary ........................................................................................................................................ 6 1.4.2.1 Interviews ............................................................................................................................................................. 6 1.4.2.2 Documents Review ............................................................................................................................................... 6
2 BACKGROUND TO TIME AND COST OVER-RUNS IN ROADWORKS ...................................................................... 7
2.1 GLOBAL SCENARIO - SAMPLES OF SOURCES, CAUSES AND SUGGESTIONS ........................................................ 7
2.2 SRI LANKAN BACKDROP – INDUSTRY BACKGROUND: RELEVANT OVERVIEW .................................................. 10
2.3 SRI LANKAN SCENARIO – EXAMPLES FROM PREVIOUS SAMPLES .................................................................... 11
3 EXAMPLES OF OVER-RUNS AND DOCUMENTED REASONS ................................................................................13
3.1 PREAMBLE ....................................................................................................................................................... 13
3.2 PRP - PROVINCIAL ROADS PROJECT ................................................................................................................. 13
3.3 RSAP - ROAD SECTOR ASSISTANCE PROJECT.................................................................................................... 15
4 INTERVIEWS ......................................................................................................................................................18
4.1 INTERVIEW TARGETS AND FORMATS .............................................................................................................. 18
4.1.1 Objectives, strategy, structure and formats: .............................................................................................. 18
4.1.2 Schedule of Main Interviews: ...................................................................................................................... 19
4.2 SAMPLE EXTRACTS FROM EXPERIENTIAL OBSERVATIONS .............................................................................. 19
4.2.1 Sample observations from Employers (RDA & PRP) and Funding Agency personnel & consultants ........... 20
4.2.2 Sample observations from Consultants ...................................................................................................... 22
4.2.3 Sample observations from Contractors....................................................................................................... 23 4.2.3.1 General: .............................................................................................................................................................. 23 4.2.3.2 Employer: ............................................................................................................................................................ 24 4.2.3.3 Engineer: ............................................................................................................................................................. 24 4.2.3.4 Contractor ........................................................................................................................................................... 24
4.2.4 Sample observations from DAB members ................................................................................................... 24
5 POTENTIAL SOURCES, POSSIBLE CAUSES AND POINTERS TO IMPROVEMENT AREAS .........................................26
5.1 IDENTIFIED COMMON SOURCES AND POSSIBLE CAUSES OF TIME AND COST-OVER-RUNS ............................ 26
5.1.1 Preamble ..................................................................................................................................................... 26
5.1.2 Principal Common Sources and apparent Causes of Over-runs identified from this pilot study ................. 26
5.2 POINTERS TO A SAMPLE OF ‘POTENTIAL AREAS FOR IMPROVEMENT’ ............................................................ 31
iv
5.2.1 Preamble ..................................................................................................................................................... 31
5.2.2 Sample of ‘Important Issues’ with ‘suggested areas for improvement’ ..................................................... 31
5.3 EXAMPLES OF FOCUS AREAS FOR IN-DEPTH INVESTIGATION ......................................................................... 34
5.3.1 Focus area examples ................................................................................................................................... 34
5.3.2 Preliminary suggestions on strategies for In-depth Investigation and follow-up Implementation ............ 34
REFERENCES, BIBLIOGRAPHY AND ACKNOWLEDGEMENTS ........................................................................................36
APPENDICES AND TABLES ..........................................................................................................................................40
APPENDIX 1: PREVIOUS EXAMPLE FROM ELSEWHERE (HONG KONG) OF A ‘CASUAL HIERARCHY’ OF CONSTRUCTION CLAIMS ............... 41
APPENDIX 2 (A): PREVIOUS EXAMPLE FROM ELSEWHERE (HONG KONG) OF A SAMPLE PROFILE OF TIME OVER-RUNS ........................ 42
APPENDIX 2 (B): PREVIOUS EXAMPLE FROM ELSEWHERE (HONG KONG) OF A SAMPLE PROFILE OF COST OVER-RUNS ........................ 43
TABLE 1: PRP - MAY 2014 SUMMARY OF RECOMMENDED EOT ............................................................................................ 44
TABLE 2A: PRP ‘APPROVED COSTS’ AND ‘% INCREASES’ STATUS SUMMARY – UVA PROVINCE ......................................................... 45
TABLE 2B: PRP ‘APPROVED COSTS’ AND ‘% INCREASES’ STATUS SUMMARY – EASTERN PROVINCE ................................................... 47
TABLE 2C: ‘APPROVED COSTS’ AND ‘% INCREASES’ STATUS SUMMARY - PRP - NORTHERN PROVINCE ............................................... 48
TABLE 3: RSAP -1: ‘APPROVED COSTS’ AND ‘% INCREASES’ STATUS SUMMARY ............................................................................ 49
TABLE 4: ROAD SECTOR ASSISTANCE PROJECT I: TIME OVER-RUNS & COMPARISON....................................................................... 50
TABLE 5: EOT ON RSAP PHASE 2_K-T SECTION .................................................................................................................... 51
TABLE 6: EOT ON RSAP RURAL ROADS................................................................................................................................ 52
1
EXECUTIVE SUMMARY
While time and cost over-runs seem almost endemic in physical infrastructure projects in many countries,
they were perceived to be reaching substantial levels in some roadworks contracts in Sri Lanka. This pilot
study was formulated to identify any common sources of such over-runs and to discern any patterns. The
aim was to assess a sample of recent contracts, to identify typical levels of over-runs and any general patterns,
any common sources of over-runs, any common ‘causes’ that trigger over-runs from such sources, as well as
any potential areas for further investigation.
Data was sampled as planned, from two World Bank funded projects – the ‘Road Sector Assistance Project’
(RSAP) and the Provincial Roads Project (PRP). Apart from comparing with previous studies of related aspects
in other countries and Sri Lanka, the main research methods in this pilot study comprised: (a) document
review & analyses; and (b) interviews of a cross-sectional sample of stakeholders.
An over-run is taken here, to be the percentage increase above the contracted ‘period’ or ‘price excluding
contingencies’ on each contract. While over-runs arising from common causes such as design and contract
document errors, omissions and ambiguities had reduced over time in a few jurisdictions, the general levels
in many countries are still substantial. For example, major over-runs are often attributed to rework and to
variations or change-orders due to scope changes or site conditions, apart from design/documentation
shortcomings. Many other common causes are evident worldwide, including for example, adverse
repercussions from unrealistically low prices in some cases. For example, one recent study in Sri Lanka, on
delays based on a sample of 24 projects funded by WB, ADB and JICA, indicated an average delay of 69%,
while variations/ extra work accounted for 56% of these delays.
The following samples from the current exercise are only indicative, since both the PRP and RSAP projects
are ongoing and many claims, evaluations and settlements even on completed contracts are pending.
1. Provincial Road Project (PRP)
1.1 the EOT against time claims evaluated so far over 11 contracts, range from 7.5% to 48.6%
with an average of 28.8%, the main contributor being EOT related to ‘quantity increases’;
and.
1.2 the cost over-runs on quantity increases evaluated so far, average out at only 0.8%,
apparently due to ‘minuses’ on some contracts compensating for ‘pluses’ on others (the
lowest being –38.1%). Variations so far averaged 19.5%, the highest on a contract being
53.0%. ‘Price escalations’ so far averaged out at 12.8%. However, 6 major claims sources are
still pending.
2. Road Sector Assistance Project (RSAP)
2.1 the EOT granted so far on Phase 1, averaged 69.8%, ranging from 7.6% to 180.7% over 12
contracts;
2.2 the cost over-runs so far on Phase 1, averaged 86.5%, ranging from 51.5% to 132.4%;
2.3 in the eastern section of Phase 2 comprising 4 contracts, the EOT varied from 15.0% to 28.6%;
2
2.4 in the ‘rural roads pilot’ segment, the average EOT was 47.6% and the average increase in
contract prices was 28.3%. One of the general observations was that the evaluated
Liquidated Damages for delays appeared to be not always applied in the settlements by the
borrower.
A host of ‘common sources’ and possible underlying causes of over-runs was unearthed, based on analyses
of the detailed data obtained and the in-depth interviews with a representative range of the main project
participants. Examples of common sources include:
1. inadequate site investigations;
2. incomplete and/or delayed and/or inaccurate designs;
3. ambiguities within contract documents;
4. discrepancies between contract documents;
5. sub-standard performance - of contractors and/or consultants;
6. delays from overall contract administration;
7. excessive rework;
8. major variations to meet public/ political needs;
9. inadequate dispute avoidance and/or resolution strategies and mechanisms;
10. high price adjustment (escalation) assessments
11. lack of standard methodologies for evaluating EOT etc.
Possible ‘underlying causes’, meriting further investigation included among others:
1. inadequate time and/or budget for design and for design review; and/or
2. shortfalls in design team capacities / experience;
3. inadequate upfront public engagement;
4. misinterpretations and misuse of Quality Assurance/ Control expectations;
5. ambiguities and loop-holes in contract documents;
6. lack of tangible deterrents to discourage non-compliance e.g. if not submitting realistic programmes
with resource loadings, method statements, etc.
Improvements could arise from addressing:
1. all the unveiled possible common causes of over-runs; and
2. overall project governance with stronger ‘employer’/ client oversight in general.
Also, examples of specific ‘potential improvement areas’ include
3. consultant and contractor selection and management, e.g. with higher weightings for potential
performance predictors, tangible deterrents/credits for non-compliance/good performance e.g. to
impact future tender opportunities and scores;
4. demarcation of responsibilities for designs, design reviews, working drawings, approvals etc.;
3
5. cost increase thresholds for applying ‘no objections’ on price rises against total ‘contract price less
contingencies’, as well as on specific critical items - e.g. to revisit and revise current thresholds (to
remove any contingencies ‘cushion’) and to introduce new ones;
6. identified contractual ambiguities and shortfalls e.g. in contract clauses on - price adjustments,
increase in quantities, EOT evaluation – e.g. to improve EOT evaluation capacities and develop
standard protocols to be trialed and recommended/ required.
All potential improvement areas, in turn merit ‘in-depth investigation’, as indeed do the possible common
causes of over-runs, since identifying and addressing the underlying root causes should be the goal. Such an
in-depth study may also prioritize what needs addressing in: (a) a road map to the desired destination of
‘reduced time and cost over-runs’ with target milestones e.g. on start and finish dates for tasks such as
‘rationalization / upgrades of standard contract clauses linked to over-runs etc.’; and (b) a preliminary but
well structured ‘action plan’ for any urgent upgrades.
Identified system shortcomings will need systemic solutions that address root causes. Pilot study outcomes
indicate needs for revamping both hard and soft systems e.g. with a ‘culture’ shift that embeds imperatives
and evokes commitment for both comprehensive planning and rigorous controls. Excellent change
management will also be needed. However, ‘in-depth investigation’ of some areas are needed before
embarking on such major transformations.
Examples of areas for ‘in-depth investigation’ before launching major transformational improvements are:
A. on injecting cut-off milestones into a project programme, so that, subject to exceptional
circumstances and with ‘top level’ approvals, there will be milestones to ‘freeze’ and ‘sign-off’ at high
levels: (A1) the design brief; (A2) the design; and (A3) the BOQs, specifications and other contract
documents. To make such requirements more viable and acceptable, it may be considered to
simultaneously introduce: [i] Value Engineering reviews before freezing designs, and [ii] ‘carrot/stick’
incentives for the ‘signing off’ teams, e.g. with special recognition including for career advancement,
when their outputs fare better (trigger less problems downstream) and vice versa.
B. on improving dispute minimization and dispute resolution protocols and mechanisms e.g. with stock-
taking of current strengths/ weaknesses and potential of Dispute Adjudication Boards in both
contractual provisions and practice. A well-structured industry forum involving a cross-section of
stake-holders, could be a starting point to drill into underlying issues and brainstorm possible ways
forward.
C. on examining the feasibility of developing a management aid like a ‘Over-run Hotspots Dashboard’
(or ‘Over-runs Alert Indicator’) – to help top management to anticipate and hence, better control
potential ‘over-run hotspots’. While certain techniques may turn out to be similar to some of those
in risk appraisals, dynamic databases of over-runs on previous similar contracts, could be designed
and codified to spotlight sources and causes that commonly spark over-runs of higher (1) magnitude,
4
(2) frequency and (3) avoidability. Color-codes and relative-ratings could provide a quick-menu
interface.
This would necessarily be a dynamic system, since new hotspots would supersede those that have
been successfully minimized etc., but overall magnitudes and frequencies would hopefully decrease
with time and effort.
D. on prioritizing the areas for improvement; then selecting higher priority initial recommendations to
be ‘trialed’ in ‘pilot’ projects or contracts. Indeed, recent experience elsewhere indicates that, if
reasonably confident of the value and viability of the systems and practices being trialed, publicizing
these as ‘demonstration’ projects/ contracts and deploying capable and committed teams on these,
increases the chances of success of such ‘pilot’ exercises, followed by smoother implementation
thereafter.
5
1 BACKDROP, AIM, SCOPE AND METHODOLOGY
1.1 BACKDROP Built infrastructure projects worldwide, are often vulnerable to various performance shortfalls unless
carefully planned and controlled from the outset. Apart from quality, environmental and/or health & safety
shortfalls, roadworks projects seem particularly prone to time and cost over-runs. Such over-runs can be
substantial if not overwhelming, from a base-line of a ‘decision to proceed’ that is based on initial estimates
of cost and time, to final hand-over and accounts (Flyvbjerg et al., 2002). Indeed these over-runs can be
significant, even from a base-line of the signed construction contract i.e. based on agreed contract price and
duration.
The sources of such time and cost over-runs could be diverse, ranging broadly for example, from
inappropriate procurement strategies and protocols, through incomplete and/or unsuitable designs, sub-
optimal tenderer-contractor planning and/or estimating, to poor construction management and/or contract
administration (Kumaraswamy, 1997a; Park and Papadopolou, 2012; Rosenfield, 2014; Love et al., 2014 a).
1.2 AIM Growing apprehensions of excessive time and cost over-runs in roadworks projects in Sri Lanka, led to
launching this independent pilot study (a) to assess to what extent such concerns are justified in terms of
time and cost over-run levels and any general patterns, based on two sample projects (RSAP and PRP); and
to identify (b) likely common sources of such shortfalls; and (c) focus areas for a more extensive and in-depth
study to identify root causes for specific attention. The findings are also expected to provide pointers to
potential areas for improvement.
It is expected that stakeholders such as the Government of Sri Lanka, the World Bank, other development
partners and implementation agencies, could benefit from the pilot study findings, as well as the envisaged
follow-up exercises, that would spotlight areas needing closer attention to elicit better time and cost
performance levels and thereby enhanced value for money, in the planning and implementation of
roadworks projects in Sri Lanka.
Apart from the above direct benefits, it is also expected that the unearthed sources and possible common
causes may also provide useful pointers to some generic underlying issues, for example arising from similar
contract documents and/or operational protocols that could adversely affect similar projects elsewhere.
1.3 SCOPE
1.3.1 Base-line for ‘Over-runs’
The base-line against which over-runs are assessed for this pilot study is the signed construction contract so
that any increases are against agreed contract price and duration. Setting an earlier base-line e.g. at project
appraisal stage would probably highlight higher over-runs, but it would have blurred the focus by shifting
attention to necessarily less accurate upstream estimates of time and cost. The current starting point, enables
the required focus on the performance of the selected contract teams, including the consultants, contractors
and contract administrators on each package.
6
1.3.2 Data Sources
Given the time-frame of the study, and the confidentiality of sensitive issues, hence limited access to details
of this type of data in general, as well as the need to assess reasonably similar and recent samples, two recent
World Bank supported roadworks projects, namely: (i) the Road Sector Assistance Project (RSAP) and (ii) the
Provincial Roads Project (PRP) were identified for sampling.
1.3.3 Limitations
This was formulated as a ‘pilot study’, hence the time-frame and data sources were limited, but considered
appropriate. Correspondingly, the findings should be considered in this context and cannot be generalized.
While providing reasonable first order conclusions on common over-run sources in similar projects, and
further pointers as targeted in the above ‘Aim’, the findings, interim conclusions and suggestions, merit
testing and verification against larger samples, more quantitative data, consequential further analysis,
consolidation and validation before they could be developed into definitive conclusions and
recommendations.
1.4 METHODOLOGY
1.4.1 Strategy
This was formulated to discern any common sources and perceived general patterns in terms of frequencies
and relative magnitudes of the time and cost over-runs under different ‘claims/ compensation heads’ (and/or
arising from different sources) in roadworks projects in the RSAP and PRP projects. The data and hence
findings are primarily based on (A) interviews and discussions with relevant parties and (B) available
documents, as received from the Colombo offices of the World Bank, the RDA RSAP project office and the
PRP project office.
1.4.2 Methods Summary
1.4.2.1 Interviews
in two stages - (I) to probe and extract (prior to structuring, consolidating and prioritizing) the relevant
experiential knowledge of at least one representative each of the major stakeholders (relevant World Bank
team, implementing agencies, employers, consultants and contractors) and at least one ‘external’/
independent expert (in this case, DAB members), after the start of the document survey; and (II) to obtain
initial feedback from some of the same major stakeholders on specific relevant aspects of the preliminary
findings and related questions that arose, in terms of perceived general common sources of time and cost
over-runs.
1.4.2.2 Documents Review
of relevant documents as made available for this study from the Colombo offices of the World Bank, the RDA
RSAP project office and the PRP project office These comprised mainly of procurement plans, contract
documents, progress reports and summary statements and breakdowns where available.
7
2 BACKGROUND TO TIME AND COST OVER-RUNS IN
ROADWORKS
2.1 GLOBAL SCENARIO - SAMPLES OF SOURCES, CAUSES AND SUGGESTIONS
Time and cost ‘creep’ throughout a project cycle is common in many countries with roadworks projects being
particularly vulnerable, arguably given more variables across more extensive terrains than some other forms
of built infrastructure. This is to some extent understandable before construction contracts are signed, for
instance arising from potentially significant changes in requirements / priorities, hence in finally chosen
options, e.g., on both physical and procurement routes. However, after such fundamental choices and even
after detailed designs, the over-runs from the point after the construction contract is signed, have attracted
attention but often defied initiatives to control them in many jurisdictions.
This has triggered many studies such as the current one, to identify the common sources or causes, so that
these may be addressed more carefully. The following summarizes some relevant examples from a random
sample, in turn derived from a cross-section of some such recent studies, that this consultant has come across
recently.
Love et al. (2014b) cited a number of previous investigations worldwide, including one that had found
excessive increases due to ‘rework’ alone, others finding ‘scope changes’ to be responsible for large over-
runs e.g. one finding ‘change orders’ accounting for 50 % of cost over-runs and 20% of late delivery, while
interestingly, ‘errors and omissions in contract documentation’ were found to range from between 5% to
20% of a project’s contract value. They also cited previous suggestions for mitigating over-runs e.g., enhanced
performance monitoring, reporting and information sharing; enhanced accountability and responsibility for
overruns against benchmarks, enhanced staff capacities, state-of-the art forecasting, as well as increased
completeness and rigor of early plans.
Refreshingly, not all scenarios are consistently negative, e.g. Love et al. (2014a) cited a 2011-published study
of road and bridge projects in Massachusetts, USA where nearly 50% were over–budget and 33% were over-
run. This implies that it had been possible to control the others. They also cited a 2011-published study of
Australian infrastructure projects which found that less than 48% of the sample were delivered on time,
budget and to the required quality. This too indicates that it is not impossible to control time and cost.
However their own survey of 58 transportation projects in Australia revealed mean rework costs of 11.2%,
cost over-runs of 13.3% and schedule over-runs of 8.91%.
Earlier and in the USA again, Bordat et al. (2004) after a detailed analysis of Indiana Department of
Transportation projects between 1996 and 2001, found that cost over-runs averaged 4.5% and were found
in 55% of the projects, while 12% of the projects incurred delays. However, assessing the total quantum of
the cost over-run to represent about 9% of the budget available for contracts, they recommended measures
to reduce this, e.g.; with a ‘Change-Order Management process’ and annual reports reviewing the
performance of consultants, and ‘assigning grades’, also taking into account the value and frequency of
‘preventable change orders attributable’ to them.
8
A worldwide cross-section would of course include special situations where over-runs may be unsurprisingly
much higher, for example as reported by Enshassi et al. (2009) with related recommendations. Rosenfield
(2014) on the other hand identified 146 potential causes of construction cost over-runs derived from a range
of international literature and local experts, based on which he filtered and ranked 15 ‘independent universal
root causes’. The top three, were (i) premature tender documents, (ii) too many changes in owners’
requirements or definitions and (iii) unrealistically low tender-winning prices (suicide tendering). Of course
these are not universally applicable, e.g. one would think that the third ranked root cause depends on the
‘market’, e.g. is less applicable when there are plenty of contracts available compared to those eligible to bid
for them e.g., as in Sri Lanka now. Apart from the root cause analysis, Rosenfield (2014) provides a useful
recent summary review of the international literature from which he extracted the 146 potential causes.
One set of studies drawn upon in the above paper, was based in Hong Kong. Based on a series of surveys and
project data analyses, Kumaraswamy (1997a) developed a hierarchy, comprising: (a) ‘common categories’ of
claims heads such as ‘ambiguities in contract documents’, (b) ‘common proximate causes’ such as
inappropriate contract forms, derived from the above ‘common categories’, and (c) ‘common root causes’
such as ‘unclear risk allocation’ in turn based on the ‘common proximate causes’. This basic Hong Kong based
hierarchy is in Appendix 1.
While remedies were explored, e.g. in more ‘appropriate appraisal and apportionment of megaproject risks'
(Kumaraswamy, 1997b), more in-depth analyses were conducted e.g. on the use and abuse of claims, while
profiles of both relative magnitudes and frequencies of both time and cost over-runs from the Hong Kong
samples were presented (Kumaraswamy, 1997a,b) as in Appendix 2 which contains two examples.
Parallel research exercises in Hong Kong helped triangulate the findings. These included studies on
'contributors to construction delays' (Kumaraswamy and Chan, 1998) and on ‘contributors to time and cost
performance in building projects’ (Dissanayake and Kumaraswamy, 1999). Drilling deeper below specific
‘hotspots’ that generated disputes arising from divergent interpretations, Kumaraswamy and Yogeswaran
(1999) expanded on principles and practices in ‘evaluating time extension entitlements’; while
Palaneeswaran and Kumaraswamy (2008) developed on this to develop an ‘integrated Decision Support
System for dealing with time extension entitlements’. In addition, from a more holistic and ‘prevention better
than cure’ perspective, Kumaraswamy and Yogeswaran (1998) developed a ‘claims focus indicator’ based on
three chosen dimensions of relative magnitude, relative frequency and ‘avoidability’ to anticipate and
thereby address in advance, the ‘significant sources of construction claims’ in specific contractual regimes.
For example, such prior knowledge could guide top management of employers, funding bodies and
consultants to focus their best efforts and high-end resources e.g. top management time, on minimizing the
more ‘avoidable’, more frequent and/or usually higher value claims.
Recent studies convey insights into examples from other Asian scenarios. For example, Park and Papadopolou
(2012) identified 27 causes of cost over-runs and assessed their severity and frequency based on data from
35 transportation projects completed between 1983 and 2010 across 12 South Asian and East Asian
countries. They concluded that ‘awarding contracts to the lowest bidder’ was the most significant cause of
9
cost over-run in their sample, while also linking lump sum contracts to the ‘greatest occurrence’ of such over-
runs. Shehu et al. (2014) focusing on Malaysia, examined factors contributing to both time and cost over-run
and concluded that delays there were mostly attributable to contractors, with their financial factors,
specifically ‘cash flow problems’ being the major culprit.
Of course various specific causes (whether ‘proximate’ or ‘root’ cases) may dominate to differing degrees in
different jurisdictions. However, one generic approach to reducing disputes and the consequential waste of
resources and time (which parties may in turn attempt to recover through further claims and counter-claims)
has been to encourage structured co-operation between contracting parties and their agents, including
consultants, sub-contractors etc. Collaborative project delivery modalities such as ‘partnering’ have been
strongly encouraged in high powered industry reports such as in the UK (Latham, 1994, Egan, 1998) and Hong
Kong (CIRC, 2001). Industry, finding merit in these recommendations has developed contractual formats and
practices that have progressed from non-contractual to contractual partnering (e.g. using the New
Engineering Contract of the Institution of Engineers UK, also used outside the UK e.g. in Hong Kong),
alliancing, as in Australia and ‘integrated project delivery’, as in the USA. These practices are based on the
principles of ‘relational contracting’ which makes allowance for ‘incomplete contracts’, i.e. acknowledging
that all eventualities cannot be clearly defined in black and white, hence contracting parties should co-
operate to handle unforeseen risks in the best win-win approach, rather than waste resources ‘passing the
buck’ to each other.
Caveats are of course in order, e.g., on where to ‘draw the line’, so that ‘partnering’ is not abused and/or does not degenerate into collusion, as well as on relevant legal implications (Kumaraswamy, 2006). On the other hand, the lack of good relationships could by itself, lead to ‘cost growth’ (Dada, 2014), while the potential benefits from co-operation across project teams are almost axiomatic and a host of studies and experiences in different jurisdictions testify to this e.g. (a) in a general comparison of ‘multi-country perspectives of relational contracting and integrated project teams’ (Rahman and Kumaraswamy, 2012); and (b) with longer-term ‘Relationally Integrated Value Frameworks’ formulated for ‘supercharging supply chains’ toward increased value for all stakeholders in general (Kumaraswamy et al., 2010), while retaining competitive elements within networks, targeting ‘co-opetition’ i.e co-operating to form competitive teams that can achieve much higher overall value for money.
On the other hand, when failures to settle issues at the lowest possible level, escalate into avoidable claims
and disputes involving top management, these tend to snowball with or without the potential personality
clashes, dragging in secondary issues that may have otherwise been amicably dealt with upstream. A recent
survey of the causes of disputes by a leading international project management and consultancy firm (E.H.
Harris/ Arcadis, 2014), revealed the following top five causes of disputes, ranked from 1 (most frequent) to
5: (1) Failure to properly administer the contract; (2) Failure to understand and/or comply with its contractual
obligations by the Employer/ Contractor/ Subcontractor; (3) Incomplete Design Information or Employer
requirements; (4) Failure to make interim awards on extensions of time and compensation; (5) poorly drafted
or incomplete and unsubstantiated claims. It should be noted that the above are based on a sample limited
to disputes that this particular international group has been involved with, but the unveiled causes, whatever
their ranking, would sound familiar in many countries including Sri Lanka, and are thus relevant to the current
study.
10
2.2 SRI LANKAN BACKDROP – INDUSTRY BACKGROUND: RELEVANT OVERVIEW Sri Lanka’s rich heritage of infrastructure megaprojects can be traced back well over two millennia, ranging
from well-planned and skillfully designed and built infrastructure megaprojects, including complex irrigation
works, comprising systems of reservoirs, canals and village tanks, religious super-structures etc. In more
recent times from about half a century ago, the construction industry was subjected to stop-go work demand
fluctuations that took a toll on its developed resources and capacities. However, the recent upsurge in
construction activities has stretched the domestic industry again, opening doors to more overseas
contractors, given the limited numbers of local contractors with the expected track records on megaprojects.
On the other hand some local contractors are handling jobs overseas.
Acknowledging that significant top-down improvements are needed, even that the ‘Sri Lankan Construction
Industry needs a resurrection on properly formed policies which are guiding tracks of a Master Plan’, a
‘Roadmap Towards Construction Industry Master Plan’ was recently issued by the Ministry of Construction,
Engineering Services, Housing & Common Amenities (2013).
The above may also reflect a resurgence of concerns that have triggered industry improvement initiatives in
the past too. As in many other countries where reports on their construction industries have from time to
time sought to address certain shortfalls, reinvent their structures, trigger desired ‘culture-shifts’ e.g. towards
collaborative modes, (Latham, 1994; Egan, 1998, CIRC, 2001), and thereby improve their industry
performance levels and industry development trajectories, Sri Lanka has also identified and targeted reforms
at various stages, whether at an industry-wide level or in certain sub-sectors. For example, at a national and
industry-wide level, the Cabinet of Ministers approved a detailed Memorandum on the ‘Development of
Domestic Construction Contractors’ in 1988, which was soon followed by a handbook of implementation
procedures (ICTAD, 1988). An example at a sub-sector level, was the set of Reports submitted in 1992 (ICTAD,
1992) - on the World Bank sponsored Study on the 'Domestic Construction Industry in the Roads Sub-Sector',
prepared by a team assembled by ICTAD and submitted to the Road Development Authority and the World
Bank. The Final Report included an action plan for uplifting the domestic roadworks contractors. Most of the
recommendations were implemented to a large extent, with the outcomes being evident in the increased
participation of domestic contractors in major road projects, even where international competitive bidding
is used.
ICTAD itself was set up by the Government of Sri Lanka in the 1986 to develop the construction industry on
various fronts, after a precursor ‘Construction Industry Training Project’. ICTAD was initially funded by the
World Bank but now relies on Government funding and self-generated income from its training programmes
and other services (ICTAD, 2014). Apart from training at all levels of the industry, including workers,
equipment operators and construction managers, ICTAD has ‘development’ and ‘advisory services’ divisions,
that for example develop standard documents and other useful publications for the industry, including
standard bidding documents, specifications, bulletins of construction statistics, price indices etc.; while also
providing services such as maintaining a system of registered contractors in different grades (ICTAD, 2008).
Another relevant organization, albeit not construction-specific that was established with Word Bank support
was the National Procurement Agency, established in 2005, but closed a few years later. This agency carried
11
out a comprehensive revision of governmental procurement guidelines; consultancy guidelines and standard
bidding documents for goods; and ICTAD revised the standard bidding documents for the construction
industry to align with these general procurement guidelines.
2.3 SRI LANKAN SCENARIO – EXAMPLES FROM PREVIOUS SAMPLES The focus of this pilot study on time and cost over-runs in roadworks projects is fully justified, given that
roadworks currently constitute the most extensive and expensive built infrastructure assets being developed
in Sri Lanka. Moreover, road networks merit special attention, since they are being developed and improved
with objectives such as lowering transportation costs, boosting efficiencies and important connectivities and
thereby economic and social development.
A few previous study exercises have examined delays and cost over-runs in Sri Lanka, with a couple focusing
on roadworks too. For example, Wijekoon and Uduweriya (2012) examined a sample of delayed projects in
the Sri Lankan water sub-sector and identified overall delay factors in both the pre-construction phase and
construction phase. While the current study focuses on the latter phase, both sets are indicated here, since
a sub-optimal pre-construction phase would also adversely affect the construction phase. The factors seem
somewhat generic and ranked in order of frequency (starting with 1 being highest frequency) they were:
A. for the pre-construction phase: (1) Evaluation of Bid documents by Employer, (2) Reviewing and
approving of Bid documents and Designs by Employer, (3 Acquisition of Land, (4) Errors in Bid
documents, (5) Delay in decision making by Engineer; and
B. (B) for the construction phase: (1) Procurement delays in imported materials, (2) Variation orders,
(3) Shortage of Skilled Labor, (4) Poor planning and scheduling, … and six more factors.
It may be noted that the first factor pertaining to imported materials may not be as important in the roads
sub-sector as in the water sub-sector. Another study by Wijekoon (2011) although focusing on the Sri Lankan
roads sub-sector, sought factors affecting overall project performance including time, cost and quality. 35
factors were identified from this broader perspective.
Focusing specifically on cost over-runs on road construction projects in Sri Lanka, Wijekoon and Attananayake
(2012) identified from their sample and ranked in descending order of importance, the following cost over-
run factors: (1) payment delays, (2) delays in shifting existing utilities, (3) cost escalation, (4) design changes
during construction, (5) issues in land acquisition.
Jeyakanthan and Jayawardane (2012) reported on their analysis of project delays in donor funded road
projects in Sri Lanka, based on data from 24 road projects funded by ADB, JICA and WB, related interviews
and various related documents. They found an overall delay of 69% at the project implementation stage on
average; and also that variation/ extra work had caused 56% of the delays, while 8% of the delays were
attributed to errors in tender drawings. In this context, they cite an ADB report that indicates a requirement
“to prepare detailed engineering designs to enable construction quantities to be calculated with reasonable
accuracy of 5%”. Also, errors and omissions in detail designs, changes in scope and specifications were the
most prevalent sources of quantity increases. Based on such findings, their recommendations included design
12
constructability reviews, capacity building, a ‘lessons learnt’ document and a more rigorous approach by the
executing agency.
From a broader perspective, if linking sources and causes of over-runs to risks, one could also compare some
findings from a study to enhance risk management in Sri Lankan road construction projects. For this, Perera
et al. (2014) conducted a Delphi survey with 33 Sri Lankan experts. Although one finding identifies ‘delays in
payment by the client’ as the most critical risk factor in the construction stage, one may wonder if this could
depend on the funding sources in the particular experience of the surveyed sample. On the other hand, the
authors highlight ‘design errors by the consultant’ since they note that it ranks high in three of the four
stages into which they divided the project life cycle i.e. (i) conceptual stage, (ii) design stage (2nd most severe
risk identified here), (iii) construction stage (2nd most severe risk identified here too) and (iv) operations stage
(2nd most severe risk identified here as well). Furthermore, ‘delays in client decision-making process’ and
‘errors in estimated cost and construction period’ are collectively concluded by the surveyed experts, to be
severe risks in both design and construction phases. The construction stage is considered the most critical in
terms of severe risks. It may be considered apt that this critical ‘construction stage’ is the focus of the current
study, given that over-runs are considered against the contracted project durations and prices of the
construction contractors. However, as indicated above, risks that are not effectively managed in the
preceding two stages i.e., conceptual and design, could well impact significantly on this already critical
construction stage.
13
3 EXAMPLES OF OVER-RUNS AND DOCUMENTED
REASONS
3.1 PREAMBLE
This section contains snapshots of common time and cost over-runs with any corresponding documented
reasons, with the objective of providing a perspective of both the scale of the problem and a flavor of the
underlying issues. It draws on extracts from data made available from the RSAP and PRP projects as planned.
Being a pilot study, it does not purport to convey a comprehensive summary nor an accurate quantitative/
statistical overview. Another inherent limitation is in that some contract packages have not yet been finalized,
either being under construction and/or with some major items under review or in dispute. However, the
areas, issues and items highlighted are not random, but attracted attention through an iterative and
interactive process of document reviews and interviews which unveiled specifics to be examined, of which
many merited highlighting as below. The important caveat is therefore that the following is not intended as
a fully representative cross-section, leave alone comprehensive review of the over-runs and documented
reasons.
3.2 PRP - PROVINCIAL ROADS PROJECT
Briefly, the original credit of US 105 million equivalent on IDA Credit CE-4630-LK was to be disbursed over the
project time-line set from the WB Board approval date of 17 Dec. 2009, ‘effectiveness date’ of 02 April 2010
and original project ‘closing date’ of 31 March 2015. Focusing on the roads rehabilitation component in the
three selected provinces only, i.e. excluding the maintenance, implementation support and capacity building:
4 of 6 roads in the Uva province and 4 of 5 in the Eastern province have been physically completed, while 2
of 4 are completed in the Northern Province. The other 2 had to be re-awarded in the Northern Province,
given which it may also be noted that any actual over-runs on the new contracts would not reflect the over-
runs from the dates of award of the precursor contracts. Generalizing such experiences, reminds one of the
need for careful selection of contractors, with extra attention to their potential performance, apart from
tender price. Moreover, from another angle, the Auditor General’s Report dated 30 June 2013 for the year
ended 31 Dec. 2012, included negative comments on the supervising consultant in terms of contracts being
‘poorly managed’ and inadequate ‘capacity’ and ‘lack of professional commitment’. In this case relating to
works in the Northern Province, the team leader was replaced, based on Employer’s recommendation. It may
be noted that similar observations regarding the capacity and/or commitment of some consultant staff, apart
from shortfalls in some contractor capacities, resource levels and attitudes have surfaced during interviews
on both PRP and non-PRP roadworks projects
In terms of time over-runs, a snapshot of the current approximate EOT (Extension of Time) assessment of the
PRP roads is in Table 1. It should be emphasized that some of the ‘EOT’ assessments have not been agreed,
with these disputes under adjudication in some contracts, while one has been ‘noticed’ for arbitration on this
EOT disagreement itself and another has been noticed for arbitration on costs related to an agreed EOT.
Therefore allowing for such future shifts in the current picture, the present profile indicates an average
contract EOT of 28.8 %, with the highest being 48.6 % so far and the lowest being 7.5 % over the 11 projects
14
where EOT has been claimed and assessed. Breaking this down to main sources, one notes a major source in
‘quantity increase’ related EOT, averaging 19.7 %, with the highest being 39.9 % so far and the lowest 5.5%.
The second major source of EOT, is adverse weather, averaging 4.6 %, with the highest being 12.7% so far
and the lowest being 0 i.e. zero claimed under this particular category (on 2 contracts) so far.
In terms of cost over-runs, Table 2 conveys a consolidated summary, of the current approximate assessments
on the 11 PRP roads assessed so far. Here it should be stressed that many of the claims have not been
assessed, leave alone agreed, so this is only an indicative ‘in advance’ profile. Secondly, there are 6 major
sources of claims, labelled as Cl. 1 to Cl. 6 in Table 2, where substantial claims have been recently submitted
but are still being assessed, so this advance profile is only a ‘part-profile’ in reflecting 3 of 8 potentially
substantial claim sources on this project. However, it may be argued that Cl. 1 termed ‘change of input %’
should be combined with the category above that in the table termed ‘Price escalation’ since it relates to that
same source, the difference being that the ‘Price adjustment’ is computed directly based on the relevant
formula in the contract, whereas the ‘change of input %’ is based on another clause (13.8 in these contracts),
that provides for adjusting input percentages if the weightings have been rendered unreasonable,
unbalanced or inapplicable. Some other claims such as those labelled as Cl. 2 on ‘prolongation’ could be
substantial, while the Cl. 3 on ‘VAT on bitumen’ arose when the Government removed the VAT (Value Added
Tax) on bitumen and simultaneously raised the selling price, so that contractors had to pay the same net
price. Although not able to claim for a price escalation, such claims are based on contractors allegedly losing
the financial benefit of this VAT recovery against their own purchases.
Subject to the above limitations, what is available to date, indicates the following ‘cost over-runs as a %
against original contract price’ (a) on ‘BOQ items’ (representing ‘changes in quantities’ in general) a current
average of 0.77 %, the highest so far being 14.37 % and the lowest being – 38.13 %; (b) on ‘variations’ – a
current average of 19.46 %, the highest so far being 53.00 %; (c) on ‘Price Escalations’ – a current average of
12.77 %, the highest so far being 17.21%; with the potential for substantial increases after evaluating the
above-mentioned Cl. 3 on ‘VAT on bitumen’ and the Cl. 1 on change of input % (both of which relate to ‘Price
Escalations’ i.e. ‘Price Adjustments’ in general).
An interesting facet noted on this PRP project, is that the net cost over-runs could have been much higher, if
not for savings that had set off some of the increases. For example, reduced cross-sectional dimensions,
based on engineer re-design of a drain where the ground conditions were better than those envisaged in the
standard design tendered upon, compensated for the extra length of drain in some contracts. Also, in some
other terrains, one drain side was reportedly designed to ‘double-up’ as a mini- retaining wall on the
embankment side, effecting further savings. Such examples may presumably be linked to vigilance / good
practices of the relevant supervision consultants and employer’s representatives in the central Project Co-
ordination Unit and/or the provincial Project Implementation Unit /designated Road Development
Department. However these ‘pluses and minuses’ may not be directly evident in specific items e.g. the item
(a) above on ‘BOQ items’ (mainly representing ‘changes in quantities’) could reflect the lower length of drain
corresponding to lengths where the cross-section was reduced, but payments for lengths with reduced cross-
sections may have had to be made under ‘variations’ since this was interpreted as a new item meriting a new
rate. A clear example is in the EP05 contract, where an apparent saving in quantities reflected in the 38.13 %
15
‘saving’ on BOQ items; masks the ground reality of a need to replace a substantial length of drains with cover
slabs of lower design strength, with drains able to sustain the higher loadings in that heavily populated area,
thereby contributing substantially to the overall ‘variation’ of 53.00 %.
3.3 RSAP - ROAD SECTOR ASSISTANCE PROJECT In summary, the original credit of US 100 million approved on the WB ‘Board date’ of 15 December 2005 on
IDA Credit Cr-4138 effective 16 March 2006, was supplemented by a First Additional Credit Cr-4429 of USD
98.1 million effective 12 December 2008 and a Second Additional Credit Cr-4906 of USD 100 million effective
02 June 2011, with a project ‘closing date’ of 30 September 2014. The total base value of the RSAP is thus
USD 298.1 million, if based on a summation of the relative USD values of the credits as at their respective
effectiveness dates, although the current USD value is correspondingly more.
The focus required in this pilot study is on the roads rehabilitation and improvements construction contracts
only, i.e. in the case of this RSAP project: excluding the road maintenance contracts, Road Maintenance Trust
Fund, Asset Management system development and other institutional strengthening components. 12
contract packages were awarded and completed in the ‘parent project’, which was also supplemented by the
first additional finance due to special conditions. However, all contract accounts have not been finalized by
the GOSL e.g. given an ongoing arbitration on one contract. In addition, 4 contract packages were awarded
and completed under Phase 1 of the second additional finance, while 4 packages are ongoing, following
changes to the planned road sections in Phase 2.
In addition to the ‘maintenance and rehabilitation of national roads’ that involved improvements and
resurfacing in certain provinces, the RSAP includes components for technical assistance, institutional
strengthening, technical audit and some goods and equipment for the above which are all in Part A. Part B
being on the ‘Maintenance and Rehabilitation of Rural Roads Pilot’, includes strengthening of the rural road
management and maintenance system of the local units (Pradeshiya Sabhas) and rehabilitation and
maintenance of specified rural roads, training, technical assistance, institutional strengthening, technical
audit and some goods and equipment as in Part A. Part C is on technical assistance in establishing the Road
Maintenance Trust Fund.
Table 3 presents a status summary of the ‘Approved Costs’, as well as the ‘% Increases’ over and above the
original contracted prices, of the 12 contract packages in RSAP Phase 1, one of 13 original packages having
been deleted from this project at the outset. The ‘approvals’ column on the left extreme, juxtaposes the WB
approvals against those of the GOSL cabinet or the Cabinet appointed Procurement Committee (CAPC) or in
one case he Ministry Procurement Committee (MPC). While no major deviations are evident between the
WB and GOSL approvals on costs, it seems that the WB recommended Liquidated Damages had not been
applied in many cases, at least up to the time of preparation of this summary on 22 May 2013. One may note
that, whether the non-enforcement of Liquidated Damages results from some global settlement or
otherwise, industry awareness of such precedents and possibilities could undermine an important deterrent
against delays.
16
The bottom-most row of figures in Table 3 projects an overall profile over the 12 contracts so far (noting that
an arbitration is pending), of the cost over-run in term of ‘% rise’ over the base contract price (without
contingency) datum. Given the chosen breakdown ‘heads’, the ‘% rise’ is highest under ‘price adjustment’ at
53.97 %, while variations at 17.21 % are considerable. Although the ‘quantity changes’ may have been
expected to have yielded more than the 3.92 % seen here, it is possible that the quantity increases due to
road width expansion etc. were off-set by some omissions or even variations. For example, the quantity
reduction in one road package accounts for reducing almost a third of the price, whereas the variations adds
back much more than that reduced - over 70 % more in this case. The other drawback in this type of ‘plus-
minus’ scenario is that the rates applied to variations may be higher than the contracted base rates if the
contractor can justify an increase, as had happened in the above example, even when similar works were
removed and then added back at reportedly short notice.
The highlighted column of ‘% Cost Over-run’ in Table 3 projects the ‘Total Increase in project cost’ - ‘Base
Contract Price (without contingency)’ as a % of the ‘Base Contract Price (without contingency)’. The base
figures in Table 3 are those with RDA and WB, the only computations for this Report being the ‘% Cost Over-
run’ column and the bottom row on ‘% Rise on BANK approved costs’. Assuming the base figures have been
computed as indicated in the original column heads, it may be noted that the cost over-runs will not appear
as high against the actual contract prices which do in fact, include physical and price contingencies,
although for the purposes of this report too, it is prudent to follow what was in the base figures as given, in
order to project the true extent of deviations e.g. of quantities, prices etc. Another caveat is that some figures
are pending finalization e.g. with one contract under arbitration, although the WB figures are not expected
to change. The % Cost Over-runs range from 51.49 to 132.41 in this project, with an arithmetic mean of
86.46 representing the average over-run in a contract. This needs to be differentiated from the parallel figure
of 75.58 % in the bottom-most row of figures, since the latter shows the ‘% Rise’ over base contract prices
without contingences for the whole RSAP 1 project.
Revisiting the breakdown of cost increases in the highlighted bottom row, a higher average ‘% rise’ was
expected under ‘claims’, based on a small sample of some of the original claims and EOT granted e.g. on
‘unavailability of points of reference issued by the Engineer’ and ‘unavailability of drawings that required
Engineer to design based on surveys done by the contractor’ and ‘entrusting the contractor to draft these
drawings’. However, the absence of financial compensation for such apparent lapses, may perhaps be
considered alongside the lower than expected liquidated damages in general, given the magnitudes of the
time over-runs.
The significance of any such overall ‘% rise’ in project cost so far of almost 80 % (78.67 %), may in general,
only be alleviated by any justifications of increase in value e.g. with increased road width . However, the fact
that the bulk of the cost over-run appears to arise from price adjustments, underlines the imperatives for
reducing the time over-runs.
The time over-run profile in RSAP Phase 1 contracts is seen in Table 4, ranging from 7.62 % to 180.70 %.
However both these values seem to be ‘outliers’/ extremes, the next highest and lowest being 105.23 and
26.61 respectively, while the arithmetic mean at present is 69.77 % or 70 %. It should be noted that the EOTs
17
granted (or under dispute) are not shown here, the time over-run being directly based on the completion
date - start date, as compared with the contract period, as obtained from the RSAP office.
Table 5 conveys a snapshot of the EOT granted on the four contract packages in the RSAP Phase 2 – Kantalai-
Trincomalee segment. While generally less significant than many contracts in Phase 1, EOT based on quantity
revisions (EOT category ‘2’ in this table) seem high, ranging from 65 to 82 days, compared to the contract
periods (each being 15 months). Also, one contract incurred additional delays (40 days EOT) due to some
special utility line issues. The lowest and highest overall time over-runs are 15.0 % and 28.6 % respectively.
The other segment of RSAP Phase 2 is ongoing and given the substantial works remaining it is premature to
comment on over-runs, although interviews of consultant personnel and DAB members on these contracts
provided useful ‘live’ pictures of both generic and specific issues. For example, it seems that the original
contract durations may be argued to be unrealistic, give this type of dense urban arteries leading into the
capital city. Other issues such as allegedly inadequate design preparation and review time-frames, substantial
deviations from the tender (base) drawings, shortfalls in contractor planning and resource levels etc. also
decelerate progress, so much so, that the ‘physical progress % (estimated)’ in the four package ‘Lots’ as of
30 April 2014, was 28.50, 17.40, 30.00 and 20.50; against ‘planned progress % (financial)’ of 79.38, 78.55,
87.05 and 83.67 respectively. It may be noted that relatively substantial EOT and financial claims are being
received on this project.
Moving to a completed segment of the RSAP, Table 6 summarizes the EOT granted on the suite of contracts
for the ‘Maintenance and Rehabilitation of Rural Roads Pilot’, the average EOT is 47.6 %. Issues leading to
EOT and extra costs include road width increases, issues with house access provisions, structure
improvements, unplanned retaining walls and box culverts, base improvements and causeways. The
increases in the contract prices, as compiled by relevant project staff (not reproduced here), taken together
e.g. covering variations and changes of quantities, averaged out at 28.32 % of the original contract prices –
again excluding contingencies, hence not appearing so high if compared against overall full contract prices.
There were net ‘minuses’ in some contracts (presumably due to deletion of some work items in some
contracts) that reduced the ‘pluses’ in other contracts. For example, the increase in one contract was 90.2%,
the next highest being 62.9 %, then 48.8 % while the three most negative were – 24.0 %, – 15.1 % and -15.0
%. Indeed there were only four contracts with net contract price ‘minuses’ in this sample. One could assume
that there were such ‘minuses’ and ‘pluses’ within contracts too (i.e. in various work items), as in other
samples which were examined in more detail, being bigger contract packages.
18
4 INTERVIEWS
4.1 INTERVIEW TARGETS AND FORMATS
4.1.1 Objectives, strategy, structure and formats:
The objectives and associated strategy, as indicated in the ‘Methods Summary’ in 1.4.2.1, were for interviews
to be planned and conducted in two stages - (I) for ‘knowledge-mining’ of relevant experiential knowledge
from a cross-section of the major stakeholders and independent experts (in this case, DAB members) in
parallel with, although starting after the document survey; and (II) to obtain initial feedback from some of
these major stakeholders on specific relevant aspects of the initial findings on apparently typical sources of
time and cost over-runs, information gaps, and related questions.
All interviews were semi-structured, based on a set of general questions as well as a supplementary set of
interviewee-specific questions that targeted the knowledge pool that could potentially be drawn upon from
each interviewee’s special positioning and expected experiences. Interviewees were assured that this is
essentially a 'looking back to collect & consolidate the lessons learned' exercise (including ‘positives’) so as
to plan & implement future projects better. It was also conveyed that the interviewer was interviewing
and/or had already interviewed a few stakeholders who were involved at different stages of both projects,
but that the specific insights and inputs from the current interview would be valuable in filling some gaps and
adding high level overviews. They were also assured that all views and sensitive information conveyed would
be treated as confidential and in any case, neither specific individuals, work packages nor organisations would
be cited on particular matters, but that the consolidated information would be used to derive general findings
and conclusions, while important non-confidential data available may be cited, since it could have been
obtained from one of many sources.
Typical general questions were developed in steps during the stage (1) interviews itself, following the initial
document appraisal and a few interviews that pointed to some useful areas for exploration. Some of the
general questions used were as follows:
1. (a) Were the initial contract durations reasonable/ realistic? (b) Were the initial contract values
reasonable/ workable?
2. (a) To what extent were the Consultants expected to have inputs into the designs and contract
documents, including special conditions of contract, specifications and drawings etc.? (b) In
hindsight could this be approached better, in the light of local conditions etc. on similar projects?
3. (a) Was the demarcation of responsibility clear (to all including contractors), for the designs and
detailed/ working drawings? (i.e. including centre lines, longitudinal sections, reference points/
levels, formation levels, structures, drainage)? (b) as in 2(b) above?
4. Did the compensation for price fluctuations seem reasonable (to both Employer and Contractor)?
5. Did the Employer/ Client inputs differ from what was expected on such projects? If so, how? Any
examples?
6. Did the Funding body inputs differ from what was expected on such projects? If so, how?
7. Did the Consultants’ inputs differ from what was expected on such projects? If so, how? Any
examples?
19
8. Did the Contractors’ inputs and outputs/ performance in general, differ from what was expected
on such projects? If so, how? Any examples?
9. Did the DAB inputs and outputs in general, differ from what was expected on such projects? If so,
how?
10. Could the variations have been reduced? If so how?
11. What were the main issues that led to (a) time over-runs and (b) cost over-runs?
12. (A) In your personal opinion, what were the root causes of (i) time over-runs and (ii) cost over-
runs? (B) Of these, which root causes contributed most? (C) Of these, which may be easier
minimized in future? … by …………………?
In keeping with the interview strategy, a few Phase II interviews were of a few of those interviewed in Phase
I, with the dual objectives of (a) filing in some information gaps and inconsistencies/ ambiguities that
emerged subsequent to the first interview and (b) obtaining feedback on the initial/ interim findings and
potential suggestions.
The basic interviewee profile is as below.
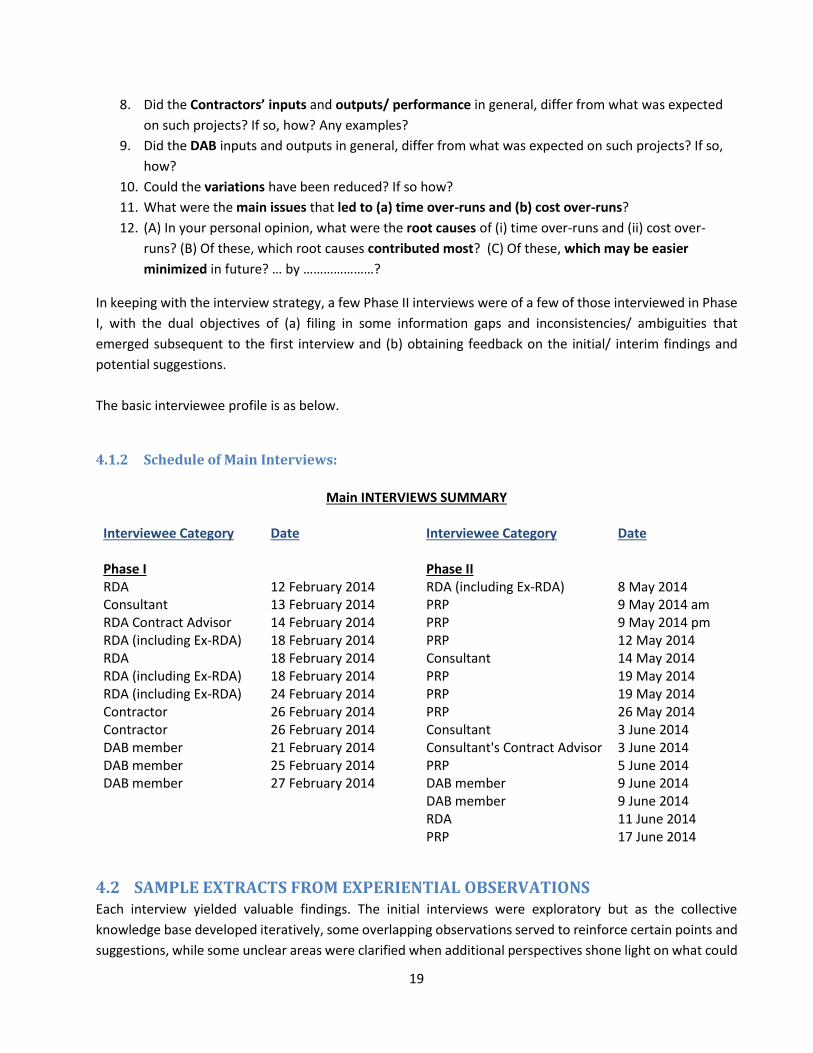
4.1.2 Schedule of Main Interviews:
Main INTERVIEWS SUMMARY
Interviewee Category Date Interviewee Category Date Phase I
Phase II
RDA 12 February 2014 RDA (including Ex-RDA) 8 May 2014 Consultant 13 February 2014 PRP 9 May 2014 am RDA Contract Advisor 14 February 2014 PRP 9 May 2014 pm RDA (including Ex-RDA) 18 February 2014 PRP 12 May 2014 RDA 18 February 2014 Consultant 14 May 2014 RDA (including Ex-RDA) 18 February 2014 PRP 19 May 2014 RDA (including Ex-RDA) 24 February 2014 PRP 19 May 2014 Contractor 26 February 2014 PRP 26 May 2014 Contractor 26 February 2014 Consultant 3 June 2014 DAB member 21 February 2014 Consultant's Contract Advisor 3 June 2014 DAB member 25 February 2014 PRP 5 June 2014 DAB member 27 February 2014 DAB member 9 June 2014
DAB member 9 June 2014 RDA 11 June 2014 PRP 17 June 2014
4.2 SAMPLE EXTRACTS FROM EXPERIENTIAL OBSERVATIONS Each interview yielded valuable findings. The initial interviews were exploratory but as the collective
knowledge base developed iteratively, some overlapping observations served to reinforce certain points and
suggestions, while some unclear areas were clarified when additional perspectives shone light on what could
20
have happened and why. Rather than list all points gleaned from all interviews, the following are some sample
extracts. Since the following sub-sections are categorized according to groupings such as employers,
consultants, contractors, in order to reduce repetition some points which originated from more than one
group are not duplicated unless essential to complement and complete the picture.
4.2.1 Sample observations from Employers (RDA & PRP) and Funding Agency personnel &
consultants
The employers conveyed how a few special issues triggered the more substantial time and cost over-runs in
the RSAP and PRP projects. On the RSAP, an ‘across the board’ increase of the design road width from 5.5m
to 6.2m after the contracts were signed, led to major works quantity spikes. These were of course aggravated
in contracts in hilly terrain where substantially increased earthworks, enhanced culvert and drainage
provisions etc. were entailed. Secondly, particular periods of a bitumen shortage, as well as of a bitumen
price hike had significantly impacted time and cost.
In terms of ‘positives’ in ‘good practices’, in one project (as partly described in 4.2 above), net cost over-runs
were reduced by rationalizing the designs of (a) drains and/or (b) road specifications, where (a) the ground
conditions and/or (b) traffic conditions were better than those envisaged in the standard designs tendered
upon. Such savings helped compensate for (some of) the extra costs arising from (a) the extra length of drains
and/or (b) extra roadworks quantities, as well as (c) some area where the pavement design needed
upgrading.
In general, some contract clauses were perceived to be prone to different interpretations if not
misinterpretations e.g. (i) the regular use of the ‘changes in inputs %’ to claim price escalations (adjustments)
on certain inputs like bitumen where prices may have risen relatively more to other inputs, even based on a
small change from the contract quantities, whereas those who formulated this provision at ICTAD had
reportedly envisaged recourse to this only where there was a substantial change; (ii) different approaches to
claiming and evaluating EOT.
Although, employers believed that EOT on adverse climatic conditions was generally well justified with
adequate weather records, this was examined further, given substantial claims on some contracts and it was
found that different justification and quantification methodologies were used in different standard
conditions, suggesting a need for revisiting and standardization. In particular, one apparent omission was
noted in that the World Bank Standard Bidding Documents for Procurement of Small Works (WB.SBD.PSW)
does not provide for EOT based on ‘exceptionally adverse climatic conditions’ (as does the corresponding
World Bank Standard Bidding Documents for Procurement of Works - WB.SBD.PW and other standard
contracts encountered), since it is neither in Clause 26 (on ‘extension of the intended completion date’) nor
in Clause 41 (on compensation events referred to in Clause 26), leading to some allegedly using 41(f) which
is for adverse ground conditions.
Another noteworthy example is that the EOT assessment of a delay analysis expert who was recently
mobilized to assist in a major arbitration is that the EOT that had already been agreed on this contract was
excessive. One may wonder if any more over-assessments may emerge if his assessment technique for EOT
21
due to increase of road width, is applied to other contracts that received EOT for the same reason. From a
‘lessons learned’ viewpoint, it appears necessary to develop and specify a standard EOT assessment
methodology in contracts, given that different approaches yield diverse answers, but even worse, some
approaches seen in contractors claims seem to lack any reasonable technique/ basis – so a recommended
methodology would assist them and also minimize spurious claims, saving resources for all concerned.
In other general examples: (iii) some obligations of contractors were perceived by some to lack adequate
contractual ‘teeth’ that could deter non-compliance e.g. for not supplying sufficiently detailed and timely
work programmes, method statements, as-built drawings etc.; with even the termination clause being
suggested for strengthening since some felt the reasons for termination need expanding and elaboration ;
(iv) different interpretations of ‘methods of measurement’ on some items was noted, e.g. disputes had arisen
on tolerances and related payments for ‘average’ or otherwise, including when outside the tolerances; and
(v) disputes on approaches to evaluating of overheads in variations or prolongation claims. Disputes had also
arisen on interpretations of (vi) when a contractor can claim on ‘statement of completion’, one view being
that the claim can be deferred to the end of the defects liability period, thereby increasing the uncertainty of
contract price; (vi) the basis on which a contractor can apply for new rates for varied quantities – while there
are four conditions in Clause 12.3 of WB.SBD.PW, it seemed difficult to disprove that the unit cost changed
by over 1% unless a standard methodology was specified for evaluating both the initial and final unit costs.
At a more ‘macro’/ higher level, a concern aired in some quarters in terms of controlling over-runs, is on the
adequacy and clarity of the threshold at which ‘no objections’ must be sought from (a) the funding agency
and (b) the employer’s hierarchy. While some at the implementation ‘coal-face’ may prefer to retain a
flexibility to deal with contingency related over-runs by balancing against potential savings, a case can be
made for submitting for (a) ‘no objections’ review of the funding agency, not just when the contract price
increases by over 15%, but even when any one of some defined critical elements/ items exceeds a certain
margin e.g. whether 20% or 25%; and similarly (b) for employer’s review at an appropriate level too. Secondly,
it seems useful to rationalize the appropriate authorization levels / thresholds in the employers’ hierarchy
when the increase in contract price reaches a certain trigger-point ‘value’ (e.g. LKR 500m) and/or ‘%’ (e.g.
15%) increases,. Although guided by documents such as Supplement 14 to the Procurement Manual of GOSL
and clause 8.13.4 therein, it appears there may be some perceived flexibility in for example, when to refer to
a Provincial Secretary, a Ministry Secretary/ Ministry Procurement Committee or the Cabinet appointed
Tender Board. While established practices may be proving adequate in each organization, tightening this type
of requirement, along with introducing ‘elemental’ /critical item thresholds as recommended for triggering
referral to the funding agency above, may help heighten efforts to ‘nip’ potential over-runs ‘in the bud’.
There was unanimous and emphatic agreement that more realistic time-frames and budgets should be
provided for more comprehensive and/or detailed planning, site investigations and designs, along with the
associated risk assessments, since many design changes and consequential over-runs could be traced to
shortfalls in these areas e.g. with under-estimated quantities, unexpected conditions etc.
Employers (and also consultants) urged a revisiting of the insistence on quality assurance protocols that
correspondingly reduced consultant resources available for quality control. It was felt that many contractors
22
on these projects (whether ‘international’ or ‘national’) abused the expectations, thereby leading to
excessive rework, consequential disruptions and disputes and delays at the least, if not cost over-runs. On
the other hand, a few employer representatives alleged room for improvements motivation / commitment
of some of the consultant staff they had encountered on previous contracts. Indeed an example is
documented in an Auditor General’s report of 30 June 2013 for the year ended 31 Dec. 2012 on the PRP
project, which faulted the supervising consultant on one segment of a project on poor contract management,
inadequate capacity and lack of professional commitment.
Some employers and consultants felt that the funding agency loan period limit imposed onerous restrictions.
On the other hand, one may take an alternative view that while a realistic period should definitely be set at
the outset, all stakeholders should be impressed with the time imperatives also from the inception, so that
‘work does not expand to fill the time (apparently) available for it’ and then over-run due to contingencies.
Another (apparently positive) perspective was that any ‘additional value’/ benefit that was targeted and
obtained should be ‘factored in’ when viewing time and cost over-runs, e.g. the benefits from additional
road width and/or improved road quality to cater for higher expectations and/or traffic loadings. However,
post-contractual variations almost always cost more than what that work component would have cost if
embedded in the original contract. In any case, the cardinal principle of anticipating and building in such
possibilities/ risks should be a corner-stone in the agendas of planners and designers. That they should also
be given time to do this, reinforces the imperative for the adequacy of upstream time-lines and resources for
detailed planning and site investigations and careful designs.
4.2.2 Sample observations from Consultants
This sub-section also includes observations from a Contracts Adviser to one of the consultants, while it may
be noted that the consultants interviewed were only those on the RSAP.
There were perceptions of unrealistic contract durations having been imposed on some contracts based on
internal/ political targets and allegedly (as a couple of interviewees perceived) to fall within the funding
agency loan period, or even with inadequate technical and practical considerations e.g. without considering
the terrain and urban conditions. So while feasible for some flat non-urban terrains these were not workable
in hilly or urban terrains. Also, road rehabilitation that entailed planned and unplanned utility relocations
were apparently under-estimated in terms of risks, hence the ensuing time and cost over-runs. One positive
suggestion to mitigate one such risk source, was to boost the ‘public engagement’ of the affected community
– by (a) advancing its timing to well before the roadworks reached each area so that for example, temporary
and permanent access / connection issues could be worked out and agreed by an advance team, rather than
disrupting or stalling the work as often happened on some contracts and (b) ‘engaging’ more constructively
and productively, possibly with higher level inputs. Similar suggestions were received on quarries and burrow
pits, since delays in securing these and/or disruptions even after establishing these, had led to substantial
EOT on some contracts.
Some consultants engaged for design review and supervision had been disappointed that the bulk of the
documents arrived closer to the end of design review period. Also, when asked about significant EOT claims
23
that had been granted in at least one contract, based on ‘unavailability of points of reference issued by the
Engineer’, ‘unavailability of drawings that required Engineer to design based on surveys done by the
contractor’ and ‘entrusting the contractor to draft these drawings’, they attributed this to what was (not)
done prior to their coming on board. It seems from such examples, that the demarcation of responsibilities
for designs (arising from the definition of expected detail ‘design’), working drawings and approvals thereof
is open to divergent interpretations. Any such ambiguity on fundamentals could easily trigger, as it evidently
has, ‘passing the buck’, delays, disputes and over-runs.
There was a useful suggestion for the Engineer’s team to work with the Employer’s designated project team
in a common office. Indeed this happens elsewhere. Specific requirements were recommended to be
stipulated on the production of the ‘Clause 8.3 programme and supporting documentation’ including
resource loadings. Similarly, method statements and monthly progress reports should be upgraded. Penalties
were suggested for non-compliance with above, as well as for not supplying/ deploying the stipulated
resources. The same interviewee suggested that the Engineer be required to submit a monthly ‘cost
management report’.
Some other unsubstantiated observations which may be personality-specific, but arose from more than one
source, were (a) allegations of direct site instructions from some Employer’s representatives, sometimes by-
passing the Consultant and (b) a perception that claims and counter-claims (including Liquidated Damages)
may be settled at a higher level on a global basis. Again (as in sub-section 4.2.1 above), there were comments
about the funding agency loan expiry seeming to ‘drive the construction contract’ also leaving some alleged
loose ends on the disputes resolution and defects liability period. Note: one may consider a somewhat
mitigating perspective on this point where a deterrent of a definitive end date helps focus minds on
completion from the outset (as also described at the bottom of the penultimate paragraph of the sub-section
4.2.1 above). However, these perspectives are worth revisiting together.
4.2.3 Sample observations from Contractors
It should be noted that although the contractors interviewed had worked on both RSAP and PRP projects,
their observations were explicitly based on their broader experience on roadworks contracts funded by other
agencies and GOSL as well. Interestingly, the particular contractors interviewed took a holistic and
professional view of the issues to the extent of listing out to the interviewer, their perceptions of ‘causes of
time and cost over-runs on road projects’ under sources/ categories of General’, ‘Employer’, ‘Engineer’ and
‘Contractor’.:
4.2.3.1 General:
Relative shortage (compared to current demand) of materials engineers, laboratory staff, quality
officers, environmental officers, skilled plant operators
Lack of job security, discouraging youth from joining the construction industry
Inadequate training and skills development facilities
Lack of incentive to seek proper training and skills development
Quality of raw materials lacks control (including bitumen, that is now also imported privately)
Out-dated environmental regulations/ standards
Poor communication between parties
24
Mistrust between parties
Unexpected local community/ social demands
Price Fluctuation indices not reflecting market
Overseas contractors competing unfairly with financial packages that enable unrealistic prices
Suppliers of bitumen & diesel demand advance payments, aggravating contractor’s cash flow
Obtaining permits for mining etc. is time-consuming and onerous
4.2.3.2 Employer:
Relocating utilities taking longer than expected
Slow decision making
Awarding contracts below Engineer’s estimate
Unreasonable work distribution - only a few contractors benefit (including interviewees!), while
having ‘sufficient work in hand’
Timing of awards – e.g. just before rains or long holidays, or delaying commencement
Payment delays
Lack of work continuity
4.2.3.3 Engineer:
Quality assurance/ control misunderstood by many
Inadequate numbers of qualified and experienced staff
While the contract is based on calendar days, Engineer’s staff do not work accordingly
Inadequate pre-design investigations
Inappropriate designs arising from above e.g. pavement design for a heavy rainfall and landslide
prone area was not different from the standard design given for a sound terrain
Inappropriate contract conditions and specifications
Excessive variations
Delays in approvals and decisions
4.2.3.4 Contractor
Informal sub-contracting system leads to poor performance
Inadequate planning and monitoring
Inadequate resources arising from inadequate working capital
Influx of poor quality plant and machinery due to affordability issues
4.2.4 Sample observations from DAB members
Some of the points derived from interviews were complemented and/or substantiated by relevant sample
DAB reports obtained separately from the Employers (RDA and PRP). Also, informal discussions were held
with two other DAB members, hence reinforcing and supplementing the following, gleaned mainly from the
three who were formally interviewed.
Significant needs were identified for rationalization of tender and contract documents e.g. (a) for specifying
items where expected in the ‘documents hierarchy’ e.g. in the drawings and (b) more consistency checks for
discrepancies between documents. Examples on item (a) above included some that were also raised by other
25
parties (employers’ representatives, consultants and contractors) e.g. listing of some specific high value
construction activities in the Environmental Management Plan although not shown in the drawings, leading
contractors to claim that they had not been priced in tenders. Many examples on item (b) above, centered
on changes made in one document in particular conditions or specifications, as well as in drawings or Bills of
Quantities that impacted on others, rendering them incompatible, hence a hotbed of ambiguities and
consequential claims.
Two of the DAB interviewees raised a concern about the status of a payment made on an adjudication award,
given that it can be reversed in arbitration; one saying that FIDIC had recently changed the wording to
ameliorate this, while a bond may be given as security, although another opined that obtaining a bond can
be onerous. Other issues that may be revisited, since emerging in disputes were whether a substantial
quantity increase (‘even 100%) could be considered a ‘scope change’; and the perennial ‘time bar’ issue when
seemingly reasonable claims are submitted ‘too late’ but still often entertained.
Two DAB interviewees drew attention to an ambiguity in the payment clause in terms of foreign vs. local
currency components, when an extra payment has been evaluated on the price adjustment clause. Although
it appears that no price adjustment is payable on the foreign component in most contracts, a loophole in
interpreting the actual payment clause (where all payments must be in that agreed proportion) has led to
DAB decisions upholding the contractor’s interpretation.
DAB members also commented on some general issues leading to over-runs, reinforcing some points raised
by others e.g. on inadequate designs, the shortage of qualified and competent staff at different levels,
including in technical, financial and overall project management
Another macro level issue that emerged in other fora as well as in the above discussions, was the need to
take stock of the DAB system itself, now that it has been in operation for a few years in Sri Lanka, with
objectives of identifying strengths and weaknesses and ways forward in making better use of DABs for their
intended purpose. For example, confidence in the value of DABs varies, so that in some cases they are not
appointed early in the contract as expected; and in some DABs, even if appointed early they are not even
copied claims by contractors, leave alone alerted in advance of brewing claims scenarios that may have been
defused. One example was on a project with the same Engineer and the same DAB overseeing two parallel
sets of contracts, where the contractor on one contract, copied the claims to the DAB, whereas the other did
not. Benefits should accrue from standardizing DAB mobilization and operating procedures and one
suggestion (not from the above interviews) was for a Seminar / Workshop to identify what has been achieved
by DABs, what more can be achieved and how to get there.
26
5 POTENTIAL SOURCES, POSSIBLE CAUSES AND
POINTERS TO IMPROVEMENT AREAS
5.1 IDENTIFIED COMMON SOURCES AND POSSIBLE CAUSES OF TIME AND COST-
OVER-RUNS
5.1.1 Preamble
Previous sections are necessarily descriptive so as to explain and substantiate the basis for the conclusions
reached in this section. The following conclusions are in a more concise format, of listings with bullet points
and brief summaries where useful, so as to enable a quick overview and comparison. Justifications for each
conclusion in 5.1 and suggestions in 5.2 and 5.3 may be revisited if needed, as such back-up data should be
available in previous sections. No attempt is made to prioritize or rank the conclusions on sources and
apparent causes of over-runs, nor on examples of suggested mitigation strategies; not only because it is
outside the scope of this pilot study, but more importantly, since various stakeholders may assign different
ranks, depending on their own experiences and priorities, as well as the practicalities and capacities for
change in specific scenarios.
5.1.2 Principal Common Sources and apparent Causes of Over-runs identified from this pilot
study
‘Sources’ of over-runs may be taken to be one level below the ‘categories’ (or ‘claims heads’) of claims such
as ‘exceptionally adverse weather’, ‘variations’ or ‘price escalations’, where the over-runs can be linked to
claims. Some over-runs may not be directly linked to claims heads though, particularly where the contractor
is responsible for the over-run. Therefore the following listings will not be constrained by a strict definition
of ‘source’; thus whether or not the source can be linked to a contractually available claim category is
immaterial in this report. Secondly a couple of sources such as ‘Price Escalations’ may seem to overlap with
claim categories themselves, although these are differentiated herein, e.g. as ‘High (and allegedly excessive)
price adjustment computations’.
Thirdly, for this pilot study, no definitive demarcation (based on mutually exclusive definitions) is professed
between sources and ‘causes’ either, since these boundaries are sometimes blurred. In general a ‘cause’ or
‘causes’ are generally expected to contribute to the source, just as some fundamental ‘root causes’ could
later be taken to contribute to the ‘proximate’ (immediately apparent) causes that are identified herein. An
illustrative example based on a wider and deeper previous study in Hong Kong, visualizes the eventually
expected hierarchy and links, as in Appendix 1. However, if delving into more detail, more than one cause
may contribute to one ‘claim category’, while one cause may contribute to more than one ‘claim category’
(as in Appendix 1) e.g. a proximate cause of ‘inadequate brief’ could unleash ‘over-run’ claim categories of
both ‘variations’ and ‘delayed design information’. A more detailed mapping of linkages is thus possible.
Fourthly, some of the identified ‘proximate’ causes may later by found to be fundamental i.e. root causes in
themselves. Also, the ‘causal hierarchy’ envisaged in the current pilot study differs from that developed in
Appendices 1 and 2, since the latter was based on one standard contract (Hong Kong Government standard
conditions for civil engineering works), whereas the current one should cater for a few different standard
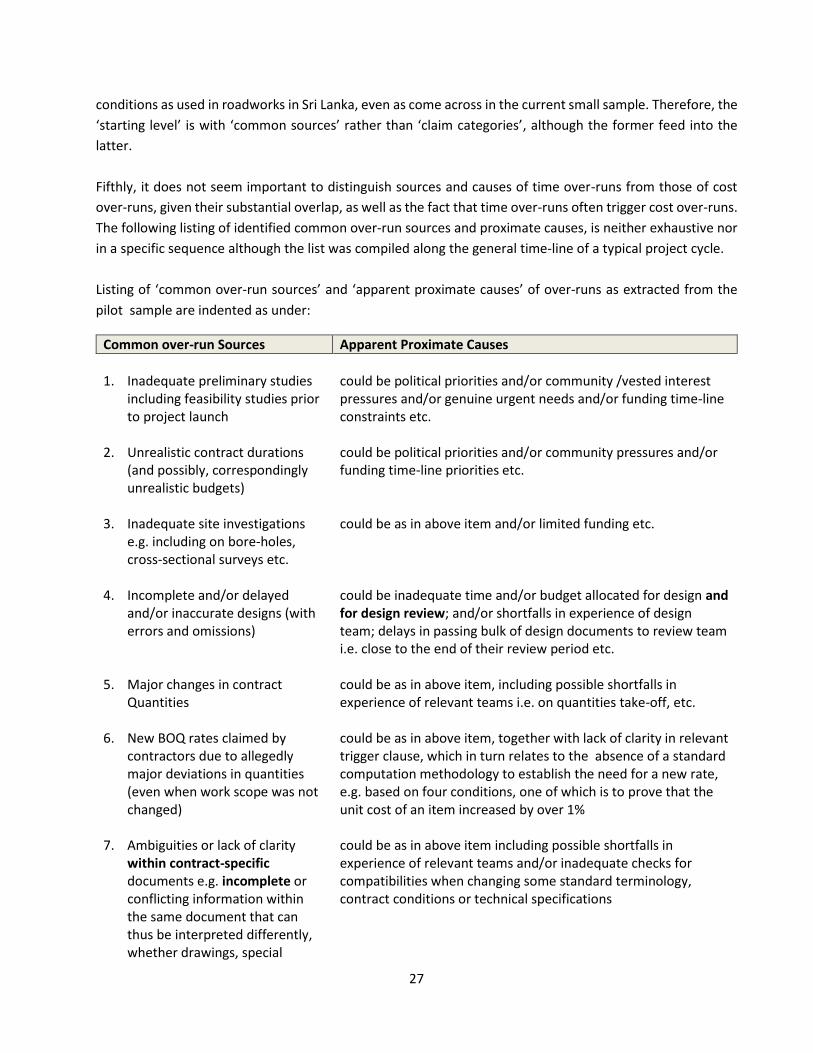
27
conditions as used in roadworks in Sri Lanka, even as come across in the current small sample. Therefore, the
‘starting level’ is with ‘common sources’ rather than ‘claim categories’, although the former feed into the
latter.
Fifthly, it does not seem important to distinguish sources and causes of time over-runs from those of cost
over-runs, given their substantial overlap, as well as the fact that time over-runs often trigger cost over-runs.
The following listing of identified common over-run sources and proximate causes, is neither exhaustive nor
in a specific sequence although the list was compiled along the general time-line of a typical project cycle.
Listing of ‘common over-run sources’ and ‘apparent proximate causes’ of over-runs as extracted from the
pilot sample are indented as under:
Common over-run Sources Apparent Proximate Causes
1. Inadequate preliminary studies
including feasibility studies prior to project launch
could be political priorities and/or community /vested interest pressures and/or genuine urgent needs and/or funding time-line constraints etc.
2. Unrealistic contract durations (and possibly, correspondingly unrealistic budgets)
could be political priorities and/or community pressures and/or funding time-line priorities etc.
3. Inadequate site investigations e.g. including on bore-holes, cross-sectional surveys etc.
could be as in above item and/or limited funding etc.
4. Incomplete and/or delayed and/or inaccurate designs (with errors and omissions)
could be inadequate time and/or budget allocated for design and for design review; and/or shortfalls in experience of design team; delays in passing bulk of design documents to review team i.e. close to the end of their review period etc.
5. Major changes in contract Quantities
could be as in above item, including possible shortfalls in experience of relevant teams i.e. on quantities take-off, etc.
6. New BOQ rates claimed by contractors due to allegedly major deviations in quantities (even when work scope was not changed)
could be as in above item, together with lack of clarity in relevant trigger clause, which in turn relates to the absence of a standard computation methodology to establish the need for a new rate, e.g. based on four conditions, one of which is to prove that the unit cost of an item increased by over 1%
7. Ambiguities or lack of clarity within contract-specific documents e.g. incomplete or conflicting information within the same document that can thus be interpreted differently, whether drawings, special
could be as in above item including possible shortfalls in experience of relevant teams and/or inadequate checks for compatibilities when changing some standard terminology, contract conditions or technical specifications
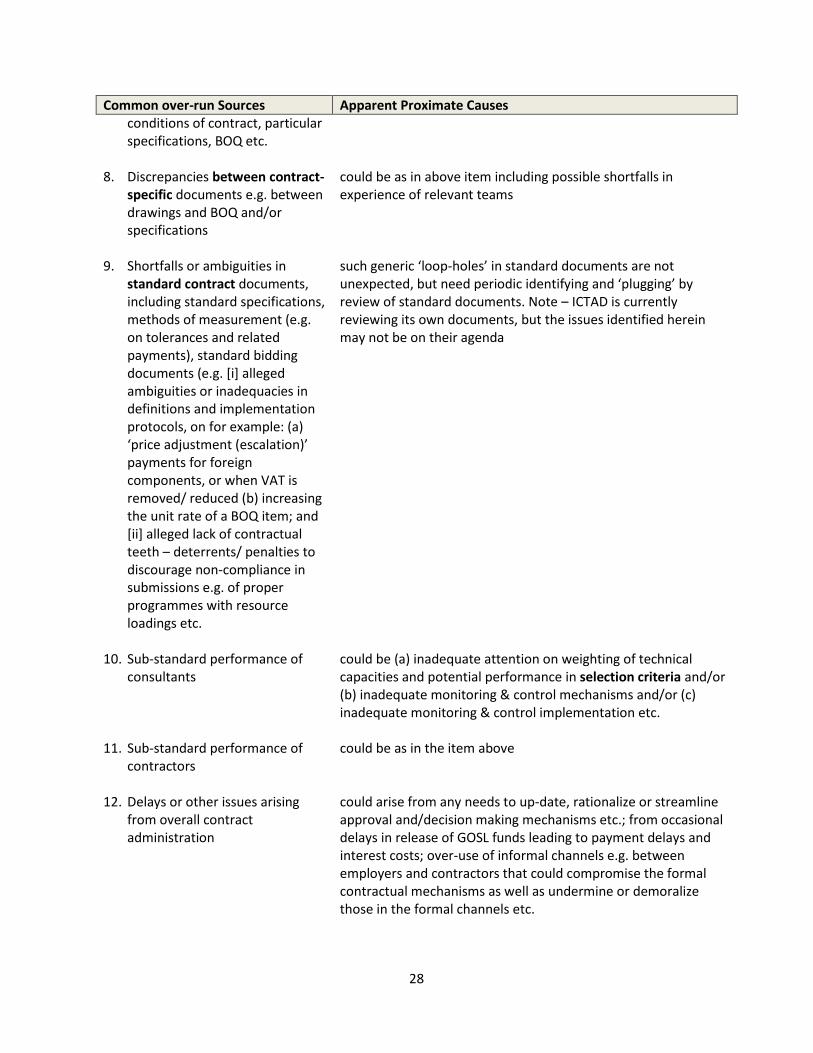
28
Common over-run Sources Apparent Proximate Causes conditions of contract, particular specifications, BOQ etc.
8. Discrepancies between contract-
specific documents e.g. between drawings and BOQ and/or specifications
could be as in above item including possible shortfalls in experience of relevant teams
9. Shortfalls or ambiguities in standard contract documents, including standard specifications, methods of measurement (e.g. on tolerances and related payments), standard bidding documents (e.g. [i] alleged ambiguities or inadequacies in definitions and implementation protocols, on for example: (a) ‘price adjustment (escalation)’ payments for foreign components, or when VAT is removed/ reduced (b) increasing the unit rate of a BOQ item; and [ii] alleged lack of contractual teeth – deterrents/ penalties to discourage non-compliance in submissions e.g. of proper programmes with resource loadings etc.
such generic ‘loop-holes’ in standard documents are not unexpected, but need periodic identifying and ‘plugging’ by review of standard documents. Note – ICTAD is currently reviewing its own documents, but the issues identified herein may not be on their agenda
10. Sub-standard performance of consultants
could be (a) inadequate attention on weighting of technical capacities and potential performance in selection criteria and/or (b) inadequate monitoring & control mechanisms and/or (c) inadequate monitoring & control implementation etc.
11. Sub-standard performance of contractors
could be as in the item above
12. Delays or other issues arising from overall contract administration
could arise from any needs to up-date, rationalize or streamline approval and/decision making mechanisms etc.; from occasional delays in release of GOSL funds leading to payment delays and interest costs; over-use of informal channels e.g. between employers and contractors that could compromise the formal contractual mechanisms as well as undermine or demoralize those in the formal channels etc.
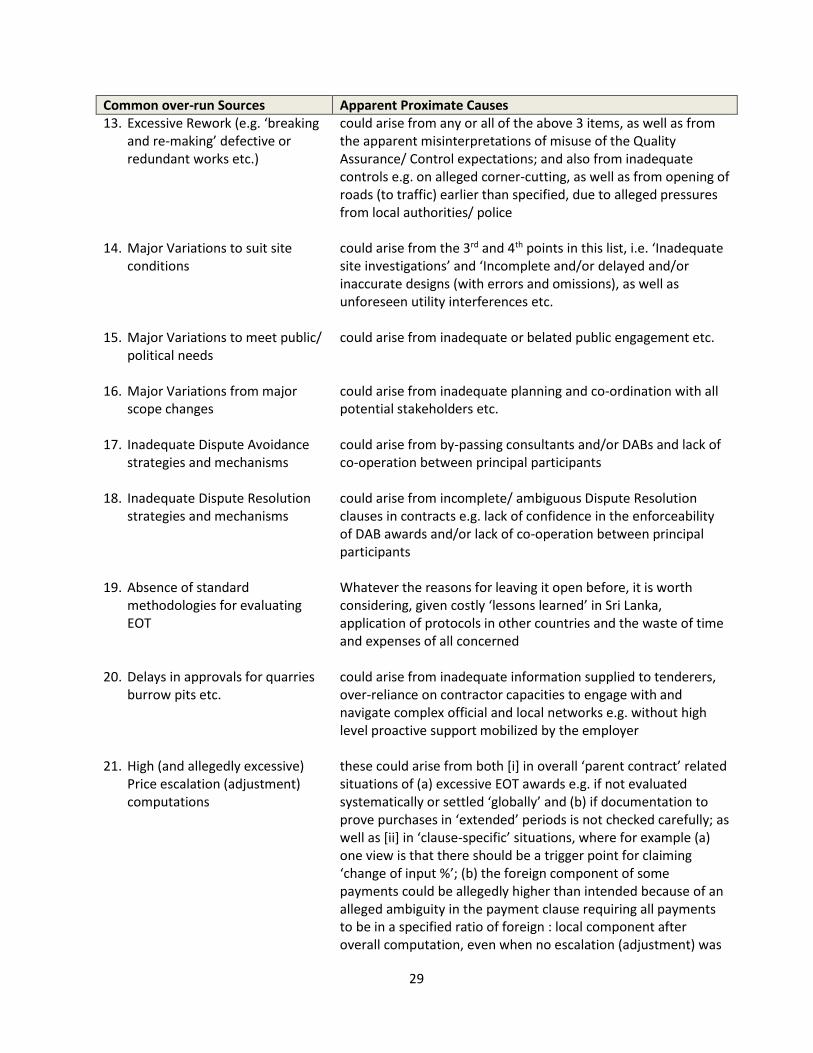
29
Common over-run Sources Apparent Proximate Causes 13. Excessive Rework (e.g. ‘breaking
and re-making’ defective or redundant works etc.)
could arise from any or all of the above 3 items, as well as from the apparent misinterpretations of misuse of the Quality Assurance/ Control expectations; and also from inadequate controls e.g. on alleged corner-cutting, as well as from opening of roads (to traffic) earlier than specified, due to alleged pressures from local authorities/ police
14. Major Variations to suit site conditions
could arise from the 3rd and 4th points in this list, i.e. ‘Inadequate site investigations’ and ‘Incomplete and/or delayed and/or inaccurate designs (with errors and omissions), as well as unforeseen utility interferences etc.
15. Major Variations to meet public/ political needs
could arise from inadequate or belated public engagement etc.
16. Major Variations from major scope changes
could arise from inadequate planning and co-ordination with all potential stakeholders etc.
17. Inadequate Dispute Avoidance strategies and mechanisms
could arise from by-passing consultants and/or DABs and lack of co-operation between principal participants
18. Inadequate Dispute Resolution strategies and mechanisms
could arise from incomplete/ ambiguous Dispute Resolution clauses in contracts e.g. lack of confidence in the enforceability of DAB awards and/or lack of co-operation between principal participants
19. Absence of standard methodologies for evaluating EOT
Whatever the reasons for leaving it open before, it is worth considering, given costly ‘lessons learned’ in Sri Lanka, application of protocols in other countries and the waste of time and expenses of all concerned
20. Delays in approvals for quarries burrow pits etc.
could arise from inadequate information supplied to tenderers, over-reliance on contractor capacities to engage with and navigate complex official and local networks e.g. without high level proactive support mobilized by the employer
21. High (and allegedly excessive) Price escalation (adjustment) computations
these could arise from both [i] in overall ‘parent contract’ related situations of (a) excessive EOT awards e.g. if not evaluated systematically or settled ‘globally’ and (b) if documentation to prove purchases in ‘extended’ periods is not checked carefully; as well as [ii] in ‘clause-specific’ situations, where for example (a) one view is that there should be a trigger point for claiming ‘change of input %’; (b) the foreign component of some payments could be allegedly higher than intended because of an alleged ambiguity in the payment clause requiring all payments to be in a specified ratio of foreign : local component after overall computation, even when no escalation (adjustment) was
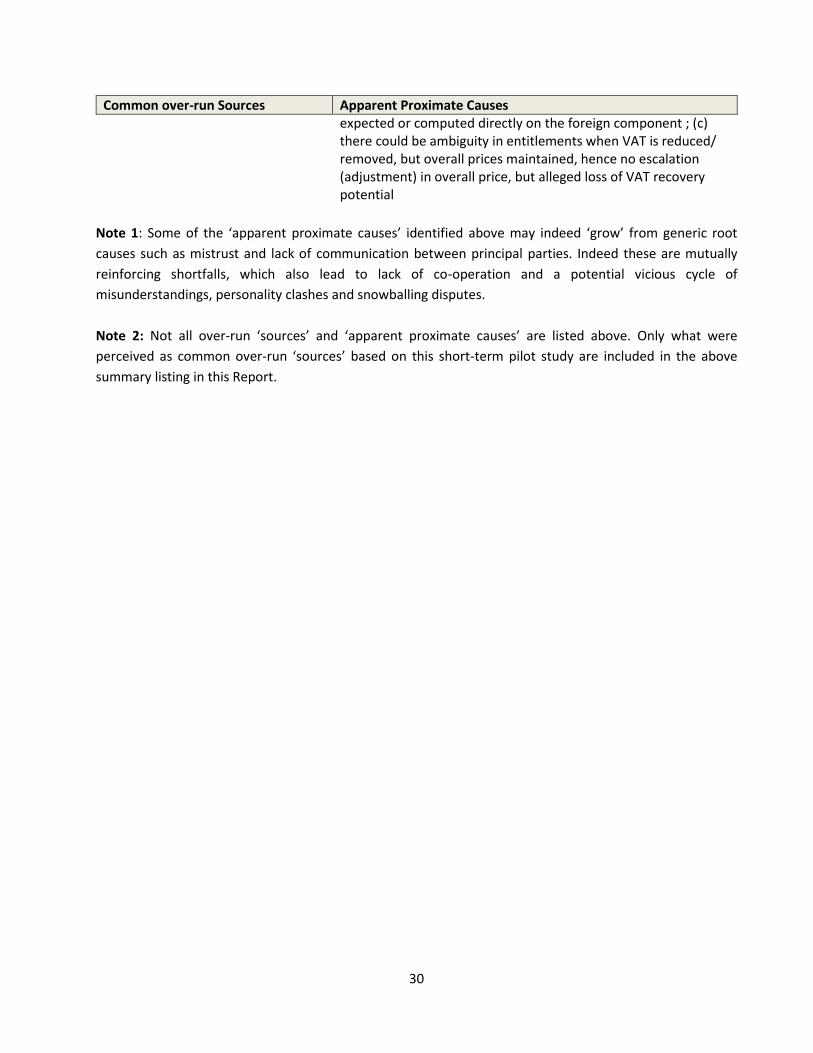
30
Common over-run Sources Apparent Proximate Causes expected or computed directly on the foreign component ; (c) there could be ambiguity in entitlements when VAT is reduced/ removed, but overall prices maintained, hence no escalation (adjustment) in overall price, but alleged loss of VAT recovery potential
Note 1: Some of the ‘apparent proximate causes’ identified above may indeed ‘grow’ from generic root
causes such as mistrust and lack of communication between principal parties. Indeed these are mutually
reinforcing shortfalls, which also lead to lack of co-operation and a potential vicious cycle of
misunderstandings, personality clashes and snowballing disputes.
Note 2: Not all over-run ‘sources’ and ‘apparent proximate causes’ are listed above. Only what were
perceived as common over-run ‘sources’ based on this short-term pilot study are included in the above
summary listing in this Report.
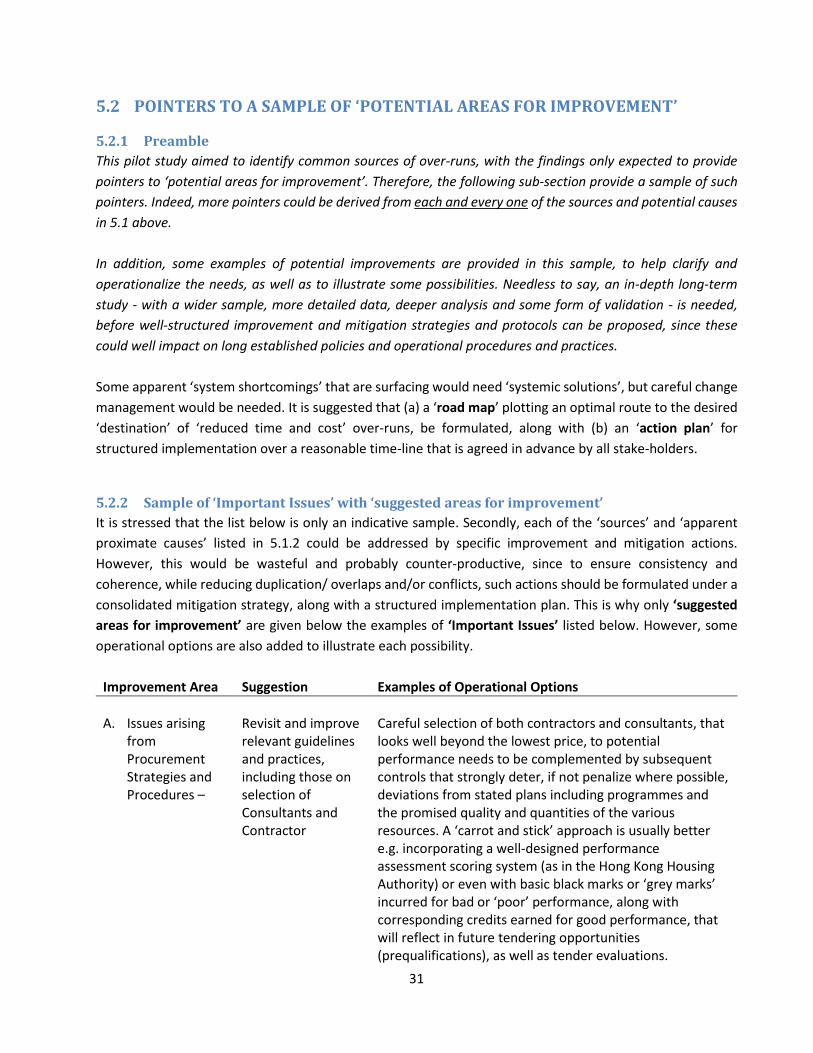
31
5.2 POINTERS TO A SAMPLE OF ‘POTENTIAL AREAS FOR IMPROVEMENT’
5.2.1 Preamble
This pilot study aimed to identify common sources of over-runs, with the findings only expected to provide
pointers to ‘potential areas for improvement’. Therefore, the following sub-section provide a sample of such
pointers. Indeed, more pointers could be derived from each and every one of the sources and potential causes
in 5.1 above.
In addition, some examples of potential improvements are provided in this sample, to help clarify and
operationalize the needs, as well as to illustrate some possibilities. Needless to say, an in-depth long-term
study - with a wider sample, more detailed data, deeper analysis and some form of validation - is needed,
before well-structured improvement and mitigation strategies and protocols can be proposed, since these
could well impact on long established policies and operational procedures and practices.
Some apparent ‘system shortcomings’ that are surfacing would need ‘systemic solutions’, but careful change
management would be needed. It is suggested that (a) a ‘road map’ plotting an optimal route to the desired
‘destination’ of ‘reduced time and cost’ over-runs, be formulated, along with (b) an ‘action plan’ for
structured implementation over a reasonable time-line that is agreed in advance by all stake-holders.
5.2.2 Sample of ‘Important Issues’ with ‘suggested areas for improvement’
It is stressed that the list below is only an indicative sample. Secondly, each of the ‘sources’ and ‘apparent
proximate causes’ listed in 5.1.2 could be addressed by specific improvement and mitigation actions.
However, this would be wasteful and probably counter-productive, since to ensure consistency and
coherence, while reducing duplication/ overlaps and/or conflicts, such actions should be formulated under a
consolidated mitigation strategy, along with a structured implementation plan. This is why only ‘suggested
areas for improvement’ are given below the examples of ‘Important Issues’ listed below. However, some
operational options are also added to illustrate each possibility.
Improvement Area Suggestion Examples of Operational Options
A. Issues arising
from Procurement Strategies and Procedures –
Revisit and improve relevant guidelines and practices, including those on selection of Consultants and Contractor
Careful selection of both contractors and consultants, that looks well beyond the lowest price, to potential performance needs to be complemented by subsequent controls that strongly deter, if not penalize where possible, deviations from stated plans including programmes and the promised quality and quantities of the various resources. A ‘carrot and stick’ approach is usually better e.g. incorporating a well-designed performance assessment scoring system (as in the Hong Kong Housing Authority) or even with basic black marks or ‘grey marks’ incurred for bad or ‘poor’ performance, along with corresponding credits earned for good performance, that will reflect in future tendering opportunities (prequalifications), as well as tender evaluations.
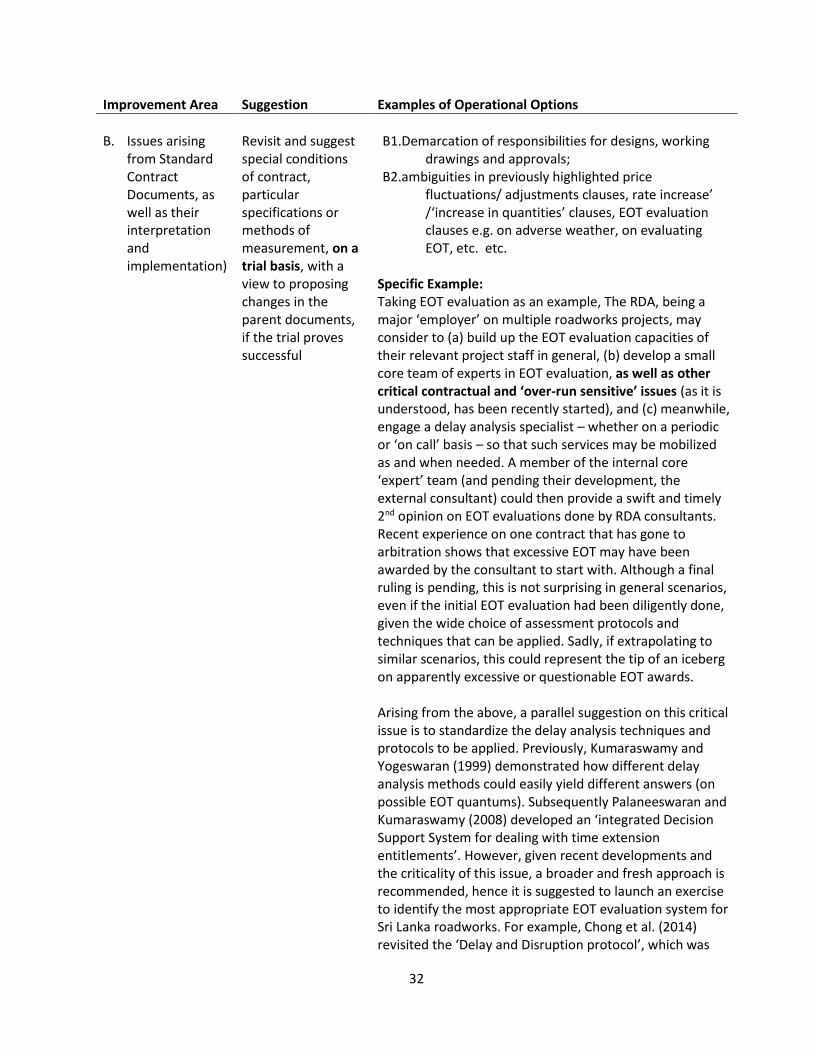
32
Improvement Area Suggestion Examples of Operational Options
B. Issues arising
from Standard Contract Documents, as well as their interpretation and implementation)
Revisit and suggest special conditions of contract, particular specifications or methods of measurement, on a trial basis, with a view to proposing changes in the parent documents, if the trial proves successful
B1.Demarcation of responsibilities for designs, working drawings and approvals;
B2.ambiguities in previously highlighted price fluctuations/ adjustments clauses, rate increase’ /‘increase in quantities’ clauses, EOT evaluation clauses e.g. on adverse weather, on evaluating EOT, etc. etc.
Specific Example: Taking EOT evaluation as an example, The RDA, being a major ‘employer’ on multiple roadworks projects, may consider to (a) build up the EOT evaluation capacities of their relevant project staff in general, (b) develop a small core team of experts in EOT evaluation, as well as other critical contractual and ‘over-run sensitive’ issues (as it is understood, has been recently started), and (c) meanwhile, engage a delay analysis specialist – whether on a periodic or ‘on call’ basis – so that such services may be mobilized as and when needed. A member of the internal core ‘expert’ team (and pending their development, the external consultant) could then provide a swift and timely 2nd opinion on EOT evaluations done by RDA consultants. Recent experience on one contract that has gone to arbitration shows that excessive EOT may have been awarded by the consultant to start with. Although a final ruling is pending, this is not surprising in general scenarios, even if the initial EOT evaluation had been diligently done, given the wide choice of assessment protocols and techniques that can be applied. Sadly, if extrapolating to similar scenarios, this could represent the tip of an iceberg on apparently excessive or questionable EOT awards. Arising from the above, a parallel suggestion on this critical issue is to standardize the delay analysis techniques and protocols to be applied. Previously, Kumaraswamy and Yogeswaran (1999) demonstrated how different delay analysis methods could easily yield different answers (on possible EOT quantums). Subsequently Palaneeswaran and Kumaraswamy (2008) developed an ‘integrated Decision Support System for dealing with time extension entitlements’. However, given recent developments and the criticality of this issue, a broader and fresh approach is recommended, hence it is suggested to launch an exercise to identify the most appropriate EOT evaluation system for Sri Lanka roadworks. For example, Chong et al. (2014) revisited the ‘Delay and Disruption protocol’, which was
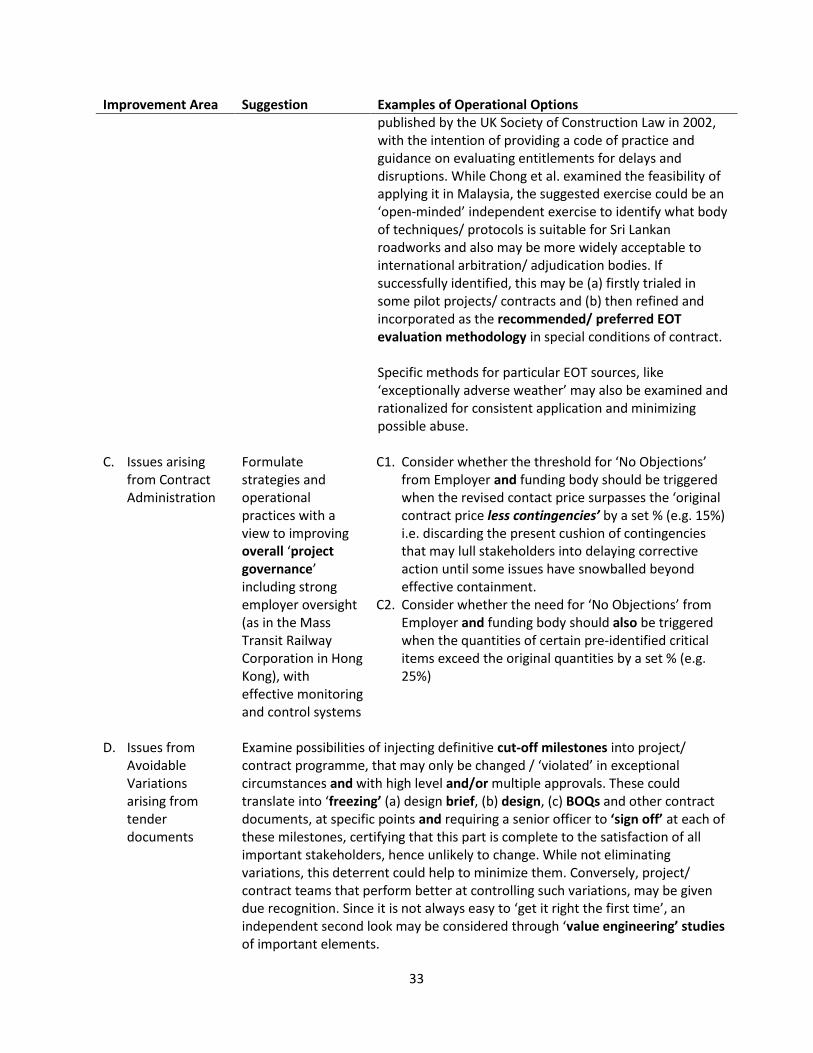
33
Improvement Area Suggestion Examples of Operational Options published by the UK Society of Construction Law in 2002, with the intention of providing a code of practice and guidance on evaluating entitlements for delays and disruptions. While Chong et al. examined the feasibility of applying it in Malaysia, the suggested exercise could be an ‘open-minded’ independent exercise to identify what body of techniques/ protocols is suitable for Sri Lankan roadworks and also may be more widely acceptable to international arbitration/ adjudication bodies. If successfully identified, this may be (a) firstly trialed in some pilot projects/ contracts and (b) then refined and incorporated as the recommended/ preferred EOT evaluation methodology in special conditions of contract. Specific methods for particular EOT sources, like ‘exceptionally adverse weather’ may also be examined and rationalized for consistent application and minimizing possible abuse.
C. Issues arising from Contract Administration
Formulate strategies and operational practices with a view to improving overall ‘project governance’ including strong employer oversight (as in the Mass Transit Railway Corporation in Hong Kong), with effective monitoring and control systems
C1. Consider whether the threshold for ‘No Objections’ from Employer and funding body should be triggered when the revised contact price surpasses the ‘original contract price less contingencies’ by a set % (e.g. 15%) i.e. discarding the present cushion of contingencies that may lull stakeholders into delaying corrective action until some issues have snowballed beyond effective containment.
C2. Consider whether the need for ‘No Objections’ from Employer and funding body should also be triggered when the quantities of certain pre-identified critical items exceed the original quantities by a set % (e.g. 25%)
D. Issues from Avoidable Variations arising from tender documents
Examine possibilities of injecting definitive cut-off milestones into project/ contract programme, that may only be changed / ‘violated’ in exceptional circumstances and with high level and/or multiple approvals. These could translate into ‘freezing’ (a) design brief, (b) design, (c) BOQs and other contract documents, at specific points and requiring a senior officer to ‘sign off’ at each of these milestones, certifying that this part is complete to the satisfaction of all important stakeholders, hence unlikely to change. While not eliminating variations, this deterrent could help to minimize them. Conversely, project/ contract teams that perform better at controlling such variations, may be given due recognition. Since it is not always easy to ‘get it right the first time’, an independent second look may be considered through ‘value engineering’ studies of important elements.
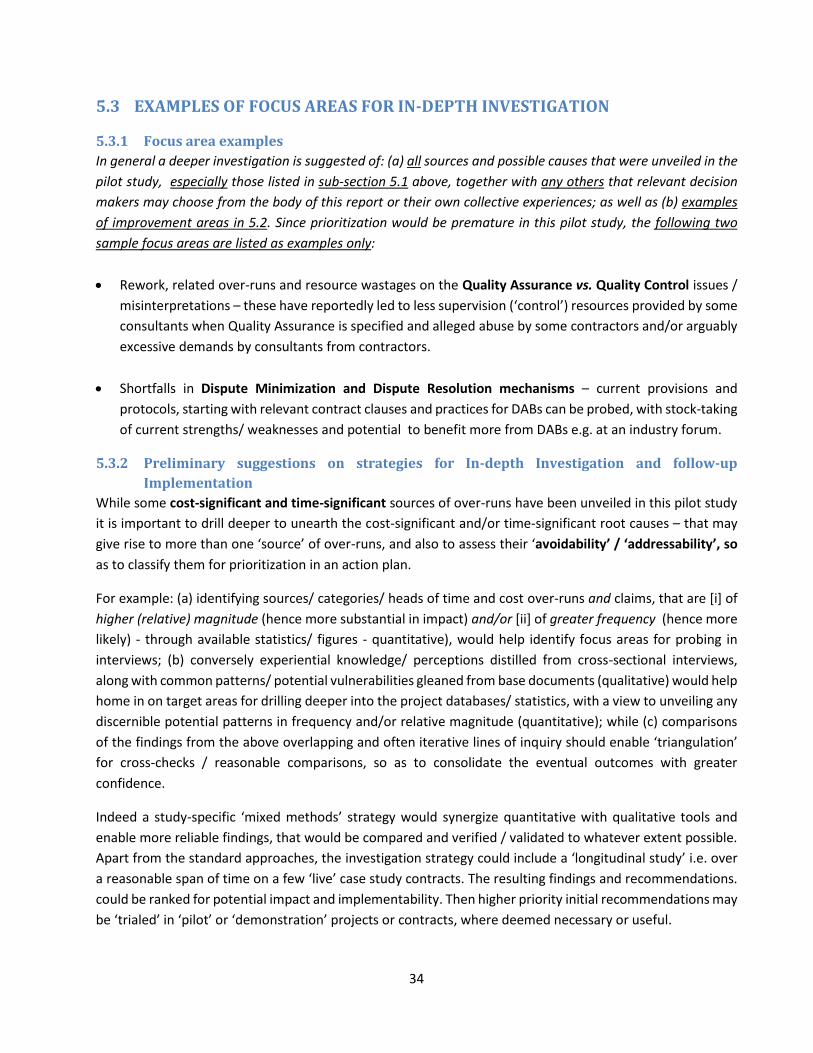
34
5.3 EXAMPLES OF FOCUS AREAS FOR IN-DEPTH INVESTIGATION
5.3.1 Focus area examples
In general a deeper investigation is suggested of: (a) all sources and possible causes that were unveiled in the
pilot study, especially those listed in sub-section 5.1 above, together with any others that relevant decision
makers may choose from the body of this report or their own collective experiences; as well as (b) examples
of improvement areas in 5.2. Since prioritization would be premature in this pilot study, the following two
sample focus areas are listed as examples only:
Rework, related over-runs and resource wastages on the Quality Assurance vs. Quality Control issues /
misinterpretations – these have reportedly led to less supervision (‘control’) resources provided by some
consultants when Quality Assurance is specified and alleged abuse by some contractors and/or arguably
excessive demands by consultants from contractors.
Shortfalls in Dispute Minimization and Dispute Resolution mechanisms – current provisions and
protocols, starting with relevant contract clauses and practices for DABs can be probed, with stock-taking
of current strengths/ weaknesses and potential to benefit more from DABs e.g. at an industry forum.
5.3.2 Preliminary suggestions on strategies for In-depth Investigation and follow-up
Implementation
While some cost-significant and time-significant sources of over-runs have been unveiled in this pilot study
it is important to drill deeper to unearth the cost-significant and/or time-significant root causes – that may
give rise to more than one ‘source’ of over-runs, and also to assess their ‘avoidability’ / ‘addressability’, so
as to classify them for prioritization in an action plan.
For example: (a) identifying sources/ categories/ heads of time and cost over-runs and claims, that are [i] of
higher (relative) magnitude (hence more substantial in impact) and/or [ii] of greater frequency (hence more
likely) - through available statistics/ figures - quantitative), would help identify focus areas for probing in
interviews; (b) conversely experiential knowledge/ perceptions distilled from cross-sectional interviews,
along with common patterns/ potential vulnerabilities gleaned from base documents (qualitative) would help
home in on target areas for drilling deeper into the project databases/ statistics, with a view to unveiling any
discernible potential patterns in frequency and/or relative magnitude (quantitative); while (c) comparisons
of the findings from the above overlapping and often iterative lines of inquiry should enable ‘triangulation’
for cross-checks / reasonable comparisons, so as to consolidate the eventual outcomes with greater
confidence.
Indeed a study-specific ‘mixed methods’ strategy would synergize quantitative with qualitative tools and
enable more reliable findings, that would be compared and verified / validated to whatever extent possible.
Apart from the standard approaches, the investigation strategy could include a ‘longitudinal study’ i.e. over
a reasonable span of time on a few ‘live’ case study contracts. The resulting findings and recommendations.
could be ranked for potential impact and implementability. Then higher priority initial recommendations may
be ‘trialed’ in ‘pilot’ or ‘demonstration’ projects or contracts, where deemed necessary or useful.
35
A proposal based on the above findings, could be to explore both the feasibility and potential value of
developing an ‘Over-run Hotspots Dashboard’ (or ‘Over-runs Alert Indicator’) that could help management
to focus more attention and deploy resources, on areas particularly vulnerable to over-runs in different types
of roadworks projects. While certain methods could be similar to some of those in risk appraisals, databases
of over-runs on previous similar contracts, could be developed and categorized to highlight sources and
causes triggering over-runs of higher (a) magnitude, (b) frequency and (c) avoidability.
Focusing attention on such hotspots in advance, should help reduce the more avoidable and significant time
and cost over-runs. Apart from the ‘systemic solutions’ suggested in 5.2.1, along with the proposed ‘road
map’ and ‘action plan’, overall over-runs minimization would also need total organizational commitment,
probably including a ‘culture shift’, adequate relevant resources and excellent change management.
36
REFERENCES, BIBLIOGRAPHY and
ACKNOWLEDGEMENTS
REFERENCES (cited herein)
Bordat, C., McCullouch, B.G., Labi, S. and Sinha, K.C. (2004) An analysis of Cost Overruns and Time Delays of INDOT projects, Publication FHWA/IN/JTRP-2004/07, Joint Transportation Reearch Pogram: Indiana Department of Transportation [INDOT] and Purdue University, USA. Chong, H., Tan, C., and Munir, O. (2014) Revisiting U.K. Delay and Disruption Protocol: Distinguished Features for
Contract Drafting." SCE Jnl. of Management in Engineering, 10.1061/(ASCE)ME.1943-5479.0000299.
CIRC (2001) CIRC (Construction Industry Review Committee) ‘Construct for Excellence’ report, The Government of Hong Kong Special Administrative Region, 207 pp. Dada, M.O. (2014) The influence of project team relationships on cost growth, Journal of Financial Management of Property and Construction, Vol. 19, Iss. 1, Aug., pp. 126-151. Dissanayake, S.M. and Kumaraswamy, M.M. (1999) ‘Comparing Contributors to Time and Cost Performance in Building
Projects’, Building and Environment Journal, Jan. ’99, Vol. 34, Issue 1, pp. 31-42.
Egan, J., (1998), Rethinking Construction. Report of the Construction Task Force, DETR/ HMSO, London, UK. E.H. Harris/ Arcadis (2014) Global Contract Disputes 2014, www.arcadis.com. Enshassi, A., Al-Najjar, J. and Kumaraswamy, M. (2009) Delays and Cost Overruns in the construction projects in the Gaza Strip, Journal of Financial Management of Property and Construction, Vol. 14, Issue 2, Aug., pp. 126-151.
Flyvbjerg, B., Holm, M.S. and Buhl, S. (2002) Under-estimating costs in public works projects, Error or Lie, Journal of
American Planning Association, Vol. 68, pp. 279-295.
ICTAD (1988) Institute for Construction Training and Development (ICTAD), Development of Domestic Construction Contractors, Cabinet paper 116 (contd. 71) of 14.06.88 – approved on 10.08.88 – Implementation Procedures, Publication no. ICTAD/ID/03. ICTAD (1992) Reports on 'Domestic Construction Industry in the Roads Sub-Sector': Inception Report in February 1992,
Interim Report in May 1992 and Final Report in September 1992, to RDA (Road Development Authority), World Bank
funded study, ICTAD (Institute for Construction Training and Development), Sri Lanka.
ICTAD (2008) Institute for Construction Training and Development (2008), Guidelines for Registration and Grading of Construction Contractors (English), 2nd edition, Publication no. ICTAD/ID/10.
ICTAD (2014) Institute for Construction Training and Development, web-site [accessed 22 May 2014]
http://www.ictad.lk/
Jeyakanthan, J. and Jayawardane, A.K.W. (2012), Mitigating project delays in donor funded road projects in Sri Lanka,
Engineer, Journal of the IESL (Instn. Of Engineer Sri Lanka), Vol. XXXXV, Issue 1.
37
Kumaraswamy, M.M. (1997a) ‘Common Categories and Causes of Construction Claims’, Construction Law Journal, Sweet
& Maxwell, U.K., Vol. 13, Issue 1, pp. 21-34.
Kumaraswamy, M.M. (1997b) 'Appropriate Appraisal and Apportionment of Megaproject Risks', ASCE Journal of
Professional Issues in Engineering, Vol. 123, Issue 2, April 1997, pp.51-56.
Kumaraswamy, M.M. (1997c) 'Conflicts, Claims and Disputes in Construction', Engineering, Construction and
Architectural Management Journal, Blackwell Science, Vol. 4, Issue 2, 1997, pp. 95-111.
Kumaraswamy, M.M. (2006) Editorial, Special Issue on ‘Legal Aspects of Relational Contracting’, ASCE (American
Society of Civil Engineers) Journal of Professional Issues in Engineering Education and Practice (Legal Affairs Section),
Vol. 132, Issue 1, Jan. 2006, pp. 42-43.
Kumaraswamy, M.M. and Chan, D.W.M. (1998) 'Contributors to Construction Delays', Journal of Construction
Management and Economics, Vol. 16, Issue 1, E.& F.N. Spon, pp. 17-29.
Kumaraswamy, M.M. and Yogeswaran, K. (1998) ‘Significant Sources of Construction Claims’ International Construction
Law Review, LLP, Vol. 15, Part 1, pp. 144-160.
Kumaraswamy, M.M. and Yogeswaran. K. (1999) ‘Evaluating Time Extension Entitlements’, Construction Law Journal,
Sweet & Maxwell, Vol. 15, Issue 6, pp. 437-448.
Kumaraswamy, M.M., Anvuur, A.M. and Smyth, H.J. (2010) Pursuing ‘Relational Integration’ and ‘Overall Value’ Through
‘RIVANS’, Facilities, Vol. 28, Issue 13/14, pp. 673 – 686, Oct. 2010.
Latham, M., (1994), Constructing the Team – Final Report of the Government/Industry Review of Procurement and Contractual Arrangements in the UK Construction Industry, HMSO, UK, 130 pp. Love, P.E.D., Sing, C.P., Wang, X.Y., Irani, Z. and Thwala D.W. (2014a) Overruns in Transportation Infrastructure Projects, Structure and Infrastructure Engineering, Vol. 10, Issue 2, pp. 141-159. Love, P.E.D., Smith, J. Simpson, I. Regan, M. Sutrisna and M. Olatunji, O. (2014b) Understanding the landscape of Overruns in Transportation Infrastructure Projects, Environment and Planning B: Planning & Design, accessed 14-6-‘14: http://www.researchgate.net/publication/261707474_Understanding_the_Landscape_of_Overruns_in_Transport_Infrastructure_Projects Ministry of Construction, Engineering Services, Housing & Common Amenities (2013) Roadmap Towards Construction
Industry Master Plan for Sri Lanka 2014-2024, ICTAD, 160 p.
Rahman, M.M. and Kumaraswamy, M.M. (2012) Multi-Country Perspectives of Relational Contracting and Integrated
Project Teams, Journal of Construction Engineering and Management, ASCE, Apr 2012, Vol. 138 Issue 4, pp. 469-480.
Rosenfield, Y. (2014) Root-cause analysis of Construction-Cost Overruns, ASCE Journal of Construction Engineering and Management, Vol. 140, Iss. 1, (Jan. 2014), pp. 04013039-1 to 04013039-10.
Shehu, Z. Endut, R. and Akintoye, A. (2014) Factors contributing to project time and hence cost overrun in the Malaysian
construction industry, Jnl. Of Financil Management of Property an Construction, Vol. 19, Iss. 1, pp. 55-75.
Palaneeswaran, E. and Kumaraswamy. M.M. (2008) An integrated Decision Support System for dealing with Time
Extension Entitlements, Journal of Automation in Construction, Vol. 17, Issue 4, May, pp. 425 – 438.
38
Park, Y. and Papadopoulou, T. (2012) Cost Overruns in Transport Infrastructure Projects in Asia: their Significance and
Relationship with Project Size, Built Environment Project and Asset Management, Vol. 2, Iss. 2, pp. 195-216.
Perera, B.A.K.S., Rameezdeen, R, Chieshe, N. and Hosseni, M.R. (2014) Enhancing the effectiveness of risk management
practices in Sri Lankan road construction projects: A Delphi approach, International Journal of Construction
Management, Vol. 14, Issue 1, pp. 1-19.
Wijekoon (2011) Study on the factors influencing Performance of Road construction industry, International Conference
on Structural Engineering, Construction and Management( ICSECM 2011), December 2011, Kandy Sri Lanka, Paper
No.SEC/11/75.
Wijekoon and Attananayake (2012) Study on the Cost Overrun in Road construction projects in Sri Lanka, Second International Conference on Sustainable Built Environment (ICSBE 2012), December 2012, Kandy, Sri Lanka, Paper No.SBE/12/111. Wijekoon and Uduweriya (2012) Study on the Delays in construction projects in Water Sector in Sri Lanka, Annual
Sessions of the Institution of Engineers Sri Lanka, Transaction 2012, Volume 1-Part B Technical Papers), pp. 313-319.
BIBLIOGRAPHY (not specifically cited, but potentially relevant)
Chan, D.W.M. and Kumaraswamy, M.M. (1999) ‘Forecasting Construction Durations for Public Housing Projects: a Hong
Kong perspective’ Building and Environment Journal, Vol. 34, No. 5, pp. 633-646.
Chan, D.W.M. and Kumaraswamy, M.M. (2002) ‘Compressing construction durations: Lessons learned from Hong Kong
building projects’, International Journal of Project Management, Vol. 20, Issue 1, ISSN 0263-7863/01, pp. 23-35.
Creedy (2006) Risk Factors leading to Cost Overrun in the delivery of Highway Construction projects, PhD Thesis, Queensland University of Technology, Australia. Dissanayaka S.M. and Kumaraswamy, M.M. (1999) ‘Evaluation of factors affecting Time and Cost performance in Hong Kong Building projects’, Engineering, Construction and Architectural Management Journal, Vol. 6, No. 3, pp. 287-298. Kumaraswamy, M.M. and Yogeswaran, K. (1997) 'Encouraging Conflicts, Discouraging Disputes and Managing Claims',
NICMAR Journal of Construction Management, National Institute of Construction Management and Research, India, Vol.
XII, Jan. - Mar. 1997, pp. 15-30.
Kumaraswamy, M.M. and Yogeswaran, K. (2003) ‘Substantiation and Assessment of Claims for Extensions of Time’, International Journal of Project Management, Vol. 21, pp. 27-38.
Wong, K.K.W., Kumaraswamy, M.M., Mahesh, G., Ling, F.Y.Y. (2014) Building Integrated Project and Asset Management
Teams for Sustainable Built Infrastructure Development, Journal of Facilities Management, Vol. 12, Issue 3.
Palaneeswaran, E., Love, P.E.D, Kumaraswamy, M.M. and Ng, T.S.T. (2008) Mapping rework causes and effects using
artificial neural networks, Building Research & Information, Vol. 36, Issue 5, Aug., pp. 450-465
Palaneeswaran, E., Love P., Kumaraswamy, M.M. and Ng, S.T., (2014) Causal Ascription of Rework in Building and Civil
Engineering Projects: A Multivariate Exploration, Engineering, Construction and Architectural Management, Vol. 21, No.
1, pp. 111-126.

39
Yogeswaran. K., Kumaraswamy, M.M., and Miller, D.R.A. (1998) ‘Claims for Extensions of Time in Civil Engineering
Projects’, Journal of Construction Management and Economics, Vol. 16, No. 3, pp. 283-293.
40
APPENDICES and TABLES
Appendix 1 Example from Hong Kong, of a previous ‘Causal hierarchy’ of Construction Claims
Appendix 2(A) Example from Hong Kong, of a previous profile of Time Over-runs
Appendix 2(B) Example from Hong Kong, of a previous profile of Cost Over-runs
Table 1 PRP - May 2014 SUMMARY of Recommended EOT
Table 2(a) PRP - ‘Approved Costs’ and ‘% Increases’ status summary – Uva Province
Table 2(b) PRP - ‘Approved Costs’ and ‘% Increases’ status summary – Eastern Province
Table 2(c) PRP - ‘Approved Costs’ and ‘% Increases’ status summary – Northern Province
Table 3 RSAP -1: ‘Approved Costs’ and ‘% Increases’ status summary as in May 2013
Table 4 RSAP -1 (Road Sector Assistance Project I): Time Over-runs & comparison
Table 5 RSAP -2 Kantalai-Trincomalee Section: EOT on RSAP Phase 2 K-T section
Table 6 RSAP Rural Roads Pilot: EOT on RSAP Rural Roads
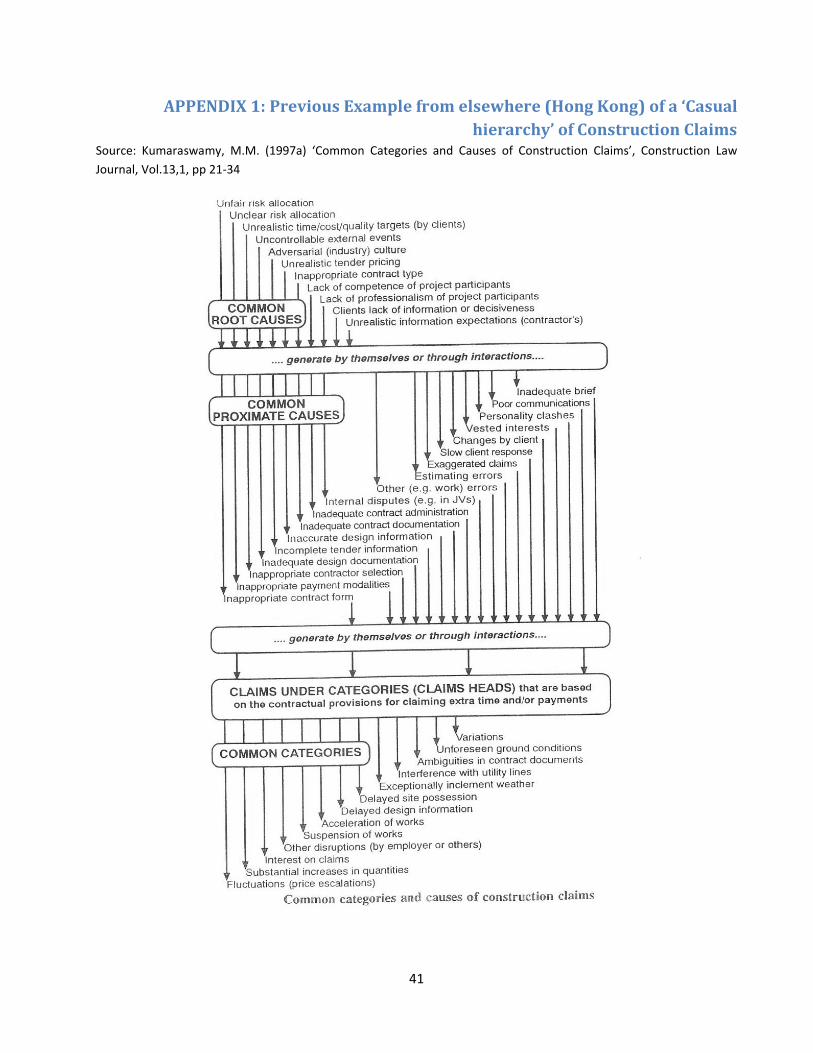
41
APPENDIX 1: Previous Example from elsewhere (Hong Kong) of a ‘Casual
hierarchy’ of Construction Claims Source: Kumaraswamy, M.M. (1997a) ‘Common Categories and Causes of Construction Claims’, Construction Law
Journal, Vol.13,1, pp 21-34
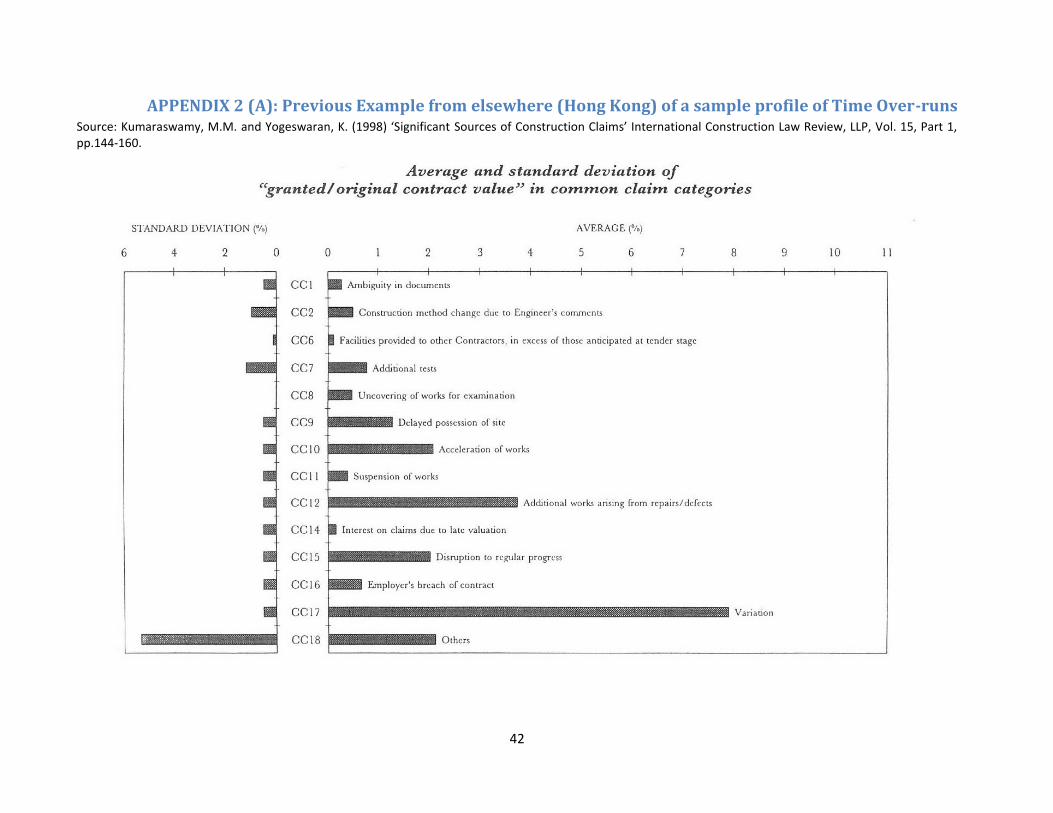
42
APPENDIX 2 (A): Previous Example from elsewhere (Hong Kong) of a sample profile of Time Over-runs Source: Kumaraswamy, M.M. and Yogeswaran, K. (1998) ‘Significant Sources of Construction Claims’ International Construction Law Review, LLP, Vol. 15, Part 1, pp.144-160.
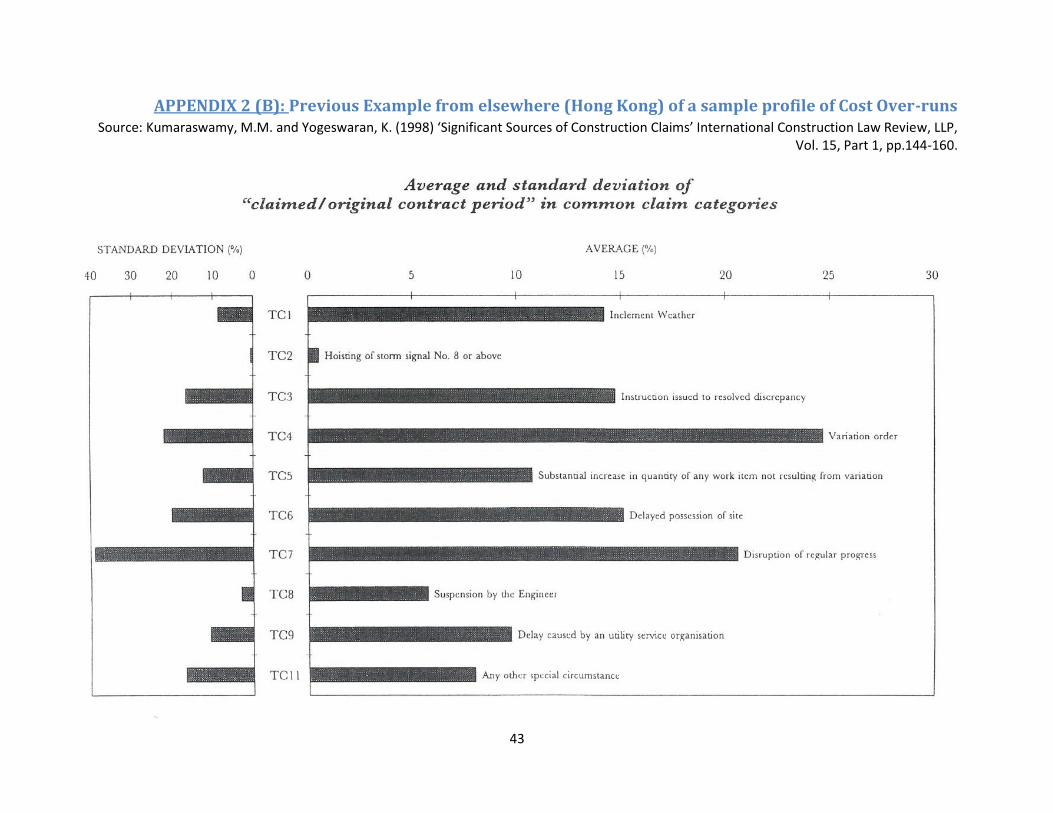
43
APPENDIX 2 (B): Previous Example from elsewhere (Hong Kong) of a sample profile of Cost Over-runs Source: Kumaraswamy, M.M. and Yogeswaran, K. (1998) ‘Significant Sources of Construction Claims’ International Construction Law Review, LLP,
Vol. 15, Part 1, pp.144-160.
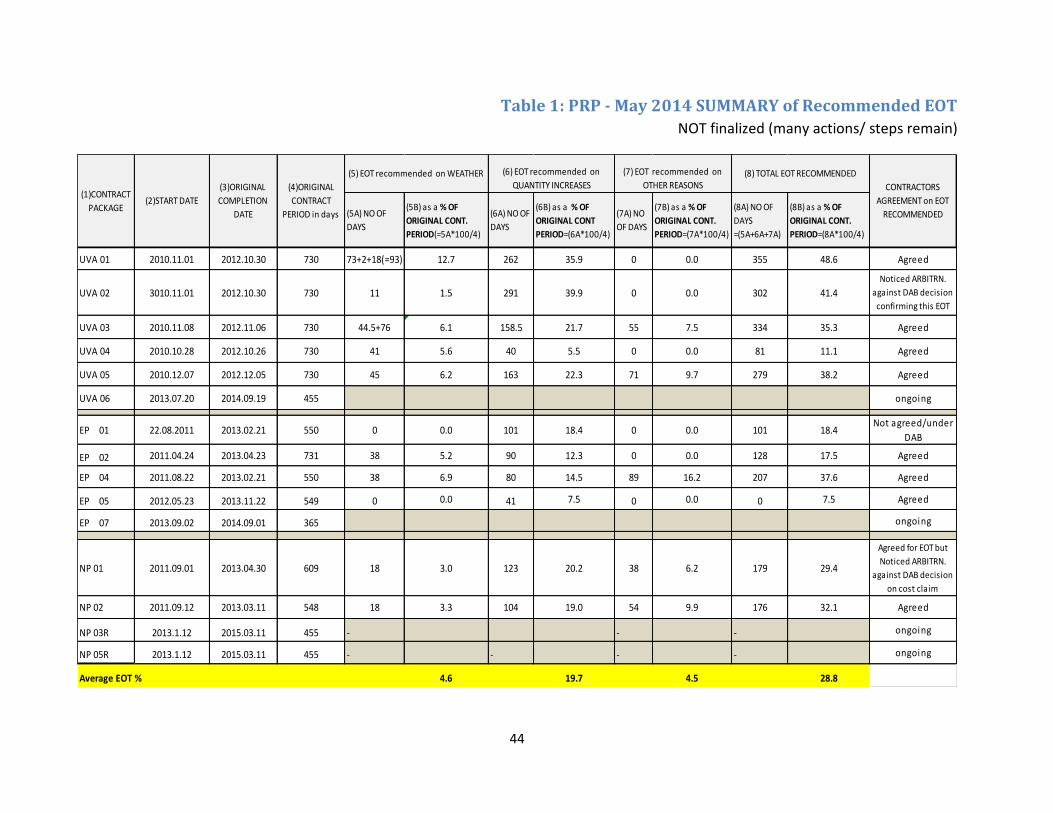
44
Table 1: PRP - May 2014 SUMMARY of Recommended EOT
NOT finalized (many actions/ steps remain)
(5A) NO OF
DAYS
(5B) as a % OF
ORIGINAL CONT.
PERIOD(=5A*100/4)
(6A) NO OF
DAYS
(6B) as a % OF
ORIGINAL CONT
PERIOD=(6A*100/4)
(7A) NO
OF DAYS
(7B) as a % OF
ORIGINAL CONT.
PERIOD=(7A*100/4)
(8A) NO OF
DAYS
=(5A+6A+7A)
(8B) as a % OF
ORIGINAL CONT.
PERIOD=(8A*100/4)
UVA 01 2010.11.01 2012.10.30 730 73+2+18(=93) 12.7 262 35.9 0 0.0 355 48.6 Agreed
UVA 02 3010.11.01 2012.10.30 730 11 1.5 291 39.9 0 0.0 302 41.4
Noticed ARBITRN.
against DAB decision
confirming this EOT
UVA 03 2010.11.08 2012.11.06 730 44.5+76 6.1 158.5 21.7 55 7.5 334 35.3 Agreed
UVA 04 2010.10.28 2012.10.26 730 41 5.6 40 5.5 0 0.0 81 11.1 Agreed
UVA 05 2010.12.07 2012.12.05 730 45 6.2 163 22.3 71 9.7 279 38.2 Agreed
UVA 06 2013.07.20 2014.09.19 455 ongoing
EP 01 22.08.2011 2013.02.21 550 0 0.0 101 18.4 0 0.0 101 18.4Not agreed/under
DAB
EP 02 2011.04.24 2013.04.23 731 38 5.2 90 12.3 0 0.0 128 17.5 Agreed
EP 04 2011.08.22 2013.02.21 550 38 6.9 80 14.5 89 16.2 207 37.6 Agreed
EP 05 2012.05.23 2013.11.22 549 0 0.0 41 7.5 0 0.0 0 7.5 Agreed
EP 07 2013.09.02 2014.09.01 365 ongoing
NP 01 2011.09.01 2013.04.30 609 18 3.0 123 20.2 38 6.2 179 29.4
Agreed for EOT but
Noticed ARBITRN.
against DAB decision
on cost claim
NP 02 2011.09.12 2013.03.11 548 18 3.3 104 19.0 54 9.9 176 32.1 Agreed
NP 03R 2013.1.12 2015.03.11 455 - - - ongoing
NP 05R 2013.1.12 2015.03.11 455 - - - - ongoing
Average EOT % 4.6 19.7 4.5 28.8
(7) EOT recommended on
OTHER REASONS (8) TOTAL EOT RECOMMENDED
CONTRACTORS
AGREEMENT on EOT
RECOMMENDED
(5) EOT recommended on WEATHER
(1)CONTRACT
PACKAGE(2)START DATE
(3)ORIGINAL
COMPLETION
DATE
(4)ORIGINAL
CONTRACT
PERIOD in days
(6) EOT recommended on
QUANTITY INCREASES
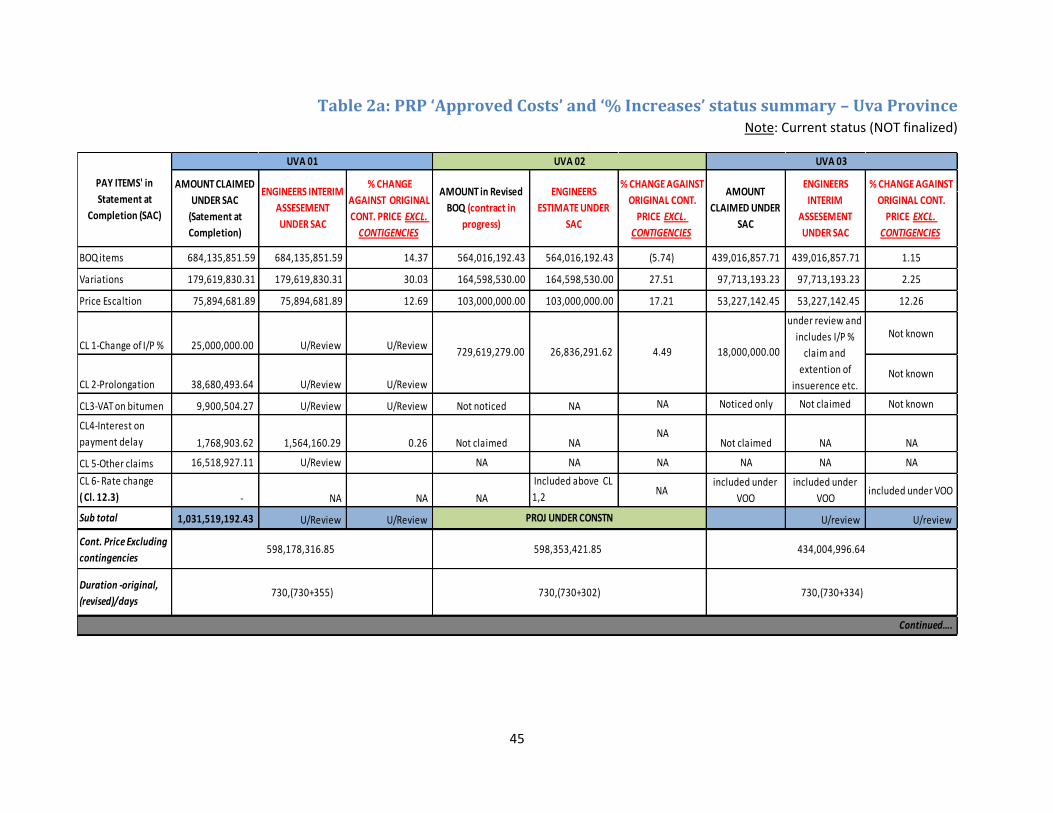
45
Table 2a: PRP ‘Approved Costs’ and ‘% Increases’ status summary – Uva Province Note: Current status (NOT finalized)
BOQ items 684,135,851.59 684,135,851.59 14.37 564,016,192.43 564,016,192.43 (5.74) 439,016,857.71 439,016,857.71 1.15
Variations 179,619,830.31 179,619,830.31 30.03 164,598,530.00 164,598,530.00 27.51 97,713,193.23 97,713,193.23 2.25
Price Escaltion 75,894,681.89 75,894,681.89 12.69 103,000,000.00 103,000,000.00 17.21 53,227,142.45 53,227,142.45 12.26
CL 1-Change of I/P % 25,000,000.00 U/Review U/ReviewNot known
CL 2-Prolongation 38,680,493.64 U/Review U/ReviewNot known
CL3-VAT on bitumen 9,900,504.27 U/Review U/Review Not noticed NA NA Noticed only Not claimed Not known
CL4-Interest on
payment delay 1,768,903.62 1,564,160.29 0.26 Not claimed NANA
Not claimed NA NA
CL 5-Other claims 16,518,927.11 U/Review NA NA NA NA NA NA
CL 6- Rate change
( Cl. 12.3) - NA NA NA
Included above CL
1,2 NA
included under
VOO
included under
VOOincluded under VOO
Sub total 1,031,519,192.43 U/Review U/Review U/review U/review
Cont. Price Excluding
contingencies
Duration -original,
(revised)/days
Continued….
730,(730+355) 730,(730+302) 730,(730+334)
PROJ UNDER CONSTN
598,178,316.85 598,353,421.85 434,004,996.64
729,619,279.00 26,836,291.62 4.49 18,000,000.00
under review and
includes I/P %
claim and
extention of
insuerence etc.
AMOUNT CLAIMED
UNDER SAC
(Satement at
Completion)
ENGINEERS INTERIM
ASSESEMENT
UNDER SAC
% CHANGE
AGAINST ORIGINAL
CONT. PRICE EXCL.
CONTIGENCIES
AMOUNT in Revised
BOQ (contract in
progress)
ENGINEERS
ESTIMATE UNDER
SAC
% CHANGE AGAINST
ORIGINAL CONT.
PRICE EXCL.
CONTIGENCIES
AMOUNT
CLAIMED UNDER
SAC
ENGINEERS
INTERIM
ASSESEMENT
UNDER SAC
% CHANGE AGAINST
ORIGINAL CONT.
PRICE EXCL.
CONTIGENCIES
PAY ITEMS' in
Statement at
Completion (SAC)
UVA 01 UVA 02 UVA 03
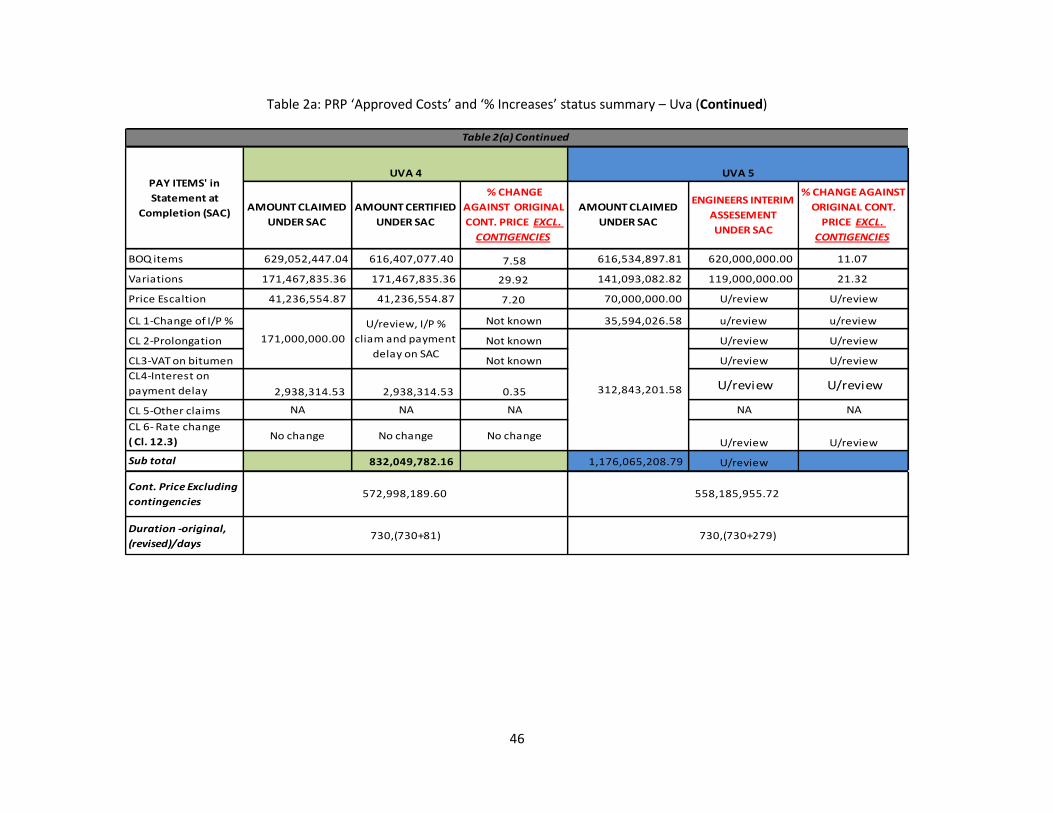
46
Table 2a: PRP ‘Approved Costs’ and ‘% Increases’ status summary – Uva (Continued)
BOQ items 629,052,447.04 616,407,077.40 7.58 616,534,897.81 620,000,000.00 11.07
Variations 171,467,835.36 171,467,835.36 29.92 141,093,082.82 119,000,000.00 21.32
Price Escaltion 41,236,554.87 41,236,554.87 7.20 70,000,000.00 U/review U/review
CL 1-Change of I/P % Not known 35,594,026.58 u/review u/review
CL 2-Prolongation Not known U/review U/review
CL3-VAT on bitumen Not known U/review U/review
CL4-Interest on
payment delay 2,938,314.53 2,938,314.53 0.35 U/review U/review
CL 5-Other claims NA NA NA NA NA
CL 6- Rate change
( Cl. 12.3)No change No change No change
U/review U/review
Sub total 832,049,782.16 1,176,065,208.79 U/review
Cont. Price Excluding
contingencies
Duration -original,
(revised)/days
PAY ITEMS' in
Statement at
Completion (SAC)
Table 2(a) Continued
730,(730+81) 730,(730+279)
U/review, I/P %
cliam and payment
delay on SAC
312,843,201.58
572,998,189.60 558,185,955.72
AMOUNT CLAIMED
UNDER SAC
ENGINEERS INTERIM
ASSESEMENT
UNDER SAC
% CHANGE AGAINST
ORIGINAL CONT.
PRICE EXCL.
CONTIGENCIES
171,000,000.00
UVA 5UVA 4
AMOUNT CLAIMED
UNDER SAC
AMOUNT CERTIFIED
UNDER SAC
% CHANGE
AGAINST ORIGINAL
CONT. PRICE EXCL.
CONTIGENCIES
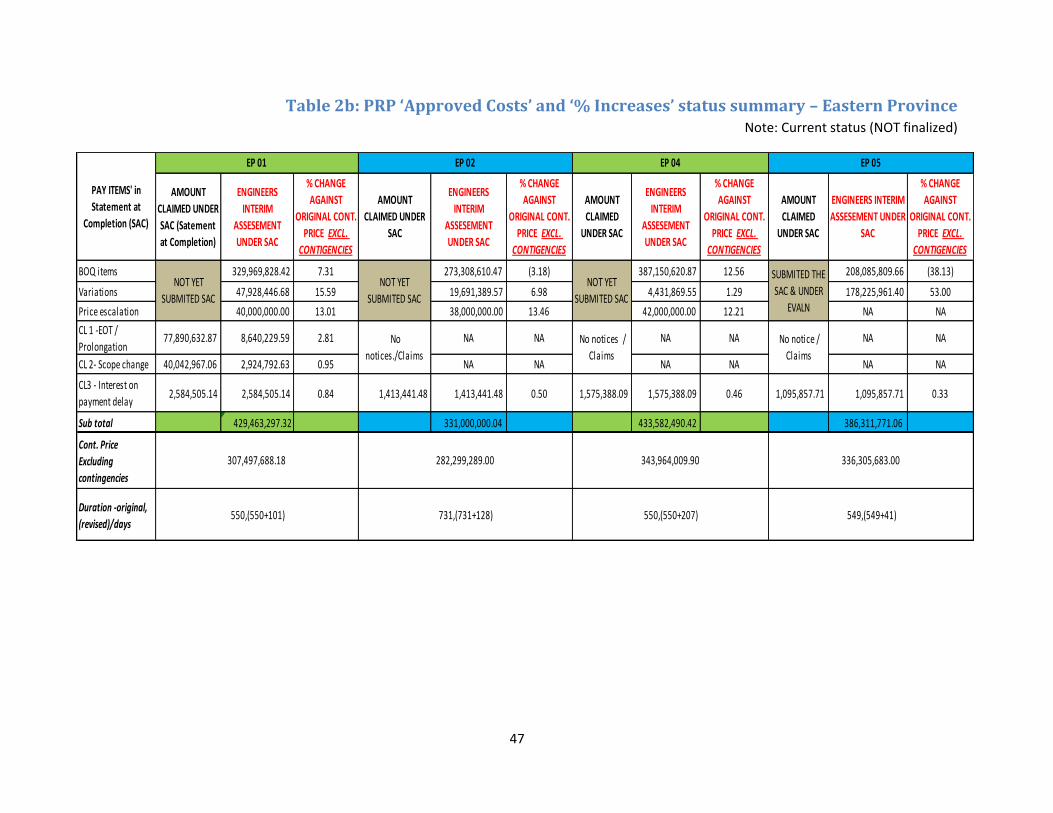
47
Table 2b: PRP ‘Approved Costs’ and ‘% Increases’ status summary – Eastern Province Note: Current status (NOT finalized)
BOQ items 329,969,828.42 7.31 273,308,610.47 (3.18) 387,150,620.87 12.56 208,085,809.66 (38.13)
Variations 47,928,446.68 15.59 19,691,389.57 6.98 4,431,869.55 1.29 178,225,961.40 53.00
Price escalation 40,000,000.00 13.01 38,000,000.00 13.46 42,000,000.00 12.21 NA NA
CL 1 -EOT /
Prolongation 77,890,632.87 8,640,229.59 2.81 NA NA NA NA NA NA
CL 2- Scope change 40,042,967.06 2,924,792.63 0.95 NA NA NA NA NA NA
CL3 - Interest on
payment delay 2,584,505.14 2,584,505.14 0.84 1,413,441.48 1,413,441.48 0.50 1,575,388.09 1,575,388.09 0.46 1,095,857.71 1,095,857.71 0.33
Sub total 429,463,297.32 331,000,000.04 433,582,490.42 386,311,771.06
Cont. Price
Excluding
contingencies
Duration -original,
(revised)/days
336,305,683.00
550,(550+101) 731,(731+128) 550,(550+207) 549,(549+41)
No notices /
Claims
No notice /
Claims
EP 01 EP 02
NOT YET
SUBMITED SAC
No
notices./Claims
NOT YET
SUBMITED SAC
282,299,289.00
AMOUNT
CLAIMED UNDER
SAC (Satement
at Completion)
ENGINEERS
INTERIM
ASSESEMENT
UNDER SAC
AMOUNT
CLAIMED UNDER
SAC
ENGINEERS
INTERIM
ASSESEMENT
UNDER SAC
AMOUNT
CLAIMED
UNDER SAC
ENGINEERS
INTERIM
ASSESEMENT
UNDER SAC
AMOUNT
CLAIMED
UNDER SAC
ENGINEERS INTERIM
ASSESEMENT UNDER
SAC
EP 04
% CHANGE
AGAINST
ORIGINAL CONT.
PRICE EXCL.
CONTIGENCIES
% CHANGE
AGAINST
ORIGINAL CONT.
PRICE EXCL.
CONTIGENCIES
NOT YET
SUBMITED SAC
SUBMITED THE
SAC & UNDER
EVALN
% CHANGE
AGAINST
ORIGINAL CONT.
PRICE EXCL.
CONTIGENCIES
% CHANGE
AGAINST
ORIGINAL CONT.
PRICE EXCL.
CONTIGENCIES
343,964,009.90
EP 05
307,497,688.18
PAY ITEMS' in
Statement at
Completion (SAC)
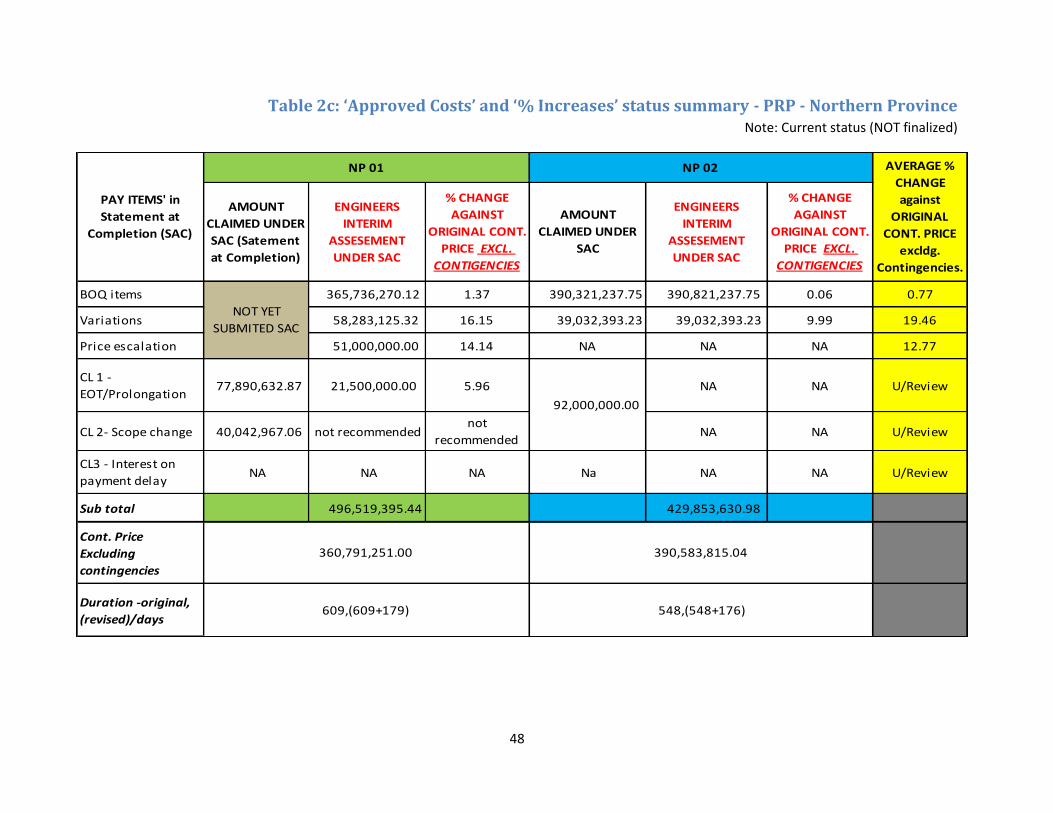
48
Table 2c: ‘Approved Costs’ and ‘% Increases’ status summary - PRP - Northern Province Note: Current status (NOT finalized)
BOQ items 365,736,270.12 1.37 390,321,237.75 390,821,237.75 0.06 0.77
Variations 58,283,125.32 16.15 39,032,393.23 39,032,393.23 9.99 19.46
Price escalation 51,000,000.00 14.14 NA NA NA 12.77
CL 1 -
EOT/Prolongation 77,890,632.87 21,500,000.00 5.96 NA NA U/Review
CL 2- Scope change 40,042,967.06 not recommended not
recommended NA NA U/Review
CL3 - Interest on
payment delay NA NA NA Na NA NA U/Review
Sub total 496,519,395.44 429,853,630.98
Cont. Price
Excluding
contingencies
Duration -original,
(revised)/days609,(609+179) 548,(548+176)
92,000,000.00
NOT YET
SUBMITED SAC
AVERAGE %
CHANGE
against
ORIGINAL
CONT. PRICE
excldg.
Contingencies.
360,791,251.00 390,583,815.04
AMOUNT
CLAIMED UNDER
SAC
ENGINEERS
INTERIM
ASSESEMENT
UNDER SAC
NP 01 NP 02
% CHANGE
AGAINST
ORIGINAL CONT.
PRICE EXCL.
CONTIGENCIES
% CHANGE
AGAINST
ORIGINAL CONT.
PRICE EXCL.
CONTIGENCIES
PAY ITEMS' in
Statement at
Completion (SAC)
AMOUNT
CLAIMED UNDER
SAC (Satement
at Completion)
ENGINEERS
INTERIM
ASSESEMENT
UNDER SAC
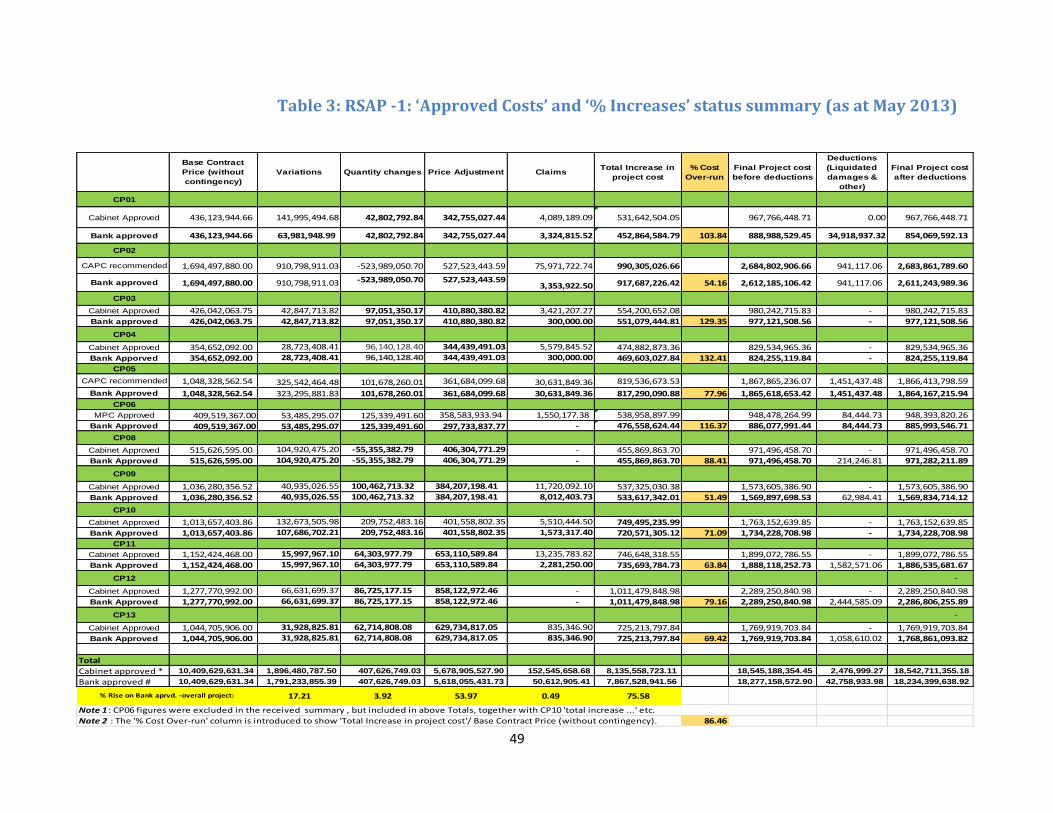
49
Table 3: RSAP -1: ‘Approved Costs’ and ‘% Increases’ status summary (as at May 2013)
Base Contract
Price (without
contingency)
Variations Quantity changes Price Adjustment ClaimsTotal Increase in
project cost
% Cost
Over-run
Final Project cost
before deductions
Deductions
(Liquidated
damages &
other)
Final Project cost
after deductions
CP01
Cabinet Approved 436,123,944.66 141,995,494.68 42,802,792.84 342,755,027.44 4,089,189.09 531,642,504.05 967,766,448.71 0.00 967,766,448.71
Bank approved 436,123,944.66 63,981,948.99 42,802,792.84 342,755,027.44 3,324,815.52 452,864,584.79 103.84 888,988,529.45 34,918,937.32 854,069,592.13
CP02
CAPC recommended 1,694,497,880.00 910,798,911.03 -523,989,050.70 527,523,443.59 75,971,722.74 990,305,026.66 2,684,802,906.66 941,117.06 2,683,861,789.60
Bank approved 1,694,497,880.00 910,798,911.03 -523,989,050.70 527,523,443.593,353,922.50 917,687,226.42 54.16 2,612,185,106.42 941,117.06 2,611,243,989.36
CP03
Cabinet Approved 426,042,063.75 42,847,713.82 97,051,350.17 410,880,380.82 3,421,207.27 554,200,652.08 980,242,715.83 - 980,242,715.83
Bank approved 426,042,063.75 42,847,713.82 97,051,350.17 410,880,380.82 300,000.00 551,079,444.81 129.35 977,121,508.56 - 977,121,508.56
CP04
Cabinet Approved 354,652,092.00 28,723,408.41 96,140,128.40 344,439,491.03 5,579,845.52 474,882,873.36 829,534,965.36 - 829,534,965.36
Bank Apporved 354,652,092.00 28,723,408.41 96,140,128.40 344,439,491.03 300,000.00 469,603,027.84 132.41 824,255,119.84 - 824,255,119.84
CP05
CAPC recommended 1,048,328,562.54 325,542,464.48 101,678,260.01 361,684,099.68 30,631,849.36 819,536,673.53 1,867,865,236.07 1,451,437.48 1,866,413,798.59
Bank Approved 1,048,328,562.54 323,295,881.83 101,678,260.01 361,684,099.68 30,631,849.36 817,290,090.88 77.96 1,865,618,653.42 1,451,437.48 1,864,167,215.94
CP06
MPC Approved 409,519,367.00 53,485,295.07 125,339,491.60 358,583,933.94 1,550,177.38 538,958,897.99 948,478,264.99 84,444.73 948,393,820.26
Bank Approved 409,519,367.00 53,485,295.07 125,339,491.60 297,733,837.77 - 476,558,624.44 116.37 886,077,991.44 84,444.73 885,993,546.71
CP08
Cabinet Approved 515,626,595.00 104,920,475.20 -55,355,382.79 406,304,771.29 - 455,869,863.70 971,496,458.70 - 971,496,458.70
Bank Approved 515,626,595.00 104,920,475.20 -55,355,382.79 406,304,771.29 - 455,869,863.70 88.41 971,496,458.70 214,246.81 971,282,211.89
CP09
Cabinet Approved 1,036,280,356.52 40,935,026.55 100,462,713.32 384,207,198.41 11,720,092.10 537,325,030.38 1,573,605,386.90 - 1,573,605,386.90
Bank Approved 1,036,280,356.52 40,935,026.55 100,462,713.32 384,207,198.41 8,012,403.73 533,617,342.01 51.49 1,569,897,698.53 62,984.41 1,569,834,714.12
CP10
Cabinet Approved 1,013,657,403.86 132,673,505.98 209,752,483.16 401,558,802.35 5,510,444.50 749,495,235.99 1,763,152,639.85 - 1,763,152,639.85
Bank Approved 1,013,657,403.86 107,686,702.21 209,752,483.16 401,558,802.35 1,573,317.40 720,571,305.12 71.09 1,734,228,708.98 - 1,734,228,708.98
CP11
Cabinet Approved 1,152,424,468.00 15,997,967.10 64,303,977.79 653,110,589.84 13,235,783.82 746,648,318.55 1,899,072,786.55 - 1,899,072,786.55
Bank Approved 1,152,424,468.00 15,997,967.10 64,303,977.79 653,110,589.84 2,281,250.00 735,693,784.73 63.84 1,888,118,252.73 1,582,571.06 1,886,535,681.67
CP12 -
Cabinet Approved 1,277,770,992.00 66,631,699.37 86,725,177.15 858,122,972.46 - 1,011,479,848.98 2,289,250,840.98 - 2,289,250,840.98
Bank Approved 1,277,770,992.00 66,631,699.37 86,725,177.15 858,122,972.46 - 1,011,479,848.98 79.16 2,289,250,840.98 2,444,585.09 2,286,806,255.89
CP13 -
Cabinet Approved 1,044,705,906.00 31,928,825.81 62,714,808.08 629,734,817.05 835,346.90 725,213,797.84 1,769,919,703.84 - 1,769,919,703.84
Bank Approved 1,044,705,906.00 31,928,825.81 62,714,808.08 629,734,817.05 835,346.90 725,213,797.84 69.42 1,769,919,703.84 1,058,610.02 1,768,861,093.82
Total
Cabinet approved * 10,409,629,631.34 1,896,480,787.50 407,626,749.03 5,678,905,527.90 152,545,658.68 8,135,558,723.11 18,545,188,354.45 2,476,999.27 18,542,711,355.18
Bank approved # 10,409,629,631.34 1,791,233,855.39 407,626,749.03 5,618,055,431.73 50,612,905.41 7,867,528,941.56 18,277,158,572.90 42,758,933.98 18,234,399,638.92
17.21 3.92 53.97 0.49 75.58
86.46Note 2 : The '% Cost Over-run' column is introduced to show 'Total Increase in project cost'/ Base Contract Price (without contingency).
Note 1 : CP06 figures were excluded in the received summary , but included in above Totals, together with CP10 'total increase ...' etc.
% Rise on Bank aprvd. -overall project:
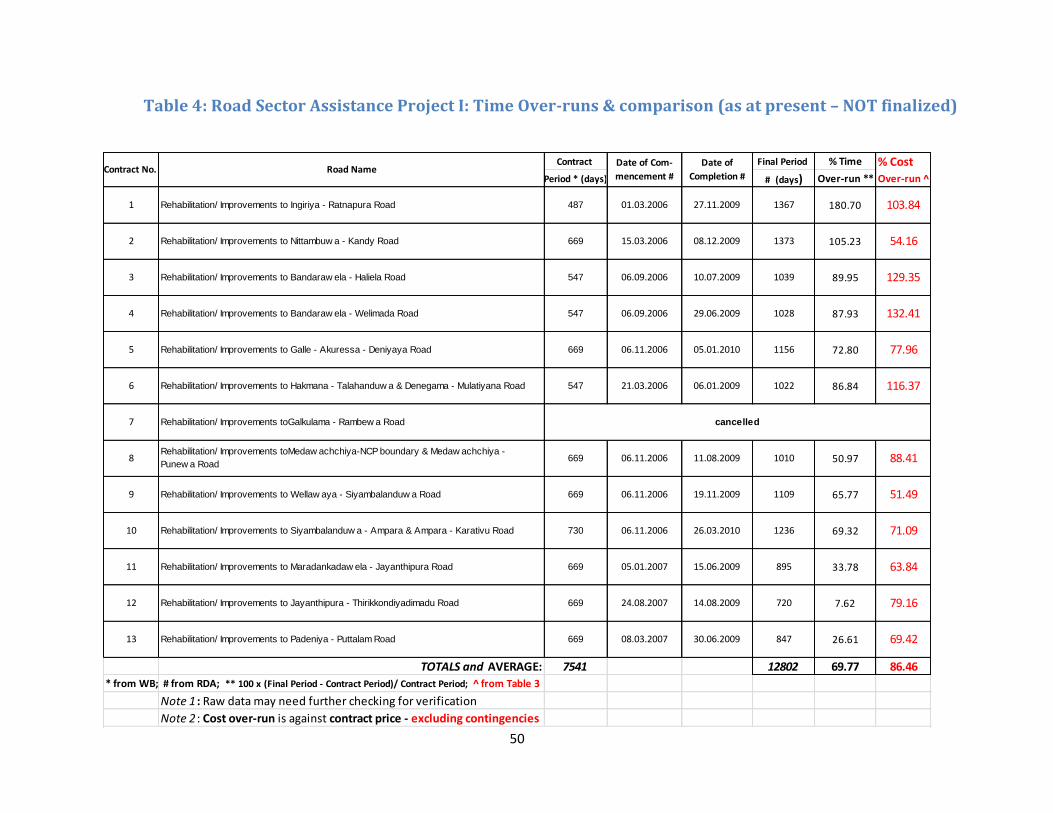
50
Table 4: Road Sector Assistance Project I: Time Over-runs & comparison (as at present – NOT finalized)
Contract Final Period % Time % Cost
Period * (days) # (days) Over-run ** Over-run ^
TOTALS and AVERAGE: 7541 12802 69.77 86.46
* from WB; # from RDA; ** 100 x (Final Period - Contract Period)/ Contract Period; ̂from Table 3
Note 1 : Raw data may need further checking for verification
Note 2 : Cost over-run is against contract price - excluding contingencies
63.84
79.16
69.42
116.37
88.41
51.49
71.09
103.84
54.16
129.35
132.41
77.96
cancelled
13
Rehabilitation/ Improvements to Galle - Akuressa - Deniyaya Road 05.01.2010
Rehabilitation/ Improvements to Hakmana - Talahanduw a & Denegama - Mulatiyana Road
Rehabilitation/ Improvements toGalkulama - Rambew a Road
Rehabilitation/ Improvements toMedaw achchiya-NCP boundary & Medaw achchiya -
Punew a Road
Rehabilitation/ Improvements to Wellaw aya - Siyambalanduw a Road 19.11.2009
Rehabilitation/ Improvements to Siyambalanduw a - Ampara & Ampara - Karativu Road
Rehabilitation/ Improvements to Maradankadaw ela - Jayanthipura Road 15.06.2009
06.01.2009
11.08.2009
26.03.2010
8
9
10
11
12
Rehabilitation/ Improvements to Padeniya - Puttalam Road 30.06.2009
669
669
Contract No.
Rehabilitation/ Improvements to Jayanthipura - Thirikkondiyadimadu Road 14.08.2009
Road NameDate of
Completion #
Date of Com-
mencement #
06.09.2006
27.11.2009
Rehabilitation/ Improvements to Nittambuw a - Kandy Road 08.12.2009
Rehabilitation/ Improvements to Bandaraw ela - Haliela Road 10.07.2009
1
2
3
4
5
6
7
Rehabilitation/ Improvements to Ingiriya - Ratnapura Road
Rehabilitation/ Improvements to Bandaraw ela - Welimada Road 29.06.2009
669
669
669
01.03.2006
15.03.2006
06.09.2006
06.11.2006
05.01.2007
24.08.2007
08.03.2007
06.11.2006
21.03.2006
06.11.2006
06.11.2006
1010
1109
730
487
669
547
547
669
1236
895
720
547
847
180.70
105.23
89.95
87.93
72.80
86.84
50.97
65.77
69.32
33.78
7.62
26.61
1367
1373
1039
1028
1156
1022
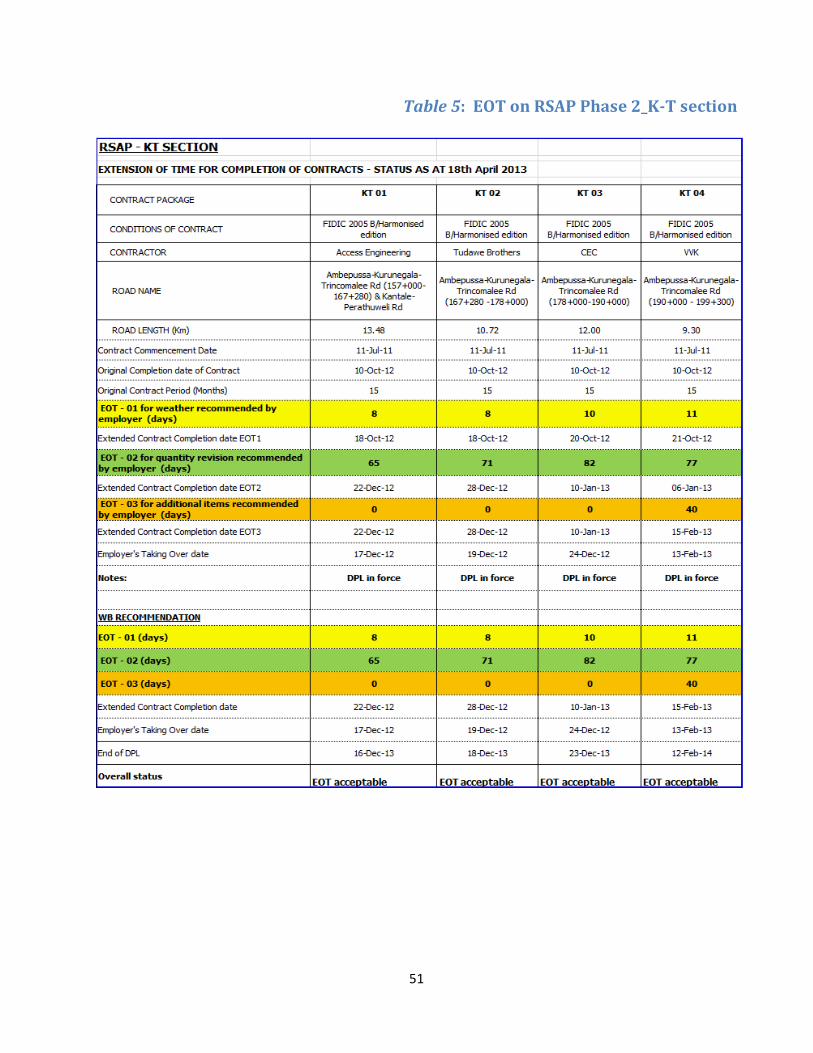
51
Table 5: EOT on RSAP Phase 2_K-T section
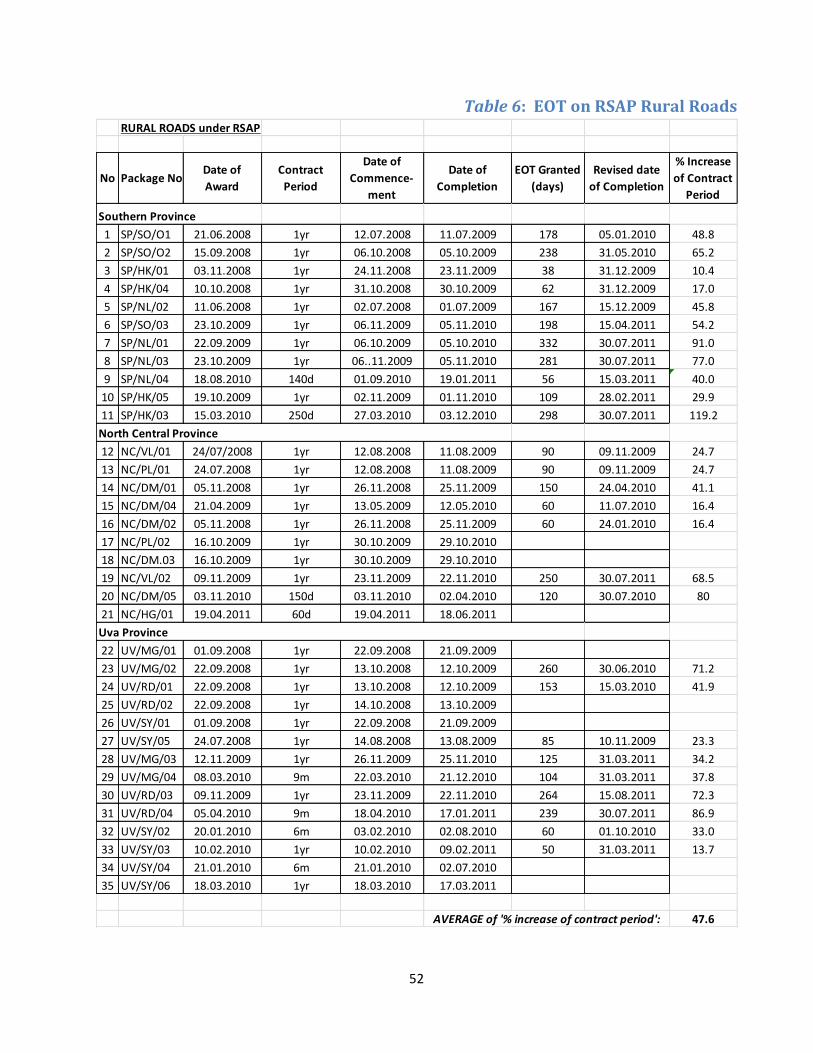
52
Table 6: EOT on RSAP Rural Roads
RURAL ROADS under RSAP
No Package NoDate of
Award
Contract
Period
Date of
Commence-
ment
Date of
Completion
EOT Granted
(days)
Revised date
of Completion
% Increase
of Contract
Period
1 SP/SO/O1 21.06.2008 1yr 12.07.2008 11.07.2009 178 05.01.2010 48.8
2 SP/SO/O2 15.09.2008 1yr 06.10.2008 05.10.2009 238 31.05.2010 65.2
3 SP/HK/01 03.11.2008 1yr 24.11.2008 23.11.2009 38 31.12.2009 10.4
4 SP/HK/04 10.10.2008 1yr 31.10.2008 30.10.2009 62 31.12.2009 17.0
5 SP/NL/02 11.06.2008 1yr 02.07.2008 01.07.2009 167 15.12.2009 45.8
6 SP/SO/03 23.10.2009 1yr 06.11.2009 05.11.2010 198 15.04.2011 54.2
7 SP/NL/01 22.09.2009 1yr 06.10.2009 05.10.2010 332 30.07.2011 91.0
8 SP/NL/03 23.10.2009 1yr 06..11.2009 05.11.2010 281 30.07.2011 77.0
9 SP/NL/04 18.08.2010 140d 01.09.2010 19.01.2011 56 15.03.2011 40.0
10 SP/HK/05 19.10.2009 1yr 02.11.2009 01.11.2010 109 28.02.2011 29.9
11 SP/HK/03 15.03.2010 250d 27.03.2010 03.12.2010 298 30.07.2011 119.2
12 NC/VL/01 24/07/2008 1yr 12.08.2008 11.08.2009 90 09.11.2009 24.7
13 NC/PL/01 24.07.2008 1yr 12.08.2008 11.08.2009 90 09.11.2009 24.7
14 NC/DM/01 05.11.2008 1yr 26.11.2008 25.11.2009 150 24.04.2010 41.1
15 NC/DM/04 21.04.2009 1yr 13.05.2009 12.05.2010 60 11.07.2010 16.4
16 NC/DM/02 05.11.2008 1yr 26.11.2008 25.11.2009 60 24.01.2010 16.4
17 NC/PL/02 16.10.2009 1yr 30.10.2009 29.10.2010
18 NC/DM.03 16.10.2009 1yr 30.10.2009 29.10.2010
19 NC/VL/02 09.11.2009 1yr 23.11.2009 22.11.2010 250 30.07.2011 68.5
20 NC/DM/05 03.11.2010 150d 03.11.2010 02.04.2010 120 30.07.2010 80
21 NC/HG/01 19.04.2011 60d 19.04.2011 18.06.2011
22 UV/MG/01 01.09.2008 1yr 22.09.2008 21.09.2009
23 UV/MG/02 22.09.2008 1yr 13.10.2008 12.10.2009 260 30.06.2010 71.2
24 UV/RD/01 22.09.2008 1yr 13.10.2008 12.10.2009 153 15.03.2010 41.9
25 UV/RD/02 22.09.2008 1yr 14.10.2008 13.10.2009
26 UV/SY/01 01.09.2008 1yr 22.09.2008 21.09.2009
27 UV/SY/05 24.07.2008 1yr 14.08.2008 13.08.2009 85 10.11.2009 23.3
28 UV/MG/03 12.11.2009 1yr 26.11.2009 25.11.2010 125 31.03.2011 34.2
29 UV/MG/04 08.03.2010 9m 22.03.2010 21.12.2010 104 31.03.2011 37.8
30 UV/RD/03 09.11.2009 1yr 23.11.2009 22.11.2010 264 15.08.2011 72.3
31 UV/RD/04 05.04.2010 9m 18.04.2010 17.01.2011 239 30.07.2011 86.9
32 UV/SY/02 20.01.2010 6m 03.02.2010 02.08.2010 60 01.10.2010 33.0
33 UV/SY/03 10.02.2010 1yr 10.02.2010 09.02.2011 50 31.03.2011 13.7
34 UV/SY/04 21.01.2010 6m 21.01.2010 02.07.2010
35 UV/SY/06 18.03.2010 1yr 18.03.2010 17.03.2011
AVERAGE of '% increase of contract period': 47.6
Uva Province
Southern Province
North Central Province