Embed Size (px)
Citation preview
Source and Dispersion of Odors in the Baldwin Hills
and Its Effect on the Surrounding Communities
To Identify Areas Potentially Impacted by Nuisance Odors in the
Baldwin Hills Community
Authored by:
Geoffrey Clifford
Bryan Moy
Andrea Siu
Jennifer Webb
Victoria Zalameda
Advised by: Travis Brooks, Magali Delmas, and Travis Longcore
Course: Environment 180
_____________________________________________________________________________
Contents
Acknowledgements……………………………………………………………………………ii Executive Summary ………………………………………………………………………...…1 Introduction …………………………………………………………………………………....3 Literature Review…………………………………………………………………………….11 Wind Patterns and Dispersion ……………………………………………………….11 Environmental Justice ………………………………………………………………..12 Public Health ………………………………………………………………………....14 Methodology …………………………………………………………………………………16 Results ………………………………………………………………………………………..20 Special Knowledge Survey …………………………………………………………..20 Door-to-Door Survey ………………………………………………………...............21 Wind Patterns ………………………………………………………………………...24 Discussion ……………………………………………………………………………………28 Challenges ……………………………………………………………………………29 Future Implications ………………………………………………………………….30 References ……………………………………………………………………………………33 Appendix A: Special Knowledge Survey Appendix B: Door-to-Door Survey Appendix C: Wind Measurements
_____________________________________________________________________________
ii
Acknowledgements
E would like to thank David McNeil, Executive Officer, and Sandra Hamlat, Associate Park and Recreation Specialist, of the Baldwin Hills Conservancy for their assistance and support in completing this project. We would also like to thank Dr.
Travis Longcore for his guidance and orchestrating a wonderful Senior Capstone Experience, and Dr. Magalis Delmas for her assistance and sponsorship of the Human Subject Review process. Further acknowledgment goes to Professor Burkard Baschek, whom without his weather station, meteorological data could not have been collected. Lastly, we would like to thank our group advisor, Travis Brooks, for his perseverance, persistence, and unending guidance to push us to achieve a product that we are truly proud of. None of this would have been possible without his help.
W
_____________________________________________________________________________
Executive Summary
HE Baldwin Hills, located in Los Angeles, California, represents a prime example of the intersection of conflicting land uses. Within close proximity to numerous businesses, highways, municipal buildings and an oil field, the communities within and surrounding
the Baldwin Hills have the potential for exposure to a number of environmental hazards. Because of the large minority and low-income populations in these areas, there are also concerns about environmental justice, requiring attention to identify hazards that disproportionally impact the community and to make efforts to mitigate them. Members of the community are concerned about the potential impact to their health from these hazards, including the impact of nuisance odors. However, in part due to the topography of the area, local wind patterns and the intermittent and unpredictable nature of nuisance odors, it has been difficult to consistently identify the sources of nuisance odors.
The goal of this study was to identify areas potentially impacted by nuisance odors in the Baldwin Hills community in order to gain further information and awareness regarding the impact of adjacent land uses. Due to previous significant releases of nuisance odors from sewer gases and oil production operations, the community has become concerned regarding the threat of future nuisance odors and their associated potential health effects. By identifying the areas in the Baldwin Hills community that have been most affected by nuisance odors and characterizing the local wind patterns in those areas, this project (1) characterizes the geographic extent of populations that are impacted by nuisance odors, (2) provides baseline information for efforts to mitigate potential future nuisance odors, and (3) identifies areas that may benefit from long term air quality monitoring.
From the preliminary results gathered, it was inferred that a majority of areas surrounding the Baldwin Hills have experienced varying amounts of nuisance odors, although overall most survey respondents do not report experiencing nuisance odors. In the early morning hours, the movement of air masses, and correspondingly nuisance odors, are highly influenced by the topography of the Baldwin Hills. In the early morning hours wind speeds are very low, close to one mph, and hence, cold air drainage appears to determine the movement of air masses, as cold air moves down-slope. The afternoon hours are dominated by faster wind speeds, between three to four mph, in the North to East direction, which is characteristic of the typical on shore afternoon coastal breeze in Los Angeles. Areas in the Baldwin Hills to the North and East are most likely impacted by nuisance odors transported across the open space and oil production activity of the Baldwin Hills in the afternoon, while nuisance odors are most likely transported by cold air drainage to low lying areas in the Baldwin Hills in the morning. These preliminary conclusions need to be tested further and are only applicable for typical meteorological conditions and do not apply to weather events, such as during storm systems or Santa Ana Winds.
Interpretation of the significance of the results is limited by the lack of access to gated communities and business for door-to-door surveys. The hours which surveys were conducted also influenced the study results, as many residents were unavailable to be surveyed due to conflicting work hours. Lastly, while it is difficult to determine if residents have become sensitized to specific nuisance odors, this may have major implications in that possible nuisance odor problems may exist, however, residents may be too acclimated to notice.
T

_____________________________________________________________________________
2
By identifying both the areas in the community that have been historically affected by nuisance odors and the prevailing wind patterns in those areas, the project’s results will hopefully provide baseline information that can be used by industry and residents to mitigate potential future nuisance odors. While this project cannot assess the health impacts associated with the nuisance odors, or specifically identify the exact odor sources, this project has provided the Baldwin Hills community with information about the areas experiencing nuisance odors, and how the local wind patterns can affect their transport. Through garnered community support, the Baldwin Hills community can utilize this study as a resource. Since the community already has a general interest with nuisance odors, this study will bring the community closer together and give them additional support in determining the potential sources of the nuisance odors.
_____________________________________________________________________________
3
Introduction
OS Angeles, California is known for a rich diversity of people, sprawling urban communities, and for a variety of dynamic industries, including entertainment, fashion, aerospace, transportation, construction and oil production. The historical trajectory of
urban and industrial development in Los Angeles, beginning from a small farming community in 1781 to a modern megalopolis, has changed the landscape from open scrublands and ephemeral wetlands to a densely knit patchwork of residential, commercial, industrial and public space.
Los Angeles is densely populated and the geographic patterns of land use are important to the quality of life of its inhabitants. According to the U.S. Census Bureau, Los Angeles County was the highest populated county in California, estimating around 9,883,649 people out of an approximate baseline of 36,264,467 people in California (U.S. Census 2007). The development of land in such a densely populated region has sometimes resulted in the creation of conflicting land uses that may pose threats to natural ecosystems and human communities. The Baldwin Hills is an area that demonstrates the challenges posed by these conflicts – generated by the arrangement of residential areas adjacent to oil and gas production, highways, businesses, parkland and natural open space.
The Baldwin Hills community and neighboring areas have experienced symptoms from these conflicting land use patterns, including complaints about excessive noise, dust, nuisance odors and concern about the possible health effects from air pollution. This project focused more closely on nuisance odors, attempting to identify areas in the Baldwin Hills community that have been most effected by nuisance odors in the past and identifying the speed and direction of micro-wind patterns that influence the spread of nuisance odors in these local areas. Special attention was paid to areas that include a concentration of people that are at a higher risk for health effects from air pollution and the nuisance odors that may be associated with it. These sites are termed “sensitive receptors,” and include schools, hospitals, daycare, and convalescent homes. By identifying both the areas in the community that have been historically affected by nuisance odors and the prevailing wind patterns in those areas, the project’s results will hopefully provide baseline information that can be used by industry and residents to mitigate potential future nuisance odors.
The Baldwin Hills are surrounded by Culver City to the west, Inglewood and Crenshaw to the south, and Los Angeles City to the north and east. Within the Baldwin Hills is one of the last remaining open land spaces in the Los Angeles urban region. This area is dominated by active oil and gas extraction activity and dirt roads, but includes remnant native coastal sage scrub vegetation at the boundaries of activity and on steep slopes. Also within this area are two State Parks: Kenneth Hahn State Recreation Area (SRA), which provides picnic areas, nature walks, and a fishing pond for the community; and Baldwin Hills Scenic Overlook, which is a new park providing educational opportunities about the natural resources of the Baldwin Hills and open space for native vegetation and low-impact recreation. The Baldwin Hills Conservancy is a state entity that seeks to implement a long-term planning goal of connecting and expanding the two existing State Parks into a larger regional park by acquiring and managing the open space currently used for oil and gas extraction. If completed, the expanded regional park will serve the recreational needs of the surrounding urban communities, provide outdoor educational opportunities and preserve open space for native habitat.
Most of the Baldwin Hills are currently dominated by active oil and gas production operations, which are located on privately owned land, and have become the most noticeable and
L
_____________________________________________________________________________
4
recognizable visual element in the landscape. Consequently, much of the community concern regarding nuisance odors is directed at the oil and gas production equipment and operations; however, it is prudent to learn about other potential sources of nuisance odors in the area to gain a greater understanding of the impacts from other conflicting land uses.
The Inglewood oil fields that are underneath the Baldwin Hills have been in production since the early 1920s and were discovered by Standard Oil (LACDRP 2008). Plains and Exploration Co. (PXP) is the company currently extracting oil and gas in the Baldwin Hills. The primary structures within the oil fields include drilling rigs, settling and storage tanks with pressure relief valves, an assortment of pipelines, and drilling effluent “ponds.” Industrial development in the Baldwin Hills has a storied past that includes significant impacts to the surrounding communities. In 1963, an environmental incident occurred when the Baldwin Hills reservoir broke and flooded the communities below. On the morning of December 14, the reservoir walls slowly cracked and eventually breached as the weight and pressure of the water compromised the crumbling structure. The suspected cause was the lack of oil field land subsidence monitoring. Subsidence can occur when the oil-water-gas mix is removed from the underground reservoir formation by extraction wells at rate substantially greater than new liquids and gases from the surrounding matrix can replace the extracted material. The underground infrastructure surrounding the void can collapse causing buckling of the soil, resulting in a bowl-like indention (Chilingar and Endres 2004). Five deaths came about from this unfortunate event and plans for additional housing development were abandoned, as proposed plots were in areas sensitive to geologic fault activity and continued land subsidence. The property was eventually sold to the State and was developed into what is currently known as the Kenneth Hahn SRA (Chilingar and Endres 2004). Communities surrounding the oil field in the Baldwin Hills have recently submitted complaints to the local South Coast Air Quality Management District (AQMD) identifying nuisance odors that they suspect were coming from the oil field operations. The most significant incidents that were verified by the AQMD occurred during February 2006 and February/March 2008, from which PXP was cited for public nuisance violations related to nuisance odors. The AQMD claimed that PXP failed to follow good operating procedures, such as closing ventilation lids, properly pumping raw water sewage to the vapor recovery tanks, and relieving pressure valves of tanks that expel high concentrations of gases. During the 2008 incident, at approximately two a.m. and during the proceeding pre-dawn hours several complaints were made about nuisance odors that were reported to have a variety of smells from a chemical-like odor to petroleum oil-type odors. All surrounding activity that correlated during the time of the complaints was investigated and the AQMD found that PXP violated air quality regulations and was cited accordingly with a notice of violation (SCAQMD 2008).
In consideration of the recent episodes that resulted in notices of violation being issued to PXP by the AQMD, combined with concern about potential environmental and health impacts, PXP’s recent plans to expand oil and gas production brought great concern to members of the community. In October 2008, an Environmental Impact Report (EIR) was generated in response to the proposal and in concert with the findings of the EIR, the Los Angeles County Department of Regional Planning, in cooperation with PXP, developed a Community Standards District (CSD) to mandate additional monitoring and notification requirements, in addition to existing environmental regulations. The CSD is a designated boundary outlining the jurisdiction over the oil fields and any future expansion of wells, with some communities contained in this CSD boundary. As noted in the EIR, the CSD’s purpose is to “…reduce environmental impacts of
_____________________________________________________________________________
5
future development at the Inglewood oil fields through the establishment of permanent development standards, operating requirements and procedures” (LACDRP 2008). The EIR describes the potential impact of emission release scenarios on air quality, heightened health risks, and the associated environmental justice issues given that the communities surrounding the Baldwin Hills have a high representation of minority populations, as shown in Table 1 and Figures 1-2.
The 2008 EIR includes models of the potential spatial dispersion of odor dispersal scenarios, including odors from tank hatch pressure relief valves and from drilling mud (Figures 3 and 4). Figures 3 and 4 display odor dispersal scenarios that are based on two important assumptions: first, that there are releases from all related equipment in the production zone; and second, that the dispersal pattern of these odors is well represented by the results of dispersion modeling based on general regional wind patterns of the Los Angeles Basin. These odor dispersal scenarios are helpful aids for broad land management planning; however, they are less useful in identifying specific areas of the community that have been most impacted by nuisance odors in the past (and therefore, perhaps more likely to experience nuisance odors in the future), and the modeled regional wind patterns tend to be less accurate in predicting patterns of odor dispersion compared with directly measured local wind patterns, which may be affected by the topographic relief of the hills in unpredictable ways.
There are other potential sources for nuisance odor episodes experienced by the community than the oil and gas production that dominates the vast majority of open space in the Baldwin Hills. For example, odors from sewer pipelines have significantly affected nearby neighborhoods. The Los Angeles County’s “LA Sewers Future Projects” webpage (www.laswers.org) shows their current and proposed projects for rehabilitating the 100-year old sewer system. At the corner of La Cienega and Jefferson Blvd, an Air Treatment Facility is in the process of being completed, which has been designed to reduce the odors escaping from the sewers. The Facility will consist of biotrickling filters that will initially use bacteria to feed on the odors passing through and then use a second carbon filter to further eliminate the foul smells. In addition to sewers, local businesses, vehicular exhaust and natural emissions could be sources of nuisance odors in the community.
It can sometimes be difficult to distinguish the source of odors because the perception of odors and sensitivity to odors is highly variable from person to person. In addition, the general public often lacks the experience necessary to differentiate types of odors. Therefore, while door-to-door surveys will be essential in evaluating the relative geographic awareness and/or perception of nuisance odors by neighborhood, the characterization of local wind patterns is a critical tool in determining the likely upwind source of nuisance odors that have been experienced by stakeholders in the past.
By identifying the areas in the Baldwin Hills community that have been most affected by nuisance odors and characterizing the local wind patterns in those areas, this project (1) characterizes the geographic extent of populations that are impacted by nuisance odors, (2) provides baseline information for efforts to mitigate potential future nuisance odors, and (3) identifies areas that may benefit from long term air quality monitoring. The influence of micro-wind patterns on odor, the relationship between the perception of nuisance odors and potential health threats from these odors, and possible environmental justice issues are discussed in the following literature review.
_____________________________________________________________________________
6
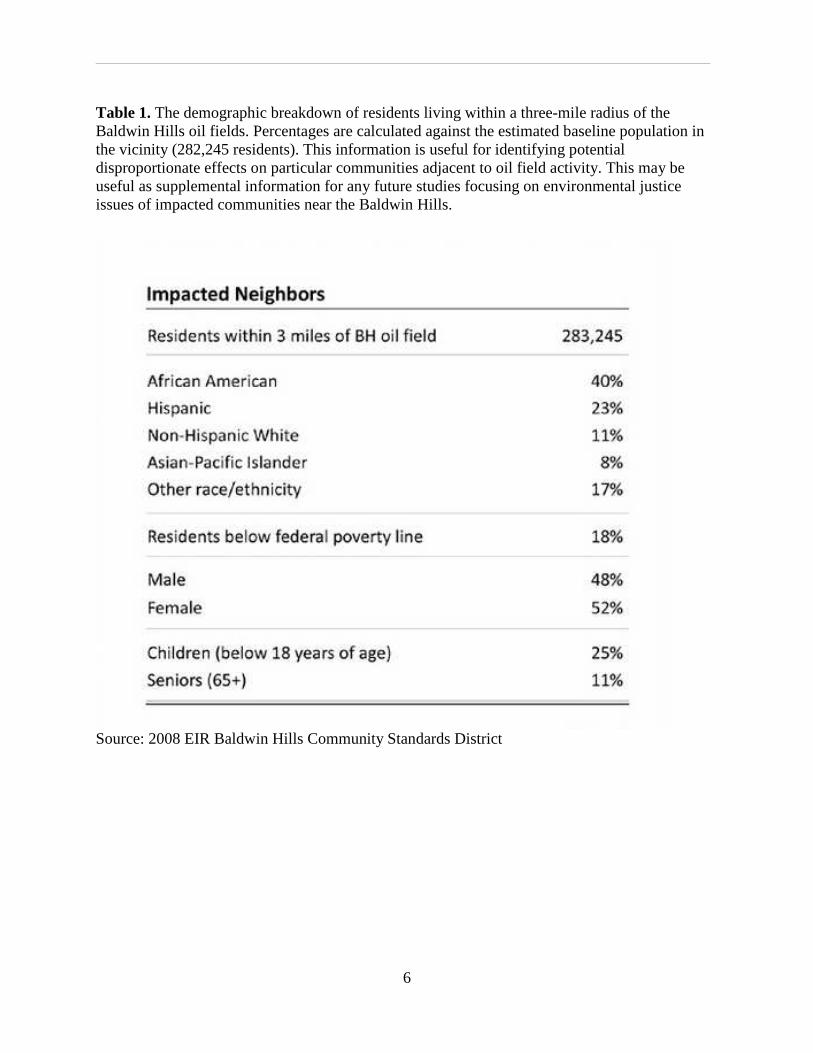
Table 1. The demographic breakdown of residents living within a three-mile radius of the Baldwin Hills oil fields. Percentages are calculated against the estimated baseline population in the vicinity (282,245 residents). This information is useful for identifying potential disproportionate effects on particular communities adjacent to oil field activity. This may be useful as supplemental information for any future studies focusing on environmental justice issues of impacted communities near the Baldwin Hills.
Source: 2008 EIR Baldwin Hills Community Standards District
_____________________________________________________________________________
7
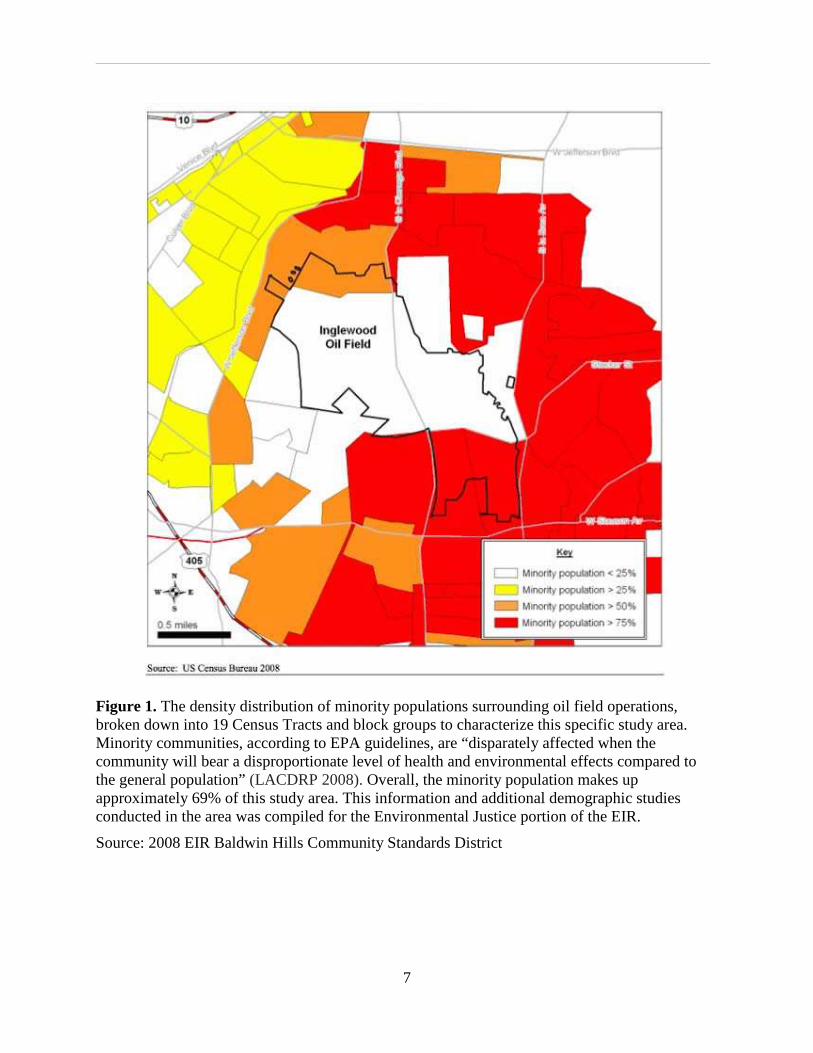
Figure 1. The density distribution of minority populations surrounding oil field operations, broken down into 19 Census Tracts and block groups to characterize this specific study area. Minority communities, according to EPA guidelines, are “disparately affected when the community will bear a disproportionate level of health and environmental effects compared to the general population” (LACDRP 2008). Overall, the minority population makes up approximately 69% of this study area. This information and additional demographic studies conducted in the area was compiled for the Environmental Justice portion of the EIR.
Source: 2008 EIR Baldwin Hills Community Standards District
_____________________________________________________________________________
8
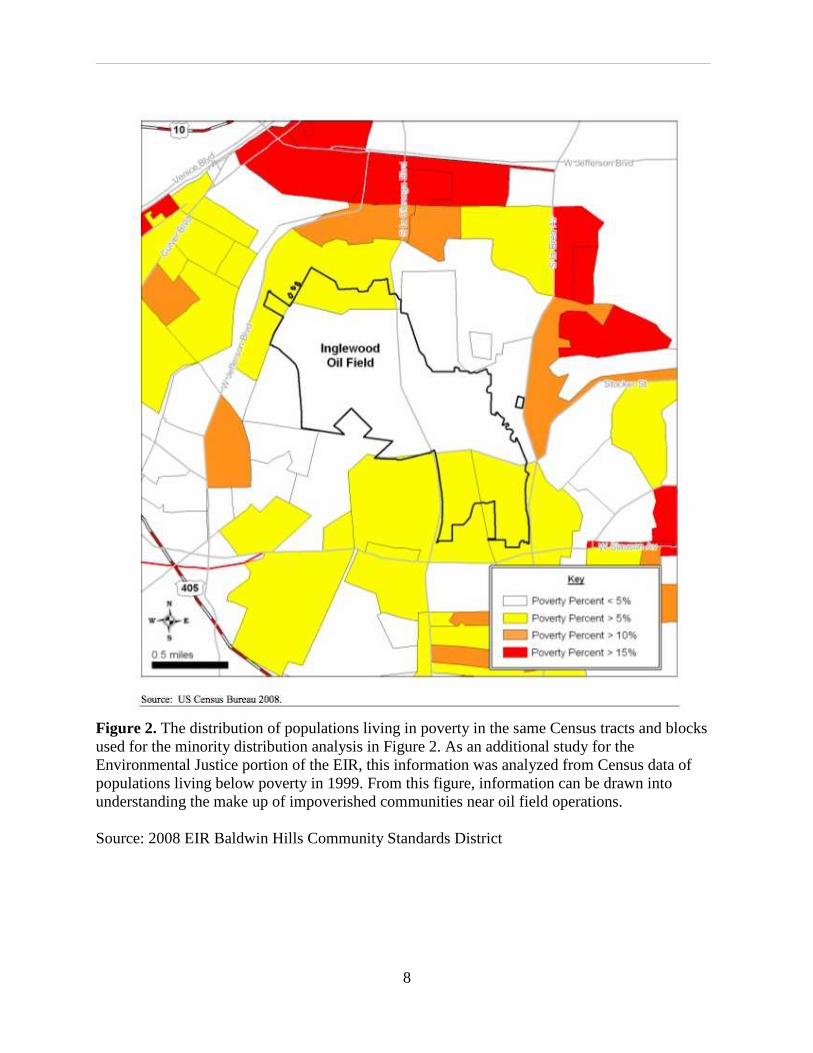
Figure 2. The distribution of populations living in poverty in the same Census tracts and blocks used for the minority distribution analysis in Figure 2. As an additional study for the Environmental Justice portion of the EIR, this information was analyzed from Census data of populations living below poverty in 1999. From this figure, information can be drawn into understanding the make up of impoverished communities near oil field operations. Source: 2008 EIR Baldwin Hills Community Standards District
_____________________________________________________________________________
9
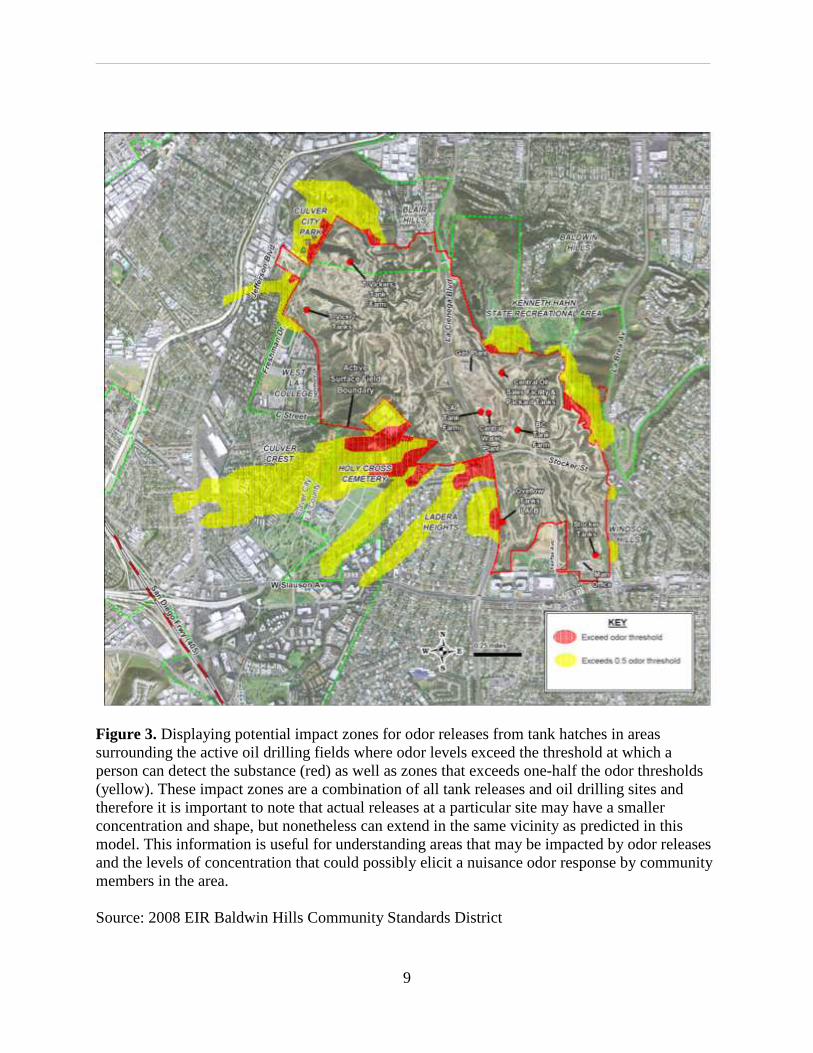
Figure 3. Displaying potential impact zones for odor releases from tank hatches in areas surrounding the active oil drilling fields where odor levels exceed the threshold at which a person can detect the substance (red) as well as zones that exceeds one-half the odor thresholds (yellow). These impact zones are a combination of all tank releases and oil drilling sites and therefore it is important to note that actual releases at a particular site may have a smaller concentration and shape, but nonetheless can extend in the same vicinity as predicted in this model. This information is useful for understanding areas that may be impacted by odor releases and the levels of concentration that could possibly elicit a nuisance odor response by community members in the area. Source: 2008 EIR Baldwin Hills Community Standards District
_____________________________________________________________________________
10
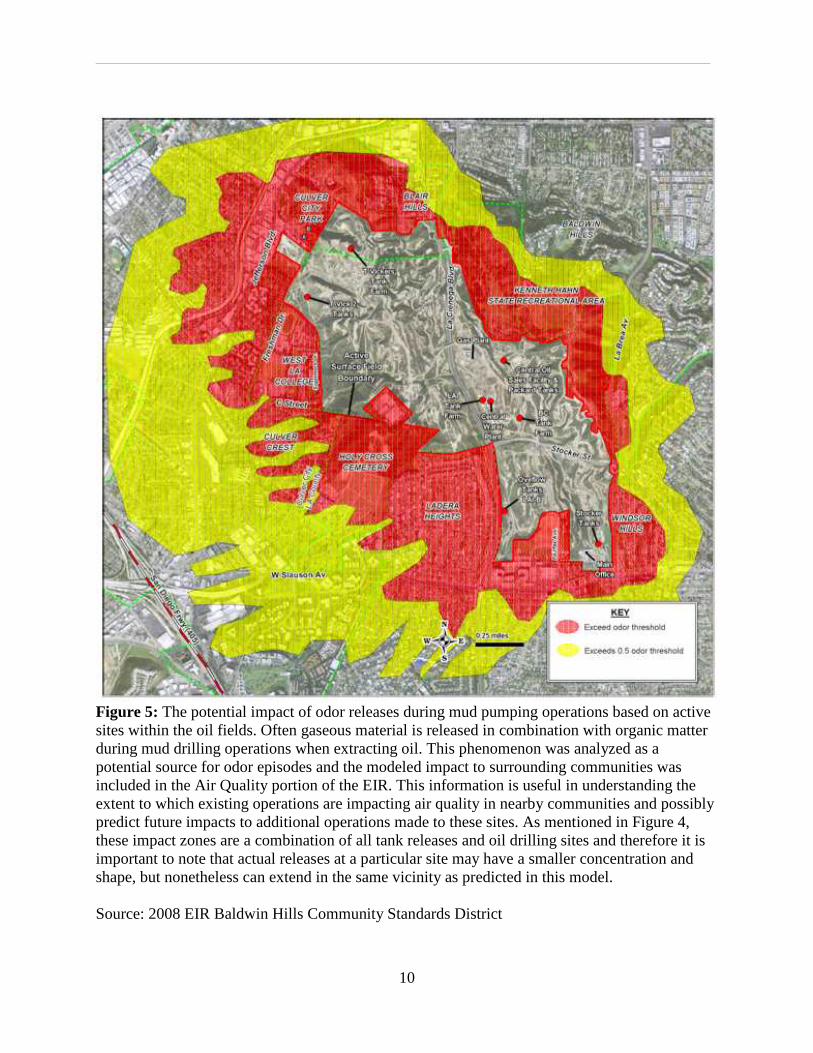
Figure 5: The potential impact of odor releases during mud pumping operations based on active sites within the oil fields. Often gaseous material is released in combination with organic matter during mud drilling operations when extracting oil. This phenomenon was analyzed as a potential source for odor episodes and the modeled impact to surrounding communities was included in the Air Quality portion of the EIR. This information is useful in understanding the extent to which existing operations are impacting air quality in nearby communities and possibly predict future impacts to additional operations made to these sites. As mentioned in Figure 4, these impact zones are a combination of all tank releases and oil drilling sites and therefore it is important to note that actual releases at a particular site may have a smaller concentration and shape, but nonetheless can extend in the same vicinity as predicted in this model. Source: 2008 EIR Baldwin Hills Community Standards District
_____________________________________________________________________________
11
Literature Review Wind Patterns and Dispersion
N important component in investigating nuisance odors is measuring and analyzing wind data of the area under investigation. Examining how odors disperse throughout the test region gives important insight into which areas are likely to be affected, and when. This
is a review of the variables and assumptions that are relevant to the measurement of local winds. On a broad scale, using meteorological tools to detect, predict and measure pollutants and
their movement is a well established practice. A typical wind dispersal experiment involves the release of tracers into the atmosphere, and correlating the movement of the tracers with the wind patterns detected by weather stations. This method demonstrates how multiple wind patterns affect the same particulates and their transport. And, this method of research can encompass large regions into one study, including entire counties (Drivas and Shair 1994). Though our research will not involve measuring wind patterns and dispersal over large areas, nor will there be use of tracers to help measure wind patterns, this methodological approach helps identify the limits of our method and the assumptions that will have to be made in interpreting the results. For example, our study will have access to only one weather station at a time. When taking wind measurements, assumptions will have to be made that odor dispersal is being significantly affected by only the wind measured. This assumption may not be valid, and it will be important to compare meteorological data from major governmental agencies to the data collected to see if our micro-wind patterns correlate with the net wind flow in the region.
The effect of a coastal environment on wind data and pollution dispersal is related to the temperature and pressure gradients between the ocean and land. The temperature of columns of air over land vary more than over water, and this affects the barometry of the region by creating pressure gradient forces from colder, high pressure air masses to warmer, low pressure air masses. An important part of measuring wind patterns is understanding the oscillating land- and sea-breeze phenomena (Lu and Turco 1994). Once again, the limits of the experiment become evident when compared to studies with a high number of resources at their disposal. However, the inclusion of the land- and sea-breeze phenomena into the study seems critical. It is important for understanding the net wind flow at certain times of day so it can then be compared to what is measured at a small scale. In order to account for the oscillating land- and sea-breezes, measurements must be divided into dawn and dusk, rather than try to compute a daily average.
Topography and elevation have a clear effect on wind patterns. Wind becomes stronger at the crests of hills and mountains while becoming weaker as elevation decreases. Narrow valleys can also experience high wind velocities. In addition to changing wind speeds, topography also often has the effect of creating eddies, which are small (relative to spatial scale of the geomorphology of mountains) circular wind formations that are created by barriers in the wind path. Predicting and modeling eddies is nearly impossible with current models. Topography may have the effect of streamlining wind flow as well, or “polarizing” wind flow into a more uniform direction (Wood 1999). Seeing as research is being conducted in the Baldwin Hills, learning the effect of topography on wind patterns seemed vital. While the land- and sea-breeze phenomena should help determine when to take wind measurements, topography’s effect on wind patterns should help determine where. Though the test areas will be too small to take topography into account in
A
_____________________________________________________________________________
12
net wind movement, one should consider the topography at the test location to know how it could affect the readings. Stronger wind patterns have an increased dispersal effect, as well as a tendency to transport pollutants to higher atmospheric elevations. Likewise, very mild winds may have almost no transport effect, and pollutants may settle very close to the source and adjacent receptors.
Environmental Justice
NVIRONMENTAL justice is an important topic because it impacts the community. According to the Environmental Protection Agency (EPA) “environmental justice is the fair treatment and meaningful involvement of all people regardless of race, color, national
origin, or income with respect to the development, implementation, and enforcement of environmental laws, regulations, and polices” (Environmental Justice 2009). Environmental justice aims at allowing all groups of people to live in an environment that is safe and does not negatively impact their health. Like many urban areas, Los Angeles faces many environmental justice issues, where various groups of people are affected by their surroundings in different ways. Environmental justice is an issue that should be addressed in order to distribute the burden of environmental impacts equitably and to protect the health of all communities. Environmental justice is a fairly new topic that has undergone a lot of changes in regards to its meaning. Environmental justice first had a significant impact in 1979 and 1982 when African American communities fought against the treatment and management of landfills (Lee 2002). The communities that are affected by environmental justice issues face the challenge of typically not having an outlet to address their concerns. Another challenge that these communities face is a lack of government officials with knowledge on environmental justice issues (Lee 2002). As environmental justice issues become more prevalent, the issue will become more important.
There are three strategies that help encourage communities to take action in regards to environmental justice issues. One is to have buildings or community centers that allow communities to gather and voice their concerns. The second is to communicate their concerns on a national level. The third is to establish a model to present the communities’ goals (Lee 2002). These strategies will help environmental justice problems become established and addressed.
When communities come together to support a common cause, they have a huge impact on the environment where they live in and quality of their lives, which can be demonstrated by case studies of past environmental justices issues. Texarkana, Texas has three superfund sites in the area and a landfill near by. There are 78 homes in this community and some of the homes were sitting on top of the superfund site (Capek 1993). The superfund site was originally owned by Koppers, a company that manufactured treated wood, which led to a release of toxic chemicals in the area. In 1988, the EPA called for the soil of the superfund site to be cleaned and filtered. The EPA stated that is was not necessary for residents to move during this cleaning process. Third party organizations pointed out the toxicity of this site, including health hazardous, but the EPA denied that the toxicity levels were harmful to the community. Outside organizations helped the community understand the significance of the toxicity levels, which led to a community protest that successfully forced the government to relocate the community in 1992 (Capek 1993). This case shows that community support is essential in environmental justice movements. Without community support and persistence to be relocated, the government would not have taken the initiative to confront this environmental justice concern.
E
_____________________________________________________________________________
13
Because brownfield sites are often associated with environmental justice concerns, it is important to note their locations and surrounding demographics. Brownfield sites also provide opportunities for communities to remediate contaminated land and reclaim it for a civic or commercial purpose that benefits the community. Brownfield sites, according to the EPA, are “abandoned, idled or underused industrial and commercial properties where expansion or redevelopment is complicated by real or perceived contamination” (Cline and Garcia 2000). To help address brownfield sites, the Real Estate Recycling Program (RERP) was developed by the Gateway Cities Partnerships (GCP) in the Greater Los Angeles area to demonstrate that brownfield sites could be cleaned up. The Gateway Cities in Los Angeles County have lower economic achievements than the rest of southern California and also face numerous contamination sites (Cline and Garcia 2000). Data on these Gateway Cities was compared to the efforts to create the Baldwin Hills Park on land that is currently used for oil and gas production. Baldwin Hills has the highest amount of underdeveloped rural land in the Los Angeles area (Cline and Garcia 2000). The site faces high contamination levels due to oil drilling for over 75 years. The proposed Baldwin Hills Park is significant at both a local and national level because it is setting precedence for the reclamation of brownfield sites. The Baldwin Hills community wants to develop the brownfield site to make the land suitable for use. The brownfield site makes the Baldwin Hills community an environmental justice issue because the community is predominately African American and Hispanic, with roughly 75 percent of the population African American (Baldwin Hills 2005). Studies in southern California have found that communities of color and of lower income face more environmental justice issues, which are associated with increased health concerns. However, it is difficult to connect environmental justice issues to negative health affects. Research is currently being conducted on what the “potential health risks” are for areas exposed to higher toxicity levels (Morello-Frosch et al. 2002). Research was done in southern California because of its poor air quality, the diversity of people, the industries affiliated with the area, the increase in people’s concerns about health affects, and the fact that southern California data can be applied to other areas. This study took into account the location of industries, and where toxins were being treated, stored, and disposed. It was found that there are health affects in areas with diverse communities (Morello-Frosch et al. 2002). However, there is little information of where these pollutants originate from or why they continue to exist in these communities. In these areas, it was again found that the communities tend to not have access to as many resources and are not as economically stable as other communities (Morello-Frosch et al. 2002). Community involvement is important to the success of social equity projects that better the lives of the community members. Environmental justice is a concern because sometimes disadvantaged communities have a higher risk of being exposed to environmental hazards and therefore may have a higher risk of adverse health affects. A key to fighting social inequality is to have a solid community support base in order to identify the source of environmental hazards and work with other stakeholders to mitigate its impact. Without a strong sense of community and empowerment, it is difficult to fight for equality. With populations that include significant numbers of people that are minorities or in poverty, the Baldwin Hills community faces potential social inequalities from the adverse impact of nuisance odors and other environmental hazards that may disproportionally impact the community.
_____________________________________________________________________________
14
Public Health and Odor Perception
HE perception of odors and their related health effects are of particular concern to this study. Since this study uses survey results of individuals in the community to indicate where odors have been most prevalent in the past, it is necessary to understand that odor
detection is variable, and that potential sources for biases may exist in the responses of individuals describing odors. In particular, inherent biases based on perceived health risks from odors formed by exposure to the media (Shustermann et al. 1991), or differences in the sensitivity to odors (Dalton 1996), can largely affect survey results and skew study data. This literature review seeks to understand the current data available surrounding inherent biases among odor perception as well as the perceived and actual health effects from odors.
In order to address odor perception, it is first necessary to understand point source air emissions. Point source air emissions, such as sewers and oil production, are potential contributors of nuisance odors within the Baldwin Hills community. A nuisance odor is defined as an odor that may be experienced by an individual or a group, which causes damage, annoyance or inconvenience (Mahin et al. 2000). The effect of the nuisance odors are characterized by the frequency of the odor causing events, the intensity of the odors, and the duration of each odor incident. Often residential communities near industrial sites, wastewater treatment plants, oil plants, landfills, sewage systems, and commercial activities are the areas most affected by nuisance odors. It must be understood that not all odors may contribute to physiological symptoms, as is sometimes displayed by media outlets.
Along these lines, current literature surrounding perceived health threats indicates that sensory perception to odor exposures are influenced by the media, versus those who are sensitized to environmental odors growing up and take no offense (Dalton 1996). Such factors will largely influence this study, as those who are more exposed to various media dictate certain mentalities surrounding emission sources, will potentially be more adept and responsive to surveys. Those exposed to various odors throughout their lifetime may initially perceive odors as nuisances (Deane and Sanders 1978); however, continual exposure may sensitize residents to emissions and may note that no problem exists.
In order to help categorize and determine nuisance odors, researchers use the Citizen Complaint Pyramid model. The pyramid consists of four levels characterized by “Odor Character” at the base, followed by “Odor Intensity”, “Episode Duration” and “Episode Frequency” at the top. “Odor Character” seeks to determine what the odor smells like, while, “Odor Intensity,” refers to the overall strength of the odor. “Episode Duration” is the elapsed time of the occurrence of the odor, from when the odor is transported by the wind to the individuals who perceive the odor. “Episode Frequency” is how often an individual experiences the odor (Mahin et al. 2000). The effects of these levels are combined to display what citizens categorize as nuisance odors.
However, it must be understood that misconceptions may occur, such as the gas concentrations at which humans perceive various odors, or odor lifetimes in the atmosphere may be longer than was originally diagnosed (Ozonoff et al. 1987). These misconceptions could encourage companies to release emission at regulated levels with the belief that surrounding neighborhoods will be unaffected, or that continued releases will not be directly influenced by prevailing wind patterns because of their documented scientific persistence in the atmosphere. A reassessment of common emissions standards is needed in order to provide populations greater warning and protection of emission releases.
T

_____________________________________________________________________________
15
Even with such misconceptions, it has been demonstrated in various studies (Elliott et al. 1999, Deane and Sanders 1978), that the use of surveys as an analytical tool assessing perceptions of health outcomes to odors has greatly benefited surveyed communities. Results presented to industries have kept issues of air quality on local political agendas, and increased the communication between businesses and local communities. This aspect is particularly beneficial as issues of environmental justice can be addressed, even if variability exists between survey responses.
Variability in the perception of odors can make it difficult to assess the prevalence of nuisance odors and potential health effects. However, even when there is some uncertainty in the magnitude of the impact of nuisance odors, the use of odor survey results can promote communication and discussion between potential sources, such as local businesses and municipal services, and impacted stakeholders in the community, such as residents. This aspect is beneficial for businesses to maintain a constructive relationship with its community, and especially for stakeholders, who coexist with sources of potential nuisance odors and other environmental hazards.
_____________________________________________________________________________
16
Methodology
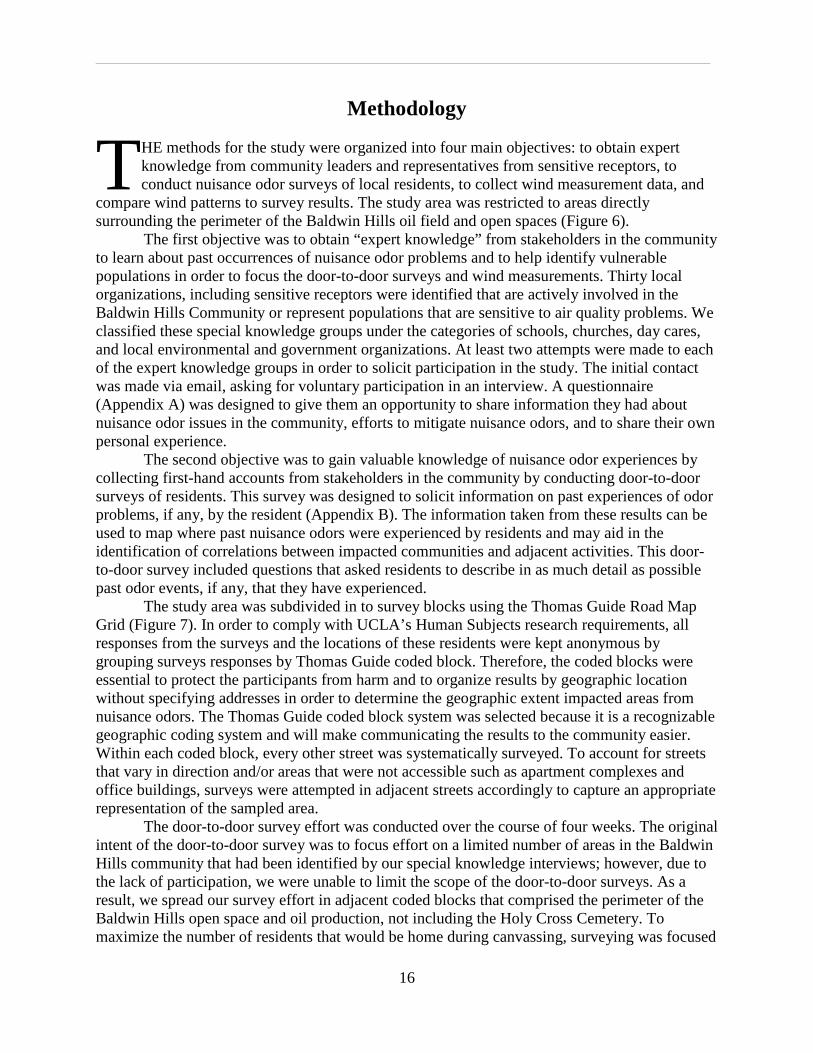
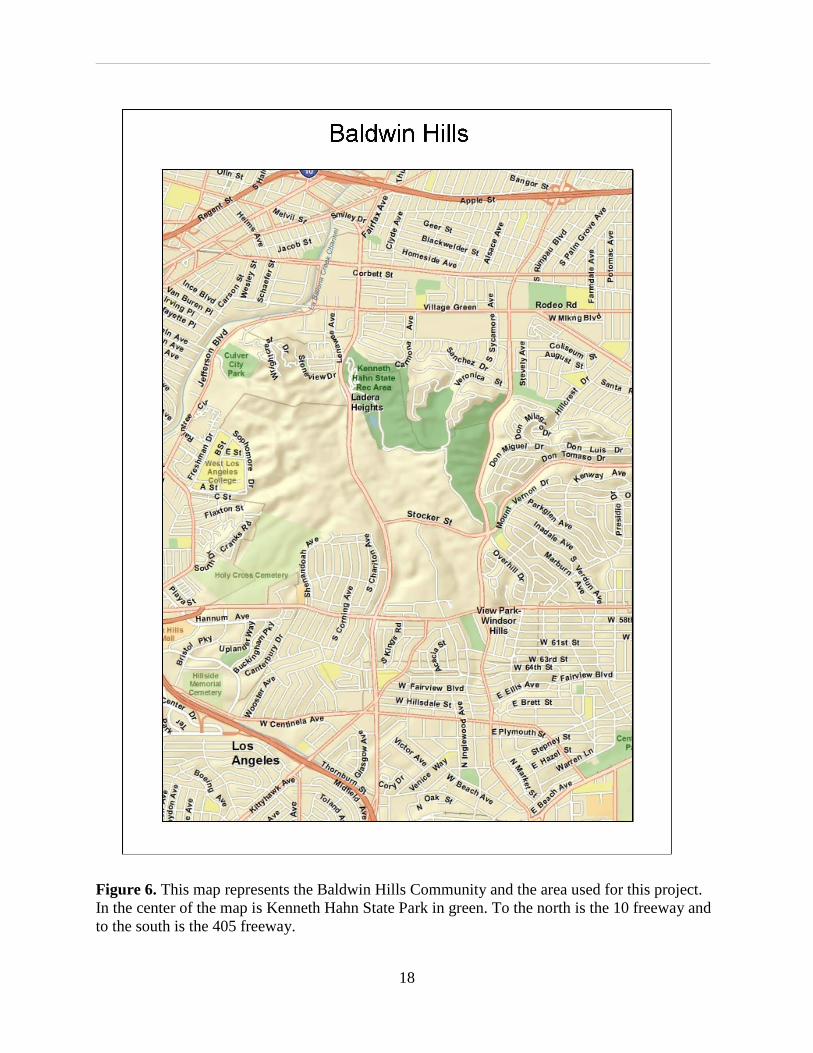
HE methods for the study were organized into four main objectives: to obtain expert knowledge from community leaders and representatives from sensitive receptors, to conduct nuisance odor surveys of local residents, to collect wind measurement data, and
compare wind patterns to survey results. The study area was restricted to areas directly surrounding the perimeter of the Baldwin Hills oil field and open spaces (Figure 6).
The first objective was to obtain “expert knowledge” from stakeholders in the community to learn about past occurrences of nuisance odor problems and to help identify vulnerable populations in order to focus the door-to-door surveys and wind measurements. Thirty local organizations, including sensitive receptors were identified that are actively involved in the Baldwin Hills Community or represent populations that are sensitive to air quality problems. We classified these special knowledge groups under the categories of schools, churches, day cares, and local environmental and government organizations. At least two attempts were made to each of the expert knowledge groups in order to solicit participation in the study. The initial contact was made via email, asking for voluntary participation in an interview. A questionnaire (Appendix A) was designed to give them an opportunity to share information they had about nuisance odor issues in the community, efforts to mitigate nuisance odors, and to share their own personal experience.
The second objective was to gain valuable knowledge of nuisance odor experiences by collecting first-hand accounts from stakeholders in the community by conducting door-to-door surveys of residents. This survey was designed to solicit information on past experiences of odor problems, if any, by the resident (Appendix B). The information taken from these results can be used to map where past nuisance odors were experienced by residents and may aid in the identification of correlations between impacted communities and adjacent activities. This door-to-door survey included questions that asked residents to describe in as much detail as possible past odor events, if any, that they have experienced.
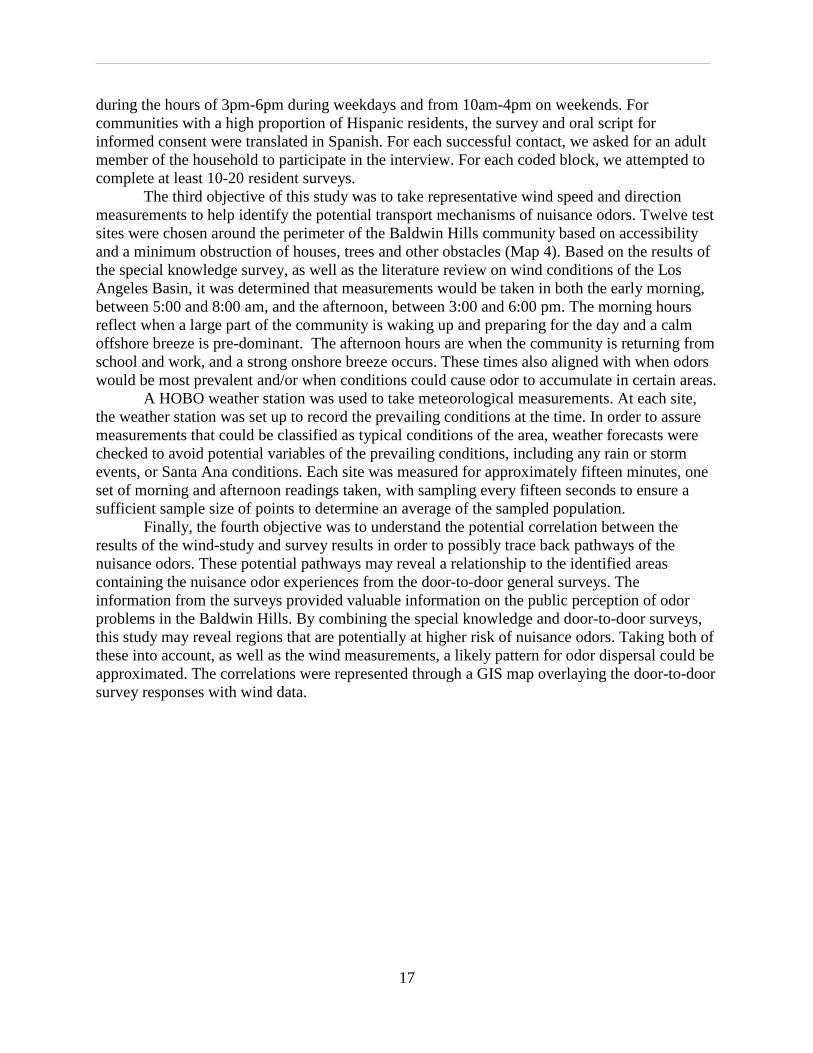
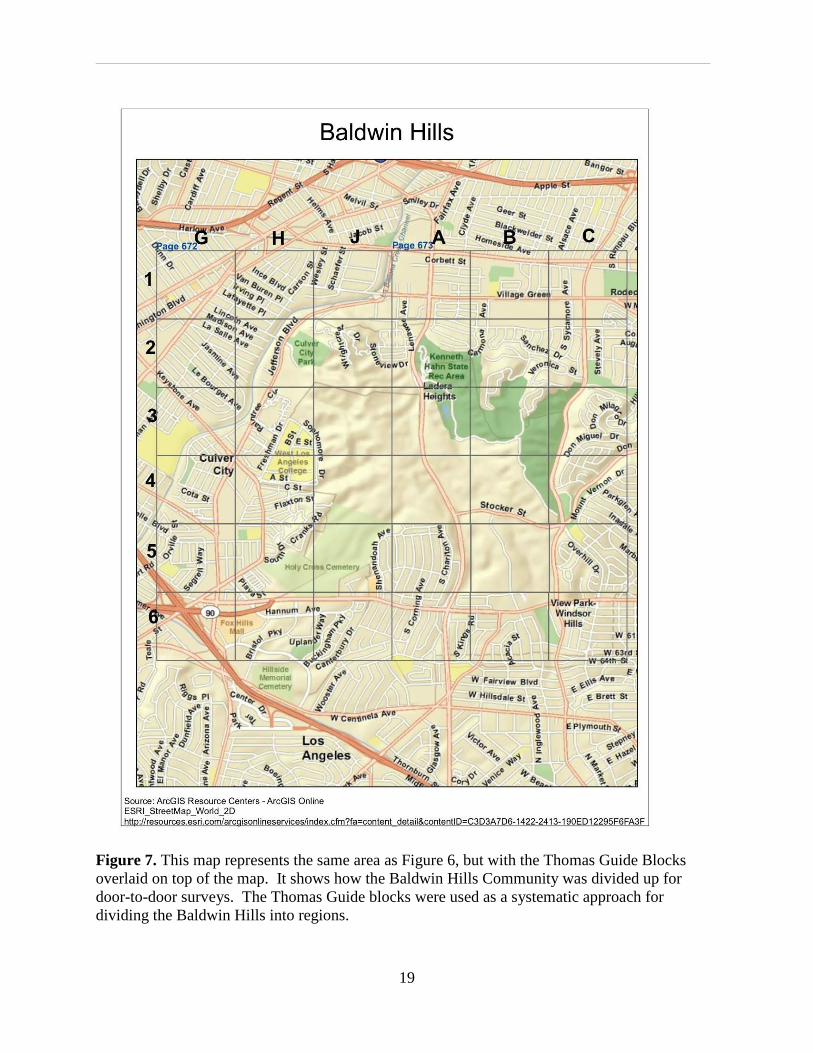
The study area was subdivided in to survey blocks using the Thomas Guide Road Map Grid (Figure 7). In order to comply with UCLA’s Human Subjects research requirements, all responses from the surveys and the locations of these residents were kept anonymous by grouping surveys responses by Thomas Guide coded block. Therefore, the coded blocks were essential to protect the participants from harm and to organize results by geographic location without specifying addresses in order to determine the geographic extent impacted areas from nuisance odors. The Thomas Guide coded block system was selected because it is a recognizable geographic coding system and will make communicating the results to the community easier. Within each coded block, every other street was systematically surveyed. To account for streets that vary in direction and/or areas that were not accessible such as apartment complexes and office buildings, surveys were attempted in adjacent streets accordingly to capture an appropriate representation of the sampled area.
The door-to-door survey effort was conducted over the course of four weeks. The original intent of the door-to-door survey was to focus effort on a limited number of areas in the Baldwin Hills community that had been identified by our special knowledge interviews; however, due to the lack of participation, we were unable to limit the scope of the door-to-door surveys. As a result, we spread our survey effort in adjacent coded blocks that comprised the perimeter of the Baldwin Hills open space and oil production, not including the Holy Cross Cemetery. To maximize the number of residents that would be home during canvassing, surveying was focused
T
_____________________________________________________________________________
17
during the hours of 3pm-6pm during weekdays and from 10am-4pm on weekends. For communities with a high proportion of Hispanic residents, the survey and oral script for informed consent were translated in Spanish. For each successful contact, we asked for an adult member of the household to participate in the interview. For each coded block, we attempted to complete at least 10-20 resident surveys.
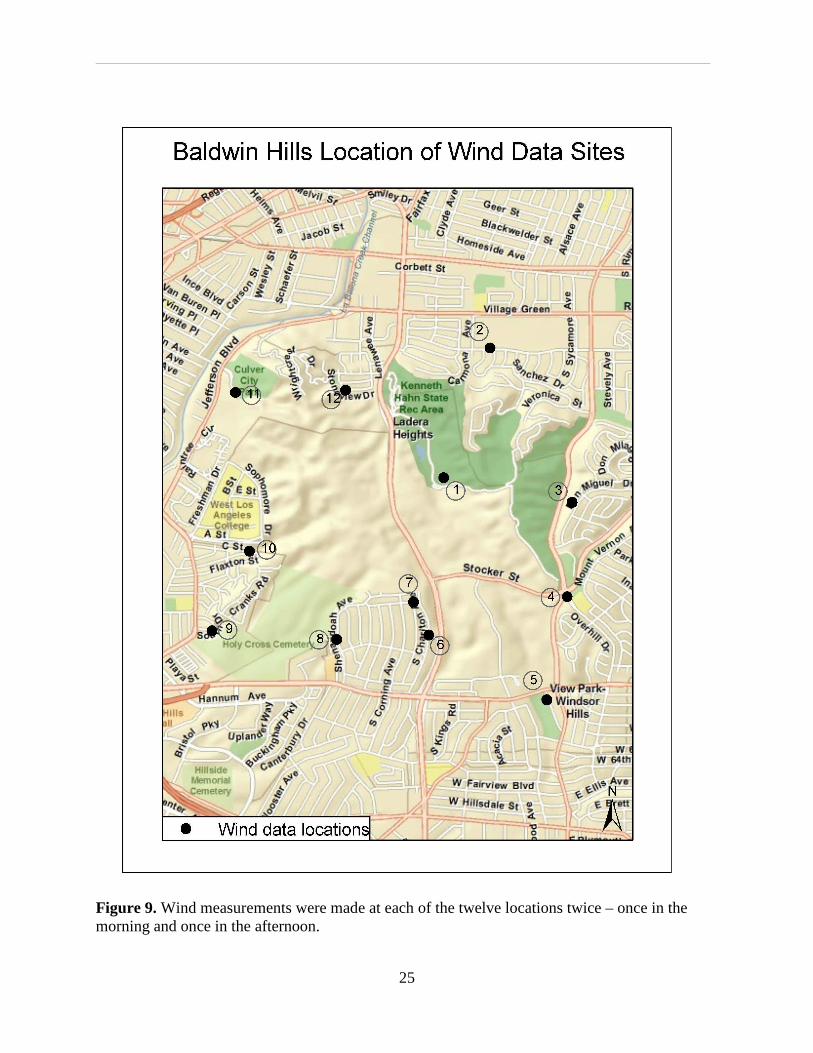
The third objective of this study was to take representative wind speed and direction measurements to help identify the potential transport mechanisms of nuisance odors. Twelve test sites were chosen around the perimeter of the Baldwin Hills community based on accessibility and a minimum obstruction of houses, trees and other obstacles (Map 4). Based on the results of the special knowledge survey, as well as the literature review on wind conditions of the Los Angeles Basin, it was determined that measurements would be taken in both the early morning, between 5:00 and 8:00 am, and the afternoon, between 3:00 and 6:00 pm. The morning hours reflect when a large part of the community is waking up and preparing for the day and a calm offshore breeze is pre-dominant. The afternoon hours are when the community is returning from school and work, and a strong onshore breeze occurs. These times also aligned with when odors would be most prevalent and/or when conditions could cause odor to accumulate in certain areas.
A HOBO weather station was used to take meteorological measurements. At each site, the weather station was set up to record the prevailing conditions at the time. In order to assure measurements that could be classified as typical conditions of the area, weather forecasts were checked to avoid potential variables of the prevailing conditions, including any rain or storm events, or Santa Ana conditions. Each site was measured for approximately fifteen minutes, one set of morning and afternoon readings taken, with sampling every fifteen seconds to ensure a sufficient sample size of points to determine an average of the sampled population.
Finally, the fourth objective was to understand the potential correlation between the results of the wind-study and survey results in order to possibly trace back pathways of the nuisance odors. These potential pathways may reveal a relationship to the identified areas containing the nuisance odor experiences from the door-to-door general surveys. The information from the surveys provided valuable information on the public perception of odor problems in the Baldwin Hills. By combining the special knowledge and door-to-door surveys, this study may reveal regions that are potentially at higher risk of nuisance odors. Taking both of these into account, as well as the wind measurements, a likely pattern for odor dispersal could be approximated. The correlations were represented through a GIS map overlaying the door-to-door survey responses with wind data.
_____________________________________________________________________________
18
Figure 6. This map represents the Baldwin Hills Community and the area used for this project. In the center of the map is Kenneth Hahn State Park in green. To the north is the 10 freeway and to the south is the 405 freeway.
_____________________________________________________________________________
19
Figure 7. This map represents the same area as Figure 6, but with the Thomas Guide Blocks overlaid on top of the map. It shows how the Baldwin Hills Community was divided up for door-to-door surveys. The Thomas Guide blocks were used as a systematic approach for dividing the Baldwin Hills into regions.
_____________________________________________________________________________
20
Results
Special Knowledge Survey
EFORE conducting the door-to-door surveys of stakeholders around the perimeter of the Baldwin Hills oil field and open spaces, attempts were made to first contact community stakeholders and local organizations that may have special knowledge about nuisance
odors experienced in the area. The results from these special knowledge surveys would ideally provide guidance on identifying specific sensitive receptors and/or any specific communities to conduct our door-to-door surveys and wind testing. We attempted to contact 30 special knowledge groups and of the four who responded back, only one organization agreed to do an interview and complete the survey. Attempts were also made to interview representatives of PXP, but we received no response.
The two members, under the category of environmental organization, met on April 15, 2009 for the interview. The following results summarize key points and comments made by these special knowledge contacts. During this meeting, the organization spoke about their efforts to implement an odor occurrence log that community members could fill out online. They also shared that the movement of some odors in the Baldwin Hills is influenced by the local topography. They explained that during early morning hours, when wind is negligible, odors may sink into the lower valleys of the Baldwin Hills due to cold air drainage as a result of diurnal micro climate changes. They further proposed that most of the odors that people are experiencing are hydrogen sulfides (H2S) and hydrocarbons (volatile organic compounds). Of these compounds, hydrogen sulfide has the ability to quickly cauterize sensory cells in the nose and as a result, allows quick acclimation to the odor. Further, it was their opinion that these odors are likely to be fugitive odor leaks from the nearby Baldwin Hills oil fields. They believe that these leaks may originate from sources such as pipe connections, de-gassing pools, or during processes where mud and other organic material are being pumped up and extracted.
The contacts from the environmental organization suggested that door-to-door surveys be conducted in residential areas south of the Baldwin Hills oil fields, northwest areas of Culver City, and Ladera Heights, due to their potential for down slope drainage points of air flow, and thus, the pooling of nuisance odors. Also, they recommended that we survey early risers, morning commuters and morning joggers because these people may be experiencing odors due to the accumulation of odors over night due to dormant wind flow and minimal mixing of air masses. Finally, they stated that remediation efforts could be most effective if the oil field pumping processes had monitoring standards similar to those at refineries. This includes quarterly pipe connection checks and computer-controlled monitoring and mechanical systems.
This meeting provided information that helped in the survey planning and implementation. However, there were challenges in contacting other special knowledge groups. Those who declined were unavailable to meet and/or had fears that there would be negative repercussions to their business.
B

_____________________________________________________________________________
21
Door-to-Door Survey
NITIALLY the proposed door-to-door survey method was to survey the residential areas that were suggested by the results from the special knowledge survey but because of the low response rate from these groups, the approach for the door-to-door survey focused on
canvassing the perimeter of the Baldwin Hills. The total number of surveys completed for each coded survey block ranges from 1 to 46
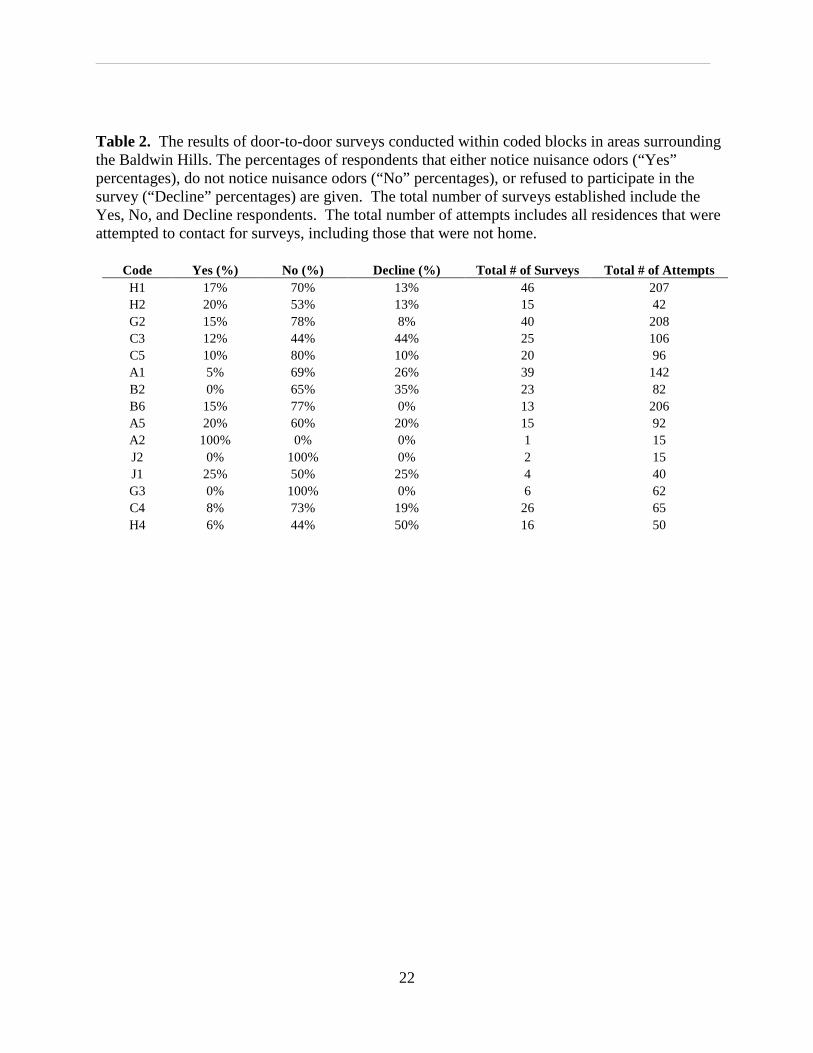
(Table 2). For those blocks with less than ten completed surveys (A2, J2, J1 and G3), the survey response is too low to draw any conclusions about the prevalence of nuisance odors. The low survey completion rate in these blocks is due to difficulty gaining access to apartment buildings and gated communities in these areas, as well as due to densities of non-residential buildings. For example, when we surveyed in Block J1, we attempted to survey this block systematically but there were office buildings and studios, which explains the four completed surveys out of 40 attempts for that area. In Table 1, the total numbers of attempted surveys column varied with each block because not all the blocks have the same number of houses and some blocks have more apartment complexes, studios, and businesses than houses which reflects the total number of surveys we were able to do.
The survey was designed to differentiate between the types of nuisance odors and the time of day nuisance odors were prevalent; however, due in part to the types of responses from survey participants and the low number of completed surveys in some survey blocks, it was not possible to summarize trends in nuisance odors by type of odor or what time of day the odor was experienced. The most representative summary of the survey results was to broadly summarize three categories by survey block: “Yes”, the respondent had experienced nuisance odors in the past; “No,” they had not; or the respondent declined participation.
For those survey blocks with more than ten completed surveys, although most people did not report nuisance odors, the results of the survey demonstrate that there are residents in the Baldwin Hills that are experiencing nuisance odors (Figure 8). A higher proportion (11-20%) of respondents reported nuisance odors in the northwest corner, (blocks H1, H2 and G2), southern border (A5 and B6) and western edge (C3). In the remaining survey blocks responses ranged between 1-10% (A1, H4, C4 and C5) and for survey block B2, out of 23 surveys no one reported nuisance odors.
I
_____________________________________________________________________________
22
Table 2. The results of door-to-door surveys conducted within coded blocks in areas surrounding the Baldwin Hills. The percentages of respondents that either notice nuisance odors (“Yes” percentages), do not notice nuisance odors (“No” percentages), or refused to participate in the survey (“Decline” percentages) are given. The total number of surveys established include the Yes, No, and Decline respondents. The total number of attempts includes all residences that were attempted to contact for surveys, including those that were not home.
Code Yes (%) No (%) Decline (%) Total # of Surveys Total # of Attempts H1 17% 70% 13% 46 207 H2 20% 53% 13% 15 42 G2 15% 78% 8% 40 208 C3 12% 44% 44% 25 106 C5 10% 80% 10% 20 96 A1 5% 69% 26% 39 142 B2 0% 65% 35% 23 82 B6 15% 77% 0% 13 206 A5 20% 60% 20% 15 92 A2 100% 0% 0% 1 15 J2 0% 100% 0% 2 15 J1 25% 50% 25% 4 40 G3 0% 100% 0% 6 62 C4 8% 73% 19% 26 65 H4 6% 44% 50% 16 50

_____________________________________________________________________________
23
Figure 8. This map represents the door-to-door survey results. The blocks are color coded to represent the percentage of individuals that had responded that they had experienced nuisance odors in the past. Areas that were not surveyed do not have a color in the block; and grey blocks had fewer than 10 respondents, which are inadequate to reflect the prevalence of nuisance odors.
_____________________________________________________________________________
24
Wind Patterns
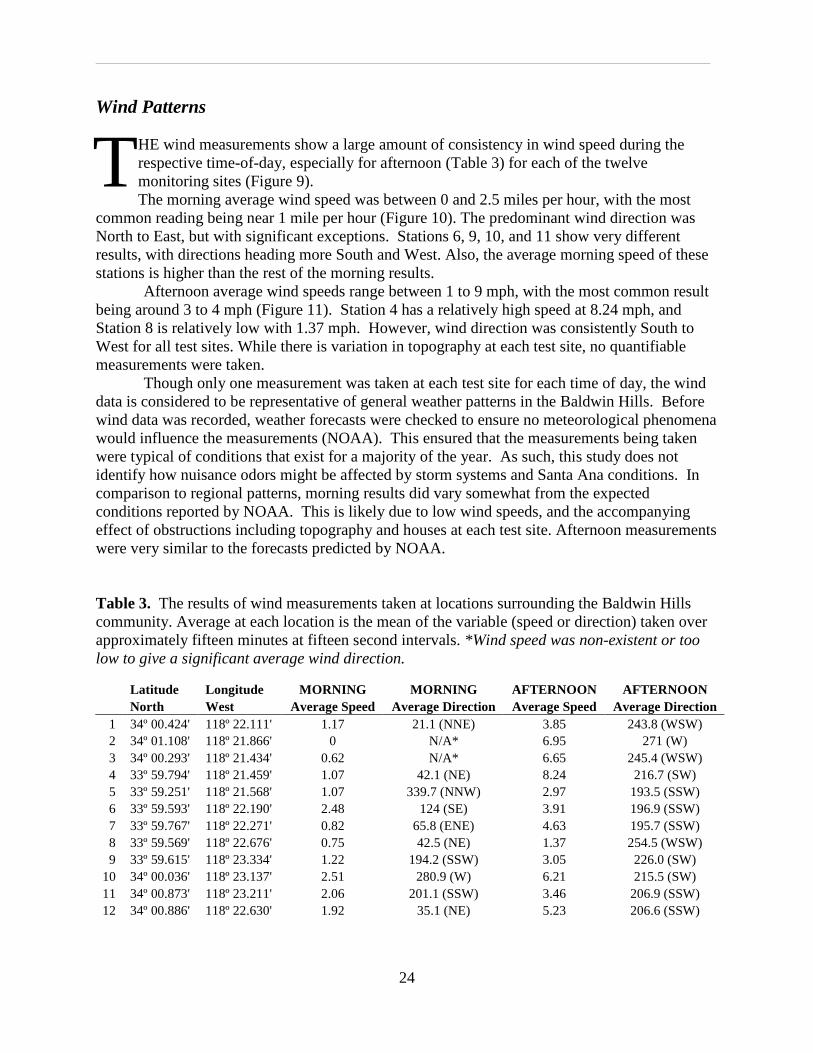
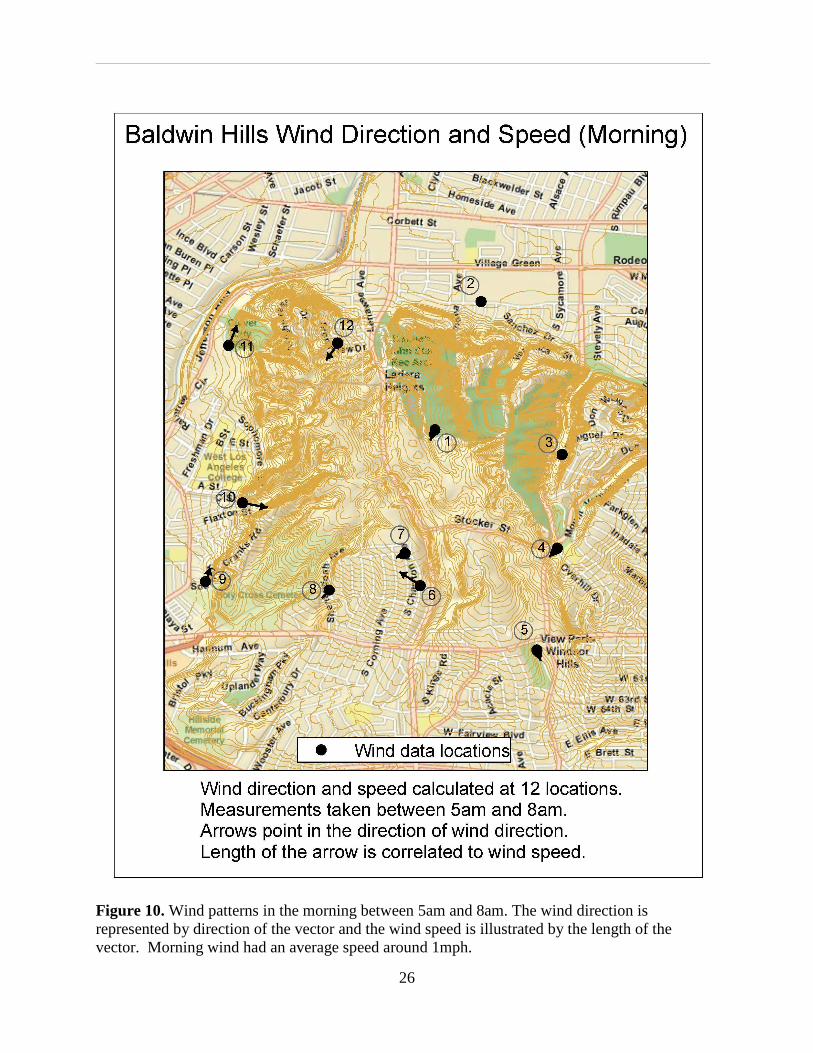
HE wind measurements show a large amount of consistency in wind speed during the respective time-of-day, especially for afternoon (Table 3) for each of the twelve monitoring sites (Figure 9). The morning average wind speed was between 0 and 2.5 miles per hour, with the most
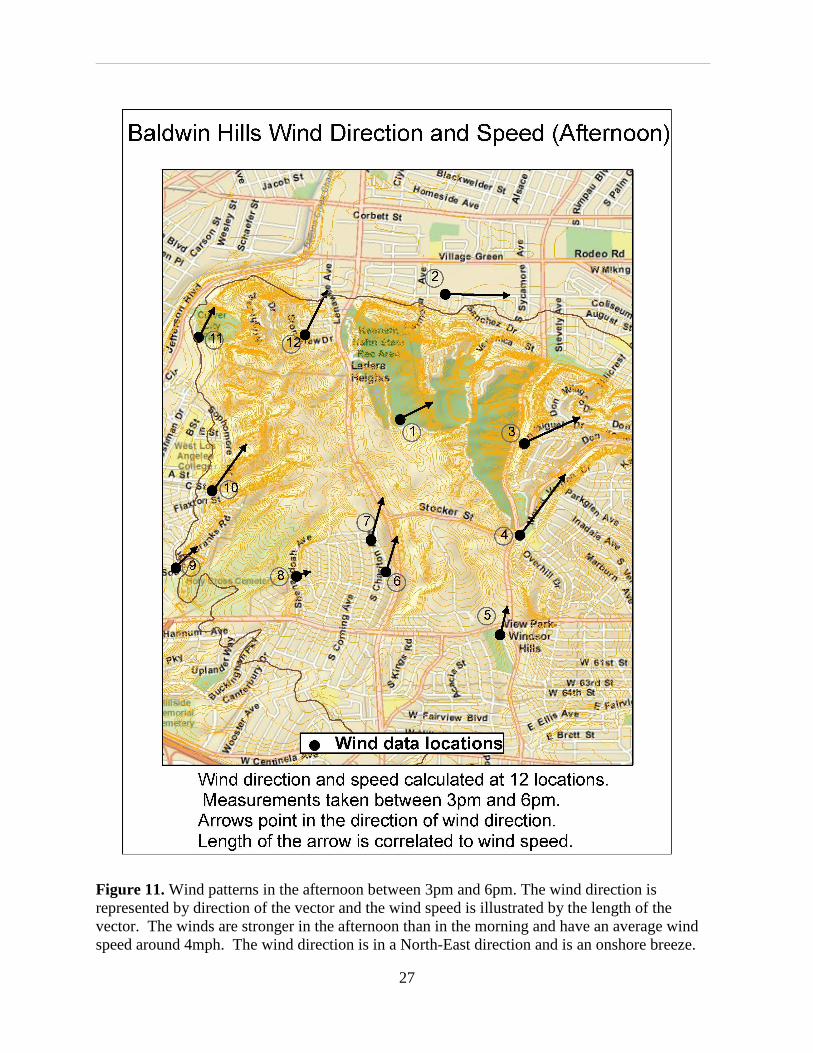
common reading being near 1 mile per hour (Figure 10). The predominant wind direction was North to East, but with significant exceptions. Stations 6, 9, 10, and 11 show very different results, with directions heading more South and West. Also, the average morning speed of these stations is higher than the rest of the morning results. Afternoon average wind speeds range between 1 to 9 mph, with the most common result being around 3 to 4 mph (Figure 11). Station 4 has a relatively high speed at 8.24 mph, and Station 8 is relatively low with 1.37 mph. However, wind direction was consistently South to West for all test sites. While there is variation in topography at each test site, no quantifiable measurements were taken.
Though only one measurement was taken at each test site for each time of day, the wind data is considered to be representative of general weather patterns in the Baldwin Hills. Before wind data was recorded, weather forecasts were checked to ensure no meteorological phenomena would influence the measurements (NOAA). This ensured that the measurements being taken were typical of conditions that exist for a majority of the year. As such, this study does not identify how nuisance odors might be affected by storm systems and Santa Ana conditions. In comparison to regional patterns, morning results did vary somewhat from the expected conditions reported by NOAA. This is likely due to low wind speeds, and the accompanying effect of obstructions including topography and houses at each test site. Afternoon measurements were very similar to the forecasts predicted by NOAA. Table 3. The results of wind measurements taken at locations surrounding the Baldwin Hills community. Average at each location is the mean of the variable (speed or direction) taken over approximately fifteen minutes at fifteen second intervals. *Wind speed was non-existent or too low to give a significant average wind direction.
Latitude Longitude MORNING MORNING AFTERNOON AFTER NOON North West Average Speed Average Direction Average Speed Average Direction 1 34º 00.424' 118º 22.111' 1.17 21.1 (NNE) 3.85 243.8 (WSW) 2 34º 01.108' 118º 21.866' 0 N/A* 6.95 271 (W) 3 34º 00.293' 118º 21.434' 0.62 N/A* 6.65 245.4 (WSW) 4 33º 59.794' 118º 21.459' 1.07 42.1 (NE) 8.24 216.7 (SW) 5 33º 59.251' 118º 21.568' 1.07 339.7 (NNW) 2.97 193.5 (SSW) 6 33º 59.593' 118º 22.190' 2.48 124 (SE) 3.91 196.9 (SSW) 7 33º 59.767' 118º 22.271' 0.82 65.8 (ENE) 4.63 195.7 (SSW) 8 33º 59.569' 118º 22.676' 0.75 42.5 (NE) 1.37 254.5 (WSW) 9 33º 59.615' 118º 23.334' 1.22 194.2 (SSW) 3.05 226.0 (SW)
10 34º 00.036' 118º 23.137' 2.51 280.9 (W) 6.21 215.5 (SW) 11 34º 00.873' 118º 23.211' 2.06 201.1 (SSW) 3.46 206.9 (SSW) 12 34º 00.886' 118º 22.630' 1.92 35.1 (NE) 5.23 206.6 (SSW)
T
_____________________________________________________________________________
25
Figure 9. Wind measurements were made at each of the twelve locations twice – once in the morning and once in the afternoon.
_____________________________________________________________________________
26
Figure 10. Wind patterns in the morning between 5am and 8am. The wind direction is represented by direction of the vector and the wind speed is illustrated by the length of the vector. Morning wind had an average speed around 1mph.
_____________________________________________________________________________
27
Figure 11. Wind patterns in the afternoon between 3pm and 6pm. The wind direction is represented by direction of the vector and the wind speed is illustrated by the length of the vector. The winds are stronger in the afternoon than in the morning and have an average wind speed around 4mph. The wind direction is in a North-East direction and is an onshore breeze.
_____________________________________________________________________________
28
Discussion
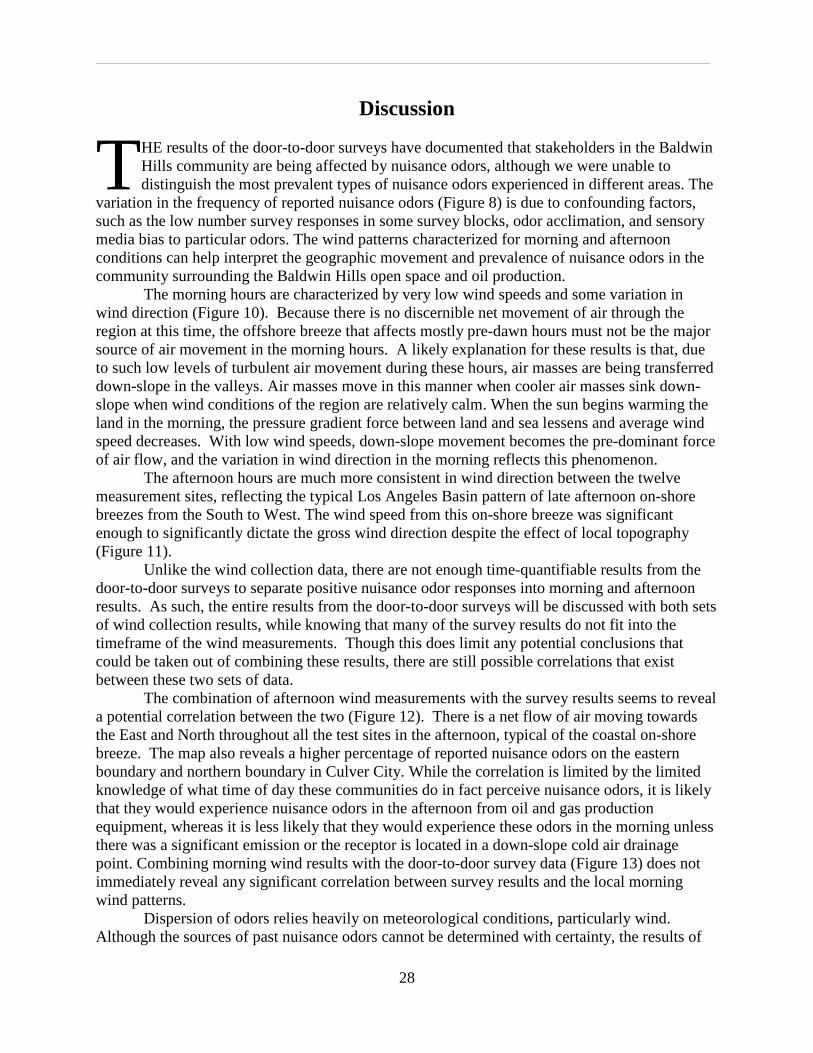
HE results of the door-to-door surveys have documented that stakeholders in the Baldwin Hills community are being affected by nuisance odors, although we were unable to distinguish the most prevalent types of nuisance odors experienced in different areas. The
variation in the frequency of reported nuisance odors (Figure 8) is due to confounding factors, such as the low number survey responses in some survey blocks, odor acclimation, and sensory media bias to particular odors. The wind patterns characterized for morning and afternoon conditions can help interpret the geographic movement and prevalence of nuisance odors in the community surrounding the Baldwin Hills open space and oil production. The morning hours are characterized by very low wind speeds and some variation in wind direction (Figure 10). Because there is no discernible net movement of air through the region at this time, the offshore breeze that affects mostly pre-dawn hours must not be the major source of air movement in the morning hours. A likely explanation for these results is that, due to such low levels of turbulent air movement during these hours, air masses are being transferred down-slope in the valleys. Air masses move in this manner when cooler air masses sink down-slope when wind conditions of the region are relatively calm. When the sun begins warming the land in the morning, the pressure gradient force between land and sea lessens and average wind speed decreases. With low wind speeds, down-slope movement becomes the pre-dominant force of air flow, and the variation in wind direction in the morning reflects this phenomenon. The afternoon hours are much more consistent in wind direction between the twelve measurement sites, reflecting the typical Los Angeles Basin pattern of late afternoon on-shore breezes from the South to West. The wind speed from this on-shore breeze was significant enough to significantly dictate the gross wind direction despite the effect of local topography (Figure 11).
Unlike the wind collection data, there are not enough time-quantifiable results from the door-to-door surveys to separate positive nuisance odor responses into morning and afternoon results. As such, the entire results from the door-to-door surveys will be discussed with both sets of wind collection results, while knowing that many of the survey results do not fit into the timeframe of the wind measurements. Though this does limit any potential conclusions that could be taken out of combining these results, there are still possible correlations that exist between these two sets of data.
The combination of afternoon wind measurements with the survey results seems to reveal a potential correlation between the two (Figure 12). There is a net flow of air moving towards the East and North throughout all the test sites in the afternoon, typical of the coastal on-shore breeze. The map also reveals a higher percentage of reported nuisance odors on the eastern boundary and northern boundary in Culver City. While the correlation is limited by the limited knowledge of what time of day these communities do in fact perceive nuisance odors, it is likely that they would experience nuisance odors in the afternoon from oil and gas production equipment, whereas it is less likely that they would experience these odors in the morning unless there was a significant emission or the receptor is located in a down-slope cold air drainage point. Combining morning wind results with the door-to-door survey data (Figure 13) does not immediately reveal any significant correlation between survey results and the local morning wind patterns.
Dispersion of odors relies heavily on meteorological conditions, particularly wind. Although the sources of past nuisance odors cannot be determined with certainty, the results of
T
_____________________________________________________________________________
29
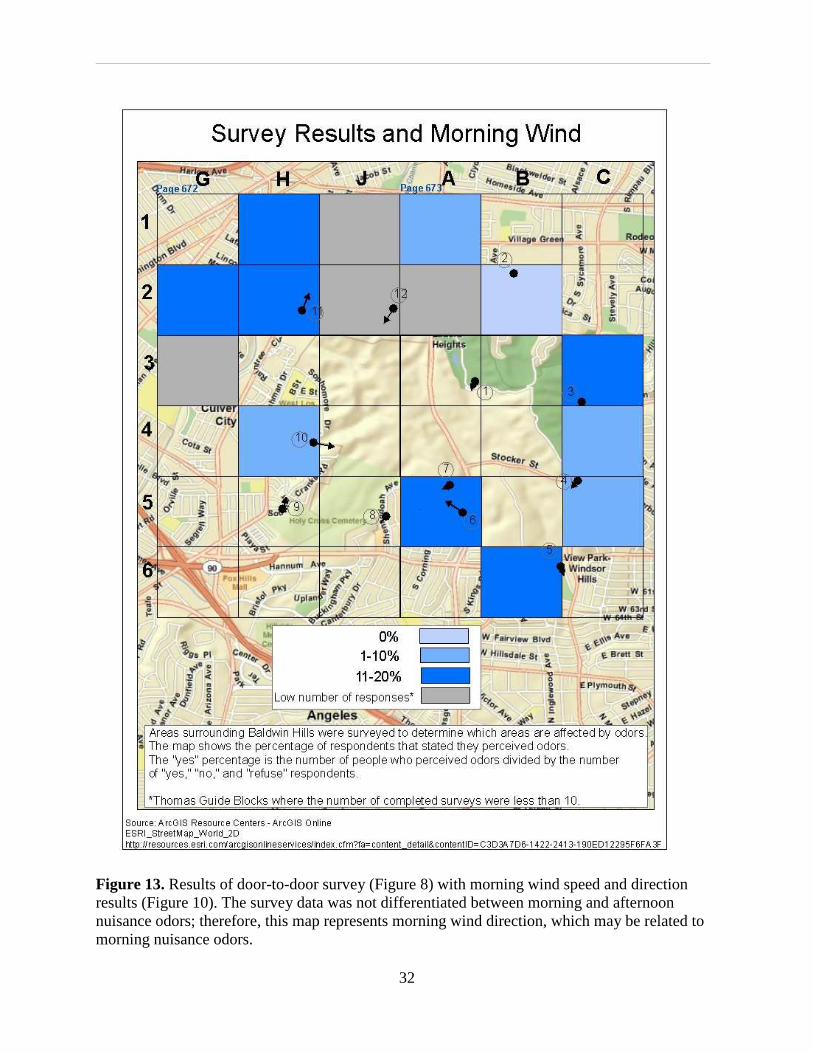
the wind study can give an approximate heading of airborne odors during the respective time of day. In the morning, the results show a majority of wind coming from the North and East (and towards the South and West) (Figure 13). Residencies that have oil production or sewage treatment, or experience high levels of traffic, to their Northeast, especially if at low elevations, are most at risk of odor nuisances during early morning hours. In the afternoon, wind is coming exclusively from the South and West. Residencies on the eastern boundaries of the Baldwin Hills are most at risk of nuisance odors coming from oil production in the region. Due to the higher wind speeds in the afternoon, there is no evidence that communities at lower elevations are more at risk in the afternoon. Challenges
HROUGHOUT this project, there were many limitations that had to be overcome. From these experiences we can make recommendations and suggestions to guide future studies. We had a very low response rate from the 30 groups contacted that would have expert
knowledge about the prevalence of nuisance odors in the community. Outreach can be improved by building a larger social network prior to soliciting participation in the survey in order to increase the opportunities to speak with representatives of the target groups. Many of the groups did not respond, or when they did, were not interested in participating. By establishing a larger social network, we expect to better identify representatives interested in participating in the study. To encourage participation with the special knowledge survey, providing it online may emphasize how easily it can be completed and how responses are compiled anonymously. Efforts can therefore be focused on encouraging them to complete the survey. The door-to-door surveys were limited in the number of completed surveys due to a lack of knowledge about the impact of nuisance odors in the community and by the lack of accessibility to potential participants. An education campaign prior to conducting the survey would help increase the community’s awareness of the nature of different odors, the potential health impacts and environmental regulatory requirements with respect to nuisance odors. Increased awareness in the community is expected to increase participation in surveys related to characterizing the prevalence of nuisance odors. In order to address the lack of accessibility to apartments, gated communities and businesses, efforts could be made to gain permission to address these communities at neighborhood council meetings, neighborhood watch meetings or homeowners association meetings. It is important to address these communities in future studies because of the high concentration of individuals in these areas. Another challenge involving the door-to-door survey was the hours that participation was solicited. About half of the surveys were conducted during the week between the hours of three to six in the afternoon. Many individuals may have been at work or coming home from work, therefore they were not available to participate in the study, which would account for the high number individuals that were not available.
A challenge involving odor perception is that some individuals may have acclimated to the odors and therefore do not notice them. This does not mean that odors do not exist, but rather that individuals in the community are accustomed to the odors and do not recognize them. It is also important to note that this project focused on nuisance odors in the community and due to lack of money, time, and resources, this project could not assess whether or not the odors the community experiences has any impact on public health.
T
_____________________________________________________________________________
30
Another challenge involving odor perception is media sensory bias. Some individuals may be told by the media that areas are being impacted by odors, which leads them to claim to smell odors, although they may not be actually experiencing these odors. Due to these challenges, it is difficult to differentiate the type of odors that the community is experiencing. Some individuals may be noticing odors, but due to media bias they may misinterpret the type of odor that they experience. Future Implications
HE project results can be used to prioritize areas for air quality monitoring and nuisance odor abatement projects. This is an improvement on the potential odor dispersion scenarios in the EIR (LACDRP 2008), which presents more general and less actionable
information because this project focuses on local wind measurements and door-to-door survey results. Future studies can focus their efforts on gated communities, apartments, studios, and businesses as well areas surrounding Baldwin Hills that were unable to be surveyed in this projects due to lack of time and resources.
Future studies could further characterize the role of topography in the movement of early morning air masses to determine if low-lying areas adjacent to oil and gas production activity are most likely to be impacted by nuisance odors in the early morning hours. In addition, areas that are currently experiencing nuisance odors would benefit from the installation of a permanent weather station to determine meteorological conditions when nuisance odors are reported in the surrounding community.
This study has increased awareness in the community about areas impacted by nuisance odors. This project will hopefully make nuisance odor discussion a part of regular political agendas. Being more aware of the issue and more proactive will help in resolving odor concerns in the community. Finally this project will open up lines of communication between the community and local businesses. With more communication, the community can voice their concerns and with the community, businesses, and local government working together these issues can be addressed and mitigated.
T

_____________________________________________________________________________
31
Figure 12. Results of door-to-door survey (Figure 8) with afternoon wind speed and direction results (Figure 11). The survey data was not differentiated between morning and afternoon nuisance odors, therefore this map represents afternoon wind patterns, which may be related to afternoon nuisance odors.
_____________________________________________________________________________
32
Figure 13. Results of door-to-door survey (Figure 8) with morning wind speed and direction results (Figure 10). The survey data was not differentiated between morning and afternoon nuisance odors; therefore, this map represents morning wind direction, which may be related to morning nuisance odors.
_____________________________________________________________________________
33
References Baldwin Hills, Los Angeles, California. 2005. Accessed February 10, 2009.
http://www.nationmaster.com/encyclopedia/Baldwin-Hills,-Los-Angeles,-California Capek, S. 1993. The “Environmental Justice” Frame: A Conceptual Discussion and an
Application. Social Problems, Volume 40, 5-24. Chilingar, G. V. and Endres, B. 2004. Environmental hazards posed by the Los Angeles Basin
urban oilfields: an historical perspective of lessons learned. Environmental Geology, 7(2), 302-317.
Cline, S. and Garcia, B. 2000. Brownfield Redevelopment in the Los Angeles Basin. 23-27. Dalton, P. 1996. Odor Perception and Beliefs about Risk. Monell Chemical Senses Center. Dalton, P. 2003. Upper Airway irritation, Odor Perception and Health Risk due to Airborne
Chemicals. Toxicology Letters, 140, 239-248. Dalton, P., Wysocki, C., Brody, M., and Lawley, H. 1997. The Influence of Cognitive Bias on
the perceived odor, irritation and health symptoms from chemical exposure. International Archive of Occupational Environmental Health, 69, 407-417.
Deane, M. and Sanders, G. 1978. Annoyance and Health Reactions to Odor from Refineries and
Other Indusries in Carson, California. Environmental Research, 15, 119-132. Drivas, P. J. and Shair, F. H. 1994. A Tracer Study of Pollutant Transfer and Dispersion in the
Los Angeles Area. Atmospheric Environment, 8, 1155-1163. Elliott, S. J., Cole, D. C., Krueger, P., Voorberg N., and Wakefield, S. 1999. The power of
perception: health risk attributed to air pollution in an urban industrial neighborhood. Risk Analysis 19 (4), 615-628.
Environmental Justice. 2009. Accessed February 12, 2009,
http://www.epa.gov/compliance/environmentaljustice/index.html Fernando, H. J. S., Lee, S.M., Anderson, J., Princevac, M., Pardyjak, E., and Grossman-Clarke,
S. 2000. Urban Fluid Mechanics: Air Circulation and Contaminant Dispersion in Cities. Environmental Fluid Mechanics, 1, 107-164.
Green, M. C., Flocchini, R. G., and Myrup, L. O. 1991. The Relationship of the Extinction
Coefficient Distribution to Wind Field Patterns in Southern California. Atmospheric Environment, 26 (5), 827-840.
Los Angeles County Department of Regional Planning (LACDRP). 2008. “Baldwin Hills
Community Standards District.” Environmental Impact Report (EIR).
_____________________________________________________________________________
34
Lee, C. (2002). Environmental Justice: Building a Unified Vision of Health and the
Environment. Environmental Health Perspectives, Volume 110, 141-144. Lu, R. and Turco, R. P. 1994. Air Pollutant Transport in a Coastal Environment—Three
Dimensional Simulations Over Los Angeles Basin. Atmospheric Environment, 29 (13), 1499-1518.
Mahin, T. D., McGinley, C. M., and Pope, R. J. 2000. Elements of Successful Odor/ Odour
Laws. Minnesota: St. Croix Sensory Inc. Morello-Frosch, R., Pastor, M., Porras, C., and Sadd, J. 2002. Environmental Justice and
Regional Inequality in Southern California. Environmental Health Perspectives, Volume 110, 149-154.
Ozonoff, D., Colten, M., Cupples, A., Heeren, T., Schatzkin, A., Mangione, T., Dresner, M., and
Colton, T. 1987. Health Problems Reported by Residents of a Neighbrhood Contaminated by a Hazardous Waste Facility. American Journal of Industrial Medicine, 11, 581-597.
Shustermann, D., Lipscomb, J., Raymond, N., and Satin, K. 1991. Symptom Prevalence and
Odor-Worry Interaction near Hazardous Waste Sites. Environmental Health Perspectives, 94, 25-30.
South Coast Air Quality Management District (SCAQMD). 2008. Notice of violation reports:
P37137, P44789, P44790, P44802. U.S. Census Bureau. 2007. “2005-2007 American Community Survey: Los Angeles County”.
www.census.gov Accessed 2/10/09. Wood, N. 1999. Wind Flow Over Complex Terrain: A Historical Perspective and the Prospect
for Large-Eddy Modeling. Boundary-Layer Meteorology, 96, 11-32.
Appendix A
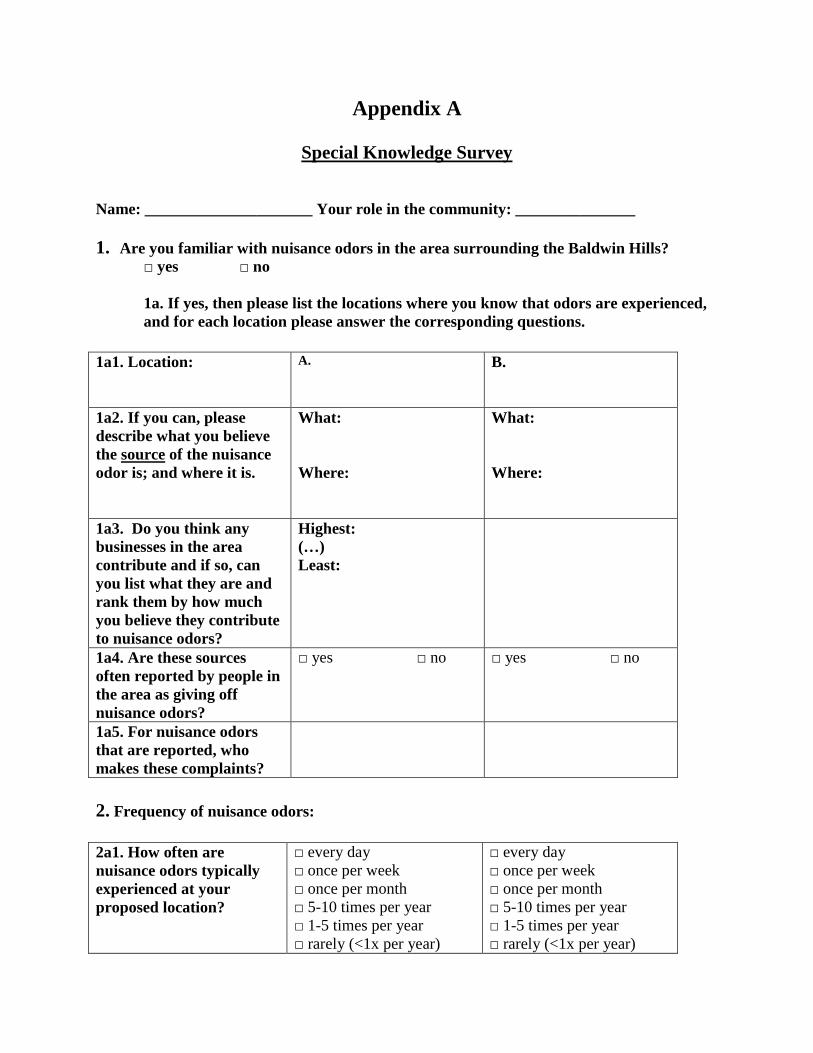
Special Knowledge Survey
Name: _____________________ Your role in the community: _______________ 1. Are you familiar with nuisance odors in the area surrounding the Baldwin Hills?
□ yes □ no 1a. If yes, then please list the locations where you know that odors are experienced, and for each location please answer the corresponding questions.
1a1. Location:
A. B.
1a2. If you can, please describe what you believe the source of the nuisance odor is; and where it is.
What: Where:
What: Where:
1a3. Do you think any businesses in the area contribute and if so, can you list what they are and rank them by how much you believe they contribute to nuisance odors?
Highest: (…) Least:
1a4. Are these sources often reported by people in the area as giving off nuisance odors?
□ yes □ no □ yes □ no
1a5. For nuisance odors that are reported, who makes these complaints?
2. Frequency of nuisance odors: 2a1. How often are nuisance odors typically experienced at your proposed location?
□ every day □ once per week □ once per month □ 5-10 times per year □ 1-5 times per year □ rarely (<1x per year)
□ every day □ once per week □ once per month □ 5-10 times per year □ 1-5 times per year □ rarely (<1x per year)

2a2. On average, how often are these locations frequented?
□ every day □ once per week □ once per month □ 5-10 times per year □ 1-5 times per year □ rarely (<1x per year)
□ every day □ once per week □ once per month □ 5-10 times per year □ 1-5 times per year □ rarely (<1x per year)
2a3. How often are nuisance odors typically reported?
□ every day □ once per week □ once per month □ 5-10 times per year □ 1-5 times per year □ rarely (<1x per year)
□ every day □ once per week □ once per month □ 5-10 times per year □ 1-5 times per year □ rarely (<1x per year)
2a4. What time of day do nuisance odors occur (check all that apply)?
□ midnight to dawn □ after dawn to noon □ afternoon to dusk □ after dusk to midnight □ don’t know/remember
□ midnight to dawn □ after dawn to noon □ afternoon to dusk □ after dusk to midnight □ don’t know/remember
3. Has there been research into the causes of odor already done?
□ yes □ no
3a. If so, can you provide us with this information or direct us to where we can get these resources of these studies that will aid us in our research?
______________________
4. What areas do you believe to be affected by odor issues the most?
Location A: ______________ Location B: ______________ Location C: _______________
4a. Within these locations, what are the sensitive populations that are vulnerable to
nuisance odors?
A. _________________ B. _______________ C. _______________
4b. Can you list other reasons for these areas being more affected by odor issues than other areas (i.e. topography, proximity to sources, demographics)?

A: _____________ B: _____________ C: _____________
5. Do you know of any mitigation measures that have been pursued to prevent the occurrence of the nuisance odor? If not, what do you think can be done to better manage these nuisance odors in the future?
a. What entities have the most to gain from efforts to reduce odors?
b. What entities might have the most to lose?
6. Can you make any last recommendations that can aid in our research/project? 7. Could you recommend additional people to interview? If so, could you provide their contact information? 8. May we contact you in the future with follow up questions regarding your responses to this survey? □ yes □ no Email: Contact Number: THANK YOU
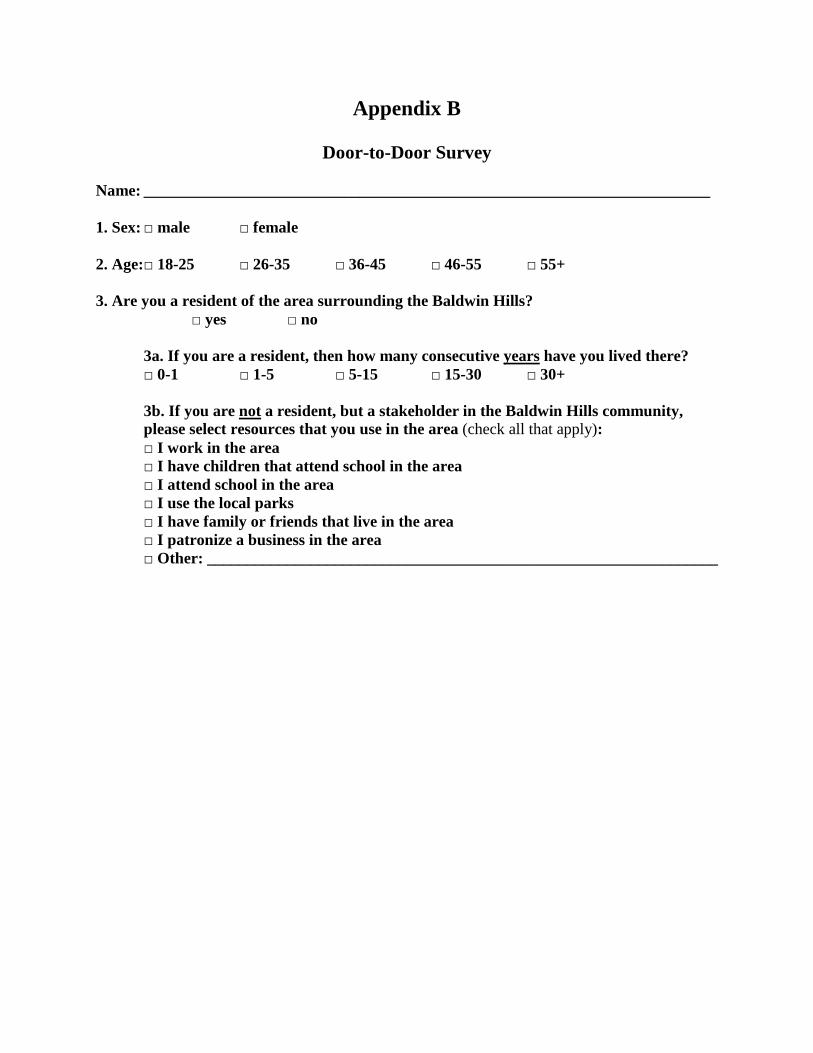
Appendix B
Door-to-Door Survey Name: _______________________________________________________________________ 1. Sex: □ male □ female 2. Age:□ 18-25 □ 26-35 □ 36-45 □ 46-55 □ 55+ 3. Are you a resident of the area surrounding the Baldwin Hills?
□ yes □ no 3a. If you are a resident, then how many consecutive years have you lived there? □ 0-1 □ 1-5 □ 5-15 □ 15-30 □ 30+ 3b. If you are not a resident, but a stakeholder in the Baldwin Hills community, please select resources that you use in the area (check all that apply):
□ I work in the area □ I have children that attend school in the area □ I attend school in the area □ I use the local parks □ I have family or friends that live in the area □ I patronize a business in the area □ Other: ________________________________________________________________
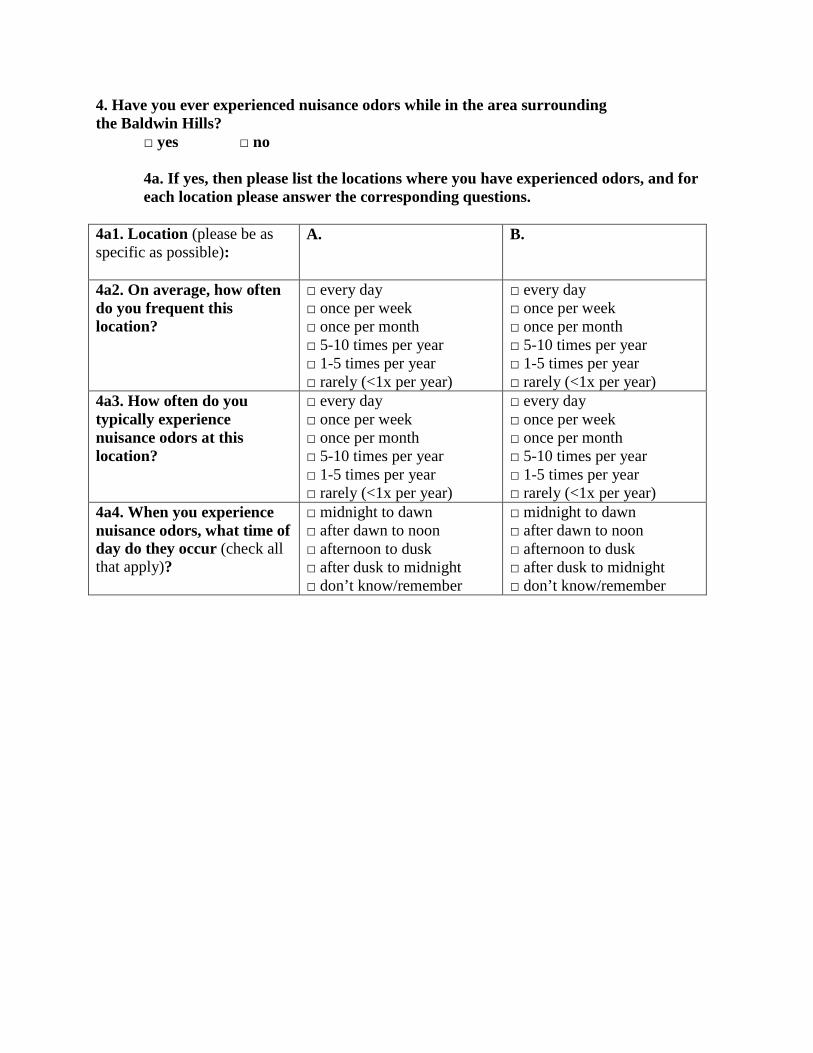
4. Have you ever experienced nuisance odors while in the area surrounding the Baldwin Hills?
□ yes □ no 4a. If yes, then please list the locations where you have experienced odors, and for each location please answer the corresponding questions.
4a1. Location (please be as specific as possible):
A.
B.
4a2. On average, how often do you frequent this location?
□ every day □ once per week □ once per month □ 5-10 times per year □ 1-5 times per year □ rarely (<1x per year)
□ every day □ once per week □ once per month □ 5-10 times per year □ 1-5 times per year □ rarely (<1x per year)
4a3. How often do you typically experience nuisance odors at this location?
□ every day □ once per week □ once per month □ 5-10 times per year □ 1-5 times per year □ rarely (<1x per year)
□ every day □ once per week □ once per month □ 5-10 times per year □ 1-5 times per year □ rarely (<1x per year)
4a4. When you experience nuisance odors, what time of day do they occur (check all that apply)?
□ midnight to dawn □ after dawn to noon □ afternoon to dusk □ after dusk to midnight □ don’t know/remember
□ midnight to dawn □ after dawn to noon □ afternoon to dusk □ after dusk to midnight □ don’t know/remember
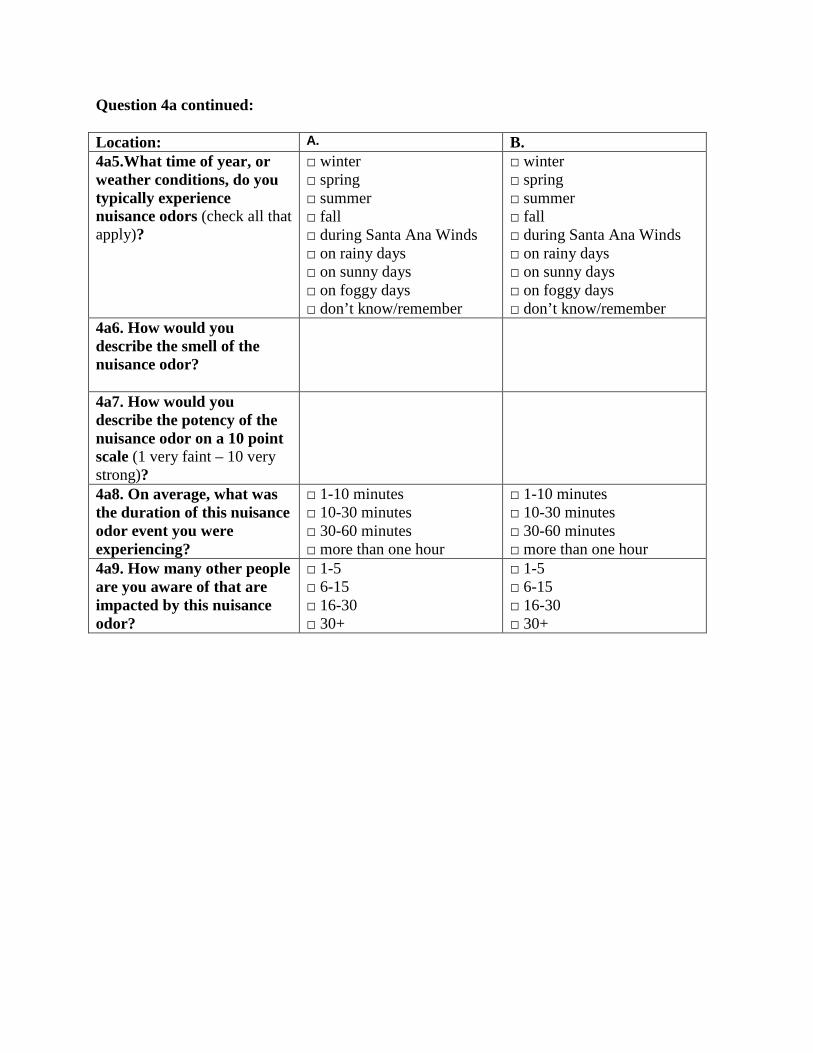
Question 4a continued: Location: A. B. 4a5.What time of year, or weather conditions, do you typically experience nuisance odors (check all that apply)?
□ winter □ spring □ summer □ fall □ during Santa Ana Winds □ on rainy days □ on sunny days □ on foggy days □ don’t know/remember
□ winter □ spring □ summer □ fall □ during Santa Ana Winds □ on rainy days □ on sunny days □ on foggy days □ don’t know/remember
4a6. How would you describe the smell of the nuisance odor?
4a7. How would you describe the potency of the nuisance odor on a 10 point scale (1 very faint – 10 very strong)?
4a8. On average, what was the duration of this nuisance odor event you were experiencing?
□ 1-10 minutes □ 10-30 minutes □ 30-60 minutes □ more than one hour
□ 1-10 minutes □ 10-30 minutes □ 30-60 minutes □ more than one hour
4a9. How many other people are you aware of that are impacted by this nuisance odor?
□ 1-5 □ 6-15 □ 16-30 □ 30+
□ 1-5 □ 6-15 □ 16-30 □ 30+
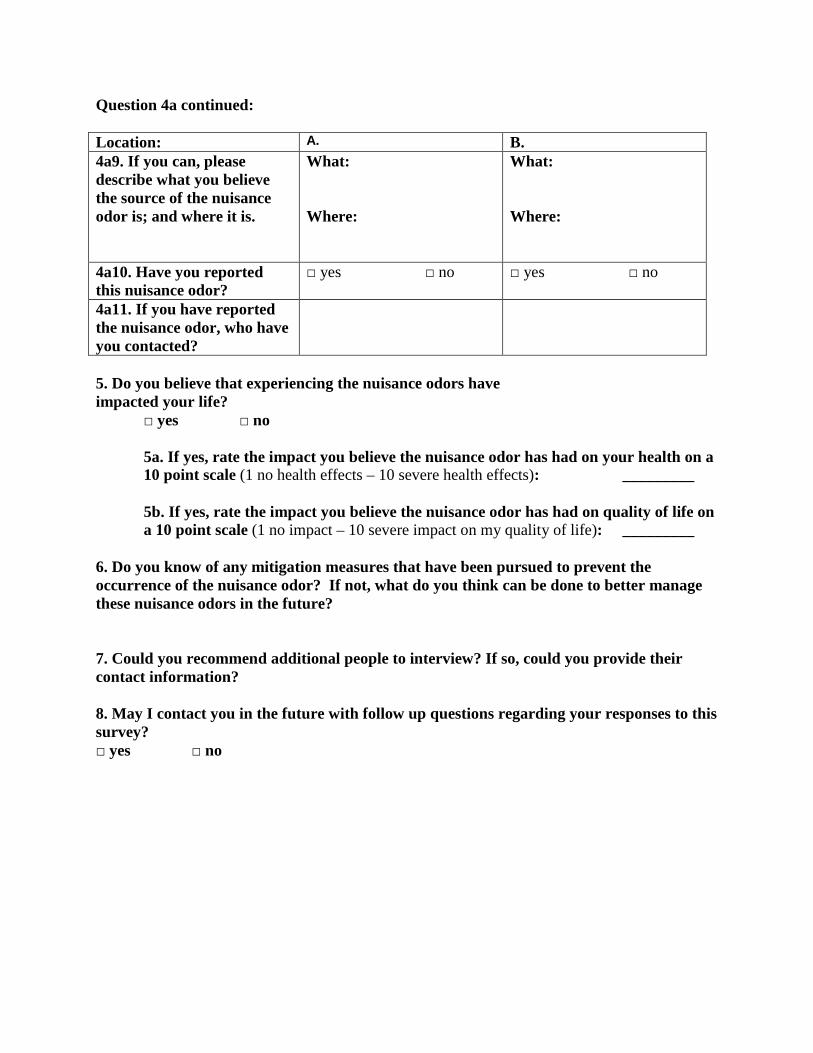
Question 4a continued: Location: A. B. 4a9. If you can, please describe what you believe the source of the nuisance odor is; and where it is.
What: Where:
What: Where:
4a10. Have you reported this nuisance odor?
□ yes □ no □ yes □ no
4a11. If you have reported the nuisance odor, who have you contacted?
5. Do you believe that experiencing the nuisance odors have impacted your life?
□ yes □ no 5a. If yes, rate the impact you believe the nuisance odor has had on your health on a 10 point scale (1 no health effects – 10 severe health effects): _________ 5b. If yes, rate the impact you believe the nuisance odor has had on quality of life on a 10 point scale (1 no impact – 10 severe impact on my quality of life): _________
6. Do you know of any mitigation measures that have been pursued to prevent the occurrence of the nuisance odor? If not, what do you think can be done to better manage these nuisance odors in the future? 7. Could you recommend additional people to interview? If so, could you provide their contact information? 8. May I contact you in the future with follow up questions regarding your responses to this survey? □ yes □ no
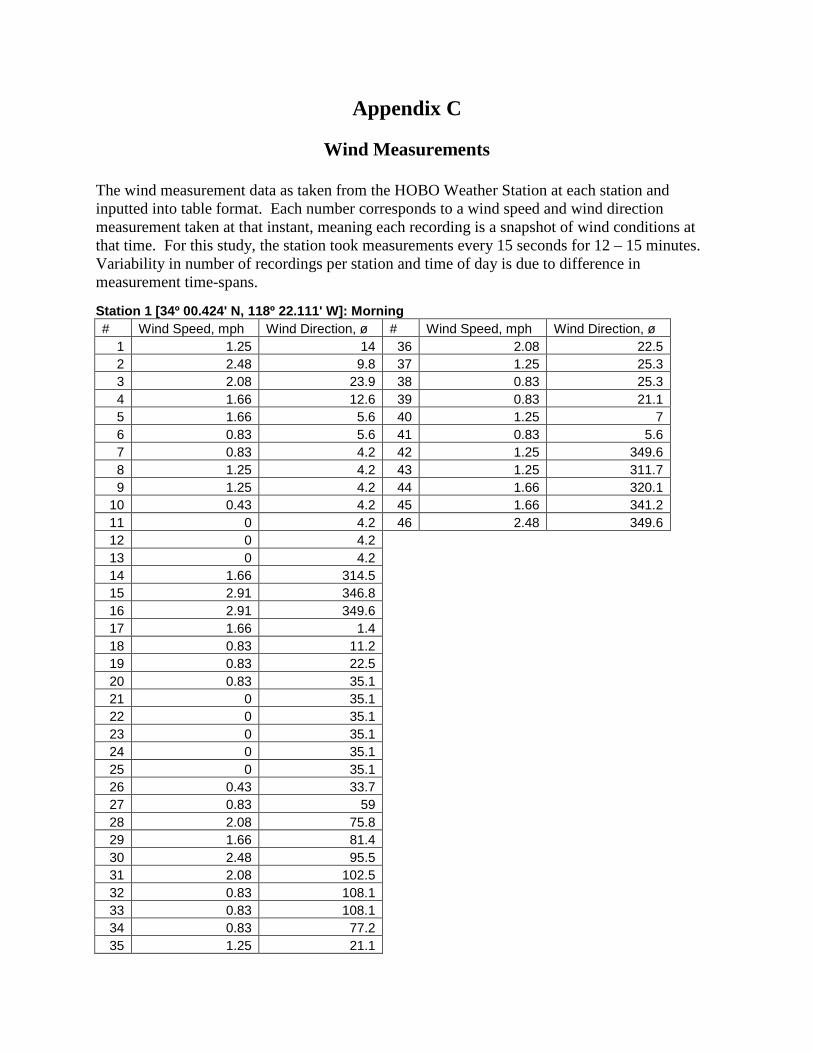
Appendix C
Wind Measurements
The wind measurement data as taken from the HOBO Weather Station at each station and inputted into table format. Each number corresponds to a wind speed and wind direction measurement taken at that instant, meaning each recording is a snapshot of wind conditions at that time. For this study, the station took measurements every 15 seconds for 12 – 15 minutes. Variability in number of recordings per station and time of day is due to difference in measurement time-spans. Station 1 [34º 00.424' N, 118º 22.111' W]: Morning # Wind Speed, mph Wind Direction, ø # Wind Speed, mph Wind Direction, ø
1 1.25 14 36 2.08 22.5 2 2.48 9.8 37 1.25 25.3 3 2.08 23.9 38 0.83 25.3 4 1.66 12.6 39 0.83 21.1 5 1.66 5.6 40 1.25 7 6 0.83 5.6 41 0.83 5.6 7 0.83 4.2 42 1.25 349.6 8 1.25 4.2 43 1.25 311.7 9 1.25 4.2 44 1.66 320.1
10 0.43 4.2 45 1.66 341.2 11 0 4.2 46 2.48 349.6 12 0 4.2 13 0 4.2 14 1.66 314.5 15 2.91 346.8 16 2.91 349.6 17 1.66 1.4 18 0.83 11.2 19 0.83 22.5 20 0.83 35.1 21 0 35.1 22 0 35.1 23 0 35.1 24 0 35.1 25 0 35.1 26 0.43 33.7 27 0.83 59 28 2.08 75.8 29 1.66 81.4 30 2.48 95.5 31 2.08 102.5 32 0.83 108.1 33 0.83 108.1 34 0.83 77.2 35 1.25 21.1

Station 1 [34º 00.424' N, 118º 22.111' W]: Afternoo n # Wind Speed, mph Wind Direction, ø # Wind Speed, mph Wind Direction, ø
1 4.99 255.5 36 4.16 231.6 2 3.74 262.5 37 2.08 247.1 3 2.48 273.8 38 3.31 247.1 4 4.16 249.9 39 4.16 251.3 5 4.16 238.7 40 3.74 240.1 6 4.56 275.2 41 2.91 241.5 7 5.82 244.3 42 5.82 221.8 8 4.99 241.5 43 4.56 256.9 9 4.56 261.1 44 5.82 254.1
10 4.16 241.5 45 4.16 256.9 11 4.16 228.8 46 4.16 249.9 12 4.16 244.3 47 3.31 263.9 13 3.31 210.6 48 3.74 245.7 14 3.31 188.1 49 3.74 240.1 15 3.74 238.7 50 4.16 238.7 16 3.31 234.5 51 3.31 227.4 17 2.48 233.1 18 1.66 252.7 19 2.08 313.1 20 2.48 299 21 4.56 282.2 22 3.74 279.4 23 2.91 217.6 24 3.74 265.3 25 5.39 238.7 26 4.16 254.1 27 3.31 320.1 28 3.74 258.3 29 2.48 231.6 30 4.56 209.2 31 4.16 207.8 32 4.99 200.8 33 4.16 251.3 34 3.74 238.7 35 4.16 230.2
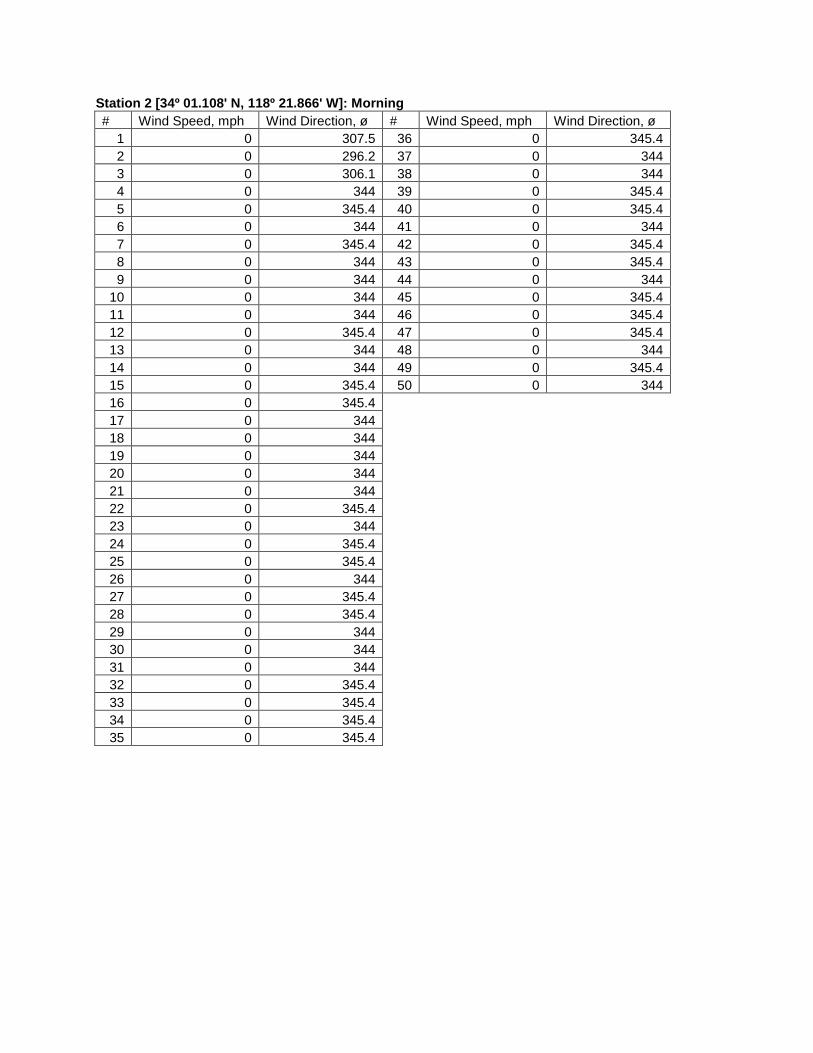
Station 2 [34º 01.108' N, 118º 21.866' W]: Morning # Wind Speed, mph Wind Direction, ø # Wind Speed, mph Wind Direction, ø
1 0 307.5 36 0 345.4 2 0 296.2 37 0 344 3 0 306.1 38 0 344 4 0 344 39 0 345.4 5 0 345.4 40 0 345.4 6 0 344 41 0 344 7 0 345.4 42 0 345.4 8 0 344 43 0 345.4 9 0 344 44 0 344
10 0 344 45 0 345.4 11 0 344 46 0 345.4 12 0 345.4 47 0 345.4 13 0 344 48 0 344 14 0 344 49 0 345.4 15 0 345.4 50 0 344 16 0 345.4 17 0 344 18 0 344 19 0 344 20 0 344 21 0 344 22 0 345.4 23 0 344 24 0 345.4 25 0 345.4 26 0 344 27 0 345.4 28 0 345.4 29 0 344 30 0 344 31 0 344 32 0 345.4 33 0 345.4 34 0 345.4 35 0 345.4
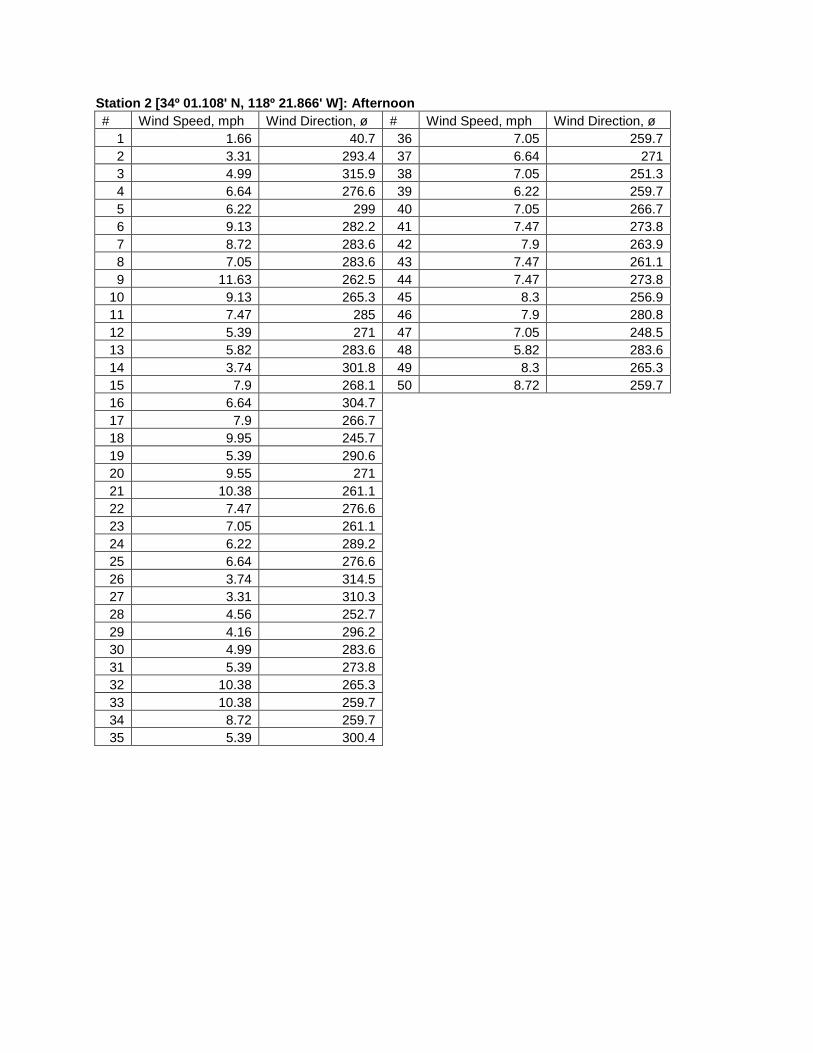
Station 2 [34º 01.108' N, 118º 21.866' W]: Afternoo n # Wind Speed, mph Wind Direction, ø # Wind Speed, mph Wind Direction, ø
1 1.66 40.7 36 7.05 259.7 2 3.31 293.4 37 6.64 271 3 4.99 315.9 38 7.05 251.3 4 6.64 276.6 39 6.22 259.7 5 6.22 299 40 7.05 266.7 6 9.13 282.2 41 7.47 273.8 7 8.72 283.6 42 7.9 263.9 8 7.05 283.6 43 7.47 261.1 9 11.63 262.5 44 7.47 273.8
10 9.13 265.3 45 8.3 256.9 11 7.47 285 46 7.9 280.8 12 5.39 271 47 7.05 248.5 13 5.82 283.6 48 5.82 283.6 14 3.74 301.8 49 8.3 265.3 15 7.9 268.1 50 8.72 259.7 16 6.64 304.7 17 7.9 266.7 18 9.95 245.7 19 5.39 290.6 20 9.55 271 21 10.38 261.1 22 7.47 276.6 23 7.05 261.1 24 6.22 289.2 25 6.64 276.6 26 3.74 314.5 27 3.31 310.3 28 4.56 252.7 29 4.16 296.2 30 4.99 283.6 31 5.39 273.8 32 10.38 265.3 33 10.38 259.7 34 8.72 259.7 35 5.39 300.4
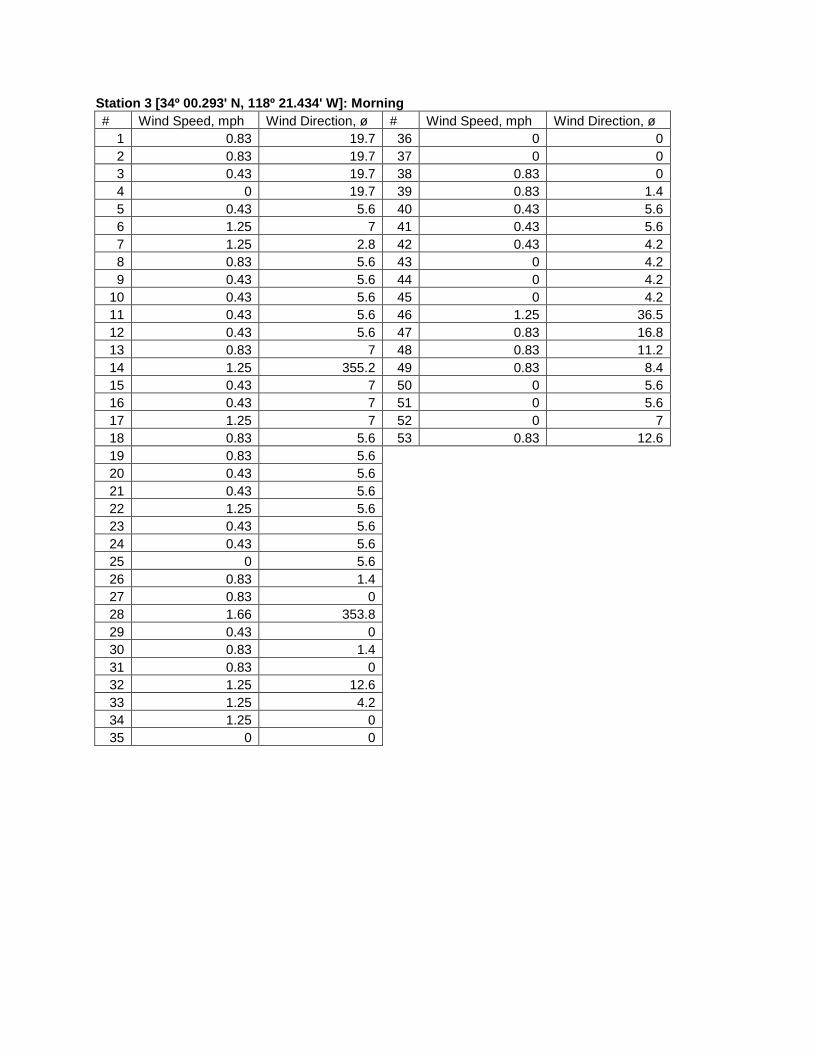
Station 3 [34º 00.293' N, 118º 21.434' W]: Morning # Wind Speed, mph Wind Direction, ø # Wind Speed, mph Wind Direction, ø
1 0.83 19.7 36 0 0 2 0.83 19.7 37 0 0 3 0.43 19.7 38 0.83 0 4 0 19.7 39 0.83 1.4 5 0.43 5.6 40 0.43 5.6 6 1.25 7 41 0.43 5.6 7 1.25 2.8 42 0.43 4.2 8 0.83 5.6 43 0 4.2 9 0.43 5.6 44 0 4.2
10 0.43 5.6 45 0 4.2 11 0.43 5.6 46 1.25 36.5 12 0.43 5.6 47 0.83 16.8 13 0.83 7 48 0.83 11.2 14 1.25 355.2 49 0.83 8.4 15 0.43 7 50 0 5.6 16 0.43 7 51 0 5.6 17 1.25 7 52 0 7 18 0.83 5.6 53 0.83 12.6 19 0.83 5.6 20 0.43 5.6 21 0.43 5.6 22 1.25 5.6 23 0.43 5.6 24 0.43 5.6 25 0 5.6 26 0.83 1.4 27 0.83 0 28 1.66 353.8 29 0.43 0 30 0.83 1.4 31 0.83 0 32 1.25 12.6 33 1.25 4.2 34 1.25 0 35 0 0
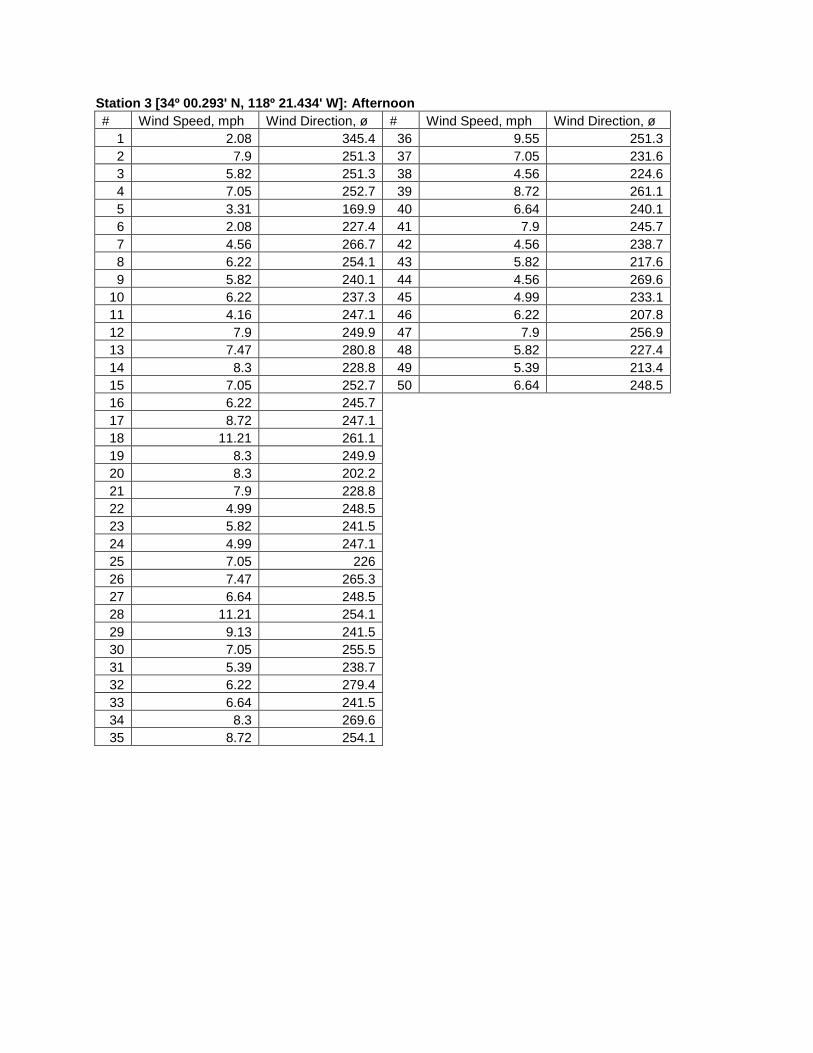
Station 3 [34º 00.293' N, 118º 21.434' W]: Afternoo n # Wind Speed, mph Wind Direction, ø # Wind Speed, mph Wind Direction, ø
1 2.08 345.4 36 9.55 251.3 2 7.9 251.3 37 7.05 231.6 3 5.82 251.3 38 4.56 224.6 4 7.05 252.7 39 8.72 261.1 5 3.31 169.9 40 6.64 240.1 6 2.08 227.4 41 7.9 245.7 7 4.56 266.7 42 4.56 238.7 8 6.22 254.1 43 5.82 217.6 9 5.82 240.1 44 4.56 269.6
10 6.22 237.3 45 4.99 233.1 11 4.16 247.1 46 6.22 207.8 12 7.9 249.9 47 7.9 256.9 13 7.47 280.8 48 5.82 227.4 14 8.3 228.8 49 5.39 213.4 15 7.05 252.7 50 6.64 248.5 16 6.22 245.7 17 8.72 247.1 18 11.21 261.1 19 8.3 249.9 20 8.3 202.2 21 7.9 228.8 22 4.99 248.5 23 5.82 241.5 24 4.99 247.1 25 7.05 226 26 7.47 265.3 27 6.64 248.5 28 11.21 254.1 29 9.13 241.5 30 7.05 255.5 31 5.39 238.7 32 6.22 279.4 33 6.64 241.5 34 8.3 269.6 35 8.72 254.1
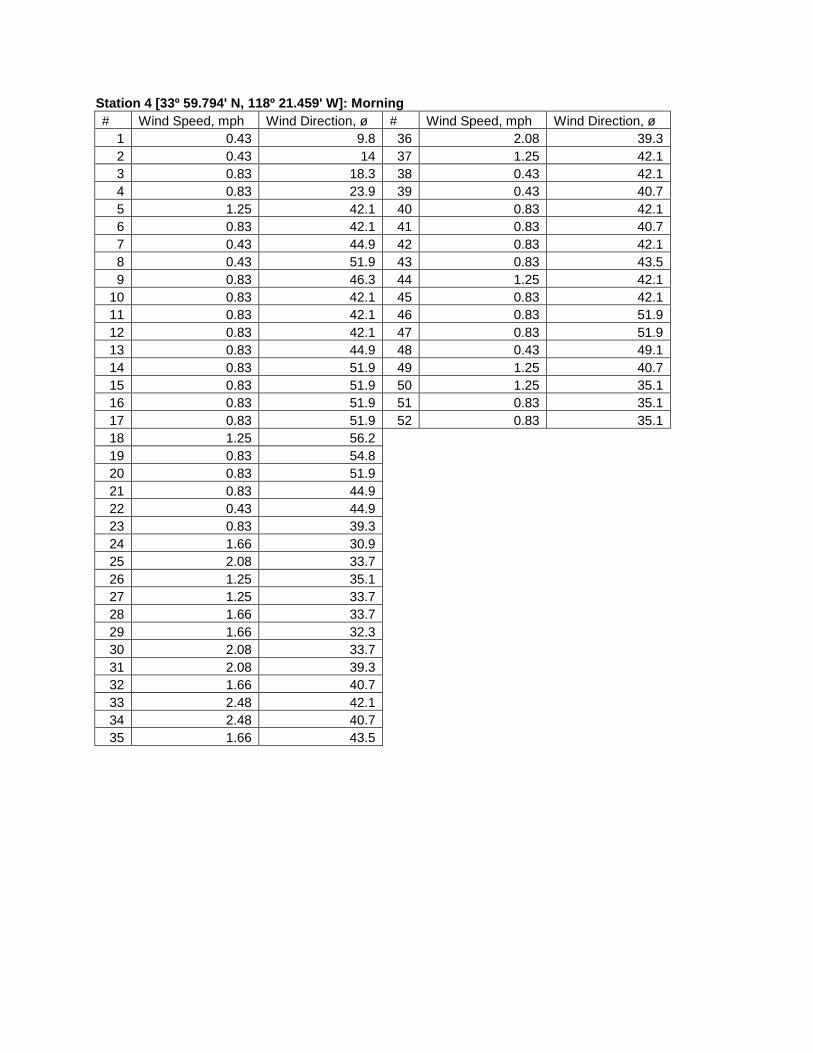
Station 4 [33º 59.794' N, 118º 21.459' W]: Morning # Wind Speed, mph Wind Direction, ø # Wind Speed, mph Wind Direction, ø
1 0.43 9.8 36 2.08 39.3 2 0.43 14 37 1.25 42.1 3 0.83 18.3 38 0.43 42.1 4 0.83 23.9 39 0.43 40.7 5 1.25 42.1 40 0.83 42.1 6 0.83 42.1 41 0.83 40.7 7 0.43 44.9 42 0.83 42.1 8 0.43 51.9 43 0.83 43.5 9 0.83 46.3 44 1.25 42.1
10 0.83 42.1 45 0.83 42.1 11 0.83 42.1 46 0.83 51.9 12 0.83 42.1 47 0.83 51.9 13 0.83 44.9 48 0.43 49.1 14 0.83 51.9 49 1.25 40.7 15 0.83 51.9 50 1.25 35.1 16 0.83 51.9 51 0.83 35.1 17 0.83 51.9 52 0.83 35.1 18 1.25 56.2 19 0.83 54.8 20 0.83 51.9 21 0.83 44.9 22 0.43 44.9 23 0.83 39.3 24 1.66 30.9 25 2.08 33.7 26 1.25 35.1 27 1.25 33.7 28 1.66 33.7 29 1.66 32.3 30 2.08 33.7 31 2.08 39.3 32 1.66 40.7 33 2.48 42.1 34 2.48 40.7 35 1.66 43.5
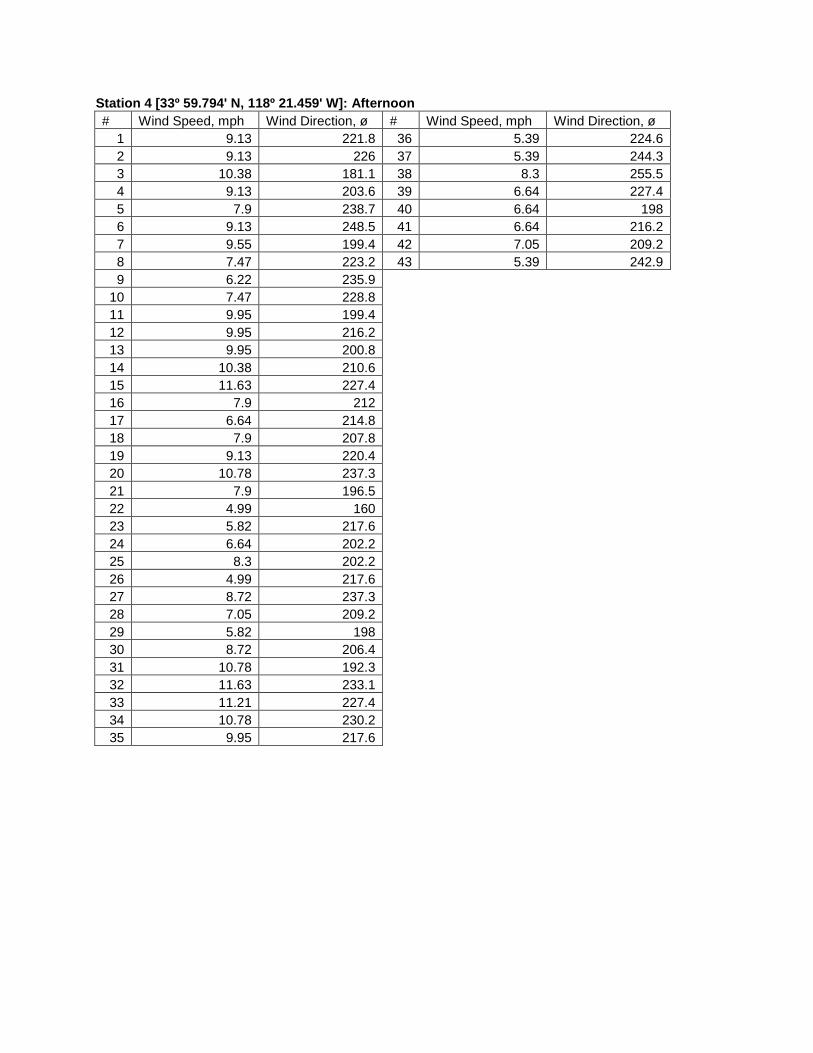
Station 4 [33º 59.794' N, 118º 21.459' W]: Afternoo n # Wind Speed, mph Wind Direction, ø # Wind Speed, mph Wind Direction, ø
1 9.13 221.8 36 5.39 224.6 2 9.13 226 37 5.39 244.3 3 10.38 181.1 38 8.3 255.5 4 9.13 203.6 39 6.64 227.4 5 7.9 238.7 40 6.64 198 6 9.13 248.5 41 6.64 216.2 7 9.55 199.4 42 7.05 209.2 8 7.47 223.2 43 5.39 242.9 9 6.22 235.9
10 7.47 228.8 11 9.95 199.4 12 9.95 216.2 13 9.95 200.8 14 10.38 210.6 15 11.63 227.4 16 7.9 212 17 6.64 214.8 18 7.9 207.8 19 9.13 220.4 20 10.78 237.3 21 7.9 196.5 22 4.99 160 23 5.82 217.6 24 6.64 202.2 25 8.3 202.2 26 4.99 217.6 27 8.72 237.3 28 7.05 209.2 29 5.82 198 30 8.72 206.4 31 10.78 192.3 32 11.63 233.1 33 11.21 227.4 34 10.78 230.2 35 9.95 217.6
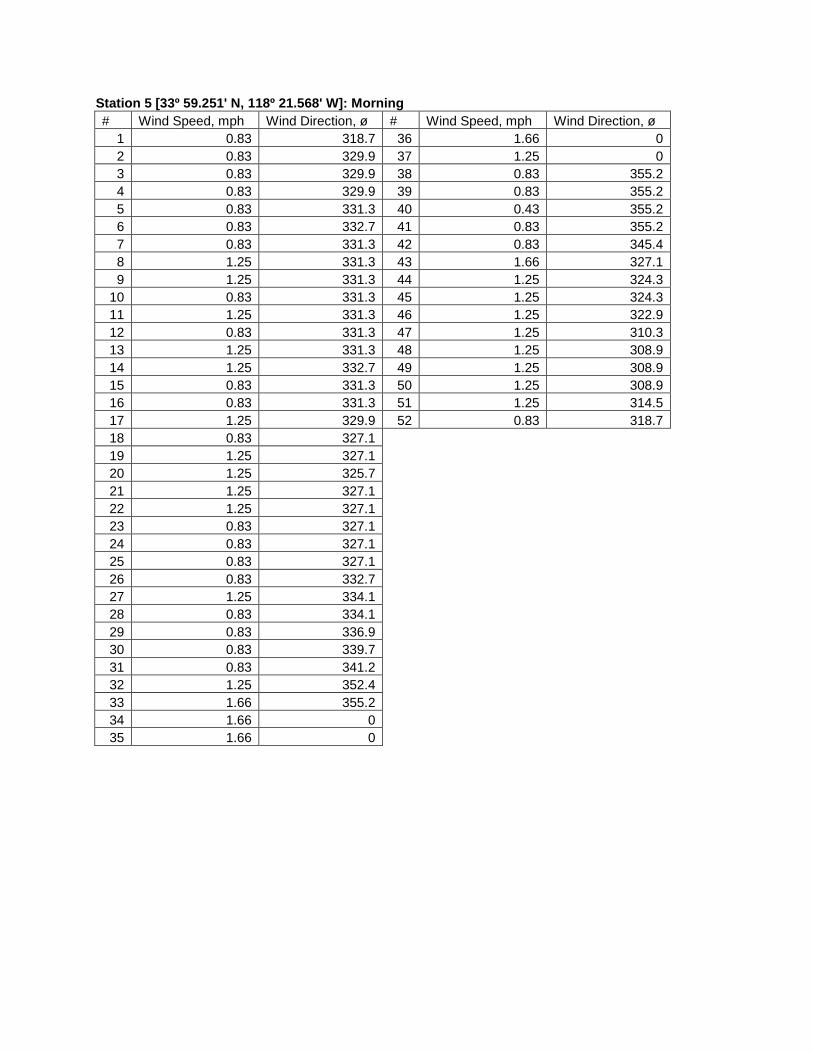
Station 5 [33º 59.251' N, 118º 21.568' W]: Morning # Wind Speed, mph Wind Direction, ø # Wind Speed, mph Wind Direction, ø
1 0.83 318.7 36 1.66 0 2 0.83 329.9 37 1.25 0 3 0.83 329.9 38 0.83 355.2 4 0.83 329.9 39 0.83 355.2 5 0.83 331.3 40 0.43 355.2 6 0.83 332.7 41 0.83 355.2 7 0.83 331.3 42 0.83 345.4 8 1.25 331.3 43 1.66 327.1 9 1.25 331.3 44 1.25 324.3
10 0.83 331.3 45 1.25 324.3 11 1.25 331.3 46 1.25 322.9 12 0.83 331.3 47 1.25 310.3 13 1.25 331.3 48 1.25 308.9 14 1.25 332.7 49 1.25 308.9 15 0.83 331.3 50 1.25 308.9 16 0.83 331.3 51 1.25 314.5 17 1.25 329.9 52 0.83 318.7 18 0.83 327.1 19 1.25 327.1 20 1.25 325.7 21 1.25 327.1 22 1.25 327.1 23 0.83 327.1 24 0.83 327.1 25 0.83 327.1 26 0.83 332.7 27 1.25 334.1 28 0.83 334.1 29 0.83 336.9 30 0.83 339.7 31 0.83 341.2 32 1.25 352.4 33 1.66 355.2 34 1.66 0 35 1.66 0

Station 5 [33º 59.251' N, 118º 21.568' W]: Afternoo n # Wind Speed, mph Wind Direction, ø # Wind Speed, mph Wind Direction, ø
1 2.91 195.1 36 3.31 192.3 2 3.31 224.6 37 4.16 174.1 3 1.66 227.4 38 3.31 203.6 4 2.08 213.4 39 2.91 216.2 5 2.48 183.9 40 2.48 182.5 6 1.66 168.5 41 2.08 178.3 7 3.31 178.3 42 1.66 196.5 8 2.91 172.7 43 2.48 217.6 9 3.31 195.1 44 2.91 198
10 2.91 227.4 45 3.74 176.9 11 2.48 255.5 46 4.56 189.5 12 2.91 235.9 47 2.48 182.5 13 2.91 206.4 48 2.91 192.3 14 2.91 196.5 49 2.91 176.9 15 2.48 183.9 50 2.91 178.3 16 4.16 198 17 2.48 168.5 18 3.74 199.4 19 3.31 199.4 20 2.91 185.3 21 2.48 172.7 22 2.08 172.7 23 3.31 186.7 24 3.74 185.3 25 2.91 181.1 26 2.48 179.7 27 2.91 175.5 28 2.91 190.9 29 4.16 220.4 30 4.16 192.3 31 4.16 196.5 32 2.91 182.5 33 3.74 188.1 34 2.91 181.1 35 2.08 199.4
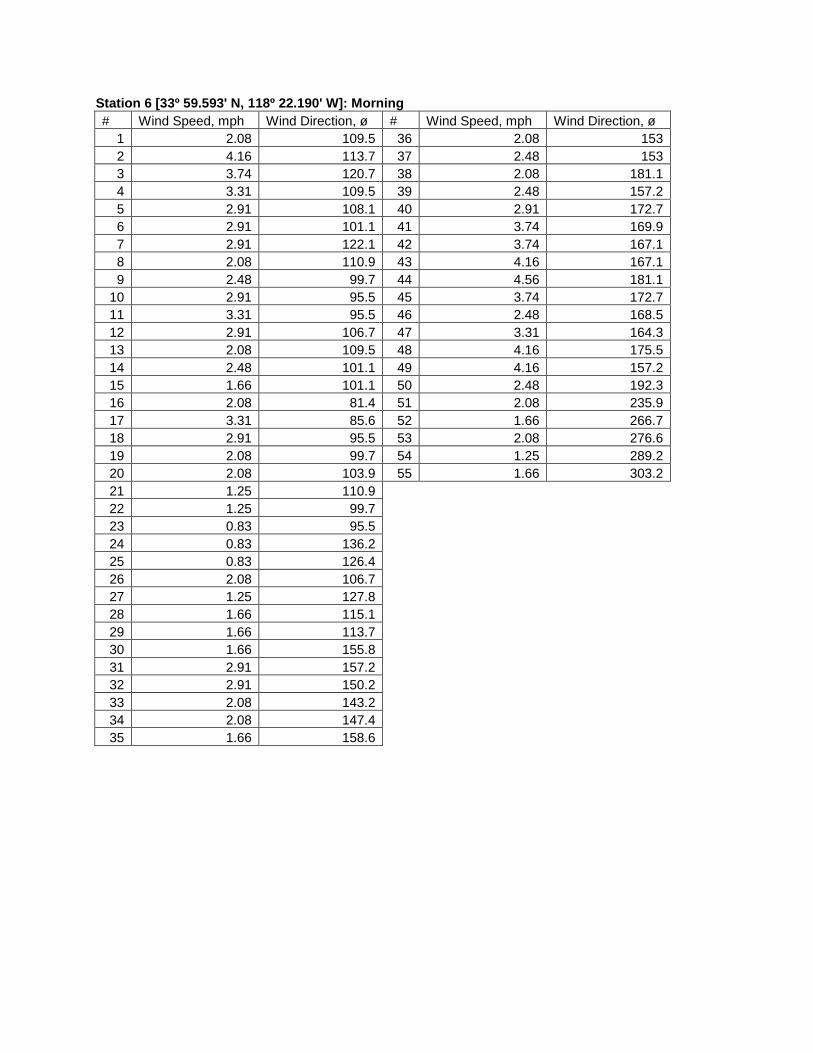
Station 6 [33º 59.593' N, 118º 22.190' W]: Morning # Wind Speed, mph Wind Direction, ø # Wind Speed, mph Wind Direction, ø
1 2.08 109.5 36 2.08 153 2 4.16 113.7 37 2.48 153 3 3.74 120.7 38 2.08 181.1 4 3.31 109.5 39 2.48 157.2 5 2.91 108.1 40 2.91 172.7 6 2.91 101.1 41 3.74 169.9 7 2.91 122.1 42 3.74 167.1 8 2.08 110.9 43 4.16 167.1 9 2.48 99.7 44 4.56 181.1
10 2.91 95.5 45 3.74 172.7 11 3.31 95.5 46 2.48 168.5 12 2.91 106.7 47 3.31 164.3 13 2.08 109.5 48 4.16 175.5 14 2.48 101.1 49 4.16 157.2 15 1.66 101.1 50 2.48 192.3 16 2.08 81.4 51 2.08 235.9 17 3.31 85.6 52 1.66 266.7 18 2.91 95.5 53 2.08 276.6 19 2.08 99.7 54 1.25 289.2 20 2.08 103.9 55 1.66 303.2 21 1.25 110.9 22 1.25 99.7 23 0.83 95.5 24 0.83 136.2 25 0.83 126.4 26 2.08 106.7 27 1.25 127.8 28 1.66 115.1 29 1.66 113.7 30 1.66 155.8 31 2.91 157.2 32 2.91 150.2 33 2.08 143.2 34 2.08 147.4 35 1.66 158.6
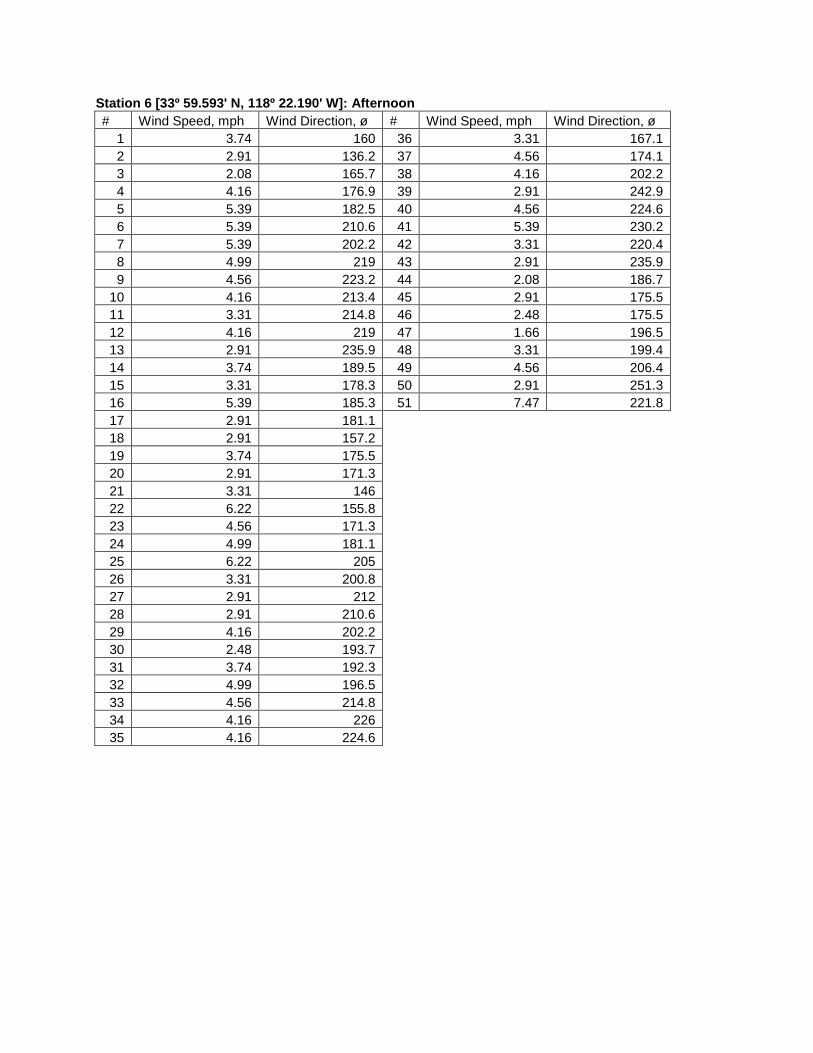
Station 6 [33º 59.593' N, 118º 22.190' W]: Afternoo n # Wind Speed, mph Wind Direction, ø # Wind Speed, mph Wind Direction, ø
1 3.74 160 36 3.31 167.1 2 2.91 136.2 37 4.56 174.1 3 2.08 165.7 38 4.16 202.2 4 4.16 176.9 39 2.91 242.9 5 5.39 182.5 40 4.56 224.6 6 5.39 210.6 41 5.39 230.2 7 5.39 202.2 42 3.31 220.4 8 4.99 219 43 2.91 235.9 9 4.56 223.2 44 2.08 186.7
10 4.16 213.4 45 2.91 175.5 11 3.31 214.8 46 2.48 175.5 12 4.16 219 47 1.66 196.5 13 2.91 235.9 48 3.31 199.4 14 3.74 189.5 49 4.56 206.4 15 3.31 178.3 50 2.91 251.3 16 5.39 185.3 51 7.47 221.8 17 2.91 181.1 18 2.91 157.2 19 3.74 175.5 20 2.91 171.3 21 3.31 146 22 6.22 155.8 23 4.56 171.3 24 4.99 181.1 25 6.22 205 26 3.31 200.8 27 2.91 212 28 2.91 210.6 29 4.16 202.2 30 2.48 193.7 31 3.74 192.3 32 4.99 196.5 33 4.56 214.8 34 4.16 226 35 4.16 224.6
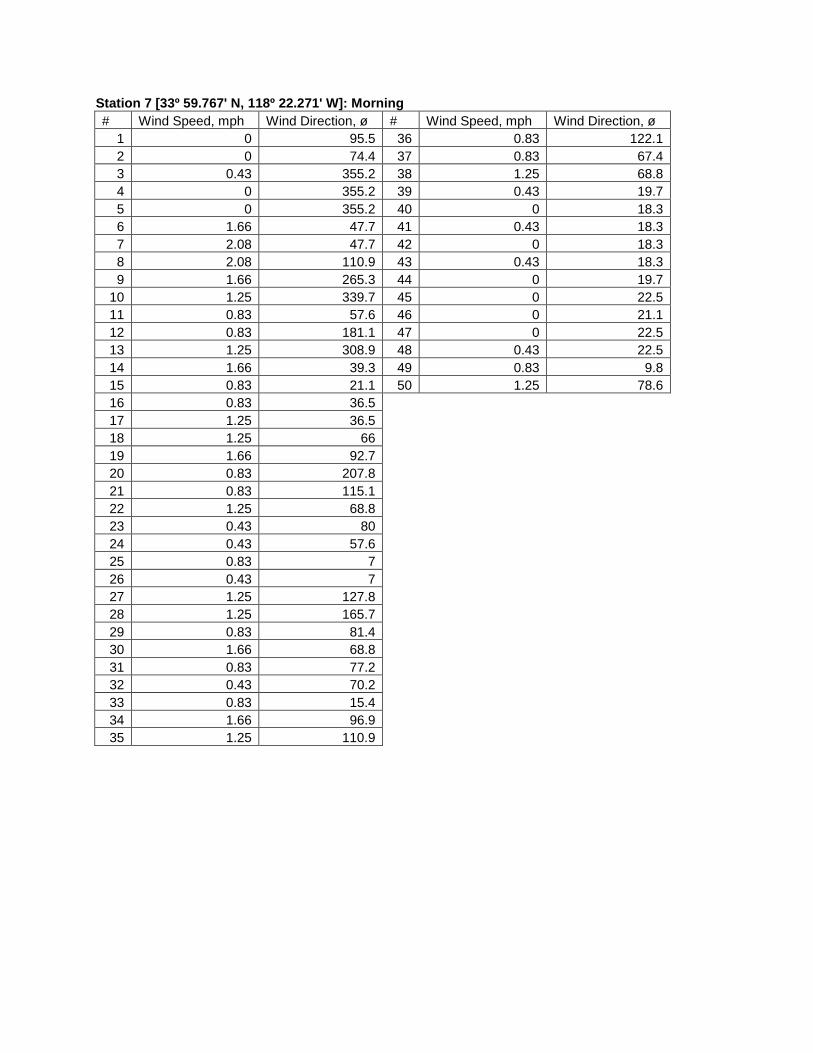
Station 7 [33º 59.767' N, 118º 22.271' W]: Morning # Wind Speed, mph Wind Direction, ø # Wind Speed, mph Wind Direction, ø
1 0 95.5 36 0.83 122.1 2 0 74.4 37 0.83 67.4 3 0.43 355.2 38 1.25 68.8 4 0 355.2 39 0.43 19.7 5 0 355.2 40 0 18.3 6 1.66 47.7 41 0.43 18.3 7 2.08 47.7 42 0 18.3 8 2.08 110.9 43 0.43 18.3 9 1.66 265.3 44 0 19.7
10 1.25 339.7 45 0 22.5 11 0.83 57.6 46 0 21.1 12 0.83 181.1 47 0 22.5 13 1.25 308.9 48 0.43 22.5 14 1.66 39.3 49 0.83 9.8 15 0.83 21.1 50 1.25 78.6 16 0.83 36.5 17 1.25 36.5 18 1.25 66 19 1.66 92.7 20 0.83 207.8 21 0.83 115.1 22 1.25 68.8 23 0.43 80 24 0.43 57.6 25 0.83 7 26 0.43 7 27 1.25 127.8 28 1.25 165.7 29 0.83 81.4 30 1.66 68.8 31 0.83 77.2 32 0.43 70.2 33 0.83 15.4 34 1.66 96.9 35 1.25 110.9
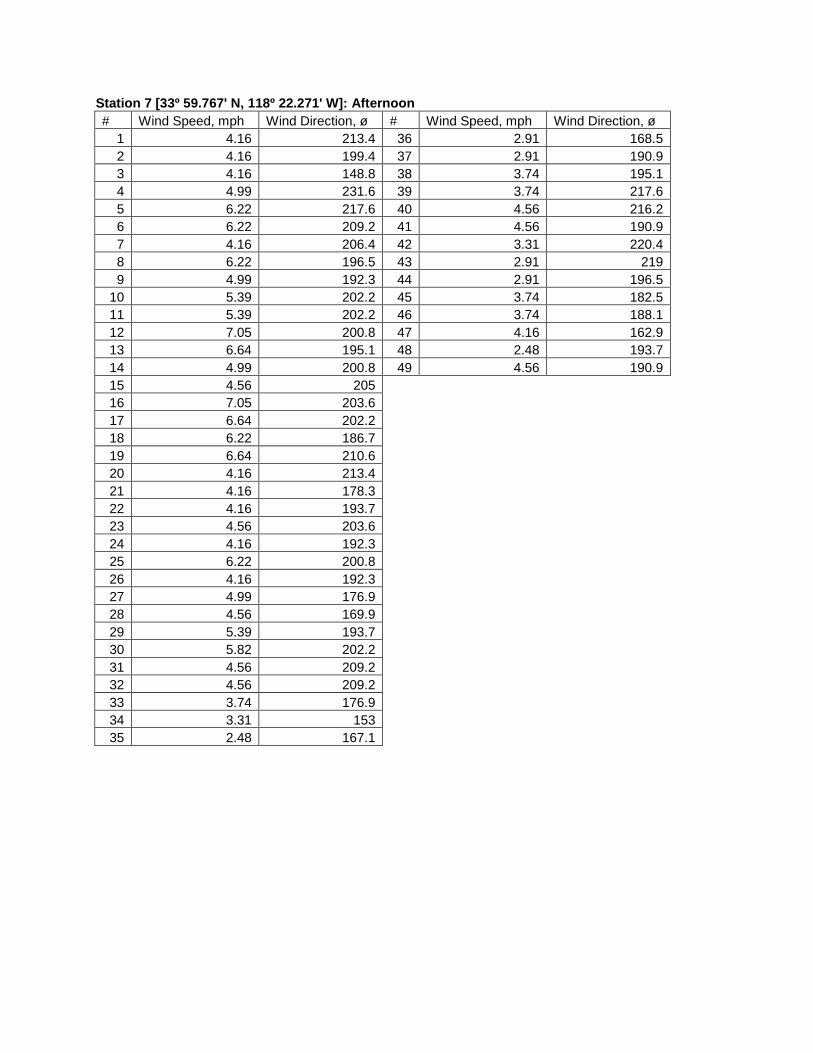
Station 7 [33º 59.767' N, 118º 22.271' W]: Afternoo n # Wind Speed, mph Wind Direction, ø # Wind Speed, mph Wind Direction, ø
1 4.16 213.4 36 2.91 168.5 2 4.16 199.4 37 2.91 190.9 3 4.16 148.8 38 3.74 195.1 4 4.99 231.6 39 3.74 217.6 5 6.22 217.6 40 4.56 216.2 6 6.22 209.2 41 4.56 190.9 7 4.16 206.4 42 3.31 220.4 8 6.22 196.5 43 2.91 219 9 4.99 192.3 44 2.91 196.5
10 5.39 202.2 45 3.74 182.5 11 5.39 202.2 46 3.74 188.1 12 7.05 200.8 47 4.16 162.9 13 6.64 195.1 48 2.48 193.7 14 4.99 200.8 49 4.56 190.9 15 4.56 205 16 7.05 203.6 17 6.64 202.2 18 6.22 186.7 19 6.64 210.6 20 4.16 213.4 21 4.16 178.3 22 4.16 193.7 23 4.56 203.6 24 4.16 192.3 25 6.22 200.8 26 4.16 192.3 27 4.99 176.9 28 4.56 169.9 29 5.39 193.7 30 5.82 202.2 31 4.56 209.2 32 4.56 209.2 33 3.74 176.9 34 3.31 153 35 2.48 167.1
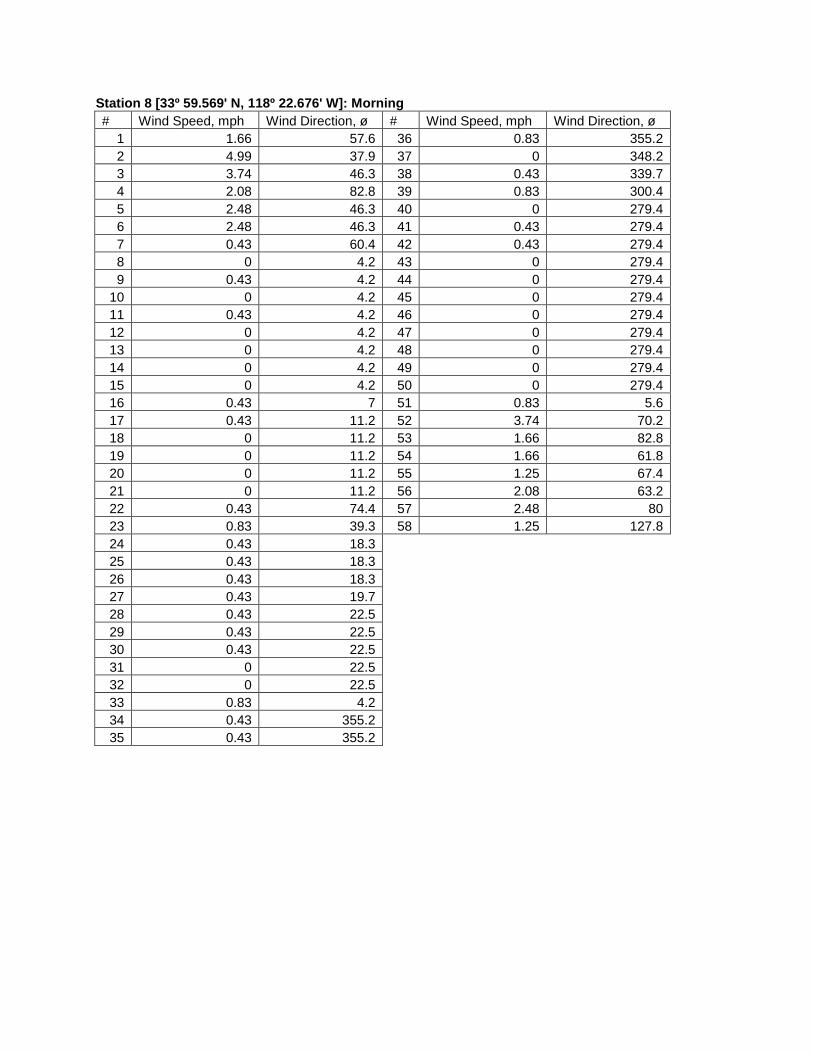
Station 8 [33º 59.569' N, 118º 22.676' W]: Morning # Wind Speed, mph Wind Direction, ø # Wind Speed, mph Wind Direction, ø
1 1.66 57.6 36 0.83 355.2 2 4.99 37.9 37 0 348.2 3 3.74 46.3 38 0.43 339.7 4 2.08 82.8 39 0.83 300.4 5 2.48 46.3 40 0 279.4 6 2.48 46.3 41 0.43 279.4 7 0.43 60.4 42 0.43 279.4 8 0 4.2 43 0 279.4 9 0.43 4.2 44 0 279.4
10 0 4.2 45 0 279.4 11 0.43 4.2 46 0 279.4 12 0 4.2 47 0 279.4 13 0 4.2 48 0 279.4 14 0 4.2 49 0 279.4 15 0 4.2 50 0 279.4 16 0.43 7 51 0.83 5.6 17 0.43 11.2 52 3.74 70.2 18 0 11.2 53 1.66 82.8 19 0 11.2 54 1.66 61.8 20 0 11.2 55 1.25 67.4 21 0 11.2 56 2.08 63.2 22 0.43 74.4 57 2.48 80 23 0.83 39.3 58 1.25 127.8 24 0.43 18.3 25 0.43 18.3 26 0.43 18.3 27 0.43 19.7 28 0.43 22.5 29 0.43 22.5 30 0.43 22.5 31 0 22.5 32 0 22.5 33 0.83 4.2 34 0.43 355.2 35 0.43 355.2
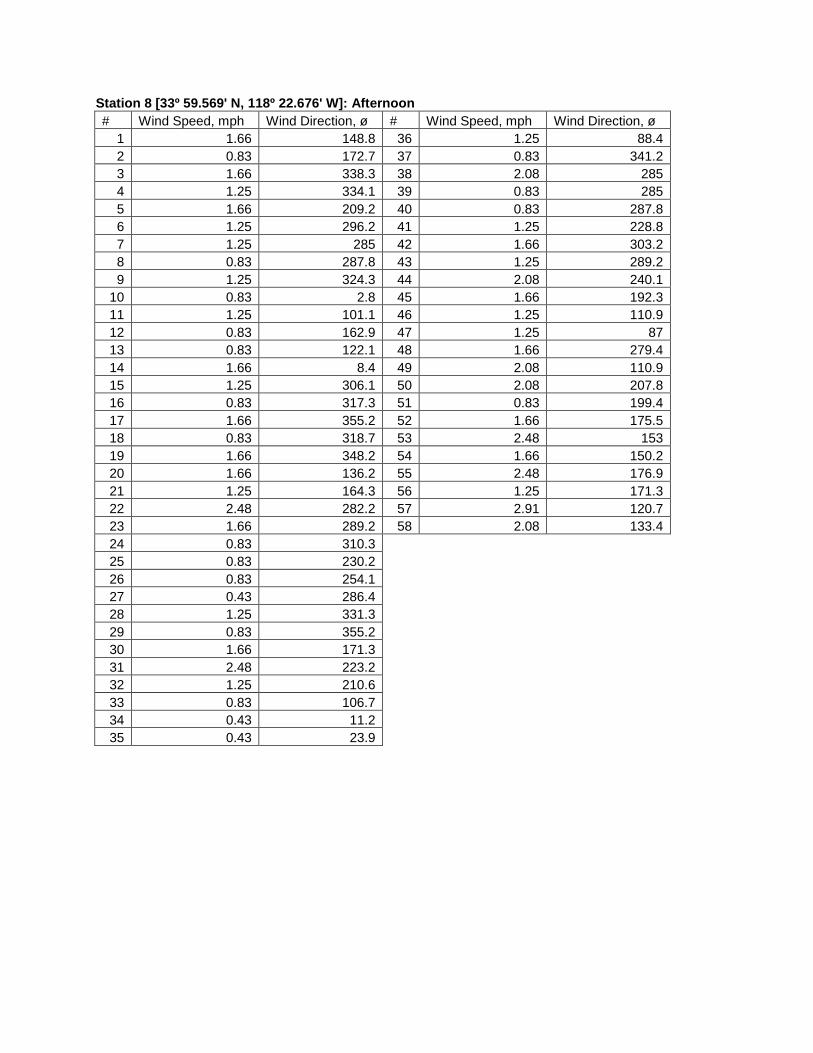
Station 8 [33º 59.569' N, 118º 22.676' W]: Afternoo n # Wind Speed, mph Wind Direction, ø # Wind Speed, mph Wind Direction, ø
1 1.66 148.8 36 1.25 88.4 2 0.83 172.7 37 0.83 341.2 3 1.66 338.3 38 2.08 285 4 1.25 334.1 39 0.83 285 5 1.66 209.2 40 0.83 287.8 6 1.25 296.2 41 1.25 228.8 7 1.25 285 42 1.66 303.2 8 0.83 287.8 43 1.25 289.2 9 1.25 324.3 44 2.08 240.1
10 0.83 2.8 45 1.66 192.3 11 1.25 101.1 46 1.25 110.9 12 0.83 162.9 47 1.25 87 13 0.83 122.1 48 1.66 279.4 14 1.66 8.4 49 2.08 110.9 15 1.25 306.1 50 2.08 207.8 16 0.83 317.3 51 0.83 199.4 17 1.66 355.2 52 1.66 175.5 18 0.83 318.7 53 2.48 153 19 1.66 348.2 54 1.66 150.2 20 1.66 136.2 55 2.48 176.9 21 1.25 164.3 56 1.25 171.3 22 2.48 282.2 57 2.91 120.7 23 1.66 289.2 58 2.08 133.4 24 0.83 310.3 25 0.83 230.2 26 0.83 254.1 27 0.43 286.4 28 1.25 331.3 29 0.83 355.2 30 1.66 171.3 31 2.48 223.2 32 1.25 210.6 33 0.83 106.7 34 0.43 11.2 35 0.43 23.9
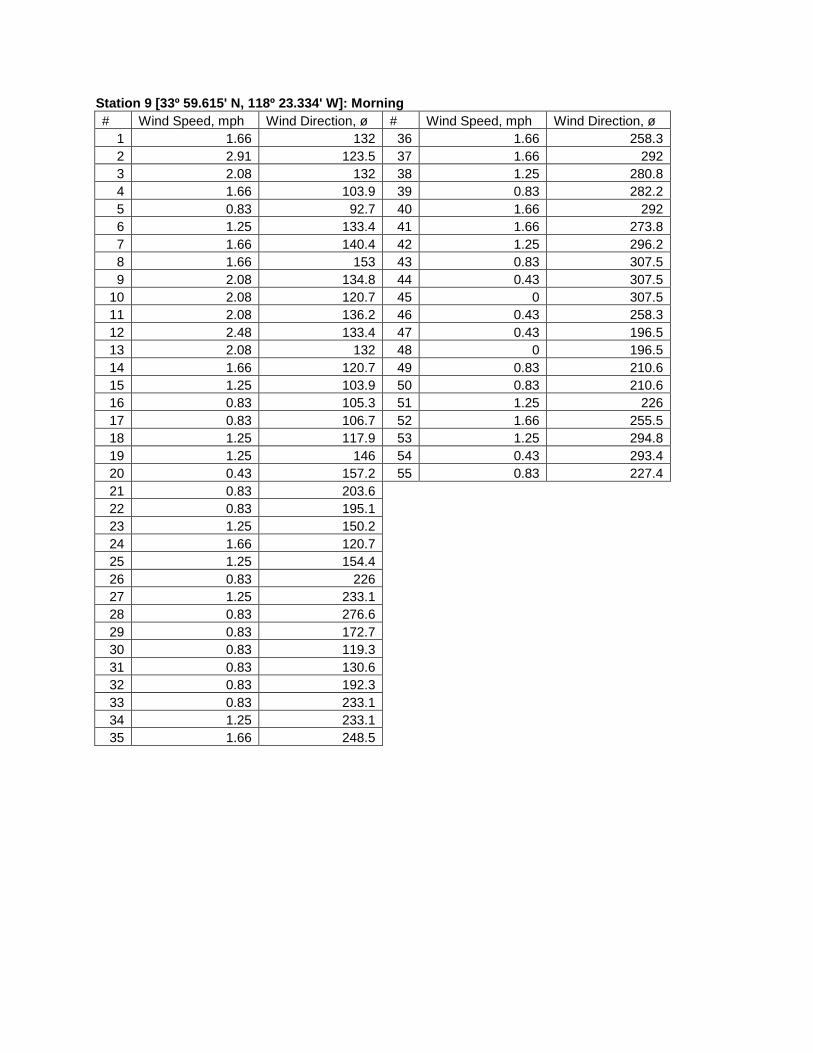
Station 9 [33º 59.615' N, 118º 23.334' W]: Morning # Wind Speed, mph Wind Direction, ø # Wind Speed, mph Wind Direction, ø
1 1.66 132 36 1.66 258.3 2 2.91 123.5 37 1.66 292 3 2.08 132 38 1.25 280.8 4 1.66 103.9 39 0.83 282.2 5 0.83 92.7 40 1.66 292 6 1.25 133.4 41 1.66 273.8 7 1.66 140.4 42 1.25 296.2 8 1.66 153 43 0.83 307.5 9 2.08 134.8 44 0.43 307.5
10 2.08 120.7 45 0 307.5 11 2.08 136.2 46 0.43 258.3 12 2.48 133.4 47 0.43 196.5 13 2.08 132 48 0 196.5 14 1.66 120.7 49 0.83 210.6 15 1.25 103.9 50 0.83 210.6 16 0.83 105.3 51 1.25 226 17 0.83 106.7 52 1.66 255.5 18 1.25 117.9 53 1.25 294.8 19 1.25 146 54 0.43 293.4 20 0.43 157.2 55 0.83 227.4 21 0.83 203.6 22 0.83 195.1 23 1.25 150.2 24 1.66 120.7 25 1.25 154.4 26 0.83 226 27 1.25 233.1 28 0.83 276.6 29 0.83 172.7 30 0.83 119.3 31 0.83 130.6 32 0.83 192.3 33 0.83 233.1 34 1.25 233.1 35 1.66 248.5
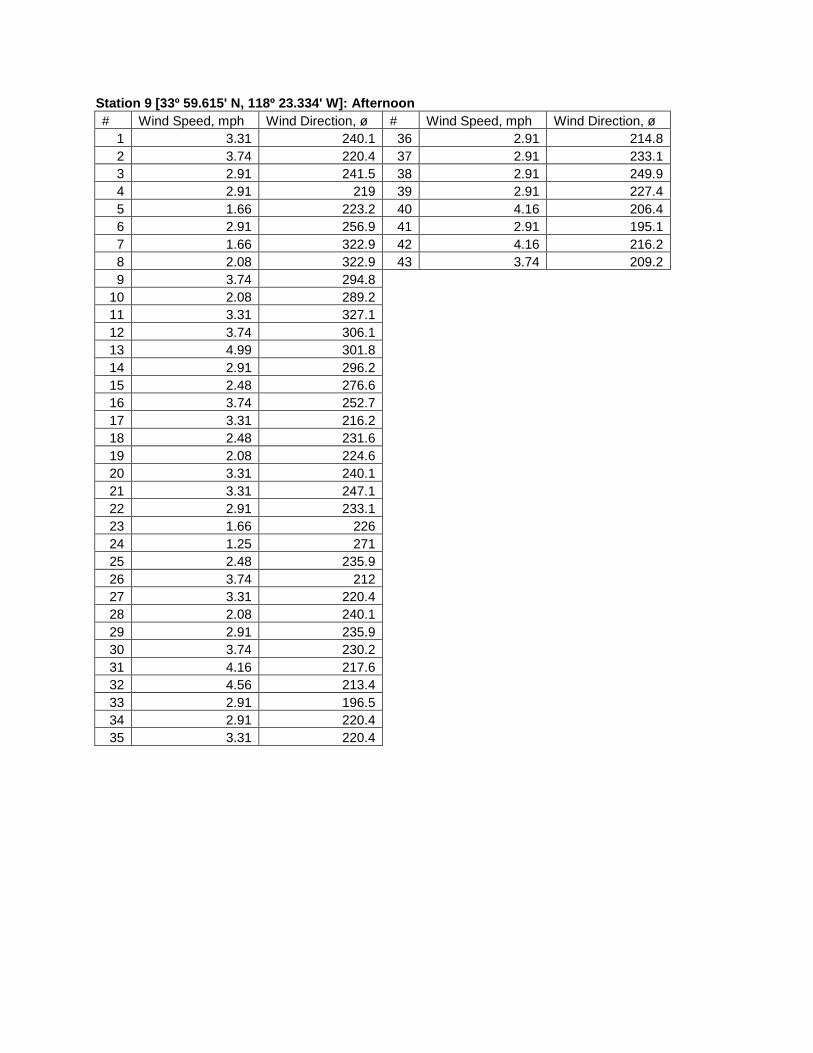
Station 9 [33º 59.615' N, 118º 23.334' W]: Afternoo n # Wind Speed, mph Wind Direction, ø # Wind Speed, mph Wind Direction, ø
1 3.31 240.1 36 2.91 214.8 2 3.74 220.4 37 2.91 233.1 3 2.91 241.5 38 2.91 249.9 4 2.91 219 39 2.91 227.4 5 1.66 223.2 40 4.16 206.4 6 2.91 256.9 41 2.91 195.1 7 1.66 322.9 42 4.16 216.2 8 2.08 322.9 43 3.74 209.2 9 3.74 294.8
10 2.08 289.2 11 3.31 327.1 12 3.74 306.1 13 4.99 301.8 14 2.91 296.2 15 2.48 276.6 16 3.74 252.7 17 3.31 216.2 18 2.48 231.6 19 2.08 224.6 20 3.31 240.1 21 3.31 247.1 22 2.91 233.1 23 1.66 226 24 1.25 271 25 2.48 235.9 26 3.74 212 27 3.31 220.4 28 2.08 240.1 29 2.91 235.9 30 3.74 230.2 31 4.16 217.6 32 4.56 213.4 33 2.91 196.5 34 2.91 220.4 35 3.31 220.4
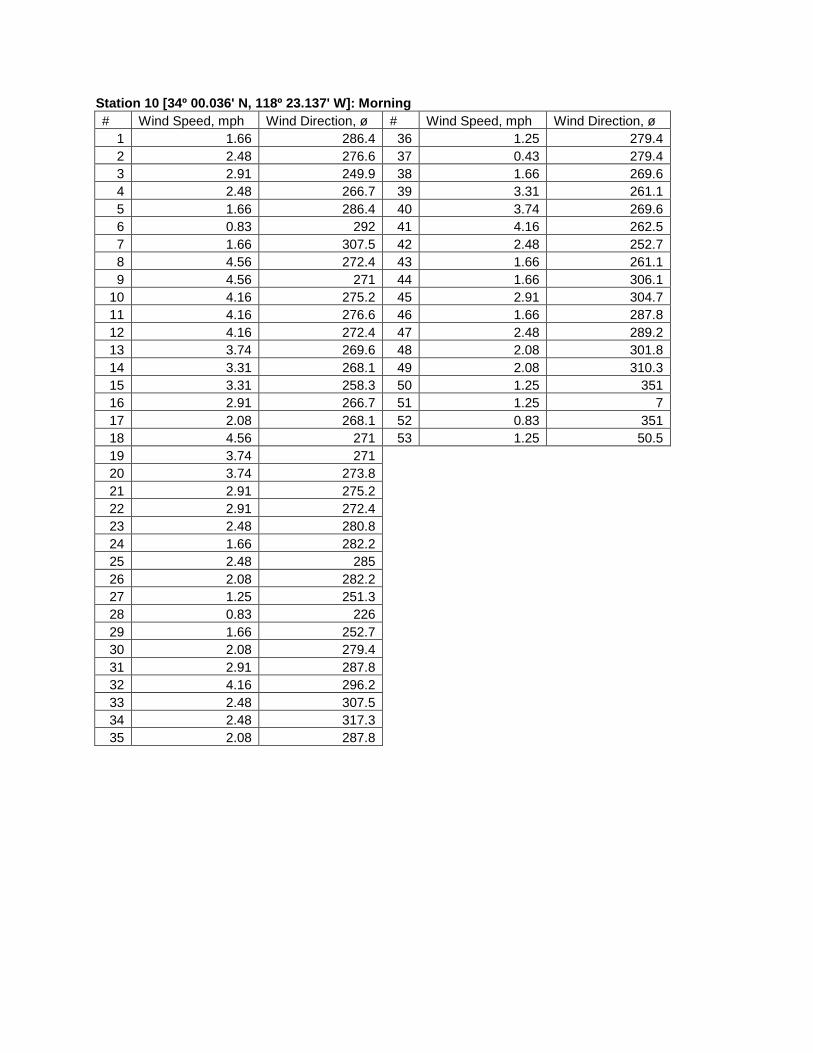
Station 10 [34º 00.036' N, 118º 23.137' W]: Morning # Wind Speed, mph Wind Direction, ø # Wind Speed, mph Wind Direction, ø
1 1.66 286.4 36 1.25 279.4 2 2.48 276.6 37 0.43 279.4 3 2.91 249.9 38 1.66 269.6 4 2.48 266.7 39 3.31 261.1 5 1.66 286.4 40 3.74 269.6 6 0.83 292 41 4.16 262.5 7 1.66 307.5 42 2.48 252.7 8 4.56 272.4 43 1.66 261.1 9 4.56 271 44 1.66 306.1
10 4.16 275.2 45 2.91 304.7 11 4.16 276.6 46 1.66 287.8 12 4.16 272.4 47 2.48 289.2 13 3.74 269.6 48 2.08 301.8 14 3.31 268.1 49 2.08 310.3 15 3.31 258.3 50 1.25 351 16 2.91 266.7 51 1.25 7 17 2.08 268.1 52 0.83 351 18 4.56 271 53 1.25 50.5 19 3.74 271 20 3.74 273.8 21 2.91 275.2 22 2.91 272.4 23 2.48 280.8 24 1.66 282.2 25 2.48 285 26 2.08 282.2 27 1.25 251.3 28 0.83 226 29 1.66 252.7 30 2.08 279.4 31 2.91 287.8 32 4.16 296.2 33 2.48 307.5 34 2.48 317.3 35 2.08 287.8
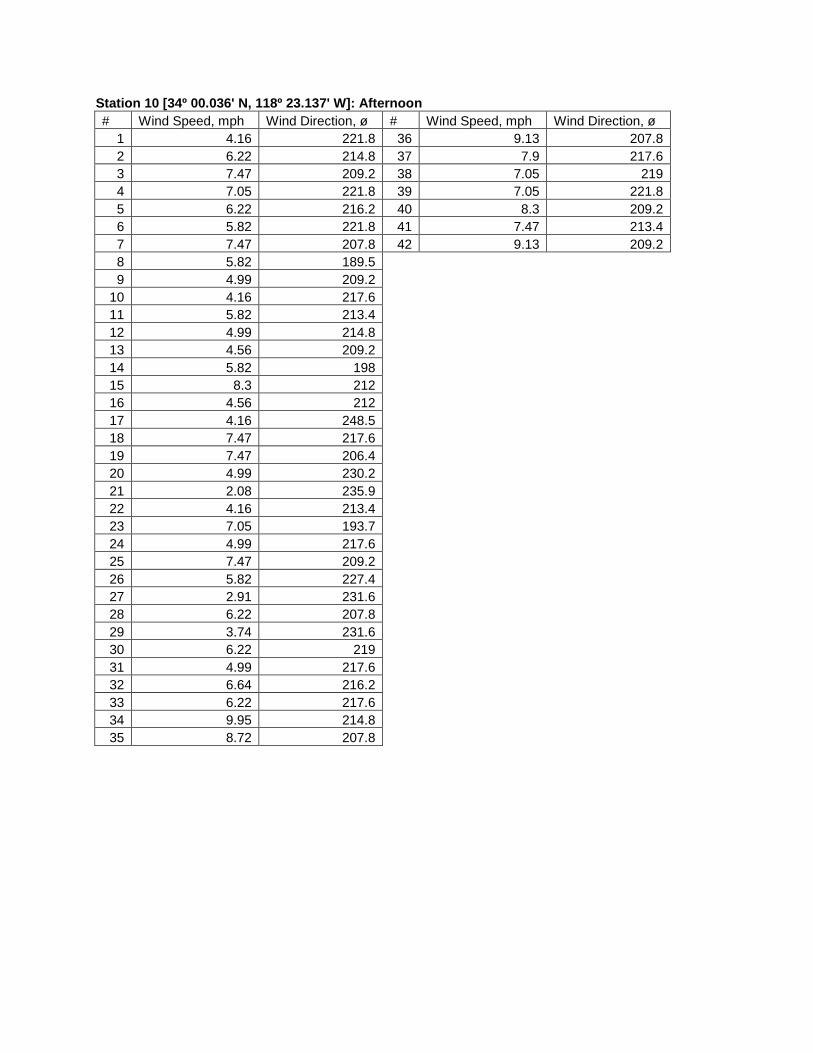
Station 10 [34º 00.036' N, 118º 23.137' W]: Afterno on # Wind Speed, mph Wind Direction, ø # Wind Speed, mph Wind Direction, ø
1 4.16 221.8 36 9.13 207.8 2 6.22 214.8 37 7.9 217.6 3 7.47 209.2 38 7.05 219 4 7.05 221.8 39 7.05 221.8 5 6.22 216.2 40 8.3 209.2 6 5.82 221.8 41 7.47 213.4 7 7.47 207.8 42 9.13 209.2 8 5.82 189.5 9 4.99 209.2
10 4.16 217.6 11 5.82 213.4 12 4.99 214.8 13 4.56 209.2 14 5.82 198 15 8.3 212 16 4.56 212 17 4.16 248.5 18 7.47 217.6 19 7.47 206.4 20 4.99 230.2 21 2.08 235.9 22 4.16 213.4 23 7.05 193.7 24 4.99 217.6 25 7.47 209.2 26 5.82 227.4 27 2.91 231.6 28 6.22 207.8 29 3.74 231.6 30 6.22 219 31 4.99 217.6 32 6.64 216.2 33 6.22 217.6 34 9.95 214.8 35 8.72 207.8
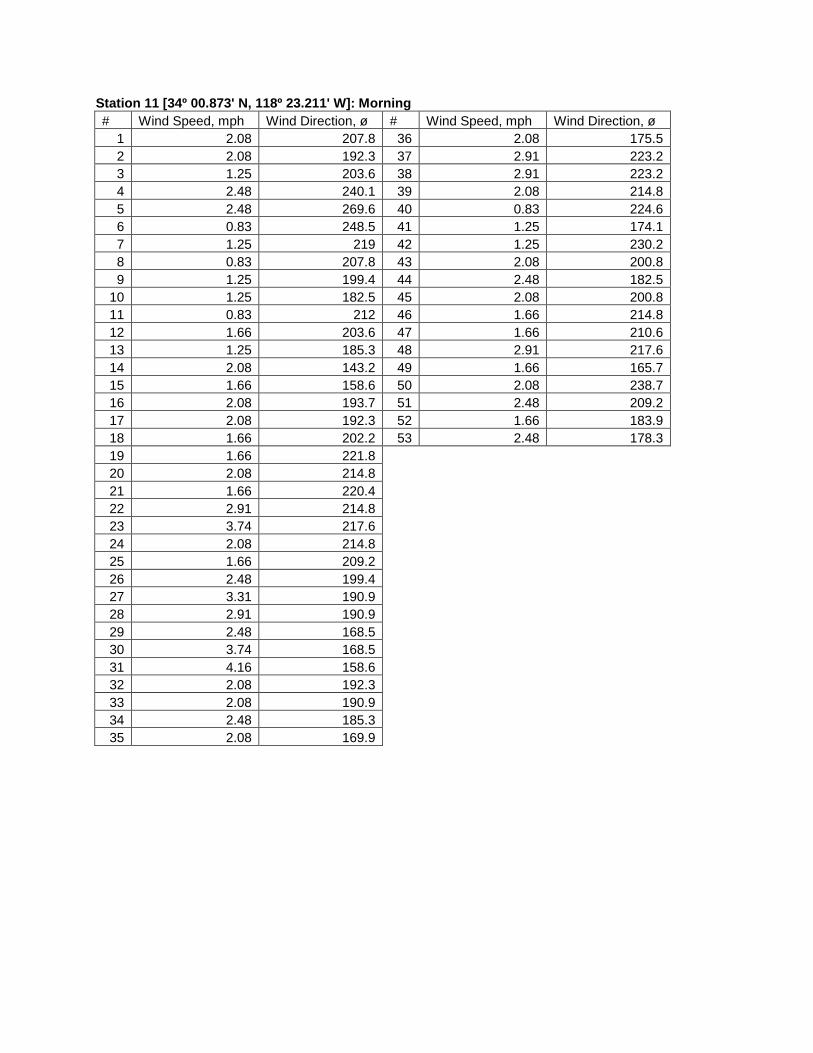
Station 11 [34º 00.873' N, 118º 23.211' W]: Morning # Wind Speed, mph Wind Direction, ø # Wind Speed, mph Wind Direction, ø
1 2.08 207.8 36 2.08 175.5 2 2.08 192.3 37 2.91 223.2 3 1.25 203.6 38 2.91 223.2 4 2.48 240.1 39 2.08 214.8 5 2.48 269.6 40 0.83 224.6 6 0.83 248.5 41 1.25 174.1 7 1.25 219 42 1.25 230.2 8 0.83 207.8 43 2.08 200.8 9 1.25 199.4 44 2.48 182.5
10 1.25 182.5 45 2.08 200.8 11 0.83 212 46 1.66 214.8 12 1.66 203.6 47 1.66 210.6 13 1.25 185.3 48 2.91 217.6 14 2.08 143.2 49 1.66 165.7 15 1.66 158.6 50 2.08 238.7 16 2.08 193.7 51 2.48 209.2 17 2.08 192.3 52 1.66 183.9 18 1.66 202.2 53 2.48 178.3 19 1.66 221.8 20 2.08 214.8 21 1.66 220.4 22 2.91 214.8 23 3.74 217.6 24 2.08 214.8 25 1.66 209.2 26 2.48 199.4 27 3.31 190.9 28 2.91 190.9 29 2.48 168.5 30 3.74 168.5 31 4.16 158.6 32 2.08 192.3 33 2.08 190.9 34 2.48 185.3 35 2.08 169.9
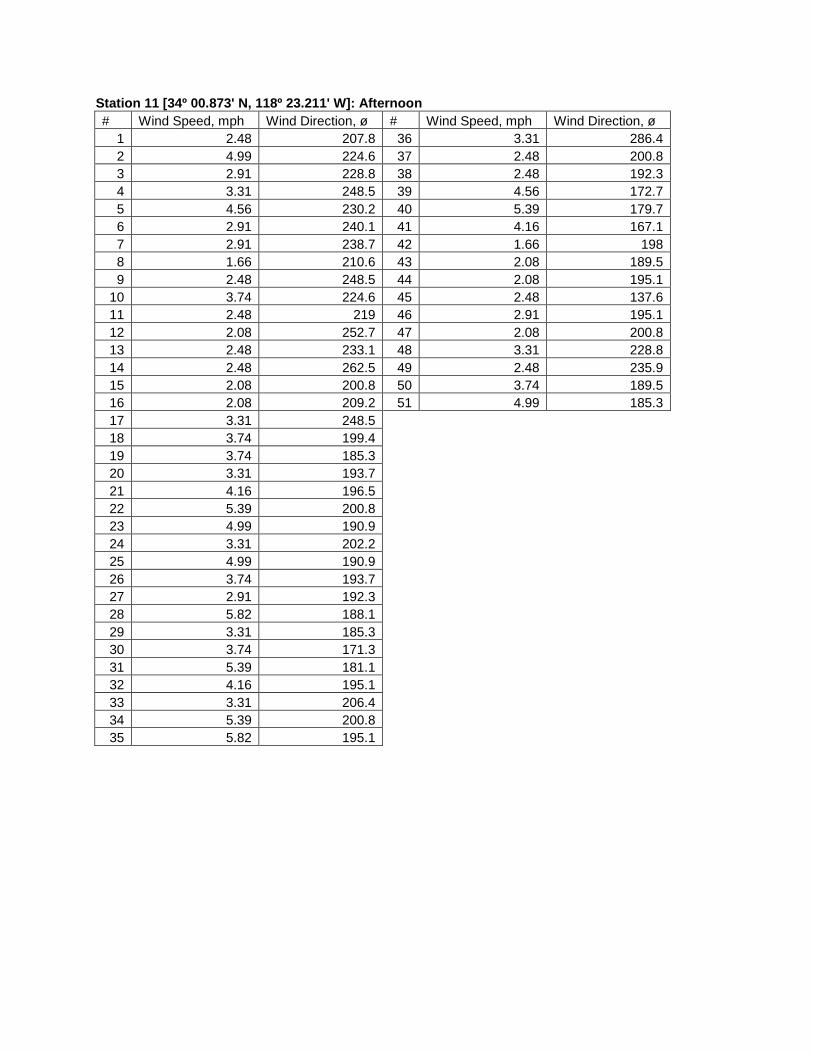
Station 11 [34º 00.873' N, 118º 23.211' W]: Afterno on # Wind Speed, mph Wind Direction, ø # Wind Speed, mph Wind Direction, ø
1 2.48 207.8 36 3.31 286.4 2 4.99 224.6 37 2.48 200.8 3 2.91 228.8 38 2.48 192.3 4 3.31 248.5 39 4.56 172.7 5 4.56 230.2 40 5.39 179.7 6 2.91 240.1 41 4.16 167.1 7 2.91 238.7 42 1.66 198 8 1.66 210.6 43 2.08 189.5 9 2.48 248.5 44 2.08 195.1
10 3.74 224.6 45 2.48 137.6 11 2.48 219 46 2.91 195.1 12 2.08 252.7 47 2.08 200.8 13 2.48 233.1 48 3.31 228.8 14 2.48 262.5 49 2.48 235.9 15 2.08 200.8 50 3.74 189.5 16 2.08 209.2 51 4.99 185.3 17 3.31 248.5 18 3.74 199.4 19 3.74 185.3 20 3.31 193.7 21 4.16 196.5 22 5.39 200.8 23 4.99 190.9 24 3.31 202.2 25 4.99 190.9 26 3.74 193.7 27 2.91 192.3 28 5.82 188.1 29 3.31 185.3 30 3.74 171.3 31 5.39 181.1 32 4.16 195.1 33 3.31 206.4 34 5.39 200.8 35 5.82 195.1

Station 12 [34º 00.886' N, 118º 22.630' W]: Morning # Wind Speed, mph Wind Direction, ø # Wind Speed, mph Wind Direction, ø
1 2.08 47.7 36 1.66 33.7 2 1.66 32.3 37 1.25 42.1 3 2.48 36.5 38 1.25 40.7 4 3.31 35.1 39 1.25 14 5 2.91 5.6 40 0.43 341.2 6 1.66 5.6 41 1.66 18.3 7 2.48 44.9 42 1.66 19.7 8 2.48 43.5 43 1.66 11.2 9 2.48 46.3 44 1.25 25.3
10 2.48 46.3 45 1.25 15.4 11 2.48 44.9 46 0.83 11.2 12 3.31 44.9 47 0.43 11.2 13 2.91 44.9 48 1.66 355.2 14 1.66 30.9 49 0.83 331.3 15 2.08 355.2 16 2.48 353.8 17 1.66 16.8 18 2.08 22.5 19 2.08 19.7 20 2.08 40.7 21 2.08 19.7 22 2.08 21.1 23 2.08 42.1 24 2.48 44.9 25 3.31 25.3 26 2.48 1.4 27 2.08 15.4 28 1.25 35.1 29 1.25 12.6 30 2.48 7 31 2.91 19.7 32 2.08 37.9 33 1.66 47.7 34 0.83 49.1 35 1.25 44.9

Station 12 [34º 00.886' N, 118º 22.630' W]: Afterno on # Wind Speed, mph Wind Direction, ø # Wind Speed, mph Wind Direction, ø
1 5.39 217.6 36 5.39 168.5 2 4.56 202.2 37 4.56 193.7 3 5.39 186.7 38 7.9 219 4 5.39 185.3 39 7.9 240.1 5 5.39 206.4 40 6.64 224.6 6 6.64 223.2 41 5.82 193.7 7 7.9 241.5 42 3.74 195.1 8 6.22 237.3 43 3.31 192.3 9 4.16 192.3 44 3.74 195.1
10 6.64 230.2 45 3.31 228.8 11 3.74 230.2 46 1.66 231.6 12 5.39 234.5 47 2.08 198 13 8.72 228.8 48 4.56 186.7 14 6.64 213.4 49 4.16 207.8 15 6.22 237.3 50 5.82 198 16 5.39 230.2 51 5.82 193.7 17 7.47 231.6 52 5.82 202.2 18 8.3 230.2 53 5.39 206.4 19 6.22 200.8 54 3.74 185.3 20 6.64 217.6 21 5.39 210.6 22 4.16 223.2 23 4.16 210.6 24 6.22 192.3 25 6.22 212 26 5.39 205 27 5.39 214.8 28 5.39 199.4 29 4.56 217.6 30 1.66 216.2 31 2.91 160 32 4.16 161.5 33 4.16 160 34 5.39 158.6 35 3.74 176.9