Embed Size (px)
Citation preview
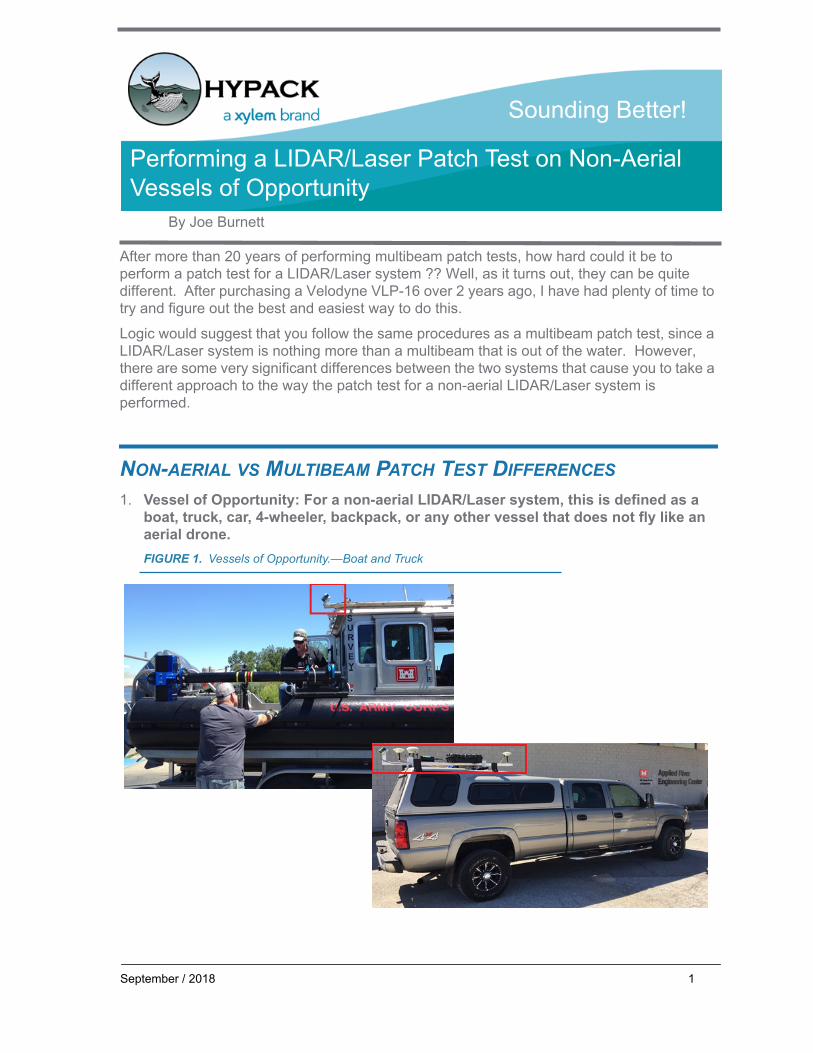
Sounding Better!
Performing a LIDAR/Laser Patch Test on Non-Aerial Vessels of Opportunity
By Joe Burnett
After more than 20 years of performing multibeam patch tests, how hard could it be to perform a patch test for a LIDAR/Laser system ?? Well, as it turns out, they can be quite different. After purchasing a Velodyne VLP-16 over 2 years ago, I have had plenty of time to try and figure out the best and easiest way to do this.
Logic would suggest that you follow the same procedures as a multibeam patch test, since a LIDAR/Laser system is nothing more than a multibeam that is out of the water. However, there are some very significant differences between the two systems that cause you to take a different approach to the way the patch test for a non-aerial LIDAR/Laser system is performed.
NON-AERIAL VS MULTIBEAM PATCH TEST DIFFERENCES1. Vessel of Opportunity: For a non-aerial LIDAR/Laser system, this is defined as a
boat, truck, car, 4-wheeler, backpack, or any other vessel that does not fly like an aerial drone.FIGURE 1. Vessels of Opportunity.—Boat and Truck
September / 2018 1
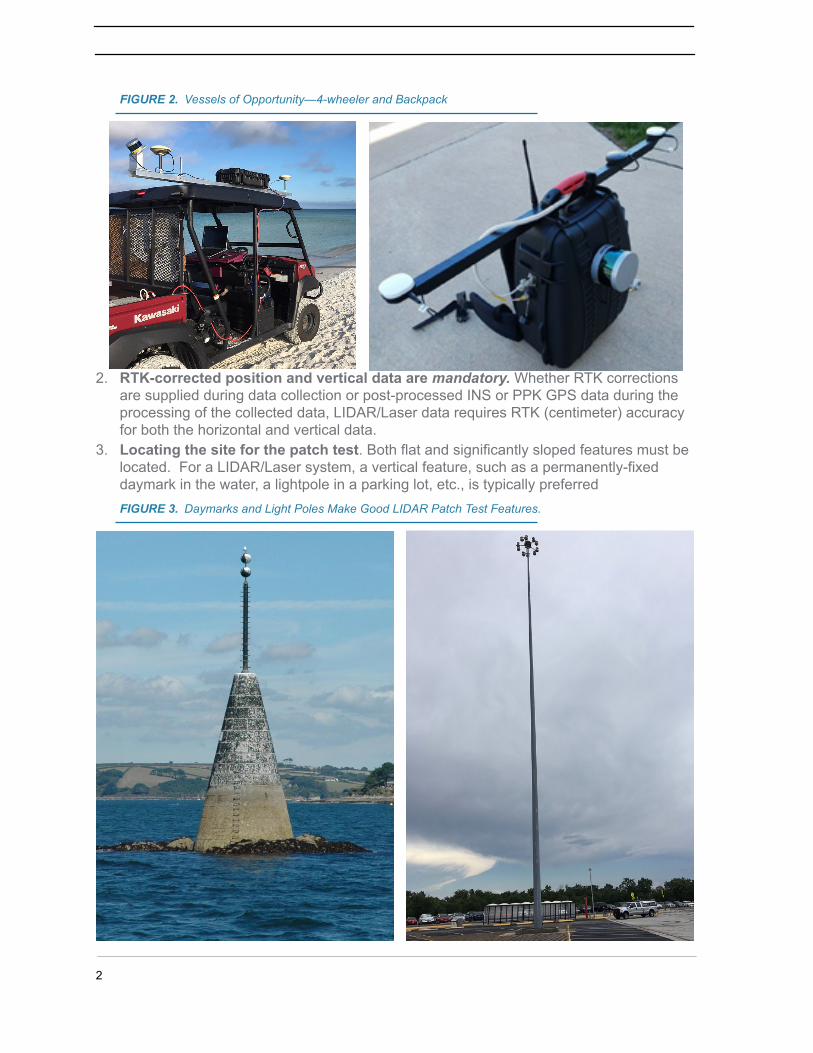
FIGURE 2. Vessels of Opportunity—4-wheeler and Backpack
2. RTK-corrected position and vertical data are mandatory. Whether RTK corrections are supplied during data collection or post-processed INS or PPK GPS data during the processing of the collected data, LIDAR/Laser data requires RTK (centimeter) accuracy for both the horizontal and vertical data.
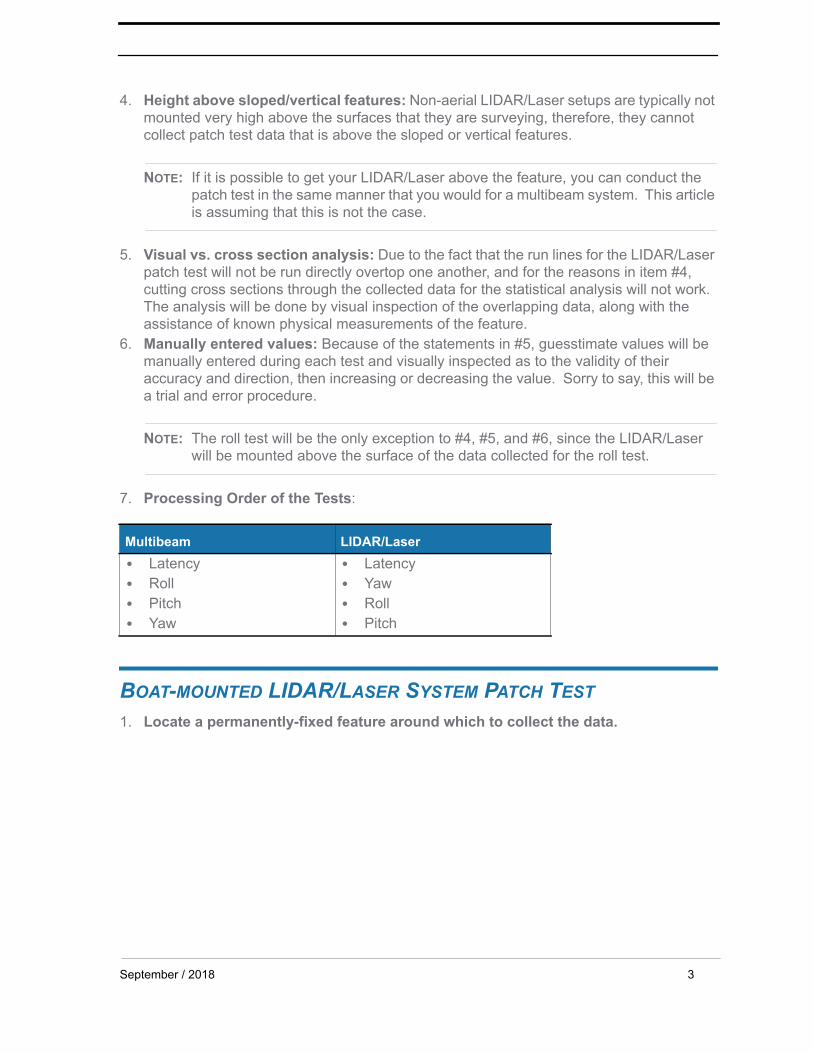
3. Locating the site for the patch test. Both flat and significantly sloped features must be located. For a LIDAR/Laser system, a vertical feature, such as a permanently-fixed daymark in the water, a lightpole in a parking lot, etc., is typically preferred FIGURE 3. Daymarks and Light Poles Make Good LIDAR Patch Test Features.
2
4. Height above sloped/vertical features: Non-aerial LIDAR/Laser setups are typically not mounted very high above the surfaces that they are surveying, therefore, they cannot collect patch test data that is above the sloped or vertical features.
NOTE: If it is possible to get your LIDAR/Laser above the feature, you can conduct the patch test in the same manner that you would for a multibeam system. This article is assuming that this is not the case.
5. Visual vs. cross section analysis: Due to the fact that the run lines for the LIDAR/Laser patch test will not be run directly overtop one another, and for the reasons in item #4, cutting cross sections through the collected data for the statistical analysis will not work. The analysis will be done by visual inspection of the overlapping data, along with the assistance of known physical measurements of the feature.
6. Manually entered values: Because of the statements in #5, guesstimate values will be manually entered during each test and visually inspected as to the validity of their accuracy and direction, then increasing or decreasing the value. Sorry to say, this will be a trial and error procedure.
NOTE: The roll test will be the only exception to #4, #5, and #6, since the LIDAR/Laser will be mounted above the surface of the data collected for the roll test.
7. Processing Order of the Tests:
BOAT-MOUNTED LIDAR/LASER SYSTEM PATCH TEST1. Locate a permanently-fixed feature around which to collect the data.
Multibeam LIDAR/Laser• Latency• Roll• Pitch• Yaw
• Latency• Yaw• Roll• Pitch
September / 2018 3

FIGURE 4. Black Rock Danger Marker at beginning of Falmouth Harbor, UK
2. Create run lines to collect data in a box formation around the feature. It is recommended that the 4 run lines be set at the same distance from the feature. Due to the shallow rock outcropping that surrounds the Black Rock feature, there is a difference in distance in this example.
3. Collect the data on the 4 run lines.FIGURE 5. Run Lines are in Red. (left), Raw Data (right)
It is easily seen that a yaw correction is needed for this setup.
4
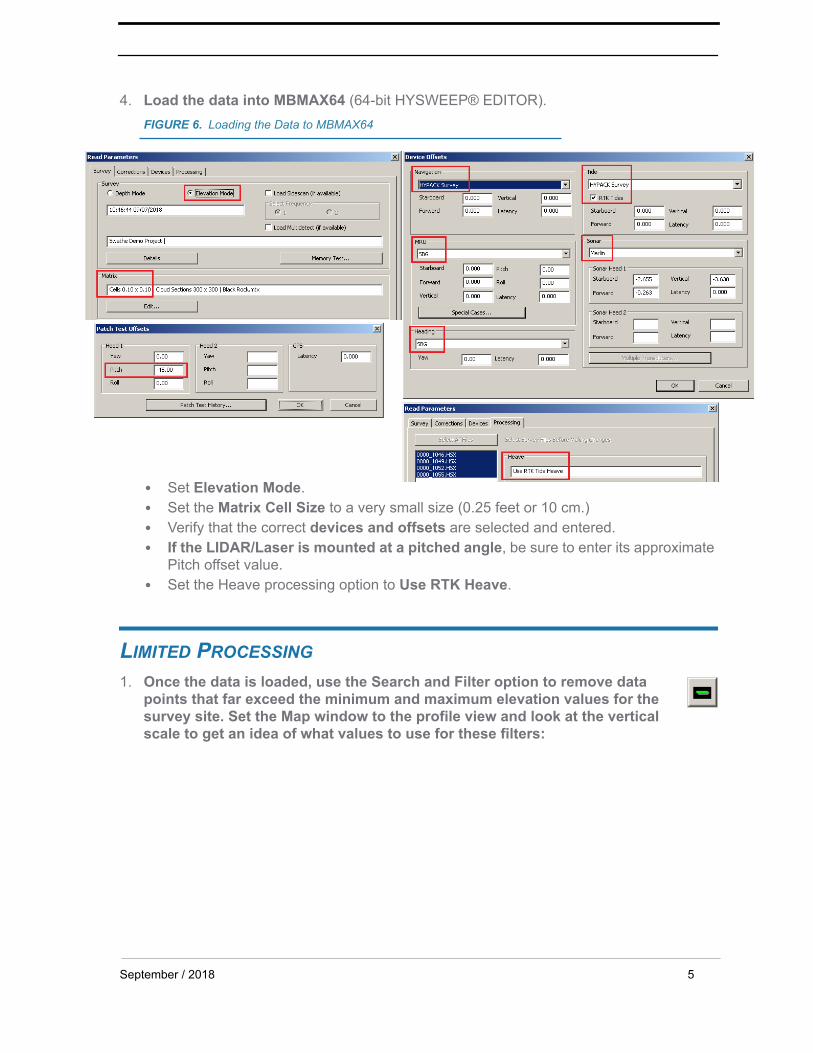
4. Load the data into MBMAX64 (64-bit HYSWEEP® EDITOR).FIGURE 6. Loading the Data to MBMAX64
• Set Elevation Mode.• Set the Matrix Cell Size to a very small size (0.25 feet or 10 cm.)• Verify that the correct devices and offsets are selected and entered.• If the LIDAR/Laser is mounted at a pitched angle, be sure to enter its approximate
Pitch offset value.• Set the Heave processing option to Use RTK Heave.
LIMITED PROCESSING1. Once the data is loaded, use the Search and Filter option to remove data
points that far exceed the minimum and maximum elevation values for the survey site. Set the Map window to the profile view and look at the vertical scale to get an idea of what values to use for these filters:
September / 2018 5
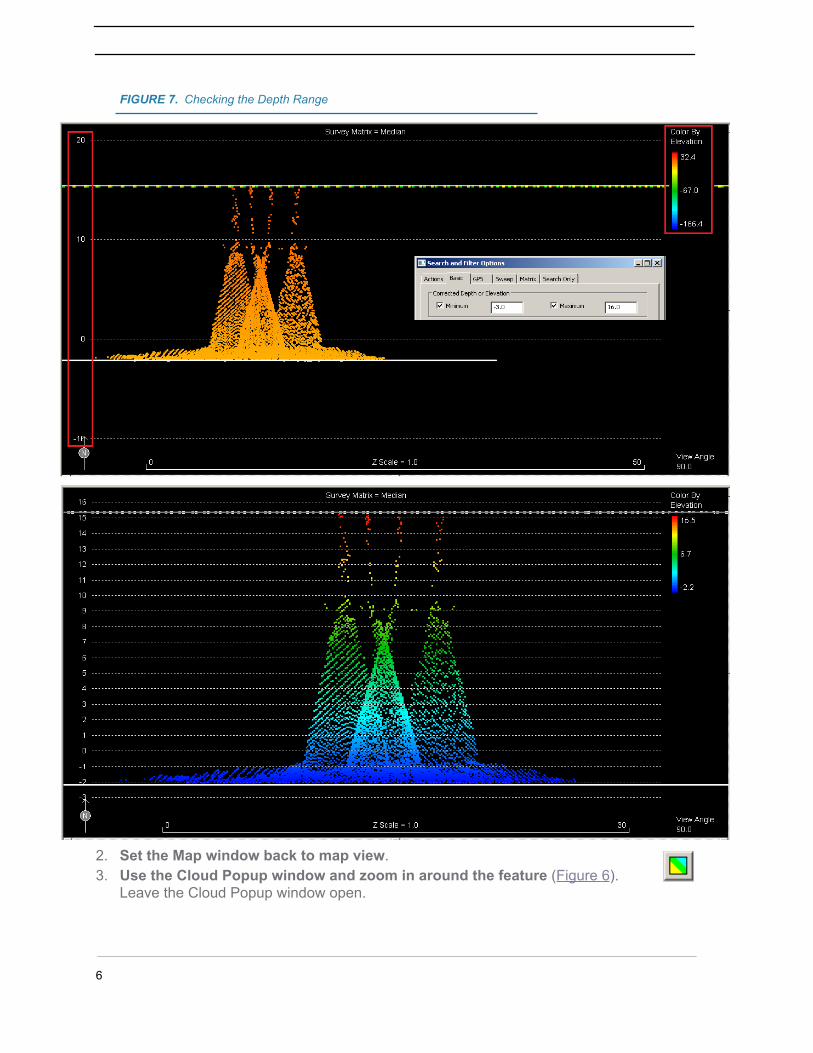
FIGURE 7. Checking the Depth Range
2. Set the Map window back to map view. 3. Use the Cloud Popup window and zoom in around the feature (Figure 6).
Leave the Cloud Popup window open.
6

FIGURE 8. Opening the Cloud Pop-up (top) and Zooming In on the Data (bottom)
September / 2018 7
YAW TESTNow, we will start to manually adjust the yaw value, so that we can twist and slide the four halves of the feature together.
Since the LIDAR/Laser was not above the feature but to its side, we are viewing half of the pole at a time and there is no overlapping data through which to cut cross sections.
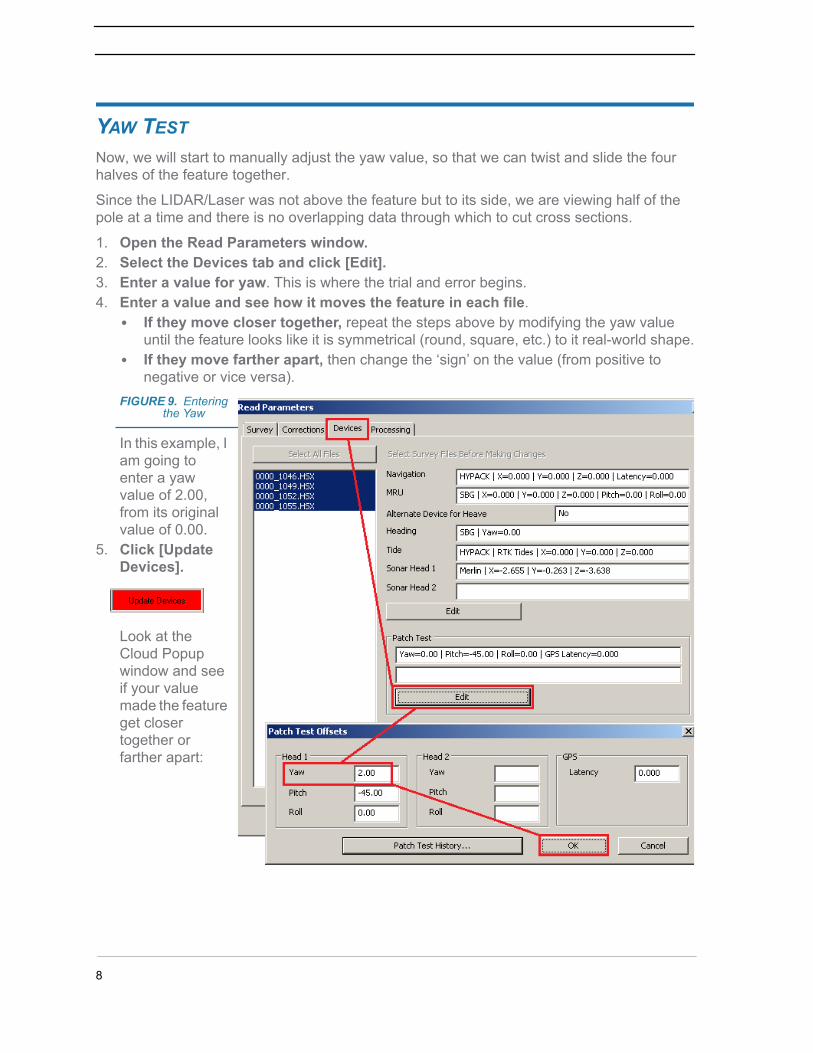
1. Open the Read Parameters window.2. Select the Devices tab and click [Edit].3. Enter a value for yaw. This is where the trial and error begins. 4. Enter a value and see how it moves the feature in each file.
• If they move closer together, repeat the steps above by modifying the yaw value until the feature looks like it is symmetrical (round, square, etc.) to it real-world shape.
• If they move farther apart, then change the ‘sign’ on the value (from positive to negative or vice versa).
FIGURE 9. Entering the Yaw
In this example, I am going to enter a yaw value of 2.00, from its original value of 0.00.
5. Click [Update Devices].
Look at the Cloud Popup window and see if your value made the feature get closer together or farther apart:
8
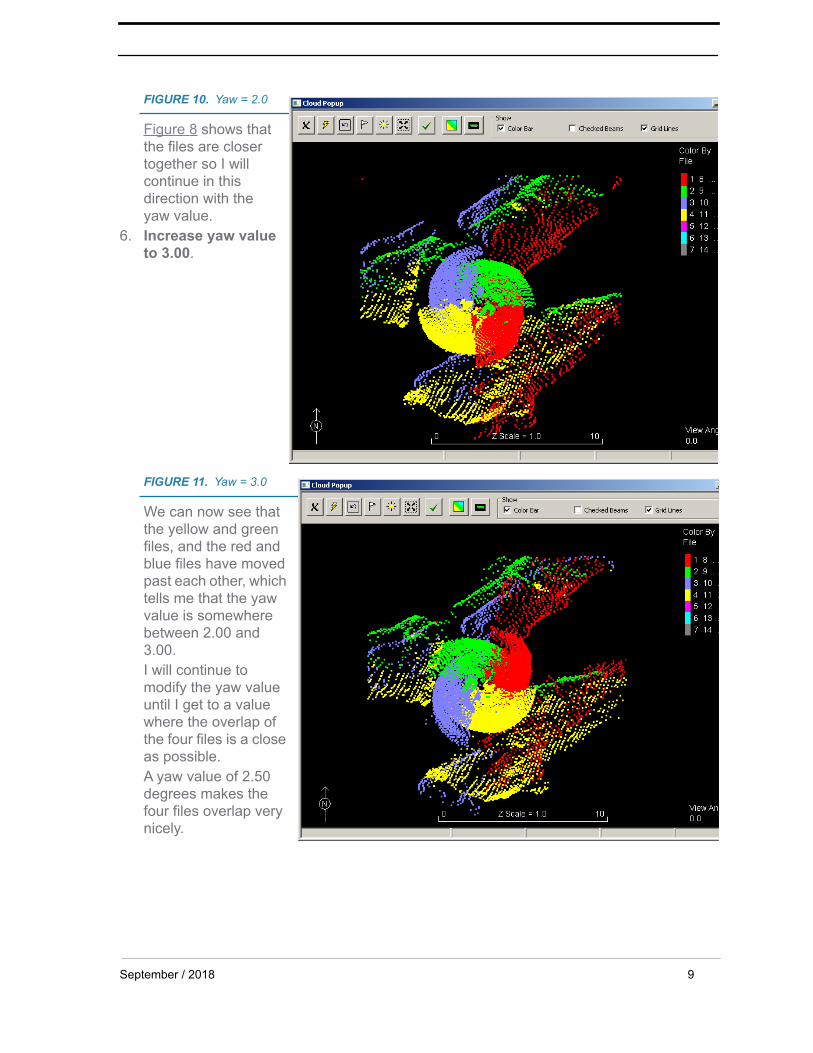
FIGURE 10. Yaw = 2.0
Figure 8 shows that the files are closer together so I will continue in this direction with the yaw value.
6. Increase yaw value to 3.00.
FIGURE 11. Yaw = 3.0
We can now see that the yellow and green files, and the red and blue files have moved past each other, which tells me that the yaw value is somewhere between 2.00 and 3.00.I will continue to modify the yaw value until I get to a value where the overlap of the four files is a close as possible.A yaw value of 2.50 degrees makes the four files overlap very nicely.
September / 2018 9
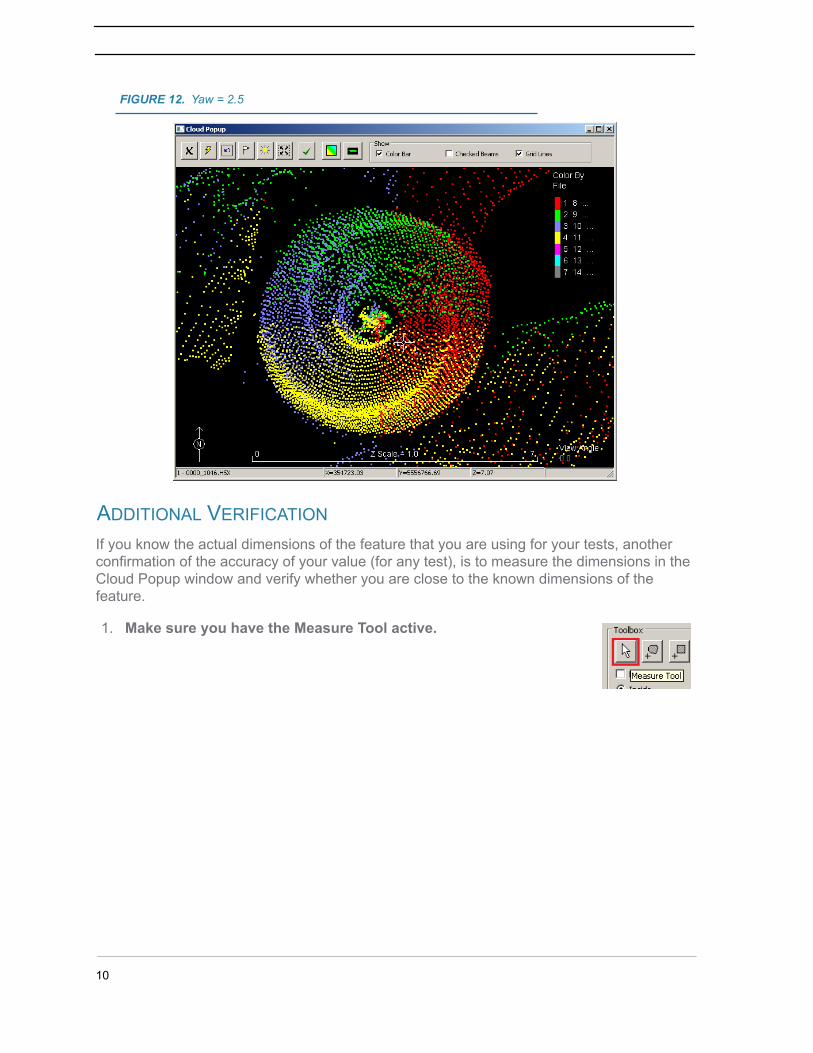
FIGURE 12. Yaw = 2.5
ADDITIONAL VERIFICATION
If you know the actual dimensions of the feature that you are using for your tests, another confirmation of the accuracy of your value (for any test), is to measure the dimensions in the Cloud Popup window and verify whether you are close to the known dimensions of the feature.
1. Make sure you have the Measure Tool active.
10
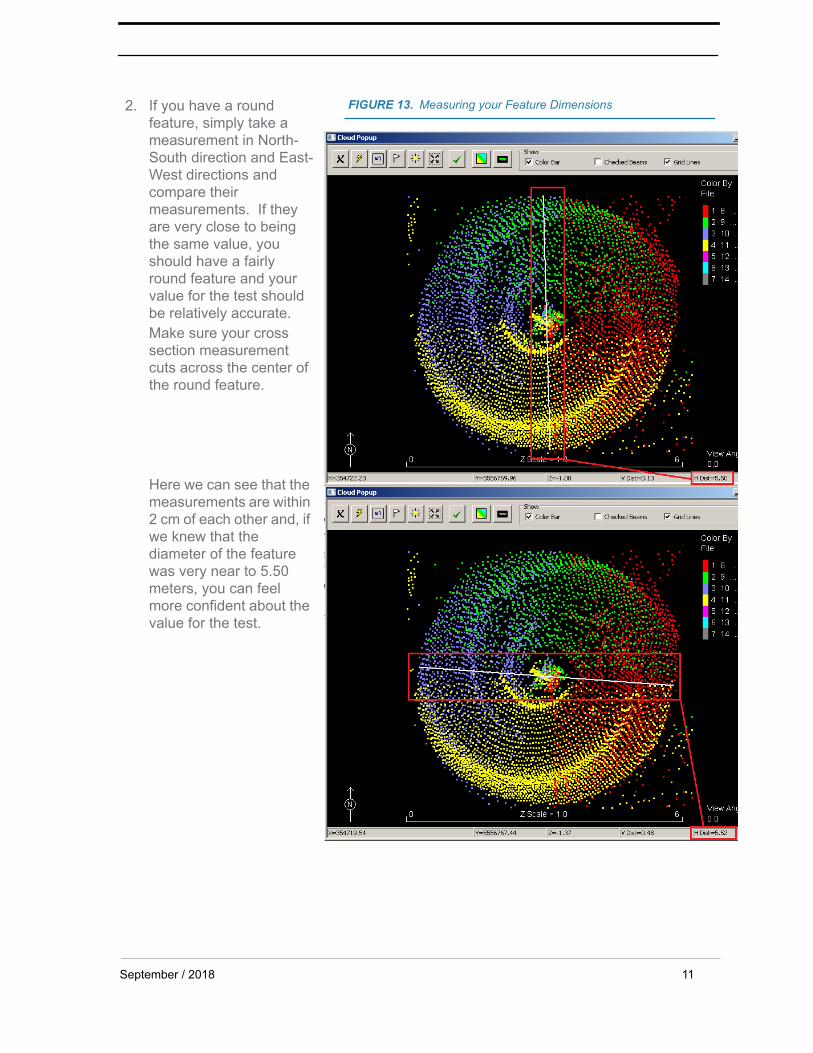
2. If you have a round feature, simply take a measurement in North-South direction and East-West directions and compare their measurements. If they are very close to being the same value, you should have a fairly round feature and your value for the test should be relatively accurate.Make sure your cross section measurement cuts across the center of the round feature.
Here we can see that the measurements are within 2 cm of each other and, if we knew that the diameter of the feature was very near to 5.50 meters, you can feel more confident about the value for the test.
FIGURE 13. Measuring your Feature Dimensions
September / 2018 11
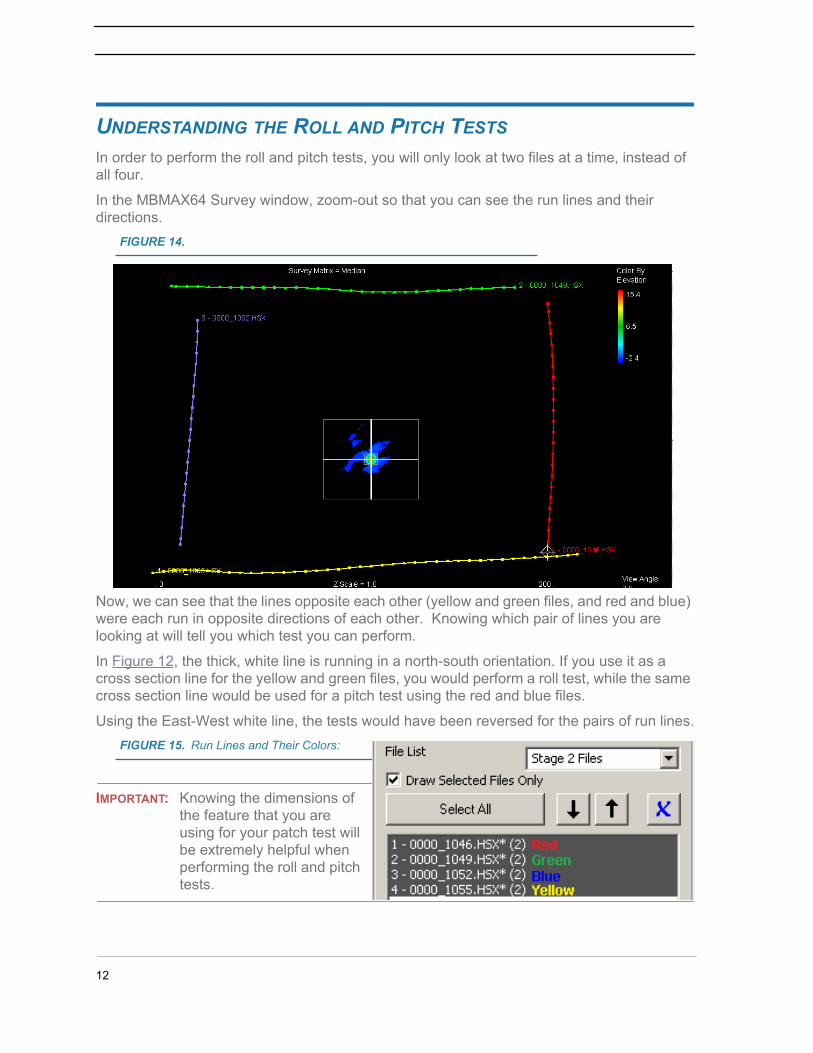
UNDERSTANDING THE ROLL AND PITCH TESTSIn order to perform the roll and pitch tests, you will only look at two files at a time, instead of all four.
In the MBMAX64 Survey window, zoom-out so that you can see the run lines and their directions.
FIGURE 14.
Now, we can see that the lines opposite each other (yellow and green files, and red and blue) were each run in opposite directions of each other. Knowing which pair of lines you are looking at will tell you which test you can perform.
In Figure 12, the thick, white line is running in a north-south orientation. If you use it as a cross section line for the yellow and green files, you would perform a roll test, while the same cross section line would be used for a pitch test using the red and blue files.
Using the East-West white line, the tests would have been reversed for the pairs of run lines.FIGURE 15. Run Lines and Their Colors:
IMPORTANT: Knowing the dimensions of the feature that you are using for your patch test will be extremely helpful when performing the roll and pitch tests.
12
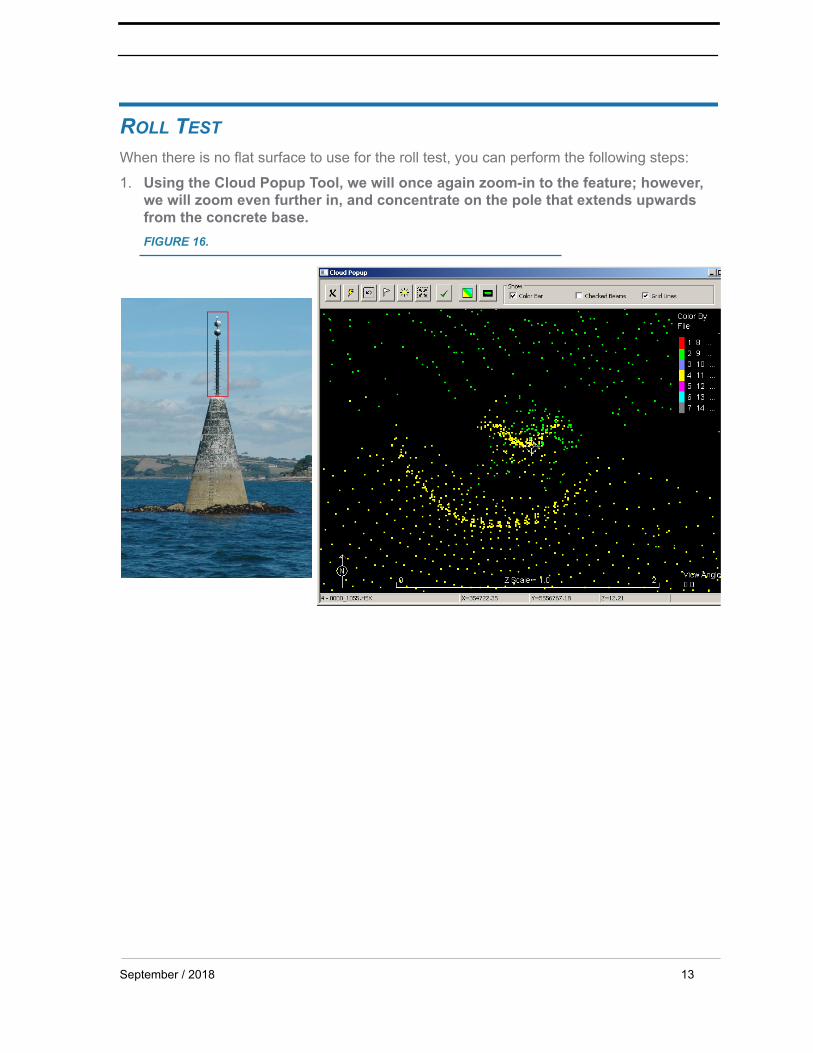
ROLL TESTWhen there is no flat surface to use for the roll test, you can perform the following steps:
1. Using the Cloud Popup Tool, we will once again zoom-in to the feature; however, we will zoom even further in, and concentrate on the pole that extends upwards from the concrete base.FIGURE 16.
September / 2018 13
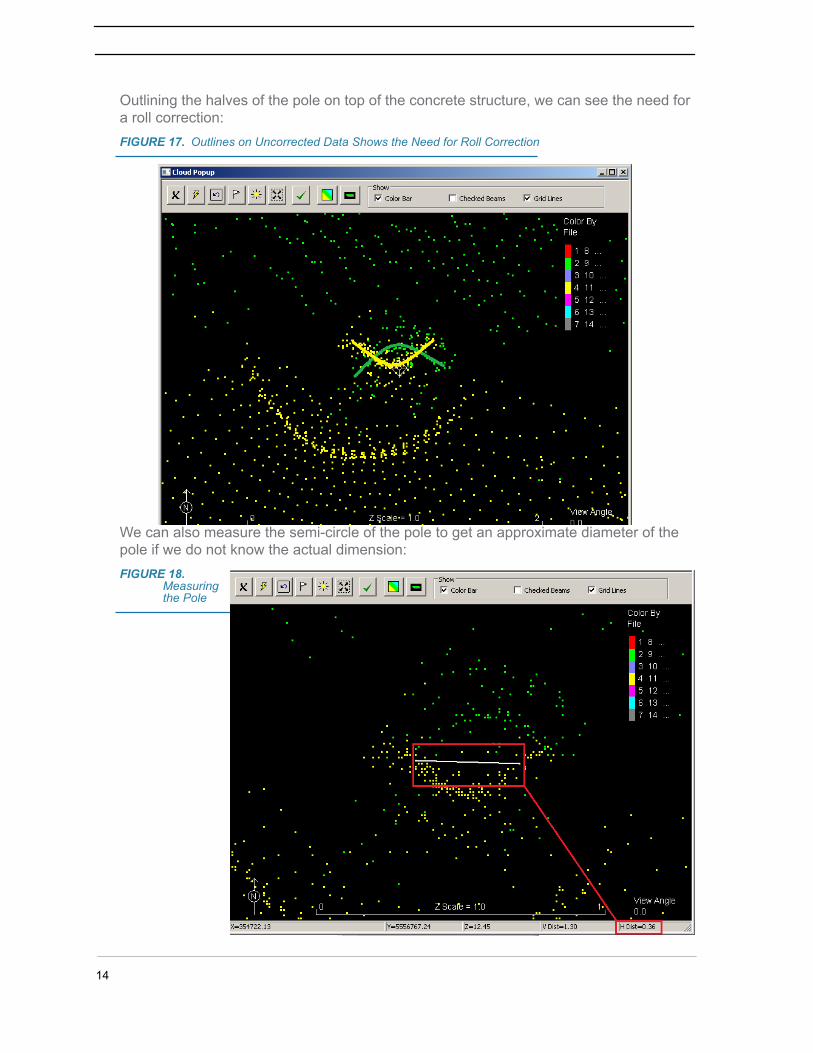
Outlining the halves of the pole on top of the concrete structure, we can see the need for a roll correction:FIGURE 17. Outlines on Uncorrected Data Shows the Need for Roll Correction
We can also measure the semi-circle of the pole to get an approximate diameter of the pole if we do not know the actual dimension:FIGURE 18.
Measuring the Pole
14
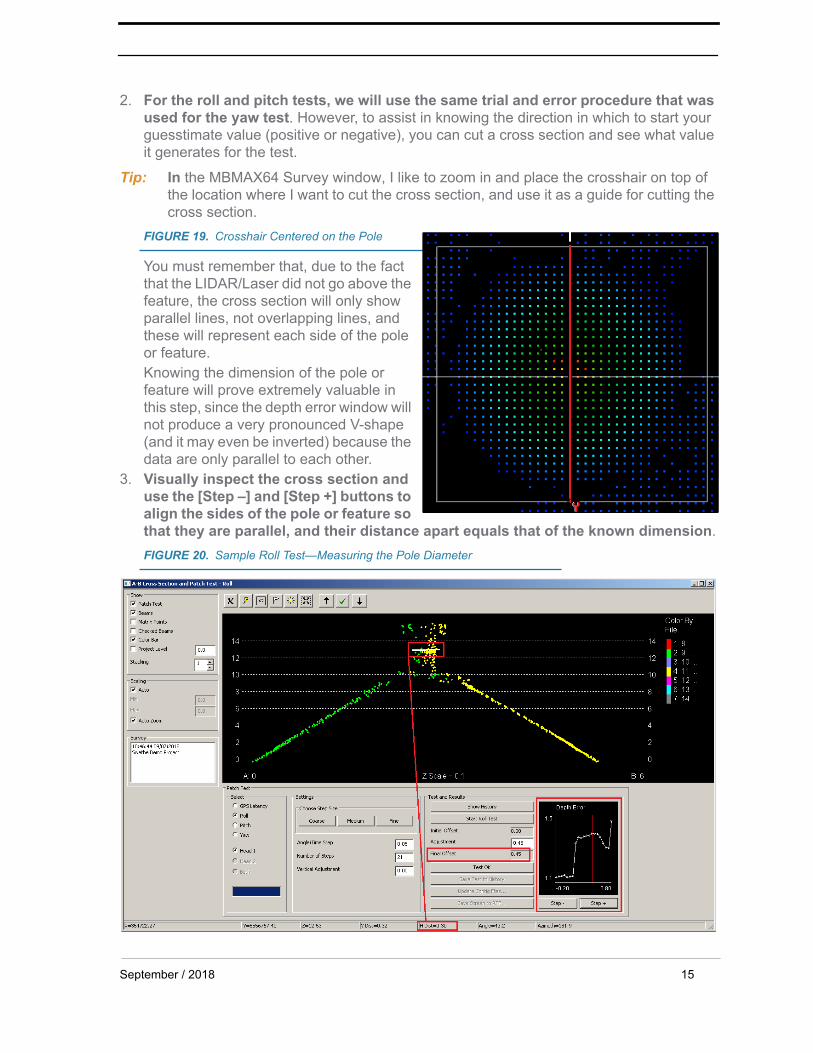
2. For the roll and pitch tests, we will use the same trial and error procedure that was used for the yaw test. However, to assist in knowing the direction in which to start your guesstimate value (positive or negative), you can cut a cross section and see what value it generates for the test.
Tip: In the MBMAX64 Survey window, I like to zoom in and place the crosshair on top of the location where I want to cut the cross section, and use it as a guide for cutting the cross section.
FIGURE 19. Crosshair Centered on the Pole
You must remember that, due to the fact that the LIDAR/Laser did not go above the feature, the cross section will only show parallel lines, not overlapping lines, and these will represent each side of the pole or feature.Knowing the dimension of the pole or feature will prove extremely valuable in this step, since the depth error window will not produce a very pronounced V-shape (and it may even be inverted) because the data are only parallel to each other.
3. Visually inspect the cross section and use the [Step –] and [Step +] buttons to align the sides of the pole or feature so that they are parallel, and their distance apart equals that of the known dimension.FIGURE 20. Sample Roll Test—Measuring the Pole Diameter
September / 2018 15
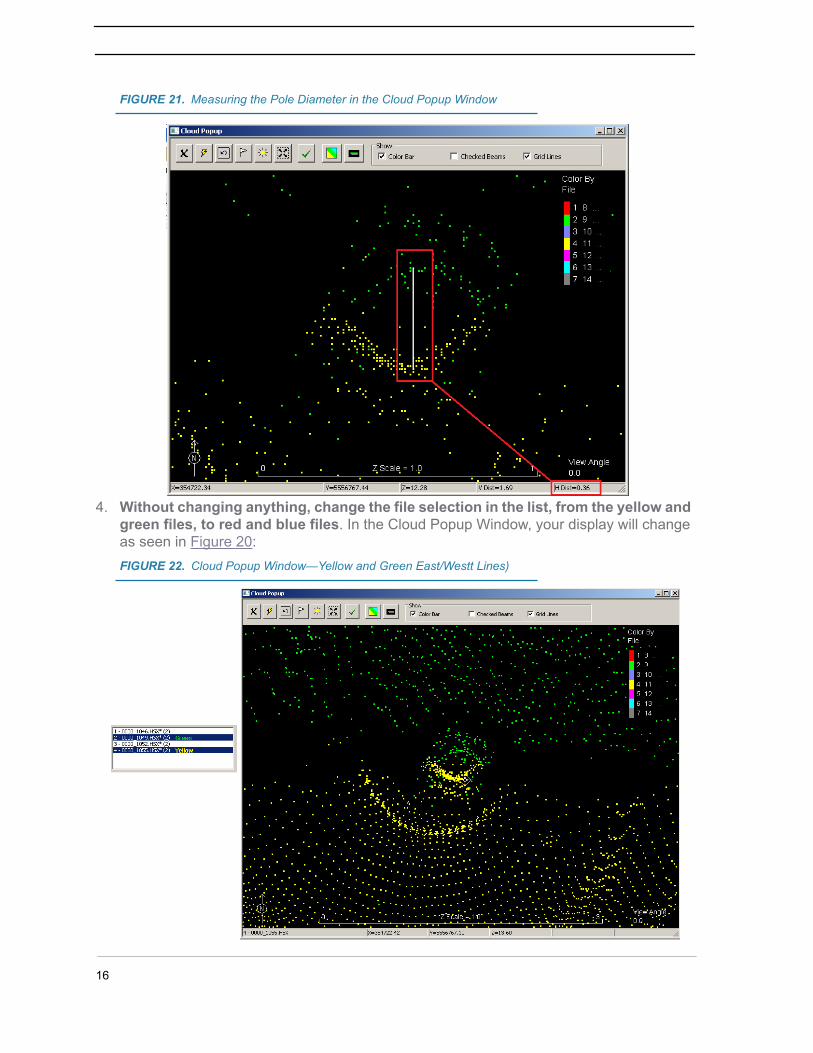
FIGURE 21. Measuring the Pole Diameter in the Cloud Popup Window
4. Without changing anything, change the file selection in the list, from the yellow and green files, to red and blue files. In the Cloud Popup Window, your display will change as seen in Figure 20:FIGURE 22. Cloud Popup Window—Yellow and Green East/Westt Lines)
16
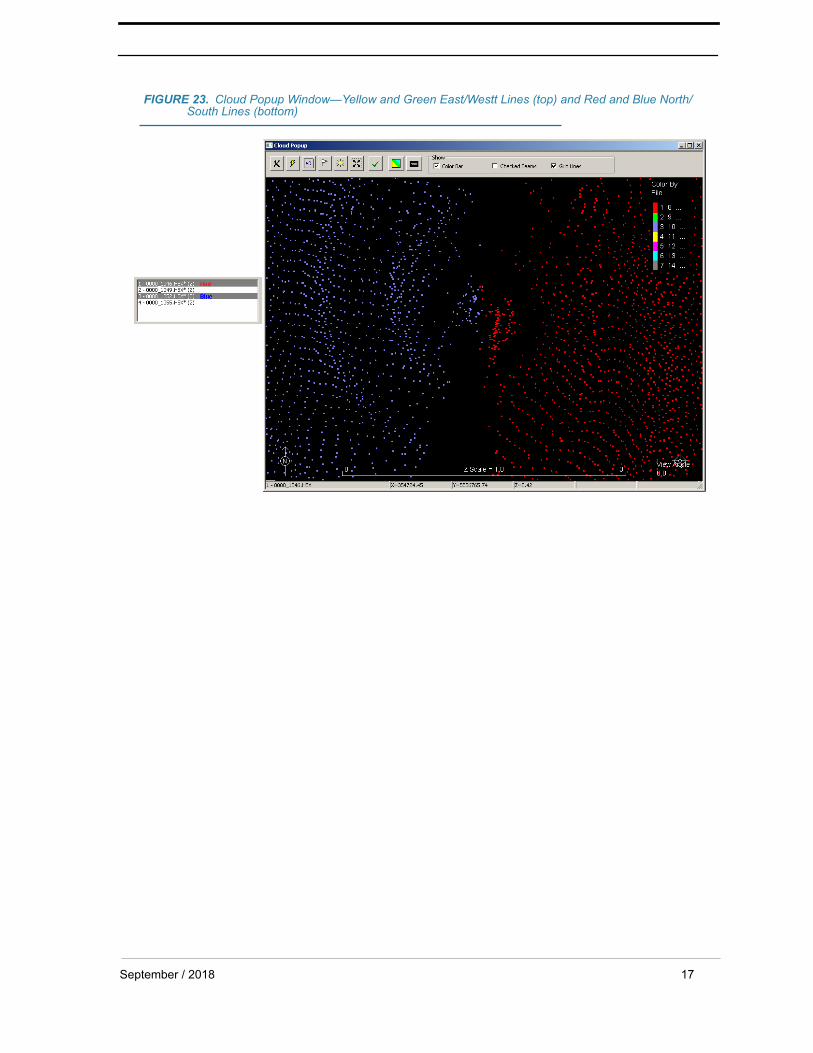
FIGURE 23. Cloud Popup Window—Yellow and Green East/Westt Lines (top) and Red and Blue North/South Lines (bottom)
September / 2018 17
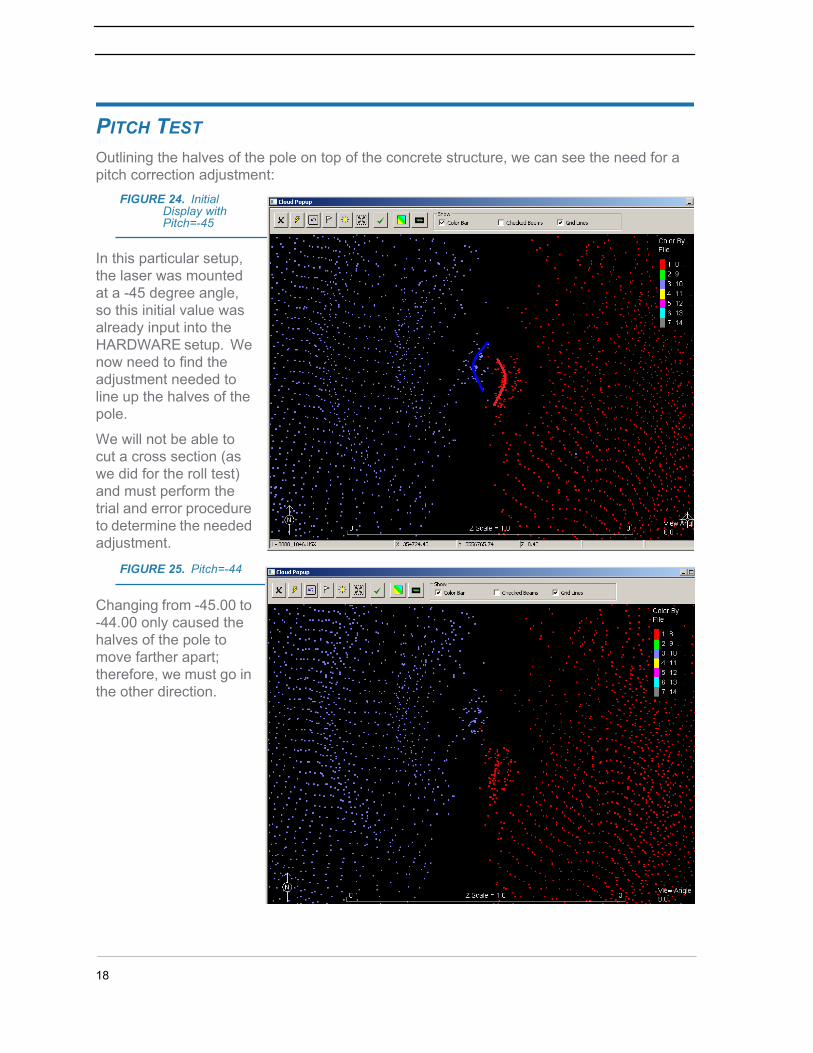
PITCH TESTOutlining the halves of the pole on top of the concrete structure, we can see the need for a pitch correction adjustment:
FIGURE 24. Initial Display with Pitch=-45
In this particular setup, the laser was mounted at a -45 degree angle, so this initial value was already input into the HARDWARE setup. We now need to find the adjustment needed to line up the halves of the pole.
We will not be able to cut a cross section (as we did for the roll test) and must perform the trial and error procedure to determine the needed adjustment.
FIGURE 25. Pitch=-44
Changing from -45.00 to -44.00 only caused the halves of the pole to move farther apart; therefore, we must go in the other direction.
18
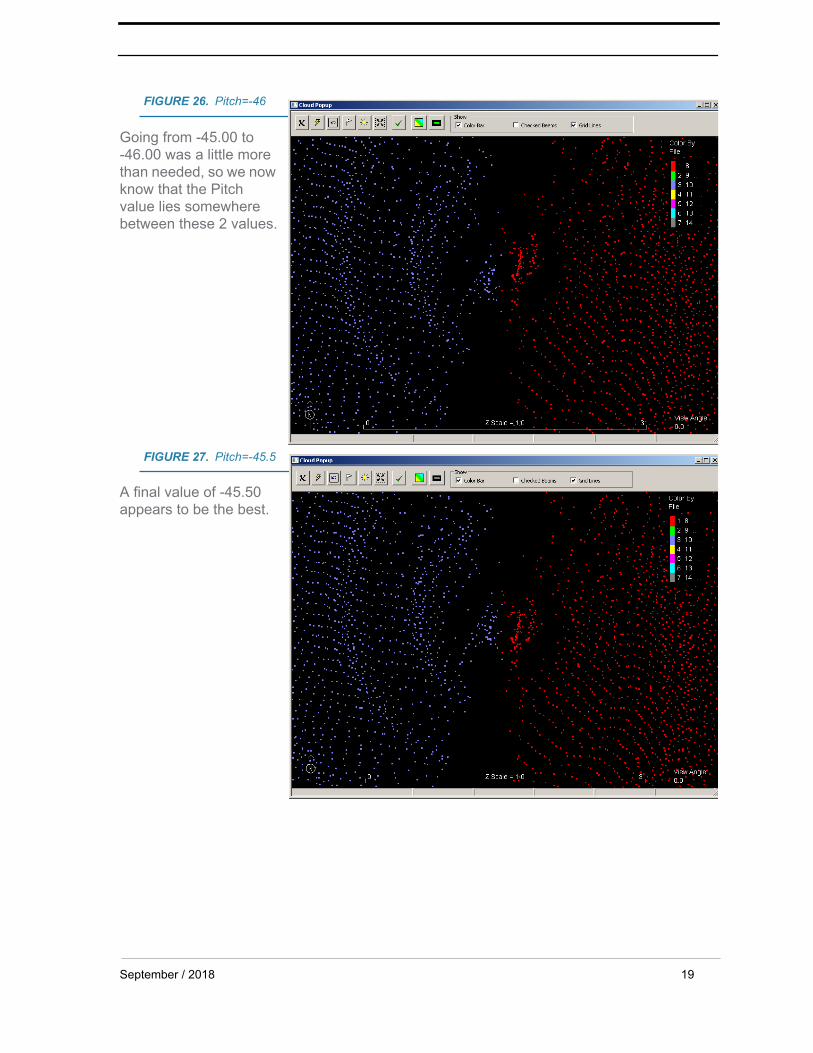
FIGURE 26. Pitch=-46
Going from -45.00 to -46.00 was a little more than needed, so we now know that the Pitch value lies somewhere between these 2 values.
FIGURE 27. Pitch=-45.5
A final value of -45.50 appears to be the best.
September / 2018 19
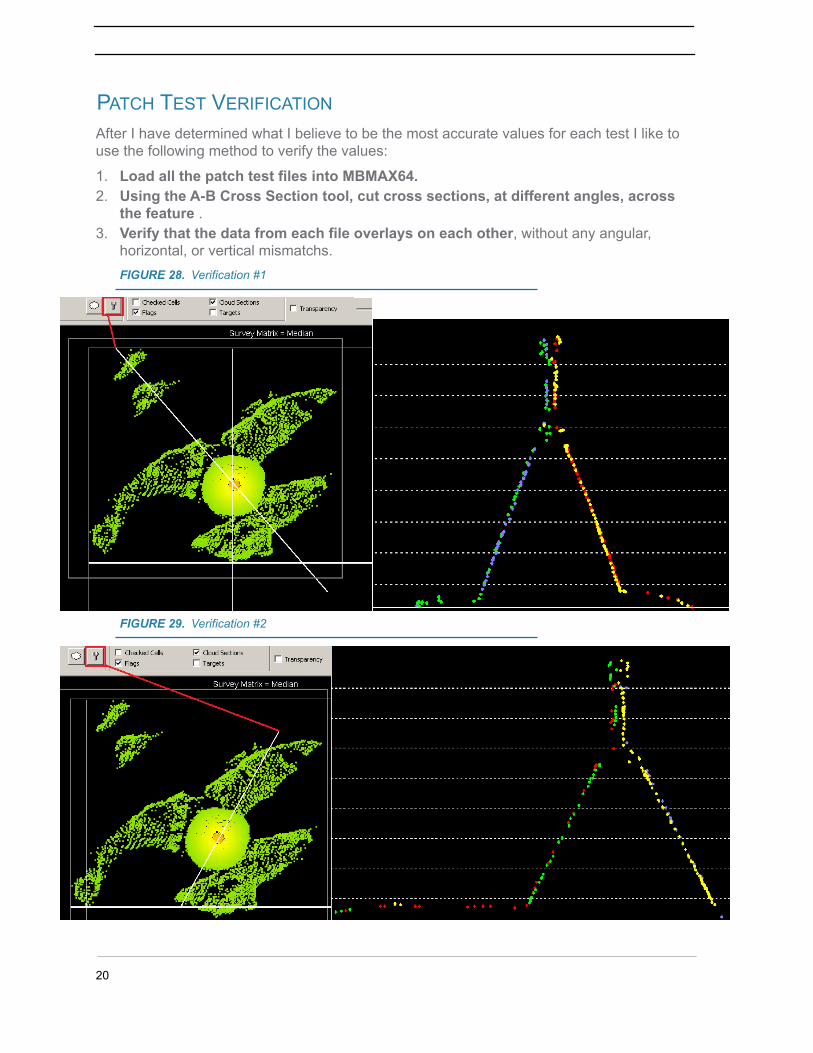
PATCH TEST VERIFICATION
After I have determined what I believe to be the most accurate values for each test I like to use the following method to verify the values:
1. Load all the patch test files into MBMAX64.2. Using the A-B Cross Section tool, cut cross sections, at different angles, across
the feature .3. Verify that the data from each file overlays on each other, without any angular,
horizontal, or vertical mismatchs.FIGURE 28. Verification #1
FIGURE 29. Verification #2
20
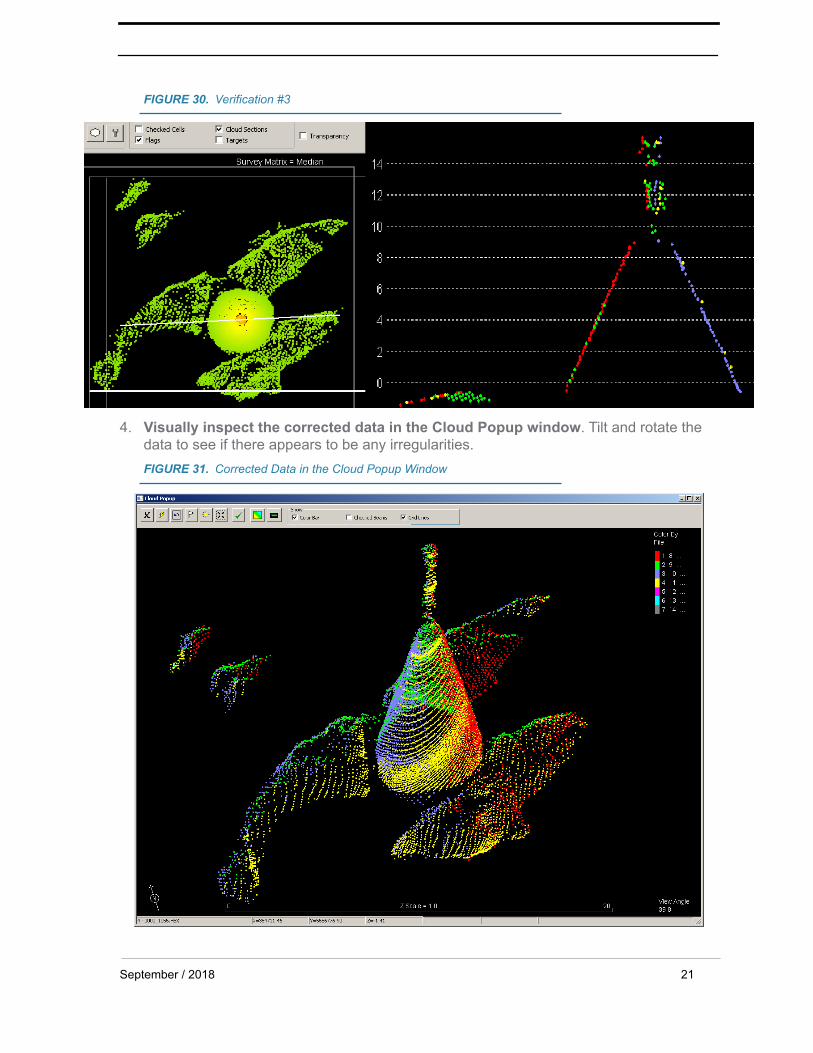
FIGURE 30. Verification #3
4. Visually inspect the corrected data in the Cloud Popup window. Tilt and rotate the data to see if there appears to be any irregularities.FIGURE 31. Corrected Data in the Cloud Popup Window
September / 2018 21
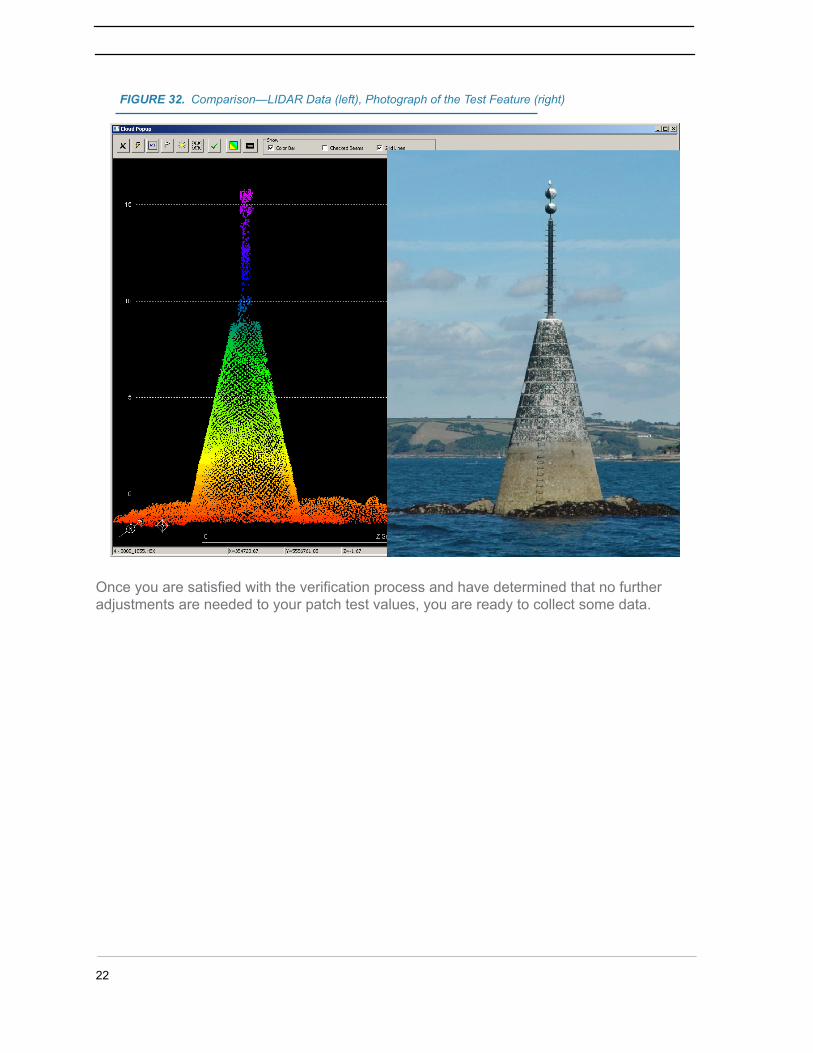
FIGURE 32. Comparison—LIDAR Data (left), Photograph of the Test Feature (right)
Once you are satisfied with the verification process and have determined that no further adjustments are needed to your patch test values, you are ready to collect some data.
22