Embed Size (px)
Citation preview
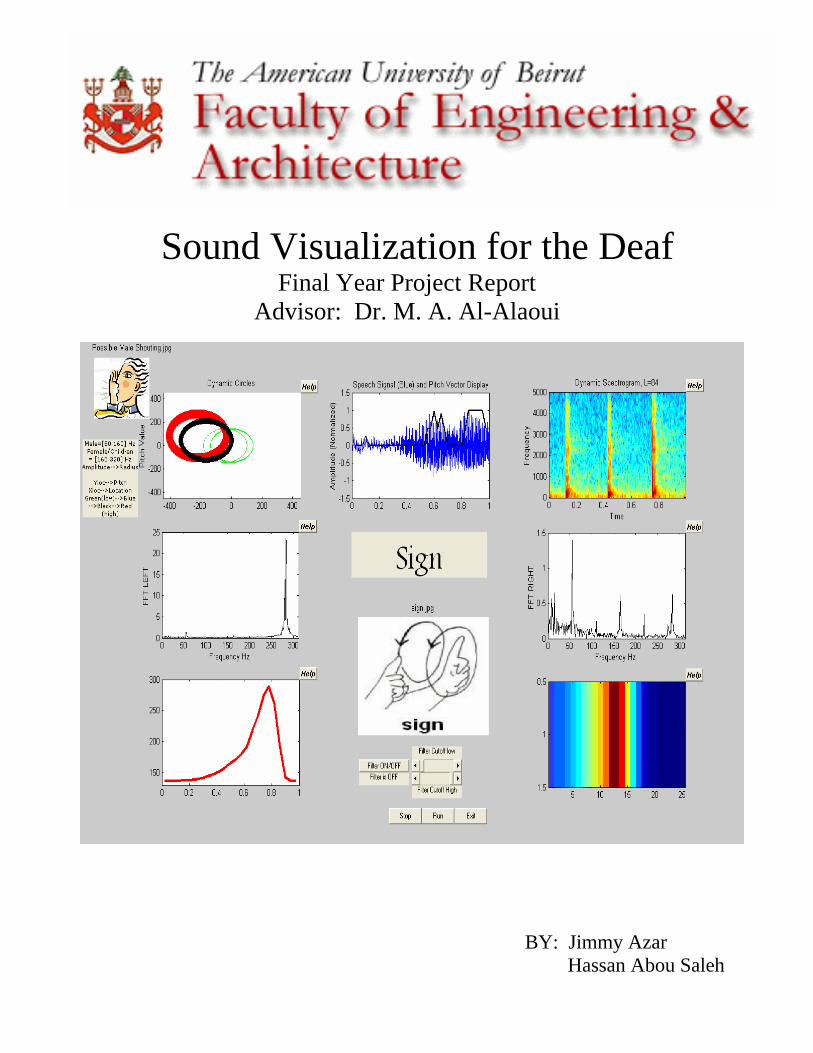
Sound Visualization for the Deaf Final Year Project Report
Advisor: Dr. M. A. Al-Alaoui
BY: Jimmy Azar Hassan Abou Saleh

i
Abstract: In this paper, we investigate several means of visualizing both ambient and
speech sounds and present a fusion of different visualization displays into one
program package that would help provide the hearing impaired with a means to an
enhanced awareness of their surroundings. The ideas investigated were implemented
in software, and the program was evaluated by means of a survey conducted in a
school for the deaf.
ii
Acknowledgments We wish to express appreciation to Dr. M. A. Al-Alaoui for his useful
feedback and support throughout the different phases of the project.
Also, we would like to thank the administration and students of the 'Learning Center
for the Deaf'-Baabda for their helpful feedback and participation in the survey.
Table of Contents
ABSTARCT....................................................................................................................i
ACKNOWLEDGMENTS .............................................................................................ii
1. INTRODUCTION ....................................................................................................1
1.1 PROBLEM DESCRIPTION & OBJECTIVE ................................................1
2. REVIEW....................................................................................................................2
2.1 EXISTING TECHNOLOGIES FOR SOUND AWARENESS .....................2
2.2 VISUAL DISPLAYS......................................................................................3
3. DESIGN & ANALYSIS............................................................................................6
3.1 ANALYSIS OF THE ASSISITIVE TECHNOLOGIES ...............................6
3.2 DESIGN SPECIFICATIONS .........................................................................8
3.3 DESIGN CONSTRAINTS…………………………………………….…….9 4. IMPLEMENTATION..............................................................................................10
4.1 INTRODUCTION ........................................................................................10
4.1.1 DESIGN OVERVIEW ........................................................................10
4.1.2 SYSTEM SETUP ................................................................................10
4.2 AMBIENT SOUND VISUALIZATION......................................................11
4.2.1 PITCH EXTRACTION ALGORITHM .............................................11
4.2.2 PITCH VECTOR DISPLAY ..............................................................14
4.2.3 DYNAMIC CIRCLES DISPLAY ......................................................15
4.2.4 DYNAMIC SPECTROGRAM ...........................................................16
4.2.5 LEFT/RIGHT FFT DISPLAY ............................................................19
4.2.6 RMS LINE DISPLAY ........................................................................19
4.2.7 RMS IMAGE DISPLAY .....................................................................20
4.3 SPEECH VISUALIZATION .......................................................................21
4.3.1 SPEECH RECOGNITION .................................................................21
4.3.2 SPEECH TO ASL TRANSLATION ..................................................21
4.3.3 SINGLE ICON DISPLAYS ...............................................................23
4.3.4 GUI CONTROLS ..............................................................................24
4.3.5 APPLICATION ...................................................................................25
5. EVALUATION........................................................................................................27
6. CONCLUSION & FUTURE WORK......................................................................29
REFERENCES ............................................................................................................30
APPENDIX : SURVEY QUESTIONS .......................................................................31
List of Figures
Figure 1: Existing Techniques of Sound Awareness for the Deaf………………………...3
Figure 2: Speech Visualized by Positional Ripples.…………………………....................4
Figure 3:(a) Implemented version of spectrograph with icon showing a phone ringing.(b)
Single icon showing a loud recognized sound with low frequency.....................................5
Figure 4: Existing Techniques of Sound Awareness for the Deaf ………………………..6
Figure 5: (a) LPF'ed Vowel Segment('a'); (b) Effect of Center Clipping………..….….12
Figure 6: ACF of Center Clipped Vowel Segment ……………..………..……………..13
Figure 7: ACF of consonant 'sh'………………………………………………………….13
Figure 8a: Pitch Vector Display (black line) with normalized sound segment overlapping………………………………………………………………………………14 Figure 8b: Plot of Pitch values and original speech signal (compare/match)…………...15
Figure 9: (a) Sound source moving towards left side and becoming louder;
(b)Sound source moving towards right side and becoming louder……………………....16
Figure 10: (a) 3 Door Knocks; (b) Someone Whistling…...…...……………...…………18
Figure 11: Visual Patterns for Phone Ring Tones (Nokia Model 8850)…………………18
Figure 12: Singing a high pitch 'aaa' from right side …...…………………………….....19
Figure 13: 'EEEE' sound showing exponentially rising loudness intensity ……………..20
Figure 14: Loudness Intensity Rising then Falling ……………………………………...20
Figure 15: Speech Recognition Display of the word 'Sign'………………... …………...21
Figure 16: Sign Language Display ……………………..……………………………….22
Figure 17: GUI Controls (BP Filter, Stop, Run, Exit)…...………………………………24
Figure 18: Main Window Display ………………………………………………..…..…25 Figure 19: Assessment of Functionality ………………………………………...………27
Figure 20: Relative Significance of the Different Displays……………………...………28 List of Tables
Table 1: Taxonomy of Existing Sound Awareness Techniques for the Deaf…………....7
Table 2: Icons Display……...……...……………………………………………...........23
1 / 27
CHAPTER 1: INTRODUCTION
1.1 PROBLEM DESCRIPTION & OBJECTIVE:
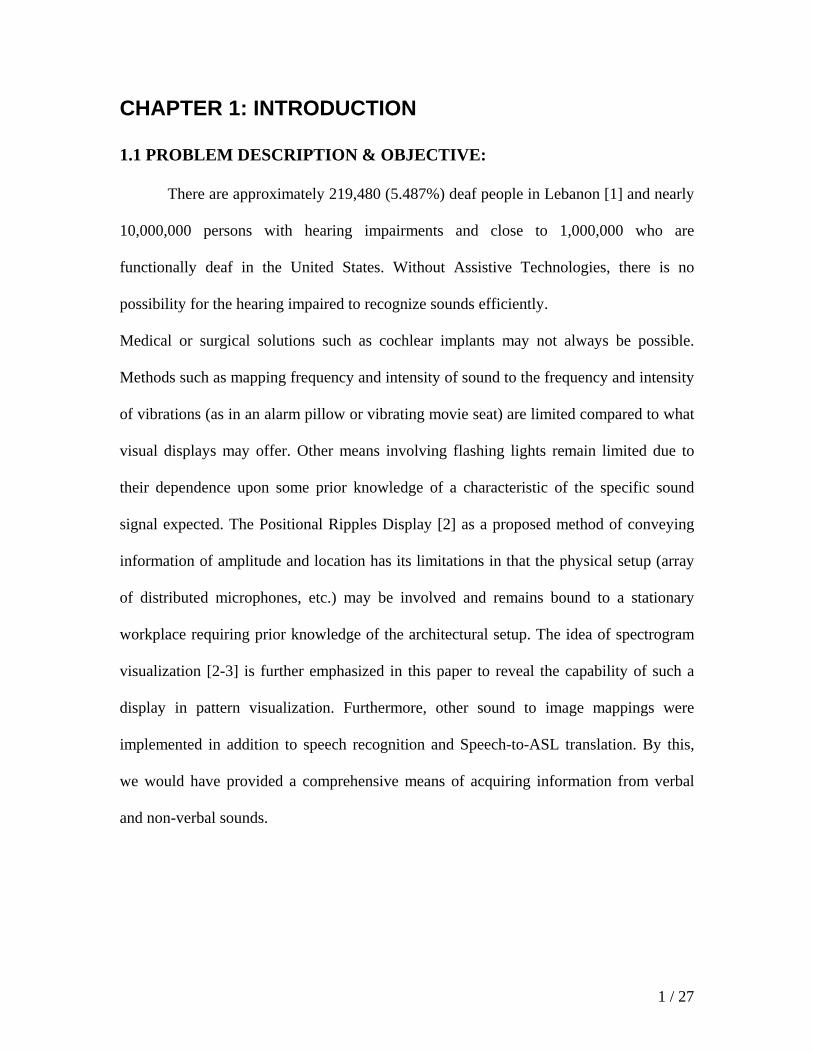
There are approximately 219,480 (5.487%) deaf people in Lebanon [1] and nearly
10,000,000 persons with hearing impairments and close to 1,000,000 who are
functionally deaf in the United States. Without Assistive Technologies, there is no
possibility for the hearing impaired to recognize sounds efficiently.
Medical or surgical solutions such as cochlear implants may not always be possible.
Methods such as mapping frequency and intensity of sound to the frequency and intensity
of vibrations (as in an alarm pillow or vibrating movie seat) are limited compared to what
visual displays may offer. Other means involving flashing lights remain limited due to
their dependence upon some prior knowledge of a characteristic of the specific sound
signal expected. The Positional Ripples Display [2] as a proposed method of conveying
information of amplitude and location has its limitations in that the physical setup (array
of distributed microphones, etc.) may be involved and remains bound to a stationary
workplace requiring prior knowledge of the architectural setup. The idea of spectrogram
visualization [2-3] is further emphasized in this paper to reveal the capability of such a
display in pattern visualization. Furthermore, other sound to image mappings were
implemented in addition to speech recognition and Speech-to-ASL translation. By this,
we would have provided a comprehensive means of acquiring information from verbal
and non-verbal sounds.
2 / 27
CHAPTER 2: REVIEW
Before discussing the Design process, it is essential to present a literature review
on existing papers and research that address the problem of non-speech sound
visualization for the deaf. This section is intended as a smooth introduction to the topic. It
attempts to condense the theory behind the principles used in the visualization process.
Here, we present a review on the different prototypes proposed in [2,3].
2.1 EXISTING TECHNOLOGIES FOR SOUND AWARENESS
We experience many non-speech sounds in every day life such as, mobile phone
calls, door knocking, chair movement, typing, etc. These sounds provide us with critical
information about events occurring in our surroundings. People make use of these sounds
to gain awareness of the state of their environment. For example, at home, the sound of
doorbells provides awareness of visitors; also, the sound of a fire alarm is a critical
notification of danger.
Without assistive technology, deaf people would not be able to recognize such
sounds. Consequently, they must use assistive techniques relying on sensing or flashing
lights in order to be aware of these ambient sounds [3].
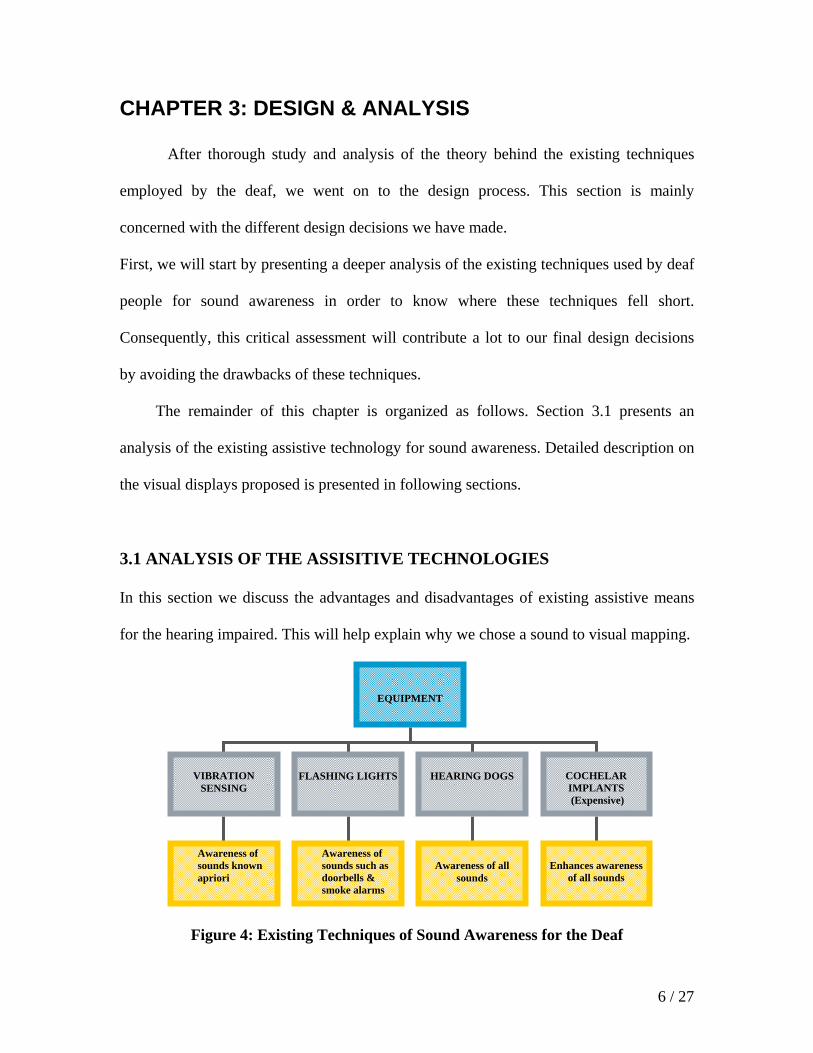
Many devices and equipments are available to help deaf and hearing impaired
people improve communication, adapt to their environment, and function in society more
efficiently. For example smoke alarms, phone ringing, and alarm clocks can all be
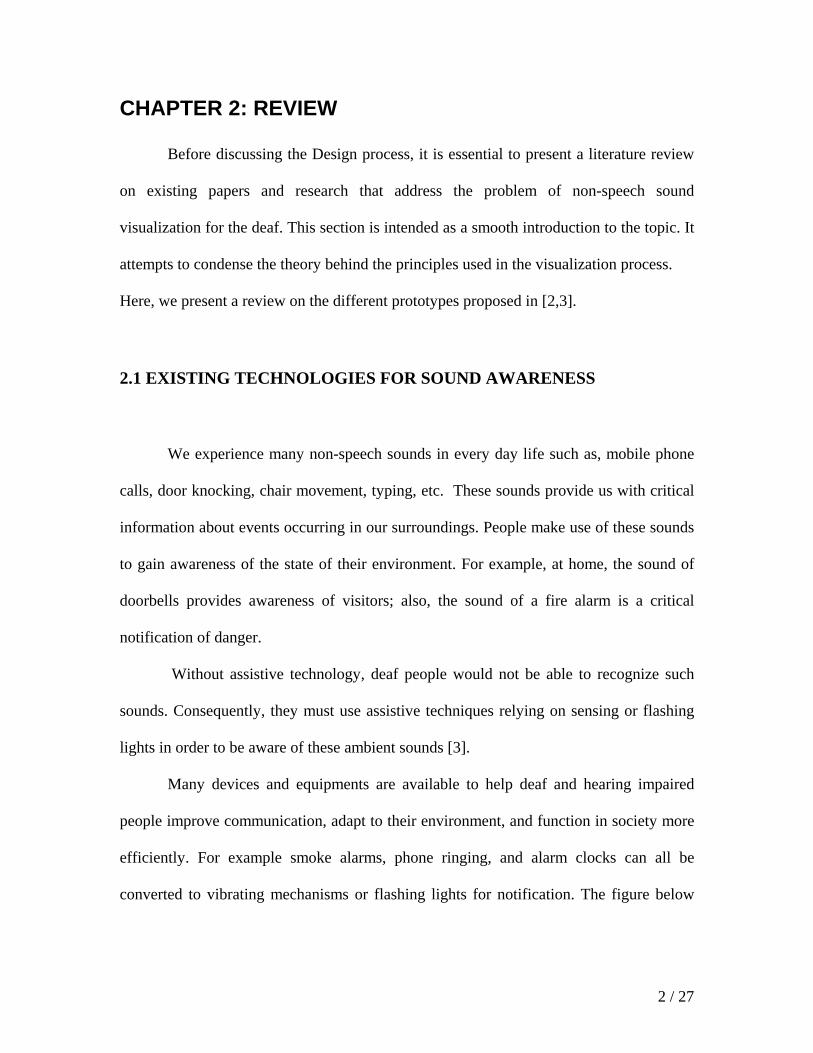
converted to vibrating mechanisms or flashing lights for notification. The figure below
3 / 27
lists the most important existing equipment and means present today. Analysis in terms of
cons and pros follows later in Section 3.1.
Figure 1: Existing Techniques of Sound Awareness for the Deaf
Flashing lights may be used to provide awareness of sounds that inform the
person about specific events which require full attention such as fire alarms, door
knocking, and phone ringing [9]. All these require a quick response or reflex.
2.2 VISUAL DISPLAYS
Non-speech sound visualization has been proposed in [2, 3, 8]. In [2] the authors
explored and analyzed the techniques used by deaf people for sound awareness; they
conducted interviews with deaf and hearing impaired participants in the aim of designing
an efficient method of sound visualization, and based on these interviews, they concluded
that the most important aspect of this visualization is to include the source of sound and
EQUIPMENT
VIBRATION
SENSING
FLASHING
LIGHTS
HEARING DOGS
COCHELAR IMPLANTS (Expensive)
Awareness of sounds known apriori
Awareness of sounds such as doorbells & smoke alarms
Awareness of all
sounds
Enhances awareness
of all sounds
4 / 27
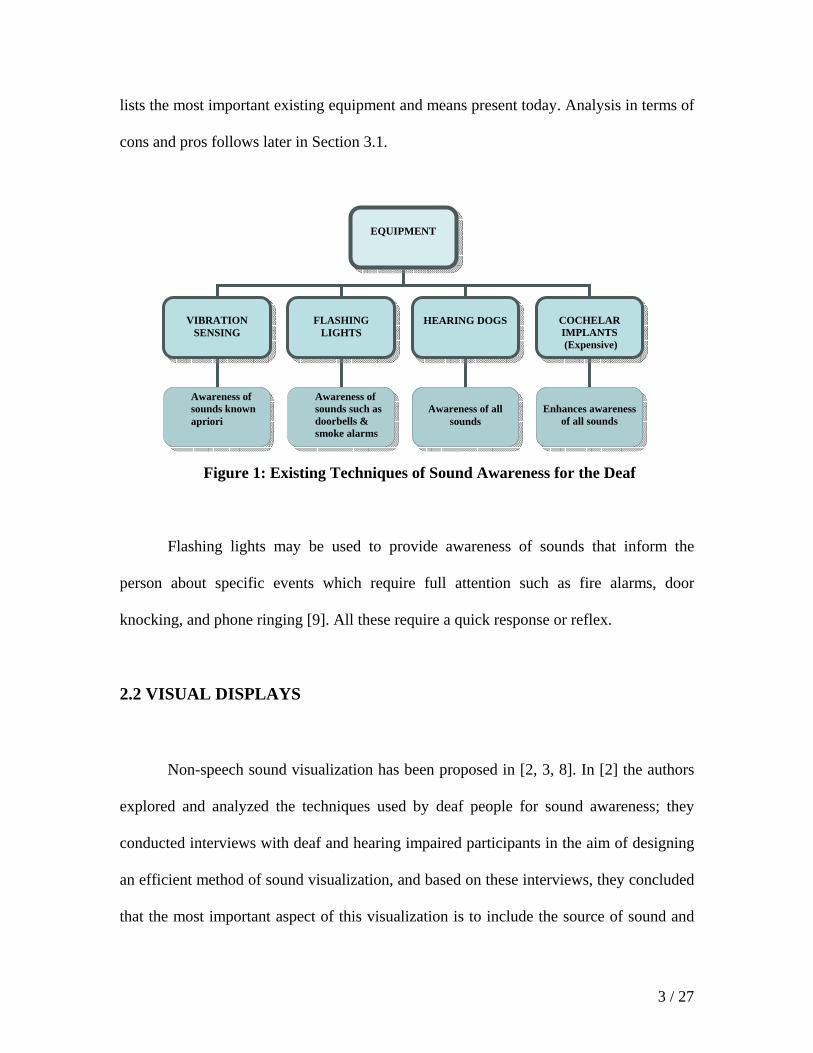
to draw sound as waves (circles). Based on these results, two sound displays have been
presented. One is based on a spectrograph and the other is based on positional ripples.
In the spectrograph scheme, height is mapped to pitch and color is mapped to
intensity (red, yellow, green, blue, etc.). In the positional ripple prototype, the
background displays an overhead map of the room. Sounds are depicted as rings, and the
center of the rings denotes the position of the sound source in the room [2]. The size of
the rings represents the amplitude of the loudest pitch at a particular point in time. Each
ring persists for three seconds before disappearing [2].
[2] Figure 2: Speech Visualized by Positional Ripples.
5 / 27
This arrangement however is impractical since it requires prior knowledge of the
architectural setup (e.g. office); also it is expensive in terms of equipment setup (array of
microphones placed at certain corners in the room) and is also not portable (bound to the
workplace environment).
In [3], new models have been proposed, based on the previous work done in [2]. The
authors proposed two models. The first model, the single icon scheme, displays
recognized sounds as icons, located on the upper right corner of the user’s computer
monitor. It was used throughout the analysis and was shown to give good results.
According to the survey performed in [3], all participants liked it because it identified
each sound event.
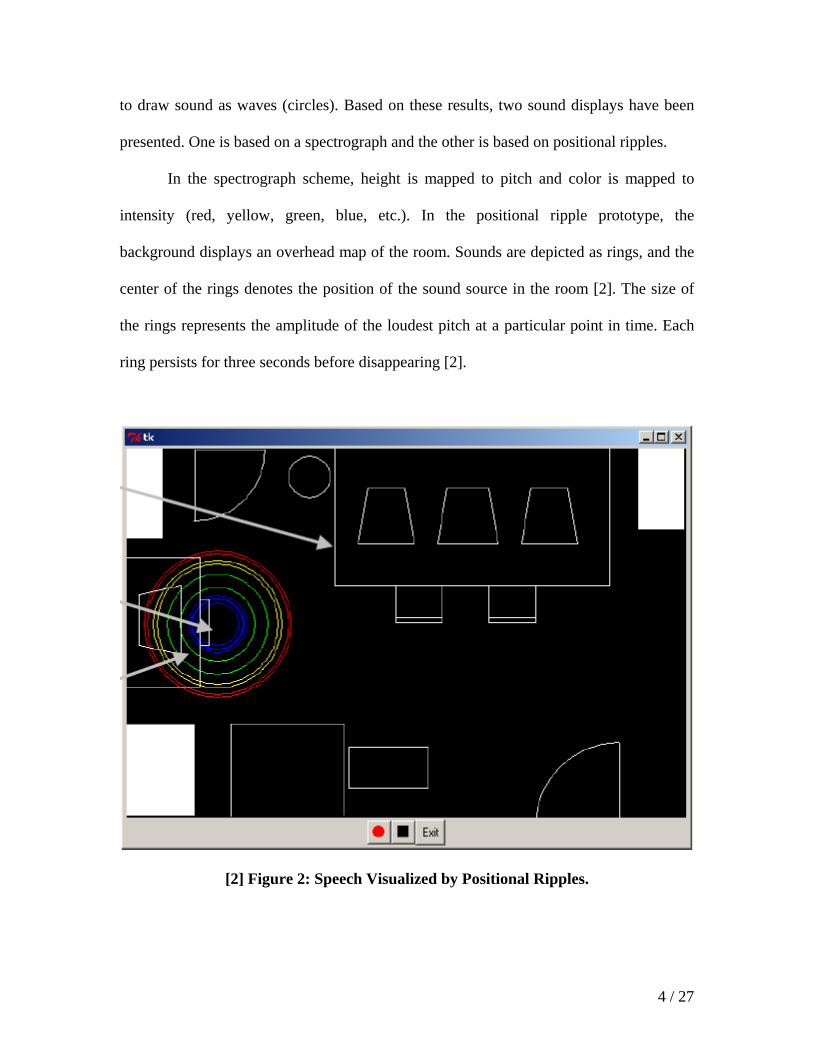
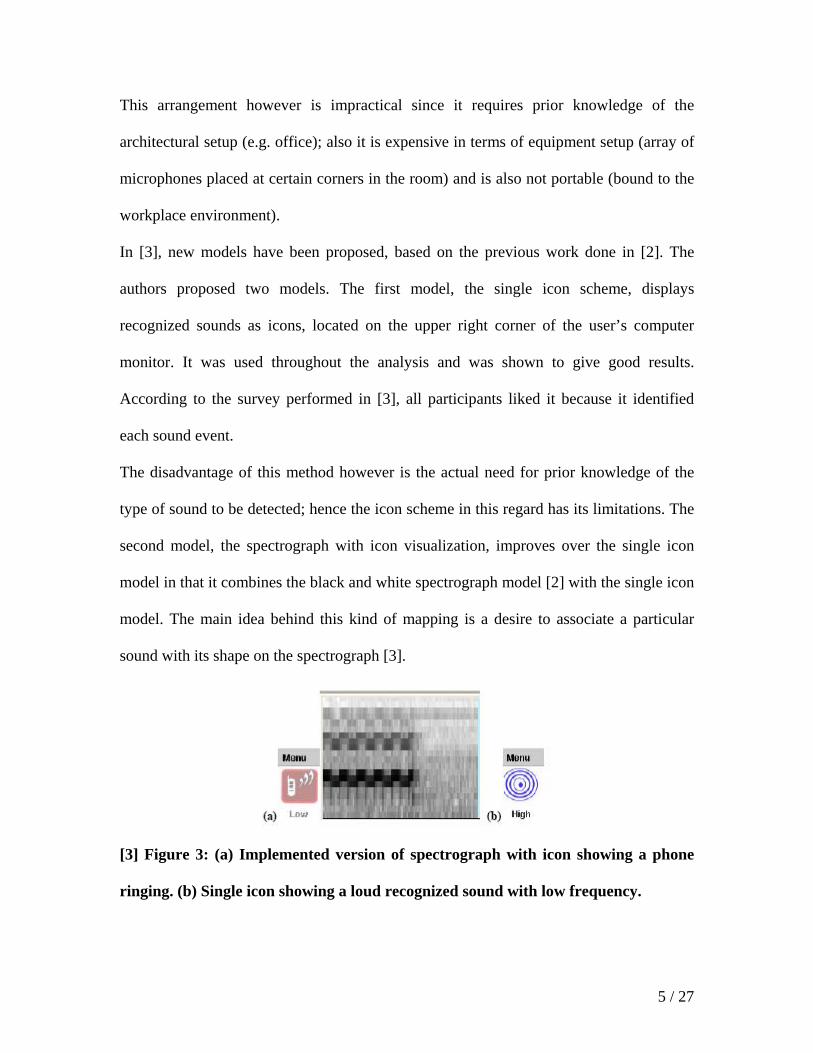
The disadvantage of this method however is the actual need for prior knowledge of the
type of sound to be detected; hence the icon scheme in this regard has its limitations. The
second model, the spectrograph with icon visualization, improves over the single icon
model in that it combines the black and white spectrograph model [2] with the single icon
model. The main idea behind this kind of mapping is a desire to associate a particular
sound with its shape on the spectrograph [3].
[3] Figure 3: (a) Implemented version of spectrograph with icon showing a phone
ringing. (b) Single icon showing a loud recognized sound with low frequency.
6 / 27
CHAPTER 3: DESIGN & ANALYSIS
After thorough study and analysis of the theory behind the existing techniques
employed by the deaf, we went on to the design process. This section is mainly
concerned with the different design decisions we have made.
First, we will start by presenting a deeper analysis of the existing techniques used by deaf
people for sound awareness in order to know where these techniques fell short.
Consequently, this critical assessment will contribute a lot to our final design decisions
by avoiding the drawbacks of these techniques.
The remainder of this chapter is organized as follows. Section 3.1 presents an
analysis of the existing assistive technology for sound awareness. Detailed description on
the visual displays proposed is presented in following sections.
3.1 ANALYSIS OF THE ASSISITIVE TECHNOLOGIES
In this section we discuss the advantages and disadvantages of existing assistive means
for the hearing impaired. This will help explain why we chose a sound to visual mapping.
Figure 4: Existing Techniques of Sound Awareness for the Deaf
EQUIPMENT
VIBRATION
SENSING
FLASHING LIGHTS
HEARING DOGS
COCHELAR IMPLANTS (Expensive)
Awareness of sounds known apriori
Awareness of sounds such as doorbells & smoke alarms
Awareness of all
sounds
Enhances awareness
of all sounds
7 / 27
Assistive technologies and methods such as Phone Flasher, hearing dogs, etc. are
impractical in the sense that they require high initial investment, are limited, or need
ongoing maintenance. In addition, we realized that all the existing commercial techniques
used a separate costly system to notify deaf with sounds, and each system detects a
specific kind of sound. For instance, the flashing light technique was used specifically for
telephones and doorbells (notification sounds). In addition, other drawbacks stem from
the fact that these techniques failed to make the deaf able to depict the state of such
appliances; for instance, how can the deaf identify music and the presence of others for
example? Hence, many sounds have implicit interpretations that indicate their state.
Awareness of such sounds by the existing technologies is limited.
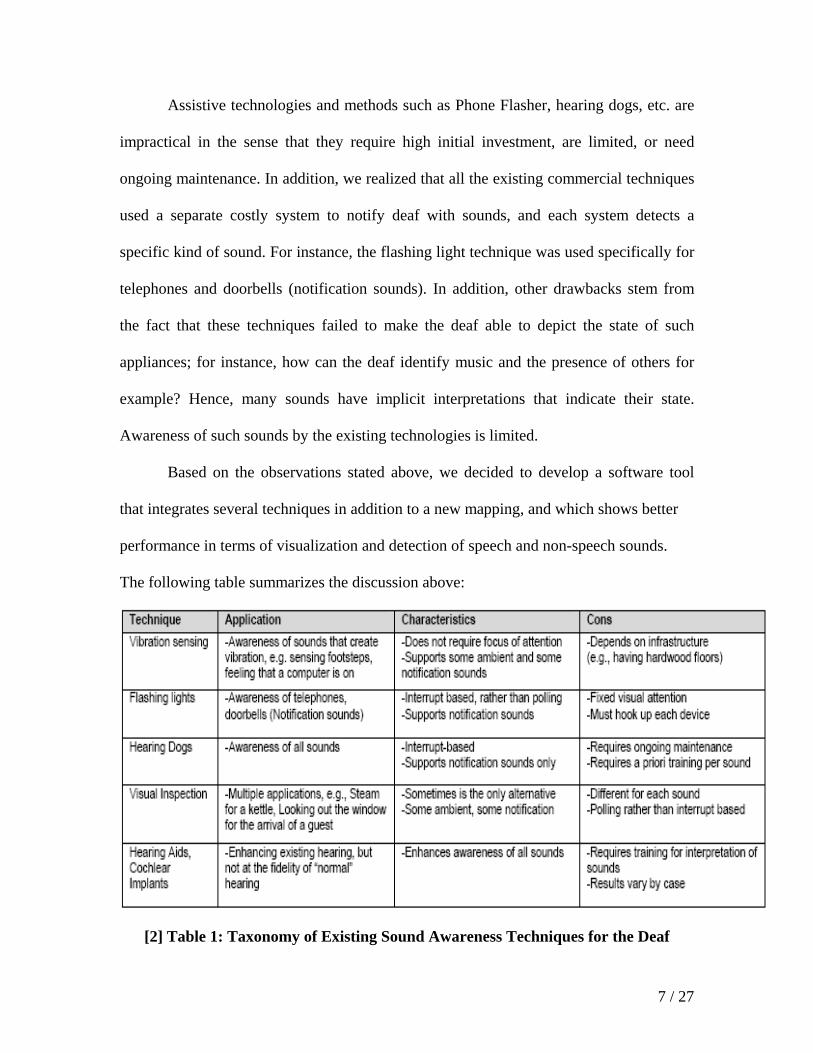
Based on the observations stated above, we decided to develop a software tool
that integrates several techniques in addition to a new mapping, and which shows better
performance in terms of visualization and detection of speech and non-speech sounds.
The following table summarizes the discussion above:
[2] Table 1: Taxonomy of Existing Sound Awareness Techniques for the Deaf
8 / 27
Sight is one of the most important senses. Other senses like touch (vibrating pillow or
vibration simulation mapped to intensity while watching a movie) have more limitations
when it comes to representing sounds. The technique of flashing lights to indicate certain
events is also limited and requires prior installation and knowledge of the type of sound
(hence impractical). We are trying to integrate speech and pattern visualization in our
program to account for all these needs.
3.2 DESIGN SPECIFICATIONS
We have established the limitations of currently existing awareness techniques for
the Deaf. What remains is obtaining the design specs—the target of our design. This is
mainly obtained by examining the needs of deaf people. Based on the feedback obtained
from the 'Learning School for the Deaf'—Baabda, the needs for deaf people in general
may be summarized as:
i) The need to understand Spoken Speech when present
ii) The need to be aware of certain events that tend to recur such as phone ringing and
door knocking.
iii) The need to be aware of the source of sound (direction)
In addition to these, we have added
iv) The ability to observe the variation in the loudness of sound (increasing/decreasing/
monotone)
v) The ability to distinguish the different frequency components of sound (low
pitch/high pitch)
vi) The ability to identify whether the sound belongs to a male/female ,
9 / 27
shouting/speaking, or Nonhuman Loud, or Telephone ringing.
We have tested the success in achieving these specs by means of a survey conducted in a
school for the deaf. The results are summarized in Section 5 (Evaluation).
In designing for these specs, we had to acquire two input sound signals to localize sound,
calculate root mean square values to tag loudness levels, precondition the signals, and
apply a pitch extraction algorithm, DFT analysis, and spectrogram setup. The detailed
implementation of these ideas is next examined in section 4.
3.3 DESIGN CONSTRAINTS
The program to be designed had to be flexible and implementable onto any usual
microprocessor. The constraints on the program itself can be summarized as:
i) Should provide a user friendly Graphic User Interface.
ii) Should support a reasonable vocabulary size for speech recognition
iii) Should yield accurate detection of sounds, their location, and loudness, etc.
iv) Should be able to implement a fusion of Speech and NonSpeech sound Visulaization
onto 1 Main Window.
10 / 27
CHAPTER 4: IMPLEMETATION
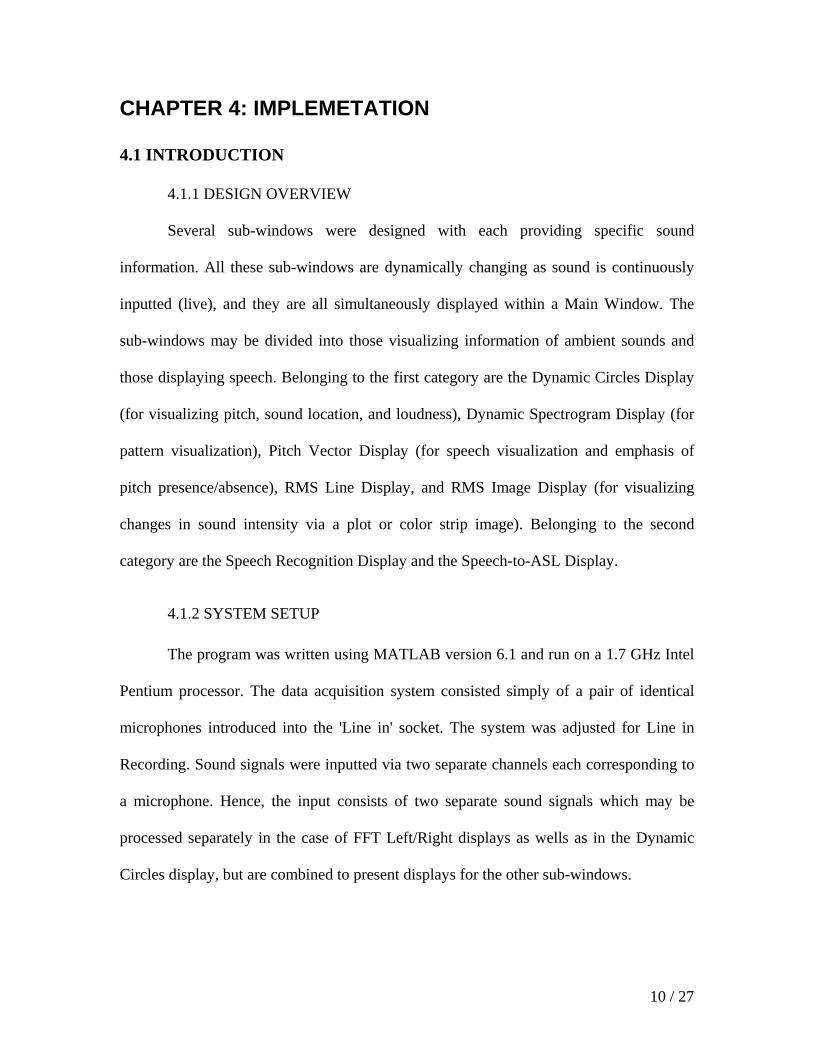
4.1 INTRODUCTION
4.1.1 DESIGN OVERVIEW
Several sub-windows were designed with each providing specific sound
information. All these sub-windows are dynamically changing as sound is continuously
inputted (live), and they are all simultaneously displayed within a Main Window. The
sub-windows may be divided into those visualizing information of ambient sounds and
those displaying speech. Belonging to the first category are the Dynamic Circles Display
(for visualizing pitch, sound location, and loudness), Dynamic Spectrogram Display (for
pattern visualization), Pitch Vector Display (for speech visualization and emphasis of
pitch presence/absence), RMS Line Display, and RMS Image Display (for visualizing
changes in sound intensity via a plot or color strip image). Belonging to the second
category are the Speech Recognition Display and the Speech-to-ASL Display.
4.1.2 SYSTEM SETUP
The program was written using MATLAB version 6.1 and run on a 1.7 GHz Intel
Pentium processor. The data acquisition system consisted simply of a pair of identical
microphones introduced into the 'Line in' socket. The system was adjusted for Line in
Recording. Sound signals were inputted via two separate channels each corresponding to
a microphone. Hence, the input consists of two separate sound signals which may be
processed separately in the case of FFT Left/Right displays as wells as in the Dynamic
Circles display, but are combined to present displays for the other sub-windows.
11 / 27
Section 2 of the paper discusses the various means of visualizing ambient sounds.
Different displays are proposed and implemented.
Section 3 discusses speech visualization which includes the implementation of speech
recognition and speech to ASL translation followed by an overall view of the entire Main
Window Display.
Section 4 includes a summary of the statistical results gathered from a survey conducted
in a school for the hearing impaired in the intention of assessing the usefulness and
performance of our program. Possible applications are also discussed.
Section 5 contains the conclusion of our work and suggestions for possible future
improvements.
4.2 AMBIENT SOUND VISUALIZATION
4.2.1 PITCH EXTRACTION ALGORITHM
The Autocorrelation Function (ACF) as defined in equation (1)
1]-y[n y[n] ]k[Ry ><=
(1)
(where <.> corresponds to the mean) is essential for extracting the pitch value of a sound
segment. Prior to extracting the pitch, preconditioning is applied mainly in the form of
Center Clipping and median filtering. Pitch contributes to significant peaks in the
Autocorrelation function (ACF), however in between there may exist secondary peaks
corresponding to the vocal tract transfer function. These peaks may cause errors in the
automated pitch detection process. Center Clipping the speech signal by considering only
the peaks that overpass 68% of the minimum or maximum values of the signal eliminates
these undesirable peaks and hence allows for a more accurate detection of pitch [4].
12 / 27
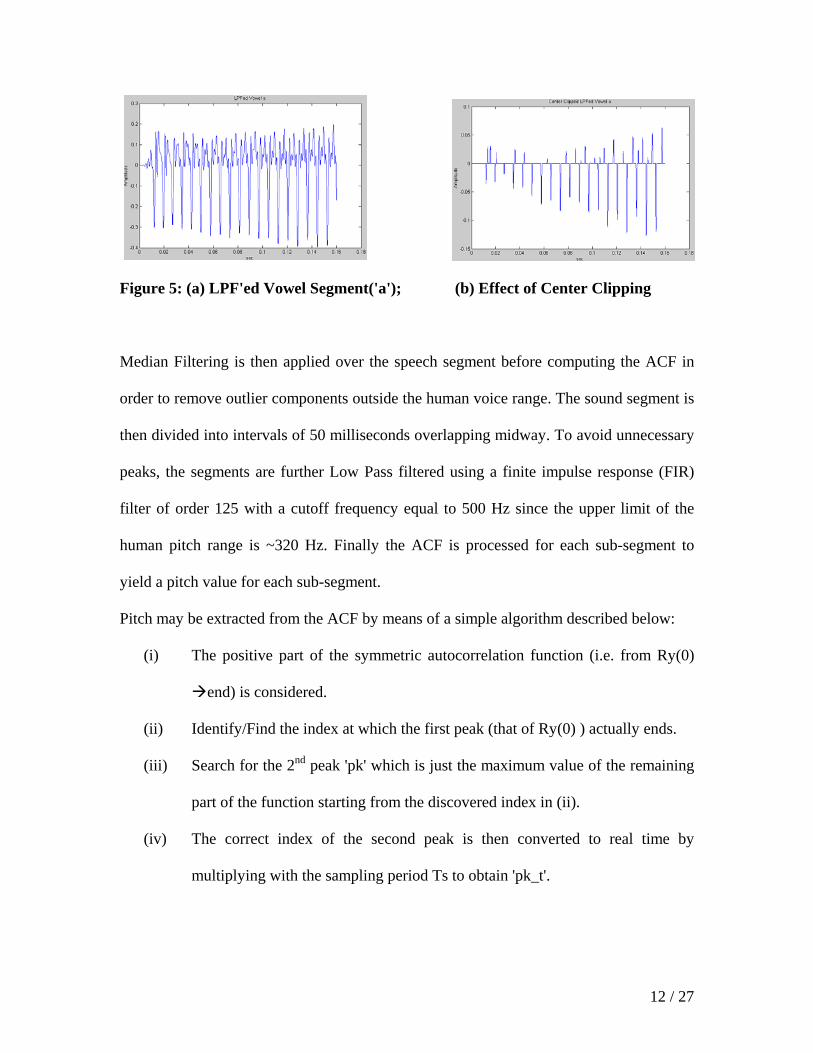
Figure 5: (a) LPF'ed Vowel Segment('a'); (b) Effect of Center Clipping
Median Filtering is then applied over the speech segment before computing the ACF in
order to remove outlier components outside the human voice range. The sound segment is
then divided into intervals of 50 milliseconds overlapping midway. To avoid unnecessary
peaks, the segments are further Low Pass filtered using a finite impulse response (FIR)
filter of order 125 with a cutoff frequency equal to 500 Hz since the upper limit of the
human pitch range is ~320 Hz. Finally the ACF is processed for each sub-segment to
yield a pitch value for each sub-segment.
Pitch may be extracted from the ACF by means of a simple algorithm described below:
(i) The positive part of the symmetric autocorrelation function (i.e. from Ry(0)
end) is considered.
(ii) Identify/Find the index at which the first peak (that of Ry(0) ) actually ends.
(iii) Search for the 2nd peak 'pk' which is just the maximum value of the remaining
part of the function starting from the discovered index in (ii).
(iv) The correct index of the second peak is then converted to real time by
multiplying with the sampling period Ts to obtain 'pk_t'.
13 / 27
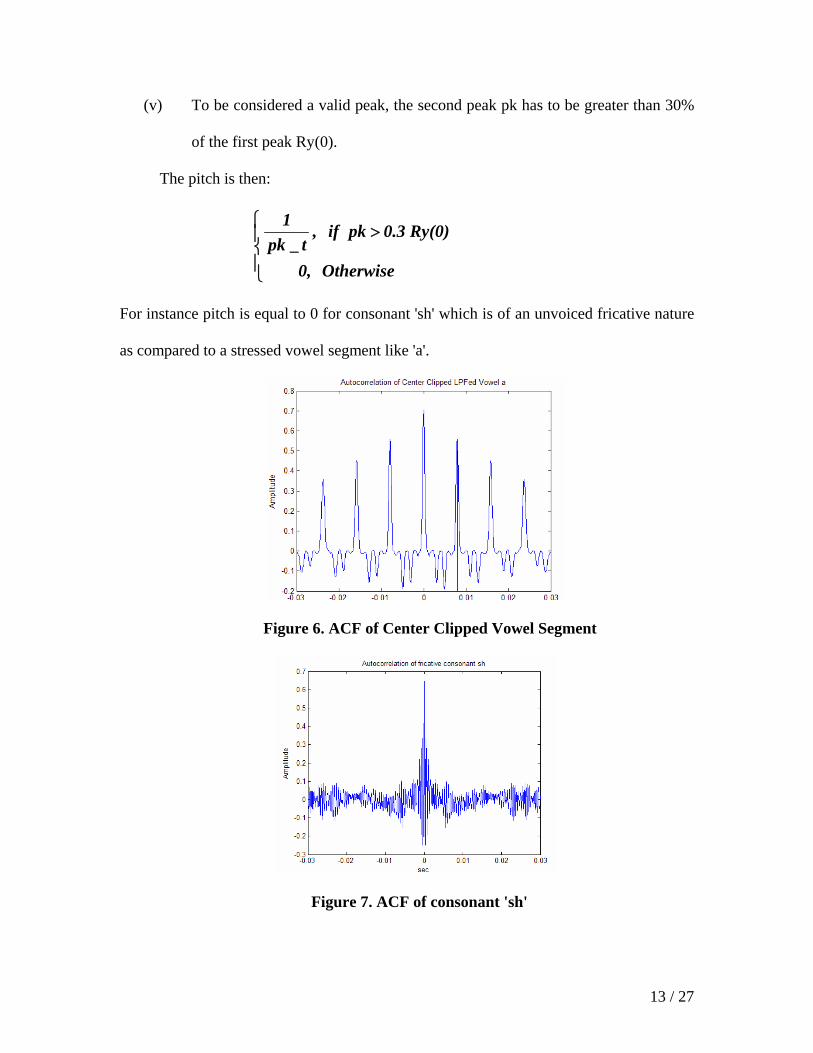
(v) To be considered a valid peak, the second peak pk has to be greater than 30%
of the first peak Ry(0).
The pitch is then:
⎪⎩
⎪⎨
⎧ >
Otherwise 0,
Ry(0) 0.3 pk if ,t_pk
1
For instance pitch is equal to 0 for consonant 'sh' which is of an unvoiced fricative nature
as compared to a stressed vowel segment like 'a'.
Figure 6. ACF of Center Clipped Vowel Segment
Figure 7. ACF of consonant 'sh'
14 / 27
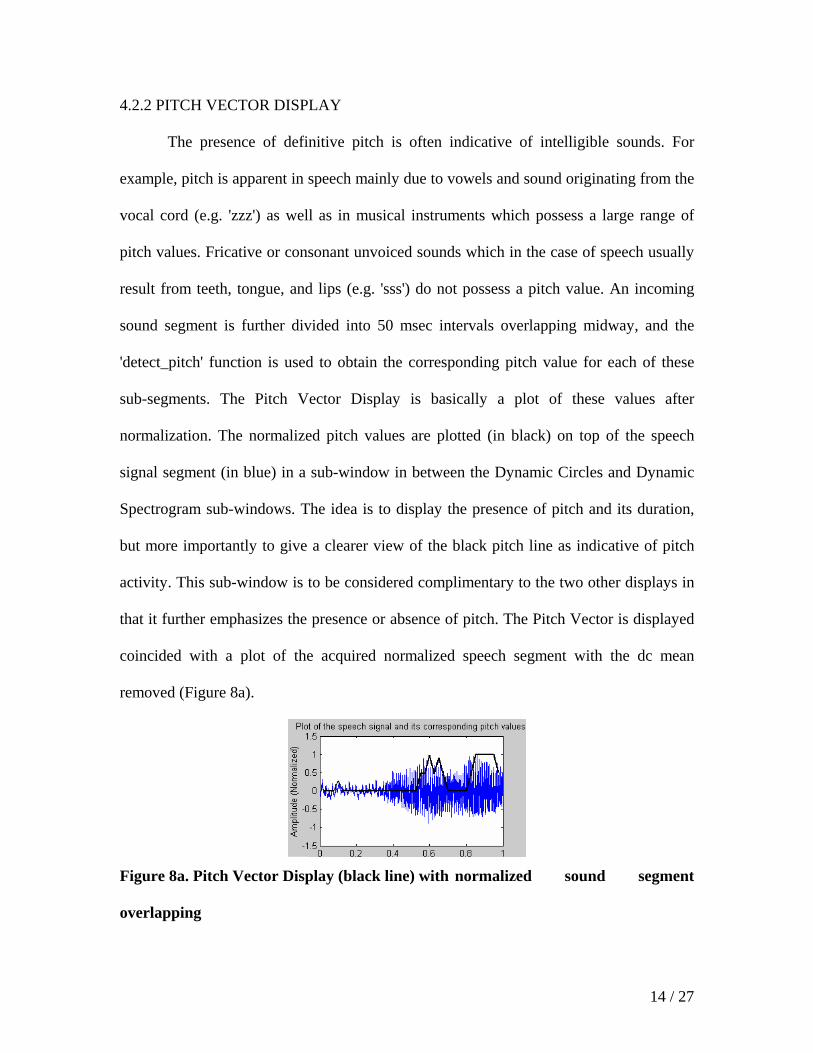
4.2.2 PITCH VECTOR DISPLAY
The presence of definitive pitch is often indicative of intelligible sounds. For
example, pitch is apparent in speech mainly due to vowels and sound originating from the
vocal cord (e.g. 'zzz') as well as in musical instruments which possess a large range of
pitch values. Fricative or consonant unvoiced sounds which in the case of speech usually
result from teeth, tongue, and lips (e.g. 'sss') do not possess a pitch value. An incoming
sound segment is further divided into 50 msec intervals overlapping midway, and the
'detect_pitch' function is used to obtain the corresponding pitch value for each of these
sub-segments. The Pitch Vector Display is basically a plot of these values after
normalization. The normalized pitch values are plotted (in black) on top of the speech
signal segment (in blue) in a sub-window in between the Dynamic Circles and Dynamic
Spectrogram sub-windows. The idea is to display the presence of pitch and its duration,
but more importantly to give a clearer view of the black pitch line as indicative of pitch
activity. This sub-window is to be considered complimentary to the two other displays in
that it further emphasizes the presence or absence of pitch. The Pitch Vector is displayed
coincided with a plot of the acquired normalized speech segment with the dc mean
removed (Figure 8a).
Figure 8a. Pitch Vector Display (black line) with normalized sound segment
overlapping
15 / 27
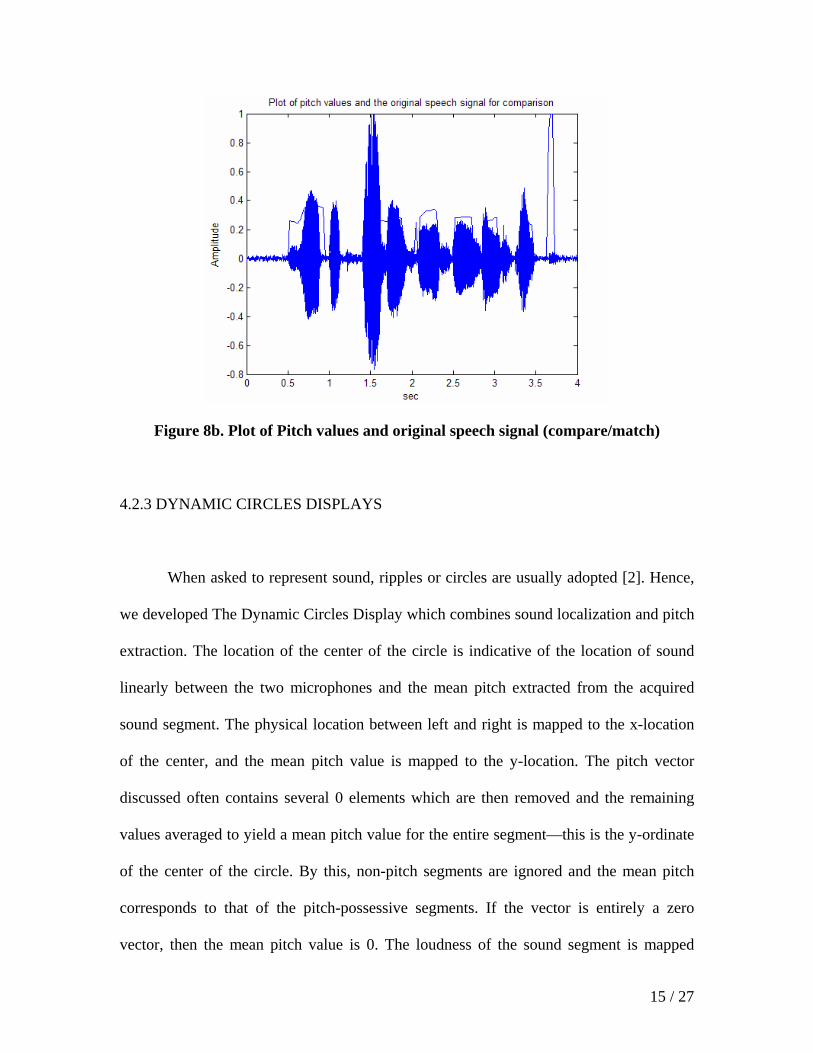
Figure 8b. Plot of Pitch values and original speech signal (compare/match)
4.2.3 DYNAMIC CIRCLES DISPLAYS
When asked to represent sound, ripples or circles are usually adopted [2]. Hence,
we developed The Dynamic Circles Display which combines sound localization and pitch
extraction. The location of the center of the circle is indicative of the location of sound
linearly between the two microphones and the mean pitch extracted from the acquired
sound segment. The physical location between left and right is mapped to the x-location
of the center, and the mean pitch value is mapped to the y-location. The pitch vector
discussed often contains several 0 elements which are then removed and the remaining
values averaged to yield a mean pitch value for the entire segment—this is the y-ordinate
of the center of the circle. By this, non-pitch segments are ignored and the mean pitch
corresponds to that of the pitch-possessive segments. If the vector is entirely a zero
vector, then the mean pitch value is 0. The loudness of the sound segment is mapped
16 / 27
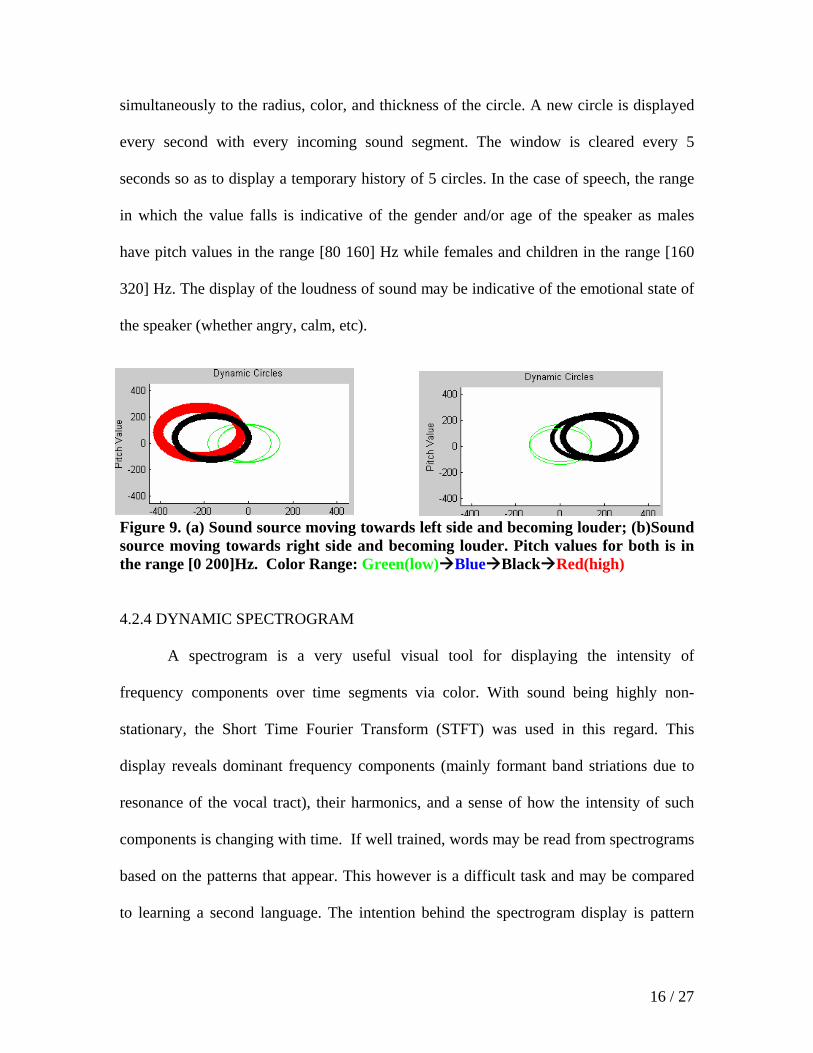
simultaneously to the radius, color, and thickness of the circle. A new circle is displayed
every second with every incoming sound segment. The window is cleared every 5
seconds so as to display a temporary history of 5 circles. In the case of speech, the range
in which the value falls is indicative of the gender and/or age of the speaker as males
have pitch values in the range [80 160] Hz while females and children in the range [160
320] Hz. The display of the loudness of sound may be indicative of the emotional state of
the speaker (whether angry, calm, etc).
Figure 9. (a) Sound source moving towards left side and becoming louder; (b)Sound source moving towards right side and becoming louder. Pitch values for both is in the range [0 200]Hz. Color Range: Green(low) Blue Black Red(high)
4.2.4 DYNAMIC SPECTROGRAM
A spectrogram is a very useful visual tool for displaying the intensity of
frequency components over time segments via color. With sound being highly non-
stationary, the Short Time Fourier Transform (STFT) was used in this regard. This
display reveals dominant frequency components (mainly formant band striations due to
resonance of the vocal tract), their harmonics, and a sense of how the intensity of such
components is changing with time. If well trained, words may be read from spectrograms
based on the patterns that appear. This however is a difficult task and may be compared
to learning a second language. The intention behind the spectrogram display is pattern
17 / 27
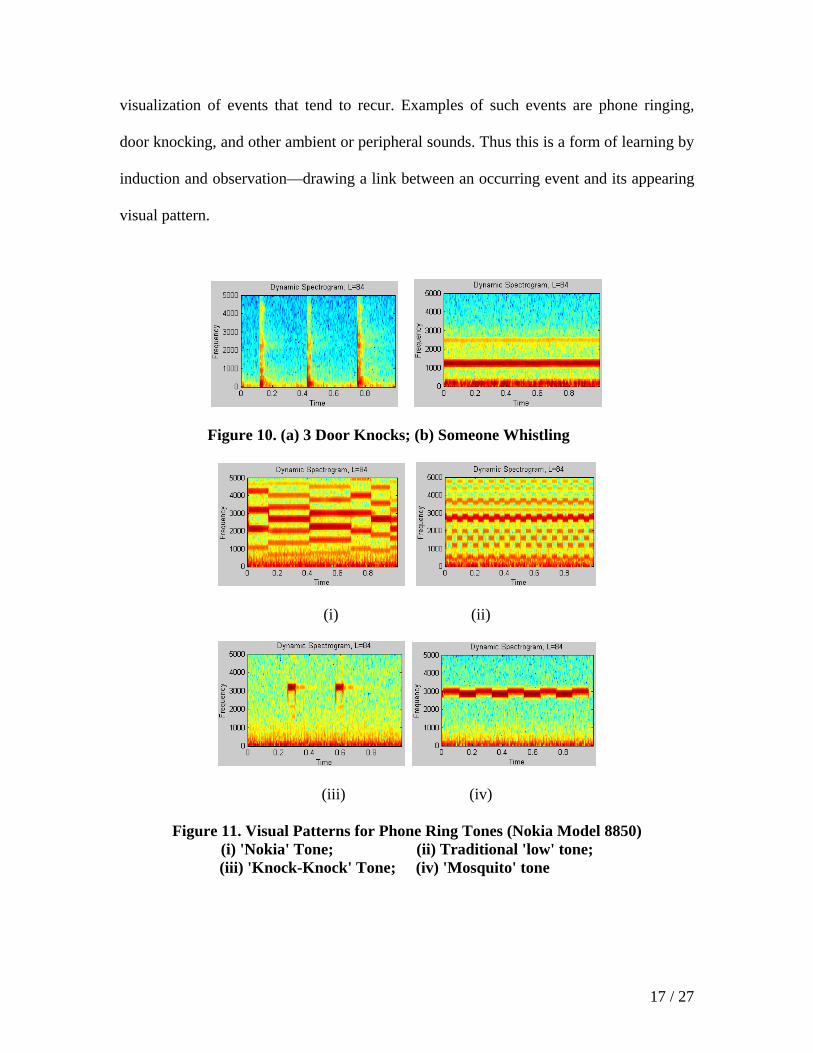
visualization of events that tend to recur. Examples of such events are phone ringing,
door knocking, and other ambient or peripheral sounds. Thus this is a form of learning by
induction and observation—drawing a link between an occurring event and its appearing
visual pattern.
Figure 10. (a) 3 Door Knocks; (b) Someone Whistling
(i) (ii)
(iii) (iv)
Figure 11. Visual Patterns for Phone Ring Tones (Nokia Model 8850) (i) 'Nokia' Tone; (ii) Traditional 'low' tone;
(iii) 'Knock-Knock' Tone; (iv) 'Mosquito' tone
18 / 27
The spectrogram used is wide-band with a frequency resolution of 300 Hz. The window
utilized within the spectrogram is a Hanning window [5] described by equation (2)
MnM- ,
12Mn x x 2cos1
21)n(w ≤≤⎥
⎦
⎤⎢⎣
⎡⎟⎠
⎞⎜⎝
⎛+π
+= (2)
It should be noted that the tradeoff between time and frequency resolution is described by
the uncertainty principle [6] mainly stating:
If an impulse response h(t) treated as a probability density function (PDF) decays to
zero faster than t
1
for large t, then
(∆T) (∆ω) ≥ 2 (3)
Where (∆T), the time duration, is defined as twice the standard deviation hσ from its
zero centered mean hμ :
∫∫∞
∞−
∞
∞=σ=Δdt)t(h
dth(t) t 4 4 )T(
2-
22 2
h2
(4)
and (∆ω), the bandwidth of H(ω), is defined as twice the standard deviation Hσ of the
PDF 2)(H ω .
∫∫
∞
∞−
∞
∞
ωω
ωωω=σ=ωΔ
d)H(
d)H( 4 4 )(
2-
22 2
H2
(5)
19 / 27
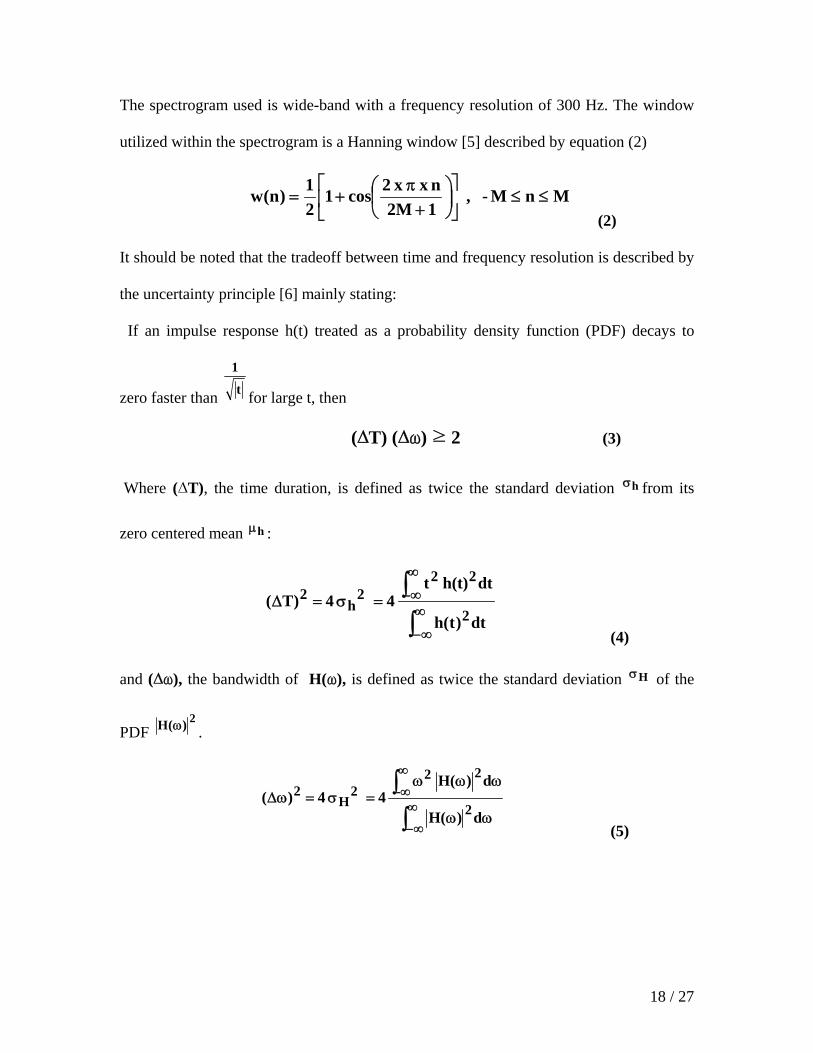
4.2.5 LEFT/RIGHT DISPLAY
The input consists always of two sound segments acquired from the left and right
microphones. The Discrete Fourier Transform (DFT) is applied on each of the two
segments using the Fast Fourier Transform (FFT) algorithm. The magnitude of the DFT
is then plotted versus frequency for the left and right signals separately. This display
allows visually detecting the dominant and non-dominant frequency components present
and comparing these between left and right sides.
Figure 12. Singing a high pitch 'aaa' from right side (a) DFT Display (left mic); (b) DFT Display (right mic) shows dominant frequency component in range [250 300] Hz.
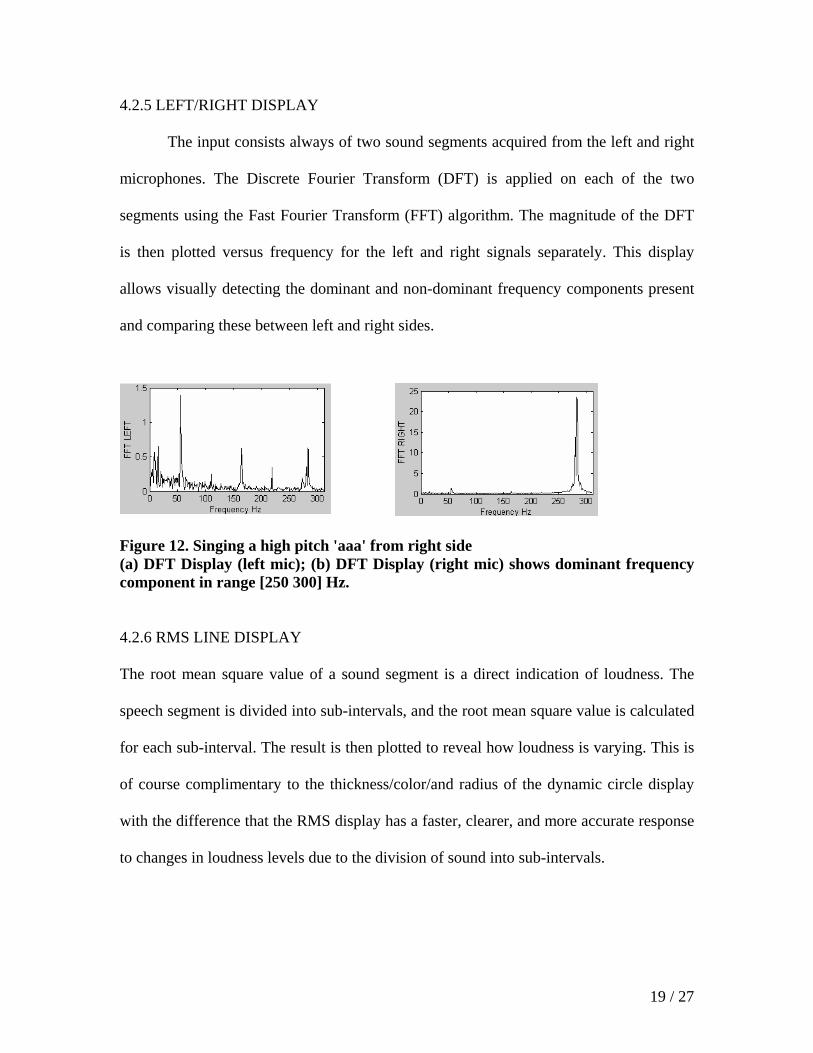
4.2.6 RMS LINE DISPLAY
The root mean square value of a sound segment is a direct indication of loudness. The
speech segment is divided into sub-intervals, and the root mean square value is calculated
for each sub-interval. The result is then plotted to reveal how loudness is varying. This is
of course complimentary to the thickness/color/and radius of the dynamic circle display
with the difference that the RMS display has a faster, clearer, and more accurate response
to changes in loudness levels due to the division of sound into sub-intervals.
20 / 27
Figure 13. 'EEEE' sound showing exponentially rising loudness intensity.
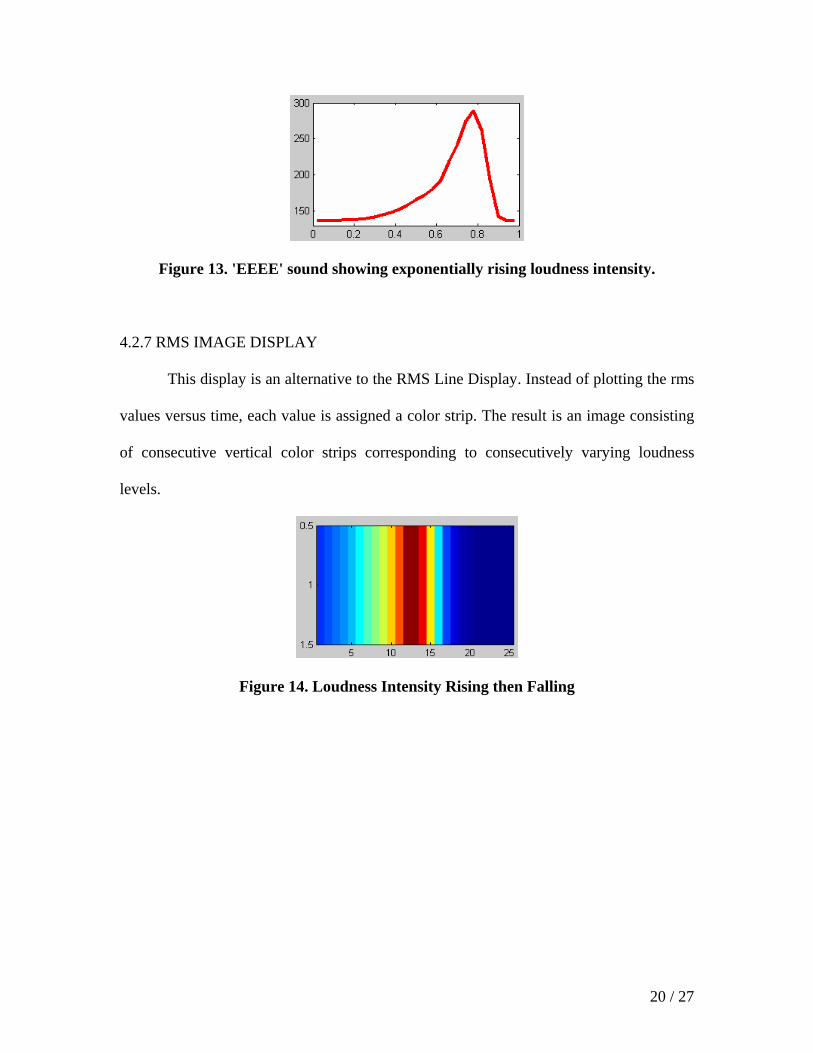
4.2.7 RMS IMAGE DISPLAY
This display is an alternative to the RMS Line Display. Instead of plotting the rms
values versus time, each value is assigned a color strip. The result is an image consisting
of consecutive vertical color strips corresponding to consecutively varying loudness
levels.
Figure 14. Loudness Intensity Rising then Falling
21 / 27
4.3 SPEECH VISUALIZATION
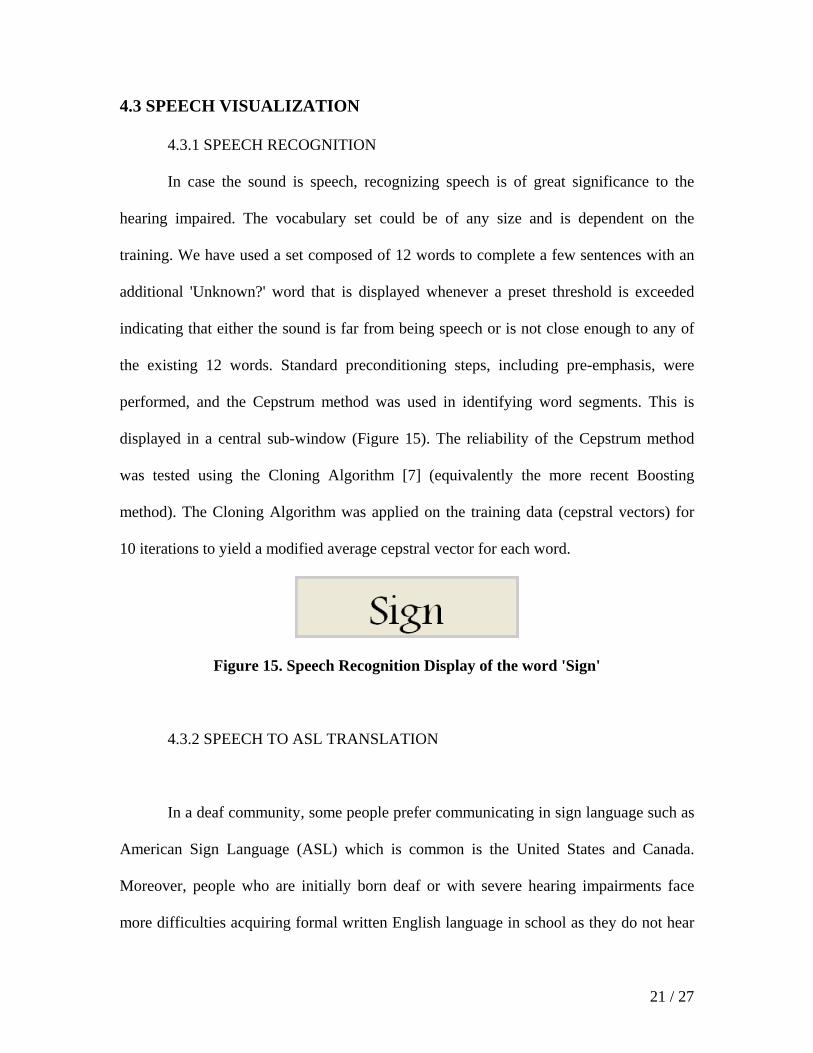
4.3.1 SPEECH RECOGNITION
In case the sound is speech, recognizing speech is of great significance to the
hearing impaired. The vocabulary set could be of any size and is dependent on the
training. We have used a set composed of 12 words to complete a few sentences with an
additional 'Unknown?' word that is displayed whenever a preset threshold is exceeded
indicating that either the sound is far from being speech or is not close enough to any of
the existing 12 words. Standard preconditioning steps, including pre-emphasis, were
performed, and the Cepstrum method was used in identifying word segments. This is
displayed in a central sub-window (Figure 15). The reliability of the Cepstrum method
was tested using the Cloning Algorithm [7] (equivalently the more recent Boosting
method). The Cloning Algorithm was applied on the training data (cepstral vectors) for
10 iterations to yield a modified average cepstral vector for each word.
Figure 15. Speech Recognition Display of the word 'Sign'
4.3.2 SPEECH TO ASL TRANSLATION
In a deaf community, some people prefer communicating in sign language such as
American Sign Language (ASL) which is common is the United States and Canada.
Moreover, people who are initially born deaf or with severe hearing impairments face
more difficulties acquiring formal written English language in school as they do not hear
22 / 27
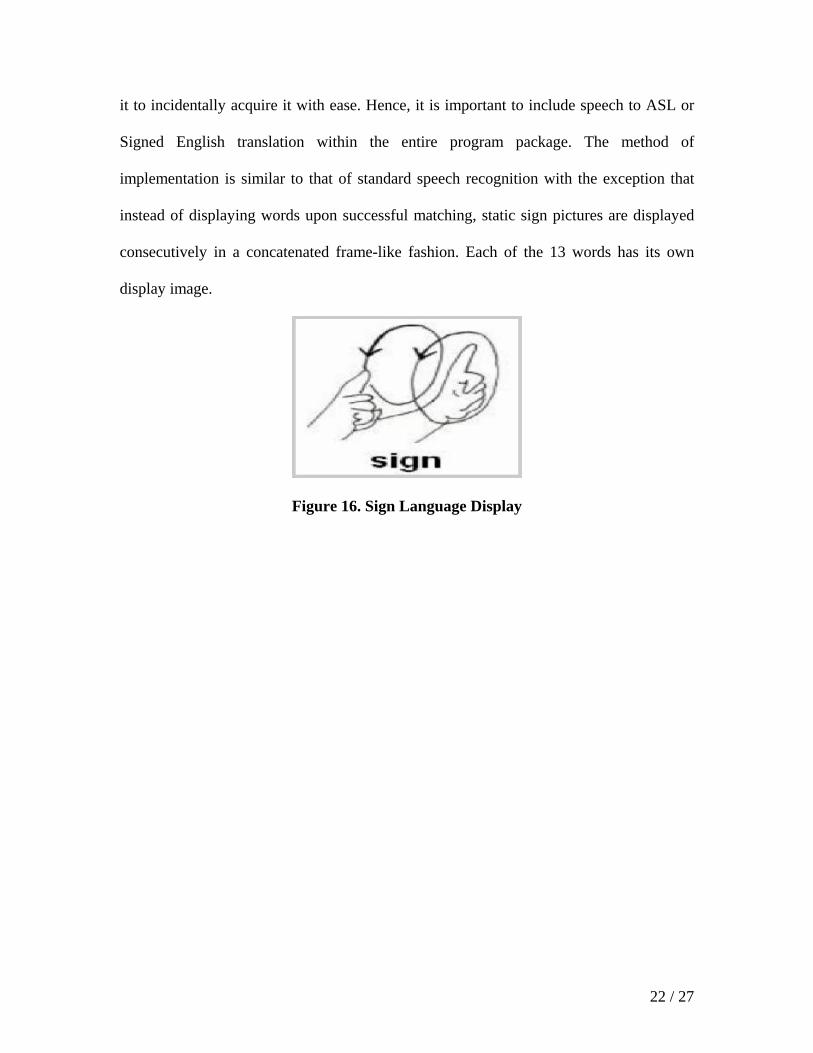
it to incidentally acquire it with ease. Hence, it is important to include speech to ASL or
Signed English translation within the entire program package. The method of
implementation is similar to that of standard speech recognition with the exception that
instead of displaying words upon successful matching, static sign pictures are displayed
consecutively in a concatenated frame-like fashion. Each of the 13 words has its own
display image.
Figure 16. Sign Language Display
23 / 27
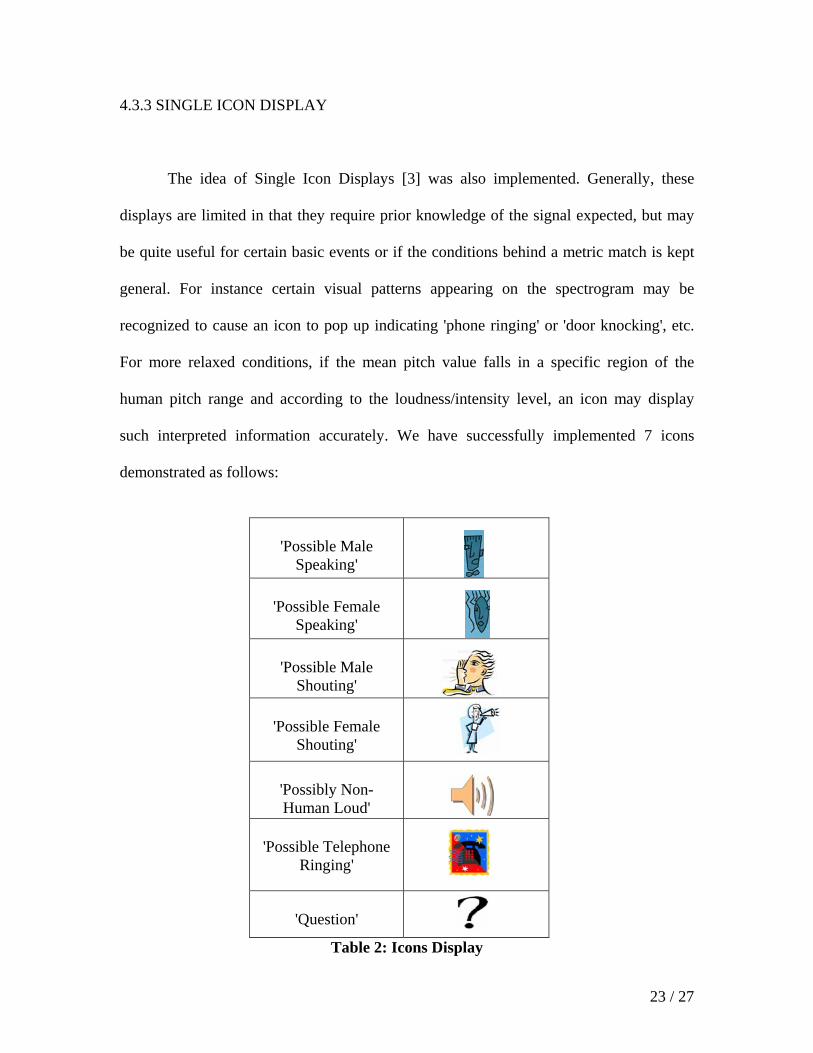
4.3.3 SINGLE ICON DISPLAY
The idea of Single Icon Displays [3] was also implemented. Generally, these
displays are limited in that they require prior knowledge of the signal expected, but may
be quite useful for certain basic events or if the conditions behind a metric match is kept
general. For instance certain visual patterns appearing on the spectrogram may be
recognized to cause an icon to pop up indicating 'phone ringing' or 'door knocking', etc.
For more relaxed conditions, if the mean pitch value falls in a specific region of the
human pitch range and according to the loudness/intensity level, an icon may display
such interpreted information accurately. We have successfully implemented 7 icons
demonstrated as follows:
'Possible Male Speaking'
'Possible Female
Speaking'
'Possible Male
Shouting'
'Possible Female Shouting'
'Possibly Non-Human Loud'
'Possible Telephone
Ringing'
'Question'
Table 2: Icons Display
24 / 27
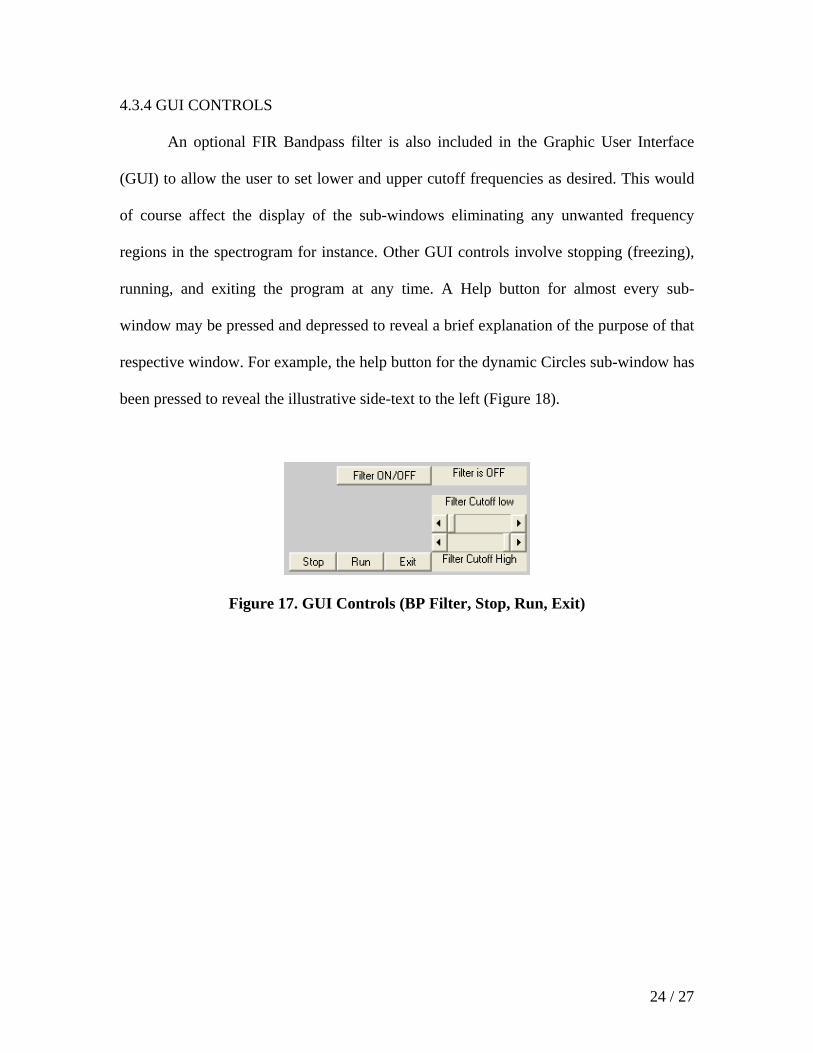
4.3.4 GUI CONTROLS
An optional FIR Bandpass filter is also included in the Graphic User Interface
(GUI) to allow the user to set lower and upper cutoff frequencies as desired. This would
of course affect the display of the sub-windows eliminating any unwanted frequency
regions in the spectrogram for instance. Other GUI controls involve stopping (freezing),
running, and exiting the program at any time. A Help button for almost every sub-
window may be pressed and depressed to reveal a brief explanation of the purpose of that
respective window. For example, the help button for the dynamic Circles sub-window has
been pressed to reveal the illustrative side-text to the left (Figure 18).
Figure 17. GUI Controls (BP Filter, Stop, Run, Exit)
25 / 27
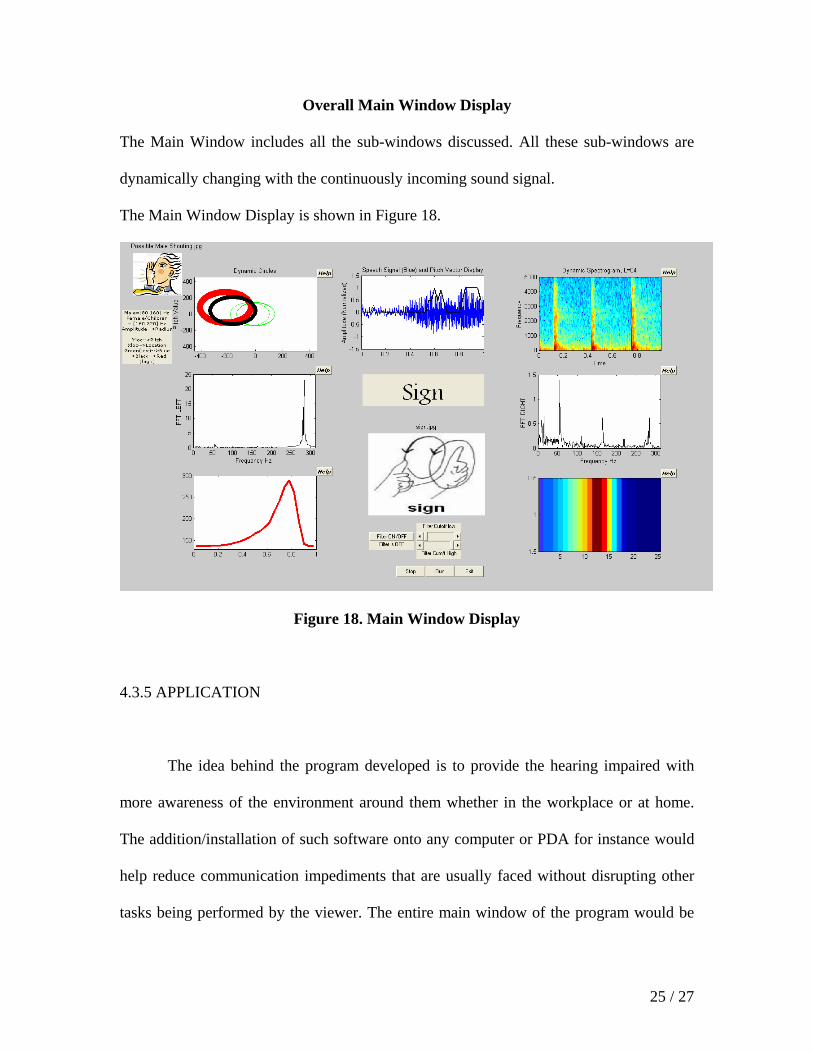
Overall Main Window Display
The Main Window includes all the sub-windows discussed. All these sub-windows are
dynamically changing with the continuously incoming sound signal.
The Main Window Display is shown in Figure 18.
Figure 18. Main Window Display
4.3.5 APPLICATION
The idea behind the program developed is to provide the hearing impaired with
more awareness of the environment around them whether in the workplace or at home.
The addition/installation of such software onto any computer or PDA for instance would
help reduce communication impediments that are usually faced without disrupting other
tasks being performed by the viewer. The entire main window of the program would be
26 / 27
displayed for example in a separate corner of the screen while the user would be working
in another program. The software could also be integrated into any portable computer
based device that would include two built-in microphones or an array of microphones
situated on the lower backside of the screen. A small separate device with a reasonable
microprocessor supporting the program, sensitive microphones, and a miniature screen
may be even used as a portable wrist bound item. The program would continuously
provide information of sound source location, loudness, pitch, speech translation, etc.
27 / 27
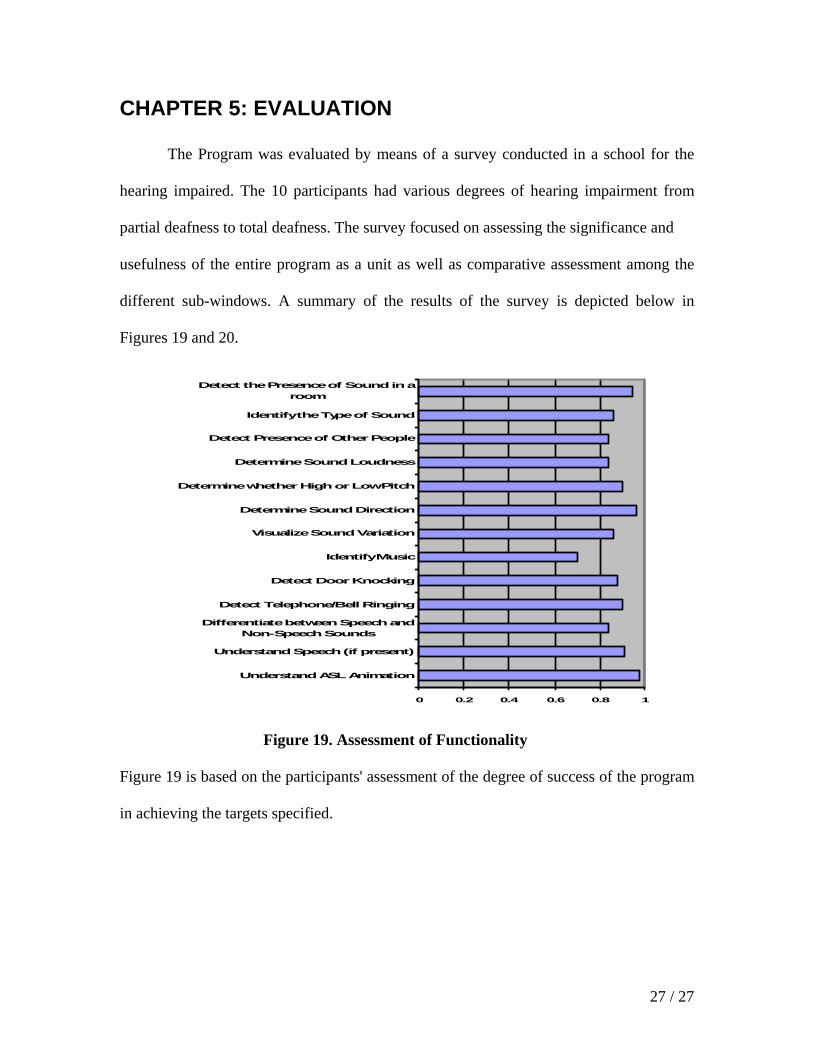
CHAPTER 5: EVALUATION
The Program was evaluated by means of a survey conducted in a school for the
hearing impaired. The 10 participants had various degrees of hearing impairment from
partial deafness to total deafness. The survey focused on assessing the significance and
usefulness of the entire program as a unit as well as comparative assessment among the
different sub-windows. A summary of the results of the survey is depicted below in
Figures 19 and 20.
0 0.2 0.4 0.6 0.8 1
Understand ASL Animation
Understand Speech (if present)
Differentiate between Speech andNon-Speech Sounds
Detect Telephone/Bell Ringing
Detect Door Knocking
Identify Music
Visualize Sound Variation
Determine Sound Direction
Determine whether High or Low Pitch
Determine Sound Loudness
Detect Presence of Other People
Identify the Type of Sound
Detect the Presence of Sound in aroom
Figure 19. Assessment of Functionality
Figure 19 is based on the participants' assessment of the degree of success of the program
in achieving the targets specified.
28 / 27
Dynamic Spectrogram
Display
RMS Line Display
RMS Image Display
FFT Display
Dynamic Circles Display
Pitch Vector Display
Speech Text Display
Single Icon Display
ASL Display
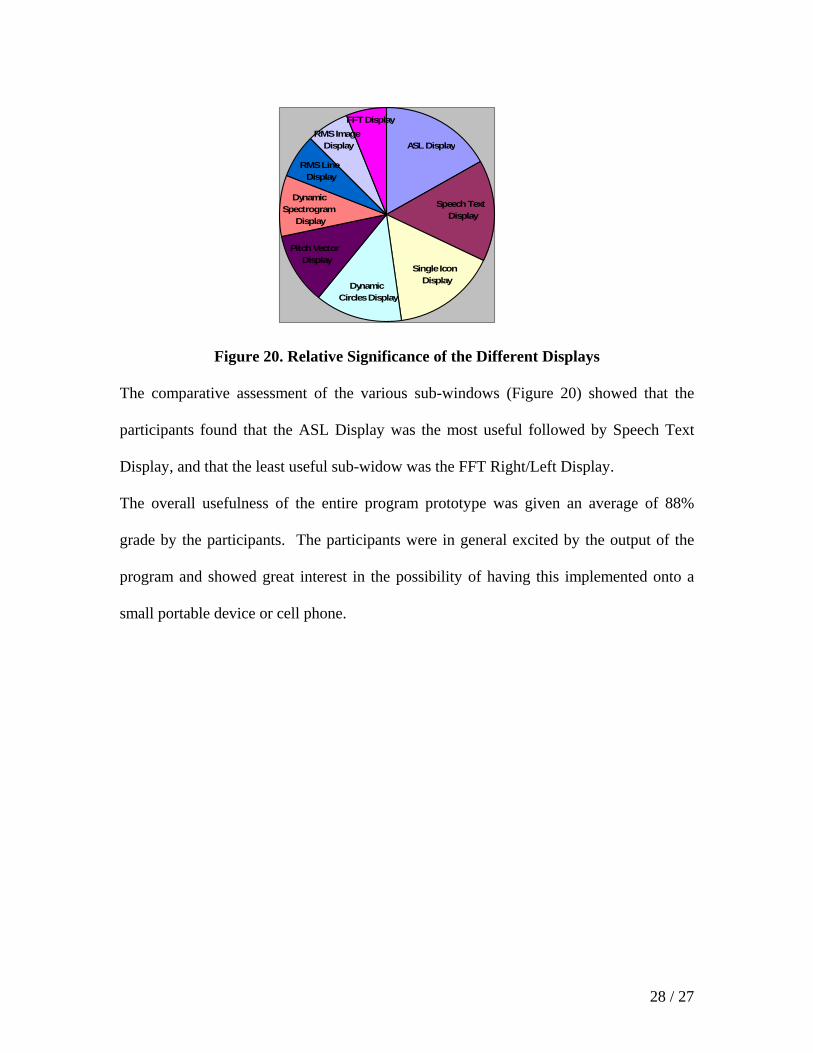
Figure 20. Relative Significance of the Different Displays
The comparative assessment of the various sub-windows (Figure 20) showed that the
participants found that the ASL Display was the most useful followed by Speech Text
Display, and that the least useful sub-widow was the FFT Right/Left Display.
The overall usefulness of the entire program prototype was given an average of 88%
grade by the participants. The participants were in general excited by the output of the
program and showed great interest in the possibility of having this implemented onto a
small portable device or cell phone.
29 / 27
CHAPTER 6: CONCLUSIONS & FUTURE WORK
The program discussed in this paper would provide the hearing impaired with
varying types of information extracted from sound. The program was written in the
simulation environment of MATLAB. Future work would include actual hardware
implementation in more efficient program languages such as C before optimization into
Assembly Code. Speech Recognition may be improved and transformed into a
Continuous Speaker-Independent system based on phoneme recognition and HMM.
Furthermore, the program may be developed even further to include two-way
communication means. For instance, the hardware could be designed to support a two-
sided screen; the screen facing the user would show the program display and the screen
opposing the user would be used to display any text typed by the user (which
simultaneously shows on the screen facing the user). Moreover, with the advances in
ASL-to-Speech recognition software, a computer camera may be installed to provide a
further option of signing instead of typing text on a keyboard. The sub-windows may be
designed with the option of collapsing any frame whenever the user feels it is distracting
and/or not required for the moment.
30 / 27
REFERENCES [1] Ethnologue report for Lebanon
http://www.ethnologue.com/show_country.asp?name=LB [2] F. Wai-ling Ho-Ching, Jennifer Mankoff, James A. Landay, (2003). "From
Data to Display: the Design and Evaluation of a Peripheral Sound Display for the Deaf", In Proceedings of CHI 2003. 8 pages.
[3] Tarra Matthews, Janette Fong, Jennifer Mankoff, "Visualizing Non-Speech Sounds for the Deaf", In Proceedings of ACM SIGACCESS conference on Computers and Accessibility (ASSETS). Baltimore, MD, pp. 52-59, 2005.
[4] L.R. Rabiner and R.W. Schafer, "Digital Processing of Speech Signals", Prentice-Hall, 1978, pp. 150-154.
[5] Sanjit K. Mitra, "Digital Signal Processing A Computer-Based Approach", 3rd ed, McGraw-Hill, pp.533
[6] David Slepian, "Some Comments on Fourier analysis, uncertainty and modeling", SIAM Review, Vol. 25, No.3, pp. 379-393.
[7] Mohamad Adnan Al-Alaoui, Rodolphe Mouci, Mohammad M. Mansour, and Rony Ferzli, "A Cloning Approach to Classifier Training", IEEE Transactions on Systems, Man, and Cybernetics—Part A: Systems and Humans, Vol. 32, NO. 6, November 2002, pp. 746-752.
[8] "Sound visualization: Sound to animation" 2001. <http://www.mat.ucsb.edu/~woony/research/fall01/mat596b/> Accessed 2005 Dec 15.
[9] American Speech-Language-Hearing Association."Assistive Technology. What are Assistive Listening Devices? " <http://www.asha.org/public/hearing/treatment/assist_tech.htm> Accessed 2005 Dec 2.
31 / 27
APPENDIX (SURVEY QUESTIONS) The following Questionnaire is intended after the entire program is complete in the Spring Semester. It will be addressed to a Deaf Community (such as a School for the Deaf). The survey will help assess the degree of success of the program in providing an integrated tool for visualizing sound. The questions are still preliminary subject to change or additions depending on the final state and features of the sub-programs yet to be designed. Questionnaire Topic: The purpose of this survey is to assess the design of a system that visualizes speech & non-speech sounds to help people with hearing impairment. We appreciate your support by responding to the following questions. Section I. Tell us about you. 1) What is your full name? (Optional) 2) Describe your occupation? 3) Do you have any hearing impairments? If so, please describe it and tell us when you started experiencing hearing loss? 4) Do you have any non-correctable visual impairment? If you have normal vision with glasses or contact lenses it does not count. Section II. Work 1) Describe your working environment (office, cubicle, office building, etc.) 2) In an average working day, how many hours do you spend at work? 3) Describe all the sounds that you hear in a typical day at work both inside and outside the office. 4) What sounds help you do your job (telephone, customers, co-workers)?
32 / 27
5) What sounds do you listen for (footsteps into office, keyboard clicking, boss)? 6) What sounds distract you from your work? Section III. Home 1) Describe your home environment (apartment, house, commercial area). 2) In an average day, how many hours do you spend at home? _______ 3) What sounds do you normally encounter at home (people, barking, phone, cars)? 4) What sounds do you or would you attentively listen to (phone, doorbell, etc.)? 5) What sounds do you find distracting or annoying at home? Section IV The purpose of this survey is to aid in the design of a computer program to help the hearing disabled by visualizing and monitoring speech and non-speech sounds, thereby allowing one sense (sight) to process information meant for a weaker or non-existent sense (hearing). The following questions will help assess and determine the design of the final device. On a scale of 1-7 (1=Least, 7=Most) please rank to what degree did the program allow you to detect each of the following, and please explain briefly why. 1) Detect the presence of sound in a room 1 2 3 4 5 6 7 2) Detect both the presence of sound and identify the type of sound in or near a room. 1 2 3 4 5 6 7
33 / 27
3) Detect the presence of other people in a room. 1 2 3 4 5 6 7 4) Determine the volume or intensity of sound in a room 1 2 3 4 5 6 7 5) Visualize whether the sound in a room is of high pitch or low pitch. 1 2 3 4 5 6 7 6) Determine what direction the sound is coming from 1 2 3 4 5 6 7 7) Having a sense of the way the sound changes over time 1 2 3 4 5 6 7 8) Being able to detect if someone is playing music 1 2 3 4 5 6 7 9) Being able to detect if someone is knocking on the door or if a doorbell is ringing 1 2 3 4 5 6 7 10) Being able to detect if the telephone is ringing 1 2 3 4 5 6 7 11) Differentiate between speech and non-speech sounds. 1 2 3 4 5 6 7 12) Understand speech (if present)
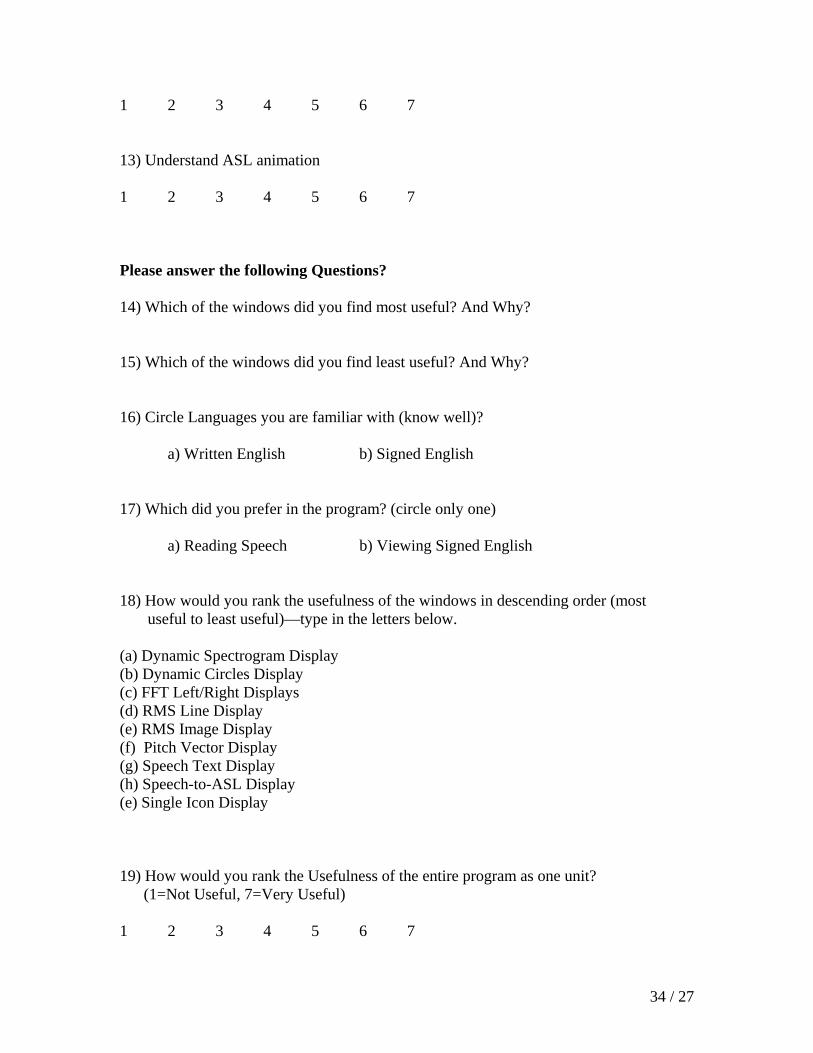
34 / 27
1 2 3 4 5 6 7 13) Understand ASL animation 1 2 3 4 5 6 7 Please answer the following Questions? 14) Which of the windows did you find most useful? And Why? 15) Which of the windows did you find least useful? And Why? 16) Circle Languages you are familiar with (know well)? a) Written English b) Signed English 17) Which did you prefer in the program? (circle only one) a) Reading Speech b) Viewing Signed English 18) How would you rank the usefulness of the windows in descending order (most useful to least useful)—type in the letters below. (a) Dynamic Spectrogram Display (b) Dynamic Circles Display (c) FFT Left/Right Displays (d) RMS Line Display (e) RMS Image Display (f) Pitch Vector Display (g) Speech Text Display (h) Speech-to-ASL Display (e) Single Icon Display 19) How would you rank the Usefulness of the entire program as one unit? (1=Not Useful, 7=Very Useful) 1 2 3 4 5 6 7